JURNAL KEPERAWATAN GAWAT DARURAT II dedy
48
JURNAL KEPERAWATAN GAWAT DARURAT II THE EFFECT OF BASELINE PRESSURE ERRORS ON AN INTRACRANIAL PRESSURE-DERIVED INDEX: RESULTS OF A PROSPECTIVE OBSERVATIONAL STUDY Dosen :Arif Adi Setiawan, S.Kep,Ns Disusun Oleh : Nama : Dedi Irawan NIM : 04.11.3036 Kelas : F / Kp / VII KONSENTRASI INSTRUMENTASI DAN OPRATOR BEDAH PROGRAM STUDI ILMU KEPERAWATAN SEKOLAH TINGGI ILMU KESEHATAN SURYA GLOBAL
-
Upload
cincinkawinjogjakarta -
Category
Documents
-
view
1 -
download
0
Transcript of JURNAL KEPERAWATAN GAWAT DARURAT II dedy

JURNAL KEPERAWATAN GAWAT DARURAT II
THE EFFECT OF BASELINE PRESSURE ERRORS ON AN INTRACRANIAL
PRESSURE-DERIVED INDEX: RESULTS OF A PROSPECTIVE
OBSERVATIONAL STUDY
Dosen :Arif Adi Setiawan, S.Kep,Ns
Disusun Oleh :
Nama : Dedi Irawan
NIM : 04.11.3036
Kelas : F / Kp / VII
KONSENTRASI INSTRUMENTASI DAN OPRATOR BEDAH
PROGRAM STUDI ILMU KEPERAWATAN
SEKOLAH TINGGI ILMU KESEHATAN SURYA GLOBAL

YOGYAKARTA
2014


Biomed Eng Online. 2014; 13: 99.
Published online Jul 23, 2014. doi: 10.1186/1475-925X-
13-99
PMCID: PMC4125597
The effect of baseline pressure errors on an intracranial
pressure-derived index: results of a prospective
observational study
Per Kristian Eide Angelika Sorteberg, Torstein R Meling,
and Wilhelm Sorteberg
Author information Article notes Copyright and License
information
Abstract
Background
In order to characterize the intracranial pressure-volume
reserve capacity, the correlation coefficient (R) between
the ICP wave amplitude (A) and the mean ICP level (P),
the RAP index, has been used to improve the diagnostic
value of ICP monitoring. Baseline pressure errors (BPEs),

caused by spontaneous shifts or drifts in baseline
pressure, cause erroneous readings of mean ICP.
Consequently, BPEs could also affect ICP indices such as
the RAP where in the mean ICP is incorporated.
Methods
A prospective, observational study was carried out on
patients with aneurysmal subarachnoid hemorrhage (aSAH)
undergoing ICP monitoring as part of their surveillance.
Via the same burr hole in the scull, two separate ICP
sensors were placed close to each other. For each
consecutive 6-sec time window, the dynamic mean ICP wave
amplitude (MWA; measure of the amplitude of the single
pressure waves) and the static mean ICP, were computed.
The RAP index was computed as the Pearson correlation
coefficient between the MWA and the mean ICP for 40 6-sec
time windows, i.e. every subsequent 4-min period (method
1). We compared this approach with a method of
calculating RAP using a 4-min moving window updated every
6 seconds (method 2).
Results
The study included 16 aSAH patients. We compared 43,653
4-min RAP observations of signals 1 and 2 (method 1), and
1,727,000 6-sec RAP observations (method 2). The two
methods of calculating RAP produced similar results.
Differences in RAP ≥0.4 in at least 7% of observations
were seen in 5/16 (31%) patients. Moreover, the
combination of a RAP of ≥0.6 in one signal and <0.6 in
the other was seen in ≥13% of RAP-observations in 4/16
(25%) patients, and in ≥8% in another 4/16 (25%)
patients. The frequency of differences in RAP >0.2 was
significantly associated with the frequency of BPEs (5
mmHg ≤ BPE <10 mmHg).
Conclusions
Simultaneous monitoring from two separate, close-by ICP
sensors reveals significant differences in RAP that
correspond to the occurrence of BPEs. As differences in
RAP are of magnitudes that may alter patient management,
we do not advocate the use of RAP in the management of
neurosurgical patients.
Go to:

Background
Monitoring of intracranial pressure (ICP) is crucial in
the intensive care management of neurosurgical patients
[1-4]. The common management goal is to maintain the
static pressure parameter mean ICP <20-25 mmHg [3]. When
the cardiac-induced ICP waves are monitored as well, the
goal is to keep the dynamic pressure parameter mean ICP
wave amplitude (MWA) <5 mmHg [1]. In an attempt to better
characterize the intracranial pressure-volume reserve
capacity, some authors have also calculated an index
measuring the correlation coefficient (R) between the ICP
wave amplitude (A) and the mean ICP level (P), denoted
RAP [5,6]. Repetitive computation of this RAP index has
been used in the surveillance of patients with traumatic
brain injury (TBI), cerebral bleeds, and hydrocephalus
[6-9]. Using the RAP index, which ranges from -1 to +1,
the upper normal threshold is +0.6 [6,8-12]. A RAP
approaching +1 has hence been considered as indicative of
reduced compensatory reserve capacity, or impaired
intracranial compliance.
The mean ICP is always determined against a baseline
pressure (i.e. zero or reference pressure). A major
weakness of this is that the mean ICP value that is
displayed to the physician or nurse becomes erroneous if
this baseline pressure is spontaneously altered during
ongoing monitoring [13]. Such baseline pressure errors
(BPEs) occur during clinical ICP monitoring, and has been
seen in a variety of ICP sensor types and locations from
where the ICP is recorded [13,14]. In contrast, the
dynamic ICP parameters, such as the MWA remain unaffected
by BPEs as they express just changes of ICP within each
heartbeat.
In a recent prospective, observational study on 16
patients with aneurysmal subarachnoid haemorrhage (SAH),
we reported a high frequency and severity of BPEs [15].
Being recognized as differences in mean ICP in
combination with close to identical MWA, BPEs affect the
RAP index, causing the RAP to differ widely when
determined from two separate ICP sensors in the same
patient [16]. This is most evident when monitoring ICP
from two different types of ICP sensors [16]. The present

study was undertaken to explore the frequency and
severity of differences in RAP when using two ICP sensors
of the same type. To this end, we reanalysed the
continuous ICP recordings of 16 aSAH patients enrolled in
a prospective, observational study in which we recorded
the ICP from two separate ICP sensors placed in the brain
tissue via the same burr hole in the scull [15].
Go to:
Methods
Patients
Aneurysmal SAH patients who need continuous ICP
monitoring as part of their intensive care management
were enrolled in the study. Their intensive care
management was not influenced by their participation.
The study was approved by The Regional Ethics Committee,
REK South-East (2010/1328B) and Oslo University Hospital
(2010/16315), Oslo, Norway. Inclusion was by oral and
written informed consent, either by the patient
herself/himself or by the closest family member.

Study design
A prospective, observational study design was used to
determine the frequency and severity of BPEs, and how
BPEs affect scores of ICP and ICP indices. These data
were re-analyzed in order to investigate the frequency
and severity of differences in RAP. Moreover, we compared
two different methods of calculating the RAP.
Monitoring and analysis of ICP
Two Raumedic NeuroVent P (Raumedic AG, Münchberg, GE) ICP
sensors were placed in the brain parenchyma via the same
burr hole, either during aneurysm surgery, or during
placement of an external ventricular drain (EVD). The
location of the ICP sensors was verified postoperatively
by cerebral computer tomography (CT) scanning.
Both sensors were connected to the MPR-1 monitor
(Raumedic AG, Münchberg, GE), which in turn was connected
to a laptop computer running Sensometrics Software (dPCom
AS, Oslo, Norway). The digital sampling rate of pressure
signals from the two sensors (Sensors 1 and 2) was
100 Hz. The raw data files were stored on the computer.

Recordings from the two sensors continued throughout the
time period the patient was in need of ICP surveillance.
As previously described, the ICP signals were analyzed
according to the methodology implemented in Sensometrics
Software (Figure 1) [17]. An automatic method identifies
the heartbeat-induced single ICP waves, differentiating
them from the pressure waves of other origins (noise or
various artifacts). Each heartbeat-induced single ICP
wave is characterized by the following wave parameters:
the amplitude (dP), rise time (dT), and the rise-time
coefficient (dP/dT) (Figure 1c). Only 6-sec time windows
containing a minimum of four cardiac-beat-induced waves
were included for further analysis. The MWA is computed
in consecutive 6-sec time window (Figure 1c). During the
same 6-sec time windows, the mean ICP is determined as
the sum of sample values divided by the number of
samples.

Figure 1
Illustration of the method of determining the RAP
[correlation coefficient (R) between the intracranial
pressure (ICP) wave amplitude (A) and the mean ICP level
(P)] in patient 2. Following automatic identification of
the cardiac induced single intracranial ...
Calculation of RAP
The software incorporates an automatic procedure for
determining the correlation coefficient (R) between the
ICP wave amplitude (A) and the ICP level (P), the RAP,
during consecutive 4-min time periods. The RAP-index is
the Pearson correlation coefficient between the MWA and
the mean ICP during 40 6-sec time window periods.
Computation of RAP has previously been described by
others [6,12]. Since we compared the RAP of two
simultaneous ICP signals, the RAP of Sensors 1 and 2 were
derived from simultaneous 6-sec time windows (Figures 1a-
b).The Pearson correlation coefficient is a measure of
the strength of a relationship between two variables,
ranging from -1 to +1. When one variable changes in the

opposite direction of the other, the correlation
coefficient becomes negative, whereas the correlation
coefficient becomes positive when both variables change
in the same direction (Figures 1d-f). The closer the
correlation coefficient is to+or -1, the stronger is the
relationship between the two variables. The assumptions
for using the Pearson correlation coefficient during 4-
min periods as performed in this study were fulfilled:
Both the mean ICP and the MWA are continuous and
independent observations that follow a normal
distribution. Moreover, for intervals of 4-minute
duration, the correlation coefficient between these two
observations reflects a linear relationship.We further
compared two different methods of calculating the RAP:(i)
Method 1. According to method 1, a new RAP value was
calculated every 4 min period. Hence, for every
consecutive 4-min period the software determined the
Pearson correlation coefficient (RAP) values of the two
ICP signals (Figures 1c-d). The RAP scores could then be
trended as shown in Figure 2.

Figure 2
Trend plots of RAP [correlation coefficient (R) between
the intracranial pressure (ICP) wave amplitude (A) and
the mean ICP level (P)] of Signals 1 and 2 in patient 2.
For patient 2, the trend plots of (a) RAP determined
during 100 consecutive 4-min periods ...
(ii) Method 2. This method incorporates a moving time
window. A new RAP value is updated every 6 second.
Consequently, every 6 second, the ‘oldest’ averaged value
drops out and the ‘newest’ drops in. This approach was
previously described by others [18], except that in this
latter study the authors used 5 min intervals and
10 seconds windows, as compared to 4 min intervals and
6 seconds windows in the present paper.
Determination of baseline pressure errors (BPEs)

BPEs were defined as differences in mean ICP in
combination with close to identical MWAs (difference
between sensors <0.5 mmHg), as recently described in this
journal [15]. In this study, we determined the percentage
of recording time with BPEs of given magnitudes (5 mmHg≤
BPE<10 mmHg) for every patient.
Go to:
Results
Patients
The study enrolled a total of 16 aSAH patients, 8 females
and 8 males, with median age 58 (ranges 39 – 74) years
(Table 1, left). The distances between the two ICP
sensors are presented in Table 1, right and were: axially
median 11 (ranges 2-38) mm, coronally median 8 (ranges 3-
20) mm and sagitally median 9 (ranges 3-26) mm. No
adverse effects of the ICP monitoring were observed.

Table 1
Demographic data of the 16 patients included in the
study, and distance between Sensors 1 and 2
Method 1: comparison of 4-min RAP-values between signals
1 and 2
Table 2 left shows the number of 4-min RAP observations
obtained in the 16 patients. For all patients combined,
43,653 4-min RAP-values were available for analysis;
median number for the patients was 2,472 (ranges 1,090 –
5,522).Figure 1 illustrates how differences in RAP
between Signals 1 and 2 were associated with marked
differences in mean ICP whereas the MWAs remained close
to identical during the recording.
Table 2
Comparison of 4-min RAP-values between Signals 1 and 2

Simultaneous 4-min RAP scores (determined according to
method 1) from Signal 1 and Signal 2 are presented in
Table 2. While Table 2, middle, lists the RAP scores
(mean and±standard deviation) for each patient, Table 2,
right presents differences in RAP between the two signals
that were≥0.2, ≥0.4, and ≥0.6, respectively. Major
differences (≥0.4) in RAP were seen in 5 (31%) of 16
patients, including patients 1, 2, 8, 9, and 13 (Table 2,
right). The trend plots of RAP of the two signals are
visualized for subjects 2, 8, and 9 in Figures 2a,
a,3a, 3 a, and and4a, 4 a, respectively. The locations of the
ICP sensors for these three patients are shown on CT
scans in Figures 2b, b,3b, 3 b, and and4b, 4 b, respectively.
Figure 3
Trend plots of RAP [correlation coefficient (R) between
the intracranial pressure (ICP) wave amplitude (A) and
the mean ICP level (P)] of Signals 1 and 2 in patient 8.
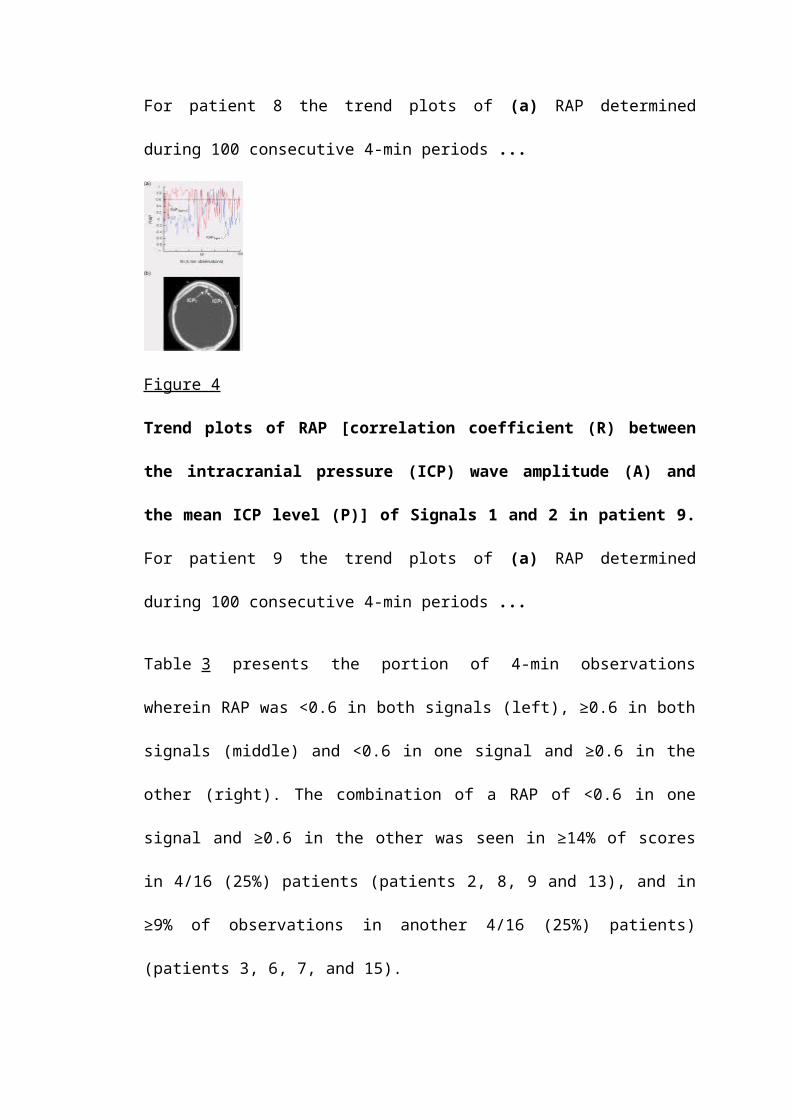
For patient 8 the trend plots of (a) RAP determined
during 100 consecutive 4-min periods ...
Figure 4
Trend plots of RAP [correlation coefficient (R) between
the intracranial pressure (ICP) wave amplitude (A) and
the mean ICP level (P)] of Signals 1 and 2 in patient 9.
For patient 9 the trend plots of (a) RAP determined
during 100 consecutive 4-min periods ...
Table 3 presents the portion of 4-min observations
wherein RAP was <0.6 in both signals (left), ≥0.6 in both
signals (middle) and <0.6 in one signal and ≥0.6 in the
other (right). The combination of a RAP of <0.6 in one
signal and ≥0.6 in the other was seen in ≥14% of scores
in 4/16 (25%) patients (patients 2, 8, 9 and 13), and in
≥9% of observations in another 4/16 (25%) patients)
(patients 3, 6, 7, and 15).

Table 3
Proportion of 4-min observations with RAP <0.6 in both
signals (left), RAP≥0.6 in both signals (middle) and RAP
≥0.6 in one signal while RAP<0.6 in another signal
(right) ...
Method 2: comparison of 6-sec RAP-values between signals
1 and 2
The 6-sec RAP observations of the 16 patients are shown
in Table 4. A total of 1,727,000 6-sec RAP values were
analyzed; median number for the 16 patients was 97,922
(ranges 42,162 – 220,276). Table 4, right shows
differences in RAP between the two signals that were
≥0.2, ≥0.4, and ≥0.6, respectively. Major differences
(≥0.4) in RAP were seen in 5 of 16 patients (31%),
including patients 1, 2, 8, 9, and 13 (Table 4, right).
Figure 5 illustrates that computation of RAP according to
methods 1 and 2 gave close to identical results, as

illustrated by the percentage of differences in RAP
between signals 1 and 2≥0.4.
Table 4
Differences in 6-sec RAP-values between Signals 1 and 2
Figure 5
Comparisons of methods 1 and 2 regarding percentage of
observations with differences in RAP ≥0.4 between signals
1 and 2. The percentages of RAP-differences ≥0.4 between
signals 1 and 2 were determined for each patient using
methods 1 ...
Table 5 presents the portion of 6-sec observations
wherein RAP was <0.6 in both signals (left), ≥0.6 in both
signals (middle) and <0.6 in one signal and ≥0.6 in the
other (right). The combination of a RAP of <0.6 in one
signal and ≥0.6 in the other in ≥8% of observations was

seen 8/16 (50%) patients (patients 2, 3, 6-9, 13 and 15).
Figure 6 further illustrates that the two different
methods of calculating the RAP gave similar results
regarding the percentage of observations where RAP was
<0.6 in one signal and ≥0.6 in the other.
Table 5
Proportion of 6-sec observations of RAP <0.6 in both
signals (left), RAP≥0.6 in both signals (middle) and RAP
≥0.6 in one signal while RAP<0.6 in another signal
(right) ...
Figure 6
Comparisons of methods 1 and 2 regarding percentage of
observations with discrepancy in RAP </≥0.6 between
signals 1 and 2. The percentages of observations wherein

one signal showed RAP ≥0.6 while the other showed RAP
<0.6 ...
BPEs of various magnitudes versus difference in RAP
Figure 7 presents the correlation between percentages of
BPEs of given magnitude (5 mmHg≤BPE<10 mmHg) and the
percentage of 4-min periods with RAP difference being
≥0.2 (Figure 7a), ≥0.4 (Figure 7b), and ≥0.6 (Figure 7c).
The correlation plots demonstrate that in patient
recordings with a high percentage of BPEs, there is also
a high percentage of marked differences in RAP, i.e. the
occurrences of differences in RAP are associated with the
occurrences of BPEs.
Figure 7

Correlation plots of percentages of baseline pressure
errors (BPEs) and RAP [correlation coefficient (R)
between the intracranial pressure (ICP) wave amplitude
(A) and the mean ICP level (P)]-differences. The
percentages of RAP-differences are plotted ...
Discussion
The main observation of this study was a marked
difference in RAP indices [moving correlation coefficient
(R) between the ICP wave amplitude (A) and the ICP (P)]
obtained from simultaneous registrations from two
separate, close-by ICP sensors of the same type. The
discrepancy in RAP between signals 1 and 2 was
independent of the use of a moving window with frequent
updates. The occurrences of differences in RAP were
associated with occurrences of baseline pressure errors
(BPEs). While the number of patients was rather small (n=
16), the number of RAP observations was high (total
43,653 4-min RAP observations and 1,727,000 6-sec RAP
observations), with a median number of RAP-observations
for each patient (median 2,472).

Clinical use of ICP-derived indices
ICP derived indices were introduced in the early 1990’s
to enhance the diagnostic information of ICP monitoring
[6,12]. In particular, the RAP index has been used as a
possible indicator of the intracranial pressure volume
compensatory reserve capacity [5,7,10,12]. Several
authors have found the RAP to be of value in the
surveillance of patients with TBI [6,9,10,12,19] and in
the diagnostic assessment of hydrocephalus [7,8,11]; then
proposing an upper normal threshold value of about +0.6
[6,8-11]. However, the clinical usefulness of this index
remains to be determined [20-22].
In contrast, as compared to RAP scores derived from
amplitudes computed using the frequency domain method
[6,12], we presently used an amplitude computed from the
time domain method (the MWA) [17]. The frequency- and
time-domain methods for calculating single pressure wave
amplitudes are not equivalent [23]. The time domain
method has the advantage of correctly identifying the
heartbeat-induced pressure waves versus artifact waves.

Using the frequency domain method, on the other hand, the
amplitude is retrieved from the first harmonic of the
power spectrum, hence providing an approximation of the
amplitude [23]. In this present work, which compared RAP
values, the mode of amplitude computation should not
affect the results.
It can be discussed how many data points that should be
used for computation of RAP. Most recent studies have
determined RAP from 40 data points separated by 6 seconds
over 4 min periods [3,7-9,11]. We used the same approach
in this present study.
Comparison of RAP scores from two simultaneous ICP
signals
Combining the present RAP findings with those of an
earlier study [16], differences in RAP are smaller when
comparing signals from similar ICP sensor types and
larger when comparing signals from different ICP sensor
types [16]. The largest differences were hence seen when
monitoring from one solid - and one fluid ICP sensor.

The present findings extend our previous observations of
marked differences in 4-min RAP when monitored
simultaneously from two separate ICP sensors [16]. A
difference in 4-min RAP ≥0.4 was hence seen in ≥8% of
observations in 5/16 (31%) patients. Determining the
proportion of 4-min observations wherein the RAP was ≥0.6
in one signal and <0.6 in another (above normal threshold
level in one sensor and below in the other) revealed this
setting in >14% of scores in 4/16 (25%) patients and >9%
of scores in another 4/16 (25%) patients. The combination
of above normal threshold level in one sensor and below
in the other is of particular importance because it
carries the potential to change the clinical decision
making process.
Determining the RAP every 4 min period (presently
referred to as method 1) carries the potential risk of
introducing high variability in the recorded value. In an
attempt to reduce the variation in calculated RAP, some
clinicians chose to use a moving window with updates
every 5-10 seconds [18]. Incorporating such a moving time
window with updates every 5-10 seconds means that the

‘oldest’ averaged value drops out and the ‘newest’ drops
in, thereby slightly altering the Pearson correlation
coefficient every 5-10 seconds. Presently we have shown
that incorporating such a moving time window with
frequent updates of RAP (method 2) do not reduce the
discrepancy in RAP between the two signals, as compared
to updating the RAP every 4-min period (method 1).
Another approach to reduce the variability in RAP is to
average scores over a long time period, e.g. 20-30 min.
However, averaging scores works as filtering of the
calculated values, and has the drawback of hiding
information. Averaging over long time periods will thus
extensively mask differences in RAP. This can be seen in
Table 2, left, where the average of RAP scores over many
hours of recording reveals only minor differences in the
RAP. From a clinical perspective, such multi-hour average
values are of limited interest. Since RAP is recommended
for use in the surveillance of critically ill patients,
short-term updates of RAP would be needed. Averaging over
20-30 minute periods has hence less relevance since

marked clinical deterioration may happen over such long
periods.
Obviously, it can be disputed which differences in RAP
that have clinical significance. In this context, it
should be remembered that ICP and ICP-derived indices
such as RAP are used in the surveillance of critically
ill patients. An erroneous measurement revealed to the
physician/nurse may represent potential harm to the
patient. In this present study cohort, one ICP sensor
showed RAP >0.6 while the other showed RAP <0.6 in about
1/10 observations (9-14%) in 8/16 patients. Given the
diagnostic importance of such an index in patient
management, we consider such a difference of clinical
significance.
In the present patients, ICP monitoring was done as part
of patient surveillance. Therefore, monitoring was
independent whether the EVD was open or closed, and
independent the opening pressure of the EVD. Since the
ICP sensors were placed close by within the brain, both

ICP sensors would be similarly impacted independent of
drainage through the EVD.
The RAP should be considered together with the mean ICP
since RAP may become de-coupled from the mean ICP when
mean ICP is very high (>20-40 mmHg) [12]. It should be
noted that mean ICP of the patients presented here was
well below 20 mmHg, as recently reported for this same
patient material [15].
Baseline pressure errors (BPEs)
In 2006 Eide [13] described the phenomenon of baseline
pressure errors (BPEs) when monitoring ICP simultaneously
from two separate ICP sensors. The BPEs were manifested
as marked differences in mean ICP combined with close to
identity in ICP wave parameters such as the MWA [13]. In
subsequent studies, BPEs could explain the differences in
mean ICP observed when the two sensors were placed in
different intracranial compartments [24,25]. By
monitoring simultaneously from two separate ICP sensors,
we have observed BPEs in solid sensors (Codman), air-
pouch sensors (Spiegelberg) and fluid sensors (Edward’s

Life science) [14]; indeed, BPEs have been observed in
every type of ICP sensors tested, the Raumedic Neurovent
P [26,27], the Codman [28], the Camino [29] and the
Spiegelberg [30] sensor. Our recent prospective
observational study has confirmed that BPEs occur
frequently in the clinical setting, and can be of a
magnitude that may affect clinical management [15]. BPEs
may also explain the abrupt shifts and drifts in the
relationship between mean ICP and MWA that are observed
when monitoring using merely one ICP sensor [31].
In an experimental study, Eide and Bakken [32], showed
that solid ICP sensors are sensitive to electrostatic
discharges (ESDs) and observed BPEs in the form of sudden
pressure shifts. Pressure drifts were thus seen following
ESDs. The BPEs were of a magnitude that could alter
patient management in a clinical setting given similar
changes in mean ICP. This observation has recently been
confirmed by others [33]. The cause of BPEs may be
different when recording from a fiber-optic ICP sensor, a
solid sensor based on the whetstone bridge principle, or
from an air-pouch type of ICP sensor. All technical

components of an ICP monitoring system (sensor, cable,
transducer, display) represent potential sites of origin
of BPEs. When monitoring ICP through an EVD, BPEs may in
addition be created by imperfect fluid connection caused
by air bubbles and debris, or through movement of the
sensor position (height) relative to the measurement site
[14].
Impact of BPEs on ICP-derived indices
As illustrated in Figure 1, the BPEs were revealed as
marked differences in mean ICP combined with close to
identical ICP waveform. The largest differences in RAP
were seen in patients 2, 3, 6, 7, 8, 9, 13, and 15
(Table 3). In these very same patients, there was also a
high frequency and severity of BPEs.
Given that BPEs cause alterations in mean ICP, it is to
be expected that every pressure index wherein the mean
ICP is incorporated also becomes affected. However, the
differences in RAP are less pronounced than the
differences in mean ICP. This is because the RAP also
incorporates the ICP amplitude, which is resistant to

BPEs. For this reason, indices solely based on static
pressure measures such as the pressure reactivity index
(PRx), which is the moving correlation between mean ICP
and mean arterial blood pressure (mean ABP) [34], can be
anticipated to be particularly susceptible to BPEs.
Due to the effect of BPEs on the RAP indices, its
feasibility as a guide in the management of neurosurgical
patients will be hampered. In our opinion, the divergence
in RAP from the two sensors is of such an extent that we
do not advocate the use of RAP in clinical practice. In
contrast, since the ICP wave amplitude is unaffected by
BPEs, the ICP wave amplitude is a robust parameter. Thus,
in a recent study comparing the ICP wave amplitude, ICP
wave slope, and RAP as measures of intracranial
compliance in head injury patients, the ICP wave
amplitude was found to be superior to the other
parameters [21].
Conclusions
Simultaneous monitoring from two separate, close-by ICP
sensors reveals significant differences in RAP that

correspond to the occurrence of BPEs. As differences in
RAP are of magnitudes that may alter patient management,
we do not advocate the use of RAP as a guide in the
management of neurosurgical patients.
References
1. Eide PK, Bentsen G, Sorteberg AG, Marthinsen PB,
Stubhaug A, Sorteberg W. A randomized and blinded
single-center trial comparing the effect of
intracranial pressure and intracranial pressure wave
amplitude-guided intensive care management on early
clinical state and 12-month outcome in patients with
aneurysmal subarachnoid hemorrhage. Neurosurgery.
2011;13(5):1105–1115. [PubMed]
2. Chesnut RM, Temkin N, Carney N, Dikmen S, Rondina C,
Videtta W, Petroni G, Lujan S, Pridgeon J, Barber J,
Machamer J, Chaddock K, Celix JM, Cherner M, Hendrix
T. Global Neurotrauma Research Group. A trial of
intracranial-pressure monitoring in traumatic brain
injury. N Engl J Med. 2012;13(26):2471–2481.

doi:10.1056/NEJMoa1207363. [PMC free article]
[PubMed]
3. Czosnyka M, Pickard JD. Monitoring and
interpretation of intracranial pressure. J Neurol
Neurosurg Psychiatry. 2004;13(6):813–821. [PMC free
article] [PubMed]
4. Hutchinson PJ, Kolias AG, Czosnyka M, Kirkpatrick
PJ, Pickard JD, Menon DK. Intracranial pressure
monitoring in severe traumatic brain injury. BMJ.
2013;13:f1000. [PubMed]
5. Czosnyka M, Smielewski P, Timofeev I, Lavinio A,
Guazzo E, Hutchinson P, Pickard JD. Intracranial
pressure: more than a number. Neurosurg Focus.
2007;13(5):E10. [PubMed]
6. Czosnyka M, Price DJ, Williamson M. Monitoring of
cerebrospinal dynamics using continuous analysis of
intracranial pressure and cerebral perfusion
pressure in head injury. Acta Neurochir (Wien)
1994;13(2–4):113–119. [PubMed]

7. Kim DJ, Czosnyka Z, Keong N, Radolovich DK,
Smielewski P, Sutcliffe MP, Pickard JD, Czosnyka M.
Index of cerebrospinal compensatory reserve in
hydrocephalus. Neurosurgery. 2009;13(3):494–501.
discussion 501-492. [PubMed]
8. Schuhmann MU, Sood S, McAllister JP, Jaeger M, Ham
SD, Czosnyka Z, Czosnyka M. Value of overnight
monitoring of intracranial pressure in hydrocephalic
children. Pediatr Neurosurg. 2008;13(4):269–279.
[PubMed]
9. Timofeev I, Czosnyka M, Nortje J, Smielewski P,
Kirkpatrick P, Gupta A, Hutchinson P. Effect of
decompressive craniectomy on intracranial pressure
and cerebrospinal compensation following traumatic
brain injury. J Neurosurg. 2008;13(1):66–73.
[PubMed]
10. Smith M. Monitoring intracranial pressure in
traumatic brain injury. Anesth Analg.
2008;13(1):240–248. [PubMed]

11. Weerakkody RA, Czosnyka M, Schuhmann MU,
Schmidt E, Keong N, Santarius T, Pickard JD,
Czosnyka Z. Clinical assessment of cerebrospinal
fluid dynamics in hydrocephalus. Guide to
interpretation based on observational study. Acta
Neurol Scand. 2011;13(2):85–98. [PubMed]
12. Czosnyka M, Guazzo E, Whitehouse M, Smielewski
P, Czosnyka Z, Kirkpatrick P, Piechnik S, Pickard
JD. Significance of intracranial pressure waveform
analysis after head injury. Acta Neurochir (Wien)
1996;13(5):531–541. discussion 541-532. [PubMed]
13. Eide PK. Comparison of simultaneous continuous
intracranial pressure (ICP) signals from a Codman
and a Camino ICP sensor. Med Eng Phys.
2006;13(6):542–549. [PubMed]
14. Eide PK, Holm S, Sorteberg W. Simultaneous
monitoring of static and dynamic intracranial
pressure parameters from two separate sensors in
patients with cerebral bleeds: comparison of

findings. Biomed Eng Online. 2012;13(1):66. [PMC
free article] [PubMed]
15. Eide PK, Sorteberg A, Meling TR, Sorteberg W.
Baseline pressure errors (BPEs) extensively
influence intracranial pressure scores: results of a
prospective observational study. Biomed Eng Online.
2014;13(1):7. [PMC free article] [PubMed]
16. Eide PK, Sorteberg W. An intracranial pressure-
derived index monitored simultaneously from two
separate sensors in patients with cerebral bleeds:
comparison of findings. Biomed Eng Online.
2013;13:14. [PMC free article] [PubMed]
17. Eide PK. A new method for processing of
continuous intracranial pressure signals. Med Eng
Phys. 2006;13(6):579–587. [PubMed]
18. Budohoski KP, Czosnyka M, de Riva N, Smielewski
P, Pickard JD, Menon DK, Kirkpatrick PJ, Lavinio A.
The relationship between cerebral blood flow
autoregulation and cerebrovascular pressure
reactivity after traumatic brain injury.

Neurosurgery. 2012;13(3):652–660. discussion 660-
651. [PubMed]
19. Czosnyka M, Citerio G. Brain compliance: the
old story with a new ‘et cetera’ Intensive Care Med.
2012;13(6):925–927. [PubMed]
20. Eide PK, Sorteberg W. Diagnostic intracranial
pressure monitoring and surgical management in
idiopathic normal pressure hydrocephalus: a 6-year
review of 214 patients. Neurosurgery. 2010;13(1):80–
91. [PubMed]
21. Howells T, Lewen A, Skold MK, Ronne-Engstrom E,
Enblad P. An evaluation of three measures of
intracranial compliance in traumatic brain injury
patients. Intensive Care Med. 2012;13(6):1061–1068.
[PubMed]
22. Eide PK, Kerty E. Static and pulsatile
intracranial pressure in idiopathic intracranial
hypertension. Clin Neurol Neurosurg. 2011;13(2):123–
128. [PubMed]

23. Holm S, Eide PK. The frequency domain versus
time domain methods for processing of intracranial
pressure (ICP) signals. Med Eng Phys.
2008;13(2):164–170. [PubMed]
24. Eide PK. Comparison of simultaneous continuous
intracranial pressure (ICP) signals from ICP sensors
placed within the brain parenchyma and the epidural
space. Med Eng Phys. 2008;13(1):34–40. [PubMed]
25. Eide PK, Sorteberg W. Simultaneous measurements
of intracranial pressure parameters in the epidural
space and in brain parenchyma in patients with
hydrocephalus. J Neurosurg. 2010;13(6):1317–1325.
[PubMed]
26. Citerio G, Piper I, Chambers IR, Galli D,
Enblad P, Kiening K, Ragauskas A, Sahuquillo J,
Gregson B. Multicenter clinical assessment of the
Raumedic Neurovent-P intracranial pressure sensor: a
report by the BrainIT group. Neurosurgery.
2008;13(6):1152–1158. discussion 1158. [PubMed]
27. Stendel R, Heidenreich J, Schilling A, Akhavan-
Sigari R, Kurth R, Picht T, Pietila T, Suess O, Kern
C, Meisel J, Brock M. Clinical evaluation of a new
intracranial pressure monitoring device. Acta
Neurochir (Wien) 2003;13(3):185–193. discussion 193.
[PubMed]
28. Koskinen LO, Olivecrona M. Clinical experience
with the intraparenchymal intracranial pressure
monitoring Codman MicroSensor system. Neurosurgery.
2005;13(4):693–698. discussion 693-698. [PubMed]
29. Gelabert-Gonzalez M, Ginesta-Galan V,
Sernamito-Garcia R, Allut AG, Bandin-Dieguez J,
Rumbo RM. The Camino intracranial pressure device in
clinical practice. Assessment in a 1000 cases. Acta
Neurochir (Wien) 2006;13(4):435–441. [PubMed]
30. Lang J-M, Beck J, Zimmermann M, Seifert V,
Raabe A. Clinical evaluation of intraparenchymal
spiegelberg pressure sensor. Neurosurgery.
2003;13(6):1455–1459. [PubMed]
31. Eide PK, Rapoport BI, Gormley WB, Madsen JR. A
dynamic nonlinear relationship between the static
and pulsatile components of intracranial pressure in
patients with subarachnoid hemorrhage. J Neurosurg.
2010;13(3):616–625. [PMC free article] [PubMed]
32. Eide PK, Bakken A. The baseline pressure of
intracranial pressure (ICP) sensors can be altered
by electrostatic discharges. Biomed Eng Online.
2011;13:75. [PMC free article] [PubMed]
33. Andresen M, Juhler M, Thomsen OC. Electrostatic
discharges and their effect on the validity of
registered values in intracranial pressure monitors.
J Neurosurg. 2013;13(5):1119–1124. [PubMed]
34. Eide PK, Sorteberg A, Bentsen G, Marthinsen PB,
Stubhaug A, Sorteberg W. Pressure-derived versus
pressure wave amplitude-derived indices of
cerebrovascular pressure reactivity in relation to
early clinical state and 12-month outcome following
aneurysmal subarachnoid hemorrhage. J Neurosurg.
2012;13(5):961–971. [PubMed]

1. WHAT
1) Apa topik dari jurnal tersebut?
Topik penelitian ini adalah Pengaruh kesalahan
tekanan awal pada indeks tekanan yang diturunkan
intrakranial : hasil studi observasional prospektif
2) Apa yang menjadi latar belakang dilakukan penelitian
tersebut?
a) Dalam rangka untuk mengkarakterisasi kapasitas
cadangan tekanan volume intrakranial , koefisien
korelasi ( R ) antara gelombang amplitudo ICP
( A ) dan tingkat rata-rata ICP ( P ) , indeks RAP
, telah digunakan untuk meningkatkan nilai
diagnostik pemantauan ICP.
b) Kesalahan dasar tekanan ( BPEs ) , yang disebabkan
oleh pergeseran spontan atau drift tekanan awal,
menyebabkan pembacaan yang salah dari rata-rata
ICP.
3) Apa tujuan dilakukannya penelitian tersebut ?

Penelitian ini dilakukan untuk mengetahui
pengaruh kesalahan tekanan awal pada indeks
tekanan yang diturunkan intrakranial
Penelitian ini dilakukan untuk mengeksplorasi
frekuensi dan tingkat keparahan perbedaan RAP ketika
menggunakan dua sensor ICP dari jenis yang sama.
2. WHEN
1) Kapan penilaian hasil penelitian tersebut dilakukan?
Penelitian ini dilakukan 5 menit dan 10 detik jendela,
dibandingkan dengan 4 interval menit dan 6 detik Pada
tahun 2010
3. WHERE
1) Dimana penelitian tersebut dilakukan?
Di University Hospital, Oslo, Norwegia.
4. WHO

1) Siapa yang melakukan penelitian tersebut ?
Per Kristian Eide
Angelika Sorteberg
Torstein R Meling
Wilhelm Sorteberg
2) Siapa yang menjadi responden dalam penelitian
tersebut?
Responden dalam penelitian ini adalah Penelitian
ini melibatkan 16 pasien Asah . Kami membandingkan
43.653 pengamatan RAP 4 - min sinyal 1 dan 2
( metode 1 ) , dan 1.727.000 6 - sec pengamatan
RAP ( metode 2 )
5. WHY
1) Mengapa penelitian tersebut dilakukan?
Guna menilai pengaruh kesalahan tekanan awal pada
indeks tekanan yang diturunkan intrakranial : hasil
studi observasional prospektif.
6. HOW
1) Bagaimana metode penelitian tersebut dilakukan ?
Sebuah studi observasional prospektif dilakukan pada
pasien dengan aneurisma subarachnoid hemorrhage

( Asah ) menjalani pemantauan ICP sebagai bagian
dari pengawasan mereka .
2. Bagaimana hasil dari penelitian tersebut ?
Penelitian ini melibatkan 16 pasien Asah . Kami
membandingkan 43.653 pengamatan RAP 4 - min sinyal 1
dan 2 ( metode 1 ) , dan 1.727.000 6 - sec
pengamatan RAP ( metode 2 ) . Kedua metode
perhitungan RAP menghasilkan hasil yang sama .
Perbedaan RAP ≥0.4 setidaknya 7 % dari pengamatan
terlihat pada 5/16 ( 31 % ) pasien . Selain itu,
kombinasi dari RAP dari ≥0.6 dalam satu sinyal dan <
0,6 yang lain terlihat pada ≥13 % dari RAP -
pengamatan di 4/16 ( 25 % ) pasien , dan pada ≥8 %
di lain 4/16 ( 25 % ) pasien . Frekuensi perbedaan
RAP > 0,2 secara bermakna dikaitkan dengan frekuensi
BPEs ( 5 mmHg ≤ BPE < 10 mmHg ) .
Kesimpulan
Pemantauan simultan dari dua terpisah , dekat dengan
sensor ICP menunjukkan perbedaan yang signifikan
dalam RAP yang sesuai dengan terjadinya BPEs .

Seperti perbedaan RAP adalah besaran yang dapat
mengubah manajemen pasien , kami tidak menganjurkan
penggunaan RAP dalam pengelolaan pasien bedah
saraf .

MIND MAPPING ABOUT T H E JOURNA L
1. 8 perempuan
2. 8 laki
koefisienkorelasi
Per Kristian Eide,
Angelika, Sorteberg
Pengaruh kesalahantekanan awal padaindeks tekanan yangditurunkan
Biomed Eng Online.
2014; 13: 99.
Published online Jul
23, 2014. doi: Kesalahan dasar tekanan(BPEs), yang disebabkanoleh pergeseran spontanatau drift tekanan awal,menyebabkan pembacaan
Adanya perbedaan antaraRAP Sinyal 1 dan 2dihubungkan denganperbedaan yang nyatapada rata-rata ICPsedangkan mwas tetap
Menunjukkan perbedaan RAPantara dua sinyal yangmasing-masing ≥0.2, ≥0.4,dan ≥0.6,. Perbedaan utama(≥0.4) dalam RAP terlihatpada 5 dari 16 pasien
Kesimpulan
Di dalam penelitian initidak terdapat efek
samping dalampemantauan ICP
Metode 2: perbandingan 6-sec RAP-nilai antara
Metode 1: perbandingan 4-min RAP-nilai antara

Dari kedua penelitian ini adalah perbedaan yang jelas dalam indeks
RAP [bergerak koefisien korelasi (R) antara gelombang amplitudo
ICP (A) dan ICP (P)] diperoleh dari pendaftaran simultan dari dua
sensor ICP terpisah, dekat dengan dari Jenis yang sama. Perbedaan
dalam RAP antara sinyal 1 dan 2 adalah independen dari penggunaan
jendela bergerak dengan sering update. Kejadian perbedaan RAP
dikaitkan dengan kejadian kesalahan tekanan awal (BPEs). Sementara
jumlah pasien agak kecil (n = 16), jumlah pengamatan RAP tinggi
(Total 43.653 pengamatan 4-min RAP dan 1.727.000 pengamatan 6-sec
RAP), dengan jumlah rata-rata RAP-pengamatan untuk setiap pasien
(median 2.472).