“Rumsfieldian Atheism: Skepticism and the Wake of Religious Disappointment.”
Upload
independentCategory
view
5download
0
Joy and disappointment in thehotel experience: managing
relationship segmentsMichael D. Johnson
Cornell University School of Hotel Administration, Ithaca, New York, USA, and
Line Lervik Olsen and Tor Wallin AndreassenBI Norwegian School of Management, Oslo, Norway
Abstract
Purpose – The objective of this research is to provide insight into the management of service qualityand emotions across customer relationships in the business-to-consumer market and to identify whichsegmentation method, i.e. conceptual versus data-driven, is more effective for this purpose.
Design/methodology/approach – A cross-sectional customer satisfaction survey conducted in thehotel industry was used to test the predictions. The respondents were Norwegian customers (n ¼ 689)of an international hotel chain, interviewed by telephone through a professional marketing researchbureau. Several statistical analyses were applied to analyze the data, i.e. Cluster, MANOVA andregression. The conceptual model was estimated using PLS.
Findings – It would appear that the weaker the relationship segment, the more quality-based anddisappointing is the customer experience. The stronger or closer the relationship segment, the morebalanced (with respect to price and quality) and joyful is the experience. One segmentation methodseems to be more efficient than the other in this context.
Research limitations/implications – The sample consists of Norwegian customers from the hotelindustry represented by the business customer segment. There are more men than women in thesamples.
Practical implications – The findings will allow service providers to develop more effectiveproduct-service-price offerings and manage the emotional responses of customers with whom theyhave very different relationships.
Originality/value – This is the first scientific study to examine just how the role of emotions variesacross relationship segments while comparing the findings from two different segmentationtechniques.
Keywords Customer satisfaction, Customer relations, Market segmentation, Individual psychology,Customer services quality
Paper type Research paper
IntroductionOne major challenge facing service providers today is adapting service levels to aheterogeneous customer base. Even a branded service has customers who are at verydifferent relationship stages. Consider two different hotel customers, where one is arepeat customer who has a strong relationship with the hotel and its staff and the otheris an infrequent visitor at best. Customer satisfaction for each customer is a complexcombination of perceptions and emotional responses. Yet each customer’s perceptionsand resulting emotions are likely to be categorically quite different and require verydifferent service responses.
The current issue and full text archive of this journal is available at
www.emeraldinsight.com/0960-4529.htm
MSQ19,1
4
Managing Service QualityVol. 19 No. 1, 2009pp. 4-30q Emerald Group Publishing Limited0960-4529DOI 10.1108/09604520910926782

Theoretically the role of emotions has become central to our understanding of theconsumption experience (Oliver, 1997). Prior studies show an impact of emotions onsatisfaction (Brown and Kirmani, 1999; Dube and Morgan, 1996; Mano and Oliver,1993; Oliver, 1993; Westbrook and Oliver, 1991), other research has examinedrelationship levels (Garbarino and Johnson, 1999), and relationship types (Gutek, e.g.1997, 1999; Gutek et al., 1999, 2000). No studies to our knowledge have examined justhow the role of emotion varies across relationship segments.
The goal of this study is to provide insight into the management of service qualityand emotions across customer relationships. To identify which segmentation methodis more effective we explore and compare two different ways of segmenting customers,i.e. one conceptual and one data driven. Three research questions are guiding ourstudy. First, what is the influence of perceived performance versus emotions onsatisfaction in different customer relationships? Second, how does the nature of theemotional response (joy vs disappointment) evolve with the relationship? Finally, howdoes the impact of a firm’s product-service-price mix on emotions change as therelationship change?
The answers to these questions provide service managers and employees with themeans to develop more effective product-service-price offerings for customers withwhom they have very different relationships. Armed with a better understanding ofboth the perceptions and emotions that customers experience, service providers cantruly customize their relationship management activities.
Perceived performance, customer satisfaction and emotionsCustomer satisfaction is the hub in a system that connects customer perceptions andemotional responses to subsequent behaviors and business performance. Customersatisfaction is defined as a customer’s overall evaluation of an offering’s performanceto date (Fornell et al., 1996). This satisfaction includes an offering’s ability to provide apleasurable level of consumption-related fulfillment (Oliver, 1997). Theory suggeststhat the more experiences one accumulates and integrates into this satisfactionevaluation the more affective and emotional the evaluation becomes (Oliver, 1999).
The marketing literature supports clear links from customer satisfaction to bothcustomer retention and business performance. For example, Bolton (1998) finds apositive effect of customer satisfaction on retention for cell phone customers, whileBolton and Lemon (1999) show a positive effect of satisfaction on customer usage oftelecom subscription services. Mittal and Kamakura (2001) show a strong albeitnonlinear effect of customer satisfaction on repurchase behavior for automobiles,where the functional form relating satisfaction to repurchase is marginally increasing.More recently Gustafsson et al. (2005) show significant effects of customer satisfaction,calculative commitment (switching barriers) and prior churn on customer retention fora range of telecom services. With respect to financial performance, customersatisfaction is positively associated with operating margin, return on investment,accounting returns and shareholder value (see Anderson et al., 2004). Finally, customer(dis)satisfaction has been linked to positive word of mouth (Anderson, 1998) and postswitching behavior due to negative word of mouth (Wangenheim, 2005). Both effectsimpact a firm’s ability to attract new customers and thus grow the top line.
Managingrelationship
segments
5

Customer satisfaction modelingThe importance of customer satisfaction underscores the need to understand just whatdrives satisfaction as an indication of what customers value in an offering (Best, 2004).Customer satisfaction modeling has emerged as an important means of estimating thestatistical impact of an offering’s benefits on customer satisfaction (Gustafsson andJohnson, 2004), which we use here to understand the combined effects of performanceperceptions and emotions on satisfaction.
There are a variety of marketing research methods for estimating the impact ofperformance benefits and emotions on customer satisfaction. Gustafsson and Johnson(2004) compared the common approaches to estimating satisfaction models and foundthat PLS (partial least squares) provided the most diagnostic estimates for qualityimprovement decisions. PLS is essentially an iterative estimation procedure thatintegrates principal-components analysis with multiple regression (Fornell and Cha,1994; Wold, 1982). A unique feature of PLS modeling is that the attributes that make upor operationalize any given performance benefit as a latent variable may be specifiedas either formative or reflective. This is important for our purposes as emotions areconceptualized as a combination of positive and negative emotions. In contrast,perceived price and quality are measured using multiple reflective measures of theunderlying benefits.
To examine whether there are any systematic changes in the levels of the latentvariables in the model, we run a series of analyses of variance models, across differentrelationship types. In keeping with Johnson and Selnes (2004) “type of relationship”and “level of commitment” are the categorical factors in these analyses.
Finally, we explore the effects of emotion and other latent variables on customersatisfaction. Also, the relationship between emotions and the other latent constructs isstudied. Both tests are performed using Baron and Kenny’s (1986) test of mediation. Inline with Gustafsson and Johnson (2004) we run Principal Component Regression (PCR)analyses. According to Gustafsson and Johnson (2004) PCR is an alternative toformative and reflective PLS. In this study PCR is used to replicate and extend theresults from the PLS analyses. Traditional PCR, is data driven and atheoretical(Gustafsson and Johnson, 2004). Hence, in our study we apply a variation of PCR as wewant to test our conceptual model and not let the data decide for us.
Emotions and satisfactionAs an overall evaluation established over time, satisfaction typically mediates theeffects of product quality, service quality and price or payment equity on retention(Bolton and Lemon, 1999). Although satisfaction models tend to focus on customers’more cognitive evaluations, cumulative satisfaction contains a significant emotional oraffective component created through repeated product or service usage (Oliver, 1999).
Within the growing literature on emotion in marketing, quite some attention hasbeen given to the role emotions play in a customer satisfaction model (Oliver, 1997;Bagozzi, Gopinath and Nyer, 1999). Studies have been conducted in various servicecontexts. To mention but a couple, Evrard and Aurier (1994) studied the relationshipbetween emotions and satisfaction during a movie experience. Price et al. (1995)investigated the relationship between emotions and satisfaction in extended, affectiveand intimate service encounters, while Mooradian and Olver (1997) looked at therelationship between personality, emotions, satisfaction and behavioral consequences.
MSQ19,1
6

Wirtz and Bateson (1999) integrated Russell’s (1980) model of affect into Oliver’s (1980)disconfirmation of satisfaction model in a home banking service and Liljander andStrandvik (1997) looked at the effects of negative versus positive emotions onsatisfaction in different emotional customer segments of a public labor force bureaux.More recently, Ladhari (2007) examines the bi-dimensional nature of disconfirmation ofexpectations, i.e. disconfirmation of cognitive expectations and affective expectations,using the movie experience again, as in the Evrard and Aurier (1994) study.
Contemporary research is very consistent regarding the role of emotions vis-a-visperceptions and satisfaction. This research supports positive and negative emotions aspartial mediators that connect performance perceptions to customer satisfaction lookto (Brown and Kirmani, 1999; Dube and Morgan, 1996; Mano and Oliver, 1993; Oliver,1993; Taylor, 1994; Westbrook and Oliver, 1991) also. Liljander and Strandvik (1997),among others discuss the role of affect as an independent contributor to satisfactiontogether with a cognitive construct. These two roles of affect, i.e. as a mediator on theone hand and an independent variable on the other, are not mutual exclusive, ratherperformance “can affect satisfaction either directly or indirectly through affect”(Liljander and Strandvik, 1997, p. 151) and Oliver, (1997). As such, improving price orquality performance levels both enhances positive emotions and lowers negativeemotions, which in turn improves customer satisfaction. Improved performance has adirect effect on satisfaction in addition to its indirect effect via emotions. This expectedcausality is consistent with the classical primacy of cognition hypothesis (e.g. Zajonc,1998) where appraisals are assumed to begin with cognitions (Oliver, 1997), i.e.customers evaluating and judging service features such as price and quality. Does thesequence of events always begin this way? Several researchers have raised thisquestion (e.g. Oliver, 1997, Zajonc, 1980, 1998). Both Oliver (1997) and Zajonc (1998)conclude that it can be easily “defended for primacy of affect on several grounds”(Zajonc, 1998, p. 613). “In fact”, as summarized by Oliver (1997, p. 310) even “aback-and-forth interplay of emotions and cognition over time is not unusual”. Ascustomers of today tend to engage in different service provider relationships, ofvarious length and complexity, the nature of the relationship will most likely influenceand even alternate the sequence of events in the evaluation process (Liljander andStrandvik, 1997). Although, the “cognition first, emotion second” sequenceencompasses a large number of consumption situations” (Oliver, 1997, p. 310).
Another stream of research explores the role of emotions in service recoverysituations. Andreassen (1999) demonstrates how emotions have a negative impact onsatisfaction and future behavioral intent over a wide variety of services. Smith andBolton (2002) show how the effect of emotional responses on satisfaction depends onthe industry and the customer’s point of reference. They find no effect of emotions onsatisfaction in a restaurant setting where the reference point is any given serviceprovider, but a significant effect in a hotel setting where the reference point is aparticular chain. Two other findings from this study are pertinent to ours. First,emotions had greater influence on more transaction-based evaluations, which are akinto the weaker relationships in our segmentation scheme. Second, the more negative theemotions, the more thoroughly customers’ evaluated the service provider’sperformance and the greater its impact on satisfaction.
Managingrelationship
segments
7
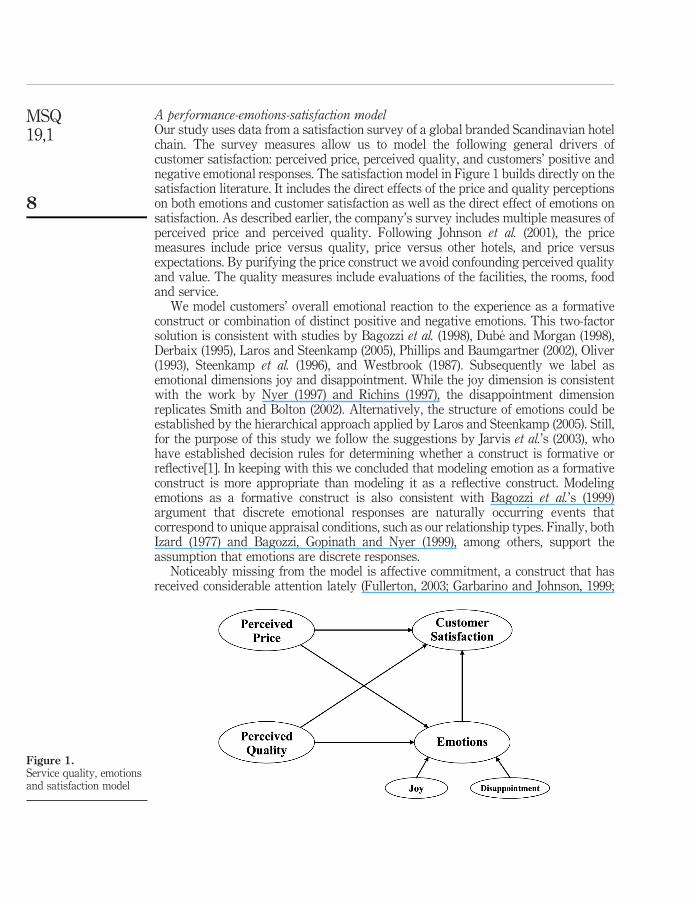
A performance-emotions-satisfaction modelOur study uses data from a satisfaction survey of a global branded Scandinavian hotelchain. The survey measures allow us to model the following general drivers ofcustomer satisfaction: perceived price, perceived quality, and customers’ positive andnegative emotional responses. The satisfaction model in Figure 1 builds directly on thesatisfaction literature. It includes the direct effects of the price and quality perceptionson both emotions and customer satisfaction as well as the direct effect of emotions onsatisfaction. As described earlier, the company’s survey includes multiple measures ofperceived price and perceived quality. Following Johnson et al. (2001), the pricemeasures include price versus quality, price versus other hotels, and price versusexpectations. By purifying the price construct we avoid confounding perceived qualityand value. The quality measures include evaluations of the facilities, the rooms, foodand service.
We model customers’ overall emotional reaction to the experience as a formativeconstruct or combination of distinct positive and negative emotions. This two-factorsolution is consistent with studies by Bagozzi et al. (1998), Dube and Morgan (1998),Derbaix (1995), Laros and Steenkamp (2005), Phillips and Baumgartner (2002), Oliver(1993), Steenkamp et al. (1996), and Westbrook (1987). Subsequently we label asemotional dimensions joy and disappointment. While the joy dimension is consistentwith the work by Nyer (1997) and Richins (1997), the disappointment dimensionreplicates Smith and Bolton (2002). Alternatively, the structure of emotions could beestablished by the hierarchical approach applied by Laros and Steenkamp (2005). Still,for the purpose of this study we follow the suggestions by Jarvis et al.’s (2003), whohave established decision rules for determining whether a construct is formative orreflective[1]. In keeping with this we concluded that modeling emotion as a formativeconstruct is more appropriate than modeling it as a reflective construct. Modelingemotions as a formative construct is also consistent with Bagozzi et al.’s (1999)argument that discrete emotional responses are naturally occurring events thatcorrespond to unique appraisal conditions, such as our relationship types. Finally, bothIzard (1977) and Bagozzi, Gopinath and Nyer (1999), among others, support theassumption that emotions are discrete responses.
Noticeably missing from the model is affective commitment, a construct that hasreceived considerable attention lately (Fullerton, 2003; Garbarino and Johnson, 1999;
Figure 1.Service quality, emotionsand satisfaction model
MSQ19,1
8

Gustafsson et al., 2005; Verhoef, 2003). Marketing scholars have variously definedrelationship commitment as a desire to maintain a relationship (Moorman et al., 1992;Morgan and Hunt, 1994), a pledge of continuity between parties (Dwyer et al., 1987), thesacrifice or potential for sacrifice if a relationship ends (Anderson and Weitz, 1992), orthe absence of competitive offerings (Gundlach et al., 1995).
The various definitions suggest two major dimensions of relationship commitment,affective and calculative or continuance commitment (Fullerton, 2003; Hansen et al.,2003; Johnson et al., 2001). Affective commitment is a hotter or more emotional factorthat develops through the degree of reciprocity or personal involvement that acustomer has with a company, which results in a higher level of trust and commitment(Garbarino and Johnson, 1999; Morgan and Hunt, 1994). Calculative commitment is thecolder or more rational, economic-based dependence on product benefits due to a lackof viable competitive alternatives (Anderson and Weitz, 1992; Dwyer et al., 1987; Heideand John, 1992), which operates with customer satisfaction and past behavior to predictretention (Gustafsson et al., 2005).
As previously mentioned, affective commitment is not in the model per se because itmay serve as an ideal basis for operationalizing customer segments that are low,medium or high with respect to their personal relationship and resulting commitmentto a hotel. Because affective commitment is used outside the model to segmentcustomers, we exclude it from the satisfaction model. This avoids any problemsassociated with using commitment as both an endogenous and exogenous construct.
Relationship typologyFrom seminal works in the inter-organizational marketing literature (see for exampleMacCaulay, 1963; MacNeil, 1974, 1978, 1980; Dwyer et al., 1987; Noordweier et al., 1990;Heide, 1994), we have learned that the nature of an exchange should fall somewhere onthe continuum between a discrete transaction and a relationship. In the servicemarketing literature, several researchers as for example Liljander and Strandvik (1995)and Lovelock (1983) apply this continuum when distinguishing between the serviceencounter and a relationship. Breaking away from the traditional perspective analternative typology is suggested by Gutek et al. (1995, 1997, 1999, 2000). Underlyingtheir framework is the suggestion that customer/service provider contacts initiallymay be viewed as interactions between strangers. They refer to the differentinteraction types as service encounters, pseudo or service relationships. As such thesedifferent interaction types will most likely include different dimensions that vary indegree of rationality and affectivity. In their conceptual description of the differenttypes of service relationships, Gutek et al. (1995, 1997, 1999, 2000) suggest that aservice encounter takes place between two strangers who do not expect to interact inthe future. They argue that customers consider service providers to be functionallyequivalent and therefore interchangeable. A pseudo relationship is a hybrid of theservice encounter and the service relationship. It takes place when the customer returnsto the same organization time and again but interacts with different service providerseach time (e.g. Gutek, 1999). Customer information is stored so it is available to any ofthe organization’s service providers any time. A typical example would be a customerloyalty program, such as a frequent flier milage program or a hotel’s frequent stayerprogram. Finally, a service relationship occurs when a customer has repeated contactwith a particular provider. Customers and provider get to know each other, both as
Managingrelationship
segments
9

individuals and as role occupants (e.g. Gutek, 1999). The customer perceives andexperiences a special connection with the front line service provider.
An alternative to Gutek et al.’s typology yet likely related is to segment customers’based on their degree of affective commitment to the supplier. Affective commitment iscentral to relationship typologies in marketing. Johnson and Selnes (2004) exploredhow value is created in buyer-supplier relationships as affective commitment growsfrom acquaintances, to friends, to partners. More transaction-based or acquaintancerelationships are effective as long as the supplier provides an offering that issatisfactory at a price that is perceived as fair. Repetitive interactions createfamiliarity, which facilitates marketing, sales and service. Friendships evolve when asupplier provides buyers with a differentiated offering that generates not justsatisfaction, but a level of trust in the relationship. The flow of information betweenbuyer and supplier is greater, which enables suppliers to adapt to changes in customerneeds, communicate them through the organization, and produce improved productsand services (Kohli and Jaworski, 1990; Narver and Slater, 1990). Partnerships requirehigher levels of commitment in the form of information sharing and relationshipspecific investments (Morgan and Hunt, 1994). Products and service becomecustomized, not just differentiated, which leads to higher levels of personalcommitment.
Psychologically, affective commitment is a natural continuum on which to segmentcustomers across a relationship typology. However, while we expect emotionalresponses to vary with commitment level there are competing arguments as to how.One argument, from traditional attitude theory, is that stored evaluations and attitudesbecome more affective and emotionally charged with repeated experience. Forexample, Oliver’s (1999) loyalty framework suggests that the affective component inoverall satisfaction evaluations grows with a customer’s experience and commitment.The logic is that the cognitive component of the evaluation predominates when anattitude is forming while the affective component grows with attitude strength (Pettyet al., 1995; Priester et al., 2004). With reference to our model in Figure 1, this argumentsuggests that customers’ emotions have greater impact on customer satisfaction asaffective commitment increases.
An alternative prediction is that emotions have more impact when relationshipcommitment is low because of the valence (negativity versus positivity) of the emotions(Andreassen and Lindestad, 1998). This prediction rests on the observation thatweaker relationships are marked by lower levels of customer satisfaction (Gustafssonet al., 2005) based on a higher incidence of “things gone wrong”. That “losses loomlarger than gains” is one of the most generalized findings in decision research(Kahneman and Tversky, 1979). Within a customer satisfaction context, this suggeststhat the more negative emotions that accompany lower levels of commitment havegreater impact on customer satisfaction, while the more positive emotions thataccompany higher levels of commitment have less impact on satisfaction.
This prediction is consistent with the observation that individuals who arerelatively dissatisfied based on a negative evaluative or emotional state use moredetailed and elaborate evaluation processes (Smith and Bolton, 2002). The prediction isalso consistent with Anderson’s (1998) study of word of mouth as a function ofcustomer (dis)satisfaction. He finds that customer dissatisfaction results insignificantly higher levels of negative word of mouth than does satisfaction result in
MSQ19,1
10

positive word of mouth. Finally, the prediction is consistent with the notion thatemotions play a greater role in transaction-specific evaluations of satisfaction ratherthan more cumulative evaluations (Smith and Bolton, 2002). Customer expectations aresimply less likely to be met when customers have limited experience with an offering.Experienced customers, in contrast, should have more accurate expectations andexperience fewer surprises (Johnson et al., 1995; Rust et al., 1999).
PredictionsWe summarize the discussion by making explicit predictions both with respect to theconceptual model and how changes in affective commitment and relationship typeaffect the model. As we rely on a model structure that is well supported in theliterature, we expect all of the paths in Figure 1 to be significant. At the same time, weexpect the degree to which price versus quality impact emotions and/or satisfaction tobe very context or value-proposition dependent. Our focal predictions are competingregarding the effects of emotions on satisfaction. Using an attitude-theory argument,we expect the impact of emotions to increase with affective commitment as thestrength of the attitude grows. Relying more on the valence of the emotions, analternative prediction is two-fold. First, the higher the affective commitment orstronger the relationship, the less negative and more positive are the emotions. Second,the more positive emotions that accompany stronger relationships have less influenceon customer satisfaction than do the negative emotions that accompany weakerrelationships.
Hotel studyMethodologyWe tested our predictions using cross-sectional customer satisfaction survey data froman international hotel chain. The respondents were Norwegian customers of the chaininterviewed by telephone (CATI) through a professional marketing research bureau.Prospective respondents, who were not available on the first call, were called backthree times before a substitute was picked. Each interview lasted approximately 15minutes. There were in total 689 hotel customers interviewed in this study. Overall thesample was 87 percent male with a median age of 56 and median income of almost95,000 USD (620,000 NOK).
Survey measures and emotion dimensionsAll of the survey measures used to estimate the model in Figure 1 are listed in Table I.As noted, the hotel chain’s price levels were evaluated using three reflective measures:price versus quality, price versus other hotels, and price versus expectation. Perceivedquality was also measured using three reflective measures: quality of the facilities andequipment, quality of the products (the room and breakfast), and the service levels inreception, housekeeping and the restaurant. Customer satisfaction, as an overallevaluation of the customers experience with the hotel chain, was measured using threeestablished reflective measures: overall satisfaction, overall performance versusexpectations, and overall performance versus an ideal hotel (Fornell et al., 1996).
Each survey respondent also rated their emotional reactions to their experienceswith the hotel on 12 uni-polar questions asking the respondent to express to whatextent each emotion describes their own feeling as recommended by Bagozzi, Gopinath
Managingrelationship
segments
11

and Nyer (1999). The questions were adapted from classical studies on emotions (seeOliver, 1997; Westbrook and Oliver, 1991). These included ratings of joy, elation,enthusiasm, satisfaction, indifference, disappointment, frustration, irritation, disliking,contempt, hatred and anger. An exploratory principal components analysis of theseratings (with varimax rotation) revealed two primary emotional dimensions, onepositive and one negative. These results are consistent with previous research by, e.g.Liljander and Strandvik (1997), Oliver (1993, 1997), Bagozzi, Wong and Yi (1999) andLaros and Steenkamp (2005). They were the only two dimensions with Eigenvaluesgreater than one and explain 72 percent of the variation among the measures. Thehighest loadings for the positive dimension were for joy, elation and enthusiasm. Thehighest loadings for the negative dimension were for disappointment, frustration,irritation and disliking. The satisfaction rating was dropped from further analysisbecause of its conceptual overlap with our satisfaction latent variable. The indifferencerating was also dropped as it did not load highly on either of the two major dimensions.
The contempt, hatred and anger dimensions were unique in that they loadedpositively on the negative emotion dimension (although none as high as the fourmeasures of disappointment) and positively on the joy dimension (although none ashigh as the three measures of joy). In initial tests of the model we explored using thesemeasures to create a third emotion dimension, which we termed hatred to capture themore extreme emotions. The impact of this factor never approached significance andwas subsequently dropped from the models. Again, these results support the twofactor solution identified in earlier research.
We subsequently created two indices to capture the positive and negative emotions.The negative index included ratings of the joy, elation and enthusiasm that customershave for the hotel, which we label joy. The negative index included ratings ofdisappointment, frustration, irritation and disliking, which we label disappointment.Principal components analysis was used to extract the first component of each separateset of measures to operationalize these dimensions. For the joy dimension, the index
Construct Measures AVE
Perceived quality 1. Quality of facilities and equipment LC ¼ 0.7092. Quality of products such as the room and
breakfastMC ¼ 0.646
3. Quality of the service levels in reception,housekeeping and the restaurant
HC ¼ 0.700
Perceived price 1. Price versus quality LC ¼ 0.8002. Price versus other hotels MC ¼ 0.7483. Price versus expectations HC ¼ 0.762
Emotions 1. Joy index LC ¼ 0.6622. Disappointment index MC ¼ 0.596
HC ¼ 0.535
Customer satisfaction 1. Overall satisfaction LC ¼ 0.7662. Overall performance versus expectation MC ¼ 0.6913. Overall performance versus an ideal hotel HC ¼ 0.662
Notes: LC ¼ low commitment, MC ¼ medium commitment and HC ¼ high commitment. Theperceived quality and perceived price measures are rated on scales of 1 (poor) to 10 (excellent)
Table I.Model constructs, surveymeasures and AVE byrelationship segment
MSQ19,1
12

explains 90 percent of the variation among the ratings. For the disappointmentdimension, the index explains 83 percent of the variation among the ratings. In our PLSmodels, these two dimensions are used as formative indicators of customers’ overallemotional reaction to the hotel experience.
Relationship segmentsIn an effort to identify the more effective method of relationship segmentation wecontrast Gutek et al.’s framework (1995, 1997, 1999, 2000) with a segmentation methodbased on level of affective commitment.
Gutek et al.’s work requires screening statements in which customers reportwhether they attend a regular “contact person” or “a clinic”. A regular “contact person”classifies as a service relationship. A regular “clinic”, implies a pseudo relationship. Ifneither of the above is true, then the incident is defined as a service encounter. Thehotel industry is not a context were it is common to approach the same contact personeach time. For this reason special selection criteria had to be developed to identify theright respondents for each type of interaction. These selection criteria were alsodeveloped in line with Gutek et al.’s work (1995, 1997) and in cooperation with themanagement of the hotel chain. Gutek’s statements were used as complementaryquestions. In order to identify service relationship customers, respondents with at leastten stays at the same hotel over the past 12 months were selected. Pseudo relationshipcustomers had to stay at least at ten different hotels during the last 12 months. Serviceencounter customers were required to have only one stay at a hotel over the last 12months. The hotel chain provided customer lists for each sample. This segmentationmethod provided us with 142 service encounter customers, 247 pseudo relationshipcustomers and 300 service relationship customers. As very few have little or noexperience with hotels it was difficult to obtain respondents for the service encountergroup. In the service encounter sample, ten respondents reported having a regularcontact person (7 percent), compared with six respondents (2 percent) reporting thesame in the pseudo relationship sample, and 34 (11 percent) in the service relationshipsample. This suggests that in the hotel industry customers engaging in servicerelationships are more likely to have a regular contact person than those in a serviceencounter or pseudo relationship.
Table II reports descriptive statistics for the three service relationships based onGutek et al.’s typology.
In order to develop three significantly different relationship commitment segmentswe used our three measures of affective commitment as input to latent clusteringanalysis (Vermunt and Magidson, 2003). The commitment measures were Likertratings of three statements that reflect the personal relationship and commitmentbetween the hotel and its guest:
(1) “I stay with the hotel because I feel like part of the family”;
(2) “I stay with the hotel because I appreciate the hotel and the people workingthere”; and
(3) “I stay with hotel because I like the hotel and the people working there”.
A three-cluster solution was estimated to be theoretically consistent with existingrelationship typologies (Johnson and Selnes, 2004). This yields a highly significantsolution with 234, 339 and 116 customers in the low commitment, medium commitment
Managingrelationship
segments
13

and high commitment segments respectively (Log likelihood ¼ 23; 568:707,R 2 ¼ 0:897).
Table III reports descriptive statistics for the three clusters across the three affectivecommitment measures as well as the three customer satisfaction measures (all onten-point scales) and the two emotion dimensions (standardized principal componentscores).
To explore the relationship between the two segmentation methods, we rancrosstabs analysis on “relationship type” by “commitment level”, see Table IV.
From Table IV we see that all three levels of commitment are represented in eachrelationship type. Indicating that even service encounter customers may be highlycommitted. We do also find the opposite situation that service relationship customersmay sometimes be low in their commitment.
Comparing MANOVA results (see Table V), the three relationship groupssuggested by Gutek and colleagues, show a general trend of increasingly more positivescore as the relationship evolve.
However, this segmentation methodology provides fewer significant differencesacross relationships. In general, it seems like service encounter customers are lesssatisfied, think less of the price, and experience less joy than the service relationship
Descriptor Service encounter Pseudo relation Service relation
Segment size 142(20.60%)
247(35.84%)
300(43.54%)
Affective commitment measures (means):1. “I stay with the hotel because I feel like part
of the family.” 5.93 6.88 7.152. “I stay with the hotel because I appreciate
the hotel and the people working there.” 6.72 7.27 7.553. “I stay with the hotel because I like the
hotel and the people working there.” 6.44 7.12 7.60
Customer satisfaction measures (means):1. Overall satisfaction 7.28 7.47 7.642. Overall performance versus expectations 6.76 6.90 7.013. Overall performance versus ideal 6.36 6.95 6.85
Price (means):1. Price versus quality 6.85 6.69 7.492. Price versus other hotels 6.76 6.53 7.233. Price versus expectations 6.77 6.36 7.06
Quality (means):1. Quality of facilities and equipment 6.99 7.00 6.902. Quality of products such as room and
breakfast 6.97 7.14 7.143. Quality of the service levels in reception,
housekeeping and the restaurant 7.15 7.28 7.72
Emotion dimensions (standardized means):1. Joy 20.138 20.063 0.1172. Disappointment 20.125 0.138 20.054
Table II.Mean score byrelationship typesegments
MSQ19,1
14

customers do. The pseudo relationship customer group is not significantly differentfrom the service encounter customer group on any account except they seem to be moredisappointed in the service provider. Compared to the service relationship group, thepseudo relationship customers are, less happy with the price and find the service lessjoyful and again they are more disappointed in the service provider. Despite, their lackof affection towards the service provider, they seem to think that the hotels they havestaid at are closer to the ideal, than service encounter and relationship customers thinkof their hotels (see Table II for this result). This finding may be explained by the
Descriptor
Lowaffective
commitment
Mediumaffective
commitment
Highaffective
commitment
Segment size 234(35.29%)
339(47.95%)
116(16.76%)
Affective commitment measures (means):1. “I stay with the hotel because I feel like part of the
family.” 4.312 7.562 9.8952. “I stay with the hotel because I appreciate the
hotel and the people working there.” 4.980 8.028 10.0003. “I stay with the hotel because I like the hotel and
the people working there.” 4.892 7.927 9.936
Customer satisfaction measures (means):1. Overall satisfaction 5.811 7.197 8.3442. Overall performance versus expectations 6.333 7.805 8.9913. Overall performance versus ideal 5.740 7.046 8.127
Price (means):1. Price versus quality 6.189 7.239 8.2872. Price versus other hotels 6.134 6.999 8.0083. Price versus expectations 6.048 6.871 7.732
Quality (means):1. Quality of facilities and equipment 6.201 7.398 8.5002. Quality of products such as room and breakfast 6.166 7.118 8.0433. Quality of the service levels in reception,
housekeeping and the restaurant 6.184 7.272 8.474
Emotion dimensions (standardized means):1. Joy 20.706 0.155 0.9722. Disappointment 0.318 20.047 20.504
Table III.Mean score by
relationship commitmentsegments
Service encounterPseudo
relationship True relationship
Low commitment 69 10% 79 11.5% 86 12%Medium commitment 59 8.5% 147 21% 133 20%High commitment 14 2% 21 3% 81 12%Total 142 247 300 689/100%
Table IV.Relationship type by level
of commitment
Managingrelationship
segments
15

different points of reference when comparing distance to ideal point. Pseudorelationship customers may use the hotel chain as point of reference whereas truerelationship customers may use the contact person as point of reference – leaving moreto be desired.
Bottom line, when we apply Gutek et al.’s relationship categories we find that thethree categories are not significantly different from each other in all respects. That isservice encounters seem to be significantly different from service relationships, butoverall pseudo relationships customers are not different from service encountercustomers. Thus, we interpret these categories as evolutionary stages in a servicerelationship development process rather than distinct different relationship types.Alternatively, as more significant differences are found from the pseudo relationshipgroup to true relationship group, this may indicate two distinct realationshipcategories rather than three. Under any circumstances, in this evolutionary process wefind support for the first part of the alternative prediction, in which we suggest that thehigher the affective commitment or stronger the relationship, the less negative andmore positive are the emotions. Therefore, we do note that emotion seems to be aconcept that may pose distinctions between the groups.
Applying the commitment segmentation methodology, MANOVA models seeTable VI, support significant differences across all three segments on each set of themeasures in the table.
The affective commitment segments vary predictably with respect to the level ofsatisfaction, which is consistent with Gustafsson et al.’ (2005) empirical study and
Low affectivecommitmentðn ¼ 234)
Med. affectivecommitmentðn ¼ 339Þ
High affectivecommitmentðn ¼ 116Þ
Satisfaction 20.753 0.190 0.964Price 20.506 0.097 0.739Quality 20.667 0.127 0.975Joy 20.706 0.155 0.972Disappointment 0.318 20.047 20.504
Notes: All means are standardized. All mean scores are significantly different across groups atp , 0:05
Table VI.MANOVA results:relationship type by levelof commitment
Service encounters (a)ðn ¼ 142Þ
Pseudo relationships (b)ðn ¼ 247Þ
True relationships (c)ðn ¼ 300Þ
Satisfaction 20.180 * * * 0.022 0.066 *
Price 20.054 * * * 20.235 * * * 0.219 *, * *
Quality 20.087 20.015 0.054Joy 20.138 * * * 20.063 * * * 0.117 *, * *
Disappointment 20.125 * * 0.138 *, * * * 20.054 * *
Notes: All means are standardized; *, * *, * * * indicate significant difference from respective group atp , 0:05
Table V.MANOVA results:relationship type segment
MSQ19,1
16

Johnson and Selnes’ (2004) relationship typology (where satisfaction increases fromacquaintances, to friends, to partners).
The emotion dimensions are particularly interesting as they support a distinctevolution of emotions. As affective relationship commitment increases, there is asystematic decrease in disappointment and increase in joy. This finding supports thefact that business to consumer relationship take on fundamentally different forms ascustomers evolve through different phases or stages of a relationship (Bendapudi andBerry, 1997), which explains customers’ commitment and loyalty to the serviceprovider.
So far in this study, we have seen that both segmentation methods support theprediction that emotions become more positive as relationship evolves. We do also findthat applying commitment level rather than relationship type is a more efficientsegmentation tool. When applying commitment as segmentation variable, therespective groups become intra homogenous and inter heterogenous, which are crucialcriteria that must be met (e.g. Kotler, 1994). In keeping with our finding we will conductthe remaining analyses in the three commitment groups only. We will refer to these asrelationship segments.
Estimation resultsOur next step was to estimate the conceptual model using PLS for each of the threecommitment based relationship segments. PLS models are evaluated on the reliabilityof the reflective constructs, the discriminant validity of the reflective constructs, thesize and significance of the path coefficients, and the ability of the model to predict (inthis case customer satisfaction). Note that the reliability and discriminant validitycriteria do not apply to formative constructs (in this case emotions), as such constructsare conceptually defined by their sub-dimensions (Bagozzi and Yi, 1994; Fornell andCha, 1994). The reliability criterion is referred to as communality or AVE (averagevariance extracted; see Fornell and Larcker, 1981) in the case of the standardizedresults reported in Table I. The AVE criteria should exceed 0.5, which is the case for allthe reflective constructs in the models. The discriminant validity of the reflectiveconstructs is supported by the fact that their squared correlations are lower than theircorresponding AVEs (Fornell and Larcker, 1981).
The path coefficients for all three models are presented in Table V along with thevariance explained in emotions and customer satisfaction. We subsequently used themeasurement weights from the PLS models to operationalize the latent variables andrerun the final linear models. The purpose is twofold:
(1) to test the statistical significance of the path coefficients for each group; and
(2) to test for differences across the segments by combining the segments andtesting for interactions.
These group-level results completely replicate the PLS output. We then included afixed factor to test for differences across all three segments by estimating a series ofgeneral linear models. Table VII notes which paths in the individual models are notsignificant, and where the paths change significantly from level to level based onsignificant interactions in the general linear models.
The most interesting results for our investigation relate to changes in the pathcoefficients across relationship segments. Notice that the direct effect of emotions on
Managingrelationship
segments
17

satisfaction drops significantly as the customer relationships get stronger. This resultis consistent with the observation that the stronger the relationship segment, the lessdisappointing and more joyful the experience. As losses loom larger than gains, themore negative emotions in the low commitment segment have a larger net impact onsatisfaction. Observe that the relationship segments are very similar with respect to thedirect effects of price and quality on customer satisfaction, where all three segmentsare more quality sensitive than price sensitive. Although price does not have asignificant direct effect on satisfaction when each segment is analyzed separately, itdoes have a significant direct effect on both satisfaction and emotions when all threesegments are combined in a general linear model.
The impact of price directly on emotions increases with relationship strength,although the interaction is not significant. There is, however, a significant interactionor decrease in the impact of quality on emotions as relationship strength increases. Theimpact of quality on emotions is three times larger for the low commitment segment(0.493) than for the high commitment segment (0.134). When the price and qualityresults are combined, it becomes clear that the disappointment experienced by lowcommitment customers is predominantly quality-based, while the joy experienced byhigher commitment customers is more price-based.
Finally the increasingly positive emotions that accompany increased relationshipcommitment show a clear pattern with respect to joy and disappointment. The higherthe commitment, the systematically higher the contribution of joy and lower thecontribution of disappointment on emotions (both interactions are significant). Thesefinding are consistent with the prediction and finding that the problems that result inlower satisfaction for low commitment customers loom larger than the gainsexperienced by higher commitment customers. In contrast, our findings are
Model parameter
Low affectivecommitment
(n ¼ 234)
Medium affectivecommitment
(n ¼ 339)
High affectivecommitment
(n ¼ 116)Significant change**
(from low to high?)
Price !Satisfaction 0.084 * 0.064 * 0.106 * NoQuality !Satisfaction 0.511 0.570 0.560 NoEmotions !Satisfaction 0.330 0.240 0.192 YesPrice !Emotions 0.155 0.231 0.370 NoQuality !Emotions 0.493 0.405 0.134 * YesJoy ! Emotions 0.627 0.788 0.847 YesDisappointment! Emotions 20.601 20.474 20.468 YesEmotions R 2 0.355 0.309 0.209 –Satisfaction R 2 0.647 0.577 0.515 –
Notes: * ¼ not significant at p , 0.05 based on regression results; * * Significant change ( p , 0.05)across segments based on interactions in the general linear models
Table VII.Model results acrossrelationship segments
MSQ19,1
18

inconsistent with the alternative prediction that the stronger attitudes that accompanystronger relationships yield a greater net impact of emotions on customer satisfaction.
Regression analysesTo replicate the causal model in the three customer segments we ran a sequence of PCRregression analyses. In the first step, customer satisfaction was defined as a function ofjoy, disappointment, perceived quality and perceived price (CS ¼ JOY þ DIS þ PQ þPP). The results are summarized in Table VIII.
From Table VIII we can see that emotions have an impact on customer satisfactionboth in terms of joy and disappointment. The positive side of emotions seems to havestronger effect than the negative side. Across commitment levels, joy has a positivesignificant effect. However, the effect decreases across levels and have the least effectin high commitment relationships. Disappointment has a negative effect that turnsinsignificant from medium to high commitment. Consequently disappointment has astronger effect in low and medium commitment relationships and none in highcommitment relationships.
These observations are consistent with our previous findings from the PLSanalyses, that supports the prediction that positive emotions have less effect and that“losses loom larger”. Perceived price seems to have a significant effect on satisfactiononly in the low commitment group, while perceived quality is significant and strongacross all groups. Our model explains more of the variance in customer satisfaction inlow commitment group than in medium and high commitment groups as the explainedvariance in customer satisfaction decreases from level to level. This observation mayindicate that medium or highly committed customers have a top down approach toservice evaluations while customers with low commitment tend to evaluate the serviceexperience bottom up (e.g. Olsen and Johnson, 2003).
Building on the first regressions we estimated, in our second step, a group levelmodel across segments where commitment is a three level categorical variablerepresenting low, medium and high commitment groups. Now customer satisfaction isa function of joy, disappointment, perceived quality, perceived price and commitment.In addition we test if there is any interaction effect between; joy and commitment,disappointment and commitment, perceived quality and commitment and perceivedprice and commitment that effect satisfaction. All these variables are therefore enteredsimultaneously into the equation (CS ¼ JOY þ DIS þ PQ þ PP þ COM þ JOYxCOMþ DISxCOM þ PQxCOM þ PPxCOM). These results are summarized in Table IX.
StdBeta StdBeta StdBetaRegression equationby level
Coef.Level 1 Sign.
Coef.Level 2 Sign.
Coef.Level 3 Sign.
Joy ! CustSat 0.261 0.000 0.213 0.000 0.164 0.025Disapp ! CustSat 20.140 0.002 20.091 0.019 20.87 0.228Perceived Price ! CustSat 0.085 0.081 0.068 0.108 0.113 0.194Perceived Quality ! CustSat 0.514 0.000 0.561 0.000 0.551 0.000DR 2 CustSat 0.643 0.567 0.493
Table VIII.Regression analysis by
commitment level
Managingrelationship
segments
19

From Table IX we see that only joy, disappointment, perceived quality, commitmentand the interaction effect between joy and commitment, have a significant effect oncustomer satisfaction. Interestingly, price does not have any effect on satisfaction at all.When commitment level is applied as the grouping variable we explain 74.3 percent ofthe variance in customer satisfaction.
To explore whether the causal model is the same across commitment levels weapplied Baron and Kenny’s (1986) method of mediation procedure. We start out withthe regression equation where customer satisfaction is a function of joy (CS ¼ Joy). Wecontinue with replacing joy with perceived price and perceived quality(CS ¼ PP þ PQ) and end with including joy in the equation again(CS ¼ Joy þ PP þ PQ). These regression analyses were performed across all levelsof commitment. We later substitute joy with disappointment, and run all analysesacross commitment levels. At last, we flip-flop customer satisfaction andjoy/disappointment, i.e. now joy/disappointment is a function of customersatisfaction, then joy/disappointment is a function of perceived price and perceivedquality, etcetera.
From this procedure we learn that joy is a strong and positive driver of customersatisfaction independent of commitment levels. When perceived price and quality areentered together and without other variables present, quality has stronger effect onsatisfaction than price across all levels of commitment. Price on the other hand seemsto decrease in importance from the low to medium commitment group and increase itsimportance from medium to high commitment group.
When we enter joy into the equation the strength of perceived price and qualitydrop. This indicates that joy mediates the effects of perceived price and perceivedquality on customer satisfaction. This result is consistent across commitment levels.Next, we replaced joy with disappointment in the equation. When disappointment isentered alone in the equation, our results show that disappointment has a negativeeffect on customer satisfaction across levels of commitment. It is also significant in allinstances. When perceived price, perceived quality and disappointment are enteredtogether in the equation, perceived quality is the most important driver of customersatisfaction across all levels of commitment. Disappointment does not seem to be as
Regression equation
StdBetaCoef.
By ComSign.
By Com
Joy ! CustSat 0.393 0.000Disapp ! CustSat 20.135 0.021Perceived Price ! CustSat 0.074 0.280Perceived Quality ! CustSat 0.515 0.000Com (level) ! CustSat 0.135 0.000Joy *Com/Group ! CustSat 20.190 0.005Dis *Com/Group ! CustSat 0.047 0.415PQ *Com/Group ! CustSat 0.005 0.950PP *Com/Group ! CustSat 0.003 0.963DR 2 CustSat 0.743
Table IX.Group level model bycommitment
MSQ19,1
20

strong a driver as joy. In the low and medium commitment groups, disappointment is astronger driver than perceived price, while the opposite is true for the highcommitment group. This means that disappointment may not always be mediating theeffect of price and quality on satisfaction.
By using customer satisfaction in predicting joy and disappointment we find thatcustomer satisfaction is the stronger driver of joy across all commitment levels orrelationship types. It has a positive and significant effect in all instances. Interestinglythe relationship between the independent variables are not that clear anymore. Whenperceived price and perceived quality are the only variables entered, we find thatperceived quality is the stronger predictor of joy and the only variable that has stableeffects. Perceived price turns insignificant in the low commitment group. When allvariables are entered simultaneously, we see that customer satisfaction is the onlystable predictor of joy. At the same time perceived price and perceived quality drops ineffects and turn insignificant in low and high commitment relationships. Finally, weenter customer satisfaction as a predictor of disappointment. When entered alone in theequation, satisfaction is a negative, significant predictor of disappointment. Itsstrengths vary to a great extend across commitment levels. An unexpected pattern isfound across commitment levels. In fact, in high commitment level relationshipsperceived price seems to be much stronger than perceived quality in its effects. Whenall variables are entered in the equation, the effects of perceived price and perceivedquality on disappointment fall, this result is consistent across commitment levels, withone exception. In high commitment relationships the effects of perceived qualityincrease.
In summary, we see that our findings support the PLS results and our causal model.We find that quality and price are stable drivers of customer satisfaction across
different commitment levels. The drivers of emotions on the other hand seem to changeas the relationship evolves. Our findings indicate that quality drives emotions in lowand medium commitment level groups, while price seem to have an impact on emotionsin high commitment relationships. Furthermore, it appears that joy is a stable mediatorof the effects of quality and price on customer satisfaction. Disappointment is not astable mediator across commitment levels. Still, we can conclude that we find supportfor our causal model both in our PLS and PCR analyses. Finally, for the sake ofverifying our decision that segmentation by commitment level is more efficient than byGutek et al.’s typology, we ran the PCR analyses applying their typology. The resultsfrom these analyses supported the pattern we have described above, but seemedsomewhat weaker. The correlation matrix for all the variables in the study is providedin Table X.
DiscussionEven branded service organizations face the task of customizing the service experienceto particular customer relationships. The goal is to improve customer equity throughincreased customer satisfaction. Any given service organization’s customers vary inthe strength of their relationship with the organization, which drive very differentperceptions of and emotional responses to the service experience. Based on this generalprediction our study examined three specific research questions:
(1) What is the influence of perceived performance versus emotions on hotel guestsatisfaction across customer relationships?
Managingrelationship
segments
21

(2) How does the nature of emotional response (disappointment or joy) vary withthe relationship?
(3) How does the impact of an organization’s service quality and prices on emotionsvary with the relationship?
To investigate these questions we applied two different segmentation methods. Oneconceptual based on Gutek et al.’s work and one data driven. The latter one turned outto be more efficient in which we segmented a hotel chain’s customers into threedifferent relationship segments based on the customers’ affective commitment to thehotel.
Overall our results paint an interesting picture of the cognitive and emotionalresponses of different relationship segments. The weaker the relationship segment, themore disappointed, emotional and less satisfied the customer, where service qualityproblems are the culprit. The stronger the relationship segment, the more joyful,satisfied and less emotional the customer, where price is an increasing source of joy.
At least in the context of our study and sample, the results suggest that servicequality is the source of customer disappointment while money can buy happiness.
Theoretically the results support the notion that the valence of the emotions,disappointment versus joy, is more important toward predicting emotional impactthan is the strength of the personal relationship one has to the hotel. While at odds withsatisfaction theory (Oliver, 1997), one possible explanation for our results is that westudy a service domain that is somewhat weaker in relationship strength than othercontexts, such as business-to-business relationships (Heide, 1994). Even though weidentified three distinct relationship segments, our emotions-valence argument is likelystronger in weak-to-moderate relationship contexts. Consider that relatively fewcustomers ever develop a true symbiotic partnership with a hotel chain. More likely weare capturing varying levels of acquaintances and friends. In contrast, theattitude-theory prediction may become more viable when relationships and attitudesare much stronger. Across a broader spectrum of relationship levels, it may be the casethat customer satisfaction becomes less emotional (from disappointingly weak
Variables/correlationcoefficient Satisfaction Price Quality Joy Disappointment
Affectivecommitment
Satisfaction 1Price 0.603 * 1
0.000Quality 0.815 * 0.650 * 1
0.000 0.000Joy 0.682 * 0.494 * 0.604 * 1
0.000 0.000 0.000Disappointment 20.463 * 20.421 * 20.431 * 20.339 * 1
0.000 0.000 0.000 0.000Affective commitment 0.679 * 0.471 * 0.591 * 0.655 * 20.341 * 1
0.000 0.000 0.000 0.000 0.000
Note: * Correlation is significant at 0.01 level (two-tailed)
Table X.Correlation matrix for allvariables in the study
MSQ19,1
22

relationships to comfortable friendships) before becoming more emotional (fromfriendships to true partnerships).
Another implication of our findings for relationship research is that buyer-sellerrelations indeed have a social value of their own. That joy is a key driver of emotionsand emotions is a key driver of satisfaction supports this. Borrowing from thecustomer equity literature, this suggests that firms with a large portion of committedcustomers possess not only high value equity but also high retention equity (Rust et al.,2004). For CRM researchers this finding confirms the impact of the one-to-oneparadigm through a personalized service offer (Rust and Verhoef, 2005).
From an applied perspective the results provide service managers and employeeswith the means to develop more effective product-service-price offerings for customerswith whom they have very different relationships. Dowling (2002) argues that the bestrelationship strategy is not to have relationships. He argues that often the key tosuccess (i.e. customer satisfaction and retention) is to maximize the moment of truthevery time – something that would make sense for service encounter and pseudorelationship customers. Our results show how customer satisfaction drivers varysystematically with the relationship largely through their effects on emotions.Specifically, the results suggest that hotel employees serving lower affectivecommitment customers (such as the infrequent visitor in our introduction) shouldfailsafe their service delivery processes to eliminate things-gone-wrong or improve the“moments of truth”. Our findings show that too many (hotel) interactions with thesecustomers result in significant disappointment (i.e. they fail to meet customers’expectations), which results in customer dissatisfaction and negative emotions. Asdissatisfied customers typically do not complain, such information is often missingfrom an organization’s customer information systems (Dutka, 1994).
In contrast, customers who are more affectively committed to the organization valuethe relationship they have with the hotel. This commitment is marked a significantdecrease in quality-based disappointment and an increase in price-based joy. In orderto keep the customers experience positive and their patronage strong, it is important toactively manage the relationships by remembering the customer’s name andsocializing to some degree. This often requires maintaining one’s best employees ormaking sure that a team of employees helps manage the relationship (Bendapudi andLeone, 2002). One implication is that service managers offering a service that attractsmore acquaintances than friends or partners can accept a higher personnel turnover, aslong as new employees can be trained to deliver consistent and error-free service. Thatis, the social value of the relationship is less of an issue.
That our findings reveal a predominance of quality-driven rather than price-drivensatisfaction should be a wake up call for managers who believe that price is the mostimportant value driver in the service marketing mix. Too many campaigns and loyaltyprograms are based on this misconception. Rather, managers should recognize thateach relationship segment has its own optimal mix of price and quality or valueproposition. By adapting the value proposition to specific relationship segments, boththe perceptions and emotional responses that drive customer satisfaction can indeed bemanaged.
Finally, our study illustrates the value of a fundamentally new approach to marketsegmentation. Hotel customers are typically segmented by type (business, conference,or holiday/leisure) or by frequency of use (light, medium and heavy users). Rather, our
Managingrelationship
segments
23

results illustrate the importance of segmenting markets by relationship strength, andspecifically affective commitment. If employees can be trained to identify affectivelycommitted or uncommitted customers and adapt the service experience accordingly,then the service can indeed be adapted to a heterogeneous customer base.
One limitation of our research is that our sample is predominantly male, which issimply due to the fact that more men than women traveled to the hotels. As thesatisfaction and loyalty of men and women is very different (Bryant and Cha, 1996),this naturally limits the generalizability of our findings. But we do not think it limitsthe generalizability of our segmentation method. Rather, we think it would performeven better in samples were women are represented on a more equal basis. Researchsupports our argument as results show that female customers systematically reporthigher scores on satisfaction than male customers across industries (e.g. Bryant andCha, 1996). According to Carlson (1971), they are also more emotional in theirevaluations of service encounters than males and the relationship between evaluationof service encounter and loyalty intentions is stronger for female than male customers(Darley et al., 2008). As such, affective commitment should be a very relevant criteriawhen female customers are represented in the customer base. Having demonstrated theefficiency of this segmentation method in the hotel industry, which may be consideredless relationship oriented, indicates an increased efficiency when applied to morerelationship oriented industries. Still, as any company today has to manage it’scustomer base in order to optimize customer lifetime value, we think our method isapplicable in most industries.
It is also important to explicitly compare our segmentation method with traditionalsegmentation methods. Conducting a comparative study with alternative segmentationschemes as a moderator would provide insight into both the advantages anddisadvantages of our approach and how the segmentation schemes relate to each other.This would provide concrete knowledge for hotel managers striving to improve thesatisfaction of their various customer groups.
Note
1. These criteria are: direction of causality from construct to measure implied by the conceptualdefinition; interchangeability of the indicators/items; covariantion among the indicators, andnomological network of the construct indicators.
References
Anderson, E.W. (1998), “Customer satisfaction and word of mouth”, Journal of Service Research,Vol. 1, August, pp. 5-17.
Anderson, E. and Weitz, B. (1992), “The use of pledges to build and sustain commitment indistribution channels”, Journal of Marketing Research, Vol. 29, February, pp. 18-34.
Anderson, E.W., Fornell, C. and Mazvancheryl, S.K. (2004), “Customer satisfaction andshareholder value”, Journal of Marketing, Vol. 68, October, pp. 172-85.
Andreassen, T.W. (1999), “Dissatisfaction with services”, doctoral dissertation, University ofStockholm, Stockholm.
Andreassen, T.W. and Lindestad, B. (1998), “The effect of corporate image in the formation ofcustomer loyalty”, Journal of Service Research, Vol. 1, August, pp. 82-92.
MSQ19,1
24

Bagozzi, R.P. and Yi, Y. (1994), “Advanced topics in structural equation models”,in Bagozzi, R.P. (Ed.), Advanced Methods of Marketing Research, Blackwell, Cambridge,MA, pp. 1-52.
Bagozzi, R.P., Baumgartner, H. and Pieters, R. (1998), “Goal directed emotions”, Cognitions andEmotion, Vol. 12 No. 1, pp. 1-26.
Bagozzi, R.P., Gopinath, M. and Nyer, P.U. (1999), “The role of emotions in marketing”, Journal ofthe Academy of Marketing Science, Vol. 27, Spring, pp. 184-206.
Bagozzi, R.P., Wong, N. and Yi, Y. (1999), “The role of culture and gender in the relationshipbetween positive and negative affect”, Cognition and Emotion, Vol. 13 No. 6, pp. 641-72.
Baron, R.N. and Kenny, D. (1986), “The moderator-mediator variable distinction in socialpsychological research: conceptual, strategic, and statistical considerations”, Journal of thePersonality and Social Psychology, Vol. 51 No. 6, pp. 1173-82.
Bendapudi, N. and Berry, L.L. (1997), “Customers’ motivations for maintaining relationships withservice providers”, Journal of Retailing, Vol. 73 No. 1, pp. 15-37.
Bendapudi, N. and Leone, R.P. (2002), “Managing business-to-business customer relationshipsfollowing key contact employee turnover in a vendor firm”, Journal of Marketing, Vol. 66,April, pp. 83-101.
Best, R.J. (2004), Market-Based Management: Strategies for Growing Customer Value andProfitability, 3rd ed., Prentice-Hall, Upper Saddle River, NJ.
Bolton, R.N. (1998), “A dynamic model of customers’ usage of services: usage as an antecedentand consequence of satisfaction”, Marketing Science, Vol. 17, Winter, pp. 45-65.
Bolton, R.N. and Lemon, K.N. (1999), “A dynamic model of customers’ usage of services: usage asan antecedent and consequence of satisfaction”, Journal of Marketing Research, Vol. 36,May, pp. 171-86.
Brown, T.J. and Kirmani, A. (1999), “The influence of pre-encounter affect on satisfaction with ananxiety-provoking service encounter”, Journal of Service Research, Vol. 1, May, pp. 333-46.
Bryant, B.E. and Cha, J. (1996), “Crossing the threshold”, Marketing Research, Vol. 8 No. 4,pp. 20-8.
Carlson, R. (1971), “Sex differences in ego functioning: exploratory studies of agency andcommunion”, Journal of Consulting and Clinical Psychology, Vol. 37 No. 2, pp. 267-77.
Darley, W.K., Luethge, D.J. and Thatte, A. (2008), “Exploring the relationship of perceivedautomotive salesperson attributes, customer satisfaction and intentions to automotiveservice department patronage: the moderating role of customer gender”, Journal ofRetailing & Consumer Services, Vol. 15 No. 6, pp. 469-79.
Derbaix, C.M. (1995), “The impact of affective reactions on attitudes toward the advertisementand the brand: a step toward ecological validity”, Journal of Marketing Research, Vol. 32No. 4, pp. 470-9.
Dowling, G. (2002), “Customer relationship management: in B2C markets, often less is more”,California Management Review, Vol. 44 No. 3, pp. 87-104.
Dube, L. and Morgan, M.S. (1996), “Trend effects and gender differences in retrospectivejudgments of consumption emotions”, Journal of Consumer Research, Vol. 23, September,pp. 156-62.
Dube, L. and Morgan, M.S. (1998), “Capturing the dynamics of in-process consumption emotionsand satisfaction in extended service transactions”, International Journal of Research inMarketing, Vol. 15 No. 4, pp. 309-20.
Dutka, A.F. (1994), AMAHandbook for Customer Satisfaction, American Marketing Association,Chicago, IL.
Managingrelationship
segments
25

Dwyer, F.R., Schurr, P.H. and Oh, S. (1987), “Developing buyer-seller relationships”, Journal ofMarketing, Vol. 51, April, pp. 11-27.
Evrard, Y. and Aurier, P. (1994), “The influence of emotions on satisfaction with movieconsumption”, Journal of Consumer Satisfaction, Dissatisfaction and ComplainingBehavior, Vol. 7, pp. 119-25.
Fornell, C., Johnson, M.D., Anderson, E.W., Cha, J. and Bryant, B.E. (1996), “The AmericanCustomer Satisfaction Index: nature, purpose and findings”, Journal of Marketing, Vol. 60,October, pp. 7-18.
Fornell, C. and Cha, J. (1994), “Partial least squares”, in Bagozzi, R.P. (Ed.), Advanced Methods ofMarketing Research, Blackwell, Cambridge, MA, pp. 52-78.
Fornell, C. and Larcker, D.F. (1981), “Evaluating structural equation models with unobservablevariables and measurement error”, Journal of Marketing Research, Vol. 18, February,pp. 39-50.
Fullerton, G. (2003), “When does commitment lead to loyalty?”, Journal of Service Research, Vol. 5,May, pp. 333-44.
Garbarino, E. and Johnson, M.S. (1999), “The differential roles of satisfaction, trust, andcommitment in customer relationships”, Journal of Marketing, Vol. 63, April, pp. 70-87.
Gundlach, G.T., Achrol, R.S. and Mentzer, J.T. (1995), “The structure of commitment inexchange”, Journal of Marketing, Vol. 59, January, pp. 78-92.
Gutek, B.A. (1995), The Dynamics of Service: Reflections on the Changing Nature of Service,Jossey Bass, San Francisco, CA.
Gutek, B.A. (1997), “Dyadic interaction in organizations”, in Cooper, C.L. and Jackson, S.E. (Eds),Creating Tomorrow’s Organizations, John Wiley & Sons Ltd, Chichester.
Gutek, B.A. (1999), “The social psychology of service interactions”, Journal of Social Issues,Vol. 55 No. 3, pp. 603-17.
Gutek, B.A., Bhappu, A.D., Liao-Troth, M.A. and Cherry, B. (1999), “Distinguishing betweenservices relationships and encounters”, Journal of Applied Psychology, Vol. 84 No. 2,pp. 218-33.
Gutek, B.A., Cherry, B., Bhappu, A.D., Schneider, S. and Wolf, L. (2000), “Features of servicerelationships and encounters”, Work and Occupations, Vol. 27 No. 3, pp. 319-52.
Gustafsson, A. and Johnson, M.D. (2004), “Determining attribute importance in a servicesatisfaction model”, Journal of Service Research, Vol. 7, November, pp. 124-41.
Gustafsson, A., Johnson, M.D. and Roos, I. (2005), “The effects of customer satisfaction,relationship commitment dimensions, and triggers on customer retention”, Journal ofMarketing, Vol. 69, October, pp. 210-18.
Hansen, H., Sandvik, K. and Selnes, F. (2003), “Direct and indirect effects of commitment to aservice employee on the intention to stay”, Journal of Service Research, Vol. 5, May,pp. 356-68.
Heide, J.B. (1994), “Interorganizational governance in marketing channels”, Journal of Marketing,Vol. 58, January, pp. 71-85.
Heide, J.B. and John, G. (1992), “Do norms matter in marketing relationships?”, Journal ofMarketing, Vol. 56, April, pp. 32-44.
Izard, C.E. (1977), Human Emotions, Plenum, New York, NY.
Jarvis, C.B., Mackenzie, S.B. and Podsakoff, P.M. (2003), “A critical review of construct indicatorsand measurement model misspecification in marketing and consumer research”, Journal ofConsumer Research, Vol. 30, September, pp. 199-218.
MSQ19,1
26

Johnson, M.D. and Selnes, F. (2004), “Customer portfolio management: toward a dynamic theoryof exchange relationships”, Journal of Marketing, Vol. 68, April, pp. 1-17.
Johnson, M.D., Anderson, E.W. and Fornell, C. (1995), “Rational and adaptive performanceexpectations in a customer satisfaction framework”, Journal of Consumer Research, Vol. 21,March, pp. 695-707.
Johnson, M.D., Gustafsson, A., Andreassen, T.W., Lervik, L. and Cha, J. (2001), “The evolutionand future of national customer satisfaction index models”, Journal of EconomicPsychology, Vol. 22, April, pp. 217-45.
Kahneman, D. and Tversky, A. (1979), “Prospect theory: an analysis of decision under risk”,Econometrica, Vol. 47 No. 2, pp. 263-91.
Kohli, A.K. and Jaworski, B.J. (1990), “Market orientation: the construct, research propositions,and managerial implications”, Journal of Marketing, Vol. 54, April, pp. 1-18.
Kotler, P. (1994), Marketing Management: Analysis, Planning, Implementation and Control,Prentice-Hall, Englewood Cliffs, NJ.
Ladhari, R. (2007), “The movie experience: a revised approach to determinants of satisfaction”,Journal of Business Research, Vol. 60 No. 5, pp. 454-62.
Laros, F.J.M. and Steenkamp, J.B.E.M. (2005), “Emotions in consumer behavior: a hierarchicalapproach”, Journal of Business Research, Vol. 58 No. 10, pp. 1437-45.
Liljander, V. and Strandvik, T. (1995), “The nature of customer relationships in services”,in Swartz, T.A., Bowen, D.E. and Brown, S.W. (Eds), Advances in Services Marketing andManagement, JAI Press Inc., Greenwich, CT.
Liljander, V. and Strandvik, T. (1997), “Emotions in service satisfaction”, International Journal ofService Industry Management, Vol. 8 No. 2, pp. 148-69.
Lovelock, C. (1983), “Classifying services to gain strategic marketing insights”, Journal ofMarketing, Vol. 47, Summer, pp. 9-20.
MacCaulay, S. (1963), “Non-contractual relations in business”, American Sociological Review,Vol. 28, February, pp. 55-67.
MacNeil, I.R. (1974), “The many futures of contract”, Southern California Review, Vol. 47,pp. 691-816.
MacNeil, I.R. (1978), “Contracts: adjustment of long-term economic relations under classical,neoclassical and relational contract law”, Northwestern University Law Review, Vol. 72No. 6, pp. 854-902.
MacNeil, I.R. (1980), The New Social Contract: An Inquiry into Modern Contractual Relations,Yale University Press, New Haven, CT.
Mano, H. and Oliver, R.L. (1993), “Assessing the dimensionality and structure of the consumptionexperience: evaluation, feeling, and satisfaction”, Journal of Consumer Research, Vol. 20,December, pp. 451-66.
Mittal, V. and Kamakura, W. (2001), “Satisfaction, repurchase intent, and repurchase behavior:investigating the moderating effects of customer characteristics”, Journal of MarketingResearch, Vol. 38 No. 1, pp. 131-42.
Mooradian, T.A. and Olver, J.M. (1997), “I can’t get no satisfaction: the impact of personality andemotion on postpurchase processes”, Psychology and Marketing, Vol. 14 No. 4, pp. 379-93.
Moorman, C., Zaltman, G. and Deshpande, R. (1992), “Relationships between providers and usersof market research: the dynamics of trust within and between organizations”, Journal ofMarketing Research, Vol. 29, August, pp. 314-28.
Managingrelationship
segments
27

Morgan, R.M. and Hunt, S.D. (1994), “The commitment-trust theory of relationship marketing”,Journal of Marketing, Vol. 58, July, pp. 20-38.
Narver, J.C. and Slater, S.F. (1990), “The effects of a market orientation on business profitability”,Journal of Marketing, Vol. 54, October, pp. 20-35.
Noordweier, T.G., John, G. and Nevin, J.R. (1990), “Performance outcomes of purchasingarrangements in industrial buyer-vendor relationships”, Journal of Marketing, Vol. 54,October, pp. 80-93.
Nyer, P.U. (1997), “A study of the relationship between cognitive appraisals and consumptionemotions”, Journal of the Academy of Marketing Science, Vol. 25 No. 4, pp. 296-304.
Oliver, R.L. (1980), “A cognitive model of antecedents and consequences of satisfactiondecisions”, Journal of Marketing Research, Vol. 17, November, pp. 460-9.
Oliver, R.L. (1993), “Cognitive, affective, and attribute bases of the satisfaction response”, Journalof Consumer Research, Vol. 20, December, pp. 418-30.
Oliver, R.L. (1997), Satisfaction: A Behavioral Perspective on the Consumer, McGraw-Hill,New York, NY.
Oliver, R.L. (1999), “Whence consumer loyalty?”, Journal of Marketing, Vol. 63, Special Issue,pp. 33-44.
Olsen, L.L. and Johnson, M.D. (2003), “Service equity, satisfaction, and loyalty: fromtransaction-specific to cumulative evaluations”, Journal of Service Research, Vol. 5,February, pp. 184-95.
Petty, R.E., Haugtvedt, C.P. and Smith, S.M. (1995), “Elaboration as a determinant of attitudestrength: creating attitudes that are persistent, resistant, and predictive of behavior”,in Petty, R.E. and Krosnick, J.A. (Eds), Attitude Strength: Antecedents and Consequences,Lawrence Erlbaum Associates, Mahwah, NJ.
Phillips, D.M. and Baumgartner, H. (2002), “The role of consumption emotions in the satisfactionresponse”, Journal of Consumer Psychology, Vol. 12 No. 3, pp. 243-52.
Price, L.L., Arnould, E.J. and Tierney, P. (1995), “Going to extremes: managing service encountersand assessing provider performance”, Journal of Marketing, Vol. 59, April, pp. 83-97.
Priester, J.R., Nayakankuppam, D., Fleming, M.A. and Godek, J. (2004), “The A2SC2 Model:the influence of attitudes and attitude strength on consideration and choice”, Journal ofConsumer Research, Vol. 30, March, pp. 574-87.
Richins, M.L. (1997), “Measuring emotions in the consumption experience”, Journal of ConsumerResearch, Vol. 24 No. 2, pp. 127-46.
Russel, J.A. (1980), “A circumplex model of affect”, Journal of Personality and Social Psychology,Vol. 39 No. 6, pp. 1161-78.
Rust, R.T. and Verhoef, P.C. (2005), “Optimizing the marketing interventions mix inintermediate-term CRM”, Marketing Science, Vol. 24, Summer, pp. 477-89.
Rust, R.T., Lemon, K.N. and Zeithaml, V.A. (2004), “Return on marketing: using customer equityto focus marketing strategy”, Journal of Marketing, Vol. 68, January, pp. 109-21.
Rust, R.T., Inman, J.J., Jia, J. and Zahorik, A. (1999), “What you don’t know aboutcustomer-perceived quality: the role of customer expectation distributions”, MarketingScience, Vol. 18 No. 1, pp. 77-92.
Smith, A.K. and Bolton, R.N. (2002), “The effect of customers’ emotional responses to servicefailures on their recovery effort evaluations and satisfaction judgments”, Journal of theAcademy of Marketing Science, Vol. 30 No. 1, Winter, pp. 5-23.
MSQ19,1
28

Steenkamp, J.B.E.M., Baumgartner, H. and Van der Wulp, E. (1996), “The relationships amongarousal potential, arousal and stimulus evaluation, and the moderating role of need forstimulation”, International Journal of Research in Marketing, Vol. 13 No. 4, pp. 319-29.
Taylor, S. (1994), “Waiting for service: the relationship between delays and evaluations ofservice”, Journal of Marketing, Vol. 58, April, pp. 56-69.
Verhoef, P.C. (2003), “Understanding the effect of customer relationship management efforts oncustomer retention and customer share development”, Journal of Marketing, Vol. 67,October, pp. 30-45.
Vermunt, J.K. and Magidson, J. (2003), LatentGOLD Choice Version 3.0.6, Statistical InnovationsInc., Belmont, MA.
Wangenheim, F. (2005), “Postswitching negative word of mouth”, Journal of Service Research,Vol. 8, August, pp. 67-78.
Westbrook, R.A. (1987), “Product/consumption-based affective responses and postpurchaseprocesses”, Journal of Marketing Research, Vol. 24, August, pp. 258-70.
Westbrook, R.A. and Oliver, R.L. (1991), “The dimensionality of consumption emotion patternsand consumer satisfaction”, Journal of Consumer Research, Vol. 18, June, pp. 84-91.
Wirtz, J. and Bateson, J.E.G. (1999), “Consumer satisfaction with services: integrating theenvironment perspective in services marketing into the traditional disconfirmationparadigm”, Journal of Business Research, Vol. 44 No. 1, pp. 55-66.
Wold, H. (1982), “Systems under indirect observation using PLS”, in Fornell, C. (Ed.), A SecondGeneration of Multivariate Analysis Methods, Praeger, New York, NY.
Zajonc, R.B. (1980), “Feeling and thinking: preferences need no inferences”, AmericanPsychologist, Vol. 35, February, pp. 151-75.
Zajonc, R.B. (1998), in Gilbert, D.T., Fiske, S.T. and Lindzey, G. (Eds), The Handbook of SocialPsychology, The McGraw-Hill Companies, Inc., New York, NY.
Further reading
Hart, C.W. and Johnson, M.D. (1999), “Growing the trust relationship”, Marketing Management,Vol. 8, Spring, pp. 8-19.
About the authorsMichael D. Johnson is the Dean of Cornell University’s School of Hotel Administration and holdsthe E.M. Statler Professorship of Hotel Administration. Johnson has been the D. Maynard PhelpsCollegiate Professor of Business Administration and Professor of Marketing at the StephenM. Ross School of Business at the University of Michigan. In addition to his teaching duties,Johnson served as the director of the Center for Customer-Focused Management in ExecutiveEducation, and earlier as a member of the school’s executive committee. A distinguished scholar,Johnson’s research focuses on the development of customer information systems and how theycan be utilized to craft strategy and manage customer relationships. He seeks to understand howto manage customer portfolios over time, how customer satisfaction and loyalty models changeas customer relationships grow, and how managers can use customer information to make moreinformed resource allocation and strategy decisions. Johnson has consulted for a diverse range ofcompanies and public agencies. He holds a PhD and MBA from the University of Chicago, and aBS with honors from the University of Wisconsin.
Line Lervik Olsen is an Associate Professor of Marketing at the Norwegian School ofManagement, where she received her PhD degree in marketing in 2002. Lervik Olsen spent oneyear as a visiting PhD student at the University of Michigan Business School. At the NorwegianSchool of Management Lervik Olsen is responsible for services and relationship marketing
Managingrelationship
segments
29

courses, a strategic marketing management program, and teaches both undergraduate andgraduate students. She has been the research leader of the Norwegian Customer SatisfactionBarometer. Her work is published in journals such as the Journal of Service Research and theJournal of Economic Psychology, as well as in books. Prior to her PhD. Lervik Olsen studiedhospitality management at the Norwegian School of Hotel Management and FloridaInternational University. Line Lervik Olsen is the corresponding author and can be contactedat: [email protected]
Tor W. Andreassen is Professor and Chair Department of Marketing. Professor Andreassenis the founder and director of Service Forum and the founder of The Norwegian CustomerSatisfaction Barometer at the Norwegian School of Management. He holds a Sivilokonom degreefrom The Norwegian School of Economics and Business Administration, a MSc in marketing(with honors) from the Norwegian School of Management, and a Doctor of Economics fromStockholm University, School of Business. He has received the 2007 MSI/H. Paul Root Award, theHighly Commended Paper award from Managing Service Quality and the Most DownloadedArticle Award – Top 200 from the Emerald Group Publishing Limited and the Citation ofExcellence of Highest Quality Rating by Anbar Electronic Intelligence. His research has beenpublished in such journals as Journal of Marketing, Quality & Quantity, Journal of EconomicPsychology, Journal of Public Sector Management, and Journal of Service Research.
MSQ19,1
30
To purchase reprints of this article please e-mail: [email protected] visit our web site for further details: www.emeraldinsight.com/reprints
Copyright © 2022 FDOKUMEN