(journal version) Financial Support for Families with Children and its Trade-offs: Balancing...
26
This article was downloaded by: [89.67.85.154] On: 29 January 2015, At: 11:13 Publisher: Routledge Informa Ltd Registered in England and Wales Registered Number: 1072954 Registered office: Mortimer House, 37-41 Mortimer Street, London W1T 3JH, UK Baltic Journal of Economics Publication details, including instructions for authors and subscription information: http://www.tandfonline.com/loi/rbec20 Financial support for families with children and its trade-offs: balancing redistribution and parental work incentives Michał Myck, Anna Kurowska & Michał Kundera Published online: 03 Jun 2014. To cite this article: Michał Myck, Anna Kurowska & Michał Kundera (2013) Financial support for families with children and its trade-offs: balancing redistribution and parental work incentives, Baltic Journal of Economics, 13:2, 61-85, DOI: 10.1080/1406099X.2013.10840533 To link to this article: http://dx.doi.org/10.1080/1406099X.2013.10840533 PLEASE SCROLL DOWN FOR ARTICLE Taylor & Francis makes every effort to ensure the accuracy of all the information (the “Content”) contained in the publications on our platform. However, Taylor & Francis, our agents, and our licensors make no representations or warranties whatsoever as to the accuracy, completeness, or suitability for any purpose of the Content. Any opinions and views expressed in this publication are the opinions and views of the authors, and are not the views of or endorsed by Taylor & Francis. The accuracy of the Content should not be relied upon and should be independently verified with primary sources of information. Taylor and Francis shall not be liable for any losses, actions, claims, proceedings, demands, costs, expenses, damages, and other liabilities whatsoever or howsoever caused arising directly or indirectly in connection with, in relation to or arising out of the use of the Content. This article may be used for research, teaching, and private study purposes. Any substantial or systematic reproduction, redistribution, reselling, loan, sub-licensing, systematic supply, or distribution in any form to anyone is expressly forbidden. Terms & Conditions of access and use can be found at http://www.tandfonline.com/page/ terms-and-conditions
Transcript of (journal version) Financial Support for Families with Children and its Trade-offs: Balancing...

This article was downloaded by: [89.67.85.154]On: 29 January 2015, At: 11:13Publisher: RoutledgeInforma Ltd Registered in England and Wales Registered Number: 1072954 Registeredoffice: Mortimer House, 37-41 Mortimer Street, London W1T 3JH, UK
Baltic Journal of EconomicsPublication details, including instructions for authors andsubscription information:http://www.tandfonline.com/loi/rbec20
Financial support for families withchildren and its trade-offs: balancingredistribution and parental workincentivesMichał Myck, Anna Kurowska & Michał KunderaPublished online: 03 Jun 2014.
To cite this article: Michał Myck, Anna Kurowska & Michał Kundera (2013) Financial support forfamilies with children and its trade-offs: balancing redistribution and parental work incentives,Baltic Journal of Economics, 13:2, 61-85, DOI: 10.1080/1406099X.2013.10840533
To link to this article: http://dx.doi.org/10.1080/1406099X.2013.10840533
PLEASE SCROLL DOWN FOR ARTICLE
Taylor & Francis makes every effort to ensure the accuracy of all the information (the“Content”) contained in the publications on our platform. However, Taylor & Francis,our agents, and our licensors make no representations or warranties whatsoever as tothe accuracy, completeness, or suitability for any purpose of the Content. Any opinionsand views expressed in this publication are the opinions and views of the authors,and are not the views of or endorsed by Taylor & Francis. The accuracy of the Contentshould not be relied upon and should be independently verified with primary sourcesof information. Taylor and Francis shall not be liable for any losses, actions, claims,proceedings, demands, costs, expenses, damages, and other liabilities whatsoeveror howsoever caused arising directly or indirectly in connection with, in relation to orarising out of the use of the Content.
This article may be used for research, teaching, and private study purposes. Anysubstantial or systematic reproduction, redistribution, reselling, loan, sub-licensing,systematic supply, or distribution in any form to anyone is expressly forbidden. Terms& Conditions of access and use can be found at http://www.tandfonline.com/page/terms-and-conditions

61Financial support for families with children and its trade-offs: balancing redistribution and parental work incentives
Financial support for families with children and its trade-offs: balancing redistribution and parental work incentives
Michał Myck, Anna Kurowska, Michał Kundera1
Abstract:
Financial support for families with children implies inherent trade-offs some of which are less obvious than others. In the end these trade-offs determine the effectiveness of policy with respect to the material situation of families and employment of their parents. We anal-yse several kinds of trade-offs involved using a careful selection of potential changes to the system of financial support for families with children. We focus on: 1) the trade-off between redistribution of income to poorer households and improving work incentives, 2) the trade-off between improving work incentives for first and for second earners in couples, 3) the trade-off between improving work incentives for those facing strong and weak incentives in the baseline system. The exercise is conducted on data from Poland, a country characterized by high levels of child poverty, low female employment and one of the lowest fertility rates in Europe. We demonstrate the complexity of potential consequences of family support policy and stress the need for well-defined policy goals and careful analysis ahead of any reform.
Keywords: labour supply, tax and benefit reforms, microsimulation, family policyJEL Classification: J22, J13, J18
1 Michal Myck is director of the Centre for Economic Analysis, CenEA and a Research Associate at DIW-Berlin; e-mail: [email protected]; Anna Kurowska is Assistant Professor at the Institute of Social Policy at the University of Warsaw; e-mail: [email protected]; Michal Kundera is Research Economist at CenEA; e-mail: [email protected]. The paper was written with financial support from the Foundation for Polish Science (Parent-Bridge Pro-gramme) as part of the project “Joint influences of family and labour market policies on labour market participation and fertility decisions of men and women” coordinated by Anna Kurowska. Data used in the analysis were provided by the Polish Central Statistical Office (GUS), which takes no responsibility for the analysis and interpretation of the results. We are grateful to Katharina Wrohlich, Irena Kotowska and participants of the EUROMOD Microsimulation Research Workshop in Lisbon for comments on the early drafts of this paper. The usual disclaimer applies.
Dow
nloa
ded
by [
89.6
7.85
.154
] at
11:
13 2
9 Ja
nuar
y 20
15

62 Baltic Journal of Economics 13(2) (2013) 59–83
1. Introduction
While financial support for families with children is often portrayed as a single package, the policy objectives behind it imply inherent contradictions and implicit trade-offs. In this paper we present the complex nature of the consequences of different forms of financial support and analyse them in the light of distributional and labour market implications. The analysis is conducted with reference to the Polish system of support for families with children, but its conclusions extend beyond the specificity of Polish circumstances and provide guidance to policy making in systems of financial support more generally.
Financial support for families with children is an important and integral part of the broad fam-ily policy package, the goals of which fall into three basic categories of reducing child pov-erty, increasing labour market activity of parents and ensuring demographic stability through high fertility rates (see e.g. Whiteford and Adema, 2007; Björklund, 2006; Immervoll, et al., 2001; Thévenon and Luci, 2012; Europa 2020). However, the particular policy aimed at one of these objectives may be detrimental to achievement of the other goals. For example, family/child benefits may directly increase family income and thus reduce child poverty (see e.g. Whiteford and Adema, 2007; Immervoll, et al., 2001). At the same time, however, these same benefits could have a negative effect on parental incentives to work, particularly for so-called second earners, usually mothers (see e.g. Laroque and Salanie, 2008; Kornstad and Thoresen, 2007; Haan and Wrohlich, 2011). Benefits and low employment among mothers might positively affect the timing of childbirth and influence fertility (Laroque and Salanie, 2008; Matysiak and Vignoli, 2008; Gauthier, 2007; Duclos, et al., 2001). On the other hand, though, employment of both parents often turns out to be crucial for long term poverty reduc-tion (Whiteford and Adema, 2007) and in some cases it is also a precondition for fertility decisions (Matysiak, 2011; Fiori et al., 2013).
Specific policy solutions focused on child poverty and employment contain implicit trade-offs (Blundell 2001; Immervoll et al. 2007), which are often poorly understood or treated superficially in the policy debate. The effect of this lack of understanding may result in badly designed policy reactions to identified problems, which in turn may imply that one of the ob-jectives is achieved at the cost of the other(s), or even that policies work against all of them. In this paper, using the Polish microsimulation model SIMPL, we simulate modification of several elements of the Polish tax and benefit system to demonstrate the complex nature of trade-offs on the one hand between incomes and employment policy, and on the other, within employment policy itself. The underlying assumption of the analysis is that any effective policy which aims at lower child poverty and higher fertility in the long run ought to realize and address issues of parental labour market activity.2 Governments should therefore aim at a design of financial support for families to provide assistance to poor households and at the same time strong work incentives for parents. The analysis is conducted against a background of significant demographic challenges facing Poland in the coming decades due to very low fertility rates, as well as a combination of high child poverty and low female employment in particular among mothers.
2 Note that this assumption is not at odds with parental preferences concerning taking time off work to take care of children when they are young (Kotowska, et al., 2009; Hakim, 2003).
Dow
nloa
ded
by [
89.6
7.85
.154
] at
11:
13 2
9 Ja
nuar
y 20
15

63Financial support for families with children and its trade-offs: balancing redistribution and parental work incentives
The starting point for the analysis is a reform of a particular feature of the design of Family Benefits, the main channel of financial support for families with children in Poland, namely the point of withdrawal of benefits once income exceeds the means-test eligibility threshold. The proposed tapered withdrawal of benefits serves as a cost benchmark for four other re-forms – two further changes in the system of Family Benefits, and two reforms of the Child Tax Credit, the second largest instrument of child support. These five reforms are designed in such a way as to demonstrate the nature and the degree of trade-offs implied by financial support for families. The principal trade-offs we discuss are:
a) the trade-off between redistribution of income to poorer households and improving work incentives;
b) the trade-off between improving work incentives for first and for second earners in couples;
c) the trade-off between improving work incentives for those facing strong and weak incentives in the baseline system.
The most important trade-offs related to support of low-income families and its consequences in the labour market have long been known (see e.g. Duncan and Giles, 1996; Blundell et al. 2000; Immervoll and Barber 2006; Immervoll et al. 2007; Adam and Browne 2010; Jara and Tumino 2013). This paper, however, sheds new light on the problem and extends analysis of the trade-offs involved to issues which have so far been little examined. Apart from the well-established trade-off between equity and labour market concerns, we draw attention to the need to balance out first and second earner work incentives as well as incentives by the degree of existing financial motivation to work.
The rest of the paper is organised as follows. In Section 2 we describe the main tax and ben-efit instruments aimed at families with children in Poland. This is followed in Section 3 by a brief discussion of the data we use for the exercise and of labour market differences by family status. Against this background we describe the five potential policy interventions in the area of taxes and benefits using CenEA’s microsimulation model SIMPL (Section 4).3 In Section 5 the reforms are analysed from the point of view of labour market incentives with a focus on couples to examine the three principal trade-offs. Section 6 concludes the paper.
2. Financial support for families with children in Poland
In the analysis below we use Polish Household Budget Survey data from 2010 and apply to this the 2010 system of taxes and benefits as the baseline for our reform simulations. In this section we present a brief description of two main instruments of support directed at families with children in Poland, namely the system of Family Benefits and the non-refundable Child Tax Credit in the system of personal income taxation.
In the Polish tax and benefits system market earnings are subject to social security contribu-tions (SSCs) covering pension, disability, sickness, unemployment and accident insurance.
3 SIMPL is CenEA’s microsimulation model for Poland. It is based on Polish Household Budgets Survey data and allows detailed calculation of the main elements of the tax and benefit system in Poland. It allows simulation of both actual systems and various alternative tax and benefit scenarios and their direct consequences on household incomes. For details concerning the model and for examples of its earlier applications see, e.g. Bargain et al. (2007), Morawski and Myck (2009, 2011), Haan and Myck (2010, 2012).
Dow
nloa
ded
by [
89.6
7.85
.154
] at
11:
13 2
9 Ja
nuar
y 20
15

64 Baltic Journal of Economics 13(2) (2013) 59–83
On top of SSCs individuals pay personal income tax at two rates (18% and 32%) and health insurance at 9% of which 7.75pp. is deductible as a tax credit from income tax. Taxes and health insurance are paid on income net of SSCs. Every individual taxpayer can claim a universal tax credit of 556.02 PLN (€134) and revenue cost allowance at the individual level of 1,334 PLN (€321) is available to earners. 4 Tax splitting (joint taxation) is available to married couples and lone parents, and since 2007 parents can set their tax liabilities against the Child Tax Credit, which is a non-refundable tax credit, the maximum value of which is 1,112.04 PLN (€268) per year for every dependent child.5
The Polish system of support for low income families, Family Benefits, consists primarily of Family Allowance (FA) with supplements. These are means-tested and are available to fami-lies with net incomes below 504 PLN (€121) per month per person (or 583 PLN if a disabled child is in the family). The value of the FA depends on the age of the child and ranges from 68 PLN to 98 PLN (€16.40 to €23.60) per month. For eligible parents this is supplemented by additional means-tested payments to such groups as lone parents, families with more than two children, and those with school-age children (see Table A1 in the Appendix for a full list of supplements and their 2010 values). Parents of disabled children receive further support through the universal Nursing Allowance and the Nursing Benefit, and there is a universal one-off birth benefit of 1000 PLN (€241).
Eligibility criteria for Family Benefits assess family income with reference to a threshold, which once exceeded makes the family ineligible to claim the benefits. This point withdrawal of benefits implies very high effective marginal tax rates and has significant implications for average effective rates of tax (see Myck et al., 2013). Although parents who received family benefits in the year preceding the time of application are allowed (only for one year) to exceed the income threshold by the equivalent of the value of a single family allowance, this only shifts the threshold upwards, and implies that families where income is just above 600 PLN per person would no longer receive the benefits even if their income crosses the increased threshold only by 1 PLN. Eligibility of families whose incomes fall relative to the previous year are assessed with reference to the basic threshold.
This feature of the system is illustrated in Figure 1A where we show the budget constraint for a single earner couple with one, two and three children, and in Figure 1B, which for the same families shows the relationship between gross income and monthly total family support – the sum of Family Benefits and the CTC. As we can see the combination of these two elements results in similar levels of support given to low and high income families in 2010, while the highest amounts are paid to families with incomes just below the FB eligibility threshold where they can claim part of the Child Tax Credit and still receive the full amounts of Family Benefits. For couples with one child this corresponds to gross income of 125.50 PLN per month, while for families with two and three children to 281.50 and 517.40 PLN per month. The point withdrawal of Family Benefits is probably the most peculiar element of the Polish system of family support, and we take reform of this element through the introduction of a gradual withdrawal taper as a reference scenario for comparison of other alternative changes to the system of support in Sections 4 and 5.
4 All monetary values in the paper are given in Polish zloty (PLN). The exchange rate of the euro to PLN in June 2010 was: €1=4.15PLN and we occasionally quote values in euro alongside PLN values.5 For details of the Polish tax and benefit system see e.g.: Morawski and Myck (2010, 2011), Domitrz et al. (2013) or Kundera et al. (2012).
Dow
nloa
ded
by [
89.6
7.85
.154
] at
11:
13 2
9 Ja
nuar
y 20
15

65Financial support for families with children and its trade-offs: balancing redistribution and parental work incentives
Figure 1: Gross income and family support – 2010 A – Budget constraint B – Total family support
Source: Authors’ calculations using the SIMPL microsimulation model (V4S3_12).
As the above description makes clear the Polish tax and benefit system contains no instru-ments specifically targeted at providing work incentives to second earners in couples. All of the gains available to couples – joint taxation, joint availability of the Child Tax Credit and joint assessment of incomes for Family Benefits, with the particular feature of the point with-drawal of benefits – are classic examples of features of the tax and benefit systems which act to discourage employment of secondary earners in couples through the income effect (e.g. Duncan and Giles, 1996; Blundell et al., 2000; Haan and Myck, 2007; Bargain and Orsini, 2006, Brewer et al., 2006; Immervoll et al., 2011). In the case of parents of pre-school chil-dren joint employment often involves substantial childcare costs, which further contributes to financial disincentives to work for the second earner. Research on the consequences of these features using data for other countries suggests that they play an important role in determin-ing the pattern of employment among couples (Dearing et al., 2007; Steiner and Wrohlich, 2004).
3. Data used for analysis and employment of parents in Poland
3.1 Data and samples used for analysis
Our analysis is based on data from the Polish Household Budget Survey (PHBS) which is con-ducted annually by the Polish Central Statistical Office and covers detailed information on demo-graphics, incomes and household expenditure. We use the 2010 PHBS database which includes information on a representative sample of 37,412 private households (107,967 individuals). For the purpose of our analysis households are divided into families, composed of adults (singles or cohabiting couples) with or without dependent children. There are 51,413 families in the sample. The great majority of households are single-family households (73.1%), but in about 20% of households we identify two families and in 16.9% three or more.6 The descriptive statistics for employment presented below focus on families where heads 6 Throughout the paper percentages computed for the purpose of sample description use sample weights provided by the Polish CSO in PHBS data.
Mon
thly
dis
posa
ble
inco
me
Mon
thly
fam
ily su
ppor
t
Dow
nloa
ded
by [
89.6
7.85
.154
] at
11:
13 2
9 Ja
nuar
y 20
15
66 Baltic Journal of Economics 13(2) (2013) 59–83
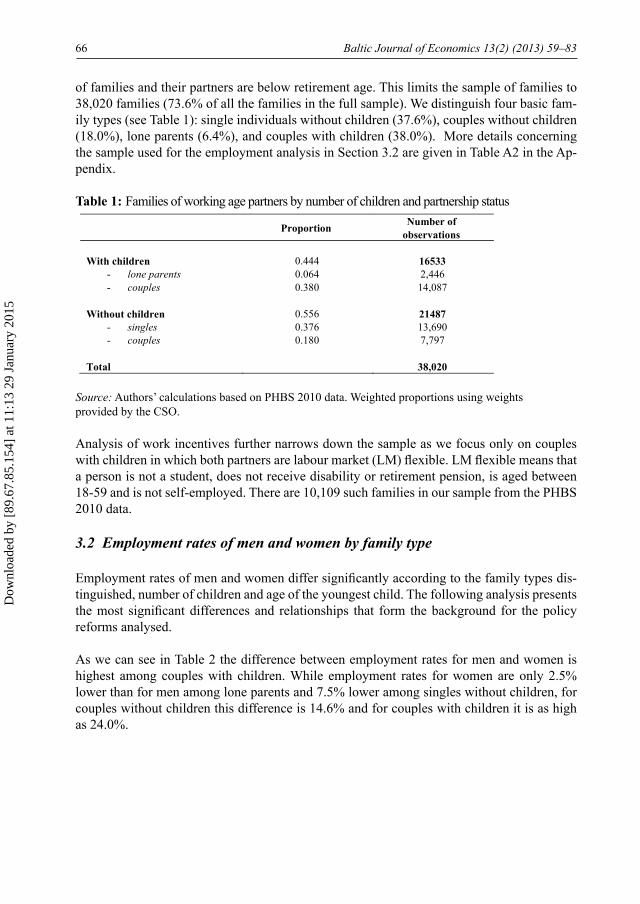
of families and their partners are below retirement age. This limits the sample of families to 38,020 families (73.6% of all the families in the full sample). We distinguish four basic fam-ily types (see Table 1): single individuals without children (37.6%), couples without children (18.0%), lone parents (6.4%), and couples with children (38.0%). More details concerning the sample used for the employment analysis in Section 3.2 are given in Table A2 in the Ap-pendix.
Table 1: Families of working age partners by number of children and partnership status
Source: Authors’ calculations based on PHBS 2010 data. Weighted proportions using weights provided by the CSO.
Analysis of work incentives further narrows down the sample as we focus only on couples with children in which both partners are labour market (LM) flexible. LM flexible means that a person is not a student, does not receive disability or retirement pension, is aged between 18-59 and is not self-employed. There are 10,109 such families in our sample from the PHBS 2010 data.
3.2 Employment rates of men and women by family type
Employment rates of men and women differ significantly according to the family types dis-tinguished, number of children and age of the youngest child. The following analysis presents the most significant differences and relationships that form the background for the policy reforms analysed.
As we can see in Table 2 the difference between employment rates for men and women is highest among couples with children. While employment rates for women are only 2.5% lower than for men among lone parents and 7.5% lower among singles without children, for couples without children this difference is 14.6% and for couples with children it is as high as 24.0%.
Proportion Number of observations
With children 0.444 16533
- lone parents 0.064 2,446 - couples 0.380 14,087
Without children 0.556 21487
- singles 0.376 13,690 - couples 0.180 7,797
Total 38,020
Dow
nloa
ded
by [
89.6
7.85
.154
] at
11:
13 2
9 Ja
nuar
y 20
15

67Financial support for families with children and its trade-offs: balancing redistribution and parental work incentives
Table 2: Employment rates by family type
Source: Authors’ calculations based on PHBS 2010 data. Weighted proportions using weights provided by the CSO.
The difference in employment rates of mothers and fathers in couples is very high when women are in the reproductive age range (up to about 40 years old), and in particular at ages when they are likely to have young children (Figure 2A). Employment of women in couples grows among older women with children and from about 40 is actually slightly higher com-pared to women without children (Figure 2A). The employment rate of men in couples up to the age of about 45 is above 80% and there is little difference between men with and without children. Employment of both men and women in the age groups above 45 begins to fall, but we need to remember that the analysis cannot distinguish age from cohort effects and the lower rates of employment among those aged 50+ may be driven by cohort differences in labour market activity.
Figure 2: Employment rates by family type, age, and age of youngest child
A. Men and women in couples B. Parents by age of youngest child
Source: Authors’ calculations based on PHBS 2010 data.
The age of the youngest child has a clear effect on the employment rates of mothers but little consequence for the employment rate of fathers (Figure 2B). Employment rates of mothers (both in couples and lone mothers) grow significantly with the age of their youngest child. At the same time the employment rate of fathers remains stable up to the age of 12 of their youngest child, and drops slightly when the youngest child becomes older.
Men Women Singles without children 0.617 0.571
Lone parents 0.701 0.684 Couples without children 0.696 0.595 Couples with children 0.890 0.676
Dow
nloa
ded
by [
89.6
7.85
.154
] at
11:
13 2
9 Ja
nuar
y 20
15

68 Baltic Journal of Economics 13(2) (2013) 59–83
3.3 Employment rates by receipt of family benefits
It has long been argued that the system of family benefits in Poland is mainly focused on passive poverty reduction and offers little additional incentives to encourage parents to work (e.g. Wóycicka, 2005; Haan, et al., 2008; Kurowska, 2012). This is partly due to the point withdrawal of Family Benefits, but also relates to the overall joint approach to eligibility for family support through benefits and taxes and lack of any employment-related incentives or elements supporting childcare expenditure. This problem has recently worsened as a result of a policy of increasing real benefit values with simultaneous reductions in the real value of eligibility thresholds (e.g. Myck et al. 2011, Domitrz et al. 2013).
The point withdrawal of family benefits is certainly one of the most problematic features of the system from the point of view of labour market incentives. This approach discourages greater intensity of work and increases in productivity among first earners and implies strong disincentives for second earners on the extensive margin. Among couples receiving benefits only 39.2% are two-earner couples, and 44.9% are couples where only the father works. The respective figures for those who do not receive benefits are 67.8% and 23.0% (see Table 3). These differences are hardly surprising, as entering employment for many of the mothers would result in loss of benefits (the majority of which are paid directly to the mother). As we can see in Table A3 (in the Appendix) the potential for increasing employment of mothers is particularly high among recipients of Family Benefits with one or two children (56.3% of single-earner families) and those with children of pre-school age (61.9%). The statistics con-firm the pattern found in other countries of a higher proportion of single-earner families when their youngest child is below school age. This relates on the one hand to the greater need for parental care among youngest children, but also to childcare costs which have to be borne to facilitate employment of both parents.
Table 3: Employment of parents in families with children according to receipt or non–re-ceipt of family benefits
Source: Authors’ calculations based on PHBS 2010 data. Weighted proportions using weights provided by the Polish CSO.
Families: Without family benefits With family benefits
Couples (n.obs.): 10817 3270
- both working 0.678 0.392 - only father works 0.230 0.449 - only mother works 0.062 0.082 - both not working 0.031 0.077
Lone mothers (n.obs): 1502 720
- working 0.803 0.472 - not working 0.197 0.528
Dow
nloa
ded
by [
89.6
7.85
.154
] at
11:
13 2
9 Ja
nuar
y 20
15

69Financial support for families with children and its trade-offs: balancing redistribution and parental work incentives
4. Reforming financial support for families – design and distributional consequences
4.1 Modelled reform options
The principal goal of the simulations presented in this paper is to analyse the trade-offs in-volved in different types of changes applied to the main elements of financial support for families in Poland. As mentioned above the starting point for this analysis, and a reference in terms of potential costs of the reform, is the move to tapered withdrawal of Family Benefits. For this purpose we use the rate of withdrawal at 55%, which is the rate used in a broadly studied in-work support programme in the UK, the Working Families’ Tax Credit (WFTC) in the late 1990s and early 2000s (see, e.g.: Blundell et al., 2000; Brewer et al., 2006; Clark et al., 2002, Haan et al., 2008). Application of the taper implies that with an increase of net income of 1 PLN beyond the withdrawal threshold, the total value of benefits is reduced by 0.55 PLN. Such a change would imply greater certainty and predictability of benefit receipt, compared to the current point withdrawal system. However, as it extends the availability of benefits to families who currently no longer qualify for them, it would carry additional costs. We estimate this cost to be in the range of about 1.04 bn PLN (€250mln) per year, an increase in the total value of family benefits by about 14%.
The withdrawal taper reform (referred to below as System 1) is used as a cost benchmark for four other potential changes to the tax and benefit system designed in such a way as to have different implications for work incentives. The first two reforms change the parameters of the Family Benefits system, while the third and fourth change the functioning of the Child Tax Credit. Details of changes implemented in all modelled reform systems are summarized in Table 4 and are presented for stylised households in Figures 3 and 4.
Changes in Family Benefits under System 2 involve simple increases in the values of Fam-ily Allowance, which is raised by 20% given the cost benchmark of 1.04 bn PLN. The final reform to Family Benefits (System 3) combines introduction of the withdrawal taper (at 55%) with a bonus system for two-earner families with the specific aim of providing stronger work incentives for second earners. The bonus consists of an increase in the withdrawal threshold from which Family Benefits begin to be reduced by 50% compared to the baseline threshold value for families where both parents work. This approach requires specification of condi-tions qualifying families for double-earner status, and we set this in the form of a minimum earnings level for both parents of at least 80% of the minimum wage (1,054.00 PLN). Since benefit eligibility is assessed on the basis of annual incomes in Poland this requirement could take the form of employment at less than the full time minimum wage throughout the year or full time work for part of the year with earnings at or above the minimum wage. The addition of this double earner bonus on top of the 55% withdrawal taper further increases the costs of the reform. To calibrate these to the benchmark cost of 1.04 bn PLN we reduce the reference income threshold from which Family Benefits begin to be withdrawn by 9.0%.
The first reform of Child Tax Credit assumes an increase in the value of the CTC by 19.8% (calibrated to cost 1.04 bn PLN), while the second uses this tax credit instrument to reward two-earner status. In the latter case, double-earner couples are granted an additional value of
Dow
nloa
ded
by [
89.6
7.85
.154
] at
11:
13 2
9 Ja
nuar
y 20
15

70 Baltic Journal of Economics 13(2) (2013) 59–83
the credit (92.70 PLN per month). The cost of this reform is again calibrated to the level of other reforms by adjusting the earnings requirement set for both parents to qualify as double-earner couples. This calibrated requirement is 2,324.50 PLN per month, which is equivalent to 176.5% of the minimum wage. The effects of the modelled reforms for the values of Family Benefits and Child Tax Credit are demonstrated for different stylized households in Figures 3 (Systems 1-3) and 4 (Systems 4 and 5).
Table 4: Improving incentives to work for families with children: reform scenarios
Source: Authors’ selection with calibration based on the SIMPL microsimulation model. Notes: * - mw – minimum wage (1317 PLN per month).
Figure 3A presents the effects of changes for a single earner family with two children con-ditional on the gross earnings of the earner. Under the 2010 baseline system (System 0) the maximum amount of Family Benefits this family can receive is 167.30 PLN (€40.30) per month, and this is paid up to the point when the income from work exceeds the threshold of 504.00 PLN per person which for this family corresponds to gross earnings of 2,565.00 PLN per month. Introduction of tapered benefit withdrawal (System 1) extends eligibility to Family Benefits for this family to 2,950.00 PLN. Under System 2 the eligibility criteria do not change but families eligible to receive benefits under the base scenario see their benefit amounts grow due to increases in Family Allowance. In the case of the Family in Figure 3A the value of Family Benefits grows to 199.20 PLN (€48) per month. The consequences of introducing System 3 with respect to the baseline system imply earlier withdrawal of benefits (from 2,340.00 PLN per month) given the change of the withdrawal threshold from which benefits begin to be tapered away. However, because of tapered withdrawal the benefits now extend further up the earnings distribution compared to the baseline scenario. Thus single earner families with gross earnings between 2,340.00 PLN and 2,720.00 PLN per month gain on the introduction of System 3. As Figure 3A makes clear, though, System 1 is more gener-ous than System 3 for single earner families.
The reason for the difference between Systems 1 and 3 in the case of single earner families, given the same cost of the two reforms, is demonstrated in Figure 3B where we demonstrate the effect of the reforms, conditional on the earnings of the second earner and assuming that the first earner receives gross earnings corresponding to 75% of the mean wage.7 In this case the generosity of the baseline and reformed scenarios is shown for a family with three
7 The value of the mean gross wage in 2010 was 3,225 PLN per month.
Policy name
Changes in basic policy: FB
taper
Double earner couples:
FB thresholds
FB amounts
CTC amount
minimum income
of 2ndperson
FB thresholds extension
CTC amounts
extension System 1 - - - 55.0% - - -
System 2 - + 20.0% - - - - -
System 3 - 9.0% - - 55.0% 80.0% of mw* + 50.0% -
System 4 - - + 19.8% - - - -
System 5 - - - - 176.5% of mw* - + 1 CTC
Dow
nloa
ded
by [
89.6
7.85
.154
] at
11:
13 2
9 Ja
nuar
y 20
15

71Financial support for families with children and its trade-offs: balancing redistribution and parental work incentives
children. As we can see in this case benefits in the baseline System 0 and under System 2 are withdrawn when the second earner’s gross earnings reach 785.00 PLN per month. It is worth noting here that under System 2 the family income in the out of work scenario of the second earner is higher relative to the baseline scenario. Family Benefits under System 3 begin to be withdrawn at gross earnings of the second earner beyond 465.00 PLN per month. However, the system now rewards double earner status by raising the benefit withdrawal threshold by 50% once the earnings of both partners are at least 80% of the minimum wage, i.e. 1,054.00 PLN. This means that in the example shown in Figure 3B the family is again eligible to re-ceive the full amount of Family Benefits up to the earnings level of 1,960.00 PLN. From that point benefits are tapered away and families cease to receive them once the earnings of the second earner reach the level of 2,835.00 PLN.
Figure 3: Monthly family benefits in a single & double earner family: baseline (System 0) and Systems 1-3
A. Single earner family B. Double earner family with three with two children: children (1st earner on wage at 75% of mean wage):
Source: Authors’ calculations using the SIMPL microsimulation model (V4S3_12).Notes: Assumed gross monthly minimum wage at 2010 level (1,317 PLN); the gross monthly mean wage in 2010 was 3,224.98 PLN. The choice of stylized household types has been made for illustrative reasons.
0
100
200
300
400
0 1000 2000 3000 4000Gross monthly income
System 0 System 1 System 2 System 3
0
100
200
300
400
Mon
thly
FB
amou
nt
0 1000 2000 3000 4000Gross monthly income
System 0 System 1 System 2 System 3
Mon
thly
FB
amou
nt
Dow
nloa
ded
by [
89.6
7.85
.154
] at
11:
13 2
9 Ja
nuar
y 20
15

72 Baltic Journal of Economics 13(2) (2013) 59–83
Figure 4: Monthly CTC amount in a single & double earner family: baseline (System 0) and Systems 4 and 5
A. Single earner family B. Double earner family with two with two children: children (1st earner on wage at 75% of mean wage)
Source: Authors’ calculations using the SIMPL microsimulation model (V4S3_12).Notes: Assumed gross monthly minimum wage at 2010 level (1,317 PLN); the gross monthly mean wage in 2010 was 3,224.98 PLN.
In Figure 4 we show the simulated effects of changes in Child Tax Credit. These are demon-strated for a family with two children in the case of a single earner scenario (Figure 4A) and with respect to the earnings of the second earner with the same assumption on the earnings of the first earner as in Figure 3B. As we can see from Figure 4A, benefits of Child Tax Credit begin once earnings of the first earner exceed 1,275.00 PLN per month and for a family with two children the full credit under the baseline scenario is exhausted from earnings beyond 3,370.00 PLN. This implies that the value of the CTC for this example family still grows when the second partner takes up employment and the earnings of the first earner are at the assumed level of 75% of the mean wage (i.e. 2,419.00 PLN, Figure 4B). Thus single earner families with gross earnings beyond 3,370.00 PLN, and the second earner scenario with gross earnings beyond 1,175.00 PLN benefit from introduction of System 4. The effects of intro-ducing the double earner premium in the CTC (System 5) benefits only the family with the second earner (Figure 4B), and only when earnings exceed the required threshold of 2,325 PLN (176.5% of the minimum wage, or 72.1% of the mean wage). Since the double earner premium in CTC is equivalent to the full CTC amount for every child, the family gains 92.67 PLN (€22.30) per month once the earnings of the second earner exceed the required thresh-old.
Dow
nloa
ded
by [
89.6
7.85
.154
] at
11:
13 2
9 Ja
nuar
y 20
15

73Financial support for families with children and its trade-offs: balancing redistribution and parental work incentives
4.2 Distributional consequences of modelled reforms
The assumptions underlying the modelled scenarios are very clearly reflected in the (static) distributional effects of the simulated changes. The proportional changes in incomes among families with children by population decile groups resulting from the simulated reforms are demonstrated in Figure 5A for Systems 1-3 and Figure 5B for Systems 4-5.
The poorest families benefit most under System 2, since it raises the values of Family Al-lowance for those who receive it under the baseline scenario. On average the incomes of households with children in the bottom decile grow by about 3% as a result of higher rates of Family Allowance. System 5, on the other hand, allocates the additional resources primarily to better off households with the highest proportional changes in the 9th decile amounting on average to about 0.8%. Increases in CTC under System 4 are proportionally most generous to middle income families, while Systems 1 and 3 are most generous to families in the 2nd, 3rd, and 4th decile.
The difference in the distributional effect between systems 1 and 3 is worth noting. Since the benefits of System 3 focus on two-earner families, the reform has a negligible effect on the poorest households. At the same time it benefits families in deciles 3, 4 and 5 by 1.47%, 1.16% and 0.57% respectively, i.e. more than System 1 (1.38%, 0.85%, 0.41%). This is be-cause in these decile groups we find families with two earners who under the baseline 2010 system would no longer qualify for Family Benefits.
Figure 5: Distributional consequences of modelled reforms
A. Reforms to Family Benefits B. Reforms to Child Tax Credit
Source: Authors’ calculations using the SIMPL microsimulation model (V4S3_12) on PHBS 2010 data.Notes: Reference system: Baseline 2010; average figures per decile computed for households with chil-dren.
Dow
nloa
ded
by [
89.6
7.85
.154
] at
11:
13 2
9 Ja
nuar
y 20
15

74 Baltic Journal of Economics 13(2) (2013) 59–83
5. Effects of reforms on employment incentives
In this Section we present the effects of the analysed reforms on labour market incentives at the ex-tensive margin, i.e. on the incentive for parents to take up or to leave a job. We focus on incentives for parents in couples, and analyse them by looking at changes in the replacement ratios (RRs) of first and second earners. For the analysis presented in this section we focus on a subsample of the data and use only couples where both partners are defined as “labour market flexible” (LM-flexi-ble). A labour market flexible person is someone who is not a student, does not receive disability or retirement pensions, is aged between 18-59 and is not self-employed. This sample includes 10,109 couples with children. One ought to note here that financial incentives to work which we focus on here are only one of several important factors which determine parental employment. For a more complete picture of the possible consequences of reforms in the labour market one would have to examine other factors, including labour market and institutional constraints. Among the latter, availability of formal and informal childcare is clearly an important element affecting labour mar-ket behaviour of parents, and in particular employment of both parents. However, since childcare cost is often an important barrier when it comes to employment in particular of second earners, the financial rewards for working will affect the combination of employment and childcare use choices (Brewer et al. 2006, Myck and Reed, 2006).8
Measuring incentives at the extensive margin
For the couples in the subsample we compute three sets of family-level incomes, conditional on employment either of the first earner (who is the person with higher expected earnings in a couple) or of both partners:- Y(1,1)for the scenario where both partners are employed (full-time);- Y(1,0) for the scenario where the first earner is employed (full-time);- Y(0,0) for the scenario where both partners are not employed.This allows us to compute replacement ratios for the first earner (RR1) and the second earner (RR2) for each of the analysed tax and benefit systems (S): RR1
s.j.=YS j(0,0)/Y
Sj(1,0) (1)
RR2s.j.=YS
j(1,0)/YS
j(1,1) (2)
Replacement ratios are computed for the baseline tax and benefit system (Base) and for all five reform systems (Systems 1-5). Results of the calculations are presented as the difference between the Base system (0) and the reform systems (R). The effects of the reforms on the first and second earners are thus computed as:
(3)
8 Poland has a significantly lower formal childcare enrollment rate for preschool children compared to the EU average (43% compared to 84% in 2011). This is partly related to a historically low number of childcare places in “collective childcare structures”, popular use of informal childcare by family members or nannies and closure of a significant number of childcare facilities after 1989 (Heiner and Wator, 2006, Kamińska, 2003). Several important improve-ments in childcare availability have been implemented since 2006, including liberalization of childcare provision and development of childcare infrastructure (Swianiewicz, 2012). As a result, the share of preschool children has grown systematically since 2006.
1,
1,0
10 jRjRj RRRRRR −=∆
Dow
nloa
ded
by [
89.6
7.85
.154
] at
11:
13 2
9 Ja
nuar
y 20
15

75Financial support for families with children and its trade-offs: balancing redistribution and parental work incentives
(4)
Positive values of these differences will imply improvements in labour market incentives and reflect either an increase in income from work or a reduction of out of work income. Negative values reflect weaker incentives to take up a job or, alternatively, higher incentives to drop out of employment. In Figure 6 we present kernel densities of changes in RRs for first earners (Figures 6A, 6C and 6E) and for second earners (6B, 6D, 6F) for all five reform systems. These distributions illustrate the labour market effects of the reforms and demonstrate the relative magnitude of changes under different reformed regimes. Since only some of the families in the sample are affected by the modelled changes, for clarity of exposition we present figures only for those for whom the reforms imply a change in incentives (the number of families in the sample affected by each reform is given in the Figures). Table 5 gives details of the proportion of families in the sample of couples with two LS-flexible partners affected by the simulated changes in a positive and negative way. The results presented in Table 5 reflect the nature of the simulated changes and their implications as demonstrated in Figures 3 and 4.
Table 5: Effect of reforms: proportion of couples by change in work incentives
Source: Authors’ calculations using the SIMPL model based on PHBS 2010 data.Notes: Based on a sample of couples with two LS-flexible partners.
Figure 6: Changes in RRs resulting from modelled reforms
A) Systems 1 and 3: first earners B) Systems 1 and 3: second earners
2,
2,0
20 jRjRj RRRRRR −=∆
System 1 System 2 System 3 System 4 System 5 First earner incentives - worsened 0.007 0.724 0.034 0.010 0.000 - unchanged 0.791 0.240 0.805 0.461 1.000 - improved 0.203 0.037 0.161 0.529 0.000 Second earner incentives - worsened 0.125 0.096 0.077 0.512 0.000 - unchanged 0.852 0.901 0.841 0.113 0.563 - improved 0.023 0.003 0.082 0.376 0.437
Dow
nloa
ded
by [
89.6
7.85
.154
] at
11:
13 2
9 Ja
nuar
y 20
15

76 Baltic Journal of Economics 13(2) (2013) 59–83
C) System 2: first earners D) System 2: second earners
E) System 4: first earners F) Systems 4 and 5: second earners
Source: Authors’ calculations using the SIMPL microsimulation model (V4S3_12) on PHBS 2010 data.Notes: Based on a sample of couples with two LM-flexible partners. For clarity of exposition figures are drawn excluding outliers below the 1st percentile and above the 99th percentile of the distribution of changes in RRs. Kernel densities are presented only for the subsample of couples for whom incentives change as a result of the simulated reform. The number of families included is specified in each figure.
Financial incentives for first earners improve under System 1, with introduction of the 55% withdrawal taper, for 20.3% of the modelled families and under System 3, where the taper is combined with a lower eligibility threshold, for 16.1% of couples. The mean changes in RRs for families who are affected by these reforms are 0.95 percentage points (pp) and 0.58pp respectively. About 3% of families see their first earner incentives worsened under System 3, which reflects the lower withdrawal threshold for Family Benefits. A higher value of Child Tax Credit (System 4) increases incentives to work for first earners in 52.9% of families, but as we can see in Figure 6E, because of small changes in values of the credit the differences in work incentives are in most cases very small. The mean value of the change in RRs is 0.08pp. Increasing the value of Family Allowance under System 2 (Figure 6C) has a negative effect on first earner incentives, as the reform increases out of work income in the scenario when neither of the parents is employed. This change affects first earner incentives of about 72.4% of families, with a substantial average change in RRs of about 1.4pp. In the case of this reform the unaffected couples either have dependent children whose age makes them ineligible for Family Benefits, are cohabiting couples in which case the parents are treated separately for eligibility to Family Benefits, or have high out of work incomes, which makes them ineligible
Dow
nloa
ded
by [
89.6
7.85
.154
] at
11:
13 2
9 Ja
nuar
y 20
15

77Financial support for families with children and its trade-offs: balancing redistribution and parental work incentives
for Family Benefits regardless of the work status of the parents. Since under System 5 the additional CTC premium is limited to second earners the reform has no effect on first earner incentives. In Table 5 we can also see a reflection of the features of the Polish tax and benefit system which allows for situations where higher income from work or from Family Benefits can lead to a reduction in the family disposable income (through point withdrawal of Family Benefits and other means tested transfers). This is reflected in the small number of families where incentives to work worsen under Systems 1 and 4, and improve under System 2.
The picture for second earner incentives is much more complex and demonstrates the trade-offs between providing higher incentives to first and to second earners in couples. Introduc-tion of the withdrawal taper (System 1) makes work more attractive for almost 20.3% of first earners. However, the fact that it leads to increases in out of work incomes for second earners implies a reduction in their financial incentives to work in the case of 12.5% of families, and results in a mean reduction of RRs of over 3pp for the affected families (Figure 6B). Work becomes more attractive in the case of this reform only for 2.3% of second earners. This contrasts with the reform under System 3, which extends eligibility to Family Benefits for two-earner couples and leads to improvements in second-earner work incentives for 8.2% of families in the sample and an overall increase in second earner work incentives of about 1pp. Because many families lose their entitlement to Family Benefits when the first earner works full time, the out of work income of the majority of second earners is unaffected by an increase in the level of Family Allowance. Thus System 2 reform worsens second earner incentives only in the case of 9.6% of families. As in the case of first earners a mean change in RRs of second earners at 1.5pp is quite substantial.
A similar pattern of changes to work incentives as in System 1 can be observed for the in-crease in the value of Child Tax Credit (System 4). Higher incomes in one-earner scenarios imply improvements in work incentives for first earners. This however leads to worsened incentives for second earners in 51.2% of families. At the same time, though, since some families do not take full advantage of the CTC in the one-earner scenario, they actually gain from the increased CTC only if both parents are working (as in the example in Figure 4B). This is the case in 37.6% of the families in our sample, with the resulting average effect on replacement ratios of about 0.1pp among the families affected by this reform. The design of the reform in System 5 implies only improvements in the work incentives of second earners. Moreover, since the reform affects only 43.7% of the couples in the sample, given the require-ment regarding the level of earnings, those families who are affected see a relatively strong effect on their incentives to work of about 1pp.
The results of changes in RRs are presented once again in Figures 7 and 8 from the perspec-tive of distribution of incentives in the baseline system. The figures show average changes in RRs for first and second earners respectively by centiles of the baseline distribution of replacement ratios with lowest values of RRs implying the strongest incentives and highest values reflecting the weakest incentives. This approach provides evidence on the third of the analysed trade-offs. The pattern which emerges from Figures 7 and 8 reflects to some extent the distributional effects of the reforms (Figure 5). This is because richer families are usually those with high labour market incomes and thus low RRs, while poorer families face weaker incentives given their low actual (or potential) earnings, and thus face higher replacement ratios.
Dow
nloa
ded
by [
89.6
7.85
.154
] at
11:
13 2
9 Ja
nuar
y 20
15

78 Baltic Journal of Economics 13(2) (2013) 59–83
Figure 7: Changes in RRs by baseline work incentives – first earners
Source: Authors’ calculations using the SIMPL microsimulation model (V4S3_12) on PHBS 2010 data.Notes: Based on a sample of couples with two LS-flexible partners. For clarity of exposition averages are computed for two adjacent centiles excluding outliers below the 1st percentile and above the 99th percen-tile of the distribution of changes in RRs.
Figure 8: Changes in RRs by baseline work incentives – second earners
Source: Authors’ calculations using the SIMPL microsimulation model (V4S3_12) on PHBS 2010 data.Notes: Based on a sample of couples with two LS-flexible partners. For clarity of exposition averages are computed for two adjacent centiles excluding outliers below the 1st percentile and above the 99th percen-tile of the distribution of changes in RRs.
Dow
nloa
ded
by [
89.6
7.85
.154
] at
11:
13 2
9 Ja
nuar
y 20
15

79Financial support for families with children and its trade-offs: balancing redistribution and parental work incentives
As we can see in Figure 7, Systems 1 and 3 increase financial incentives to work for first earn-ers among those with relatively weak incentives – the noticeable positive effects of Systems 1 and 3 start at about the 50th and 60th percentile of the baseline RR distribution, and are high-est at about the 75th percentile. The effects are then reduced because families with the weak-est work incentives receive Family Benefits both in and out of work. This effect also explains why the negative effects of introducing System 2 are smaller among those with high levels of baseline RRs. These effects, however, are quite substantial throughout the distribution of first earner incentives. The same cannot be said of the positive effects of System 4. Although the effects are positive across distribution of the baseline RRs, the resulting changes in replace-ment ratios are very low. The effects of System 4 on second earner incentives are also small and they are fairly evenly distributed across distribution of second earners’ RRs (Figure 8). The distribution of the effect of the modelled reforms on work incentives of second earners is particularly interesting in the case of Systems 3 and 5. The mean effect of these changes on RRs in both cases is about 1.0pp, but the effects concentrate on those with the weakest baseline incentives in the case of System 3, and on those with the strongest incentives in the case of System 5. Under System 3 the mean changes in RRs become positive beyond about the 75th percentile of baseline RR distribution, and are highest for second earners from the top decile of this distribution, i.e. for the 10% of families where second earner incentives are weakest. This group of second earners is also most strongly affected by the negative conse-quences of increasing the value of Family Allowance under System 2.
6. Conclusion – family support and its trade-offs
Reducing child poverty and increasing parental employment belong to the most important policy objectives of many governments, in particular in countries which due to low fertil-ity rates face substantial demographic imbalances in the coming decades. Using data from Poland and simulated policy reforms of the system of financial support for families with chil-dren we demonstrated that realising both of these objectives is a complex task, in particular given the financial constraints faced by governments as a result of the economic slowdown. The most important trade-offs related to support of low-income families and its consequences on the labour market have long been known (e.g. Duncan and Giles, 1996; Blundell et al. 2000). This paper, however, sheds new light on the problem and extends analysis of the trade-offs involved to issues which have so far been little examined.
Poland has one of the highest rates of child poverty in Europe and its female employment rates lag behind many EU countries. At the same time its level of spending on means-tested financial support for children is among the lowest (Levy et al., 2009) and the system of taxes and benefits contains no support elements conditional on labour market activity and in par-ticular no instruments designed to make work pay for second earners in couples. It is difficult to imagine significant improvements in the material situation of families with children in Poland and other countries of the region facing similar challenges (e.g. Bulgaria, Latvia or Romania) without increases in the generosity of family-related benefits. We argue that given the complex nature of consequences which financial support for children carries with it, this will pose significant challenges to policy makers.
Dow
nloa
ded
by [
89.6
7.85
.154
] at
11:
13 2
9 Ja
nuar
y 20
15

80 Baltic Journal of Economics 13(2) (2013) 59–83
Apart from the well-established trade-off between equity and labour market concerns, this paper draws attention to the need to balance out first and second earner work incentives as well as incentives by the degree of existing financial motivation to work. As a benchmark for the analysed changes we used the introduction of tapered withdrawal of Family Benefits in place of the existing point withdrawal. This reform would cost about 1bn PLN per year and would increase the total value of Family Benefits by about 14%. The equity and labour mar-ket implications of this change have been compared to four other potential reforms including two to the system of Family Benefits and two to the generosity of the Child Tax Credit. All four have been calibrated to cost as much as the benchmark reform and their consequences have been analysed from the overall distributional perspective and from the point of view of labour market incentives for a sample of couples with children.
Reforms at the two extremes of the distributional spectrum, namely an increase in the level of Family Benefits and a Child Tax Credit bonus for two-earner couples, result in very different incentive effects. The former significantly weakens incentives of both first and second earners in couples, while the second, which specifically directs resources at second earners, produces important improvements in incentives to work for second earners. As we demonstrated in this paper, however, these gains focus on the part of the spectrum of the baseline distribution of work incentives where these are already strong. This contrasts with a reform in which a two-earner “bonus” is created as part of Family Benefits. This system increases the generosity of in-work support for first earners in couples in a similar way to the benchmark reform. At the same time, however, it improves the attractiveness of work for second earners by raising the level of income from which benefits are withdrawn for couples in which both partners are working. This arrangement balances out the negative influence on second earner incentives of the income effect of making work more financially attractive for first earners, which does not happen under our benchmark scenario. Moreover, we demonstrate that trying to increase work incentives through higher levels of Child Tax Credit available to families would have a positive effect on the work incentives of a large number of families, in particular on first earners in couples. The flip-side of this effect would be some negative incentive effects on second earners, but generally both types of effect would be very low given the assumed cost restriction of the modelled reforms.
Naturally, there is an endless number of ways in which a billion PLN can be spent on families with children. As we argued above each type of reform will have a complex set of conse-quences on household incomes and incentives to work for parents. The breakdown of em-ployment pattern by family types presented in Section 3 suggests that from the point of view of increasing labour market activity, family support policy should focus on trying to make work pay for second earners in couples, most of whom are women. As we demonstrated this can be done in such a way as to balance out incentives for first earners and provide strong incentives to those second earners who currently face the weakest incentives to work. At the same time resources would be directed to families in the lower half of income distribution which could result in direct reduction of child poverty.
The analysis presented in this paper shows a broad range of consequences of different types of reform to the system of financial support for families with children and the trade-offs be-tween them. Each of the analysed changes implies different distributional effects and varies in the consequences concerning work incentives for first and second earners. Moreover, these
Dow
nloa
ded
by [
89.6
7.85
.154
] at
11:
13 2
9 Ja
nuar
y 20
15

81Financial support for families with children and its trade-offs: balancing redistribution and parental work incentives
labour market effects may affect different segments of the baseline distribution of employ-ment incentives which would influence their actual impact. It is policy makers who have to define objectives and follow this with policy implementation. Understanding the complexity of the consequences involved in family policy is crucial if the aim is to “kill two birds with one stone” (Bargain and Orsini, 2006), namely to reduce poverty and improve incentives to work. At the time of a long lasting economic slowdown and tight government budgets, achieving this aim may be more important than ever.
References:
Adam S., M. Brewer and A. Shephard (2006) Financial Work Incentives in Britain: Comparisons Over Time and Between Family Types, Institute of Fiscal Studies Working Paper 06/20, London.Adam S. and J. Browne (2010) Redistribution, Work Incentives and Thirty Years of UK Tax and Benefit Reform, Institute of Fiscal Studies Working Paper 10/24, London.Bargain O. and K. Orsini (2006) In-Work Policies in Europe: Killing two Birds with one Stone? Labour Economics, vol. 13 (6), pp. 667-693.Bargain O., L. Morawski, M. Myck and M. Socha (2007) “As SIMPL as that – introducing a Tax-Benefit Microsimulation model for Poland”, IZA Discussion Paper 2988, Bonn.Blundell R. (2001) Welfare reform for low income workers, Oxford Economic Papers, vol. 53, pp. 189-214.Blundell R., A. Duncan, J. McCrae and C. Meghir (2000) The Labour Market Impact of the Working Families’ Tax Credit, Fiscal Studies, vol. 21(1), pp. 75-104.Brewer M., A. Duncan, A. Shephard and M.-J. Suarez (2006) “Did Working Families’ Tax Credit Work? The Impact of In-Work Support on Labour Supply in Great Britain”, Labour Economics, vol. 13, pp. 699-720.Björklund A. (2006) Does family policy affect fertility? Journal of Population Economics, vol. 19 (1), pp. 3-24.Clark T., A. Dilnot, A. Goodman, and M. Myck (2002) Taxes and Transfers, Oxford Review of Economic Policy, vol.18 (2), pp. 187-201.Dearing H., H. Hofer, C. Lietz, R. Winter-Ebmer and K. Wrohlich (2007) Why do mothers work longer hours in Austria than in Germany? A comparative microsimulation study. Fiscal Studies, vol. 28(4), pp. 463-495.Domitrz A., M. Myck, L. Morawski, A. Semeniuk (2013) Dystrybucyjny wpływ reform podatkowo-świadczeniowych wprowadzonych w latach 2006-2011, Bank i Kredyt, vol. 44(3), pp. 261-286. Haan P., and M. Myck (2010) „Safety net still in transition: labour market incentive effects of social support in Poland and Germany“ Bank i Kredyt, vol. 41(3), pp. 5–34.Haan P., M. Myck (2012) “Multi-family households in a labour supply model: a calibration method with application to Poland.” Applied Economics, vol. 22, pp. 2907-2919.Haan P. and K. Wrohlich (2011) Can Child Care Encourage Employment and Fertility? Evi dence from a Structural Model. Labour Economics, vol. 18 (4), pp. 498-512.Duclos E., P. Lafebre, P. Merrigan (2001) A natural Experiment on the economics on storks: Evidence on the impact of differential family policy on fertility rates in Canada. Center of Research on Economics, Fluctuations and Employment, Working paper no. 136, Montreal and Quebec University.
Dow
nloa
ded
by [
89.6
7.85
.154
] at
11:
13 2
9 Ja
nuar
y 20
15

82 Baltic Journal of Economics 13(2) (2013) 59–83
Duncan, A. and C. Giles (1996) Labour Supply Incentives and Recent Family Credit Re forms, The Economic Journal, vol. 106(434), pp. 142-155.European Commission (2010) Europa 2020. A Strategy for smart, sustainable and inclusive growth, Communication from the Commission, European Commission, Brussels. Fiori F., F. Rinesi, A. Pinelli and S. Prati (2013) Economic Insecurity and the Fertility Intentions of Italian Women with One Child, Population Research and Policy Review, vol. 32, pp. 373-413.Gauthier, A. H. (2007) The impact of family policies on fertility in industrialized countries: a re view of the literature, Population Research and Policy Review, vol. 26, pp. 323-346.Haan P. and M. Myck (2007) Apply with caution: introducing UK-style in-work support in Germany, Fiscal Studies, vol. 28, pp. 43-72.Haan P., L. Morawski, and M. Myck (2008) “Taxes, Benefits and Financial Incentives to Work. the United Kingdom, Germany and Poland Compared.”, Bank i Kredyt, vol. 39 (1), pp. 5-33.Heinen J. and M. Wator (2006) Child Care in Poland before, during and after Transition: Still a Women’s Business, Social Politics, vol. 2 (20) pp. 189-216.Immervoll H. and D. Barber (2007) Can Parents Afford to Work? Childcare Costs, Tax-Benefit Policies and Work Incentives, IZA Discussion Paper nr 1932.Immervoll H., H. Kleven, H. Kreiner, E. Saez (2007) Welfare Reform in European Countries: A Microsimulation Analysis, Economic Journal, 117 (516), pp. 1–44.Immervoll H., H. J. Kleven, C. T. Kreiner and N. Verdelin (2011) An Evaluation of the Tax- Transfer Treatment of Married Couples in European Countries, Journal of Public Economics, 95 (11-12), pp. 1485-1500.Immervoll H., H. Sutherland, K. de Vos (2001) Reducing child poverty in the European Union: the role of child benefits, in: Vleminckx K. and Smeeding T.M. (eds) Child well-being, Child poverty and Child Policy in Modern Nations. What do we know? Revised Edition; The Policy Press: Bristol.Jara H. X., A. Tumino (2013) Tax-benefit Systems, Income Distribution and Work Incentives in the European Union, EUROMOD Working Paper No. EM 7/13, ISER, University of Essex, Colchester.Kamińska K. (2003) Upowszechnienie edukacji przedszkolnej w Polsce: stan i prognozy na przyszłość, In: Zahorska, M. (ed.), Edukacja przedszkolna w Polsce – szanse i zagrożenia, ISP, Warsaw.Kundera M., H. Levy, M. Myck (2013) Euromod Country Report - Poland 2007-2012. ISER, University of Essex, Colchester.Kurowska A. (2012) Wpływ wybranych instrumentów polityki rodzinnej i polityki zatrudnienia na dzietność oraz aktywność zawodową kobiet, Polityka Społeczna, vol. 11-12, pp. 14-19.Laroque G. and B. Salanie (2008) Does Fertility Respond to Financial Incentives?, IZA Dis cussion Paper, nr 3575, IZA-Bonn.Kornstad T. and T. O. Thoresen (2007) A Discrete Choice Model for Labor Supply and Child Care, Journal of Population Economics, vol. 20 (4), pp. 781-803.Levy H., L. Morawski, and M. Myck (2009) Alternative tax-benefit strategies to support children in Poland, in Lelkes O., H. Sutherland (eds) Tax and Benefit Policies in the Enlarged Europe: Assessing the Impact with Microsimulation Models, Ashgate, Vienna. Matysiak A. (2011) On the interdependencies between fertility and women’s labour supply, European Studies of Population, vol. 17, Springer.
Dow
nloa
ded
by [
89.6
7.85
.154
] at
11:
13 2
9 Ja
nuar
y 20
15

83Financial support for families with children and its trade-offs: balancing redistribution and parental work incentives
Matysiak A. and D. Vignoli (2008) Fertility and women’s employment: a meta-analysis, European Journal of Population, vol. 24(4), pp. 363–384.Morawski L. and M. Myck (2010) ‘Klin’-ing up: Effects of Polish Tax Reforms on Those In and on those Out, Labour Economics, vol. 17(3), pp.556-566. Morawski L. and M. Myck (2011) Distributional Effects of the Child Tax Credit in Poland and Its Potential Reforms, Ekonomista vol. 6, pp. 815-831.Myck M., A. Domitrz, L. Morawski and A. Semeniuk (2013) Financial incentives to work in the context of a complex reform package and growing wages: the Polish experience 2005-2011, CenEA Working Paper, WP 1/2013, CenEA, Szczecin.Myck M. and H. Reed (2006) “Tax and Benefit Reforems in a Model of Labour Market Transitions”, Vierteljahrshefte zur Wirtschaftsforschung (Quarterly Journal of Eco- nomic Research) vol. 75 (3), pp. 208-239.OECD (2011) Doing better for families, OECD Publishing, Paris.Steiner V. and K. Wrohlich (2004) Household Taxation, Income Splitting and Labor Supply Incentives: A Microsimulation Study for Germany, CESifo Economic Studies, vol. 50, pp. 541-568.Swianiewicz P. (ed) (2012) Edukacja Przedszkolna, Ośrodek Rozwoju Edukacji, Warsaw.Thévenon O. and A. Luci (2012) Reconciling Work, Family and Child Outcomes. What Implications for Family Support Policies? Population Research and Policy Review, vol. 31, pp. 855-882.Whiteford P. and W. Adema (2007) What Works Best in Reducing Child Poverty: A Benefit of Work strategy? OECD Social, Employment and Migration Woking Papers, nr 51, OECD, Paris.
Dow
nloa
ded
by [
89.6
7.85
.154
] at
11:
13 2
9 Ja
nuar
y 20
15

84 Baltic Journal of Economics 13(2) (2013) 59–83
Appendix
Table A1: Family Benefits in 2010 (in PLN per month)
Source: Ministry of Labour and Social Affairs.
Table A2: Families with dependent children by number and age of children
Source: Authors’ calculations based on PHBS 2010 data.Notes: Lone fathers excluded from the detailed breakdown (only 224 lone fathers are in the sample of families of working age parents).
Total Couples Lone mothers Number of children:
- 1 0.472 0.446 0.627 - 2 0.372 0.389 0.264 - 3 0.112 0.118 0.078 - 4+ 0.045 0.047 0.032
Age of youngest child
- <3 0.216 0.230 0.149 - 3-6 0.194 0.198 0.179 - 7-12 0.230 0.229 0.233 - 13-16 0.168 0.163 0.193 - 17-24 0.193 0.181 0.250 -
Total number of observations 16,533 14,087 2,222
2010 system: (January to October)
Income criterion 504 Income criterion with a disabled child in the family 583
Family allowance per child: - child aged 0-4 68 - child aged 5-17 91 - child aged 18 and more 98 Main supplements: - lone parent supplement a) amount per child 170 b) amount per child if child is disabled 250 - for parents on unpaid maternal leave 400 - for families with more than 2 children 80 - school year start (one per year) 100 - child birth supplement 1000 Nursing allowance Income criterion - Amount of allowance 520 Nursing benefit 153 Universal child birth benefit 1000
Dow
nloa
ded
by [
89.6
7.85
.154
] at
11:
13 2
9 Ja
nuar
y 20
15

85Financial support for families with children and its trade-offs: balancing redistribution and parental work incentives
Table A3: Employment of parents in families according to the number or age of children and receipt of family benefits
Source: Authors’ calculations based on PHBS 2010 data.
Types of family
Families not receiving family benefits Families receiving family benefits number of children age of youngest child number of
children age of youngest child
1 or 2 3 + 6 or less 6+ 1 or 2 3 + 6 or less 6+ Couples (n.obs.): 9702 1115 4092 6725 2175 1095 1794 1476 Both working: 0.673 0.713 0.649 0.695 0.348 0.479 0.322 0.475 Only father works: 0.229 0.234 0.314 0.179 0.473 0.401 0.567 0.306 Only mother works: 0.064 0.038 0.025 0.084 0.090 0.067 0.052 0.119 Both not working: 0.033 0.015 0.013 0.042 0.089 0.054 0.059 0.100 Lone mothers (n.obs.) 1438 64 1132 370 572 148 420 300 Working 0.799 0.891 0.673 0.845 0.479 0.446 0.357 0.555 Not working 0.201 0.109 0.327 0.155 0.521 0.554 0.643 0.445
Dow
nloa
ded
by [
89.6
7.85
.154
] at
11:
13 2
9 Ja
nuar
y 20
15