
Journal of SPORT Volume 3 Issue 1 2014
142
-
Upload
khangminh22 -
Category
Documents
-
view
1 -
download
0
Transcript of Journal of SPORT Volume 3 Issue 1 2014


© Kent State University 2014. All rights reserved. Duplication of the material contained herein is strictly prohibited without the express written consent of the Editor of The Journal of SPORT. ISBN-13: 978-1499145250 ISBN-10: 149914525X ISSN: 2328-7624

Contents Formal and Informal Athlete Leaders: The Relationship between Athlete Leadership Behaviors and Cohesion Burkett, Blom, Razon, and Johnson………………...……...…….....2 Understanding Online Purchase Intentions of Licensed Sports Merchandise through Integration of Technology Acceptance Model and Trust Yoo and Ross…………………………………………...……...…...30 Achievement Goal Orientation as a Predictor of Sport Involvement and Perceived Benefits of Sport Involvement: Examination of a Mixture Model Lower, Turner, and Petersen…………………………….......……63 Case Study: Using a Sport Event within Coordinated Destination Marketing: A Case History of the New Mexico Bowl Barnes and Ballou………………..………………..……...….......102 About the Journal of Sport……….……………...………….…....135


Athlete Leadership Behaviors and Cohesion
2
The Journal of SPORT, 2014, 3(1), 2-29 © Kent State University
Formal and Informal Athlete Leaders: The Relationship between Athlete Leadership Behaviors and Cohesion
Benjamin M. Burkett Ball State University
Lindsey C. Blom
Ball State University
Selen Razon Ball State University
James E. Johnson Ball State University
Abstract
Aside from coaches, athletes hold leadership roles amongst their teams
(Loughead et al., 2006), and leadership behaviors often relate to cohesion (e.g., Shields, Gardner, Bredemeier, & Bostro, 1997; Vincer & Loughead, 2010). There are two main types of athlete leaders that have been identified: formal and informal athlete leaders. Vincer and Loughead (2010) discuss that in order to gain a conceptual picture of athlete leadership, these two types of athlete leaders must be examined independently unlike past literature, which has focused on athlete leaders as a general group. The present research examined the differences between formal and informal athlete leadership behaviors, the gender differences, and the relationship that leadership behaviors have with cohesion. Seventy-four varsity male and female college basketball players completed the Group Environment Questionnaire (GEQ; Carron, Widmeyer, & Brawley, 1985), the Leadership Scale for Sport (LSS; Challadurai & Saleh, 1980) modified for formal athlete leaders, and the LSS modified for informal athlete leaders. A paired-samples t-test revealed significant differences between formal and informal athlete leaders on leadership behaviors, and a Pearson-product moment correlation revealed significant correlations between athlete leadership behaviors and cohesion. These results could benefit coaches by increasing their understanding of athlete leaders, allowing them to more effectively select or appoint athlete leadership.

Burkett, Blom, Razon & Johnson
3
Leadership is a key factor in any group setting, and leadership behaviors can have both positive and negative effects on the group cohesion (Shields, Gardner, Bredemeier, & Bostro, 1997; Vincer & Loughead, 2010). This is important to note because cohesion is positively correlated with performance among athletes (Carron, Colman, Wheeler, & Stevens, 2002), and leadership behaviors have been found to be significantly related to cohesion (Gardner, Shields, Bredemeier, & Bostrom, 1996; Murray, 2006; Shields et al., 1997; Turman, 2003), meaning that leadership behaviors may be indirectly related to performance through their relationship with cohesion. Athletes hold leadership positions within their team, and therefore it is necessary to explore the relationships that their behaviors may have on different factors influencing the team.
Before athlete leadership can be understood it is necessary to consider the fundamental nature of athlete leaders by conceptualizing the need, development, and selection of them. Some research has delved into the concept of how athlete leaders develop (e.g. Voekler, Gould, & Crawford, 2011; Wright & Côté, 2003). It was explained that athlete leaders have developed high skill, strong work ethic, tactical sport knowledge, and good rapport with teammates through exposure to a nonthreatening sport environment, having supportive parents who also act as play partners, and early participation with older peers (Wright & Côté, 2003). It was also reported that athlete leaders learned leadership skills from past experiences (Voekler et al., 2011;Wright & Côté, 2003), but Wright and Côté (2003) further explained that if athletes were not given the chance to lead then they may never develop the necessary skills of a leader. In their research, Wright and Côté discussed the fundamentals of athlete leadership through concepts such as interpersonal expectancy effects and social exchange theory.
Interpersonal expectancy effects are considered when “one person (A), acting in accordance with a set of expectations, treats another person (B) in such a manner as to elicit behavior that tends to confirm the original expectations” (Harris & Rosenthal, 1988, p. 2). For example, coaches form a certain expectation about athletes
Athlete Leadership Behaviors and Cohesion
4
and thus treat the athletes in alignment with those expectations, and then the athletes likely perform in accordance to the coaches’ expectations (Wilson & Stephens, 2007). The fundamental idea of interpersonal effects is very similar to that of the self-fulfilling prophecy. This phenomenon can be seen in athletes beginning to show leadership due to the way they are treated by or the expectations of their coaches.
Another theoretical explanation of athlete leaders is that of social exchange theory. Social exchange theory involves social exchanges which are defined as “a two-sided mutually contingent, and mutually rewarding process involving transactions or simply exchange” (Emerson, 1976, p. 336). In other words, something is given and something is received between two people or parties working to benefit themselves through the specific trade or exchange. Exchanges could be in the form of monetary gifts, work, reward, or in this case, leadership. In the instance of leadership as the form of exchange, originally a person will provide their characteristics to the group members for the benefit of the group in exchange for the title of leader, which is the benefit to that specific person. This idea can also be a valuable way of looking into athlete leadership and athlete leadership behaviors (Moran & Weiss, 2006) because athletes can use their ability or other attributes in exchange for leadership. Athletes attain different abilities or attributes that can be important for a leadership position amongst their team, and due to such variability there are many different types of athlete leaders.
In recent research, athlete leadership has been split into two groups: team leaders and peer leaders (Loughead, Hardy, & Eys, 2006). Team leaders have been identified as athletes who occupy a formal role such as captain (Loughead et al., 2006). These team or formal leaders have been operationally defined as being leaders who were identified by at least 50% of their teammates as holding a leadership position and have been found to often be starters, which frequently indicates the most skilled or gifted athletes or those who were high in task/sport related experience or skill (Loughead et al., 2006). Moran and Weiss (2006) support that idea as they found

Burkett, Blom, Razon & Johnson
5
athletic ability to be a predictor of athlete leadership. It was also found that team or formal leaders were often in their third year with their college team (Loughead et al., 2006) meaning they had likely developed rapport with their teammates, and earned their teammates’ respect. It is suggested that team captains would lead the team on the field of play, but not necessarily off the field (Holmes, McNeil, & Adorna, 2010; Moran & Weiss, 2006). Furthermore, as discussed by Loughead and colleagues (2006), formal leaders are members of not only the team, but an extension of the coaching staff as well. Because of this dynamic formal leaders often serve as the liaison between the players and the coaches.
Aside from team or formal leaders, there are also peer or informal athlete leaders. Peer or informal leaders have been operationally defined as athletes who were reported as having provided leadership to at least two of their fellow athletes (Loughead et al., 2006). Also, peer leaders were likely to be viewed by their teammates as those without a formal leadership title. While team or formal leaders have their respective roles, peer or informal leaders often play different roles on the team. For example, these types of leaders may provide clarification to teammates with regards to coaching instruction (Loughead et al., 2006) or demonstrate their abilities during situations that call for interpersonal communication and social support (Holmes et al., 2010). While formal leaders lead mostly on the field, it is likely that informal leaders fulfill their roles off the field in activities such as community service or team gatherings. Informal leaders or peer leaders have been shown to have a significant impact on group activities, create an aspect of group culture, and influence group processes and structure (Loughead et al., 2006).
While it is apparent that both formal and informal leaders have their specific roles, the extant literature is not clear about the influence or impact of these roles. Eys, Loughead, and Hardy (2007) discovered when leadership positions were distributed equally among a team, the athletes were more satisfied. This suggests that even though formal leaders are important, it is just as important to have informal or peer leaders to balance the relationship and

Athlete Leadership Behaviors and Cohesion
6
optimize overall satisfaction among team members. Therefore, since informal and formal leaders both play an integral role in the team dynamic, it is critical to examine the leadership behaviors of both types of athlete leaders.
Fundamentally, males and females are different, and in order to fully understand athlete leadership behaviors we must understand the gender differences among athlete leaders. Jambor and Zhang (1997) argue differences in leadership do not exist between genders, but in a more recent study, Sherman, Fuller, and Speed (2000) suggested that it is important to look back at gender differences and leadership to understand what changes may have occurred, if any, due to shifts in society and gender roles in general.
Of the few studies regarding gender and leadership, most of the researchers have focused on coaches and their behaviors (e.g., Beam, Serwatka, & Wilson, 2004; Jambor & Zhang, 1997; Sherman et al., 2000). Although coaches and athlete leaders are different, this information is useful because with such a lack of research on athlete leadership and gender differences, it would prove beneficial to gain further insight from a similar population. Beam et al. (2004) as well as Sherman and colleagues (2000) provide research on athletes from 18-35 years who were participants in football, netball, basketball, baseball, soccer, volleyball, tennis, golf, and track and field/cross country. The researchers examined differences in preferred coaching behaviors among male and female coaches and found that both genders preferred behaviors such as positive feedback, training and instruction, and democratic behavior (Sherman et al., 2000). Additionally, Sherman et al. suggested that neither gender preferred social support nor autocratic behaviors in their coaches. While overall preferences have been found to be the same, there have been differences identified in how much each gender prefers a behavior. For example, female athletes have been shown to prefer democratic behaviors and positive feedback (Sherman et al., 2000) as well as training and instruction (Beam et al., 2004) significantly more than male athletes. It was also suggested that male athletes preferred social support and autocratic behaviors significantly more than female athletes. These findings supply some data regarding athlete

Burkett, Blom, Razon & Johnson
7
preferences of coaching behaviors, but are not conclusive regarding athlete leader behaviors
No research to date has explored gender differences in athlete leaders’ actual behaviors, but Holmes et al. (2010) began to explore gender differences among what athletes see as characteristics of good and bad athlete leaders. Through a qualitative design that included baseball, football, golf, soccer, track and field/cross country, lacrosse, softball, and tennis athletes, Holmes at al. found that both genders defined a good leader as vocal and trustworthy, a role model who serves example, and possesses strong interpersonal skills. Of those leader behaviors, being vocal, having good interpersonal skills, and being sensitive were more important to women. On the other hand, trustworthiness and experience were more important leader behaviors to men. Both genders reported that a bad leader had negative attitudes and abused power.
Drawing upon the aforementioned gaps in the literature, the focus of this study was three-fold: 1) to explore leadership behaviors of formal and informal athlete leaders and examine if these behaviors differ between the types of leaders; and 2) to investigate the possible relationships between formal and informal athlete leader behaviors and cohesion; and 3) to examine the leadership behaviors of male and female athlete leaders and determine if these behaviors differ between genders.
Accordingly, it was hypothesized that: 1) formal athlete leaders would be perceived as showing more training and instruction behaviors, informal athlete leaders would be perceived as showing more social support behaviors, and that there would be no difference between formal and informal athlete leaders on perceived democratic behaviors, autocratic behaviors, or positive feedback; 2) training and instruction behaviors would be positively related to both individual attractions to the group – task (ATGT) and group integration – task (GIT), social support behaviors would be positively related to both individual attractions to the group – social (ATGS) and group integration – social (GIS), positive feedback behaviors would be positively related to ATGT, ATGS, GIT, and GIS, democratic behaviors would be positively related to ATGT, ATGS, GIT, and

Athlete Leadership Behaviors and Cohesion
8
GIS, and autocratic behaviors would be negatively related to ATGT, ATGS, GIT, and GIS; and 3) male athlete leaders would be perceived as showing more training and instruction behaviors than female athlete leaders, female athlete leaders would be perceived as showing more social support behaviors than male athlete leaders, male athlete leaders would be perceived as showing more autocratic behaviors than female athlete leaders, female athlete leaders would be perceived as showing more democratic behaviors than male athlete leaders, and there would be no difference between male and female athlete leaders on positive feedback.
Methods Participants
Participants included 74 athletes from NCAA Division III college basketball teams including 32 men and 42 women (see Table 1); teams were sampled from all regions in the United States. Due to incomplete surveys, there were an additional 68 responses that were excluded from data analysis. Of the athletes participating, 55 reported they were an athlete leader, and of those 55 athlete leaders, 39 reported they were an informal leader (i.e., an athlete who has provided leadership to at least two of their teammates) and 16 reported serving as a formal leader (i.e., an athlete who holds a formal title such as captain).

Burkett, Blom, Razon & Johnson
9
Measures
Three instruments were used in this study: a) a demographic questionnaire to gather sample characteristics, b) the Group Environment Questionnaire (GEQ; Carron, Widmeyer, & Brawley, 1985) to measure group cohesion, and c) the Leadership Scale for Sport (LSS; Chelladurai & Saleh, 1980) to measure athlete leadership behaviors.
Demographic Questionnaire. A demographic questionnaire was used to examine characteristics of the sample group including age, class year, race, sex, years on team, athlete leader status, and how many years they have been an athlete leader.
Group Environment Questionnaire. Group Environment Questionnaire (GEQ; Carron et al., 1985) was used to gauge group cohesion. The GEQ is an 18-item instrument measuring four aspects of team cohesiveness: Individual Attractions to the Group-Task, Individual Attractions to the Group-Social, Group Integration-Task, and Group Integration-Social. Individual Attractions to the Group-Task consists of feelings of team members about their personal impact or involvement in team tasks and is measured through four items. Individual Attractions to the Group-Social consists of feelings
Table 1 Frequencies for Sample
Number of Participants Age 18 19 20 21 22 23
4 24 20 14 11 1
Race White/Caucasian Black/African American Asian Other
60 7 2 5

Athlete Leadership Behaviors and Cohesion
10
of the team members with regards to their social acceptance and interactions and is measured with five items. Group Integration-Task consists of the feelings of individual members with regards to the similarity and relatedness of the team toward their task and is measured through five items. Group Integration-Social consists of the feelings of team members with regards to the similarity and relatedness of the team towards social happenings and is measured through four items. Responses are measured on a 9-point Likert scale ranging from strongly disagree to strongly agree. Each subscale is scored independently by summing the scores of each subscale then dividing by the number of items within the subscale to find the mean of each individual participant, and then the process is completed for the team as a whole.
In past research the internal consistency of the GEQ has been found to fall within the acceptable to good levels (e.g., Gardner et al., 1996; Murray, 2006; Shields et al., 1997; Vincer & Loughead, 2010). All of the following data was obtained through samples of high school athletes, college-age athletes, or both who participated in baseball, basketball, hockey, indoor soccer, softball, or volleyball. For the Group Integration-Task dimension alphas of: a) .71 (Vincer & Loughead, 2010); b) .82 (Murray, 2006); and c) .68 (Gardner et al., 1996; Shields et al., 1997) were found. For the Group Integration-Social dimension, alphas of: a) .72 (Vincer & Loughead, 2010); b) .78 (Murray, 2006); and c) .60 (Gardner et al., 1996; Shields et al., 1997) have been reported. For Individual Attractions to the Group-Task, alphas of: a) .65 (Vincer & Loughead, 2010); b) .71 (Murray, 2006); and c) .60 (Gardner et al., 1996; Shields et al., 1997) have been found. For the Individual Attractions to the Group-Social dimension, alphas of: a) .60 (Vincer & Loughead, 2010); b) .78 (Murray, 2006); and c) .61 (Gardner et al., 1996; Shields et al., 1997) were reported.
Athlete Leader Version of the Leadership Scale for Sport.
The Leadership Scale for Sport (LSS; Chelladurai & Saleh, 1980) was used to measure leadership behaviors. A revised version to measure athlete leadership behaviors was developed by Vincer and

Burkett, Blom, Razon & Johnson
11
Loughead (2010). This Athlete Leader Version of the LSS only included a change to the stem of each item; for example, “The athlete leader(s) on my team” instead of “My coach” as is found in the original LSS (Vincer & Loughead, 2010). Items are scored on a 5-point Likert scale ranging from always to never, which represents the frequency that an athlete leader engages in the specific leadership behavior. The modified version of the LSS contains the same dimensions (i.e., Training and Instruction, Democratic Behavior, Autocratic Behavior, Social Support, and Positive Feedback) and number of total items (i.e., 40) as the original LSS. Training and Instruction measures a leader’s behaviors intended to improve athletes’ performance by promoting full effort, Democratic Behavior measures the extent to which an athlete leader involves his/her teammates in decision making, Autocratic Behavior measures the extent to which an athlete leader is independent in decision making, Social Support measures how much an athlete leader has concern for his/her teammates, and Positive Feedback measures the extent to which an athlete leader intends to reinforce a team member’s behavior. In an athlete leadership study completed by Vincer and Loughead (2010), each of the five dimensions reached internal consistency: a) Training and Instruction, .88; b) Democratic Behavior, .79; c) Autocratic Behavior, .74; d) Social Support, .86; and e) Positive Feedback, .84. Procedure
Institutional Review Board approval was obtained before any participants were contacted to participate in this study. A nationwide convenience sample of one hundred thirty-eight NCAA Division III college basketball coaches (out of a possible population of 650) were contacted. Coaches were asked to provide an email Qualtrics link to their athletes so that participants could complete questionnaires via an online format. Due to a limited response rate following coach emails, a nationwide convenience sample of 118 athletes, not associated with the aforementioned coaches, were emailed directly with the introductory information and the link to the survey. Athletes were identified on their school’s online roster, and

Athlete Leadership Behaviors and Cohesion
12
their emails were accessed through their school’s online directory. Participants were directed to an overview of the study and then instructed to continue to the data collection portion if they decided to participate. Participants completed the Demographic Questionnaire, GEQ, and modified version of the LSS twice (once focusing on formal athlete leaders and once focusing informal athlete leaders). Data Analysis
Data were analyzed using PASW Statistics 18. Descriptive statistics were run and Cronbach’s alpha was calculated for each subscale. A Paired Samples t-Test was used to measure the differences between the two leader types for each of the five leadership behaviors. Pearson’s bivariate correlations were run between each leadership behavior subscale and cohesion subscales. Finally, a MANOVA was used to measure the differences between male and female athletes on each of the five leadership behaviors. Results Descriptive statistics were run for each of the subscales by leadership type (see Table 2). Cronbach’s alpha was assessed for each version of the measure and each subscale. For the Athlete Leader Version of the LSS for the formal athlete leaders, all five subscales reached internal reliability with coefficients for the Instruction and Training, Democratic Behaviors, Autocratic Behaviors, Social Support, and Positive Feedback subscales, .94, .89, .85, .93, and .93, respectively. For the Athlete Leader Version of the LSS for informal athlete leaders, all five subscales reached internal reliability with alpha coefficients for Instruction and Training, Democratic Behaviors, Autocratic Behaviors, Social Support, and Positive Feedback, .94, .91, .82, .93, and .94, respectively.
Burkett, Blom, Razon & Johnson
13
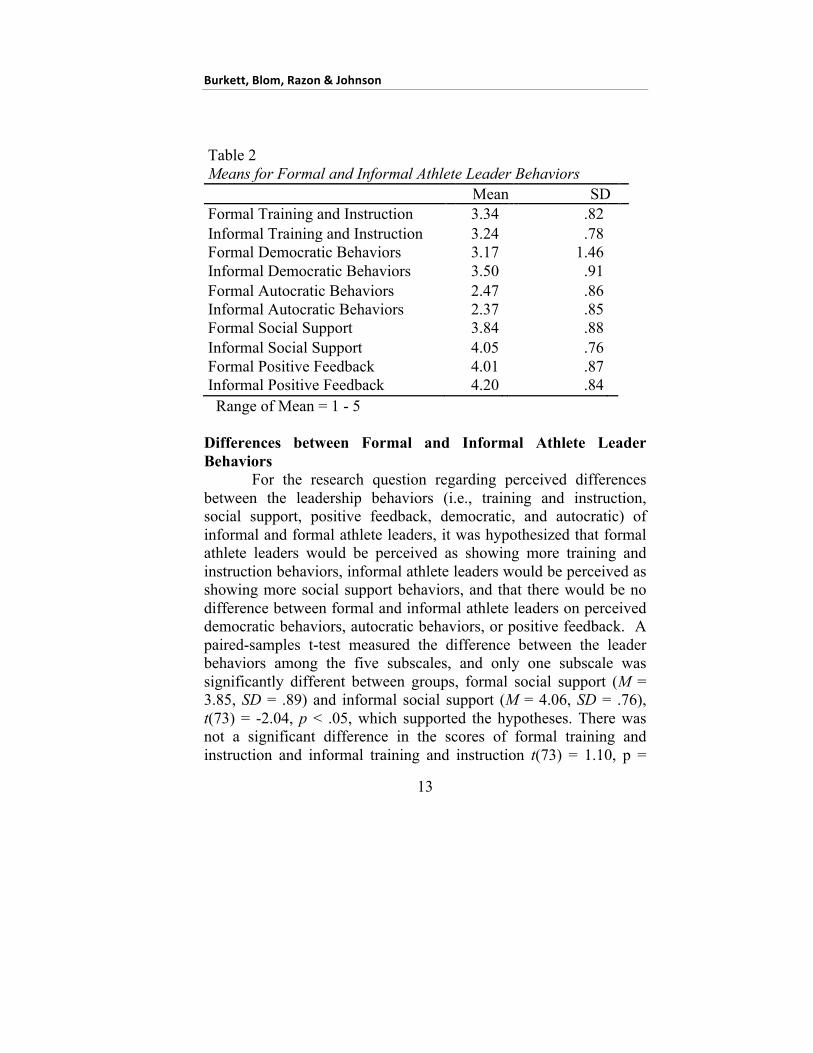
Table 2 Means for Formal and Informal Athlete Leader Behaviors
Mean SD Formal Training and Instruction 3.34 .82 Informal Training and Instruction 3.24 .78 Formal Democratic Behaviors 3.17 1.46 Informal Democratic Behaviors 3.50 .91 Formal Autocratic Behaviors 2.47 .86 Informal Autocratic Behaviors 2.37 .85 Formal Social Support 3.84 .88 Informal Social Support 4.05 .76 Formal Positive Feedback 4.01 .87 Informal Positive Feedback 4.20 .84 Range of Mean = 1 - 5 Differences between Formal and Informal Athlete Leader Behaviors For the research question regarding perceived differences between the leadership behaviors (i.e., training and instruction, social support, positive feedback, democratic, and autocratic) of informal and formal athlete leaders, it was hypothesized that formal athlete leaders would be perceived as showing more training and instruction behaviors, informal athlete leaders would be perceived as showing more social support behaviors, and that there would be no difference between formal and informal athlete leaders on perceived democratic behaviors, autocratic behaviors, or positive feedback. A paired-samples t-test measured the difference between the leader behaviors among the five subscales, and only one subscale was significantly different between groups, formal social support (M = 3.85, SD = .89) and informal social support (M = 4.06, SD = .76), t(73) = -2.04, p < .05, which supported the hypotheses. There was not a significant difference in the scores of formal training and instruction and informal training and instruction t(73) = 1.10, p =

Athlete Leadership Behaviors and Cohesion
14
.27, refuting the hypothesis. However, as expected, there were no differences between leader groups for democratic behaviors, t(73) = -1.75, p = .08, autocratic behaviors, t(73) = 1.07, p = .29, or positive feedback behaviors, t(73) = -1.79, p = .078, which supported the hypotheses. Relationship between Athlete Leader Behaviors and Cohesion For the research question regarding relationships between athlete leadership behaviors and types of cohesion (i.e., group integration –social (GIS), individual attraction to the group – social (ATGS), group integration – task (GIT), and individual attraction to the group – task (ATGT). Due to the task related nature of training and instruction behaviors, it was hypothesized that they would be positively related to both ATGT and GIT. Similarly, because of the nature of social support behaviors it was hypothesized that they would be positively related to both ATGS and GIS. Positive feedback, democratic, and autocratic behaviors are not specifically task or social oriented such as training and instruction and social support are, and therefore, it was hypothesized that positive feedback behaviors would be positively related to ATGT, ATGS, GIT, and GIS, democratic behaviors would be positively related to ATGT, ATGS, GIT, and GIS, and autocratic behaviors would be negatively related to ATGT, ATGS, GIT, and GIS. Pearson-Product Moment Correlations were used to measure these relationships.
There were several significant relationships between the formal athlete leader behaviors and cohesion (see Table 3). A statistically significant positive correlation was observed between formal training and instruction and ATGT, r(72) = .45, p < .01 and GIT, r(72) = .42, p < .01, which supports the hypothesis that as the perceived amount of training and instruction behaviors of formal leaders increased, so did the perception of task cohesion. A statistically significant positive correlation was observed between formal social support and all four GEQ subscales: ATGS, r(72) = .37, p < .01, ATGT, r(72) = .33, p < .01, GIS, r(72) = .24, p < .05, GIT, r(72) = .40, p < .01, which supports and expands upon the hypothesis that as the perceived amount of socially supportive

Burkett, Blom, Razon & Johnson
15
behaviors increased, so did the perception of both task and social cohesion. A statistically significant positive correlation was observed between formal positive feedback and ATGS, r(72) = .33, p < .01, ATGT, r(72) = .43, p < .01, and GIT, r(72) = .45, p < .01, which partially supports the hypothesis that as the perceived amount of positive feedback increased, so did the perception of ATGS, ATGT, and GIT. GIS, however, was not found to be related to formal positive feedback as predicted, thus, the hypothesis was partially supported. A statistically significant negative relationship was found between formal autocratic behaviors and ATGS, r(72) = -.30, p < .05, ATGT, r(72) = -.26, p < .05 and GIT, r(72) = -.26, p < .05, which partially supports the hypothesis that as the perceived amount of autocratic behaviors increased, the perception of ATGS, ATGT, and GIT decreased. The remainder of the hypothesis regarding the GIS was not supported by the findings. There were no statistically significant correlations between formal democratic behaviors and any of the GEQ subscales, which refutes the hypothesis that democratic behaviors would be positively related to both task and social cohesion.
There were several significant relationships between the Informal Athlete Leader RLSS and the GEQ. A statistically significant positive correlation was observed between informal training and instruction and ATGT, r(72) = .49, p < .01 and GIT, r(72) = .42, p < .01, which supports the hypothesis that as the amount of perceived training and instruction behaviors of the informal leader increased, so did the perception of task cohesion. A statistically significant positive correlation was observed between informal democratic behaviors and ATGS, r(72) = .28, p < .05 and GIT, r(72) = .41, p < .01, which partially supports the hypothesis that as the amount of perceived democratic behaviors increased, so did the perception of ATGS and GIT, but not ATGT and GIS as hypothesized. A statistically significant positive correlation was observed between informal social support and ATGS, r(72) = .47, p < .01, GIS, r(72) = .23, p < .05, and GIT, r(72) = .40, p < .01, which supports and expands upon the hypothesis that as the perceived amount of social support increased, so did the perception of social

Athlete Leadership Behaviors and Cohesion
16
cohesion. It was found that informal social support also positively correlated with task cohesion, which expanded on the hypothesis. A statistically significant positive correlation was observed between informal positive feedback and ATGS, r(72) = .32, p < .01, ATGT, r(72) = .23, p < .05, and GIT, r(72) = .35, p < .01, which partially supports the hypothesis that as the perceived amount of positive feedback increased, so would the perception of ATGS, ATGT, and GIT. GIS was not correlated with positive feedback as it was hypothesized. There were no statistically significant correlations between informal autocratic behaviors and any of the GEQ subscales which refutes the hypothesis that as the perception of autocratic behaviors increased, so would both task and social cohesion. Table 3 Correlations between formal and informal athlete leadership behaviors and cohesion ATGS ATGT GIS GIT Formal Training and Instruction
.18 .50** .11 .42**
Formal Democratic Behavior .07 .07 .10 .04 Formal Autocratic Behavior -.30* -.26* -.22 -.26* Formal Social Support .37** .33** .42* .40** Formal Positive Feedback .33** .43** .18 .45** Informal Training and Instruction
.12 .49** .04 .42**
Informal Democratic Behaviors
.28* .22 .19 .41**
Informal Autocratic Behaviors -.18 -.04 -.18 -.05 Informal Social Support .47** .22 .23* .40** Informal Positive Feedback .32** .28** .11 .35** ** p < .01 level. * p < .05 level.

Burkett, Blom, Razon & Johnson
17
Gender Differences between Athlete Leader Behaviors For the research question regarding differences between male and female athlete leadership behaviors, it was hypothesized that male athlete leaders would be perceived as showing more training and instruction behaviors than female athlete leaders, female athlete leaders would be perceived as showing more social support behaviors than male athlete leaders, male athlete leaders would be perceived as showing more autocratic behaviors than female athlete leaders, female athlete leaders would be perceived as showing more democratic behaviors than male athlete leaders, and there would be no difference between male and female athlete leaders on positive feedback. A Multivariate Analysis of Variance (MANOVA) was used to measure the difference between the genders on each leadership subscale. There was not a significant difference between athlete leader behaviors based on gender, F(5, 68) = 1.36, p = .25; Wilk’s Λ = .91, partial n2 = .09. Due to the overall difference between genders on athlete leadership behaviors failing to reach significance no post-hoc observations or analyses were included, meaning that the hypotheses could not be supported based on the data collected.
Discussion
An athlete leader is considered both a member and often an extension of the coaching staff (Loughead et al., 2006), and their behaviors are very similar to those shown by coaches (i.e., training and instruction, democratic behaviors, autocratic behaviors, social support, and positive feedback) (Chelladurai & Saleh, 1980). Furthermore, research has shown that there is no longer one single type of athlete leader amongst teams (Loughead et al., 2006). Often, teams will have multiple athlete leaders, which include team or formal athlete leaders and peer or informal athlete leaders. Loughead and colleagues (2006) have suggested that the roles that these two types of athlete leaders hold are different. Team or formal leaders often fulfill leadership duties on the field of play whereas peer or informal athlete leaders often fulfill leadership duties off the field or more so behind the scenes.

Athlete Leadership Behaviors and Cohesion
18
A recent study conducted by Vincer and Loughead (2010) revealed that athlete leadership behaviors are correlated with cohesion. Given the similarities in roles between athlete leaders and coaches as well as their comparable leadership behaviors this makes sense. According to Carron et al. (1985), cohesion consists of four aspects: individual attraction to the group – social (ATGS), individual attraction to the group – task (ATGT), group integration – social (GIS), and group integration – task (GIT).These four aspects make up the Group Environment Questionnaire (GEQ). Vincer and Loughead (2010) found positive relationships between training and instruction, democratic behaviors, social support, and positive feedback and all four subscales of cohesion as well as negative relationships between autocratic behaviors and all four subscales of cohesion, but went on to suggest that differences may exist between formal and informal athlete leadership behaviors. Because of the previously mentioned gaps, the main purpose of this study was to explore leadership behaviors of formal and informal athlete leaders and examine if these behaviors differ between the types of leaders. Again, it was hypothesized that formal athlete leaders would be perceived as showing more training and instruction behaviors, informal athlete leaders would be perceived as showing more social support behaviors, and that there would be no difference between formal and informal athlete leaders on perceived democratic behaviors, autocratic behaviors, or positive feedback.
In the exploration of differences between the leadership behaviors of informal and formal athlete leaders, only one difference was observed, which was between the social support behaviors of each type of athlete leader. More specifically, informal athlete leaders were found to be perceived as showing more social support than formal athlete leaders. This finding supports the idea that informal leaders fulfill their role off the field of competition through social activities and focus on social behaviors, such as spending time in community service and activities and team-related gatherings (Loughead et al., 2006). Furthermore, informal athlete leaders have been shown to often perform duties demonstrating support such as providing clarification to other teammates on instructions given by

Burkett, Blom, Razon & Johnson
19
the coaches or formal leaders (Loughead et al., 2006), or more generally, demonstrating their abilities during situations calling for interpersonal communications (Holmes et al., 2010). It is reasonable to assume that situations requiring interpersonal communications or instruction clarification happen both off the field and on, and informal athlete leaders likely fulfill their role in both settings due to their less structured roles as an athlete leader. This may help to explain the difference between formal and informal leaders. Formal athlete leaders’ opportunities for social support likely only occur on the field rather than in both domains such as what occurs with informal leaders. These contextual qualifications would explain the difference observed between the two types of athlete leaders.
Failing to support the hypothesis, it was found that there was no difference between formal and informal athlete leaders on training and instruction behaviors. According to Loughead et al. (2006), formal leaders are often high in task/sport related experience and skill and frequently lead on the field of competition (Holmes et al., 2010; Moran & Weiss, 2006). The results from past research suggest that formal leaders would score higher on training and instruction based on them being the more skilled athletes who lead on the field. The results of this study do not support this conclusion. Lack of role clarity could be impacting these results meaning that informal leaders may fulfill these duties alongside the formal leaders. Voekler and colleagues (2011) found that 12 out of 13 high school athlete leaders studied received little or no training as an athlete leader. This means that athletes may simply be fulfilling duties that they feel are best or those that are natural to them, and not necessarily those that are characteristic of their leadership position because of a lack of training or guidance from their coach regarding their roles. Also, it should be noted that informal leaders are perceived as showing social support for their teammates, including their formal athlete leaders. Through their social support behaviors, informal athlete leaders provide clarification on instructions given by coaches or formal athlete leaders in which case their behaviors could be mistaken for training and instruction behaviors by teammates,

Athlete Leadership Behaviors and Cohesion
20
which could explain the similar perceived amount of training and instruction behavior among each type of leader.
As hypothesized, there were no differences found between formal and informal athlete leaders’ democratic behaviors, autocratic behaviors, and positive feedback behaviors. However, these leadership behaviors are fundamental to athlete leaders, and more exploration is needed to better understand the nuances of formal and informal athlete leaders, as well as athlete leaders as a whole. Again, the lack of training of athletes in leadership positions could result in a lack of role clarity, meaning that both formal and informal athlete leaders may complete similar tasks. This lack of clarity may also have affected the responses in this study. Student-athletes could have been unclear as to behavioral distinctions between formal and informal leader behaviors which could have led to the overall lack of difference in leader behaviors. In general, it has been suggested that athlete leaders demonstrate the following characteristics: lead by example, being positive, effective communications, respectful to team (Dupuis, Bloom, & Loughead, 2006), strong work ethic (Holmes et al., 2010), provide social support (Vincer & Loughead, 2010), and superior skill (Wright & Côté, 2003). Past literature does not distinguish these behaviors as being exhibited by formal or informal athlete leaders, further supporting a lack of differences between groups on democratic behaviors, autocratic behaviors, and positive feedback. If an athlete holds a leadership position (e.g., Dupuis et al., 2006; Holmes et al., 2010; Vincer & Loughead, 2010; Wright and Côté, 2003), these are the behaviors that will be represented in athlete leadership with no mention of differences of formal and informal athlete leaders. With a lack of differences between the two types of athlete leaders, an athlete leader-training program may help to clarify roles and begin to develop more salient differences between the behaviors or formal and informal athlete leaders.
The relationships found included positive relationships between training and instruction, democratic behaviors, social support, and positive feedback and both task and social cohesion as well as negative relationships between autocratic behaviors and both

Burkett, Blom, Razon & Johnson
21
task and social cohesion were found in the current study. As the perceived amount of training and instruction increased, so did the perception of task and social cohesion. This is supported by the findings of Vincer and Loughead (2010) who found that training and instruction can positively influence a team’s task cohesion. Training and instruction consists of behaviors such as teaching a sport related skill or providing information regarding a game plan, and task cohesion involves a team’s cohesiveness on the field or in the sport itself, thus explaining a positive relationship between the two. A coach would be wise to take into consideration how much an athlete uses training and instruction behaviors in their leadership before appointing or electing them to a leadership position. Seeing how training and instruction positively relates to both, task and social cohesion, athletes’ training and instruction behaviors would likely have a positive relationship with the team cohesion, and thus, improve the team’s performance based on the cohesion-performance relationship discussed by Carron, et al. (2002). Similarly, due to the findings that as the perception of both social support and positive feedback increases, so does the perceived amount of cohesion, it is necessary for coaches to take these behaviors into consideration during selection of athlete leaders because of the indirect relationship they have with performance. Each of these two aspects of athlete leadership can increase interpersonal relationships among teammates through interactions with each other, and this is beneficial to a team’s cohesion. Additionally, it was found that as the perceived amount of democratic behaviors increased, so did the perceived task and social cohesion. Loughead et al. (2006) explain that multiple athlete leaders within a team trying to democratically make a decision can be difficult and counterproductive. It has also been reported that higher levels of democratic behaviors can sometimes be ineffective (Vincer & Loughead, 2010). Therefore, although the results show the perceived amount of democratic behaviors increases cohesion, coaches should avoid too many democratic athlete leaders because it may as well have the opposite effect on the team.
Moreover in the present study, as the perceived amount of formal autocratic behaviors increased, the perception of both task

Athlete Leadership Behaviors and Cohesion
22
and social subscales decreased. This finding supports results from Vincer and Loughead (2010) who found that autocratic behaviors in athlete leaders are negatively associated with all cohesion subscales. Informal autocratic behaviors not correlating with any subscales of cohesion could be due to the fact that informal leaders lead off the field and are more social leaders, and there are not many opportunities for decision-making, which is what defines autocratic behaviors. These findings suggest that coaches may want to consider an athlete’s ability to use autocratic behaviors before placing them into a formal leadership position. This may be more crucial for formal than informal positions as only the formal athlete leader's autocratic behaviors were negatively correlated with cohesion.
Athletes looking to fill a leadership position on their team should consider what behaviors have positive relationships with cohesion because those are likely the valued behaviors that coaches or teammates are looking for when considering an athlete leader. According to the Social Exchange Theory (Emerson, 1976), behaviors or traits can be exchanged for a leadership position. For example, if an athlete has certain traits that the coaches or their fellow athletes desire, then that athlete would be selected into a leadership position so that the team can benefit from those traits. Therefore, the athlete becomes an athlete leader as he desires and the rest of the team gets a leader with traits that they desire. If an athlete desires a leadership position on their team it would make sense for he/she to work on developing behaviors such as training and instruction, democratic behaviors, social support, and positive feedback, while limiting autocratic behaviors as much as possible. Doing so will make the athlete a desirable leader for the team and the team may be more willing to select him/her as an athlete leader because the team would benefit from the athlete’s traits or behaviors.
These results can also be used by sport psychology professionals to educate athletes on the relationships that their behaviors may have on cohesion and, indirectly, on performance. They will be better suited to provide sound advice for athletes regarding athlete leadership because of a more in depth
Burkett, Blom, Razon & Johnson
23
understanding developed by the results of the current study. Sport psychology professionals should instruct athletes and help them foster training and instruction behaviors, democratic behaviors, social support behaviors, and positive feedback behaviors, but also help them to limit or eliminate autocratic behaviors. Through such instruction, an athlete with a largely autocratic leadership style should learn that those behaviors might not be appropriate or beneficial for the team because they can hurt team cohesion. Additionally, that same leader should be able to learn to develop more effective behaviors such as training and instruction, democratic, social support, and positive feedback. Sport psychology professionals will have the knowledge to educate athletes how to effectively lead, what exactly being an athlete leader entails, and what type of athlete leader they should strive to be (i.e., formal or informal).
For the third research question, no differences in leadership behaviors between the genders were found. This supported the hypothesis stating that no differences were expected for positive feedback, but failed to support all other hypotheses. Researchers have argued whether gender differences exist between men and women in leadership roles. Jambor and Zhang (1997) provide support for the results found in this current study. Their research on coaches suggested that differences in gender on leadership behaviors should not be anticipated. Sherman et al. (2000) share similar comments that they believe the idea that men and women require different types of leadership is no longer true. However, Beam et al. (2004) found gender differences in preference for coach behaviors, which led to the hypotheses in this study. They reported that men preferred autocratic behaviors and social support more than women, and that women preferred democratic behaviors, training and instruction, and situational consideration behavior. The golden rule may provide insight into the matter. If athlete leaders treat others the way they would like to be treated then the males would show autocratic behaviors and social support while females would show democratic behaviors, consideration and training and instruction.

Athlete Leadership Behaviors and Cohesion
24
The results of the current study indicated that there were no differences between genders. However, the lack of difference is likely caused by the continual path to equality among genders. The closer society gets to equality the closer the genders get in terms of roles they play or positions they hold. Sherman et al. (2000) suggests that it is necessary to look into gender every few years to understand the changes that take place, but the current results refute that necessity within athlete leadership. The latter is because, at least in the present study, it appeared as if gender differences in athlete leadership do not exist, at least as they relate to type of leader and leadership behaviors. Limitations
There were a few limitations for this particular study. First, the study was conducted during the peak of basketball season through the end of the school year. Whether athletes participated at the end of their season or toward the end of their school year, the response rate was 23% from the initial email contact with coaches and 30% from emailing student-athletes directly. These rates are not that low for survey research, but likely would have been higher in a less busy time of year for the student-athletes. Second, the sample was limited to NCAA Division III college basketball players. It is unknown whether these results could be generalizable to other college sports or other levels of basketball. Third, lack of difference between genders could be attributed to the small sample size of each gender group. Fourth, due to the structure of the online survey format, the order in which the participants completed the questionnaires could not be counterbalanced. This could have affected the responses on the second and third questionnaires, which were the GEQ and informal leader version of the LSS. Fatigue and focus are not only issues, but taking the formal leader version of the LSS prior to the informal version could have also influenced the results on the informal version. Fifth, the LSS is a widely used measure for leadership behaviors in coaches, but such high Cronbach’s alphas for athletes seem to suggest that the number of items per subscale may need to be reduced. The subscales vary

Burkett, Blom, Razon & Johnson
25
widely in terms of the number of items per each subscale. For example, Training and Instruction has 13 items whereas Autocratic Behaviors has five; however, it appears that five items for Autocratic Behaviors may be more effective than 13 for Training and Instruction. The Cronbach’s alphas for Training and Instruction is very high at .94 for both types of athlete leaders whereas Autocratic Behaviors is .85 (formal athlete leaders) and .82 (informal athlete leaders), which suggests that Training and Instruction may become repetitive in its items. Shorter, more to-the-point subscales could make this measure a more effective tool for measuring leadership behaviors. Sixth, it is important to note that student-athletes in this study were asked to report about their perceptions of the behaviors of their athlete leaders. This was not a self-report; however, 55 of the 74 student-athletes participating reported that they were an athlete leader, which means they could have unintentionally been self-reporting their own behaviors instead of the behavior of other athlete leaders on their team. This could have had an effect on the results by athletes either over-reporting or under-reporting their own behaviors, potentially leading to skewed results. Without controlling for this, there is no way to know if an effect exists, but it is something for future researchers to keep in mind. It is recommended that future studies control for this potential effect either within the methodology or in their data analysis. Lastly, the results were descriptive meaning that no causation can be drawn from them; the differences and relationships can solely be observed. Future Directions
The significant results from this study complements the literature surrounding athlete leadership. In order to fully develop an understanding of athlete leadership, researchers must continue to explore different types of athlete leaders, including formal and informal, peer and team, elected and appointed, and other developing types. This study also provides a beneficial methodological basis for similar studies looking to compare two types of athlete leaders on their behaviors or their teammates’ perceptions of their leadership as

Athlete Leadership Behaviors and Cohesion
26
it relates to cohesion, performance, or any other number of team characteristics.
Future directions for this line of research would first be to expand the concept to other sports or levels of competition to develop a more generalizable set of findings. Additionally, future researchers would be encouraged to examine other types of athlete leaders, like peer and task athlete leaders or appointed and elected athlete leaders. Lastly, it is suggested that research explores the concept of leadership training for athlete leaders or potential athlete leaders so that the leadership will be more efficient and effective.
Following the results of Vincer and Loughead (2010) and the current study, it is clear that this line of research is only beginning to develop, and these studies lay the foundation for important future research regarding athlete leadership. Both Vincer and Loughead (2010) and the current study stress the importance of understanding athlete leadership because it can have both positive and negative impacts on cohesion and performance. With the importance of athlete leadership and athlete leadership behaviors starting to come into focus it brings up a future line of research that has been neglected: how athlete leaders are selected for their leadership positions? Through the review of literature for this particular study it became apparent that athlete leaders were selected for a variety of reasons, and their selection or election into the positions seem to be done rather haphazardly. Through every day conversations with athlete and coaches, it seems that some coaches appoint their athlete leaders on their own, others have team members elect their leaders, and others simply allow upperclassmen or seniors to be designated leaders. Now that we have begun to understand the impact that athlete leadership can have on team cohesion and performance it is critical to assess the effectiveness of the athlete leader selection process in order to uncover a best practice.
Conclusion
Vincer and Loughead (2010) examined the relationships between the types of athlete leadership behaviors and types of cohesion. The current study attempted to expand their work by

Burkett, Blom, Razon & Johnson
27
examining differences between formal and informal athlete leaders. The results of this study indicated that formal and informal athlete leaders were perceived to have similar behaviors other than social support in which informal athlete leaders were perceived as showing more social support behaviors. Furthermore, it was found that training and instruction, democratic behaviors, social support, and positive feedback all positively correlated with at least one subscale of cohesion. Autocratic behaviors were shown to negatively correlate with multiple subscales of cohesion. It is suggested that coaches keep the negative relationship between autocratic behaviors and cohesion in mind when they select or elect athlete leaders for their team. Athletes who demonstrate autocratic behaviors may negatively affect cohesion, and considering the positive relationship between cohesion and team performance (Carron et al., 2002), these athlete leaders could indirectly decrease team performance. The results also indicated there were no significant differences in leadership behaviors among male and female athlete leaders. Therefore, since the findings show that male and female athlete leaders display similar behaviors, it is necessary for both coaches of men’s and women’s teams to focus on the appointment or election of athlete leaders who are not going to lead autocratically. Each of these results provides important information that can be put into immediate use by coaches, athletes, sport psychology consultants, and other researchers.
Athlete Leadership Behaviors and Cohesion
28
References Beam, J. W., Serwatka, T. S., & Wilson, W. J. (2004). Preferred
leadership of NCAA Division I and II intercollegiate student-athletes. Journal of Sport Behavior, 27(1), 3-17.
Carron, A. V., Colman, M. M., Wheeler, J., & Stevens, D. (2002). Cohesion and performance in sport: A meta analysis. Journal of Sport and Exercise Psychology, 24(2), 168-188.
Carron, A. V., Widmeyer, W. N., & Brawley, L. R. (1985). The development of an instrument to assess cohesion in sport teams: The Group Environment Questionnaire. Journal of Sport Psychology, 7, 244-266.
Chelladurai, P. & Saleh, S. D. (1980). Dimensions of leader behavior in sports: Development of a leadership scale. Journal of Sport Psychology, 2, 34-45.
Dupuis, M., Bloom, G. A., & Loughead, T. M. (2006). Team captains’ perceptions of athlete leadership. Journal of Sport Behavior, 29(1), 60-78.
Emerson, R. M. (1976). Social exchange theory. Annual Review of Sociology, 2, 335-362.
Eys, M. A., Loughead, T. M., & Hardy, J. (2007). Athlete leadership dispersion and satisfaction in interactive sport teams. Psychology of Sport and Exercise, 8(3), 281-296.
Gardner, D. E., Shields, D. L., Bredemeier, B. J., & Bostrom, A. (1996). The relationship between perceived coaching behaviors and team cohesion among baseball and softball players. The Sport Psychologist, 10(4), 367-381.
Harris, M. J. & Rosenthal, R. (1988). Human performance research: An overview. In Enhancing Human Performance: Background Papers, Issues of Theory and Methodology. Washington, DC: The National Academies Press, 1988.
Holmes, R. M., McNeil, M., & Adorna, P. (2010). College athletes’ perceptions of formal and informal team leaders. Journal of Sport Behavior, 33(4), 442-465.
Jambor, E. A., & Zhang, J. J. (1997). Investigating leadership, gender, and coaching level using the Revised Leadership Scale for Sport. Journal of Sport Behavior, 20(3), 313-322.

Burkett, Blom, Razon & Johnson
29
Loughead, T. M., Hardy, J., & Eys, M. A. (2006). The nature of athlete leadership. Journal of Sport Behavior, 29(2), 142-158.
Moran, M. M., & Weiss, M. R. (2006). Peer leadership in sport: Links with friendship, peer acceptance, psychological characteristics, and athletic ability. Journal of Applied Sport Psychology, 18(2), 97-113.
Murray, N. P. (2006). The differential effect of team cohesion and leadership behaviors in high school sports. Individual Differences Research, 4(4), 216-225.
Sherman, C. A., Fuller, R., & Speed, H. D. (2000). Gender comparisons of preferred coaching behaviors in Australian sports. Journal of Sport Behavior, 23(4), 389-406.
Shields, D. L., Gardner, D. E., Bredemeier, B. J., & Bostro, A. (1997). The relationship between leadership behaviors and group cohesion in team sports. Journal of Psychology, 131(2), 196-210.
Turman, P. D. (2003). Coaches and cohesion: The impact of coaching techniques on team cohesion in the small group sport setting. Journal of Sport Behavior, 26(1), 86-104.
Vincer, D. J., & Loughead, T. M. (2010). The relationship among athlete leadership behaviors and cohesion in team sports. The Sport Psychologist, 24(4), 448-467.
Voekler, D. K., Gould, D., & Crawford, M. J. (2011). Understanding the experience of high school sport captains. The Sport Psychologist, 25(1), 47-66.
Wilson, M. A., & Stephens, D. E. (2007). Great expectations: An examination of the differences between high and low expectancy athletes’ perception of coach treatment. Journal of Sport Behavior, 30(1), 358-373.
Wright, A., & Côté, J. (2003). A retrospective analysis of leadership development through sport. The Sport Psychologist, 17(3), 268-291.

Online Purchase Intentions
30
The Journal of SPORT, 2014, 3(1), 30-62 © Kent State University
Understanding Online Purchase Intentions of Licensed Sport Merchandise through Integration of Technology Acceptance
Model and Trust
Jinhee Yoo University of Minnesota
Stephen D. Ross
University of Minnesota
Abstract
This study proposed and examined a research model to explain sport consumers’ intentions to purchase licensed sport merchandise online. The model extends the TAM by adding the construct of trust in order to propose an adaptive model for the online sport context. The respondents were students (N = 266) attending a large university in the Midwestern United States. The proposed model included measures of perceived ease of use, perceived usefulness, trust, attitude, and online purchase intentions of licensed sport merchandise. Structural equation modeling was used to test the proposed model and the relationships among constructs that were indicated by multiple measures. The results indicated that the proposed model (x2/df = 2.48, NFI = .90, TLI = .92, CFI = .94, RMSEA = .075) fit the data with a degree of reasonable fit. The findings indicate a positive influence of perceived ease of use on perceived usefulness, perceived usefulness on attitude, and trust on attitude.

Yoo & Ross
31
The Internet has provided sport businesses with more opportunities to increase revenues and reach more consumers. According to U.S. Census Bureau (2011), e-commerce of sporting goods accounts for 68.6% of total sales, $4.82 million out of $7.03 million in 2009, up 19.2% compared to the previous year. In fact, e-commerce of sporting goods was the second largest increasing area followed by computer software in terms of change of sales volume. Furthermore, consumers now buy more sport products online than offline (U.S. Census Bureau, 2011), and as a result, major sectors of the sport industry including teams, leagues, and manufacturers also use the Internet as a critical component of their business strategy (Hur, Ko, & Valacich, 2008). For example, the Minnesota Twins of the MLB sell tickets and merchandise, and also provide auction services through their website. As such, sport organizations now utilize the Internet as an outlet for information distribution, entertainment, a point of purchase for many consumers, while at the same time attempting to enhance interactive features and consumer satisfaction (Seo & Green, 2008).
Due to the growth of e-commerce, researchers and practitioners have made efforts to understand the factors influencing online consumer behavior (e.g., Kim, Ferrin, & Rao, 2008; Palvia, 2009; Zhang & Won, 2009). Particularly, researchers have studied online consumer behavior by focusing on behavioral intentions (Kim et al., 2008; Pavlou & Fygenson, 2006; Schlosser, White, & Lloyd, 2006). In an effort to understand behavioral intentions in the e-commerce setting, the technology acceptance model (TAM) (Davis, 1986, 1989; Davis, Bagozzi, & Warshaw, 1989), which was developed based on theory of reasoned action (Fishbein & Ajzen, 1975), has been broadly used to explain how potential users accept or reject a technology (Davis et al., 1989).
The TAM has provided many researchers a conceptual framework for explaining online buying behavior (Gefen, Karahanna, & Straub, 2003; Ha & Stoel, 2009; Pavlou, 2003), and has been examined and proven to be robust and parsimonious in various contexts such as mobile commerce (Wu & Wang, 2005), online learning (Saadé & Bahli, 2005), online commerce and

Online Purchase Intentions
32
information systems (Bruner & Kumar, 2005; Porter & Donthu, 2006; Venkatesh & Davis, 2000). Relative to this study, the TAM has been applied and extended in e-commerce contexts to understand the online consumer behavior due to the proliferation of e-commerce (Chiu, Chang, Cheng, & Fang, 2009; Ha & Stoel, 2009; Koufaris, 2002; Van der Heijden, Verhagen, & Creemers, 2003).
Researchers have attempted to extend the TAM not only by testing the model in different contexts, but also finding additional constructs (Lin & Lu, 2000). In particular, researchers have paid special attention to the construct of trust (Gefen et al., 2003; Van der Heijden, 2003; Van der Heijden et al., 2003). Researchers have argued that consumers may perceive more risk (e.g., fiduciary, security, and privacy risks) when shopping online than shopping in the traditional establishments because they need to depend on an unseen and unknown vendor (Everard & Galletta, 2006). Therefore, many online customers still remain simply web site visitors, and not actual buyers. Because of this type of behavior, many online retailers are struggling to find a way to convert these visitors to actual customers (Donthu & Garcia, 1999; Schlosser et al., 2006). As such, trust has been considered as a perceived risk reducer when shopping online (Van der Heijden et al., 2003). This issue highlights the importance of trust in online transactions because consumers hesitate to make a decision unless they trust the seller (Van der Heijden et al., 2003).
Given the increasing importance of the Internet as a platform of purchase for consumers (Seo & Green, 2008), it is significant to understand how consumers make decisions to buy products online. Despite the proliferation of online consumer studies, little empirical research has been conducted to explain factors that influence purchasing intentions of licensed sport merchandise, especially in online settings. Previous research that tried to explain the online buying behavior in sports has specifically focused on intangible sport products such as sports-related information (Hur et al., 2008; Hur, Ko, & Claussen, 2011; Seo & Green, 2008). The models and factors used in the previous research may not be directly applied to explain online purchasing intentions of more tangible sport products.
Yoo & Ross
33
Sport products consist of tangible and intangible elements (Mullin, Hardy, & Sutton, 2007). Vijayasarathy (2002) suggested that intentions to shop using the Internet are different between tangible and intangible products. Therefore, a conceptual model that explains online purchasing intention of tangible sport products is needed. This study focused on tangible sport products, specifically licensed sport merchandise.
The purpose of the present research is to propose and empirically test a conceptual model to explain how sport consumers intend to purchase licensed sport merchandise online. Specifically, this study extends the TAM to include trust to propose an adaptive model for the online sport context. This study will provide a more thorough understanding of consumer behaviors in the online environment for researchers and practitioners who are interested in factors that influence online purchase intention of sport product. In addition, the application of such a model to a variety of online sports consumptions in future contexts may contribute to the advancement of a body of knowledge in the field of sport marketing.
Theoretical Background
Technology Acceptance Model (TAM) Davis (1986, 1989) introduced the TAM as an adaptation of
theory of reasoned action (TRA: Fishbein & Ajzen, 1975) model to explain why a particular system may be acceptable to users. TRA has been broadly used to predict behavioral intentions and/or behavior (Madden, Ellen, & Ajzen, 1992; Hansen, Jensen, Solgaard, 2004). According to TRA, a single behavior is determined by the intentions to perform the specific behavior (Ajzen & Fishbein, 1977, 1980), and behavioral intentions are a function of subjective norm and attitude toward the behavior (Fishbein & Ajzen, 1975; Hansen et al., 2004).
In the TAM, subjective norm which was originally included in TRA was eliminated because it is the least understood facet of TRA for buying behavior based on technology (Davis et al., 1989). The TAM has been broadly tested in various technology-related contexts (Ha & Stoel, 2009; Porter & Donthu, 2006) including the
Online Purchase Intentions
34
workplace (Davis, Bagozzi, & Warshaw, 1992; Igbaria, Iivari, & Maragahh, 1995; Venkatesh & Bala, 2008), the Internet or website use (Brunner & Kumar, 2005; Moon & Kim, 2001), and online shopping settings (Gefen et al., 2003; Koufaris, 2003; Palvia, 2009; Pavlou, 2003).
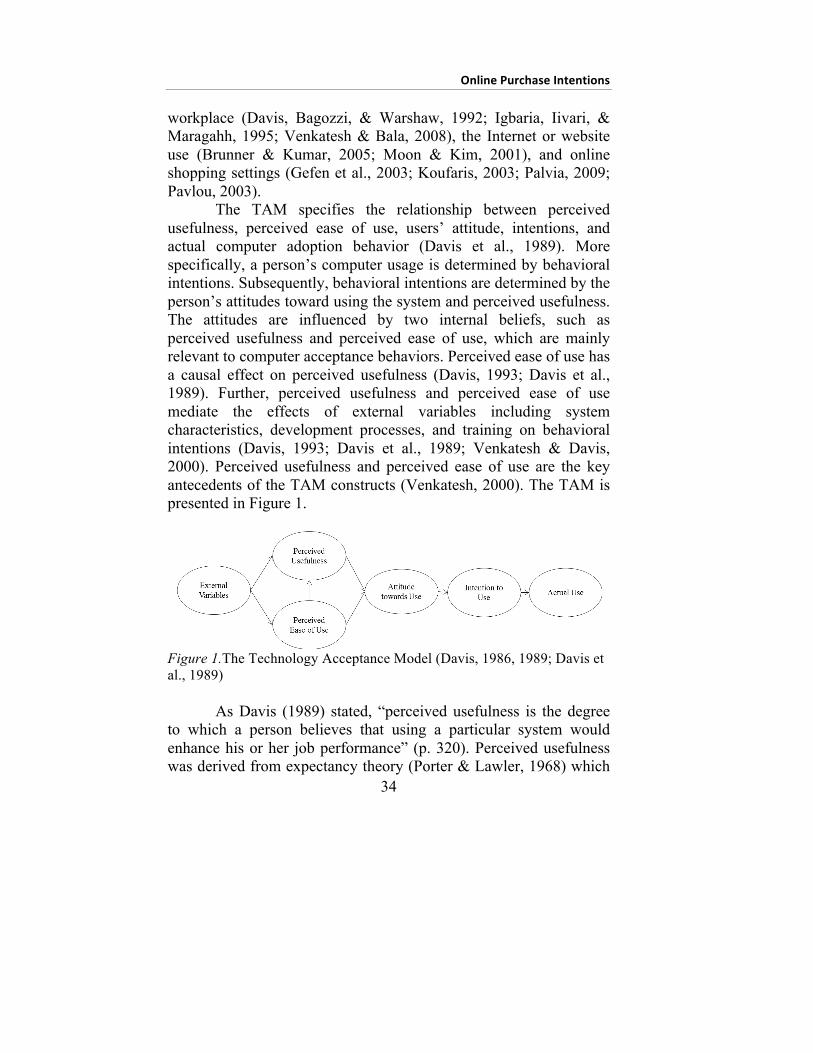
The TAM specifies the relationship between perceived usefulness, perceived ease of use, users’ attitude, intentions, and actual computer adoption behavior (Davis et al., 1989). More specifically, a person’s computer usage is determined by behavioral intentions. Subsequently, behavioral intentions are determined by the person’s attitudes toward using the system and perceived usefulness. The attitudes are influenced by two internal beliefs, such as perceived usefulness and perceived ease of use, which are mainly relevant to computer acceptance behaviors. Perceived ease of use has a causal effect on perceived usefulness (Davis, 1993; Davis et al., 1989). Further, perceived usefulness and perceived ease of use mediate the effects of external variables including system characteristics, development processes, and training on behavioral intentions (Davis, 1993; Davis et al., 1989; Venkatesh & Davis, 2000). Perceived usefulness and perceived ease of use are the key antecedents of the TAM constructs (Venkatesh, 2000). The TAM is presented in Figure 1.
Figure 1.The Technology Acceptance Model (Davis, 1986, 1989; Davis et al., 1989)
As Davis (1989) stated, “perceived usefulness is the degree
to which a person believes that using a particular system would enhance his or her job performance” (p. 320). Perceived usefulness was derived from expectancy theory (Porter & Lawler, 1968) which
Yoo & Ross
35
suggests a person continuously evaluates the consequences of his/her behavior and assesses the likelihood that the action will produce various results in a subject way. Perceived usefulness should be fully considered when designing or implementing successful systems because user’s technology acceptance is strongly influenced by perceived usefulness. How users perceive risks in using and adopting the technology can have different effects on the influence of perceived usefulness. For example, if users perceive that the risk of technology is low, perceived usefulness should be emphasized.
Perceived ease of use is “the extent to which a person believes that using a particular system would be free of effort” (Davis, 1989, p. 320). Self-efficacy theory (Bandura, 1982) can be seen as similar to perceived ease of use, as it refers to “judgments of how well one can execute courses of action required to deal with prospective situations” (Bandura, 1982, p. 122). The TAM suggests that perceived ease of use is instrumental in explaining the variance in perceived usefulness (Ha & Stoel, 2008). For example, if an online consumer believes a website is easy to use, he or she will tend to perceive the website as being useful. Therefore, online consumers do not have to waste time by understanding how to use the systems, and spend more time to search for information about the product they want to buy. Individual’s behavioral intentions to use an information technology is determined by perceived usefulness and perceived ease of use in the TAM.
Trust
Trust is a set of specific beliefs including integrity, benevolence, ability, and predictability (Gefen et al., 2003). Integrity refers to a set of principles provided by the trustee found to be acceptable by the trustor (Mayer, Davis, & Schoorman, 1995), while benevolence is “based on the extent to which the retailer believes that the vendor has intentions and motives beneficial to the retailer when new conditions arise, conditions for which a commitment was not made” (Ganesan, 1994, p. 3). Ability describes how a trustee has functional competence, interpersonal competence, business sense, and judgment (Gabarro, 1978; Mayer et al., 1995). Finally,

Online Purchase Intentions
36
predictability evaluates if consumers can predict or expect the vendor will behave with reliability in order to reduce social uncertainty (Gefen & Straub, 2004).
Researchers have emphasized the importance of trust by stating that although the use and popularity of online transactions have grown, the inherent uncertainty in the online consumption environment brings the issue of trust towards the Internet as a transactional means to the forefront of academic and practical marketing research (Ha, 2003; Kim et al., 2008; Pavlou, 2003). Unlike traditional transactions, online purchases have a higher possibility of significant fiduciary, security, and privacy risk due to lack of vendors’ visibility (Everard & Galletta, 2006). These possible risks, therefore, make trust a critical component in online transactions given the reduction in perceived risk among consumers (Pavlou, 2003). Many researchers have also suggested that the development and maintenance of consumer brand trust on the web should be at the core of companies’ marketing plans (Fournier & Yao, 1997; Ha, 2003).
However, Gefen (2004) pointed out that it is costly for companies to invest in systems for ensuring trust in the short run, given that relationships based on trust are likely to be long term and result in higher levels of loyalty and reduced costs for negotiation, monitoring, and transaction. Given that trust is considered to be a short-term issue and also the most critical long-term obstacle for the consumers (Kim, Kim, & Shin, 2009), trust has been integrated into the TAM. As a result, both the technology-oriented and the trust-oriented viewpoints jointly became mainstream in explaining the online consumer behavior (Van der Heijden et al., 2003). That is, researchers have strived to explain the online consumer behavior by incorporating the technology-oriented and the trust-oriented viewpoints (Van der Heijden et al., 2003). Gefen et al. (2003) proposed a model based on the TAM by adding trust and its antecedents (e.g., knowledge-based trust, institution-based trust, and calculative-based trust). Trust was included as an antecedent of online purchase intention. Kim, Kim, and Shin (2009) applied the TAM in the e-commerce settings (i.e., the airline B2C e-commerce

Yoo & Ross
37
websites), and suggested that trust is one of the most important long-term barriers for online shopping for both consumers and firms.
In a sport context, it has been found that trust also is an important factor that significantly influences the online purchasing intention. Zhang and Won (2009) suggested that sport consumers should accept the e-commerce first when purchasing sport product, and trust plays the most important role as a determinant of online purchase intention.
Research Model and Relationship Hypotheses
The model proposed here is derived primarily from an integrated model for trust and the TAM in online shopping by Gefen et al. (2003), yet was applied to the sport context. The final integrated model consists of five constructs including perceived ease of use, perceived usefulness, trust, attitude, and online purchase intentions. The model proposes the influence of perceived ease of use on perceived usefulness, attitude, and online purchase intentions; the influence of perceived usefulness on attitude and online purchase intentions; the influence of trust on attitude and online purchase intentions; the influence of attitude on online purchase intentions. The research model is presented in Figure 2. Following research propositions are suggested based on the literature reviewed.
Figure 2. A Research Model for Online Purchase Intentions of Licensed Sport Merchandise
Online Purchase Intentions
38
Perceived Ease of Use and Perceived Usefulness According to the TAM, there is a positive relationship
between perceived usefulness and perceived ease of use (Van der Heijden, 2003). Specifically, perceived usefulness is influenced by perceived ease of use (Ha & Stoel, 2009; Saadé & Bahli, 2005), given that the system is developed and enhanced by making it easier to use (Venkatesh & Davis, 2000). This suggests that if a sport consumer believes that the website selling the sport product is easy to learn or use, he or she will tend to consider these systems as more useful compared to their competitors (Bruner & Kumar, 2005; Wu & Wang, 2005). This process therefore helps the consumer to have an intention to buy the sport product in the website. As such the following hypothesis is offered:
Hypothesis 1: A sport consumer’s perceived ease of use of a website for licensed sport merchandise will significantly influence perceived usefulness of the website.
Perceived Ease of Use and Attitude
Like perceived usefulness, perceived ease of use is also a belief that influences consumer’s attitude toward the technology (Davis et al., 1989; Van der Heijden, 2003; Porter & Donthu, 2006). When sport consumers believe that a website is easy to use, learn, or navigate, they are more likely to have positive attitude toward using the website. Although both perceived usefulness and perceived ease of use have positive effects on attitude, the effect of ease of use on attitude is debated (Ha & Stoel, 2009). For example, compared to perceived usefulness, perceived ease of use has a weaker direct effect on attitude (Davis, 1989; Porter & Donthu, 2006). On the other hand, Van der Heijden (2003) suggested that perceived ease of use influences attitude at almost the same level as perceived usefulness. Therefore, an effect of perceived ease of use on attitude should be examined in order to understand the relationship between perceived ease of use and attitude. Therefore, it is posited that:
Hypothesis 2: A sport consumer’s perceived ease of use of a website for licensed sport merchandise will significantly

Yoo & Ross
39
influence attitude toward buying licensed sport merchandise in the website.
Perceived Ease of Use and Online Purchase Intentions
In online consumer behavior, a web interface that is perceived as easy to operate tends to be more accepted by consumers (Pavlou, 2003). Many researchers found that perceived ease of use has a direct effect on various behavioral intentions such as intentions to return to an e-vendor, intentions to use the communication technology, intentions to transact online, and intentions to use the information technology (Gefen et al., 2003; Im, Kim, & Han, 2008; Pavlou, 2003; Venkatesh, 2000; Venkatesh & Davis, 2000). In the sport context, Hur (2007) found that a sports fan’s perceived ease of use of a sports website positively influences intentions to use the website. Therefore, it is posited that:
Hypothesis 3: A sport consumer’s perceived ease of use of a website for licensed sport merchandise will significantly influence the intentions to buy licensed sport merchandise online.
Perceived Usefulness and Attitude
Lin and Lu (2000) referred to a preference for a website as an attitude and suggested that perceived usefulness positively influences a preference for a website. How useful a website is an important factor for consumers when developing an attitude toward using the website (Davis et al., 1989; Porter & Donthu, 2006). Many researchers have found that attitude mediates perceived usefulness and behavioral intention. For example, Davis et al. (1989) and Van der Heijden (2003) found that attitude is a mediator between perceived usefulness and behavioral intention. That is, if sport consumers believe that the website is useful, they will have a positive attitude toward the website, and then they have intentions to buy sport products from the website. This leads to the following hypothesis posited:
Hypothesis 4: A sport consumer’s perception of usefulness of a website for licensed sport merchandise will significantly
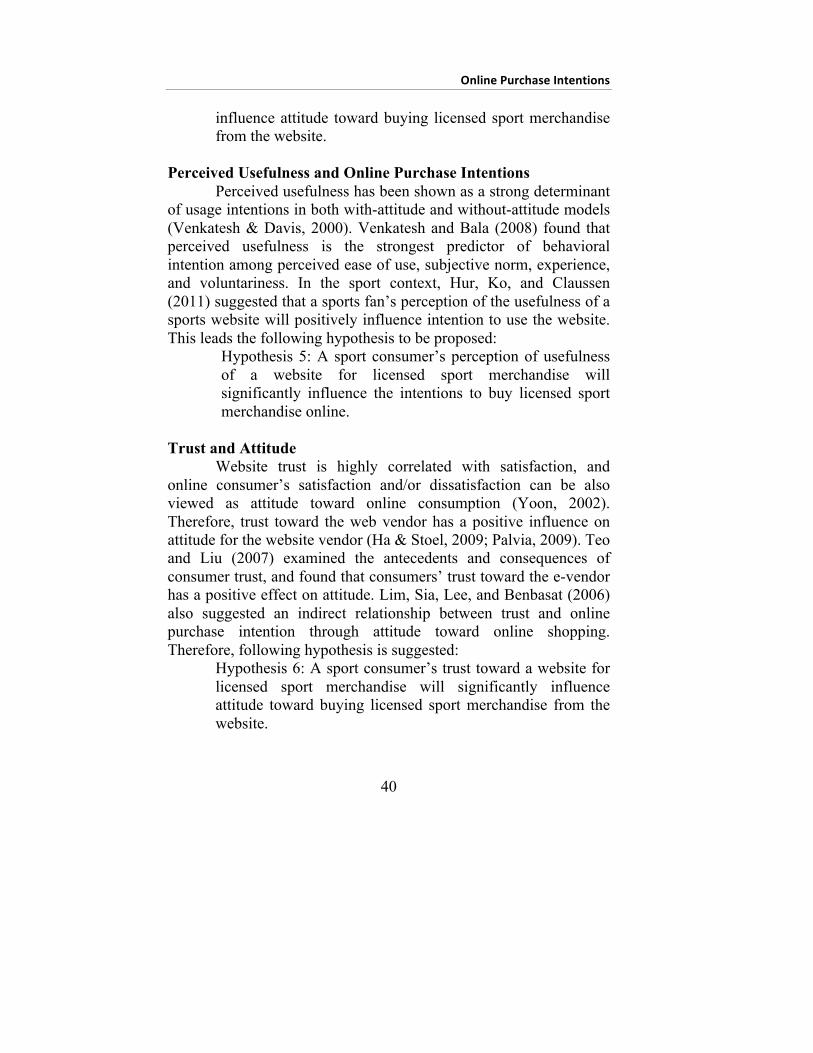
Online Purchase Intentions
40
influence attitude toward buying licensed sport merchandise from the website.
Perceived Usefulness and Online Purchase Intentions
Perceived usefulness has been shown as a strong determinant of usage intentions in both with-attitude and without-attitude models (Venkatesh & Davis, 2000). Venkatesh and Bala (2008) found that perceived usefulness is the strongest predictor of behavioral intention among perceived ease of use, subjective norm, experience, and voluntariness. In the sport context, Hur, Ko, and Claussen (2011) suggested that a sports fan’s perception of the usefulness of a sports website will positively influence intention to use the website. This leads the following hypothesis to be proposed:
Hypothesis 5: A sport consumer’s perception of usefulness of a website for licensed sport merchandise will significantly influence the intentions to buy licensed sport merchandise online.
Trust and Attitude
Website trust is highly correlated with satisfaction, and online consumer’s satisfaction and/or dissatisfaction can be also viewed as attitude toward online consumption (Yoon, 2002). Therefore, trust toward the web vendor has a positive influence on attitude for the website vendor (Ha & Stoel, 2009; Palvia, 2009). Teo and Liu (2007) examined the antecedents and consequences of consumer trust, and found that consumers’ trust toward the e-vendor has a positive effect on attitude. Lim, Sia, Lee, and Benbasat (2006) also suggested an indirect relationship between trust and online purchase intention through attitude toward online shopping. Therefore, following hypothesis is suggested:
Hypothesis 6: A sport consumer’s trust toward a website for licensed sport merchandise will significantly influence attitude toward buying licensed sport merchandise from the website.

Yoo & Ross
41
Trust and Online Purchase Intentions Trust plays a critical role in consumer’s adoption of online
shopping (Ha & Stoel, 2009), and Yoon (2002) found that web-site trust positively influences online purchase intention. Beliefs in integrity, competence, and benevolence of a website positively influence consumer’s trust of the website (Palvia, 2009). In addition, the consumers who trust the website are more likely to transact online. There was a direct and indirect positive relationship between trust and online purchase intention (Lim, Sia, Lee, & Benbasat, 2006; Pavlou, 2003). Jarvenpaa, Tractinsky, and Vitale (1999) found that trust influences the consumer’s attitude and risk perceptions, and in turn it influences the willingness to buy online.
Further research by Bart, Shankar, Sultan, and Urban (2005) examined the relationships among website and personal characteristics, online trust, and behavioral intention. They found that online trust partially mediates the relationships between website characteristics and behavioral intent. They categorized the website characteristics such as privacy, security, navigation and presentation, brand strength, advice, order fulfillment, community features, and absence of errors. Specifically, privacy, navigation, advice, order fulfillment, and absence of errors were found to be important for building trust in e-tail websites. Additionally, this mediating effect was found to be strong for sites with infrequently purchased and high-involvement items, but weak for the websites with frequent transactions. Pavlou (2003) found that trust affects perceived risk, perceived usefulness, and perceived ease of use, and in turn, purchase intention. Given this extensive research, it is posited that:
Hypothesis 7: A sport consumer’s trust toward website for licensed sport merchandise will significantly influence the intentions to buy licensed sport merchandise from the website.
Attitude and Online Purchase Intentions Attitude toward online purchase is a critical variable to
differentiate between sport product online buyers and sports website browsers (Zhang & Won, 2010). Lim et al. (2006) suggested that

Online Purchase Intentions
42
attitude toward online shopping has a positive effect on willingness to buy online. In the original TAM, attitude was included as a mediator between perceived usefulness, perceived ease of use, and behavioral intentions. Many researchers (Bruner & Kumar, 2005; Ha & Stoel, 2009; Lin & Lu, 2000) have examined the mediating role of attitude in the process of online buying behavior. However, there is a lack of consensus regarding this mediating role of attitude (Davis et al., 1989; Gefen et al., 2003; Pavlou, 2003; Venkatesh, 2000; Venkatesh & Davis, 2000), since it partially mediates perceived usefulness and behavioral intention (Venkatesh, 2000). That is, although perceived usefulness has a weak effect on attitude, perceived usefulness still has a strong effect on behavioral intentions (Venkatesh, 2000). However, Van der Heijden (2003) argued that attitude plays a powerful role as a mediator between beliefs and the intention to use. Therefore, it is suggested that attitude should be included in the proposed model, and the following hypothesis generated:
Hypothesis 8: A sport consumer’s attitude toward buying licensed sport merchandise in the website will significantly influence the intentions to buy licensed sport merchandise from the website.
Methodology Sample
College-aged consumers are likely to be familiar with the Internet and a major target market for online retailers (Ha & Stoel, 2009) and for licensed sport merchandise (Kwon & Trail, 2001; Zhang & Won, 2009). Furthermore, a theoretical relationship between constructs may be sound if a homogeneous sample is used (Iwasaki & Havitz, 1998). For these reasons, the college student market is considered to provide important information about the online purchase intentions of young adults.
As such, non-probability sampling was utilized through a convenience sampling method to recruit participants in the study. Respondents consisted of 538 graduate and undergraduate students who enrolled sport management and general kinesiology courses at a

Yoo & Ross
43
large Midwestern university in the U.S. Among the respondents, 266 who had experience in buying licensed sport merchandise online were selected as the final sample by asking a qualifying question on whether the respondent had previously purchased a licensed sport merchandise using the Internet or not. The focus on including theses respondents was due to the intent of the study and targeting only those with experiences purchasing licensed sport merchandise online, and the scales that were developed based on respondents’ experiences. Procedure and Instrument
The survey was reviewed and approved by the Institutional Review Board (IRB) on the campus before conducting survey. Upon approval from the IRB, a pilot study was conducted to establish content validity by assessing the perspective of participants to ensure that the instrument is comprehensible to the target sample (Andrew, Pedersen, & McEvoy, 2011). A total of 42 undergraduate students in a sport management course participated in the pilot study. Respondents were not only asked to complete the survey, but also to provide feedback on item wording and phrasing that were needed to further revise the instrument. A panel of experts also provided suggestions regarding the organization of the online survey and phrasing of specific items to establish content and face validity of the instrument. After revising the instrument based on the pilot study and a panel of experts, instructors for undergraduate and graduate level courses were contacted in order for their students to be asked to participate in the survey. The survey was conducted in classrooms. Each participant was asked to participate in the survey only one time in order to avoid redundancy.
A self-administered questionnaire was used in the study, and scales for perceived usefulness, perceived ease of use, and trust were adapted from Gefen et al.'s (2003) study. Scales for attitude and online purchase intention were derived from Ajzen and Madden (1986) and Pavlou (2003), respectively. Perceived usefulness, perceived ease of use, trust, and online purchase intention are 7-point Likert type scale ranging from 1 (Strongly Disagree) to 7 (Strongly

Online Purchase Intentions
44
Agree). The measures of attitude were obtained by evaluative semantic differential scales ranging from +3 to -3.
To evaluate the internal consistency of the variables, Cronbach's alpha coefficients were calculated. Reliability of the measures was confirmed as all the measures had the Cronbach’s α coefficient above the acceptable level of .70 (Nunnally, 1978). Average variance extracted (AVE) values were calculated for each construct to ensure that each indicator represents the latent construct. All latent scale values were greater than the suggested cut-off value of .50 (Fornell & Larcker, 1981; Hair, Anderson, Tatham, & Black, 1998; Kwon & Armstrong, 2006). Reliability of the scale is presented in Table 1. Table 1. Reliability of the Scales
Construct Number of items Cronbach’s α AVE Perceived ease of use 6 .842 .577 Perceived usefulness 6 .851 .662 Trust 7 .827 .626 Attitude 8 .855 .548 Online purchase intentions 3 .834 .639
Data Analysis
SPSS 19.0 and AMOS 18.0 were used for data analysis. Prior to actual analysis, descriptive statistics were generated for each item and construct such as means, variance, median, and normality in order to screen the data by checking the qualifying question, outliers, missing, and unreliable data. After data cleaning, 266 out of 538 were valid for analysis. Correlation analysis was conducted to test for multicollinearity and convergent validity. Confirmatory factor analysis (CFA) was conducted to test the validity of the measurement model using AMOS 18.0. Next, structural equation modeling (SEM) was conducted to confirm the research model using AMOS 18.0, allowing the researchers to examine both the path structure of the latent model and the factor loadings of the

Yoo & Ross
45
measurement model. Furthermore, SEM allows researchers to test and explain measurement issues (Kwon & Armstrong, 2006).
Results
Means, standardized deviations, skewness, and kurtosis values were calculated to determine normality of the data. Absolute skewness and kurtosis values for all constructs were no greater than 3.0 and 8.0, respectively, indicating the data was close to normal distribution (Kline, 2011). The correlation matrix indicated that significant levels of multicollinearity did not exist (Kline, 2011), and the correlations among the constructs ranged from .428 to .784 (see Table 2). Therefore, the data seemed to have no issues in multicollinearity and showed evidence of convergent validity.
Table 2. Correlations between Constructs
Perceived
ease of use
Perceived usefulness Trust Attitude
Online purchase intentions
Perceived ease of use 1
Perceived usefulness .784** 1
Trust .770** .702** 1 Attitude .428** .488** .488** 1 Online purchase intentions
.730** .725** .697** .447** 1
M 5.681 5.450 5.640 5.834 5.607 SD .964 1.092 1.048 .805 1.080
Skewness -1.306 -.927 -.910 -1.682 -1.076 Kurtosis 3.007 1.385 .935 5.329 1.866
** p < .01
The results of the revised measurement model revealed an adequate fit to the data (x2/df = 2.49 <3.0, p = .001, NFI = .90, TLI = .91, CFI = .94, RMSEA = .075). The convergent validity of the
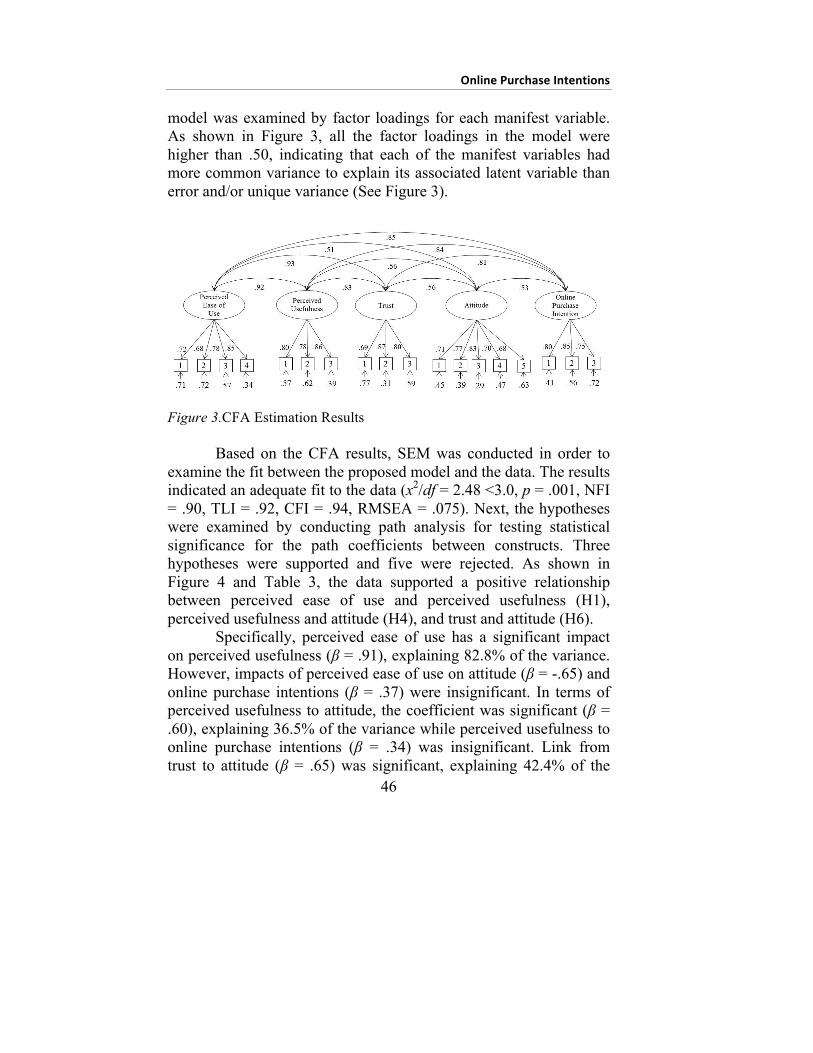
Online Purchase Intentions
46
model was examined by factor loadings for each manifest variable. As shown in Figure 3, all the factor loadings in the model were higher than .50, indicating that each of the manifest variables had more common variance to explain its associated latent variable than error and/or unique variance (See Figure 3).
Figure 3.CFA Estimation Results Based on the CFA results, SEM was conducted in order to
examine the fit between the proposed model and the data. The results indicated an adequate fit to the data (x2/df = 2.48 <3.0, p = .001, NFI = .90, TLI = .92, CFI = .94, RMSEA = .075). Next, the hypotheses were examined by conducting path analysis for testing statistical significance for the path coefficients between constructs. Three hypotheses were supported and five were rejected. As shown in Figure 4 and Table 3, the data supported a positive relationship between perceived ease of use and perceived usefulness (H1), perceived usefulness and attitude (H4), and trust and attitude (H6).
Specifically, perceived ease of use has a significant impact on perceived usefulness (β = .91), explaining 82.8% of the variance. However, impacts of perceived ease of use on attitude (β = -.65) and online purchase intentions (β = .37) were insignificant. In terms of perceived usefulness to attitude, the coefficient was significant (β = .60), explaining 36.5% of the variance while perceived usefulness to online purchase intentions (β = .34) was insignificant. Link from trust to attitude (β = .65) was significant, explaining 42.4% of the

Yoo & Ross
47
variance whereas trust to online purchase intentions (β = .15) was not significant. Finally, the influence of attitude on online purchase intentions (β = .07) was not significant.
Figure 4. SEM Estimation Results
Table 3. The Results of Hypothesis Tests
Hypothesis Path Estimate SE C.R. H1 Perceived ease of use →
Perceived usefulness .91 .09 11.41***
H2 Perceived ease of use → Attitude
-.65 .32 -1.55
H3 Perceived ease of use → Online purchase intentions
.37 .37 1.15
H4 Perceived usefulness → Attitude
.60 .17 2.44*
H5 Perceived usefulness → Online purchase intentions
.34 .19 1.75
H6 Trust → Attitude .65 .23 2.22* H7 Trust → Online purchase
intentions .15 .26 .66
H8 Attitude → Online purchase intentions
.07 .10 .98
*** p < .001, * p <. 05

Online Purchase Intentions
48
Discussion Significance of the online stores has increased as a
distribution channel for licensed sport merchandise. Along with the advances in e-commerce, sport consumers have shown different consumption patterns compared to past. Online sport consumers are likely to purchase licensed sports merchandise of a certain team or brand based on their volitional motivation (Deci, Koestner, & Ryan, 1999). This implies that sport consumers are distinctive from other consumers. It also suggests a need for research to understand sport consumers' distinctiveness and uniqueness. Therefore, the purpose of this study was to test a proposed research model to account for intentions to purchase licensed sport merchandise online. Furthermore, the study attempted to gain a better understanding of the factors influencing online sports product purchasing behavior. The proposed model included perceived ease of use, perceived usefulness, trust, attitude, and online purchase intentions, and was proven that the model is suitable to explain intentions to buy sports product online. Influence of Perceived Ease of Use
As expected, perceived usefulness increased as perceived ease of use increased. The results are consistent with previous findings that perceived ease of use is a strong predictor of perceived usefulness (Chiu et al., 2009; Kim et al., 2009; Palvia, 2009; Pavlou, 2003). The results imply that the more the sports fans perceive the online store to be easy to learn and provide flexible interaction, clear, and understandable, the more likely they will consider the online store as useful. Therefore, perceived ease of use can be considered as the basic component for a success of online sport product stores. In order to ensure the website is easy to use and ultimately successful, the efficiency of the site's navigation, sufficient information (Da Silva & Alwi, 2008), fast page downloading speed, consistent accessibility, and easy product order process should be considered (Rios & Riquelme, 2010).
Given the relationships among the constructs, the results are partly supportive of other TAM studies. The findings suggested that

Yoo & Ross
49
there were no significant effect of perceived ease of use on attitude and online purchase intentions. The reason for the failure to detect significance may be that the respondents were students, who are most likely technologically savvy (Tsuji, Bennett, & Leigh, 2009). That is, perceived ease of use may not contribute to a positive attitude and online purchase intentions once a certain evaluation level has been reached (Van der Heijden et al., 2003). Second, the results also reveal that the process to purchase product may be different depending on product, resulting from the level of involvement with the product. That is, if consumers are not highly involved with a product, they may not consider ease of use because they are more likely to make a decision fast and easy as compared to when they are highly involved. Influence of Perceived Usefulness
The findings of this research suggest that perceived usefulness has a positive influence on attitude. This finding is consistent with previous studies, supporting that perceived usefulness is a major component of the TAM (Bruner & Kumar, 2005; Childers, Carr, Peck, & Carson, 2001; Davis, 1993; Ha & Stoel, 2009). The results also suggest that the more consumers perceive the online store to help them search and buy merchandise effectively, the more likely they will have favorable and positive attitude toward using the online store.
However, perceived usefulness did not have a significant impact on online purchase intentions. According to Van der Heijden et al. (2003), the TAM model focuses on usage intentions of the technology rather than purchase intentions. Usage intentions may be broader in scope than purchase intentions in an online transaction context because an individual may use an online store not only to purchase, but also to learn about products and services. Therefore, people may not intend to buy sports merchandise at the online store, even though they perceive the online store as useful (Van der Heijden et al., 2003). Furthermore, perceived usefulness might not matter if the respondents of the study are loyal customers of the online stores they have used. For example, if a customer buys a

Online Purchase Intentions
50
sports merchandise from a certain online store frequently, the customer may use the website automatically without considering alternatives. The customer will know about how the website is organized and the ordering process is operated, thus, not need to consider how useful the website is prior to decision making. Influence of Trust
In regards to trust, this study showed that trust is a strong predictor of attitude. This result is consistent with previous findings (Ha & Stoel. 2009; Kim et al., 2009; Palvia, 2009; Suh & Han, 2002), and imply that the more the sports fans trust the online store and its service, the more likely they have favorable and positive attitude toward using the online store for buying sports merchandise. However, the current study suggests that trust does not have an influence upon online purchase intentions as evidenced by the lack of significance found in the results. Interestingly, this finding contradicts previous studies suggesting that trust-building strategies are essential for the online retailers in order to build long-term relationship with customers (Gefen et al., 2003; Kim et al., 2009; Palvia, 2009; Pavlou, 2003). The results imply that trust might play differential roles for experienced and less experienced online customers. According to Chiu, Lin, Sun, and Hsu (2009), the Internet experience stimulates online purchases, and that online shopping experience tends to influence future online shopping intentions.
Trust, therefore, might play a critical role for those who may not have or have less experience in online transactions due to the potential risks (e.g., customer service, product quality, delivery, security and privacy) (Hur et al., 2008). However, the respondents were not only technologically savvy, but also had experiences purchasing sport products online. As Van der Heijden et al. (2003) suggested, a sport consumer may or may not buy at a trustworthy website that provides a user-friendly environment and reduce feelings of uncertainty. However, the sport consumer will certainly not buy at an untrustworthy website because trust is a threshold variable. Furthermore, it is plausible that the respondents are loyal

Yoo & Ross
51
customers to a certain online retailer. Thus, trust might be taken for granted for the experienced customer and might not be considered to be a significant factor in decision making. As Chiu, Hsu, Lai, and Chang (2012) suggested, trust should be taken into consideration in order to build long-term relationships with customers and increase habitual buyers. However, if the website is considered untrustworthy, customers will not utilize the website. Given that gaining customer trust is mainly under the control of online retailers, the online retailers should make great efforts to ensure satisfactory product and service qualities throughout the whole transaction process. Influence of Attitude
Attitude did not have a significant influence on online purchase intentions, and provides an important contribution of this study. Although sports fans may develop favorable attitudes toward shopping online, they may not have intentions to buy sports merchandise online. This finding is inconsistent with previous research that suggests a positive impact of attitude on intentions (Ha & Stoel, 2009; Lin & Lu, 2000; Palvia, 2009; Van der Heijden, 2003; Yang & Yoo, 2004).
Several explanations for these results can be offered. First, attitude might be a threshold variable much like perceived ease of use and trust. That is, sport consumers may or may not buy licensed sports merchandise even though they have favorable attitude toward shopping online. Second, sport consumers might visit the online stores to enhance the shopping efficiency by searching for information about the licensed sports merchandise before buying it in the brick-and-mortar stores. This finding supports Levin, Levin, and Weller (2005) who suggested that online preference is greater at the information search stage than the purchase stage. Third, the sample of undergraduate and graduate students might prefer shopping in the traditional retail establishments because they might consider shopping as a fun experience. They might go to conventional stores with their friends and colleagues and enjoy the
Online Purchase Intentions
52
time with them, suggesting they might pursue enjoyment from shopping in these types of establishments. Conclusion and Future Research
The purpose of this study was to examine a proposed research model to explain intentions to purchase licensed sport merchandise online. The research model was developed by integrating the TAM and trust and applied to the sport context. Several important conclusions can be drawn from the findings. First, the proposed research model fit the data, while some relationships among the constructs were not consistent as expected. Interestingly, none of hypothesized constructs influenced online purchase intentions. Accordingly, researchers should consider modifying the model by including more paths among the constructs in future research. For example, several researchers have included the influence of trust on perceived usefulness (Gefen, 2004; Ha & Stoel, 2009) and the influence of perceived ease of use on trust (Gefen et al., 2003), providing some evidence of the significance of the relationships.
Second, this study applied and adapted the TAM that has been widely tested and adopted as a powerful theoretical framework in the information system and e-commerce areas. This study confirmed that the adapted TAM is applicable to the sports context. Perceived ease of use was confirmed to be a strong predictor of perceived usefulness and perceived ease of use to be a strong predictor of attitude. The original TAM postulates that attitude mediates between perceived ease of use and intentions, and between perceived usefulness and intentions. However, the mediating effect of attitude was not found in the current study. The findings imply that perceived ease of use directly influences perceived usefulness, in turn, perceived usefulness influences attitude toward shopping online.
Third, the findings showed that perceived ease of use is a strong predictor of perceived usefulness. The findings suggest that a website should be designed to be user-friendly to enhance its usefulness. Fourth, the results revealed that attitude is influenced by

Yoo & Ross
53
perceived usefulness, and fifth, it was found that trust influences attitude. The results suggest that if a website is trustworthy, consumers have favorable and positive attitude toward shopping online. Trust seems to be essential for the online retailers selling licensed sport merchandise. For this reason, online retailers need systematic strategies to build trust toward the website. According to Kim, Ferrin, and Rao (2008), online retailers should pay attention to enhanced privacy and security protection, information quality, their party seals, and reputation to increase trust.
Finally, online purchase intentions were not influenced by perceived ease of use, perceived usefulness, trust, and attitude. The results suggest that even though usefulness and trust toward the website might be considered to be prerequisites for the customers to build a favorable attitude toward online transactions, they may or may not use the website for purchasing licensed sport merchandise. However, the findings also imply that the customers will not use the website if it is not easy to use, useful, and trustworthy. Therefore, online retailers for licensed sport merchandise need sophisticated and systematic plans to make their websites easy to navigate and transact. Sufficient and accurate information about their products should be provided on their websites. As Zhang and Won (2009) suggest, online retailers should establish trust using privacy seal programs such as TRUSTe and BBBOnLine while generating transferred trust for their customers.
Further research is needed to validate the findings because majority of the results of this study are inconsistent with theoretical expectations, and limitations were found. First, there is a possibility of confounding variables that might influence online purchase intentions. The research model could be extended and integrated by including factors that might influence online purchase intentions. For example, several researchers suggested that perceived enjoyment plays a critical role in the extended TAM (Childers et al., 2001; Koufaris, 2002; Teo, Lim, & Lai, 1999; Venkatesh, 2000). Lin and Lu (2000) also suggested that information quality influences perceived ease of use and perceived usefulness when using a website. Furthermore, considering the possible differences in online

Online Purchase Intentions
54
purchase behaviors between those who have online shopping experience and those who do not (Chiu et al., 2009), it would be meaningful in the future to include online shopping experience in the research model to test the effect on online purchase intentions of licensed sport merchandise.
Second, the current study was examined using sport merchandise as the object. If the research model is further extended and tested by including sport-specific constructs, it would contribute to understand whether the model can be applied to a sport context in a broader sense. Therefore, it would be meaningful to include sport-specific constructs such as team identification and psychological commitment to the research model in order to explore these relationships.
Third, this study limited the sport products to tangible licensed sport merchandise. Further research is recommended to expand the sport products and examine whether significant difference exists in online purchase intentions between tangible and intangible products. Given that the consumers may have different behavioral patterns when buying tangible and intangible products, the behavioral patterns may be further enhanced when shopping online.
Yoo & Ross
55
References Ajzen, I., & Fishbein, M. (1977). Attitude-behavior relations: a
theoretical analysis and review of empirical research. Psychological Bulletin, 84(5), 888-918.
Ajzen, I., & Fishbein, M. (1980). Understanding attitudes and predicting social behavior. Englewood Cliffs, NJ: Prentice Hall.
Ajzen, I., & Madden, T. J. (1986). Prediction of goal-directed behavior: Attitudes, intentions, and perceived behavioral control. Journal of Experimental Social Psychology, 22(5), 453-474.
Andrew, D. P., Pedersen, P. M., & McEvoy, C. D. (2011). Research methods and design in sport management. M. Schrag, (Ed.). Champaign IL: Human Kinetics.
Bandura, A. (1982). Self-efficacy mechanism in human agency. American Psychologist, 37(2), 122-147.
Bart, Y., Shankar, V., Sultan, F., & Urban, G. (2005). Are the drivers and role of online trust the same for all websites and consumers? A large-scale exploratory empirical study. Journal of Marketing, 69(4), 133-152.
Bruner, G., & Kumar, A. (2005). Explaining consumer acceptance of handheld Internet devices. Journal of Business Research, 58(5), 553-558.
Childers, T. L., Carr, C. L., Peck, J., & Carson, S. (2001). Hedonic and utilitarian motivations for online retail shopping behavior. Journal of Retailing, 77(4), 511-535.
Chiu, C., Chang, C., Cheng, H., & Fang, Y. (2009). Determinants of customer repurchase intention in online shopping. Online Information Review, 33(4), 761-784.
Chiu, C., Hsu, M., Lai, H., & Chang, C. (2012). Re-examining the influence of trust on online repeat purchase intention: The moderating role of habit and its antecedents. Decision Support Systems. 53(4), 835-845.
Chiu, C., Lin, H., Sun, S., & Hsu, M. (2009). Understanding customers’ loyalty intentions towards online shopping: An

Online Purchase Intentions
56
integration of technology acceptance model and fairness theory. Behavior & Information Technology, 28(4), 347-360.
Da Silva, R. V., & Alwi, S. F. S. (2008). Online brand attributes and online corporate brand images. European Journal of Marketing, 42(9), 1039-1058.
Davis, F. D. (1986). A technology acceptance model for empirically testing new end-use information systems: Theory and results (Doctoral dissertation, Massachusetts Institute of Technology). Retrieved from http://hdl.handle.net/1721.1/15192
Davis, F. D. (1989). Perceived usefulness, perceived ease of use, and user acceptance of information technology. MIS Quarterly, 13(3), 319-340.
Davis, F. D. (1993). User acceptance of information technology: system characteristics, user perceptions and behavioral impacts. International Journal of Man-Machine Studies, 38(3), 475-487.
Davis, F. D., Bagozzi, R. P., & Warshaw, P. R. (1989). User acceptance of computer technology: A comparison of two theoretical models. Management Science, 35(8), 982-1003.
Davis, F. D., Bagozzi, R. P., & Warshaw, P. R. (1992). Extrinsic and intrinsic motivation to use computers in the workplace. Journal of Applied Social Psychology, 22(14), 1111-1132.
Deci, E. L., Koestner, R., & Ryan, R. M. (1999). A meta-analytic review of experiments examining the effects of extrinsic rewards on intrinsic motivation. Psychological Bulletin, 125(6), 627-668.
Donthu, N., & Garcia, A. (1999). The Internet shopper. Journal of Advertising Research, 39(3), 52-58.
Everard, A., & Galletta, D. (2006). How presentation flaws affect perceived site quality, trust, and intention to purchase from an online store. Journal of Management Information Systems, 22(3), 55-95.
Fishbein, M., & Ajzen, I. (1975). Belief, attitude, intention, and behavior: An introduction to theory and research. Reading. MA: Addison-Wesley Pub.

Yoo & Ross
57
Fornell, C., & Larcker, D. F. (1981). Evaluating structural equation models with unobservable variables and measurement error. Journal of Marketing Research, 18(1), 39-50.
Fournier, S., & Yao, J. (1997). Reviving brand loyalty: A reconceptualization within the framework of consumer-brand relationships. International Journal of Research in Marketing, 14(5), 451-472.
Gabarro, J. (1978). The development of trust, influence, and expectations. Englewood Cliffs, NJ: Prentice Hall.
Ganesan, S. (1994). Determinants of long-term orientation in buyer-seller relationships. Journal of Marketing, 58(2), 1-19.
Gefen, D. (2004). What makes an ERP implementation relationship worthwhile: Linking trust mechanisms and ERP usefulness. Journal of Management Information Systems, 21(1), 263-288.
Gefen, D., Karahanna, E., & Straub, D. W. (2003). Trust and TAM in online shopping: An integrated model. MIS Quarterly, 27(1), 51-90.
Gefen, D., & Straub, D. W. (2004). Consumer trust in B2c e-commerce and the importance of social presence: experiments in e-products and e-services. Omega, 32(6), 407-424.
Ha, H. Y. (2003). Factors influencing consumer perceptions of brand trust online. Journal of Product & Brand Management, 13(5), 329-342.
Ha, S., & Stoel, L. (2009). Consumer e-shopping acceptance: Antecedents in a technology acceptance model. Journal of Business Research, 62(5), 565-571.
Hair, J. F., Anderson, R. E., Tatham, R. L., & Black, W. C. (1998). Multivariate data analysis. Upper Saddle River, NJ: Prentice-Hall.
Hansen, T., Jensen, J. M., & Solgaard, H. S. (2004). Predicting online grocery buying intention: A comparison of the theory of reasoned action and the theory of planned behavior. International Journal of Information Management, 24(6), 539-550.

Online Purchase Intentions
58
Hur, Y. (2007). Determinants of sport website acceptance: An application and extension of the technology acceptance model (Doctoral dissertation, Washington State University). Retrieved from http://www.dissertations.wsu.edu/Dissertations/Summer2007/y_hur_072707.pdf
Hur, Y., Ko, Y. J., & Claussen, C. L. (2011). Acceptance of sports websites: A conceptual model. International Journal of Sports Marketing & Sponsorship. 12(3), 209-224.
Hur, Y., Ko, Y. J., & Valacich, J. (2008). Motivation and concerns for online sport consumption. Journal of Sport Management, 21(4), 521-539.
Igbaria, M., Iivari, J., & Maragahh, H. (1995). Why do individuals use computer technology? A Finnish case study. Information & Management, 29(5), 227-238.
Im, I., Kim Y., & Han, H. J. (2008). The effects of perceived risk and technology type on user’s acceptance of technologies. Information & Management, 45(1), 1-9.
Iwasaki, Y., Havitz, M. E. (1998). A path analytic model of relationships between involvement, psychological commitment and loyalty. Journal of Leisure Research, 30(2), 256-280.
Jarvenpaa, S. L., Tractinsky, J., & Vitale, M. (1999). Consumer trust in an Internet store: A cross-cultural validation. Information Technology and Management, 5(2), 45-71.
Kim, D. J., Ferrin, D. L., & Rao, H. R. (2008). A trust-based consumer decision-making model in electronic commerce: The role of trust, perceived risk, and their antecedents. Decision Support Systems, 44(2), 544-564.
Kim, H., Kim, T., & Shin, S. W. (2009). Modeling roles of subjective norms and eTrust in customers' acceptance of airline B2C eCommerce websites. Tourism Management, 30(2), 266-277.
Kline, R. B. (2011). Principles and practice of structural equation modeling. New York, NY: The Guilford Press.

Yoo & Ross
59
Koufaris, M. (2002). Applying the technology acceptance model and flow theory to online consumer behavior. Information Systems Research, 13(2), 205-223.
Kwon, H, H., & Armstrong, K. L. (2006). Impulse purchases of sport team licensed merchandise: What matters? Journal of Sport Management, 20(1), 101-119.
Kwon, H. H., & Trail, G. (2001). Sport fan motivation: A comparison of American students and international students. Sport Marketing Quarterly, 10(3), 147-155.
Levin, A. M., Levin, I. P., & Weller, J. A. (2005). A multi-attribute analysis of preferences for online and offline shopping: Differences across products, consumers, and shopping stages. Journal of Electronic Commerce Research, 6(4), 281-290.
Lim, K. H., Sia, C. L., Lee, M. K. O., & Benbasat, I. (2006). Do I trust you online, and if so, will I buy? An empirical study of two trust-building strategies. Journal of Management Information Systems, 23(2), 233-266.
Lin, J. C., & Lu, H. (2000). Towards an understanding of the behavioural intention to use a website. International Journal of Information Management, 20(3), 197-208.
Madden, T. J., Ellen, P. S., & Ajezn, I. (1992). A comparison of the theory of planned behavior and the theory of reasoned action. Personality and Social Psychology Bulletin, 18(1), 3-9.
Mayer, R. C., Davis, J. H., & Schoorman, F. D. (1995). An integrative model of organizational trust. The Academy of Management Review, 20(3), 709-734.
Moon, J., & Kim, Y. (2001). Extending the TAM for a World-Wide-Web context. Information & Management, 38(4), 217-230.
Mullin, B. J., Hardy, S., & Sutton, W. A. (2007). Sport marketing, 3rd ed., Champaign, IL: Human Kinetics.
Nunnally, J. C. (1978). Psychometric theory. New York, NY: McGraw Hill.
Palvia, P. (2009). The role of trust in e-commerce relational exchange: A unified model. Information & Management, 46(4), 213-220.

Online Purchase Intentions
60
Pavlou, P. A. (2003). Consumer acceptance of electronic commerce: Integrating trust and risk with the technology acceptance model. International Journal of Electronic Commerce, 7(3), 101-134.
Pavlou, P. A., & Fygenson, M. (2006). Understanding and predicting electronic commerce adoption: An extension of the theory of planned behavior. MIS Quarterly, 30(1), 115-143.
Porter, C. E., & Donthu, N. (2006). Using the technology acceptance model to explain how attitudes determine Internet usage: The role of perceived access barriers and demographics. Journal of Business Research, 59(9), 999-1007.
Porter, L. W., & Lawler, E. E. (1968). Managerial attitudes and performance. Homewood, IL: RD Irwin.
Rios, R. E., & Riquelme, H. E. (2010). Sources of brand equity for online companies. Journal of Research in Interactive Marketing, 4(3), 214-240.
Saadé, R., & Bahli, B. (2005). The impact of cognitive absorption on perceived usefulness and perceived ease of use in on-line learning: an extension of the technology acceptance model. Information & Management, 42(2), 317-327.
Schlosser, A. E., White, T. B., & Lloyd, S. M. (2006). Converting website visitors into buyers: How website investment increases consumer trusting beliefs and online purchase intentions. Journal of Marketing, 70(2), 133-148.
Seo, W. J., & Green, C. (2008). Development of the motivation scale for sport online consumption. Journal of Sport Management, 22(1), 82-109.
Suh, B., & Han, I. (2002). Effect of trust on customer acceptance of Internet banking. Electronic Commerce Research and Applications, 1(3-4), 247-263.
Teo, T. S. H., Lim, V. K. G., & Lai, R. Y. C. (1999). Intrinsic and extrinsic motivation in Internet usage. Omega, 27(1), 25-37.
Teo, T. S. H., & Liu, J. (2007). Consumer trust in e-commerce in the United States, Singapore, and China. Omega, 35(1), 22-38.

Yoo & Ross
61
Tsuji, Y., Bennett, G., & Leigh, J. H. (2009). Investigating factors affecting brand awareness of virtual advertising. Journal of Sport Management, 23(4), 511-544.
U.S. Census Bureau (2011). http://www.census.gov/econ/estats/ Van der Heijden, H. (2003). Factors influencing the usage of
websites: The case of a generic portal in the Netherlands. Information & Management, 40(6), 541-549.
Van der Heijden, H., Verhagen, T. V., & Creemers, M. (2003). Understanding online purchase intentions: Contributions from technology and trust perspectives. European Journal of Information Systems, 12(1), 41-48.
Venkatesh, V. (2000). Determinants of perceived ease of use: Integrating control, intrinsic motivation, and emotion into the technology acceptance model. Information Systems Research, 11(4), 342-365.
Venkatesh, V., & Bala, H. (2008). Technology acceptance model 3 and a research agenda on interventions. Decision Sciences, 39(2), 273-315.
Venkatesh, V., & Davis, F. D. (2000). A theoretical extension of the technology acceptance model: Four longitudinal field studies. Management Science, 46(2), 186-204.
Vijayasarathy, L. R. (2002). Product characteristics and Internet shopping intentions. Internet Research, 12(5), 411-426.
Wu, J., & Wang, S. (2005). What drives mobile commerce? An empirical evaluation of the revised technology acceptance model. Information & Management, 42(5), 719-729.
Yang, H., & Yoo, Y. (2004). It’s all about attitude: revisiting the technology acceptance model. Decision Support Systems, 38(1), 19-31.
Yoon, S. J. (2002). The antecedents and consequences of trust in online-purchase decisions. Journal of Interactive Marketing,16(2), 47-63.
Zhang, Z., & Won, D. (2009). The effects of trust in Internet shopping on sport consumers’ intentions of purchasing sport product on the Internet. International Journal of Sport Management and Marketing, 6(1), 87-105.

Online Purchase Intentions
62
Zhang, Z., & Won, D. (2010). Buyer or browser? An analysis of sports fan behavior online. International Journal of Sports Marketing & Sponsorship, 11(2), 124-139.

Achievement Goal Orientation
63
The Journal of SPORT, 2014, 3(1), 63-101 © Kent State University
Achievement Goal Orientation as a Predictor of Sport Involvement and Perceived Benefits of Sport Involvement:
Examination of a Mixture Model
Leeann M. Lower The Ohio State University
Brian A. Turner
The Ohio State University
Jeffrey C. Petersen Baylor University
Abstract
Grounded in the dichotomous achievement goal framework, this
study examined the utility of achievement goal orientations to predict sport involvement and perceived benefits (social, intellectual, and fitness) associated with participation in three college recreational sport programs: group fitness, intramural sport, and sport clubs. A questionnaire, based on the Task and Ego Orientation in Sport Questionnaire (TEOSQ) and Quality and Importance of Recreational Services (QIRS) perceived benefit scale, was administered to recreational sport participants (n = 1,564) at a single institution. A mixture model was proposed and tested, for which task orientation was found to positively predict sport involvement and perceived benefits of involvement, while ego orientation only predicted sport involvement. Sport involvement was found to positively predict perceived benefits of involvement. Implications for sport practitioners include task goal orientation enhancement within sport offerings and increased involvement opportunities, while theoretical implications can guide future achievement goal research within the sport domain.

Lower, Turner & Petersen
64
Sport is a type of achievement activity that has received considerable attention in management and psychology literature. Theoretical and empirical investigation of the achievement goal construct emerged from a desire to account for achievement behavior and help guide individuals to adopt optimal motivation in achievement settings (Elliot, 2005). The achievement goal construct is considered among the strongest predictors of achievement-related behavior and outcomes (Elliot & McGregor, 2001; Moller & Elliot, 2005). Research examining the predictive relationship between achievement goal orientations, behaviors, and outcomes can guide effective program structuring and interventions facilitated by sport practitioners to influence participant dispositions in order to produce positive behaviors and outcomes. The purpose of this study was to examine a structural model incorporating achievement goal orientations, recreational sport involvement (i.e., achievement behavior), and perceived benefits of recreational sport involvement (i.e., achievement outcome). Such assessment can advance achievement goal theory and involvement theory by gaining a better understanding of the antecedents and consequences of achievement goal orientations and sport involvement. In addition to furthering the body of knowledge, the findings of this study can be used to shed light on optimal dispositions within sport which can help practitioners produce improved participant outcomes through sport programs.
Review of Literature
Recreational Sport Recreational sport is one of many conduits of extracurricular
activities available on most American college campuses. The recreational sport programs that the current study examined include group fitness, intramural sports, and sport clubs. Group fitness programs typically operate in a system of classes through which trained student instructors facilitate physical exercises. The dynamic structure of group fitness enables the program to meet the interests of a diverse population, emphasizing effort and personal achievement. Intramural sports emerged through student initiated

Achievement Goal Orientation
65
athletic competitions, prior to the establishment of varsity athletics on college campuses (Bourgeois et al., 1995; Staurowsky & Abney, 2011). The purpose of intramural sport is to provide an avenue for a wider cross-section of students to participate in competitive games with students enrolled at the same university. “The role of sports club programs has changed from providing the foundation and development for varsity athletic programs to becoming an important recreation program alternative” (Cooney, 1979, p. 40). Sport clubs are designed to be an opportunity for students to participate in competitive sport outside the confines of their own institution, in which club members organize and host the competitions.
Involvement with recreational sport on college campuses has been associated with learning outcomes, student development, and additional beneficial outcomes (NIRSA/NASPA Consortium, 2010; Haines & Fortman, 2008; The Ohio State University, 2003). While recreational sport assessment often focuses on positive outcomes, achievement goal literature considers both positive and negative outcomes, such as persistence, effectiveness, and anxiety (Elliot, 2005; Hendricks & Payne, 2007; Roberts, Treasure, & Balague, 1998). Perceived benefits of sport participation were selected as the achievement-related outcome measure due to the secondary purpose of this study which aimed at examining the value of sport programs. Perceived Benefits of Involvement
In an effort to understand the potential gains of sport programs, investigators have developed instruments for the purpose of measuring outcomes of program participation, such as perceived benefits. The literature emphasizes three benefit subgroups associated with physical activity programs: intellectual, social, and fitness benefits (Artinger et al., 2006; Haines, & Fortman, 2008; NIRSA, 2004). Perceived benefits are typically assessed through scales measuring one’s perception of gains realized through participation. Several instruments have been developed to assess perceived benefits of recreational sport involvement, including: Exercise Benefits/Barriers Scale (EBBS), Measuring Outcomes from

Lower, Turner & Petersen
66
Recsports Experiences (MORE), and Quality and Importance of Recreational Services (QIRS) perceived benefit scale.
The QIRS survey, developed by the National Intramural-Recreational Sport Association (NIRSA), is of primary importance to this study; its saliency within recreational sport literature has been demonstrated (NIRSA, 2000). The perceived benefit scale is a component within the QIRS survey which focuses on assessing perceived benefits associated with recreational sport involvement. The perceived benefits scale was selected for the purpose of this study based upon its focus on the dominant benefit subgroups and brevity. Involvement
Within sport literature, involvement is typically synonymous with participation. However there are varying types of participation that must be considered (e.g., coach, player, spectator, employee) when deciphering involvement. Theoretical frameworks have been developed to offer foundational perspectives from which to interpret the construct. Within Astin’s theory (1999), involvement refers to the time and energy spent participating in an academic or extra-curricular experience, incorporating both a quantitative and qualitative component (Astin, 1999; Kuh, 1991). Quantitative involvement pertains to the amount of time spent participating in an activity while qualitative involvement emphasizes degree of effort or energy expended. Within the literature, quantitative involvement is more frequently utilized than qualitative involvement likely due to its objective nature which allows for ease of measurement.
For the purpose of this study, involvement focused on quantity of time spent participating as opposed to qualitative involvement. Involvement was selected as a measure of achievement-related behavior to facilitate the investigation of the hypothesized relationship between the achievement goal construct and achievement-related behavior. The construct was also selected based upon empirical research which has found involvement associated with cognitive, affective, and overall student development, which closely aligns with the perceived benefit groups

Achievement Goal Orientation
67
of interest within this current study (Astin, 1999; Hall, 2006; Lindsey & Sessoms, 2006). Achievement Goal Theory
The achievement goal construct emerged in the 1970s through the independent and collaborative efforts of Ames, Dweck, Maehr, and Nicholls (Roberts, 2001; Elliot, 2005). Achievement goal theory stems from a social cognitive perspective of attribution (LeUnes, 2008). Attribution theory is a prominent motivational model that examines the underlying causes of an individual’s behavior. Motivation can be defined by the constructs that “energize, direct, and regulate achievement behavior”, where achievement refers to the attainment of an achievement goal (Roberts, Treasure, & Conroy, 2007, p. 3). Achievement goal theory assumes that achievement goals guide (i.e., motivate) achievement-related behavior and reflect anticipated outcomes of this behavior (Roberts et al., 2007). Achievement goals often constitute the purpose of task engagement (Elliot, 1999). A social cognitive approach to motivation assumes that individuals actively engage in making decisions regarding their achievement behavior, which reflects the achievement goal construct (Roberts, 2001; Roberts et al., 2007). Achievement itself is a construct subjectively defined; success or failure of attaining an achievement goal is based upon an individual’s subjective assessment of the outcome.
Competency and valence are two fundamental elements within the achievement goal theory. Nicholls (1984) proposed that two primary conceptions of ability manifest in achievement contexts – undifferentiated and differentiated concepts of ability, which delineate how competency is defined. The two conceptions of ability represent different criteria for assessing one’s ability. An undifferentiated concept of ability associates ability with effort, therefore the more effort one expends, the greater learning (indication of ability) one achieves – linking effort and perceived ability. While the undifferentiated approach associates ability and effort, the differentiated concept of ability differentiates between ability and effort, for which ability is perceived as capacity. By

Lower, Turner & Petersen
68
differentiating ability and effort, one might learn through effort yet fail to demonstrate high ability. The two conceptions of ability constitute the source of criteria used to assess success and failure (Roberts et al., 2007). Three standards have been utilized in competence evaluation – absolute, intrapersonal, and normative. An undifferentiated concept of ability assesses ability through personal improvement (intrapersonal evaluation) or mastery (absolute evaluation). A differentiated concept of ability assesses ability through interpersonal comparison of effort and ability, for which success is associated with outperforming others (normative evaluation). Nicholls labeled the adoption of an undifferentiated concept of ability as task involvement and the adoption of a differentiated concept of ability as ego involvement. Ames and Archer (1988) identified terminology used synonymously with task and ego goals within achievement goal literature (e.g., task: learning, mastery; ego: performance, ability) and recommended the terms ‘mastery’ and ‘performance’ goals; however, some researchers have continued to use Nicholls’ original task-ego labels (Elliot, 2005). For the purpose of this study, achievement goals will be labeled ‘task’ and ‘ego’.
Achievement goal theorists have hypothesized an association between task goals and positive, adaptive processes and outcomes (e.g., enhanced task enjoyment, effort in the face of difficulty) and between ego goals and negative, maladaptive processes and outcomes (e.g., reduced persistence in the face of difficulty, avoiding challenge; Elliot, 1999, 2005; Roberts et al., 1998). When considering achievement goals characterized by how competency is defined (i.e., task and ego goals), research has demonstrated relatively consistent findings regarding the consequences of task goals (positive), yet inconsistent findings regarding the consequences of ego goals (positive, neutral, negative; Elliot, 2005; Roberts, Treasure, & Kavussanu, 1996). The inconsistent results fail to support the original hypothesized relationship between ego goals and negative processes and outcomes. Researchers have considered the capacity of task goals to moderate the potentially negative effects of ego goals to explain the inconsistencies in the literature (Roberts
Achievement Goal Orientation
69
et al., 1996). Other researchers have incorporated an approach-avoidance motivation distinction to help explain the varied results (Elliot, 1999).
Approach and avoidance motivation are considered a function of valence. Competence is valenced in that it is conceptualized as either a positive possibility (i.e., competency, success) or negative possibility (i.e., incompetency, failure); these conceptions have been linked with approach and avoidance tendencies (Elliot & Covington, 2001; Lang, 1995). The approach-avoidance distinction was incorporated in the first formal model of achievement motivation (Lewin, Dembo, Festinger, & Sears, 1944). With the emergence of the achievement goal construct in the 1970s and 80s, the approach-avoidance distinction was overlooked. Dweck and Nicholls maintained a contemporary conceptualizing of achievement goals, focusing on how competency is defined. Dweck considered achievement goals to be omnibus constructs that included a combination of approach-avoidance tendencies, while Nicholls characterized both achievement goals (task and ego) as approach-oriented (Elliot, 1999). In the 1990s, Elliot and colleagues returned to the incorporation of the approach-avoidance distinction to address inconsistent findings associated with use of the dichotomous conceptual framework and extend achievement goal theory (Adie, Duda, & Ntoumanis, 2008; Elliot, 1999; Roberts et al., 2007). Achievement Goal Models
Dichotomous model. The contemporary achievement goal approach is conceptualized as dichotomous or orthogonal. Dweck and Nicholls are primarily recognized for the development and utilization of this dichotomous approach (Dweck & Leggett, 1988; Nicholls, 1989). Dweck and Leggett (1988) conducted their theory of intelligence, involving achievement goals, as a dichotomous variable, regarding the construct as omnibus with both approach and avoidance tendencies. Although Nicholls (1984) defined achievement behavior as demonstrating high ability or avoiding demonstrating low ability, he later proposed orthogonal goal orientations characterized as approach-oriented (Duda, 2005; Elliot,

Lower, Turner & Petersen
70
2005; Roberts et al., 1996). The orthogonal viewpoint perceives goal orientations as independent, in which one can possibly have both dispositions at the same time (Roberts et al., 1996). The orthogonal interpretation of achievement goals has been empirically supported (Roberts et al., 1996); however, with the construct having theoretically evolved towards the inclusion of the approach-avoidance distinction, the conceptualization has followed the dichotomous (i.e., divided) structure.
The dichotomous achievement goal approach was selected for the purpose of this study based upon the following rationale. The task-ego (i.e., mastery-performance) structure is recognized as having simple and straightforward features and has gained widespread attention in the literature (Elliot & McGregor, 2001). The approach-avoidance distinction has yielded inconsistent results. Past research has collapsed approach-avoidance motivation suggesting similarities between the constructs, while more recent research supports the distinction (Duda, 2005; Elliot, Murayama, & Pekrun, 2011). Research investigating the predictive utility of the 2x2 framework was suggested to be parsimonious in 2008 (Adie et al., 2008), and the 3x2 approach was just introduced in 2011 (Elliot, Murayama, & Pekrun, 2011). Overall, the dichotomous approach was selected because of its simplistic, adaptable nature and widespread usage, as well as due to the changing developments in regards to the valence dimension.
Alternative models. Elliot and Harackiewicz (1996) expanded the dichotomous framework by incorporating the approach-avoidance distinction within the performance (i.e., ‘ego’) goal, resulting in a trichotomous framework. Later, Elliot concluded that the trichotomous framework was designed to only consider positive mastery possibilities (associated with an approach orientation) (Elliot, 2005), therefore Elliot and McGregor (2001) expanded the trichotomous framework by incorporating the approach-avoidance distinction within the mastery (i.e., ‘task’) goal, creating a 2x2 framework. The 2x2 framework was expanded to the most recent achievement goal approach (3x2) by Elliot, Murayama, and Pekrun (2011). Elliot and colleagues suggest the division of

Achievement Goal Orientation
71
task-based and self-based goals based upon the possibility of pursuing these goals independently. Within the 3x2 framework, the authors define competency by three types of achievement goals (task, self, other), while maintaining the approach-avoidance distinction. Goal Orientation
A state of goal involvement (task or ego) depends on one’s dispositional goal orientation and situational factors (e.g., perceived motivational climate; Roberts, 2001). Goal orientation reflects an individual’s predisposition towards task or ego goal involvement (Roberts et al., 2007). Goal orientation is not a personal trait, rather a cognitive schema that may be subject to change, such as through socialization. Scholars have demonstrated the relative stability of goal orientations over time but suggest a malleable quality in that goal orientations may be impacted by situational factors (Ames, 1992; Duda & Whitehead, 1998; Sage, & Kavussanu, 2008).
To measure an individual’s predisposition in achievement contexts, researchers have developed questionnaires incorporating criteria one might associate with success (i.e., demonstrating competence, avoiding the demonstration of incompetence). The questionnaires assess one’s perception of the evaluation criteria in order to estimate one’s disposition. The Task and Ego Orientations in Sport Questionnaire (TEOSQ; Duda, 1989; Duda, 1998; Roberts et al.,1998) was selected for the purpose of this study based upon its prominence throughout goal orientation literature and dichotomous framework (Biddle, Want, Kavussanu, & Spray, 2003). A state of goal involvement (task or ego) depends on one’s dispositional goal orientation and situational factors (e.g., perceived motivational climate; Roberts, 2001). Goal orientation reflects an individual’s predisposition towards task or ego goal involvement (Roberts et al., 2007). Goal orientation is not a personal trait, rather a cognitive schema that may be subject to change, such as through socialization. Scholars have demonstrated the relative stability of goal orientations over time but suggest a malleable quality in that goal orientations

Lower, Turner & Petersen
72
may be impacted by situational factors (Ames, 1992; Duda & Whitehead, 1998; Sage, & Kavussanu, 2008).
To measure an individual’s predisposition in achievement contexts, researchers have developed questionnaires incorporating criteria one might associate with success (i.e., demonstrating competence, avoiding the demonstration of incompetence). The questionnaires assess one’s perception of the evaluation criteria in order to estimate one’s disposition. The Perception of Success Questionnaire and Task and Ego Orientations in Sport Questionnaire (TEOSQ) are prominent instruments that adopt the dichotomous framework with an orthogonal perspective.
The TEOSQ emerged from the Achievement Motivation Scale (i.e., Motivational Orientation Scale) developed by Nicholls and colleagues (Nicholls, Patashnick, & Nolen, 1985). Nicholls and Duda modified the Achievement Motivation Scale for the sport domain and utilized conceptual definitions of achievement goal orientations for the development of the TEOSQ (Duda, 1989; Duda, 1998; Roberts et al.,1998). The TEOSQ has been used in a multitude of studies to measure dispositional goal orientations (Biddle, Want, Kavussanu, & Spray, 2003).
A systematic review of research by Biddle et al., (2003), investigated the correlates of dispositional goal orientations. The review was limited to studies that used either the TEOSQ or the POSQ in the sport and physical activity domains and were published between 1990 and 2000. The systematic review analyzed 98 studies of which 80.6% used the TEOSQ to measure dispositional goal orientations. Based upon the prominence of the instrument throughout goal orientation literature, this study employed the TEOSQ to measure dispositional goal orientations. Integration of Constructs
The achievement goal theory stems from a social cognitive perspective of attribution (LeUnes, 2008). Social cognitive theory suggests that personal factors, environmental factors, and behavior are reciprocal determinants of each other (Dishman & Chambliss, 2010). Within this study, the personal factor examined was goal

Achievement Goal Orientation
73
orientation while behavior was represented by degree of recreational sport involvement. Achievement goal literature considers the achievement goal construct one of the strongest predictors of achievement-related behavior and outcomes (Elliot & McGregor, 2001; Moller & Elliot, 2006). For the purpose of this study, perceived benefits of recreational sport participation represented achievement-related outcomes. The link between achievement goals and achievement-related behavior and outcomes is motivation - the underlying causes of an individual’s behavior and expected outcomes of that behavior.
Past achievement goal theorists have suggested task goals to be associated with positive, adaptive processes and outcomes and ego goals to be associated with negative, maladaptive processes and outcomes (Elliot, 1999, 2005; Roberts et al., 1998). A task orientation has received greater support because evaluation of one’s success is within the individual’s control. Literature has often suggested the depression of an ego orientation based upon past empirical studies which have linked ego orientation with negative behaviors and outcomes. An ego oriented individual is not able to control the likelihood of success because he/she cannot control the performance of others, which is why maladaptive achievement behaviors are often exhibited when challenges arise (Roberts et al., 1998).Empirical studies have demonstrated relatively consistent findings regarding the consequences of task goals (positive), yet inconsistent findings regarding the consequences of ego goals (positive, neutral, negative; Elliot, 2005; Roberts et al., 1996). Roberts et al., (1996) suggest that the potential negative behaviors and outcomes associated with an ego orientation can be moderated by enhancing an individual’s task orientation. Further investigation is needed to confirm the type of consequences associated with a task goal orientation and illuminate the inconsistency with the ego goal orientation construct. In regards to the relationship between achievement goal orientations and achievement-related behaviors and outcomes, it was hypothesized that achievement goals will directly predict sport involvement and indirectly predict perceived benefits of sport involvement.

Lower, Turner & Petersen
74
Astin (1999) postulates a positive direct relationship between involvement and student development; empirical research has also found involvement associated with cognitive, affective, and overall student development. The student development outcome closely aligns with the perceived benefit outcomes investigated within this current study (Astin, 1999; Hall, 2006; Lindsey & Sessoms, 2006), therefore it was hypothesized that sport involvement will positively predict perceived benefits of sport involvement. A structural model (Figure 1) integrating the achievement goal orientation (i.e., task and ego), recreational sport involvement, and perceived benefits of recreational sport variables was proposed and tested.
Involvement
Quantitative Involvement
Social Benefits
Intellectual Benefits
Fitness Benefits
Perceived Benefits
Task Orientation
Ego Orientation
Figure 1 Path diagram for proposed structural model

Achievement Goal Orientation
75
Methods
Participants The study was conducted at a mid-sized, post-secondary
institution in the Southwestern United States. The target population included participants involved in one of three recreational sport programs on campus: group fitness, intramural sports, and sport clubs. The sampling frame consisted of 6,467 subjects. A non-probability, convenience sampling technique was utilized. A total of 1,881 subjects participated in the study; after eliminating duplicate questionnaires, incomplete cases, and cases constituted as outliers (based upon recreational sport involvement), the sample size comprised 1,564 subjects. Instrumentation
The research instrument included a total of 44 items organized within three primary sections: demographics (6 items), a modified version of the TEOSQ (12 items), and a modified version of the QIRS survey (22 items). The demographic section included data regarding: recreational sport involvement, gender, age, academic year, and ethnic group. Quantitative involvement in recreational sport was measured by minutes of participation per week for each of the three recreational sport program areas (i.e., group fitness, intramural sports, and sport clubs).
The TEOSQ was used to determine the achievement goal orientation of the subjects. The instrument was designed to assess an individual’s proneness for task and ego involvement (Duda, 1998). The TEOSQ uses a 5-point Likert scale ranging from 1 (strongly disagree) to 5 (strongly agree). For the purpose of this study, the questionnaire was modified to 12 items (six ego orientation items, six task orientation items). The modification allowed for each domain to be represented equally.
Validity and reliability of the TEOSQ instrument was established by Duda (1998). Reliability was established by test-retest and internal consistency. Test-retest resulted in an r = .68 and r = .75 after a three week period respectively, indicating that the instrument

Lower, Turner & Petersen
76
measured dispositional proneness consistently over time. Over 56 studies were used to measure internal consistency of the TEOSQ instrument, resulting in Cronbach’s alpha coefficients of α = .79 and α = .81 for the task and ego orientation scales respectively, representing an acceptable internal consistency. Validity of the TEOSQ was established by factorial validity, concurrent validity, and predictive validity. “Investigations employing exploratory factor analysis … have continuously found support for the predominant two-dimensional structure of the TEOSQ” (Duda, 1998, p. 24). Duda (1998) administered the task and ego orientation sport scales and the Motivation Orientation Scales to examine the concurrent validity of the TEOSQ. The study resulted in an r = .67 and r = .62 respectively between the two scales, a strong positive correlation.
The QIRS perceived benefit scale measured the subjects’ perception of the gains associated with their recreational sport involvement. The 22 item perceived benefit scale was modified to a 4- point Likert-type scale ranging from 1 (no benefit) to 4 (great benefit) for clarity and brevity within this tool. Reliability of the scale was implied by its psychometric properties (Forrester & Beggs, 2005). Forrester and Beggs (2005) established construct validity of the perceived benefits scale through principal component analysis and confirmatory factor analysis. Results from the principal component analysis found the three subgroups: social, intellectual, and fitness, to account for 68.59 percent of the variance, while the confirmatory factor analysis indicated a good fit (RMSEA: .09; NFI: .98; CFI: .98). The structure of the scale, however, has been found to vary across empirical studies (Forrester & Beggs, 2005; Lower, Turner, & Petersen, 2013). Procedures
An online survey tool (Qualtrics) was used to host the online survey instrument and collect questionnaire responses. The consent form and link to the online questionnaire was emailed to the sampling frame. To collect additional responses, the principal investigator attended recreational sport program classes, meetings, and competitions to administer the hard copy survey instrument.

Achievement Goal Orientation
77
Following the completion of data collection, responses to the hard copy instrument were manually entered into Qualtrics to coalesce with the online responses. Statistical Analysis
Statistical analysis of the data included: descriptive statistics, factor analyses, reliabilities, and structural equation modeling. The data was imported into SPSS Statistics 19 software to treat the data. The pattern of missing data was analyzed to determine the extent of missing data, for which multiple imputation with fully conditional specification was employed to treat the data to reduce the number of incomplete cases. Once missing data was treated, SPSS was used to produce a covariance matrix of the 12 achievement goal orientation variables which was then inputted to LISREL 9.0 software to conduct confirmatory factor analysis and test the theoretical dichotomous measurement model. To assess the factor loadings, the observed t-values of the paths in the model were compared against the critical value of t for a two-tailed test at a α < .05 level of significance. The global fit indices were evaluated once the statistical significance of the parameter estimates was determined. The fit of the measurement model was assessed through the following five indices: chi-square (χ2), root-mean-square error of approximation (RMSEA), goodness-of-fit index (GFI), comparative fit index (CFI), and standardized root-mean square residual (SRMR). Criterion associated with an acceptable model fit, in regards to the five indices selected, include: a nonstatistically significant χ2, a RMSEA less than .100, a GFI and CFI greater than .90 or .95, and a SRMR less than .05 (Schumacker & Lomax, 2010). Statistical significance was set at α < .05 for all analyses, a commonly accepted probability level in the behavioral sciences (Ary, Jacobs, & Sorensen, 2010). If the majority of fit indices indicated an acceptable model fit and there were no theoretically justifiable modification suggestions, the measurement model was considered to be theoretically and empirically supported. Following confirmatory factor analysis, reliability was calculated for each confirmed factor. For which constructs with a Cronbach’s alpha of .70 or greater were

Lower, Turner & Petersen
78
considered to be reliable based upon the .70 standard set by Hair et al. (1998). Once the structure of the measurement model was confirmed and the reliability of the factors assessed, the data was reduced from 12 items to two factors by creating a mean task orientation variable and mean ego orientation variable based on the factor loadings.
Principal component analysis was conducted to examine the factor structure of the QIRS perceived benefit scale, for which any factor with an eigenvalue greater than 1.0 was retained (Stevens, 2009). Varimax and oblimin rotation were both employed to determine which rotation method was appropriate for the perceived benefit data based on the correlations among the factors. Each item’s factor loading was examined for which any loading greater than .60 was deemed acceptable and maintained (Hair, Anderson, Tathan, & Black, 1998); all items with factor loadings less than the .60 standard were removed. Any items with factor loadings that loaded similarly across multiple factors were assessed based on theory and past studies utilizing the scale to determine which factor to group the item with. Items found to load appropriately were grouped and then the reliability was calculated for each extracted factor, utilizing the .70 standard previously noted. Once the structure of the perceived benefit scale was determined, the data was reduced from 22 items to three factors by creating a mean social perceived benefits score, mean fitness perceived benefit score, and mean intellectual perceived benefit score based on the factor loadings.
A total quantitative recreational sport involvement variable was created by summing the subjects’ recreational sport involvement in each of the three recreational sport program areas. In addition to performing data reduction techniques, normality was assessed through skewness and kurtosis of the created variables (i.e., task orientation, ego orientation, social perceived benefits, fitness perceived benefits, intellectual perceived benefits, and quantitative involvement). The normality assumption was considered to be met if the skewness and kurtosis statistics fell with the accepted range per Kendall and Stuart’s (1958) standards (i.e., skewness: +2.00 to -2.00; kurtosis: +5.00 to -5.00).

Achievement Goal Orientation
79
Upon completing descriptive statistics, factor analyses, and reliabilities, SEM analyses were conducted, for which a polyserial correlation matrix was inputted into LISREL 8.8 software and the model relationships and parameters were specified. The observed t-values for the individual paths in the mixture model were compared to the critical t-value previously noted to assess the model. Once statistical significance of the parameter estimates was examined, the fit of the proposed model was assessed through the global fit indices previously noted. Upon considering model modification suggestions, the asymptotic covariance matrix was added to generate robust statistics. The model was considered to be theoretically and empirically supported if there were no theoretically justifiable modification suggestions and the majority of fit indices indicated a good fitting model.
Results Data The sample consisted of a total of 1,881 recreational sport participants from a mid-sized institution. The pattern of missing data was analyzed in SPSS, which revealed that 37% (n = 696) of the cases had missing data, accounting for approximately 12.63% of the total values. Multiple imputation with fully conditional specification was conducted to treat the data and reduce the number of cases with missing data. The multiple imputation resulted in 1,639 complete cases, transforming 454 of the incomplete cases. The number of eligible, complete cases was reduced from 1,639 to 1,564 based upon constraints placed on the total quantitative involvement variable. The involvement variable was constrained to greater than zero minutes and less than or equal to 1200 minutes for the purpose of this study. Involvement was fixed to be greater than zero minutes per week based upon the assertion that a subject must have contributed greater than zero minutes of sport involvement to experience benefits from that involvement. The variable was constrained to less than or equal to 1200 minutes (i.e., 20 hours) of recreational sport involvement per week as only .4% of the sample reported greater than 1200 minutes of involvement, skewing the

Lower, Turner & Petersen
80
results, and student employment with the recreational sport department only allows for up to 20 hours of work per week. The resulting sample size used for all analyses comprised 1,564 cases. Sample
The respondents consisted of 49% male (n = 763) and 45% female (n = 709), with 92 respondents missing gender data. The vast majority of respondents (88%) ranged 18 to 22 years of age. The results indicated a representative academic class distribution with 18% freshmen respondents, 21% sophomore respondents, 21% junior respondents, 22% senior respondents, 8% graduate respondents, and 5% non-student respondents, with 96 respondents missing data. The sample was predominately Caucasian (74%); 8% of respondents were Hispanic; 5% African-American, 4% Asian, 1% Native American, and 2% classified as ‘other’, with 100 respondents missing data. Confirmatory Factor Analysis The TEOSQ is designed to measure achievement goal orientations within the sport domain, with a dichotomous achievement goal framework. The dichotomous measurement model was tested through confirmatory factor analysis to confirm or disconfirm the factor loadings in order to inform data reduction. The 12 goal items (Table 1) were hypothesized to load onto two factors (i.e., task goal orientation, ego goal orientation) based upon the theoretical dichotomous achievement goal model.

Achievement Goal Orientation
81
Table 1 Proposed factor loadings for dichotomous achievement goal measurement model Observed Variables Variable Items Paths
Goal 1 I'm the only one who can do the play or skill Goal 1 → Ego
Goal 2 I learn a new skill and it makes me want to practice more Goal 2 → Task
Goal 3 I can do better than my friends Goal 3 → Ego Goal 4 The others can't do as well as me Goal 4 → Ego Goal 5 I learn something that is fun to do Goal 5 → Task Goal 6 Others mess up and I don't Goal 6 → Ego Goal 7 I learn a new skill by trying hard Goal 7 → Task Goal 8 I score the most points/goals/hits, etc. Goal 8 → Ego
Goal 9 Something I learn makes me want to go and practice more Goal 9 → Task
Goal 10 I'm the best Goal 10 → Ego Goal 11 A skill I learn really feels right Goal 11 → Task Goal 12 I do my very best Goal 12 → Task Note. The following abbreviations were applied: Task: Task Orientation; Ego: Ego Orientation. A covariance matrix of the achievement goal orientation items was produced in SPSS and then inputted into LISREL 9.0 for confirmatory factor analysis. The largest factor loading for each factor was fixed to 1.0 and the factors were allowed to correlate. The objective of the analysis was to determine which factor loadings produced the best fitting model. The global fit indices for the dichotomous model [χ2(53) = 645, p < .001; RMSEA: .085; GFI: .933; CFI: .951; SRMR: .056] suggest a good fitting model as the majority of the fit indices upheld the standards previously noted (i.e., RMSEA < .100, GFI > .90, CFI > .95). Confirmatory factor analysis found all factor loadings significant at the α < .05 level of significance. The largest standardized residuals were associated with observed variables which loaded onto the same factor; the residuals

Lower, Turner & Petersen
82
did not suggest a modification involving the factor loadings. The MI and EPC statistics were examined, for which Goal 11 was suggested to load onto the ego factor rather than the task factor. However, the R2 for Goal 11(.419) suggests that the observed variable explains a moderate amount of the variance in task orientation. The other modification suggestions were either not theoretically justifiable or focused on adding error covariances (which was not the objective of the confirmatory factor analysis). The dichotomous measurement model was modified to incorporate the path from Goal 11 to ego orientation to examine if the fit of the model improved. The modification was found to deteriorate the fit of the model [χ2(53) = 1233.15, p < .001; RMSEA: .119; GFI: .890; CFI: .912; SRMR: .118]. Therefore, the modification was not maintained and the proposed dichotomous measurement model (Figure 2) was upheld.

Achievement Goal Orientation
83
Figure 2 Path diagram for proposed dichotomous achievement goal measurement model with standardized solutions
Note. The fixed factors are denoted by 'F'. * p < .001.
.13
.80F
.72*
.72*
.76*
69*
.65*
.56*
.65*
.80F
.71*
.69*
.76*
Task Orientation
Ego Orientation
Goal 2
Goal 5
Goal 7
Goal 9
Goal 11
Goal 12
Goal 1
Goal 3
Goal 4
Goal 6
Goal 8
Goal 10
.4
.5
.4
.3
.5
.6
.5
.5
.4
.4
.4
.3

Lower, Turner & Petersen
84
Once the factor structure of the dichotomous achievement
goal model was confirmed, reliability statistics were conducted for each factor. Cronbach’s alpha coefficients for both factors (task α = .849; ego α = .869) suggested high reliability based on Hair et al.’s (1998) .70 standard previously noted. The data was then reduced from 12 goal items to two goal orientation measures of central tendency. A mean task goal orientation and mean ego goal orientation was calculated for each subject based on the confirmed factors and factor loadings. Principal Component Analysis The QIRS perceived benefit scale was designed to measure perceived benefits of recreational sport involvement, with a three factor structure. The perceived benefit items have not loaded consistently in past empirical studies, therefore principal component analysis was conducted to explore the factor structure of the scale. Principal component analysis was run with both a varimax rotation and oblimin rotation to determine which rotation method was most appropriate. The correlations found among the factors ranged from .311 to .441 suggesting non-orthogonal factors; therefore oblimin rotation was selected for the analysis. Results of the analysis can be viewed in Table 2. The three extracted factors (based on an eigenvalue greater than 1.0) were found to account for 57.3% of the variance cumulatively, for which the first component (i.e., social perceived benefits) accounted for 41.1%. The ‘sports skills’ perceived benefit item did not meet the .60 factor loading standard previously noted; as a result the item was eliminated from future analyses. The ‘defining problems’ and ‘problem-solving skills’ perceived benefit items loaded similarly onto multiple components, requiring theoretical justification for the factor loadings. Both items have loaded onto the intellectual factor in previous empirical research and therefore were selected to load onto the intellectual factor for the subsequent analyses of the current study.

Achievement Goal Orientation
85
Table 2
Principal component analysis with oblimin rotation for perceived benefit items Component Perceived Benefit Items Social Fitness Intellectual Sense of adventure 0.601 0.459 0.391 Group cooperation skills 0.797 0.325 0.305 Respect for others 0.750 0.401 0.378 Communication skills 0.795 0.294 0.406 Belonging/association 0.751 0.464 0.254 Leadership skills 0.757 0.303 0.456 Developing friendships 0.697 0.401 0.255 Sports skills 0.579* 0.536 0.310 Improved self-confidence 0.531 0.662 0.350 Feeling of physical well-being 0.442 0.760 0.125 Sense of accomplishment 0.523 0.702 0.199 Weight control 0.252 0.722 0.401 Fitness 0.324 0.794 0.160 Physical strength 0.329 0.768 0.347 Stress reduction 0.272 0.653 0.236 Balance/coordination 0.413 0.707 0.390 Defining problems 0.654 0.277 0.690 Problem-solving skills 0.703 0.287 0.659 Study habits 0.300 0.359 0.756 Time-management skills 0.456 0.507 0.666 Understanding written information 0.442 0.283 0.830 Handling several tasks at once 0.560 0.397 0.693 Note. Factor loadings > .60 are in boldface. * Item fell below the .60 threshold and was removed.

Lower, Turner & Petersen
86
Reliability analyses were conducted for the three extracted factors, for which Cronbach’s alphas suggested high reliability for all factors (social α = .869; fitness α = .872; intellectual α = .857) based on the .70 standard previously noted. The data was then reduced from 22 perceived benefit items to three measures of perceived benefits based on central tendency. A mean social perceived benefit, fitness perceived benefit, and intellectual perceived benefit score was calculated for each subject based on the extracted factors and factor loadings. Normality Normality is a necessary assumption for SEM analysis as nonnormal data may affect results such as parameter estimates, standard errors, and fit indices (Schumacker & Lomax, 2010). The normality assumption was assessed through skewness and kurtosis statistics of the observed variables. The skewness and kurtosis statistics for the goal orientation variables and perceived benefit variables were found to fall within the accepted ranges previously noted (Kendall & Stuart, 1958). The continuous quantitative involvement variable was found to be positively skewed and platykurtic (skewness: 2.685; kurtosis: 8.482). Involvement. To address the normality violation of the continuous quantitative involvement variable, the researcher created an ordinal variable which divided the sample into 20 categories based on level of involvement (i.e., range of minutes per week for which each category constituted consecutive ranges of one hour; e.g., 1 = 1-60 min., 2 = 61-120 min, …). The ordinal quantitative involvement variable was also found to be nonnormal. SEM analyses were conducted for both types of quantitative involvement variables (i.e., continuous and ordinal), for which the continuous variable was found to cause multicollinearity issues. Therefore, the ordinal quantitative involvement variable was maintained. Descriptive statistics of the observed variables can be found in Table 3.

Achievement Goal Orientation
87
Table 3 Descriptive statistics of observed variables Variables n M SD Skewness Kurtosis Ordinal Quantitative Involvement 1564 2.892 3.112 2.719 8.630
Task Orientation 1564 4.001 0.672 -1.468 4.157 Ego Orientation 1564 2.788 0.905 0.197 -0.421 Social Perceived Benefits 1564 3.048 0.652 -0.434 -0.154 Fitness Perceived Benefits 1564 3.140 0.603 -0.572 0.030 Intellectual Perceived Benefits 1564 2.536 0.746 0.094 -0.501
Model The structural model proposed (Figure 1) hypothesizes achievement goal orientations to predict quantitative sport involvement which in turn predicts perceived benefits of sport involvement. The achievement goal variables were not hypothesized to measure a latent variable as empirical research has found inconsistent results regarding the consequences of a task and ego goal orientation; as such the unique relationships between the individual goal orientations and quantitative involvement were of interest. The quantitative involvement ordinal variable was hypothesized to measure an involvement latent variable based upon Astin’s (1999) conceptualization of involvement, which measures involvement both quantitatively and qualitatively. The latent variable suggests a greater involvement construct, supporting Astin’s conceptualization. The perceived benefit variables were hypothesized to measure a perceived benefit latent variable as the observed variables were extracted components of an overall perceived benefit measure. The proposed structural model contained both interval and ordinal observed variables; therefore the model was treated as a mixture model. The observed variables were defined as either

Lower, Turner & Petersen
88
continuous or ordinal in PRELIS 9.0 and then a polyserial correlation matrix and asymptotic covariance matrix of the observed variables was produced and saved for the SEM analyses. The polyserial correlation matrix can be found in Table 4. The first run included the polyserial matrix only; the means and standard deviations were specified as a correlation matrix was used to account for the relationships among the observed variables. The observed and latent variables and the relationships among those variables were specified, with the achievement goal variables correlating. As a single observed variable (i.e., quantitative involvement) was used to assess the involvement latent variable, it is assumed that the latent variable is perfectly measured by the single observed variable; therefore the factor loading was fixed to 1.0 and the measurement error was fixed to 0.0. Of the perceived benefit observed variables, the social perceived benefit factor loading was fixed to 1.0 based upon the results of the principal component analysis. Table 4 Polyserial correlation matrix of observed variables Observed Variables 1 2 3 4 5 6 1. Quantitative Involvement 1.000
2. Task Goal Orientation 0.097 1.000 3. Ego Goal Orientation 0.091 0.123 1.000 4. Social Perceived Benefits 0.075 0.102 -0.049 1.000 5. Fitness Perceived Benefits 0.136 0.232 0.022 0.574 1.000 6. Intellectual Perceived
Benefits 0.038 0.005 0.010 0.698 0.541 1.000 Note. Quantitative Involvement refers to ordinal variable.
The model was over-identified with 21 unique values in the
covariance matrix S (based on six observed variables) and 13 free parameters, indicating room for model modification. The generalized least squares (GLS) and maximum likelihood (ML) methods of estimation were employed to determine the most appropriate method

Achievement Goal Orientation
89
of estimation for the model. The ML method is recommended for slight to moderate nonnormal interval and ordinal data, while the GLS method is recommended for severely nonnormal interval and ordinal data (Schumacker & Lomax, 2010). The ML method of estimation was found to produce a better fitting model and therefore was used for all SEM analyses.
The mixture model, using a polyserial correlation matrix, was run, for which all factor loadings and structural coefficients were found significant at the α < .05 level of significance. The global fit indices of the proposed model (Table 5) suggest a poor fitting model as three of the five indices do not meet the standards previously noted (i.e., non-significant χ2; RMSEA < .100; SRMR < .05). The R2 values were moderately strong for the measurement equations but small for the structural equations. When considering the modification suggestions, the only theoretically justifiable suggestion was adding a path between the task orientation observed variable and perceived benefits latent variable (anticipated decrease in chi-square: 14.7).
Table 5
Structural equation modeling goodness of fit statistics for the structural model
Model Details χ2 df p RMSEA GFI CFI SRMR Mixture Model - Polyserial Correlation Matrix
154.95 8 <.001 0.108 0.969 0.927 0.058
Modification 1 (Path Task Benefits) 139.90 7 <.001 0.110 0.972 0.933 0.045 Mixture Model - Polyserial Correlation Matrix & Asymptotic Covariance Matrix (Modification 1)
137.17 6 <.001 0.118 0.973 0.935 0.044
Note. The following abbreviations were applied: Path: factor loading adjusted to stated variables; Task: Task Orientation; Benefits: Perceived Benefits.

Lower, Turner & Petersen
90
The mixture model was modified by adding a path from the task orientation observed variable to the perceived benefits latent variable to determine if the fit of the model would improve. All factor loadings and structural coefficients remained significant at the α < .05 level of significance. The global fit indices for the modified mixture model (Table 5) suggest a good fitting model as the majority of indices upheld the standards previously noted (i.e., GFI > .95, CFI > .90, SRMR < .05). The structural equation R2 statistics also improved, supporting the modification to the model. The modification indices were reviewed for which no suggestions were found theoretically justifiable. Thus the modified model (Figure 3), with three indices indicating a good fit, was found to be the best fitting model. As the structural model is considered a mixture model with both continuous and ordinal data, the asymptotic covariance matrix was inputted to provide additional information for the SEM analysis and generate robust statistics. The final modified model was rerun using both the polyserial correlation matrix and asymptotic covariance matrix. The global fit indices improved slightly (Table 5), supporting the inclusion of the asymptotic covariance matrix.
The proposed structural model was partially supported in that all relationships hypothesized were found statistically significant at the α < .05 level of significance. The mixture model was modified by adding a path between the task orientation observed variable and perceived benefits latent variable to improve the fit of the model, indicating that the proposed model did not provide the best fit.

Achievement Goal Orientation
91
Figure 3 Path diagram of modified structural model with standardized solutions
Note: The fixed factors are denoted by ‘F’.**p<.05,***p<.001.
Discussion
A mixture model was proposed and tested, examining the relationships among achievement goal orientations (i.e., task and ego), recreational sport involvement (i.e., quantitative involvement), and perceived benefits of recreational sport involvement (i.e., social, fitness, and intellectual benefits). Several procedures were conducted
.12
.86F .67***
.08*** .11*** .08**
.09*
.80***
Perceived Benefits
Quantitative Involvement
Task Orientation
Social Benefits
Fitness Benefits
Intellectual Benefits
.2 .5 .3
Involvement
Ego Orientation
.00
1.00F

Lower, Turner & Petersen
92
prior to testing the model, including confirmatory factor analysis, principal component analysis, and descriptive statistics to examine the assumption of normality. Confirmatory factor analysis was conducted to test the structure of the TEOSQ scale, which utilizes the dichotomous achievement goal model. The dichotomous measurement model was upheld, confirming the proposed factor structure of the TEOSQ. The confirmatory factor analysis and reliability analyses of the TEOSQ suggest it to be an empirically sound instrument for testing the dichotomous achievement goal model within the sport domain.
Principal component factor analysis was conducted to examine the structure of the QIRS perceived benefit scale. The factor loadings of the perceived benefit scale have varied across empirical studies, which is why an exploratory factor analysis technique was employed for the current study. The three factor structure of the scale was upheld, supporting past research which has extracted three components. An oblimin rotation was found to be most appropriate based upon the correlations found among the perceived benefit factors. As all items were developed to measure a comprehensive construct (perceived benefits of recreational sport), the correlation among the types of perceived benefits is justifiable. The constructs reflecting the extracted components proposed in past studies (i.e., social, fitness, and intellectual perceived benefits) were suitable for the extracted components of the current study and therefore were maintained. Of the 22 perceived benefit items, the ‘sport skills’ item had a factor loading less than the .60 standard previously noted. Of the extracted components, the ‘sport skills’ item was anticipated to load onto the fitness component. The low factor loading may have been influenced by the population investigated, which included group fitness participants who may not relate to the perceived benefit item, which has an emphasis on sport. Ultimately, the confirmatory factor and principal component analyses were used as data reduction techniques to reduce the TEOSQ from 12 items to two components and the QIRS perceived benefit scale from 22 items to three components. The data was

Achievement Goal Orientation
93
reduced for the purpose of proposing a more parsimonious structural model. When assessing the normality of the observed variables, the quantitative involvement variable (both continuous and ordinal) was found to be nonnormal. The distribution of the data indicates that approximately 77% of subjects reported involvement less than or equal to 180 minutes per week, while the involvement variable ranged from one to 1200 minutes. The distribution of the data is likely due to the structure of the intramural sport program and inclusion of recreational sport student employees in the study. The intramural sport program at the institution studied schedules only two sports concurrently, which limits participation to approximately 120 minutes per week and may account for the positively skewed data. The responses indicating close to 1200 minutes of involvement may be explained by the inclusion of recreational sport student employees in the study as many student employees are also involved in recreational sport programs as participants and may consider recreational sport involvement to include both work and voluntary time. Although both involvement variables (i.e., continuous and ordinal) were found to be nonnormal, the ordinal variable was selected for analyses to avoid the multicollinearity issues that arose with the continuous variable. With the inclusion of continuous and ordinal variables, a mixture model was used for SEM analysis. Based upon the nonnormality of the quantitative involvement variable, both the ML and GLS methods of estimation were employed to determine the most appropriate estimation method for the data. The maximum likelihood method was found to produce a better fitting model, suggesting that the violation of normality was minimal. The violation was likely not a major issue as only one of the six observed variables were found to be nonnormal. The chi-square global fit indice was found nonsignificant for all SEM analyses, suggesting poor fitting models. However, the chi-square model-fit criterion is sensitive to sample size (Schumacker & Lomax, 2010) and therefore was likely influenced by the study’s large sample (n = 1564). The global fit indices for the final modified
Lower, Turner & Petersen
94
mixture model suggested a good fitting model as the majority of fit indices met the standards previously noted. Inclusion of the asymptotic covariance matrix within the analysis improved the fit of the mixture model, supporting the assertion that its inclusion yields robust statistics within mixture models.
Although the model was found to have a good fit, the structural coefficients and squared multiple correlations for the structural equations were relatively small suggesting moderate to weak predictive relationships among the achievement goal orientation, quantitative involvement, and perceived benefits of involvement variables. The positive predictive relationship between task orientation and the involvement and perceived benefits factors supports past research which has consistently found a task orientation associated with positive achievement-related outcomes. The positive predictive relationship between ego orientation and the involvement factor provides additional insight into the outcomes of an ego orientation as there have been inconsistent findings in past studies. Lastly, the positive predictive relationship between the involvement and perceived benefits of involvement factors supports Astin’s (1999) assertion of a direct positive relationship between involvement and student development. In contrast to the structural coefficients, the perceived benefit factor loadings were relatively large, supporting the use of the three components (i.e., social, fitness, and intellectual perceived benefits) as a measure of perceived benefits of recreational sport involvement.
Conclusions
Limited research has investigated the predictive relationship between achievement goal orientations, sport involvement, and perceived benefits of sport participation within a structural model. Examining how goal orientation, sport involvement, and program perceived benefits interact can help sport practitioners better understand retention, participant experiential differences, programmatic weaknesses and strengths, the optimal program structure, as well as other significant components of a successful program.

Achievement Goal Orientation
95
This study was designed to examine the premise that achievement goals predict achievement-related behaviors and outcomes. Results from this study support the supposition that a task orientation should be enhanced and proposal that an ego orientation need not be depressed but can actually result in positive achievement-related outcomes. Sport program facilitators can influence participant goal orientations by consistently emphasizing the desired achievement goal through purposeful behaviors. Behaviors that project a task goal orientation emphasize personal improvement, effort, and learning. Sport instructors can set goals focusing on skill development to motivate and evaluate progress, present skill modifications and alternatives, offer instruction and constructive feedback in private, and reinforce effort through encouragement and feedback. Competition is an inherent element of sport, emphasizing performance, winning, and rewards - characteristics often associated with an ego orientation. Based upon the current study, an ego orientation need not be discouraged. Future studies should seek to confirm or disconfirm this finding as there has been inconsistent results regarding the achievement-related outcomes of an ego orientation. The results from this study have several implications for sport practitioners regarding the outcomes of program participation and the factors influencing those outcomes. Generalizability of the results is limited due to the single institution research model. Therefore, further research should be conducted to support the findings of this study or offer additional explanations for these findings.
Limitations and Recommendations
This study offers many opportunities for expansion to better understand the interaction of goal orientation, program involvement, and perceived benefits associated with program participation. The constructs selected to represent achievement-related behaviors and outcomes can be developed further to provide a more comprehensive outlook of the consequences of achievement goal orientations. The involvement measure within the current study was limited to quantitative involvement; future research should consider including

Lower, Turner & Petersen
96
qualitative involvement (e.g., degree of effort expenditure) for additional insight to the overarching involvement factor. The quantitative involvement variable was found to be nonnormal, which has the potential to affect the results of SEM analysis. Future studies investigating quantitative involvement may consider using a scale rather than an open-ended question, to address the normality issue. Perceived benefits of program participation were selected to reflect achievement-related outcomes; however, the measure used in this study focused only on positive achievement-related outcomes. Future studies should consider incorporating both positive and negative outcomes for a more comprehensive analysis.
Since the conception of the dichotomous achievement goal model, the achievement goal theory has expanded to incorporate the valence dimension (i.e., approach-avoidance motivation) and divide the competency dimension into three elements based on standards of evaluation (task-based, self-based, other-based). The trichotomous, 2x2, and 3x2 achievement goal models add complexity and potentially allow for more in-depth analysis. Expanding this study to incorporate the additional factors may offer more in-depth insight to the interaction between the variables. Currently, only the dichotomous and 2x2 frameworks have published measures developed for the sport domain. Researchers should consider examining the trichotomous and 3x2 models within the sport domain in order to determine which approach is most appropriate within the sport context.
The model focused on consequences of achievement goal orientations and can be expanded to integrate antecedents of achievement goal orientations in order to better understand the construct and its interaction with other achievement-related variables. The terms consequences and outcomes were not indented to indicate any causality among the variables, merely predictive relationships with a logical progression (i.e., goal orientation → involvement → perceived benefits). Longitudinal research with an experimental design may be considered if investigation of causality among the achievement-related constructs is of interest.
Achievement Goal Orientation
97
References Adie, J. W., Duda, J. L., & Ntoumanis, N. (2008). Achievement
goals, competition appraisals, and the psychological and emotional welfare of sport participants. Journal of Sport & Exercise Psychology, 30, 302-322.
Ames, C. (1992). Classrooms, goals, structures, and student motivation. Journal of Educational Psychology, 84, 261-271.
Ames, C., & Archer, J. (1988). Achievement goals in the classroom: Students’ learning strategies and motivation processes. Journal of Educational Psychology, 80 (3), 260-267.
Artinger, L., Clapham, L., Hunt, C., Meigs, M., Milord, N., Sampson, B., & Forrester, S. A. (2006). The social benefits of intramural sports. NASPA Journal, 43 (1), 69-86. Ary, D., Jacobs, L. C., & Sorensen, C. (2010). Introduction to research in education (8th ed.). Belmont, CA: Wadsworth.
Astin, A. W. (1999). Involvement in learning revisited: Lessons we have learned. Journal of College Student Development, 40 (5), 587-598.
Astin, A. W. (1999). Student involvement: A developmental theory for higher education. Journal of College Student Development, 40 (5), 518-529.
Biddle, S. J., Want, C. K., Kavussanu, M., & Spray, C. M. (2003). Correlates of achievement goal orientations in physical activity: A systematic review of research. European Journal of Sport Science, 3 (5), 1-20.
Bourgeois, A., LeUnes, A., Burkett, S., Dragges-Bourgeois, T., Friend, J., & Meyers, M. (1995, Spring). Factors influencing intramural sport participation. NIRSA Journal, 44-48.
Cooney, L. (1979). Sports clubs: Their place within the total intramural-recreational sports program. Journal of Physical Education and Recreation, 50 (3), 40-41.
Dishman, R. K., & Chambliss, H. O. (2010). Exercise psychology. In J. M. Williams (6th Ed.), Applied sport psychology: Personal growth to peak performance (p.497-518). Boston: McGraw-Hill.

Lower, Turner & Petersen
98
Duda, J. L. (1989). Relationship between task and ego orientation and the perceived purpose of sport among high school athletes. Journal of Sport & Exercise Psychology, 11 (3), 318-335.
Duda, J. L. (1998). Advances in sport and exercise psychology measurement. Morgantown: Fitness Information Technology.
Duda, J. L. (2005). Motivation in sport: The relevance of competence and achievement goals. In Elliot, A.J., & Dweck, C.S. (Eds.), Handbook of competence and motivation (pp. 318-335). New York: Guilford Press.
Duda, J. L., & Whitehead, J. (1998). Measurement of goal perspectives in the physical domain. In J. Duda (Ed.), Advances in sport and exercise psychology measurement (pp. 21-48). Morgantown, WV: Fitness Information Technology.
Elliot, A. J. (1999). Approach and avoidance motivation and achievement goals. Educational Psychologist, 34 (3), 169-189.
Elliot, A. J. (2005). A conceptual history of the achievement goal construct. In A. J. Elliot & C. S. Dweck (Eds.), Handbook of competence and motivation (pp. 52-72). New York, NY: The Guilford Press.
Elliot, A. J., & Covington, M. V. (2001). Approach and avoidance motivation. Educational Psychology Review, 13 (2), 73-92.
Elliot, A. J., & Harackiewicz, J. M. (1996). Approach and avoidance achievement goals and intrinsic motivation: A meditational analysis. Journal of Personality and Social Psychology, 70 (3), 461-475.
Elliot, A. J., & McGregor, H. A. (2001). A 2 x 2 achievement goal framework. Journal of Personality and Social Psychology, 80 (3), 501-519.
Elliot, A. J., Murayama, K., & Pekrun, R. (2011). A 3 x 2 achievement goal model. Journal of Educational Psychology, 103 (3), 632-648.

Achievement Goal Orientation
99
Forrester, S. A., & Beggs, B. (2005). Validation of the quality and importance of recreational sports scale. [Abstract] Canadian Congress on Leisure Research accessed online at http://lin.ca/Uploads/cclr11/CCLR11-35.pdf
Haines, D. J., & Fortman, T. (2008). The college recreational sports learning environment. Recreational Sports Journal, 32, 52-61.
Hair, J. F., Anderson, R. E., Tatham, R. L., Black, W. C. (1998). Multivariate data analysis with readings. Englewood, NJ: Prentice Hall.
Hall, D. A. (2006). Participation in a campus recreation program and its effect on student retention. Recreational Sports Journal, 30 (1), 40-45.
Hendricks, J. W., & Payne, S. C. (2007). Beyond the big five: Leader goal orientation as a predictor of leadership effectiveness. Human Performance, 20 (4), 317-343.
Kendall, M. G., & Stuart, A. (1958). The advanced theory of statistics. New York, NY: Hafner.
Kuh, G. D. (1991). Involving colleges: Successful approaches to fostering student learning and development outside the classroom. San Francisco: Jossey-Bass.
Lang, P. J. (1995). The emotion probe: Studies of motivation and attention. American Psychologist, 50 (5), 372-285.
LeUnes, A. (2008). Sport psychology (4th ed.). New York, NY: Psychology Press.
Lewin, K., Dembo, T., Festinger, L., & Sears, P. S. (1944). Level of aspiration. In J. Hunt (Ed.), Personality and the behavior disorders (pp. 333-378). New York, NY: Ronald Press.
Lindsey, R., & Sessoms, E. (2006). Assessment of a campus recreation program on student recruitment, retention, and frequency of participation across certain demographic variables. Recreational Sports Journal, 30 (1), 30-39.
Lower, L. M., Turner, B. A., & Petersen, J. C. (2013). A comparative analysis of perceived benefits of participation between recreational sport programs. Recreational Sports Journal, 37, 66-83.

Lower, Turner & Petersen
100
Moller, A. C., & Elliot, A. J. (2006). The 2x2 achievement goal framework: An overview of empirical research. In A. Mitel (Ed.), Focus on educational psychology (pp. 307-326). New York, NY: Nova Science Publishers, Inc.
National Intramural-Recreational Sports Association (NIRSA). (2000). Quality and importance of recreational services (QIRS). Champaign, IL: Human Kinetics.
National Intramural-Recreational Sports Association. (2004). The value of recreational sports in higher education. Corvallis, Oregon: NIRSA.
Nicholls, J. G. (1984). Achievement motivation: Conceptions of ability, subjective experience, task choice, and performance. Psychological Review, 91 (3), 328-346.
Nicholls, J. G. (1989). The competitive ethos and democratic education. Cambridge, MA: Harvard University Press.
NIRSA/NASPA Consortium. (2010). 2010 NIRSA/NASPA Consortium campus recreation impact study. Retrieved July 12, 2012, from http://www.nirsa.org/AM/Template.cfm?Section=Files&Template=/MembersOnly.cfm&ContentFileID=11377
Roberts, G. C. (2001). Understanding the dynamics of motivation in physical activity. In G. Roberts (Ed.), Advances in motivation in sport and exercise (pp. 1-50). Champaign, IL: Human Kinetics.
Roberts, G. C., Treasure, D. C., & Balague, G. (1998). Achievement goals in sport: The development and validation of the perception of success questionnaire. Journal of Sports Sciences, 16, 337-347.
Roberts, G. C., Treasure, D. C., & Conroy, D. E. (2007). Understanding the dynamics of motivation in sport and physical activity: An achievement goal interpretation. In G. Tenenbaum, & R. Eklund (Eds.), Handbook of sport psychology (3rd ed.) (pp. 3-30). Hoboken, NJ: John Wiley & Sons, Inc.

Achievement Goal Orientation
101
Roberts, G. C., Treasure, D. C., & Kavussanu, M. (1996). Orthogonality of achievement goals and its relationship to beliefs about success and satisfaction in sport. The Sport Psychologist, 10, 398-408.
Sage, L. D., & Kavussanu, M. (2008). Goal orientations, motivational climate, and prosocial and antisocial behaviour in youth football: Exploring their temporal stability and reciprocal relationships. Journal of Sports Sciences, 26 (7), 717-732.
Schumacker, R. E. & Lomax, R. G. (2010). A beginner’s guide to structural equation modeling (3rd ed.). New York: Routledge.
Staurowsky, E. J., & Abney, R. (2011). Intercollegiate athletics. In P. Pedersen, J. Parks, J. Quarterman, & L. Thibault (Eds.), Contemporary sport management (pp. 142-163). Champaign, IL: Human Kinetics.
Stevens, J. P. (2009). Applied multivariate statistics for the social sciences (5th ed.). New York: Routledge.
The Ohio State University. (2003, April). 2002 QIRS – general report. Retrieved from http://studentlife.osu.edu/pdfs/assess_recreation_report.pdf

Case Study: New Mexico Bowl
102
The Journal of SPORT, 2014, 3(1), 102-134 © Kent State University
Using a Sport Event within Coordinated Destination Marketing: A Case History of the New Mexico Bowl
John C. Barnes
University of New Mexico
Dan Ballou Albuquerque Convention & Visitors Bureau
Abstract
Sports events are important tools in the marketing of destinations. Events attract outsiders who provide economic impact. They also attract media attention that allows for a place to be seen in a favorable light as well as help position a city as a tourist destination for the event and in the succeeding years.
The purpose of this case study is to provide information and examples of cooperative marketing efforts by various destination marketing stakeholders within a community, based upon the development of an American college football bowl game. Included will be a brief discussion of the creation of the game as a place marketing tool, development of outside activities that are designed to add to the value perceived by visitors, and techniques used to encourage involvement by the various stakeholders in the local hospitality industry.

Barnes & Ballou
103
Teaching Notes
Theoretical Areas and Applicable Courses The theoretical areas that coincide with this case study are
related to place marketing. Place marketing, or place branding is ever-increasing in importance as competition between cities luring event producers has never been higher. With that, Destination Marketing Organizations are using sports events as a way to appeal and attract out-of-town travelers.
The term, ‘place’ may refer to a mechanism of distribution and also a physical location, such as a destination city or region (Schneider & Bradish, 2006). As such, place marketing may be considered advertising and promotions that creates a positive place image, develops attractions for tourists, and improves infrastructure and quality of life within a community (Malecki, 2004). More specifically, if we are marketing a place as a tourist destination, place marketing and destination marketing are interchangeable terms and the strategies used to attract visitors are the same.
This case study is applicable to several departments on a campus. It would be beneficial to sports administration, hospitality management, and marketing programs campus-wide. Specific to sports administration, it would be part of curriculum in sports marketing courses, especially when dealing with destination marketing brand image, and how that image is used to attract visitors and worldwide media exposure through broadcast events. It would also fit well in a sports finance course and should be introduced in topical areas such as economic impact, public vs. private sector spending, using facilities to attract new customers, and the role a short-term event can play in increasing direct spending, and where those dollars are being spent.
The New Mexico Bowl case study could also be used in an event management class in facilitation discussions, and how representatives from several different local organizations came together to produce this game from the start. Dialogue pertaining to getting buy-in from the city, state, university, local media, local ticket-buying audience should be represented and role playing

Case Study: New Mexico Bowl
104
exercises could be done using this case study going back to when the game was just an idea and taking into account all the different attitudes that had to be brought together, discussed, and accepted before the decision was rendered on whether to move forward with the game. Discussion Questions
1. Define all the appropriate stakeholders that would have an interest in the New Mexico Bowl, both from a local and non-local perspective.
a. The state of New Mexico – From the Governor’s office when the announcement was made, to the Department of Tourism for implementation of the brand, how does the state benefit by sponsor involvement, and to what extent can it be insured the deliverables provide the benefits expected?
b. Department of Tourism – What is the best approach to market the state through the game and best mechanisms to reach the intended audience? Does the bowl game provide the necessary advertising inventory to appeal to the viewing audience in order to get them to consider coming to New Mexico at some point in the future? Is this measurable?
c. The Albuquerque Convention & Visitors Bureau – As the flagship city in the state, what are the best and most effective ways to reach alumni groups and fans to not only get them to Albuquerque, but to also take advantage of the attractions the city has to offer once they are here? What strategies could DMO’s in Albuquerque develop to increase the chances of attracting more of the targeted audience?
d. The University of New Mexico – The University of New Mexico plays a huge role in the bowl game. The university earns rent from the use of the stadium, and included in the rent is all the necessary staff required to host the game. From ticket sellers and takers,

Barnes & Ballou
105
custodial, field maintenance, security, game management, sports information, athletic training, all the way to top-level administrators, the university has a heightened level of involvement in the game and must be involved in every aspect of its production.
e. Local Media – The local media play a very important role in spreading the word about the game in an effort to help promote ticket sales and attendance at ancillary events. The New Mexico Bowl must work on partnerships with the local media to effectively plan ticket buying campaigns and to help create a buzz about the game each year.
f. Corporate Sponsors – Sponsors play a large role in helping to insure that the game is successful from the local side of things. On the national level, the game’s title sponsor (Gildan), helps provide the necessary financial footing required to keep the game in operation, and the local sponsorships, combined with local ticket sales, should be the most influential factors that keep the game profitable.
g. Ticket buying public – The local citizens, the ones who can make very quick decisions on whether or not to attend the game, are a key component to the bowl’s success. These people should never be taken for granted.
2. With the very short time frame between the announcement of teams for the bowl game, and the game itself, there are advantages and disadvantages that were discussed. Name those advantages and disadvantages and which of the advantages offers the most benefit to the stakeholders in the bowl game?
a. Advantages – First bowl game of the season, fans are watching because the game kicks off the bowl season. Ratings have been good with more than 2.5 million viewers for each year of the bowl game thus far. The time frame of the bowl game does not force fans of

Case Study: New Mexico Bowl
106
the teams to give up holiday time because of the game’s early bowl-season placement.
b. Disadvantages – The quick turnaround time from the announcement to the game does not give Destination Marketing Organization’s a sufficient amount of time to extend marketing efforts into the destination market, alumni groups, or general fan base of the teams attending the game. With that, the opportunity to present the cognitive and affective benefits of the destination can be lost. It is also difficult to measure whether the limited marketing that can be done is effectively reaching the desired population.
3. From a marketing perspective, how might DMO’s do a better job capitalizing on the television air time allotted for promotion of the destination?
a. One opportunity would be to replace general advertisements used to market the city and state and replace them with advertisements specific to the bowl game with a defined targeted demographic. Since the game has a history, and since it is apparently healthy and will remain for years to come, advertisements specific to sport would be appropriate. Advertisements created that include the Albuquerque brand highlighted as a specific sports destination could replace existing ads and have a lifespan of 2 – 4 years.
4. Based on the case study, how successful do you think bowl games are, or sporting events as a whole, are in aiding the place marketing efforts of a particular city?
a. Sporting events can do a good job of promoting a city as a desirable destination through heavy promotion of attractions, resources, and other activities to take advantage of while in a city (both from an affective and cognitive approach). For a new event like the New Mexico Bowl, carving out some kind of niche or difference allows the game to stand out from the

Barnes & Ballou
107
many other options. Because of the early timeframe of the game, it enjoys the tag of “first” bowl game of the season. Even though there is some evidence of drawbacks associated with that, it is likely a far better scenario than being buried amidst days when there are multiple bowl games televised, and the holiday season is in full swing. Care should be undertaken that bowl games (or other sports events), partner with DMO’s to highlight all the positive aspects a destination has to offer (again, be it affective or cognitive), and the event should be used as a bridge to connect the traveler with the destination.
Information on how the challenge was addressed The biggest issues associated with the New Mexico Bowl are the timing of the game itself in relation to the time of the bowl team announcements. This issue was discussed in the list of discussion questions. Coordinating in-class discussion In-class discussion could be done through an introduction of the New Mexico Bowl, and this case study to the students. Facilitation efforts could be done with role playing where selected students act the role of a representative from the list of stakeholders in question 1 in the Discussion Questions section. Through role playing, students could brainstorm potential ideas and marketing strategies that could prove beneficial to a destination’s overall place marketing strategy while bringing to the forefront the concerns of the group they are representing. Also, students could be split into groups and each group could develop additional strategies not included in the article. Ideas on how to more effectively gain market penetration in cities where potential New Mexico Bowl teams may come from could be developed from this strategy. Students should not be restricted to budgetary issues, or other logistical considerations, but rather they should be instructed to think outside the box. This would allow them

Case Study: New Mexico Bowl
108
to generate ideas, and once the ideas are generated, could be used as in-class discussion at which time the feasibility and reality of the ideas could be debated. Additional readings While all the references listed on the case study are related and provide solid information regarding the use of sports events to aid in destination marketing, industry journals specific to bowl games would be recommended. In particular, students truly interested in the bowl selection process could start by reading the Dan Wetzel’s book, Death to the BCS. Another potential resource is Street & Smith’s Sports Business Journal which regularly runs information regarding bowl game payouts. Students would be well advised to monitor this publication on a regular basis. SportsTravel Magazine is an option that regularly features destinations and what sporting events those destinations use to draw media attention and visitors to those cities. Shank’s Sports Marketing: A Strategic Perspective is a great source for information specific to marketing. Journal of Vacation Marketing, International Journal of Event Management Research, Tourism Management, Journal of Sport Tourism, International Journal of Tourism Research, Tourism and Hospitality Research, Journal of Sport & Tourism, are all research journals that pertain to this destination marketing and sport event tourism. Introduction
Unlike nations, regions and cities can, to a certain extent, go out of business due to out-migration of people and businesses. This can leave a community at a competitive disadvantage within the tourism and economic market of communities. Thus, cities and regions must compete for outside investment, tourists, and work force. The upshot of competition between cities and regions is that it produces effects greater than just infrastructure improvement and media attention. It is a means of “compilation and distribution of information and data about a place” (Malecki, 2004, p. 1113).

Barnes & Ballou
109
Within marketing theory, ‘place’ may refer to a mechanism of distribution and also a physical location, such as a destination city or region (Schneider & Bradish, 2006). As such, place marketing may be considered advertising and promotions that creates a positive place image, develops attractions for tourists, and improves infrastructure and quality of life within a community (Malecki, 2004). More specifically, if we are marketing a place as a tourist destination we may look at place marketing as destination marketing. According to Elbe, Hallén, and Axelsson (2009), destination marketing is a culmination of three factors: 1) Activities performed by the Destination Marketing Organization (DMO) in order to build up legitimacy and foster cooperation, 2) Allocation and development of resources related to tourism, and 3) Destination integration in terms of relevant actors forming alliances. All of these components are interrelated in their roles in place marketing. Marketing of a place is related to economic development of the city or region by creating demand for a destination community. Marketing activities foster consumption (tourism) and that creates production, both factors of economic development (Oudan & Luparelli, 2011).
Sports events are an important tool in the marketing of destinations. Events attract outsiders who provide economic impact. They also attract media attention that allows for a place to be seen in a favorable light (Chalip, Green, & Hill, 2003). According to Hede (2005):
Special events, including sports events, are now playing an integral role in many destination marketing strategies. Some destinations are using sports events as a constant, and core component of their destination marketing strategies…Short-term sporting events of fixed duration…provide opportunities for host destinations to showcase their attributes to their visitors…(and) can change how host destinations are perceived and that they provide the new ‘middle class tourist’ with the impetus to visit host destinations in the future (p. 187-188).

Case Study: New Mexico Bowl
110
But those events are most effective when they can add to the ‘saliency’ of the overall place brand. This allows for generation of attitudes held by targets before, during, and after the event. The destination brand is beyond a logo or slogan, it is a reference to overall impression of the place that may be held in the minds of the consumer. It includes physical attributes, services, attractions, reputation, and benefits to the consumer (Chalip & Costa, 2005). Although media attention to a sport event may not specifically affect potential tourists’ intentions to visit a host community, television coverage may be used to help create a more positive way the community is perceived, in general (Brown, 2007). The purpose of this paper is to use a case study technique to examine the development of a sport event that was created to provide a specific tourism attraction as well as how it is used in the overall marketing efforts of one destination region: The New Mexico Bowl college football game as a part of the destination marketing of the City of Albuquerque and the State of New Mexico. In a case study of the Athens 2004 Olympic Games and its media telecast, Hede (2005) noted that a case study approach is suitable when the subject matter focuses on current circumstances and does not require control over behavioral events. Included in this case study will be a brief review of literature related to place/destination marketing and brand image, the use of specific events to enhance an overall destination marketing campaign, the integration of an event into the branding of the destination, a brief description of the New Mexico Bowl game, and how the game has been supported and exploited by the local tourism industry to enhance the destination marketing and branding of the State of New Mexico and the City of Albuquerque. Place/Destination Marketing and Brand Image According to Elbe, Hallén, and Axelsson (2009, p. 283), “Destination marketing is a concept used to denote deliberate, often strategically developed activities performed in order to attract visitors, i.e. tourists, to a specific location…Destination-management organizations (DMOs) are often given a central role in the marketing

Barnes & Ballou
111
of a destination because they are created to take the overall responsibility for promoting tourism and for attracting visitors to the place or region defined as their domain”. This also includes creating business tourism which lures conferences and conventions to a city. In addition, it includes the creation or attraction of hallmark events such as high profile sports and since these events are a scarce resource, competition among cities for them emerges, with the hopes of capturing ‘mobile capital’ (Malecki, 2004, p. 1108). Thus, a city can be treated as a ‘product’ that has utility/benefit for the tourist. A place’s image may be defined as “The sum of beliefs, ideas and impressions that people have of that place” (Gertner & Kotler, 2004, p. 50). Destination marketers try to promote a favorable image of a community by developing a brand that contains all of the positive elements of that community’s image. Branding allows a destination community to transmit messages regarding the qualities and benefits of the place to consumers (Chadwick & Holt, 2008). There is an increase in the use of branding of tourist destinations in order to create positioning that creates an advantage in the destination marketplace. Destination brands are a “…strategic combination of ‘a consistent mix of brand elements to identify and distinguish a destination through positive image building’…These elements, similar to the consumer products, are proposed to include terms, names, signs, logos, designs, symbols, slogans, color, packages, architecture, typography, photographic styles, as well as heritage, language, myths and legends” (Tasci & Kozak, 2006, p. 301). As such, it makes sense to market a place as a brand, as the brand is essentially the culmination of the consumers’ images of the components of the place (Elbe, Hallén, & Axelsson, 2009).
Branding in destination marketing has unique characteristics and challenges. This is due in part to the fact that the destination ‘product’ is usually unchangeable and that tourism is heavily grounded in service, meaning it has the characteristics of a service: Perishability, inseparability, intangibility, heterogeneity ” (Tasci & Kozak, 2006).
Branding of cities is essentially the adoption of marketing strategies to create a brand image for the city or region. The basis of

Case Study: New Mexico Bowl
112
this is that a city can be seen as an object that can have a distinct identity that represents the characteristics of that city. In this sense, a city can be treated as a ‘product’ that has utility/benefit for the tourist. The city’s brand image may be developed using community factors such as “…history, demography, economy, politics and policies. A city usually has certain identifiable images or core values perceived by its people” (Zhang & Zhao, 2009, p. 245). And while there is consistency in a product that is, as mentioned above, unchangeable, there is a challenge in providing a consistent brand message that is the existence of diverse values and opinions held by the various stakeholders within the community itself. This challenge must be overcome in order to allow the brand to deliver images that are not in conflict with one another (Zhang & Zhao, 2009). According to Fyall and Leask (2007), the destination is one of the most difficult products to market: Numerous products; Numerous stakeholders and organizational bodies; Numerous commercial entities. Therefore, because of the heterogeneity of a place – stakeholders, attractions, etc., resources must be pooled and marketing must be done in a coordinated manner in order to keep branding and marketing messages consistent, as well as to get the most effect from marketing investment.
As brand image is the culmination of the relevant associations as linked to the destination brand, the destination brand image is based within a schema that holds nodes of info connected by associations. According to Chalip and Costa (2005):
Destination branding consists of fostering spreading activation to nodes that the marketer most wants associated with the destination brand. To do so, the marketer first identifies the most desirable and relevant nodes, and then works to create and strengthen the associations among them. (p. 222)
So, as Chadwick and Holt (2008) noted, understanding the array of associations, attachments, tourist self-identification and affiliation influences is of utmost importance in destination marketing. This also means that careful selection of significant marketing partners is critical. Developing destination brand equity

Barnes & Ballou
113
therefore involves creating strategies that capitalize upon the understanding of sport tourist market segmentation rather than specifically branding for a perceived or desired market position. As Zhang and Zhao (2009) wrote, the marketable properties and central beliefs of a city are largely determined by how the city is perceived by the target tourist market. Therefore, destination branding should be understood as being based on that market segment’s interpretations of the city or region. Tourists tend to assess a destination community in concrete terms, focusing on issues such as culture, intra-city travel, climate, cost of living, recreation and sport facilities, and social make-up of the city. Zhang and Zhao (2009) use Anholt’s (2007) aspects by which a community is understood and how a city’s branding can be assessed. These can be categorized as:
Aspect Meaning Presence The city’s international status
and standing; the city’s global contribution.
Place The city’s appearance and physical attributes, such as cleanliness of environment.
Potential The city’s opportunities for future development. Pulse The city’s vibrant and exciting
ways of life, with lots of interesting activities for residents and visitors.
People The city’s friendliness, openness, cultural diversification and safety.
Prerequisite The city’s basic infrastructure and public amenities. (Zhang and Zhao, 2009, p. 247)

Case Study: New Mexico Bowl
114
Gnoth, as written in Tasci and Kozak (2006) developed a model of tourism branding that took into consideration the different elements of branding in travel destinations:
1) Functional elements: Those emphasizing the destination’s problem solving capabilities such as accessibility and reliability;
2) Symbolic elements: Those emphasizing the destination’s ego enhancing attributes such as family, and affiliations with celebrities;
3) Experiential elements: Those emphasizing the destination’s cognitive or affective attributes such as relaxation and learning.
How the New Mexico Bowl football game works within these two destination branding models will be discussed later in this paper. Sport Events used within Destination Marketing
In their discussion of sport tourism, Deery, Jago, and Fredline (2004) utilize Gibson’s definition of sport tourism as “…leisure-based travel that takes individuals temporarily outside of their home communities to play, watch physical activities or venerate attractions associated with these activities”(p. 235). In the late 1990’s, sport event tourism grew to be the fastest growing segment within leisure travel.
Sport events are important methods for the development of urban and regional communities around the world, including in the U.S. (Kellett, Hede & Chalip, 2008). According to Malecki (2004, p. 1107), “Tourism is an ill-defined sector that has risen in importance as both business tourism and leisure tourism have expanded greatly, sparking policies and building 'urban entertainment amenities' explicitly to attract visitors”. The rationale for the use of sport events as tools for development of a community include: Creating an increase in tourism; Diminishing fluctuations in tourism due to seasonality; and, Creating proximal and general development within the community which, in turn, creates jobs (Chalip & McGuirty, 2004) (Kellett, Hede & Chalip, 2008).

Barnes & Ballou
115
Both place marketing strategies and events within those strategies have been recognized as important for a host community (Chalip, Green & Hill, 2003) (Wood, 2005). One benefit to hosting events is the direct economic impact they may create. Sport event tourism generates around $27 billion per year in tourist spending. 75 million people in the U.S. reported having taken a sport event trip in the previous five years (Gibson, Willming, & Holdnak, 2003). Furthermore, the tourism travel industry has not been left unaffected by the downturn in the U.S. economy. According to the U.S. Department of Commerce: Bureau of Economic Analysis (2011), there were 543,000 full- or part-time jobs in performing arts, spectator sports, museums, and related activities in 2010, down from 558,000 in 2008, a decrease of 15,000 jobs or 2.7%. Thus, communities may see the creation of specific sport events as a way to overcome the effects of a recessionary economy.
Perhaps more important to a community hosting a sport event - beyond its direct economic impact - may be the impact a sport event, especially one that is televised, has on raising the public awareness and shaping brand image of the host city or region (Chalip & Costa, 2005). According to Hede (2005),
One premise of event-related destination marketing strategies is that images and information communicated of, and about, host destinations through events, particularly mega-events, have the capacity to create positive perceptions [of a destination] which will likely be associated with positive behavioural intentions [to visit the destination] in the future…As the telecasts of mega-events are now being used to extend this ‘showcase’ effect to media audiences outside the host destination, mega-events can therefore play an effective role in destination marketing strategies aimed at creating positive perceptions towards host destinations. (p. 189) More and more, communities are using events such as the
Olympic Games as a mechanism to help raise the profile and image of their city or region. This is believed to help attract outside

Case Study: New Mexico Bowl
116
investment and tourist visitors to the area and create a positive economic impact. “Media exposure makes it possible to create ‘interest in a destination in the marketplace’ …, and a distinctive characteristic of mega-events is their ability to pull increasingly fragmented audiences back onto the major television networks” (Brown, 2007, p. 316). But sport events do not need to be mega-events to be beneficial to a host community. Gibson, Willming, and Holdnak, (2003, p. 188) noted, “…college sports events attract a significant proportion of fans from outside of the local community and as such, support the growing focus within the tourism literature that small-scale-sport tourism events may hold more benefit for a community than hosting mega-events”. Maximizing the Benefits and Impacts of a Destination Sport Event
Exploiting a destination sport event, in part means enhancing the event’s direct impacts. Direct impact is the generation of spending in the host community by non-residents. This means that the host community must attract non-resident consumers to the community and attend the event. The design of the experience and how it is displayed in advertising is an important factor in affecting sport tourists travel choice (Harrison-Hill & Chalip, 2005). Perhaps more importantly, event managers and organizers must know which market segments are interested and attracted to which specific events. Marketing of destination events is driven by branding of the event and brand positioning statements that help with communicating the event to specific market segments (Getz & McConnell, 2011). A consumer will choose a particular travel destination if it provides more benefits than any other alternative…including staying home. This guides the DMO to design experiences and promotions that are perceived by the target consumer to be most beneficial (Snelgrove, Taks, Chalip, & Green, 2008).
There are three types of motives for travelling to sport events: 1) Being a fan of the sport; 2) Leisure opportunities; 3) Identification with the subculture of the sport event (Snelgrove,

Barnes & Ballou
117
Taks, Chalip, & Green, 2008). Sports can create subcultures by fostering socialization fans towards the adoption of the attitudes, beliefs, and values associated with the sport or team. This creates a self-identity with the subculture of the sport or team can drive consumption choices where the consumer makes purchasing decisions that will help them display or represent the values of the subculture…Including sport event travel decisions. Thus, the identification with a sport subculture has an effect on a consumer’s decision to attend a sport event. As Snelgrove, Taks, Chalip, & Green (2008, p. 167) noted, “…fan behaviors and attitudes are driven by fans’ motives. In other words, the expectation is that the higher one’s fan motivation, the more likely it is that one will care about and consume sport entertainments”.
Getting sport event tourists to take advantage of other attractions and services within the host community is another way to maximize the direct effects of a destination sport event. This may be enhanced by the cooperation and collaboration of DMOs and the service providers in the community, who can develop strategies to make tourists more aware of other attractions and create special events to attract that particular group (Gibson, Willming, & Holdnak, 2003) That being said, sport event tourists are more likely to be involved in regular tourist activities if they stay in a host community for more than 24 hours. Therefore, it is incumbent upon DMOs to create a total package of interrelated activities designed to encourage sport tourists to stay for more than one day. In addition, DMOs who are attempting to build their brand through a single sport event must create an assortment of ancillary events. “A single event – even one with a high profile – has only a passing effect on the destination brand” (Chalip & Costa, 2005, p. 231).
Sport tourists tend to be aggressive in their searches for details on events to attend. They are also particular about the associated attractions of a sport event. They seek ‘bundles of benefits’. It will be important for the local DMO and associated businesses to strategically incorporate ancillary events into the mix of available events and attractions within the event community or region. Providing more attractions related to the event will create
Case Study: New Mexico Bowl
118
more perceived value for the potential tourist (Chalip & McGuirty, 2004).
Enhancing the sport tourist’s experience in a particular destination may be aided by providing multiple events and bases for affective involvement. This creates a deeper emotional involvement for the tourist by providing meaning to them through narratives, genres, and symbols (ie: flags, posters, murals, emblems that are displayed throughout the area during the time of the event). Harrison-Hill, and Chalip (2005). refer to this as “experience marketing” (p. 306). Experience marketing seeks to engage the sport tourist on many levels, including physical, emotional, intellectual, and even spiritual. This involvement can occur through two means – participation in activities and immersion in the experience. This allows for the consumer to have a more ‘authentic’ experience within the host community. The authors provide four factors that will enhance repeat sport tourist visitation: 1) A distinct sport servicescape (p. 307); 2) Good infrastructure and service; 3) Socializing opportunities; 4) Effective narratives, symbols, and genres. The servicescape is the physical environment in which the service takes place. This presents a challenge to the marketer as the physical characteristics of the servicescape cannot be altered to meet the wants and needs of the sport consumer. However using relevant theming related to the sport event can be used to embellish the servicescape and make it more appealing to the consumer. Service providers are also a part of shaping the consumer experience. Since the servicescape is a fixed asset and cannot be altered, customer service is important in shaping tourist experiences. Finally, the presence of other customers who are travelling to a particular destination have a profound influence on the experience of the sport tourist. Socializing activities with others is a large influence on a sport tourist’s decision to travel to a particular destination. Sport event visitors will sometimes stay in the city of the event beyond the time of the event, in order to spend more time with other like-minded tourists. This practice can be enhanced by local businesses that provide event-associated themes, signage, and promotions (Chalip & McGuirty, 2004).

Barnes & Ballou
119
It may be of use for DMOs to include activities and signage with themes that evoke memories related to the teams, personalities, and events of earlier times in order to attract sport tourists. As Gibson (2005, p. 136) noted, it may be important to showcase
…the nostalgia that is evoked by visiting tangible sites of former sporting glory such as sports stadia or museums, nostalgia can also be evoked by a group of sport tourists who have a history of participating together in a particular experience, such as an annual bus trip to watch their football team play.
Integration of a Sport Event into Overall Destination Marketing While the integration of a sport event into the overall destination marketing and branding of a city or region is seen as an effective way to directly and indirectly increase tourism to the host community, it must be done with care and careful planning. This is due to factors related to the event as well as factors related to the host community brand. First, successful community branding is enhanced by finding a way to portray the city’s distinctive qualities in ways that are easily understood by the target audience, harmonious with established beliefs held by that audience, and consistent (Zhang & Zhao, 2009). This means that the branding of the event should be related to the positive elements of the existing brand image of the community. It also means that the connection of the brand of the event should be recognizable to target consumers as being consistent with that of the community in general. Sport events are most effective when they can add to the ‘saliency’ of the overall place brand. This allows for generation of attitudes held by targets before, during, and after the event. As Chalip and Costa (2005, p. 219) wrote, “Branding a city or a region in order to promote tourism requires that available attractions and activities be identified and, if necessary, augmented or enhanced in a manner that is consistent with the brand image that the destination seeks to convey”. In other words, the brands of the event and the destination are judged more favorably by the targets if they are congruent with one another…likely creating greater image

Case Study: New Mexico Bowl
120
associations. Images of each should be ‘conceptually consistent’ with each other (Chalip & Costa, 2005). Harrison-Hill and Chalip (2005) echoed this contention and went even further by stating that not only should the event and the host community feature congruent brand image elements, they should also be marketed jointly. In this regard they wrote,
Bundling and co-branding share the requirement that destinations and the sport they host are marketed jointly. The sport is used to promote the destination, and the destination is leveraged to promote its sport. By capitalizing on the two simultaneously, each adds value to the other. This, in turn, requires that destination marketers and sport marketers form alliances to plan and implement the necessary marketing strategies. (p. 313)
Thus, a destination’s image is affected by the image of the events it hosts. How much affect will be determined by the congruence of the event and the place (Chalip, Green, & Hill, 2003). This notion is similar to the branding of product extensions in that success in the co-branding of a product (in this case, the host community) and an extension of that product (in this case, the sport event) requires that the “event’s inclusion in the destination’s product and service mix should appear rational. In other words, it needs to be shown that the event fits with other attractions and activities offered at the destination” (Chalip & Costa, 2005, p. 227).
Some destinations have a market position advantage in that they have historical relevance and/or they are in locals with favorable climates and geographic appeal. Events in these destinations have an advantage in attracting tourists. Events in destinations without an historical or geographic advantage may benefit from bundling or packaging their event with other elements of the place (Getz & McConnell, 2011). At the very least, the branding for the destination should be valid, believable, simple, not confusing, appealing (to the target consumer), and distinctive (Gertner & Kotler, 2004).

Barnes & Ballou
121
Two major roadblocks to the creation and maintenance of a consistent and congruous brand image of a community and a sport event in that community are the multitude of stakeholders within the community and the heterogeneity of the community. First, there is a challenge in providing a consistent brand message due to the existence of diverse values and opinions held by the various stakeholders within the community itself. Creating associated events is hindered by the fact that Destination Marketing Organizations (DMOs) and hospitality businesses often do not work together to coordinate the events (Chalip & McGuirty, 2004). This challenge must be overcome in order to allow the brand to deliver images that are not in conflict with one another (Zhang & Zhao, 2009). Thus, in order to better leverage a sport event for economic and social benefit, coordination of involvement by public and private entities is necessary (Kellett, Hede, & Chalip, 2008). This is especially true if the community wishes to realize tourist consumption of other various attractions within the community. It is important for DMOs to understand that just because sport event tourists will come to a community for an event, they will not automatically utilize the other attractions and services in the community. Getting sport event tourists to take advantage of those other attractions and services may be enhanced by the cooperation and collaboration of DMOs and the service providers in the community, who can develop strategies to make tourists more aware of other attractions and create special events to attract that particular group (Gibson, Willming, & Holdnak, 2003). Place heterogeneity is an issue that may also hinder the development of a consistent brand image. Because of the heterogeneity of a place – stakeholders, attractions, etc., resources must be pooled and marketing must be done in a coordinated manner in order to keep branding and marketing messages consistent as well as to get the most effect from marketing investment. As Fyall and Leask (2007) noted,
One of the primary frustrations for many destination marketers is their inability to control elements of the destination product…the difficulties of co-ordination

Case Study: New Mexico Bowl
122
and control have the potential to undermine a strategic approach to marketing based on destination branding because campaigns can be undertaken by a variety of tourist businesses with no consultation or co-ordination on the prevailing message or the destination values being promoted. (p. 55)
Again, creating and maintaining consistent brand image and brand messages is of major importance in overcoming these challenges. When a brand has a consistent message, consistent logo and colors, consistent images, etc., it is cohesive in the mind of the consumer. This means that the consumer has more detailed information about the brand and the product. It also means that the fit between each element within the brand schema fits well. When this occurs, the consumer sees and understands the connections between these elements. According to Gwinner and Bennett (2008),
Brand cohesiveness can be thought of as a measure of internal brand congruence. Keller (1993, p. 7) states that the “congruence among brand associations determines the ‘cohesiveness’ of the brand image—that is, the extent to which the brand image is characterized by associations or subsets of associations that share meaning”. Thus, brands that have developed non-ambiguous meanings are more cohesive than those brands whose meanings are more diffused. A brand’s image will be more cohesive to the extent that it has maintained the same positioning over time, has used consistent images (e.g., logos, colors, endorsers, slogans, etc.) in its promotional efforts, and has cultivated associations with other entities (e.g., sponsorship activities) that share a similar theme. (p. 413)
DMOs and event organizers should utilize tactics related to media coverage of the event in order to help create brand cohesiveness and a consistent brand image of a sport event within a destination community. Although media attention to a sport event may not specifically affect potential tourists’ intentions to visit a host

Barnes & Ballou
123
community, television coverage may be used to help create a more positive way the community is perceived, in general (Brown, 2007). This may entail infusion of local place culture in the brand and the marketing messages as well as the event itself (Fyall & Leask, 2007). For example, the New Mexico Bowl creates a new and unique trophy to be given to the winning team each year. This trophy is a ceramic bowl that is hand-maid and hand-painted by artists from one of the many Native American pueblos within the state.
The bottom line here is that the value of creating and hosting a sport event will be based, in part, on the ability of the sport event brand to, as Xing and Chalip (2006, p. 54) noted, “strengthen relevant aspects of the destination’s brand”.
History of the New Mexico Bowl Game
The first New Mexico Bowl game was played on December 23, 2006. That first game was the culmination of several months of accelerated negotiations and preparation to devise and define the game as well as to establish funding, create sponsorships, and generate all of the activities that surround a college football bowl game. The New Mexico Bowl was a creation of the New Mexico Sports Authority. The Authority proposed the idea to ESPN Regional Television (ERT) midyear in 2005, with the idea of matching up two leagues with prominent history in collegiate athletics in the state – the Mountain West Conference and the Western Athletic Conference (WAC). The automatic tie-in with the WAC ended prior to the 2011 bowl game and the current matchup features a member of the PAC-12 Conference. Although these conferences have automatic entries into the game, a member conference must have the required number of wins to be bowl eligible. This was not the case in the 2010 and 2011 games, as two non-affiliated conference schools were extended invitations to the game – University of Texas, El Paso in 2010, and Temple University in 2011. The New Mexico Bowl was proposed to the NCAA Bowl Certification Committee in April of 2006 and awarded the same day. Two other bowl games were also awarded at the time: The

Case Study: New Mexico Bowl
124
International Bowl in Toronto (no longer in existence) and the BBVA Compass Bowl in Birmingham, Alabama. In its first five years, the game lacked a true title sponsor and was simply known as the New Mexico Bowl. In 2011, ERT and Gildan, a Canada-based apparel manufacturer agreed to a five-year title sponsorship of the game. The current official title is the Gildan New Mexico Bowl. As part of the original arrangement when the bowl game was being created, the local organizing committee (LOC) insisted that “New Mexico” always would be part of the title and could never be removed as the LOC felt the identification of the bowl game as a geographical indicator would help aid in the marketing of the destination (J. Siembieda, personal communication, August 2, 2012). This was a logical decision as prior to the Gildan sponsorship that started in 2011, the Albuquerque Convention and Visitors Bureau and the New Mexico Department of Tourism were the two major sponsors of the event. And even with the new title sponsorship, both organizations continue their relationship with the game today. The New Mexico Bowl became the sixth bowl game of seven owned and operated by ESPN, the others being the Pioneer Las Vegas Bowl, Sheraton Hawai`i Bowl, Bell Helicopters Armed Forces Bowl, PapaJohns.com Bowl, the St. Petersburg Bowl, and the Texas Bowl. The Las Vegas bowl was the first bowl game acquired by ERT, and the Hawai’i Bowl was the first game the network started from inception. ESPN ventured into the world of bowl game ownership and operation as a means of extending the ESPN brand into host communities, and the brand is strengthened by the programming platform they provide. Regardless of the size of a bowl game, or the perception a game might have on national ranking implications, they tend to rate well (Overby, 2012). This is an important factor for the marketing of New Mexico as the reach of images and messages related to the community is extensive. According to ESPN’s 2010 New Mexico Bowl Partnership Review (ESPN, 2011), that reach was substantial. Based upon media equivalency figures, Albuquerque Convention and Visitors Bureau in-game signage and

Barnes & Ballou
125
mention exposure time value was estimated to be $1,245,270, City of Albuquerque signage and mention value was $732,330 and, signage and mention value for the ACVB web site address, itsatrip.org was $661,260. Furthermore, taking into account media equivalency values for exposure beyond the live broadcast (mentions and signage on ESPN programming and in national press coverage of the game), the total value of the game as a promotional tool for the City Albuquerque and State of New Mexico was $6,752,060. The New Mexico Bowl and Destination Marketing
Successful use of a sport event in order to enhance a destination image may be dependent upon how well the important attributes of the brand of the host community and the brand of the event match up. This contention is grounded in schema theory and the basic types of association factors might include attributes of the product, personality of the brand, user imagery, and experiential and symbolic benefits to the consumer (Xing & Chalip, 2006). Understanding this, it is beneficial to examine how well these factors match between the brands of the New Mexico Bowl and of the host communities. Destination marketers in the city and state were assigned the task of matching the bowl game events with the attractions, cultures, cuisines, affordability, and other areas used in a typical destination marketing campaign or convention selling process in the Albuquerque metro region. Understanding that, the brand imagery the Albuquerque Convention and Visitors Bureau, as well as the State of New Mexico Department of Tourism, has been related to educating meeting planners, sports event organizers, tourists, and leisure travelers about the city and state and what they have to offer visitors. Chalip and Costa (2005) asserted that tourists, leisure travelers, or fans of sports teams will use both cognitive and affective descriptions of a destination. Albuquerque and the state of New Mexico promote the cognitive images of its southwestern landscape, numerous outdoor activities, and how those natural resources have been combined with manmade structures in an effort to allow humans the opportunities to access these resources. The

Case Study: New Mexico Bowl
126
Sandia Peak Aerial Tramway, National Park Service trail systems, Rio Grande Valley Nature Centers, et al, are activities highlighted in bowl week, and marketed by the ACVB to the New Mexico Bowl staff as opportunities for which the teams may take advantage. The ACVB also puts these features into promotional materials for use with both teams’ fans. As a membership driven organization, the Albuquerque CVB goes to great lengths in associating its member businesses with convention delegates, leisure travelers, and those fans coming in to the New Mexico Bowl, or any other sporting event the city hosts. In its March 2006 Albuquerque’s Destination Master Plan (Harvey, et al, 2006, p. 3), organizations and leaders promoting Albuquerque as a destination led off the document with the following mission statement: “We will make Albuquerque a world class destination by preserving and promoting our authentic Southwest heritage, rich culture, dramatic landscape, and spectacular climate.” This has been evident in many aspects of the marketing and game-week activities of the New Mexico Bowl. A key component of the marketing campaign to incoming fans is to immediately immerse them into the culture of the area right away. One of the easiest ways to introduce the Southwest heritage is through the cuisine that is specific to Albuquerque and in New Mexico. Through the use of advertising collateral that shows photos of the food, the goal is to promote ACVB member dining options as early in the overall marketing process as possible. Other cultural aspects are featured in the initial marketing stages for visiting fans. Some of these relate to topics of interest that again are unique to the area. Albuquerque bills itself as the hot air ballooning capital of the world as evidenced by the long-running success of the Albuquerque International Balloon Fiesta. Another highlighted area is historic Old Town, where Albuquerque was originally settled more than 300 years ago, and now is the site of the aforementioned New Mexico Bowl pep rally. The Old Town Merchants Association benefits from the pep rally though exposure to out of town visitors numbering in the low thousands who, without the New Mexico Bowl, would likely never have been in

Barnes & Ballou
127
Albuquerque on a Friday evening in December, exploring the area and experiencing the modern day delicacies and shopping opportunities in original adobe structures, some of which are nearly 300 years old. The dramatic landscape of the area is highlighted during bowl week by exposing visitors to Sandia Peak via the Sandia Peak Aerial Tramway. Fans can take flights to the top of the peak with 50 people in each “tram”. Once at the top, more than 11,000 square miles of desert and mountain landscapes are available to the naked eye. These are all examples of the cognitive imagery Chalip and Costa (2005) asserted will help make a destination attractive to visitors. The ACVB and State Tourism Department also use an affective approach in marketing Albuquerque as a destination through the New Mexico Bowl. This is done through the use of four affective descriptors targeted during the decision-making phase for visitors to the city, as well as for those contemplating traveling to Albuquerque for the bowl game. The four descriptors are: affordability; accessibility; attractions; activities. It is acknowledged that these are common terms that many cities would use to describe their destination marketing efforts, especially in the Midwest and Southwest Regions of the United States. It should also be noted that cities in these regions adjust their pricing depending on the time of the year. As an example, prices visitors would expect to pay in Phoenix in summer months are far less expensive than prices from October to May, and the same reasoning holds true with destinations that offer winter skiing, or some other element justifying an increase based on seasonality. The affordability component refers to the cost of various travel methods to reach a destination, the cost of lodging, rental cars, or public transportation, as well as meals. With the limited time inherent to most bowl game travel, the ACVB and Department of Tourism promote the use of e-coupons and other options of saving money once fans get to Albuquerque. Realizing that short term flights are typically higher priced and out of the control of the destination marketing organizations, the destination marketers really

Case Study: New Mexico Bowl
128
amp up the efforts to promote the affordability of the destination once fans arrive. This element is something that is much more controllable. Albuquerque has long been marketed as an affordable destination overall, so it is crucial to provide information to incoming fans regarding the heightened levels of attractions and activities in relation to the attenuated levels of relative cost to enjoy them. Accessibility is related to the different ways travelers can get to a destination. As mentioned, the expense related to getting to a city is out of the control of the local destination marketing organizations. With that, when introducing the destination to visitors who likely don’t know much about the city, it is imperative that the ACVB provides all accessibility options to fans. This is related to a previous statement in this article and how important the education process is in the overall decision making process.
One other aspect that should be given careful consideration is the scenario that occurs for the New Mexico Bowl regarding team announcements. This component is critical as the destination marketing strategies are given very small windows to be put in place. The early date of the New Mexico Bowl provides a unique opportunity. Because the game has been the first bowl game of the bowl season for the last six years, TV ratings have been strong, with more than 2.5 million views each year regardless of the game’s matchup (Overby, 2012). The ratings are crucial to the destination’s exposure through the use of bumper shots coming in and out of commercial breaks. These bumper shots are extremely crucial to the destination because the ACVB has a lot of input on the content used in the buffer shots. Credit ERT for trusting that as the marketing arm for the destination, the ACVB is highly tuned to what the most effective visuals are when selling the destination. Often times, ACVB or Department of Tourism B-Roll footage is provided to supplement the live broadcast of the game. The sponsorships with the ACVB, and the Department of Tourism hinge on the level of image exposure the destination obtains during the broadcast. Since the game has proven to have a strong level of viewership as the first
Barnes & Ballou
129
bowl game of the season, this is likely the most important component of the sponsorship fulfillment. One crucial element that must be considered is the time available to put any type of marketing strategy in place. Consider that in 2011 the bowl announcements took place in early December, not quite two weeks prior to the game meaning that full-force marketing efforts started immediately to capitalize on the excitement of fans following the team announcements. The strategy applied by the ACVB is to immediately contact the alumni association of the schools selected to start the process of providing them lodging and attraction information.
Also the ACVB sends out ticket envelope stuffers with photos of the items mentioned previously in the cognitive selling process (cuisine, ballooning, mountains). These stuffers are the quickest way to direct fans to website information pertaining to the bowl game and the city itself. While the announcement of the teams coming to the game comes late, these are marketing items that can be prepared regardless of the teams selected. Once the teams were known, these deliverables are then put into place so that fans who are buying tickets to come, have access to attractions and activities as soon as the tickets are in their possession.
The New Mexico Bowl has benefitted on three different occasions with teams that were from markets relatively close to Albuquerque (Fort Collins, Colorado; Laramie, Wyoming; El Paso Texas) and ending bowl game droughts. This situation is a destination marketer’s dream come true, in that the marketing effort does not need to be as dependent on time and penetration in to that market as would Fresno, California. However, what the quick turnaround time does not allow is for extensive media penetration in each school’s home market. With Temple University in the 2011 game, the Philadelphia market would have been one that would have had large appeal as a targeted market to educate and create exposure for the city and state in a market not typically designated as a targeted area. As one of the major sponsors of the Gildan New Mexico Bowl, the Albuquerque Convention & Visitors Bureau receives a

Case Study: New Mexico Bowl
130
Total Exposure Valuation provided by ESPN soon after the broadcast. ESPN breaks down the various exposure areas and itemizes the value of each. The table below (Table 1) itemizes those varying exposure sources and assigns dollar values to them (ESPN, 2013). Exposure Source
Exposure Time
# of Mentions /Articles
Impressions Exposure Value
National Television 0:28:27 30 19,171,392 $1,760,480.00
Television News N/A 70 2,082,720 $36,260.16 On-site impact N/A N/A 0 $0.00 Advertising/Promotions
N/A N/A 0 $0.00
Print Media N/A 356 39,125,904 $685,003.40 Internet News N/A 1,063 43,296,589 $753,793.62 Total 0:28:27 1,519 103,676,605 $3,235,537.23
Table 1
Chalip (2006) stated two elements vital for creating liminality at sports events: The sense of celebration and the sense of social camaraderie. The celebration occurs at the end of a long season, and fans and participants come together to rejoice in a successful season. This occurs during the New Mexico Bowl often at pre-game pep rallies or during tailgating opportunities, at bowl-sponsored events, or at university or alumni-produced festivities. While these events are often attended en masse as part of a process of bringing strangers together due to a common bond (Chalip, 2006), the celebrations, and eventually the game itself, are normally attended and viewed by those who were previously acquainted. Within college bowl games history, the Gildan New Mexico Bowl is in its infancy. Ironically though, Albuquerque is one of the oldest cities in the United States, having celebrated it’s tricentennial in 2010. The similarities though that exist between the bowl game

Barnes & Ballou
131
and the city, and the entire state for that matter, are that the game, the city, and the state are not necessarily top-of-mind in each of their respective categories. What makes the bowl game a potential boon is that it provides much-needed exposure for a city and state that struggles with unfamiliarity at the national level. Albuquerque and the state of New Mexico are areas that benefit from the experience visitors have when they visit the destination. The dilemma has not necessarily been during the visit itself, but the process of getting convention goers, leisure travelers, and now bowl fans to consider the destination at all. The hope that lies with the Gildan New Mexico Bowl is that it invigorates the education process of travelers so that the city and state move up the list of desirable southwestern locations.
Case Study: New Mexico Bowl
132
References Brown, G., 2007. Sponsor hospitality at the Olympic Games: An
analysis of the implications for tourism. International Journal of Tourism Research, 9, 315-327
Chadwick, S. & Holt, M. (2008). Releasing latent brand equity: the case of UEFA’s Champions League. The Marketing Review, 2008, 8(2), 147-162.
Chalip, L. & Costa, C. 2005. Sport event tourism and the destination brand: Towards a general theory. Sport in Society, 8(2), 218-237.
Chalip, L., Green, B., & Hill, B. (2003). Effects of sport event media on destination image and intention to visit. Journal of Sport Management, 17, 214-234.
Chalip, L. & McGuirty, J. (2004). Bundling sport events with the host destination. Journal of Sport Tourism, 9(3), 267-282.
Deery, M., Jago, L., & Fredline, L. (2004). Sport tourism or event tourism: Are they one and the same? Journal of Sport Tourism, 9(3), 235-245.
Elbe, J., Hallén, L. & Axelsson, B. (2009). The destination- management organisation and the integrative destination-marketing process. International Journal of Tourism Research, 11, 283–296.
ESPN Regional Television. (2013, February). 2012 New Mexico Bowl Total Exposure Valuation. Charlotte, NC: ESPN Regional Television.
ESPN Regional Television. (2011, June). 2010 New Mexico Bowl Partnership Review Report. Charlotte, NC: ESPN Regional Television.
Fyall, A. & Leask, A. (2007). Destination marketing: Future issues — Strategic challenges. Tourism and Hospitality Research, 7(1), 50–63.
Gertner, D. (2011). Unfolding and configuring two decades of

Barnes & Ballou
133
research and publications on place marketing and place branding. Place Branding and Public Diplomacy, 7(2), 91–106.
Gertner, D. & Kotler, P. (2004). How can a place correct a negative image? Place Branding, 1(1), 50–57.
Getz, D. & McConnell, A. (2011. Serious sport tourism and event travel centers. Journal of Sport Management, 25, 326-338.
Gibson, H. (2005). Sport tourism: Concepts and theories. An introduction. Sport in Society, 8(2), 133-141.
Gibson, H., Willming, C., & Holdnak, A. (2003). Small-scale event sport tourism: Fans as tourists. Tourism Management, 24, 181-190.
Gwinner, K. & Bennett, G., 2008. The impact of brand cohesiveness and sport identification on brand fit in a sponsorship context. Journal of Sport Management, 22, 410-426.
Harrison-Hill, T. & Chalip, L. (2005). Marketing sport tourism: Creating synergy between sport and destination. Sport in Society, 8(2), 302–320.
Harvey, B., Kelsay, D. & Russell, D. (2006). Albuquerque’s Destination Master Plan (March 2006). Willard, Missouri: Egret Communications.
Hede, A. (2005). Sports-events, tourism and destination marketing strategies: an Australian case study of Athens 2004 and its media telecast. Journal of Sport Tourism 10(3), 2005, 187–200.
Kellett, P., Hede, A., & Chalip, L., (2008). Social policy for sport events: Leveraging (relationships with) teams from other nations for community benefit. European Sport Management Quarterly, 8(2), 101-121.
Kotler, P. & Gertner, D. (2002). Country as brand, product, and beyond: A place marketing and brand management perspective. Brand Management, 9(4-5), 249-261.
Malecki, E. (2004). Jockeying for position: What it means and why it matters to regional development policy when places compete. Regional Studies, 38(9), 1101-1120.

Case Study: New Mexico Bowl
134
Oudan, R. & Luparelli, A., 2011. Marketing and growth strategies for emerging economies: A case-study of Trinidad and Tobago. International Business & Economics Research Journal, 10(10), 71-81.
Schneider, R. & Bradish, C. (2006). Location, location, location: The marketing of place and Super Bowl XL. Sport Marketing Quarterly, 15(4), 206-213.
Shibli, S. & Coleman, R. (2005). Economic impact and place marketing evaluation: A case study of the World Snooker Championship. International Journal of Event Management Research, 1(1), 13-29.
Snelgrove, R., Taks, M., Chalip, L., & Green, C. (2008). How visitors and locals at a sport event differ in motives and identity. Journal of Sport & Tourism, 13(3), 165–180.
Tasci, A. & Kozak, M. (2006). Destination brands vs. destination images: Do we know what we mean? Journal of Vacation Marketing, 12(4), 299–317.
U.S. Department of Commerce: Bureau of Economic Analysis. (December 13, 2011).
Wood, E. (2005). Measuring the economic and social impacts of local authority events. International Journal of Public Sector Management, 18(1), 37-53.
Xing, X. & Chalip, L. (2006). Effects of hosting a sport event on a destination brand: A test of co-branding and match-up models. Sport Management Review, 9, 49-78.
Zhang, L. & Zhao, S. (2009). City branding and the Olympic effect: A case study of Beijing. Cities, 26, 245–254.
About
135
About The Journal of SPORT
The Journal of SPORT brings together in one journal the wide variety of research disciplines in sport and will be published biannually with Winter and Summer edition. The Journal of SPORT is published by the Center for Sport and Recreation Development at Kent State University. A faculty Advisory Board composed of nationally, as well as internationally recognized faculty participates in the peer mentorship review process. This unique, but distinctive, mentorship process provides opportunities for graduate students, at an array of institutions, to thoroughly analyze and review research in conjunction with a faculty mentor. The number of articles accepted will be limited through a selective review process. After the faculty mentored peer review is completed a final determination is made to accept or reject the article. The Journal of SPORT encourages faculty and/or students to submit their research for review.
Submission Guidelines
See www.thejournalofsport.com for Submission Guidelines.
Editor
Mark Lyberger Kent State University
Production Coordinator
Aaron Mulrooney
Kent State University

About
136
Student Review Board
Patrick Gentile Kent State University
Sean Hanus
Kent State University
Mike Jones Kent State University
Ashley Just
Kent State University
Zach Keller Kent State University
Sean Offerdahl
Kent State University
Editorial Review Board (Volume 3 Issue 1)
Edward Bolden Kent State University
Andrew Carnes
Kent State University
Walter Davis Kent State University
Judy Devine
Kent State University
Shawn Fitzgerald Kent State University
G. Leticia Gonzalez Kent State University

About
137
Marta Guivernau Kent State University
Jonathan Jensen
The Ohio State University
Sun J. Kang The Ohio State University
Jennifer Kulics
Kent State University
Greg Lott The Ohio State University
Kristy McCray
The Ohio State University
Mauro Palmero East Tennessee State University
Megan Parietti
The Ohio State University
Michael Rebold Kent State University
Kimberly Schimmel Kent State University
Robert Stadulis
Kent State University
Per Gunnar Svensson University of Louisville
Theresa Walton
Kent State University

About
138