volume 3 issue 2 year 2015
178
CONTENTS EDITOR’S INTRODUCTION i Simona VINEREAN THE INFLUENCE OF COMBINED ASSURANCE INITIATIVES ON THE EFFICIENCY OF RISK MANAGEMENT IN RETAIL SMALL AND VERY SMALL ENTERPRISES IN BELLVILLE, SOUTH AFRICA 63 Samantha PRINSLOO, Candice WALKER, Lise BOTHA, Juan-Pierre BRUWER, Yolande SMIT LEAN TOOLS IN THE IT SECTOR 82 Zoltan VAJNA COMPETENCE UTILIZATION FOR INNOVATION CAPABILITIES - A QUESTION OF TRUST? 90 Bria BOLZERN-KONRAD, Carolin EGGER, Erika SUMILO STRESS AND TIME MANAGEMENT SETTINGS IN UNIVERSITY OF MAROUA, CAMEROON 105 Joseph BESONG BESONG PRODUCING JUST PAPERS OR CREATING ADDED VALUE? SNAP-SHOT ABOUT QUALITY SYSTEMS AT HUNGARIAN SMES 111 Emil NYERKI, Robert LIPPERT, Emil NYERKI Jr. QUALITY SERVICE AND ITS RELATION WITH GLOBAL SATISFACTION IN FAST FOOD CONSUMERS. A CASE STUDY 119 Luis Enrique IBARRA MORALES, Jesús VELÁZQUEZ, Lourdes PARTIDA, Cinthia FRANCO ARE HOUSING MARKETS DECOUPLED? A CASE STUDY OF RESIDENTIAL REAL ESTATE AFFORDABILITY IN AUSTRIA 129 Florian PHILIPP ISSN 2344-6781 Expert Journal of Business and Management VOLUME 3 ISSUE 2 YEAR 2015
-
Upload
khangminh22 -
Category
Documents
-
view
5 -
download
0
Transcript of volume 3 issue 2 year 2015
CONTENTS
EDITOR’S INTRODUCTION i
Simona VINEREAN
THE INFLUENCE OF COMBINED ASSURANCE INITIATIVES ON THE EFFICIENCY OF RISK MANAGEMENT
IN RETAIL SMALL AND VERY SMALL ENTERPRISES IN BELLVILLE, SOUTH AFRICA 63
Samantha PRINSLOO, Candice WALKER, Lise BOTHA, Juan-Pierre BRUWER, Yolande SMIT
LEAN TOOLS IN THE IT SECTOR 82
Zoltan VAJNA
COMPETENCE UTILIZATION FOR INNOVATION CAPABILITIES - A QUESTION OF TRUST? 90
Britta BOLZERN-KONRAD, Carolin EGGER, Erika SUMILO
STRESS AND TIME MANAGEMENT SETTINGS IN UNIVERSITY OF MAROUA, CAMEROON 105
Joseph BESONG BESONG
PRODUCING JUST PAPERS OR CREATING ADDED VALUE? SNAP-SHOT ABOUT QUALITY SYSTEMS AT
HUNGARIAN SMES 111
Emil NYERKI, Robert LIPPERT, Emil NYERKI Jr.
QUALITY SERVICE AND ITS RELATION WITH GLOBAL SATISFACTION IN FAST FOOD CONSUMERS.
A CASE STUDY 119
Luis Enrique IBARRA MORALES, Jesús VELÁZQUEZ, Lourdes PARTIDA, Cinthia FRANCO
ARE HOUSING MARKETS DECOUPLED? A CASE STUDY OF RESIDENTIAL REAL ESTATE AFFORDABILITY IN
AUSTRIA 129
Florian PHILIPP
ISSN 2344-6781
Expert Journal of Business andManagement
VOLUME 3ISSUE 2
YEAR 2015
Expert Journal of Business and Management http://business.expertjournals.com
Copyright © 2015 Sprint Investify.
This issue is now available at: http://business.expertjournals.com/2015-3-2
Editors-in-Chief
Simona VINEREAN Sprint Investify Research Unit [email protected]
Alin OPREANA Lucian Blaga University of Sibiu [email protected]
Associate Editors
Lucian BELAȘCU, Lucian Blaga University of Sibiu
Anca ȘERBAN, Lucian Blaga University of Sibiu
Alexandra VINEREAN, Lucian Blaga University of Sibiu
Contributing Editors
Juan-Pierré BRUWER, Cape Peninsula University of Technology, South Africa
Francesco CIAMPI, University of Florence, Italy
Li Xue CUNNINGHAM, Cass Business School, City University London, United Kingdom
Alfredo D’ANGELO, University of Glasgow, Adam Smith Business School, United Kingdom
Niccolò GORDINI, University of Milano – Biccoca, Italy
Pushkar P. JHA, Northumbria University, Newcastle upon Tyne, United Kingdom
Grigorios L. KYRIAKOPOULOS, National Technical University of Athens (NTUA), Greece
Rainer LUEG, Aarhus University, Denmark
José Maria MERIGÓ i LINDAHL, University of Barcelona, Spain
Bartosz WITKOWSKI, Warsaw School of Economics, Poland
Aims and Scope
The purpose of the Expert Journal of Business and Management is designed to be an open source forum for a dissemination of relevant and original scientific
articles dealing with aspects of business and management. Expert Journal of Business and Management is an interdisciplinary journal that aims to publish
thought-provoking and insightful articles of interest to business research and management.
Expert Journal of Business and Management provides insights and foresights to practitioners (CEOs, boards of directors, industry consultants, strategic
executives, and managers) and scholars (academics, researchers, lecturers, students) interested in business management articles.
Submitted papers should cover theoretical or empirical manuscripts meant to provide relevant insights into the current management and have significant
implications for business practice and research. Nonetheless, Expert Journal of Business and Management also publishes research articles, empirical studies, case
studies, research notes, simulations, teaching notes, and book reviews.
All manuscripts should reflect original contributions and not be under consideration for publication elsewhere. The submitted papers should exhibit relevancy,
value, originality, argumentation, reasoning, and analysis. Expert Journal of Business and Management is a double peer review process and is published by Sprint
Investify.
Coverage includes, but is not limited to: Business Strategy and Policy, Business Performance Modeling, Entrepreneurship, Human Resource Management,
Organizational Behavior, Organizational Theory, Supply Chain Management, Strategic Management, Business Ethics, Corporate Social Responsibility, Quality
Management, Innovation and Change Theory, Cross-Cultural Management, Crisis Management, Corporate Intrapreneurship, Leadership, International Business,
Operations Management, Logistics.
Publisher
Expert Journal of Business and Management is published by Sprint Investify. Expert Journal of Business and Management is published online at
http://business.expertjournals.com. Visit the journal’s homepage for details of the aims and scope, instructions to authors, submission process and Editor contact
details. Use the website to search online tables of contents, read articles and submit your papers.
Expert Journal
of
Business and Management
Editors in Chief
SIMONA VINEREAN Sprint Investify Research Unit
ALIN OPREANA Lucian Blaga University of Sibiu
Volume 3, Issue 2
Year 2015
Copyright © 2015 Sprint Investify • ISSN-L 2344-6781 • Online ISSN 2344-6781
http://business.expertjournals.com
© 2015 Sprint Investify. Expert Journal of Business and Management is published by Sprint Investify.
ISSN 2344-6781
Article Review Process
Expert Journal of Business and Management has a two-stage review process in order to be accepted for publication.
In the first stage, the business management articles are reviewed by one editor who will verify the reasoning of the paper
and if the article fits the aim and scope of Expert Journal of Business and Management. Articles that do not concur to the
journal’s scope are rejected. Articles that are already published fully or partly in other publications or websites are neither
reviewed, not accepted. The editor decides if the paper should be assessed by a reviewer.
In the second stage, the paper will be verified by at least one reviewer for detailed comments on how to improve the
paper. In the peer review process of Expert Journal of Business and Management, the identities of the reviewers and
authors remain anonymous. Whether a business management article is accepted or rejected depends on the average
score given by reviewers. The reviewer grades a submitted article on a scale of 1 to 5. To be accepted for publication, the
article must obtain an average score of at least 2.5.
Originality and Plagiarism
All the articles sent to Expert Journal of Business and Management should reflect original works, and the authors should
appropriately cite and quote any influential publication or work of other authors. Please take note that we examine all
submitted research articles for plagiarism and check for resemblances and similitudes to existing published papers. Articles
that denote any form of plagiarism are rejected.
Article Copyright
The copyrights for articles published in Expert Journal of Business and Management belong to the authors. The journal is
granted the first publication right. However, the journal is not responsible for subsequent uses of the authors’ work.
Expert Journal of Business and Management
Volume 3 ● Issue 2 ● 2015 ● ISSN 2344-6781
CONTENTS
Editor’s Introduction i
Simona VINEREAN
The Influence of Combined Assurance Initiatives on the Efficiency of Risk Management in Retail
Small and Very Small Enterprises in Bellville, South Africa 63
Samantha PRINSLOO, Candice WALKER, Lise BOTHA, Juan-Pierre BRUWER,
Yolande SMIT
LEAN Tools in the IT Sector 82
Zoltan VAJNA
Competence Utilization for Innovation Capabilities - A Question of Trust? 90
Britta BOLZERN-KONRAD, Carolin EGGER, Erika SUMILO
Stress and Time Management Settings in University of Maroua, Cameroon 105
Joseph BESONG BESONG
Producing Just Papers or Creating Added Value? Snap-Shot about Quality Systems at Hungarian SMEs 111
Emil NYERKI, Robert LIPPERT, Emil NYERKI Jr.
Quality Service and its Relation with Global Satisfaction in Fast Food Consumers. A Case Study 119
Luis Enrique IBARRA MORALES, Jesús VELÁZQUEZ, Lourdes PARTIDA, Cinthia FRANCO
Stress and Time Management Settings in University of Maroua, Cameroon 129
Florian PHILIPP
A Conceptual Mapping Resource Advantage Theory, Competitive Advantage Theory, and Transient
Competitive Advantage 140
Jasanta PERANGINANGIN
Remodeling Strategic Staff Safety and Security Risks Management in Nigerian Tertiary Institutions 150
Sunday S. AKPAN, Isaac A. AYANDELE
Global Leadership and Organizational Change from Past to Now 166
Alexander STELZER
Upper Echelon Theory: Role of Community and Strategy 171
Majdi Anwar QUTTAINAH
The Impact of SOX Adoption on the Compensation of Non-US Companies’ Boards: The Case of
Canadian Companies 182
Nadejda SERDIUC, Hanen KHEMAKHEM
Supplier Analysis of the IMMEX in Sonora 189
Rosalina JAIME MEULY
Human Resource Management’s Marketing Approach and Its Contribution Towards Employee-
Satisfaction 194
Susanna MINDER, Signe BALINA
Linear and Non-Linear Regression: Powerful and Very Important Forecasting Methods 205
Athanasios VASILOPOULOS
Ex pe r t J o ur na l o f B us ine s s a nd M a n ag e me nt , Vo lu m e 3 , I s su e 2 , p p . i - i i i , 2 0 1 5
© 2 0 1 5 T h e Au t h or . Pu b l i sh e d b y S pr i n t I n v e st i fy . I SSN 2 3 4 4 -6 7 8 1
ht t p : / /Bu s in e s s . Ex p e r t J ou r na l s . c o m
i
Editor’s Introduction to Volume 3, Issue 2 of
Expert Journal of Business and Management
Simona VINEREAN*
Sprint Investify
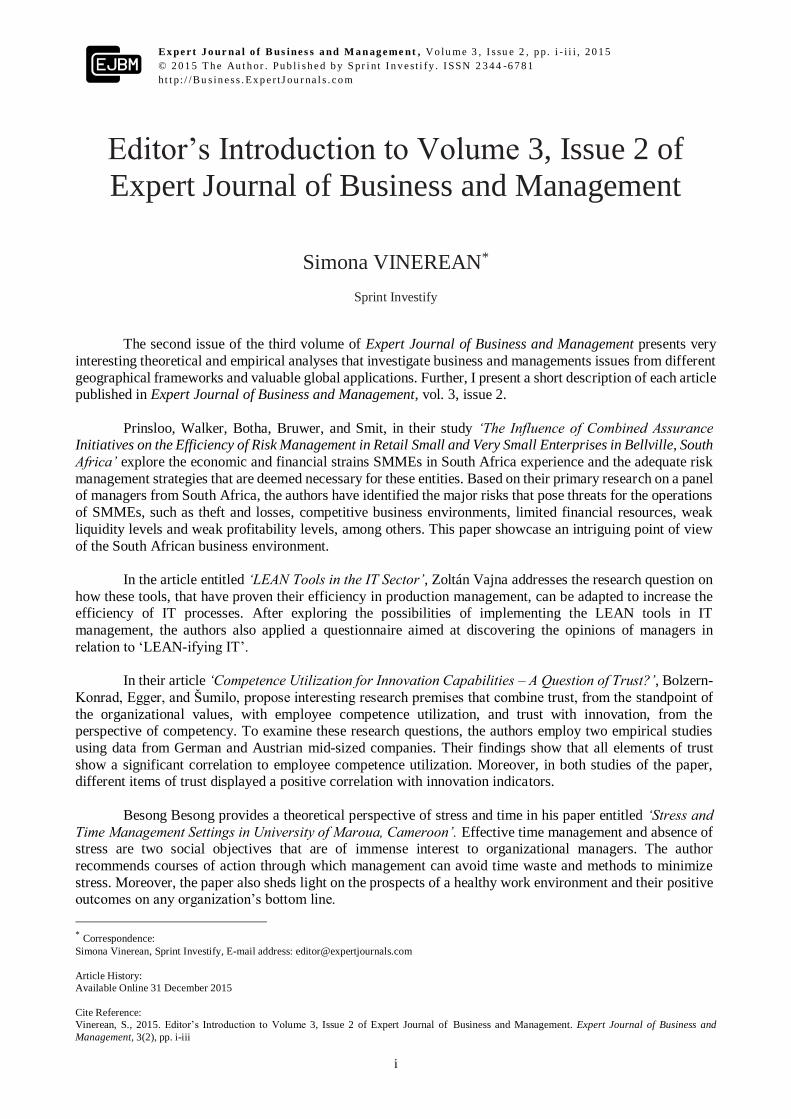
The second issue of the third volume of Expert Journal of Business and Management presents very
interesting theoretical and empirical analyses that investigate business and managements issues from different
geographical frameworks and valuable global applications. Further, I present a short description of each article published in Expert Journal of Business and Management, vol. 3, issue 2.
Prinsloo, Walker, Botha, Bruwer, and Smit, in their study ‘The Influence of Combined Assurance Initiatives on the Efficiency of Risk Management in Retail Small and Very Small Enterprises in Bellville, South
Africa’ explore the economic and financial strains SMMEs in South Africa experience and the adequate risk
management strategies that are deemed necessary for these entities. Based on their primary research on a panel of managers from South Africa, the authors have identified the major risks that pose threats for the operations
of SMMEs, such as theft and losses, competitive business environments, limited financial resources, weak
liquidity levels and weak profitability levels, among others. This paper showcase an intriguing point of view
of the South African business environment.
In the article entitled ‘LEAN Tools in the IT Sector’, Zoltán Vajna addresses the research question on
how these tools, that have proven their efficiency in production management, can be adapted to increase the efficiency of IT processes. After exploring the possibilities of implementing the LEAN tools in IT
management, the authors also applied a questionnaire aimed at discovering the opinions of managers in
relation to ‘LEAN-ifying IT’.
In their article ‘Competence Utilization for Innovation Capabilities – A Question of Trust?’, Bolzern-
Konrad, Egger, and Šumilo, propose interesting research premises that combine trust, from the standpoint of
the organizational values, with employee competence utilization, and trust with innovation, from the perspective of competency. To examine these research questions, the authors employ two empirical studies
using data from German and Austrian mid-sized companies. Their findings show that all elements of trust
show a significant correlation to employee competence utilization. Moreover, in both studies of the paper, different items of trust displayed a positive correlation with innovation indicators.
Besong Besong provides a theoretical perspective of stress and time in his paper entitled ‘Stress and
Time Management Settings in University of Maroua, Cameroon’. Effective time management and absence of stress are two social objectives that are of immense interest to organizational managers. The author
recommends courses of action through which management can avoid time waste and methods to minimize
stress. Moreover, the paper also sheds light on the prospects of a healthy work environment and their positive outcomes on any organization’s bottom line.
* Correspondence:
Simona Vinerean, Sprint Investify, E-mail address: [email protected]
Article History:
Available Online 31 December 2015
Cite Reference:
Vinerean, S., 2015. Editor’s Introduction to Volume 3, Issue 2 of Expert Journal of Business and Management. Expert Journal of Business and
Management, 3(2), pp. i-iii
Vinerean, S., 2015. Editor’s Introduction to Volume 3, Issue 2 of Expert Journal of Business and Management.
Expert Journal of Business and Management, 3(1), pp. i-iii
ii
Nyerki, Lippert, Nyerki, E. Jr, in their paper ‘Producing Just Papers or Creating Added Value?
Snap-Shot about Quality Systems at Hungarian SMEs’, they tackle certification of quality management
systems in small and middle sized companies, by exploring the responses of 50 managers from Hungary. Their study has showed that there is a notable gap between written procedures and the daily operations of companies.
Furthermore, based on their findings, the authors propose different management practices so that the quality
management systems can be implemented and sustained in daily operations.
Ibarra Morales, Velázquez, Partida, and Franco wrote and published a research paper, entitled ‘Quality
Service and its Relation with Global Satisfaction in Fast Food Consumers. A Case Study’, which examines
the concepts of quality service and customer satisfaction. More specifically, in this study, the authors undergo a comprehensive analysis of quality service for fast food in Mexico, by using the Service Performance
(Servperf) as a model to examine consumer satisfaction on a qualitative sample of Burger King’s customers.
For their empirical analysis, the authors use various methods of validation of the main relationship and research question of their study.
Philipp, in his article ‘Are Housing Markets Decoupled? A Case Study of Residential Real Estate
Affordability in Austria’, explores two main research questions: (i) the impact of changes in net household incomes in comparison with the changes in real estate prices in Austria, and (ii) the impact of changes in the
base interest rate on the affordability of real estate in relation to the household income. Philipp’s
comprehensive and innovative research led to various interesting results related to the prices for dwellings and house affordability.
Jasanta Peranginangin’s paper, ‘A Conceptual Mapping Resource Advantage Theory, Competitive
Advantage Theory, and Transient Competitive Advantage’, approaches various theories that are meant to explain important strategies in organizations that need to pursue innovation in order to remain competitive in
a fierce business environment. The theoretical framework created in this article is comprehensive and opens
the discussion of the importance of human development supported by dynamic resources.
Akpan and Ayandele explored two main topics of organizational management, namely safety and
security management and control, in their paper entitled ‘Remodeling Strategic Staff Safety and Security Risks Management in Nigerian Tertiary Institutions’. Their results showed a positive relationship between the
funding of security management and workers’ performance. Most importantly, their study offers practical
suggestions for implementation in higher education institutions in order to assure a safe environment for staff
in distress working situations.
Alexander Stelzer extends the management literature related to organizations in his article ‘Global
Leadership and Organizational Change from Past to Now’. He explores the concept of organizational theory from the point of view of classical approaches, behavioral approaches, and situational approaches. The author
also proposes a differentiation between firms and educational organizations, based on their distinct ways of
operation.
Majdi A. Quttainah’s paper ‘Upper Echelon Theory: Role of Community and Strategy’ examines an
intriguing research question related to the impact of community on framing the cognitions of CEOs and top
executive. Furthermore, the author extends his study by exploring the ways in which an organization can overcome the boundaries associated with its location and the ways in which it can adapt to grow both
domestically and internationally. This original study offers theory-backed propositions that add to current
knowledge on upper echelon theory and its relation to community’s impact on decision-making for managers.
The article ‘The Impact of SOX Adoption on the Compensation of Non-US Companies’ Boards: The
Case of Canadian Companies’, authored by Nadejda Serdiuc and Hanen Khemakhem, provides an empirical
analysis of 17 Canadian companies listed on US stock exchanges as it examines the existence of a relationship between the adoption of SOX and the board of directors’ rise of cash compensation. Their ANCOVA-related
findings also highlight different effects of the SOX according to the size of the companies sampled for this
research.
Vinerean, S., 2015. Editor’s Introduction to Volume 3, Issue 2 of Expert Journal of Business and Management.
Expert Journal of Business and Management, 3(1), pp. i-iii
iii
Rosalina Jaime Meuly’s paper (‘Supplier Analysis of the IMMEX in Sonora’) provides an interesting read on the factors that prevent local suppliers, from Sonora, Mexico, in playing a bigger part at a local
business and in offering their services to international companies. By approaching notable and appropriate
literature sources related to different supply models, the author explores in detail the advantages and disadvantages of local supplies and their opportunity to further development. Also, this study also offers
perspectives and recommendations for local government to monitor and sustain the activities of local
suppliers.
In ‘Human Resource Management’s Marketing Approach and Its Contribution Towards Employee-
Satisfaction’, Minder and Balina discuss employer attractiveness for acquiring and retaining top talent, by
pursuing a marketing approach in achieving employee satisfaction. The empirical analysis of the quantitative research involves causal modelling and triangulation, as well as exhaustive explanations of the results and
potential implications. Their findings exhibit a direct relationship between an HRM from a marketing
perspective and employee satisfaction. Moreover, their analysis also highlights the importance of this approach in relation to a company’s brand awareness on the labor market and to the attractiveness of an
organization for potential employees.
Athanasios Vasilopoulos’s article entitled ‘Linear and Non-Linear Regression: Powerful and Very Important Forecasting Methods’ presents comprehensive analyses of four types of regression (linear model,
exponential model, power model, quadratic model) which are examined through manual calculations and
MINITAB compilations. His detailed input offers other researchers valuable insights on how to choose the most appropriate model in terms of ‘best-fit’ for a widely popular forecasting technique.
A Final Thought On behalf of the Expert Journal of Business and Management Editorial Board, I would like to thank
our Authors for publishing their valuable research with us, our Reviewers for their incredible work ethic and
commitment, and our Readers for advancing and disseminating the work we publish in their future articles!

Exper t J o urna l o f Bus iness a nd Ma na g e men t , V o lu m e 3 , Is su e 2 , p p . 6 3 -8 1 , 20 1 5
© 2 0 1 5 Th e Au th or s . Pu b l i sh ed b y Sp r in t In v es t i f y . IS S N 2 3 4 4 -6 78 1
h t t p : / / Bu s in ess .Exp er t J ou rn a ls . c om
63
The Influence of Combined Assurance Initiatives
on the Efficiency of Risk Management in Retail
Small and Very Small Enterprises in Bellville,
South Africa
Samantha PRINSLOO1, Candice WALKER1, Lise BOTHA1,
Juan-Pierré BRUWER1*, and Yolandé SMIT2
1Cape Peninsula University of Technology, South Africa
2Independent researcher
According to the South African Small Business Act No. 102 of 1996 Small Medium
and Micro Enterprises (SMMEs) are regarded as separate small business entities
owned by one or more owners; operating in various sectors of the national economy.
SMMEs play a significant role in contributing to the South African economy,
particularly by means of providing employment opportunities and assisting in the
equal distribution of wealth. Albeit the latter prior research reveals that 80% of
SMMEs do not ‘survive’ beyond their first five years of existence. Plausible reasons
for the latter include the influence of micro-economic factors and macro-economic
factors; resulting in direct, inevitable risks being placed on the overall existence of
SMMEs. In order to identify and manage these risks, SMMEs need to make use of
adequate risk management strategies. More often than not a risk management
strategy should eliminate and/or mitigate risks and provide reasonable assurance
that business objectives will be achieved in the foreseeable future. To assist in the
attainment of the latter, combined assurance initiatives should be used since it is
believed to enhance both the understanding and treatment of risks; providing
management with optimum assurance that its relevant objectives will be met in the
foreseeable future. Stemming from the above, the perception was formulated that
SMMEs do not have adequate risk management strategies in place due to the lack of
combined assurance initiatives. This research study consisted of survey research
whereby 30 questionnaires were collected from SMME management (i.e. owners
and/or managers) – all of whom had to adhere to a strict set of delineation criteria.
It was found that SMMEs make use of semi-formal risk management strategies to
mitigate and/or eliminate risks which are somewhat effective, but applicable risks
are not optimally managed due to a lack of ample combined assurance initiatives.
Keywords: small and very small enterprises, risk management, risk management
strategies, risk, assurance, combined assurance
JEL Classification: G32
* Corresponding Author:
Juan-Pierré Bruwer, Faculty of Business, Cape Peninsula University of Technology, P.O.Box 625, Cape Town, 8000, South Africa
Article History: Received 22 March 2015 | Accepted 19 April 2015 | Available Online 19 May 2015
Cite Reference: Prinsloo, S., Walker, C., Botha, L., Bruwer, J.P., and Smit, Y., 2015. The Influence of Combined Assurance Initiatives on the Efficiency of Risk
Management in Retail Small and Very Small Enterprises in Bellville, South Africa. Expert Journal of Business and Management, 3(2), pp.63-81
Prinsloo, S., Walker, C., Botha, L., Bruwer, J.P., and Smit, Y., 2015. The Influence of Combined Assurance Initiatives on the Efficiency of Risk
Management in Retail Small and Very Small Enterprises in Bellville, South Africa. Expert Journal of Business and Management, 3(2), pp.63-81
64
1. Introduction
Small Medium Micro Enterprises (SMMEs) are formally defined in terms of the South African Small
Business Act No. 102 of 1996 as separate and distinct business entities, including cooperative enterprises and
non-governmental organisations, managed by one or more owner which, including its branches or subsidiaries,
if any, are predominantly carried on in any sector or subsector of the economy (South Africa, 1996).
Furthermore, the South African government views SMMEs as important to achieve three main objectives
which are: 1) to alleviate poverty, 2) to create employment opportunities, and 3) to promote economic growth
(South Africa, 1996). The importance of SMMEs is especially significant in developing economies. In the case
of South Africa, these entities contribute between an estimated 27% and 34% towards the national Gross
Domestic Product (GDP) (Department of Trade and Industry, 2008). In a global context the importance of
SMMEs is substantiated by Shah and Khedkar (2006) who aver that significant contributions, in respect of
employment figures, manufacturing and exports statistics and the national GDP, mainly derive from SMME
activities (Roberts, 2006).
Notwithstanding the above Giliomee (2004) is of the opinion that more than 80% of South African
SMMEs do not ‘survive’ beyond their first five years of existence and therefore, the objectives as imposed on
SMMEs, as per their legislative definition, are not being attained with great success. Both macro-economic
factors and micro-economic factors, such as uncertain financial prospects, government regulations (law),
increases in inflation, increases in interest rates and market instabilities, among others, have been reported to
have an adverse influence on the existence-rate of SMMEs (Brink, et al., 2003). The Department of Trade and
Industry (2008) make mention that SMME leaders generally do not possess the skills required to manage,
maintain and/or develop their respective businesses which results in the ineffective generation of income.
Hence it is not surprising that the failure rate of SMMEs in South Africa places a stigma on these entities to
be very ‘risky’ (Bizbooks, 2008).
Manu (2005) explains that a “risk” can be viewed as a possibility of an incident happening that will
impact upon the objectives of an organisation, be it positive or negative. In turn, the management of such risks
is a whole process, effected by an entity’s relevant management (and other personnel), in a strategic setting,
to help identify potential events that may affect the business and manage them according to the ‘risk appetite’
of the relevant business (COSO, 2004). The latter should evidently provide reasonable assurance regarding the
achievement of a business’ objectives. Furthermore, the Institute of Internal Auditors (2009) explains that risks
should be managed by means of utilising preventive, detective and corrective measures – holding strong
relevancy to the Enterprise Risk Management (ERM) framework. The ERM framework pertains to the
identification, evaluation, controlling, monitoring and reporting of risks - ensuring that risks are managed
effectively all together, other than being managed in ‘silos’ (Beasley, et al., 2006).
To aid in the management of risks Simnett, et al. (2009) explain that different assurance providers
exist to provide businesses with ‘information’ about their identified risks (hazards and opportunities), and
recommends the best way(s) in which these risks need to be managed to provide optimum assurance that
businesses’ objectives will be attained. Assurance providers are generally demarcated as ‘internal assurance
bodies’ and ‘external assurance bodies’. These assurance providers should find evidence of controls that have
been put in place to prevent risks from realising and also recommend ways in which to minimise the related
adverse impact in the event of an occurrence of threats. Businesses holistically benefit from assurance related
‘services’ because it improves the efficiency of risk management within a business. Assurance that is provided
in a collaborative manner between ‘internal assurance providers’ and ‘external assurance providers’ is better
referred to as ‘combined assurance’ (Grant Thornton, 2012).
The crux of the matter, according to KPMG (2009), is that effective risk management and optimum
assurance are attained by implementing the “three lines of defence structure”. The first line of defence
constitutes of assurance provided by management in their review of daily business processes. The second
assurance line is provided by oversight functions within the entity to ensure compliance with organisational
policies, procedures, laws and regulations. Independent assurance providers that provide assurance over the
mentioned business operations and oversight functions form the final line of assurance (KPMG, 2009). These
oversight functions are generally monitored by the audit committee of an organisation which, in turn, oversees
the integrated reporting, internal financial control and risk management processes (Institute of Directors,
2009). The role of the audit committee is supported by the internal audit function, external audit function, as
well as other assurance providers.
Although most SMMEs do not necessarily have the resources to employ formal audit committees
(Ngary, et al., 2014), the owners and/or managers should take up the responsibility of fulfilling the tasks of an
audit committee – ultimately taking on sole responsibility for ensuring that assurance activities are ‘on track’.
Prinsloo, S., Walker, C., Botha, L., Bruwer, J.P., and Smit, Y., 2015. The Influence of Combined Assurance Initiatives on the Efficiency of Risk
Management in Retail Small and Very Small Enterprises in Bellville, South Africa. Expert Journal of Business and Management, 3(2), pp.63-81
65
King III corroborates the importance of the audit committee function in SMMEs by encouraging private
companies, regardless of size, to voluntarily appoint audit committees if resources allow for it (Institute of
Directors, 2009). Hence, it is clear that SMME leaders are placed in a disadvantaged position through the lack
of resources to identify imminent risks which their businesses face due to the lack of proper internal controls
and assurance activities (Noorvee, 2006).
Stemming from the above it is clear that SMMEs are influenced by the existence of risks and, as such,
these risks need to be effectively managed. Due to the fact that a combined assurance initiatives are not
‘mandatory’ for SMMEs (and due to various resource limitations) it is highly probable that these entities are
not necessarily managing their risks as effectively as they should. Hence, the authors formulated the perception
that SMMEs do not have adequate risk management strategies in place due to the lack of combined assurance
initiatives
In order to shed light on the latter research problem, the following questions were asked:
What type of risks do SMMEs encounter?
How do SMME leaders identify risks?
How do SMME leaders manage identified risks?
What assurance providers do SMMEs make use of?
What is the value that these assurance providers add to SMMEs?
To what extent do SMMEs make use of combined assurance?
2. Literature Review
2.1. Overview of South African SMMEs
The National Small Business Act No. 102 of 1996, as replaced by The National Small Business
Amendment Act 26 of 2003, and enacted by the South African government, refers to SMMEs as separate and
specific business entities, which are managed by one or more owner(s) trading in any sector and/or subsector
of the national economy (South Africa, 1996). The above-mentioned Act further classifies SMMEs in terms
of their size as “micro”, “very small”, “small” and “medium” (South Africa, 2003). The categorisation of
SMME sizes are based on one or more of the following criteria: 1) the number of employees employed on a
full-time basis, 2) total turnover per annum, 3) total gross asset value (excluding fixed property). A more
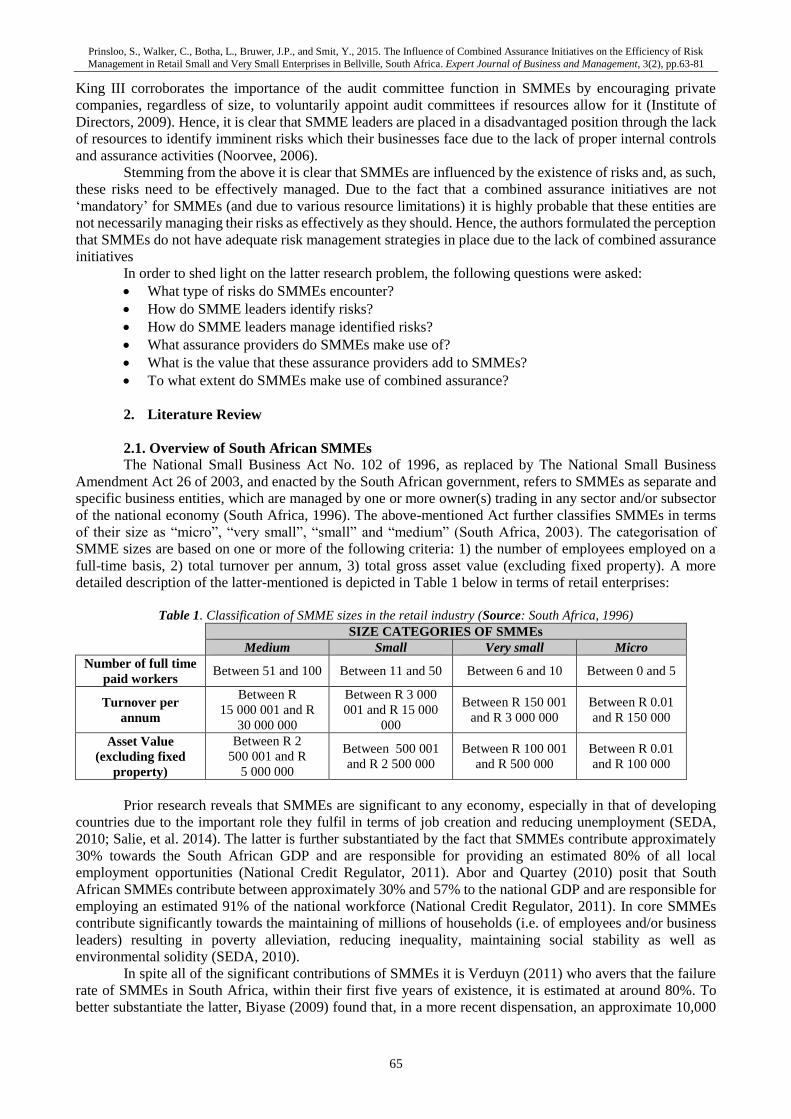
detailed description of the latter-mentioned is depicted in Table 1 below in terms of retail enterprises:
Table 1. Classification of SMME sizes in the retail industry (Source: South Africa, 1996)
SIZE CATEGORIES OF SMMEs
Medium Small Very small Micro
Number of full time
paid workers Between 51 and 100 Between 11 and 50 Between 6 and 10 Between 0 and 5
Turnover per
annum
Between R
15 000 001 and R
30 000 000
Between R 3 000
001 and R 15 000
000
Between R 150 001
and R 3 000 000
Between R 0.01
and R 150 000
Asset Value
(excluding fixed
property)
Between R 2
500 001 and R
5 000 000
Between 500 001
and R 2 500 000
Between R 100 001
and R 500 000
Between R 0.01
and R 100 000
Prior research reveals that SMMEs are significant to any economy, especially in that of developing
countries due to the important role they fulfil in terms of job creation and reducing unemployment (SEDA,
2010; Salie, et al. 2014). The latter is further substantiated by the fact that SMMEs contribute approximately
30% towards the South African GDP and are responsible for providing an estimated 80% of all local
employment opportunities (National Credit Regulator, 2011). Abor and Quartey (2010) posit that South
African SMMEs contribute between approximately 30% and 57% to the national GDP and are responsible for
employing an estimated 91% of the national workforce (National Credit Regulator, 2011). In core SMMEs
contribute significantly towards the maintaining of millions of households (i.e. of employees and/or business
leaders) resulting in poverty alleviation, reducing inequality, maintaining social stability as well as
environmental solidity (SEDA, 2010).
In spite all of the significant contributions of SMMEs it is Verduyn (2011) who avers that the failure
rate of SMMEs in South Africa, within their first five years of existence, it is estimated at around 80%. To
better substantiate the latter, Biyase (2009) found that, in a more recent dispensation, an approximate 10,000
Prinsloo, S., Walker, C., Botha, L., Bruwer, J.P., and Smit, Y., 2015. The Influence of Combined Assurance Initiatives on the Efficiency of Risk
Management in Retail Small and Very Small Enterprises in Bellville, South Africa. Expert Journal of Business and Management, 3(2), pp.63-81
66
South African SMMEs fail on a monthly basis. Stemming from the latter, South African SMMEs are believed
to have one of the weakest business-existence rates in the world (Fatoki, 2014).
2.2. Economic Factors Which South African SMMEs Face
The latter dispensation has generally been pinned on numerous economic ‘challenges’ such as limited
funding, poor management skills, lack of inadequate training and education, just to mention but a few
(Mogashoa, 2013). Underlying adverse influences like macro-economic factors (e.g. increases in inflation,
fluctuating interest rates, excessive ‘red tape’, fluctuations in the supply and demand of goods and/or services,
high levels of competition, lack of funding opportunities, electrical power failures, etc.) as well as micro-
economic factors (e.g. the lack of business skills, the lack of effective internal controls, low staff morale, the
lack of mentoring, etc.) affect the actual existence of South African SMMEs in an adverse manner (Bruwer, et
al., 2013; Siwangaza, et al., 2014). As a result, prior research suggests that these economic factors ‘cultivate’
a magnitude of risks which South African SMMEs have to face.
2.3. Risks Influencing South African SMMEs
The Institute of Internal Auditors (2009) defines a risk as the uncertainty of an event occurring that
could have an impact on the achievement of objectives, be it positive or negative. According to Jung (2010)
the most common risks which SMMEs are likely to face include: 1) decreases in actual successful sale
transactions, 2) decreases in cash on hand, 3) severe declines in demand for goods and/or services, 4)
diminishing relationships with debtors due to late payments, 5) diminishing relationships with creditors due to
late payments, 6) decreases in available working capital, 7) increases in costs of material, labour and/or
overheads, 8) increases in the probability of non-compliance with rules, regulations and/or formal policies,
and 9) decreases in the integrity of information to make sound business decisions due to a lack of knowledge
pertaining to the target market(s). Moreover Bruwer, et al. (2013) aver that risks can be strategic in nature (has
a direct influence on the vision and mission of a business), operational in nature (has a direct influence on
business operations), reporting related (has a direct influence on the manner in which financial information is
reported) and/or compliance related (has a direct influence on the manner in which policies, rules and
regulations are adhered to). In fundamental nature it is of paramount importance that these risks are managed
to such an extent that they do not realise (preventative controls) and/or that they are adequately identified when
realising (detective controls) and/or adequately dealt with (corrective controls) (Smit, 2012). To manage risks
effectively the concepts of “probability” (the likelihood of risks occurring) and “materiality” (impact of risks
when they occur) need to be taken into account (Coetzee, et al., 2013). Risks can be demarcated into three
categories, namely inherent risks, control risks and detection risks (Institute of Internal Auditors, 2009):
Inherent risks: These risks form an integral part of the organisation’s operations and may occur
regardless of the internal controls that are present. Inherent risks are present due to nature of the
business and/or industry the organisation operates in.
Control risks: These risks could materialise amidst the existence of internal controls but are not
prevented or detected by these controls before such risks actually materialise. In essence such risks
serve as indication that the internal controls of an entity are not operating as effectively as it
should.
Detection risks: These risks include risks of material misstatements not being detected by an
assurance provider. Due to inadequate controls, the chances of such risks to realise become greater.
2.4. Risk Management
The evolution of risk management was mooted by the recognition of management as a profession
(Kloman, 1984, cited by Valsamakis, et al., 1996, p.13). Management is generally tasked with the
responsibility of protecting and securing the income-generating assets of an organisation (Valsamakis et al.,
1996, pp.13-14). This entails the development of a structured function in terms of which an organisational
risk strategy is set, and risk managers partake through a formal mechanism to deal with change.
Risk management, as it relates to a service business, is defined by Hollman and Forrest (1991, pp. 49-
50) as: “The protection of a firm’s assets and profits. It is a systematic method of using a firm’s resources –
physical, financial, and human capital – to realise certain objectives concerning pure loss exposures. Pure loss
is one where there is a chance of loss, but no chance of gain”. From the above the analogy can be drawn that
risk management is a structured approach that utilises various techniques to manage an organisation’s exposure
(Smit, 2012).
Prinsloo, S., Walker, C., Botha, L., Bruwer, J.P., and Smit, Y., 2015. The Influence of Combined Assurance Initiatives on the Efficiency of Risk
Management in Retail Small and Very Small Enterprises in Bellville, South Africa. Expert Journal of Business and Management, 3(2), pp.63-81
67
The increase in global competition and the volatility of international markets have elevated risk
management to the forefront of business thinking. An integrated risk management approach or Enterprise Risk
Management (ERM) approach is suggested by Valsamakis, et al. (2000, pp.21), as it is “comprehensive”,
“inclusive” and “proactive”. The evolution from ‘risk management’ to ‘ERM’ is intended to transform silo-
based risk management practices to a cross-functional risk management activity, where risk identification,
evaluation and management impact on the achievement of an organisation’s objectives. Integrated risk
management lends itself to a coordinated approach in managing strategic and operational-tactical processes.
As a result, the management of risk is not focused purely on the management of negative events, but also on
the realisation of opportunities (Henriksen and Uhlenfeldt, 2006, pp.122-126).
Strategy-focused integrated risk management frameworks such as DeLoach’s enterprise-wide risk
management framework (DeLoach, 2000, pp.213), COSO’s enterprise risk management framework (COSO,
2004), FERMA’s risk management standard (FERMA, 2003) and the Australian/New Zealand risk
management framework (AS/NZS 4360, 2004), incorporate a holistic perspective on the management of the
total risk portfolio of an organisation (Henriksen and Uhlenfeldt, 2006, pp.111-112). The importance of risk
management is highlighted by Smit and Watkins (2012) who posit that regardless of the risk management
strategies or framework that are used; these strategies need to provide, to a certain extent, assurance that all
risks are effectively managed and that objectives will be attained. It is therefore not surprising that ‘risk
management’ and ‘assurance’ are viewed as complementary practices of one another. In essence a
collaborative effort of ‘risk management’ and ‘assurance’ will aid in 1) the identification of all material risks,
2) ensuring the evaluation and analysis of risks is done correctly, 3) ensuring the effectiveness and adequacy
of main controls are present, and 4) management’s addressing of intolerable risks in a proper manner (Institute
of Internal Auditors, 2012a).
2.4.1. Enterprise Risk Management Defined
The Committee of Sponsoring Organisations of the Treadway Commission (COSO, 2004), defines
ERM as “a process, effected by an entity’s board of directors, management and other personnel, applied in
strategy setting and across the enterprise, designed to identify potential events that may affect the entity, and
manage risk to be within its risk appetite, to provide reasonable assurance regarding the achievement of entity
objectives”. A simplified definition of ERM is provided by Miccolis, et al. (s.a., p.xxii) when defining ERM
as “a rigorous and coordinated approach to assessing and responding to all risks that affect the achievement of
an organization’s strategic and financial objectives. This includes both upside and downside risks”.
According to Abrams, et al. (2007, p.221), an evaluation of the numerous ERM definitions show that
they share three critical characteristics, namely in that ERM should be:
Integrated: ERM must span across all functions of an organisation.
Comprehensive/inclusive: ERM must include all types of risk.
Strategic: ERM must be aligned with the overall organisational strategy(/ies) and organisational
objectives.
As companies begin to manage risk, they realise that they cannot manage it in an isolated manner by
activity, process or department alone, but rather in an inclusive, integrated way throughout the organisation.
Such an integrated risk management practice entails the defining of risk (both positive and negative), the
establishment of risk tolerances, the formulation of policies and procedures dealing with risk, the inclusion of
risk in all decision-making processes, taking into account the interconnectedness of risks, and the reporting of
risk in a consistent manner, all within the boundaries of a single business strategy of the organisation (Abrams
et al., 2007:222).
A broad definition of ERM focuses on the achievement of business objectives through the participation
of all stakeholders at every level of the organisation. It should be noted that ERM constitutes multidirectional,
repetitive processes, where activities influence one another with the primary differentiating factor, the focus
on strategy.
By embedding an ERM system into an organisation’s strategic and operational processes, risk can be
managed from a holistic and systematic perspective. Such an ERM approach would enable organisations to
focus on positive risk occurrences that foster sustainable growth through improved decision-making, and
proactive risk management. An integrated risk management practice would enhance the organisation’s
flexibility, providing a competitive advantage over competitors who do not utilise such a framework (Schrøder,
2006, pp.65-66). Hence the incorporation of ERM practices within an organisation should provide
management with a ‘common language’ to define and manage risk. Furthermore, an effective risk assessment
process and framework would support the organisation’s strategies and risk acceptance by creating an optimum
Prinsloo, S., Walker, C., Botha, L., Bruwer, J.P., and Smit, Y., 2015. The Influence of Combined Assurance Initiatives on the Efficiency of Risk
Management in Retail Small and Very Small Enterprises in Bellville, South Africa. Expert Journal of Business and Management, 3(2), pp.63-81
68
balance between risk, control and growth, eliminating unacceptable risks and strategic errors (DeLoach, 2000,
p.208).
For large and small organisations alike, ERM entails the development of organisational objectives, the
identification of risks which may impact on the defined objectives, and the development of a process to manage
the risk in an organisation. Small organisations have an advantage as far as ERM is concerned in that it is
easier for management to be actively involved in ERM processes, than it would be in larger organisations. The
development and implementation of an ERM system in a small organisation’s processes would therefore be
easier, especially if the following value-adding capabilities (Watt, 2007:33-40) of small organisations’ ERM
practices are promoted:
The organisation’s focus is directed at its mission and vision without straying.
The organisation complies with best practices.
A reduction in insurance premiums can be achieved.
Avoid the over-management of risks, i.e. risk should be managed in a cost-effective manner.
2.4.2. Risk Management for Small Business
Risk and risk management are a major concern for all companies, especially small and medium-sized
enterprises, which are particularly sensitive to business risk and competition (Blanc et al., 2006, p.273). A
substantial number of larger organisations have developed a risk management culture consisting of complex
procedures and executed by teams of experts. In smaller organisations such as SMMEs, such integrated risk
management processes do not exist (Ntlhane, 1995, pp.106-107; Dupré, 2009, p.17). In SMMEs the risk
management function usually resides with the owner’s assessment of threats and opportunities pertaining to
the enterprise (Watt, 2007, pp.33-34). Although risk management principles are common to all types of
enterprises, management’s risk perception and their attitude towards risk management influence the adequacy
of the enterprise’s risk management actions deployed (Ntlhane, 1995, p.106-107).
Implied in SMME risk management is the core principle that entrepreneurial or management focus
should be aimed at recognising future uncertainty, deliberating risks, identifying possible manifestations and
effects, and formulating plans to address such risks and reduce or eliminate their impact on the enterprise
(Ntlhane, 1995, p.27). One of the skills required of entrepreneurs is the ability to identify and analyse risks to
ensure that advantage is taken of calculated risks (Watson, 2004, pp.84-85). This managerial focus is of vital
importance for SMMEs, where risk identification and control depend on the risk personality of the entrepreneur
(Ntlhane, 1995, p.27). Management, when considering implementing an ERM programme or evaluating
existing risk procedures, should take cognisance of the following (Bradford, 2009, p.15):
Are the largest risks facing the enterprise identified?
Are risk measures in place to address these risks?
If losses do occur despite preventative measures implemented, is the enterprise prepared to handle
them?
Is a structured approach available to create opportunities out of risks?
The fact that a risk is beyond the control of management does not absolve them from the need to
anticipate the risk, and reducing the impact of the risk occurrence to achieve organisational goals. Management
should furthermore take cognisance of managerial risks that arise as a result of management’s own actions
when planning and executing business strategies. These risks may arise as a direct or indirect result of
managerial actions (Berkeley, et al., 1991, p.5).
South African SMME management should be educated in risk management principles, risk handling
techniques available and risk control programmes that can be used, but care should be taken in the application
of risk management principles, as although risk principles are common to all types of enterprises, the
application thereof differs substantially between small and larger enterprises. However, many SMMEs practise
intuitive risk management when they assess the risk involved in decisions (Ntlhane, 1995, pp.106-113; Dupré,
2009, p.17).
2.4.3. SME Risk Architecture Model
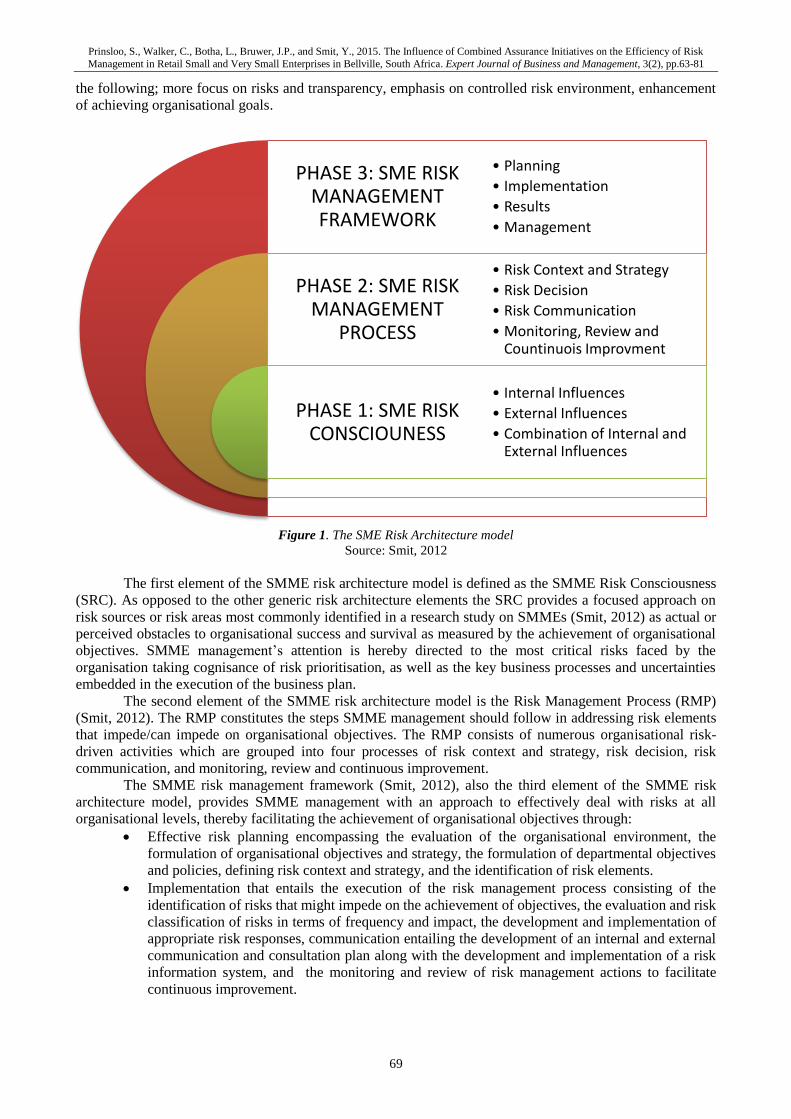
The SMME risk architecture model, as depicted in Figure 1 below, was created to support SMMEs to
effectively manage their risks. As a result, this model is divided into three parts which consist of 1) SMME
risk consciousness, 2) SMME risk management process and 3) SMME risk management framework. The aim
is to provide for a structured way of dealing with risks facing micro- and small enterprises and from which
various benefits can be derived for the business. These organisational benefits include but are not limited to
Prinsloo, S., Walker, C., Botha, L., Bruwer, J.P., and Smit, Y., 2015. The Influence of Combined Assurance Initiatives on the Efficiency of Risk
Management in Retail Small and Very Small Enterprises in Bellville, South Africa. Expert Journal of Business and Management, 3(2), pp.63-81
69
the following; more focus on risks and transparency, emphasis on controlled risk environment, enhancement
of achieving organisational goals.
Figure 1. The SME Risk Architecture model
Source: Smit, 2012
The first element of the SMME risk architecture model is defined as the SMME Risk Consciousness
(SRC). As opposed to the other generic risk architecture elements the SRC provides a focused approach on
risk sources or risk areas most commonly identified in a research study on SMMEs (Smit, 2012) as actual or
perceived obstacles to organisational success and survival as measured by the achievement of organisational
objectives. SMME management’s attention is hereby directed to the most critical risks faced by the
organisation taking cognisance of risk prioritisation, as well as the key business processes and uncertainties
embedded in the execution of the business plan.
The second element of the SMME risk architecture model is the Risk Management Process (RMP)
(Smit, 2012). The RMP constitutes the steps SMME management should follow in addressing risk elements
that impede/can impede on organisational objectives. The RMP consists of numerous organisational risk-
driven activities which are grouped into four processes of risk context and strategy, risk decision, risk
communication, and monitoring, review and continuous improvement.
The SMME risk management framework (Smit, 2012), also the third element of the SMME risk
architecture model, provides SMME management with an approach to effectively deal with risks at all
organisational levels, thereby facilitating the achievement of organisational objectives through:
Effective risk planning encompassing the evaluation of the organisational environment, the
formulation of organisational objectives and strategy, the formulation of departmental objectives
and policies, defining risk context and strategy, and the identification of risk elements.
Implementation that entails the execution of the risk management process consisting of the
identification of risks that might impede on the achievement of objectives, the evaluation and risk
classification of risks in terms of frequency and impact, the development and implementation of
appropriate risk responses, communication entailing the development of an internal and external
communication and consultation plan along with the development and implementation of a risk
information system, and the monitoring and review of risk management actions to facilitate
continuous improvement.
PHASE 3: SME RISK MANAGEMENT FRAMEWORK
PHASE 2: SME RISK MANAGEMENT
PROCESS
PHASE 1: SME RISK CONSCIOUNESS
• Planning
• Implementation
• Results
• Management
• Risk Context and Strategy
• Risk Decision
• Risk Communication
• Monitoring, Review and Countinuois Improvment
• Internal Influences
• External Influences
• Combination of Internal and External Influences
Prinsloo, S., Walker, C., Botha, L., Bruwer, J.P., and Smit, Y., 2015. The Influence of Combined Assurance Initiatives on the Efficiency of Risk
Management in Retail Small and Very Small Enterprises in Bellville, South Africa. Expert Journal of Business and Management, 3(2), pp.63-81
70
Actioning of results that may also be termed the ‘risk action consequence’, consisting of
identification of key performance indicators indicating the achievement of departmental and
organisational objectives as defined in the planning phase.
Assessing the effectiveness of the planning and risk management actions in meeting the stated
objectives. In measuring the adequacy of the actions taken, management can use any formally
defined performance measurement model or framework such as the balanced scorecard; or any
informal, in-house designed performance measurement system.
2.5. Assurance and Assurance Providers
It is clear that risk management should provide assurance that business objectives should be attained
in the foreseeable future. In order to attain such assurance, various businesses make use of different assurance
providers to help mitigate and/or eliminate risks (Institute of Internal Auditors, 2012b). Assurance services are
defined as an engagement in which an independent party expresses a conclusion designed to enhance the
degree of confidence of the intended user after evaluating a subject matter against a set criteria. (International
Auditing and Assurance Standards Board, 2014) The Institute of Internal Auditors (2009) lists a few examples
of assurance providers, namely: 1) line management and employees, 2) senior management, 3) internal- and
external auditors, 4) quality assurance teams, 5) risk management teams, 6) environmental auditors, 7)
workplace health and safety auditors, 8) government performance auditors, 9) financial reporting review
teams, and 10) sub-committees of the board, among other.
According to Vallabhaneni (2005), in a broad business dispensation, the Chief Executive Officer
(CEO) is ultimately responsible for the actual attainment of business objectives. As such Teketel and Berhanu
(2009) aver that the CEO can be equated to the owner and/or manager within an SMME setup. To assist the
CEO (owner and/or manager in a SMME-setup) internal assurance providers and external assurance providers
should support business activities, by providing inputs on the effectiveness of these activities, in relation to the
attainment of business objectives (Deloitte, 2011). In addition, these assurance providers should also ideally
assist management to identify all risks within the organisation and recommend ways in which to manage it
soundly.
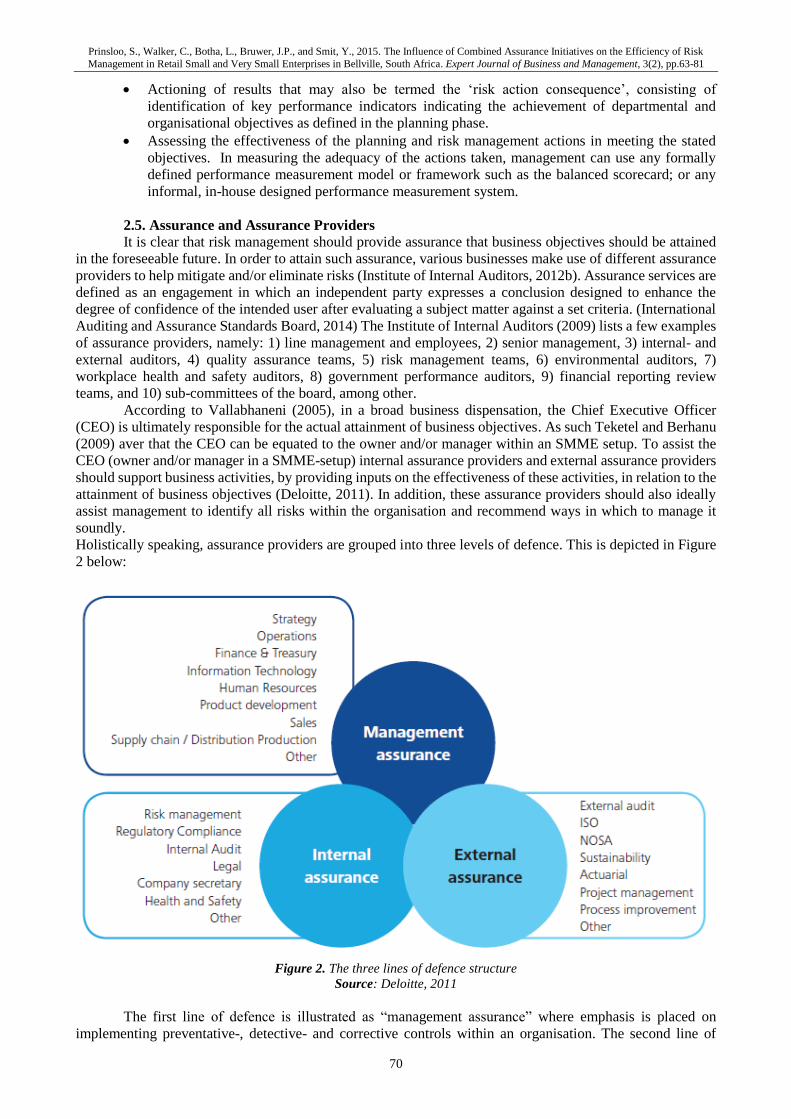
Holistically speaking, assurance providers are grouped into three levels of defence. This is depicted in Figure
2 below:
Figure 2. The three lines of defence structure
Source: Deloitte, 2011
The first line of defence is illustrated as “management assurance” where emphasis is placed on
implementing preventative-, detective- and corrective controls within an organisation. The second line of
Prinsloo, S., Walker, C., Botha, L., Bruwer, J.P., and Smit, Y., 2015. The Influence of Combined Assurance Initiatives on the Efficiency of Risk
Management in Retail Small and Very Small Enterprises in Bellville, South Africa. Expert Journal of Business and Management, 3(2), pp.63-81
71
defence is portrayed as “internal assurance” where focus is placed on managing risks and reviewing the first
line of defence with a specific role to confirm compliance while dealing with instances of non-compliance in
the organisation. The third line of defence is “external assurance” where importance is placed on the reviewing
of the first and the second line of defence in an organisation; ultimately confirming (in an independent manner)
compliance and/or recommend improvements within the organisation (Institute of Internal Auditors, 2012b).
It needs to be noted that in the context of SMMEs, SMME leaders are responsible for the first line of defence
and the second line of defence – i.e. “management assurance” and “internal assurance” – while only a minority
can actually afford to make use of the third line of defence (Siwangaza, 2014; Jiong and Li, 2010). Albeit the
latter, KPMG (2009) denotes that the practice of the three lines of defence affords clarity in terms of roles,
responsibility and accountability with regards to risk management and assurance – constituting combined
assurance.
2.6. Combined Assurance
According to the King III Report combined assurance is deemed as a process to integrate and align
assurance practices in a business to help maximise risk and governance oversight and improve control
efficiencies, and optimise overall assurance to the audit and risk committee, considering the respective
business’ risk appetite (Roos, 2012). Furthermore, combined assurance should assist and enhance the
understanding of the overall levels of assurance and how to address and/or mitigate areas of risk (Grant
Thornton, 2012).
PwC (2013) suggests that benefits of implementing a combined assurance model include factors such
as coordinated and relevant assurance processes focussing on key risks; minimising business operational
disruptions, improved reporting and accountability and possible reduction of assurance costs. It was further
found that a combined assurance model will provide a better understanding within the organisation of “who”
the assurance providers are and “what” the subject matter being assured is. This sentiment is further
substantiated by Felix, et al. (2001) who found that coordination of external and internal audit assurance
activities has a decreasing effect on external audit fees. This inverse correlation between external audit fees
and coordination of only two assurance providers could therefore possibly be enhanced by coordination of all
assurance providers, i.e. combined assurance.
Notwithstanding the later, prior research shows that combined assurance initiatives are very rare as
assurance providers are performing their activities in ‘silos’ (i.e. independent lines of defence as opposed to
interdependent lines of defence); resulting in risk management and assurance activities of organisations to be
ineffective (IIA Research Foundation, 2012).
3. Research Design and Methodology
The research design of any research study can be classified in terms of its purpose, process, logic and
outcome (Collis and Hussey, 2009). For this research study the following research design was used:
• Purpose: This research study was descriptive in nature as the main intention of this study was to
describe a particular phenomenon at hand (see Paragraph 1) through means of empirical
observations.
• Process: Quantitative research (positivism) was used to obtain data to solve and/or mitigate an
identified research problem. This was done through means of disseminating a questionnaire-tool
to a representative sample of a particular population.
• Logic: Deductive reasoning was used throughout this research study as the authors formulated a
certain perception (see Paragraph 1) through means of consulting existing literature. Essentially
this research study shifts the focus from a general understanding of a phenomenon, to a specific
understanding of the related phenomenon, at hand, as authors’ perception was tested through means
of empirical observations.
• Outcome: This research study was regarded as basic research. The authors used the findings made
in this research study to shed more light on an identified research problem (see Paragraph 1) with
the main intention to making it more understandable.
This research study constituted survey research whereby data were gleaned from a representative
sample size of a particular population, about a general collective perception, through means of a questionnaire-
tool (Leedy and Ormrod, 2010). The questionnaire-tool used consisted of 13 main-questions of a quantitative
nature. As the size of the population was unknown, non-probability sampling (a mixture of purposive sampling
and convenience sampling) was used to select a total of 50 respondents who had to adhere to strict delineation
criteria. In addition, the authors wanted to obtain rich data pertaining to a certain focused area. Only 37
Prinsloo, S., Walker, C., Botha, L., Bruwer, J.P., and Smit, Y., 2015. The Influence of Combined Assurance Initiatives on the Efficiency of Risk
Management in Retail Small and Very Small Enterprises in Bellville, South Africa. Expert Journal of Business and Management, 3(2), pp.63-81
72
respondents responded positively to the questionnaire-tool and after validating all received responses, only 30
responses were found to be valid. In order for respondents’ responses to be regarded as valid, they had to
adhere to the following delineation criteria:
• Respondents had to be part of management (owners and/or managers) of SMMEs.
• Respondents must have been actively involved in their businesses’ operations.
• SMMEs must have conformed to the formal definition of a “Small Medium and Micro Enterprise”
as defined by the National Small Business Act of 1996.
• SMMEs must have employed between 0 and 50 full-time employees.
• SMMEs must have been in existence for at least three years.
• SMMEs must have been regarded as “very small enterprises” and/or “small enterprises”.
• SMMEs must have been operating in the retail industry.
• SMMEs must have been located in Bellville (Cape Town).
All respondents were assured that all information provided by them would be treated with the highest
levels of confidentiality and that their anonymity were guaranteed. It was also explained to participants that if
they would decide to participate in this research study that they could withdraw from the study at any given
time as their participation were completely voluntary in nature.
4. Data Analysis and Discussion of Findings
The findings made from this research study are presented under the following headings: 1) general
findings, 2) risks and risk management initiatives of respondents, and 3) assurance providers and combined
assurance initiatives of respondents.
4.1. General Findings
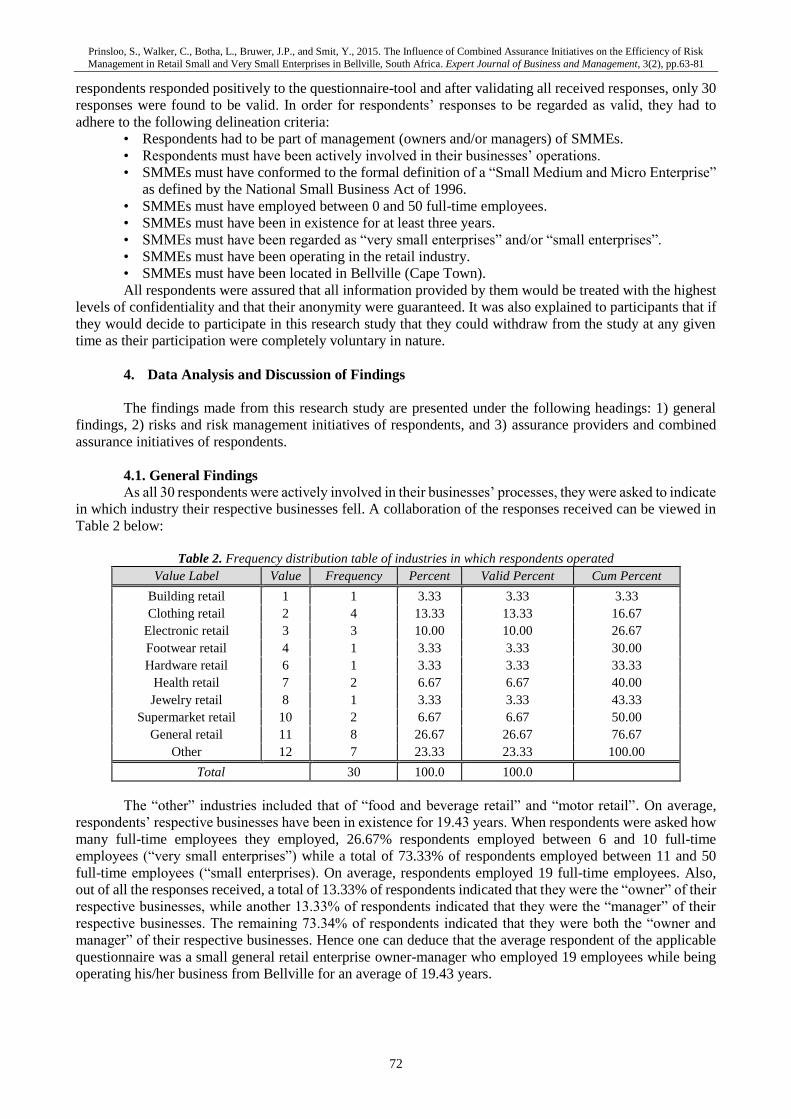
As all 30 respondents were actively involved in their businesses’ processes, they were asked to indicate
in which industry their respective businesses fell. A collaboration of the responses received can be viewed in
Table 2 below:
Table 2. Frequency distribution table of industries in which respondents operated
Value Label Value Frequency Percent Valid Percent Cum Percent
Building retail 1 1 3.33 3.33 3.33
Clothing retail 2 4 13.33 13.33 16.67
Electronic retail 3 3 10.00 10.00 26.67
Footwear retail 4 1 3.33 3.33 30.00
Hardware retail 6 1 3.33 3.33 33.33
Health retail 7 2 6.67 6.67 40.00
Jewelry retail 8 1 3.33 3.33 43.33
Supermarket retail 10 2 6.67 6.67 50.00
General retail 11 8 26.67 26.67 76.67
Other 12 7 23.33 23.33 100.00
Total 30 100.0 100.0
The “other” industries included that of “food and beverage retail” and “motor retail”. On average,
respondents’ respective businesses have been in existence for 19.43 years. When respondents were asked how
many full-time employees they employed, 26.67% respondents employed between 6 and 10 full-time
employees (“very small enterprises”) while a total of 73.33% of respondents employed between 11 and 50
full-time employees (“small enterprises). On average, respondents employed 19 full-time employees. Also,
out of all the responses received, a total of 13.33% of respondents indicated that they were the “owner” of their
respective businesses, while another 13.33% of respondents indicated that they were the “manager” of their
respective businesses. The remaining 73.34% of respondents indicated that they were both the “owner and
manager” of their respective businesses. Hence one can deduce that the average respondent of the applicable
questionnaire was a small general retail enterprise owner-manager who employed 19 employees while being
operating his/her business from Bellville for an average of 19.43 years.
Prinsloo, S., Walker, C., Botha, L., Bruwer, J.P., and Smit, Y., 2015. The Influence of Combined Assurance Initiatives on the Efficiency of Risk
Management in Retail Small and Very Small Enterprises in Bellville, South Africa. Expert Journal of Business and Management, 3(2), pp.63-81
73
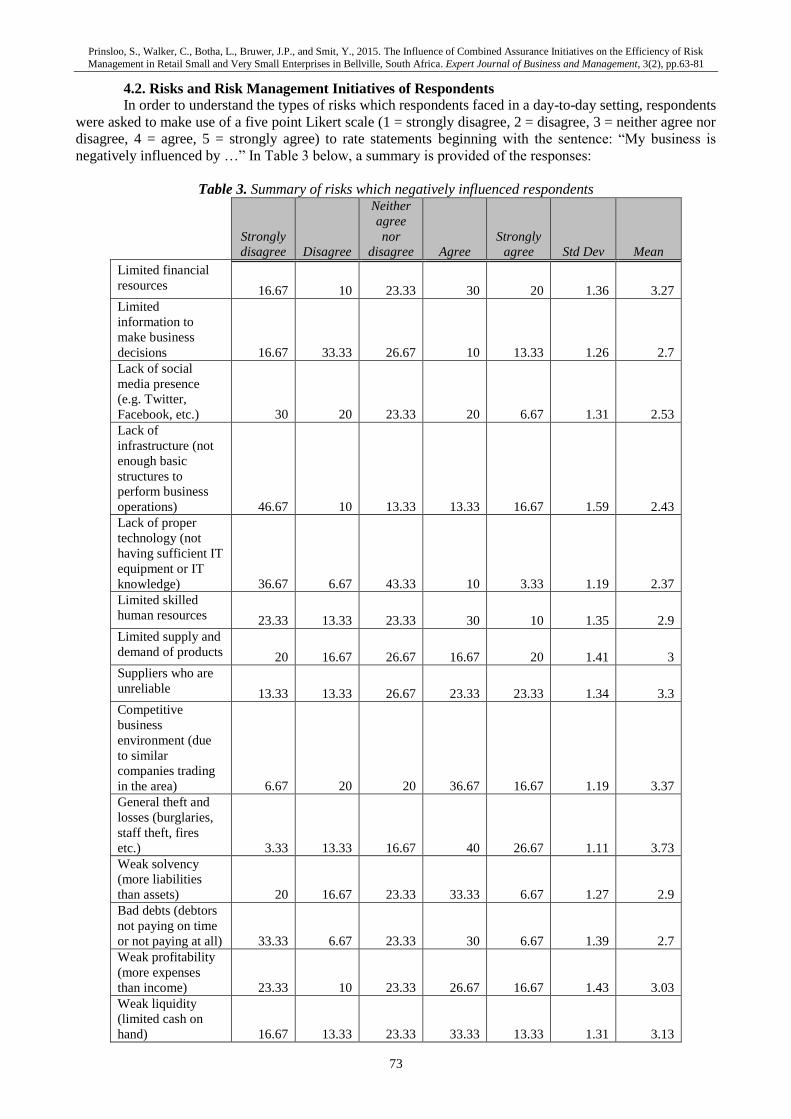
4.2. Risks and Risk Management Initiatives of Respondents
In order to understand the types of risks which respondents faced in a day-to-day setting, respondents
were asked to make use of a five point Likert scale (1 = strongly disagree, 2 = disagree, 3 = neither agree nor
disagree, 4 = agree, 5 = strongly agree) to rate statements beginning with the sentence: “My business is
negatively influenced by …” In Table 3 below, a summary is provided of the responses:
Table 3. Summary of risks which negatively influenced respondents
Strongly
disagree Disagree
Neither
agree
nor
disagree Agree
Strongly
agree Std Dev Mean
Limited financial
resources 16.67 10 23.33 30 20 1.36 3.27
Limited
information to
make business
decisions 16.67 33.33 26.67 10 13.33 1.26 2.7
Lack of social
media presence
(e.g. Twitter,
Facebook, etc.) 30 20 23.33 20 6.67 1.31 2.53
Lack of
infrastructure (not
enough basic
structures to
perform business
operations) 46.67 10 13.33 13.33 16.67 1.59 2.43
Lack of proper
technology (not
having sufficient IT
equipment or IT
knowledge) 36.67 6.67 43.33 10 3.33 1.19 2.37
Limited skilled
human resources 23.33 13.33 23.33 30 10 1.35 2.9
Limited supply and
demand of products 20 16.67 26.67 16.67 20 1.41 3
Suppliers who are
unreliable 13.33 13.33 26.67 23.33 23.33 1.34 3.3
Competitive
business
environment (due
to similar
companies trading
in the area) 6.67 20 20 36.67 16.67 1.19 3.37
General theft and
losses (burglaries,
staff theft, fires
etc.) 3.33 13.33 16.67 40 26.67 1.11 3.73
Weak solvency
(more liabilities
than assets) 20 16.67 23.33 33.33 6.67 1.27 2.9
Bad debts (debtors
not paying on time
or not paying at all) 33.33 6.67 23.33 30 6.67 1.39 2.7
Weak profitability
(more expenses
than income) 23.33 10 23.33 26.67 16.67 1.43 3.03
Weak liquidity
(limited cash on
hand) 16.67 13.33 23.33 33.33 13.33 1.31 3.13
Prinsloo, S., Walker, C., Botha, L., Bruwer, J.P., and Smit, Y., 2015. The Influence of Combined Assurance Initiatives on the Efficiency of Risk
Management in Retail Small and Very Small Enterprises in Bellville, South Africa. Expert Journal of Business and Management, 3(2), pp.63-81
74
Non-compliance
with laws (inability
to enforce contracts
and possible law
suites) 33.33 13.33 20 23.33 10 1.43 2.63
Non-compliance
with regulations
(licences can lapse
and be revoked) 26.67 23.33 16.67 23.33 10 1.37 2.67
Non-compliance
with recommended
practices
(compromise
quality outputs) 26.67 20 23.33 23.33 6.67 1.3 2.63
Non-compliance
with internal
policies (staff not
adhering and/or
unaware of
company policies) 30 13.33 20 16.67 20 1.53 2.83
Non-compliance
with procedures of
ethical standards
(can damage the
goodwill of the
company) 20 20 13.33 36.67 10 1.35 2.97
AVERAGE 1.34 2.90
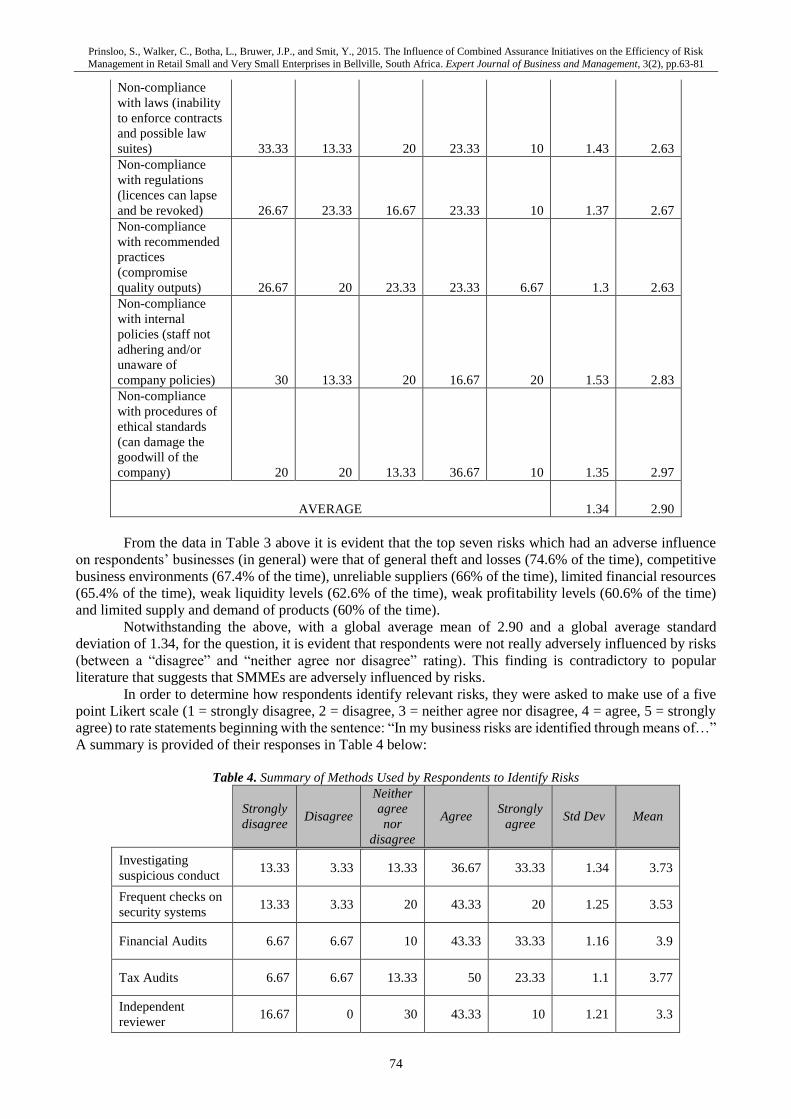
From the data in Table 3 above it is evident that the top seven risks which had an adverse influence
on respondents’ businesses (in general) were that of general theft and losses (74.6% of the time), competitive
business environments (67.4% of the time), unreliable suppliers (66% of the time), limited financial resources
(65.4% of the time), weak liquidity levels (62.6% of the time), weak profitability levels (60.6% of the time)
and limited supply and demand of products (60% of the time).
Notwithstanding the above, with a global average mean of 2.90 and a global average standard
deviation of 1.34, for the question, it is evident that respondents were not really adversely influenced by risks
(between a “disagree” and “neither agree nor disagree” rating). This finding is contradictory to popular
literature that suggests that SMMEs are adversely influenced by risks.
In order to determine how respondents identify relevant risks, they were asked to make use of a five
point Likert scale (1 = strongly disagree, 2 = disagree, 3 = neither agree nor disagree, 4 = agree, 5 = strongly
agree) to rate statements beginning with the sentence: “In my business risks are identified through means of…”
A summary is provided of their responses in Table 4 below:
Table 4. Summary of Methods Used by Respondents to Identify Risks
Strongly
disagree Disagree
Neither
agree
nor
disagree
Agree Strongly
agree Std Dev Mean
Investigating
suspicious conduct 13.33 3.33 13.33 36.67 33.33 1.34 3.73
Frequent checks on
security systems 13.33 3.33 20 43.33 20 1.25 3.53
Financial Audits 6.67 6.67 10 43.33 33.33 1.16 3.9
Tax Audits 6.67 6.67 13.33 50 23.33 1.1 3.77
Independent
reviewer 16.67 0 30 43.33 10 1.21 3.3
Prinsloo, S., Walker, C., Botha, L., Bruwer, J.P., and Smit, Y., 2015. The Influence of Combined Assurance Initiatives on the Efficiency of Risk
Management in Retail Small and Very Small Enterprises in Bellville, South Africa. Expert Journal of Business and Management, 3(2), pp.63-81
75
Information
Systems (IS)
Audits
13.33 3.33 40 33.33 10 1.14 3.23
Brainstorming with
staff 10 10 16.67 50 13.33 1.17 3.47
Risk register 20 0 26.67 33.33 20 1.37 3.33
Informal
discussions with
staff
6.67 3.33 16.67 53.33 20 1.04 3.77
Periodic stock
taking 6.67 0 16.67 46.67 30 1.05 3.93
Comparisons of
current and prior
year financial
statements
3.33 0 10 50 36.67 0.87 4.17
Staff behavior
changes 6.67 0 30 46.67 16.67 0.99 3.67
Customer
satisfaction surveys 13.33 10 20 36.67 20 1.3 3.4
Objectives not
being met 13.33 6.67 30 36.67 13.33 1.21 3.3
Consulting other
businesses in
similar industries
6.67 0 33.33 43.33 16.67 1 3.63
AVERAGE 1.15 3.61
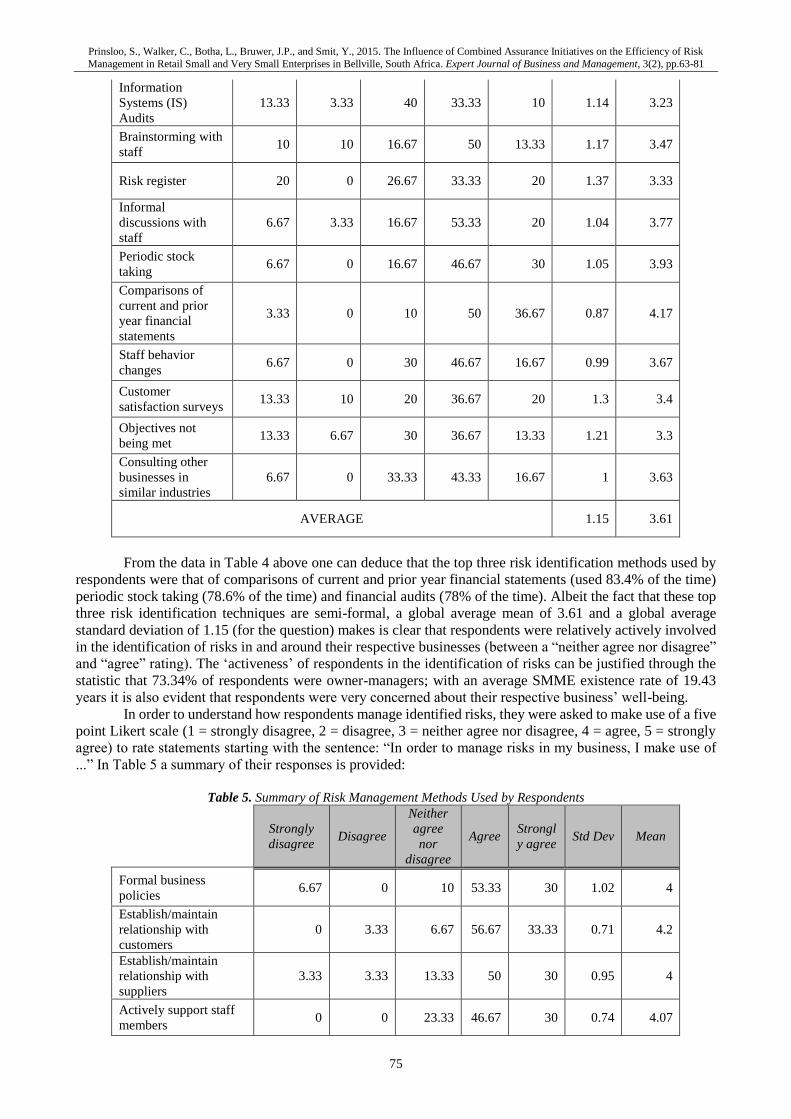
From the data in Table 4 above one can deduce that the top three risk identification methods used by
respondents were that of comparisons of current and prior year financial statements (used 83.4% of the time)
periodic stock taking (78.6% of the time) and financial audits (78% of the time). Albeit the fact that these top
three risk identification techniques are semi-formal, a global average mean of 3.61 and a global average
standard deviation of 1.15 (for the question) makes is clear that respondents were relatively actively involved
in the identification of risks in and around their respective businesses (between a “neither agree nor disagree”
and “agree” rating). The ‘activeness’ of respondents in the identification of risks can be justified through the
statistic that 73.34% of respondents were owner-managers; with an average SMME existence rate of 19.43
years it is also evident that respondents were very concerned about their respective business’ well-being.
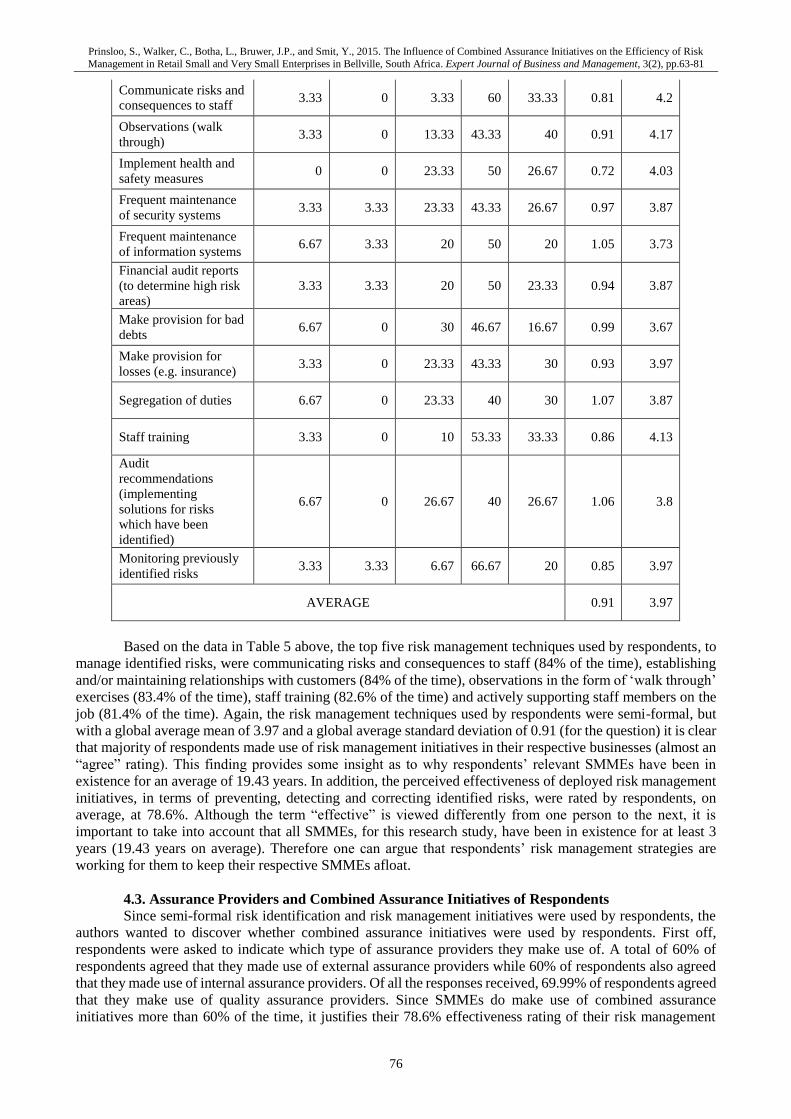
In order to understand how respondents manage identified risks, they were asked to make use of a five
point Likert scale (1 = strongly disagree, 2 = disagree, 3 = neither agree nor disagree, 4 = agree, 5 = strongly
agree) to rate statements starting with the sentence: “In order to manage risks in my business, I make use of
...” In Table 5 a summary of their responses is provided:
Table 5. Summary of Risk Management Methods Used by Respondents
Strongly
disagree Disagree
Neither
agree
nor
disagree
Agree Strongl
y agree Std Dev Mean
Formal business
policies 6.67 0 10 53.33 30 1.02 4
Establish/maintain
relationship with
customers
0 3.33 6.67 56.67 33.33 0.71 4.2
Establish/maintain
relationship with
suppliers
3.33 3.33 13.33 50 30 0.95 4
Actively support staff
members 0 0 23.33 46.67 30 0.74 4.07
Prinsloo, S., Walker, C., Botha, L., Bruwer, J.P., and Smit, Y., 2015. The Influence of Combined Assurance Initiatives on the Efficiency of Risk
Management in Retail Small and Very Small Enterprises in Bellville, South Africa. Expert Journal of Business and Management, 3(2), pp.63-81
76
Communicate risks and
consequences to staff 3.33 0 3.33 60 33.33 0.81 4.2
Observations (walk
through) 3.33 0 13.33 43.33 40 0.91 4.17
Implement health and
safety measures 0 0 23.33 50 26.67 0.72 4.03
Frequent maintenance
of security systems 3.33 3.33 23.33 43.33 26.67 0.97 3.87
Frequent maintenance
of information systems 6.67 3.33 20 50 20 1.05 3.73
Financial audit reports
(to determine high risk
areas)
3.33 3.33 20 50 23.33 0.94 3.87
Make provision for bad
debts 6.67 0 30 46.67 16.67 0.99 3.67
Make provision for
losses (e.g. insurance) 3.33 0 23.33 43.33 30 0.93 3.97
Segregation of duties 6.67 0 23.33 40 30 1.07 3.87
Staff training 3.33 0 10 53.33 33.33 0.86 4.13
Audit
recommendations
(implementing
solutions for risks
which have been
identified)
6.67 0 26.67 40 26.67 1.06 3.8
Monitoring previously
identified risks 3.33 3.33 6.67 66.67 20 0.85 3.97
AVERAGE 0.91 3.97
Based on the data in Table 5 above, the top five risk management techniques used by respondents, to
manage identified risks, were communicating risks and consequences to staff (84% of the time), establishing
and/or maintaining relationships with customers (84% of the time), observations in the form of ‘walk through’
exercises (83.4% of the time), staff training (82.6% of the time) and actively supporting staff members on the
job (81.4% of the time). Again, the risk management techniques used by respondents were semi-formal, but
with a global average mean of 3.97 and a global average standard deviation of 0.91 (for the question) it is clear
that majority of respondents made use of risk management initiatives in their respective businesses (almost an
“agree” rating). This finding provides some insight as to why respondents’ relevant SMMEs have been in
existence for an average of 19.43 years. In addition, the perceived effectiveness of deployed risk management
initiatives, in terms of preventing, detecting and correcting identified risks, were rated by respondents, on
average, at 78.6%. Although the term “effective” is viewed differently from one person to the next, it is
important to take into account that all SMMEs, for this research study, have been in existence for at least 3
years (19.43 years on average). Therefore one can argue that respondents’ risk management strategies are
working for them to keep their respective SMMEs afloat.
4.3. Assurance Providers and Combined Assurance Initiatives of Respondents
Since semi-formal risk identification and risk management initiatives were used by respondents, the
authors wanted to discover whether combined assurance initiatives were used by respondents. First off,
respondents were asked to indicate which type of assurance providers they make use of. A total of 60% of
respondents agreed that they made use of external assurance providers while 60% of respondents also agreed
that they made use of internal assurance providers. Of all the responses received, 69.99% of respondents agreed
that they make use of quality assurance providers. Since SMMEs do make use of combined assurance
initiatives more than 60% of the time, it justifies their 78.6% effectiveness rating of their risk management
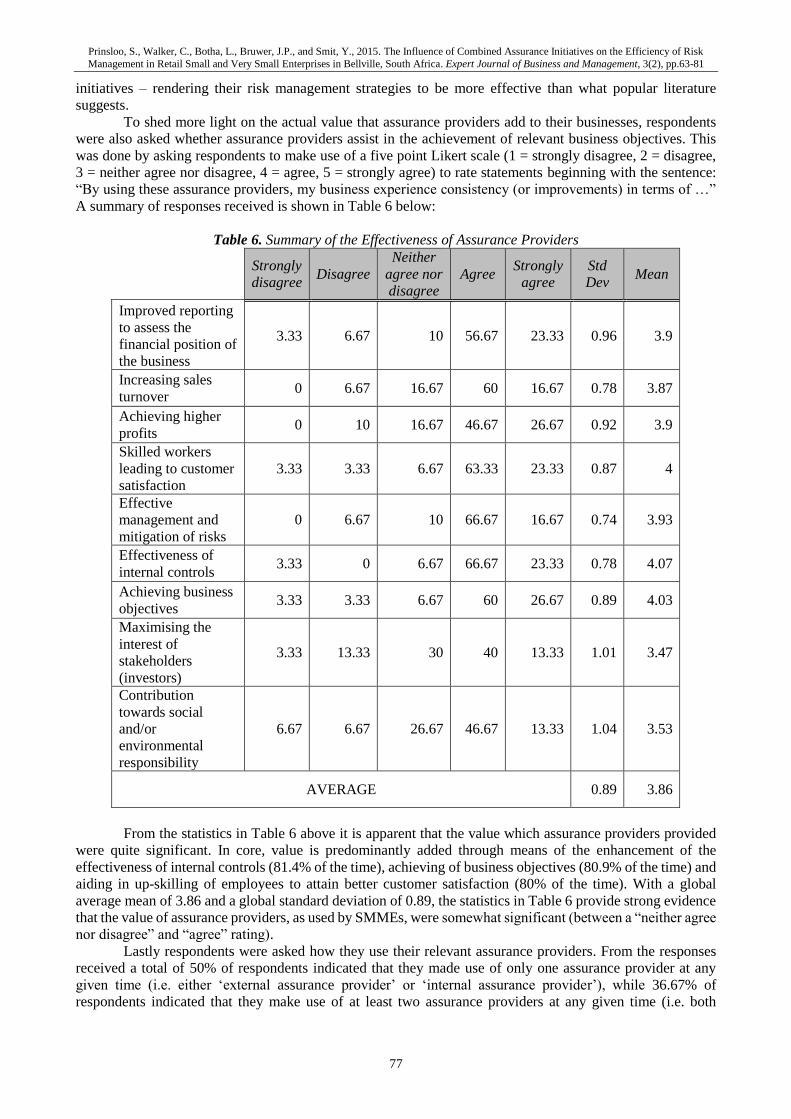
Prinsloo, S., Walker, C., Botha, L., Bruwer, J.P., and Smit, Y., 2015. The Influence of Combined Assurance Initiatives on the Efficiency of Risk
Management in Retail Small and Very Small Enterprises in Bellville, South Africa. Expert Journal of Business and Management, 3(2), pp.63-81
77
initiatives – rendering their risk management strategies to be more effective than what popular literature
suggests.
To shed more light on the actual value that assurance providers add to their businesses, respondents
were also asked whether assurance providers assist in the achievement of relevant business objectives. This
was done by asking respondents to make use of a five point Likert scale (1 = strongly disagree, 2 = disagree,
3 = neither agree nor disagree, 4 = agree, 5 = strongly agree) to rate statements beginning with the sentence:
“By using these assurance providers, my business experience consistency (or improvements) in terms of …”
A summary of responses received is shown in Table 6 below:
Table 6. Summary of the Effectiveness of Assurance Providers
Strongly
disagree Disagree
Neither
agree nor
disagree
Agree Strongly
agree
Std
Dev Mean
Improved reporting
to assess the
financial position of
the business
3.33 6.67 10 56.67 23.33 0.96 3.9
Increasing sales
turnover 0 6.67 16.67 60 16.67 0.78 3.87
Achieving higher
profits 0 10 16.67 46.67 26.67 0.92 3.9
Skilled workers
leading to customer
satisfaction
3.33 3.33 6.67 63.33 23.33 0.87 4
Effective
management and
mitigation of risks
0 6.67 10 66.67 16.67 0.74 3.93
Effectiveness of
internal controls 3.33 0 6.67 66.67 23.33 0.78 4.07
Achieving business
objectives 3.33 3.33 6.67 60 26.67 0.89 4.03
Maximising the
interest of
stakeholders
(investors)
3.33 13.33 30 40 13.33 1.01 3.47
Contribution
towards social
and/or
environmental
responsibility
6.67 6.67 26.67 46.67 13.33 1.04 3.53
AVERAGE 0.89 3.86
From the statistics in Table 6 above it is apparent that the value which assurance providers provided
were quite significant. In core, value is predominantly added through means of the enhancement of the
effectiveness of internal controls (81.4% of the time), achieving of business objectives (80.9% of the time) and
aiding in up-skilling of employees to attain better customer satisfaction (80% of the time). With a global
average mean of 3.86 and a global standard deviation of 0.89, the statistics in Table 6 provide strong evidence
that the value of assurance providers, as used by SMMEs, were somewhat significant (between a “neither agree
nor disagree” and “agree” rating).
Lastly respondents were asked how they use their relevant assurance providers. From the responses
received a total of 50% of respondents indicated that they made use of only one assurance provider at any
given time (i.e. either ‘external assurance provider’ or ‘internal assurance provider’), while 36.67% of
respondents indicated that they make use of at least two assurance providers at any given time (i.e. both
Prinsloo, S., Walker, C., Botha, L., Bruwer, J.P., and Smit, Y., 2015. The Influence of Combined Assurance Initiatives on the Efficiency of Risk
Management in Retail Small and Very Small Enterprises in Bellville, South Africa. Expert Journal of Business and Management, 3(2), pp.63-81
78
‘external assurance provider’ and ‘internal assurance provider’). The remaining 13.33% of respondents were
unsure about how they use their relevant assurance providers.
5. Conclusion
Stemming from the above, it is evident that SMMEs experience economic and financial strain. Due to
these adversities, adequate risk management strategies are deemed very necessary for these entities. The
starting point in a sound risk management strategy is to identify risks that are present and/or have the
probability to realise in the foreseeable future. From the findings made, it is clearly evident that SMMEs were
aware of the risks that threaten their businesses to a great extent. These risks include general theft and losses,
competitive business environments, limited financial resources, weak liquidity levels and weak profitability
levels, just to mention a few. Albeit the latter, it was found that risks do not really adversely influence SMMEs
to a great extent.
In addition, SMME leaders were asked how they identified risks. It was found that SMME leaders
made use of comparisons of current and prior year financial statements, periodic stock taking and financial
audits. Furthermore respondents indicated that the manner in which they manage their identified risks include
communicating risks and consequences to staff, establishing and/or maintaining relationships with customers,
observations in the form of ‘walk through’ exercises, staff training and actively supporting staff members on
the job. Albeit the fact that the latter risk identification initiatives and risk management initiatives were only
semi-formal, it is imperative to note that all SMMEs, on average, have been in existence for an average of
19.43 years; hence SMME leaders must have a ‘working’ risk management strategy with an average self-rated
effectiveness, by respondents, of 78.6%.
More light was shed on a probable reason as to why the risk management strategies deployed by
SMME leaders were rated so high in terms of efficiency when it was found that SMMEs place reliance on
assurance providers to add value to the organisation by enhancing the effectiveness of internal controls,
reaching of business objectives as well as improving employee skills in order to improve customer satisfaction.
SMMEs therefore see assurance providers as value adding functions which, in turn, assist in the identification
and management of risks in and around the organisation.
Although only 36.67% of respondents made use of combined assurance initiatives (and 50% made use
of ordinary assurance initiatives) one can deduce that if more SMMEs would utilise a combined assurance
model (by making use of ‘internal service providers’ and ‘external service providers’ at the same time) it will
lead to more effective risk management strategies; adding value to these entities in terms of sustainability, as
well as possibly lowering assurance costs.
Acknowledgements
The authors of this paper wish to acknowledge the following individuals for their assistance with the
collection of data in this research study: Xabisa Hlulani, Robyn September, Jenine Giddion, Oliver Tamo and
Mkhanyisi Ncumeza.
References
Abrams, C., Von Känel, J., Müller, S., Pfitzmann, B. and Ruschka-Taylor, S., 2007. Optimized enterprise risk
management. IBM Systems Journal, 46(2), pp.219-232.
Australian/New Zealand Standard 4360 (AS/NZS 4360), 2004. Risk Management. [Online]. Available from:
http://www/standards.com.au [Accessed 15/5/2014]
Beasley, M., Chen, A., Nune, K. and Wright, L., 2006.Working hand in hand; Balance Scorecard and
Enterprise Risk Management. Strategic Finance, 87(9), 2006.
Berkeley, D., Humphreys, P.C. and Thomas, R.D., 1991. Project risk action management. Construction
Management and Economics, 9, pp.3-17.
Biyase L., 2009. DTI to look at how crisis hurts small enterprises [Online]. Available from:
www.busrep.co.za/index.php?fSectionId=561andfArticleId=4947848 [Accessed 10/06/2014]
Bizbooks, 2008. I want my own business. Consider this then? [Online]. Available from:
http://bizbooks.co.za/blog/?tag=south-africa-smme [Accessed 10/06/2014]
Blanc Alquier, A.M. and Lagasse Tignol, M.H., 2006. Risk management in small- and medium-sized
enterprises. Production Planning and Control, 17(3), pp.273-282.
Bradford, M., 2009. Sovay turns risk into opportunity. Business Insurance, 43(20), pp.4-28.
Prinsloo, S., Walker, C., Botha, L., Bruwer, J.P., and Smit, Y., 2015. The Influence of Combined Assurance Initiatives on the Efficiency of Risk
Management in Retail Small and Very Small Enterprises in Bellville, South Africa. Expert Journal of Business and Management, 3(2), pp.63-81
79
Brink, A., Cant, M. and Ligthelm, A., 2003.Problems experienced by small businesses is South Africa. Paper
presented at the Annual conference of Small Enterprise Association of Australia and New Zealand,
University of Ballarat, Australia.
Bruwer, J., Masama, B., Mgidi, A., Myezo, M., Nqayi, P., Nzuza N., Phangwa, M., Sibanyoni, S andVa, N.,
2013. The need for a customised risk management framework for small enterprises. International
Southern African Accounting Association Conference.
Coetzee, P., Du Bruyn, R., Fourie, H. and Plant, K., 2013. Internal Auditing: An Introduction. Johannesburg:
LexisNexis.
Collis, J. and Hussey, R., 2009. Business Research: A practical guide for undergraduate and post graduate
students. Hampshire: Palgrave Macmillan.
COSO, 2004. Enterprise Risk Management – Integrated Framework [Online]. Available from
http://www.coso.org/publications/erm/coso_erm_executivesummary.pdf [Accessed on 21/05/2014]
Deloitte, 2011. Combined Assurance Taking corporations to the next level. [Online]. Available from:
http://www.deloitte.com/assets/Dcom-
SouthAfrica/Local%20Assets/Documents/Combined_assurance.pdf [Accessed on 22/03/2014]
DeLoach, J.W., 2000. Enterprise-Wide Risk Management. Strategies for linking risk and opportunity. London:
Financial Times Prentice Hall.
Department of Trade and Industry, 2008. Annual Review of Small Business in South Africa 2005 – 2007. 2008
Dupré, A., 2009. Linking risk management to the budgeting process. CMA Management, August/September,
pp.16-18.
Fatoki, O. 2014.The Causes of the Failure of New Small and Medium Enterprises in South Africa.
Mediterranean Journal of Social Sciences, 5(20), pp. 922-927.
Felix, W., Grambling, A., and Maletta, M., 2001.The Contribution of Internal Auditas a Determinant of
External AuditFees and Factors InfluencingThis Contribution. Journal of Accounting Research, 39(3),
pp. 1-27
Federation of European Risk Management Association (FERMA), 2003. A Risk Management Standard.
[Online]. Available from: http://www.ferma.eu [Accessed 21/11/2010]
Giliomee, J., 2004. The small business environment. Entrepreneurial Business School [Online]. Available
from: http://ebschool.com/wpcontent/uploads/2009/07/The_Small_Business_Environment.pdf
[Accessed on 05/05/2014]
Grant Thornton, 2012. An instinct for growth – Combined Assurance. [Online]. Available from:
http://www.gt.co.za/files/grant_thornton_combined_assurance_brochure.pdf [Accessed on
22/03/2014]
Henriksen, P. and Uhlenfeldt, T., 2006. Contemporary Enterprise-Wide Risk Management Frameworks: A
Comparative Analysis in a Strategic Perspective. [In: Andersen, T.J. (ed.). Perspectives on Strategic
Risk Management. Denmark: Copenhagen Business School Press].
Hollman, K.W. and Forrest, J.E., 1991. Risk Management in a Service Business. International Journal of
Service Industry Management, 2(2), pp.49-65.
Institute of Directors, Southern Africa., 2009. King code of governance for South Africa [Online]. Available
from: www.iodsa.co.za/?kingIII [Accessed on 10/06/2014]
Institute of Internal Auditors, 2009. Conducting the Internal Audit Engagement: identifying and prioritising
the potential risks. [Online]. Available from: https://na.theiia.org/standards-guidance/Member
Documents/PA_2210-A1-1.pdf [Accessed on 05/05/2014]
Institute of Internal Auditors, 2012. Practice Guide, Coordinating Risk Management and Assurance. [Online].
Available from: https://na.theiia.org/standards-guidance/recommended-guidance/practice-
guides/Pages/Coordinating-Risk-Management-and-Assurance-Practice-Guide.aspx [Accessed on
10/06/2014]
Institute of Internal Auditors, 2012. Public Sector Forum on the importance steps towards an effective
combined assurance model. [Online]. Available from:
www.nkonki.com/download.php?filename=administrator/media/uploads/idv-3088224-
298ffdba282738ac69ce2b38ccced96e.pdf [Accessed on 31/03/2014]
International Auditing and Assurance Standards Board, 2014. Handbook of International Quality Control,
Auditing, Review and Other Assurance, and Related Services Pronouncements, Volume 1.[Online].
Available from: https://www.ifac.org/sites/default/files/publications/files/2014-IAASB-
HANDBOOK-VOLUME-1_0.pdf [Accessed on 3/12/2014]
Jiong, L. and Li, X., 2010. Discussions on the Improvement of the Internal Control in SMEs, International
Journal of Multidisciplinary Research, 5(9), September 2010.
Prinsloo, S., Walker, C., Botha, L., Bruwer, J.P., and Smit, Y., 2015. The Influence of Combined Assurance Initiatives on the Efficiency of Risk
Management in Retail Small and Very Small Enterprises in Bellville, South Africa. Expert Journal of Business and Management, 3(2), pp.63-81
80
Jung, D., 2010. Risks and Opportunities facing SMEs in the Post-Crisis Era [Online]. Available from:
http://www.apecscmc.org/files/training/3_2.pdf [Accessed on 21/09/2014]
KPMG, 2009. The Audit Committee Institute. [Online]. Available from:
https://www.kpmg.com/RU/en/IssuesAndInsights//ArticlesPublications//Audit-Committee-
Journal/The-three-lines-of-defence-en.pdf [Accessed on 05/05/2014]
Leedy, P. and Omrod, J., 2010. Practical Research: Planning and Design, 9th ed. New Jersey: Pearson
Education.
Manu, C., 2005. Risk management in the context of public sector reforms. [Online] Available from:
http://www.modernghana.com/news/116837/1/riskmanagement-in-the-context-ofpublic-sector-
re.html [Accessed 05/05/14]
Miccolis, J.A., Hively, K. and Merkley, B.W. S.a. Enterprise Risk Management: Trends and Emerging
Practices. S.l.:Tillinghast - Towers Perrin.
Mogashoa, T., 2013. Shocking ‘Missing Middle’ SMMEs in South Africa revealed. [Online]. Available from:
http://tebogomogashoa.com/shocking-missing-middle-smme-in-south-africa-revealed/ [Accessed on
21/09/2014]
National Credit Regulator, 2011. Literature Review on Small and Medium Enterprises' Access to Credit and
Support in South Africa
Ngary, C., Smit, Y., Ukpere, W. and Bruwer, J-P., 2014. Financial Performance Measures and Business
Objectives Attainment in Fast Food SMMEs in the Cape Metropolis: A preliminary Liability and
Suitability analysis. Mediterranean Journal of Social Sciences, 5(20), pp.909-921. September, 2014.
Noorvee, L., 2006. Evaluation of the Effectiveness of Internal Controls over Financial Reporting. Master’s
Thesis, University of Tartu, Tartu.
Ntlhane, K.E., 1995. The application of risk management principles to smaller enterprises. A research report
submitted in partial fulfilment of the requirements for the degree of Masters of Business
Administration in the Faculty of Management at the University of the Witwatersrand.
PwC, 2014. National Treasury: Combined Assurance Practical Approach and Reporting Key Learning’s
[Online]. Available from:
http://oag.treasury.gov.za/Event%20Documentation/20130228%20Public%20Entities%20Risk%20
Management%20Forum/2.%20System%20of%20Combined%20Assurance%20and%20Institutional
%20performance%20-%20A%20Moosa%20and%20JC%20Heyns.pdf [Accessed on 04/12/2014].
Roberts, S., 2006. Sustainable Manufacturing: The Case of South Africa and Ekurhuleni. Durban, Juta
Company Ltd.
Roos, A., 2012. Audit committees and combined assurance. [Online]. Available from:
http://www.saiga.co.za/home_htm_files/8%20Roos.pdf [Accessed on 05/05/2014]
Salie, M., Strauss, N., Davids, M., Smit, Y., Boshoff, S. and Bruwer, J-P., 2014. The effects of sin tax on the
profitability of SMME convenience stores in the Cape Metropole. Topclass Journal of Business
Management, 1(2), pp. pp. 25-36, 26 June 2014.
Schrøder, P.W., 2006. Impediments to Effective Risk Management. Perspectives on Strategic Risk
Management. [In: Andersen, T.J. (ed.). Perspectives on Strategic Risk Management. Denmark:
Copenhagen Business School Press].
SEDA, 2010. The small business monitor [Online]. Available from:
http://www.seda.org.za/Publications/Publications/SEDA%20SBM%20Vol.6%20Issue%201%20201
0.pdf [Accessed on 22/03/2014]
Shah, T. and Khedkar, A., 2006. Case on successful SME financing – SIDBI.Indian Institute of Planning and
Management (IIPM). Ahmedabad.
Simnett, R., Vanstraelen, A., and Chua, W. F., 2009. Assurance on sustainability reports: An international
comparison. The Accounting Review, 84(1), pp. 937-67, 26 October 2007.
Siwangaza, L., 2014. The status of internal controls in fast moving consumer goods SMMEs in the Cape
Peninsula. Dissertation submitted for the fulfilment for aMTech: Internal Auditing. Cape Peninsula
University of Technology.
Siwangaza, L., Ukpere, W., Smit, Y. and Bruwer, J., 2014. The Status of Internal Controls in Fast Moving
Small Medium and Micro Consumer Goods Enterprises within the Cape Peninsula. Mediterranean
Journal of Social Sciences, 5(10), pp.163-175
Smit, Y., 2012. A structured approach to risk management for South African SMEs. Thesis submitted in full
fulfilment for a DTech: Internal Auditing. Cape Peninsula University of Technology, Cape Town.
Prinsloo, S., Walker, C., Botha, L., Bruwer, J.P., and Smit, Y., 2015. The Influence of Combined Assurance Initiatives on the Efficiency of Risk
Management in Retail Small and Very Small Enterprises in Bellville, South Africa. Expert Journal of Business and Management, 3(2), pp.63-81
81
Smit, Y. and Watkins, A., 2012.A literature review of small and medium enterprises (SME) risk management
practices in South Africa. African Journal of Business Management, 6(21), pp. 6324-6330, 30 May
2012.
South Africa, 1996. National Small Business Enabling Act No, 102 of 1996. Pretoria: Government Printer.
South Africa, 2003. National Small Business Amendment Act No. 26 of 2003. Pretoria: Government Printers
Teketel, T. and Berhanu, Z., 2009. Internal Controls in Swedish Small and Medium Size enterprises. A
dissertation submitted in full fulfilment of the requirement for the degree of Masters in Business
Administration at the University of Umea.
Vallabhaneni, S.R., 2005. Wiley CIA Exam Review, Internal Audit Activity's Role in Governance, Risk. John
Wiley and Sons.
Valsamakis, A.C., Vivian, R.W., and Du Toit, G.S., 1996. The Theory and Principles of Risk Management.
Isando: Heinemann.
Valsamakis, A.C., Vivian, R.W. and Du Toit, G.S., 2000. Risk Management 2nd Edition. Sandton: Heinemann
Higher and Further Education.
Verduyn M., 2011. Step back to move ahead. [Online]. Available from:
http://www.rubeus.co.za/index.php?option=com_content&view=article&id=43:step-back-to-
moveahead&catid=16:articles&Itemid=5 [Accessed on 05/05/2014]
Watson, G.E.H., 2004. A situational analysis of entrepreneurship mentors in South Africa. A dissertation
submitted in fulfilment of the requirements for the degree Masters of Commerce in Business
Management at the University of South Africa.
Watt, J., 2007. Strategic risk management for small businesses. [In: Reuvid, J. (ed.). Managing Business Risk
2nd Edition – a practical guide to protecting your business. London – Philadelphia: Kogan Page].
Exper t J o urna l o f Bus iness a nd Ma na g e men t , V o lu m e 3 , Is su e 2 , p p . 8 2 -8 9 , 20 1 5
© 2 0 1 5 Th e Au th or . Pu b l i sh ed b y Sp r in t In v es t i f y . ISS N 2 3 4 4 -6 7 81 h t t p : / / Bu s in ess .Exp er t J ou rn a ls . c om
82
LEAN Tools in the IT Sector
Zoltán VAJNA*
MVMI Informatics Ltd., Hungary
Nowadays the LEAN tools – with their proven efficiency – are indispensable parts of
the production management. I think there is no producing enterprise that cannot
utilize a wide variety of these LEAN tools. The question now is how these tools can
support companies in increasing the efficiency of their supporting IT processes. In
this study I will demonstrate how these well-known LEAN tools from production
management can be used in IT management to create more cost-effective, efficient
and transparent solutions during the IT system development and IT operation
activities. I will show respectively – without attempting to be comprehensive – the
most important tools of the LEAN management and I will analyse how these tools can
be used in the IT sector. At the end of this study I will demonstrate what the IT
managers think about the practical use of these tools.
Keywords: LEAN, IT, waste, development, efficiency, cost-savings
JEL Classification: M15
1. Introduction
We cannot really study local markets nowadays, since major international corporations are present in
every market segment, it is thus safe to say then even small local producers have to compete in an international
competition. Different professional organisations constantly aim to formulate new recommendations, which
include principles that enable the corporations to more successfully compete in their specific market segment.
This is how the LEAN approach spread from the automobile manufacturing industry a few decades ago. The
most important elements of LEAN include flexibility, the identification of customer demands, providing values
and eliminating losses.
Without the appropriate IT support and IT systems, no corporation can meet the modern market
challenges in the 21st century. IT plays a dual role in business: we use it as a controlling tool and as a supporting
tool as well. Considering the fact that IT is intertwined in everyday lives, it is safe to say that IT operation, IT
system development and the results thereof are very important factors in the efficient operation of a
corporation. In my view, in order to enable IT the play the largest role possible in our business results, we need
to eliminate losses.
2. Eliminating Losses
In the competitive market there is a specific price the customers are willing to pay for a product.
Therefore LEAN methods aim to raise profit through decreasing the losses of the specific processes, instead
* Corresponding Author:
Zoltán Vajna, MVMI Informatics Ltd., Hungary
Article History:
Received 24 April 2014 | Accepted 10 May 2015 | Available Online 28 May 2015
Cite Reference:
Vajna, Z., 2015. LEAN Tools in the IT Sector. Expert Journal of Business and Management, 3(2), pp.82-89
Vajna, Z., 2015. LEAN Tools in the IT Sector. Expert Journal of Business and Management, 3(2), pp.82-89
83
of increasing prices. Toyota's Production System distinguishes between a total of seven losses (Ohno, 1988),
which was later supplemented by Liker with an eighth (Liker, 2008).
These losses are the following:
Overproduction: overproducing is the result of the manufacturing process that produced to the
inventory, without actual orders. The costs of overproduction appear in multiple fields of the manufacturing
process, including HR, storage, energy consumption and even transportation. In order to limit overproduction,
JIT transportation, application of the Kanban or "pull" principle, and one-piece flow were invented. In my
opinion, overproduction in the IT field means that more functions are developed to a specific system than what
is required. In such cases, the loss is apparent in the time spent, in operating and maintenance costs, but if the
system's complexity increases, it will have a direct impact on the work performance of the users and the
Support activity generated during operation.
Waiting: when material flow is not continuous on the line, waiting takes place. Waiting may be caused
by unbalanced manufacturing, loss due to changeovers, or it may be due to the lack of materials. When reserves
of the system run out, the first apparent consequence is waiting, which may be eliminated by techniques such
as SMED, balanced manufacturing or KANBAN baskets of the appropriate size. In the field of IT, waiting
should be divided into two separate parts: losses during development and operational time. Waiting during
development can be caused by the lack of available environments, during the time of testing or re-testing, or
by the non-conformity of distributing authorisations. In the development period, it is probably the lack of
information or its accuracy that causes the major and frequent problems, since it affects all the other losses as
well. During operation, waiting can be caused by maintenance times or slow response times.
Unnecessary movement of goods: the loss of the movement of goods occurs when the product is moved
more than what is necessary for the specific process. In such cases, unnecessary expenses occur on both the
HR and the logistics side. In production, this type of loss may be reduced for example by the plant layout (U-
shape) and by rethinking outsourced activities. In the field of IT, the unnecessary movement of goods may
apply when specific applications do not produce the required result for the first time, since this involves fixing
and re-testing. The previously mentioned quality and quantity of information also leads here, since if the
customer has to be visited again, it is classified as a loss. This attached loss can be eliminated most easily, if
the infrastructure required for development is established at the customer (Poppendieck & Poppendieck, 2003).
Processing or quality loss: every action that is beyond the identified required values, causing loss. Re-
processing or scrap (rejects) due to quality problems also mean a loss for the corporation. This loss may be
reduced, if value stream mapping is performed and quality is installed into the product (SIX SIGMA). It is
important to develop systems that can indicate failures and automatically stop the process, if necessary. During
the course of the IT development, quality may be implemented in the process by performing continuous
interaction with the customer or applying automatic testing systems. We build modular systems, and design
development in a manner that disassembles it to the smallest operational elements, which are then tested and
delivered. The most obvious choice is using a more iterative and agile methodology instead of the waterfall
model, which would enable us to produce an adequate quality in a relatively swiftly changing environment as
well (Qusef & Lucia, 2010).
Inventory: the costs of maintaining the inventory are apparent in multiple areas. Such incurred costs
include the maintenance of buildings, HR, the costs of certain tools and materials, depreciation, and therefore
we face a problem that is easy to grasp and calculate from a production point of view. Another disadvantage
of accumulating the inventory, is that it hides the operative problems of the organisation. Therefore, in case
inventory is reduced, waiting may occur on the production line. In such cases, the tasks is not to reload the
inventory, but to investigate and eliminate the root causes of waiting. During system development, inventory
can be interpreted the following way: if the specific development activity is ready sooner than it could be
received by the customer for testing, we have unused capacities created. During operation, inventory may also
be interpreted through the aspects of unnecessary storage space and server accumulation. Today's modern
virtualization techniques can provide an answer to this, and balance the usage peaks of the unbalanced use of
the specific services.
Unnecessary motion: all activities including movements that supplement our value-creating activity,
shall be considered losses. The loss can be reduced by activity analysis. The lack of the previously mentioned
information also leads to such loss, since if the customer has to be visited again, it is also classified as
unnecessary motion. This attached loss can be eliminated most easily, if the infrastructure required for
development is established at the customer (Poppendieck & Poppendieck, 2003). If it is not possible, then
creating certain workgroup pages may reduce the time spent with acquiring information. During operation, the
time spent on solving the repeated failure can be classified as this type of loss.
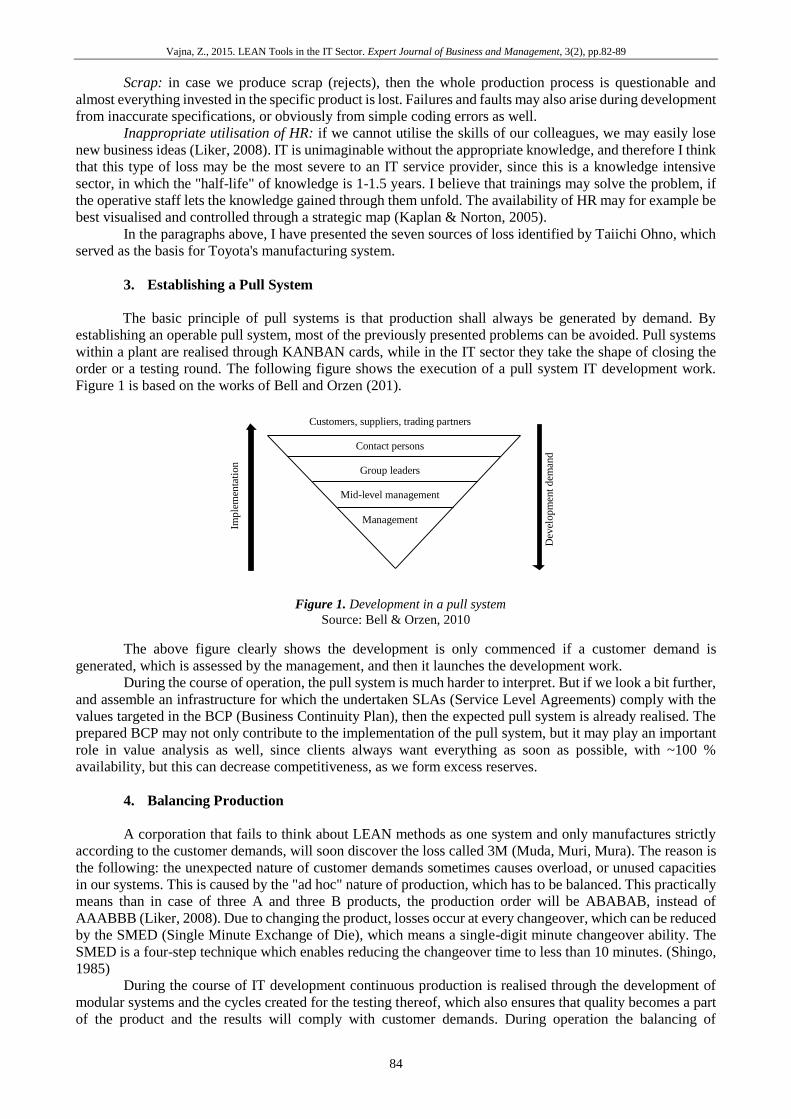
Vajna, Z., 2015. LEAN Tools in the IT Sector. Expert Journal of Business and Management, 3(2), pp.82-89
84
Scrap: in case we produce scrap (rejects), then the whole production process is questionable and
almost everything invested in the specific product is lost. Failures and faults may also arise during development
from inaccurate specifications, or obviously from simple coding errors as well.
Inappropriate utilisation of HR: if we cannot utilise the skills of our colleagues, we may easily lose
new business ideas (Liker, 2008). IT is unimaginable without the appropriate knowledge, and therefore I think
that this type of loss may be the most severe to an IT service provider, since this is a knowledge intensive
sector, in which the "half-life" of knowledge is 1-1.5 years. I believe that trainings may solve the problem, if
the operative staff lets the knowledge gained through them unfold. The availability of HR may for example be
best visualised and controlled through a strategic map (Kaplan & Norton, 2005).
In the paragraphs above, I have presented the seven sources of loss identified by Taiichi Ohno, which
served as the basis for Toyota's manufacturing system.
3. Establishing a Pull System
The basic principle of pull systems is that production shall always be generated by demand. By
establishing an operable pull system, most of the previously presented problems can be avoided. Pull systems
within a plant are realised through KANBAN cards, while in the IT sector they take the shape of closing the
order or a testing round. The following figure shows the execution of a pull system IT development work.
Figure 1 is based on the works of Bell and Orzen (201).
Figure 1. Development in a pull system
Source: Bell & Orzen, 2010
The above figure clearly shows the development is only commenced if a customer demand is
generated, which is assessed by the management, and then it launches the development work.
During the course of operation, the pull system is much harder to interpret. But if we look a bit further,
and assemble an infrastructure for which the undertaken SLAs (Service Level Agreements) comply with the
values targeted in the BCP (Business Continuity Plan), then the expected pull system is already realised. The
prepared BCP may not only contribute to the implementation of the pull system, but it may play an important
role in value analysis as well, since clients always want everything as soon as possible, with ~100 %
availability, but this can decrease competitiveness, as we form excess reserves.
4. Balancing Production
A corporation that fails to think about LEAN methods as one system and only manufactures strictly
according to the customer demands, will soon discover the loss called 3M (Muda, Muri, Mura). The reason is
the following: the unexpected nature of customer demands sometimes causes overload, or unused capacities
in our systems. This is caused by the "ad hoc" nature of production, which has to be balanced. This practically
means than in case of three A and three B products, the production order will be ABABAB, instead of
AAABBB (Liker, 2008). Due to changing the product, losses occur at every changeover, which can be reduced
by the SMED (Single Minute Exchange of Die), which means a single-digit minute changeover ability. The
SMED is a four-step technique which enables reducing the changeover time to less than 10 minutes. (Shingo,
1985)
During the course of IT development continuous production is realised through the development of
modular systems and the cycles created for the testing thereof, which also ensures that quality becomes a part
of the product and the results will comply with customer demands. During operation the balancing of
Customers, suppliers, trading partners
Contact persons
Group leaders
Mid-level management
Management
Dev
elop
men
t d
eman
d
Imp
lem
enta
tion

Vajna, Z., 2015. LEAN Tools in the IT Sector. Expert Journal of Business and Management, 3(2), pp.82-89
85
production is implemented through virtualization technologies. This means that the system is provided with
the virtual availability of resources that it does not actually possess, and thus the irregularities caused by usage
can be balanced. For example the HR system runs at full capacity during payroll management, so if we find a
system that is used at some other time, then the two systems can share the resources.
5. Including Quality in the Process
If we ensure that appropriate quality production can be realised at the first attempt, then we are relieved
of a loss identified in one of the previous chapters. In mass production the most important goal is the operation
of the lines, while according to the LEAN approach, in case of a failure, the process has to stop and shall be
repaired, in order to prevent the failure from occurring again. Practically any employee is authorised to stop
the line, when he faces a problem. Switches are placed along the production line, and in case of a problem the
employee can use them to indicate the foreman that he faced a problem and requires help (Liker, 2008). These
lights are called "andons" and they are means of visual control.
Quality can be included in the product through continuous improvement. In order to enable this, we
need analysis techniques like 5W (5 Whys), RCA (Root cause analysis), FMEA (Failure mode and effects
analysis), FMECA (Failure mode, effects, and criticality analysis) or FTA (Fault tree analysis).
The different monitoring systems fulfil the role of the previously explained "andon" in IT operation.
In these systems, the entire analysed infrastructure is constructed based on the tree structure (in the required
depth) and the specific service is located at the root of the tree. The system continuously tests the different
branches of the tree, and signals to the operator if any algorithm faces an error, if there is no response, or - if
applicable - when the response time is too long. In case of a failure, the specific service part is indicated in a
flashy manner on the operator's screen, and he may decide whether it is necessary to intervene in the process.
If the problem can be solved without shutting down, providing a continuous service is practically ensured.
By developing modular systems, not only the workloads between specification-development-testing
can be distributed, but we also receive quicker feedback regarding the qualities of the completed elements,
enabling faster intervention in the process and reaching the optimal result. The methodology of "fragmented"
system development complies with the principle of one-piece material flow. The services of thus created
system components provide a foundation of appropriate quality for satisfying further business demands.
6. Standardization
According to Henry Ford, standardization is the basis of development (Liker, 2008). He argued that
the optimum of the current stage shall be reached first, and then we shall continue to work to develop it.
Standardization is also an important element of the LEAN approach, which is reflected in the 5S (Seiri, Seiton,
Seiso, Seiketsu, Shitsuke). The fourth and fifth S can be introduced, if the target results are already reach in
the three first areas, i.e. we defined what is required for work, placed them properly and maintain them as well.
The fourth and fifth S is about measurement and training.
Standardization in the IT service is primarily reflected in the ITIL or CMML SVC recommendations.
This includes how our IT services should be structured in order to be able to provide high level services.
During the course of development, standardization is included in planning and system development
approach according to the SOA (Service Oriented Architecture). But what is SOA? It is hard to define. Not
because there was no definition, but because there are so many definitions that it is hard to decide which one
is appropriate. According to the approach I find the most appropriate, the SOA is a paradigm and planning
method approach that should be applied in order to get the description of a business or IT architecture. (Nicolai
M., 2007) In the SOA-based philosophy, stand-alone systems cease to exist and we discuss the internal
structure of the components. In the SOA maturity model of "The Open Group", the companies at the top level
possess such IT infrastructure that is suitable for dynamic application development, has a reconfigurable
architecture, models business processes and its control is based on an appropriate set of rules (The Open Group,
2013).
7. Continuous Learning, Development
Continuous learning is based on looking in the mirror from time to time, and analysing our
deficiencies. If we know where our deficiencies lie, we can execute continuous learning, the KAIZEN (Liker,
2008). In the LEAN approach, continuous learning has four levels: the corporate, the management, the
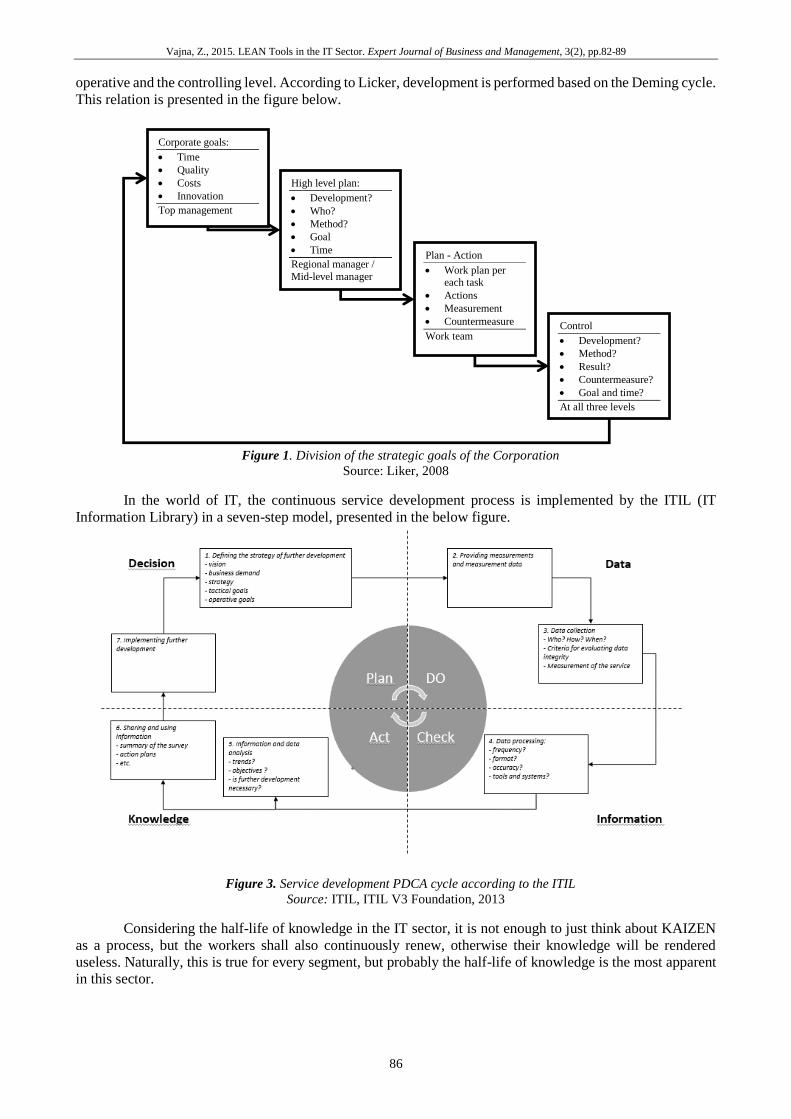
Vajna, Z., 2015. LEAN Tools in the IT Sector. Expert Journal of Business and Management, 3(2), pp.82-89
86
operative and the controlling level. According to Licker, development is performed based on the Deming cycle.
This relation is presented in the figure below.
Figure 1. Division of the strategic goals of the Corporation
Source: Liker, 2008
In the world of IT, the continuous service development process is implemented by the ITIL (IT
Information Library) in a seven-step model, presented in the below figure.
Figure 3. Service development PDCA cycle according to the ITIL
Source: ITIL, ITIL V3 Foundation, 2013
Considering the half-life of knowledge in the IT sector, it is not enough to just think about KAIZEN
as a process, but the workers shall also continuously renew, otherwise their knowledge will be rendered
useless. Naturally, this is true for every segment, but probably the half-life of knowledge is the most apparent
in this sector.
Corporate goals:
Time
Quality
Costs
Innovation
Top management
High level plan: Development?
Who?
Method?
Goal
Time
Regional manager /
Mid-level manager
Plan - Action Work plan per
each task
Actions
Measurement
Countermeasure
Work team Control Development?
Method?
Result?
Countermeasure?
Goal and time?
At all three levels
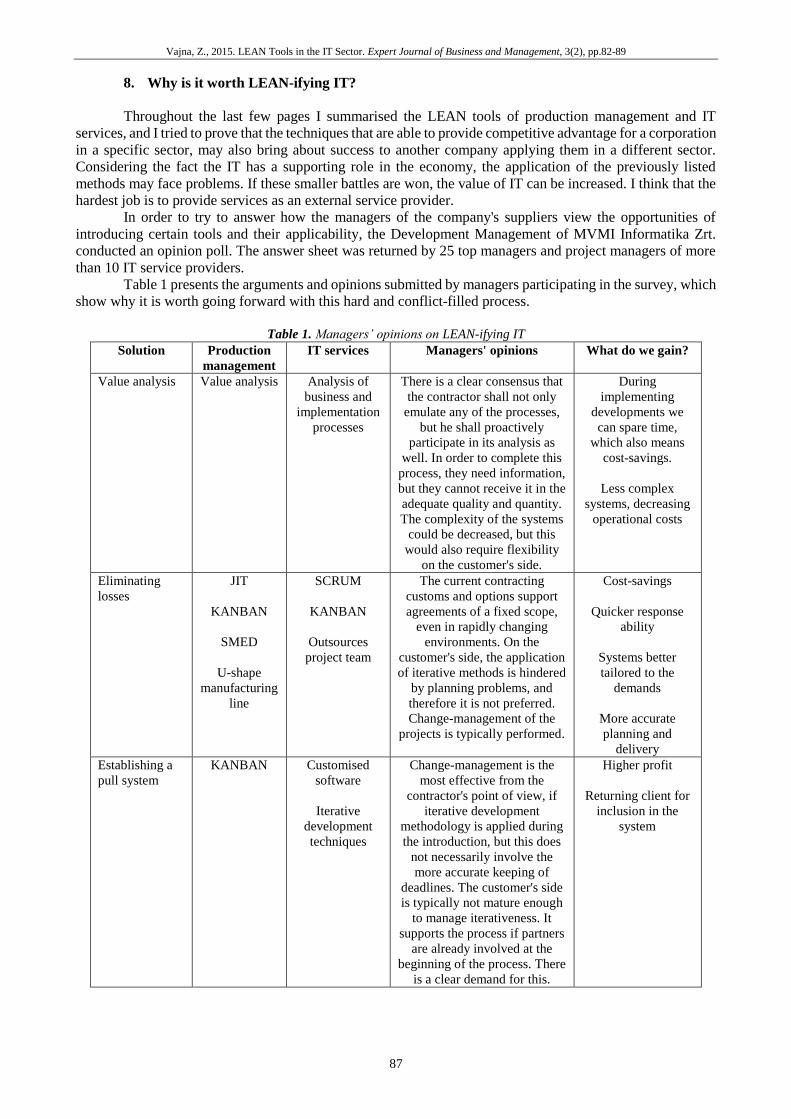
Vajna, Z., 2015. LEAN Tools in the IT Sector. Expert Journal of Business and Management, 3(2), pp.82-89
87
8. Why is it worth LEAN-ifying IT?
Throughout the last few pages I summarised the LEAN tools of production management and IT
services, and I tried to prove that the techniques that are able to provide competitive advantage for a corporation
in a specific sector, may also bring about success to another company applying them in a different sector.
Considering the fact the IT has a supporting role in the economy, the application of the previously listed
methods may face problems. If these smaller battles are won, the value of IT can be increased. I think that the
hardest job is to provide services as an external service provider.
In order to try to answer how the managers of the company's suppliers view the opportunities of
introducing certain tools and their applicability, the Development Management of MVMI Informatika Zrt.
conducted an opinion poll. The answer sheet was returned by 25 top managers and project managers of more
than 10 IT service providers.
Table 1 presents the arguments and opinions submitted by managers participating in the survey, which
show why it is worth going forward with this hard and conflict-filled process.
Table 1. Managers’ opinions on LEAN-ifying IT
Solution Production
management
IT services Managers' opinions What do we gain?
Value analysis Value analysis Analysis of
business and
implementation
processes
There is a clear consensus that
the contractor shall not only
emulate any of the processes,
but he shall proactively
participate in its analysis as
well. In order to complete this
process, they need information,
but they cannot receive it in the
adequate quality and quantity.
The complexity of the systems
could be decreased, but this
would also require flexibility
on the customer's side.
During
implementing
developments we
can spare time,
which also means
cost-savings.
Less complex
systems, decreasing
operational costs
Eliminating
losses
JIT
KANBAN
SMED
U-shape
manufacturing
line
SCRUM
KANBAN
Outsources
project team
The current contracting
customs and options support
agreements of a fixed scope,
even in rapidly changing
environments. On the
customer's side, the application
of iterative methods is hindered
by planning problems, and
therefore it is not preferred.
Change-management of the
projects is typically performed.
Cost-savings
Quicker response
ability
Systems better
tailored to the
demands
More accurate
planning and
delivery
Establishing a
pull system
KANBAN Customised
software
Iterative
development
techniques
Change-management is the
most effective from the
contractor's point of view, if
iterative development
methodology is applied during
the introduction, but this does
not necessarily involve the
more accurate keeping of
deadlines. The customer's side
is typically not mature enough
to manage iterativeness. It
supports the process if partners
are already involved at the
beginning of the process. There
is a clear demand for this.
Higher profit
Returning client for
inclusion in the
system
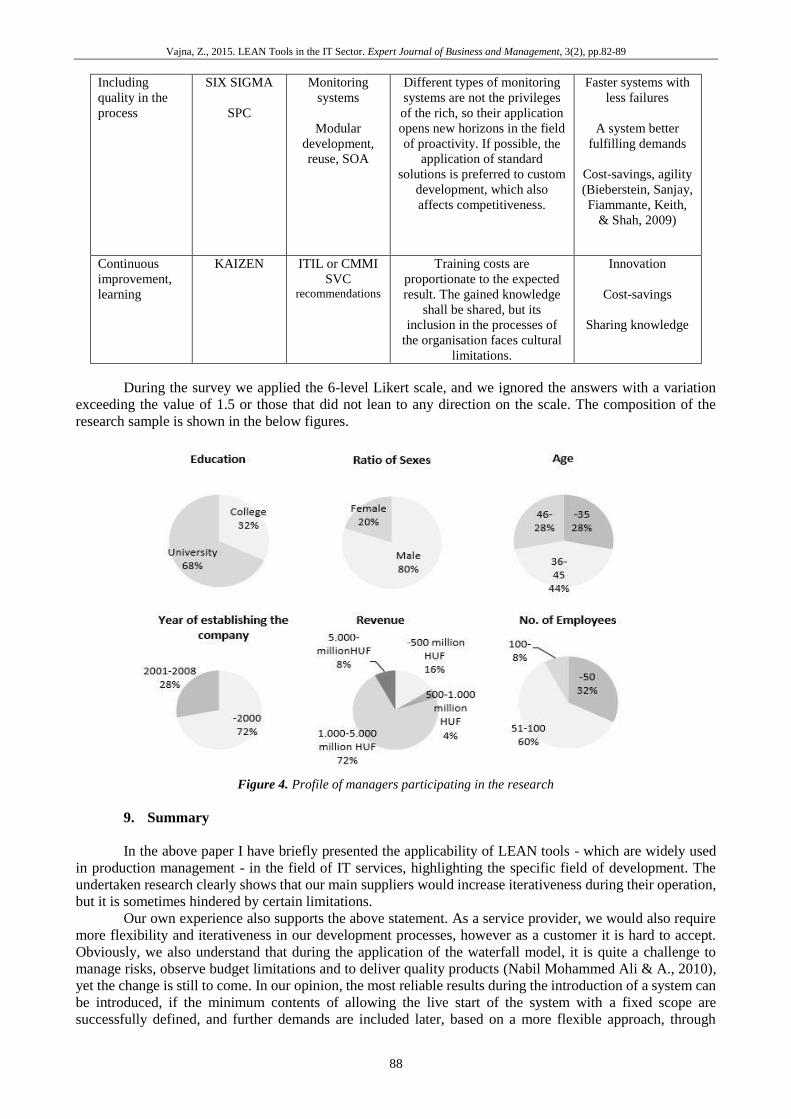
Vajna, Z., 2015. LEAN Tools in the IT Sector. Expert Journal of Business and Management, 3(2), pp.82-89
88
Including
quality in the
process
SIX SIGMA
SPC
Monitoring
systems
Modular
development,
reuse, SOA
Different types of monitoring
systems are not the privileges
of the rich, so their application
opens new horizons in the field
of proactivity. If possible, the
application of standard
solutions is preferred to custom
development, which also
affects competitiveness.
Faster systems with
less failures
A system better
fulfilling demands
Cost-savings, agility
(Bieberstein, Sanjay,
Fiammante, Keith,
& Shah, 2009)
Continuous
improvement,
learning
KAIZEN ITIL or CMMI
SVC recommendations
Training costs are
proportionate to the expected
result. The gained knowledge
shall be shared, but its
inclusion in the processes of
the organisation faces cultural
limitations.
Innovation
Cost-savings
Sharing knowledge
During the survey we applied the 6-level Likert scale, and we ignored the answers with a variation
exceeding the value of 1.5 or those that did not lean to any direction on the scale. The composition of the
research sample is shown in the below figures.
Figure 4. Profile of managers participating in the research
9. Summary
In the above paper I have briefly presented the applicability of LEAN tools - which are widely used
in production management - in the field of IT services, highlighting the specific field of development. The
undertaken research clearly shows that our main suppliers would increase iterativeness during their operation,
but it is sometimes hindered by certain limitations.
Our own experience also supports the above statement. As a service provider, we would also require
more flexibility and iterativeness in our development processes, however as a customer it is hard to accept.
Obviously, we also understand that during the application of the waterfall model, it is quite a challenge to
manage risks, observe budget limitations and to deliver quality products (Nabil Mohammed Ali & A., 2010),
yet the change is still to come. In our opinion, the most reliable results during the introduction of a system can
be introduced, if the minimum contents of allowing the live start of the system with a fixed scope are
successfully defined, and further demands are included later, based on a more flexible approach, through
Vajna, Z., 2015. LEAN Tools in the IT Sector. Expert Journal of Business and Management, 3(2), pp.82-89
89
continuous development. The application of virtualization techniques and monitoring systems is widely
popular, but the advantages of the SOA are yet to be seen. In this field, the biggest challenge is having to teach
participants not to think in IT systems, but in corporate, business and IT architectures.
References
Bell, S. C., and Orzen, M. A., 2010. Lean IT: Enabling and Sustaining Your Lean Transformation. New York:
Productivity Press.
Bieberstein, N., Sanjay, B., Fiammante, M., Keith, J., and Shah, R., 2009. Szolgáltatásorientált Architektúra.
Budapest: Panem Könyvkiadó Kft.
Carr, N., 2003. IT Doesn't Matter. Harward Buisness Review.
Ho Ha , S., and Chan Park , S., 2006. Service Quality Improvement through Business Process Management
based on Data Mining. SIGKDD Explorations , 8(1), pp.49-56. Available online:
http://www.kdd.org/newsletter/explorations-june-2006-8-1 [Accessed 19 February 2015]
ITIL., 2013. ITIL alapszintű oktatás. Sarkadi-Nagy István, Paks.
ITIL., 2013. ITIL V3 Foundation. Sarkadi-Nagy István, Paks.
Kaplan, R., and Norton, D., 2005. Stratégiai térképek. Budapest: Panem Kft.
Liker, J. K., 2008. A Toyota Módszer: 14 Vállalatirányítási alapelv. Budapest: HVG Kiadó Zrt.
Martin, K., and Osterling, M., 2013. Walue Stream Mapping. Mc Graw Hill.
Nabil Mohammed A.M. and Govardhan, A., 2010. A Comparison Between Five Models Of Software
Engineering. International Journal of Computer Science Issues , 7(5), pp.94-101.
Nicolai M., J., 2007. SOA in Practice: The Art of Distributed System Design. Sebastopol: O'Reilly Media Inc.
Ohno, T., 1988. Toyota Production System - Beyond Large-Scale Production. Portland: Productivity Inc.
Poppendieck, M., and Poppendieck, T., 2003. Lean Software Development - An Agile Toolkit. Crawfordswille:
Addison-Wesley.
Qusef , A., and Lucia, A. D., 2010. Requirements Engineering in Agile Software Development. Journal of
Emerging Technologies in Web Intelligence, 2(3), pp.212-220.
Rother, M., and Shook, J., 1999. Learning to See: Value Stream Mapping to Add Value and Eliminate MUDA.
Cambridge: Lean Enterprise Institute Inc.
Shingo, S., 1985. A Revolution in Manufacturing: The SMED System. Cambridge: Productivity Press.
The Open Group, 2013. Retrieved from OSIMM Version 2 Technical Standard. Available online:
http://www.opengroup.org/soa/source-book/osimmv2/model.htm#fig1 [Accessed 19 February 2015]
Wikipedia., 2013. Lean IT. Available online: http://en.wikipedia.org/wiki/Lean_IT [Accessed online 06 June
2013]
Womack, J. P., and Jones, D. T., 2009. Lean szemlélet. Budapest: HVG Kiadó Zrt.
Exper t J o urna l o f Bus iness a nd Ma na g e men t , V o lu m e 3 , Is su e 2 , p p . 9 0 -1 0 4 , 2 0 15
© 2 0 1 5 Th e Au th ors . Pu b l i sh ed b y Sp r in t In v es t i f y . IS S N 2 3 4 4 -6 78 1
h t t p : / /Bu s in ess .Exp er t J ou rn a ls . c om
90
Competence Utilization for Innovation
Capabilities – A Question of Trust?
Britta BOLZERN-KONRAD1, Carolin EGGER1,2*,
Ērika ŠUMILO1
1University of Latvia, Latvia 2Kufstein University of Applied Sciences, Austria
The purpose of this paper is to show how trust as an organizational value
contributes to employee competence utilization in the case of innovation
capability. Thus, it is the objective of this paper to analyze the positive
impacts, but also potential limits of trust in business management. The
research paper uses two different quantitative empirical studies drawn from
German and Austrian mid-sized companies to empirically test this
interrelation. As a result, the paper determines particular aspects of trust
such as accountability, shared norms and the ability to take responsibility to
be interrelated with the usage of employee competences and underlines a
positive connection between product innovation performance and trust.
However, the trust concept needs enriching elements to be balanced towards
a feeling of mutual reliance and support creativity instead; inclusions of
bridging social capital, elements of distrust and a pioneering spirit are to be
mentioned here.
Keywords: Trust, employee competence utilization, innovation, creativity
JEL Classification: D23, D83, L22, L25, M11, M14, L20, O30, O31, O32,
O34
1. Introduction
Scientists have elaborated on a wide range of ideas on innovations related to different influencing
variables in companies (Medina et al., 2005). Still, innovation in itself is mostly unique, which is the reason
why an entirely valid model for fruitful innovation has not yet appeared (Delbecq and Mills, 1985). To manage
all the influencing factors, which, generally, can be classified into factors from the general environment, the
competitive environment, and the company environment becomes increasingly important for managers. With
limited budgets, the question arises where to focus on and how to enhance innovation capabilities without
* Corresponding Author: Carolin Egger, Kufstein University of Applied Sciences, Austria
Article History: Received 29 April 2015 | Accepted 15 May 2015 | Available Online 29 May 2015
Cite Reference:
Bolzern-Konrad, B., Egger, C., and Šumilo, Ē., 2015. Competence Utilization for Innovation Capabilities – A Question of Trust?. Expert Journal of
Business and Management, 3(2), pp.90-104
Bolzern-Konrad, B., Egger, C. and Šumilo, Ē., 2015. Competence Utilization for Innovation Capabilities – A Question of Trust?
Expert Journal of Business and Management, 3(2), pp.90-104
91
having above-average financial resources. And, even if financial resources are available, research shows that
this alone does not make innovation an automatic outcome at all, either. Despite the importance generally
attributed to soft organizational factors such as organizational values for innovation, empirical research
remains somewhat limited. Particularly the interrelations of trust as an organizational value, and how it
contributes to the utilization of employee competences with special regard to innovation has only received
scarce treatment so far. Therefore, the research paper at hand makes a first approach to fill in this gap. The
major research question involved can be phrased as follows: How does trust as an organizational value
contribute to employee competence utilization in the case of innovation capability? First, a theoretical framework of employee competence utilization, trust, and its impact on innovation
is built. On the basis of two empirical studies in German and Austrian mid-sized companies, the positive impact
of different aspects on particular innovation performance outcomes is determined. This leads to a discussion
of the empirical results and an overall validation of the propositions that the authors put forth. Finally, the end
of the paper shows limitations, conclusions and suggestions for further research.
2. Literature Review: A Theoretical Framework of Trust, Employee Competence Utilization
and Innovation
2.1. The Capability to Develop Innovative Ideas as Part of a Universal Competence Portfolio
In order to approach the aspect of competence utilization, the concept of competencies itself has to be
understood first. With the historical development of the competence definition in mind, the discussion debate
has moved from a purely individual perspective to one focused on social systems and organizations (Bolzern-
Konrad, 2013). Furthermore, for both individual and organizational levels of competence, the research has
moved from a more stability-oriented view to a dynamic view (Eberl, 2009). Especially in the frame of
education science Weinert (2001) gives an important definition on competencies: “competencies are cognitive
skills, either existing or learnable, along with motivational and social willingness and ability to solve these
problems successfully and responsibly in various situations (HRK, 2012).” Reflecting on the individual
competence understanding, and with this linking back also to the psychological and educational perspective,
Eberl subsumes in another work, that the connecting bracket has to be seen in three basic bonding elements:
the emphasis on practice, the self-organization-disposition thought and the relevance of learning. The emphasis
on practice requires effective action that delivers positive, usable results. Further to this, if competencies cannot
be demonstrated competence reduction is the result on a long-term perspective. The self-organization
disposition is related to qualitative aspects like skills and knowledge as well as motivational skills such as
motives, norms and attitudes. It also includes the element of self-directed solutions. The learning dimension
covers the aspect of self-directed continuous extension of knowledge and ability (Eberl, 2009). These elements
are comparable to the description of competencies by Erpenbeck and Rosenstiel (2007). Their understanding
of competencies incorporates a meaningful and fruitful action in open, complex, sometimes even chaotic
situations that allow self-organization under theoretical and actual insecurity through self-accounting rules,
norms and values. According to their model, competencies include skills, knowledge and qualifications, but
cannot be reduced to it. Competencies additionally need the capacity to act in open unsecure complex situations
based on self-made rules, norms and values. Therefore competencies are dispositions of self-organized action,
including informal and self-organized learning (Erpenbeck and Rosenstiel, 2007). The aspect of self-organized
learning is directly linked to innovation capability.
The individual perspective can neither be seen as isolated, nor as organizational competencies, which
should be seen separately from the organizational perspective. In this sense individual competences generate
in its combination sustainable success for the company, with organizational competencies being a product of
competent individuals in addition (Eberl, 2009). In her model of organizational competencies Eberl specifies
organizational competencies towards three dimensions: the cognitive, the practical and the affective. The
cognitive dimension refers to “sense models”. This dimension incorporates the organization’s “view on the
world” and can be allocated in the field of organizational culture. The practical dimension refers to “patterns
of action” and is defined through collective, complex schemes of action. The affective dimension refers to
creativity and motivation in insecure environments (Eberl, 2009). The capability to develop innovative and
creative ideas is thus a central part of the universal competence portfolio, based on self-organization and
affective processes. Particularly the affective dimension also reflects the aspect of willingness; an essential
aspect when touching on competence utilization. Competence-in-use is based on a sufficient level of ability,
but necessarily needs the element of willingness as well. Referring to the situational leadership model of
Hersey and Blanchard (1974), the maturity level of an employee equates to their development level. They
further explain that the developmental level is the degree of competence and commitment a person has, to
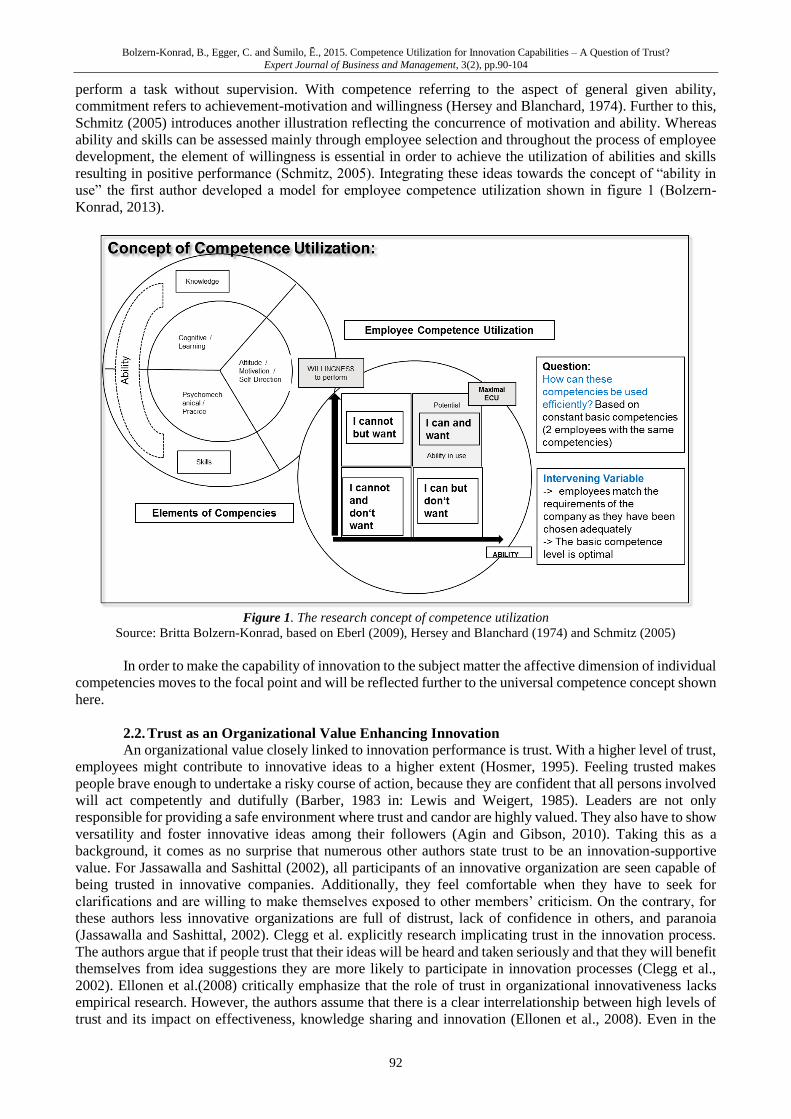
Bolzern-Konrad, B., Egger, C. and Šumilo, Ē., 2015. Competence Utilization for Innovation Capabilities – A Question of Trust?
Expert Journal of Business and Management, 3(2), pp.90-104
92
perform a task without supervision. With competence referring to the aspect of general given ability,
commitment refers to achievement-motivation and willingness (Hersey and Blanchard, 1974). Further to this,
Schmitz (2005) introduces another illustration reflecting the concurrence of motivation and ability. Whereas
ability and skills can be assessed mainly through employee selection and throughout the process of employee
development, the element of willingness is essential in order to achieve the utilization of abilities and skills
resulting in positive performance (Schmitz, 2005). Integrating these ideas towards the concept of “ability in
use” the first author developed a model for employee competence utilization shown in figure 1 (Bolzern-
Konrad, 2013).
Figure 1. The research concept of competence utilization
Source: Britta Bolzern-Konrad, based on Eberl (2009), Hersey and Blanchard (1974) and Schmitz (2005)
In order to make the capability of innovation to the subject matter the affective dimension of individual
competencies moves to the focal point and will be reflected further to the universal competence concept shown
here.
2.2. Trust as an Organizational Value Enhancing Innovation
An organizational value closely linked to innovation performance is trust. With a higher level of trust,
employees might contribute to innovative ideas to a higher extent (Hosmer, 1995). Feeling trusted makes
people brave enough to undertake a risky course of action, because they are confident that all persons involved
will act competently and dutifully (Barber, 1983 in: Lewis and Weigert, 1985). Leaders are not only
responsible for providing a safe environment where trust and candor are highly valued. They also have to show
versatility and foster innovative ideas among their followers (Agin and Gibson, 2010). Taking this as a
background, it comes as no surprise that numerous other authors state trust to be an innovation-supportive
value. For Jassawalla and Sashittal (2002), all participants of an innovative organization are seen capable of
being trusted in innovative companies. Additionally, they feel comfortable when they have to seek for
clarifications and are willing to make themselves exposed to other members’ criticism. On the contrary, for
these authors less innovative organizations are full of distrust, lack of confidence in others, and paranoia
(Jassawalla and Sashittal, 2002). Clegg et al. explicitly research implicating trust in the innovation process.
The authors argue that if people trust that their ideas will be heard and taken seriously and that they will benefit
themselves from idea suggestions they are more likely to participate in innovation processes (Clegg et al.,
2002). Ellonen et al.(2008) critically emphasize that the role of trust in organizational innovativeness lacks
empirical research. However, the authors assume that there is a clear interrelationship between high levels of
trust and its impact on effectiveness, knowledge sharing and innovation (Ellonen et al., 2008). Even in the
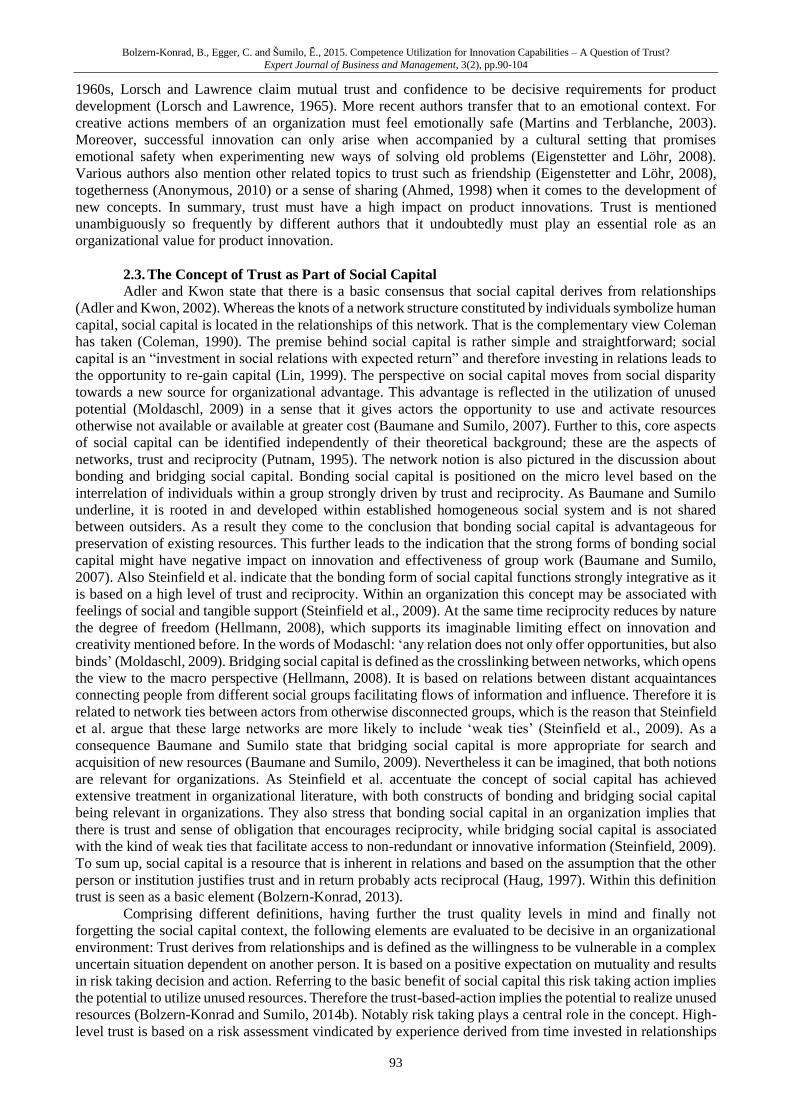
Bolzern-Konrad, B., Egger, C. and Šumilo, Ē., 2015. Competence Utilization for Innovation Capabilities – A Question of Trust?
Expert Journal of Business and Management, 3(2), pp.90-104
93
1960s, Lorsch and Lawrence claim mutual trust and confidence to be decisive requirements for product
development (Lorsch and Lawrence, 1965). More recent authors transfer that to an emotional context. For
creative actions members of an organization must feel emotionally safe (Martins and Terblanche, 2003).
Moreover, successful innovation can only arise when accompanied by a cultural setting that promises
emotional safety when experimenting new ways of solving old problems (Eigenstetter and Löhr, 2008).
Various authors also mention other related topics to trust such as friendship (Eigenstetter and Löhr, 2008),
togetherness (Anonymous, 2010) or a sense of sharing (Ahmed, 1998) when it comes to the development of
new concepts. In summary, trust must have a high impact on product innovations. Trust is mentioned
unambiguously so frequently by different authors that it undoubtedly must play an essential role as an
organizational value for product innovation.
2.3. The Concept of Trust as Part of Social Capital
Adler and Kwon state that there is a basic consensus that social capital derives from relationships
(Adler and Kwon, 2002). Whereas the knots of a network structure constituted by individuals symbolize human
capital, social capital is located in the relationships of this network. That is the complementary view Coleman
has taken (Coleman, 1990). The premise behind social capital is rather simple and straightforward; social
capital is an “investment in social relations with expected return” and therefore investing in relations leads to
the opportunity to re-gain capital (Lin, 1999). The perspective on social capital moves from social disparity
towards a new source for organizational advantage. This advantage is reflected in the utilization of unused
potential (Moldaschl, 2009) in a sense that it gives actors the opportunity to use and activate resources
otherwise not available or available at greater cost (Baumane and Sumilo, 2007). Further to this, core aspects
of social capital can be identified independently of their theoretical background; these are the aspects of
networks, trust and reciprocity (Putnam, 1995). The network notion is also pictured in the discussion about
bonding and bridging social capital. Bonding social capital is positioned on the micro level based on the
interrelation of individuals within a group strongly driven by trust and reciprocity. As Baumane and Sumilo
underline, it is rooted in and developed within established homogeneous social system and is not shared
between outsiders. As a result they come to the conclusion that bonding social capital is advantageous for
preservation of existing resources. This further leads to the indication that the strong forms of bonding social
capital might have negative impact on innovation and effectiveness of group work (Baumane and Sumilo,
2007). Also Steinfield et al. indicate that the bonding form of social capital functions strongly integrative as it
is based on a high level of trust and reciprocity. Within an organization this concept may be associated with
feelings of social and tangible support (Steinfield et al., 2009). At the same time reciprocity reduces by nature
the degree of freedom (Hellmann, 2008), which supports its imaginable limiting effect on innovation and
creativity mentioned before. In the words of Modaschl: ‘any relation does not only offer opportunities, but also
binds’ (Moldaschl, 2009). Bridging social capital is defined as the crosslinking between networks, which opens
the view to the macro perspective (Hellmann, 2008). It is based on relations between distant acquaintances
connecting people from different social groups facilitating flows of information and influence. Therefore it is
related to network ties between actors from otherwise disconnected groups, which is the reason that Steinfield
et al. argue that these large networks are more likely to include ‘weak ties’ (Steinfield et al., 2009). As a
consequence Baumane and Sumilo state that bridging social capital is more appropriate for search and
acquisition of new resources (Baumane and Sumilo, 2009). Nevertheless it can be imagined, that both notions
are relevant for organizations. As Steinfield et al. accentuate the concept of social capital has achieved
extensive treatment in organizational literature, with both constructs of bonding and bridging social capital
being relevant in organizations. They also stress that bonding social capital in an organization implies that
there is trust and sense of obligation that encourages reciprocity, while bridging social capital is associated
with the kind of weak ties that facilitate access to non-redundant or innovative information (Steinfield, 2009).
To sum up, social capital is a resource that is inherent in relations and based on the assumption that the other
person or institution justifies trust and in return probably acts reciprocal (Haug, 1997). Within this definition
trust is seen as a basic element (Bolzern-Konrad, 2013).
Comprising different definitions, having further the trust quality levels in mind and finally not
forgetting the social capital context, the following elements are evaluated to be decisive in an organizational
environment: Trust derives from relationships and is defined as the willingness to be vulnerable in a complex
uncertain situation dependent on another person. It is based on a positive expectation on mutuality and results
in risk taking decision and action. Referring to the basic benefit of social capital this risk taking action implies
the potential to utilize unused resources. Therefore the trust-based-action implies the potential to realize unused
resources (Bolzern-Konrad and Sumilo, 2014b). Notably risk taking plays a central role in the concept. High-
level trust is based on a risk assessment vindicated by experience derived from time invested in relationships
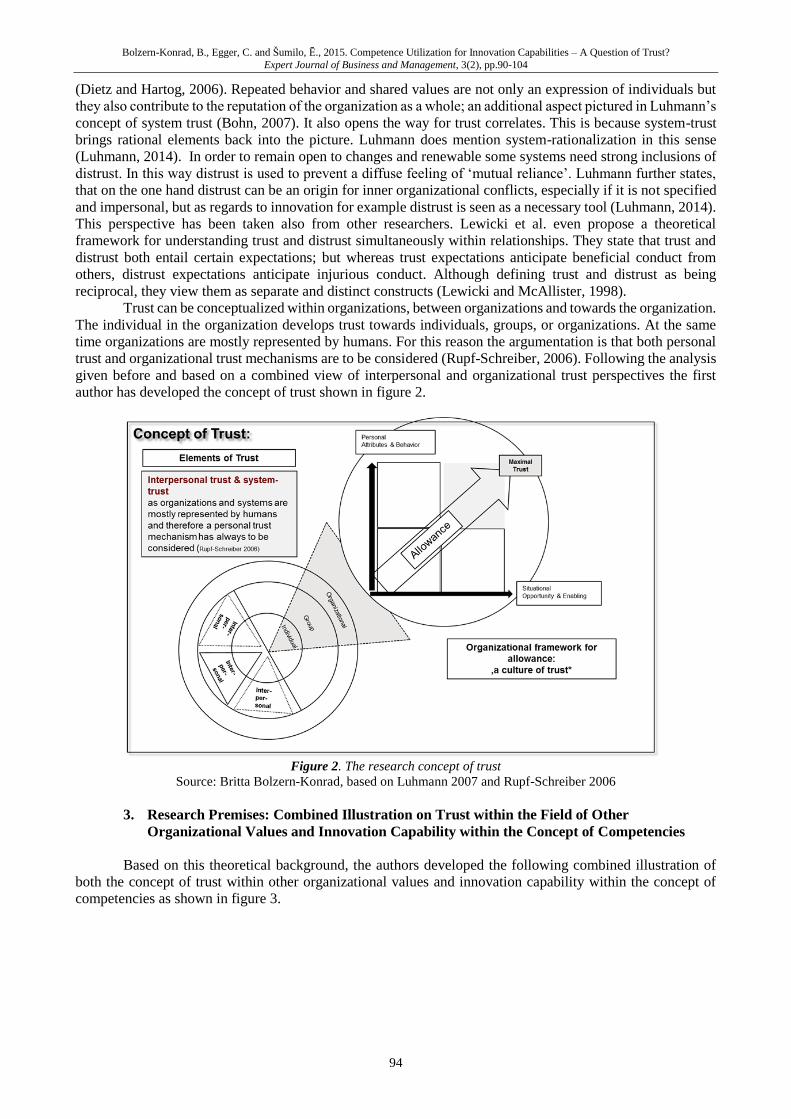
Bolzern-Konrad, B., Egger, C. and Šumilo, Ē., 2015. Competence Utilization for Innovation Capabilities – A Question of Trust?
Expert Journal of Business and Management, 3(2), pp.90-104
94
(Dietz and Hartog, 2006). Repeated behavior and shared values are not only an expression of individuals but
they also contribute to the reputation of the organization as a whole; an additional aspect pictured in Luhmann’s
concept of system trust (Bohn, 2007). It also opens the way for trust correlates. This is because system-trust
brings rational elements back into the picture. Luhmann does mention system-rationalization in this sense
(Luhmann, 2014). In order to remain open to changes and renewable some systems need strong inclusions of
distrust. In this way distrust is used to prevent a diffuse feeling of ‘mutual reliance’. Luhmann further states,
that on the one hand distrust can be an origin for inner organizational conflicts, especially if it is not specified
and impersonal, but as regards to innovation for example distrust is seen as a necessary tool (Luhmann, 2014).
This perspective has been taken also from other researchers. Lewicki et al. even propose a theoretical
framework for understanding trust and distrust simultaneously within relationships. They state that trust and
distrust both entail certain expectations; but whereas trust expectations anticipate beneficial conduct from
others, distrust expectations anticipate injurious conduct. Although defining trust and distrust as being
reciprocal, they view them as separate and distinct constructs (Lewicki and McAllister, 1998).
Trust can be conceptualized within organizations, between organizations and towards the organization.
The individual in the organization develops trust towards individuals, groups, or organizations. At the same
time organizations are mostly represented by humans. For this reason the argumentation is that both personal
trust and organizational trust mechanisms are to be considered (Rupf-Schreiber, 2006). Following the analysis
given before and based on a combined view of interpersonal and organizational trust perspectives the first
author has developed the concept of trust shown in figure 2.
Figure 2. The research concept of trust
Source: Britta Bolzern-Konrad, based on Luhmann 2007 and Rupf-Schreiber 2006
3. Research Premises: Combined Illustration on Trust within the Field of Other
Organizational Values and Innovation Capability within the Concept of Competencies
Based on this theoretical background, the authors developed the following combined illustration of
both the concept of trust within other organizational values and innovation capability within the concept of
competencies as shown in figure 3.
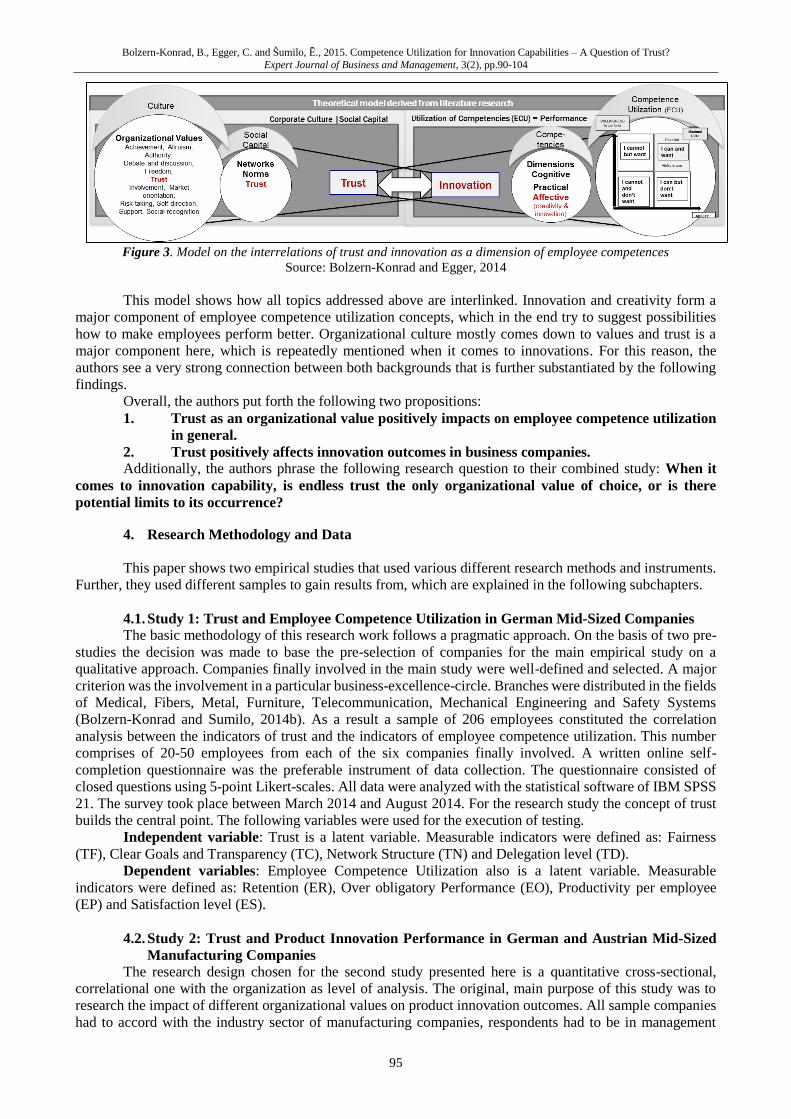
Bolzern-Konrad, B., Egger, C. and Šumilo, Ē., 2015. Competence Utilization for Innovation Capabilities – A Question of Trust?
Expert Journal of Business and Management, 3(2), pp.90-104
95
Figure 3. Model on the interrelations of trust and innovation as a dimension of employee competences
Source: Bolzern-Konrad and Egger, 2014
This model shows how all topics addressed above are interlinked. Innovation and creativity form a
major component of employee competence utilization concepts, which in the end try to suggest possibilities
how to make employees perform better. Organizational culture mostly comes down to values and trust is a
major component here, which is repeatedly mentioned when it comes to innovations. For this reason, the
authors see a very strong connection between both backgrounds that is further substantiated by the following
findings.
Overall, the authors put forth the following two propositions:
1. Trust as an organizational value positively impacts on employee competence utilization
in general.
2. Trust positively affects innovation outcomes in business companies.
Additionally, the authors phrase the following research question to their combined study: When it
comes to innovation capability, is endless trust the only organizational value of choice, or is there
potential limits to its occurrence?
4. Research Methodology and Data
This paper shows two empirical studies that used various different research methods and instruments.
Further, they used different samples to gain results from, which are explained in the following subchapters.
4.1. Study 1: Trust and Employee Competence Utilization in German Mid-Sized Companies
The basic methodology of this research work follows a pragmatic approach. On the basis of two pre-
studies the decision was made to base the pre-selection of companies for the main empirical study on a
qualitative approach. Companies finally involved in the main study were well-defined and selected. A major
criterion was the involvement in a particular business-excellence-circle. Branches were distributed in the fields
of Medical, Fibers, Metal, Furniture, Telecommunication, Mechanical Engineering and Safety Systems
(Bolzern-Konrad and Sumilo, 2014b). As a result a sample of 206 employees constituted the correlation
analysis between the indicators of trust and the indicators of employee competence utilization. This number
comprises of 20-50 employees from each of the six companies finally involved. A written online self-
completion questionnaire was the preferable instrument of data collection. The questionnaire consisted of
closed questions using 5-point Likert-scales. All data were analyzed with the statistical software of IBM SPSS
21. The survey took place between March 2014 and August 2014. For the research study the concept of trust
builds the central point. The following variables were used for the execution of testing.
Independent variable: Trust is a latent variable. Measurable indicators were defined as: Fairness
(TF), Clear Goals and Transparency (TC), Network Structure (TN) and Delegation level (TD).
Dependent variables: Employee Competence Utilization also is a latent variable. Measurable
indicators were defined as: Retention (ER), Over obligatory Performance (EO), Productivity per employee
(EP) and Satisfaction level (ES).
4.2. Study 2: Trust and Product Innovation Performance in German and Austrian Mid-Sized
Manufacturing Companies
The research design chosen for the second study presented here is a quantitative cross-sectional,
correlational one with the organization as level of analysis. The original, main purpose of this study was to
research the impact of different organizational values on product innovation outcomes. All sample companies
had to accord with the industry sector of manufacturing companies, respondents had to be in management
Bolzern-Konrad, B., Egger, C. and Šumilo, Ē., 2015. Competence Utilization for Innovation Capabilities – A Question of Trust?
Expert Journal of Business and Management, 3(2), pp.90-104
96
positions with a task relevant to product development and innovation. To begin with, the standardized online
questionnaire clarified the main terms of the research – organizational values and product innovation. In the
following, the online questionnaire mainly consisted of closed questions using 5-point Likert-scales. All data
were analyzed with the statistical software of IBM SPSS 21. The survey took place between February 25th,
2014 and April 25, 2014. On the whole, 81 respondents from different German and Austrian industrial
companies took part in the survey. In general, these companies stated to be rather large (more than 250
employees), rather internationally active (at least all across Europe), and rather innovative compared to their
industry competitors. All data were checked for normality with Kolmogorov-Smirnov-Tests and all
significance levels lie below .05. Therefore, non-parametric tests are used for further analysis. The following
variables were used for the execution of testing.
Independent variables: 12 organizational value themes, namely achievement, altruism, authority,
debate and discussion, freedom, involvement, market orientation, risk taking, self-direction, social recognition,
support, and trust. These value themes resulted from an intense content analysis of 40 previous studies
regarding organizational values and innovation performance (for further details see Egger, 2014a). Generally,
they were measured first in terms of how much they are important to product innovation, secondly, in terms
of how much they are characteristic of the managers’ organizations. The meaning of each value theme was
explained in detail in accordance with other measurement instruments of values.
Dependent variables: 6 product innovation performance indicators, namely the number of new
products introduced, the pioneer disposition to introduce new products, the clever response to new products
introduced by competitors, financial efforts to develop new products, additional efforts to develop new
products in terms of hours per person, teams, technology and training involved (in accordance with Naranjo-
Valencia et al., 2011; Naranjo-Valencia et al., 2010), the speed of new product development (NPD) (in
accordance with Prajogo and Ahmed, 2006). Here, enterprises had to evaluate their innovation performance
against industry competitors in the past three years in order to limit industry effects.
5. Analysis and Results
The following section shows the results of each study. For both studies, correlations, coefficients of
determination and in some cases regressions were calculated. The chapter also combines the results of both
studies in the last section.
5.1. Study 1: Trust and Employee Competence Utilization in German Mid-Sized Companies
Being founded on a sample of 206 questionnaires the hypothesis “the higher the level of (perceived)
trust, the higher the level of employee competence utilization” was not falsified. To explore the correlation
between variables, Spearman’s rho as the nonparametric measure of choice was assessed. As a result the
dependence between trust and ECU is 0.455 = r. As a second measure to assess the impact of trust on employee
competence utilization, the coefficient of determination r² was examined. As a result r² is 0.202 with a
significance level of 0.01 two sided. Accordingly, a positive connection between trust and employee
competence utilization outcomes can be underlined in saying that trust has an impact of 20% on changes in
employee competence utilization.
Table 1. Correlation between Trust and Employee Competence Utilization (ECU)
Correlation Trust/ECU
Employee = 206
Correlation r
(Trust/ECU)
Coefficient of Determination (r²)
(Trust/ECU)
Spearman-Rho 0.455** 0.207**
**. The correlation is on a level of 0.01 (2-sided) significant
Source: Survey results
This result is traceable with the theory background as well as with the specific organizational
environment in mind. Even if a 100 percent trust level might be regarded as a desirable goal with respect to
the resulting potential realization, it may neither be assumed nor should be sought. Not only that theoretical
results have shown that trust never can be the only impact factor, results have also shown that elements of
control and distrust should always be involved in order to avoid blind trust. Further to this strategic
management is embedded in internal and external factors, influenced by macro- and microenvironment. Here
to name the competitive environment, basic technological developments, new substitution products in the field
on the macro level, and even more employees’ qualification level, process technology, the organization’s
structure and systems in place on the micro level, are expected to significantly impact the “ability in use”. As
Bolzern-Konrad, B., Egger, C. and Šumilo, Ē., 2015. Competence Utilization for Innovation Capabilities – A Question of Trust?
Expert Journal of Business and Management, 3(2), pp.90-104
97
a consequence a level of 20 percent being the outcome of the empirical study might not be unrealistic in terms
of relative influence weight. Overall, proposition 1 is highly substantiated with this finding. Moving one step
further and deepen the level of analysis the different indicators for trust respective employee competence
utilization have been analyzed as regards to their correlation.
Table 2. Coefficient of determination of all indicators for Trust and all indicator s for ECU based on the authors model
on level 2
Coefficient of Determination (r²) based
on Spearman-Rho
Employees n=206
Overobligatory Performance
(EO)
Satisfaction Level
(ES)
Fairness (TF) 0.38** 0.58**
Clear Goals and Transparence (TC) 0.41** 0.47**
Network Structure (TN) 0.19** 0.29**
Delegation Level (TD) 0.33** 0.46**
**. The correlation is on a level of 0.01 (2-sided) significant
Source: Survey results study 1
As a result all elements of trust show a significant correlation to employee competence utilization.
Though, fairness and clear goals show the highest results with regard to the correlation to employee
competence utilization. Fairness even shows a correlation towards satisfaction of 58 percent. This might be
explainable do to the fact that fairness also includes additional elements like failure culture and justice. Clear
goals show a correlation towards over obligatory performance of 41 percent. Both results particularly catch to
the eye towards the correlation of trust elements with over obligatory performance and satisfaction. These two
elements of employee competence utilization incorporate essentially the aspects of commitment and
engagement and meaningfulness, motivation and growth perspective. Having seen that especially fairness and
clear goals correlate specifically high with over obligatory performance and satisfaction it is of interest to
deepen the level of analyzes further.
Table 3. Coefficient of determination between specific indicators of Trust and specific indicators of Employee
Competence Utilization (ECU) on level 3
Coefficient of Determination based
on Spearman-Rho (r²)
Commitment
(EOC)
Engagement
( EOE)
Intrinsic
Motivation
(ESI)
Growth
Perspectives
(ESG)
Accountability (TFA) 0.35** 0.42** 0.30**
Accepted Goals (TCA) 0.23** 0.36**
Shared Norms (TCS) 0.36**
Communication (TNC) 0.34**
Ability to take responsibility (TDA) 0.48**
**. The correlation is on a level of 0.01 (2-sided) significant
Source: Survey results study 1
Summarizing on these results it can be stated that indicators such as accountability, shared norms,
open communication, delegation and empowerment are strongly interrelated with the usage of employee
competences. Particularly the accountability of the trustee as well as shared norms and accepted goals between
trustor and trustee show the highest correlations with specific indicators in the employee competence
utilization field. Here to be named commitment, intrinsic motivation and growth perspectives. But it has to be
emphasized that especially the ability to take responsibility correlates significantly with 48 percent to the
trustor’s intrinsic motivation. Thus it can be assumed that a situational context that allows freedom in decision
and action motivates employees intrinsically; the work content itself, as well as the takeover of responsibility
are to be named as essential elements of the intrinsic motivation in this context. Commitment and motivation
are thus very close, especially as motivation is seen as a factor of affective commitment being responsible for
high retention of employees. Shared norms and accepted goals are also of high impact as regard to commitment
(Morrow, 1993). Interpreting these results, shared goals obviously lead to focused behavior and an alignment
of the individual goal plan with the company’s expectations on the same; an effects that supports a strong
feeling of satisfaction, incorporating the growth perspective in the scope of the author’s model.
Putting the subject matter towards innovation results are interesting. Being part of the concept of
competencies, innovation is especially exposed to creativity and knowledge.
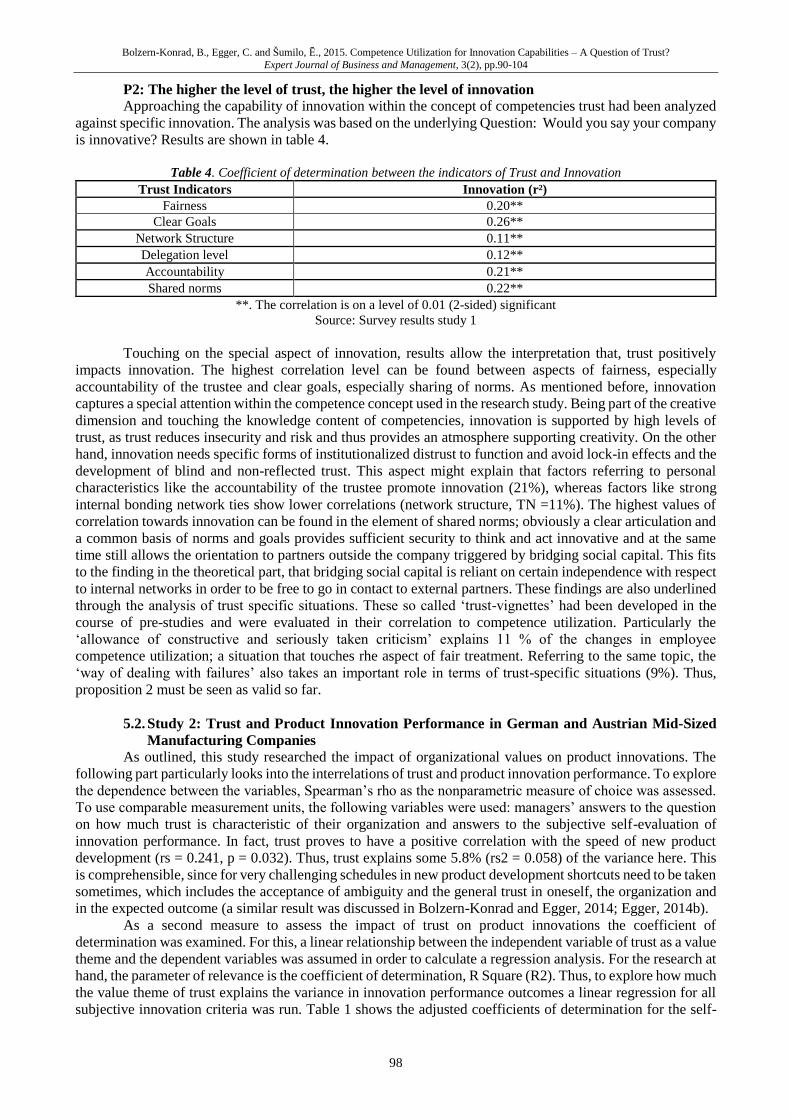
Bolzern-Konrad, B., Egger, C. and Šumilo, Ē., 2015. Competence Utilization for Innovation Capabilities – A Question of Trust?
Expert Journal of Business and Management, 3(2), pp.90-104
98
P2: The higher the level of trust, the higher the level of innovation
Approaching the capability of innovation within the concept of competencies trust had been analyzed
against specific innovation. The analysis was based on the underlying Question: Would you say your company
is innovative? Results are shown in table 4.
Table 4. Coefficient of determination between the indicators of Trust and Innovation
Trust Indicators Innovation (r²)
Fairness 0.20**
Clear Goals 0.26**
Network Structure 0.11**
Delegation level 0.12**
Accountability 0.21**
Shared norms 0.22**
**. The correlation is on a level of 0.01 (2-sided) significant
Source: Survey results study 1
Touching on the special aspect of innovation, results allow the interpretation that, trust positively
impacts innovation. The highest correlation level can be found between aspects of fairness, especially
accountability of the trustee and clear goals, especially sharing of norms. As mentioned before, innovation
captures a special attention within the competence concept used in the research study. Being part of the creative
dimension and touching the knowledge content of competencies, innovation is supported by high levels of
trust, as trust reduces insecurity and risk and thus provides an atmosphere supporting creativity. On the other
hand, innovation needs specific forms of institutionalized distrust to function and avoid lock-in effects and the
development of blind and non-reflected trust. This aspect might explain that factors referring to personal
characteristics like the accountability of the trustee promote innovation (21%), whereas factors like strong
internal bonding network ties show lower correlations (network structure, TN =11%). The highest values of
correlation towards innovation can be found in the element of shared norms; obviously a clear articulation and
a common basis of norms and goals provides sufficient security to think and act innovative and at the same
time still allows the orientation to partners outside the company triggered by bridging social capital. This fits
to the finding in the theoretical part, that bridging social capital is reliant on certain independence with respect
to internal networks in order to be free to go in contact to external partners. These findings are also underlined
through the analysis of trust specific situations. These so called ‘trust-vignettes’ had been developed in the
course of pre-studies and were evaluated in their correlation to competence utilization. Particularly the
‘allowance of constructive and seriously taken criticism’ explains 11 % of the changes in employee
competence utilization; a situation that touches rhe aspect of fair treatment. Referring to the same topic, the
‘way of dealing with failures’ also takes an important role in terms of trust-specific situations (9%). Thus,
proposition 2 must be seen as valid so far.
5.2. Study 2: Trust and Product Innovation Performance in German and Austrian Mid-Sized
Manufacturing Companies
As outlined, this study researched the impact of organizational values on product innovations. The
following part particularly looks into the interrelations of trust and product innovation performance. To explore
the dependence between the variables, Spearman’s rho as the nonparametric measure of choice was assessed.
To use comparable measurement units, the following variables were used: managers’ answers to the question
on how much trust is characteristic of their organization and answers to the subjective self-evaluation of
innovation performance. In fact, trust proves to have a positive correlation with the speed of new product
development (rs = 0.241, p = 0.032). Thus, trust explains some 5.8% (rs2 = 0.058) of the variance here. This
is comprehensible, since for very challenging schedules in new product development shortcuts need to be taken
sometimes, which includes the acceptance of ambiguity and the general trust in oneself, the organization and
in the expected outcome (a similar result was discussed in Bolzern-Konrad and Egger, 2014; Egger, 2014b).
As a second measure to assess the impact of trust on product innovations the coefficient of
determination was examined. For this, a linear relationship between the independent variable of trust as a value
theme and the dependent variables was assumed in order to calculate a regression analysis. For the research at
hand, the parameter of relevance is the coefficient of determination, R Square (R2). Thus, to explore how much
the value theme of trust explains the variance in innovation performance outcomes a linear regression for all
subjective innovation criteria was run. Table 1 shows the adjusted coefficients of determination for the self-
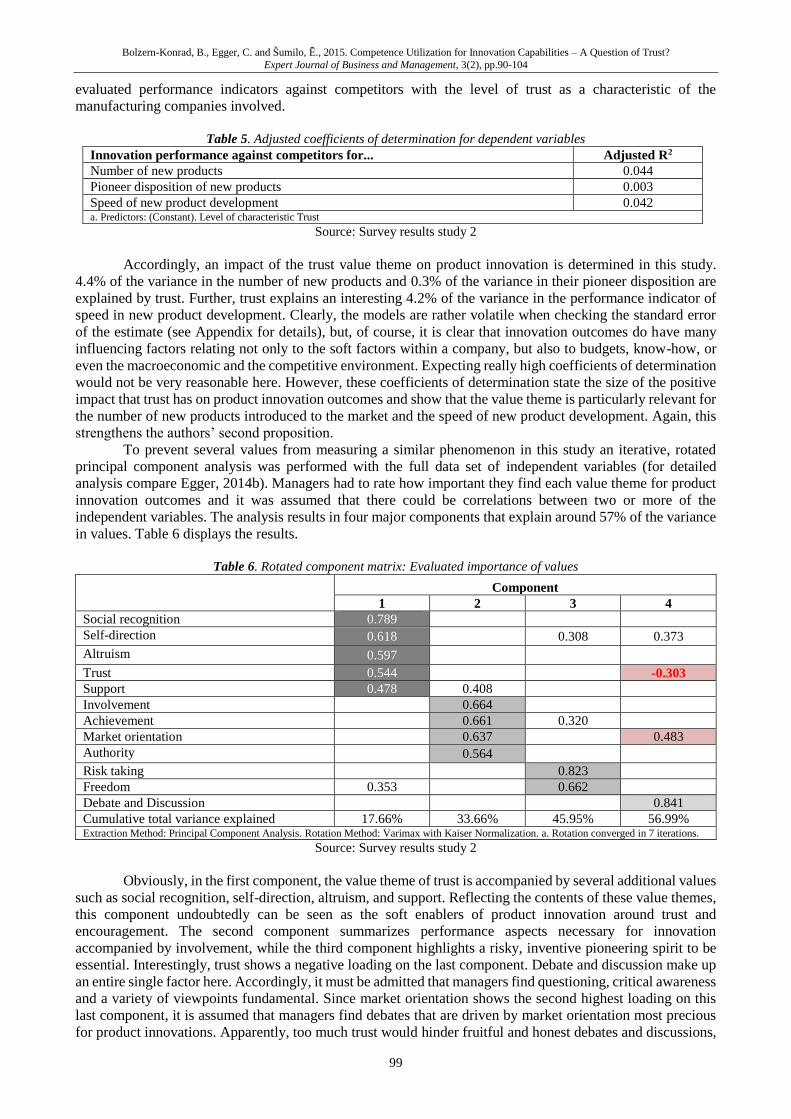
Bolzern-Konrad, B., Egger, C. and Šumilo, Ē., 2015. Competence Utilization for Innovation Capabilities – A Question of Trust?
Expert Journal of Business and Management, 3(2), pp.90-104
99
evaluated performance indicators against competitors with the level of trust as a characteristic of the
manufacturing companies involved.
Table 5. Adjusted coefficients of determination for dependent variables
Innovation performance against competitors for... Adjusted R2
Number of new products 0.044
Pioneer disposition of new products 0.003
Speed of new product development 0.042 a. Predictors: (Constant). Level of characteristic Trust
Source: Survey results study 2
Accordingly, an impact of the trust value theme on product innovation is determined in this study.
4.4% of the variance in the number of new products and 0.3% of the variance in their pioneer disposition are
explained by trust. Further, trust explains an interesting 4.2% of the variance in the performance indicator of
speed in new product development. Clearly, the models are rather volatile when checking the standard error
of the estimate (see Appendix for details), but, of course, it is clear that innovation outcomes do have many
influencing factors relating not only to the soft factors within a company, but also to budgets, know-how, or
even the macroeconomic and the competitive environment. Expecting really high coefficients of determination
would not be very reasonable here. However, these coefficients of determination state the size of the positive
impact that trust has on product innovation outcomes and show that the value theme is particularly relevant for
the number of new products introduced to the market and the speed of new product development. Again, this
strengthens the authors’ second proposition.
To prevent several values from measuring a similar phenomenon in this study an iterative, rotated
principal component analysis was performed with the full data set of independent variables (for detailed
analysis compare Egger, 2014b). Managers had to rate how important they find each value theme for product
innovation outcomes and it was assumed that there could be correlations between two or more of the
independent variables. The analysis results in four major components that explain around 57% of the variance
in values. Table 6 displays the results.
Table 6. Rotated component matrix: Evaluated importance of values
Component
1 2 3 4
Social recognition 0.789
Self-direction 0.618 0.308 0.373
Altruism 0.597
Trust 0.544 -0.303
Support 0.478 0.408
Involvement 0.664
Achievement 0.661 0.320
Market orientation 0.637 0.483
Authority 0.564
Risk taking 0.823
Freedom 0.353 0.662
Debate and Discussion 0.841
Cumulative total variance explained 17.66% 33.66% 45.95% 56.99% Extraction Method: Principal Component Analysis. Rotation Method: Varimax with Kaiser Normalization. a. Rotation converged in 7 iterations.
Source: Survey results study 2
Obviously, in the first component, the value theme of trust is accompanied by several additional values
such as social recognition, self-direction, altruism, and support. Reflecting the contents of these value themes,
this component undoubtedly can be seen as the soft enablers of product innovation around trust and
encouragement. The second component summarizes performance aspects necessary for innovation
accompanied by involvement, while the third component highlights a risky, inventive pioneering spirit to be
essential. Interestingly, trust shows a negative loading on the last component. Debate and discussion make up
an entire single factor here. Accordingly, it must be admitted that managers find questioning, critical awareness
and a variety of viewpoints fundamental. Since market orientation shows the second highest loading on this
last component, it is assumed that managers find debates that are driven by market orientation most precious
for product innovations. Apparently, too much trust would hinder fruitful and honest debates and discussions,
Bolzern-Konrad, B., Egger, C. and Šumilo, Ē., 2015. Competence Utilization for Innovation Capabilities – A Question of Trust?
Expert Journal of Business and Management, 3(2), pp.90-104
100
since it might make people too blind to challenge colleagues and leaders in order to ensure the best solution to
a problem.
Thus, for successful product innovations, trust alone is not enough. Instead, there can even be
situations where too much trust hinders it, which is the reason why it needs to be completed by additional value
themes such as achievement and critical debates and discussions to enhance innovation capability. This gives
a first indication for the additional research question that the authors phrased above.
5.3. Combined Results of the Two Empirical Studies
As an intermediate conclusion, this section determined the following empirical results. In general, trust
shows a positive impact on the utilization of employee competences. In both studies, different aspects of trust
correlate positively with innovation outcome indicators. Further, it explains an interesting amount of the
variance in innovation performance and thus, its positive connection can no longer be denied. However, both
studies brought to light that other aspects are needed for innovations as well. The next section further discusses
these insights.
6. Discussion and Conclusion
It was the purpose of this paper to show how trust as an organizational value contributes to employee
competence utilization in the case of innovation capability. In this paper, it was outlined, that a universal
competence portfolio includes the capability to develop innovative ideas, for which in turn organizations need
trust. Trust itself can be seen as embedded in the idea of social capital and surely is a multifaceted phenomenon
in itself.
6.1. Theoretical Contribution
With the intention to give answers to the propositions made upfront results are discussed and evaluated
towards their implications and limitations.
1. Trust as an Organizational Value Positively Impacts on Employee Competence
Utilization In General
Overall, it can be stated from this research paper that trust as an organizational value highly contributes
to the utilization of employee competences, specifically when it comes to innovation capabilities. Thus, it is
an aspect of major managerial importance. Trust within the concept of social capital is able to gain an effect
that would not be possible based on pure control. This is possible because in a culture of trust we are able to
accept risk. Furthermore and being related to the first study, the results particularly show a high correlation of
trust towards over obligatory performance and satisfaction.
2. Trust Positively Affects Innovation Outcomes in Business Companies
Although the literature on success factors for innovation comes up with a very diversified number of
organizational values, these ideas can be limited to four major aspects according to this study: trust and
encouragement, intrinsically motivated performance, pioneering spirit, and market-driven debates and
discussions. Even if this sounds contradictory at first sight, it perfectly accords with Khazanchi et al.’s findings
on the impact of organizational values on process innovation revealing both, flexibility and control values
(performance values), to be decisive, because control values enable flexibility values (Khazanchi et al., 2007),
respectively performance and market orientation enable trust and pioneering spirit. Being related to the first
study innovation captures a special attention within the competence model being part of the creative dimension.
Results have shown that especially factors referring to personal characteristics like the trustee’s accountability
promote innovation whereas factors like strong network ties, especially internal bonding ties show lower
correlations.
Regarding the additional research question “When it comes to innovation capability, is endless trust
the only organizational value of choice, or is there potential limits to its occurrence?”, the authors argue
the following:
It needs to be declared that trust shows an inconsistent picture: when it comes to debates and
discussions, trust shows a negative relationship. One could even argue that sometimes in innovations, “distrust”
is needed to push people to better performances and question the solutions that they have already found. In
order to ensure diverse viewpoints, critically question the status quo and challenge easy explanations, too much
trust and cosiness can be counterproductive. Instead, managers should never sacrifice the target of striving for
peak performance and innovative solutions to a friendly, trustful atmosphere. In summary, the general
recommendation for managers to “deal with the people as human beings, but with the problem on its merits
(tough with the issue, but soft with employees)” (Fisher et al., 2011) must be underlined here. These results
Bolzern-Konrad, B., Egger, C. and Šumilo, Ē., 2015. Competence Utilization for Innovation Capabilities – A Question of Trust?
Expert Journal of Business and Management, 3(2), pp.90-104
101
reflect on the particular character of trust being analyzed in detail in the first study. The results of the first
empirical study have shown, that a situation referring to seriously taken constructive criticism, as well as the
aspect of failure handling show high correlations to employee competence utilization. Especially these two
elements incorporate aspects of institutionalized distrust. Thus is can be assumed if distrust is institutionalized
it might be even recognized as a trustful atmosphere. Especially innovation needs specific forms of
institutionalized distrust in order to avoid lock-in effects and the development of blind and un-reflected trust.
As a conclusion the authors see trust as a very complex phenomenon that has to be institutionally anchored,
but also includes a healthy level of distrust in order to enable constructive criticism and critical awareness of
many different viewpoints.
6.2. Managerial Implications
This research points to various interesting implications for business managers. Firstly, the theoretical
framework elaborated here, reminds us that trust as an organizational value and institutionally anchored not
only is a complex phenomenon, but also shows various positive effects regarding employee performance and
organizational outcomes. Therefore the positive impact of trust on employee competence utilization needs top
management attention. The actual environment organizations live in however creates challenging requirements
on the personal characteristics, relational abilities and contextual behaviors of managers which are important
to establish frameworks that allow the realization of its employees’ competencies and with this contribute to
the success of the organization. Thus, it comes as a leadership challenge to set up companies accordingly.
Secondly, although correlation does not necessarily prove a cause-effect-relationship, it provides strong
evidence for it, which is substantiated by the theoretical background provided in this paper. Therefore,
managers must realize that employees need appropriate organizational backgrounds that go far beyond
financial resources in order to develop innovative ideas. Further, there is also the need to reconsider
relationships with other stakeholders beyond company boundaries, such as suppliers, financial institutions,
customers, or research laboratories. Again, using trust in bridging capital does support innovation performance.
For this reason, treating suppliers as equal partners and working on trustful, long-lasting relationships with
them rather than pushing them down in prices until they struggle for existence, for example, comes as a
necessary success factor. On the other hand, managers must work on the right balance between trust,
constructive distrust and performance aspects. Thus, business companies need to train managers much more
in leadership capabilities. Further, top management has to ensure appropriate time frames, trainings on-the-job
and even mentoring programs to ensure that leaders can actually work on the appropriate environment
compiling trust as an organizational, institutionally anchored value.
6.3. Limitations of study / Future directions of research
Regarding the methodology of the two empirical studies, it has to be stated here that both studies were
approached in a cross-sectional research design. Developments and trends can therefore not be assessed.
Moreover, both samples consisted of mid-sized companies in Germany and Austria with employee numbers
mainly between 250 to around 2.000. This certainly limits the generalization of the results in terms of external
validity to some extent. However, internal validity was accounted for since measurement instruments in both
studies go in accordance with a lot of other empirical research. Still, for the second study amongst
manufacturing companies, it has to be stated that the survey only investigated managers’ perceptions. The
employees’ point of view was left out, although organizational values definitely are a topic relevant to all
hierarchy levels. As with other empirical studies in the field, organizational values were measured here at one
point in time while innovation performance was measured over a longer period of observation (namely 3
years). For the first study the correlation between trust and employee competence utilization is based on the
perception of the employees. Also, in this study the measurement of trust and employee competence utilization
is based on a snapshot evaluation, not taking time effects into account being involved in the development of
trust. Data has been focused on a number of company cases from the business excellence environment being
chosen based on a qualitative approach. However, results are relevant for medium sized manufacturing
companies in Germany and Austria. They are of particular significance as they combine the managers’ and
employees’ perspective to a comprehensive and holistic view.
As discussed, trust as an organizational value can come to its limits as well, particularly when it comes
to innovation. For this reason, the authors suggest to investigate similar topics in other countries. With this, it
would be possible to account for the influence of national culture. The authors assume that this does play a
major role in value-backgrounds to innovation as well. Further to this, authors believe that more research is
needed regarding the implementation of trust. According to the authors, there is a long way from knowing that
something is important to actually putting it into practice. In the course of the first study recommendations for
Bolzern-Konrad, B., Egger, C. and Šumilo, Ē., 2015. Competence Utilization for Innovation Capabilities – A Question of Trust?
Expert Journal of Business and Management, 3(2), pp.90-104
102
strategic management are given in a balanced scorecards approach. Further practical recommendations for
managers how to spread the ideas of this paper through whole organizations and use them to achieve
competitive advantage and business excellence would be of high value.
References
Adler, P.S. and Kwon, S., 2002, Social Capital: Prospects for a new concept, Academy of Management Review, Vol. 27,
No. 1, pp. 17–40.
Agin, E. and Gibson, T., 2010. Developing an innovative culture. American Society for Training and Development, (July),
pp.52–55.
Ahmed, P.K., 1998. Culture and climate for innovation. European Journal of Innovation Management, 1(1), pp.30–43.
Anonymous, 2010. Managing numbers and knowledge: Some ways to boost innovation. Strategic Direction, 26(11),
pp.28–31. http://dx.doi.org/10.1108/02580541011087963
Baumane, I. and Sumilo, E., 2007, Social Capital as an important factor for synergy creation in organizations,
Management Theory and Practice: Synergy in Organizations, pp. 70–82.
Bohn, U., 2007, Vertrauen in Organisationen: Welchen Einfluss haben Reorganisationsmaßnahmen auf
Vertrauensprozesse? Eine Fallstudie.
Bolzern-Konrad, B and Sumilo, E 2014b, Trust and Employee Competence Utilization - Empirical Testing of a Model,
Proceedings of the 15th European Conference on Kowledge Management, Santarem, Portugal, 04 September, pp.
862–1355.
Bolzern-Konrad, B., 2013, Company competenceies and individual competencies in the prism of social capital,
Conference Proceedings, May 9-11, Riga, University of Latvia, pp. 77–87.
Bolzern-Konrad, B. and Egger, C., 2014. Trust as an enduring organizational value for competitive advantage in a
constantly changing business world: Theoretical analysis and empirical findings from two research studies. In J. F.
S. Gomes and J. P. Coelho, eds. Values in Shock: The role of contrasting management, economic, and religious
paradigms in the workplace. Los Angeles: ISSWOV - International Society of the Study of Work and
Organizational Values, pp. 323 – 330.
Clegg, C. et al., 2002. Implicating trust in the innovation process. Journal of Occupational and Organizational
Psychology, 75(4), pp.409–422.
Coleman, J.S., 1990, Foundations of social theory, Belknap Press of Harvard University Press, Cambridge, Mass.
Delbecq, A.L. and Mills, P.K., 1985. Managerial practices that enhance innovation. Organizational Dynamics, 14(1),
pp.24–34.
Dietz, G. and Hartog, D.N.D, 2006, Measuring trust inside organizations, Personnel Review, vol. 35, no. 5, pp. 557–588.
Eberl, M., 2009, Die Dynamisierung organisationaler Kompetenzen. Eine kritische Rekonstruktion und Analyse der
Dynamic Capability-Debatte, Kovac, Hamburg.
Egger, C., 2014a. An international perspective on the impact of organizational values on product innovations in
manufacturing companies. In J. Hair, Z. Krupka, and G. Vlasic, eds. Global Business Conference 2014 Proceedings
- Questioning the Widely-held Dogmas. Dubrovnik: Innovation Institute Zagreb, pp. 94-104.
Egger, C., 2014b. Organizational Values for Product Innovations in Manufacturing Companies. In Conference
Proceedings for Political Sciences, Law, Finance, Economics and Tourism. Sofia: SGEM International
Multidisciplinary Scientific Conferences on Social Sciences and Arts, pp. 381–388.
Eigenstetter, M. and Löhr, A., 2008. Ethikprogramme in Unternehmen: Unterstützung einer innovationsförderlichen
Gestaltung von Unternehmenskultur? FORUM Wirtschaftsethik, 16(3), pp.16–33.
Ellonen, R., Blomqvist, K. and Puumalainen, K., 2008. The role of trust in organisational innovativeness. European
Journal of Innovation Management, 11(2), pp.160–181.
Erpenbeck, J. and Rosenstiel, L., 2007, Handbuch Kompetenzmessung. Vorbemerkung zur 2. Auflage, Schäffer-Poeschl
Verlag.
Fisher, R., Ury, W. and Patton, B., 2011. Getting to Yes, 3rd ed., New York: Penguin Group.
Haug, S. (ed.), 1997, Soziales Kapital. Ein kritischer Überblick über den aktuellen Forschungsstand, Mannheim.
Hellmann, K., 2008, Solidarität, Sozialkapital und Systemvertrauen. Formen sozialer Integration.
Hersey, P. and Blanchard Kenneth, H., 1974. So You Want To Know Your Leadership Style?, Training and Development
Journal, February, pp. 22–37.
Hosmer, L.T., 1995. Trust: The Connecting Link between Organizational Theory and Philosophical Ethics. The Academy
of Management Review, 20(2), pp.379–403.
HRK Hochschulkonferenz (ed.) 2012, Fachgutachten zur Kompetenzorientierung in Studium und Lehre.
Jassawalla, A.R. and Sashittal, H.C., 2002. Cultures that support product innovation processes. Academy of Management
Journal, 16(3), pp.42–54.
Khazanchi, S., Lewis, M.W. and Boyer, K.K., 2007. Innovation-supportive culture: The impact of organizational values
on process innovation. Journal of Operations Management, 25(4), pp.871–884.
Lewicki, R.J. and McAllister, D.J. and B.R.J., 1998, Trust and Distrust: New relationships and realities, Academy of
Management Review, vol. 23, no. 3, pp. 438–458.
Bolzern-Konrad, B., Egger, C. and Šumilo, Ē., 2015. Competence Utilization for Innovation Capabilities – A Question of Trust?
Expert Journal of Business and Management, 3(2), pp.90-104
103
Lewis, J.D. and Weigert, A., 1985. Trust as a Social Reality. Social Forces, University of North Carolina Press, 63(4),
pp.967–985.
Lin, N., 1999, Building a Network Theory of Social Capital, Connections, vol. 22, no. 1, pp. 28–51.
Lorsch, J.W. and Lawrence, P.R., 1965. Organizing for Product Innovation. Harvard Business Review, (43), pp.109–122.
Luhmann, N., 2014, Vertrauen. Ein Mechanismus der Reduktion sozialer Komplexität, UVK-Verl.-Ges. [u.a.], Konstanz.
Martins, E.C. and Terblanche, F., 2003. Building organisational culture that stimulates creativity and innovation.
European Journal of Innovation Management, 6(1), pp.64–74.
Medina, C.C., Lavado, A.C. and Cabrera, R.V., 2005. Characteristics of Innovative Companies: A Case Study of
Companies in Different Sectors. Creativity and Innovation Management, 14(3), pp.272–287.
Moldaschl, M., 2009, Wem gehört das Sozialkapital? in Müller, Kaegi (Hg.) 2009 – Wem gehört das Sozialkapital, pp.
83–108.
Morrow, P.C., 1983, Concept Redundancy in Organizational Research: The Case of Work Commitment, Academy of
Management Research, vol. 1983, Vol. 8, No. 3, pp. 486–500.
Naranjo-Valencia, J.C., Jiménez-Jiménez, D. and Sanz-Valle, R., 2011. Innovation or imitation? The role of
organizational culture. Management Decision, 49(1), pp.55–72.
Naranjo-Valencia, J.C., Valle, R.S. and Jiménez, D.J., 2010. Organizational culture as determinant of product innovation.
European Journal of Innovation Management, 13(4), pp.466–480.
Prajogo, D.I. and Ahmed, P.K., 2006. Relationships between innovation stimulus, innovation capacity, and innovation
performance. R&D Management, 36(5), pp.499–515.
Putnam, R.D., 1995, Tuning In, Tuning Out: The Strange Disappearance of Social Capital in America, Political Science
and Politics, vol. 28, no. 4, pp. 664–683.
Rupf Schreiber, M., 2006, Identifikation und Vertrauen in Organisationen: eine empirische Untersuchung in der
Bankenbranche. Dissertation zur Erlangung der Doktorwürde, Freiburg.
Schmitz, H., 2005, Raus aus der Demotivationsfalle. Wie verantwortungsbewusstes Management Vertrauen, Leistung
und Innovation fördert, Gabler, Wiesbaden.
Steinfield, C., DiMicco, J. and Ellison, N.L.C., 2009, Bowling Online: Social Networking and Social Captial within the
Organization, Conference Proceedings, CandT 09, June 25-27, Pennsylvania, University Park, USA, pp. 245–254.
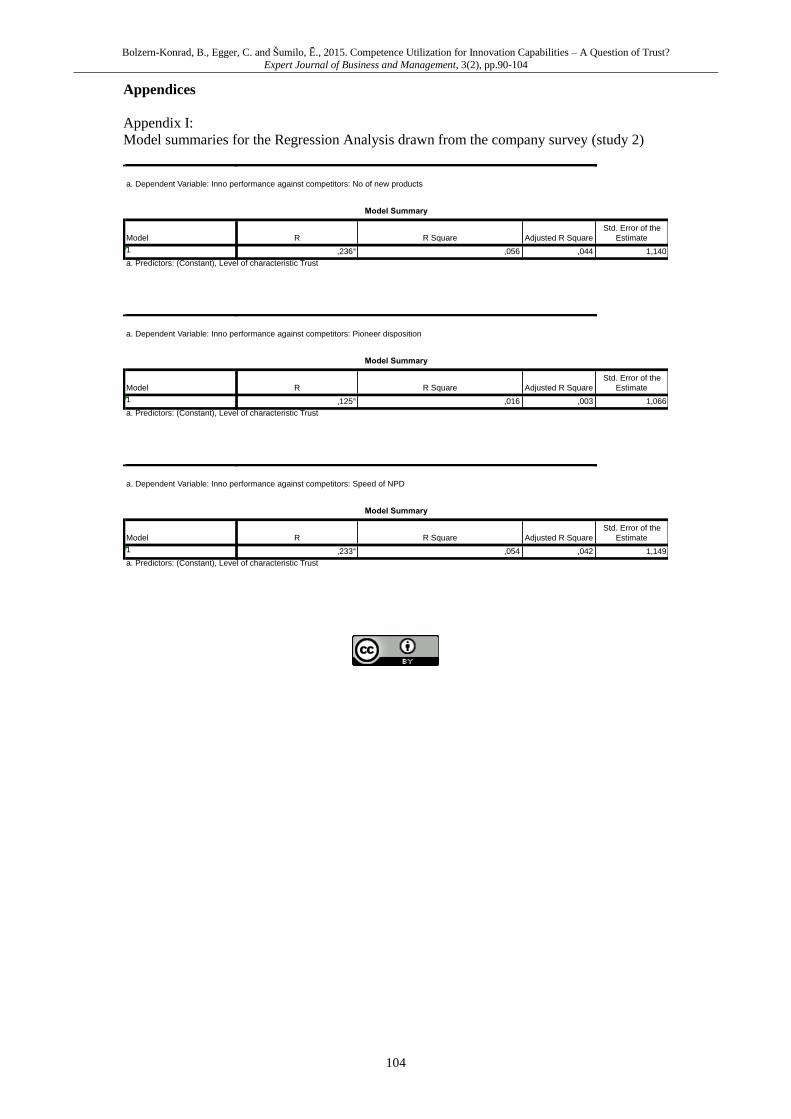
Bolzern-Konrad, B., Egger, C. and Šumilo, Ē., 2015. Competence Utilization for Innovation Capabilities – A Question of Trust?
Expert Journal of Business and Management, 3(2), pp.90-104
104
Appendices
Appendix I:
Model summaries for the Regression Analysis drawn from the company survey (study 2)
a. Dependent Variable: Inno performance against competitors: No of new products
R R Square Adjusted R Square
Std. Error of the
Estimate
1 ,236a ,056 ,044 1,140
Model Summary
Model
a. Predictors: (Constant), Level of characteristic Trust
a. Dependent Variable: Inno performance against competitors: Pioneer disposition
R R Square Adjusted R Square
Std. Error of the
Estimate
1 ,125a ,016 ,003 1,066
Model Summary
Model
a. Predictors: (Constant), Level of characteristic Trust
a. Dependent Variable: Inno performance against competitors: Speed of NPD
R R Square Adjusted R Square
Std. Error of the
Estimate
1 ,233a ,054 ,042 1,149
Model Summary
Model
a. Predictors: (Constant), Level of characteristic Trust
Exper t J o urna l o f Bus iness a nd Ma na g e men t , V o lu m e 3 , Is su e 2 , p p . 1 0 5 -1 10 , 2 01 5
© 2 0 1 5 Th e Au th or . Pu b l i sh ed b y Sp r in t In v es t i f y . ISS N 2 3 4 4 -6 7 81
h t t p : / / Bu s in ess .Exp er t J ou rn a ls . c om
105
Stress and Time Management Settings in
University of Maroua, Cameroon
Dr. Joseph BESONG BESONG*
University of Maroua, Cameroon
The aim of this paper is to examine stress and time in educational management in
Maroua University. These two phenomena are profound in educational issues in
Cameroon due to the complex administration or management. Education comprised
of diversity of activities ranging from administration, discipline, teaching, evaluation
and learning. Each of these activities requires time schedule to avoid stress in the
face of pressure. Administration requires planning, organizing, controlling,
commanding, coordinating, reporting and budgeting. Each of these managing
variables requires time, just as discipline, teaching, evaluation and learning should
need. The situation may be affected by higher authority interference and cause a rush
thus affecting every schedule in the system on this note, it is necessary that every
administrator on management cadre should develop a list of activities such as
admissions, examinations, sports, vacations and other ceremonies which requires his
attention on daily, weekly, or monthly bases and there after allocate in a tentative
fashion the most appropriate times for dealing with such activities. Some profile
recommendations are: strict adhering to schedules to avoid overlapping or
prolongation to other programs; the schedules should be pasted or placed at a
convenient point in the office for reference to avoid forgetfulness: as an
administrator, time should be allocated for meeting or consulting with visitors and
subordinates; he should delegate functions to his accredited subordinates to crave
chance or time for essential duty; he should review the school or organization
programs on daily, weekly or monthly bases the degree to which his administration
goals have been attained and he (i.e. administrator) should crave time for rest i.e.
holidays, relaxation and various forms of physical exercises to revitalizes the body
for subsequent activities. The paper recommends planning which is vital in
management to avoid time waste which is scarce and organizing to avoid repetition
and also derailed. Hence, a healthy climate may encourage staff participation in
decision making, program, daily routines to avoid time constraint and stress, which
by-products are hypertension, insomnia and poor or unsuccessful accomplishment of
education programs in Maroua University in particularly and nation – wide in
general.
Keywords: stress, time management, higher education institutions
JEL Classification: M10, M12
* Corresponding Author:
Dr. Joseph Besong Besong, Department of Sciences of Education, Higher Teachers’ Training College, University of Maroua, P.O. Box 55, Maroua –
Cameroon
Article History:
Received 29 November 2014 | Accepted 21 May 2015 | Available Online 01 June 2015
Cite Reference:
Besong Besong, J., 2015. Stress and Time Management Settings in University of Maroua, Cameroon. Expert Journal of Business and Management,
3(2), pp.105-110
Besong Besong, J., 2015. Stress and Time Management Settings in University of Maroua, Cameroon.
Expert Journal of Business and Management, 3(2), pp. 105-110
106
1. Introduction
Stress and time are two issues that are of profound importance to educators and educationists. In our
efforts to place our schools on a sound footing and thereby enhance the attainment of positive school outcomes
for the benefit of our society, the two issues need to be adequately and properly managed. However, their
coincidental placement or presence as suggested by the topic under discussion should not put us under the
illusion that the two concepts, time and stress, have anything more than a spurious association. For this reason,
therefore, we would take the issues or concepts individually and discuss each of it at that level.
The concept of stress is popular among most Cameroonians definitions that different people do not
readily agree on. Selye (1956) considers it simply as the rate of tear and wear in the body and has proposed
the Generalized Adaptation Syndrome (GAS) to describe its mechanism, McGarth (1970) considers stress as
a perceived substantial imbalance between demand and response capability under conditions where failure to
meet demands has important perceived consequences. But generally, most people consider stress from the
point of view of destabilization of the equilibrium of the body mechanism by external factors (Stressors) and
the restoration of this equilibrium (homeostasis) is effected by stress responses. In essence, when our system
(body) is assaulted by events or incidents that put it in a state of disequilibrium, it musters its available
resources to achieve self-protection. It achieves this through stimulating the body organs in readiness to
dissipate huge energy reserves in order to counter the assault.
Teaching and educational administration are both characterized are high stress occupations (Milstein
and Golaszeweski, 1995). Teachers are generally stressed by the effects of violence, the disciplinary problems
encountered in the course of dealing with students, the diminishing purchasing value of the Francs, the
possibility that there may be no salary at the end of the month, the increasing social expectation that teachers
metamorphose into magicians in order to cure society’s ills (Spark, 1979). For administrators, they must cope
with the growing and diverse demands from teachers, their own superiors, and the communities they serve.
Both groups are often overwhelmed by the mounting paperwork and other time consuming tasks that stare
them in the face. The end result of all these are that many talented men and women in the education enterprise
who have high achievement expectation become dispirited and disillusioned. Some leave the profession. Those
who stay must contend with a multitude of physical, emotional and behavioral stress – related manifestation
(Walsh, 1979; Needle et al, 1982). In the Cameroonian situation, Denga (1991) has noted that the need for
economic survival, the fight for political supremacy and all that go with it, the intense competition in the
classrooms, the routine bustle and hustle of life have all together sentenced the citizenry with hard labor to
stress and depression.
Stress may be manifested in various forms including physical exhaustion, hypertension, ulcer, lower
back pain, insomnia, overeating, drug or alcohol abuse, mental fatigue, extreme sensitivity, diminishing sexual
appetite, occupational burnout, absenteeism, fear of crime, disease, religious disturbances, rage, retirement,
etc. the list is almost unending and, perhaps, should suggest the need to scrutinize our personal conditions or
problems with a view to ascertaining whether or not they are stress-related.
Over the decades, researchers have worked tirelessly to isolate categories of organizational based
stressors (Chernis, 1980; Cooper and Marshall, 1978; French and Caplan, 1972). From theirs and other studies,
Milstein and Golaszewski (1985) have extrapolated the following five categories or sources or organizationally
based stressors:
i. Relationships at Work: The critical issue here is the degree of extent of interaction on the job among workers either on a
horizontal or vertical dimension. The horizontal deals with interaction among individuals at the same level
while the vertical relates to the interaction among those at different levels e.g. the student and teacher, principal
and the school Supervisor, the Supervisor and the Director General in charge of the post Primary Schools
Management Board. There is a direct relationship between the extent of trust demonstrated in the relationships
among organizational members and their feelings in job satisfaction and well-being.
ii. Organizational Structure and Climate This relates the degree to which individuals in an organization participate in decision making. Such
participation engenders a feeling of belonging. In a school situation, it may include such diverse areas as
whether school Supervisors provide effective Supervision and support to schools and teachers, whether
communication across the various levels in the organization is clear and sufficient, and the degree to which
limitations are placed on the behaviors of members of the system.
iii. Factors Intrinsic to the Job Different occupations and jobs have their peculiar built in working conditions such as extent, type and
place of work, the physical energy demanded of the job, the total number of hours and the specific hours of
Besong Besong, J., 2015. Stress and Time Management Settings in University of Maroua, Cameroon.
Expert Journal of Business and Management, 3(2), pp. 105-110
107
the day or night spent on the job, the factors such as space, lighting, noise level and availability of private
space.
iv. Role in the Organization Stress may be induced by some job related factors such role ambiguity (confusion relating to scope
and responsibilities associated with the job), role conflict (being pulled in different directions by incompatible
demands), roles that are high in responsibility for people, and the perception that there is minimal authority or
power associated with one’s organizational role.
v. Career Development These deals with whether or not there is some built – in career progression such as improved status,
opportunity for advancement and salary increase, etc., for members. It also relates to job security, perception
of low probability of reward for efforts committed organizational progress. The above stressors operate
essentially in job-related organization and individuals who are incapable of coping satisfactorily with them
soon begin to show manifestations of stress. Denga (1991) has also listed such other stressors of personal type
(some individuals have greater drive for achievement), lifestyle, physique, lack of leisure environmental
proneness to risk, etc. in all cases, there are two major pattern of stress, First there is the prolonged,
degenerative and chronic pattern. This extreme pattern or type may lead to hypertension and various forms of
heart diseases. The second type is the situational or transient form. These generally linked with specific
environmental events or situation. Typical examples include test stress, marital stress, stress due to some forms
of danger, etc. as soon as the object or event that induces the stress is removed, homeostasis is restored. Our
concern for transient or situational stress arises from the fact that its occurrence may inhibit an individual effort
to function maximally in an educational setting.
1.1. Dealing With Organizational Stress
In organizational situations, the tendency learns more towards creating an environment that is free of
stress rather than allowing for the onset of stress and thereafter seeking strategies for its management. Stress
strategies for creating a stress-free environment are:
i. Encourage responsible interpersonal among members of an organization. An organization is
made up of individuals. These individuals should be able to interact freely within the limits of organizational
rules in order to generate feelings of security, trust and job satisfaction.
ii. Create an atmosphere in educational and administrative settings in which members of the
setting have ample opportunity to contribute to or participate in decisions making and the related processes.
Apart from eliminating the related stress, such participation will generate a sense of belonging and self-esteem.
Communication of organizational decisions must be made to all members in very clear terms with appropriate
explanations where necessary.
iii. The daily input by workers, in terms of number of hours into an organization should not exceed
that needed to maintain them in optional functioning condition on a daily basis. There is very little to gain from
a situation where overworked staff continually report of incapacitation due to ill-health. The issue of space and
noise in school situations must be adequately addressed in order to promote better mental health and
productivity.
iv. Individuals functioning in official capacities in Schools and related professions must have their
roles adequately defined in unambiguous manner for the purpose of clarity. As much as possible, situations
where too much power or responsibilities are entrusted in the hands of a few officers must be avoided. Power
and authority should be delegated to all those who can use them responsibly.
v. There should be some School or organizational based mechanism that rewards hardworking
individuals with career progression and opportunities for advancement in terms of status, salary and job
security. Workers must perceive the probability that their efforts would be rewarded in some positive manner.
vi. Administrators must on a regular basis conduct surveys using appropriate strategies such as
questionnaires, interviews and observational schedules for the purpose of determining current levels of stress
among workers and students. Only such a survey would provide the needed data for organizational intervention
and also identify stressors operating in the academic, occupational, social and environmental Spheres.
vii. Where the existing level of stress in an organization exceeds a threshold limit, appropriate
stress reduction techniques such as relaxation technique, anxiety management, cognitive appraisal, emotive
therapy, behavior modification internationalized dialogue, shared group experience, etc. may be applied by
individuals with the experience. However, those with extreme levels of stress must see a doctor.
viii. Educators and educational administrators must persistently encourage the habit of a good use
of leisure time for relaxation, games, rest, physical activities and different forms of mental diversion.
Besong Besong, J., 2015. Stress and Time Management Settings in University of Maroua, Cameroon.
Expert Journal of Business and Management, 3(2), pp. 105-110
108
1.2. Time Management
Time is a very important variable in the life of man. Evidence of the significance of time in our life is
very apparent in such common statements as “Time is money”, “Time waits for nobody”, and “There is time
for everything”, “A tick of a clock is never regained”. In an educational setting, the significance of time in the
life of learners assumes a certain level of dimension. There is so much to be learned within so short a period
of formal exposure to school learning that curriculum developers must apply some degree of selectivity to
determining the educational experience to which learners are subjected. The element of selectivity in
curriculum development underlines the critical importance of time in school related activities. Even at the
administrative level of education, time is no less of critical importance. Yet our schools spend a depressing
amount of their time trying to teach children to sit quietly and to act calmly when research resulting points to
the fact that intellectual excitement is usually accompanied by physical, verbal and emotional excitement.
Similarly, large muscular movements have been shown to facilitate certain kinds of learning. This in essence
implies that we, as educators, waste time teaching children to vegetate at nearly aligned desks, and by our
success, we hinder the process of education.
2. Literature Review
In educational literature review Carroll’s (1963) model of learning has served as a focus for time-
related studies. In this model, Carroll proposed that learning is a function of time needed and time spent.
However, most studies of school time have concentrated on measurement of learning using such indicators as
number of days in the year, weekly, monthly and daily school attendance; number of hours of exposure to
instruction as well as proximate measures of time – use such as student attention or engagement. Such related
studies do suggest that time spent is positively and moderately related to students’ academic achievement.
However, if we are to effectively understand the potentials of school time as an agent for ensuring greater or
enhanced learning, there is very little to gain from global studies of the effect of time. An average effect size
has less information to communicate than to hide since certain dimensions of time are not directly
manipulative. Indeed, in order to effectively gauge the effect of time as an educationally relevant variable,
there should be studies that accurately measure the link between student engagement and achieved level of
learning. Similarly, to ascertain the potential of engaged time, there is also need for studies that document how
engaged time is related to allocated time such as length of school term or day.
In the recent decades, legislative houses aiming at increasing academic achievement in schools have
relied almost exclusively on increasing the number of days in a school year, number of hours in a school day,
and number of minutes allocated to a given subject or topic. However, the actual use of scheduled time may
vary depending on such school factors as students’ school attendance, the erosion of instructional time by non-
academic activities and events, and students’ perception of a given instruction in a given subject as necessary
for his future. On a general note, differential use of allocated time in classrooms and schools implies that
studies of the effect of allocated time are or limited value for understanding the actual effect of increasing the
school term or day. Thus, allocated time measures are too far removed from the variable of interest time
engaged with instruction to unambiguously tell us about their impact on learning.
Cross-national comparisons of academic achievement and time indicate that in the U.S., the 180 days
school year is significantly shorter than the 240 – day year in Japan and Taiwan. In the U.S.A., achievement
at the elementary levels is behind that of a similar category of learners in Japan and Taiwan (Stevenson, 1983).
Given the above fact, it has been implied that U.S. could achieve comparable academic levels as Japan and
Taiwan by increasing U.S. time allotments. Such interpretations obviously ignore the necessary cautions for
attributing causality in correlational studies. For it is very necessary under conditions to convincingly argue
that time effects are indeed due to time differences and not to some other effects that masquerade as time.
According to Karweit (1985), while difference in time allocations may vary with achievement differences,
manipulating the time allocations may not drastically alter achievement because time per se may not be the
cause of achievement differences. There is, however, the possibility that societal and cultural difference in
education, not time differences, is largely responsible for achievement differences. In essence, allocating more
time may or may not be a reasonable strategy for increasing achievement.
Given the above and other relevant data, it is apparent that we know very little about reasonable goals
for how much of school day can be used for instruction and how much day allocations we may make towards
increasing the school year. Similarly, we have little systematic data to guide teachers and students under
different settings and for different types of tasks. What is needed is to examine the relationship between time
and learning in studies that have measured time as engagement with learning. This is to say that as our present
Besong Besong, J., 2015. Stress and Time Management Settings in University of Maroua, Cameroon.
Expert Journal of Business and Management, 3(2), pp. 105-110
109
knowledge is concerned; time management by way of increasing or decreasing length of school year does not
have the relevant data to guide such nations.
A basic fact about good and effective time management is that it is a learned skill that an individual
teacher or student may habituate once acquired. Habituation implies that ability to manage time effectively
may ultimately become a routine part of the individual’s day to day activities. It has such advantages as freeing
the individual from unnecessary and unproductive dissipation of energy, ensures a much better use of available
time and puts more time available in our hands for other productive ventures such as leisure and relaxation.
Common sense knowledge indicates that students, teachers and administrators become more efficient on their
respective jobs when they plan and manage their time adequately and effectively. Inability to plan an effective
use of one’s time often leads to indecision and mental conflict Students and administrators who lack time
management skills often complain of having too much to at a given point in time. Generally, successful
students are those who plan and use their time properly.
What time management calls for is an individual’s effort to program his daily routines. It achieves its
results by way of getting the individual started with specific tasks, drawing the individuals’ attention to the
variety of tasks to be accomplished, reminding him or her about leisure time and eliminating the practice of
procrastination and thereby avoiding the possibility of a rush at the last minute.
2.1. Recommendations:
Suggestion of procedures for effective time management: The following are some suggestions for
effective time management:
i. Every administrator, school principal, or classroom teacher must develop a list of activities that
require his attention on a daily, weekly or monthly basis and thereafter allocate in a tentative fashion the most
appropriate times for dealing with such activities. Experience or practice in adapting oneself to such a schedule
may demand the need for modification, a radical change or for continuity in terms of allocated time in hours
or minutes and in terms of the specific times of the day allocated for a specific activity.
ii. It may be essential to have such a schedule placed or pasted at a convenient point in the office
where it may be referred to at will for the sake of guidance. Given the limitations of the human memory, a
display of one’s work schedule may become easily understandable. For administrators who enjoy the services
of secretaries, the schedule may be kept and maintained by such a personnel while also maintaining the
responsibility of acquainting or reminding the boss of the next schedule of activity. Once a schedule has been
regularized and the administrator is therefore comfortable operating it, efforts must be made to, as such as
possible, keep to it. However, the need for flexibility may be respected as demanded by specific occasions or
events.
iii. Administrators are public servants. They require some time for meeting or consulting with visitors
and subordinates. While such consultations are part of the administrator’s daily routines, care must be taken to
ensure that they do not consume the entire working hours of the administrators. Many administrators have
developed the strategy of depicting conspicuous notices on their doors that specifically indicate times for
meeting different categories of visitors. A good practice is to refer visitors with certain categories of need to
subordinate officers to handle. An effective school principal will have no business settling a fight between two
students. He would rather refer all such cases to the discipline master or, perhaps, the school guidance
counselor.
iv. Administrators with subordinates must realize that a good component of their skills as effective
time managers include ensuring that those under them do adequately and appropriately apply themselves to
the responsibilities associated with their offices. To achieve this would require on the part of administrators
some degree of supervision, effective communication, good relationship, motivation and organizational
discipline. While some of the above factors do not appear to bear any relationship with time management, it
would be apparent that their absence in an organizational situation may cause low productivity under which
poor time management may be subsumed.
v. An important aspect of good time management requires an effort on the part of administrators to
regularly review on daily, weekly or monthly bases the degree to which administrative goals have been attained
and the obstacle encountered in a bid to implement one’s official or personal schedules. Such a review need
not be a personal responsibility of the administrator but should involve the subordinates and, where possible,
some superior officers who may adequately contribute to identifying inherent problems related to the
attainment of organizational goals.
vi. Avoid the practice of confusing or combining official with personal responsibilities. Taking out
hours to receive and entertain personal guests either in the office or in one’s personal residence is unproductive
since these contribute nothing to the achievement of organizational goals. As also does the often observed
Besong Besong, J., 2015. Stress and Time Management Settings in University of Maroua, Cameroon.
Expert Journal of Business and Management, 3(2), pp. 105-110
110
practice among administrators to move into their colleagues offices for the purpose of engaging in idle talks
and gossips while members of the public needing their services must wait almost endlessly.
vii. Good and effective time management must be oblivious of the limitations of the human body and
mind. While it is expected that public officers painstakingly commit a great deal of their time towards attaining
organizational or social goals, wise administrators nonetheless do carve out some time for rest, relaxation and
various forms of physical exercises. Excessive work that is not adequately cushioned with rest and relaxation
would for sure lead to mental fatigue and physical breakdown – and the various forms of discomfort and loss
in man – hours that are associated with them. The loser in such a situation is the individual and the society.
3. Conclusion
Effective time management and absence of stress are two social objectives that are of immense interest
to organizational managers. The two objectives aim at ensuring members of an organization in University of
Maroua in particular and in Cameroon in general should apply themselves the need to achieving specified
social objectives while maintaining individual or personal mental health. These objectives have scarcely been
met in Cameroon society given the productively level our economy and the large number of mental cases that
stare us in the face on a daily basis. What these circumstances suggest is that most Cameroonians live a life
that is full of stress. The entire problems have been the lot of the average Cameroonians for the last three
decades. There is very little light at the end of the tunnel. This would suggest that part of the survival of the
Cameroonian citizenry may be achieved through teaching citizens the requisite skills for coping with stress.
On the part of organizational managers or administrators, they must learn to make every minute count towards
their efforts at achieving social or organizational goals in University of Maroua.
References
Allen, D.W., and Christenson, P.R., 1974. Using time, Space and people effectively. In D.W. Allen and T.C..
Hecht (Eds,) Controversies in Education, Philadelphia: W.B. Sounders.
Carol, J., 1963. A model for school learning. Teachers’ College Record 64 723 – 733.
Chernis, C., 1980. Staff burnout. Beverage Hills, CAL: Sage
Copper, C.V, and Marshall, J., 1978. Sources of marginal and white collar stress. In C.L. Cooper and R. Rayned
(Eds.), Stress at Work. New York: John Wiley.
Denga, D.I. 1991. Stress inoculation and executive depression for Student, businessmen and Workers, Calabar:
Rapid Educational Publishers.
French, J.R.P, and Caplan, R.D., 1972. Organizational stress and individual strain. In A.J. Marrow (Ed.), The
failure of success. New York: Amacom.
Karweit, N., 1985. Should we length the school term? Educational Researcher, 14, pp.9 – 15
Millstein. M.M., and Golaszewski, T.J., 1985. Effect of organizationally based stress Management efforts in
elementary school setting. Urban Education, 19. 389 – 409
Needle, R, Griffin, T., and Suendson, R., 1981. Occupational Stress, coping health Problems of teachers.
Journal of School Health, March, pp.175-181.
Seyle, H., 1956. The stress of life. New – York: McGraw Hill.
Spark, D., 1982. Managing teacher stress and burnout: Post effort and future Direction. Paper Presented at
the stress of the American Educational Research Association: Los Angeles.
Stevenson, H., 1983. A Comparison of Japanese. Taiwanese and American mathematics achievement:
Standford, Ca: Center for Advanced Study in the Behavioral Sciences.
Waslh, D., 1979. Classroom stress and teacher burnout. Phi Delta Kappan. December. 153.
Expert Journal of Business and Management, Volume 3, Issue 2, pp. 111-118, 2015
© 2015 The Authors. Published by Sprint Investify. ISSN 2344-6781
http://Business.ExpertJournals.com
111
Producing Just Papers or Creating Added Value?
Snap-Shot about Quality Systems at
Hungarian SMEs
Emil NYERKI1*, Róbert LIPPERT1, Emil NYERKI Jr.2
1University of Pannonia, Hungary 2University of Szeged, Hungary
In this paper, a short historical review and the research results are presented, which
are focused on the quality management systems used by the Hungarian SME’s. The
research was based on an original empirical survey, conducted using a random
sample of fifty managers from small and medium sized Hungarian enterprises. All of
them use certified quality management systems. The paper presents their current state
in the light of their responses, under several aspects. In conclusion, suggestions are
given for the problems, such as measurement, development, and education on the
research topic.
Keywords: efficiency, management, process, quality, sustainability, quality
management system, improvement
JEL Classification: M10, M12
1. Introduction
Currently there are approximately 11.000 companies in Hungary, certified according to ISO 9001.
Fifteen years ago, in 2000, this number was only 3280, and thus the increase of the number of certified
companies is really impressive (Bálint, 2004). Under this premise, the current research is conducted to provide
a better understanding of the companies’ ISO certification process and organizational behavior.
2. ISO Certifications in Hungary
2.1. Possible Reasons of Increase in ISO Certifications
This increase of companies adoption of ISO certification can be explored through the following
questions:
- Is the new version of ISO system (ISO 9001:2000) more user-friendly?
- Is the market requesting the certification? Could it be, as in almost all cases, that the supplier
evaluation checklists starts with this particular question?
* Corresponding Author:
Emil Nyerki, University of Pannonia, Plant Manager, Szekszárd, Korsófölde u 2 H-7100, Hungary
Article History:
Received 1 July 2014 | Accepted 28 July 2015 | Available Online 03 August 2015
Cite Reference:
Nyerki, E., Lippert, R., Nyerki, E. Jr, 2015. Producing Just Papers or Creating Added Value? Snap-Shot about Quality Systems at Hungarian SMEs.
Expert Journal of Business and Management, 3(2), pp.111-118
Nyerki, E., Lippert, R., Nyerki, E. Jr, 2015. Producing Just Papers or Creating Added Value? Snap-Shot about Quality Systems at Hungarian SMEs.
Expert Journal of Business and Management, 3(2), pp. 111-118
112
- Is quality system just a fashion phenomenon? Followed by further systems, like environment, IT
security, EHS system?
- Does certified quality systems create added value through controlled operations? And is it in a
business’s interest to introduce and certify?
Most probably there is no exact answer as all reasons are partly valid. The real answer can be
completed from all these aspects. Considering the significant differences between the “old” (Edition 1993) and
“new” revision of the ISO 9001 standard, four important factors can be identified:
- The “old” ISO system is quite complicated and for a proper interpretation, deep knowledge is
necessary. The ISO 9001: 2001 contains major changes:
- The “new” system is not only applicable for production companies, but usable for service
providers and institutions too.
- The modified system is fully customer oriented. Until recently, the continuous level of production
was targeted, now the customer is positioned in the middle of the activities (Róth, 2000).
- Requirement of quality system is harmonized with other management systems, enabling the
creation of integrated management systems (environment, EHS, IT security).
2.2. Market Requirements
In the last years, the existence of certified quality systems is more and more a requirement for possible
suppliers. Is this a reflection of customers’ requirement, or is the profession pushing work towards suppliers?
It is much to ask for a certification, than making a detailed and professional process audit, although the
causality between professional operation and certified quality system is not always given. There is a number
of small family-owned companies, where certification means not only a high cost, but does not influence the
daily operations. Technology and staff are given, processes are running, the „management review” was
achieved after „Sunday’s lunch" – but it was not called „management review”. Does certified quality systems
help making the business results better? Most probably not, but it does help companies to get more business.
2.3. Costs of Certification
According to a study made in 2008, certification cost of a company under 51 employees is between
500.000 - 1 Mil.) HUF (1850-3700 EUR) for 3 years. On average, 11.000 certified companies are generating
business of 2.750 Bil. HUF for certification bodies.
2.4. Certification Phase
Market is growing, once it is full, companies will not be interested to get certification anymore. From
a business point of view, it is a must to create a new system, set up certification standards and convince big
market leaders of a need. Also, it is necessary to certify the whole supply chain from the smallest company up
to the biggest one. We are not implying that certified systems are without value, of course, but majority of
those systems’ requirements are needed to be fulfilled, as it is a logical must. Let us consider the requirements
of the environmental, work safety, and IT rules. Nowadays, energy management systems are under installation.
2.5. Quality Management as a Tool of Business Excellence
Spending 10 years in quality management, the answer is most definitely yes, that the quality
management as a tool of business excellence. If during the establishment of the system’s business efficiency
was set as a major goal, keeping procedures resulted „automatically” in business success. If it is a bureaucracy
or a copied system, the requirements of „real life” and the quality systems are never meet.
Glaser-Segura, Peinado and Reis Greml (2009) presented the results of a survey conducted via
managers from 248 companies from Argentina, Brazil and Romania. They measured practices related to
quality, waste reduction and supplier management, as well as their managerial and HR support practices. The
result of their study shows that the achievements in emerging and transition economies are not as good as they
are in developed countries.
Ebert, Tanner and Tutures (1998) carried out an extensive survey involving Romania’s manufacturers,
which are adopting lean manufacturing and quality systems in order to improve their competitiveness, faced
with the fierce conditions of the global market. They argued for the need to change the syllabus of operation
management and other engineering subjects taught in the country’s schools.
According to Glaser-Segura and Anghel (2003), the quality problems of Romanian manufacturers
were caused by the influence of old values, from the time prior to the revolution, when the communist
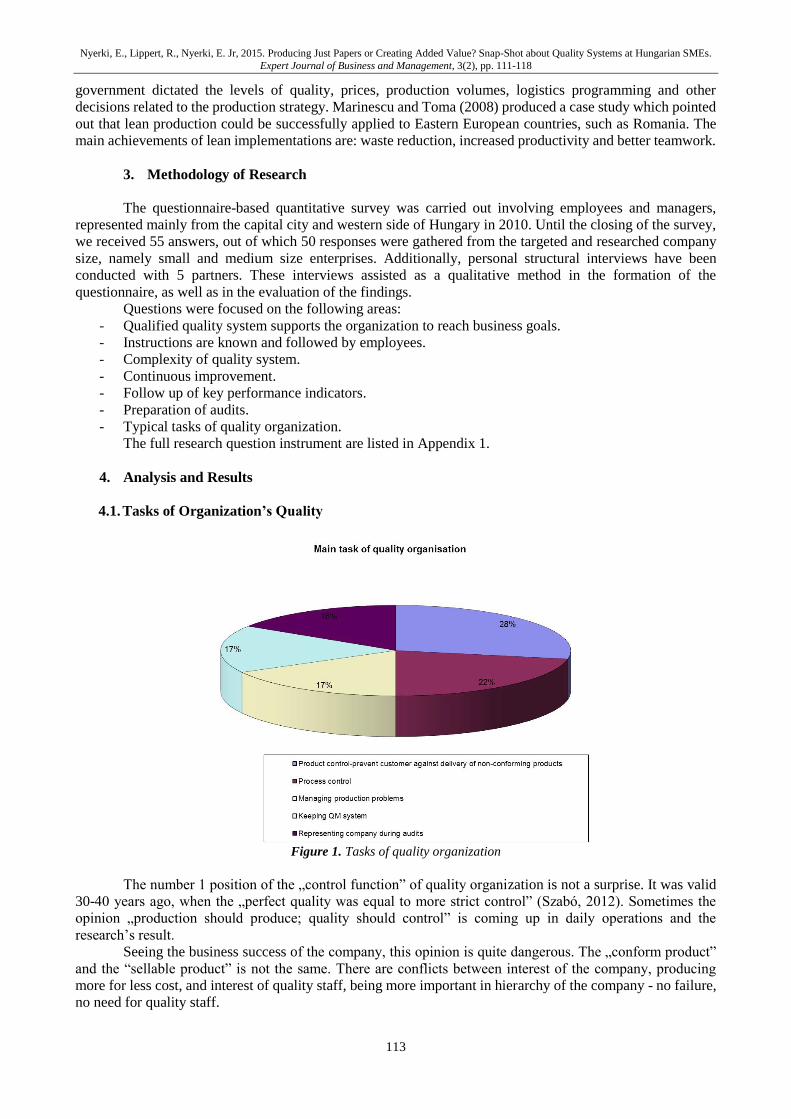
Nyerki, E., Lippert, R., Nyerki, E. Jr, 2015. Producing Just Papers or Creating Added Value? Snap-Shot about Quality Systems at Hungarian SMEs.
Expert Journal of Business and Management, 3(2), pp. 111-118
113
government dictated the levels of quality, prices, production volumes, logistics programming and other
decisions related to the production strategy. Marinescu and Toma (2008) produced a case study which pointed
out that lean production could be successfully applied to Eastern European countries, such as Romania. The
main achievements of lean implementations are: waste reduction, increased productivity and better teamwork.
3. Methodology of Research
The questionnaire-based quantitative survey was carried out involving employees and managers,
represented mainly from the capital city and western side of Hungary in 2010. Until the closing of the survey,
we received 55 answers, out of which 50 responses were gathered from the targeted and researched company
size, namely small and medium size enterprises. Additionally, personal structural interviews have been
conducted with 5 partners. These interviews assisted as a qualitative method in the formation of the
questionnaire, as well as in the evaluation of the findings.
Questions were focused on the following areas:
- Qualified quality system supports the organization to reach business goals.
- Instructions are known and followed by employees.
- Complexity of quality system.
- Continuous improvement.
- Follow up of key performance indicators.
- Preparation of audits.
- Typical tasks of quality organization.
The full research question instrument are listed in Appendix 1.
4. Analysis and Results
4.1. Tasks of Organization’s Quality
Figure 1. Tasks of quality organization
The number 1 position of the „control function” of quality organization is not a surprise. It was valid
30-40 years ago, when the „perfect quality was equal to more strict control” (Szabó, 2012). Sometimes the
opinion „production should produce; quality should control” is coming up in daily operations and the
research’s result.
Seeing the business success of the company, this opinion is quite dangerous. The „conform product”
and the “sellable product” is not the same. There are conflicts between interest of the company, producing
more for less cost, and interest of quality staff, being more important in hierarchy of the company - no failure,
no need for quality staff.
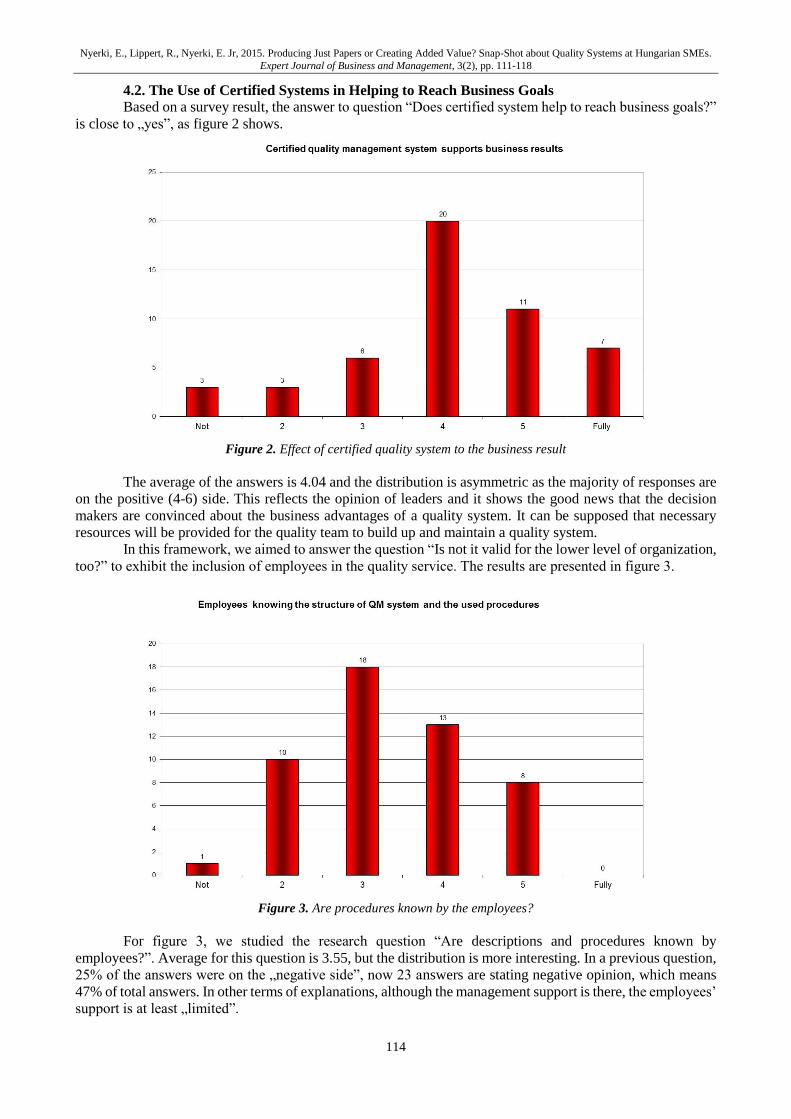
Nyerki, E., Lippert, R., Nyerki, E. Jr, 2015. Producing Just Papers or Creating Added Value? Snap-Shot about Quality Systems at Hungarian SMEs.
Expert Journal of Business and Management, 3(2), pp. 111-118
114
4.2. The Use of Certified Systems in Helping to Reach Business Goals
Based on a survey result, the answer to question “Does certified system help to reach business goals?”
is close to „yes”, as figure 2 shows.
Figure 2. Effect of certified quality system to the business result
The average of the answers is 4.04 and the distribution is asymmetric as the majority of responses are
on the positive (4-6) side. This reflects the opinion of leaders and it shows the good news that the decision
makers are convinced about the business advantages of a quality system. It can be supposed that necessary
resources will be provided for the quality team to build up and maintain a quality system.
In this framework, we aimed to answer the question “Is not it valid for the lower level of organization,
too?” to exhibit the inclusion of employees in the quality service. The results are presented in figure 3.
Figure 3. Are procedures known by the employees?
For figure 3, we studied the research question “Are descriptions and procedures known by
employees?”. Average for this question is 3.55, but the distribution is more interesting. In a previous question,
25% of the answers were on the „negative side”, now 23 answers are stating negative opinion, which means
47% of total answers. In other terms of explanations, although the management support is there, the employees’
support is at least „limited”.
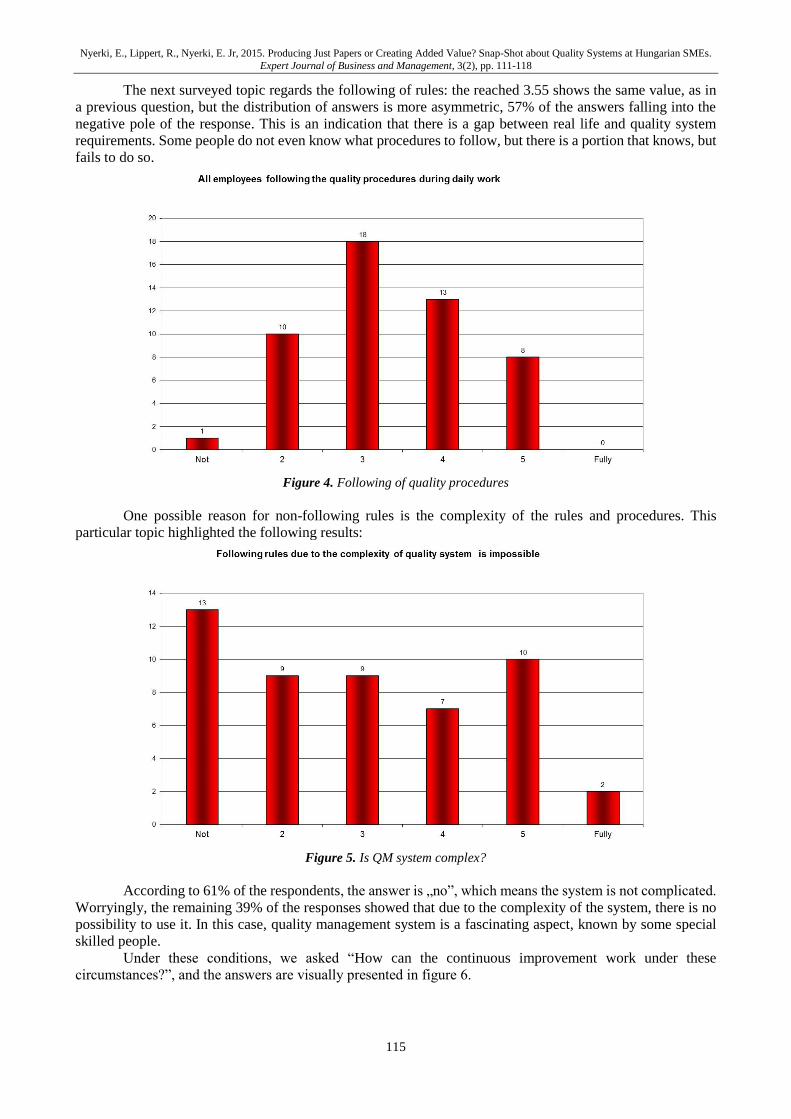
Nyerki, E., Lippert, R., Nyerki, E. Jr, 2015. Producing Just Papers or Creating Added Value? Snap-Shot about Quality Systems at Hungarian SMEs.
Expert Journal of Business and Management, 3(2), pp. 111-118
115
The next surveyed topic regards the following of rules: the reached 3.55 shows the same value, as in
a previous question, but the distribution of answers is more asymmetric, 57% of the answers falling into the
negative pole of the response. This is an indication that there is a gap between real life and quality system
requirements. Some people do not even know what procedures to follow, but there is a portion that knows, but
fails to do so.
Figure 4. Following of quality procedures
One possible reason for non-following rules is the complexity of the rules and procedures. This
particular topic highlighted the following results:
Figure 5. Is QM system complex?
According to 61% of the respondents, the answer is „no”, which means the system is not complicated.
Worryingly, the remaining 39% of the responses showed that due to the complexity of the system, there is no
possibility to use it. In this case, quality management system is a fascinating aspect, known by some special
skilled people.
Under these conditions, we asked “How can the continuous improvement work under these
circumstances?”, and the answers are visually presented in figure 6.
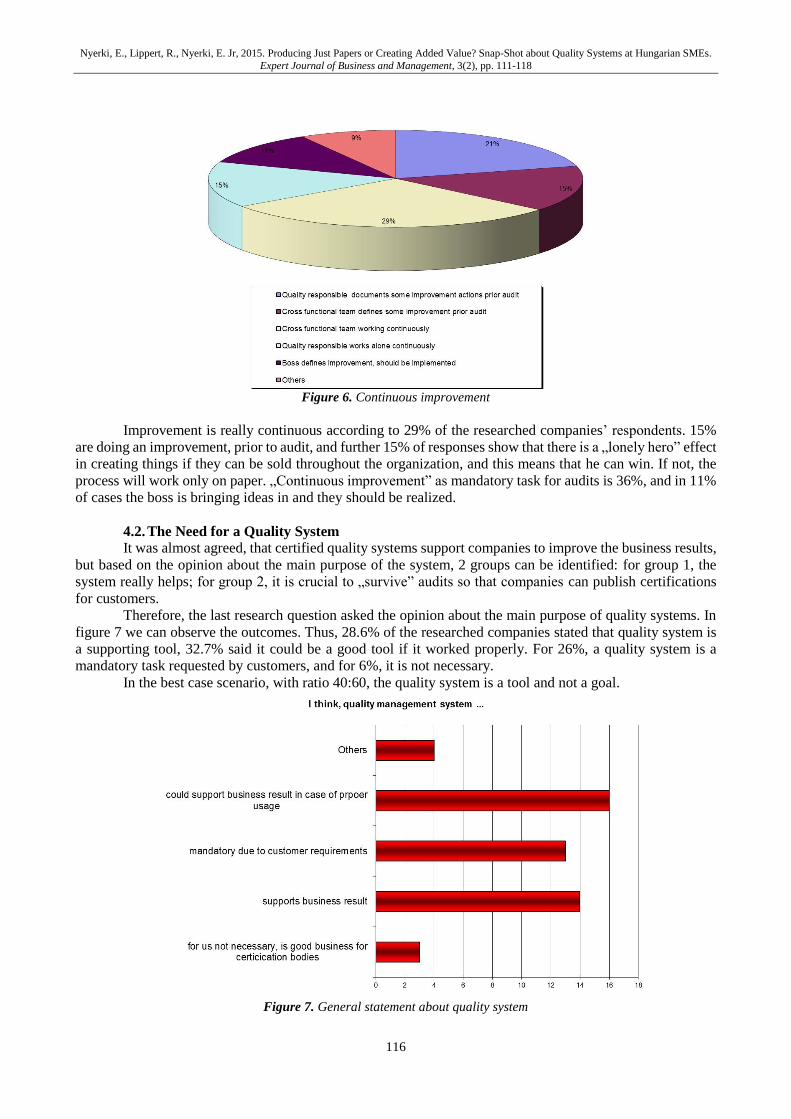
Nyerki, E., Lippert, R., Nyerki, E. Jr, 2015. Producing Just Papers or Creating Added Value? Snap-Shot about Quality Systems at Hungarian SMEs.
Expert Journal of Business and Management, 3(2), pp. 111-118
116
Figure 6. Continuous improvement
Improvement is really continuous according to 29% of the researched companies’ respondents. 15%
are doing an improvement, prior to audit, and further 15% of responses show that there is a „lonely hero” effect
in creating things if they can be sold throughout the organization, and this means that he can win. If not, the
process will work only on paper. „Continuous improvement” as mandatory task for audits is 36%, and in 11%
of cases the boss is bringing ideas in and they should be realized.
4.2. The Need for a Quality System
It was almost agreed, that certified quality systems support companies to improve the business results,
but based on the opinion about the main purpose of the system, 2 groups can be identified: for group 1, the
system really helps; for group 2, it is crucial to „survive” audits so that companies can publish certifications
for customers.
Therefore, the last research question asked the opinion about the main purpose of quality systems. In
figure 7 we can observe the outcomes. Thus, 28.6% of the researched companies stated that quality system is
a supporting tool, 32.7% said it could be a good tool if it worked properly. For 26%, a quality system is a
mandatory task requested by customers, and for 6%, it is not necessary.
In the best case scenario, with ratio 40:60, the quality system is a tool and not a goal.
Figure 7. General statement about quality system
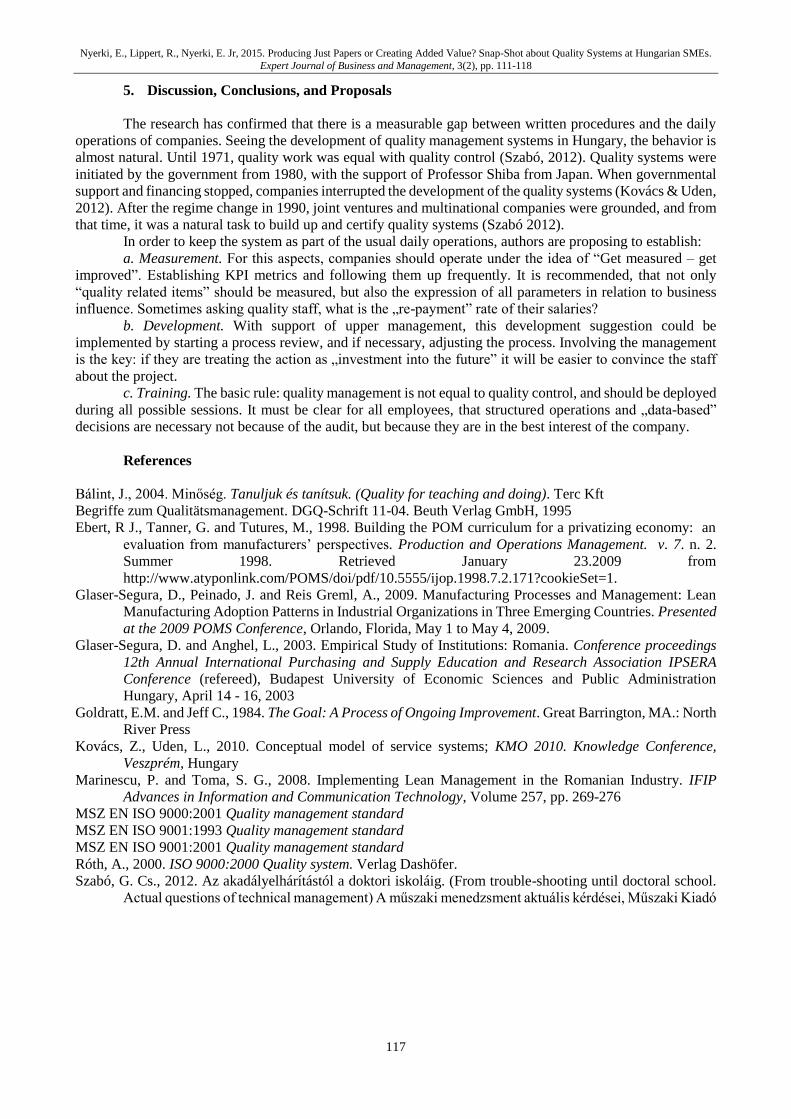
Nyerki, E., Lippert, R., Nyerki, E. Jr, 2015. Producing Just Papers or Creating Added Value? Snap-Shot about Quality Systems at Hungarian SMEs.
Expert Journal of Business and Management, 3(2), pp. 111-118
117
5. Discussion, Conclusions, and Proposals
The research has confirmed that there is a measurable gap between written procedures and the daily
operations of companies. Seeing the development of quality management systems in Hungary, the behavior is
almost natural. Until 1971, quality work was equal with quality control (Szabó, 2012). Quality systems were
initiated by the government from 1980, with the support of Professor Shiba from Japan. When governmental
support and financing stopped, companies interrupted the development of the quality systems (Kovács & Uden,
2012). After the regime change in 1990, joint ventures and multinational companies were grounded, and from
that time, it was a natural task to build up and certify quality systems (Szabó 2012).
In order to keep the system as part of the usual daily operations, authors are proposing to establish:
a. Measurement. For this aspects, companies should operate under the idea of “Get measured – get
improved”. Establishing KPI metrics and following them up frequently. It is recommended, that not only
“quality related items” should be measured, but also the expression of all parameters in relation to business
influence. Sometimes asking quality staff, what is the „re-payment” rate of their salaries?
b. Development. With support of upper management, this development suggestion could be
implemented by starting a process review, and if necessary, adjusting the process. Involving the management
is the key: if they are treating the action as „investment into the future” it will be easier to convince the staff
about the project.
c. Training. The basic rule: quality management is not equal to quality control, and should be deployed
during all possible sessions. It must be clear for all employees, that structured operations and „data-based”
decisions are necessary not because of the audit, but because they are in the best interest of the company.
References
Bálint, J., 2004. Minőség. Tanuljuk és tanítsuk. (Quality for teaching and doing). Terc Kft
Begriffe zum Qualitätsmanagement. DGQ-Schrift 11-04. Beuth Verlag GmbH, 1995
Ebert, R J., Tanner, G. and Tutures, M., 1998. Building the POM curriculum for a privatizing economy: an
evaluation from manufacturers’ perspectives. Production and Operations Management. v. 7. n. 2.
Summer 1998. Retrieved January 23.2009 from
http://www.atyponlink.com/POMS/doi/pdf/10.5555/ijop.1998.7.2.171?cookieSet=1.
Glaser-Segura, D., Peinado, J. and Reis Greml, A., 2009. Manufacturing Processes and Management: Lean
Manufacturing Adoption Patterns in Industrial Organizations in Three Emerging Countries. Presented
at the 2009 POMS Conference, Orlando, Florida, May 1 to May 4, 2009.
Glaser-Segura, D. and Anghel, L., 2003. Empirical Study of Institutions: Romania. Conference proceedings
12th Annual International Purchasing and Supply Education and Research Association IPSERA
Conference (refereed), Budapest University of Economic Sciences and Public Administration
Hungary, April 14 - 16, 2003
Goldratt, E.M. and Jeff C., 1984. The Goal: A Process of Ongoing Improvement. Great Barrington, MA.: North
River Press
Kovács, Z., Uden, L., 2010. Conceptual model of service systems; KMO 2010. Knowledge Conference,
Veszprém, Hungary
Marinescu, P. and Toma, S. G., 2008. Implementing Lean Management in the Romanian Industry. IFIP
Advances in Information and Communication Technology, Volume 257, pp. 269-276
MSZ EN ISO 9000:2001 Quality management standard
MSZ EN ISO 9001:1993 Quality management standard
MSZ EN ISO 9001:2001 Quality management standard
Róth, A., 2000. ISO 9000:2000 Quality system. Verlag Dashöfer.
Szabó, G. Cs., 2012. Az akadályelhárítástól a doktori iskoláig. (From trouble-shooting until doctoral school.
Actual questions of technical management) A műszaki menedzsment aktuális kérdései, Műszaki Kiadó

Nyerki, E., Lippert, R., Nyerki, E. Jr, 2015. Producing Just Papers or Creating Added Value? Snap-Shot about Quality Systems at Hungarian SMEs.
Expert Journal of Business and Management, 3(2), pp. 111-118
118
Appendix 1
Research Questions of the Measurement Instrument
What are the main tasks of a quality organization?
Do you think, that certified quality system support reaching business goals?
Are quality procedures known by all employees of the company?
Are quality procedures followed by all employees of the company?
Do you think that the installed quality system at your company is complex?
How are you performing continuous improvement actions?
What is your general opinion about quality system at your company?
Expert Journal of Business and Management, Volume 3, Issue 2, pp. 119-128, 2015
© 2015 The Authors. Published by Sprint Investify. ISSN 2344-6781
http://Business.ExpertJournals.com
119
Quality Service and its Relation with Global
Satisfaction in Fast Food Consumers.
A Case Study
Luis Enrique IBARRA MORALES*, Jesús VELÁZQUEZ,
Lourdes PARTIDA, Cinthia FRANCO
Sonora State University, Hermosillo, Sonora, México
The present study analyzes the quality service perception and its relation with the
satisfaction for the fast food consumers of hamburgers’ sector of the chain Burger
King in Hermosillo, Sonora. By the application of Servperf of Cronin and Taylor
methodology and a data regression method, through the coefficient of determination
(R2) was determined that the independent variables explain the variability or
variance of 82.9% in consumer satisfaction and that the explanatory variable which
has the most influence in absolute value over the explained variable is reliability, due
to its standardized beta is 0.301, being the highest score among the variables. To
achieve the objective of this study, a quantitative and correlation investigation was
designed, where data was collected from a survey structured by five dimensions,
measured by 22 items. It was applied to a random and representative sample of 385
consumers, with a 95% level confidence and a ±5% of permissible error. An
inferential statistical analysis allowed observing a positive relation between
consumers’ satisfaction level and quality service. The results showed that Servperf is
a valid instrument with psychometric characteristics of high reliability that makes it
appropriate to measure quality service. The same way, it was observed an index of
service global satisfaction of 69.27%, which according to the scale used implies
clients are satisfied with the received service.
Keywords: quality service, consumers, satisfaction, Burger King, Servperf
JEL Classification: C10, M10, M30, M31
1. Introduction
Nowadays, the quality term is applied and defined, as well as in the industrial sector as in the service
sector, with all the properties, characteristics or qualities of a product or service to satisfy the implied
preferences of consumers or users (Kotler, Bowen, Makens, 2005). According to Cantú (2006), quality has
* Corresponding Author:
Luis Enrique Ibarra Morales, Sonora State University, School of International Trade, Hermosillo, Sonora, México
Article History:
Received 24 June 2014 | Accepted 5 August 2015 | Available Online 10 August 2015
Cite Reference:
Ibarra Morales, L.E., Velázquez, J., Partida, L., Franco, C., 2015. Quality Service and its Relation with Global Satisfaction in Fast Food Consumers.
A Case Study. Expert Journal of Business and Management, 3(2), pp.119-128
Ibarra Morales, L.E., Velázquez, J., Partida, L., Franco, C., 2015. Quality Service and its Relation with Global Satisfaction in Fast Food Consumers.
A Case Study. Expert Journal of Business and Management, 3(2), pp. 119-128
120
had a long evolution that gives a great complexity to the concept itself, due to the existence of a variety of
criteria and points of view that can be applied to the service sector.
On the other hand, the service offered by the food sector, especially the franchises dedicated to the
commercialization of hamburgers, must build a fundamental pillar in its corporative and functional business
model strategy. This implies having guaranteed, not only the sales income but going further by assuring that
the products and service offered, represent the satisfaction of consumers’ needs, preferences and demands; or
in other words, the quality perception.
Clients’ satisfaction nature is based, according to Lucas Arocas (2000), on the evaluation that the
clients make of the service’s attributes when it is offered or provided, which corresponds to a purely cognitive
process. Setó (2004) considers it is important to include the customers’ needs as an affective-cognitive process
to the models or groups of attributes indicated in the literature.
In this investigation, an analysis of quality service is performed upon the basis of a measure scale and
having as a case study the Burger King franchise, company of the fast food sector, specifically hamburgers, in
the city of Hermosillo, Sonora, México.
The approach used to measure the quality service and the global satisfaction of this branch’s clients,
was the one designed and proposed by Cronin and Taylor (1992), Service Performance (Servperf). The model
is based on the performance, and this is the reason why it only considers the consumer’s perception as the
producer of the satisfaction dimension. The Servperf instrument uses the same attributes of the Servqual
Method, designed and proposed by Parasuraman, Zeithlaml and Berry (1988).
Servperf is based on the following five dimensions: tangible –the physical environment represented
by visual elements, communication and facilities’ comfort; reliability –the service is provided with
responsibility and precision; responsiveness –the company’s willingness to offer an efficient and fast service;
assurance –diverse elements that provide reliability and assurance to customers; and finally, empathy –
company’s ability to offer each client a personalized service.
2. Literature Review
Different studies have tried to define, measure and explain the concept of quality service and customer
satisfaction (Cronin and Taylor, 1994; Parasuraman et al., 1985; 1988; 1991; Teas, 1994); however, these two
terms have been considered as synonyms; are used interchangeably, which has provoked a major complexity
at the time of studying quality in the service.
On one hand, the quality in the service promotes clients’ satisfaction, the desire of coming back and
developing certain loyalty to a certain service or brand; while on the other hand, the concept of satisfaction
and quality service are closely related, to the point that these two constructs tend to be confused and overlapped.
2.1. Quality Service
There is not a unique definition for quality service, neither a unique manner to be measured. Quoting
some authors and approaches, for Jain and Gupta (2004) service quality can be seen as continuity between
“ideal quality” and “totally unacceptable quality”. For Stevens et al. (1995) it is the customer’s perception
about the superiority in the service received, containing two great dimensions, the intangibles –perceived as
the attention offered by the personnel, and the tangibles –as the physical facilities or personnel appearance. On
the other hand, for Chao (2008) quality service can be conceptualized in the form of four attributes: personnel,
operation, physical appearance, and merchandise.
In general terms, the two most common manners of measuring the perception of service quality is by
asking the consumers to express their opinion about the quality received when a product or service is given at
a certain moment (Oh, 1999). The other one tends to be the predominant in literature, and is the Servperf items
designed (Cronin andTaylor, 1992), or any others derived from this instrument or the ones proposed by
Parasuraman et al., (1988), in which the five dimensions of service quality are identified: tangible aspects
(physical environment), reliability (accomplishment and consistency), responsiveness to customer’s needs,
offering assurance and empathy with customers.
The validity and reliability of the Servperf instruments have been tested in different service contexts,
being an instrument widely used by researchers and academics. It is important to mention that the 22 items can
be adapted or adjusted to the type of industry or service sector that will be analyzed, in order to avoid confusion
or discrepancy at the moment of being applied to customers.
Ibarra Morales, L.E., Velázquez, J., Partida, L., Franco, C., 2015. Quality Service and its Relation with Global Satisfaction in Fast Food Consumers.
A Case Study. Expert Journal of Business and Management, 3(2), pp. 119-128
121
2.2. Elements that Constitute Customer Satisfaction
Customer satisfaction is basically composed by three elements: (a) perceived performance, defined as
the result of the customers’ perception in the performance achieved by the received service or product; (b)
expectation, defined as the customers’ assumption of receiving something, which can be the result of promises
made by the company, of previous experience-related buys, people’s opinions and promises made by the
company; (c) satisfaction levels that are produced when the purchase or acquisition of a product or service is
done, then the customer perceives one of these three levels of satisfaction: not satisfied –when customers’
expectations are not fulfilled; satisfied –when the product or service received meets clients’ expectations; and
complacency –it is produced when perceived performance overpass customers’ expectations; in that manner,
a pleased customer will become a loyal client to a brand or a service due to an emotional affinity that overcomes
a rational affinity.
2.3. Fast-Food Sector
The commercial activity has a great importance in México, independently of the different categories
on the market, especially in the fast food sector, since the remarkable growth in the sector sales has been
accelerated, as well as the amount of companies where this sort of products are promoted and commercialized.
The fast food market is constituted by companies, transnational ones as well as small ones, dedicated
to the manufacturing of food consumption products; in that manner, since the 90s a turning point in public
politics is marked, with the signing and implementation of the North American Free Trade Agreement
(TLCAN by its acronym in Spanish) a process that began and allowed that transnational companies, including
a diversity of franchises, to be inserted in the service sector dynamic. Burger King, as the rest of the franchises
installed in México and the State of Sonora, is a chain of restaurants specialized in hamburgers. These types
of franchises are characterized by their excellent service and quality in products, which are provided by food
chains recognized worldwide.
Fast food restaurants offer the opportunity of ordering in the facilities or in a drive-thru, presenting an
alternative of selection according to customers’ preferences. Is well known that these companies invest great
sums of money and time in the development and application of new services, products, techniques and
equipment used or that will be used in the future. The Burger King Corporation, as other fast food restaurants,
controls the processes of development and growth in each one of the franchises they administer.
As expected, each purchase can have as a result a good service received, which leaves a consumer
with a high satisfaction level; or in the contrary, a consumer may experience negative perception of the received
service.
2.4. Service Quality Dimensions in Mexican Restaurants
A restaurant is a commercial enterprise where a menu is offered, a service and quality attentions are
provided within a cordial and varied styles environment. The term derives from the Latin restaurare that means
recover or restore. According to Talavera (2009) a restaurant receives multiple names, according to the
environment, type of food and the attention disposition.
The restaurant’s industry must take into consideration that the activity includes a tangible side that is
focused in the preparation of the food served and a non-tangible side, which is integrated by the customer. The
importance in the service can be perceived in different manners among the consumers, who take into
consideration other aspects that complement the activity, as the speed of service and dishes’ vary. The activities
include food preparation for immediate consumption, taking place within the facilities, with or without table
service or outside the restaurant, (Anker and Batta, 2000).
Trujillo and Vera (2007), determined through a study that 25 variables constitute the quality service
in México’ restaurants industry, which are grouped by content similarity in six dimensions: facilities - how
pleasant and comfortable the place is perceived; accessibility - how easy is to arrive to the restaurant; personnel,
- how amiable and proficient personnel attend customers; environment - how pleasant is the atmosphere or the
environment perceived in the establishment; food - how well prepared and portioned are the dishes;
dependability and honesty - how often the customer receives the same service.
In Table 1 are shown the dimensions, variables and definitions that integrate the quality service in
México. For this investigation, these factors were adapted or adjusted to each one of the dimensions of the
Servperf measurement tool that was designed to be applied to the hamburgers sector consumers.
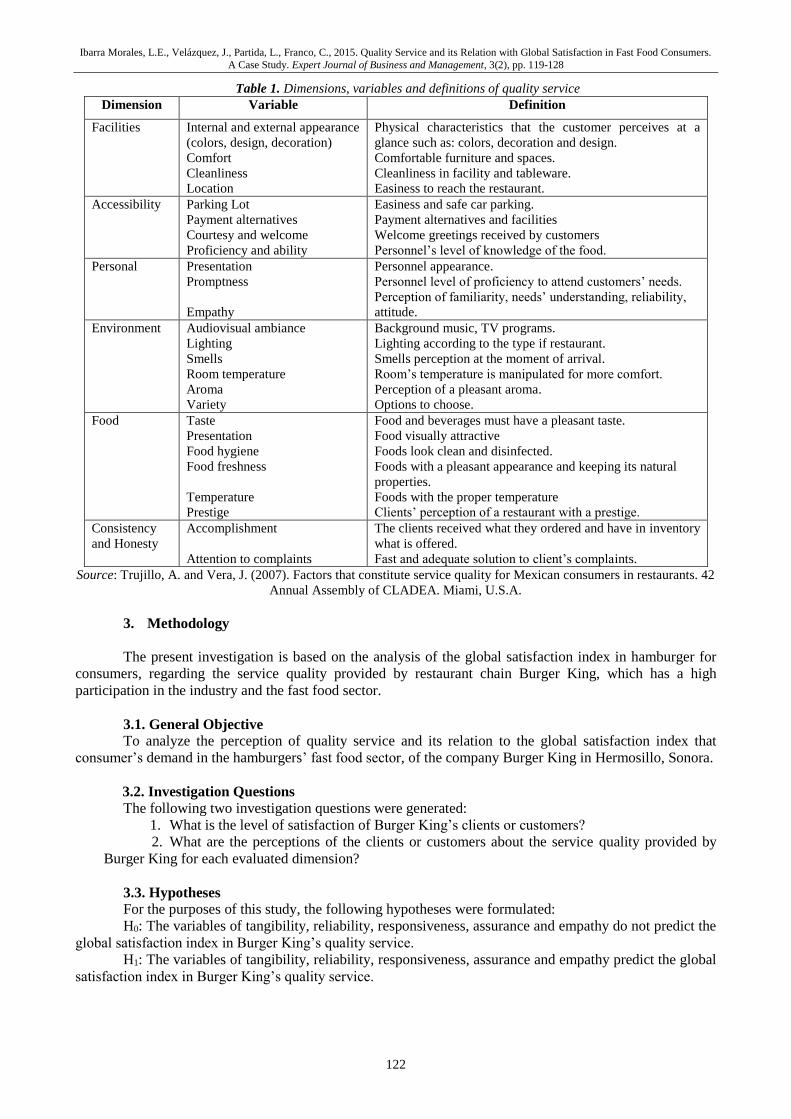
Ibarra Morales, L.E., Velázquez, J., Partida, L., Franco, C., 2015. Quality Service and its Relation with Global Satisfaction in Fast Food Consumers.
A Case Study. Expert Journal of Business and Management, 3(2), pp. 119-128
122
Table 1. Dimensions, variables and definitions of quality service
Dimension Variable Definition
Facilities Internal and external appearance
(colors, design, decoration)
Comfort
Cleanliness
Location
Physical characteristics that the customer perceives at a
glance such as: colors, decoration and design.
Comfortable furniture and spaces.
Cleanliness in facility and tableware.
Easiness to reach the restaurant.
Accessibility Parking Lot
Payment alternatives
Courtesy and welcome
Proficiency and ability
Easiness and safe car parking.
Payment alternatives and facilities
Welcome greetings received by customers
Personnel’s level of knowledge of the food.
Personal Presentation
Promptness
Empathy
Personnel appearance.
Personnel level of proficiency to attend customers’ needs.
Perception of familiarity, needs’ understanding, reliability,
attitude.
Environment Audiovisual ambiance
Lighting
Smells
Room temperature
Aroma
Variety
Background music, TV programs.
Lighting according to the type if restaurant.
Smells perception at the moment of arrival.
Room’s temperature is manipulated for more comfort.
Perception of a pleasant aroma.
Options to choose.
Food Taste
Presentation
Food hygiene
Food freshness
Temperature
Prestige
Food and beverages must have a pleasant taste.
Food visually attractive
Foods look clean and disinfected.
Foods with a pleasant appearance and keeping its natural
properties.
Foods with the proper temperature
Clients’ perception of a restaurant with a prestige.
Consistency
and Honesty
Accomplishment
Attention to complaints
The clients received what they ordered and have in inventory
what is offered.
Fast and adequate solution to client’s complaints.
Source: Trujillo, A. and Vera, J. (2007). Factors that constitute service quality for Mexican consumers in restaurants. 42
Annual Assembly of CLADEA. Miami, U.S.A.
3. Methodology
The present investigation is based on the analysis of the global satisfaction index in hamburger for
consumers, regarding the service quality provided by restaurant chain Burger King, which has a high
participation in the industry and the fast food sector.
3.1. General Objective
To analyze the perception of quality service and its relation to the global satisfaction index that
consumer’s demand in the hamburgers’ fast food sector, of the company Burger King in Hermosillo, Sonora.
3.2. Investigation Questions
The following two investigation questions were generated:
1. What is the level of satisfaction of Burger King’s clients or customers?
2. What are the perceptions of the clients or customers about the service quality provided by
Burger King for each evaluated dimension?
3.3. Hypotheses
For the purposes of this study, the following hypotheses were formulated:
H0: The variables of tangibility, reliability, responsiveness, assurance and empathy do not predict the
global satisfaction index in Burger King’s quality service.
H1: The variables of tangibility, reliability, responsiveness, assurance and empathy predict the global
satisfaction index in Burger King’s quality service.
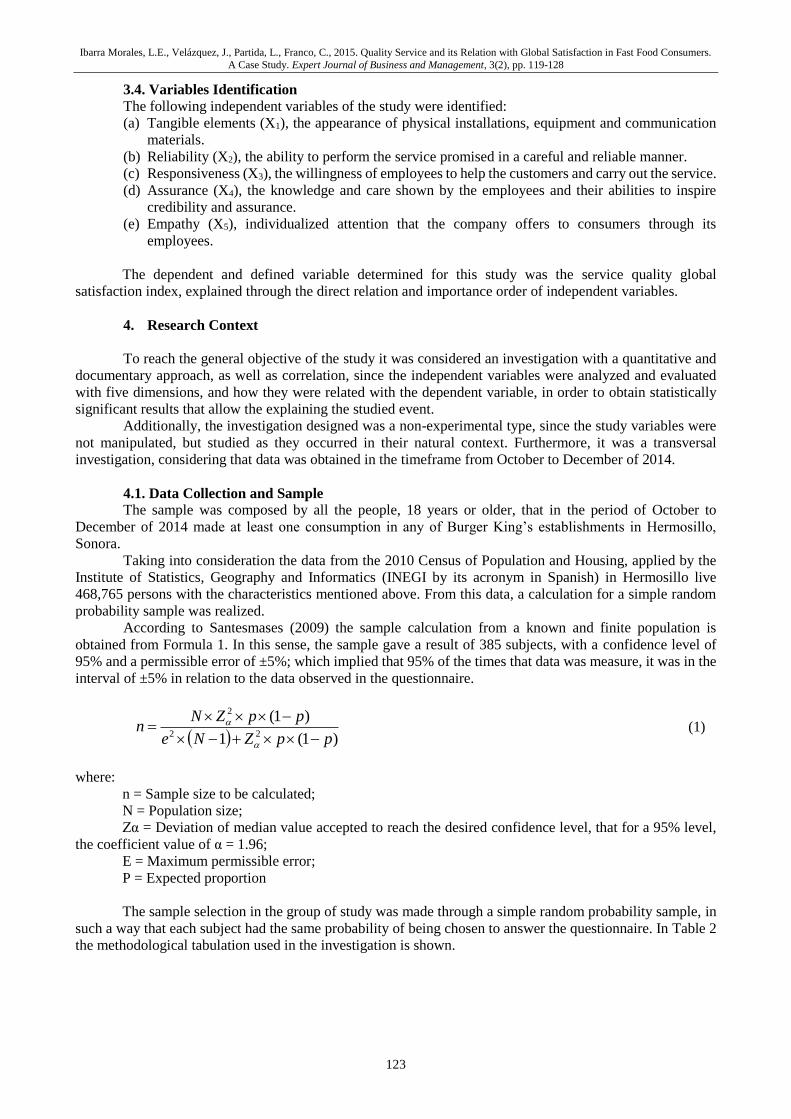
Ibarra Morales, L.E., Velázquez, J., Partida, L., Franco, C., 2015. Quality Service and its Relation with Global Satisfaction in Fast Food Consumers.
A Case Study. Expert Journal of Business and Management, 3(2), pp. 119-128
123
3.4. Variables Identification
The following independent variables of the study were identified:
(a) Tangible elements (X1), the appearance of physical installations, equipment and communication
materials.
(b) Reliability (X2), the ability to perform the service promised in a careful and reliable manner.
(c) Responsiveness (X3), the willingness of employees to help the customers and carry out the service.
(d) Assurance (X4), the knowledge and care shown by the employees and their abilities to inspire
credibility and assurance.
(e) Empathy (X5), individualized attention that the company offers to consumers through its
employees.
The dependent and defined variable determined for this study was the service quality global
satisfaction index, explained through the direct relation and importance order of independent variables.
4. Research Context
To reach the general objective of the study it was considered an investigation with a quantitative and
documentary approach, as well as correlation, since the independent variables were analyzed and evaluated
with five dimensions, and how they were related with the dependent variable, in order to obtain statistically
significant results that allow the explaining the studied event.
Additionally, the investigation designed was a non-experimental type, since the study variables were
not manipulated, but studied as they occurred in their natural context. Furthermore, it was a transversal
investigation, considering that data was obtained in the timeframe from October to December of 2014.
4.1. Data Collection and Sample
The sample was composed by all the people, 18 years or older, that in the period of October to
December of 2014 made at least one consumption in any of Burger King’s establishments in Hermosillo,
Sonora.
Taking into consideration the data from the 2010 Census of Population and Housing, applied by the
Institute of Statistics, Geography and Informatics (INEGI by its acronym in Spanish) in Hermosillo live
468,765 persons with the characteristics mentioned above. From this data, a calculation for a simple random
probability sample was realized.
According to Santesmases (2009) the sample calculation from a known and finite population is
obtained from Formula 1. In this sense, the sample gave a result of 385 subjects, with a confidence level of
95% and a permissible error of ±5%; which implied that 95% of the times that data was measure, it was in the
interval of ±5% in relation to the data observed in the questionnaire.
)1(1
)1(22
2
ppZNe
ppZNn
(1)
where:
n = Sample size to be calculated;
N = Population size;
Zα = Deviation of median value accepted to reach the desired confidence level, that for a 95% level,
the coefficient value of α = 1.96;
E = Maximum permissible error;
P = Expected proportion
The sample selection in the group of study was made through a simple random probability sample, in
such a way that each subject had the same probability of being chosen to answer the questionnaire. In Table 2
the methodological tabulation used in the investigation is shown.
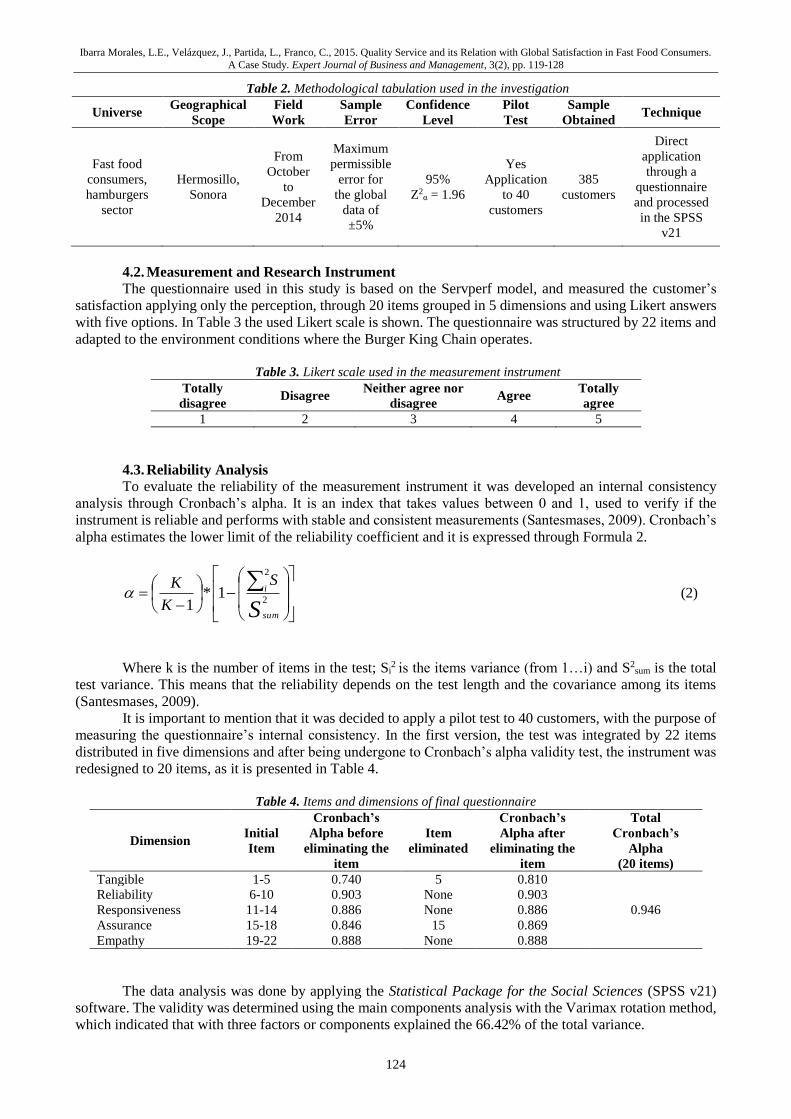
Ibarra Morales, L.E., Velázquez, J., Partida, L., Franco, C., 2015. Quality Service and its Relation with Global Satisfaction in Fast Food Consumers.
A Case Study. Expert Journal of Business and Management, 3(2), pp. 119-128
124
Table 2. Methodological tabulation used in the investigation
Universe Geographical
Scope
Field
Work
Sample
Error
Confidence
Level
Pilot
Test
Sample
Obtained Technique
Fast food
consumers,
hamburgers
sector
Hermosillo,
Sonora
From
October
to
December
2014
Maximum
permissible
error for
the global
data of
±5%
95%
Z2α = 1.96
Yes
Application
to 40
customers
385
customers
Direct
application
through a
questionnaire
and processed
in the SPSS
v21
4.2. Measurement and Research Instrument
The questionnaire used in this study is based on the Servperf model, and measured the customer’s
satisfaction applying only the perception, through 20 items grouped in 5 dimensions and using Likert answers
with five options. In Table 3 the used Likert scale is shown. The questionnaire was structured by 22 items and
adapted to the environment conditions where the Burger King Chain operates.
Table 3. Likert scale used in the measurement instrument
Totally
disagree Disagree
Neither agree nor
disagree Agree
Totally
agree
1 2 3 4 5
4.3. Reliability Analysis
To evaluate the reliability of the measurement instrument it was developed an internal consistency
analysis through Cronbach’s alpha. It is an index that takes values between 0 and 1, used to verify if the
instrument is reliable and performs with stable and consistent measurements (Santesmases, 2009). Cronbach’s
alpha estimates the lower limit of the reliability coefficient and it is expressed through Formula 2.
S sum
iS
K
K2
2
1*1
(2)
Where k is the number of items in the test; Si2 is the items variance (from 1…i) and S2
sum is the total
test variance. This means that the reliability depends on the test length and the covariance among its items
(Santesmases, 2009).
It is important to mention that it was decided to apply a pilot test to 40 customers, with the purpose of
measuring the questionnaire’s internal consistency. In the first version, the test was integrated by 22 items
distributed in five dimensions and after being undergone to Cronbach’s alpha validity test, the instrument was
redesigned to 20 items, as it is presented in Table 4.
Table 4. Items and dimensions of final questionnaire
Dimension Initial
Item
Cronbach’s
Alpha before
eliminating the
item
Item
eliminated
Cronbach’s
Alpha after
eliminating the
item
Total
Cronbach’s
Alpha
(20 items)
Tangible 1-5 0.740 5 0.810
0.946
Reliability 6-10 0.903 None 0.903
Responsiveness 11-14 0.886 None 0.886
Assurance 15-18 0.846 15 0.869
Empathy 19-22 0.888 None 0.888
The data analysis was done by applying the Statistical Package for the Social Sciences (SPSS v21)
software. The validity was determined using the main components analysis with the Varimax rotation method,
which indicated that with three factors or components explained the 66.42% of the total variance.
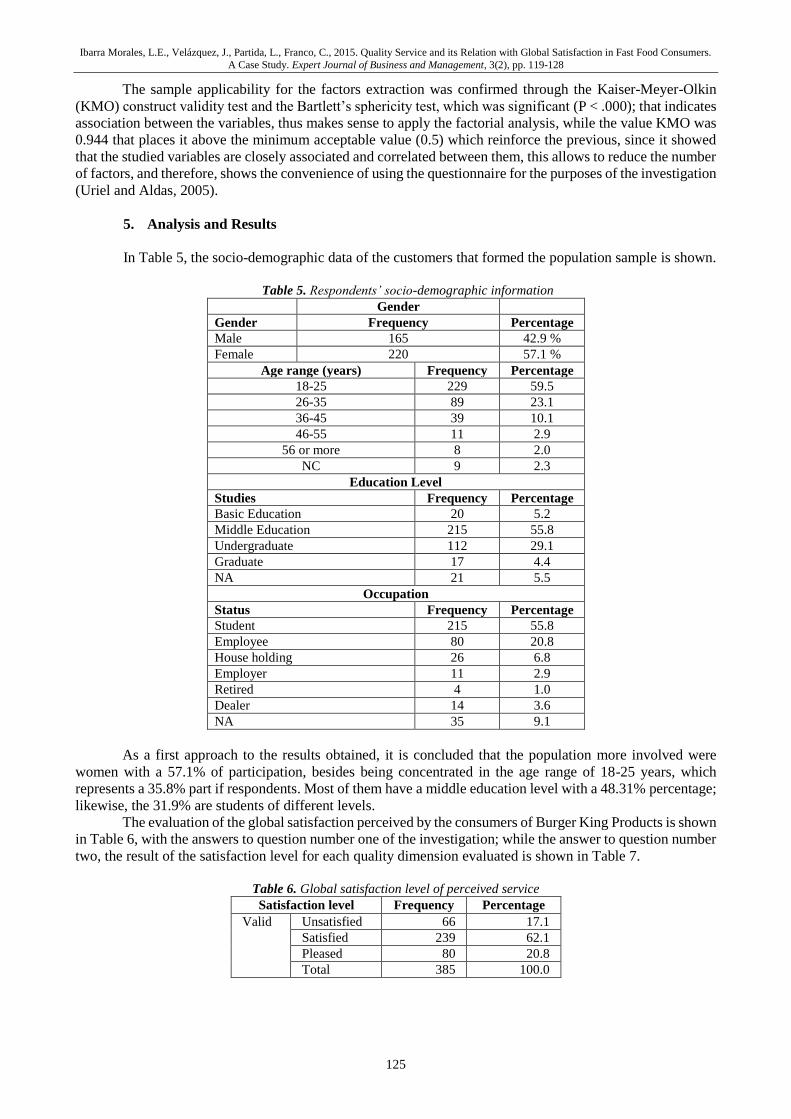
Ibarra Morales, L.E., Velázquez, J., Partida, L., Franco, C., 2015. Quality Service and its Relation with Global Satisfaction in Fast Food Consumers.
A Case Study. Expert Journal of Business and Management, 3(2), pp. 119-128
125
The sample applicability for the factors extraction was confirmed through the Kaiser-Meyer-Olkin
(KMO) construct validity test and the Bartlett’s sphericity test, which was significant (P < .000); that indicates
association between the variables, thus makes sense to apply the factorial analysis, while the value KMO was
0.944 that places it above the minimum acceptable value (0.5) which reinforce the previous, since it showed
that the studied variables are closely associated and correlated between them, this allows to reduce the number
of factors, and therefore, shows the convenience of using the questionnaire for the purposes of the investigation
(Uriel and Aldas, 2005).
5. Analysis and Results
In Table 5, the socio-demographic data of the customers that formed the population sample is shown.
Table 5. Respondents’ socio-demographic information
Gender
Gender Frequency Percentage
Male 165 42.9 %
Female 220 57.1 %
Age range (years) Frequency Percentage
18-25 229 59.5
26-35 89 23.1
36-45 39 10.1
46-55 11 2.9
56 or more 8 2.0
NC 9 2.3
Education Level
Studies Frequency Percentage
Basic Education 20 5.2
Middle Education 215 55.8
Undergraduate 112 29.1
Graduate 17 4.4
NA 21 5.5
Occupation
Status Frequency Percentage
Student 215 55.8
Employee 80 20.8
House holding 26 6.8
Employer 11 2.9
Retired 4 1.0
Dealer 14 3.6
NA 35 9.1
As a first approach to the results obtained, it is concluded that the population more involved were
women with a 57.1% of participation, besides being concentrated in the age range of 18-25 years, which
represents a 35.8% part if respondents. Most of them have a middle education level with a 48.31% percentage;
likewise, the 31.9% are students of different levels.
The evaluation of the global satisfaction perceived by the consumers of Burger King Products is shown
in Table 6, with the answers to question number one of the investigation; while the answer to question number
two, the result of the satisfaction level for each quality dimension evaluated is shown in Table 7.
Table 6. Global satisfaction level of perceived service
Satisfaction level Frequency Percentage
Valid Unsatisfied 66 17.1
Satisfied 239 62.1
Pleased 80 20.8
Total 385 100.0
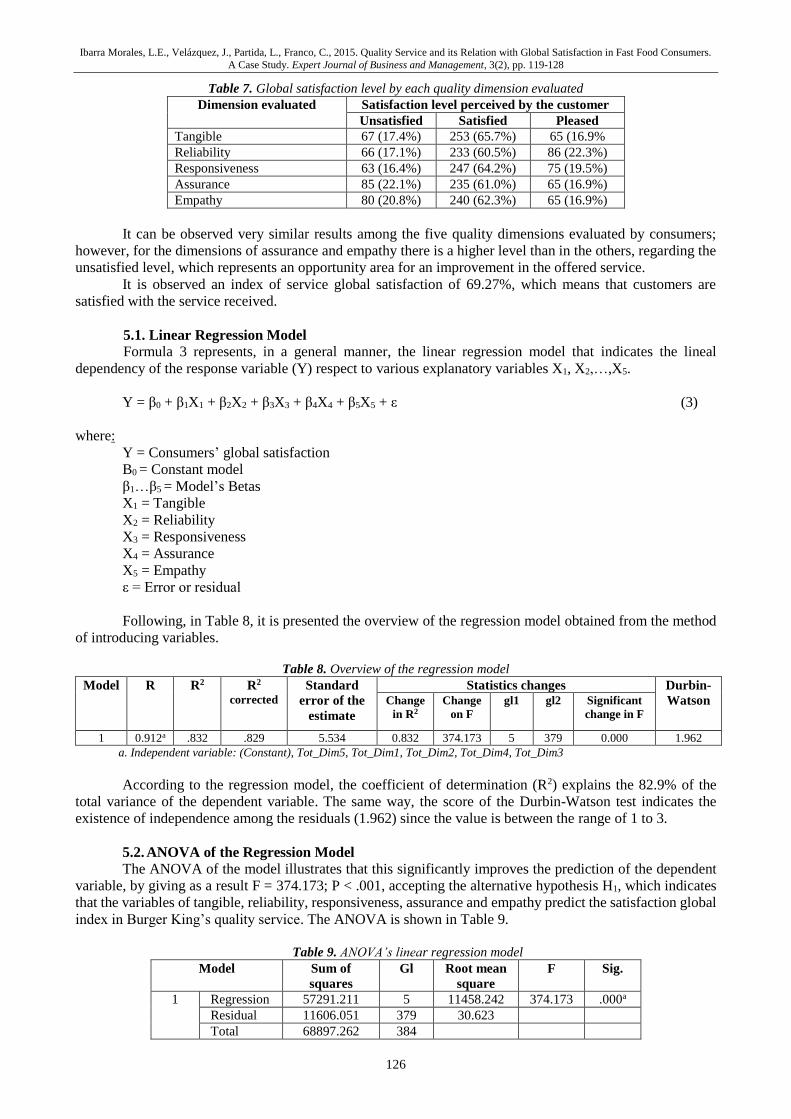
Ibarra Morales, L.E., Velázquez, J., Partida, L., Franco, C., 2015. Quality Service and its Relation with Global Satisfaction in Fast Food Consumers.
A Case Study. Expert Journal of Business and Management, 3(2), pp. 119-128
126
Table 7. Global satisfaction level by each quality dimension evaluated
Dimension evaluated Satisfaction level perceived by the customer
Unsatisfied Satisfied Pleased
Tangible 67 (17.4%) 253 (65.7%) 65 (16.9%
Reliability 66 (17.1%) 233 (60.5%) 86 (22.3%)
Responsiveness 63 (16.4%) 247 (64.2%) 75 (19.5%)
Assurance 85 (22.1%) 235 (61.0%) 65 (16.9%)
Empathy 80 (20.8%) 240 (62.3%) 65 (16.9%)
It can be observed very similar results among the five quality dimensions evaluated by consumers;
however, for the dimensions of assurance and empathy there is a higher level than in the others, regarding the
unsatisfied level, which represents an opportunity area for an improvement in the offered service.
It is observed an index of service global satisfaction of 69.27%, which means that customers are
satisfied with the service received.
5.1. Linear Regression Model
Formula 3 represents, in a general manner, the linear regression model that indicates the lineal
dependency of the response variable (Y) respect to various explanatory variables X1, X2,…,X5.
Y = β0 + β1X1 + β2X2 + β3X3 + β4X4 + β5X5 + ε (3)
where:
Y = Consumers’ global satisfaction
B0 = Constant model
β1…β5 = Model’s Betas
X1 = Tangible
X2 = Reliability
X3 = Responsiveness
X4 = Assurance
X5 = Empathy
ε = Error or residual
Following, in Table 8, it is presented the overview of the regression model obtained from the method
of introducing variables.
Table 8. Overview of the regression model
Model R R2 R2 corrected
Standard
error of the
estimate
Statistics changes Durbin-
Watson Change
in R2
Change
on F
gl1 gl2 Significant
change in F
1 0.912a .832 .829 5.534 0.832 374.173 5 379 0.000 1.962
a. Independent variable: (Constant), Tot_Dim5, Tot_Dim1, Tot_Dim2, Tot_Dim4, Tot_Dim3
According to the regression model, the coefficient of determination (R2) explains the 82.9% of the
total variance of the dependent variable. The same way, the score of the Durbin-Watson test indicates the
existence of independence among the residuals (1.962) since the value is between the range of 1 to 3.
5.2. ANOVA of the Regression Model
The ANOVA of the model illustrates that this significantly improves the prediction of the dependent
variable, by giving as a result F = 374.173; P < .001, accepting the alternative hypothesis H1, which indicates
that the variables of tangible, reliability, responsiveness, assurance and empathy predict the satisfaction global
index in Burger King’s quality service. The ANOVA is shown in Table 9.
Table 9. ANOVA’s linear regression model
Model Sum of
squares
Gl Root mean
square
F Sig.
1 Regression 57291.211 5 11458.242 374.173 .000a
Residual 11606.051 379 30.623
Total 68897.262 384
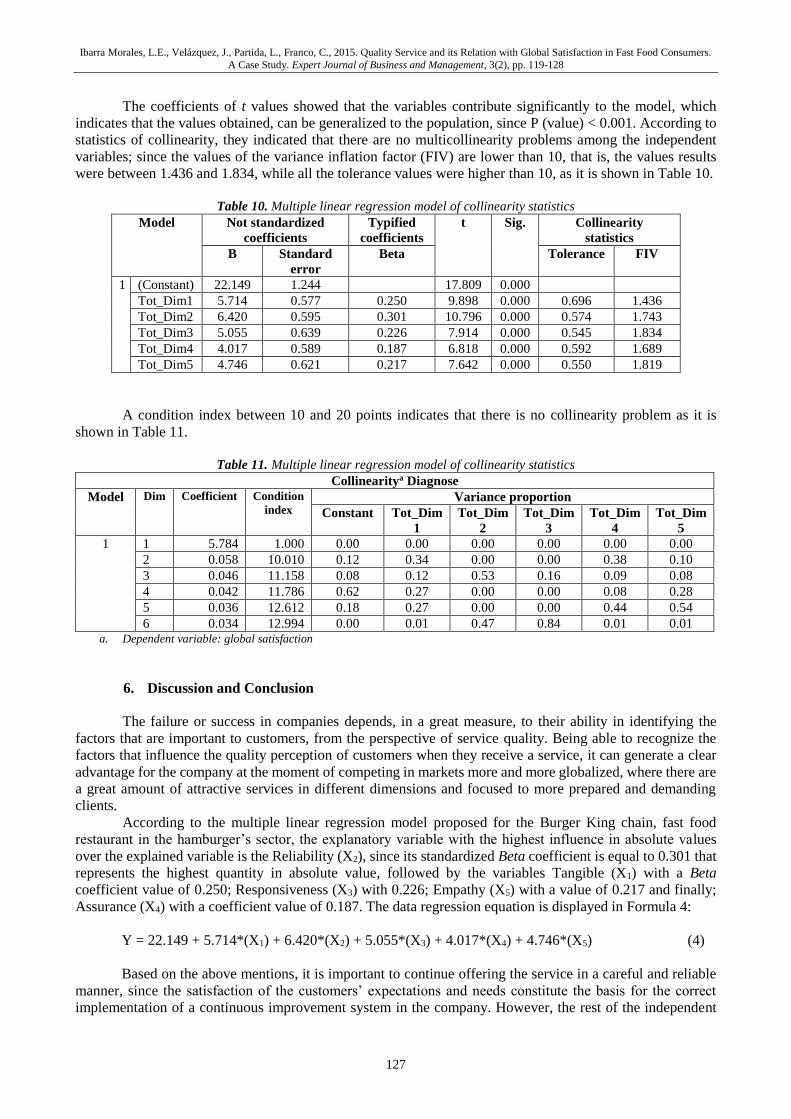
Ibarra Morales, L.E., Velázquez, J., Partida, L., Franco, C., 2015. Quality Service and its Relation with Global Satisfaction in Fast Food Consumers.
A Case Study. Expert Journal of Business and Management, 3(2), pp. 119-128
127
The coefficients of t values showed that the variables contribute significantly to the model, which
indicates that the values obtained, can be generalized to the population, since P (value) < 0.001. According to
statistics of collinearity, they indicated that there are no multicollinearity problems among the independent
variables; since the values of the variance inflation factor (FIV) are lower than 10, that is, the values results
were between 1.436 and 1.834, while all the tolerance values were higher than 10, as it is shown in Table 10.
Table 10. Multiple linear regression model of collinearity statistics
Model Not standardized
coefficients
Typified
coefficients
t Sig. Collinearity
statistics
B Standard
error
Beta Tolerance FIV
1 (Constant) 22.149 1.244 17.809 0.000
Tot_Dim1 5.714 0.577 0.250 9.898 0.000 0.696 1.436
Tot_Dim2 6.420 0.595 0.301 10.796 0.000 0.574 1.743
Tot_Dim3 5.055 0.639 0.226 7.914 0.000 0.545 1.834
Tot_Dim4 4.017 0.589 0.187 6.818 0.000 0.592 1.689
Tot_Dim5 4.746 0.621 0.217 7.642 0.000 0.550 1.819
A condition index between 10 and 20 points indicates that there is no collinearity problem as it is
shown in Table 11.
Table 11. Multiple linear regression model of collinearity statistics
Collinearitya Diagnose
Model Dim Coefficient Condition
index Variance proportion
Constant Tot_Dim
1
Tot_Dim
2
Tot_Dim
3
Tot_Dim
4
Tot_Dim
5
1 1 5.784 1.000 0.00 0.00 0.00 0.00 0.00 0.00
2 0.058 10.010 0.12 0.34 0.00 0.00 0.38 0.10
3 0.046 11.158 0.08 0.12 0.53 0.16 0.09 0.08
4 0.042 11.786 0.62 0.27 0.00 0.00 0.08 0.28
5 0.036 12.612 0.18 0.27 0.00 0.00 0.44 0.54
6 0.034 12.994 0.00 0.01 0.47 0.84 0.01 0.01 a. Dependent variable: global satisfaction
6. Discussion and Conclusion
The failure or success in companies depends, in a great measure, to their ability in identifying the
factors that are important to customers, from the perspective of service quality. Being able to recognize the
factors that influence the quality perception of customers when they receive a service, it can generate a clear
advantage for the company at the moment of competing in markets more and more globalized, where there are
a great amount of attractive services in different dimensions and focused to more prepared and demanding
clients.
According to the multiple linear regression model proposed for the Burger King chain, fast food
restaurant in the hamburger’s sector, the explanatory variable with the highest influence in absolute values
over the explained variable is the Reliability (X2), since its standardized Beta coefficient is equal to 0.301 that
represents the highest quantity in absolute value, followed by the variables Tangible (X1) with a Beta
coefficient value of 0.250; Responsiveness (X3) with 0.226; Empathy (X5) with a value of 0.217 and finally;
Assurance (X4) with a coefficient value of 0.187. The data regression equation is displayed in Formula 4:
Y = 22.149 + 5.714*(X1) + 6.420*(X2) + 5.055*(X3) + 4.017*(X4) + 4.746*(X5) (4)
Based on the above mentions, it is important to continue offering the service in a careful and reliable
manner, since the satisfaction of the customers’ expectations and needs constitute the basis for the correct
implementation of a continuous improvement system in the company. However, the rest of the independent
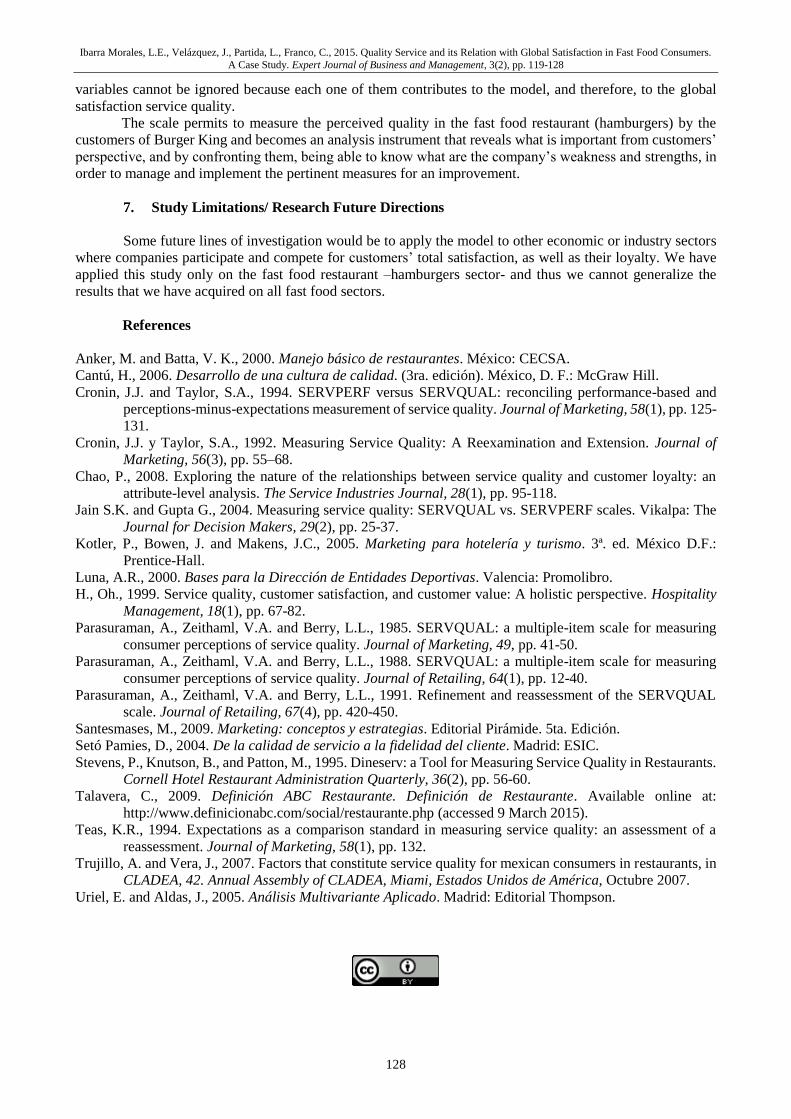
Ibarra Morales, L.E., Velázquez, J., Partida, L., Franco, C., 2015. Quality Service and its Relation with Global Satisfaction in Fast Food Consumers.
A Case Study. Expert Journal of Business and Management, 3(2), pp. 119-128
128
variables cannot be ignored because each one of them contributes to the model, and therefore, to the global
satisfaction service quality.
The scale permits to measure the perceived quality in the fast food restaurant (hamburgers) by the
customers of Burger King and becomes an analysis instrument that reveals what is important from customers’
perspective, and by confronting them, being able to know what are the company’s weakness and strengths, in
order to manage and implement the pertinent measures for an improvement.
7. Study Limitations/ Research Future Directions
Some future lines of investigation would be to apply the model to other economic or industry sectors
where companies participate and compete for customers’ total satisfaction, as well as their loyalty. We have
applied this study only on the fast food restaurant –hamburgers sector- and thus we cannot generalize the
results that we have acquired on all fast food sectors.
References
Anker, M. and Batta, V. K., 2000. Manejo básico de restaurantes. México: CECSA.
Cantú, H., 2006. Desarrollo de una cultura de calidad. (3ra. edición). México, D. F.: McGraw Hill.
Cronin, J.J. and Taylor, S.A., 1994. SERVPERF versus SERVQUAL: reconciling performance-based and
perceptions-minus-expectations measurement of service quality. Journal of Marketing, 58(1), pp. 125-
131.
Cronin, J.J. y Taylor, S.A., 1992. Measuring Service Quality: A Reexamination and Extension. Journal of
Marketing, 56(3), pp. 55–68.
Chao, P., 2008. Exploring the nature of the relationships between service quality and customer loyalty: an
attribute-level analysis. The Service Industries Journal, 28(1), pp. 95-118.
Jain S.K. and Gupta G., 2004. Measuring service quality: SERVQUAL vs. SERVPERF scales. Vikalpa: The
Journal for Decision Makers, 29(2), pp. 25-37.
Kotler, P., Bowen, J. and Makens, J.C., 2005. Marketing para hotelería y turismo. 3ª. ed. México D.F.:
Prentice-Hall.
Luna, A.R., 2000. Bases para la Dirección de Entidades Deportivas. Valencia: Promolibro.
H., Oh., 1999. Service quality, customer satisfaction, and customer value: A holistic perspective. Hospitality
Management, 18(1), pp. 67-82.
Parasuraman, A., Zeithaml, V.A. and Berry, L.L., 1985. SERVQUAL: a multiple-item scale for measuring
consumer perceptions of service quality. Journal of Marketing, 49, pp. 41-50.
Parasuraman, A., Zeithaml, V.A. and Berry, L.L., 1988. SERVQUAL: a multiple-item scale for measuring
consumer perceptions of service quality. Journal of Retailing, 64(1), pp. 12-40.
Parasuraman, A., Zeithaml, V.A. and Berry, L.L., 1991. Refinement and reassessment of the SERVQUAL
scale. Journal of Retailing, 67(4), pp. 420-450.
Santesmases, M., 2009. Marketing: conceptos y estrategias. Editorial Pirámide. 5ta. Edición.
Setó Pamies, D., 2004. De la calidad de servicio a la fidelidad del cliente. Madrid: ESIC.
Stevens, P., Knutson, B., and Patton, M., 1995. Dineserv: a Tool for Measuring Service Quality in Restaurants.
Cornell Hotel Restaurant Administration Quarterly, 36(2), pp. 56-60.
Talavera, C., 2009. Definición ABC Restaurante. Definición de Restaurante. Available online at:
http://www.definicionabc.com/social/restaurante.php (accessed 9 March 2015).
Teas, K.R., 1994. Expectations as a comparison standard in measuring service quality: an assessment of a
reassessment. Journal of Marketing, 58(1), pp. 132.
Trujillo, A. and Vera, J., 2007. Factors that constitute service quality for mexican consumers in restaurants, in
CLADEA, 42. Annual Assembly of CLADEA, Miami, Estados Unidos de América, Octubre 2007.
Uriel, E. and Aldas, J., 2005. Análisis Multivariante Aplicado. Madrid: Editorial Thompson.
Expert Journal of Business and Management, Volume 3, Issue 2, pp. 129-139, 2015
© 2015 The Author. Published by Sprint Investify. ISSN 2344-6781
http://Business.ExpertJournals.com
129
Are Housing Markets Decoupled? A Case Study
of Residential Real Estate Affordability in
Austria
Florian PHILIPP*
University of Latvia
Real estate arguably forms the most important asset to most households and the basis
for their wealth. Around this context a model has been set up testing the relative
affordability of real estate for the median household in Austria and the consequences
of lower borrowing costs between 2004 and 2013 by vintage year. In this paper the
hypothesis that the significant decline in base interest rates is not sufficient to offset
the relative affordability loss caused by declining net household incomes and the
simultaneous increase of real estate prices. To test this hypothesis a model has been
set up comparing two different Housing Affordability Indices – one including and one
excluding financing effects, having been compared via a multi factor model. Based
on this calculation the author finds decreased base interest rates to offset relative
affordability losses by only approximately 50%, verifying the hypothesis. The paper
therefore argues for a potential decoupling of the residential housing market in
Austria.
Keywords: Household Income, Taxation, Real Estate, Interest Rates, Debt Service, Austria, Housing Affordability
JEL Classification: M20, M21
1. Introduction. Declining Real Estate Affordability a Global Phenomenon?
Real estate affordability is a vast field of research spanning from the late 18th century, documenting
housing costs for worker to highly complex regression models capturing pricing and affordability trends in the
recent years. What appears to be worthwhile examining, is that there seems to be a more global trend of
depressed housing affordability, comparing the research done by Lin at al. (2014) for Taiwan, Radzimski
(2014) for Poland or Kallakmaa‐Kapsta and Kolbre (2013) examining the Estonian housing market, all
pointing to declining real estate affordability. Despite the findings of three researchers do not constitute the
existence of a global trend, the author’s interest arose to examine the relationship between household income
and real estate prices in Austria, to see if a comparable trend could be also found in this market. The paper
therefore tries to develop a model that measures the affordability of real estate housing prices in Austria
* Corresponding Author:
Florian Philipp, University of Latvia, Latvia
Article History:
Received 11 August 2015 | Accepted 26 August 2015 | Available Online 9 September 2015
Cite Reference:
Philipp, F., 2015. Are Housing Markets Decoupled? A Case Study of Residential Real Estate Affordability in Austria. Expert Journal of Business and
Management, 3(2), pp.129-139
Philipp, F., 2015. Are Housing Markets Decoupled? A Case Study of Residential Real Estate Affordability in Austria.
Expert Journal of Business and Management, 3(2), pp. 129-139
130
between 2004 and 2013 through a price-to-income measurement and further explore the impact of base interest
rate changes on this affordability.
2. Literature Research – Theory and Empirical Background
2.1. Income Hypothesis – Life-cycle Permanent
Tracking income-consumption behaviour theory in social science ultimately leads to the income
hypothesis by Keynes (1936), upon which the modern consumption theory, the life cycle permanent income
theory, was built. The theory has been prominently tested by Hall (1978) and is still in use by highly regarded
research institutions, such as OECD (2004) in their study on housing markets, wealth and the business cycle.
But next to consumption functions in theory, actual spending behaviour – notably for housing expenditure –
has been tracked since the 18th century.
2.2. Measuring Affordability in the Context of Real Estate - Expenditure to Income
Since the measurement of income is obviously one of the key criterions for assessing the affordability
of real estate, we shall explore the findings of past researchers on the measurement of those. Herman Schwabe
and Ernst Engel, identified as one of the forefathers of income to housing expenditure research by Stigler
(1954), stated an inverse relationship between household income and expenditure for housing. Looking at the
spending on rent to household income, a general increase on such spending might be argued over time. While
the expenditure was between 5.3% and 4.3% in 1793 for English working families, it had increased to between
8.3% and 9.0% for Belgian workmen’s families in 1853, as summarised by Stigler (1954). Despite it might be
argued that this is an invalid conclusion on tendencies, Gilderbloom (1985) finds that professional landlords –
in his research this group has been defined as those owning more than 50 rental units – apply a common rule
of thumb of 25% of household income to housing costs, when assessing tenant quality.
Stone’s (2006) finding that this value has been increased further from 25% up to the early 1980’s to
30% thereafter. Gan and Hill (2009) find that a 28% cost-to-income ratio being applied by the National
Association of Homebuilders in the US. Lin at al. (2014) compare the household’s actual budget to purchase
a home with the household’s permanent income, creating a price-to-income ratio. Conceptually along this
lines, despite considering a different format, Radzimski (2014) and Trojanek (2013) also take a housing price
to household income ratio to measure the affordability of residential real estate – for their respective studies
on Poland. Kallakmaa‐Kapsta and Kolbre (2013) also use a household income-to-price ratio – not accounting
for a household’s spending behaviour – due the lack of data – while examining the Estonian residential real
estate market.
We can therefore conclude that the approach to estimate the amount of spending on housing by the
respective households might be criticised but even as the latest research shows – at least to the author’s
knowledge – there is no other approach than to simply ignore the factor of disposable income for housing or
apply the rule of thumb that seems to be widely applied by real estate tracking indices and professional
landlords.
Hulchanski (1995), reviewing the housing affordability in the context of housing expenditure to
income ratios, identifies six sectors of usability for cost to income relationships and its’ validity. Rejecting
four out of the six areas examined, he finds it a "valid and reliable quantitative indicator in housing research
and analysis, depending on the questions asked and the methods used". Despite these aspects, he argues that
the "housing outlays" are rather a measurement of liquidity rather than of assets, and he, in principle, finds it
a valuable tool to research on trends in the real estate market, measuring comparative positions within. On his
liquidity argument the author disagrees since the liquidity is the key determinant of the asset acquisition both
in the saving phase, when equity is accrued for the down payment at asset acquisition, and at the time of
purchase when the liquidity defines the mortgage amount assumed by the lender to be serviceable by the
respective household. Following this logic it actually remains the only relevant determinant for the mortgage
lender during the "exploitation phase" when the mortgage granted needs to be served.
Around this context Gyourko and Linneman (1993) have been examining the relative affordability of
home ownership in the US over a period of 30 years, between 1960 and 1989. They find that between 1960
and 1974, despite real home prices have increased, no affordability issued existed due to the strong real wage
increase. Despite this might arguably have a more historical character due to the time lag, the author considers
this a significant finding, since this seems to point into the direction that real home price increases may only
be met by affordability during simultaneous strong wage increases.
The question to which extend (if at all) interest rates may offset reverse or rather diverging tendencies,
shall be examined by this paper. Further Gyourko and Linneman (1993) observe that despite the then relative
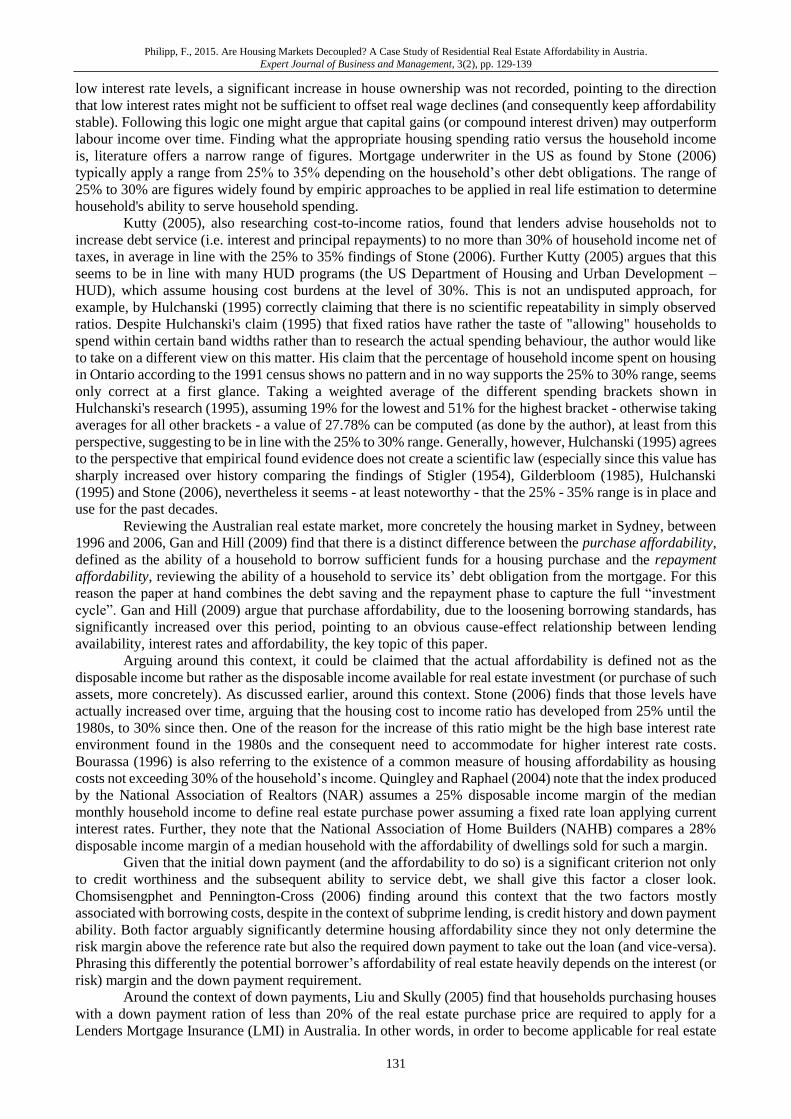
Philipp, F., 2015. Are Housing Markets Decoupled? A Case Study of Residential Real Estate Affordability in Austria.
Expert Journal of Business and Management, 3(2), pp. 129-139
131
low interest rate levels, a significant increase in house ownership was not recorded, pointing to the direction
that low interest rates might not be sufficient to offset real wage declines (and consequently keep affordability
stable). Following this logic one might argue that capital gains (or compound interest driven) may outperform
labour income over time. Finding what the appropriate housing spending ratio versus the household income
is, literature offers a narrow range of figures. Mortgage underwriter in the US as found by Stone (2006)
typically apply a range from 25% to 35% depending on the household’s other debt obligations. The range of
25% to 30% are figures widely found by empiric approaches to be applied in real life estimation to determine
household's ability to serve household spending.
Kutty (2005), also researching cost-to-income ratios, found that lenders advise households not to
increase debt service (i.e. interest and principal repayments) to no more than 30% of household income net of
taxes, in average in line with the 25% to 35% findings of Stone (2006). Further Kutty (2005) argues that this
seems to be in line with many HUD programs (the US Department of Housing and Urban Development –
HUD), which assume housing cost burdens at the level of 30%. This is not an undisputed approach, for
example, by Hulchanski (1995) correctly claiming that there is no scientific repeatability in simply observed
ratios. Despite Hulchanski's claim (1995) that fixed ratios have rather the taste of "allowing" households to
spend within certain band widths rather than to research the actual spending behaviour, the author would like
to take on a different view on this matter. His claim that the percentage of household income spent on housing
in Ontario according to the 1991 census shows no pattern and in no way supports the 25% to 30% range, seems
only correct at a first glance. Taking a weighted average of the different spending brackets shown in
Hulchanski's research (1995), assuming 19% for the lowest and 51% for the highest bracket - otherwise taking
averages for all other brackets - a value of 27.78% can be computed (as done by the author), at least from this
perspective, suggesting to be in line with the 25% to 30% range. Generally, however, Hulchanski (1995) agrees
to the perspective that empirical found evidence does not create a scientific law (especially since this value has
sharply increased over history comparing the findings of Stigler (1954), Gilderbloom (1985), Hulchanski
(1995) and Stone (2006), nevertheless it seems - at least noteworthy - that the 25% - 35% range is in place and
use for the past decades.
Reviewing the Australian real estate market, more concretely the housing market in Sydney, between
1996 and 2006, Gan and Hill (2009) find that there is a distinct difference between the purchase affordability,
defined as the ability of a household to borrow sufficient funds for a housing purchase and the repayment
affordability, reviewing the ability of a household to service its’ debt obligation from the mortgage. For this
reason the paper at hand combines the debt saving and the repayment phase to capture the full “investment
cycle”. Gan and Hill (2009) argue that purchase affordability, due to the loosening borrowing standards, has
significantly increased over this period, pointing to an obvious cause-effect relationship between lending
availability, interest rates and affordability, the key topic of this paper.
Arguing around this context, it could be claimed that the actual affordability is defined not as the
disposable income but rather as the disposable income available for real estate investment (or purchase of such
assets, more concretely). As discussed earlier, around this context. Stone (2006) finds that those levels have
actually increased over time, arguing that the housing cost to income ratio has developed from 25% until the
1980s, to 30% since then. One of the reason for the increase of this ratio might be the high base interest rate
environment found in the 1980s and the consequent need to accommodate for higher interest rate costs.
Bourassa (1996) is also referring to the existence of a common measure of housing affordability as housing
costs not exceeding 30% of the household’s income. Quingley and Raphael (2004) note that the index produced
by the National Association of Realtors (NAR) assumes a 25% disposable income margin of the median
monthly household income to define real estate purchase power assuming a fixed rate loan applying current
interest rates. Further, they note that the National Association of Home Builders (NAHB) compares a 28%
disposable income margin of a median household with the affordability of dwellings sold for such a margin.
Given that the initial down payment (and the affordability to do so) is a significant criterion not only
to credit worthiness and the subsequent ability to service debt, we shall give this factor a closer look.
Chomsisengphet and Pennington-Cross (2006) finding around this context that the two factors mostly
associated with borrowing costs, despite in the context of subprime lending, is credit history and down payment
ability. Both factor arguably significantly determine housing affordability since they not only determine the
risk margin above the reference rate but also the required down payment to take out the loan (and vice-versa).
Phrasing this differently the potential borrower’s affordability of real estate heavily depends on the interest (or
risk) margin and the down payment requirement.
Around the context of down payments, Liu and Skully (2005) find that households purchasing houses
with a down payment ration of less than 20% of the real estate purchase price are required to apply for a
Lenders Mortgage Insurance (LMI) in Australia. In other words, in order to become applicable for real estate
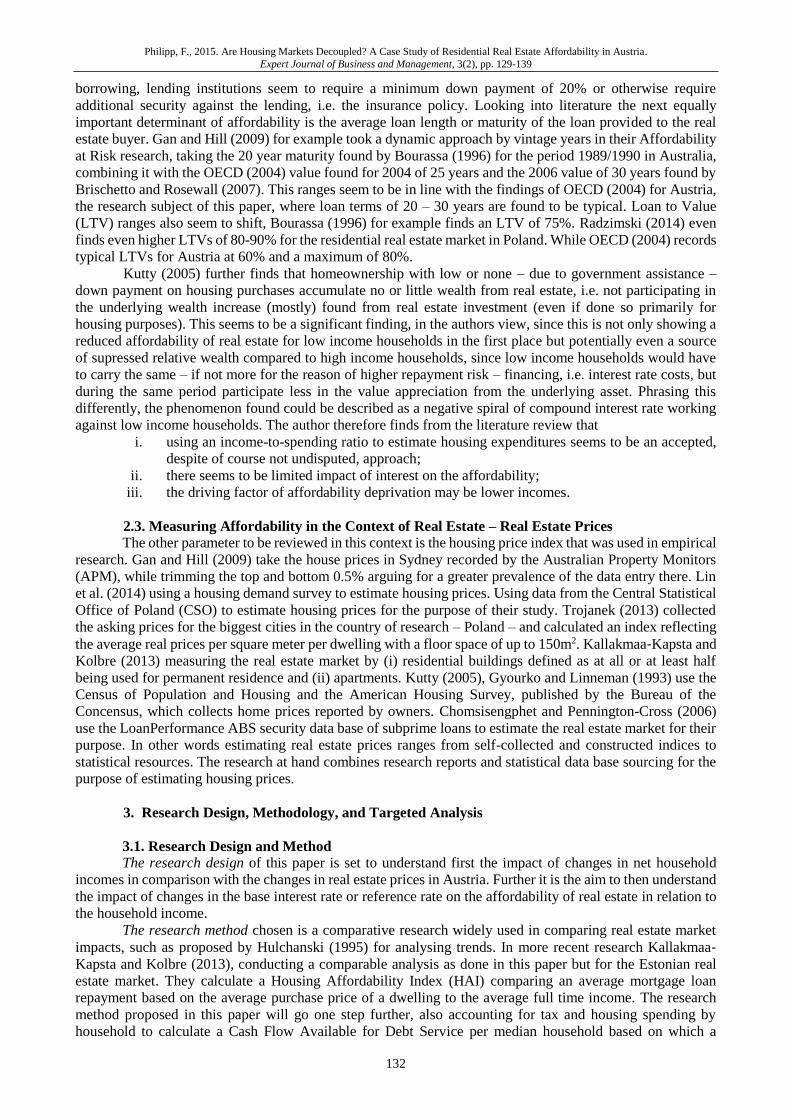
Philipp, F., 2015. Are Housing Markets Decoupled? A Case Study of Residential Real Estate Affordability in Austria.
Expert Journal of Business and Management, 3(2), pp. 129-139
132
borrowing, lending institutions seem to require a minimum down payment of 20% or otherwise require
additional security against the lending, i.e. the insurance policy. Looking into literature the next equally
important determinant of affordability is the average loan length or maturity of the loan provided to the real
estate buyer. Gan and Hill (2009) for example took a dynamic approach by vintage years in their Affordability
at Risk research, taking the 20 year maturity found by Bourassa (1996) for the period 1989/1990 in Australia,
combining it with the OECD (2004) value found for 2004 of 25 years and the 2006 value of 30 years found by
Brischetto and Rosewall (2007). This ranges seem to be in line with the findings of OECD (2004) for Austria,
the research subject of this paper, where loan terms of 20 – 30 years are found to be typical. Loan to Value
(LTV) ranges also seem to shift, Bourassa (1996) for example finds an LTV of 75%. Radzimski (2014) even
finds even higher LTVs of 80-90% for the residential real estate market in Poland. While OECD (2004) records
typical LTVs for Austria at 60% and a maximum of 80%.
Kutty (2005) further finds that homeownership with low or none – due to government assistance –
down payment on housing purchases accumulate no or little wealth from real estate, i.e. not participating in
the underlying wealth increase (mostly) found from real estate investment (even if done so primarily for
housing purposes). This seems to be a significant finding, in the authors view, since this is not only showing a
reduced affordability of real estate for low income households in the first place but potentially even a source
of supressed relative wealth compared to high income households, since low income households would have
to carry the same – if not more for the reason of higher repayment risk – financing, i.e. interest rate costs, but
during the same period participate less in the value appreciation from the underlying asset. Phrasing this
differently, the phenomenon found could be described as a negative spiral of compound interest rate working
against low income households. The author therefore finds from the literature review that
i. using an income-to-spending ratio to estimate housing expenditures seems to be an accepted,
despite of course not undisputed, approach;
ii. there seems to be limited impact of interest on the affordability;
iii. the driving factor of affordability deprivation may be lower incomes.
2.3. Measuring Affordability in the Context of Real Estate – Real Estate Prices
The other parameter to be reviewed in this context is the housing price index that was used in empirical
research. Gan and Hill (2009) take the house prices in Sydney recorded by the Australian Property Monitors
(APM), while trimming the top and bottom 0.5% arguing for a greater prevalence of the data entry there. Lin
et al. (2014) using a housing demand survey to estimate housing prices. Using data from the Central Statistical
Office of Poland (CSO) to estimate housing prices for the purpose of their study. Trojanek (2013) collected
the asking prices for the biggest cities in the country of research – Poland – and calculated an index reflecting
the average real prices per square meter per dwelling with a floor space of up to 150m2. Kallakmaa‐Kapsta and
Kolbre (2013) measuring the real estate market by (i) residential buildings defined as at all or at least half
being used for permanent residence and (ii) apartments. Kutty (2005), Gyourko and Linneman (1993) use the
Census of Population and Housing and the American Housing Survey, published by the Bureau of the
Concensus, which collects home prices reported by owners. Chomsisengphet and Pennington-Cross (2006)
use the LoanPerformance ABS security data base of subprime loans to estimate the real estate market for their
purpose. In other words estimating real estate prices ranges from self-collected and constructed indices to
statistical resources. The research at hand combines research reports and statistical data base sourcing for the
purpose of estimating housing prices.
3. Research Design, Methodology, and Targeted Analysis
3.1. Research Design and Method
The research design of this paper is set to understand first the impact of changes in net household
incomes in comparison with the changes in real estate prices in Austria. Further it is the aim to then understand
the impact of changes in the base interest rate or reference rate on the affordability of real estate in relation to
the household income.
The research method chosen is a comparative research widely used in comparing real estate market
impacts, such as proposed by Hulchanski (1995) for analysing trends. In more recent research Kallakmaa‐Kapsta and Kolbre (2013), conducting a comparable analysis as done in this paper but for the Estonian real
estate market. They calculate a Housing Affordability Index (HAI) comparing an average mortgage loan
repayment based on the average purchase price of a dwelling to the average full time income. The research
method proposed in this paper will go one step further, also accounting for tax and housing spending by
household to calculate a Cash Flow Available for Debt Service per median household based on which a
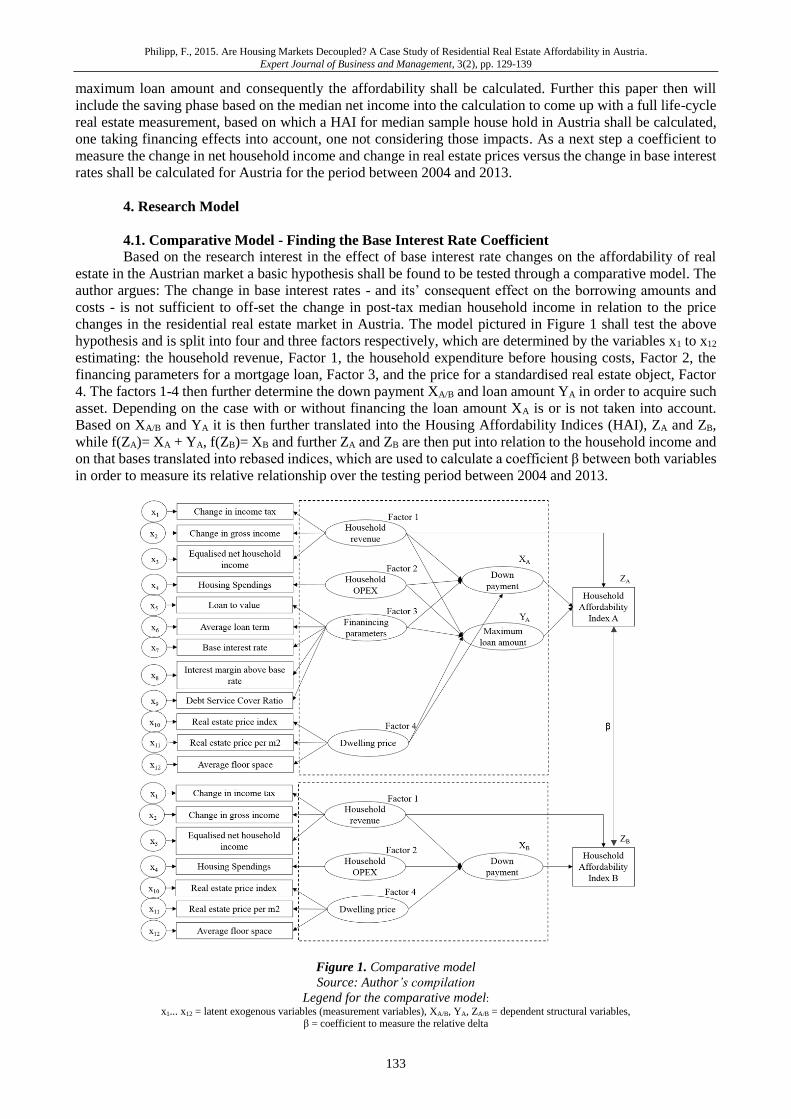
Philipp, F., 2015. Are Housing Markets Decoupled? A Case Study of Residential Real Estate Affordability in Austria.
Expert Journal of Business and Management, 3(2), pp. 129-139
133
maximum loan amount and consequently the affordability shall be calculated. Further this paper then will
include the saving phase based on the median net income into the calculation to come up with a full life-cycle
real estate measurement, based on which a HAI for median sample house hold in Austria shall be calculated,
one taking financing effects into account, one not considering those impacts. As a next step a coefficient to
measure the change in net household income and change in real estate prices versus the change in base interest
rates shall be calculated for Austria for the period between 2004 and 2013.
4. Research Model
4.1. Comparative Model - Finding the Base Interest Rate Coefficient
Based on the research interest in the effect of base interest rate changes on the affordability of real
estate in the Austrian market a basic hypothesis shall be found to be tested through a comparative model. The
author argues: The change in base interest rates - and its’ consequent effect on the borrowing amounts and
costs - is not sufficient to off-set the change in post-tax median household income in relation to the price
changes in the residential real estate market in Austria. The model pictured in Figure 1 shall test the above
hypothesis and is split into four and three factors respectively, which are determined by the variables x1 to x12
estimating: the household revenue, Factor 1, the household expenditure before housing costs, Factor 2, the
financing parameters for a mortgage loan, Factor 3, and the price for a standardised real estate object, Factor
4. The factors 1-4 then further determine the down payment XA/B and loan amount YA in order to acquire such
asset. Depending on the case with or without financing the loan amount XA is or is not taken into account.
Based on XA/B and YA it is then further translated into the Housing Affordability Indices (HAI), ZA and ZB,
while f(ZA)= XA + YA, f(ZB)= XB and further ZA and ZB are then put into relation to the household income and
on that bases translated into rebased indices, which are used to calculate a coefficient β between both variables
in order to measure its relative relationship over the testing period between 2004 and 2013.
Figure 1. Comparative model
Source: Author’s compilation
Legend for the comparative model: x1... x12 = latent exogenous variables (measurement variables), XA/B, YA, ZA/B = dependent structural variables,
β = coefficient to measure the relative delta
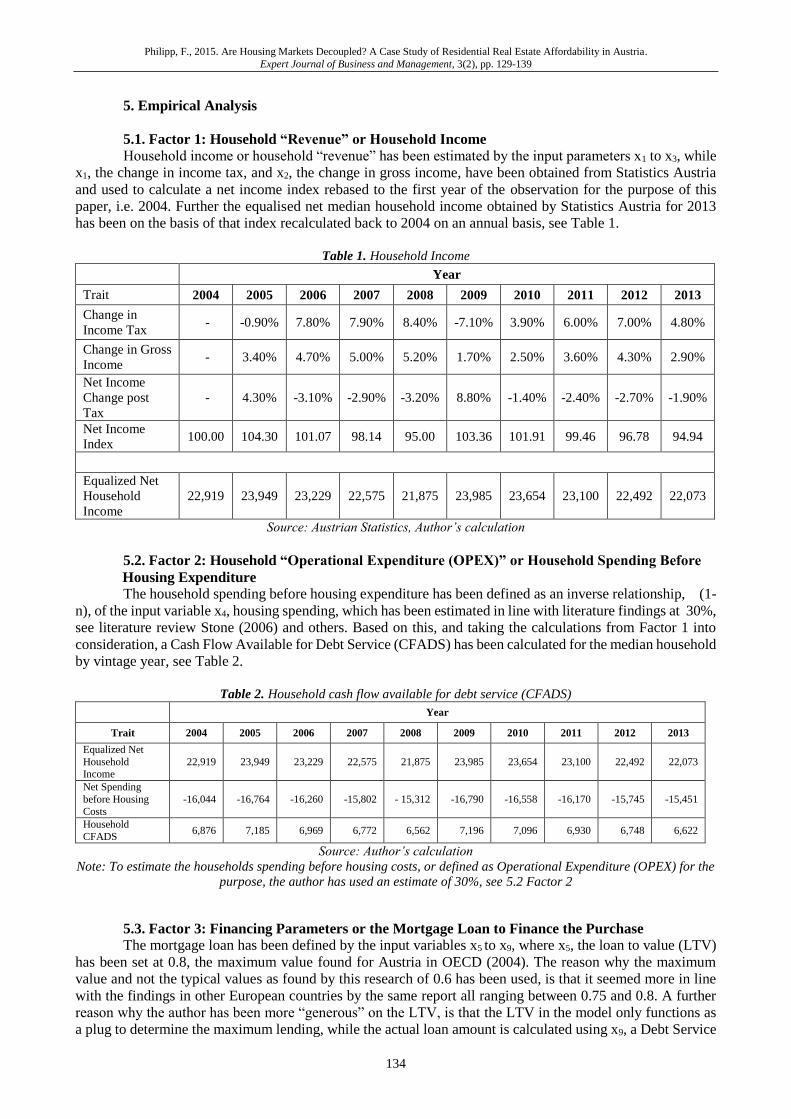
Philipp, F., 2015. Are Housing Markets Decoupled? A Case Study of Residential Real Estate Affordability in Austria.
Expert Journal of Business and Management, 3(2), pp. 129-139
134
5. Empirical Analysis
5.1. Factor 1: Household “Revenue” or Household Income
Household income or household “revenue” has been estimated by the input parameters x1 to x3, while
x1, the change in income tax, and x2, the change in gross income, have been obtained from Statistics Austria
and used to calculate a net income index rebased to the first year of the observation for the purpose of this
paper, i.e. 2004. Further the equalised net median household income obtained by Statistics Austria for 2013
has been on the basis of that index recalculated back to 2004 on an annual basis, see Table 1.
Table 1. Household Income
Year
Trait 2004 2005 2006 2007 2008 2009 2010 2011 2012 2013
Change in
Income Tax - -0.90% 7.80% 7.90% 8.40% -7.10% 3.90% 6.00% 7.00% 4.80%
Change in Gross
Income - 3.40% 4.70% 5.00% 5.20% 1.70% 2.50% 3.60% 4.30% 2.90%
Net Income
Change post
Tax
- 4.30% -3.10% -2.90% -3.20% 8.80% -1.40% -2.40% -2.70% -1.90%
Net Income
Index 100.00 104.30 101.07 98.14 95.00 103.36 101.91 99.46 96.78 94.94
Equalized Net
Household
Income
22,919 23,949 23,229 22,575 21,875 23,985 23,654 23,100 22,492 22,073
Source: Austrian Statistics, Author’s calculation
5.2. Factor 2: Household “Operational Expenditure (OPEX)” or Household Spending Before
Housing Expenditure
The household spending before housing expenditure has been defined as an inverse relationship, (1-
n), of the input variable x4, housing spending, which has been estimated in line with literature findings at 30%,
see literature review Stone (2006) and others. Based on this, and taking the calculations from Factor 1 into
consideration, a Cash Flow Available for Debt Service (CFADS) has been calculated for the median household
by vintage year, see Table 2.
Table 2. Household cash flow available for debt service (CFADS)
Year
Trait 2004 2005 2006 2007 2008 2009 2010 2011 2012 2013
Equalized Net
Household Income
22,919 23,949 23,229 22,575 21,875 23,985 23,654 23,100 22,492 22,073
Net Spending
before Housing
Costs
-16,044 -16,764 -16,260 -15,802 - 15,312 -16,790 -16,558 -16,170 -15,745 -15,451
Household
CFADS 6,876 7,185 6,969 6,772 6,562 7,196 7,096 6,930 6,748 6,622
Source: Author’s calculation
Note: To estimate the households spending before housing costs, or defined as Operational Expenditure (OPEX) for the
purpose, the author has used an estimate of 30%, see 5.2 Factor 2
5.3. Factor 3: Financing Parameters or the Mortgage Loan to Finance the Purchase
The mortgage loan has been defined by the input variables x5 to x9, where x5, the loan to value (LTV)
has been set at 0.8, the maximum value found for Austria in OECD (2004). The reason why the maximum
value and not the typical values as found by this research of 0.6 has been used, is that it seemed more in line
with the findings in other European countries by the same report all ranging between 0.75 and 0.8. A further
reason why the author has been more “generous” on the LTV, is that the LTV in the model only functions as
a plug to determine the maximum lending, while the actual loan amount is calculated using x9, a Debt Service
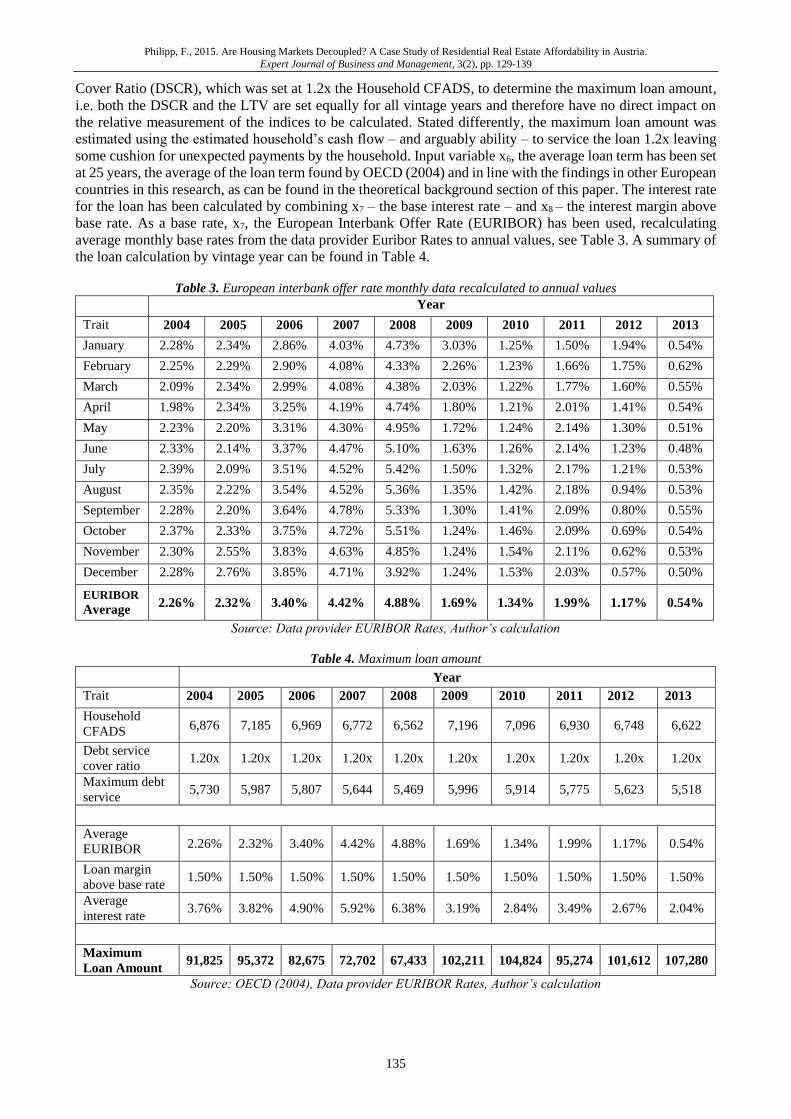
Philipp, F., 2015. Are Housing Markets Decoupled? A Case Study of Residential Real Estate Affordability in Austria.
Expert Journal of Business and Management, 3(2), pp. 129-139
135
Cover Ratio (DSCR), which was set at 1.2x the Household CFADS, to determine the maximum loan amount,
i.e. both the DSCR and the LTV are set equally for all vintage years and therefore have no direct impact on
the relative measurement of the indices to be calculated. Stated differently, the maximum loan amount was
estimated using the estimated household’s cash flow – and arguably ability – to service the loan 1.2x leaving
some cushion for unexpected payments by the household. Input variable x6, the average loan term has been set
at 25 years, the average of the loan term found by OECD (2004) and in line with the findings in other European
countries in this research, as can be found in the theoretical background section of this paper. The interest rate
for the loan has been calculated by combining x7 – the base interest rate – and x8 – the interest margin above
base rate. As a base rate, x7, the European Interbank Offer Rate (EURIBOR) has been used, recalculating
average monthly base rates from the data provider Euribor Rates to annual values, see Table 3. A summary of
the loan calculation by vintage year can be found in Table 4.
Table 3. European interbank offer rate monthly data recalculated to annual values
Year
Trait 2004 2005 2006 2007 2008 2009 2010 2011 2012 2013
January 2.28% 2.34% 2.86% 4.03% 4.73% 3.03% 1.25% 1.50% 1.94% 0.54%
February 2.25% 2.29% 2.90% 4.08% 4.33% 2.26% 1.23% 1.66% 1.75% 0.62%
March 2.09% 2.34% 2.99% 4.08% 4.38% 2.03% 1.22% 1.77% 1.60% 0.55%
April 1.98% 2.34% 3.25% 4.19% 4.74% 1.80% 1.21% 2.01% 1.41% 0.54%
May 2.23% 2.20% 3.31% 4.30% 4.95% 1.72% 1.24% 2.14% 1.30% 0.51%
June 2.33% 2.14% 3.37% 4.47% 5.10% 1.63% 1.26% 2.14% 1.23% 0.48%
July 2.39% 2.09% 3.51% 4.52% 5.42% 1.50% 1.32% 2.17% 1.21% 0.53%
August 2.35% 2.22% 3.54% 4.52% 5.36% 1.35% 1.42% 2.18% 0.94% 0.53%
September 2.28% 2.20% 3.64% 4.78% 5.33% 1.30% 1.41% 2.09% 0.80% 0.55%
October 2.37% 2.33% 3.75% 4.72% 5.51% 1.24% 1.46% 2.09% 0.69% 0.54%
November 2.30% 2.55% 3.83% 4.63% 4.85% 1.24% 1.54% 2.11% 0.62% 0.53%
December 2.28% 2.76% 3.85% 4.71% 3.92% 1.24% 1.53% 2.03% 0.57% 0.50%
EURIBOR
Average 2.26% 2.32% 3.40% 4.42% 4.88% 1.69% 1.34% 1.99% 1.17% 0.54%
Source: Data provider EURIBOR Rates, Author’s calculation
Table 4. Maximum loan amount
Year
Trait 2004 2005 2006 2007 2008 2009 2010 2011 2012 2013
Household
CFADS 6,876 7,185 6,969 6,772 6,562 7,196 7,096 6,930 6,748 6,622
Debt service
cover ratio 1.20x 1.20x 1.20x 1.20x 1.20x 1.20x 1.20x 1.20x 1.20x 1.20x
Maximum debt
service 5,730 5,987 5,807 5,644 5,469 5,996 5,914 5,775 5,623 5,518
Average
EURIBOR 2.26% 2.32% 3.40% 4.42% 4.88% 1.69% 1.34% 1.99% 1.17% 0.54%
Loan margin
above base rate 1.50% 1.50% 1.50% 1.50% 1.50% 1.50% 1.50% 1.50% 1.50% 1.50%
Average
interest rate 3.76% 3.82% 4.90% 5.92% 6.38% 3.19% 2.84% 3.49% 2.67% 2.04%
Maximum
Loan Amount 91,825 95,372 82,675 72,702 67,433 102,211 104,824 95,274 101,612 107,280
Source: OECD (2004), Data provider EURIBOR Rates, Author’s calculation
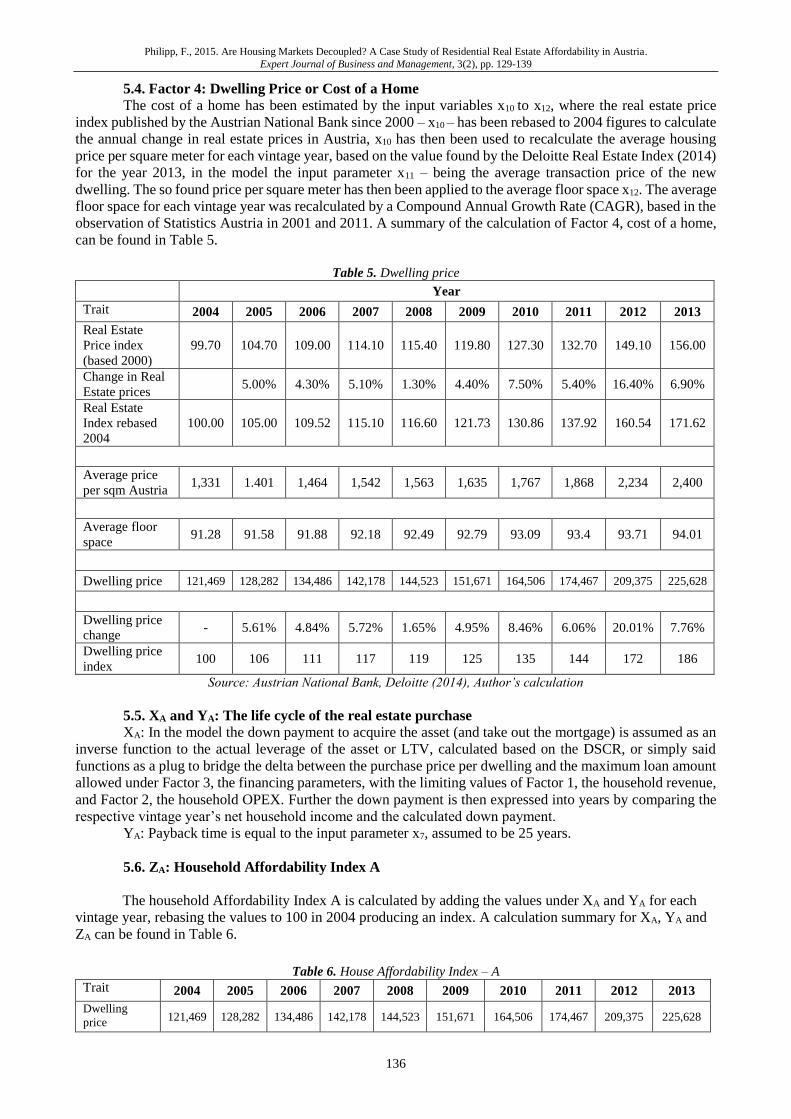
Philipp, F., 2015. Are Housing Markets Decoupled? A Case Study of Residential Real Estate Affordability in Austria.
Expert Journal of Business and Management, 3(2), pp. 129-139
136
5.4. Factor 4: Dwelling Price or Cost of a Home
The cost of a home has been estimated by the input variables x10 to x12, where the real estate price
index published by the Austrian National Bank since 2000 – x10 – has been rebased to 2004 figures to calculate
the annual change in real estate prices in Austria, x10 has then been used to recalculate the average housing
price per square meter for each vintage year, based on the value found by the Deloitte Real Estate Index (2014)
for the year 2013, in the model the input parameter x11 – being the average transaction price of the new
dwelling. The so found price per square meter has then been applied to the average floor space x12. The average
floor space for each vintage year was recalculated by a Compound Annual Growth Rate (CAGR), based in the
observation of Statistics Austria in 2001 and 2011. A summary of the calculation of Factor 4, cost of a home,
can be found in Table 5.
Table 5. Dwelling price
Year
Trait 2004 2005 2006 2007 2008 2009 2010 2011 2012 2013
Real Estate
Price index
(based 2000)
99.70 104.70 109.00 114.10 115.40 119.80 127.30 132.70 149.10 156.00
Change in Real
Estate prices 5.00% 4.30% 5.10% 1.30% 4.40% 7.50% 5.40% 16.40% 6.90%
Real Estate
Index rebased
2004
100.00 105.00 109.52 115.10 116.60 121.73 130.86 137.92 160.54 171.62
Average price
per sqm Austria 1,331 1.401 1,464 1,542 1,563 1,635 1,767 1,868 2,234 2,400
Average floor
space 91.28 91.58 91.88 92.18 92.49 92.79 93.09 93.4 93.71 94.01
Dwelling price 121,469 128,282 134,486 142,178 144,523 151,671 164,506 174,467 209,375 225,628
Dwelling price
change - 5.61% 4.84% 5.72% 1.65% 4.95% 8.46% 6.06% 20.01% 7.76%
Dwelling price
index 100 106 111 117 119 125 135 144 172 186
Source: Austrian National Bank, Deloitte (2014), Author’s calculation
5.5. XA and YA: The life cycle of the real estate purchase
XA: In the model the down payment to acquire the asset (and take out the mortgage) is assumed as an
inverse function to the actual leverage of the asset or LTV, calculated based on the DSCR, or simply said
functions as a plug to bridge the delta between the purchase price per dwelling and the maximum loan amount
allowed under Factor 3, the financing parameters, with the limiting values of Factor 1, the household revenue,
and Factor 2, the household OPEX. Further the down payment is then expressed into years by comparing the
respective vintage year’s net household income and the calculated down payment.
YA: Payback time is equal to the input parameter x7, assumed to be 25 years.
5.6. ZA: Household Affordability Index A
The household Affordability Index A is calculated by adding the values under XA and YA for each
vintage year, rebasing the values to 100 in 2004 producing an index. A calculation summary for XA, YA and
ZA can be found in Table 6.
Table 6. House Affordability Index – A
Trait 2004 2005 2006 2007 2008 2009 2010 2011 2012 2013
Dwelling
price 121,469 128,282 134,486 142,178 144,523 151,671 164,506 174,467 209,375 225,628

Philipp, F., 2015. Are Housing Markets Decoupled? A Case Study of Residential Real Estate Affordability in Austria.
Expert Journal of Business and Management, 3(2), pp. 129-139
137
Debt Maximum
Loan Amount 91,825 95,372 82,675 72,702 67,433 102,211 104,824 95,274 101,612 107,280
LTV 0.76x 0.74x 0.61x 0.51x 0.47x 0.67x 0.64x 0.55x 0.49x 0.48x
Equity
Down
payment 29,645 32,910 51,811 69,476 77,090 49,460 59,682 79,193 107,763 118,348
Household
CFADS 6,876 7,185 6,969 6,772 6,562 7,196 7,096 6,930 6,748 6,622
Saving years
for down
payment 4 5 7 10 12 7 8 11 16 18
Loan term 25 25 25 25 25 25 25 25 25 25
Total life-
cycle 29 30 32 35 37 32 33 36 41 43
Change in
life-cycle - 0.92% 9.65% 8.71% 4.22% -
13.26% 4.82% 9.03% 12.47% 4.64%
House
Affordability
Index - A 100 101 111 120 125 109 114 124 140 146
Source: Author’s calculation
5.7. XB: The life cycle of the real estate purchase
XB: Since under XB no financing is assumed, the equity down payment equals to the purchase price
and is divided by the Household’s CFADS.
5.8. ZB: Household Affordability Index B
The household Affordability Index B is calculated by rebasing the values calculated under XB to 100
in 2004 producing an index, in analogy to ZA. A calculation summary for XB, and ZB can be found in Table 7.
Table 7. House Affordability Index – B
Year
Trait 2004 2005 2006 2007 2008 2009 2010 2011 2012 2013
Dwelling price 121,469 128,282 134,486 142,178 144,523 151,671 164,506 174,467 209,375 225,628
Equity
Down payment 121,469 128,282 134,486 142,178 144,523 151,671 164,506 174,467 209,375 225,628
Household
CFADS 6,876 7,185 6,969 6,772 6,562 7,196 7,096 6,930 6,748 6,622
Saving years for
down payment 18 18 19 21 22 21 23 25 31 34
Total life-cycle 18 18 19 21 22 21 23 25 31 34
Change in life-
cycle - 1.07% 8.09% 8.79% 4.90% -4.29% 9.98% 8.60% 23.25% 9.81%
House
Affordability
Index - B 100 101 109 119 125 119 131 143 176 193
Source: Author’s calculation
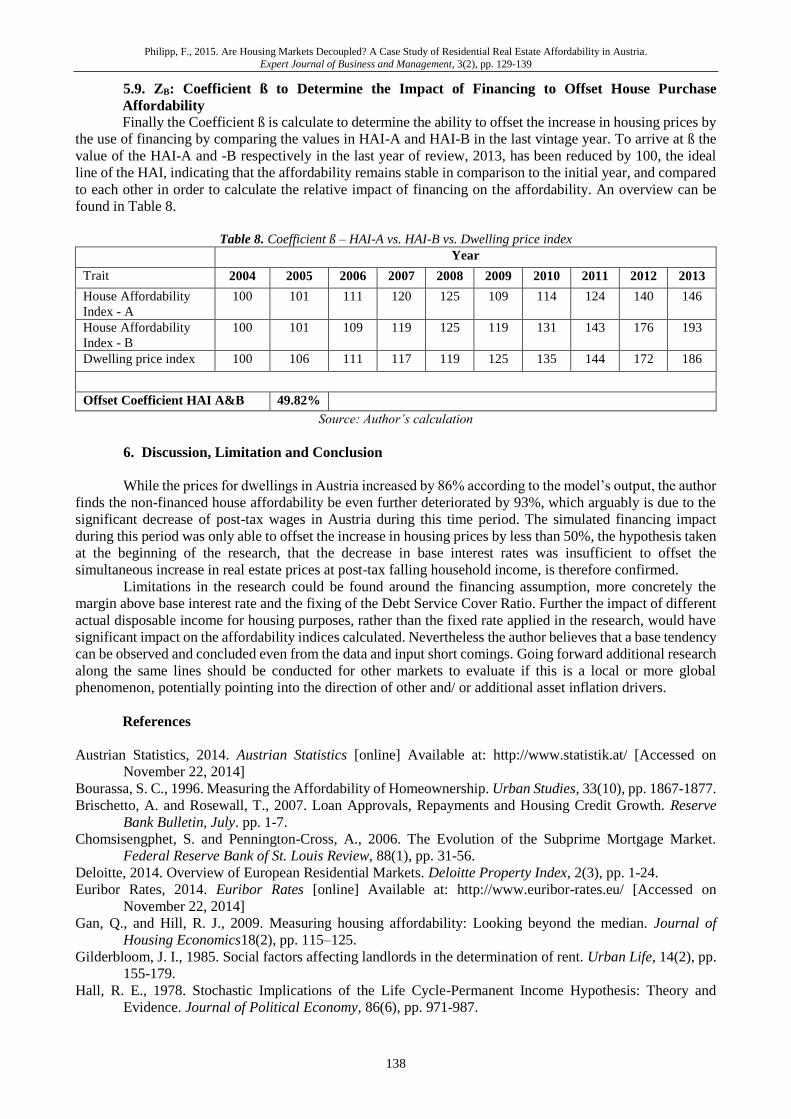
Philipp, F., 2015. Are Housing Markets Decoupled? A Case Study of Residential Real Estate Affordability in Austria.
Expert Journal of Business and Management, 3(2), pp. 129-139
138
5.9. ZB: Coefficient ß to Determine the Impact of Financing to Offset House Purchase
Affordability
Finally the Coefficient ß is calculate to determine the ability to offset the increase in housing prices by
the use of financing by comparing the values in HAI-A and HAI-B in the last vintage year. To arrive at ß the
value of the HAI-A and -B respectively in the last year of review, 2013, has been reduced by 100, the ideal
line of the HAI, indicating that the affordability remains stable in comparison to the initial year, and compared
to each other in order to calculate the relative impact of financing on the affordability. An overview can be
found in Table 8.
Table 8. Coefficient ß – HAI-A vs. HAI-B vs. Dwelling price index
Year
Trait 2004 2005 2006 2007 2008 2009 2010 2011 2012 2013
House Affordability
Index - A
100 101 111 120 125 109 114 124 140 146
House Affordability
Index - B
100 101 109 119 125 119 131 143 176 193
Dwelling price index 100 106 111 117 119 125 135 144 172 186
Offset Coefficient HAI A&B 49.82%
Source: Author’s calculation
6. Discussion, Limitation and Conclusion
While the prices for dwellings in Austria increased by 86% according to the model’s output, the author
finds the non-financed house affordability be even further deteriorated by 93%, which arguably is due to the
significant decrease of post-tax wages in Austria during this time period. The simulated financing impact
during this period was only able to offset the increase in housing prices by less than 50%, the hypothesis taken
at the beginning of the research, that the decrease in base interest rates was insufficient to offset the
simultaneous increase in real estate prices at post-tax falling household income, is therefore confirmed.
Limitations in the research could be found around the financing assumption, more concretely the
margin above base interest rate and the fixing of the Debt Service Cover Ratio. Further the impact of different
actual disposable income for housing purposes, rather than the fixed rate applied in the research, would have
significant impact on the affordability indices calculated. Nevertheless the author believes that a base tendency
can be observed and concluded even from the data and input short comings. Going forward additional research
along the same lines should be conducted for other markets to evaluate if this is a local or more global
phenomenon, potentially pointing into the direction of other and/ or additional asset inflation drivers.
References
Austrian Statistics, 2014. Austrian Statistics [online] Available at: http://www.statistik.at/ [Accessed on
November 22, 2014]
Bourassa, S. C., 1996. Measuring the Affordability of Homeownership. Urban Studies, 33(10), pp. 1867-1877.
Brischetto, A. and Rosewall, T., 2007. Loan Approvals, Repayments and Housing Credit Growth. Reserve
Bank Bulletin, July. pp. 1-7.
Chomsisengphet, S. and Pennington-Cross, A., 2006. The Evolution of the Subprime Mortgage Market.
Federal Reserve Bank of St. Louis Review, 88(1), pp. 31-56.
Deloitte, 2014. Overview of European Residential Markets. Deloitte Property Index, 2(3), pp. 1-24.
Euribor Rates, 2014. Euribor Rates [online] Available at: http://www.euribor-rates.eu/ [Accessed on
November 22, 2014]
Gan, Q., and Hill, R. J., 2009. Measuring housing affordability: Looking beyond the median. Journal of
Housing Economics18(2), pp. 115–125.
Gilderbloom, J. I., 1985. Social factors affecting landlords in the determination of rent. Urban Life, 14(2), pp.
155-179.
Hall, R. E., 1978. Stochastic Implications of the Life Cycle-Permanent Income Hypothesis: Theory and
Evidence. Journal of Political Economy, 86(6), pp. 971-987.
Philipp, F., 2015. Are Housing Markets Decoupled? A Case Study of Residential Real Estate Affordability in Austria.
Expert Journal of Business and Management, 3(2), pp. 129-139
139
Kallakmaa-Kapsta, A. and Kolbre, E., 2013. Estonian housing market: affordability problem and regulatory
framework. International Journal of Housing Markets and Analysis, 6(2). pp. 146-162.
Keynes, J. M., 1936. The general theory of employment interest and money. London: Macmillan Publishing.
Kutty, N. K., 2005. A New Measure of Housing Affordability: Estimates and Analytical Results. Housing
Policy Debate, 16(1), pp. 113-142.
Lerman, L. D. and Reeder, W.J., 1987. The Affordability of Adequate Housing. AREUEA Journal15, pp. 389–
404.
Lin, Y.-J., Chang, C.-O. and Chen, C.-L., 2014. Why homebuyers have a high housing affordability problem:
Quantile regression analysis. Habitat International, 43, pp. 41-47.
Liu, B. and Skully, M.T., 2005. The Determinants of Mortgage Yield Spread Dierentials: Securitization.
Journal of Multinational Financial Management, 15(4-5), pp. 314-333.
OECD, 2004. Housing Markets, Wealth and the Business Cycle. OECD Economic Outlook, 75(4), pp. 127-
147.
Quigley, J.M. and Raphael, S., 2004. Is Housing Unaffordable? Why Isn't It More Affordable. Journal of
Economic Perspectives, 18(1), pp. 191-214.
Radzimski, A., 2014. Subsidized mortgage loans and housing affordability in Poland. GeoJournal79, pp. 467-
494.
Stigler, G. J., 1954. The early history of empirical studies of consumer behaviour. The Journal of Political
Economy, LXII(2), pp. 95-113.
Stone, M., 2006. What is Housing Affordability? The Case for the Residual Income Approach. Housing Policy
Debate, 17(1), pp. 151-184.
Trojanek, R., 2013. Housing affordability in Poland. International Journal of Academic Research, 5(4), pp.
183-187.
Expert Journal of Business and Management, Volume 3, Issue 2, pp. 140-149, 2015
© 2015 The Author. Published by Sprint Investify. ISSN 2344-6781
http://Business.ExpertJournals.com
140
A Conceptual Mapping Resource Advantage
Theory, Competitive Advantage Theory, and
Transient Competitive Advantage
Jasanta PERANGINANGIN*
Diponegoro University, Indonesia
Competitive advantage is the main purposed of the business entity focusing on
market base view. Resource advantage theorists put their concern to empowering
resources development with resources based view, in the other side needs to
redefining competitive advantage. All the competitive advantage are transient,
concluded the end of competitive advantage. Redefining competitive advantage by
selling migration and shrewdness outward. This research to emphasize innovation
capability rarely appears in the future.
Keywords: R-A Theory, C-A Theory, and Transient Competitive Advantage
JEL Classification: M21
1. Introduction
Recent marketing literature has already been vastly developing. Such phenomenon has developed
the marketing literature into a dynamic science, even beyond its era. To this date, there have been at least
twelve schools of marketing according to Shaw and Jones (2005). It is predicted that further development
shall continue in the near future.
The development of marketing theories has been correlated to interaction among other disciplines
(Jaw and Lee, 2007). Such interaction has created marketing to be a robust subject matter in which varied
topics are developed and examined. In customer behavior subject, marketing science interacts with
psychology, in resource-based advantage it interacts with engineering, and so on.
In examining business problems related to which strategy should be applied in winning the
competition game has become an interesting debate over time. There are some advantage theories that have
been elaborated by marketing pioneers, including resource advantage theory by Shelby D. Hunt, competitive
advantage theory by Michael E. Porter, and Transient Competitive Advantage theory by Rita Gunther
McGrath. These three theories contribute with insights to different viewpoints of advantage, so that in-depth
analyses are necessary in order to create comprehensive literature reviews related to business activities.
* Corresponding Author:
Jasanta Peranginangin, Ph.D. Marketing, Diponegoro University, Jl.Erlangga Tengah 17th Semarang, Indonesia 50241
Article History: Received 22 August 2015 | Accepted 7 September 2015 | Available Online 10 September 2015
Cite Reference: Peranginangin, J., 2015. A Conceptual Mapping Resource Advantage Theory, Competitive Advantage Theory, and Transient Competitive
Advantage. Expert Journal of Business and Management, 3(2), pp.140-149
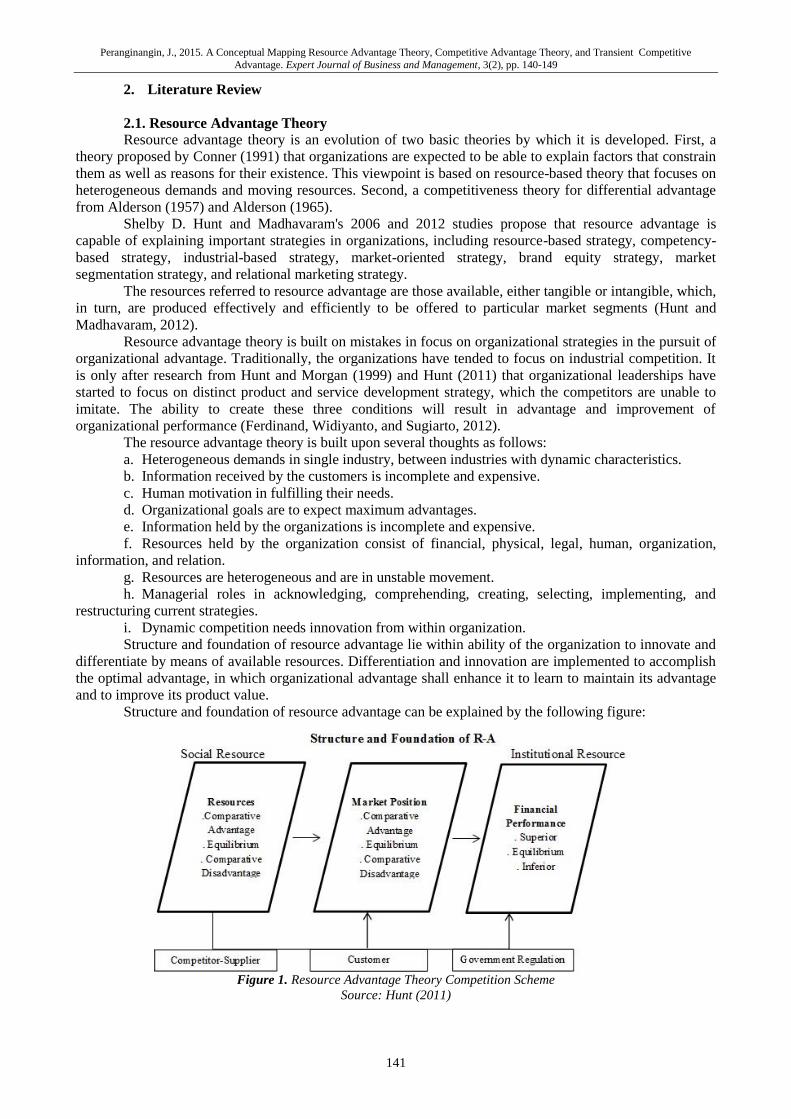
Peranginangin, J., 2015. A Conceptual Mapping Resource Advantage Theory, Competitive Advantage Theory, and Transient Competitive
Advantage. Expert Journal of Business and Management, 3(2), pp. 140-149
141
2. Literature Review
2.1. Resource Advantage Theory
Resource advantage theory is an evolution of two basic theories by which it is developed. First, a
theory proposed by Conner (1991) that organizations are expected to be able to explain factors that constrain
them as well as reasons for their existence. This viewpoint is based on resource-based theory that focuses on
heterogeneous demands and moving resources. Second, a competitiveness theory for differential advantage
from Alderson (1957) and Alderson (1965).
Shelby D. Hunt and Madhavaram's 2006 and 2012 studies propose that resource advantage is
capable of explaining important strategies in organizations, including resource-based strategy, competency-
based strategy, industrial-based strategy, market-oriented strategy, brand equity strategy, market
segmentation strategy, and relational marketing strategy.
The resources referred to resource advantage are those available, either tangible or intangible, which,
in turn, are produced effectively and efficiently to be offered to particular market segments (Hunt and
Madhavaram, 2012).
Resource advantage theory is built on mistakes in focus on organizational strategies in the pursuit of
organizational advantage. Traditionally, the organizations have tended to focus on industrial competition. It
is only after research from Hunt and Morgan (1999) and Hunt (2011) that organizational leaderships have
started to focus on distinct product and service development strategy, which the competitors are unable to
imitate. The ability to create these three conditions will result in advantage and improvement of
organizational performance (Ferdinand, Widiyanto, and Sugiarto, 2012).
The resource advantage theory is built upon several thoughts as follows:
a. Heterogeneous demands in single industry, between industries with dynamic characteristics.
b. Information received by the customers is incomplete and expensive.
c. Human motivation in fulfilling their needs.
d. Organizational goals are to expect maximum advantages.
e. Information held by the organizations is incomplete and expensive.
f. Resources held by the organization consist of financial, physical, legal, human, organization,
information, and relation.
g. Resources are heterogeneous and are in unstable movement.
h. Managerial roles in acknowledging, comprehending, creating, selecting, implementing, and
restructuring current strategies.
i. Dynamic competition needs innovation from within organization.
Structure and foundation of resource advantage lie within ability of the organization to innovate and
differentiate by means of available resources. Differentiation and innovation are implemented to accomplish
the optimal advantage, in which organizational advantage shall enhance it to learn to maintain its advantage
and to improve its product value.
Structure and foundation of resource advantage can be explained by the following figure:
Figure 1. Resource Advantage Theory Competition Scheme
Source: Hunt (2011)
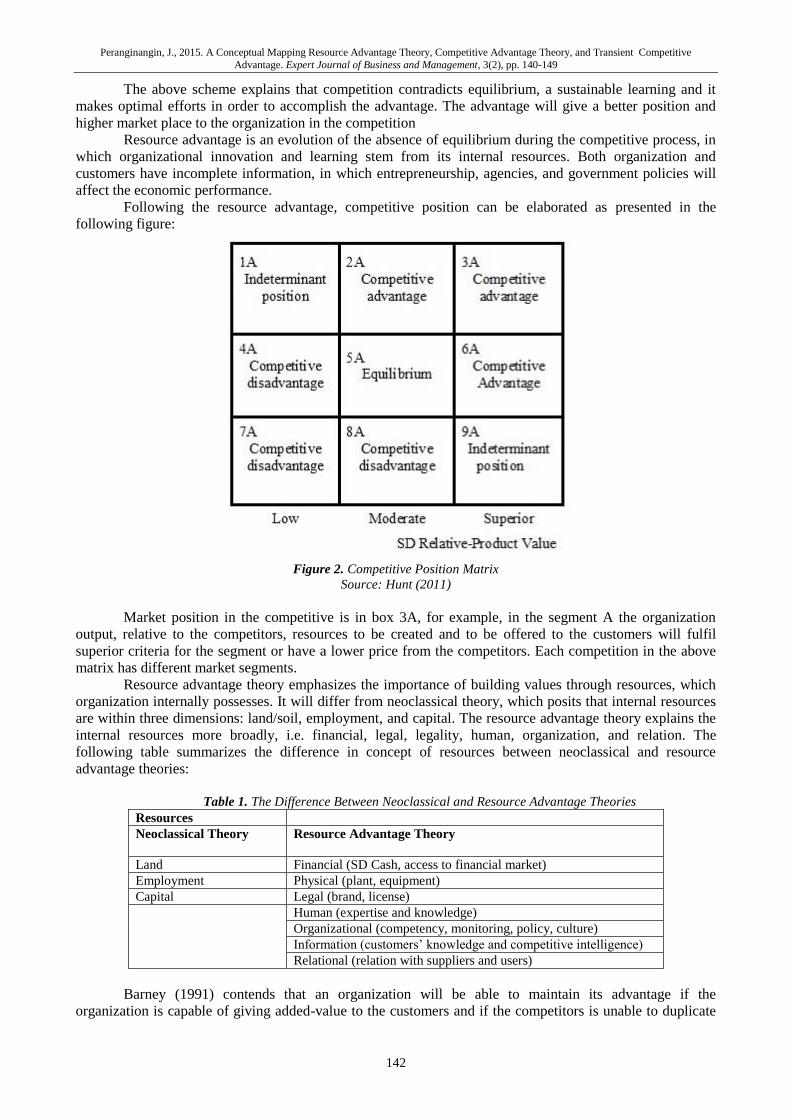
Peranginangin, J., 2015. A Conceptual Mapping Resource Advantage Theory, Competitive Advantage Theory, and Transient Competitive
Advantage. Expert Journal of Business and Management, 3(2), pp. 140-149
142
The above scheme explains that competition contradicts equilibrium, a sustainable learning and it
makes optimal efforts in order to accomplish the advantage. The advantage will give a better position and
higher market place to the organization in the competition
Resource advantage is an evolution of the absence of equilibrium during the competitive process, in
which organizational innovation and learning stem from its internal resources. Both organization and
customers have incomplete information, in which entrepreneurship, agencies, and government policies will
affect the economic performance.
Following the resource advantage, competitive position can be elaborated as presented in the
following figure:
Figure 2. Competitive Position Matrix
Source: Hunt (2011)
Market position in the competitive is in box 3A, for example, in the segment A the organization
output, relative to the competitors, resources to be created and to be offered to the customers will fulfil
superior criteria for the segment or have a lower price from the competitors. Each competition in the above
matrix has different market segments.
Resource advantage theory emphasizes the importance of building values through resources, which
organization internally possesses. It will differ from neoclassical theory, which posits that internal resources
are within three dimensions: land/soil, employment, and capital. The resource advantage theory explains the
internal resources more broadly, i.e. financial, legal, legality, human, organization, and relation. The
following table summarizes the difference in concept of resources between neoclassical and resource
advantage theories:
Table 1. The Difference Between Neoclassical and Resource Advantage Theories
Resources
Neoclassical Theory Resource Advantage Theory
Land Financial (SD Cash, access to financial market)
Employment Physical (plant, equipment)
Capital Legal (brand, license)
Human (expertise and knowledge)
Organizational (competency, monitoring, policy, culture)
Information (customers’ knowledge and competitive intelligence)
Relational (relation with suppliers and users)
Barney (1991) contends that an organization will be able to maintain its advantage if the
organization is capable of giving added-value to the customers and if the competitors is unable to duplicate
Peranginangin, J., 2015. A Conceptual Mapping Resource Advantage Theory, Competitive Advantage Theory, and Transient Competitive
Advantage. Expert Journal of Business and Management, 3(2), pp. 140-149
143
the strategy. The competitive advantage of the organization does not depend on how long it maintains the
advantage, but on the extent to which the organization does not duplicate the other organizations.
According to Zemanek and Pride (1996), an organization has strengths to direct its customers, such
as price, quantity, product line, advertising and promotion, service, stock availability, credit to the customers,
and display. The organization is expected to make the optimal use of its resources in order to maintain the
advantage.
Hunt (2010) establishes that in resource advantage theory the characteristics of the products are
highly heterogeneous, the information is incomplete, and the available resources are also heterogeneous.
Therefore, innovation is necessary to help the organization obtain a better growth, sales, and profit. In
addition, the growth may be obtained by efficiency and effectiveness of the innovation. Organizational
growth occurs in the form innovation:
a. Improving attribute value given by the customers through value-added use.
b. Improving value given to the customers through adding value on resource quality and quantity.
c. Decreasing costs by improving added-value on quality and quantity.
d. Decreasing costs by making better use.
e. Identifying new opportunities to improve growth.
f. Identifying new opportunities for the newly built markets
g. Identifying opportunities to establish new organization and to build resources in the new market.
h. Improving quantity the organization offers through adding value of the quality and quantity the
resources offer.
All these nine innovations will improve performance of the organization in the following forms:
a. Outputs obtained are derived from the pursuit of financial performance.
b. Production output growth proves the existence of the organization.
c. Production output growth is capable of creating new organization.
Gupta (2013), in his research, contends that in order to accomplish business success and advantage
an organization must possess good ability in innovating things that are difficult to be duplicated by
prospective competitors in the future. Wang, Wang, and Liang (2014) explains that successful organizations
have advantages to share knowledge and to possess strong intellectual capital. The advantage an organization
possesses must be improve over time in form of such unique, difficult innovations that the competitors
cannot duplicate.
2.2. Competitive Advantage Theory
Porter (1980) states that to perform the correct strategy, an organization must account for testing the
following consistencies:
a. Internal consistence. The organization must set rational and affordable targets. It also must have
policies that support the target accomplishment, those which empower the overall lines of the organization.
b. Environmental adaptability. Targets and policies to be set must be able to create opportunities and
to adapt with resources relative to competitive challenge. The organization must react timely to the current
environment and to respond to external interests.
c. Resource adjustment. Resource availability must be equal to the competitors’ advantage and the
strategy implementation must be timely to allow the organization to create change.
d. Communication and implementation. Objectives and targets of the organization must be truly
comprehendible by the whole members. There must be a common agreement between the targets and the
policy relative to the strategy implementation. The managers should be able to perform the strategy
efficiently and effectively.
Porter (1990) and R.G McGrath, Tsai, Venkataraman, and MacMillan (1996), propose that
organization is able to accomplish competitive advantage by innovation. The organizational innovation can
be performed by vary methods and technologies. It will give advantages to the organization in many aspects.
Updated strategies and instruments towards multidimensional, either in product, marketing, or
organizational design are necessary. Advantages can be obtained by market exploitation, threats
neutralization, and cost efficiency (Sigalas et al., 2013).
Innovation performed by the organization must exceed the needs of a single segment because
currently the competition is extremely global and transnational. Innovation must fulfil the preference and the
needs of the international society. For example, the need for automobile of Indonesian customers is different
from that of the American customers. Therefore, the organization innovators must be able to bridge or to
mediate this difference in order for the products to fulfil the global needs. Ma (1999) said that a firm
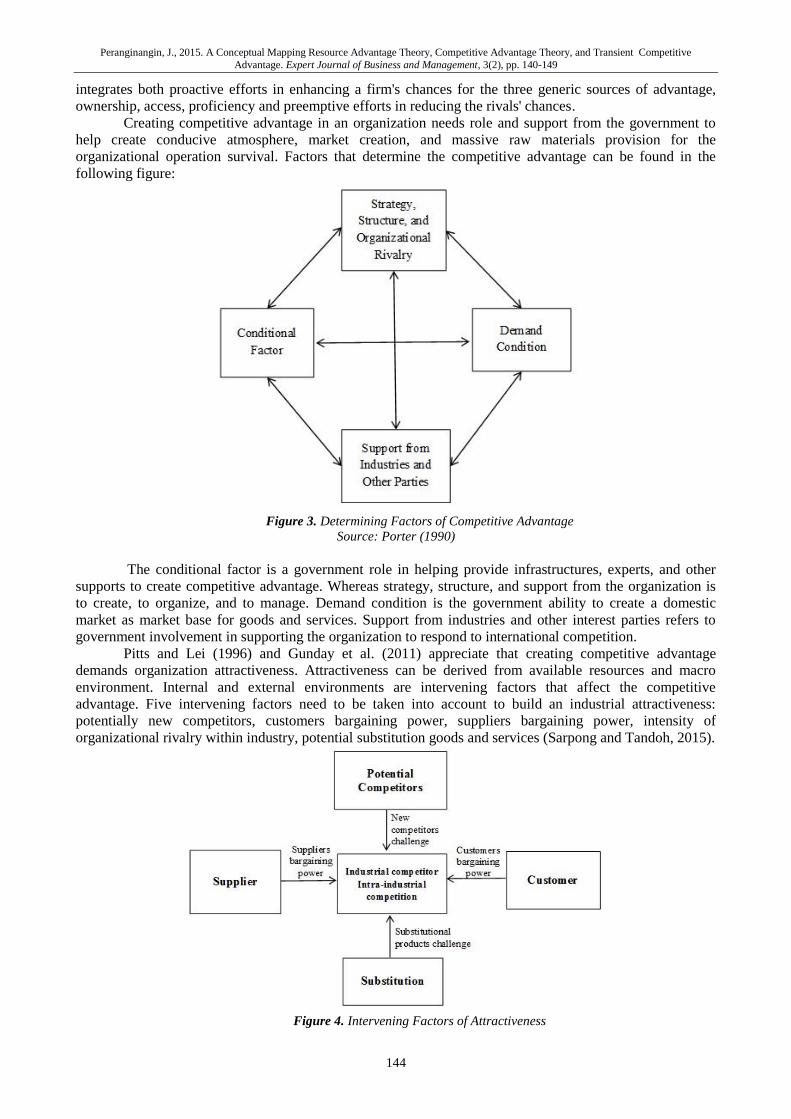
Peranginangin, J., 2015. A Conceptual Mapping Resource Advantage Theory, Competitive Advantage Theory, and Transient Competitive
Advantage. Expert Journal of Business and Management, 3(2), pp. 140-149
144
integrates both proactive efforts in enhancing a firm's chances for the three generic sources of advantage,
ownership, access, proficiency and preemptive efforts in reducing the rivals' chances.
Creating competitive advantage in an organization needs role and support from the government to
help create conducive atmosphere, market creation, and massive raw materials provision for the
organizational operation survival. Factors that determine the competitive advantage can be found in the
following figure:
Figure 3. Determining Factors of Competitive Advantage
Source: Porter (1990)
The conditional factor is a government role in helping provide infrastructures, experts, and other
supports to create competitive advantage. Whereas strategy, structure, and support from the organization is
to create, to organize, and to manage. Demand condition is the government ability to create a domestic
market as market base for goods and services. Support from industries and other interest parties refers to
government involvement in supporting the organization to respond to international competition.
Pitts and Lei (1996) and Gunday et al. (2011) appreciate that creating competitive advantage
demands organization attractiveness. Attractiveness can be derived from available resources and macro
environment. Internal and external environments are intervening factors that affect the competitive
advantage. Five intervening factors need to be taken into account to build an industrial attractiveness:
potentially new competitors, customers bargaining power, suppliers bargaining power, intensity of
organizational rivalry within industry, potential substitution goods and services (Sarpong and Tandoh, 2015).
Figure 4. Intervening Factors of Attractiveness
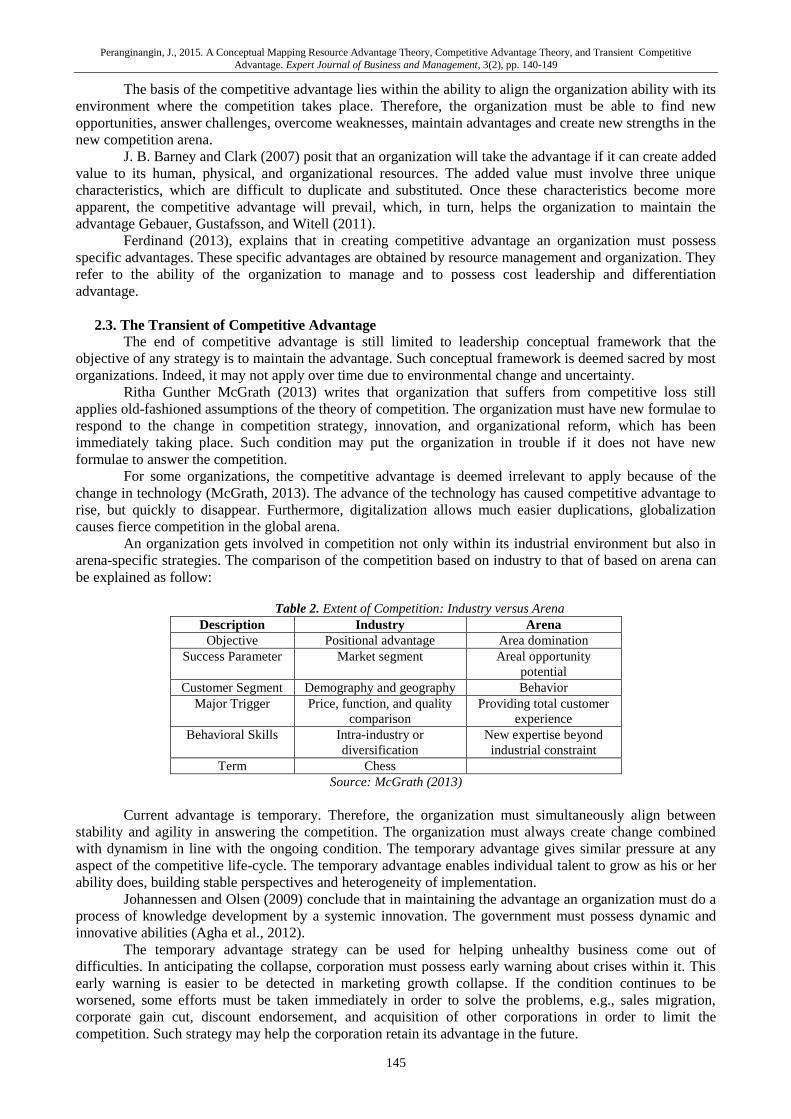
Peranginangin, J., 2015. A Conceptual Mapping Resource Advantage Theory, Competitive Advantage Theory, and Transient Competitive
Advantage. Expert Journal of Business and Management, 3(2), pp. 140-149
145
The basis of the competitive advantage lies within the ability to align the organization ability with its
environment where the competition takes place. Therefore, the organization must be able to find new
opportunities, answer challenges, overcome weaknesses, maintain advantages and create new strengths in the
new competition arena.
J. B. Barney and Clark (2007) posit that an organization will take the advantage if it can create added
value to its human, physical, and organizational resources. The added value must involve three unique
characteristics, which are difficult to duplicate and substituted. Once these characteristics become more
apparent, the competitive advantage will prevail, which, in turn, helps the organization to maintain the
advantage Gebauer, Gustafsson, and Witell (2011).
Ferdinand (2013), explains that in creating competitive advantage an organization must possess
specific advantages. These specific advantages are obtained by resource management and organization. They
refer to the ability of the organization to manage and to possess cost leadership and differentiation
advantage.
2.3. The Transient of Competitive Advantage
The end of competitive advantage is still limited to leadership conceptual framework that the
objective of any strategy is to maintain the advantage. Such conceptual framework is deemed sacred by most
organizations. Indeed, it may not apply over time due to environmental change and uncertainty.
Ritha Gunther McGrath (2013) writes that organization that suffers from competitive loss still
applies old-fashioned assumptions of the theory of competition. The organization must have new formulae to
respond to the change in competition strategy, innovation, and organizational reform, which has been
immediately taking place. Such condition may put the organization in trouble if it does not have new
formulae to answer the competition.
For some organizations, the competitive advantage is deemed irrelevant to apply because of the
change in technology (McGrath, 2013). The advance of the technology has caused competitive advantage to
rise, but quickly to disappear. Furthermore, digitalization allows much easier duplications, globalization
causes fierce competition in the global arena.
An organization gets involved in competition not only within its industrial environment but also in
arena-specific strategies. The comparison of the competition based on industry to that of based on arena can
be explained as follow:
Table 2. Extent of Competition: Industry versus Arena
Description Industry Arena
Objective Positional advantage Area domination
Success Parameter Market segment Areal opportunity
potential
Customer Segment Demography and geography Behavior
Major Trigger Price, function, and quality
comparison
Providing total customer
experience
Behavioral Skills Intra-industry or
diversification
New expertise beyond
industrial constraint
Term Chess
Source: McGrath (2013)
Current advantage is temporary. Therefore, the organization must simultaneously align between
stability and agility in answering the competition. The organization must always create change combined
with dynamism in line with the ongoing condition. The temporary advantage gives similar pressure at any
aspect of the competitive life-cycle. The temporary advantage enables individual talent to grow as his or her
ability does, building stable perspectives and heterogeneity of implementation.
Johannessen and Olsen (2009) conclude that in maintaining the advantage an organization must do a
process of knowledge development by a systemic innovation. The government must possess dynamic and
innovative abilities (Agha et al., 2012).
The temporary advantage strategy can be used for helping unhealthy business come out of
difficulties. In anticipating the collapse, corporation must possess early warning about crises within it. This
early warning is easier to be detected in marketing growth collapse. If the condition continues to be
worsened, some efforts must be taken immediately in order to solve the problems, e.g., sales migration,
corporate gain cut, discount endorsement, and acquisition of other corporations in order to limit the
competition. Such strategy may help the corporation retain its advantage in the future.
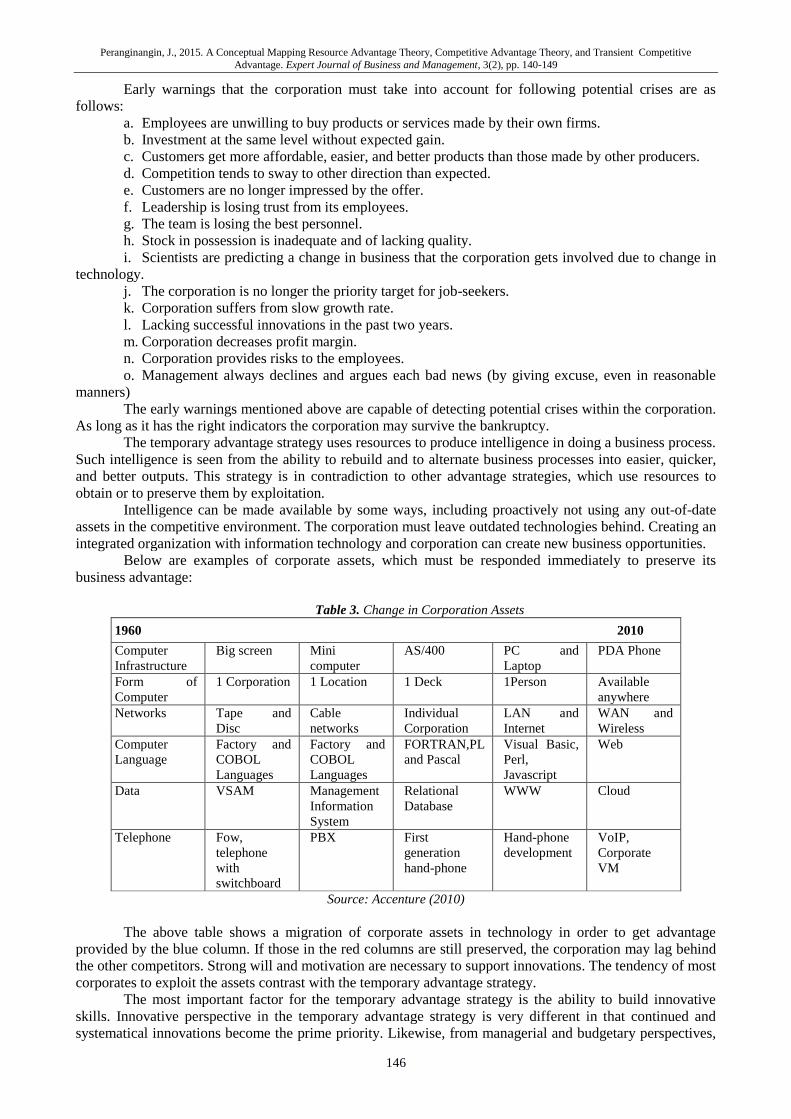
Peranginangin, J., 2015. A Conceptual Mapping Resource Advantage Theory, Competitive Advantage Theory, and Transient Competitive
Advantage. Expert Journal of Business and Management, 3(2), pp. 140-149
146
Early warnings that the corporation must take into account for following potential crises are as
follows:
a. Employees are unwilling to buy products or services made by their own firms.
b. Investment at the same level without expected gain.
c. Customers get more affordable, easier, and better products than those made by other producers.
d. Competition tends to sway to other direction than expected.
e. Customers are no longer impressed by the offer.
f. Leadership is losing trust from its employees.
g. The team is losing the best personnel.
h. Stock in possession is inadequate and of lacking quality.
i. Scientists are predicting a change in business that the corporation gets involved due to change in
technology.
j. The corporation is no longer the priority target for job-seekers.
k. Corporation suffers from slow growth rate.
l. Lacking successful innovations in the past two years.
m. Corporation decreases profit margin.
n. Corporation provides risks to the employees.
o. Management always declines and argues each bad news (by giving excuse, even in reasonable
manners)
The early warnings mentioned above are capable of detecting potential crises within the corporation.
As long as it has the right indicators the corporation may survive the bankruptcy.
The temporary advantage strategy uses resources to produce intelligence in doing a business process.
Such intelligence is seen from the ability to rebuild and to alternate business processes into easier, quicker,
and better outputs. This strategy is in contradiction to other advantage strategies, which use resources to
obtain or to preserve them by exploitation.
Intelligence can be made available by some ways, including proactively not using any out-of-date
assets in the competitive environment. The corporation must leave outdated technologies behind. Creating an
integrated organization with information technology and corporation can create new business opportunities.
Below are examples of corporate assets, which must be responded immediately to preserve its
business advantage:
Table 3. Change in Corporation Assets
1960 2010
Computer
Infrastructure
Big screen Mini
computer
AS/400 PC and
Laptop
PDA Phone
Form of
Computer
1 Corporation 1 Location 1 Deck 1Person Available
anywhere
Networks Tape and
Disc
Cable
networks
Individual
Corporation
LAN and
Internet
WAN and
Wireless
Computer
Language
Factory and
COBOL
Languages
Factory and
COBOL
Languages
FORTRAN,PL
and Pascal
Visual Basic,
Perl,
Javascript
Web
Data VSAM Management
Information
System
Relational
Database
WWW Cloud
Telephone Fow,
telephone
with
switchboard
PBX First
generation
hand-phone
Hand-phone
development
VoIP,
Corporate
VM
Source: Accenture (2010)
The above table shows a migration of corporate assets in technology in order to get advantage
provided by the blue column. If those in the red columns are still preserved, the corporation may lag behind
the other competitors. Strong will and motivation are necessary to support innovations. The tendency of most
corporates to exploit the assets contrast with the temporary advantage strategy.
The most important factor for the temporary advantage strategy is the ability to build innovative
skills. Innovative perspective in the temporary advantage strategy is very different in that continued and
systematical innovations become the prime priority. Likewise, from managerial and budgetary perspectives,
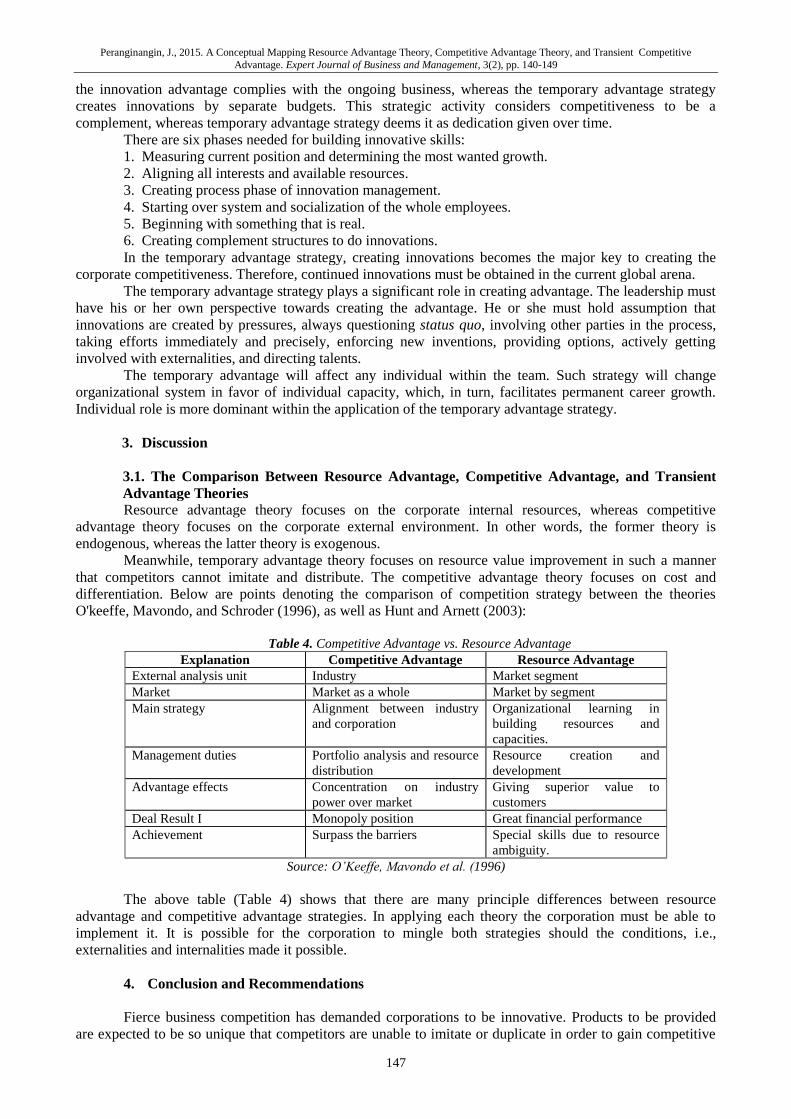
Peranginangin, J., 2015. A Conceptual Mapping Resource Advantage Theory, Competitive Advantage Theory, and Transient Competitive
Advantage. Expert Journal of Business and Management, 3(2), pp. 140-149
147
the innovation advantage complies with the ongoing business, whereas the temporary advantage strategy
creates innovations by separate budgets. This strategic activity considers competitiveness to be a
complement, whereas temporary advantage strategy deems it as dedication given over time.
There are six phases needed for building innovative skills:
1. Measuring current position and determining the most wanted growth.
2. Aligning all interests and available resources.
3. Creating process phase of innovation management.
4. Starting over system and socialization of the whole employees.
5. Beginning with something that is real.
6. Creating complement structures to do innovations.
In the temporary advantage strategy, creating innovations becomes the major key to creating the
corporate competitiveness. Therefore, continued innovations must be obtained in the current global arena.
The temporary advantage strategy plays a significant role in creating advantage. The leadership must
have his or her own perspective towards creating the advantage. He or she must hold assumption that
innovations are created by pressures, always questioning status quo, involving other parties in the process,
taking efforts immediately and precisely, enforcing new inventions, providing options, actively getting
involved with externalities, and directing talents.
The temporary advantage will affect any individual within the team. Such strategy will change
organizational system in favor of individual capacity, which, in turn, facilitates permanent career growth.
Individual role is more dominant within the application of the temporary advantage strategy.
3. Discussion
3.1. The Comparison Between Resource Advantage, Competitive Advantage, and Transient
Advantage Theories
Resource advantage theory focuses on the corporate internal resources, whereas competitive
advantage theory focuses on the corporate external environment. In other words, the former theory is
endogenous, whereas the latter theory is exogenous.
Meanwhile, temporary advantage theory focuses on resource value improvement in such a manner
that competitors cannot imitate and distribute. The competitive advantage theory focuses on cost and
differentiation. Below are points denoting the comparison of competition strategy between the theories
O'keeffe, Mavondo, and Schroder (1996), as well as Hunt and Arnett (2003):
Table 4. Competitive Advantage vs. Resource Advantage
Explanation Competitive Advantage Resource Advantage
External analysis unit Industry Market segment
Market Market as a whole Market by segment
Main strategy Alignment between industry
and corporation
Organizational learning in
building resources and
capacities.
Management duties Portfolio analysis and resource
distribution
Resource creation and
development
Advantage effects Concentration on industry
power over market
Giving superior value to
customers
Deal Result I Monopoly position Great financial performance
Achievement Surpass the barriers Special skills due to resource
ambiguity.
Source: O’Keeffe, Mavondo et al. (1996)
The above table (Table 4) shows that there are many principle differences between resource
advantage and competitive advantage strategies. In applying each theory the corporation must be able to
implement it. It is possible for the corporation to mingle both strategies should the conditions, i.e.,
externalities and internalities made it possible.
4. Conclusion and Recommendations
Fierce business competition has demanded corporations to be innovative. Products to be provided
are expected to be so unique that competitors are unable to imitate or duplicate in order to gain competitive
Peranginangin, J., 2015. A Conceptual Mapping Resource Advantage Theory, Competitive Advantage Theory, and Transient Competitive
Advantage. Expert Journal of Business and Management, 3(2), pp. 140-149
148
value. Changes in perspectives are necessary. The most important effort relates to human development
supported by dynamic resources.
Development of strategic assets must be in line with human resource development. The corporate
executives must consider human resource as an intellectual capital. To win the competition, the corporation
must be able to give birth to intelligence, sales migration, and strategic alliance with continued and
systematical innovations.
Below are capacities the corporation must possess to be effectively exploiting its potentials:
1. Quick adaptation
2. multi-line differentiation
3. product and service innovation, and
4. Timeliness in taking any measure or action.
Consideration of the correct data and business intuition has been obtained.
References
Agha, S., Alrubaiee, L. and Jamhour, M., 2012. Effect of Core Competence on Competitive Advantage and
Organizational Performance. International Journal of Business and Management, 7(1), pp.192-204
Alderson, W., 1957. Marketing Behavior and Executive Action: A Function-alist Approach to Marketing
Theory. Home-wood, IL: Richard D. Irwin, Inc.
Alderson, W. 1965. Dynamic Marketing Behavior: A Functionalist Theory of Marketing. Homewood, IL:
Richard D. Irwin, Inc.
Barney, J. 1991. Firm Resources and Sustained Competitive Advantage. Journal of Management, 17(1),
pp.99-120.
Barney, J. B. and Clark, D. N., 2007. Resource-Based Theory : Creating and Sustaining Competitive
Advantage. New York: Oxford University Press Inc.
Conner, K. R., 1991. A Historical Comparison of Resource Based Theory and Five Schools of Thought
Within and Industrial Organization Economics : Do We Have a New Theory of the Firm ? Journal
of Management, 17(1), pp.121 - 154.
Ferdinand, A. T., 2013. Company Specific Advantage and Sustainable Competitive Advantage [online]
Available online at: http://papers.ssrn.com/sol3/papers.cfm?abstract_id=2340249 [Accessed on May
22, 2015]
Ferdinand, A.T., Widiyanto, I. and Sugiarto, Y., 2012. Readings In Theory Of Marketing And
Entrepreneurship. Semarang: Universitas Diponegoro.
Gebauer, H., Gustafsson, A. and Witell, L., 2011. Competitive Advantage Through Service Differentiation
by Manufacturing Companies. Journal of Business Research, 64(12), pp.1270-1280. doi:
10.1016/j.jbusres.2011.01.015
Gunday, G., Ulusoy, G., Kilic, K. and Alpkan, L., 2011. Effects of Innovation Types on Firm Performance.
International Journal of Production Economics, 133(2), pp.662-676. doi: 10.1016/j.ijpe.2011.05.014
Gupta., 2013. Core Competencies for Business Excellence. Advances In Management, Vol. 6 (10), pg. 11-15.
Hunt, S. D., 2010. Sustainable Marketing, Equity, and Economic Growth : A Resource Advantage,
Economic Freedom Approach. Academy Of Marketing Science, 39(1), pp.7-20.
Hunt, S. D., 2011. Developing Successful Theories In Marketing: Insights From Resource Advantage
Theory. Academy of Marketing Science Journal, 1(2), pp.72-84.
Hunt, S. D. and Arnett, D. B., 2003. Resource Advantage Theory and Embeddedness : Explaining R-A
Theory's Explanatory Success. Journal of Marketing Theory and Practice, 11(1), pp.1-17.
Hunt, S. D. and Madhavaram, S., 2006. Teaching Marketing Strategy : Using Resource-Advantage Theory
as an Integrative Theoretical Foundation. Journal of Marketing Education, 28, pp93-105.
Hunt, S. D. and Madhavaram, S., 2012. Managerial Action and Resource Advantage Theory: Conceptual
Frameworks Emanating From A Positive Theory of Competition. Journal of Business & Industrial
Marketing, 27(7), pp.582-591. doi: 10.1108/08858621211257356
Hunt, S. D. and Morgan, R. M., 1999. The resource-advantage theory of competition: Dynamics, path
dependencies, and evolutionary dimension. Journal of Marketing, vol. 60, 4, pp.107-114.
Jaw, Y.-L. and Lee, G. J., 2007. The Development of The Philosophy of Marketing Science. Proceedings of
the 51st Annual Meeting of the, ISSS - 2007, p.61-78.
Johannessen, J. A. and Olsen, B., 2009. Systemic Knowledge Processes, Innovation and Sustainable
Competitive Advantages. Kybernetes, 38(3/4), pp. 559-580.
Peranginangin, J., 2015. A Conceptual Mapping Resource Advantage Theory, Competitive Advantage Theory, and Transient Competitive
Advantage. Expert Journal of Business and Management, 3(2), pp. 140-149
149
Ma, H., 1999. Creation and Preemption For Competitive Advantage. Management Decision, 37(3), pp.259-
266.
McGrath, R. G., 2013. The End of Competitive Advantage. Harvard Business Review.
McGrath, R. G., Tsai, M., Venkataraman, S. and MacMillan, I. C., 1996. Innovation, Competitive Advantage
and Rent: A Model and Test. Management Science, vol. 42(3), pp.389-403.
O'Keeffe, M., Mavondo, F. and Schroder, W., 1996. The Resource Advantage Theory of Competition:
Implication for Australian Competition. Monash Unversity Agriculture Research Unit [online]
Available online at: https://www.agrifood.info/perspectives/1998/OKeeffe.pdf [Accessed on May
22, 2015]
Pitts, R. A. and Lei, D., 1996. Strategic Management : Building and Sustaining Competitive Advantage. NY,
USA: West Publishing Company.
Porter, M. E., 1980. Competitive Strategy: Techniques For Analyzing Industries and Competitors. New
York: The Free Press.
Porter, M. E., 1990. The Competitive Advantage of Nations. Harvard Business Review, March-April.
[online] Available online at: https://hbr.org/1990/03/the-competitive-advantage-of-nations [Accessed
on May 22, 2015]
Sarpong, L. and Tandoh, I., 2015. The Role of Strategy in a Competitive Business Environment: A Case
Study of Ecobank Ghana Limited. European Journal of Business and Management, 7(11), pp.71-84.
Shaw, E. H. and Jones, D. G. B., 2005. A Historical of Schools of Marketing Thought. Marketing Theory, 5
(3), pp.239-281
Sigalas, C., Economou, V. P. and Georgopoulos, N. B., 2013. Developing A Measure of Competitive
Advantage. Journal of Strategy and Management, 6 (4), pp.320-342.
Wang, Z., Wang, N. and Liang, H., 2014. Knowledge Sharing, Intellectual Capital and Firm Performance.
Management Decision, 52(2), pp.230-258. doi: 10.1108/md-02-2013-0064
Zemanek, J. E. and Pride, W. M., 1996. Distinguishing Between Manufacturer Power and Manufacturer
Salesperson Power. The Journal of Business and Industrial Marketing, 11(2), pp.20-36.
Expert Journal of Business and Management, Volume 3, Issue 2, pp. 150-165, 2015
© 2015 The Author. Published by Sprint Investify. ISSN 2344-6781
http://Business.ExpertJournals.com
150
Remodeling Strategic Staff Safety and Security
Risks Management in Nigerian Tertiary
Institutions
Sunday S. AKPAN* and Issac A. AYANDELE
University of Uyo, Nigeria
This paper examined safety and security risk management in tertiary institutions in
Nigeria. The frequent attacks at workplace, especially schools, have placed safety
and security in the front burner of discussion in both business and political circles.
This therefore, forms the imperative for the conduct of this study. The work adopted
a cross sectional survey research design and collected data from respondents who
are security personnel of the University of Uyo. Analysis of data was done with
simple percentage statistics while the research hypotheses were tested with mean
and simple regression and correlation statistics. The findings of the study revealed
that assassination, kidnappings and bombings were principal risk incidents
threatening the safety and security of staff in University of Uyo. A significant
positive relationship was found between the funding of security management and
workers’ performance. It was discovered specifically that employment screening,
regular training of security personnel, regular safety and security meetings and
strategic security policy formation were the main strategies for managing safety
and security in University of Uyo. The paper concluded that safety and security
management and control involves every worker (management and staff) of
University of Uyo. It was recommended, among others, that management should be
more committed to safety and security management in the University by means of
making safety and security issues an integral part of University’s strategic plan and
also by adopting the management line model – one form of management structure-
where safety and security are located, with other general management
responsibilities. This way, the resurgent cases of kidnapping, hired assassination,
etc. would be reduced if not completely eradicated in the University.
Keywords: staff safety, staff security, risk management, organizational performance
JEL Classification: M10, M14
* Corresponding Author:
Sunday S. Akpan, Department of Insurance, University of Uyo, Nigeria, T/P: +2348032196839
Article History: Received 15 August 2015 | Accepted 29 September 2015 | Available Online 18 October 2015
Cite Reference: Akpan, S.S., Ayandele, I.A., 2015. Remodeling Strategic Staff Safety and Security Risks Management in Nigerian Tertiary Institutions. Expert
Journal of Business and Management, 3(2), pp.150-165
Akpan, S.S., Ayandele, I.A., 2015. Remodeling Strategic Staff Safety and Security Risks Management in Nigerian Tertiary Institutions. Expert
Journal of Business and Management, 3(2), pp.150-165
151
1. Introduction
1.1. General Outlook
Cases of workplace safety and insecurity have assumed a global status and have posed great
challenge to management of organisations. These developments are considered a rising omen in the
workplace and are deemed to have defiled all conventional management strategies. Consequently there is a
renewed awareness regarding safety and security which according to Belilos (2001) have taken precedence
over all other subjects since the terrible tragedies of September 11, 2001, in New York, Washington D. C.;
and Pennsylvania, which cost thousands of lives. While it is not realistic to believe that employees can be
insulated from all potential threats to their safety or security, effective Human Resource Managers should
take steps to help minimize these threats. From moral perspective, employers certainly have a responsibility
to provide workers with a worksite that is as free from threatening conditions as it can reasonably be. From a
legal perspective, the Occupational Safety and Health Acts of 1970 require that employers address safe and
healthful working conditions. Specifically, the law requires employers to provide their employees with a
place of employment that is free from recognizable hazards that are causing or are likely to cause death or
serious physical harm to employees, as well as the exposure at which no worker will suffer diminished
health, functional capacity, or life expectancy as a result of his or her work experience. The moral and legal
taking on safety and security are pointers to how important a safe and secured work environment is to
organizational growth and development.
According to Bertini (2000), good, safe and secured workplace bring a lot of improvements to
organization in term of healthy and sustained operations that result in improved profit, organisational and
operational efficiency, employee satisfaction with appertained effect of improved customer satisfaction all of
which ultimately lead to organizational growth and development. In support of this opinion, Kiruja, Eirik and
Sicko (2011) said good security management is about good program management: Proactively managing
risks and being better positioned to deal with crises enables us to work safety and securely. This benefits our
staff, beneficiaries, and other stakeholders. The inference here is that safety and security of personnel in an
organisation are factor that can engender organizational growth. It follows that any organization that graves
for growth and development should, in addition to managing other resources of the organization, also strive
to ensure that employees work in a safe and secured environment. In recognition of the importance of safety
and security Barabant (2001) has this to say:
“The security and safety of…..staff is of growing concern to managers of… organisations and their
‘stakeholders’. The fact that organisations increasingly find themselves working in violent environments, and
particularly the perception that they are being targeted, has given rise to a range of internal measures, as
well as inter-organisational initiatives; After an initial emphasis on security (acts of violence), staff safety
(accidents and health) is attracting renewed attention.”
In view of the above, an employer therefore has more responsibility than hiring people to do their
job. They must ensure that those hired, work in safe and secured environment otherwise the organization will
not perform effectively. This is true because in Sheik’s (2000) opinion, as soon as employees feel that their
superiors are disinterested in their work environment, they also lose passion for their work; when this
happens, the entire workforce of a business collapse”. Therefore, Safety and security in every business
should be taken seriously. It is not a gainsaying that unless management shows interest in the safety and
security of employees, the latter group also ceases to pay attention to important details that may become
crucial to the success of the organization.
There is great benefit for organizations to provide a safe and secured workplace for its workforce.
According to Barabant (2001), there is indeed an incompressible element of risk in organisation’s work, but
good security management is also a tool to help organization enter and remain in business irrespective of the
risk involved, after all business is not devoid of risk. The loss of staff and assets, either through accident or
incident, actually makes it more difficult for an organization to carry out its fundamental task. Organisations
which are generally committed to safety and security management tend to have a culture of care for its staff,
a commitment to competence and professionalism and a commitment to being a learning organization. The
importance of the attitude of the director of the organization cannot be underestimated: “safety and security
does not start with the type of staff member you recruit, it starts with the type of Chief Executive Officer you
recruit’, (Barabant, 2001).
In view of the importance of having good safe and secured workplace there is need to find out how
management of the university of Uyo has been handling the threat to workers safety and security on all the
campuses of the university. In this study therefore, the researchers envisages a thorough discussion of
Akpan, S.S., Ayandele, I.A., 2015. Remodeling Strategic Staff Safety and Security Risks Management in Nigerian Tertiary Institutions. Expert
Journal of Business and Management, 3(2), pp.150-165
152
measures that management can adopt to ensure that safety and security of their staff at workplace are given
paramount attention.
1.2. Statement of the Problem
Safety and security of personnel are today serious management challenges. Part of these challenges
is due to apparent lack of definitive clarity between the concept of safety and security which has, often times,
led to conceptual misunderstanding, misapplications and mismanagement. Acknowledging this conceptual
confusion and its appertained devastative effect on organizations, Baratant (2001) explained thus:
“…yet there is confusion between security management, and safety management. Organisations are
responsible for the safety and security of their staff. Both can be subsumed under the concept of ‘risk
management’. But while there is significant overlap between measures to improve safety and measures to
improve security, the two are not identical, and focusing on one at the expense of the other leaves dangerous
omissions.”
As an allusion to the above excerpt, many organisations in their bit to tackling source of threats to
safety and security at workplace and to the overall organizational performance, do often give much attention
to one risk management dimension, for instance security alone, with less emphasis on safety or otherwise.
The most common argument has been that safety and security risks are an integral part of organisation’s
work; and that, organisations have been managing them for decades with existing tools and competences, so
there is no need for additional or new measures (Baratant, 2001).
The above argument reveals dangerous and problematic assumptions that risk is static and cannot be
reduced through any new measure. These assumptions go against the available evidence and realities, which
is the fact that risk incidents are becoming more frequent (Barabant, 2001). Also, organisations are currently
working in dangerous, volatile, risk-prone environments and the supposed ‘immunity’ of the organizational
staff seem to decline.
Another problem is the often misused concept of safety to sometimes mean security in our daily
activities such that these twin concepts are either not given proper attention or they are simply overlooked on
account of the fact that their mentioning poses no serious threat or make no significant grievous sound in the
organization. Whether management has taken bold steps to address these issues or not is a contentious issue.
This contention is due to the fact that current hazards in Nigerian Universities are on the increase (Williams,
2012). It is becoming worrisome and most unfortunately so because staff safety and security appear to be left
on the back burner until crisis occurs, at which time, people had fallen victim to crimes, get robbed,
assaulted, and become sick or die (Barabant, 2001). This study therefore investigates how staff safety and
security are managed in the University of Uyo with a view to suggest appropriate strategies to achieve a safe
and secured workplace.
1.3. Objective of the Study
The main objectives of this research is to examine safety and security of personnel at workplace and
how management or employers of labour have handled these issues strategically in the face of limited
organizational resources. Specific objectives are to:
i. find out if bombing, assault, corruption, kidnapping, organized crime, appliances/gadgets,
machineries/equipment and, building are sources of safety and security threats to University of Uyo.
ii. find out the opinion of security personnel concerning managements’ commitment to safety and
security management in University of Uyo.
iii. find out the relationship between safety, security management and staff performance in University of
Uyo
iv. find out if good management structure, command principle, meetings, funding, threat assessment,
physical survey, employment screening, and operations planning are not effective strategies for effective
staff safety and security management in the University of Uyo.
1.4. Hypotheses
To guide the conduct of this study, four research hypotheses were developed. The null form these
hypotheses are as stated below:
i. Bombing, assault, corruption, kidnapping, organized crime, appliances/ gadgets, machineries/
equipment and, building are not sources of safety and security threats to University of Uyo.
ii. Management’s committed to safety and security management in University of Uyo is insignificant.
iii. There is no significant relationship between safety and security management and staff performance
in University of Uyo.
Akpan, S.S., Ayandele, I.A., 2015. Remodeling Strategic Staff Safety and Security Risks Management in Nigerian Tertiary Institutions. Expert
Journal of Business and Management, 3(2), pp.150-165
153
iv. Good management structure, command principles, meetings, funding, threat assessment, physical
survey, employment, screening, and operations planning not effective strategies for effective staff safety and
security management in the University of Uyo
2. Literature Review
The concepts of safety and security at workplace have received several attentions from both the
academics and the industrialists. This is to say that these concepts are not only limited to organisations but
also extends to the field of study and perhaps in a more debatable academic and industrial investigation. But
it is regrettable that the concepts of safety and security have been misconstrued to be synonymous rather than
inextricably related concepts that must be clearly distinguished and compared for proper understanding.
2.1. Safety and Security: Conceptual Distinctions and Issues
There are two slightly different meanings of safety and security. For example, home safety may
indicate building’s ability to protect against external harm events (such as weather, home invasion, etc.), or
may indicate that its internal installations (such as appliance, stair, etc) are safe (not dangerous or harmful)
for its inhabitants. Discussion of safety often includes mention of related terms. Security is such a term. With
time, the distinction between these two have often become interchanged, equated, and frequently appear
juxtaposed in the same sentence. Readers unfortunately are left to decide whether they comprise a
redundancy. This confuses the uniqueness that should be reserved for each by itself. When seen as unique, as
we intend here, each term will assume its rightful place in influencing and being influenced by the other.
According to Milan-Perez (2003):
“Safety is the condition of a “steady state” of an organization or place doing what is supposed to do.
“What it is supposed to do” is defined in terms of public codes and standards, associated architectural and
engineering designs, corporate vision and mission statements, and operational plans and personnel policies.
For any organization, place, or function, large or small, safety is a normative concept. It complies with
situation-specific definitions of what is expected and acceptable.”
Using this definition, protection from a home’s external threats and protection from its internal
structural and equipment failures are not two types of safety but rather two aspects of a home’s steady state.
In the world of everyday affairs, not all goes as planned. Some entity’s steady state is challenged. This is
where security science, which is of more recent date, enters. Drawing from the definition of safety, then:
“security is the process or means, physical or human, of delaying, preventing, or protecting against external
or internal defects, dangers, loss, criminals, and other individuals or actions that threaten, hinder or destroy
an organisation’s “steady state”, and deprive it of its intended purpose for being” (Milam-Perez, 2003).
Using this generic definition of safety it is possible to specify the elements of a security program by looking
at safety and security issues in organizations.
In human resource literatures, experts such as Van Brabant (2000, 1998), Davidson and Neal (1998),
Jensen (1999) and Macnair (1995) among others, have highlighted security issues in organisations as
encompassing areas such as security of the property itself, company assets, employees’ and customers’
personal belongings and valuables, life security, personal security, and job security (not covered here
because this latter relates to income security), among others. Similarly, safety issues in organization relate to
the structure itself, installations and fixtures (electrical, plumbing, air-conditioning and other installations),
public and work areas (e.g. slippery floors, hazardous obstacles in traffic areas), safety of furniture,
equipment, appliances, and utensils as well as health safety (nontoxic cleaning material and detergents used)
and good quality air (what we breathe, dependent upon the type of equipment, installations and fixtures used,
and regular repairs and maintenance).
Inferentially, the centre piece of safety issues in an organization is workplace accident and diseases
which is more of internal and external risk exposures while that of security is workplace violence which is
more of external than internal risk exposures. Implicitly therefore, there would not be a case of security
without the mentioning of safety in an organizational setting. This is because these two concepts are so
interwoven such that distinguishing and treating them separately become difficult and inappropriate within
an organization’s risk management framework. The most important point to note in the discussion of security
and safety issues in an organization is that, both concept fall within the framework of risk apprehension and
management.
The external risk exposures asserted to be appertained to security issues in organizations is linked to
Brabant’s (2001) corporate security. This security concept has connotations of site protection, protection of
confidential corporate information, VIP protection of executives (for example against kidnapping or
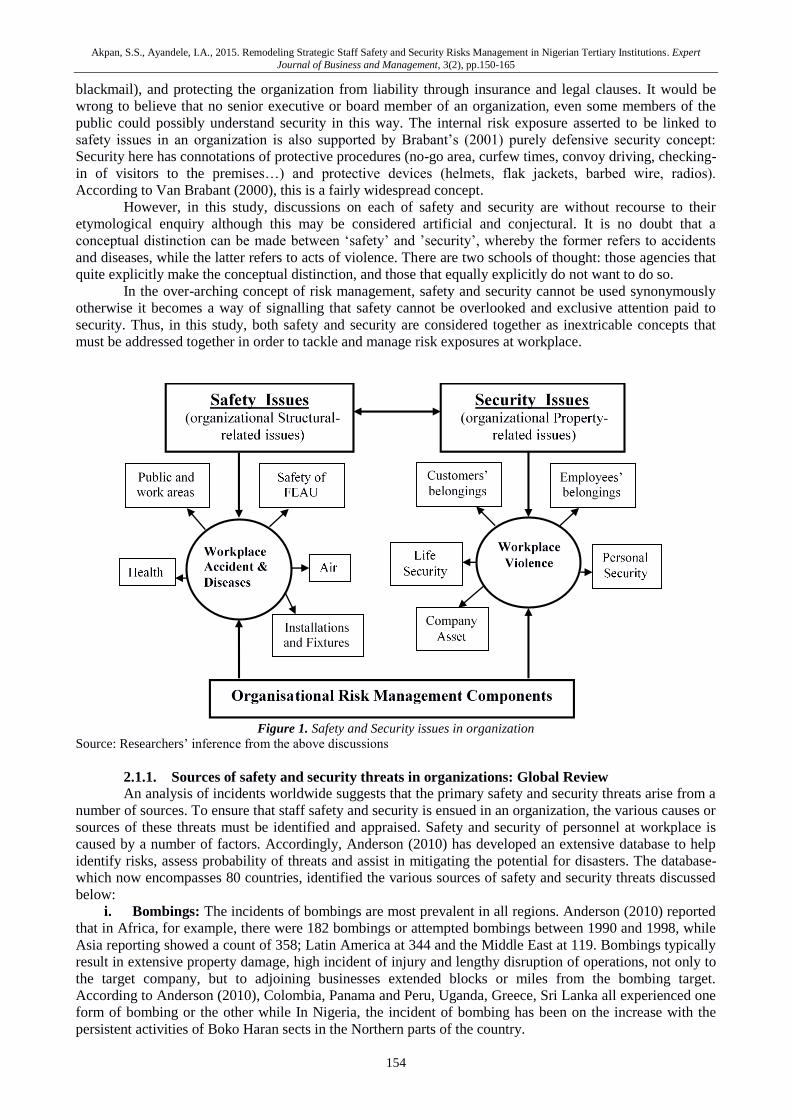
Akpan, S.S., Ayandele, I.A., 2015. Remodeling Strategic Staff Safety and Security Risks Management in Nigerian Tertiary Institutions. Expert
Journal of Business and Management, 3(2), pp.150-165
154
blackmail), and protecting the organization from liability through insurance and legal clauses. It would be
wrong to believe that no senior executive or board member of an organization, even some members of the
public could possibly understand security in this way. The internal risk exposure asserted to be linked to
safety issues in an organization is also supported by Brabant’s (2001) purely defensive security concept:
Security here has connotations of protective procedures (no-go area, curfew times, convoy driving, checking-
in of visitors to the premises…) and protective devices (helmets, flak jackets, barbed wire, radios).
According to Van Brabant (2000), this is a fairly widespread concept.
However, in this study, discussions on each of safety and security are without recourse to their
etymological enquiry although this may be considered artificial and conjectural. It is no doubt that a
conceptual distinction can be made between ‘safety’ and ’security’, whereby the former refers to accidents
and diseases, while the latter refers to acts of violence. There are two schools of thought: those agencies that
quite explicitly make the conceptual distinction, and those that equally explicitly do not want to do so.
In the over-arching concept of risk management, safety and security cannot be used synonymously
otherwise it becomes a way of signalling that safety cannot be overlooked and exclusive attention paid to
security. Thus, in this study, both safety and security are considered together as inextricable concepts that
must be addressed together in order to tackle and manage risk exposures at workplace.
Figure 1. Safety and Security issues in organization
Source: Researchers’ inference from the above discussions
2.1.1. Sources of safety and security threats in organizations: Global Review
An analysis of incidents worldwide suggests that the primary safety and security threats arise from a
number of sources. To ensure that staff safety and security is ensued in an organization, the various causes or
sources of these threats must be identified and appraised. Safety and security of personnel at workplace is
caused by a number of factors. Accordingly, Anderson (2010) has developed an extensive database to help
identify risks, assess probability of threats and assist in mitigating the potential for disasters. The database-
which now encompasses 80 countries, identified the various sources of safety and security threats discussed
below:
i. Bombings: The incidents of bombings are most prevalent in all regions. Anderson (2010) reported
that in Africa, for example, there were 182 bombings or attempted bombings between 1990 and 1998, while
Asia reporting showed a count of 358; Latin America at 344 and the Middle East at 119. Bombings typically
result in extensive property damage, high incident of injury and lengthy disruption of operations, not only to
the target company, but to adjoining businesses extended blocks or miles from the bombing target.
According to Anderson (2010), Colombia, Panama and Peru, Uganda, Greece, Sri Lanka all experienced one
form of bombing or the other while In Nigeria, the incident of bombing has been on the increase with the
persistent activities of Boko Haran sects in the Northern parts of the country.
Akpan, S.S., Ayandele, I.A., 2015. Remodeling Strategic Staff Safety and Security Risks Management in Nigerian Tertiary Institutions. Expert
Journal of Business and Management, 3(2), pp.150-165
155
ii. Assaults: Assault is the second most frequent offenses reported after bombings. Assaults take the
form of shootings, murder and physical assaults on a person. Various police jurisdictions report high
numbers. According to Sao Paulo, Brazil police records, for example 4,778 people were murdered in Sao
Paulo in 1997, averaging 13 homicides per day. The Brazilian Ministry of Justice reported that 31 of every
100,000 Brazilians are murdered compared to 20 per 100,000 in Mexico and 10 per 100,000 in the United
States. The records of the Colombian National Police reflected 31,808 murders or 87 per day in 1997, as well
as 204 muggings or assaults committed in Colombia every 24 hours. Mexico City reports more than 250,000
crimes annually or approximately 700 per day. In Nigeria, incident of assaults are also increasing especially
on females at workplace. Most common among all assaults is sexually harassment.
iii. Kidnapping: This threat has emerged as a problem worldwide, reaching critical level in Colombia
and Mexico. Kidnappings are conducted by terrorists, criminals and others acting for political reasons. Most
of the kidnappings are motivated by economic reasons, but in some cases are undertaken to effect political
change in a country. Most are resolved peacefully, but some have tragic results. These threats are become
almost a legalized business in Nigeria and especially in Akwa Ibom State. Most of these threats in Nigeria
and Akwa Ibom State are political reasons. These have however, cause serious safety and security issues in
many organizations in Nigeria and Akwa Ibom State.
iv. Organized Crime: The threat from organized crime elements has reached global proportions. The
threat ranges from the well-developed economies of the United States to such places as Hungary, Russia,
India, South Africa and other emerging markets. Organized crime groups, sometimes working in concert
with distant organization, are generally engaged in transporting stolen goods internationally, extortion,
murder, bombings, drug trafficking, arson and bribery of government officials. In Hungary, organized crime
has been responsible for killing a diplomat, newspaper publisher, the bombing of several political
candidates’ houses and offices, as well as more than 100 other bombings since 1991.
v. Corruption: The International Monetary Fund, World Bank and Inter-American Development
Bank are all addressing the issue as it relates to projects with which they are involved. The U.S. Commerce
Department estimates that companies worldwide operating outside their own national borders paid
approximately $80 billion in illegal payments or bribes to officials in other countries since 1995.
2.1.2 Safety and Security Management Framework and Strategies
The management of safety and security of personnel at workplace revolve around many factors as
encapsulated in figure 2, adapted from Brabant (2001).
The framework presented below (figure 2) contains several complex activities that are involve in
effective safety and security risk management, the cardinal activities are captured in what Brabant (1998)
refers some years ago as the ‘safety-security triangle’, which represent three ideal types of safety and
security risk management strategies namely: acceptance, protection and deterrent. In a nutshell, an
acceptance strategy tries to reduce or remove the threats by increasing the acceptance for an organization’s
presence and work in a particular environment. Another way of putting this is ‘winning the hearts and minds’
of people. A protection strategy does not affect the threats but tries to reduce organization’s vulnerability,
through protective devices (high walls, barbed wire, flak jackets, blast-walls or – where there is respect, - a
prominent logo). A deterrence strategy essentially tries to contain a threat by posing a counter-threat (arrest
and fines, international sanctions, trial by an international tribunal and, ultimately, armed protected with the
possibility of return fire).
As explained further by Brabant (2001), different safety and security risk management strategies
require different staff skills and time allocation. For instance, a protection strategy requires mostly technical
knowledge and is least context specific and requires political, social and anthropological understanding, and
diplomatic and negotiation skills, as well as significant more time spent monitoring contextual
developments.
This ‘security triangle’ (Figure 2) has been very successful, not so much because what it said as
totally new, but because it gave simple concept and simple words to things that organizations has been
implicitly practicing all over the world. It would be a mistake, however not to read the commentary with the
triangle, and therefore to misuse it. Some organizations seem to have grasped on to ‘acceptance’ and declare
it their strategy. This could be a dangerous mistake.
The commentary says that many individuals, organizations and even countries seem to have a
preferred style, but that the art of safety and security management is choosing the right mix of strategies, in
accordance with your threat and vulnerability analyses in a given context. Thus, an acceptance strategy is not
going to prove very effective against brutal organized crime. The security triangle cannot be taken in
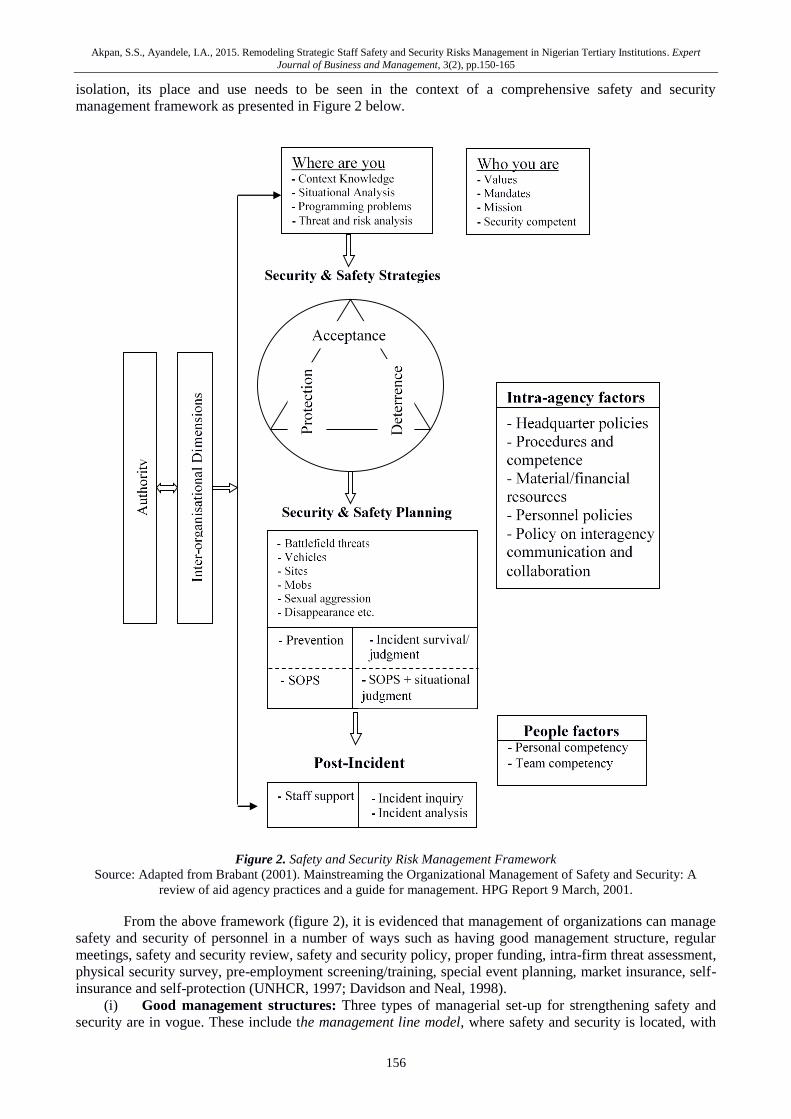
Akpan, S.S., Ayandele, I.A., 2015. Remodeling Strategic Staff Safety and Security Risks Management in Nigerian Tertiary Institutions. Expert
Journal of Business and Management, 3(2), pp.150-165
156
isolation, its place and use needs to be seen in the context of a comprehensive safety and security
management framework as presented in Figure 2 below.
Figure 2. Safety and Security Risk Management Framework
Source: Adapted from Brabant (2001). Mainstreaming the Organizational Management of Safety and Security: A
review of aid agency practices and a guide for management. HPG Report 9 March, 2001.
From the above framework (figure 2), it is evidenced that management of organizations can manage
safety and security of personnel in a number of ways such as having good management structure, regular
meetings, safety and security review, safety and security policy, proper funding, intra-firm threat assessment,
physical security survey, pre-employment screening/training, special event planning, market insurance, self-
insurance and self-protection (UNHCR, 1997; Davidson and Neal, 1998).
(i) Good management structures: Three types of managerial set-up for strengthening safety and
security are in vogue. These include the management line model, where safety and security is located, with
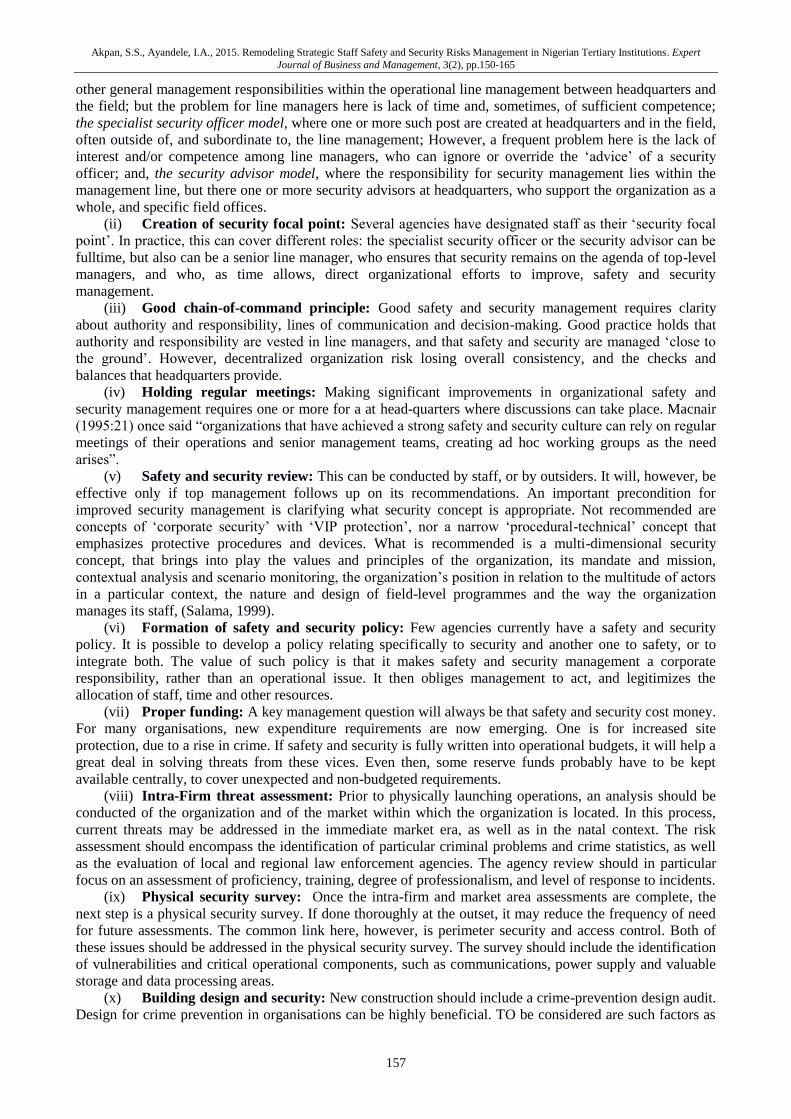
Akpan, S.S., Ayandele, I.A., 2015. Remodeling Strategic Staff Safety and Security Risks Management in Nigerian Tertiary Institutions. Expert
Journal of Business and Management, 3(2), pp.150-165
157
other general management responsibilities within the operational line management between headquarters and
the field; but the problem for line managers here is lack of time and, sometimes, of sufficient competence;
the specialist security officer model, where one or more such post are created at headquarters and in the field,
often outside of, and subordinate to, the line management; However, a frequent problem here is the lack of
interest and/or competence among line managers, who can ignore or override the ‘advice’ of a security
officer; and, the security advisor model, where the responsibility for security management lies within the
management line, but there one or more security advisors at headquarters, who support the organization as a
whole, and specific field offices.
(ii) Creation of security focal point: Several agencies have designated staff as their ‘security focal
point’. In practice, this can cover different roles: the specialist security officer or the security advisor can be
fulltime, but also can be a senior line manager, who ensures that security remains on the agenda of top-level
managers, and who, as time allows, direct organizational efforts to improve, safety and security
management.
(iii) Good chain-of-command principle: Good safety and security management requires clarity
about authority and responsibility, lines of communication and decision-making. Good practice holds that
authority and responsibility are vested in line managers, and that safety and security are managed ‘close to
the ground’. However, decentralized organization risk losing overall consistency, and the checks and
balances that headquarters provide.
(iv) Holding regular meetings: Making significant improvements in organizational safety and
security management requires one or more for a at head-quarters where discussions can take place. Macnair
(1995:21) once said “organizations that have achieved a strong safety and security culture can rely on regular
meetings of their operations and senior management teams, creating ad hoc working groups as the need
arises”.
(v) Safety and security review: This can be conducted by staff, or by outsiders. It will, however, be
effective only if top management follows up on its recommendations. An important precondition for
improved security management is clarifying what security concept is appropriate. Not recommended are
concepts of ‘corporate security’ with ‘VIP protection’, nor a narrow ‘procedural-technical’ concept that
emphasizes protective procedures and devices. What is recommended is a multi-dimensional security
concept, that brings into play the values and principles of the organization, its mandate and mission,
contextual analysis and scenario monitoring, the organization’s position in relation to the multitude of actors
in a particular context, the nature and design of field-level programmes and the way the organization
manages its staff, (Salama, 1999).
(vi) Formation of safety and security policy: Few agencies currently have a safety and security
policy. It is possible to develop a policy relating specifically to security and another one to safety, or to
integrate both. The value of such policy is that it makes safety and security management a corporate
responsibility, rather than an operational issue. It then obliges management to act, and legitimizes the
allocation of staff, time and other resources.
(vii) Proper funding: A key management question will always be that safety and security cost money.
For many organisations, new expenditure requirements are now emerging. One is for increased site
protection, due to a rise in crime. If safety and security is fully written into operational budgets, it will help a
great deal in solving threats from these vices. Even then, some reserve funds probably have to be kept
available centrally, to cover unexpected and non-budgeted requirements.
(viii) Intra-Firm threat assessment: Prior to physically launching operations, an analysis should be
conducted of the organization and of the market within which the organization is located. In this process,
current threats may be addressed in the immediate market era, as well as in the natal context. The risk
assessment should encompass the identification of particular criminal problems and crime statistics, as well
as the evaluation of local and regional law enforcement agencies. The agency review should in particular
focus on an assessment of proficiency, training, degree of professionalism, and level of response to incidents.
(ix) Physical security survey: Once the intra-firm and market area assessments are complete, the
next step is a physical security survey. If done thoroughly at the outset, it may reduce the frequency of need
for future assessments. The common link here, however, is perimeter security and access control. Both of
these issues should be addressed in the physical security survey. The survey should include the identification
of vulnerabilities and critical operational components, such as communications, power supply and valuable
storage and data processing areas.
(x) Building design and security: New construction should include a crime-prevention design audit.
Design for crime prevention in organisations can be highly beneficial. TO be considered are such factors as
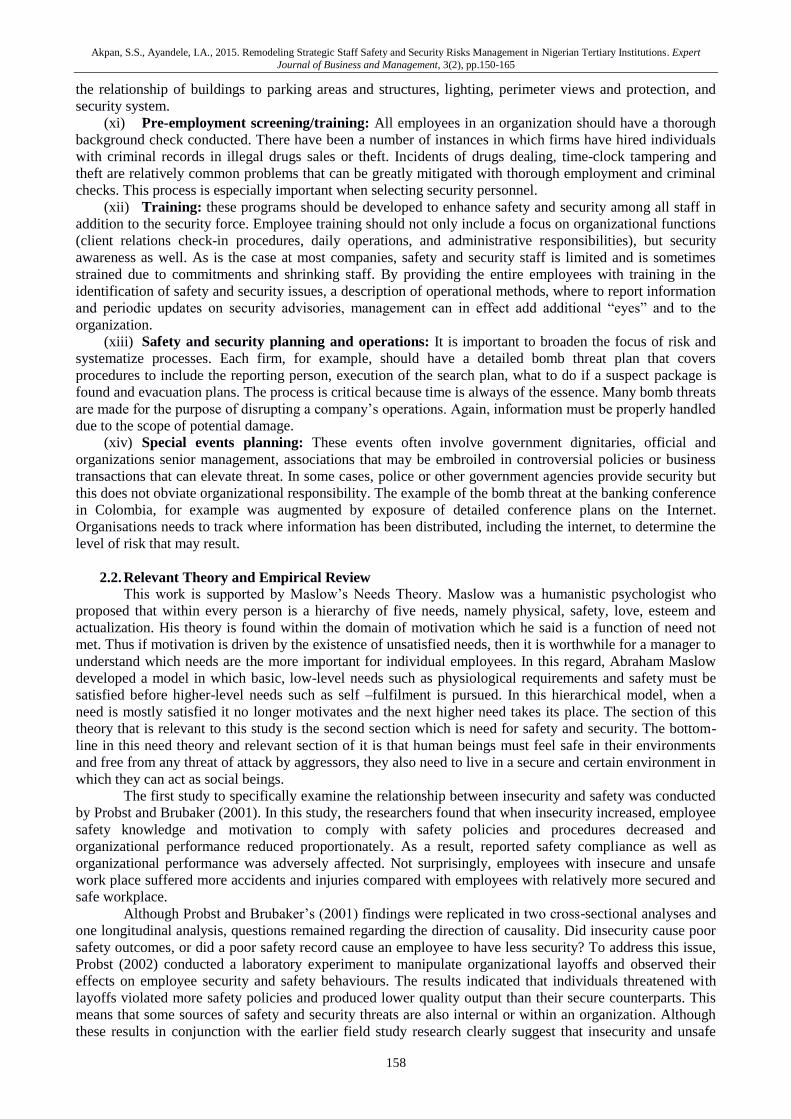
Akpan, S.S., Ayandele, I.A., 2015. Remodeling Strategic Staff Safety and Security Risks Management in Nigerian Tertiary Institutions. Expert
Journal of Business and Management, 3(2), pp.150-165
158
the relationship of buildings to parking areas and structures, lighting, perimeter views and protection, and
security system.
(xi) Pre-employment screening/training: All employees in an organization should have a thorough
background check conducted. There have been a number of instances in which firms have hired individuals
with criminal records in illegal drugs sales or theft. Incidents of drugs dealing, time-clock tampering and
theft are relatively common problems that can be greatly mitigated with thorough employment and criminal
checks. This process is especially important when selecting security personnel.
(xii) Training: these programs should be developed to enhance safety and security among all staff in
addition to the security force. Employee training should not only include a focus on organizational functions
(client relations check-in procedures, daily operations, and administrative responsibilities), but security
awareness as well. As is the case at most companies, safety and security staff is limited and is sometimes
strained due to commitments and shrinking staff. By providing the entire employees with training in the
identification of safety and security issues, a description of operational methods, where to report information
and periodic updates on security advisories, management can in effect add additional “eyes” and to the
organization.
(xiii) Safety and security planning and operations: It is important to broaden the focus of risk and
systematize processes. Each firm, for example, should have a detailed bomb threat plan that covers
procedures to include the reporting person, execution of the search plan, what to do if a suspect package is
found and evacuation plans. The process is critical because time is always of the essence. Many bomb threats
are made for the purpose of disrupting a company’s operations. Again, information must be properly handled
due to the scope of potential damage.
(xiv) Special events planning: These events often involve government dignitaries, official and
organizations senior management, associations that may be embroiled in controversial policies or business
transactions that can elevate threat. In some cases, police or other government agencies provide security but
this does not obviate organizational responsibility. The example of the bomb threat at the banking conference
in Colombia, for example was augmented by exposure of detailed conference plans on the Internet.
Organisations needs to track where information has been distributed, including the internet, to determine the
level of risk that may result.
2.2. Relevant Theory and Empirical Review
This work is supported by Maslow’s Needs Theory. Maslow was a humanistic psychologist who
proposed that within every person is a hierarchy of five needs, namely physical, safety, love, esteem and
actualization. His theory is found within the domain of motivation which he said is a function of need not
met. Thus if motivation is driven by the existence of unsatisfied needs, then it is worthwhile for a manager to
understand which needs are the more important for individual employees. In this regard, Abraham Maslow
developed a model in which basic, low-level needs such as physiological requirements and safety must be
satisfied before higher-level needs such as self –fulfilment is pursued. In this hierarchical model, when a
need is mostly satisfied it no longer motivates and the next higher need takes its place. The section of this
theory that is relevant to this study is the second section which is need for safety and security. The bottom-
line in this need theory and relevant section of it is that human beings must feel safe in their environments
and free from any threat of attack by aggressors, they also need to live in a secure and certain environment in
which they can act as social beings.
The first study to specifically examine the relationship between insecurity and safety was conducted
by Probst and Brubaker (2001). In this study, the researchers found that when insecurity increased, employee
safety knowledge and motivation to comply with safety policies and procedures decreased and
organizational performance reduced proportionately. As a result, reported safety compliance as well as
organizational performance was adversely affected. Not surprisingly, employees with insecure and unsafe
work place suffered more accidents and injuries compared with employees with relatively more secured and
safe workplace.
Although Probst and Brubaker’s (2001) findings were replicated in two cross-sectional analyses and
one longitudinal analysis, questions remained regarding the direction of causality. Did insecurity cause poor
safety outcomes, or did a poor safety record cause an employee to have less security? To address this issue,
Probst (2002) conducted a laboratory experiment to manipulate organizational layoffs and observed their
effects on employee security and safety behaviours. The results indicated that individuals threatened with
layoffs violated more safety policies and produced lower quality output than their secure counterparts. This
means that some sources of safety and security threats are also internal or within an organization. Although
these results in conjunction with the earlier field study research clearly suggest that insecurity and unsafe
Akpan, S.S., Ayandele, I.A., 2015. Remodeling Strategic Staff Safety and Security Risks Management in Nigerian Tertiary Institutions. Expert
Journal of Business and Management, 3(2), pp.150-165
159
workplace causes more negative outcomes, other empirical research suggests just the opposite – that
insecurity and unsafe workplace is related to more positive outcomes at work.
More recently, however, research is beginning to suggest that poor safety and insecurity may also
have a detrimental effect on employee work attitudes, behaviour and outcome, (Grumberg, Moore, and
Greenberg, 1996, Probst, 2002; Probst and Brubaker, 2001). In the United States alone, over 5,000
employees lost their lives in 2001 due to work related injuries, and an additional 5.7 million employees
suffered nonfatal work-related injuries and illness (Bureau of Labour Statistics, 2001). Although there is
research to suggest that employee job insecurity may be contributing to this workplace accident and injury
numbers, other research suggests instead that job insecurity is related to more positive safety outcomes
(Parker, Axtell, and Turner, 2001).
3. Methodology and Data Set
This research was an applied study aimed at solving the safety and security management problem in
an organization. The study design adopted was a cross sectional survey design. By this design, the
researchers was able to administer copies of questionnaire to a sample of 144 respondents drawn
scientifically from a total population of 224 who were security personnel in the University of Uyo through
the use of Taro Yamen’s formula as presented below: n =N/1 +N(e)2; with e = 5%; n= 224/1+224 (0.0025) =
144. Out of the 144 copies of questionnaire administered, a total of 135 questionnaires representing 93.75%
response rates were returned to the researchers in useable form. And this became the sample used for this
study.
Statistically, mean and standard deviation was used in analysing responses from respondents and the
mean (average) obtained is interpreted based on the interpretation scale (see Table 1). By the Likert Scale
Rating, responses obtained from the respondents on questionnaire items were weighted in order to get their
mean. Weighted scores refer to the respondent’s scores against each questionnaire item multiplied by the
scores under each Likert Scale Point (LSP). The products were added together on each column in order to
find out the average (mean) using the number of respondents involved. The Hypotheses were tested using
Pearson Correlation Coefficient (R) Statistics with the use of SPSS. The Null hypotheses was accepted
where R at P > 0.05 and rejected where R at p < 0.05. However, the decision rule for the mean statistics was
that where the arithmetic mean (a) value is the same with the Harmonic mean (h) and Geometric mean
(g) value, the null hypothesis was rejected and the alternative hypothesis accepted, otherwise the reverse.
Thus: Reject Ho and accept Hi if a = h = g; Accept Ho and reject Hi if a h g.
Table 1. Likert Point Rating and Interpretation Scale
Options Symbol Likert 5-point
Rating Scale
Likert 5-point
Interpretation Scale
Strongly Agree or Very committed SA or VC 4 3.50-4.00
Agree or Committed A or C 3 2.50-3.49
Disagree or Fairly committed D or FC 2 1.50-2.49
Strongly Disagree or Not
committed SD or NC 1 1.00-1.44
Undecided U 0 0.00-0.99
Source: Inference from Hassan and Olaniran, (2011).
4. Data Presentation, Analysis and Results
The analysis done here are to help proffer objective answers to the questions. It is thus, an objective
analysis of the subjective responses obtained from the respondents in relation to the questions asked. The
result on the various sources of safety and security threats to University of Uyo are presented in table 2.
From the responses on table 2, it is evident that all, except two sources were not agreed by the respondents as
constituting sources of safety and security threats. These sources were assaults and corruptions with the
mean () values of 2.30 and 2.23 respectively. All other sources were agreed with different degrees of
agreements.
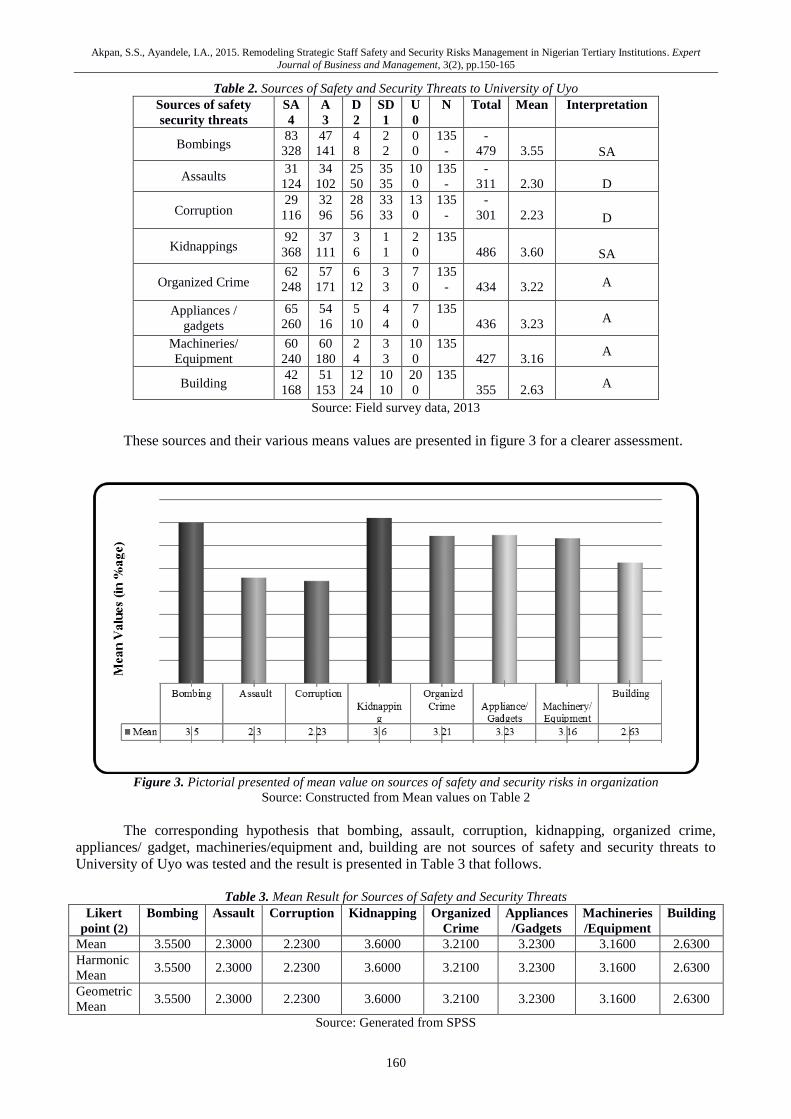
Akpan, S.S., Ayandele, I.A., 2015. Remodeling Strategic Staff Safety and Security Risks Management in Nigerian Tertiary Institutions. Expert
Journal of Business and Management, 3(2), pp.150-165
160
Table 2. Sources of Safety and Security Threats to University of Uyo
Sources of safety
security threats
SA
4
A
3
D
2
SD
1
U
0
N Total Mean Interpretation
Bombings 83
328
47
141
4
8
2
2
0
0
135
-
-
479
3.55
SA
Assaults 31
124
34
102
25
50
35
35
10
0
135
-
-
311
2.30
D
Corruption 29
116
32
96
28
56
33
33
13
0
135
-
-
301
2.23
D
Kidnappings 92
368
37
111
3
6
1
1
2
0
135
486
3.60
SA
Organized Crime 62
248
57
171
6
12
3
3
7
0
135
-
434
3.22 A
Appliances /
gadgets
65
260
54
16
5
10
4
4
7
0
135
436
3.23 A
Machineries/
Equipment
60
240
60
180
2
4
3
3
10
0
135
427
3.16 A
Building 42
168
51
153
12
24
10
10
20
0
135
355
2.63 A
Source: Field survey data, 2013
These sources and their various means values are presented in figure 3 for a clearer assessment.
Figure 3. Pictorial presented of mean value on sources of safety and security risks in organization
Source: Constructed from Mean values on Table 2
The corresponding hypothesis that bombing, assault, corruption, kidnapping, organized crime,
appliances/ gadget, machineries/equipment and, building are not sources of safety and security threats to
University of Uyo was tested and the result is presented in Table 3 that follows.
Table 3. Mean Result for Sources of Safety and Security Threats
Likert
point (2)
Bombing Assault Corruption Kidnapping Organized
Crime
Appliances
/Gadgets
Machineries
/Equipment
Building
Mean 3.5500 2.3000 2.2300 3.6000 3.2100 3.2300 3.1600 2.6300
Harmonic
Mean 3.5500 2.3000 2.2300 3.6000 3.2100 3.2300 3.1600 2.6300
Geometric
Mean 3.5500 2.3000 2.2300 3.6000 3.2100 3.2300 3.1600 2.6300
Source: Generated from SPSS
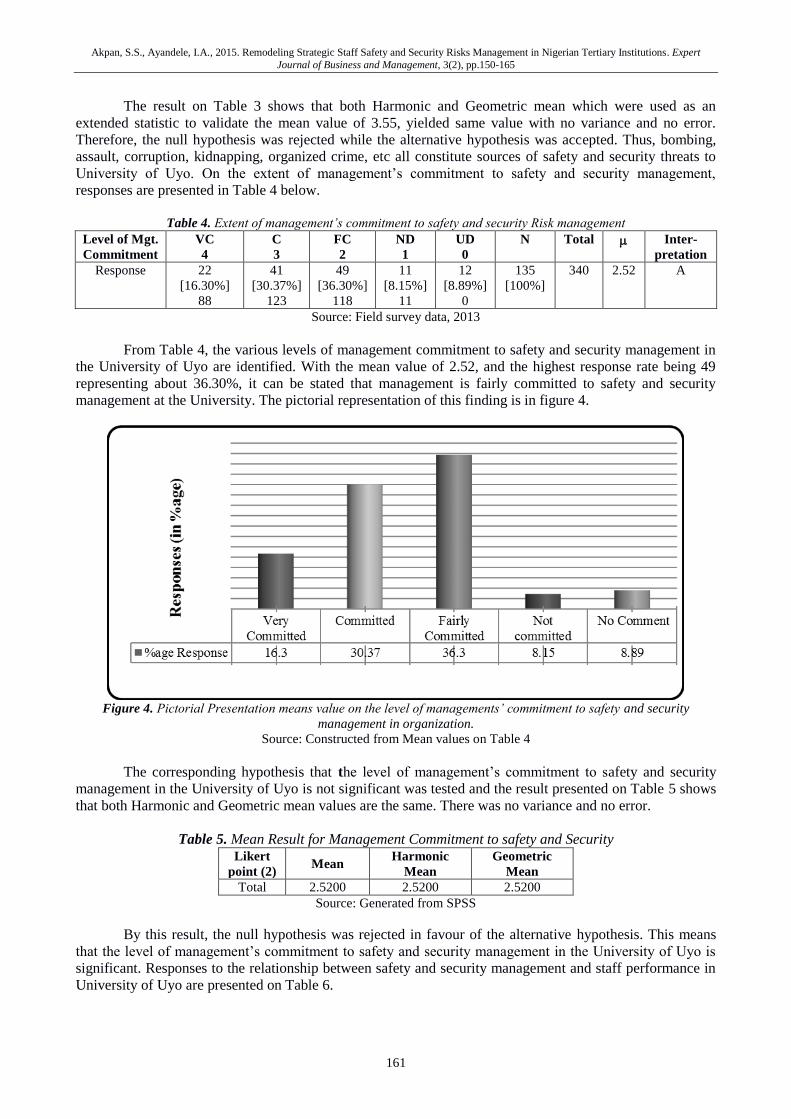
Akpan, S.S., Ayandele, I.A., 2015. Remodeling Strategic Staff Safety and Security Risks Management in Nigerian Tertiary Institutions. Expert
Journal of Business and Management, 3(2), pp.150-165
161
The result on Table 3 shows that both Harmonic and Geometric mean which were used as an
extended statistic to validate the mean value of 3.55, yielded same value with no variance and no error.
Therefore, the null hypothesis was rejected while the alternative hypothesis was accepted. Thus, bombing,
assault, corruption, kidnapping, organized crime, etc all constitute sources of safety and security threats to
University of Uyo. On the extent of management’s commitment to safety and security management,
responses are presented in Table 4 below.
Table 4. Extent of management’s commitment to safety and security Risk management
Level of Mgt.
Commitment
VC
4
C
3
FC
2
ND
1
UD
0
N Total Inter-
pretation
Response 22
[16.30%]
88
41
[30.37%]
123
49
[36.30%]
118
11
[8.15%]
11
12
[8.89%]
0
135
[100%]
340 2.52 A
Source: Field survey data, 2013
From Table 4, the various levels of management commitment to safety and security management in
the University of Uyo are identified. With the mean value of 2.52, and the highest response rate being 49
representing about 36.30%, it can be stated that management is fairly committed to safety and security
management at the University. The pictorial representation of this finding is in figure 4.
Figure 4. Pictorial Presentation means value on the level of managements’ commitment to safety and security
management in organization.
Source: Constructed from Mean values on Table 4
The corresponding hypothesis that the level of management’s commitment to safety and security
management in the University of Uyo is not significant was tested and the result presented on Table 5 shows
that both Harmonic and Geometric mean values are the same. There was no variance and no error.
Table 5. Mean Result for Management Commitment to safety and Security Likert
point (2) Mean
Harmonic
Mean
Geometric
Mean
Total 2.5200 2.5200 2.5200
Source: Generated from SPSS
By this result, the null hypothesis was rejected in favour of the alternative hypothesis. This means
that the level of management’s commitment to safety and security management in the University of Uyo is
significant. Responses to the relationship between safety and security management and staff performance in
University of Uyo are presented on Table 6.
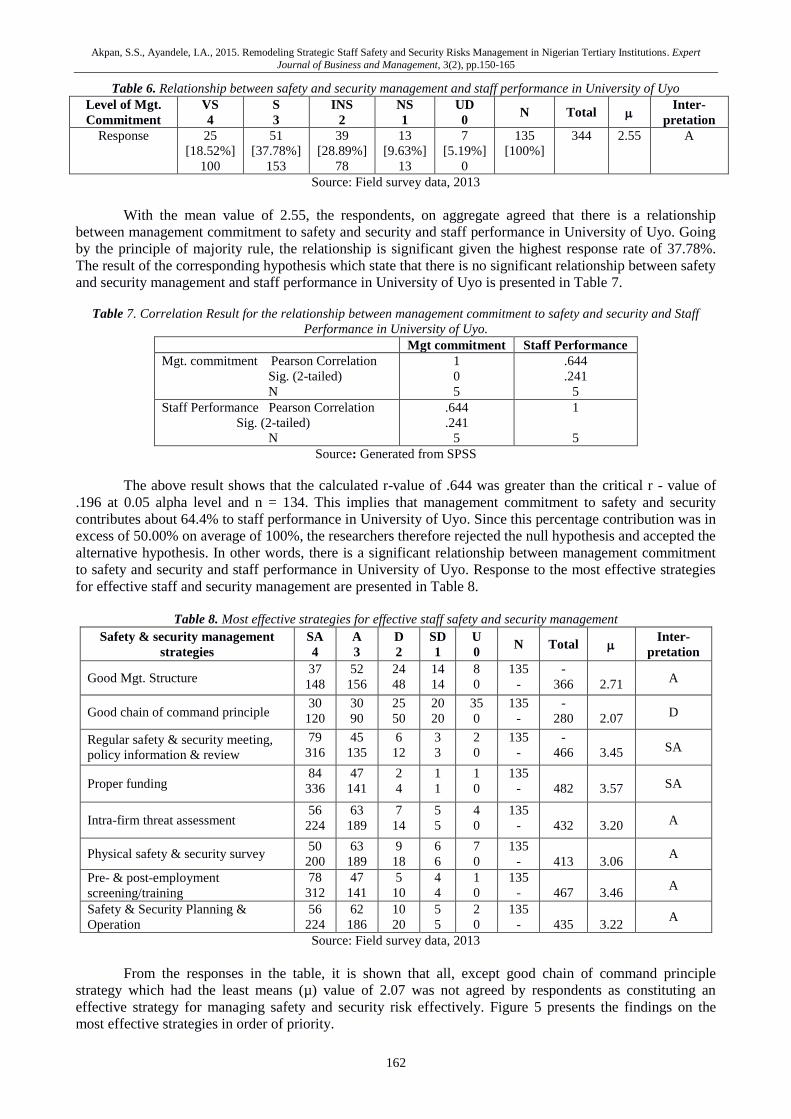
Akpan, S.S., Ayandele, I.A., 2015. Remodeling Strategic Staff Safety and Security Risks Management in Nigerian Tertiary Institutions. Expert
Journal of Business and Management, 3(2), pp.150-165
162
Table 6. Relationship between safety and security management and staff performance in University of Uyo
Level of Mgt.
Commitment
VS
4
S
3
INS
2
NS
1
UD
0 N Total
Inter-
pretation
Response 25
[18.52%]
100
51
[37.78%]
153
39
[28.89%]
78
13
[9.63%]
13
7
[5.19%]
0
135
[100%]
344 2.55 A
Source: Field survey data, 2013
With the mean value of 2.55, the respondents, on aggregate agreed that there is a relationship
between management commitment to safety and security and staff performance in University of Uyo. Going
by the principle of majority rule, the relationship is significant given the highest response rate of 37.78%.
The result of the corresponding hypothesis which state that there is no significant relationship between safety
and security management and staff performance in University of Uyo is presented in Table 7.
Table 7. Correlation Result for the relationship between management commitment to safety and security and Staff
Performance in University of Uyo.
Mgt commitment Staff Performance
Mgt. commitment Pearson Correlation
Sig. (2-tailed)
N
1
0
5
.644
.241
5
Staff Performance Pearson Correlation
Sig. (2-tailed)
N
.644
.241
5
1
5
Source: Generated from SPSS
The above result shows that the calculated r-value of .644 was greater than the critical r - value of
.196 at 0.05 alpha level and n = 134. This implies that management commitment to safety and security
contributes about 64.4% to staff performance in University of Uyo. Since this percentage contribution was in
excess of 50.00% on average of 100%, the researchers therefore rejected the null hypothesis and accepted the
alternative hypothesis. In other words, there is a significant relationship between management commitment
to safety and security and staff performance in University of Uyo. Response to the most effective strategies
for effective staff and security management are presented in Table 8.
Table 8. Most effective strategies for effective staff safety and security management
Safety & security management
strategies
SA
4
A
3
D
2
SD
1
U
0 N Total
Inter-
pretation
Good Mgt. Structure 37
148
52
156
24
48
14
14
8
0
135
-
-
366
2.71 A
Good chain of command principle 30
120
30
90
25
50
20
20
35
0
135
-
-
280
2.07 D
Regular safety & security meeting,
policy information & review
79
316
45
135
6
12
3
3
2
0
135
-
-
466
3.45 SA
Proper funding 84
336
47
141
2
4
1
1
1
0
135
-
482
3.57 SA
Intra-firm threat assessment 56
224
63
189
7
14
5
5
4
0
135
-
432
3.20 A
Physical safety & security survey 50
200
63
189
9
18
6
6
7
0
135
-
413
3.06 A
Pre- & post-employment
screening/training
78
312
47
141
5
10
4
4
1
0
135
-
467
3.46 A
Safety & Security Planning &
Operation
56
224
62
186
10
20
5
5
2
0
135
-
435
3.22 A
Source: Field survey data, 2013
From the responses in the table, it is shown that all, except good chain of command principle
strategy which had the least means (µ) value of 2.07 was not agreed by respondents as constituting an
effective strategy for managing safety and security risk effectively. Figure 5 presents the findings on the
most effective strategies in order of priority.
Akpan, S.S., Ayandele, I.A., 2015. Remodeling Strategic Staff Safety and Security Risks Management in Nigerian Tertiary Institutions. Expert
Journal of Business and Management, 3(2), pp.150-165
163
Figure 5. Pictorial presentation of the means of sources of safety and security risks in organization
Source: Constructed from Mean values on Table 8
The result of the corresponding hypothesis that good management structure, command principles,
meetings, funding, threat assessment, physical survey, employment screening, and operations planning are
not effective strategies for effective staff safety and security management in the University of Uyo is
presented in Table 9.
Table 9. Mean Result for Strategies for Effective staff Safety and Security Management in the University of Uyo
Likert
point (2)
Good
mgt.
structure
Good
chain of
command
principle
Regular safety
& security
meeting, policy
formation &
review
Proper
funding
Intra-firm
threat
assessment
Physical
safety &
security
survey
Pre- & post-
employment
screening/
training
Safety &
security
planning
operation
Mean 2.7100 2.0700 3.4500 3.57000 3.2000 3.0600 3.4600 3.2200
Harmonic
Mean 2.7100 2.0700 3.4500 3.57000 3.2000 3.0600 3.4600 3.2200
Geometric
Mean 2.7100 2.0700 3.4500 3.57000 3.2000 3.0600 3.4600 3.2200
Table 9 indicates that there are strategies that are effective for managing staff safety and security
risks in the University of Uyo. This is because all the results had no variance and no error in their Arithmetic
mean. Consequently, the null hypothesis which states that good management structure, command principle,
meetings, funding, threat assessment, physical survey, employment screening, and operations planning are
not effective strategies for effective staff safety and security management in the University of Uyo was
rejected while the alternative hypothesis was accepted. This means that good management structure,
meetings, funding, threat assessment, physical survey, employment screening, and operations planning are
effective strategies for effective staff safety and security management in the University of Uyo except for
good chain of command principle.
5. Conclusions and Recommendations
Safety and security are very important issue in organizational management. Today, the growth in
population without corresponding growth in job opportunities create several and eminent juvenile tendencies
among youths. The explosion in technology and emergent of sophisticated equipment for industrial use,
among others have all rekindled academic and industrial interests in safety and security risks at workplace.
From the findings made, it is concluded that the main sources of safety and security risks in the University of
Uyo are more of external than internal. The principal sources are kidnapping and bombing. However,
principal internal sources are Appliances/gadgets and machineries/equipment. It is concluded that the level
of Management commitment to safety and security management is far less than needed to ensure effective
safety and security operation.
Consequently, safety and security affect lives and properties in University of Uyo bi-directionally.
That is, if managed well it will strongly protect lives and properties in University of Uyo; and if managed
Akpan, S.S., Ayandele, I.A., 2015. Remodeling Strategic Staff Safety and Security Risks Management in Nigerian Tertiary Institutions. Expert
Journal of Business and Management, 3(2), pp.150-165
164
with levity, it will make lives and properties in University of Uyo vulnerable to the risk of unsafe and
insecure workplace. Funding is the most contentious issue in safety and security management. Thus adequate
funding is the most effective strategy for managing safety and security effectively in the University of Uyo.
Another most important strategy is pre- and post-employment screening/training amongst others. Based on
the above findings and conclusion, the following recommendations suffice:
i. Since one of the greatest sources of safety and security threats is external to the University, it is
recommended that management of the University of Uyo should seek alliance and network with law
enforcement agencies within Uyo metropolis to constantly keep the University environment under
surveillance, and possibly apply for armed security men who are experts in bomb detonation and anti-
kidnapping operation to be placed on strategic location along the University access roads.
ii. Management of the University of Uyo should be more committed to safety and security
management. One of the way this can be achieved is to make safety and security issues integral part of
University’s strategic pact with workforce and also by adopting the management line model – one form of
management structure – where safety and security is located with other general management responsibilities.
iii. Everybody in an organization dreads risks and desire protection, especially as they may find
insurance an expensive risk management strategy. The University of Uyo Management should look at safety
and security management as complementary risk management strategy. When workplace is safe and secured,
they will work with vigour and an intimidation-free mindset and this will lead to more employee
commitment which is a recipe for organizational growth and development.
iv. Adequate budget should be allocated to safety and security department/operations. When this is
done, other effective strategies such as pre- and post- employment screening/training would be possible. This
is hereby recommended very strongly for security personnel in the University of Uyo.
References
Andersen, A., 2010. Emergency Management, Safety and Security. [online] Available at:
http://suite101.com/article/employee-safety-and-security-a183454 [Accessed on May 20, 2015]
Barabant, K.V., 2001. Mainstreaming the Organizational Management of Safety and Security. A review of
aid agency practices and a guide for management. Overseas Development Institute. Europe.
Belilos, C., 2001. Emergency Management, Safety and Security. [online] Available at:
http://www.easytraining.com/safety.htm [Accessed on May 20, 2015]
Bertini, C., 2000. Statement by the Executive Director of WEP at the UN Security Council Open Debate on
Security of UN Humanitarian and Associated Personnel [online] Available at: www.wfp.org
Bureau of Labour Statistics, 2001. Injuries, illnesses, and fatalities: Latest members. [online] Available at:
http://www.bls.gov/lif/home.htm [Accessed on October 22, 2013]
Davidson, S., and Neal, J., 1998. Under Cover? Insurance for aid workers. London, People-in-Aid [online]
Available at: www.peopleinaid.co.uk/ [Accessed on May 20, 2015]
Jensen, S.B., 1999. Taking Care of the Care-takers under War-Conditions. Who cares?. Copenhagen:
European University Centre for Mental Health and Human rights.
Kiruja, M., Erik, K., and Sicko, P., 2011. ACT Staff Safety and Security Guidelines. A handbook for ACT
Staff Switzerland.
Macnair, R., 1995. Room for Improvement: The Management and support of relief and development
workers. London, Relief and Rehabilitation Network, Network Paper No. 10 [online] Available at:
http://www.isn.ethz.ch/Digital-Library/Publications/Detail/?id=97933&lng=en [Accessed on May
20, 2015]
Milan-Perez, L.A., 2003. HR How-To: Workplace Safety, Everything you need to know to ensure a Safety
and Healthy Workplace. CCH Incorporated.
Parker, S.K., Axtell, C. M., and Turner, N., 2001. Designing a safer workplace: Importance of job
autonomy, communication quality, and supportive supervisors. Journal of Occupational Health
Psychology, 6, pp.211-228.
Probst, T. M. 2002. Layoffs and tradeoffs: Production, quality, and safety demands under the threat of job
loss. Journal of Occupational Health Psychology, 7, pp.211-220
Probst, T.M. and Brubaker, T.L., 2001. The effects of job insecurity on employee safety outcomes: Cross-
sectional and longitudinal explorations. Journal of Occupational Health Psychology, 6, pp.139-159.

Akpan, S.S., Ayandele, I.A., 2015. Remodeling Strategic Staff Safety and Security Risks Management in Nigerian Tertiary Institutions. Expert
Journal of Business and Management, 3(2), pp.150-165
165
Salama, P., 1999. The Psychological Health of Relief workers. Some practical suggestions. London, Relief
and Rehabilitation Network, Newsletter 15 [online] Available at: www.odihpn.org.uk
http://www.odihpn.org/humanitarian-exchange-magazine/issue-15/the-psychological-health-of-
relief-workers-some-practical-suggestions [Accessed on May 20, 2015]
Sheilk, M., 2000. Deaths among Humanitarian Workers 1985-1998. Baltimore, Johns Hopkins School of
Hygiene and Public Health.
United Nations, 2000. Safety and Security of United Nations Personnel. Report of the Secretary-General.
New York. UN. General Assembly (18 October 2000)
Van Brabant, K., 2000. Operational Security Management in Violent Environments. A Development
Institute. Relief and Rehabilitation Network. Discussion paper [online] Available at:
http://www.patronusanalytical.com/page11/assets/GPR8.pdf [Accessed on May 20, 2015]
Expert Journal of Business and Management, Volume 3, Issue 2, pp. 166-170, 2015
© 2015 The Author. Published by Sprint Investify. ISSN 2344-6781
http://Business.ExpertJournals.com
166
Global Leadership and Organizational Change
from Past to Now
Alexander STELZER*
Institute for Global and Future Markets, Innsbruck, Austria
Organizational theory and organizational research (namely, organizational
behavior), have the purpose of organizations – to explain and understand – their
origin, their existence and their functioning. Therefore, I try in my work, different
approaches to take up. To this end, I chose different books and articles to explain
and expand the knowledge on this subject.
Keywords: global management, organizations models, human resource,
organizational behavior
JEL Classification: L00, L20
1. Introduction: Global Management - Global Management and Organizations Models in
Human Resource / Organizational Behavior
The difficulty is, to explain the theory and structure behind organizational theory, because the
problem is, that there is no clear standard for structuring and input. The explanations and definitions are as
varied as organizations itself. Nonetheless, the concept of organization can be defined in two ways:
1. The company has an actual organization
2. The company is an actual organization
2. Literature Review on the Subject and the Notion of Organizations
2.1. The Instrumental (or Functional) Organizational Concept
The German term of Functional Organization was coined by Erich Gutenberg (Laske et al., 2008).
Organization is a function of management, whose function and purpose is the fulfillment of tasks to perform.
Organization sees itself as a concept of operations management, among other terms, such as planning or
control (Frese, 1992).
2.2. The Institutional Organizational Concept
The institutional organization concept draws the view to the entire system, i.e. to the institution.
Committed organization with long-term objectives are social communities. They have formal structures to be
aligned with the help of the members on the goals (Frese, 1992).
* Corresponding Author:
Mag. Alexander Stelzer LL.M. LL.M., Doctoral Student, Institute for Global and Future Markets, Innsbruck, Austria
Article History:
Received 27 September 2015 | Accepted 5 October 2015 | Available Online 27 October 2015
Cite Reference:
Stelzer, A., 2015. Global Leadership and Organizational Change from Past to Now. Expert Journal of Business and Management, 3(2), pp.166-170
Stelzer, A., 2015. Global Leadership and Organizational Change from Past to Now. Expert Journal of Business and Management, 3(2), pp.166-170
167
2.3. The Processual Organizational Concept
The procedural point of view of organizations determined the activity-oriented understanding. It
describes the activities, processes and practices that made such an order, maintained and developed (Laske et
al., 2008).
The current organization theory attempts to integrate institutional and procedural understanding of
produce. The basic elements and characteristics that make up the organizations are:
The targeted nature of the organization
If units join together to pursue sustainable goals, then we speak of organizations.
The formal organizational structures
Organizations have commonly defined and formal structures, adjusted according to the actions of the
organization’s members.
Membership in organizations
The non-membership or membership shall also define the membership to an organization or not.
The design of the organization's members
The formal definition of membership means entering into a formal defined membership with an
organization. Membership does not address a person, but it refers to certain acts or services.
The boundaries of the organization
The boundaries of organizations are not natural boundaries, but are intentionally defined by people
in order to distinguish organizational inner worlds and outer worlds.
The Conclusion is that Organizations represent inter-organizational and operating structure, which
constantly interact with their environment (Laske et al., 2008).
3. Introduction to the Timeline of the Notion of Organizations
A temporal screening of the concept of organizational theory does not generate a general accepted
theory. Because organization scientists use different methods to justify their approaches, very different
assumptions or sometimes there are different interests involved (Kieser and Ebers, 2006).
The following remarks point only to a small part of the historical development in Organization
Theory, because a complete list is not possible because of the large number of Theories.
3.1. Classical Approaches (Kieser and Ebers, 2006)
Max Weber and the Analysis of Bureaucracy
The approach of the bureaucracy (namely, an efficient organizational form) promoted by Max Weber
defined the performance of work in administration and is characterized by:
o Division of labor
o Office hierarchy
o Rules
o Standards
Scientific Management and Taylorism
Taylorism was founded by Frederick Winslow Taylor and serves the increase of efficiency and
productivity by management and labor.
Administration and Management Theory
The development of management and administration theory can be traced back to Henri Fayol. The
primary questions are addressed on the task and department of education in management issues and
problems in corporate governance. Basis of the doctrine in the form of catalog management tasks include:
o Advance planning
o Organization
o Ordering
o Coordination
o Control
This doctrine also finds a clear statement on issues of clear hierarchy, which states that only higher-
level functions can give instructions on subsequent instances.
3.2. Behavioral Approaches (Kieser and Ebers, 2006)
Human-Relations-Approach
The origin of this theory is reflected in the Hawthorne-Experiments. In this context, the effects of job
conditions were examined by work efficiency.
Stelzer, A., 2015. Global Leadership and Organizational Change from Past to Now. Expert Journal of Business and Management, 3(2), pp.166-170
168
Main conclusion:
A positive attitude towards work by the members and managers of an organization turns to high
satisfaction and this in a further step to a better performance.
The key message:
Humans are a social beings and operate on their own laws.
Organizational development
The organizational development (OE) is based on the findings of a group dynamics laboratory
method (NTL Institute) and survey feedback.
Key message:
The involved person should become part “of the game”.
OE is used in large firms, governments, churches, social institutions and the army. It uses the rules
of social communities, similarly to the interests of employees.
Motivation Theory
As a result of the Human-Relations-Approach the development of the motivation theory is following,
which investigates human behavior. It examines the following relationships:
o Motivation
o Frustration
o Satisfaction
o Performance
3.3. Situational Approaches (Kieser and Ebers, 2006)
The situational approach developed in the 60 years in the U.S. and England. The aim of this approach
is to detect the relationship between:
Organizational theory
Behavior of the organization members
Efficiency of the organization
Situation
4. Distinction Between Firms and Educational Organizations
Dr. Laske et al. (2008) would like to emphasize in their work the difference between business and
educational organizations. Generally, both are organizations, but there are clear differences:
Educational organizations have budgets, but are usually not profit-oriented enterprises.
For the product "education", the customer has to join in actively, while this is not necessary the
case in the goods production.
The raw material "knowledge" is directly linked in educational organizations to the know-how
supporter.
This fact is also very aware of the knowledge holders and therefore sometimes they also can be
very demanding.
Educational organizations operate in such a different way to other forms of organizations. Therefore,
it would be wrong to apply existing organizational structures into educational organizations. According to
Dr. Laske et al.(2008) the organizations that approach this route would not necessary have a successful
outcome.
“The combination of a central concept of enlightenment (i.e. "training") with just such the economy
(namely, "organization") brings a fundamental tension reflected in the productive and reflected in the
"management" essential professional control of educational institutions” (Laske et al., 2008).
5. Organization and Management
In twenty years a typical large company has less than half of levels by management as today and
having no more than a third of managers. The company of tomorrow will distance and clear itself from the
production companies of the past (Frese, 1992). Rather, companies will become organizations of knowledge,
in which the carrier will be working with and for achieving knowledge and therefore they will have new
significance levels.
Stelzer, A., 2015. Global Leadership and Organizational Change from Past to Now. Expert Journal of Business and Management, 3(2), pp.166-170
169
The organizational structures are becoming flatter again, as it has been in the story in the past. The
difference is, that there are no longer actively controlled in base units, but the knowledge of the actual
organization is firmly anchored. Works are collected in projects and executed in task-oriented teams.
The development of information-based enterprises through the actual organization brings many
changes. To assess this possibility, it makes sense to watch already active information-based organization
and their guidelines as orchestras, hospitals and administrative details.
The actors in information-based companies are specialists. The task of a manager in an information-
based company is to coordinate these specialists in the “best use” possible. The task is not to train the
specialists in their ability or to supplement them in their functions. These leaders must not be able to exercise
their attributable functions by themselves (Drucker, 2000).
The Advanced Management Program at Harvard Business School focuses on the analysis of
organizations and their optimization. But to be able to optimize, first an existing organization must be
analyzed and for that the OFP Model (OFP = Organizational Fitness Profile) was developed. OFP schedule
implies the following steps:
Orientation and planning
Data collection
OFP Meetings
It is about an analysis of efficiency by management and in a second step to derive improvements to
the structure. So, in the first step customers and employees will be asked to clarify the strengths and
weaknesses (Stevens, 2002).
6. Conclusion
Organizations and Markets
The Wealth of Nations (Smith and Cannan, 2003) is divided into five books:
The increase in the productive powers of labor and the rule that its product is distributed among
the various classes of people naturally
The nature, accumulation and use of capital
The difference in increase of wealth in each country
The systems of political economy
The sovereign or the state’s finances
The work is, for example, the fundamental working mechanisms of the different markets, the money
economy, the factors of production and foreign trade. In this work (Smith and Cannan, 2003), specifically to
Smith's division of labor in factories, and developing his theories based on the example of pin production in
southern England. This book deals with the interaction of different actual organizations and their need in
changing times. Much of the past is reflected in the present (Smith and Cannan, 2003).
References
Drucker, P.F., 2000. Die Kunst des Managements: Eine Sammlung der in der Harvard Business Review
erschienenen Artikel. 2nd ed. München: Econ.
Frese, Erich. Organisationstheorie: Historische Entwicklung, Ansätze, Perspektiven. 2, überarbeitete und
wesentlich erw. Wiesbaden: Gabler, 1992.
Hatch, M.J. and Cunliffe, A.L., 2006. Organization theory: Modern, symbolic, and postmodern perspectives.
2nd Edition . New York: Oxford University Press.
Holub, H.W., 2005. Eine Einführung in die Geschichte des ökonomischen Denkens. Wien: LIT.
Jensen, Michael C. “Foundations of Organizational Strategy: Preface and Introduction.” SSRN Electronic
Journal (2000).
Kieser, A. and M. Ebers, M., 2006. Organisationstheorien. Kohlhammer.
Miebach, B., 2007. Organisationstheorie: Problemstellung, Modelle, Entwicklung. 1st ed. Wiesbaden: VS,
Verl. für Sozialwiss.
Sanders, K. and Andrea Kianty, A., 2006. Organisationstheorien: Eine Einführung. 1st ed. Wiesbaden: VS,
Verl. für Sozialwiss.
Shafritz, J.M. and Ott, J.S., 1992. Classics of organization theory. San Francisco, CA: Brooks/Cole Pub. Co.
Simon, F.B., 2007. Einführung in die systemische Organisationstheorie. 1st ed. Heidelberg: Auer.

Stelzer, A., 2015. Global Leadership and Organizational Change from Past to Now. Expert Journal of Business and Management, 3(2), pp.166-170
170
Smith, A. and Cannan, E., 2003. The wealth of nations: Adam Smith; introduction by Alan B. Krueger;
edited, with notes and marginal summary, by Edwin Cannan. Bantam classic. New York, N.Y:
Bantam Classic.
Laske, S., Meister-Scheytt, C., Küpers, W. and Deeg, J., 2008. Organisation und Führung. Carl von
Ossietzky University of Oldenburg [online] Available at: http://www.mba.uni-
oldenburg.de/downloads/leseproben/bildungsmanagement_-
_studienmaterial_leseprobe_organisation_und_fuehrung_laske.pdf [Accessed on May 14, 2015]
Stevens, M., 2002. Der Elite-Manager: Erfolgreich mit dem Wissen der Harvard Business School. 1st ed.
München: Econ.
Expert Journal of Business and Management, Volume 3, Issue 2, pp. 171-181, 2015
© 2015 The Author. Published by Sprint Investify. ISSN 2344-6781
http://Business.ExpertJournals.com
171
Upper Echelon Theory:
Role of Community and Strategy
Majdi Anwar QUTTAINAH*
Kuwait University
In this paper I argue that community plays an important role in shaping the values
and characteristics of top management teams. It builds on upper echelon theory to
posit that community level characteristics are instrumental in framing the
cognitions of CEOs and top executives. Strategic decisions made by managers in
organizations represent the significant impact community has on top management
teams. Examining the influence community has on top management teams provides
additional implications about why certain firms perform better than others.
Keywords: upper echelon theory, strategic management, top management,
corporate governance
JEL Classification: M16, M14
1. Introduction
A central theme in management is determining how strategic decision-making allows one
organization to perform better than another. Separating the strategies an organization pursues from those
individuals that make strategic decisions can be a critical mistake. The top management of an organization
exists to a large extent to make decisions regarding the path of the organization. A great deal of literature has
focused its attention on both the CEO and top management teams (TMTs), and the role they play in an
organization. Upper echelon theory (Hambrick and Mason, 1984) puts forward the idea that strategic
decisions are connected to the background characteristics of an organization’s management. A TMT is a
formulation of top-level managers and directors within a firm (Finkelstein and Hambrick, 1996) possessing
specific expertise in areas that will enable an organization to make informed decisions. This expertise
encapsulates the tangible and intangible knowledge and characteristics an individual possesses. According to
Hambrick and Mason, individual characteristics and cognitions are developed by past experience, education,
and personal values. Cognitions shaped by these, influence the way top managers analyze and respond to
situations, and the strategy chosen for the organization (Kaplan, 2005).
While the personal characteristics that are generally perceived to influence the decisions of
executives are experience, education, and personal values; further studies have examined additional
demographics and characteristics such as CEO tenure, international experience, functional background, and
age (Hermann and Datta, 2002). This paper intends to examine community’s effects on the personal
* Corresponding Author:
Majdi A. Quttainah, College of Business Administration, Kuwait University, PO Box: 5486, Safat 13055, Kuwait.
Article History:
Received 15 October 2015 | Accepted 27 October 2015 | Available Online 08 November 2015
Cite Reference:
Quttainah, M.A., 2015. Upper Echelon Theory: Role of Community and Strategy. Expert Journal of Business and Management, 3(2), pp.171-181
Quttainah, M.A., 2015. Upper Echelon Theory: Role of Community and Strategy. Expert Journal of Business and Management, 3(2), pp.171-181
172
characteristics of a TMT, and the impacts strategic decision making has on and eventually the performance
of the firm. Though community can be defined in a number of ways, in this paper community means the
physical location which played the most instrumental role in shaping the cognitions of each member of the
TMT. Thus, community can be the current location where the TMT lives, the original community in which
each member grew up, or a community in which a member spent a portion of time. Individuals will often end
up as managers in a new community that may or may not be similar to the community which has had the
most influence on their cognitions. At that time, the individual will be faced with the decision to choose
either to be flexible and allow to be shaped by the new community, or to employ previous characteristics
shaped by the original community. This paper will show the direct impact a TMT’s community and physical
location has on decision making, as well as point out how an organization can overcome these boundaries
and adapt to pressures to grow both domestically and internationally.
2. Literature Review: Theories and Propositions
One fundamental issue in strategy is explaining why firms differ in the strategies they pursue and
why some firms are more successful than others. Upper echelon theory (UET) was built upon strategic
leadership and suggests that individual characteristics influence differing strategic decisions by top
management teams (Pfeffer and Davis-Blake, 1986). UET has received much attention and has provided the
area of strategic management with good empirical data on the strategic decisions made by firms. It also
explains how the performance of a firm is strongly influenced by the decisions made by top-level executives,
and how the firm in Hambrick and Mason’s view becomes a reflection of top management (Hambrick and
Mason, 1984; Pfeffer and Davis-Blake, 1986; Smith, Carson and Alexander, 1984).
Examining how different characteristics and demographics influence top management’s decisions is
an important tool in explaining and predicting an organization’s performance, and numerous studies have
attempted to discover what some of these demographical influences are (Bantel and Jackson, 1989;
Finkelstein and Hambrick, 1990; Grimm and Smith, 1991; O’Reilly and Flatt, 1989; Wiersema and Bantel,
1992). Wiersema and Bantel (1992) found that age, tenure, and education level all influence the degree to
which individuals are receptive to change, willing to take risk, and creative or innovative. These
characteristics will influence the strategic decisions made by top managers regarding change, risk and
innovation. Other research has shown that an individual’s functional background, socioeconomic roots, and
financial position are linked to job involvement, job preferences, and beliefs about manager’s role
(Buchholz, 1977, 1978; Ritchie and Beardsley, 1978; Sekaran and Mowday, 1981). However, no research
has investigated the role that community can play in influencing executive cognitions.
2.1. Community Influence
Communities influence the decisions individuals in them make, and it is difficult to imagine making
a decision that is completely independent of the immediate environment in which the individual lives. For
example, one may decide not to purchase a vehicle if living in a community that values the importance of
and has engineered a good public transportation system. The child of a farmer may choose not to pursue
higher education, because the farming community values hard work and commitment to continuing a family
farm more than going to college.
At this time, it is important to make clear the concept of community as used in this paper.
Community does not mean social pressures that are administered by environmental forces. Corporate social
responsibility (CSR) (Engle 2006; Welford and Frost, 2006) argues that organizational leaders sometimes
make decisions for environmental reasons, which may be regulated by law or encouraged by social pressure.
The distinction made between CSR and how community influences the cognitions of top managers is that
there is an implication of some pressure associated with the former. Instead of resulting from external
pressure, community factors that influence top management’s cognitions involve the integration of certain
values or characteristics, present in the community, into the individual members of the TMT. Another
distinction of community influence should be made from a similar theory to CSR, that of corporate social
action.
Though research on corporate social action can provide support for this paper, it is also important to
differentiate this idea from my argument of community influence. Corporate social action takes the
perspective that corporations make strategic decisions that have social benefits for those outside the firm
(Marquis, Glynn and Davis, 2007). In this context, organizational actions are intended to assist with some
social problems that are present in an environment. These activities often take the form of some
philanthropic purpose, and are focused on giving to or acting in a way to benefit a community (Marquis et
Quttainah, M.A., 2015. Upper Echelon Theory: Role of Community and Strategy. Expert Journal of Business and Management, 3(2), pp.171-181
173
al., 2007). While some of the factors that encourage corporate social action may also influence the
characteristics of TMTs, my focus is not on actions by an organization that are directed exclusively at
benefiting the community. Each of these theories revolves around some level of external forces, which are
conscious activities in response to some outside the firm pressure. I contend the influence community has on
TMT cognitions, works as an antecedent to corporate social actions and corporate social responsibility
practices by organizations.
UET describes how an individual’s experiences and education frame cognitions and make up the
values that consciously and unconsciously shape who a manager becomes (Finkelstein and Hambrick, 1990).
In this paper I contend that that community shapes the cognitions of top management follows this same
process, and how this becomes integrated into the values and cognitions that influence decisions made by
TMTs.
Examples of community factors that can impact TMT’s cognitions include geographic
characteristics, technology, religious views, natural resources, local values and ideals, local preferences,
communication style, proximity to large cities and industry composition. These community factors can exist
in a section of a city, an entire city, a state or region, and between countries. For example, it is possible to
observe these factors play out in top manager’s cognitions by contrasting the characteristics of an individual
living in a rural Midwest City to someone living in an urban area on the west coast. Another example would
be comparing how a manager of an organization in a community where religion is very important and ideals
are conservative, differs from one living in a more liberal community where values are more diverse (Fenton,
1962; Miller and Besser, 2000; Saxenian, 1994).
Work by Bourdieu (1986) and Granovetter (1973) focused on the importance of the different
networks of organizations, and networking done by top managers. They found that these networks greatly
enable organizations through the expansion of information and opportunities. These relationships can also
establish an organization’s role in the community, such as top executives holding community positions on
different councils and boards (Johnson, Daily and Ellstrand 1996). This involvement in and with an
individual’s community would undoubtedly create an internalization of the values and characteristics held by
that community. Research also shows how association between top managers and the community develops
relationships of trust between community and the organization (DiMaggio and Powell, 1985). Such trust
would create loyalty by the people of the community for the organization, which would have positive
implications for the performance of a firm. Organizations would benefit from this loyalty by members of the
community preferring their products and services over those of other firms.
To study the influence community has on the cognitions of TMTs, it is important to look at the
decisions an organization makes and how these decisions can vary by community. Marquis et al., (2007)
describe how the community in which an organization exists influences how it spends money. They suggest
that communities such as Minneapolis encourage philanthropic giving more so than the Silicon Valley area.
It has also been found that an overwhelming majority of organizational spending takes place in the city of the
headquarters of a firm (Guthrie, 2003).
Additionally, Saxenian (1994) describes the influence community has on an organization’s
decisions. She gives a number of examples of different managerial decision-making patterns across a wide
range of locations. Much of her focus is on how living in Silicon Valley influences decisions differently than
many other areas around the country.
One example of community focus can be seen at John Deere, which was founded and is
headquartered in the United States on the border of Iowa and Illinois. John Deere has spent a lot of money in
that region, building museums and community centers, and sponsoring a number of community events such
as the John Deere Open golf tournament (http://www.deere.com). This example provides strong support for
the influence community has on the decisions and priorities of an organization. It is important to point out
that the act of giving back or spending money in a community is not necessary for how the community
influences cognitions of TMTs, but often shows what values a community possesses that become conjoined
with the values of top executives of an organization. Notice how corporate social action fits into the model
not as a directly necessary component, but as an alternative outcome in the framework.
Community can also be explained as a group in which an individual lives. Individuals have a
psychological need for relatedness, and seek relationships that create emotional bonds. These relationships
are important and are often formed by the desire to associate with those who are “like us.” Research on
social identity theory has found that people associate with certain social groups and as a result identify with
that group (Foley et al., 2002; Hogg and Terry, 2000). This finding is consistent with how TMTs would
associate themselves with a particular community and identify more with that group. Forming this kind of
identity has a strong influence on the values and characteristics that shape an individual’s cognitions. This
Quttainah, M.A., 2015. Upper Echelon Theory: Role of Community and Strategy. Expert Journal of Business and Management, 3(2), pp.171-181
174
influence fits the framework of upper echelon theory, and how the decisions made by top executives are
influenced by social identity with a community. These distinct community effects can be seen between cities,
states, regions, and countries.
Previous research has shown that community has a large impact on family firms (Anderson and
Reeb 2003), but not much work has focused on community’s influence on public firms. Arguments could be
raised that community is irrelevant in large public companies that might already exist in a number of regions
and countries and have numerous headquarters. However, I would argue that this cannot be generalized,
since many companies do have one primary physical location where the decisions makers reside. Research
also indicates that 35% of large public firms, from a broad range of industries in the United States are family
owned, and that community plays a major factor on how these organizations operate (Anderson and Reeb,
2004; Lester and Cannella 2006; Shultz et al., 2003). This and other research has examined the relationship
between family-owned corporations and firm performance.
I would argue that there is a high correlation between the cognitions of family-owned firms and the
values of public firms whose TMTs are shaped by one community. Lester and Cannella (2006) draw this
comparison, and show how community-level effects, on groups of people and organizations, provide a frame
of reference for the actions of the organization. They demonstrate how networks between family-owned
firms and community result in what they refer to as community-level social capital. The idea of community-
level social capital is driven by the connection with a community through shared values, trust, social norms,
and support of the community. The benefit of such networks on family-owned firms can also be realized by
public firms that establish the same type of relationships. By exhibiting the same connections with the
community, a public corporation will also garner the support of the community.
Another recent area of study, which points to the correlation of community level characteristics and
organizational decision making, refers to local knowledge spillover (LKS). Knowledge spillover takes the
form of intellectual development through direct or indirect exchange of information that has greater value to
the acquirer than the amount for which it was paid (Feldman and Florida, 1994). In this sense, just by being
in a certain geographic area, managers can gain knowledge that is free to them as long as they are capable of
incorporating it into the firm’s strategy.
The knowledge gained from LKS is widely understood to impact innovation, learning and growth
capabilities of organizations. Research on LKS has been combined to advocate that knowledge spillovers are
bound to a particular location (Kesidou and Romijn, 2008). This discovery implies that knowledge spillovers
being produced and acquired is a result of characteristics found within a community. Knowledge spillover
can take the shape of intellectual resources, values, ideals, and preferences of a location that become
engrained in the cognitions and values of those individuals that interact in the community. These all provide
further evidence that community factors influence the cognitive characteristics of TMTs in that location.
Proposition 1: A TMT’s community plays an instrumental role in shaping their cognitions and
values, which directly influence strategic decision making.
2.2. Organizational Expansion
The main objective of a TMT is to create value for the organization by increasing firm performance.
One strategy often used to increase the value of a firm is to grow the business beyond its current position.
Though research contributes conflicting results on the positive impact of organizational growth, there is
often still pressure on a company to expand, which leads to growth as a common business strategy. When
this strategy is pursued, it is not uncommon for a company to expand to another city, state, region or country.
TMTs face many challenges when moving into different areas and sometimes must make adaptations to
coincide with the new location. Decisions made resulting from cognitions influenced by a particular
community may not be a strategy that creates positive performance in another community or area. It makes
sense then to infer that an organization’s TMT will not face as difficult a challenge if the firm expands into a
community that is similar to the community in which the headquarter exists.
Attributes of a particular community have a tremendous impact on individuals and organizations
within that community. Since it is clear that these attributes such as religion, local ideals, social norms, and
communication styles are not shared by every area, it is recognized that differences in them can create
tension or some sense of distance between communities (Ghemawat, 2001). This is often observed as
cultural differences, which can be described not only as uniqueness between countries, but also as societal
diversity at the community level. These distinctions can impact the effectiveness of certain managerial
practices when they are practiced in a community other than the current community of a TMT. This suggests
that the success of managerial practices depends on how the cognitions and values of a TMT fit within
another community (Hofstede, 1993; Kirkman and Shapiro, 1997; Mendonca and Kanungo, 1994; Schneider,
Quttainah, M.A., 2015. Upper Echelon Theory: Role of Community and Strategy. Expert Journal of Business and Management, 3(2), pp.171-181
175
1988). The need for a fit between the values of an organization’s top management and the values of a
community suggests that a TMT would be more successful at managing firms in a similar community. In
fact, Davis and Greve (1997) found that of the top executives hired by large firms, 32% of those came from
organizations with the same area code and 39% came from organizations in the same state. This is a product
of successful decision making in one area and the correlation between a TMT’s cognitions and the
community. Though their study represents the fit of top executives within a community in the same state or
area code, physical location is not the only necessary factor moderating the relationship. This fit can be
experienced in communities that do not share a geographical closeness, but instead share the community-
level characteristics expressed in the values of a TMT.
There are a number of factors that influence how an organization will perform when it expands into
a new region. The people that make up the community play an immense role in the connection of a TMT and
the community. When top management shares the same values, perceptions, preferences, behaviors and
goals of the community in which it operates, there will be a level of integration between the organization and
the environment (Triandis, 1994). When organizational strategic actions, within the UET framework,
influenced by the cognitions and values of TMTs, fit within the cultural norms and values of a community,
that community will begin to associate with the organization (Hofstede, 1980; Schwartz, 1994; Triandis,
1995). Trust has been proven to greatly influence the relationship between an organization and the
community.
DiMaggio and Powell (1985) point out that when trust exists between a community and the members
of an organization, they will connect with the organization which will promote successful performance. Trust
can be gained informally through shared values and norms, which we know can develop into formal
networks and social structures through which TMTs can connect with a community. These networks can
encourage a relationship between a community’s preferences and its habits as a consumer. When an
organization connects with a community, the citizens will often develop preferences for that firm’s products
and services as well as begin to identify with the organization (Ghemawat, 2001). These preferences and
associations with an organization can exist not only as a result of a physical connection, but by the sharing of
values and norms. So if the values and cognitions of a TMT allow it to gain a connection with one
community, I suggest that they will also help build connections with other communities that share those
same values and norms.
Proposition 2: TMTs will be more successful when expanding to communities that are similar to the
headquarters community.
The previous section focused on the benefits resulting from expanding to a community that is similar
to top management’s current community. This section will turn our attention to the costs associated with
expanding to a community that is dissimilar. The challenges a TMT faces when a firm has more than one
physical location or is going to expand into another region can be very difficult to manage, especially if that
other location is in a community that does not share the characteristics of the headquarters’ community. Top
management must possess the ability to connect with the local culture and fit within a community. Many of
the values and characteristics of TMTs that allow an organization to conform to a particular community may
be in direct conflict with the values and characteristics possessed by another community.
This can lead to choices made by top management that result in practices that are detrimental to the
performance of the organization. Ghemawat (1997) provides an example of a television programming
company that moved into another region confident that it would realize financial success. Instead of financial
gains, the company experienced great financial loss because of the difficulty of operating in a different area.
The TMT failed to base its decisions off the cultural characteristics of the new market. By focusing primarily
on the opportunities that a new location might present, many organizational leaders fail to be attentive to
community level characteristics that often have more influence on the performance of a firm than perceived.
Galaskiewicz (1997) explains that the TMT of a firm in Silicon Valley would possibly make
decisions that would appear stingy to the people of Minneapolis, because of the value Minneapolis places on
giving. A management team may not even realize that a decision they choose may have adverse
consequences when they are used to managing firms in a community that has a different value structure. In
addition to cultural differences that may create barriers for a TMT to effectively manage in another
community, administrative and governmental aspects may pose a different type of challenge. This does not
just mean the regulatory implications that arise through performing business in different regions. Different
communities, districts, and certainly countries might have tacit rules that organizations inherently follow.
These rules are informal policies that top management in those areas knows because it is associated with the
values of the community.
Quttainah, M.A., 2015. Upper Echelon Theory: Role of Community and Strategy. Expert Journal of Business and Management, 3(2), pp.171-181
176
If a TMT expands into a community, and does not know to follow these unspoken rules, they may
make decisions that will hinder relations with the people in the community. In addition, just because a
certain community or area appears to be an attractive market, does not mean that a community will be
welcoming to an outside TMT. Ghemawat (2001) found that governments will often take actions to prevent
outside organizations from controlling their market. People in certain locations will also take a stand against
outside firms expanding into their community. We commonly see this resistance with Wal-Mart and other
mega-retailers trying to move into many communities where the residents do not believe the organization
shares their values (Bronn, 2006). This resistance can also been seen in articles on websites such as
walmartwatch.com and reclaimdemocracy.org/walmart/. These examples point out the challenges many
TMTs will face when they attempt to move into different areas, particularly when the community is different
from the one that has shaped them.
Proposition 3: A TMT will be less effective at managing the firm if they choose to expand into a
community that is dissimilar to the headquarters’ community.
2.3. Overcoming Boundaries
When a TMT is influenced by a community, there will be challenges to overcome in order to make
successful strategic decisions in different communities. Though expansion to a new area will increase the
challenges, there are several ways in which an organization can overcome these challenges by lowering and
raising the boundaries of community shaped cognitions. One measure a firm can take is in regards to top
management team diversity. Organizations in today’s business environment often have top management
teams that are comprised of a diverse conglomerate of individuals. When the cognitions of numerous top
managers have been shaped by different community level factors, the decisions made by that TMT would be
different than if they were all shaped by the same community. A TMT with a diverse community background
may be able to perform better than a TMT with a homogeneous community background if the company
expands into a dissimilar community to the headquarters. There has been a stream of research that focuses on
the effects of organizational diversity on firm performance. Studies have also attempted to measure the
effects of diverse TMTs on the performance of a business.
Research by Lyon and Ferrier (2002) looked at demographic characteristics and found a positive
relationship between TMT heterogeneity and performance. They found that the strategic decisions of a TMT
with diverse demographic characteristics lead to creativity and increased innovation. Other studies however
have found that TMT heterogeneity can also negatively affect an organization by increasing the possibility of
conflicts (Chatman and Flynn, 2001). To examine whether a TMT that has been shaped by the values of
multiple communities would perform better in a specific community, it would help to know the culture of the
community to which a firm wishes to expand. To test the impact of demographic diversity on TMTs in other
cultures, Wei et al. (2005) conducted research on organizations in China. They set up interviews in a number
of organizations to find the demographic backgrounds and team diversity of top management. Consistent
with other research examining this relationship, they found mixed results of TMT heterogeneity and firm
performance. Occupational experience of the TMTs was found to have a positive effect on firm performance.
Variable occupational experiences would be influenced by community level factors, so TMTs with
backgrounds from multiple communities would manage more effectively when operating in a different
community.
There is another benefit that a TMT with multiple community characteristics can achieve for an
organization. This benefit would take the form of social capital resulting from networking, which forms
community level relationships. The development of these relationships with members of a community does
not happen through one individual, but instead through the interaction of different individuals of an
organization with different groups within a community (Bourdieu, 1983). Any given community will also
exhibit multiple sets of values and cognitions that are not always congruent among all community members.
So it may benefit an organization to have top managers with different sets of community influenced
cognitions, in order to match the different sets of values present in the new community especially if it is
dissimilar to the current one. It is helpful to draw a comparison between this relationship and the benefits
seen with interlocks among boards of directors. Interlocks have been found to provide a connection with
some environmental factor that the firm would not otherwise possess (Pfeffer, 1972).
Interlocks can often help a firm to co-opt to form a bridge by which information and knowledge can
be acquired by an organization. The number of interlocks a firm has within its directors often aids TMTs to
manage more effectively. When the values of top executives create a connection with a community, it will
allow the managers to co-opt with certain social networks that may provide information and knowledge that
will aid in decision-making. Upper echelons with a broad range of values and cognitions will be able to
Quttainah, M.A., 2015. Upper Echelon Theory: Role of Community and Strategy. Expert Journal of Business and Management, 3(2), pp.171-181
177
connect with different groups within an area, which will increase the avenues through which the organization
as a whole can acquire resources through social capital. Having top managers that have been influenced by a
diversity of communities will thus increase the TMT’s effectiveness of decision-making in a dissimilar
community.
Proposition 4a: A TMT that has been influenced by a diverse range of communities will perform
better if the organization expands to a location that is dissimilar to the headquarters community.
Another logical thing upper echelons can do to overcome the boundaries of cognitions being framed
by community is to move into communities that are similar to the current location. One-reason firms fail or
at least fall short of expectations when entering new markets is because the organizational culture does not
align with that of the new area. When this lack of fit exists between the values and cognitions of community
and the TMT, an organization will consequently experience negative implications (Robert et al., 2000). In
order to increase the likelihood of benefiting from expanding, a TMT can look for symmetries with different
communities. Organizations also need to realize that networks that encourage fit often extend beyond the
current boundaries of the community (Lester and Cannella, 2006). By looking for communities that share the
values and characteristics of the current community, an organization can employ a growth strategy into other
communities, while still matching the cognitions of management with the new community.
Proposition 4b: A TMT will benefit by looking for communities that share the same values and
characteristics of the headquarters community.
Another thing executives must be aware of is the social norms and values of the community to which
a firm is expanding. A TMT cannot assume that another community will share the cognitions and values they
have developed by residing in a particular community. Even when the geographic distance is minimal,
differences in social norms, which should not be overlooked, may still exist (Deans and Larson, 2008).
Ghemawat (2001) indicates that it is important for TMTs to be aware of administrative and political factors
such as laws, regulations, and historical attributes that will impact a firm’s decision to locate to another
community. Acting in accordance should decrease the resistance not only by the members of the community,
but also by the administrative and governmental entities of the area. These characteristics can be accounted
for by the entry mode chosen by an organization. Herrmann and Datta (2002) studied the impact of CEO
background characteristics on CEO succession and the choice of entry into a new market, such as wholly-
owned subsidiaries, joint ventures, and contractual entry modes. TMTs can consider these findings when
deciding to expand into a new community. When the values and cognitions of a TMT do not align with those
of the community in which they want to expand, it might be wise to consider different modes to entry.
Knowing the social norms and values of the new community will allow the firm to make effective decisions.
Proposition 4c. A TMT will be more effective at lowering the boundaries of community shaped
cognitions when it knows the social norms and values of the new community.
A TMT can also overcome the boundary of community influenced values and cognitions by looking
for opportunities where current social networks or bonds with a community either already extend to other
areas or offer avenues through which networks can be extended. Executives can also utilize a growth
strategy based off the practices of another entity. In a study of law firms that expand internationally, Pinto
(2008) found that some law firms base the decision to enter a new area on where other businesses enter. Law
firms that represent an organization that enters into a new area found success when they expanded to the
same location. This creates a relationship that assists the organization to quickly achieve effective
performance, and also allows an organization to avoid some of the boundaries that would exist without a
preexisting relationship. This strategy would not work for organizations in any industry, but could definitely
benefit one with business customers that expand to new communities.
Proposition 4d: TMT’s will be more effective by expanding to communities where social networks
already extend or by following others with whom a relationship exists.
3. Discussion and Conclusion
This paper focuses on what upper echelon theory says about the cognitions and characteristics that
influence the strategic decisions of top management teams. While previous studies of TMTs have focused on
how experience, education, and personal values structure cognitions and characteristics of upper
management, there has not been any research that examined the impact the TMT’s community has on these
cognitions. I have provided an explanation that shows a relationship between the values possessed by a
Quttainah, M.A., 2015. Upper Echelon Theory: Role of Community and Strategy. Expert Journal of Business and Management, 3(2), pp.171-181
178
community and how that frames the cognitions of an organization’s top management. The impact of
community on TMT cognitions was also examined as a contributing factor of firm performance in multiple
communities. I argued that when one community has shaped a TMT’s cognitions, they would be more
successful at managing an expansion of the firm into a community with similar values. Further, that a TMT
may be less effective at managing an organization if it expands into a community that has values and
characteristics that are dissimilar from those of the headquarters’ community. Another implication of
community influence on top executives considered the makeup of the TMT. I showed that a TMT comprised
of individuals that have been shaped by multiple diverse communities, will likely have a unique set of
cognitions that influence decisions. A TMT that has diverse values and cognitions influenced by multiple
community level factors will likely be better suited for managing an organization when it expands into a
community that is dissimilar to the current community. The cognitions and values of one community that
influence a TMT can place boundaries on an organization that can affect firm performance. I explained some
ways in which TMTs can overcome these boundaries and adapt in order to be successful in various
communities and areas.
Though effects of TMT’s relationships with community as a key to building social capital to benefit
the firm are mentioned, the impact community has on the directors of an organization is not mentioned.
Many companies use directors as interlocks to co-opt with environments outside the firm. Directors are used
to attain access to particular resources or knowledge to which the firm would not otherwise have access.
Further studies could look at the impact community has on the governance structure of an organization to
benefit the growth strategy of a firm.
I also compared and contrasted corporate social responsibility and corporate social action with
communities influence on the cognitions and characteristics of TMTs. Those theories revolve around the
organization doing something for the community, but do not necessarily encompass the influence community
has on values and cognitions possessed by TMTs. It would be interesting to see how decisions made by top
executives with values shaped by a community, would result in practicing corporate social responsibility and
taking corporate social actions. This could be one way to measure the way community shapes the cognitions
of top executives, by looking at the corporate social actions an organization take. I also suggest that
communities would differ regarding the strength with which it influences top executive’s cognitions. Some
communities would greatly affect values and cognitions, while others would have a more moderate impact.
Future work could examine the role different types of communities have and the implications of that on the
cognitions of top management in those communities.
Upper echelon theory was introduced to explain the central issue in strategy of why firms differ. It
focuses on the impact top management teams have on this difference, and how it affects firm performance.
Recognizing how community influences the cognitions and values of TMTs will help to explain differences
in the decisions among a variety of firms. It also provides evidence for why one firm may perform better
than another in a given location. Knowing how community influences impact the cognitions of TMTs will
also help an organization that wants to expand into a new community. Understanding how community
influences the cognitions and strategic decisions of a TMT will affect the future direction of a firm and
explain how it impacts a firm’s performance.
References
Anderson, R.C. and Reeb, D.M., 2004. Board composition: Balancing family influence in SandP 500 firms.
Administrative Science Quarterly, 49, pp.209-237.
Bantel, K. and Jackson, S., 1989. Top management and innovations in banking: Does the composition of the
top team make a difference? Strategic Management Journal, 10, pp.107-124.
Barney, J.B., 2001. Resource-based theories of competitive advantage: A ten-year retrospective on the
resource-based view. Journal of Management, 27, pp.643-650.
Barney, J.B., 1991. Firm resources and sustained competitive advantage. Journal of Management, 17, pp.99-
120.
Bourdieu, P., 1983. The Forms of Capital. Westport, CT: Greenwood Press.
Bourdieu, P., 1986. The forms of capital. In J.G. Richardson (Ed.). Handbook of theory and research for the
sociology of education, Westport, CT: Greenwood Press, pp.241-258.
Bronn, P.S., 2006. Building corporate brands through community involvement: Is it exportable? The case of
the Ronald McDonald House in Norway. Journal of Marketing Communications, 12, pp.309-320.
Carson, C.M., Mosley, D.C. and Boyar, S.L., 2004. Performance gains through diverse top management
teams. Team Performance Management, 10, pp.121-126.
Quttainah, M.A., 2015. Upper Echelon Theory: Role of Community and Strategy. Expert Journal of Business and Management, 3(2), pp.171-181
179
Chatman, J. and Flynn, F., 2001. The influence of demographic heterogeneity on the emergence and
consequences of cooperative norms in work teams. Academy of Management Journal, 44, pp.956-
974.
Coombs, J.E. and Gilley, K.M., 2005. Stakeholder management as a predictor of CEO compensation: Main
effects and interaction with financial performance. Strategic Management Journal, 26, pp.827-840.
Dahlsrud, A., 2008. How corporate social responsibility is defined: An analysis of 37 definitions. Corporate
Social Responsibility and Environment Management, 15, pp.1-13.
Davis, G. and Greve, H., 1997. Corporate elite networks and governance changes in the 1980s. American
Journal of Sociology, 103, pp.1-37.
Deans, G. and Larson, M., 2008. Growth for growth’s sake: A recipe for a potential disaster. Ivey Business
Journal, 72, pp.1-12.
Deere and Company, 2008. Deere and Company achieves highest rank ever on corporate citizenship list.
[online] Available at:
http://www.deere.com/en_US/newsroom/2008/releases/corporate/2008_0220release.html. [Accessed
on February 20, 2008].
Dierickx, I. and Cool, K., 1989. Asset stock accumulation and sustainability of competitive advantage.
Management Science, 35, pp.1504-1511.
DiMaggio, P. and Powell, W., 1985. The structure of corporate ownership: Causes and consequences.
Journal of Political Economy, 93, pp.1155-1177.
Engle, R.L., 2007. Corporate social responsibility in host countries: a perspective from American managers.
Corporate Social Responsibility and Environmental Management, 14(1), pp.16-27 DOI:
I0.I002/csr.114.
Feldman, M. and Florida, R., 1994. The geographic sources of innovation: Technological infrastructure and
product innovation in the United States. Annals of the Association of American Geographers, 84,
pp.210-229.
Fenton, J.H., 1962. Liberal-conservative divisions of sections of the United States. The Annals of the
American Academy of Political and Social Science, 344, pp.122- 127.
Finkelstein, S. and Hambrick, D., 1987. Managerial discretion: A bridge between polar views of
organizational outcomes. Research in Organizational Behavior, 9, pp.369- 406.
Finkelstein, S. and Hambrick, D., 1990. Top management tenure and organizational outcomes: The
moderating role of managerial discretion. Administrative Science Quarterly, 35, pp.484-503.
Finkelstein, S. and Hambrick, D., 1996. Strategic Leadership: Top executives and their effects on
organizations. Minneapolis and St Paul: West Publishing Company.
Foley, S., Kidder, D., and Powell, G., 2002. The perceived glass ceiling and justice perceptions: An
investigation of Hispanic law associates. Journal of Management, 28, pp.471-496.
Galaskiewicz, J., 1997. An urban grants economy revisited: Corporate charitable contributions in the Twin
Cities. Administrative Science Quarterly, 42, pp.445- 471.
Ghemawat, P., 2001. Distance still matters. The hard reality of global expansion. Harvard Business Review,
79, pp.137-147.
Ghislanzoni, G., Penttinen, R. and Turnbull, D., 2008. The multilocal challenge: Managing cross-border
functions. McKinsey Quarterly, pp. 70-81.
Gomez-Mejia, L.R., Larraza-Kintana, M. and Makri, M., 2003. The determinants of executive compensation
in family-controlled public corporations. Academy of Management Journal, 46, pp.226-237.
Granovetter, M., 1973. The strength of weak ties. American Journal of Sociology, 78, pp.1360-1380.
Guthrie, D., 2003. Survey on Corporate-community relations. New York: Social Sciences Research Council.
Hambrick, D.C., Cho, T.S. and Chen, M-J., 1996. The influence of top management team heterogeneity on
firms’ competitive moves. Administrative Science Quarterly, 41, pp.659-684.
Hambrick, D.C. and Mason, P.A., 1984. Upper echelons: The organization as a reflection of its top
managers. Academy of Management Review, 9, pp.193-206.
Hermann, P. and Datta, D.K., 2002. CEO successor characteristics and the choice of foreign market entry
mode: An empirical study. Journal of International Business Studies, 33, pp.551-569.
Hofstede, G., 1980. Culture’s Consequences: International Differences in Work-Related Values. Beverly
Hills: Sage.
Hofstede, G., 1993. Cultural constraints in management theories. Academy of Management Executive, 7,
pp.81-94.
Hogg, M. and Terry, D., 2000. Social identity and self-categorization processes in organizational contexts.
Academy of Management Review, 25:121-140.
Quttainah, M.A., 2015. Upper Echelon Theory: Role of Community and Strategy. Expert Journal of Business and Management, 3(2), pp.171-181
180
Jackson, M., Houdard, F. and Highfield, M., 2008. Room to grow: Business location, global expansion and
resource deficits. Journal of Business Strategy, 29, pp.34-39.
Johnson, J., Daily, C., and Ellstrand, A., 1996. Boards of directors: A review and research agenda. Journal of
Management, 22, pp.409-438.
Kaplan, S., 2005. Seeing the light: Cognitive frames and firm response to the fiber-optic revolution.
Academy of Management, pH1-H6.
Kesidou, E. and Romijn, H., 2008. Do local knowledge spillovers matter for development? An empirical
study of Uruguay’s software cluster. World Development, 36, pp.2004-2028.
Kirkman, B. and Shapiro, D., 1997. The impact of cultural values on employee resistance to teams: Toward a
model of globalized self-managing work team effectiveness. Academy of Management Review, 22,
pp.730-757.
Lester, R.H. and Cannella, A.A., Jr., 2006. Interorganizational familiness: How family firms use interlocking
directorates to build community-level social capital. Entrepreneurship Theory and Practice, pp. 755-
775.
Lyon, D. and Ferrier, W., 2002. Enhancing performance with product-market innovation: The influence of
the top management team. Journal of Managerial Issues, 14, pp.452-469.
Marquis, C., Glynn, M.A. and Davis, G., 2007. Community isomorphism and corporate social action.
Academy of Management Journal, 32, pp.925-945.
Mendonca, M. and Kanungo, R., 1994. Managing human resources: The issues of cultural fit. Journal of
Management Inquiry, 3, pp.189-205.
Miller, N.J. and Besser, T.L., 2000. The importance of community values in small business strategy
formation: Evidence from rural Iowa. Journal of Small Business Management, 38, pp.68-86.
Miller, C., Burke, L. and Glick, W., 1998. Cognitive diversity among upper-echelon executives: Implications
for strategic decision processes. Strategic Management Journal, 19, pp.39-58.
O’Reilly, C. and Flatt, S., 1989. Executive team demography, organizational innovation, and firm
performance. Working paper, University of California, Berkeley.
Peng, M., Lee, S. and Wang, D., 2005. What determines the scope of the firm over time? A focus on
institutional relatedness. Academy of Management Review, 30, pp.622- 633.
Peteraf, M.A., 1993. The cornerstones of competitive advantage: A resource-based view. Strategic
Management Journal, 14, pp.179-191.
Pfeffer, J. and Davis-Blake, A., 1986. Administrative succession and organizational performance: How
administrator experience mediates the succession effect. Academy of Management Journal, 29,
pp.72-83.
Pinto, R., 2008. How many roads? International Financial Law Review, 27, pp.48-50.
Pitelis, C. and Sugden, R., 1986. The separation of ownership and control in the theory of the firm: A
reappraisal. International Journal of Industrial Organization, 4, pp.69-86.
Robert, C., Probst, T., Martocchio, J., Drasgow, F. and Lawler, J., 2000. Empowerment and continuous
improvement in the United States, Mexico, Poland, and India: Predicting fit on the basis of the
dimensions of power distance and individualism. Journal of Applied Psychology, 85, pp.643-658.
Runyan, R., Huddleston, P. and Swinney, J., 2007. A resource-based view of the small firm. Using a
qualitative approach to uncover small firm resources. Qualitative Market Research: An International
Journal, 10, pp.390-402.
Saxenian, A., 1994. Regional Advantage: Culture and competition in Silicon Valley and Rout 128.
Cambridge, MA: Harvard University Press.
Schneider, S., 1988. National vs. corporate culture: Implications for human resource management. Human
Resource Management, 27, pp.231-246.
Schulze, W.S., Lubatkin, M.H. and Dino, R.N., 2003. Exploring the agency consequences of ownership
dispersion among directors of private family firms. Academy of Management Journal, 46, pp.179-
194.
Schulze, W.S., Lubatkin, M.H., Dino, R.N. and Buchholtz, A.K., 2001. Agency relationships in family firms:
Theory and evidence. Organization Science, 12, pp.99-116.
Schwartz, S., 1994. Beyond individualism and collectivism: New cultural dimensions of values. In U. Kim,
H.C. Triandis, C. Kagitcibasi, S-C. Choi, and G. Yoon, Eds.. Individualism and collectivism:
Theory, method, and applications. Newbury Park, CA: Sage.
Smith, J.E., Carson, K.P. and Alexander, R.A., 1984. Leadership: It can make a difference. Academy of
Management Journal, 27, pp.765-776.
Triandis, H., 1994. Culture and Social Behavior. New York: McGraw Hill.

Quttainah, M.A., 2015. Upper Echelon Theory: Role of Community and Strategy. Expert Journal of Business and Management, 3(2), pp.171-181
181
Wei, L., Lau, C., Young, M.N. and Wang, Z., 2005. The impact of top management team demography on
firm performance in China. Asian Business and Management, pp. 227-250.
Welford, R. and Frost, S., 2006. Corporate social responsibility in Asian supply chains. Corporate Social
Responsibility and Environmental Management, 13, pp.166-176.
Wiersema, M. and Bantel, K., 1992. Top management team demography and corporate strategic change.
Academy of Management Journal, 35, pp.91-121
Expert Journal of Business and Management, Volume 3, Issue 2, pp. 182-188, 2015
© 2015 The Authors. Published by Sprint Investify. ISSN 2344-6781
http://Business.ExpertJournals.com
182
The Impact of SOX Adoption on the
Compensation of Non-US Companies’ Boards:
The Case of Canadian Companies
Nadejda SERDIUC and Hanen KHEMAKHEM*
École des Sciences de la Gestion de l'Université du Québec à Montréal
ESG-UQAM
The purpose of this article is to study the relationship between the adoption of the
Sarbanes-Oxley Act (SOX) and the compensation of the board of directors of
Canadian companies listed on US stock markets. The SOX act, promulgated on 30
July 2002 and the rules adopted by the Securities and Exchange Commission (SEC)
require, among furthermore, a majority of independent directors on boards. The
literature focuses on two main differences between US companies and Canadian
companies: more concentrated ownership and the smaller market capitalization of
Canadian companies. Therefore, a consistent application of SOX on all the
companies that differ at the base, in their size and structure, may have a different
impact on the costs of compliance. Using a sample of 17 Canadian companies listed
on US stock exchanges from 2001 to 2004, our analysis show that there is a link
between the adoption of SOX and the increased in the cash compensation of the
board of directors. The results also show that the effect of SOX is different
depending on the company’s size.
Keywords: SOX, Board of directors, Board compensation, Canadian companies
JEL Classification: G380
1. Introduction
The US regulations including the Sarbanes-Oxley Act (SOX), the rules adopted by the Securities and
Exchange Commission (SEC), the New York Stock Exchange (NYSE) and National Association of
Securities Dealers (NASD) focus on the importance of independent directors on the board of directors and its
committees. SOX focuses mainly on the audit committees of public companies. Article 301 (Public
Company Audit Committes) requires that each member of the audit committee be independent. The rules
adopted by the NYSE and NASDAQ require companies to have a majority of independent directors and
compensation committees and appointment / fully independent governance. (The SEC Release No. 34-
48745).
* Corresponding Author:
Hanen Khemakhem, Accounting department, ESG-UQAM École des Sciences de la Gestion de l'Université du Québec à Montréal, Canada
Article History: Received 15 October 2015 | Accepted 28 October 2015 | Available Online 14 November 2015
Cite Reference: Serdiuc, N. and Khemakhem, H., 2015. The Impact of SOX Adoption on the Compensation of Non-US Companies’ Boards: The Case of Canadian
Companies. Expert Journal of Business and Management, 3(2), pp.182-188
Serdiuc, N. and Khemakhem, H., 2015. The Impact of SOX Adoption on the Compensation of Non-US Companies’ Boards: The Case of Canadian
Companies. Expert Journal of Business and Management, 3(2), pp.182-188
183
According to several authors, board independence is important for the preservation of shareholder
wealth (Berle and Means, 1932; Fama and Jensen, 1983; Jensen, 1993). However, the effectiveness of
independent directors is limited due to information asymmetry compared to the internal board members.
Indeed, most studies find no significant relationship between board independence and firm performance
(Agrawal and Knoeber 1996; Bhagat and Black, 2002). Also, several authors have shown that there is an
increased cost due to increased regulation (Wintoki, 2007; Bruno and Claessens, 2010; Litvak, 2007; Butler
and Ribstein, 2006). Besides Linck, Netter and Yang (2009) found that the application of SOX increases the
costs of remuneration of the directors by increasing their workload and their risks. Chhaochharia and
Grinstein (2007) found that high compliance costs of new regulations have had major consequences for
small businesses.
The purpose of this article is to show the impact of the application of Sox on other companies than
American companies in term of board fees. Our goal is to analyze how does SOX, which is an international
law enforcement, affected the costs of remuneration of directors of foreign companies such as Canadian
companies listed on US markets. Indeed, SOX does not apply only to US companies, but all companies
whose securities are traded on US exchanges (Litvak, 2007). Many of these companies are non-US
companies with multiple differences such as the company's structure and size.
According to Gray (2005), in the case of Canadian companies, these differences imply first, a more
concentrated ownership, compared to US companies. This feature could be decisive for the increased
independence of the Board.
Another difference is the fact that many Canadian companies are characterized by a market
capitalization which is smaller than US. Canada unlike the United States, do not have a national securities
commission and is characterized by a large number of actors involved in the regulation of financial markets
(Carnaghan and Gunz, 2007).
The cross listing of Canadian companies allow us to conduct this study. In addition, mandatory vs
voluntary approaches (Canadian regulation on board of directors is non-mandatory, e.g. policy Statement 58-
201 in Canada. See Khemakhem, Baillargeon and Gélinas (2014) for further information.) and the different
dates of entry into force of governance reforms in both countries are favourable to the realisation of this
work. There are several studies that have examined the analysis of the costs and benefits of SOX on US
companies (Butler and Ribstein, 2006; Linck, Netter and Yang, 2009; Wintoki, 2007), or foreign companies
(Litvak, 2007). However, the analysis of the impact of SOX on the costs of remuneration of Canadian boards
remains little explored in the literature.
Our analysis contributes to the debate on the uniform application of SOX on all the companies listed
on US exchanges, including foreign companies whose country of origin have different laws and practices.
Our results show that there is a link between the entry into force of SOX, which imposes certain
characteristics of the board, and the costs of remuneration of directors of Canadian companies listed on US
stock markets.
2. Literature Review and Hypotheses
Several studies show that the introduction of new rules may affect the value of the firm. Indeed,
Chhaochharia and Grinstein (2007) and Wintoki (2007) find that SOX in the US has negatively affected the
value of some US companies.
Wintoki (2007) emphasizes the fact that it is the small companies that have suffered most from the
implementation of SOX because of higher costs. His results indicate that boards are generally structured
according to economic efficiency and maximizing the company's value. Therefore, a company whose
optimal board structure requires more internal directors on the board could have less benefit from the new
governance rules requiring more independent directors on the board.
Arcot and Bruno (2005) argue that the rules of governance are an exercise of checking boxes for
businesses, where more marked boxes means better corporate governance. If the effectiveness of corporate
governance following the adoption of SOX is still estimated in the years that follow, compliance costs them
are more obvious. To meet the new requirements companies must assess and document their existing control
systems, determine what changes are necessary to improve these systems to implement the changes and test
the effectiveness of internal controls established. The costs of achieving these tasks include increasing
salaries and benefits, external consulting fees and new and appropriate technologies (hardware and software)
(Eldridge and Kealey, 2005). In addition, the increased responsibility of directors and officers, generated by
this wave of regulatory provisions, serves to discourage entrepreneurial behavior (Gray, 2005).
Serdiuc, N. and Khemakhem, H., 2015. The Impact of SOX Adoption on the Compensation of Non-US Companies’ Boards: The Case of Canadian
Companies. Expert Journal of Business and Management, 3(2), pp.182-188
184
The compliance cost with SOX is according to different estimates in the tens of billions of US
dollars (Gray, 2005). This significant financial burden fell disproportionately on small companies before
SOX, had fewer outside directors that large companies according Linck et al. (2009). Indeed, their study
shows that spending by smaller companies towards the compensation of directors appear to have greatly
increased. According to this, they went from $ 21,688 to $ 40,783 for medium enterprises between 2001 and
2004. For small businesses, compensation for outside directors increased from $ 7.25 to $ 9.76 per $ 1,000 in
net sales during the same period, compared to an insignificant increase of $ 0.20 per $ 1,000 in net sales for
large companies.
The costs of SOX compliance are disproportionate specifically for small businesses. To avoid SOX,
some small businesses have chosen to become private, or to reduce the number of public registered
shareholders below 300, which is the application threshold imposed by the Securities and Exchange Act of
1934, including SOX belongs. Butler and Ribstein (2006) conclude that there is no justification to impose
new laws, even if they could reduce fraud, and as long as compliance costs outweigh any potential benefit
from the reduction of fraud.
In this regard, Morgenstern, Nealis and Kleinman (2004) argue that the small cap issuers generally
have a more limited financial strength (often with less experience in the public sector) and major emitters.
Small businesses, according to these authors, have sometimes only one financial officer and no internal staff.
CFOs of these companies regularly play multiple roles in finance, administration and operations. These
transmitters may find that management spends a lot of time to the disclosure required by the SEC and
compliance rather than operations and profitability.
Morgenstern, Nealis and Kleinman (2004) and point out that small issuers that have insufficient
resources and a limited number of qualified administrators, will be less able to recruit, reward, or retain the
talent needed. Their empirical data show that the costs of administrator’s retention increase when the size of
the company decreases. Morgenstern, Nealis and Kleinman (2004) conclude that the Sarbanes-Oxley (SOX)
must be reconsidered with a significant sensitivity of its impact on mid-cap issuers, private companies and
general capital markets. For SOX achieve its objectives, the rules must make a stronger distinction between
issuers by market capitalization or income.
Bruno and Claessens (2010) found that strong governance practices are less profitable for small
businesses, probably because of the high costs in terms of monitoring, time and resources that exceed the
benefits. The same authors argue that it is better to leave the control of managers to market forces and that
SOX imposes an unnecessary bureaucratic weight.
In this vein, we look at the consequences for foreign issuers subject to SOX, including Canada and
whose capital structure is different from that of US companies. Because of their activity, many Canadian
companies are subject to US regulations. There are several differences between the Canadian and US
regulations relating to governance, namely the adoption approach (mandatory / voluntary) or the effective
date but also in the financial structure of the companies (Carnaghan Gunz, 2007). Indeed, Canadian
companies are characterized by low market capitalization compared to the US. Canadian companies also
have a more concentrated ownership and higher homestead that US companies. In Canada, the regulations
relating to the Board of Directors is mostly voluntary. Indeed, the independence of the board is not
mandatory in Canada.
Given these characteristics, we expect that the costs relating to the remuneration of directors in
Canadian companies, subject to US regulations, be increased after the adoption of SOX and the fact that this
increase is different depending on the size of companies. We therefore test the following hypotheses:
H 1: The adoption of SOX increases the board of directors’ fees of Canadian companies listed in US
financial markets.
H 2: The effect of the adoption of SOX depends on company size.
3. Research Methodology
3.1. Sample Selection and Data Collection
Our starting point is the set of Canadian companies listed on US stock market from 2001 to 2004
before the entry into force of Canadian regulation. Financial sector companies are eliminated cause of their
special regulations. Companies that have experienced significant variations in size are eliminated to allow us
to analyze the size effect.
The final sample was 17 for a total of 64 firm-year observations. Table 1 details the sample
selection.
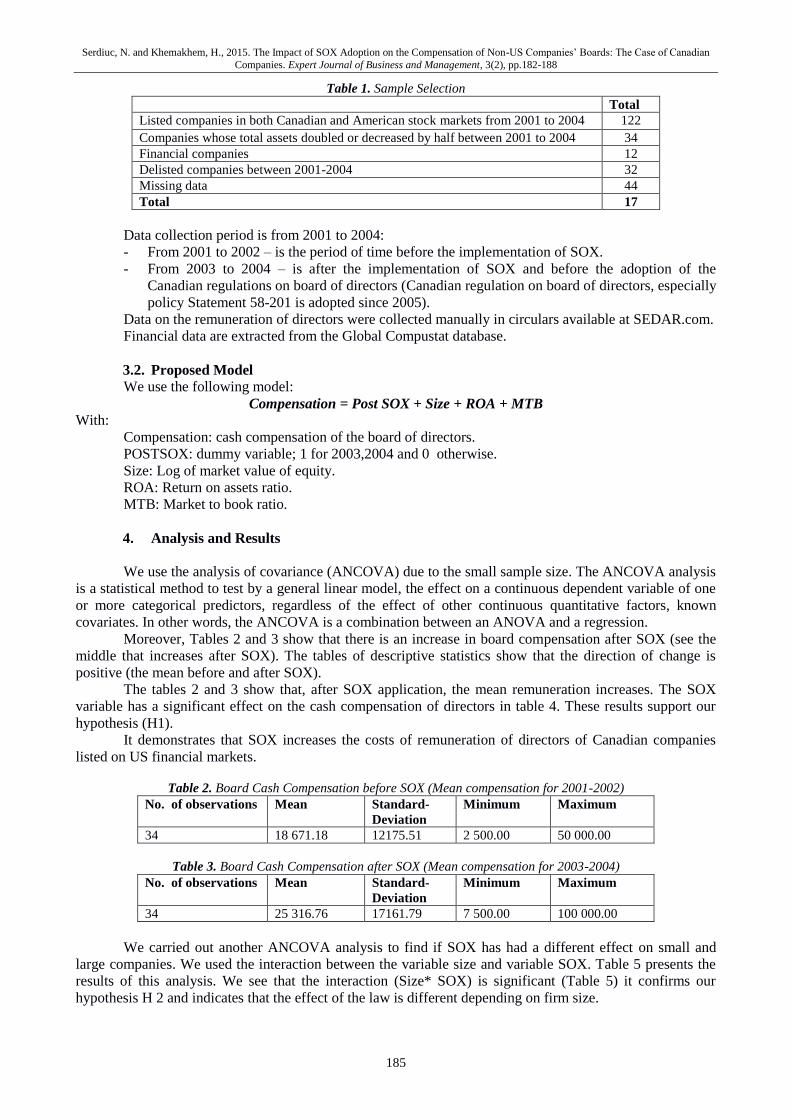
Serdiuc, N. and Khemakhem, H., 2015. The Impact of SOX Adoption on the Compensation of Non-US Companies’ Boards: The Case of Canadian
Companies. Expert Journal of Business and Management, 3(2), pp.182-188
185
Table 1. Sample Selection
Total
Listed companies in both Canadian and American stock markets from 2001 to 2004 122
Companies whose total assets doubled or decreased by half between 2001 to 2004 34
Financial companies 12
Delisted companies between 2001-2004 32
Missing data 44
Total 17
Data collection period is from 2001 to 2004:
- From 2001 to 2002 – is the period of time before the implementation of SOX.
- From 2003 to 2004 – is after the implementation of SOX and before the adoption of the
Canadian regulations on board of directors (Canadian regulation on board of directors, especially
policy Statement 58-201 is adopted since 2005).
Data on the remuneration of directors were collected manually in circulars available at SEDAR.com.
Financial data are extracted from the Global Compustat database.
3.2. Proposed Model
We use the following model:
Compensation = Post SOX + Size + ROA + MTB
With:
Compensation: cash compensation of the board of directors.
POSTSOX: dummy variable; 1 for 2003,2004 and 0 otherwise.
Size: Log of market value of equity.
ROA: Return on assets ratio.
MTB: Market to book ratio.
4. Analysis and Results
We use the analysis of covariance (ANCOVA) due to the small sample size. The ANCOVA analysis
is a statistical method to test by a general linear model, the effect on a continuous dependent variable of one
or more categorical predictors, regardless of the effect of other continuous quantitative factors, known
covariates. In other words, the ANCOVA is a combination between an ANOVA and a regression.
Moreover, Tables 2 and 3 show that there is an increase in board compensation after SOX (see the
middle that increases after SOX). The tables of descriptive statistics show that the direction of change is
positive (the mean before and after SOX).
The tables 2 and 3 show that, after SOX application, the mean remuneration increases. The SOX
variable has a significant effect on the cash compensation of directors in table 4. These results support our
hypothesis (H1).
It demonstrates that SOX increases the costs of remuneration of directors of Canadian companies
listed on US financial markets.
Table 2. Board Cash Compensation before SOX (Mean compensation for 2001-2002)
No. of observations Mean Standard-
Deviation
Minimum Maximum
34 18 671.18 12175.51 2 500.00 50 000.00
Table 3. Board Cash Compensation after SOX (Mean compensation for 2003-2004)
No. of observations Mean Standard-
Deviation
Minimum Maximum
34 25 316.76 17161.79 7 500.00 100 000.00
We carried out another ANCOVA analysis to find if SOX has had a different effect on small and
large companies. We used the interaction between the variable size and variable SOX. Table 5 presents the
results of this analysis. We see that the interaction (Size* SOX) is significant (Table 5) it confirms our
hypothesis H 2 and indicates that the effect of the law is different depending on firm size.
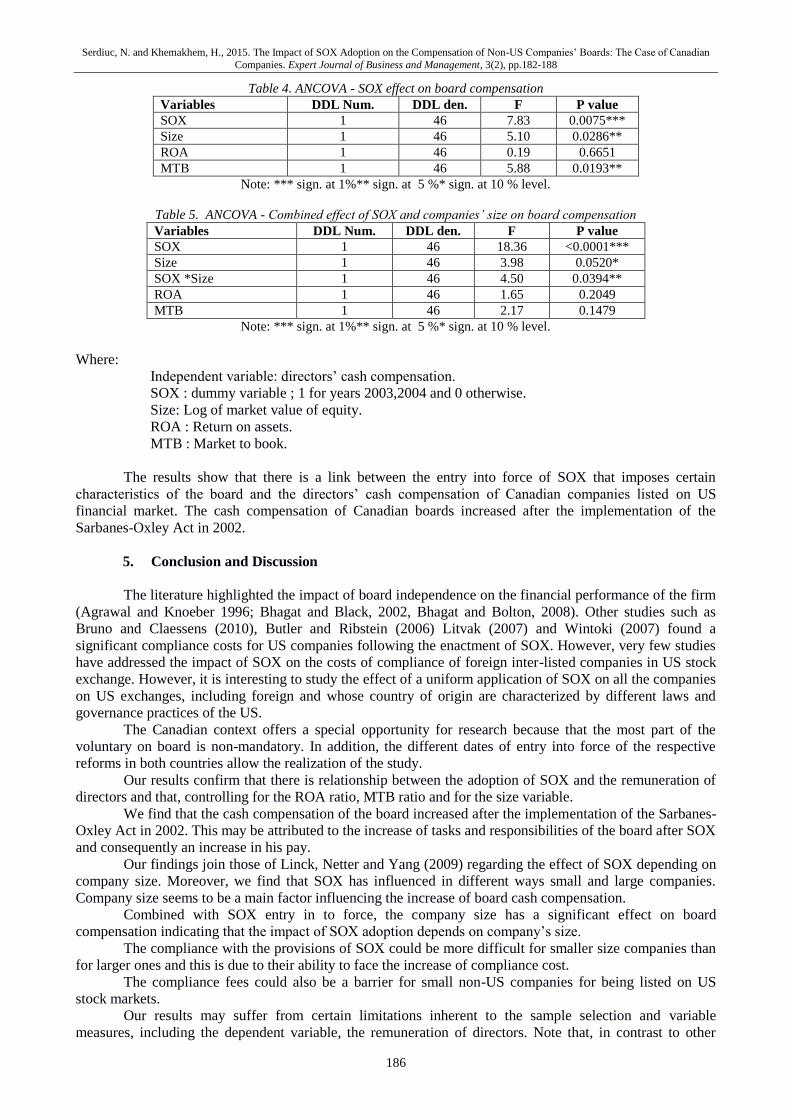
Serdiuc, N. and Khemakhem, H., 2015. The Impact of SOX Adoption on the Compensation of Non-US Companies’ Boards: The Case of Canadian
Companies. Expert Journal of Business and Management, 3(2), pp.182-188
186
Table 4. ANCOVA - SOX effect on board compensation
Variables DDL Num. DDL den. F P value
SOX 1 46 7.83 0.0075***
Size 1 46 5.10 0.0286**
ROA 1 46 0.19 0.6651
MTB 1 46 5.88 0.0193**
Note: *** sign. at 1%** sign. at 5 %* sign. at 10 % level.
Table 5. ANCOVA - Combined effect of SOX and companies’ size on board compensation
Variables DDL Num. DDL den. F P value
SOX 1 46 18.36 <0.0001***
Size 1 46 3.98 0.0520*
SOX *Size 1 46 4.50 0.0394**
ROA 1 46 1.65 0.2049
MTB 1 46 2.17 0.1479
Note: *** sign. at 1%** sign. at 5 %* sign. at 10 % level.
Where:
Independent variable: directors’ cash compensation.
SOX : dummy variable ; 1 for years 2003,2004 and 0 otherwise.
Size: Log of market value of equity.
ROA : Return on assets.
MTB : Market to book.
The results show that there is a link between the entry into force of SOX that imposes certain
characteristics of the board and the directors’ cash compensation of Canadian companies listed on US
financial market. The cash compensation of Canadian boards increased after the implementation of the
Sarbanes-Oxley Act in 2002.
5. Conclusion and Discussion
The literature highlighted the impact of board independence on the financial performance of the firm
(Agrawal and Knoeber 1996; Bhagat and Black, 2002, Bhagat and Bolton, 2008). Other studies such as
Bruno and Claessens (2010), Butler and Ribstein (2006) Litvak (2007) and Wintoki (2007) found a
significant compliance costs for US companies following the enactment of SOX. However, very few studies
have addressed the impact of SOX on the costs of compliance of foreign inter-listed companies in US stock
exchange. However, it is interesting to study the effect of a uniform application of SOX on all the companies
on US exchanges, including foreign and whose country of origin are characterized by different laws and
governance practices of the US.
The Canadian context offers a special opportunity for research because that the most part of the
voluntary on board is non-mandatory. In addition, the different dates of entry into force of the respective
reforms in both countries allow the realization of the study.
Our results confirm that there is relationship between the adoption of SOX and the remuneration of
directors and that, controlling for the ROA ratio, MTB ratio and for the size variable.
We find that the cash compensation of the board increased after the implementation of the Sarbanes-
Oxley Act in 2002. This may be attributed to the increase of tasks and responsibilities of the board after SOX
and consequently an increase in his pay.
Our findings join those of Linck, Netter and Yang (2009) regarding the effect of SOX depending on
company size. Moreover, we find that SOX has influenced in different ways small and large companies.
Company size seems to be a main factor influencing the increase of board cash compensation.
Combined with SOX entry in to force, the company size has a significant effect on board
compensation indicating that the impact of SOX adoption depends on company’s size.
The compliance with the provisions of SOX could be more difficult for smaller size companies than
for larger ones and this is due to their ability to face the increase of compliance cost.
The compliance fees could also be a barrier for small non-US companies for being listed on US
stock markets.
Our results may suffer from certain limitations inherent to the sample selection and variable
measures, including the dependent variable, the remuneration of directors. Note that, in contrast to other
Serdiuc, N. and Khemakhem, H., 2015. The Impact of SOX Adoption on the Compensation of Non-US Companies’ Boards: The Case of Canadian
Companies. Expert Journal of Business and Management, 3(2), pp.182-188
187
studies (Linck, Netter and Yang, 2009; Wintoki, 2007), which use the total compensation (cash
compensation and options), we use only cash compensation. This choice is result of insufficient or even the
lack of data on options compensation for several Canadian firms. Some limitations of generalizability of the
results are due to the small number of sample firms. Conducting the study on a larger sample and more years
will allow better generalizability of the results. Also, our study did not reveal the quantified impact of
increased costs for Canadian companies. Future research may investigate the effect of SOX on increased cost
and financial performance of non-US firms listed on US capital market.
References
Agrawal, A. and Knoeber, C. R., 1996. Firm performance and mechanisms to control agency problems
between managers and shareholders. Journal of Financial and Quantitative Analysis, 31(3), pp.377-
397.
Arcot, S. and Bruno, V. G., 2005. In Letter but not in Spirit: An Analysis of Corporate Governance in the
UK. Working paper. SSRN. http://papers.ssrn.com/sol3/papers.cfm?abstract_id=819784
Berle, A. and Means, G., 1932. The Modern Corporation and Private Property. New York : Transaction
Publishers.
Bhagat, S. and B. Bolton. 2008. Corporate governance and firm performance. Journal of Corporate Finance,
vol.14, no 3, pp.257-273.
Bhagat, S. and Black, B., 2002. The non-correlation between board independence and long-term firm
performance. Journal of Corporation Law, 27(2), pp.231-273.
Bruno, V. and Claessens, S., 2010. Corporate governance and regulation: Can there be too much of a good
thing? Journal of Financial Intermediation, 19(4), pp. 461-482.
Butler, H. N. and Ribstein, L. E., 2006. The Sarbanes-Oxley Debacle: How to Fix It and What We've
Learned. Working paper. SSRN. [online] Available at:
http://papers.ssrn.com/sol3/papers.cfm?abstract_id=911277##
Carnaghan, C. and Gunz, S. P., 2007. Recent Changes in the Regulation of Financial Markets and Reporting
in Canada. Accounting Perspectives, 6(1), pp.55-94.
Chhaochharia, V. and Grinstein, Y., 2007. Corporate Governance and Firm Value: The Impact of the 2002
Governance Rules. The Journal of Finance, 62(4), pp.1789-1825.
Eldridge, S. W. and Kealey, B. T., 2005. SOX Costs: Auditor Attestation under Section 404. Working paper.
SSRN. [online] Available at: http://dx.doi.org/10.2139/ssrn.743285 [Accessed on 17 February 2015]
Fama, E. F., 1980. Agency Problems and the Theory of the Firm. Journal of Political Economy, 88(2),
pp.288-307.
Fama, E. F. and Jensen, M. C., 1983. Separation of Ownership and Control. Journal of Law and Economics,
26(2), pp. 301-325.
Gray, T., 2005. Canadian Response to the US Sarbanes-Oxley Act of 2002: New Directions for Corporate
Governance. Library of Parliament, Canada. PRB 05-37E.
Jensen, M. C., 1993. The Modern Industrial Revolution, Exit, and the Failure of Internal Control Systems.
Journal of Finance, 48(3), pp.831-880.
Jensen, M. C. and Meckling, W. H., 1976. Theory of the firm: Managerial behavior, agency costs and
ownership structure. Journal of Financial Economics, 3(4), pp.305-360.
Jensen, M. C. and Murphy, K. J., 1990. CEO Incentives - It's Not How Much You Pay, But How. Harvard
Business Review, 68(3), pp.138-149.
Khemakhem, H., P. Gélinas and L. Baillargeon. 2014. Catalysts of Change in the Board Room: the case of
the introduction of policy statement 58-201. Journal of Legal, Ethical and Regulatory Issues,
JLERI), 17(1), pp.129-151.
La Porta, R., Lopez-de-Silanes, F., Shleifer, A. and Vishny, R., 2000. Investor protection and corporate
governance. Journal of Financial Economics, 58(1–2), pp.3-27.
Linck, J. S., Netter, J. M. and Yang, T., 2009. The Effects and Unintended Consequences of the Sarbanes-
Oxley Act on the Supply and Demand for Directors. The Review of Financial Studies, 22(8),
pp.3287-3328.
Litvak, K., 2007. The effect of the Sarbanes-Oxley act on non-US companies cross-listed in the US. Journal
of Corporate Finance, 13(2–3), pp.195-228.
Morgenstern, M., Nealis, P. and Kleinman, K., 2004. The impact of Sarbanes-Oxley on mid-cap issuers.
[online] Available at: http://www.sec.gov/info/smallbus/mmorgensternmidcap.pdf [Accessed on 17
February 2015]

Serdiuc, N. and Khemakhem, H., 2015. The Impact of SOX Adoption on the Compensation of Non-US Companies’ Boards: The Case of Canadian
Companies. Expert Journal of Business and Management, 3(2), pp.182-188
188
Mulherin, J. H., 2007. Measuring the Costs and Benefits of Regulation: Conceptual Issues in Securities
Markets. Journal Of Corporate Finance (13), pp.421-437.
Romano, R., 2005. The Sarbanes-Oxley Act and the making of quack corporate governance. Yale Law
Journal, 114, pp.1521-1611.
Stigler, G. J., 1964. Public regulation of the securities markets. Journal of Business, 37, 117-142.
Stigler, G. J., 1971. The Theory of Economic Regulation. The Bell Journal of Economics and Management
Science 2(1), pp.3-21.
Wintoki, M. B., 2007. Corporate boards and regulation: The effect of the Sarbanes–Oxley Act and the
exchange listing requirements on firm value. Journal of Corporate Finance, 13(2–3), pp.229-250.
Expert Journal of Business and Management, Volume 3, Issue 2, pp. 189-193, 2015
© 2015 The Author. Published by Sprint Investify. ISSN 2344-6781
http://Business.ExpertJournals.com
189
Supplier Analysis of the IMMEX in Sonora
Rosalina JAIME MEULY*
Sonora State University, Mexico
The objective of this research is to identify the factors that prevent the local supply
in Sonora from having a bigger development in the export industry. The research
methodology consisted of deep interviews to ten companies and their supervisors
that we considered to be the most successful, as well as the application of a survey
to 40 other companies. We have created a diagnosis of the actual factors affecting
the low recruitment of Mexican local suppliers by the industry. The idea was to
provide the information that we find interesting and relevant to industry
associations and Council of State for decision-making that can help increase the
supply for the local market and to big companies.
Keywords: Supply, IMMEX, Sonora
JEL Classification: M10
1. Introduction
According to Carrillo and Zarate (2003), the development of local suppliers promotes growth,
employment and economic stability, but face unequal footing with large foreign companies to sell their
products. In Mexico, we have more than 728 economic units belonging to the electronic sector.
Manufacturing companies are located mainly in states like Baja California, Chihuahua and Tamaulipas,
giving jobs to approximately 258 000 people in the country, according to the National Institute of Statistics
and Geography (INEGI) (promexico.gob.mx).
Following the figures of the Ministry of Economy (2001), between 2000 and 2010, the foreign
investment in the electronics sector was of 625 million dollars, focusing mainly in the manufacture of
computers and equipment. Despite the efforts of the private sector and the Mexican government, the
participation of the National Procurement in the Manufacturing and Export Services (IMMEX) in its 40
years of presence in the country, has been relatively low. In 2004, the national turnout was 10% of
intermediate consumption, this being even a lower involvement in the area of raw materials (Koido, 2003).
Contreras (2000) notes that the National Border Program was established in 1960, from which the industry
has become the most dynamic sector of the Mexican economy.
There is an idea that NAFTA is related to a more dynamic growth. However, in 2001 there was a
significant movement of employment in the industry. For some reason, this movement of employment has
something to do with some factors impacting the industry, including critical clauses in the context of
NAFTA. The dynamism of the industry has generated a development in the market, which has been
perceived as the passage of a dynamic core of the border economy to the most successful model of
* Corresponding Author:
Dra. Rosalina Jaime Meuly, Sonora State University, Mexico
Article History:
Received 31 October 2015 | Accepted 12 November 2015 | Available Online 23 November 2015
Cite Reference:
Jaime Meuly, R., 2015. Supplier Analysis of the IMMEX in Sonora. Expert Journal of Business and Management, 3(2), pp.189-193
Jaime Meuly, R., 2015. Supplier Analysis of the IMMEX in Sonora. Expert Journal of Business and Management, 3(2), pp.189-193
190
industrialization. Cities that are known for economic and industrial development, have created associations.
Studies Carrillo and Hualde (2001) point out that local plants do not have the resources to produce inputs
with high standards of quality and high technological level that are certainly required. Transnational
corporations have to turn to foreign suppliers that have located their plants near its customers.
Also, according to the college of the north border (COLEF, 2002), local Mexican suppliers only
produce indirect materials, they do not produce direct items. Foreign suppliers, however, made several direct
items. There are several reasons why the IMMEX has not developed a strong network of local suppliers, but
mainly because the plants to be installed in Mexico already had local suppliers in their own territory and who
have already established a relationship of trust regarding the quality and delivery time.
2. Literature Review
Albert O. Hirschman (1981) stated, for the first time in 1958, the theory of the forward links and
backwards, which constitute a sequence of investment decisions that take place during the process of
industrialization that characterizes economic development. The backward links are represented by
investment decisions and cooperation aimed at strengthening the production of raw materials and the goods
needed for the production of finished products to happen. Meanwhile, forward links involve the
incorporation of new technology and research and development to improve or create new products.
The types of chain may be a developing product, raw materials, secondary goods, infrastructure,
human capital, manufacturing and logistics. Aoso Kaldor proposed a new theory, from which the model of
Kaldor's explanation about the rise of capital is apparent. Kaldor's model (1956) is a thorough explanation of
the theoretical possibility of a capitalism that can grow steadily and predict cyclical movements. We believe
it can improve the income distribution (Zermeño, 2004, p.80).
In literature, ideas about Kaldor were found on other of the topics mentioned as important division in
terms of economic activity from which the following statements emerge: a) only uses of natural resources
such as land (under the assumption of diminishing returns) and; b) the industrial or processing activity (under
the assumption of increasing returns). It is believed that both types of productive type activities (excluding in
principle the services sector) exist in both economic regions depend on international trades so they can meet
their requirements. However, "the growth rates of industrial activities, will determine the growth of a country
or region" (Calderon and Martinez, 2005, p. 5).
The description of the first Kaldor Act establishes a positive relationship between the growth rate of
an economy and its manufacturing sector, which means that the latter is the engine of growth. The
explanation for this link is associated with high multiplier effect in the industrial sector due to high income
elasticities of demand for manufactured goods; the strong production chains back and forth from industrial
activities, and learning economies can be obtained with the division of labor and specialization progresses as
a result of industry activities. Kaldor says that the rate of economic growth is associated with the growth rate
of the manufacturing sector of the economy, which is considered a feature of the transition from immaturity
to maturity, where the former is defined as a situation in which productivity is low compared with the
industry, so the work is available for use in industry in relatively unlimited quantities (Thirlwall, 1983, p.
345).
Taiwan supply model: The development of suppliers in the electronics sector is aligned to the needs
imposed by international challenging; the basic factor of success is its local supply base. We conclude that
the gradual learning process and accumulation technological capabilities Taiwan has, they have facilitated
the transition of manufacturing simple products to more complex processes.
Malaysia supply model: The local supply is characterized by the development of capabilities to meet
standards of quality, cost and timelines required by transnational companies, establishing flexible production
systems as well as training programs and defending the creation of new companies within existing ones,
which act as incubators (Ariffin, 2000).
Singapore supply model: The importance of the electronics industry accounts for 40% of the value
of production and exports, however, the participation of the local supply is minimal, since the chains of
transnational corporations were primarily associated with other transnational companies in the region.
Education policies and technical training for work have led to industrialization, however a local base of
enterprises around the large transnational companies was founded. For more than three decades there was no
policy for the development of SMEs, favoring large foreign companies against local small ones. Some local
companies could provide support engineering to develop its own brands, making hard drives, chips, printed
circuit boards and computers (Torres, 2007).
Jaime Meuly, R., 2015. Supplier Analysis of the IMMEX in Sonora. Expert Journal of Business and Management, 3(2), pp.189-193
191
Japan supply model: Wants to propose a subcontract or vertical integration of other large companies
with small or medium size. Plus, the integrator policy can offer a product that is designed and developed
under certain technical specifications for several small companies, each of which performs one or more
modules and then are integrated into a single final product. If the provider meets the requirements of quality
and delivery times, the relationship should be lasting. The supplier development programs are efficient
because the suppliers who have trouble meeting the specifications, usually send teams to improve
productivity in companies owned by their suppliers (Gonzalez, 2000).
Italian supply model: It proposes to create horizontal business networks. The horizontal way differs
from the nets, they are a form of cooperation and competition between companies that are located in distinct
and consecutive positions in the production chain, and are associated for competitive advantage they
couldn’t achieve individually (Dominguez, 1996). Suppliers in value chains approach the market analyzing
the value chain, meaning "all activities of a production process from design or product conception to delivery
to the final consumer." (Porter, 1999).
Generally, the literature emphasizes these links across borders between productive enterprises and
distribution systems, which allows to see the entire cycle (product design-receipt by the final consumer) as a
process of continuous interaction and add value. The suppliers are connected with the industry that provides
its principal office, corresponding those activities within the core of the chain.
3. Supplying in Sonora
During the research on the local supply state, we found that there are obstacles that limit their
development. In the bullet points, we will present the characteristics of Mexican local suppliers, as well as
the main obstacles they face to break into the IMMEX, according to a research conducted by different
scholars in the subject (Arias and Solari, 2008; Bracamonte and Contreras, 2008; Carrillo, 2002 and 2003;
Contreras, 2000; Mungaray and Benitez, 2000; Ollivier, 2007; Zárate, 2003).
Based on the 20 surveys that were applied to managers responsible for purchases in the industry, the
following aspects were found:
• Most of all that input is reached out to the supplying companies that carry the industry and work
with foreign firms, and only about 6% of them work with the Mexican industry.
• 6% of the inputs are purchased from the local industry, 3% are indirect, such as office suppliers
and cleaning suppliers.
• In order to be an IMMEX provider, certain criteria must be achieved, such as:
a) Certification: must have a certification, which is granted by the ultimate purchaser.
b) Quality: requires to meet certain quality standards in their inputs, as this is what companies take
into account analyzing the direct impact on production costs.
c) Price: in this department, 50% seek competitive prices.
d) Ability to manage inventory: all IMMEX flexibility requires its suppliers to deliver on time
according to their abilities and depending on whatever the final order may be.
e) Good service: it must be reliable in delivery times, quality and flexibility.
f) Technological capacity: as to this department, they should ask their suppliers for innovation
capacities, production and continuous improvements.
3.1. Government’s Support of IMMEX in Sonora
In the survey applied to managers of companies involved with IMMEX, they wondered if they ever
received government support. Their response was somewhat varied, as some said no, they had never received
any support or the federal government. Also, some companies responded that they had received support,
consisting of employee training programs, and have also received support from 'Bécalos', the latter support
has helped many employees mainly giving them the opportunity to continue studying thanks to the support
provided by the Federal Government. They have also joined IMMEX programs such as CONACYT and
Federal Ministry of Economics.
3.2. Study Methodology
The methodology used in this research is strictly descriptive and documentary. To carry out and
develop the topics discussed above we rely on bibliographical sources, which are: newspapers, official
country statistics and theses. According to Alfonso (1995), documentary research, is a scientific method, a
systematic process of investigation, collection, organization, analysis and interpretation of information or
data about a given topic and in-depth interviews.
Jaime Meuly, R., 2015. Supplier Analysis of the IMMEX in Sonora. Expert Journal of Business and Management, 3(2), pp.189-193
192
4. Conclusion
With this analysis, we can be aware of the situation in our state in terms of the IMMEX program and
we can draw some conclusions related to the problems that are limiting the suppliers in Sonora.
We think that in order to be a supplier of inputs for companies with the IMMEX program, you must
go through a series of challenges, which are very important regarding quality, delivery compliance, capacity
technologies. However, there is a big problem, that the state’s producers do not have support and that many
inputs are consumed in the same state. In connection with the development of suppliers, they are not
interested in providing technological capability, however, they have supported the information about future
demand requirements, conventions that are related to indirect inputs such as packaging material, labels and
cleaning materials.
References
Ariffin, N., 2000. The Internationalisation of Innovative Capabilities: The Malaysian Electronics Industry,
Unpublished Ph.D. Thesis, SPRU, University of Sussex at Brighton
Bracamonte S., Montellano, Á. and Contreras, F., 2008. Global production networks and local suppliers: the
Sonoran entrepreneurs to the expansion of the automotive industry. Border Studies. Social Sciences
and Humanities magazine, IX, pp.161-194.
Calderon Villarreal, C. and Martinez Morales, G., 2005. Verdoorn Law and the regional manufacturing
industry in the age of NAFTA, Frontera Norte, 17 (34), pp.103-137
Carrillo, J. and Hualde, A., 2000. Is there a cluster in electronics maquiladora in Tijuana? in J. Carrillo (Ed.),
Local agglomerations or global clusters. Corporate and institutional developments in northern
Mexico, México: El Colegio de la Frontera Norte.
Carrillo, J. and Hualde, A., 2001. Is there a third cluster in electronics maquiladora in Tijuana? Mexican
Magazine of Sociology, 2(2), pp.9-12.
Carrillo, J. and Zárate, R., 2003. Limitations of Mexican suppliers of electronics against foreigners. El
Colegio de Sonora, XV (28), pp.161-162.
Carrillo, J., 2001. Technological learning in the maquiladoras of northern Mexico. Frontera Norte, 14(27).
Carrillo, J., 2002. Competitiveness of the electronics industry in Baja California. Current situation, trends
and projections. Expo-Electronics CANIETI, Tijuana BC, Mexico.
Contreras, O., 2000. Global companies, local actors. Flexible production and industrial training in the
maquiladoras. Mexico: El Colegio de Mexico.
De la Garza, E., 2001. Social work theories and studies, new approaches, in De la Garza, E, (Coord.) La
Formación socioeconómica neoliberal, Mexico: Anthropos / Plaza y Valdez / UAM
Dussel Peters, E., Palacios Lara, J. J. and Woo Gómez, G. (coords.), 2003. The electronics industry in
Mexico: problems, perspectives and proposals (pp. 7-10). Mexico, Guadalajara: Universidad of Guadalajara,
UDG.
González, B. J., 2000. Just-in-time supply industry: the challenge of the first rank suppliers. Journal of
management, organization and administration companies, 24, pp.51-60.
Gonzalez, R., 2010. Characteristics of supplier-customer relationships in Andalusian innovative industries.
Spain: Universidad de Sevilla.
Hirschman, A.O., 1981. The strategy of economic development. Mexico: Fondo de Cultura Economica.
Humphrey, J., 2002. Developing Country Firms in the World Economy: Governance and Upgrading in
Global Value Chains. INEF Report. No. 61, Institut für Entwicklung und Frieden, Duisburg, pp.59-
60.
Kaldor, N., 1956. Alternative Theories of Distribution. The Review of Economic Studies, 23(2), pp. 83-100
Koido, A., 2003. The color TV industry in Mexico's border with the United States. Foreign trade, 53(4),
pp.362-363.
Mungaray, A. and Benitez, C., 2000. Global expansion and development of local suppliers in Tijuana.
Frontera Norte, 12(24), pp.35-57.
Ocegueda Hernandez, J.M., 2003. Analysis of economic growth in the states of Mexico, 1980-2000, Foreign
Trade, 53(11), November.
Ollivier, J., 2007. National Suppliers to the maquiladora industry in Mexico: a technological challenge.
Frontera Norte, 19(038), pp.195-197.
Porter. M., 1999. Competitive advantage: creating and sustaining performance superior. Argentina:
CECSA.

Jaime Meuly, R., 2015. Supplier Analysis of the IMMEX in Sonora. Expert Journal of Business and Management, 3(2), pp.189-193
193
Thirlwall A.P., 2003. The nature of economic growth, an alternative framework for understanding the
performance of nations. Mexico City: Ed. FCE
Torres, A., 2007. Public policies and supplier development in East Asian countries; cases in Taiwan,
Malaysia and Singapore. Economy and Society, 12(19), pp.17-44.
Torres, A.D., and Solari V.A., 2008. Micro and transnational networks for Walmart in Michoacan. Economy
and Society, XIV (21), pp.111-129.
Zárate, R., 2003. Limitations of Mexican suppliers of electronics against foreigners. State and Society,
15(28), pp.168-169.
Zermeño, F., 2004. Lessons of Economic Development. Mexico: Ed. Plaza y Valdes.
Expert Journal of Business and Management, Volume 3, Issue 2, pp. 194-204, 2015
© 2015 The Authors. Published by Sprint Investify. ISSN 2344-6781
http://Business.ExpertJournals.com
194
Human Resource Management’s Marketing
Approach and Its Contribution Towards
Employee-Satisfaction
Susanna MINDER* and Signe BALINA
University of Latvia
In times when organizations in Germany are confronted with a constant change-
dynamic regarding their working conditions managers understand that human
resources are an important driving factor for the overall company’s performance.
The attractiveness of an organization towards potential and actual employees is
therefore an issue which is of broad interest for general management as it plays an
increasing role to reach company’s aims. Necessary for creating such an
attractiveness as employer are the establishment of substantiated processes of
acquiring and retaining employees. The objective of this paper is to assess whether
the application of a company’s human resource management’s marketing approach
has an impact on employee satisfaction. Concerning the research methods causal
modelling and triangulation of research are used. Quantitative research is applied.
Results show that the better a company’s human resource management’s marketing
approach in terms of its quality and performance is, the higher is the employees’
perception about their employer’s organization as well as the overall employees’
satisfaction. Findings also reveal a significant positive relationship between a high
quality of human resource management’s marketing approach and employee
satisfaction. Furthermore, a positive relation between a high performance of human
resource management’s marketing approach and the classification of a company’s
brand awareness on the labor market as well as a company’s classification into an
employer of choice is found. Thus, it can be concluded that human resource
management’s marketing approach is a viable process in the realm of human
resource management to steer a company’s success through a focus on employee
satisfaction.
Keywords: Human resource management, employee satisfaction, human resource
management’s marketing approach
JEL Classification: M51 - Firm Employment Decisions; Promotions
* Corresponding Author:
Susanna Minder, University of Latvia
Article History:
Received 20 November 2015 | Accepted 30 November 2015 | Available Online 1 December 2015
Cite Reference:
Minder, S., and Balina, S., 2015. Human Resource Management’s Marketing Approach and Its Contribution Towards Employee-Satisfaction. Expert Journal of Business and Management, 3(2), pp.194-204
Minder, S., and Balina, S., 2015. Human Resource Management’s Marketing Approach and Its Contribution Towards Employee-Satisfaction.
Expert Journal of Business and Management, 3(2), pp.194-204
195
1. Introduction
The economic task of human resource management is to ensure the most favorable supply and
maintenance of adequately capable and performance-oriented personnel in companies If this task is completed,
the principal relationship of the company towards its organization and its productive forces is fundamentally
fulfilled. In this context the relevance of the concept of human resource management as a trigger of positive
contributions to the company’s success is increasing. The pursuit of effectiveness and efficiency committed to
the company's success requires of human resources management an approach which takes into account not
only the business conditions but especially the needs of a target group that needs to be acquired and retained
by the organization.
The identification and recruiting of this target group orientates itself on the needs of the actual and
potential employees of a company and their demands towards an employer. The same applies for retaining
employees. By a successful acquiring and retaining of employees human resource management contributes
significantly to improving company’s performance. Human resource management’s marketing (HRMM)
approach – as one subsystem of human resource management - is hereby the function organizations need to
focus on. It forms the bases for a successful acquiring and retaining of employees by attractively positioning
a company on the labor market as well as significantly driving employee satisfaction within a company.
2. Theoretical background of the research
The idea of a HRMM approach that focusses on an increasing employee satisfaction is not completely
new. Different authors made an effort to establish and develop different concepts of such HRMM approaches
(Bleis, 1992, p. 10f; Dietmann, 1993, p. 108f.; Staffelbach, 1995, p. 144; Bartscher & Fritsch, 1992, p. 1747f.;
Fröhlich, 2004, p. 17f.). Nevertheless, the environment of organizations is changing fast and the development
on the labor market – as one of the driving forces for the establishment of an employee satisfying HRMM
approach as a sub-function in the area of human resource management - is very fast, too, especially in times
of fast changing economic challenges as they appear today. This gives way to an actual consideration of the
topic of HRMM as empirical approaches from ten to twenty years earlier are not adequate anymore.
In addition - caused for example by the demographic change – a situation arises which leads to an
augmented competition of organizations on the labor market for employees. Besides, the increasing demand
for employees causes a higher risk for job changes of existing employees. Therefore the importance of HRMM
approach raises. Existing employees need to be satisfied to ensure that they remain at the company and
potential employees need to be attracted to the organizations and invited to apply. Therefore, on the one hand
it is crucial for organizations to establish employee satisfying human resource management processes as
employee satisfaction is vital for ensuring the long-term efficiency and effectiveness of organizations. On the
other hand it is important for companies to position themselves successfully as a more attractive employer than
their competitors.
As comparable organizations use – more or less – the same financial and material resources for their
business but reach different performance levels in efficiency and effectiveness it becomes clear that the driving
factor for these differences is in how company’s management understands and implements its role in human
resource management. Herein, the managerial influence on employee satisfaction is essential for a constant
improvement of an organization’s human resource management processes. Thus, the two aspects of employee
satisfaction and a company’s labor market attractiveness impact positively on a privileged supply of (potential)
employees and ensure the business performance of a company (Koppel, 2008, p. 66f.).
2.1. Human resource management and the context to a HRMM approach
The economic task of human resource management is to ensure the most favorable supply and
maintenance of adequately capable and performance-oriented personnel in companies (Bisani, 1995, pp. 51-
79). If this task is completed, the principal relationship of the company towards its organization and its
productive forces is fundamentally fulfilled. In this context the relevance of the concept of human resource
management as a trigger of positive contributions to the company’s success is increasing (Lado & Wilson,
1994, p. 699f.). The pursuit of effectiveness and efficiency committed to the company's success requires of
human resources management an approach which takes into account not only the business conditions but
especially the needs of a target group that needs to be acquired and retained by the organization. Marketing
research provides - with regard to the exchange of scare resources like employees on the labor market -
fundamental insights and methods. For a conceptualization of human resource management in the context of
Minder, S., and Balina, S., 2015. Human Resource Management’s Marketing Approach and Its Contribution Towards Employee-Satisfaction.
Expert Journal of Business and Management, 3(2), pp.194-204
196
scare resources the ideas of marketing management can therefore be used. Concepts and instruments of
marketing support those core concerns of human resource management relating to obtaining and preserving
resources in a bottleneck-embossed environment. The scare resources on the labor market and at the company
need to be targeted in a way that satisfies their needs and prolongs their stay in an organization as much as
possible.
Human resource management is on the one hand used as a generic wording for every arrangement of
personnel management. On the other hand it is seen as denotation of a specific approach within the human
resource management which is identified by different characteristics (Boxall, 2008, p. 49). According to a
narrow understanding companies try to gain competitive advantage by acquiring engaged and capable
employees. For their acquisition a set of cultural, structural and personnel oriented techniques is used (Storey,
1995, p. 6f). For this approach the following three aspects are characteristic: Firstly, the reckoning of
employees as important and competitive-relevant resource. Secondly, the integration of all human resource
activities into the corporate strategy and thirdly, the integrative coordination of all human resource-related
instruments.
The paper looks at a more generic understanding of human resource management. A conceptual
clarification of the study object human resource management shows that there is broad agreement defining the
subject area as all personnel economic actions within companies. More recent views broaden the concept even
further. They transfer the concept to all human resource functional areas and aim at a strategic conformity.
Oechsler (Oechsler, 2006, p. 353) understands human resource management as the totality of all personnel
issues of design, control and development of a visionary and accordingly strategy oriented system.
Based on this, human resource management in the context of this work is defined as a system that
copes with all themes related to the staff of an organization. Hence human resource management displays not
only a conglomerate of single measures but a long-term strategy and is part of a complex interrelationship
(Fröhlich, 2004, p. 24). By defining HRMM approach as a cross-divisional function of human resource
management which influences main process functions of human resource management it is made obvious that
HRMM approach is a sub-system of human resource management and not an independent discipline itself.
2.2. Employee satisfaction in the context of human resource management
Employees are the linchpin of functions and instruments of human resource management and its
marketing approach. One of the key success indicators in this context is the satisfaction of employees
(Homburg & Bucerius, 2008, p. 53f.). Spector (Spector, 2003, S. 57f.) states as definition of employee
satisfaction with their employer that employee satisfaction is “the extent to which people like their job”.
In the realm of human resource management employee satisfaction is related to two objectives. On the
one hand employee satisfaction develops towards the work performance and the work content (work
satisfaction). On the other hand satisfaction develops towards the employer organization itself. Definitions in
literature focus mainly either on one or the other perspective (For an overview of definitions see Bauer et al.,
2004, p. 23ff.). Due to the paper’s focus on the HRMM approach of an organization and the organization’s
positioning on the labor market especially satisfaction with the employer organization is regarded.
This satisfaction with the employer organization is - analogous to Griffin (Griffin, 2010, p. 239f.) - the
emotion of an employee towards its employer as a whole, not only towards the employee’s job position within
the company. In this context three major factors need to be considered to speak of employee satisfaction with
the whole organization (Mowday, 1982, p. 83f.). Firstly, the employee needs to accept and support the
company’s overall objectives. Secondly, the employee is willing to excel in his or her daily business
performance. And thirdly, the employee feels obliged to stay a member of the organization. These three factors
can vary in their occurrence and specificity. However, what all factors have in common is that they bind the
employee to an organization and lead to reach the overall company goals. This displays the task management
– and especially human resource management - has to fulfill: to establish a mind-set within a company that
determines employee satisfaction and the behavior leading to it.
3. Methods used in research
As science-theoretical basis for the empirical investigation the ideas of Carl Popper (Mayer, 2002, p.
15), the Critical Rationalism, are used. Causal models act as a rational reconstruction of the actual practice by
applying the given theoretical framework (Mayer, 2002, p. 15). If an adequate correlation between the
variables exists, the models argue for the plausibility of postulated relations. If it is inadequate, the tenability
of such relations is rejected.
Minder, S., and Balina, S., 2015. Human Resource Management’s Marketing Approach and Its Contribution Towards Employee-Satisfaction.
Expert Journal of Business and Management, 3(2), pp.194-204
197
Besides the causal modelling also triangulation is used as research strategy. Hereby data sets of
different sources are used within the empirical investigation to balance possible bias (Brown J. , 2001, p. 228).
On the one hand company data - as one possible data source - are depicted, on the other hand data received
from employees are used. Furthermore, different indicators are applied for describing the same construct
(Todd, 1979, p. 603). Also here triangulation – within one research method - is applied.
An empirical investigation about HRMM approach and its influences on employee satisfaction needs
to meet the requirements of a certain perspective. This perspective needs to express companies’ views (self-
assessment) as well as employees’ view (assessment by others). In addition, it needs to reflect the theoretical
framework about HRMM approach in practice.
With regard to the research objective a quantitative empricial research is conducted. Hereby the
questionning was chosen as one possible research method (Schnell et al., 1999, p. 319) as a most broad
comparability as well as a most possible structuring of the data sets can be reached (Mayring, 2003, p. 89).
The questioning was documented via two different structured questionnaires. On the one hand companies have
been questioned (self-assessment), on the other hand employees out of these organizations have been
interviewed (assessment by others).
The development of both questionnaires has been closely linked to the conceptual part of the paper.
Due to that integrative procedure a systematic linkage of the theoretical, conceptual basic principles with the
empirical research is reached. The questionnaire for companies (self-assessment) consists of a brief
introduction including the reason for the survey, target group, confirmation of anonymity, estimated handling
time, contact details of participant and contact details of the author. The second part of the questionnaire
consists of questions concerning the evaluation of the quality of a company’s HRMM approach and questions
concerning the evaluation of employee satisfaction. The whole questionnaire is standardized, no comments
can be given.
The self-assessment questionnaire is filled in by companies – represented by human resource
professionals. Human resource professionals have the insight and information concerning data of a company
that illuminate the quality of its HRMM approach as well as employee satisfaction.
Human resource professionals in the context of the paper are defined as professionals working in
human resource departments of organizations. Hereby no differentiation is made concerning their educational
background or their individual tasks within the human resource department. The availability of these
professionals is essential for an effective data collection. Therefore only those companies have been involved
in the empirical research and analysed in-depth that were able to provide enough valid data. Valid data in this
context mean enough contact persons to address as well as the utilization of their answers.
The second questionnaire (assessment by employees) substantiates the scientific aim with another set
of quantitative data and is based on the same criteria concerning the linkage with the theoretical framework as
mentioned above. It starts with a brief introduction including the same items as the organizations’
questionnaire, followed by questions concerning the performance of HRMM approach and the employees’
satisfaction with the employers’ organizations.
To ensure a precise measurement of the hypothesis – both questionnaires considered details of a two-
year period (2012 and 2013). All actions that have been taken into consideration outside that time period are
not evaluated.
3.1. Research design of the empirical study
Following the definition of the research methodology and its science-theoretical basis is the definition
of the whole research design. Hereby it is important to define which companies and employees participate in
the empirical investigation and why they have been chosen. In addition, the conducting of the whole research
process needs to be described to provide transparency into the executed process.
Before the description of the research’s realization can be conducted it is - in a first step - crucial to
describe the participants to establish a solid basis for the empirical investigation. The paper’s object is the
HRMM approach at companies. Hereby, a European or even worldwide investigation is economically not
justifiable. As human resource management is – for the time being – nationally oriented a limitation to the area
of Germany is conducted.
The necessity and priority of HRMM approach is increasing in times with restricted available labor
demand. In this situation, companies make growing endeavours to acquire and retain employees. However,
some organizations are more advanced in realizing these issues and put more focus on their HRMM approach
than others (Steinle & Thies, 2008, p. 52). These organizations have understood that HRMM is one approach
to face the problems of copying with limited labor demand and increasing labor supply. One possibility to
Minder, S., and Balina, S., 2015. Human Resource Management’s Marketing Approach and Its Contribution Towards Employee-Satisfaction.
Expert Journal of Business and Management, 3(2), pp.194-204
198
overcome this problem is the participation in career fairs (Nieschlag, & Hörschgen, 2002, p. 229). Therefore
all companies participating in career fairs in Germany form the population for the empirical investigation. This
population consists of 2328 companies.
A census is – due to economic reasons like time and costs – not applicable. Therefore a limitation of
the investigation to some population’s units takes place - a random sample is drawn. Out of a relevant database,
which includes 56 different career fairs in Germany, four fairs have been randomly filtered. Hence, the sample
size - as defined by the number of companies attending the four career fairs - is 482. At every fair companies
were randomly selected to participate in the survey, so that in total 233 companies were asked to participate
(master sample). However, 137 companies were not willing to respond at all and 68 companies stopped
answering in the middle of the survey’s process. Only 28 companies were finally willing to answer the whole
questionnaire which leads to a response rate of 12.02 %. The low response rate is acknowledged and it is
emphasized that the overall conclusions cannot be generalized due to the specifics of the research’s target
group. However, it is pointed out that the response rate for surveys that are conducted in Germany normally
ranges between 10 – 20 % (Theurl & Saxe, 2009, p. 7). Even if the achieved response rate is at the lower edge
of this range it represents reality concerning response rates in Germany. As the surveyed data is in most cases
company confidential the companies’ data sets have been made anonymous.
As already mentioned an assessment by others (employee survey) is conducted to provide a second
data set on the research subject. Also here the random sampling is used. Randomly selected 336 employees of
the 28 questioned companies have been asked to participate in the empirical investigation. The number of
employees completing the whole questionnaire is 259, accounting for a response rate of 77.08%. Concerning
this questionnaire also here the data sets are anonymous.
Different authors (Friedrichs, 1990, p. 245; Mayer, 2002, p. 97) point out the necessity that a chosen
research method needs to be subjected to a pre-test, even if the author is personally present to clear ambiguities
and to interact with the interview partners (Zikmund, 2003, p. 201). Against the background of the pre-test’s
importance both questionnaires have undergone a pre-test phase.
Following the pretest phase is the empirical research itself. For the data gathering career fairs have
been personally attended between January and March 2014. The companies’ questionnaires were distributed
to the master sample of 233 companies. The organizations’ representatives (human resource professionals)
were personally invited to participate in the survey. In a second step, 336 employees out of these organizations
were invited to participate in the survey. Also here the employees’ questionnaire was personally distributed to
the participants at the career fairs from January to March 2014.
Limitation of this procedure is that only employees are interviewed who have been personally present
at the career fairs. The method of how these employees have been chosen by their organizations to participate
in the fairs is not evaluated. Therefore, this pre-selection can lead to results’ bias. However, this possible pre-
selection of probands is not of crucial importance for the aspired research aim which is to consider typical
situations within organizations. The probands still fulfill the required relevance and applicability for the
empirical investigation as their answers reflect typical situations within organizations.
The results of the surveys are evaluated by a statistical computer program (SPSS).
3.2. Modeling the relationship between HRMM approach and employee satisfaction
The purpose of the paper’s theoretical framework is to provide a basis for probation in research and
therefore for transformation into reality. The developed idea of the relationship between HRMM approach and
employee satisfaction is such a basis which needs to be tested empirically. To circumstantiate this idea, the
causal modelling is used and two causal models have been chosen to enable a bilateral evaluation of the impact
of HRMM approach on employee satisfaction. The first model (see figure 1.) depicts the companies’ view on
the influence of HRMM approach on employee satisfaction. The second model (see figure 2.) substantiates
this perspective with the employees’ perception.
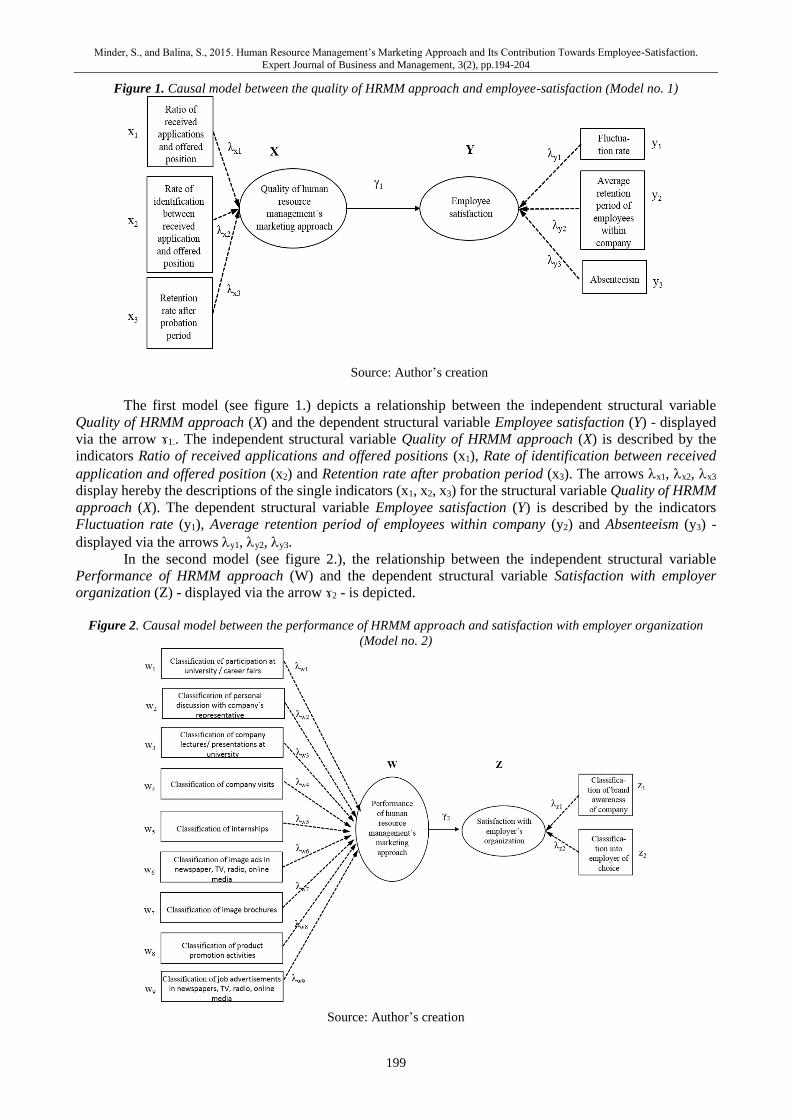
Minder, S., and Balina, S., 2015. Human Resource Management’s Marketing Approach and Its Contribution Towards Employee-Satisfaction.
Expert Journal of Business and Management, 3(2), pp.194-204
199
Figure 1. Causal model between the quality of HRMM approach and employee-satisfaction (Model no. 1)
Source: Author’s creation
The first model (see figure 1.) depicts a relationship between the independent structural variable
Quality of HRMM approach (X) and the dependent structural variable Employee satisfaction (Y) - displayed
via the arrow ɤ1.. The independent structural variable Quality of HRMM approach (X) is described by the
indicators Ratio of received applications and offered positions (x1), Rate of identification between received
application and offered position (x2) and Retention rate after probation period (x3). The arrows x1, x2, x3
display hereby the descriptions of the single indicators (x1, x2, x3) for the structural variable Quality of HRMM
approach (X). The dependent structural variable Employee satisfaction (Y) is described by the indicators
Fluctuation rate (y1), Average retention period of employees within company (y2) and Absenteeism (y3) -
displayed via the arrows y1, y2, y3.
In the second model (see figure 2.), the relationship between the independent structural variable
Performance of HRMM approach (W) and the dependent structural variable Satisfaction with employer
organization (Z) - displayed via the arrow ɤ2 - is depicted.
Figure 2. Causal model between the performance of HRMM approach and satisfaction with employer organization
(Model no. 2)
Source: Author’s creation
Minder, S., and Balina, S., 2015. Human Resource Management’s Marketing Approach and Its Contribution Towards Employee-Satisfaction.
Expert Journal of Business and Management, 3(2), pp.194-204
200
As displayed in figure 2. the independent structural variable Performance of HRMM approach (W) is
described by the nine indicators Classification of participation at university / career fairs (w1), Classification
of personal discussion with company’s representatives (w2), Classification of company lectures / presentations
at university (w3), Classification of company visits (w4), Classification of internships (w5), Classification of
image advertisements in newspapers, TV, radio, online media (w6), Classification of image brochures (w7),
Classification of product promotion activities (w8) and Classification of job advertisements in newspapers,
TV, radio, online media (w9). The arrows w1, w2, w3,>w4, w5, w6, w7, w8 and w9 display hereby the
descriptions of the single indicators (w1, w2, w3, w4, w5, w6, w7, w8, w9) for the structural variable Performance
of HRMM approach (W). The dependent structural variable Satisfaction with employer organization (Z) is
described by the indicators Classification of brand awareness of company (z1) and Classification into employer
of choice (z2) - displayed via the arrows z1 and z2.
Besides the structural variables and their indicators also a grouping variable exists which is not
displayed in the two models. This grouping variable is called Different employee groups and might disclose
differentiations in the empirical investigation. It represents different shareholders within an organization.
4. Main results’ interpretation
In a first step, all indicators have been tested via the Shapiro-Wilk-Test. Hereby it is documented
whether the indicators are normally distributed or not in order to decide for the usage of further statistical tests.
The Shapiro-Wilk-Test test was run for all indicators. The result of the Shapiro-Wilk-Test shows that no
normal distribution exists concerning all indicators. Therefore, all following statistical tests are run for non-
normal distribution.
Secondly, the causal-models’ constructs are assessed through correlation analysis (Spearman’s Rho)
to determine the strength and direction of relationship between the exogenous and endogenous variables.
Hereby - as is suggested by Bauer (Bauer F., 1984, p. 167) - all correlations r > 0.5 are considered to be strongly
related / strongly significant. Correlations between r = 0.3 and r = 0.5 are considered to be related / significant.
All correlations r < 0.3 are considered to be not related / not significant.
Finally, an analysis of differences due to the grouping variable Different employee groups (Kruskal-
Wallis Test) is conducted. In line with empirical convention an alpha level of 0.05 and confidence interval of
95.0 % are set to determine the significance of the statistical tests.
Of utmost interest is an investigation of correlations between the different variables’ indicators to
examine to which extend the postulated relations can be accepted. Correlation coefficients were calculated
using the non-parametric test Spearman’s Rho.
The results of correlation analyses indicate statistically significant relations between the postulated
relationships.
An overview of the results of companies’ assessment of Spearman’s correlations’ calculation is given
in the following table 1. The algebraic sign of the correlation coefficient indicates the direction of association
while the absolute value reveals its strength (Brosius, 2008, p. 527).
Table 1. Relationship between the quality of HRMM approach and employee satisfaction (Spearman’s Rho) – derived
from companies’ assessment for the years 2012 and 2013
Indicators in 2012 / 2013 Fluctuation rate (y1) Retention period (y2) Absenteeism (y3)
2012 2013 2012 2013 2012 2013
Ratio of received applications
to offered positions (x1) r = -0.97 r = -0.96 r = +0.96 r = +0.89 r = -0.47 r =-0.58
Rate of identification between
received application and
offered position (x2)
r = -0.45 r = -0.50 r = +0.48 r = +0.50 r = -0.95 r = -0.84
Retention rate after probation
period (x3) r = -0.78 r = -0.83 r = +0.76 r = +0.70 r = -0.32 r = -0.46
Note: All correlations are significant at the 0.01 level.
Source: Author’s creation using research results
The highest relation (r = -0.97 in 2012 and r = -0.96 in 2013) exists between the Ratio of received
applications to offered positions (x1) and the Fluctuation rate (y1) within a company. In addition, the Retention
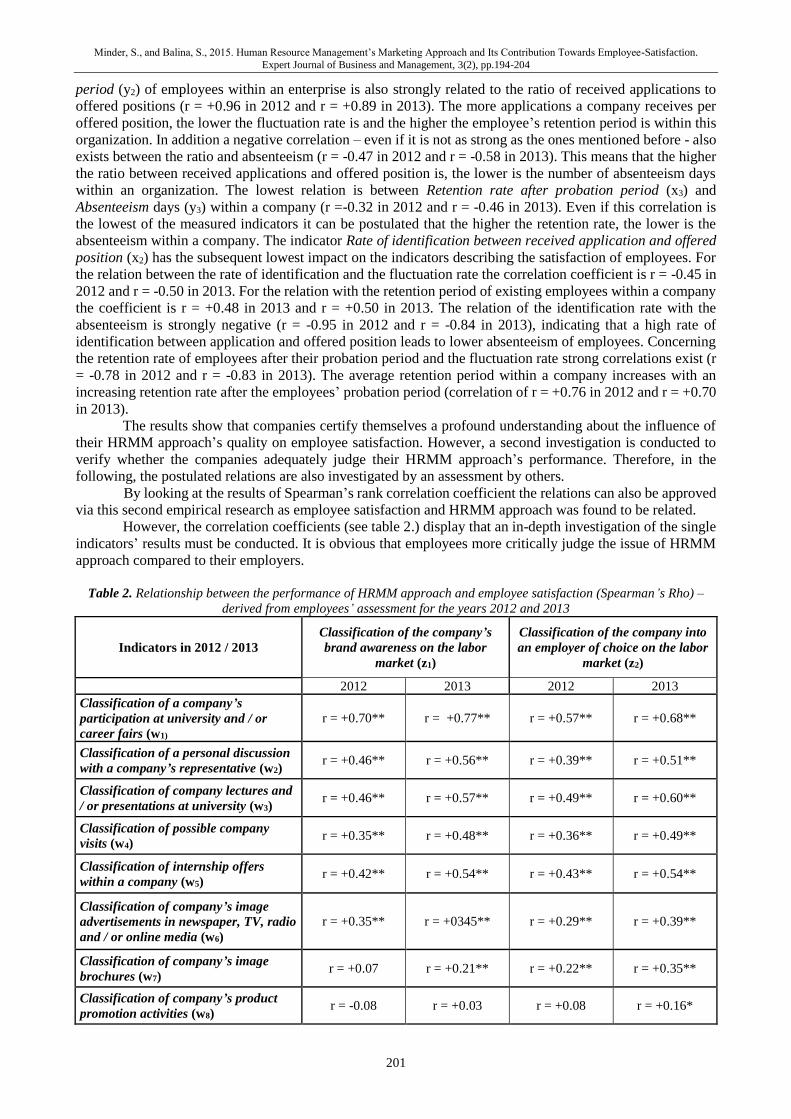
Minder, S., and Balina, S., 2015. Human Resource Management’s Marketing Approach and Its Contribution Towards Employee-Satisfaction.
Expert Journal of Business and Management, 3(2), pp.194-204
201
period (y2) of employees within an enterprise is also strongly related to the ratio of received applications to
offered positions (r = +0.96 in 2012 and r = +0.89 in 2013). The more applications a company receives per
offered position, the lower the fluctuation rate is and the higher the employee’s retention period is within this
organization. In addition a negative correlation – even if it is not as strong as the ones mentioned before - also
exists between the ratio and absenteeism (r = -0.47 in 2012 and r = -0.58 in 2013). This means that the higher
the ratio between received applications and offered position is, the lower is the number of absenteeism days
within an organization. The lowest relation is between Retention rate after probation period (x3) and
Absenteeism days (y3) within a company (r =-0.32 in 2012 and r = -0.46 in 2013). Even if this correlation is
the lowest of the measured indicators it can be postulated that the higher the retention rate, the lower is the
absenteeism within a company. The indicator Rate of identification between received application and offered
position (x2) has the subsequent lowest impact on the indicators describing the satisfaction of employees. For
the relation between the rate of identification and the fluctuation rate the correlation coefficient is r = -0.45 in
2012 and r = -0.50 in 2013. For the relation with the retention period of existing employees within a company
the coefficient is r = +0.48 in 2013 and r = +0.50 in 2013. The relation of the identification rate with the
absenteeism is strongly negative (r = -0.95 in 2012 and r = -0.84 in 2013), indicating that a high rate of
identification between application and offered position leads to lower absenteeism of employees. Concerning
the retention rate of employees after their probation period and the fluctuation rate strong correlations exist (r
= -0.78 in 2012 and r = -0.83 in 2013). The average retention period within a company increases with an
increasing retention rate after the employees’ probation period (correlation of r = +0.76 in 2012 and r = +0.70
in 2013).
The results show that companies certify themselves a profound understanding about the influence of
their HRMM approach’s quality on employee satisfaction. However, a second investigation is conducted to
verify whether the companies adequately judge their HRMM approach’s performance. Therefore, in the
following, the postulated relations are also investigated by an assessment by others.
By looking at the results of Spearman’s rank correlation coefficient the relations can also be approved
via this second empirical research as employee satisfaction and HRMM approach was found to be related.
However, the correlation coefficients (see table 2.) display that an in-depth investigation of the single
indicators’ results must be conducted. It is obvious that employees more critically judge the issue of HRMM
approach compared to their employers.
Table 2. Relationship between the performance of HRMM approach and employee satisfaction (Spearman’s Rho) –
derived from employees’ assessment for the years 2012 and 2013
Indicators in 2012 / 2013
Classification of the company’s
brand awareness on the labor
market (z1)
Classification of the company into
an employer of choice on the labor
market (z2)
2012 2013 2012 2013
Classification of a company’s
participation at university and / or
career fairs (w1)
r = +0.70** r = +0.77** r = +0.57** r = +0.68**
Classification of a personal discussion
with a company’s representative (w2) r = +0.46** r = +0.56** r = +0.39** r = +0.51**
Classification of company lectures and
/ or presentations at university (w3) r = +0.46** r = +0.57** r = +0.49** r = +0.60**
Classification of possible company
visits (w4) r = +0.35** r = +0.48** r = +0.36** r = +0.49**
Classification of internship offers
within a company (w5) r = +0.42** r = +0.54** r = +0.43** r = +0.54**
Classification of company’s image
advertisements in newspaper, TV, radio
and / or online media (w6)
r = +0.35** r = +0345** r = +0.29** r = +0.39**
Classification of company’s image
brochures (w7) r = +0.07 r = +0.21** r = +0.22** r = +0.35**
Classification of company’s product
promotion activities (w8) r = -0.08 r = +0.03 r = +0.08 r = +0.16*
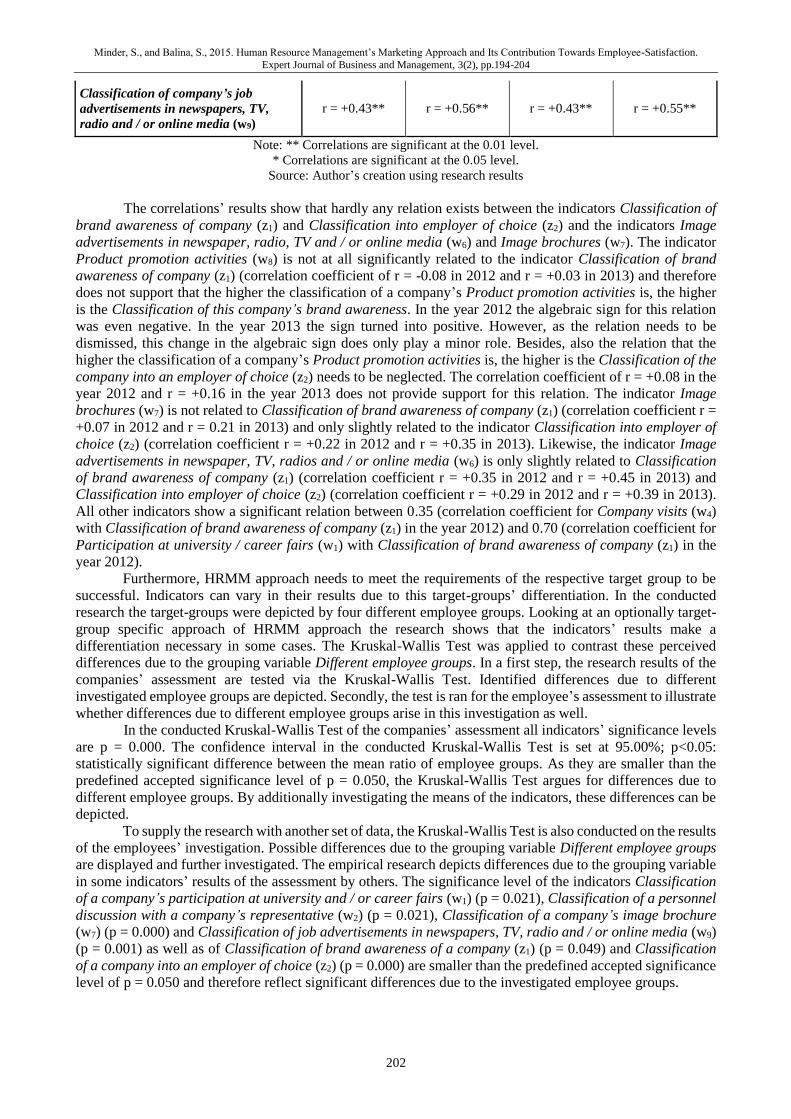
Minder, S., and Balina, S., 2015. Human Resource Management’s Marketing Approach and Its Contribution Towards Employee-Satisfaction.
Expert Journal of Business and Management, 3(2), pp.194-204
202
Classification of company’s job
advertisements in newspapers, TV,
radio and / or online media (w9)
r = +0.43** r = +0.56** r = +0.43** r = +0.55**
Note: ** Correlations are significant at the 0.01 level.
* Correlations are significant at the 0.05 level.
Source: Author’s creation using research results
The correlations’ results show that hardly any relation exists between the indicators Classification of
brand awareness of company (z1) and Classification into employer of choice (z2) and the indicators Image
advertisements in newspaper, radio, TV and / or online media (w6) and Image brochures (w7). The indicator
Product promotion activities (w8) is not at all significantly related to the indicator Classification of brand
awareness of company (z1) (correlation coefficient of r = -0.08 in 2012 and r = +0.03 in 2013) and therefore
does not support that the higher the classification of a company’s Product promotion activities is, the higher
is the Classification of this company’s brand awareness. In the year 2012 the algebraic sign for this relation
was even negative. In the year 2013 the sign turned into positive. However, as the relation needs to be
dismissed, this change in the algebraic sign does only play a minor role. Besides, also the relation that the
higher the classification of a company’s Product promotion activities is, the higher is the Classification of the
company into an employer of choice (z2) needs to be neglected. The correlation coefficient of r = +0.08 in the
year 2012 and r = +0.16 in the year 2013 does not provide support for this relation. The indicator Image
brochures (w7) is not related to Classification of brand awareness of company (z1) (correlation coefficient r =
+0.07 in 2012 and r = 0.21 in 2013) and only slightly related to the indicator Classification into employer of
choice (z2) (correlation coefficient r = +0.22 in 2012 and r = +0.35 in 2013). Likewise, the indicator Image
advertisements in newspaper, TV, radios and / or online media (w6) is only slightly related to Classification
of brand awareness of company (z1) (correlation coefficient r = +0.35 in 2012 and r = +0.45 in 2013) and
Classification into employer of choice (z2) (correlation coefficient r = +0.29 in 2012 and r = +0.39 in 2013).
All other indicators show a significant relation between 0.35 (correlation coefficient for Company visits (w4)
with Classification of brand awareness of company (z1) in the year 2012) and 0.70 (correlation coefficient for
Participation at university / career fairs (w1) with Classification of brand awareness of company (z1) in the
year 2012).
Furthermore, HRMM approach needs to meet the requirements of the respective target group to be
successful. Indicators can vary in their results due to this target-groups’ differentiation. In the conducted
research the target-groups were depicted by four different employee groups. Looking at an optionally target-
group specific approach of HRMM approach the research shows that the indicators’ results make a
differentiation necessary in some cases. The Kruskal-Wallis Test was applied to contrast these perceived
differences due to the grouping variable Different employee groups. In a first step, the research results of the
companies’ assessment are tested via the Kruskal-Wallis Test. Identified differences due to different
investigated employee groups are depicted. Secondly, the test is ran for the employee’s assessment to illustrate
whether differences due to different employee groups arise in this investigation as well.
In the conducted Kruskal-Wallis Test of the companies’ assessment all indicators’ significance levels
are p = 0.000. The confidence interval in the conducted Kruskal-Wallis Test is set at 95.00%; p<0.05:
statistically significant difference between the mean ratio of employee groups. As they are smaller than the
predefined accepted significance level of p = 0.050, the Kruskal-Wallis Test argues for differences due to
different employee groups. By additionally investigating the means of the indicators, these differences can be
depicted.
To supply the research with another set of data, the Kruskal-Wallis Test is also conducted on the results
of the employees’ investigation. Possible differences due to the grouping variable Different employee groups
are displayed and further investigated. The empirical research depicts differences due to the grouping variable
in some indicators’ results of the assessment by others. The significance level of the indicators Classification
of a company’s participation at university and / or career fairs (w1) (p = 0.021), Classification of a personnel
discussion with a company’s representative (w2) (p = 0.021), Classification of a company’s image brochure
(w7) (p = 0.000) and Classification of job advertisements in newspapers, TV, radio and / or online media (w9)
(p = 0.001) as well as of Classification of brand awareness of a company (z1) (p = 0.049) and Classification
of a company into an employer of choice (z2) (p = 0.000) are smaller than the predefined accepted significance
level of p = 0.050 and therefore reflect significant differences due to the investigated employee groups.
Minder, S., and Balina, S., 2015. Human Resource Management’s Marketing Approach and Its Contribution Towards Employee-Satisfaction.
Expert Journal of Business and Management, 3(2), pp.194-204
203
5. Conclusions
The availability of labor forces is one of the basic premises for a company’s economic success. In
order to cope with this requirement in the future, the acquisition and retention of employees is of crucial
importance. In the context of the paper human resource management and its marketing approach is displayed
concerning its correlation with employee satisfaction. The following conclusions are the outcome of the work
and starting points for further research.
Overall, the postulated relations are proven for the time being. Organizations give themselves a
positive testimonial concerning the quality of their HRMM approach. Employees judge this more
critically. However, overall they state their employers a HRMM approach which satisfies their
needs as well as demands and therefore contributes to their satisfaction.
The quality of a company’s HRMM approach is significantly contributing to the overall employee
satisfaction. Furthermore, employees’ perception of their employer’s organization is significantly
influenced by the performance of the HRMM approach of the employer’s company.
Differentiations concerning an organization’s HRMM approach arise due to addressing different
employee groups. Empirical evidence – derived from the Kruskal-Wallis Tests - shows that
measures of HRMM approach need to be adapted to the target-groups’ differing demands on the
labor market.
Spearmans’ Rho displayed that different instruments of a company concerning its HRMM
approach have a different impact on employee satisfaction. However, there is still room for further
investigation. The reasons why three instruments are not regarded as essential for a labor market-
oriented and employee satisfying approach should be deeper investigated. This could help to
develop a prioritization in the ranking of the different instruments to enhance the companies’
performance concerning their HRMM approach.
The work only conducted quantitative investigations. Further research should be applied
considering qualitative measures. Qualitative analysis can try to substantiate the already gained
deeper insight as the paper provides first explanations for employees’ satisfying structures of
human resource management and its results concerning personnel.
References
Bartscher, T., & Fritsch, S., 1992. Personalmarketing. In E. Gaugler, & W. Weber (Eds.), Personalwesen, pp.
1747 - 1758. Stuttgart: Schäffer Poeschel.
Bauer, F., 1984. Datenanalyse mit SPSS. Berlin: Springer.
Bauer, H., Neumann, M., & Lange, M., 2004. Bestimmungsfaktoren und Wirkungen von
Mitarbeiterzufriedenheit. Eine empirische Studie am Beispiel des Automobilhandels. Mannheim:
Universität Mannheim.
Bisani, F., 1995. Personalwesen und Personalführung. Der State of the Art der betrieblichen Personalarbeit
(Vol. 4) Wiesbaden: Gabler.
Bleis, T., 1992. Personalmarketing. Darstellung und Bewertung eines kontroversen Konzepts. München:
Hampp.
Boxall, P., 2008. The Goals of HRM. In P. Boxall, J. Purcell, & P. Wright (Eds.), The Oxford Book of Human
Resource Management, pp. 48 - 67. Oxford.
Brosius, F., 2008. SPSS 21 mitp Professional, Heidelberg: MITP Verlags GmbH
Brown, J., 2001. Using Surveys in Language Programs. Cambridge: Cambridge University Press.
Dietmann, E., 1993. Personalmarketing. Ein Ansatz zielgruppenorientierter Personalpolitik. Wiesbaden:
Gabler.
Friedrichs, J., 1990. Methoden der empirischen Sozialforschung. Opladen: Westdeutscher Verlag.
Fröhlich, W., 2004. Nachhaltiges Personalmarketing: Entwicklung einer Rahmenkonzeption mit
praxistauglichem Benchmarking-Modell. In W. Fröhlich (Ed.), Nachhaltiges Personalmarketing.
Strategische Ansätze und Erfolgskonzepte aus der Praxis, pp. 15 - 49. Ritterbach: Frechen.
Griffin, M., 2010. Job Involvement, Job Stress, Job Satisfaction and Organizational Commitment and the
burnout of correctional staff. Journal of Criminal Justice and Behaviour, vol. 37, pp. 239 - 255.
Homburg, C., & Bucerius, M., 2008. Kundenzufriedenheit als Managementherausforderung. In C. Homburg,
Kundenzufriedenheit: Konzepte - Methoden - Erfahrungen, pp. 53 - 90. Wiesbaden: Gabler.
Minder, S., and Balina, S., 2015. Human Resource Management’s Marketing Approach and Its Contribution Towards Employee-Satisfaction.
Expert Journal of Business and Management, 3(2), pp.194-204
204
Koppel, O., 2008. Nicht besetzbare Stellen für beruflich Hochqualifizierte in Deutschland. Ausmaß und
Wertschöpfungsverlust. IW-Trends. Vierteljahresschrift zur empirischen Wirtschaftsforschung aus
dem Institut der deutschen Wirtschaft, pp. 58 - 72.
Lado, A., & Wilson, M., 1994. Human Resource Systems and Sustained Competitive Advantage. A
Competency-Based Perspective. Academy of Management Review, vol. 19 (4), pp. 699 - 727.
Mayer, H., 2002. Interview und schriftliche Befragung - Entwicklung, Durchführung und Auswertung.
München: Oldenbourg.
Mayring, P., 2003. Qualitative Inhaltsanalyse. Grundlagen und Techniken. Weinheim.
Mowday, R., 1982. Employee-organization Linkages: The Psychology of Commitment, Absenteeism and
Turnover. New York: Academic Press.
Nieschlag, R., D. E., & Hörschgen, H., 2002. Marketing. Berlin.
Oechsler, W., 2006. Personal und Arbeit. Human Resource Management und Arbeitgeber-Arbeitnehmer-
Beziehungen (Vol. 8). München.
Schnell, R., Hill, P., & Esser, E., 1999. Methoden der empirischen Sozialforschung. München: Oldenbourg.
Spector, P., 2003. Industrial and Organizational Psychology: Research and Practice. New York: John Wiley
& Sons.
Staffelbach, B., 1995. Strategisches Personalmarketing. In C. Scholz, & M. Djarrahzadeh (Eds.), Strategisches
Personalmanagement. Konzepte und Realisation, pp. 143 - 158. Stuttgart: Schäffer Poeschel.
Steinle, M., & Thies, A., 2008. Nachhaltige Investitionen in die Arbeitgebermarke. Personalführung, vol. 41/5,
pp. 24 - 32.
Storey, J., 2006. Human Resource Management Today. An Assessment. In J. Storey (Ed.), Human Resource
Management. A Critical Text vol. 2, pp. 3 - 20. London et al.
Theurl, T., & Saxe, A., 2009. Stiftungskooperationen in Deutschland. Berlin: Trigger.
Todd, D., 1979. Mixing Qualitative and Quantitative Methods: Triangulation in Action. Administrative Science
Quarterly, vol.4, pp. 602 - 611.
Zikmund, W., 2003. Business Research Methods. Mason/ Ohio.
Expert Journal of Business and Management, Volume 3, Issue 2, pp. 205-228, 2015 © 2015 The Author. Published by Sprint Investify. ISSN 2344-6781 http://Business.ExpertJournals.com
205
Linear and Non-Linear Regression: Powerful and Very Important Forecasting Methods
Athanasios VASILOPOULOS*
St. John’s University, United States
Regression Analysis is at the center of almost every Forecasting technique, yet few people are comfortable with the Regression methodology. We hope to improve the level of comfort with this article. In this article we briefly discuss the theory behind the methodology and then outline a step-by-step procedure, which will allow almost everyone to construct a Regression Forecasting function for both the linear and some non-linear cases. Also discussed, in addition to the model construction mentioned above, is model testing (to establish significance) and the procedure by which the Final Regression equation is derived and retained to be used as the Forecasting equation. Hand solutions are derived for some small-sample problems (for both the linear and non-linear cases) and their solutions are compared to the MINITAB-derived solutions to establish confidence in the statistical tool, which can be used exclusively for larger problems. Keywords: Linear Regression, Non-Linear Regression, Best-Fitting Model, Forecasting JEL Classification: M10
1. Introduction and Model Estimation for the Linear Mo del
Regression analysis, in which an equation is derived that connects the value of one dependent
variable (Y) to the values of one independent variable X (linear model and some non-linear models), starts with a given bivariate data set and uses the Least Squares Method to assign the best possible values to the unknown multipliers found in the models we wish to estimate. The bivariate data, used to estimate the linear model and some non-linear models, consists of n ordered pairs of values:
(x1, y1),(x2, y2),..., (xn, yn)
The linear model we wish to estimate, using the given data, is: � = � + �� (1)
* Corresponding Author: Athanasios Vasilopoulos, Ph.D., St. John’s University, The Peter J. Tobin College of Business, CIS/DS Department, 8000 Utopia Parkway Jamaica, N.Y. 11439 Article History: Received 2 November 2015 | Accepted 23 November 2015 | Available Online 19 December 2015 Cite Reference: Vasilopoulos, A., 2015. Linear and Non-Linear Regression: Powerful and Very Important Forecasting Methods. Expert Journal of Business and Management, 3(2), pp.205-228
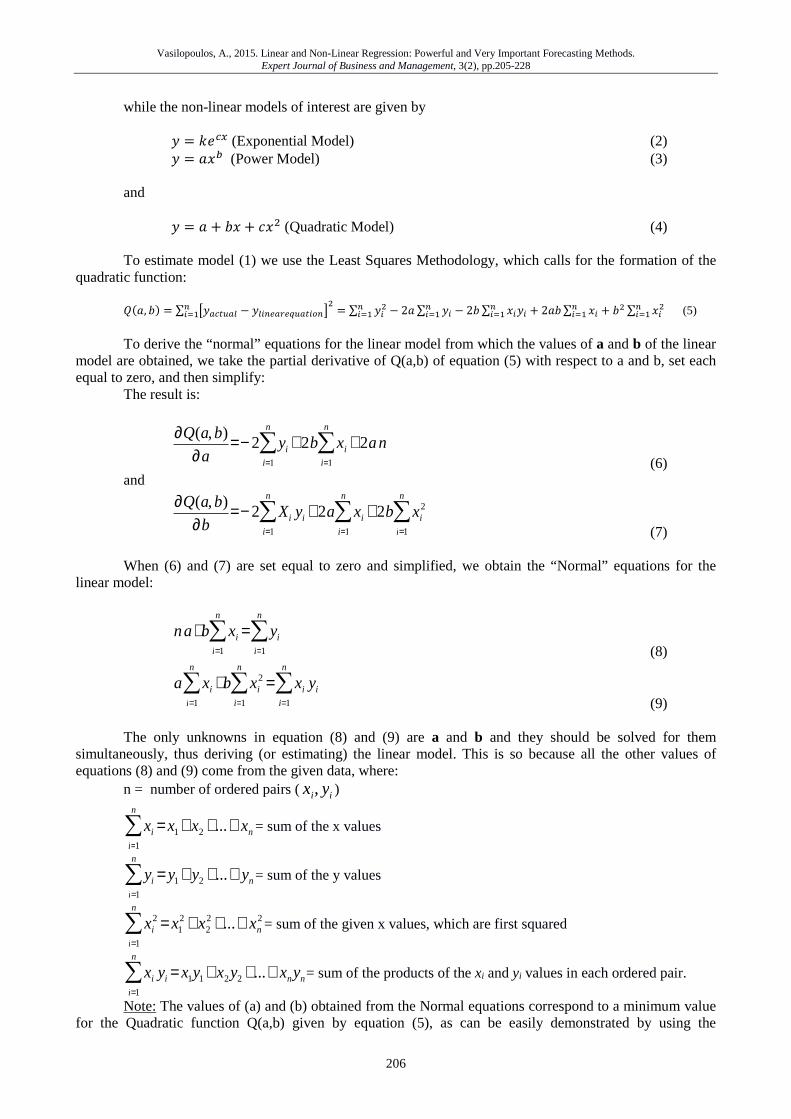
Vasilopoulos, A., 2015. Linear and Non-Linear Regression: Powerful and Very Important Forecasting Methods. Expert Journal of Business and Management, 3(2), pp.205-228
206
while the non-linear models of interest are given by � = �� (Exponential Model) (2) � = ��� (Power Model) (3) and � = � + �� + �� (Quadratic Model) (4) To estimate model (1) we use the Least Squares Methodology, which calls for the formation of the
quadratic function:
���, �� = ∑ ������� − ��������������� ���!" = ∑ ��� − 2� ∑ ����!"��!" − 2� ∑ ������!" + 2��∑ ����!" + �� ∑ �����!" (5)
To derive the “normal” equations for the linear model from which the values of a and b of the linear
model are obtained, we take the partial derivative of Q(a,b) of equation (5) with respect to a and b, set each equal to zero, and then simplify:
The result is:
∂Q(a,b)
∂a=− 2 yi
i=1
n
∑ +2b xi
i=1
n
∑ +2an (6)
and
∂Q(a,b)
∂b=− 2 Xi yi
i=1
n
∑ +2a xi
i=1
n
∑ +2b xi2
i=1
n
∑ (7)
When (6) and (7) are set equal to zero and simplified, we obtain the “Normal” equations for the
linear model:
na+b xi
i=1
n
∑ = yi
i=1
n
∑ (8)
a xi
i=1
n
∑ +b xi2
i=1
n
∑ = xi yi
i=1
n
∑ (9)
The only unknowns in equation (8) and (9) are a and b and they should be solved for them
simultaneously, thus deriving (or estimating) the linear model. This is so because all the other values of equations (8) and (9) come from the given data, where:
n = number of ordered pairs (xi, yi )
xi
i=1
n
∑ = x1+ x2 +...+ xn = sum of the x values
yi
i=1
n
∑ = y1+ y2 +...+ yn= sum of the y values
xi2
i=1
n
∑ = x12 +x2
2 +...+ xn2= sum of the given x values, which are first squared
xi yi
i=1
n
∑ = x1y1+ x2y2 +...+ xnyn= sum of the products of the xi and yi values in each ordered pair.
Note: The values of (a) and (b) obtained from the Normal equations correspond to a minimum value for the Quadratic function Q(a,b) given by equation (5), as can be easily demonstrated by using the
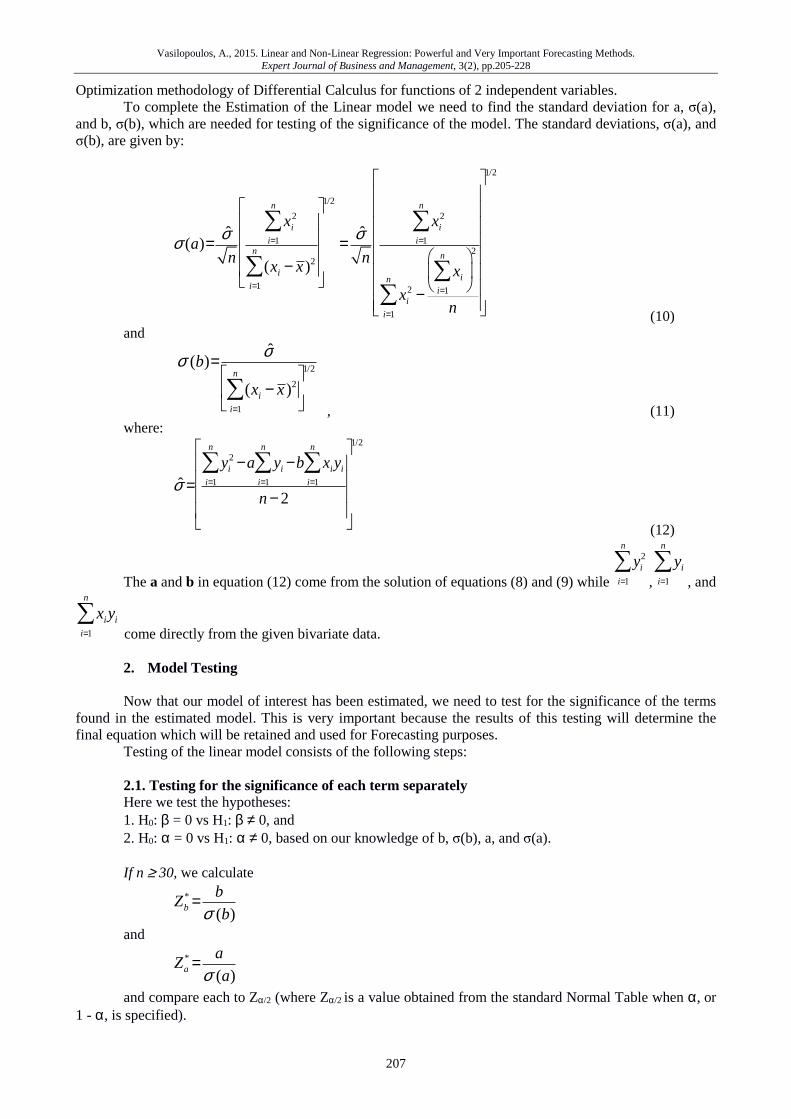
Vasilopoulos, A., 2015. Linear and Non-Linear Regression: Powerful and Very Important Forecasting Methods. Expert Journal of Business and Management, 3(2), pp.205-228
207
Optimization methodology of Differential Calculus for functions of 2 independent variables. To complete the Estimation of the Linear model we need to find the standard deviation for a, σ(a),
and b, σ(b), which are needed for testing of the significance of the model. The standard deviations, σ(a), and σ(b), are given by:
σ (a)= σn
xi2
i=1
n
∑
(xi − x)2
i=1
n
∑
1/2
= σn
xi2
i=1
n
∑
xi2
i=1
n
∑ −xi
i=1
n
∑
2
n
1/2
(10) and
σ (b)= σ
(xi − x)2
i=1
n
∑
1/2
, (11) where:
σ =yi
2
i=1
n
∑ −a yi
i=1
n
∑ −b xi yi
i=1
n
∑
n− 2
1/2
(12)
The a and b in equation (12) come from the solution of equations (8) and (9) while yi
2
i=1
n
∑,
yi
i=1
n
∑, and
xi yi
i=1
n
∑ come directly from the given bivariate data. 2. Model Testing Now that our model of interest has been estimated, we need to test for the significance of the terms
found in the estimated model. This is very important because the results of this testing will determine the final equation which will be retained and used for Forecasting purposes.
Testing of the linear model consists of the following steps: 2.1. Testing for the significance of each term separately Here we test the hypotheses: 1. H0: β = 0 vs H1: β ≠ 0, and 2. H0: α = 0 vs H1: α ≠ 0, based on our knowledge of b, σ(b), a, and σ(a). If n ≥ 30, we calculate
Zb* = b
σ (b) and
Za* = a
σ (a) and compare each to Zα/2 (where Zα/2 is a value obtained from the standard Normal Table when α, or
1 - α, is specified).
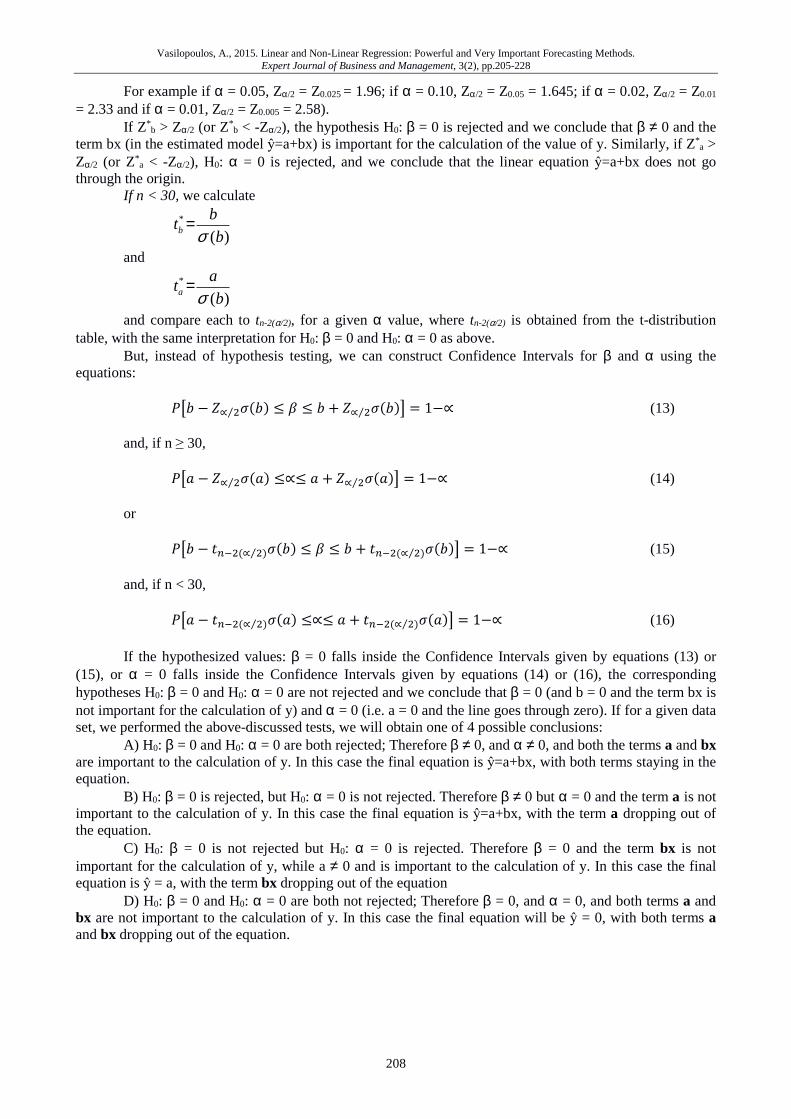
Vasilopoulos, A., 2015. Linear and Non-Linear Regression: Powerful and Very Important Forecasting Methods. Expert Journal of Business and Management, 3(2), pp.205-228
208
For example if α = 0.05, Zα/2 = Z0.025 = 1.96; if α = 0.10, Zα/2 = Z0.05 = 1.645; if α = 0.02, Zα/2 = Z0.01 = 2.33 and if α = 0.01, Zα/2 = Z0.005 = 2.58).
If Z *b > Zα/2 (or Z*
b < -Zα/2), the hypothesis H0: β = 0 is rejected and we conclude that β ≠ 0 and the term bx (in the estimated model ŷ=a+bx) is important for the calculation of the value of y. Similarly, if Z*
a > Zα/2 (or Z*
a < -Zα/2), H0: α = 0 is rejected, and we conclude that the linear equation ŷ=a+bx does not go through the origin.
If n < 30, we calculate
tb* = b
σ (b) and
ta* = a
σ (b) and compare each to tn-2(α/2), for a given α value, where tn-2(α/2) is obtained from the t-distribution
table, with the same interpretation for H0: β = 0 and H0: α = 0 as above. But, instead of hypothesis testing, we can construct Confidence Intervals for β and α using the
equations: $�� − %∝ �⁄ (��� ≤ * ≤ � + %∝ �⁄ (��� = 1−∝ (13) and, if n ≥ 30,
$�� − %∝ �⁄ (��� ≤∝≤ � + %∝ �⁄ (��� = 1−∝ (14) or $�� − ,�-��∝ �⁄ �(��� ≤ * ≤ � + ,�-��∝ �⁄ �(��� = 1−∝ (15)
and, if n < 30,
$�� − ,�-��∝ �⁄ �(��� ≤∝≤ � + ,�-��∝ �⁄ �(��� = 1−∝ (16)
If the hypothesized values: β = 0 falls inside the Confidence Intervals given by equations (13) or
(15), or α = 0 falls inside the Confidence Intervals given by equations (14) or (16), the corresponding hypotheses H0: β = 0 and H0: α = 0 are not rejected and we conclude that β = 0 (and b = 0 and the term bx is not important for the calculation of y) and α = 0 (i.e. a = 0 and the line goes through zero). If for a given data set, we performed the above-discussed tests, we will obtain one of 4 possible conclusions:
A) H0: β = 0 and H0: α = 0 are both rejected; Therefore β ≠ 0, and α ≠ 0, and both the terms a and bx are important to the calculation of y. In this case the final equation is ŷ=a+bx, with both terms staying in the equation.
B) H0: β = 0 is rejected, but H0: α = 0 is not rejected. Therefore β ≠ 0 but α = 0 and the term a is not important to the calculation of y. In this case the final equation is ŷ=a+bx, with the term a dropping out of the equation.
C) H0: β = 0 is not rejected but H0: α = 0 is rejected. Therefore β = 0 and the term bx is not important for the calculation of y, while a ≠ 0 and is important to the calculation of y. In this case the final equation is ŷ = a, with the term bx dropping out of the equation
D) H0: β = 0 and H0: α = 0 are both not rejected; Therefore β = 0, and α = 0, and both terms a and bx are not important to the calculation of y. In this case the final equation will be ŷ = 0, with both terms a and bx dropping out of the equation.
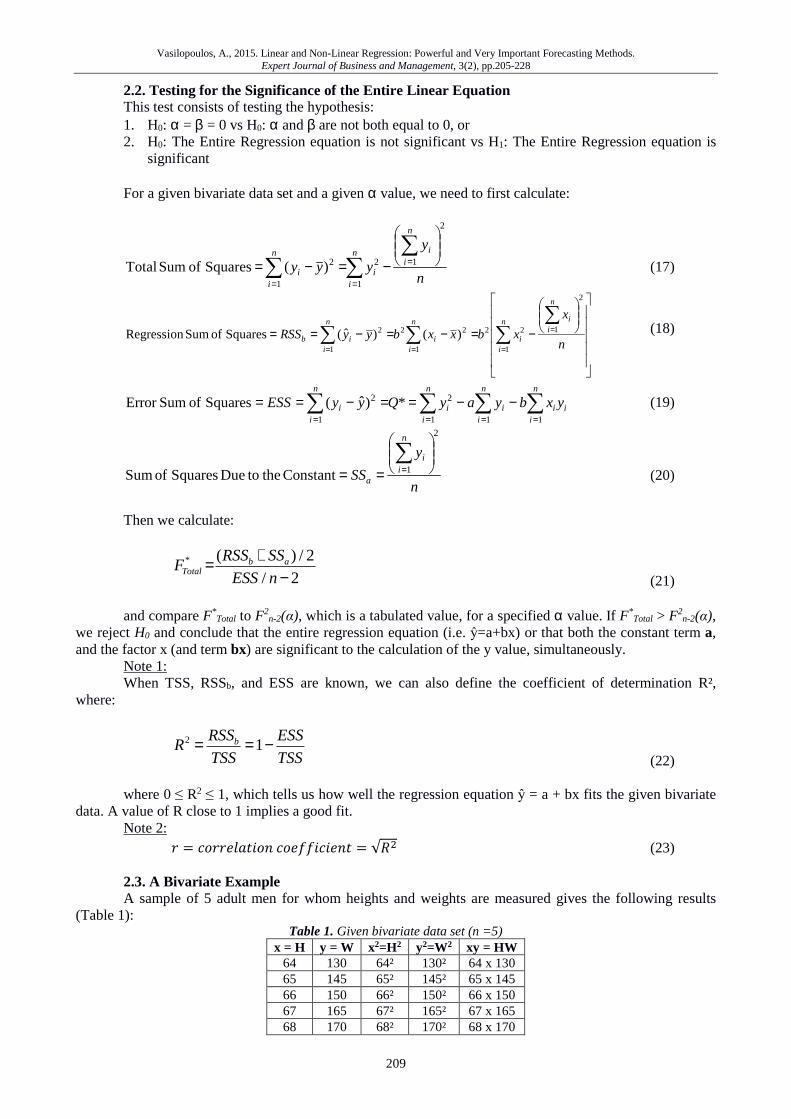
Vasilopoulos, A., 2015. Linear and Non-Linear Regression: Powerful and Very Important Forecasting Methods. Expert Journal of Business and Management, 3(2), pp.205-228
209
2.2. Testing for the Significance of the Entire Linear Equation This test consists of testing the hypothesis: 1. H0: α = β = 0 vs H0: α and β are not both equal to 0, or 2. H0: The Entire Regression equation is not significant vs H1: The Entire Regression equation is
significant For a given bivariate data set and a given α value, we need to first calculate:
n
y
yyy
n
iin
ii
n
ii
2
1
1
2
1
2)(Squares of Sum Total
−=−=∑
∑∑ =
==
(17)
−=−=−==∑
∑∑∑ =
=== n
x
xbxxbyyRSS
n
iin
ii
n
ii
n
iib
2
1
1
22
1
22
1
2 )()ˆ(Squares of Sum Regression (18)
∑∑∑∑====
−−==−==n
iii
n
ii
n
ii
n
ii yxbyayQyyESS
111
2
1
2 *)ˆ(Squares of SumError (19)
n
y
SS
n
ii
a
2
1Constant the toDue Squares of Sum
==∑
= (20)
Then we calculate:
FTotal* = (RSSb + SSa) / 2
ESS/ n− 2 (21) and compare F*
Total to F2n-2(α), which is a tabulated value, for a specified α value. If F*
Total > F2n-2(α),
we reject H0 and conclude that the entire regression equation (i.e. ŷ=a+bx) or that both the constant term a, and the factor x (and term bx) are significant to the calculation of the y value, simultaneously.
Note 1: When TSS, RSSb, and ESS are known, we can also define the coefficient of determination R²,
where:
R2 = RSSbTSS
=1− ESS
TSS (22) where 0 ≤ R2 ≤ 1, which tells us how well the regression equation ŷ = a + bx fits the given bivariate
data. A value of R close to 1 implies a good fit. Note 2: . = /..0�,1/2 /331 12, = √5� (23) 2.3. A Bivariate Example A sample of 5 adult men for whom heights and weights are measured gives the following results
(Table 1): Table 1. Given bivariate data set (n =5)
x = H y = W x2=H2 y2=W2 xy = HW 64 130 64² 130² 64 x 130 65 145 65² 145² 65 x 145 66 150 66² 150² 66 x 150 67 165 67² 165² 67 x 165 68 170 68² 170² 68 x 170

Vasilopoulos, A., 2015. Linear and Non-Linear Regression: Powerful and Very Important Forecasting Methods. Expert Journal of Business and Management, 3(2), pp.205-228
210
For this Bivariate Data set we have: n = 5
∑=
5
1
330 = 68 + 67 + 66 + 65 + 64 =i
ix
21,790 = 68² + 67² + 66² + 65² + 64² =5
1
2∑=i
ix
760 = 170 + 165 + 150 + 145 + 130 =5
1∑
=iiy
116,550 = 170² + 165² + 150² + 145² + 130² =5
1
2∑=i
iy
50,260 = 170) x (68 + 165) x (67 + 150) x (66 + 145) x (65 + 130) x (64 =5
1i
ii yx∑
=
To obtain the linear equation ŷ = a + bx, we substitute the values of n, xi
i=1
5
∑,
xi2
i=1
5
∑,
xi
i=1
5
∑ yi
to equations (8) and (9) and obtain:
6 5� + 330� = 760330� + 21,790� = 50,260
When these equations are solved simultaneously we obtain: a = -508 and b = 10, and the regression
equation is ŷ = a + bx = −508 + 10x.
Then, using the values of a = -508, b=10, and yi
i=1
5
∑,
yi2
i=1
5
∑and
xi
i=1
5
∑ yi
we obtain from equation (12):
σ = 116,550− (−508)(760)− (10)(50,260)
5− 2
1/2
= 30
3
1/2
= 10 = 3.16228
and from equations (10) and (11):
66.015 = 4358 =10
790,212
10
790,212
5
)330(790,21
790,21
5
10)(
2/12/1
2/1
2
=
=
−= x
aσ
σ (b)= 10
21, 790− (330)2
5
1/2 = 10
10[ ]1/2 = 10
10=1
Since n=5<30, a and b are distributed as tn−2 = t3variables and when α = 0.05, t3(α/2) = t3(0.025) = = ±3.1824.
Then the hypotheses H0: β = 0 vs. H1: β ≠ 0, and H0: α = 0 vs. H0: α ≠ 0 are both rejected because:
,�∗ = �(��� = −50866,015 = −7.695 < −3.1824
and
,�∗ = �(��� = 101 = 10 > 3.1824
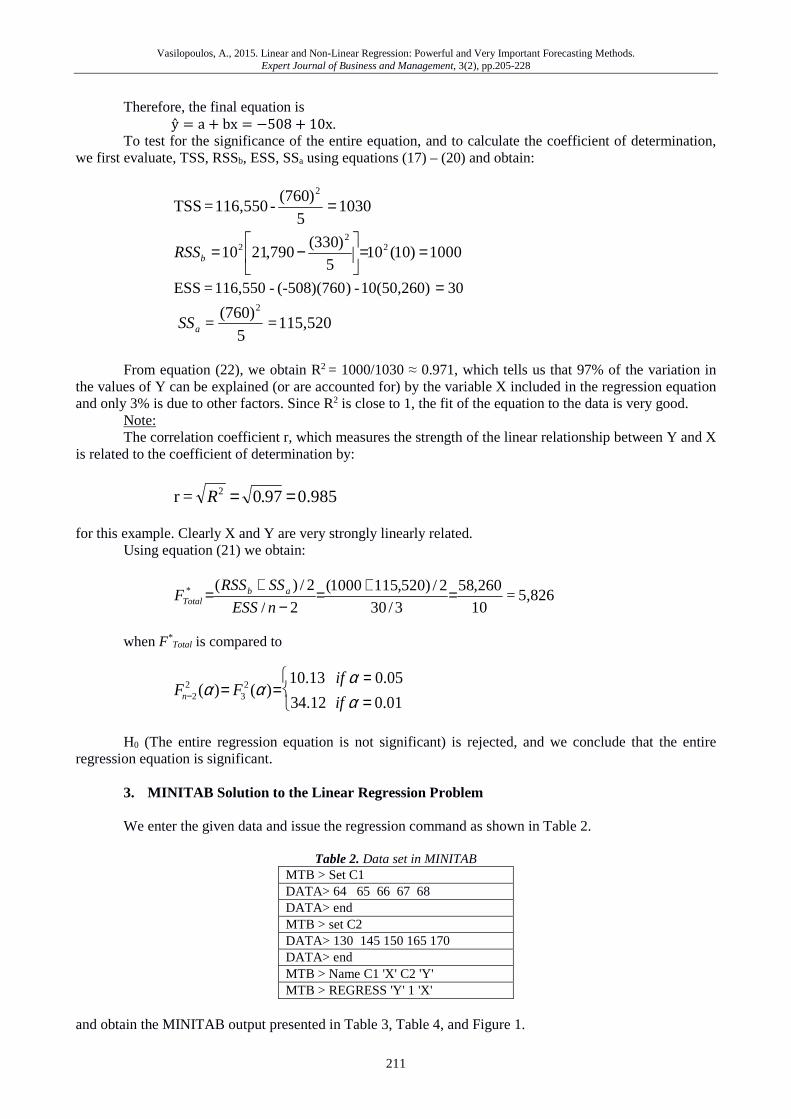
Vasilopoulos, A., 2015. Linear and Non-Linear Regression: Powerful and Very Important Forecasting Methods. Expert Journal of Business and Management, 3(2), pp.205-228
211
Therefore, the final equation is ŷ = a + bx = −508 + 10x. To test for the significance of the entire equation, and to calculate the coefficient of determination,
we first evaluate, TSS, RSSb, ESS, SSa using equations (17) – (20) and obtain:
10305
)760( - 116,550 = TSS
2
=
1000)10(105
)330(790,2110 2
22 ==
−=bRSS
3010(50,260)-)(-508)(760 - 116,550 = ESS =
115,520 =5
)760(=
2
aSS
From equation (22), we obtain R2 = 1000/1030 ≈ 0.971, which tells us that 97% of the variation in
the values of Y can be explained (or are accounted for) by the variable X included in the regression equation and only 3% is due to other factors. Since R2 is close to 1, the fit of the equation to the data is very good.
Note: The correlation coefficient r, which measures the strength of the linear relationship between Y and X
is related to the coefficient of determination by:
0.985 97.0=r 2 ==R for this example. Clearly X and Y are very strongly linearly related.
Using equation (21) we obtain:
5,826 =10
260,58
3/30
2/)520,1151000(
2/
2/)(* =+=−
+=nESS
SSRSSF ab
Total
when F*
Total is compared to
Fn−22 (α)= F3
2(α)=10.13 if α = 0.05
34.12 if α = 0.01
H0 (The entire regression equation is not significant) is rejected, and we conclude that the entire
regression equation is significant. 3. MINITAB Solution to the Linear Regression Problem We enter the given data and issue the regression command as shown in Table 2.
Table 2. Data set in MINITAB MTB > Set C1 DATA> 64 65 66 67 68 DATA> end MTB > set C2 DATA> 130 145 150 165 170 DATA> end MTB > Name C1 'X' C2 'Y' MTB > REGRESS 'Y' 1 'X'
and obtain the MINITAB output presented in Table 3, Table 4, and Figure 1.
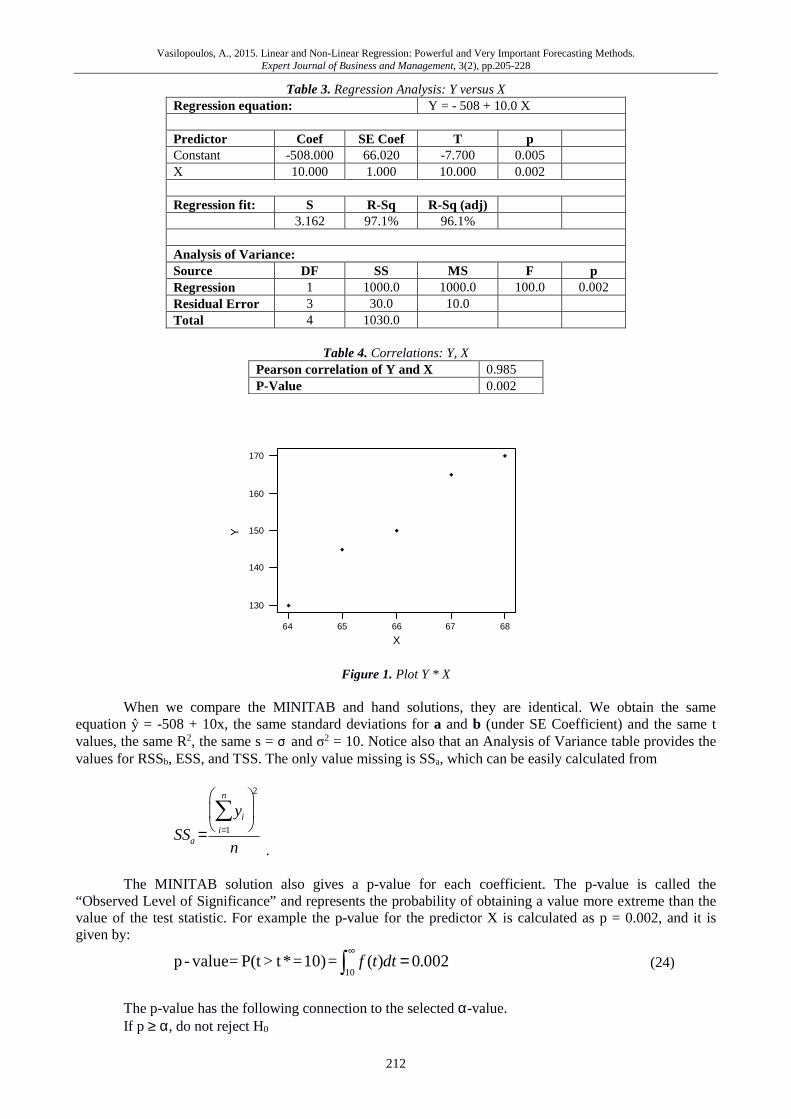
Vasilopoulos, A., 2015. Linear and Non-Linear Regression: Powerful and Very Important Forecasting Methods. Expert Journal of Business and Management, 3(2), pp.205-228
212
Table 3. Regression Analysis: Y versus X Regression equation: Y = - 508 + 10.0 X Predictor Coef SE Coef T p Constant -508.000 66.020 -7.700 0.005 X 10.000 1.000 10.000 0.002
Regression fit: S R-Sq R-Sq (adj) 3.162 97.1% 96.1% Analysis of Variance: Source DF SS MS F p Regression 1 1000.0 1000.0 100.0 0.002 Residual Error 3 30.0 10.0 Total 4 1030.0
Table 4. Correlations: Y, X
Pearson correlation of Y and X 0.985 P-Value 0.002
64 65 66 67 68
130
140
150
160
170
X
Y
Figure 1. Plot Y * X
When we compare the MINITAB and hand solutions, they are identical. We obtain the same
equation ŷ = -508 + 10x, the same standard deviations for a and b (under SE Coefficient) and the same t values, the same R2, the same s = σ and σ2 = 10. Notice also that an Analysis of Variance table provides the values for RSSb, ESS, and TSS. The only value missing is SSa, which can be easily calculated from
SSa =yi
i=1
n
∑
2
n . The MINITAB solution also gives a p-value for each coefficient. The p-value is called the
“Observed Level of Significance” and represents the probability of obtaining a value more extreme than the value of the test statistic. For example the p-value for the predictor X is calculated as p = 0.002, and it is given by:
002.0)( = 10) = * t>P(t = value-p10
=∫∞
dttf (24)
The p-value has the following connection to the selected α-value. If p ≥ α, do not reject H0
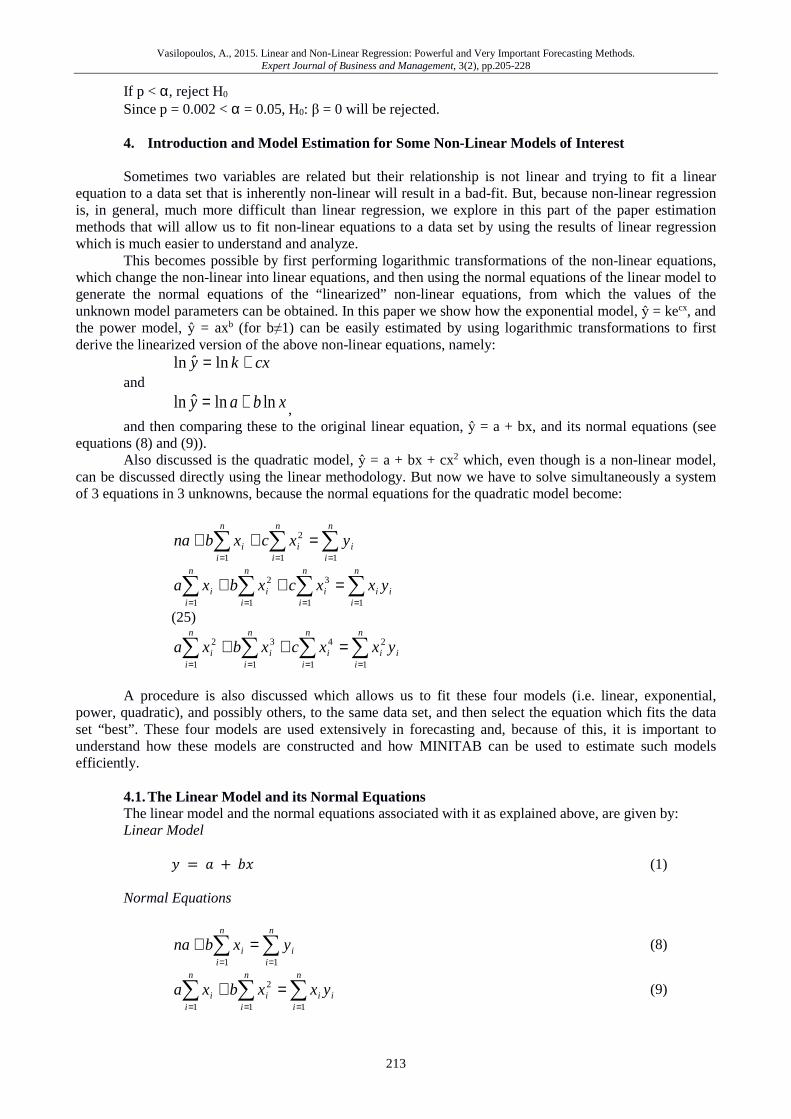
Vasilopoulos, A., 2015. Linear and Non-Linear Regression: Powerful and Very Important Forecasting Methods. Expert Journal of Business and Management, 3(2), pp.205-228
213
If p < α, reject H0 Since p = 0.002 < α = 0.05, H0: β = 0 will be rejected. 4. Introduction and Model Estimation for Some Non-Linear Models of Interest Sometimes two variables are related but their relationship is not linear and trying to fit a linear
equation to a data set that is inherently non-linear will result in a bad-fit. But, because non-linear regression is, in general, much more difficult than linear regression, we explore in this part of the paper estimation methods that will allow us to fit non-linear equations to a data set by using the results of linear regression which is much easier to understand and analyze.
This becomes possible by first performing logarithmic transformations of the non-linear equations, which change the non-linear into linear equations, and then using the normal equations of the linear model to generate the normal equations of the “linearized” non-linear equations, from which the values of the unknown model parameters can be obtained. In this paper we show how the exponential model, ŷ = kecx, and the power model, ŷ = axb (for b≠1) can be easily estimated by using logarithmic transformations to first derive the linearized version of the above non-linear equations, namely:
cxky += lnˆln and
xbay lnlnˆln += , and then comparing these to the original linear equation, ŷ = a + bx, and its normal equations (see
equations (8) and (9)). Also discussed is the quadratic model, ŷ = a + bx + cx2 which, even though is a non-linear model,
can be discussed directly using the linear methodology. But now we have to solve simultaneously a system of 3 equations in 3 unknowns, because the normal equations for the quadratic model become:
∑ ∑∑= ==
=++n
i
n
iii
n
ii yxcxbna
1 1
2
1
∑ ∑∑∑= ===
=++n
i
n
iii
n
iii
n
ii yxxcxbxa
1 11
32
1 (25)
∑ ∑∑∑= ===
=++n
i
n
iii
n
iii
n
ii yxxcxbxa
1 1
2
1
43
1
2
A procedure is also discussed which allows us to fit these four models (i.e. linear, exponential,
power, quadratic), and possibly others, to the same data set, and then select the equation which fits the data set “best”. These four models are used extensively in forecasting and, because of this, it is important to understand how these models are constructed and how MINITAB can be used to estimate such models efficiently.
4.1. The Linear Model and its Normal Equations The linear model and the normal equations associated with it as explained above, are given by: Linear Model � = � + �� (1)
Normal Equations
∑∑==
=+n
ii
n
ii yxbna
11
(8)
∑∑∑===
=+n
iii
n
ii
n
ii yxxbxa
11
2
1
(9)
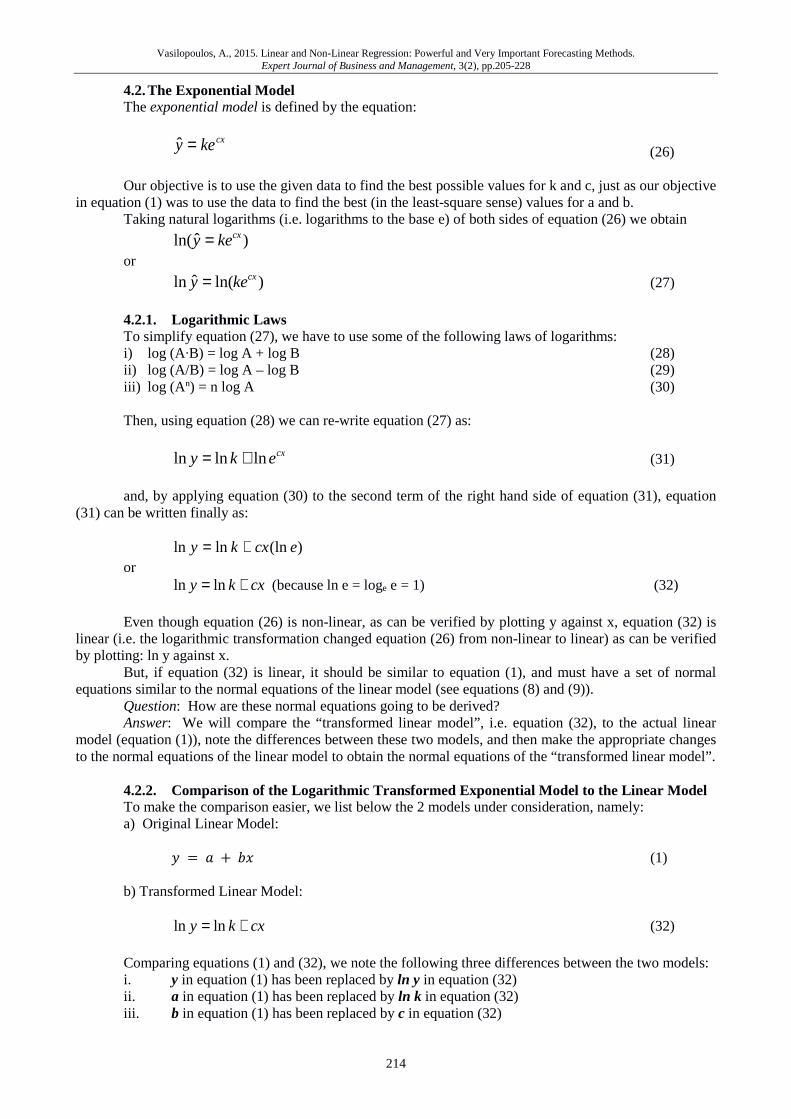
Vasilopoulos, A., 2015. Linear and Non-Linear Regression: Powerful and Very Important Forecasting Methods. Expert Journal of Business and Management, 3(2), pp.205-228
214
4.2. The Exponential Model The exponential model is defined by the equation:
cxkey =ˆ (26) Our objective is to use the given data to find the best possible values for k and c, just as our objective
in equation (1) was to use the data to find the best (in the least-square sense) values for a and b. Taking natural logarithms (i.e. logarithms to the base e) of both sides of equation (26) we obtain
)ˆln( cxkey = or
)ln(ˆln cxkey = (27) 4.2.1. Logarithmic Laws To simplify equation (27), we have to use some of the following laws of logarithms: i) log (A·B) = log A + log B (28) ii) log (A/B) = log A – log B (29) iii) log (An) = n log A (30) Then, using equation (28) we can re-write equation (27) as:
cxeky lnlnln += (31)
and, by applying equation (30) to the second term of the right hand side of equation (31), equation (31) can be written finally as:
)(lnlnln ecxky +=
or cxky += lnln (because ln e = loge e = 1) (32)
Even though equation (26) is non-linear, as can be verified by plotting y against x, equation (32) is
linear (i.e. the logarithmic transformation changed equation (26) from non-linear to linear) as can be verified by plotting: ln y against x.
But, if equation (32) is linear, it should be similar to equation (1), and must have a set of normal equations similar to the normal equations of the linear model (see equations (8) and (9)).
Question: How are these normal equations going to be derived? Answer: We will compare the “transformed linear model”, i.e. equation (32), to the actual linear
model (equation (1)), note the differences between these two models, and then make the appropriate changes to the normal equations of the linear model to obtain the normal equations of the “transformed linear model”.
4.2.2. Comparison of the Logarithmic Transformed Exponential Model to the Linear Model To make the comparison easier, we list below the 2 models under consideration, namely: a) Original Linear Model:
� = � + �� (1)
b) Transformed Linear Model:
cxky += lnln (32) Comparing equations (1) and (32), we note the following three differences between the two models: i. y in equation (1) has been replaced by ln y in equation (32) ii. a in equation (1) has been replaced by ln k in equation (32) iii. b in equation (1) has been replaced by c in equation (32)
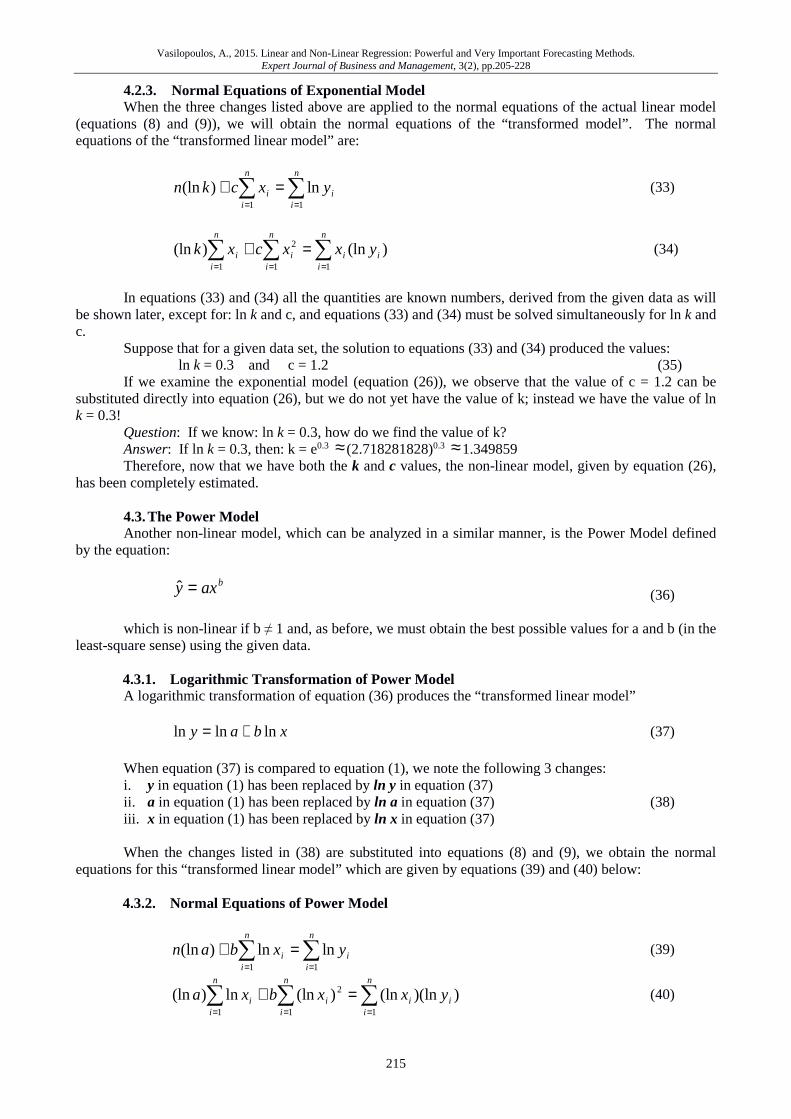
Vasilopoulos, A., 2015. Linear and Non-Linear Regression: Powerful and Very Important Forecasting Methods. Expert Journal of Business and Management, 3(2), pp.205-228
215
4.2.3. Normal Equations of Exponential Model When the three changes listed above are applied to the normal equations of the actual linear model
(equations (8) and (9)), we will obtain the normal equations of the “transformed model”. The normal equations of the “transformed linear model” are:
∑∑==
=+n
ii
n
ii yxckn
11
ln)(ln (33)
)(ln)(ln11
2
1∑∑∑
===
=+n
iii
n
ii
n
ii yxxcxk (34)
In equations (33) and (34) all the quantities are known numbers, derived from the given data as will
be shown later, except for: ln k and c, and equations (33) and (34) must be solved simultaneously for ln k and c.
Suppose that for a given data set, the solution to equations (33) and (34) produced the values: ln k = 0.3 and c = 1.2 (35) If we examine the exponential model (equation (26)), we observe that the value of c = 1.2 can be
substituted directly into equation (26), but we do not yet have the value of k; instead we have the value of ln k = 0.3!
Question: If we know: ln k = 0.3, how do we find the value of k? Answer: If ln k = 0.3, then: k = e0.3 ≈ (2.718281828)0.3 ≈1.349859 Therefore, now that we have both the k and c values, the non-linear model, given by equation (26),
has been completely estimated. 4.3. The Power Model Another non-linear model, which can be analyzed in a similar manner, is the Power Model defined
by the equation:
baxy =ˆ (36) which is non-linear if b ≠ 1 and, as before, we must obtain the best possible values for a and b (in the
least-square sense) using the given data. 4.3.1. Logarithmic Transformation of Power Model A logarithmic transformation of equation (36) produces the “transformed linear model”
xbay lnlnln += (37)
When equation (37) is compared to equation (1), we note the following 3 changes: i. y in equation (1) has been replaced by ln y in equation (37) ii. a in equation (1) has been replaced by ln a in equation (37) (38) iii. x in equation (1) has been replaced by ln x in equation (37) When the changes listed in (38) are substituted into equations (8) and (9), we obtain the normal
equations for this “transformed linear model” which are given by equations (39) and (40) below: 4.3.2. Normal Equations of Power Model
∑∑==
=+n
ii
n
ii yxban
11
lnln)(ln (39)
))(ln(ln)(lnln)(ln11
2
1∑∑∑
===
=+n
iii
n
ii
n
ii yxxbxa (40)
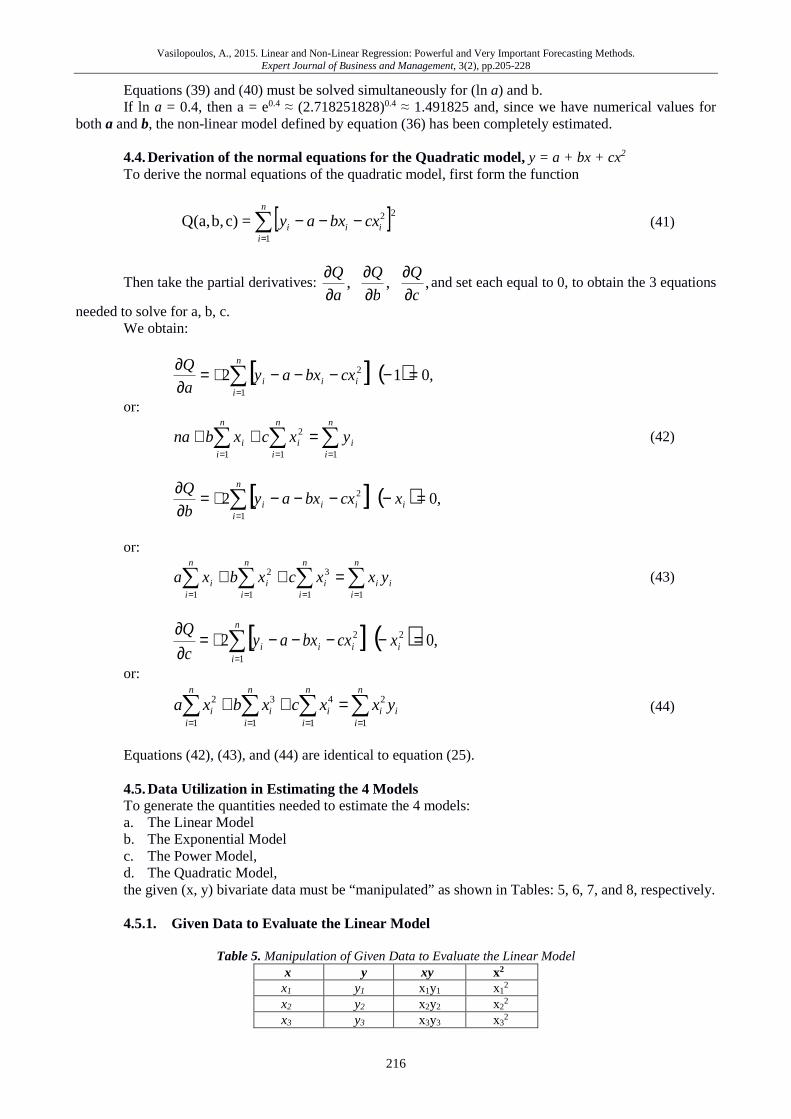
Vasilopoulos, A., 2015. Linear and Non-Linear Regression: Powerful and Very Important Forecasting Methods. Expert Journal of Business and Management, 3(2), pp.205-228
216
Equations (39) and (40) must be solved simultaneously for (ln a) and b. If ln a = 0.4, then a = e0.4 ≈ (2.718251828)0.4 ≈ 1.491825 and, since we have numerical values for
both a and b, the non-linear model defined by equation (36) has been completely estimated. 4.4. Derivation of the normal equations for the Quadratic model, y = a + bx + cx2 To derive the normal equations of the quadratic model, first form the function
[ ]∑=
−−−n
iiii cxbxay
1
22=c)b,Q(a, (41)
Then take the partial derivatives: ,,,c
Q
b
Q
a
Q
∂∂
∂∂
∂∂
and set each equal to 0, to obtain the 3 equations
needed to solve for a, b, c. We obtain:
[ ] ( )∑=
=−−−−+=∂∂ n
iiii cxbxay
a
Q
1
2 ,012
or:
∑ ∑ ∑= = =
=++n
i
n
i
n
iiii yxcxbna
1 1 1
2 (42)
[ ] ( )∑=
=−−−−+=∂∂ n
iiiii xcxbxay
b
Q
1
2 ,02
or:
∑ ∑ ∑∑= = ==
=++n
i
n
i
n
iii
n
iiii yxxcxbxa
1 1 11
32 (43)
[ ] ( )∑=
=−−−−+=∂∂ n
iiiii xcxbxay
c
Q
1
22 ,02
or:
∑ ∑ ∑∑= = ==
=++n
i
n
i
n
iii
n
iiii yxxcxbxa
1 1 1
2
1
432 (44)
Equations (42), (43), and (44) are identical to equation (25). 4.5. Data Utilization in Estimating the 4 Models To generate the quantities needed to estimate the 4 models: a. The Linear Model b. The Exponential Model c. The Power Model, d. The Quadratic Model, the given (x, y) bivariate data must be “manipulated” as shown in Tables: 5, 6, 7, and 8, respectively. 4.5.1. Given Data to Evaluate the Linear Model
Table 5. Manipulation of Given Data to Evaluate the Linear Model x y xy x2
x1 y1 x1y1
x12
x2 y2 x2y2
x22
x3 y3 x3y3
x3
2
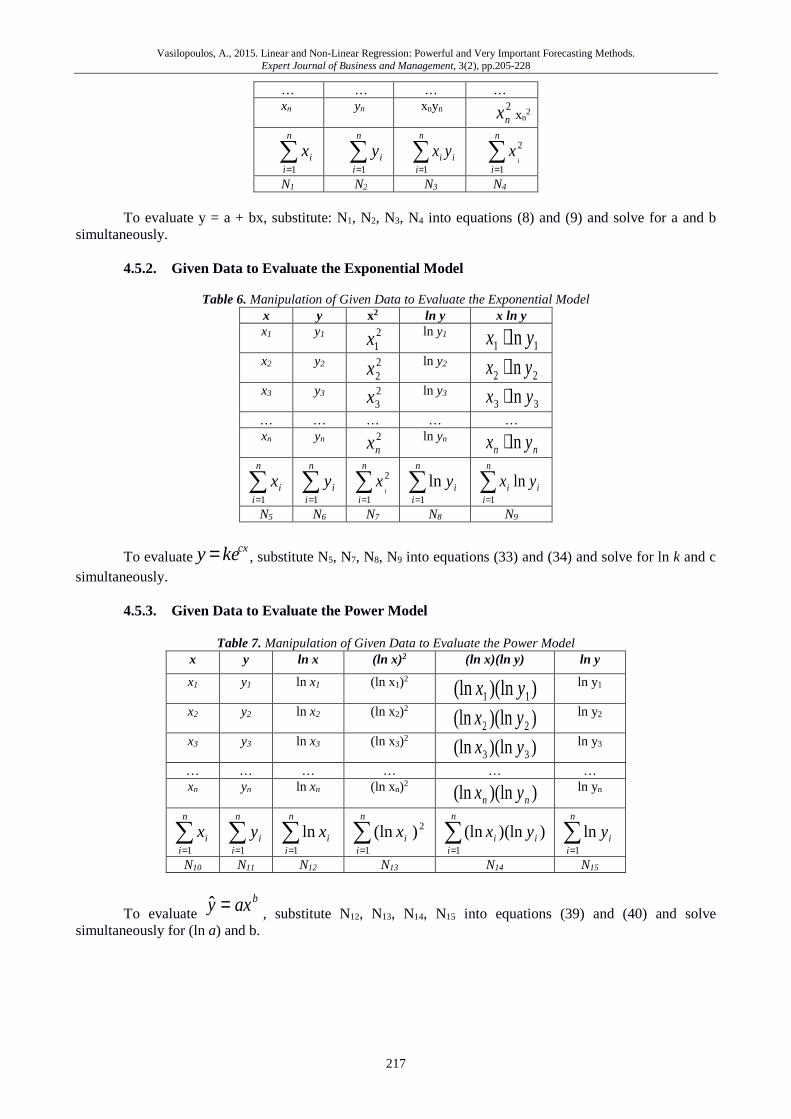
Vasilopoulos, A., 2015. Linear and Non-Linear Regression: Powerful and Very Important Forecasting Methods. Expert Journal of Business and Management, 3(2), pp.205-228
217
… … … … xn yn xnyn
2nx xn
2
∑
=
n
iix
1
∑
=
n
iiy
1
∑
=
n
iii yx
1
∑
=
n
ii
x1
2
N1 N2 N3 N4
To evaluate y = a + bx, substitute: N1, N2, N3, N4 into equations (8) and (9) and solve for a and b simultaneously.
4.5.2. Given Data to Evaluate the Exponential Model
Table 6. Manipulation of Given Data to Evaluate the Exponential Model
x y x2 ln y x ln y x1 y1 2
1x ln y1
11 ln yx ⋅
x2 y2 22x
ln y2 22 ln yx ⋅
x3 y3 23x
ln y3 33 ln yx ⋅
… … … … … xn yn 2
nx ln yn
nn yx ln⋅
∑=
n
iix
1
∑=
n
iiy
1
∑=
n
ii
x1
2 ∑
=
n
iiy
1
ln ∑=
n
iii yx
1
ln
N5 N6 N7 N8 N9
To evaluatecxkey= , substitute N5, N7, N8, N9 into equations (33) and (34) and solve for ln k and c
simultaneously. 4.5.3. Given Data to Evaluate the Power Model
Table 7. Manipulation of Given Data to Evaluate the Power Model x y ln x (ln x)2 (ln x)(ln y) ln y
x1 y1 ln x1 (ln x1)2 ))(ln(ln 11 yx ln y1
x2 y2 ln x2 (ln x2)2 ))(ln(ln 22 yx ln y2
x3 y3 ln x3 (ln x3)2 ))(ln(ln 33 yx ln y3
… … … … … … xn yn ln xn (ln xn)2 ))(ln(ln nn yx
ln yn
∑=
n
iix
1
∑=
n
iiy
1
∑=
n
iix
1
ln ∑=
n
iix
1
2)(ln ∑=
n
iii yx
1
))(ln(ln ∑=
n
iiy
1
ln
N10 N11 N12 N13 N14 N15
To evaluate baxy =ˆ
, substitute N12, N13, N14, N15 into equations (39) and (40) and solve simultaneously for (ln a) and b.
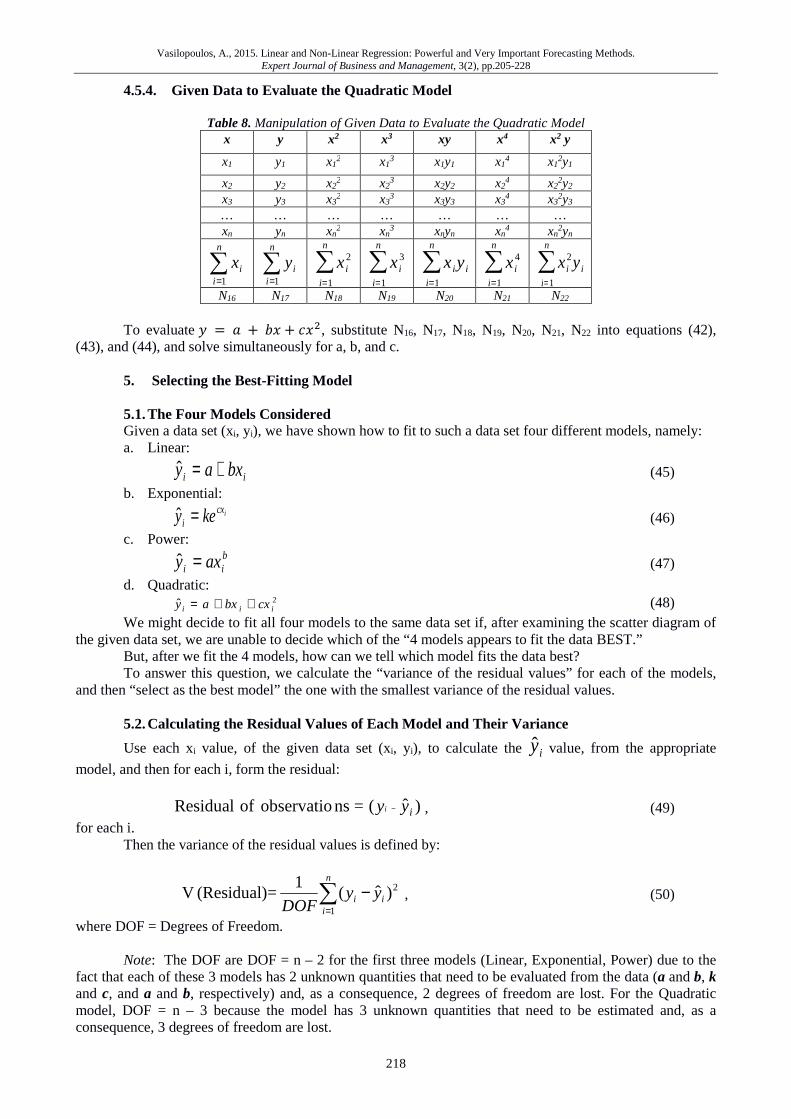
Vasilopoulos, A., 2015. Linear and Non-Linear Regression: Powerful and Very Important Forecasting Methods. Expert Journal of Business and Management, 3(2), pp.205-228
218
4.5.4. Given Data to Evaluate the Quadratic Model
Table 8. Manipulation of Given Data to Evaluate the Quadratic Model x y x2 x3 xy x4 x2 y
x1 y1 x12 x1
3 x1y1 x14 x1
2y1
x2 y2 x22 x2
3 x2y2 x24 x2
2y2 x3 y3 x3
2 x33 x3y3 x3
4 x32y3
… … … … … … … xn yn xn
2 xn3 xnyn xn
4 xn2yn
∑=
n
iix
1
∑=
n
iiy
1
xi2
i=1
n
∑ xi3
i=1
n
∑ xi
i=1
n
∑ yi xi4
i=1
n
∑ xi2
i=1
n
∑ yi
N16 N17 N18 N19 N20 N21 N22 To evaluate � = � + �� + ��, substitute N16, N17, N18, N19, N20, N21, N22 into equations (42),
(43), and (44), and solve simultaneously for a, b, and c.
5. Selecting the Best-Fitting Model 5.1. The Four Models Considered Given a data set (xi, yi), we have shown how to fit to such a data set four different models, namely: a. Linear:
ii bxay +=ˆ (45)
b. Exponential: icx
i key =ˆ (46)
c. Power: bii axy =ˆ (47)
d. Quadratic: 2ˆ iii cxbxay ++= (48)
We might decide to fit all four models to the same data set if, after examining the scatter diagram of the given data set, we are unable to decide which of the “4 models appears to fit the data BEST.”
But, after we fit the 4 models, how can we tell which model fits the data best? To answer this question, we calculate the “variance of the residual values” for each of the models,
and then “select as the best model” the one with the smallest variance of the residual values. 5.2. Calculating the Residual Values of Each Model and Their Variance
Use each xi value, of the given data set (xi, yi), to calculate the iy value, from the appropriate
model, and then for each i, form the residual:
)ˆ(= nsobservatio of Residual iyyi − , (49) for each i.
Then the variance of the residual values is defined by:
2
1
)ˆ(1
= (Residual) V ∑=
−n
iii yy
DOF , (50)
where DOF = Degrees of Freedom. Note: The DOF are DOF = n – 2 for the first three models (Linear, Exponential, Power) due to the
fact that each of these 3 models has 2 unknown quantities that need to be evaluated from the data (a and b, k and c, and a and b, respectively) and, as a consequence, 2 degrees of freedom are lost. For the Quadratic model, DOF = n – 3 because the model has 3 unknown quantities that need to be estimated and, as a consequence, 3 degrees of freedom are lost.
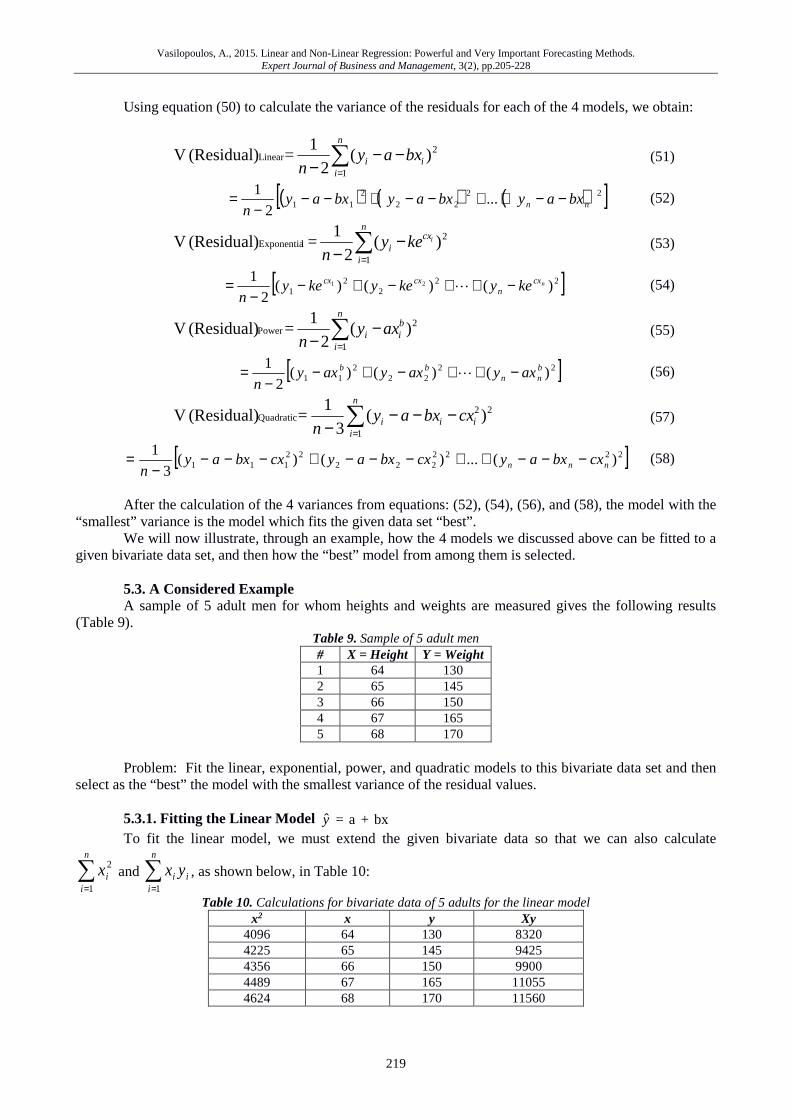
Vasilopoulos, A., 2015. Linear and Non-Linear Regression: Powerful and Very Important Forecasting Methods. Expert Journal of Business and Management, 3(2), pp.205-228
219
Using equation (50) to calculate the variance of the residuals for each of the 4 models, we obtain:
2
1
Linear )(2
1 = (Residual) V ∑
=
−−−
n
iii bxay
n (51)
( ) ( ) ( )[ ]2222
211 ...
2
1nn bxaybxaybxay
n−−++−−+−−
−= (52)
2
1
lExponentia )(2
1= (Residual) V ∑
=
−−
n
i
cxi
ikeyn
(53)
[ ]222
21 )()()(
2
121 ncx
ncxcx keykeykey
n−++−+−
−= L (54)
2
1
Power )(2
1= (Residual) V ∑
=
−−
n
i
bii axy
n (55)
[ ]2222
211 )()()(
2
1 bnn
bb axyaxyaxyn
−++−+−−
= L (56)
∑=
−−−−
n
iiii cxbxay
n 1
22Quadratic )(
3
1= (Residual) V (57)
[ ]2222222
22111 )(...)()(
3
1nnn cxbxaycxbxaycxbxay
n−−−++−−−+−−−
−= (58)
After the calculation of the 4 variances from equations: (52), (54), (56), and (58), the model with the
“smallest” variance is the model which fits the given data set “best”. We will now illustrate, through an example, how the 4 models we discussed above can be fitted to a
given bivariate data set, and then how the “best” model from among them is selected. 5.3. A Considered Example A sample of 5 adult men for whom heights and weights are measured gives the following results
(Table 9). Table 9. Sample of 5 adult men # X = Height Y = Weight 1 64 130 2 65 145 3 66 150 4 67 165 5 68 170
Problem: Fit the linear, exponential, power, and quadratic models to this bivariate data set and then
select as the “best” the model with the smallest variance of the residual values. 5.3.1. Fitting the Linear Model bx + a =y To fit the linear model, we must extend the given bivariate data so that we can also calculate
∑=
n
iix
1
2 and i
n
ii yx∑
=1
, as shown below, in Table 10:
Table 10. Calculations for bivariate data of 5 adults for the linear model x2 x y Xy
4096 64 130 8320 4225 65 145 9425 4356 66 150 9900 4489 67 165 11055 4624 68 170 11560
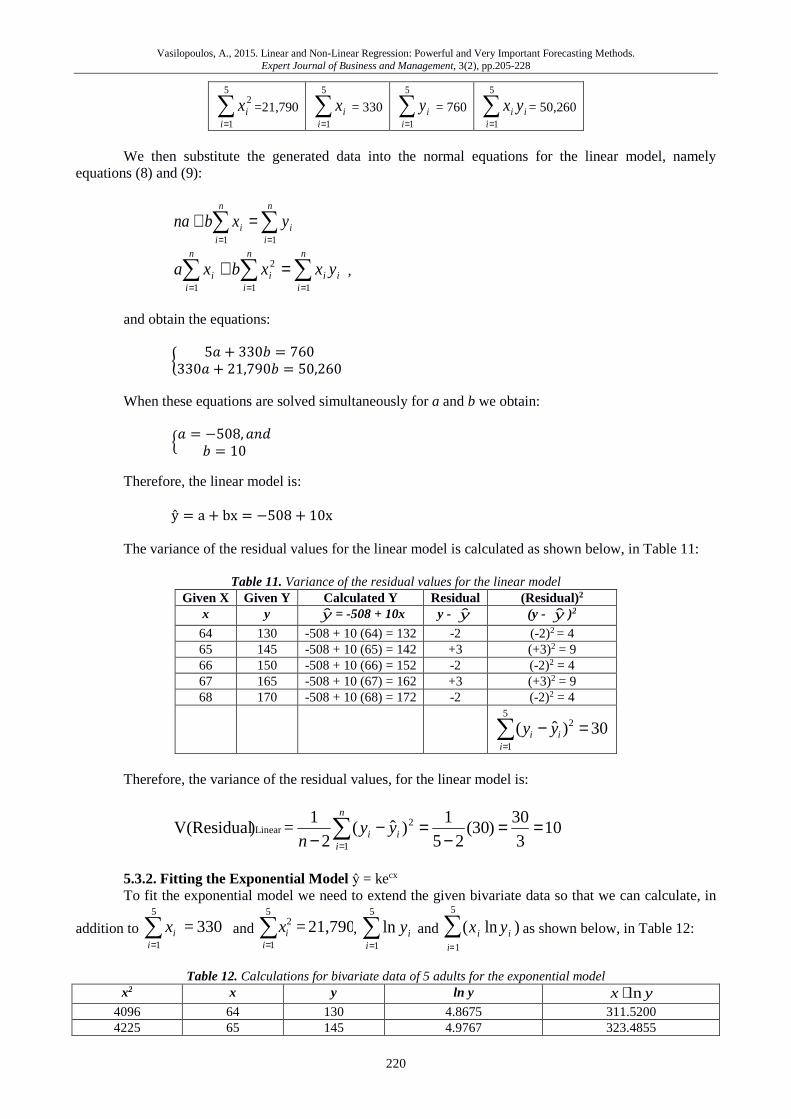
Vasilopoulos, A., 2015. Linear and Non-Linear Regression: Powerful and Very Important Forecasting Methods. Expert Journal of Business and Management, 3(2), pp.205-228
220
∑=
5
1
2
iix =21,790 ∑
=
5
1iix = 330 ∑
=
5
1iiy = 760 i
ii yx∑
=
5
1
= 50,260
We then substitute the generated data into the normal equations for the linear model, namely
equations (8) and (9):
∑∑==
=+n
ii
n
ii yxbna
11
∑∑∑===
=+n
iii
n
ii
n
ii yxxbxa
11
2
1
,
and obtain the equations:
6 5� + 330� = 760330� + 21,790� = 50,260
When these equations are solved simultaneously for a and b we obtain:
G� = −508, �2H� = 10
Therefore, the linear model is:
ŷ = a + bx = −508 + 10x The variance of the residual values for the linear model is calculated as shown below, in Table 11:
Table 11. Variance of the residual values for the linear model Given X Given Y Calculated Y Residual (Residual)2
x y y= -508 + 10x y - y (y - y )2
64 130 -508 + 10 (64) = 132 -2 (-2)2 = 4 65 145 -508 + 10 (65) = 142 +3 (+3)2 = 9 66 150 -508 + 10 (66) = 152 -2 (-2)2 = 4 67 165 -508 + 10 (67) = 162 +3 (+3)2 = 9 68 170 -508 + 10 (68) = 172 -2 (-2)2 = 4
30)ˆ( 2
5
1
=−∑=i
ii yy
Therefore, the variance of the residual values, for the linear model is:
103
30)30(
25
1)ˆ(
2
1 = )V(Residual 2
1
Linear ==−
=−− ∑
=
n
iii yy
n
5.3.2. Fitting the Exponential Model ŷ = kecx To fit the exponential model we need to extend the given bivariate data so that we can calculate, in
addition to 330 =5
1∑
=iix and 21,790 =
5
1
2∑=i
ix , ∑=
5
1
lni
iy and (xi ln yi
i=1
5
∑ ) as shown below, in Table 12:
Table 12. Calculations for bivariate data of 5 adults for the exponential model
x2 x y ln y x ⋅ ln y
4096 64 130 4.8675 311.5200 4225 65 145 4.9767 323.4855
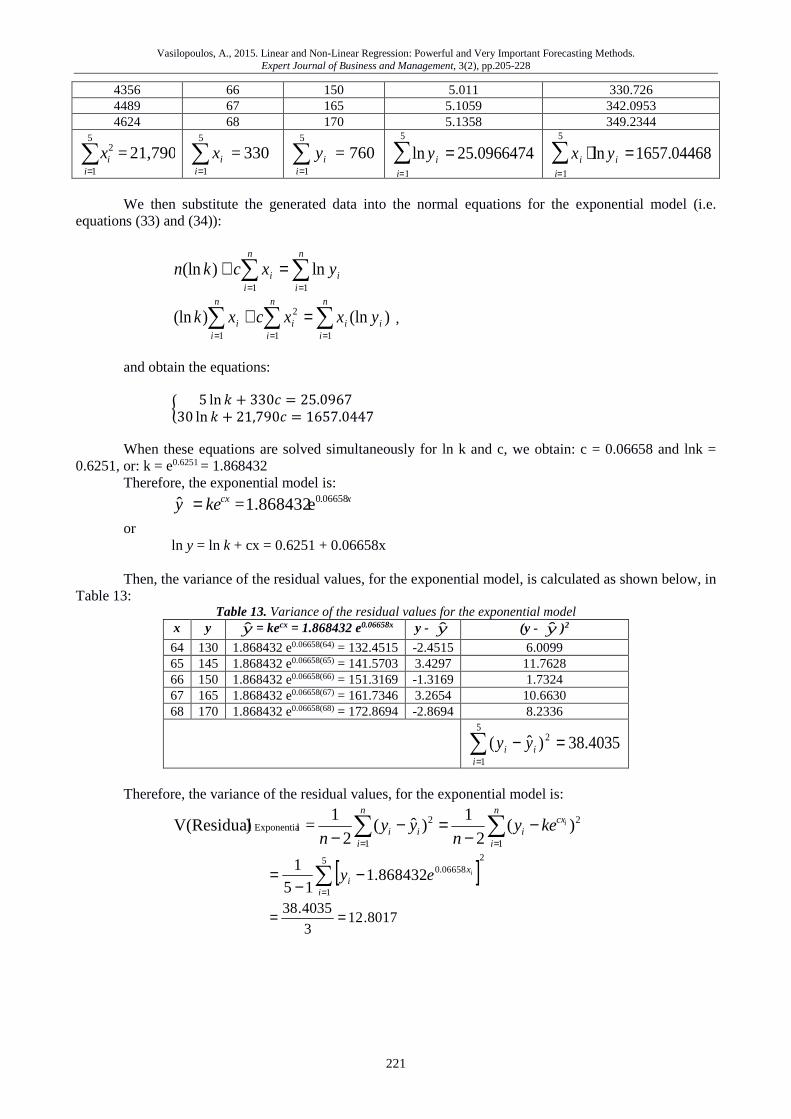
Vasilopoulos, A., 2015. Linear and Non-Linear Regression: Powerful and Very Important Forecasting Methods. Expert Journal of Business and Management, 3(2), pp.205-228
221
4356 66 150 5.011 330.726 4489 67 165 5.1059 342.0953 4624 68 170 5.1358 349.2344
21,790 =5
1
2∑=i
ix 330 =5
1∑
=iix 760=
5
1∑
=iiy ln yi
i=1
5
∑ = 25.0966474 xi ⋅ ln yi
i=1
5
∑ =1657.04468
We then substitute the generated data into the normal equations for the exponential model (i.e.
equations (33) and (34)):
∑∑==
=+n
ii
n
ii yxckn
11
ln)(ln
)(ln)(ln11
2
1∑∑∑
===
=+n
iii
n
ii
n
ii yxxcxk ,
and obtain the equations:
6 5 ln � + 330 = 25.096730 ln � + 21,790 = 1657.0447
When these equations are solved simultaneously for ln k and c, we obtain: c = 0.06658 and lnk =
0.6251, or: k = e0.6251 = 1.868432 Therefore, the exponential model is:
xcxkey 06658.0e 1.868432 =ˆ =
or ln y = ln k + cx = 0.6251 + 0.06658x
Then, the variance of the residual values, for the exponential model, is calculated as shown below, in
Table 13: Table 13. Variance of the residual values for the exponential model
x y y= kecx = 1.868432 e0.06658x y - y (y - y )2
64 130 1.868432 e0.06658(64) = 132.4515 -2.4515 6.0099 65 145 1.868432 e0.06658(65) = 141.5703 3.4297 11.7628 66 150 1.868432 e0.06658(66) = 151.3169 -1.3169 1.7324 67 165 1.868432 e0.06658(67) = 161.7346 3.2654 10.6630 68 170 1.868432 e0.06658(68) = 172.8694 -2.8694 8.2336
4035.38)ˆ( 2
5
1
=−∑=i
ii yy
Therefore, the variance of the residual values, for the exponential model is:
2
1
2
1
lExponentia )(2
1)ˆ(
2
1 = )V(Residual ∑∑
==
−−
=−−
n
i
cxi
n
iii
ikeyn
yyn
[ ]25
1
06658.0868432.115
1∑
=
−−
=i
xi
iey
8017.123
4035.38 ==

Vasilopoulos, A., 2015. Linear and Non-Linear Regression: Powerful and Very Important Forecasting Methods. Expert Journal of Business and Management, 3(2), pp.205-228
222
5.3.3. Fitting the Power Model, ŷ = axb
To fit the power model we need to extend the given bivariate data set to generate the quantities:
∑=
n
iix
1
ln , 2
1
)(ln∑=
n
iix , ∑
=
n
iiy
1
ln and ))(ln(ln1∑
=
n
iii yx , and this is accomplished as shown below, in Table
14:
Table 14. Calculations for bivariate data of 5 adults for the power model x y ln x (ln x)2 ln y (ln x)(ln y) 64 130 4.158883 17.2963085 4.867553 20.2435 65 145 4.1738727 17.42550908 4.976734 20.7723 66 150 4.189654742 17.55320686 5.010635 20.9928 67 165 4.204692619 17.67944002 5.105945 21.4689 68 170 4.219507705 17.80424527 5.135798 21.6705
∑=
5
1
lni
ix
=20.9471
25
1
)(ln∑=i
ix
=87.7581
∑=
5
1
lni
iy
=25.0967
))(ln(ln5
1∑
=iii yx
=105.1505 We then substitute the generated data into the normal equations of the power model, namely
equations (39) and (40):
∑∑==
=+n
ii
n
ii yxban
11
lnln)(ln
))(ln(ln)(lnln)(ln11
2
1∑∑∑
===
=+n
iii
n
ii
n
ii yxxbxa
and obtain the equations:
G 5 ln � + 20.9471� = 25.096720.9471 ln � + 87.7581� = 105.1505
When these equations are solved simultaneously for b and ln a we obtain:
G� = 4.3766, �2Hln � = −13.316
Therefore, the “linearized” power model becomes: ln ŷ = ln � + � ln � = −13.316 + 4.3766� Then the variance of the residual values for the power model is obtained as shown below:
Table 15. Variance of the residual values for the power model
x y ln x ln y= ln a + b ln x
= -13.316 + 4.3766x y y - y (y - y )2
64 130 4.158883 ln y 1 = 4.885768 132.3920 -2.3920 5.721664
65 145 4.173873 ln y 2 = 4.95623 141.6874 3.3126 10.973319
66 150 4.189655 ln y 3 = 5.020443 151.4784 -1.47843 2.185667
67 165 4.204693 ln y 4 = 5.086258 161.7833 3.2167 10.347159
68 170 4.219508 ln y 5 = 5.151097 172.6208 -2.6208 6.868592
i=1
5
∑ (yi - iy )2
= 36.09640
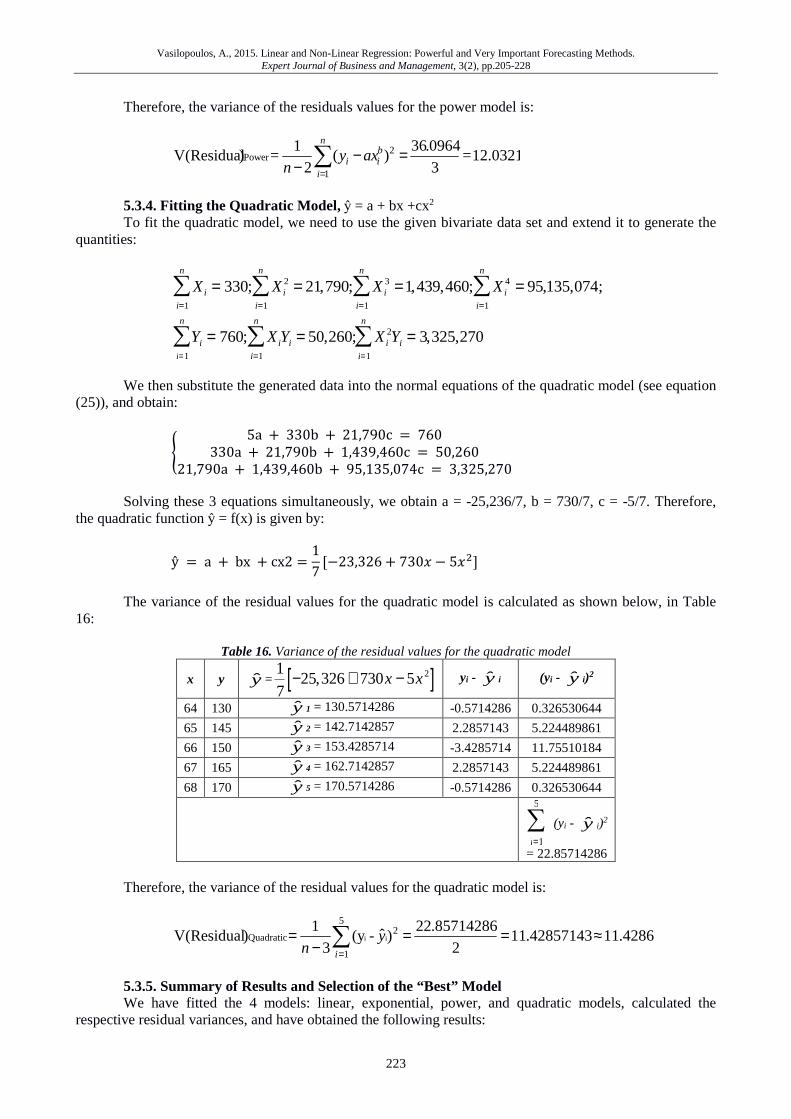
Vasilopoulos, A., 2015. Linear and Non-Linear Regression: Powerful and Very Important Forecasting Methods. Expert Journal of Business and Management, 3(2), pp.205-228
223
Therefore, the variance of the residuals values for the power model is:
12.0321 =3
0964.36)(
2
1= )V(Residual 2
1
Power =−− ∑
=
n
i
bii axy
n
5.3.4. Fitting the Quadratic Model, ŷ = a + bx +cx2 To fit the quadratic model, we need to use the given bivariate data set and extend it to generate the
quantities:
Xi = 330; Xi2
i=1
n
∑ = 21,790i=1
n
∑ ; Xi3
i=1
n
∑ =1,439,460; Xi4 = 95,135,074;
i=1
n
∑
Yi
i=1
n
∑ = 760; XiYi = 50,260;i=1
n
∑ Xi2Yi = 3,325,270
i=1
n
∑
We then substitute the generated data into the normal equations of the quadratic model (see equation
(25)), and obtain:
K 5a + 330b + 21,790c = 760330a + 21,790b + 1,439,460c = 50,26021,790a + 1,439,460b + 95,135,074c = 3,325,270
Solving these 3 equations simultaneously, we obtain a = -25,236/7, b = 730/7, c = -5/7. Therefore,
the quadratic function ŷ = f(x) is given by:
ŷ = a + bx + cx2 = 17 [−23,326 + 730� − 5��] The variance of the residual values for the quadratic model is calculated as shown below, in Table
16:
Table 16. Variance of the residual values for the quadratic model
x y y=1
7−25,326+ 730x − 5x2[ ] yi - y i (yi - y i)2
64 130 y 1 = 130.5714286 -0.5714286 0.326530644
65 145 y 2 = 142.7142857 2.2857143 5.224489861
66 150 y 3 = 153.4285714 -3.4285714 11.75510184
67 165 y 4 = 162.7142857 2.2857143 5.224489861
68 170 y 5 = 170.5714286 -0.5714286 0.326530644
i=1
5
∑ (yi - y i)2
= 22.85714286 Therefore, the variance of the residual values for the quadratic model is:
4286.1142857143.112
85714286.22)ˆ - (y
3
1)V(Residual
5
1
2 Quadratic ii ≈==
−= ∑
=i
yn
5.3.5. Summary of Results and Selection of the “Best” Model We have fitted the 4 models: linear, exponential, power, and quadratic models, calculated the
respective residual variances, and have obtained the following results:

Vasilopoulos, A., 2015. Linear and Non-Linear Regression: Powerful and Very Important Forecasting Methods. Expert Journal of Business and Management, 3(2), pp.205-228
224
a) The linear model is: 10x 508- bx + aˆ +==y with V(Residual)Linear = 10 b) The exponential model is:
xcxkey 06658.0e 1.868432 =ˆ =
with V(Residual)Exponential = 12.8017 c) The power model is: ln x 4.3766 + 13.316- =ln x b + aln ˆln =y with V(Residual)Power = 12.0321 d) The quadratic model is
[ ]22 5730326,257
1 = cx +bx + aˆ xxy −+−=
with V(Residual) Quadratic = 11.4286 Since the linear model has the smallest variance of the residual values of the 4 models fitted to the
same bivariate data set, the linear model is the “best” model (but the other 3 values are very close). The linear model, therefore, will be selected as the “best” model and used for forecasting purposes.
6. MINITAB Solutions To obtain the MINITAB solutions of the four models we discussed in this paper we do the
following: 6.1. Finding the MINITAB Solution for the Linear Mo del The data set used to find the MINITAB solution for the linear model is presented in Table 17.
Table 17. Data set in MINITAB for the linear model MTB > Set C1 DATA> 64 65 66 67 68 DATA> end MTB > set C2 DATA> 130 145 150 165 170 DATA> end MTB > Name C1 'X' C2 'Y' MTB > REGRESS 'Y' 1 'X'
The results of the regression analysis for the linear model is presented in Table 18.
Table 18. Regression analysis: Y versus X for the linear model Regression equation: Y = - 508 + 10.0 X Predictor Coef SE Coef T p Constant -508.000 66.020 -7.700 0.005 X 10.000 1.000 10.000 0.002
Regression fit: S R-Sq R-Sq (adj) 3.162 97.1% 96.1%
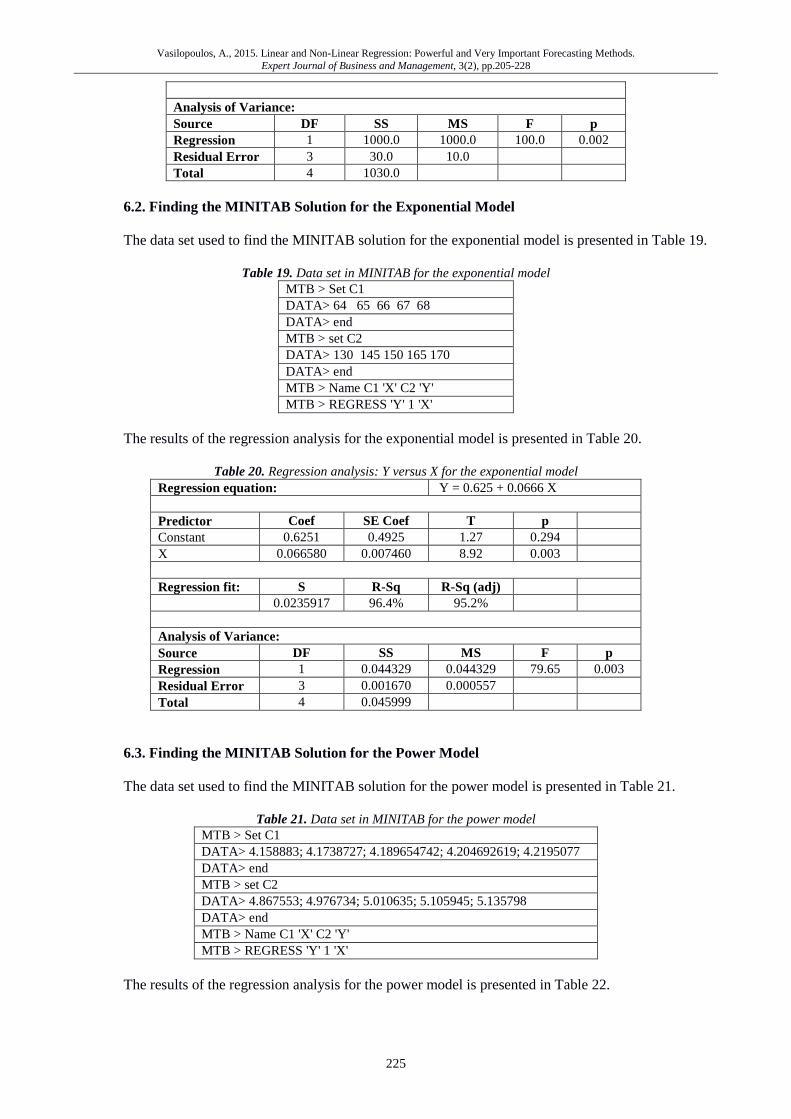
Vasilopoulos, A., 2015. Linear and Non-Linear Regression: Powerful and Very Important Forecasting Methods. Expert Journal of Business and Management, 3(2), pp.205-228
225
Analysis of Variance: Source DF SS MS F p Regression 1 1000.0 1000.0 100.0 0.002 Residual Error 3 30.0 10.0 Total 4 1030.0
6.2. Finding the MINITAB Solution for the Exponential Model The data set used to find the MINITAB solution for the exponential model is presented in Table 19.
Table 19. Data set in MINITAB for the exponential model MTB > Set C1 DATA> 64 65 66 67 68 DATA> end MTB > set C2 DATA> 130 145 150 165 170 DATA> end MTB > Name C1 'X' C2 'Y' MTB > REGRESS 'Y' 1 'X'
The results of the regression analysis for the exponential model is presented in Table 20.
Table 20. Regression analysis: Y versus X for the exponential model Regression equation: Y = 0.625 + 0.0666 X Predictor Coef SE Coef T p Constant 0.6251 0.4925 1.27 0.294 X 0.066580 0.007460 8.92 0.003
Regression fit: S R-Sq R-Sq (adj)
0.0235917 96.4% 95.2%
Analysis of Variance: Source DF SS MS F p Regression 1 0.044329 0.044329 79.65 0.003 Residual Error 3 0.001670 0.000557
Total 4 0.045999
6.3. Finding the MINITAB Solution for the Power Model The data set used to find the MINITAB solution for the power model is presented in Table 21.
Table 21. Data set in MINITAB for the power model MTB > Set C1 DATA> 4.158883; 4.1738727; 4.189654742; 4.204692619; 4.2195077 DATA> end MTB > set C2 DATA> 4.867553; 4.976734; 5.010635; 5.105945; 5.135798 DATA> end MTB > Name C1 'X' C2 'Y' MTB > REGRESS 'Y' 1 'X'
The results of the regression analysis for the power model is presented in Table 22.
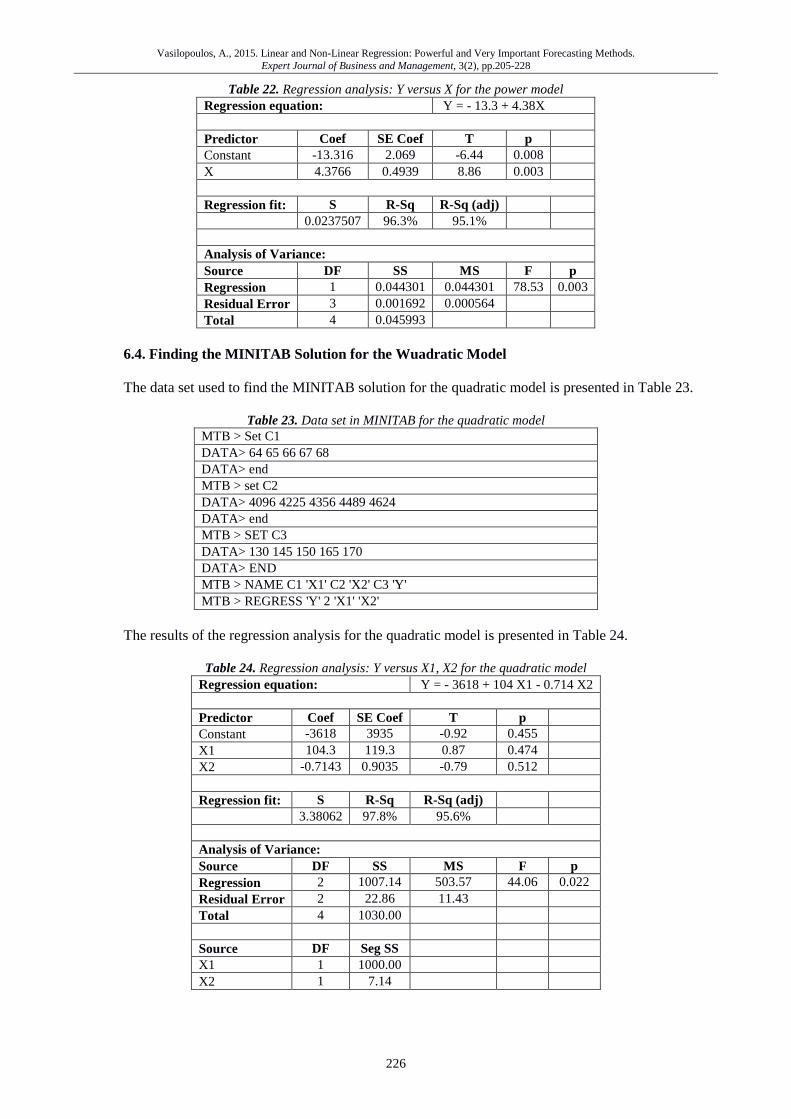
Vasilopoulos, A., 2015. Linear and Non-Linear Regression: Powerful and Very Important Forecasting Methods. Expert Journal of Business and Management, 3(2), pp.205-228
226
Table 22. Regression analysis: Y versus X for the power model Regression equation: Y = - 13.3 + 4.38X Predictor Coef SE Coef T p Constant -13.316 2.069 -6.44 0.008
X 4.3766 0.4939 8.86 0.003
Regression fit: S R-Sq R-Sq (adj)
0.0237507 96.3% 95.1%
Analysis of Variance: Source DF SS MS F p Regression 1 0.044301 0.044301 78.53 0.003 Residual Error 3 0.001692 0.000564
Total 4 0.045993
6.4. Finding the MINITAB Solution for the Wuadratic Model The data set used to find the MINITAB solution for the quadratic model is presented in Table 23.
Table 23. Data set in MINITAB for the quadratic model MTB > Set C1 DATA> 64 65 66 67 68 DATA> end MTB > set C2 DATA> 4096 4225 4356 4489 4624 DATA> end MTB > SET C3 DATA> 130 145 150 165 170 DATA> END MTB > NAME C1 'X1' C2 'X2' C3 'Y' MTB > REGRESS 'Y' 2 'X1' 'X2'
The results of the regression analysis for the quadratic model is presented in Table 24.
Table 24. Regression analysis: Y versus X1, X2 for the quadratic model Regression equation: Y = - 3618 + 104 X1 - 0.714 X2 Predictor Coef SE Coef T p Constant -3618 3935 -0.92 0.455
X1 104.3 119.3 0.87 0.474
X2 -0.7143 0.9035 -0.79 0.512
Regression fit: S R-Sq R-Sq (adj)
3.38062 97.8% 95.6%
Analysis of Variance: Source DF SS MS F p Regression 2 1007.14 503.57 44.06 0.022 Residual Error 2 22.86 11.43
Total 4 1030.00 Source DF Seg SS X1 1 1000.00 X2 1 7.14
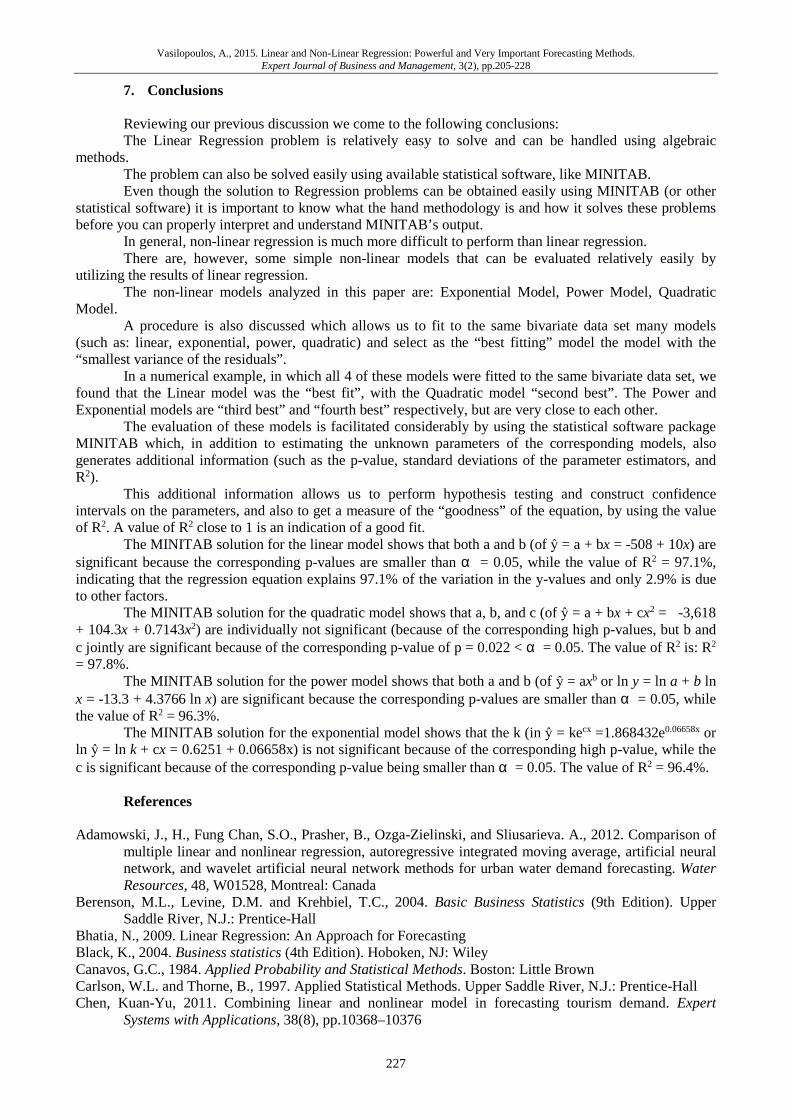
Vasilopoulos, A., 2015. Linear and Non-Linear Regression: Powerful and Very Important Forecasting Methods. Expert Journal of Business and Management, 3(2), pp.205-228
227
7. Conclusions Reviewing our previous discussion we come to the following conclusions:
The Linear Regression problem is relatively easy to solve and can be handled using algebraic methods. The problem can also be solved easily using available statistical software, like MINITAB. Even though the solution to Regression problems can be obtained easily using MINITAB (or other statistical software) it is important to know what the hand methodology is and how it solves these problems before you can properly interpret and understand MINITAB’s output. In general, non-linear regression is much more difficult to perform than linear regression. There are, however, some simple non-linear models that can be evaluated relatively easily by utilizing the results of linear regression. The non-linear models analyzed in this paper are: Exponential Model, Power Model, Quadratic Model. A procedure is also discussed which allows us to fit to the same bivariate data set many models (such as: linear, exponential, power, quadratic) and select as the “best fitting” model the model with the “smallest variance of the residuals”. In a numerical example, in which all 4 of these models were fitted to the same bivariate data set, we found that the Linear model was the “best fit”, with the Quadratic model “second best”. The Power and Exponential models are “third best” and “fourth best” respectively, but are very close to each other. The evaluation of these models is facilitated considerably by using the statistical software package MINITAB which, in addition to estimating the unknown parameters of the corresponding models, also generates additional information (such as the p-value, standard deviations of the parameter estimators, and R2). This additional information allows us to perform hypothesis testing and construct confidence intervals on the parameters, and also to get a measure of the “goodness” of the equation, by using the value of R2. A value of R2 close to 1 is an indication of a good fit. The MINITAB solution for the linear model shows that both a and b (of ŷ = a + bx = -508 + 10x) are significant because the corresponding p-values are smaller than α = 0.05, while the value of R2 = 97.1%, indicating that the regression equation explains 97.1% of the variation in the y-values and only 2.9% is due to other factors. The MINITAB solution for the quadratic model shows that a, b, and c (of ŷ = a + bx + cx2 = -3,618 + 104.3x + 0.7143x2) are individually not significant (because of the corresponding high p-values, but b and c jointly are significant because of the corresponding p-value of p = 0.022 < α = 0.05. The value of R2 is: R2 = 97.8%. The MINITAB solution for the power model shows that both a and b (of ŷ = axb or ln y = ln a + b ln x = -13.3 + 4.3766 ln x) are significant because the corresponding p-values are smaller than α = 0.05, while the value of R2 = 96.3%. The MINITAB solution for the exponential model shows that the k (in ŷ = kecx =1.868432e0.06658x or ln ŷ = ln k + cx = 0.6251 + 0.06658x) is not significant because of the corresponding high p-value, while the c is significant because of the corresponding p-value being smaller than α = 0.05. The value of R2 = 96.4%.
References
Adamowski, J., H., Fung Chan, S.O., Prasher, B., Ozga-Zielinski, and Sliusarieva. A., 2012. Comparison of
multiple linear and nonlinear regression, autoregressive integrated moving average, artificial neural network, and wavelet artificial neural network methods for urban water demand forecasting. Water Resources, 48, W01528, Montreal: Canada
Berenson, M.L., Levine, D.M. and Krehbiel, T.C., 2004. Basic Business Statistics (9th Edition). Upper Saddle River, N.J.: Prentice-Hall
Bhatia, N., 2009. Linear Regression: An Approach for Forecasting Black, K., 2004. Business statistics (4th Edition). Hoboken, NJ: Wiley Canavos, G.C., 1984. Applied Probability and Statistical Methods. Boston: Little Brown Carlson, W.L. and Thorne, B., 1997. Applied Statistical Methods. Upper Saddle River, N.J.: Prentice-Hall Chen, Kuan-Yu, 2011. Combining linear and nonlinear model in forecasting tourism demand. Expert
Systems with Applications, 38(8), pp.10368–10376

Vasilopoulos, A., 2015. Linear and Non-Linear Regression: Powerful and Very Important Forecasting Methods. Expert Journal of Business and Management, 3(2), pp.205-228
228
Childress, R.L., Gorsky, R.D. and Witt, R.M., 1989. Mathematics for Managerial Decisions. Upper Saddle River, N.J.: Prentice-Hall
Chou, Ya-lun, 1992. Statistical Analysis for Business and Economics. New York: Elsevier Freud, J.E. and Williams, F.J., 1982. Elementary Business Statistics: The Modern Approach. Upper Saddle
River, N.J.: Prentice-Hall McClave, J.T., Benson, G.P. and Sincich, T., 2001. Statistics for Business and Economics (8th Edition).
Upper Saddle River, N.J.: Prentice-Hall Pindyck, R. and Rubinfeld, D.L., 1981. Econometric Models and Economic Forecasts (2nd Edition). New
York: McGraw-Hill Vasilopoulos, A. and Lu, F.V., 2006. Quantitative Methods for Business with Computer Applications.
Boston, MA: Pearson Custom Publishing Vasilopoulos, A., 2005. Regression Analysis Revisited. Review of Business, 26 (3), pp.36-46 Vasilopoulos, A., 2007. Business Statistics – A Logical Approach. Theory, Models, Procedures, and
Applications Including Computer (MINITAB) Solutions. Boston, MA: Pearson Custom Publishing

Copyright © 2015 Sprint Investify • ISSN-L 2344-6781 • Online ISSN 2344-6781
http://business.expertjournals.com
Expert Journals
Currently, Expert Journals represents four open access journals: Expert Journal of Business and Management, Expert Journal of
Economics, Expert Journal of Finance and Expert Journal of Marketing.
Expert Journals is committed to publishing papers that are thought-provoking and exploratory in order to make contributions to each
field of study.
These journals deliver original, peer-reviewed papers from international authors meant to provide new theoretical and empirical
frameworks and ideas in their respective fields. The research articles in all the journals are available in full-text and free of charge to our
web visitors.
High-Quality Manuscripts. Manuscripts submitted to Expert Journals can present empirical, conceptual and review papers, teaching notes,
case studies, book reviews that provide relevant insights in banking and finance. The submitted articles should exhibit relevancy, value,
originality, clear argumentation, reasoning, persuasive evidence, intelligent analysis, and clear writing. Also, we highly recommend that
authors concur to generally accepted publication ethics in developing their articles.
All online journals for Expert Journals are open access, meaning that the accepted articles are available for any reader to access and
download for free.
ISSN-L 2344-6781Online ISSN 2344-6781
EXPERT JOURNALSBusiness and ManagementEconomicsMarketingFinance
CONTENTS CONTINUED
A CONCEPTUAL MAPPING RESOURCE ADVANTAGE THEORY, COMPETITIVE ADVANTAGE THEORY, ANDTRANSIENT COMPETITIVE ADVANTAGE 140Jasanta PERANGINANGIN
REMODELING STRATEGIC STAFF SAFETY AND SECURITY RISKS MANAGEMENT IN NIGERIAN TERTIARYINSTITUTIONS 150Sunday S. AKPAN, Isaac A. AYANDELE
GLOBAL LEADERSHIP AND ORGANIZATIONAL CHANGE FROM PAST TO NOW 166Alexander STELZER
UPPER ECHELON THEORY: ROLE OF COMMUNITY AND STRATEGY 171Majdi Anwar QUTTAINAH
THE IMPACT OF SOX ADOPTION ON THE COMPENSATION OF NON-US COMPANIES’ BOARDS: THE CASE OFCANADIAN COMPANIES 182Nadejda SERDIUC, Hanen KHEMAKHEM
SUPPLIER ANALYSIS OF THE IMMEX IN SONORA 189Rosalina JAIME MEULY
HUMAN RESOURCE MANAGEMENT’S MARKETING APPROACH AND ITS CONTRIBUTION TOWARDSEMPLOYEE-SATISFACTION 194Susanna MINDER, Signe BALINA
LINEAR AND NON-LINEAR REGRESSION: POWERFUL AND VERY IMPORTANT FORECASTING METHODS 205Athanasios VASILOPOULOS