Journal of Pharmacy and Pharmacology 1970 Volume.22 No.3
102
Journal of Pharmacy and Pharmacology H The Pharmaceutical Society of Great Britain
-
Upload
khangminh22 -
Category
Documents
-
view
2 -
download
0
Transcript of Journal of Pharmacy and Pharmacology 1970 Volume.22 No.3

Journal of Pharmacy and Pharmacology
HT h e P h a r m a c e u t ic a l S o c ie ty
o f G re a t B r ita in

6You don’t take a hammer to a Rotapress’In 1843 William Brockedon, a North Country Chemist, was granted a patent for the novel process of “Shaping Pills, Lozenge and Black Lead by pressure in Dies.” At the time his pre-occupation was the manufacture of pencils and it is thought that he applied the pressure by means of a hammer. No doubt Mr. Brockedon would be not a little startled if he could see the far- reaching consequences both social and scientific that his ingenious idea has unleashed to-day.
In the B.P. of 1898 there was only one tablet formula Tabellae Trinitrini, which could hardly be described as a typical example of a tablet. In the current B.P. there are no less than 227 monographs concerned with compressed Tablets.
Some 113 years after William Brock- edon’s application, another patent was granted this time to John Holroyd, the parent company of Manesty Machines. This patent related to the invention of a machine for the production of coated tablets by Compression, an equally novel idea. The machine in question was, in fact, the famous DryCota, which is now accepted the World over for the production not only of coated tablets but more often for complex Pharmaceutical formulations by the Compression method.
MANESTY have been involved in many patents both before and since
1956. It is this ability to harness ingenuity in design to engineering excellence which keeps the Company in the van of World tablet machine manufacturers.
Apart from machines with specialized functions such as the DryCota, BiCota, AutoCota, Layerpress and Accela Cota, MANESTY have a constantly developing line of modern high speed rotary presses. The new Mark II Rotapress and the Betapress are its present leaders.
Wherever tablets are made it is odds-on that you will find machines manufactured by MANESTY in operation and — not a hammer in sight!
M A N E S T YThe name behind the greatest names in tablets and now we hare won the Queen’s Award
Manesty Machines Ltd, Speke, Liverpool .L24 9LQ Tel. C51-486 1972

Journal of Pharmacy and PharmacologyPublished by T h e P h a rm a ceu tica l So c iet y o f G reat B r ita in 17 Bloomsbury Square, London, W.C.l. Telephone: 01-405 8967 V olu m e 22 Num ber 3 March 1970
Editor: George Brownlee, D.Sc., Ph.D., F.P.S. Assistant Editor: J. R. Fowler, B.Pharm., F.P.S. Editorial Board: H. S. Bean, W. C. Bowman, M. R. W. Brown, J. E. Carless, F. Fish, G. E.
Foster, F. Hartley, E. F. Hersant, D. Jack, C. A. Johnson, K. A. Lees, D. W. Mathieson,M. W. Parkes, M. J. Rand, J. M. Rowson, E. Shotton, M. J. FI. Smith, R. T. Williams. Secretary: D. F. Lewis.
Notice to ContributorsT h e J o urnal o f P harm acy and P h a rm a cology reviews and reports original research in those sciences which contribute to the development and evaluation of medicinal substances, covering inter alia biochemistry, chemistry, microbiology, pharmaceutics, pharmacognosy and pharmacology. Short papers of immediate interest are published as ‘Letters to the Editor.'Original research papers or review articles are accepted on the understanding that they are subject to editorial revision and that their content has not been published in whole or in part elsewhere.
Text. Authors should consult a c u rr en t issue of the Journal and conform to the typographical conventions, use of headings, lay-out of tables, and citation of references. Texts must be typewritten in double spacing on sheets not larger than 9 X 1 3 inches (22 X 32 cm) with a minimum margin of l i inch (3 cm). The top copy and one carbon copy should be sent. The name(s) of the contributor(s), the name and address of the laboratory where the work was done and a shortened title (not more than a total of 50 letters and spaces) should accompany the typescript. The presentation adopted should be that best suited to the clear exposition of the subject matter. A summary should be included, giving results and conclusions in the form of an abstract suitable for use as such by abstracting journals.
References. References should be arranged to the h a rv a rd system. In the text the surname of the author(s) and the date of publication are given thus: Lewis & Train(1965) described . . . . or . . . . has been described (Lewis & Train, 1965). The list of references is in alphabetical order of first authors and each reference is arranged as follows: L e w is , C. J. & T r a in , D. (1965). J. Pharm. Pharmac., 17, 33—41. The title of publication is underlined and abbreviated as in World List of Scientific Periodicals (4th edn, 1963-1965 and supplements) and is followed by the volume number and first and last page numbers. References to books should be as follows: G o o d m a n , L. S. & G il m a n , A. (1965). The Pharmacological Basis of Therapeutics, 3rd edn, p. 464, London : Collier-Macmillan.
Tables (for each copy of the text) should be typed on separate sheets, their headings should describe their content and they should be understandable without reference to the text. They should not be ruled.
Illustrations. Should be kept to the minimum number necessary to the proper understanding of the subject matter. Two of each are required, one prepared as described below the other a photo copy suitable for submission to a referee. Line illustrations such as graphs or apparatus diagrams should be clearly and boldly drawn in Indian ink on tracing cloth or paper, white paper, faintly blue-lined graph paper or Bristol board. The initial dimensions should be chosen to allow for a reduction to at least one-half and not more than one-quarter of the original size. (Most illustrations in the Journal are 2-4 inches, in width.) Kymograph records and photographs should be selected to allow for reduction to a similar extent. Lettering and numbering should be inserted lightly and clearly in pencil. Curves based on experimental data should carry clear and bold indications of the experimentally determined points, which should be marked by using, preferably, circles, crosses, triangles or squares. Legends for illustrations should be typed on separate sheets of paper and appended to the typescript of the paper or to the individual figures. The author’s name, the title of the paper and the number of the figure should be written lightly in pencil on the back of each illustration. The approximate position of each illustration should be marked in the text.
Reprints. 50 reprints are supplied free of charge to the author. A further 10 reprints are supplied free to each co-author. Additional reprints may be purchased.
Copyright© 1970 by the Journal of Pharmacy and
Pharmacology. All rights of reproduction are reserved in all countries in respect of all articles, papers, illustrations, etc.Annual subscription (including postage) £9, (U.S.A. $25). Single copies £1, (U.S.A. $3).Claims for missing copies cannot be considered unless received within 3 months of publication.
W N«*]« im iw itrw h d W-4.aEI.2513

IV The Journal of Pharmacy and Pharmacology March, 1970
. . . f r o m t h e " o r i g i n a l s u p p l i e r "
S T A N D A R D M E T H O D S M E D I AA ll D ifc o S ta n d a r d M e th o d s M e d ia c o n fo rm to p jb l is h e d s p e c if ic a t io n s fo r th e e x a m in a t io n o f w a te r , s e w a g e , d a iry p ro d u c ts a n d fo o d s . T h e w o r ld 's m o s t in c lu s iv e lin e - a ll y o u r s ta n d a rd m e th o d s m e d ia a v a i la b le f r o m o n e s o u rc e , D i f c o L a b o ra to r ie s . ,
A c c o r d in g to s p e c if ic a t io n s a n d s ta n d a rd s o f -
U S P U n ite d S ta te s P h a r m a c o p o e ia X V I I 1 9 6 5
A P H A S ta n d a r d M e t h o d s fo r E x a m in a t io n o f D a iry P ro d u c ts X I I 1 9 6 5S ta n d a r d M e t h o d s fo r E x a m in a t io n o f W a t e r a n d W a s t e - w a t e r X I I 1 9 6 5
A O A C A s s o c ia t io n o f O f f ic ia l A g r ic u ltu ra l C h e m is ts X 1 9 6 5
B & Tare the sole concessionaire for DIFCO products. A complete line of microbiological reagents and media.B a ird a n d T a t lo c k , Postal Address: P .O . B o x 1 , R o m fo r d ,
R M 1 1 H A . Situated at: F re s h w a te r R o a d , C h a d w e ll H e a th , E ssex .
Tel: 0 1 - 5 9 0 7 7 0 0 ( 2 5 l in e s ) . Telex: 2 4 2 2 5 B a irh o p . Cables: B u re tte R o m fo rd ,
D I F C O
T AS. DO.F

J . P h a r m . P h a r m a c . , 1970, 22, 153-169 R e c e i v e d O c to b e r 23, 1969
The application of nuclear magnetic resonance to pharmacological problems*
A. S. V. BURGEN AND J. C. METCALFE
Medical Research Council Molecular Pharmacology Unit, Cambridge, U.K.
Nuclear magnetic resonance (nmr) was first discovered in the investigation of fundamental properties of matter but rapidly became an important method in chemical research because of the wealth of detail it is capable of giving about molecular structure. The application to purely biological problems is more recent, but a number of the basic techniques for studying biological systems are now established and more extensive use of the method is desirable.
This survey is intended to accomplish two ends. Firstly to show that the basic principles of nmr spectroscopy are straightforward and easy to understand, and secondly to show the main ways in which this technique can be applied to problems of drug binding.
THE P R IN C IP LE S OF N U CLE A R M A G N ETIC RESONANCE
The resonance phenomenonWe will consider only the behaviour of the hydrogen nucleus in a magnetic field,
since almost all the work to date has been concerned with the resonances of this atom. The hydrogen atom has a single proton nucleus with spin I = \ and a magnetic moment, ¡i. If the proton nucleus is placed in a powerful magnetic field, it aligns itself in the direction of the field like a tiny bar magnet. Because of the quantized nature of nuclear magnetic moments, only two orientations of the proton with respect to the field are permitted. It can be aligned either in the direction of the field, or in opposition to the field.
If it is given precisely the right amount of energy, a proton aligned with the field can be flipped into the antiparallel direction against the applied field. In so doing it must absorb energy, since this orientation is less stable than the original orientation with the field. It is this absorption of energy which is the basis of the observation of the magnetic resonance of the proton.
The energy associated with a proton aligned with the field H„ is — /zH0, and against the field is +/aH0.
To induce transitions between these two orientations a quantum of energy of frequency exactly equal to AE, the energy difference between the two levels, is required The quantum of energy is given by hv = AE = —2 /xH0 where h is Planck’s constant.
Ho
111 *pHo
. AE = -2 jj Hoi n _ -PHo
* Based on a demonstration presented at the 4th International Congress of Pharmacology, Basle, Switzerland, July 14-18, 1969.

154 A. S. V. BURGEN AND J. C. METCALFENote that only the precise quantum AE will induce transitions since the two per
mitted orientations are exactly defined. The energy required is directly proportional to both the magnetic moment of the proton and the strength of the applied field.
At the magnetic field strengths currently available the resonance frequency falls conveniently in the radiofrequency range:
For sensitivity reasons explained later it is necessary that AE shall be as large as possible. This implies that only nuclei such as protons with high /x values are suitable for biological systems. It also implies that the applied field H0 should be as intense as possible.
The line widths of proton resonances for molecules in aqueous solutions commonly fall in the range OT to 1-0 Hz in a total frequency of 108 Hz.
This implies that measurements are made to 1 part in 108-109 and the magnetic field must be homogeneous to the same order if full resolution of the spectra is to be obtained. The construction of magnets with this degree of homogeneity is difficult and accounts for a substantial part of the cost of the instruments.
The essential components of an nmr spectrometer are the magnet, sample probe, radiofrequency (rf) units and accessories for recording the spectra. The sample is contained in a cylindrical glass tube (usually 5 mm diameter, holding ~0-5 ml). The radiofrequency power is supplied by coils adjacent to the sample and the induced power picked up by other coils. The strength of the magnetic field can be gradually increased until it is exactly right to give resonance at the radiofrequency employed.
The main limitation on the nmr cf biological systems is the sensitivity of the method. This is limited by two factors.
The energy of the transitions AE = — 2 /xH0 is very small, because nuclear magnetic moments are very small, even for the proton. Since AE is small, the populations of protons in the two orientations at equilibrium in a magnetic field are very nearly equal. The excess of nuclei in the lower energy level is only «1 in 105 in a field of 23,500 gauss (v = 100 MHz).
Since the radiofrequency field induces transitions between these two orientations with equal probability in both directions, there is only a net absorption of energy while an excess of nuclei is maintained in the lower energy level. As the power of the radiofrequency field is increased, it tends to equalize the populations of nuclei in the two energy levels. When this occurs the intensity of the observed signal decreases and eventually disappears. This phenomenon is termed saturation and limits the radiofrequency power which can be used and hence the sensitivity with which resonance can be detected.
The second factor determining the radiofrequency intensity at which saturation occurs and hence the sensitivity, is the rate at which nuclei return from the excited state to the lower energy level, restoring the necessary excess of nuclei in this level. This process is termed relaxation and for protons in liquids the half time is in the range 0T to 10 s. This slow relaxation together with the small value of AE account for the inherent insensitivity of nmr. In practice, to detect a proton signal in a single scan, a
H0 (K gauss)14T23-551-7
v (MHz)6 0 ~
1 0 0
2 2 0

Application o f nmr to pharmacological problems 155concentration of 1-10 mM is required and to examine many biological materials, computer techniques are necessary to enhance sensitivity.
One advantage of the very small value of AE for nmr transitions is that no chemical changes are produced in the system by the absorption of energy at resonance. A second advantage is that nmr parameters which characterize the spectra are very sensitive to the chemical environment of protons in a molecule. It is this which accounts for the high information content of nmr spectroscopy and its particular attraction for biological systems.
The relation of nmr spectroscopy to the electromagnetic spectrum is shown to emphasize how small is the energy absorbed at resonance (Fig. 1).
FrequencyHZ
Energy AE Kcal/mol
Transitions
3x10 4x10 5x10 1 0”
MJV and Visi bl« - ■Infra Red- ■Microwave ■ Radio
260 38 0 -S6
vibrational
|esr |nmr
9-5 9-5*10* X10"7
Électron Nuclearspin Magneticresonance Resonance
Fig. 1. The'electromagnetic spectrum.
Features o f nmr spectraA proton resonance signal is characterized by 3 parameters.(1) The precise frequency v at which resonance occurs for each set of protons in a
molecule. There are practical difficulties in measuring the precise frequency and the resonance position is therefore measured with respect to a convenient standard (e.g. tetramethylsilane, TMS) which is arbitrarily assigned the value zero. The position of a resonance from this zero in dimensionless units (parts per million, ppm) is then termed the chemical shift, 8 or alternatively r which is 10-8.
(2) The multiplicity of signals arising from a set of chemically equivalent protons in a molecule (e.g. methyl protons). This depends on the effect of the magnetic fields of adjacent protons, and is characterized by the coupling constant J.
(3) The lifetime of a nucleus in the excited state, and the width of the resonance absorption signals are characterized by the relaxation time T.
We now consider each of these parameters in turn.
The chemical shiftThe resonances of protons in aqueous solution are spread over approximately 10
ppm of the total resonance frequency. This is a range of 1000 Hz for a resonance frequency of 100 MHz.
The resonance frequency is not exactly the same for all protons because in an applied field H0, the effective field Hefr actually experienced by the protons is modified by their electronic environment, this is because electrons themselves have a magnetic moment which causes a local perturbation in the magnetic field experienced at the proton. The electron shielding is generally greater the higher the electron density around the proton, and we expect the shielding effect to decrease when the proton is in the vicinity of an electron withdrawing atom or group.
156 A. S. V. BURGEN AND J. C. METCALFEFor example we find that for methyl groups, the shielding experienced decreases in
the seriesc h 3 c > c h 3 n > CH3 0 —
with corresponding shifts in the frequency at which resonance takes place. A simple example is shown in Fig. 2. The spectrum of methyl acetate consists of two narrow lines of equal magnitude corresponding to the acetyl methyl and ester methyl. Note that the TMS reference signal falls at even higher field, where the methyl protons are very strongly shielded.
-0CH3 CH3CO-
TMS- l
F i g . 2 . T h e n m r s p e c tru m o f m e th y l a c e ta te s h o w s tw o e q u a l ly s ize d re s o n a n c e s d u e t o th e C H 30 a n d C H 3 CO g ro u p s . A s m a ll a m o u n t of te t ra m e th y ls ila n e (TMS) is in c lu d e d as a re fe re n c e .
Approximate resonance positions are shown for protons in a range of simple chemical structures listed in Table 1.
The position of all these resonances can be understood in terms of the electronic shielding of the protons from the applied field H0.
Especially of note are the resonances of aromatic ring protons (see benzene) which are very weakly shielded and consequently fall at low field strengths.
Table 1. Chemical shifts o f common groups
( p p m )
C H O (acetaldehyde) .. .. .. .. 9-72C eH e (benzene) .. .. .. .. .. 7-26C H CI3 ................................................................ 7-25- C H = ( f u m a r a t e )............................................ 6-74H f i ...................................................... 5-0Ci72OH (ethanol) ............................................ 3-59C // 3OH (m e th a n o l)............................................ 3-38C if 3N (trimethylamine) .. .. .. .. 2T2C H 3C O (acetone) ............................................ 2-09C / / 3-C O H (t - b u t a n o l)........................................... 1-22-C H 2- (cyclohexane) .. .. .. .. 1-44-C H 3Si ................................................................ 0
Spin coupling and spin coupling constantsIn the spectrum of acetaldehyde (CH3CHO) the methyl resonance consists of two
signals of equal intensity, while the resonance for the single aldehyde proton is split into a quartet with intensities in the ratio of 1:3:3:1 (Fig. 3).
1 0 8 ppm 4 2 0
F ig . 3. The spectrum of acetaldehyde showing the splitting of the C H 3 signal into a doublet and CHO signal into a quartet by spin coupling.

The separation between the resonances in both the doublet and the quartet is the same (Hz) and is termed the coupling constant, J.
The areas of the doublet and the quartet are in the ratio 3:1, which is the relative number of protons comprising each signal. Thus the signal area is directly proportional to the number of protons giving rise to the signal, and this frequently helps with the identification of resonances.
The multiplet structure of the acetaldehyde resonances can be readily understood once it is realized that the magnetic field experienced by a set of protons is affected by the magnetic field or nearby nuclei. For example the methyl (CH3) protons of acetaldehyde experience the two distinct orientations allowed for by the magnetic moment of the adjacent -CHO proton.
Application o f nmr to pharmacological problems 157
1
t\ >CHO proton orientations modifying Heff
These two orientations are equally probable so that half the methyl protons in the population experience Heff perturbed by each orientation. This accounts for the observation of the methyl doublet. The -CHO proton experiences a field perturbed by a more complicated set of arrangements of the methyl protons. These are:
-HF (i)m tn m 0 )i l l TILTH i3) -ilL (l)
Methyl proton orientations with respect to the applied field
The expected ratio of intensities of the individual lines of the quartet is therefore 1:3:3:1, as observed in the spectrum.
Relaxation processesRelaxation processes limit, the life time of a nucleus in the excited state. The
absorbed energy is given up by two main processes.(a) Spin-lattice relexation. The absorbed energy of the excited nuclei is dissipated
as random thermal motion throughout the assembly of nuclei in the sample (termed Lie lattice). This process acts directly to maintain the excess of nuclei in the lower energy level and is characterized by the relaxation time Tx.
This can be measured directly by applying a radiofrequency field of sufficient intensity to completely saturate the signal, and then following the recovery of the absorption signal with time, using a radiofrequency field of low intensity (Fig. 4). The exponential time course of the recovery is characterized by the time constant Tx.
i _ . A i i i u mt * t . -----------------------*■ Time
Resonance Saturation Return to originalwith low with high low intensity fieldintensity intensity and follow recoveryrf field r f field with time.
F ig . 4. The measurement o f spin-lattice relaxation by saturation and recovery.

158 A. S. V. BURGEN AND J. C. METCALFE(b) Spin-spin relaxation. Two protons in the correct spatial relation to each other in
the applied field are able to undergo a mutual exchange of orientations. This process does not affect the net number of nuclei in each orientation but does limit the life-time in the excited state. Spin-spin relaxation is characterized by the relaxation time T 2. The lifetime of the excited state directly determines the line width of resonance absorption signals so that long relaxation times give narrow lines in the spectrum and short relaxation times give broad lines. The exact relation is T2 = l/nAv where Av is the width of the line in Hz at half its maximum height, and T2 is in seconds.
An important feature of the relaxation times is that they are connected with the motion of the molecules. Both relaxation processes occur more efficiently the longer the nuclei remain aligned with the applied field. Thermal motion tends to disorientate the nuclei, so that the faster the nuclei are tumbling in solution, the longer are the relaxation times. In all experiments described here the rate of molecular motion directly determines the relaxation times Tj and T2 and they are in fact equal in magnitude (Tj = T2). For this reason we will refer in future to a single relaxation time T which is directly proportional to the rate of molecular motion of the nucleus.
INTERACTION OF ANAESTHETICS WITH CYTO-MEMBRANES We expect that when a small molecule (e.g. local anaesthetic) is partitioned into'an
ordered membrane structure, its molecular motion will be restricted whether it is inserted into the membrane lipid or bound to membrane protein. This steric interaction is readily detected from the increase in relaxation rate (1 /T) of the small molecule which results in broadened resonances.
Fig. 5. The curve on the left shows the resonance due to the five aromatic protons of benzyl alcohol dissolved in water. The curve on the right shows the same concentration of benzyl alcohol in the presence of a 1% suspension of erythrocyte membranes. The line is broadened and reduced in amplitude (Metcalfe, Seeman & Burgen, 1968).
Fig. 5 shows the broadening of the aromatic proton line of benzyl alcohol :n a 1 -0% erythrocyte membrane suspension.
The benzyl alcohol molecules exchange sufficiently rapidly between the bound and free states to give a resonance whose line width is the weighted mean of the free and bound states. That is
where a is the fraction of the alcohol molecules located in the membrane and (1 /T 2)membr and (1 /T 2)free are the values for the anaesthetic in the two separate locations.
2 HzFree benzyl alcohol 10 7» Erythrocyte membranes
T.ie values obtained show that alcohol molecules in the membrane are slowed by at leist three orders of magnitude in their rotation rates.
Experiments made with systems in rapid exchange are particularly easy because it is usually possible to work with high concentrations of the free drug compared with the concentration of the bound drug and so gain sensitivity.
This also means that the line width is under experimental control and that inconveniently broad signals need not be dealt with.
Application o f nmr to pharmacological problems 159
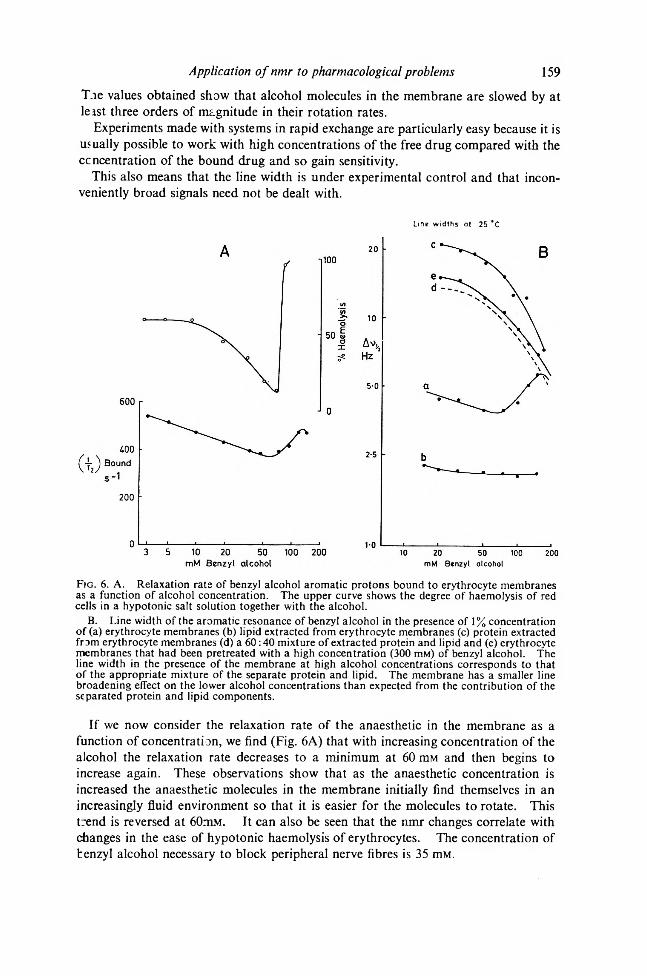
Line widths at 25 *C
Fig. 6 . A. Relaxation rats of benzyl alcohol aromatic protons bound to erythrocyte membranes as a function of alcohol concentration. The upper curve shows the degree of haemolysis of red cells in a hypotonic salt solution together with the alcohol.
B. Line width of the aromatic resonance of benzyl alcohol in the presence of 1% concentration of (a) erythrocyte membranes (b) lipid extracted from erythrocyte membranes (c) protein extracted from erythrocyte membranes (d) a 60:40 mixture of extracted protein and lipid and (e) erythrocyte membranes that had been pretreated with a high concentration (300 nm) of benzyl alcohol. The line width in the presence of the membrane at high alcohol concentrations corresponds to that of the appropriate mixture of the separate protein and lipid. The membrane has a smaller line broadening effect on the lower alcohol concentrations than expected from the contribution of the separated protein and lipid components.
If we now consider the relaxation rate of the anaesthetic in the membrane as a function of concentration, we find (Fig. 6A) that with increasing concentration of the alcohol the relaxation rate decreases to a minimum at 60 mM and then begins to increase again. These observations show that as the anaesthetic concentration is increased the anaesthetic molecules in the membrane initially find themselves in an increasingly fluid environment so that it is easier for the molecules to rotate. This trend is reversed at 60mM. It can also be seen that the nmr changes correlate with changes in the ease of hypotonic haemolysis of erythrocytes. The concentration of benzyl alcohol necessary to block peripheral nerve fibres is 35 mM.

160 A. S. V. BURGEN AND J. C. METCALFEFurther analysis of this phenomenon has been possible by studying the behaviour of
the alcohol in the presence of separated lipid and protein from the membrane.It is found that at the highest concentration, the relaxation of the anaesthetic in the
membrane corresponds to that in a mixture of protein and lipid of the correct proportions (Fig. 6B). However, in the lower concentrations, the relaxation rate in the membrane is much less than in the separated components and in these concentrations the organization of the membrane clearly reduces the degree of interaction of the anaesthetic with its components. The kind of results obtained with erythrocyte membranes can be extended to other membranes with generally similar results and also to other anaesthetics. In some such cases a number of resonances may be studied as has been done with xylocaine.
Xylocaine is a cationic local anaesthetic and competes for cationic binding sites in the membrane with inorganic cations. This phenomenon may be studied by nmr. For instance in the presence of Ca2+ a significant fraction of the xylocaine is displaced from the membrane (Fig. 7).
mM Xylocaine [pH SU]F i g . 7. Line width of the xylene methyl resonances of xylocaine in the presence of 1% erythrocyte membranes with 100 mM NaCl in the medium with this replaced by 50 mM CaCl2. The lines are narrowed by the Ca ions particularly at low anaesthetic concentrations. The narrowing is due to reduced binding of anaesthetic consequent on competitition between Caz+ ions and the xylocaine cation.
The number of molecules which can be examined directly by nmr is limited by the sensitivity requirement for concentrations > 10 m M . A wider range of molecules interacting with the membrane can be examined indirectly using a low concentration of benzyl alcohol as a reporter for changes induced in the membrane structure by other agents. An example of such an experiment where we can follow the relaxation changes of both reporter and perturbing agent simultaneously is shown (Fig. 8A). The upswing in the line width of the 15 m M benzyl alcohol resonance induced by neo- pentanol occurs simultaneously with the upswing for neopentanol itself. Thus the reporter benzyl alcohol and neopentanol are detecting the same changes in membrane structure.
Using this technique we have examined the line width changes induced in 15 m M
benzyl alcohol by the n-alkyl alcohols. Up to hexanol (C6) the form of the curve is similar to that for benzyl alcohol itself, and for each alcohol the upswing coincides with the lytic concentration range (Fig. 8B).

Application o f nmr to pharmacological problems 161
m M n e o p e n ta n o l m M C n H 2n + 1 O H
Fig . 8 A. A 1% suspension of erythrocyte membranes in a medium containing 15% mM benzyl alcohol. Neopentanol was added as indicated in the abscissa and the aromatic resonances of benzyl alcohol and the methyl resonance of neopentanol measured. It can be seen that changing the concentration of neopentanol affects both its relaxation and that of the indicator benzyl alcohol.
B. A similar experiment except that the normal aliphatic alcohols from propyl to hexyl were added. Only the line widths of the benzyl aromatic resonance were measured (lower curves). The upper curves show the effect of the alcohols on haemolysis.
IN T E R A C T IO N S OF PRO TEINS W IT H SM ALL MOLECULES
Aliphatic drugs such as acetylcholine can exist in multiple conformations (rotamers) in solution. Can we tell whether these exist for a sufficient time to be distinguishable species in drug-receptor interactions ? We have mentioned previously that T, the nmr relaxation time in liquids depends on the motion of a proton with respect to its nearest neighbours. Thus for a methyl group the relaxation of each proton depends mainly on the motion of that proton with respect to the two others attached to the same carbon atom. Consider a methyl group -C H 3 attached to a group R. If rotation about the bond is free, relaxation can occur by intra-molecular rotation of the -C H 3 as in (a). If rotation about the bond is not permitted, relaxation can only occur as a result of tumbling of the whole molecule as in (b) (Fig. 9).
(a)Intramolecular
rotation
lb)Rotation of the whole
molecule
Fig . 9. Relaxation by intramolecular rotation.
In the first case (a) relaxation will be almost completely insensitive to the size of R, in the second (b) it will be directly dependent on the rotational tumbling rate of the molecule.

162 A. S. V. BUF.GEN AND J. C. METCALFE
T -1 (c a lc u la te d ) f o r liq u id m o le c u le M w
Fig. 10A. Relaxation of n-alkyltrimethylammonium methyl protons.B. Comparison of experimental relaxation rates of methyl protons in alkylammoniums with
values calculated for (i) free rotation around bonds (ii) relaxation only by molecular tumbling, (data from Nogrady & Burgen, 1969).
This is approximately proportional to the reciprocal of the molecular weight. In (Fig. 10A) the relaxations of the A-alkyl trimethyl ammoniums CnH2n+1 + N(CH3)3 are shown. It is clear that there is a strong dependence on molecular weight. It is possible to calculate the relaxation rates for the two extreme cases of Fig. 9 and compare them with the experimental results (Fig. 10B). It can be seen that the experimental values agree well with the calculation for a rigid molecule but do not agree at all with the supposition of free rotation around bonds. These results show that the drug rotates as a whole many times before rotation around the bonds occurs. The rotamers can therefore be considered as stable configurations during the time of collision with a receptor.
The drugs so far dealt with have C-C and C -N bonds. Bonds with oxygen -O - are usually much less restricted rotationally. This is confirmed by the relaxation measurements, thus the relaxations o f-0 -C H 3 or -0 -C 0 C H 3 groups are intermediate between rigid and free rotation. Two examples are shown in Fig. 11.
t-i
- RtGD - FREE O EXPER(CH3)3 N-CH2 -CH-0-C0-CH3
j 1 ? 10 8 1 i I0-6 _CU-
o0-2 o -
0-1 - - -— —
Choline methyl ether Methacholine
Fig. 11. Relaxation of methyl protons in choline methyl ether and methacholine (data from Nogrady & Burgen, 1969). The groups referred to are indicated by the tails of the arrows.

163In choline methyl ether relaxation of the methyl groups on the nitrogen corresponds
to that expected from a rigid molecule whereas the O-methyl is intermediate in relaxation between rigid and completely free rotation. It can be estimated that the methyl group can rotate once around the bond axis in every 2-3 rotations of the whole molecule. Similar results are seen with methacholine. The yV-methyl and /3-methyl groups behave as though rotation was not permitted whereas the acetyl methyl shows considerable freedom to rotate.
Rotational stabilization o f complexesJust as anaesthetics are immobilized in a membrane, so drugs are restricted in their
motion when interacting with a specific binding site. This is illustrated by the binding of drugs of the acetylcholine group to an antibody against the nicotinic agonist choline phenyl ether C6H5O C H 2-CH2-N (CH3)3.
A simple example is tétraméthylammonium (TMA). When it is mixed with antibody in the molar ratio of 1:10 (Ab:TMA) the relaxation rate is 6-8 s-1. This value is the weighted mean of the relaxation rate in the free and bound states. From this we can calculate the relaxation rate in the bound state as 65 s“1 compared with the value of 0-09 s-1 obtained for free TMA. Thus the motion of the bound TMA is restricted by a factor of approximately 65/0-09 or «¿720.
This analysis can be applied to the more complex drug, methacholine, with three distinguishable resonances. Measurement of the relaxation rates of these three methyls showed that they are increased in the order: /3-CH;i 131, N(CH3)3 101, Acetyl CH3 78 s 1. Consider the following possibilities. (I) Only the N(CH3)3 group interacts with the antibody binding sites. (II) Only the /3-CH3 interacts.(Ill) Only the acetyl group interacts. (IV) The whole molecule interacts.
The calculated values of Tx (s_1) for the three methyls are shown in Table 2 for each possible type of interaction, together with the experimental values obtained.
Application o f nmr to pharmacological problems
Table 2. Relaxation o f the methyl groups o f methacholine in combination with an antibody
Interacting group 1. N(CH,)S only
Estimated (s-1)n -c h 3
1 0 0
jS-CH3
50-80Acetyl CH3
0-52. £-CH3 only . . 70-90 1 0 0 0-53. Acetyl CH, only 1 1 1 0 0
4. Whole molecule 1 0 0 80 80Experimental values 1 0 1 131 78
It is clear that the data are not consistent with any of the first three possibilities. The fourth could be correct or any combination of (I), (II), (III). In fact the order of relaxation rates would suggest that motion may be most restricted in the neighbourhood of the /3-methyl group. However this must not be taken to mean that this is the group in the molecule contributing most strongly to binding.
Another example of the usefulness of relaxation measurements is shown in a study of the binding of sulphonamides to bovine serum albumin (BSA). This protein has a single binding site for sulphonamides.
With sulphacetamide the increase in relaxation rate of the aromatic protons is much greater than that for the acetyl methyl group (Fig. 12). This is best interpreted as showing that the primary site of immobilization is the aromatic ring.

164 A. S. V. BLRGEN AND J. C. METCALFEs
F ^ N ^o ^ - S02NH • CO ■ ch3 H2N - ( o^-SO ;N H -/ N
-c||
> xHCn
1 1 1 N— CN
Free 0-25 T-1 (s"1) 0 4 5 Free 0 26 s - 1 0-65Bound 715 275 Bound 1330 1084
Bound/Free 2860 610 Bound /Free 5130 1640Sulphacetamide Sulphathiazole
N— 0B;N-^O^-S0;NH-Cs J : — CF3
t
h2 N-<Q>-S32Nh-C XN. /c— cN
H 1 H
9E>
Free 0 34 s-1 0 30 050 Free 0-33 s-1 0-33 0-38Bound 785 325 433 Bound 1600 330 2130
Bound/Free 2320 1080 860 Bound/ Free 4800 1000 5600
Sulphamethyl isoxazole Sulphaphenazole
F ig . 12. Relaxation of protons in 4 sulphonamides free and bound to bovine serum albumin (Jardetzky & Wade-Jardetzky, 1965.)
Similar results were obtained with both sulphathiazole and sulphamethylisoxazole. On the other hand in sulphaphenazcle which has two aromatic rings, both appear to be stabilized to the same extent. Since it was possible to demonstrate competitive displacement of one aromatic ring while the other remained bound, it follows that there are two distinct binding sites for the two aromatic rings of sulphaphenazole.
Chemical shifts in complexesAn alternative important method of studying binding is by looking for chemical
shifts in the resonances of the bounc molecule. This may occur as a result of changes in the magnetic environment of protons of the small molecule when complexed. The enzyme lysozyme hydrolyses certain glycosides containing hexosamines. Many hexosamines will act as inhibitors, for example A-acetylglucosamine (NAG). When NAG combines with the enzyme the acetyl methyl peak is displaced upheld and spli: into two. The two resonances correspond to the a- and jS- anomers of NAG. Fig. 13A shows the nmr spectrum of /3-NAG (acetamido methyl protons) free in solution and in the presence of lysozyme (3-0 x 10-3m).
When the first spectrum was obtained some a-NAG had already appeared as a resuk of mutorotation caused by the enzyme. With time the /3 peak declined and the a peak grew until after approximately 20 min they were equal in size.
The difference in chemical shift for the two anomers shows that the acetyl group is ir_ a different geometrical relation to the enzyme active centre in the two cases. In the free state the acetyl resonances of a- and /9-NAG are indistinguishable. From studies of this kind the affinity constants of the two anomers can be determined individually in the presence of each other.
By adding another reporter substituent to the molecule as in NAG methyl glycoside, further information can be obtained. When the resonance shift was studied as a function of pH, two titratable groups with pK’s of 4-7 and 6T could be demonstrated in the binding site in the neighbourhood of the acetyl group (Fig. 13B).

165Application o f nmr to pharmacological problems
F ig . 13 A. Resonance of the acetyl methyl of NAG in the free state and in the presence of lysozyme. The resonance is shifted upheld and split into two corresponding to the ft- and a-anomers of NAG which are clearly in different magnetic environments.
B. In NAG-methyl glycoside the acetylmethyl is shifted upheld by lysozyme, the ether methyl downheld. The former shows a two step change with pH, the O-methyl is unaffected (Dahlquist & Raftery, 1968).
These are sufficiently far away from the O-methyl not to affect it. The lack of effect on the O-methyl strongly suggests that a proton-dependent conformation change in the enzyme is unlikely to account for the changes.
SPECTRA OF PROTEINSAmino-acids give straightforward nmr spectra, the main features of which are shown
in Fig. 14. The a-protons all give lines in the same region (4-2-4-8 ppm). The other aliphatic protons give lines upheld in the range 1 -0—3-8 ppm. The aromatic amino- acids give lines due to their ring protons at 7-8 ppm with the exception of the C2 proton of histidine which is at 8-7 ppm. In small peptides there are small shifts from the values in the free amino-acids due to peptide bond formation and the spectra of fully unfolded proteins are similar and indeed are close to the sum of the resonances of the constituent amino-acids. They are complicated mainly by the large number of nearly coincident lines.
1 0 8 6 U 2 0— 1-----1----- 1----- 1----- 1----- 1----- 1 1 1
Glycine 1
Alanine 1 1
Leucine 1 1 11
Isoleucine 1 1 inValine 1 1 1
Serine 11
Threonine 1 1 1
Methionine 1 1 1 1 1
Arginine 1 1 11
Glutamine 1 1 1
Proline 1 11 1111
Histidine 1 1 1 1
Phenyl Alanine 11 i nTyrosine 11 1 11
Tryptophan 1111 . 1 1 1
■ ■ ______ U B H _ _Hist Aromatic oc- ß- Ö* 6 - C2 protons protons
protons
Fig . 14. Position of resonances in amino-acid spectra.
vuN flun rm jQ v iirM ifm

166 A. S. V. BERGEN AND J. C. METCALFEIn native proteins however two important changes occur, (a) The individual lines
become broadened because of the relative rigidity and restriction on motional freedom in the native protein structure, (b) Lines are shifted by electronic interactions with neighbouring residues, so that the resonances for a particular amino-acid become spread over a range. Those changes result in a drastic smearing of the details of the spectra, which appear as envelopes with few sharp lines evident. This is illustrated in the spectrum of ribonucléase. At increasing temperatures, the spectra become progressively sharper, and in the denatured state at 80°, considerable detail from the constituent amino-acids is apparent (Fig. 15).
Fig . 15. Spectrum of ribonucléase in the native state at 22° C partially unfolded at 72-5° C.
Despite these formidable difficulties it is proving possible to obtain useful information about the role of individual amino-acids in the formation of protein complexes. For instance, in ribonucléase dissolved in a buffer at pH 5-37 four small resonances can be observed down field from the aromatic region (Fig. 16A).
RNose-HISTIDINE TITRATION CURVES
Fig. 16A. Spectrum of the aromatic region of the spectrum of ribonucléase. The peaks 1, 2, 3, 4 are the C2 protons of the four histidines in the enzyme.
B. From the chemical shifts in experiments of the type shown in A, titration curves for the four histidines can be constructed (Meadows, Jardetzky & others, 1968).

167These are likely to be due to the C2 protons of histidine residues and this identifica
tion can be established by examining the shift as a function of pH. The groups show marked changes in chemical shift in the range pH 5-8 and imidazoles are the only basic groups ionizing in this pH range. The identification has been confirmed by alkylation of some of the histidines with iodacetate. There are in fact only four histidines in ribonucléase at positions 12, 48, 105 and 119 in the peptide chain. By various biochemical manipulations these have been identified unambiguously with peaks 2, 4, 1, and 3 respectively. We then have the remarkable result that the ionization of the four histidines can be individually determined (Fig. 16B). On addition of the inhibitor 3'-cytidylic acid to the enzyme some very clear cut changes are seen (Fig. 17A). The C2 resonance of histidine 119 is moved down field by 60 Hz so that it appears below 105 which is itself unaffected by the inhibitor. Histamine 12 undergoes a smaller concurrent movement down field. Histamine 48 is hardly affected.
Application o f nmr to pharmacological problems
COMPLEX OF 3'-CMP WITH RNose
Fig. 17A. Histidine resonance region of ribonucléase in the presence of 3'-cytidylic acid, (a) Ribonucléase alone (6-5 mM). (b) Plus 2 mM 3'-CMP. (c) Plus 5 mM 3'-CMP. (d) 10 mM 3'-CMP. (e) 30 mM 3'-CMP (Meadows & Jardetzky, 1968).
B. Structure of the complex between ribonucléase and 3'-CMP (Meadows, Roberts & Jardetzky, 1969).
At the same time the doublet due to the proton in the 6 position of the nucleotide is broadened and shifted down field. From comparison with the crystal structure the structure of the complex appears to be as in Fig. 17B. The down field shift of the 119 resonance is due to a hydrogen bond interaction with the phosphate of the nucleotide, whereas the down field shift of histidine 12 is due to interaction with the ribose. The down field shift of the cytidine H6 is due to the ring current from phenylalanine 120 which is lying in contact with it. The lack of effect on the other histidines is because they are not contributing to the formation of the complex. By contrast, in the complex formed by 5/-cytidylic acid with the enzyme, histidine 119 is not involved but the phosphate reacts instead with the 6 amino-group of lysine 41. This offers a neat

168 A. S. V. BURGEN AND J. C. METCALFEexample of what nmr can offer to structure activity studies in the way of distinguishing complexes in which the mode of interaction is fundamentally different.
The application of these techniques to other amino-acid residues is clearly more difficult both because the resonances are not separated and because the convenience of the pH dependence of the histidine resonance is not available. In certain cases the spectrum can be simplified by making a protein in which most of the normal amino- acids have been replaced by deuterated amino-acids; these will not give signals at the proton frequency. Staphylococcal nuclease has been prepared with all but tyrosine, tryptophane and histidine deuterated with a remarkable simplification of the spectrum and used to study interactions of this enzyme with substrates and inhibitors.
SUMMARY AND CONCLUSIONSNuclear magnetic resonance has unique properties to offer in the study of molecular
interactions, especially in view of its great sensitivity to changes of molecular geometry. While the method is inherently insensitive it is frequently possible to take advantage of rapid exchange to enhance the sensitivity and to improve the resolution, but in any case the development of computer techniques such as signal averaging and Fourier transform spectroscopy can improve the sensitivity enough to make it relatively easy to study the smaller macromolecules and even to consider working with less sensitive nuclei. Large macromolecular structures such as nucleic acid and cell membranes cannot be studied by high resolution nmr because of the very rapid relaxation rates associated with these large structures, but indirect study by rapidly exchanging probes can be carried out.
B I B L I O G R A P H Y
General accounts o f nuclear magnetic resonance A b r a g a m , A. (1961). The principles o f nuclear magnetism. Oxford University Press.B o v e y , F . A. (1969). Nuclear magnetic resonance spectroscopy. New York: Academic Press. E m s l e y , J. W., F e e n e y , J. & S u t c l if f e , L. H. (1965). High resolution nuclear magnetic resonance
spectroscopy. London : Pergamon.J a c k m a n , L. M. (1954). Applications o f nmr spectroscopy in Organic Chemistry. London:
Pergamon.J a r d e t z k y , O. (1964). Adv. chem. Phys. 7, 499-531.P o p l e , J. A., S c h n e i d e r , W. G. & B e r n s t e i n , H. J. (1959). High resolution nuclear magnetic
resonance. New York: McGraw-Hill.
Reviews related to biological systemsE h r e n b e r g , A., M a l m s t r ö m , B. G. & V ä n n g a r d , T. (1967). Magnetic Resonance in Biological
Systems. London: Pergamon.K o w a l s k y , A. & C o h n , M. (1964). Ann. Rev. Biochem., 33, 481-518.R o b e r t s , G. C . R. & J a r d e t z k y , O. (1969). Adv. Protein. Chem., in the press.
Protein nmrM a r k l e y , J. L., M e a d o w s , D. H. & J a r d e t z k y , O. (1967). /. mol. Biol., 27, 25-40.M a r k l e y , J. L., P u t t e r , I. & J a r d e t z k y , O. (1968). Science, N.Y., 161, 1249-1251. M c D o n a l d , C . C . & P h i l l i p s , W. D. (1967). J. Am. chem. Soc., 89, 6333-6341.M e a d o w s , D. H., J a r d e t z k y , O., E p a n d , R. M ., R ü t e r j a n s , H. H. & S c h e r a g a , H. A . (1968).
Proc. natn. Acad. Sei. U.S.A., 60, 766-772.M e a d o w s , D. H., M a r k l e y , J. L., C o h e n , J. S. & J a r d e t z k y , O. (1967). Ibid., 58, 1307-1313. N a k a m u r a , A. & J a r d e t z k y , O. (1968). Biochemistry, 7, 1226-1230.N a v o n , G., S h u l m a n , R. G., W y l u d a , B. J. & Y a m a n e , T. (1968). Proc. natn. Acad. Sei. U.S.A.,
60, 86-91.W ü t h r i c h , K., S h u l m a n , R. G. & P e is a c h , J. (1968). Ibid., 60, 373-380.W ü t h r i c h , K., S h u l m a n , R. G. & Y a m a n e , T. (1968). Ibid., 61, 1199-1206.

169Use in the study o f complexes
Burgen , A. S. V., J ardetzky , O ., M etcalfe, J. C. & W ade-Jardetzky , N . (1967). Ibid., 58, 447-453.
D ahlquist, F. W. & R aftery, M. A. (1968). Biochemistry, 7, 3269-3276, 3277-3280.F ischer , J. J . & J ardetzky , O. (1965). J. Am. chem. Soc., 87, 3237-3244.J ardetzky , O. & W ade-Ja rdetzky , N. G. (1965). Molec. Pharmac., 1, 214-230.M etcalfe, J. C„ Burgen , A. S. V. & J ardetzky , O. (1968). Molecular Association in Biology,
Editor : Pullman, B. New York : Academic Press.N ogrady , T. & Burgen , A. S. V. (1969). J. Am. chem. Soc., 91, 3890-3893.M etcalfe, J. C., Seeman, P. & Burgen , A. S. V. (1968). Molec. Pharmac., 4 , 87-95.Sykes, B. D. (1969). Biochemistry, 8 , 1110-1116.
Application o f nmr to pharmacological problems

J . P h a r m . P h a r m a c . , 1970, 22, 170-179 R e c e i v e d J u n e 19, 1969
The influence of corticosteroid pretreatment on anaphylactic bronchoconstriction
in the guinea-pigR. HICKS
S c h o o l o f S tu d ie s in P h a rm a c o lo g y , U n iv e rs ity o f B ra d fo rd , B r a d fo r d 7, U .K .
Previous reports that cortisone and related compounds exerted a small degree of protection against antigen-aerosol-induced anaphylactic reactions, have been confirmed. Optimal effects were obtained 16 to 24 h after corticosteroid pretreatment. Marked effects were obtained from the more potent glucocorticoids, particularly water- soluble compounds. Similar pretreatment decreased the severity and modified the form of anaphylactic bronchoconstrictor responses induced by intravenous administration of antigen. In guinea-pigs pretreated also with mepyramine, the corticosteroids suppressed the residual and presumably non-histamine component of the anaphylactic bronchoconstrictions. Anti-anaphylactic potency was correlated with glucocorticoid and anti-inflammatory activity. A suggested mode of action involves a combination of weak antihistamine activity and inhibition of release of slow reacting substances of anaphylaxis.
An anti-anaphylactic property of corticosteroids in the guinea-pig may be consistently demonstrated (Goadby & Smith, 1964; Hicks, 1968) using microshock reactions, induced by inhalation of antigen aerosol and assessed by the preconvulsion time technique. In contrast, a review of the literature (Hicks, 1969) has revealed that previous attempts to demonstrate such an effect had failed to produce consistent results when anaphylactic reactions were induced by intravenous administration of antigen. The inadequacy of the latter experiments may have been due to the failure of the subjective scoring or mortality assessment techniques employed to reveal a not very pronounced effect. Alternatively, a qualitative difference in the nature of anaphylactic reactions, induced by either inhaled aerosol or intravenously administered antigen, may provide an explanation which would be of fundamental significance.
An attempt to resolve these possibilities and to investigate further the influence of corticosteroids on guinea-pig anaphylaxis has been made using both microshock reactions and direct evaluation of bronchoconstrictor responses in v ivo . A range of corticosteroids has been investigated to see if a relation exists between anti- anaphylactic properties and glucocorticoid or anti-inflammatory potency.
EXPERIMENTALM a te r ia ls a n d m e th o d s
Virgin female albino guinea-pigs (Dunkin Hartley Strain), 300-500 g body weight, were maintained on unrestricted supplies of water, and diet S.G.I. (Oxoid), supplemented by hay and green vegetables, or ascorbic acid (50 mg/day) in the drinking water. They were housed in well ventilated conditions at 65° F.

S e n s itiza tio n . Active hypersensitivity was induced by single intraperitoneal injections of egg albumen (B.D.H. flake) in a dose of 50 mg/kg. Anaphylactic reactions were induced by further administration of the antigen 28 days later.
C o r tic o s te r o id p re p a r a tio n s . The following suspensions were used: Cortisone acetate (25 mg/ml) (Boots), methylprednisolone acetate (40 mg/ml) (Upjohn), prednisolone acetate (25 mg/ml) (Pfizer), triamcinolone diacetate (25 mg/ml) (Lederle), hydrocortisone acetate (25 mg/ml) (Roussel). Fludrocortisone acetate (4 mg/ml) and paramethasone acetate (4 mg/ml) were both made up in suspension in Boots suspension vehicle.
The following were used in solution: Dexamethasone 21-phosphate (4 mg/ml) (Roussel), betamethasone disodium phosphate (4 mg/ml) (Glaxo), hydrocortisone hemisuccinate (50 mg/ml) in saline.
A n tig e n -a e ro so l-in d u c e d a n a p h y la x is . Antigen was administered to sensitized animals by an adaptation of the microshock method of Herxheimer (1952). Egg albumen aerosol (5% solution in water) was sprayed into a closed chamber from a W rig h t nebulizer using compressed air (10 lb inch2). Guinea-pigs were placed singly in the chamber for sufficient time to inhale the antigen aerosol until the induced anaphylactic bronchoconstriction resulted in consistently visible symptoms of dyspnoea. The animal was then removed from the chamber, and the exposure time was recorded as the “preconvulsion time”. The end-point used was the first spasm of the body wall in the upper abdominal-diaphragm area. Termination of exposure at this point averted the progression of the reaction to convulsions and death. All experiments were made using groups of 5 animals, and the results were taken as the mean values of individual preconvulsion times.
A n a p h y la c tic b ro n ch o co n s tr ic tio n in d u ced b y in tra ven o u s a n tig en . Sensitized animals were anaesthetized with pentobarbitone (60 mg/kg, i.p.). Cannulae were inserted into an external jugular vein for saline drug infusions and into the trachea for artificial ventilation. Each animal received heparin 1000 units/kg intravenously, following the cannulation. Artificial ventilation was maintained from a miniature Starling Ideal pump, with a stroke volume of 1 cc of air per 100 g body weight, plus an arbitrary amount depending upon the dead space of the system. Ventilation was at a rate of 36 strokes/min. Bronchiolar tone, as indicated by resistance to positive pressure inflation, was recorded by the method of Dixon & Brodie (1903) as employed by Hicks & Leach (1963). Challenging doses of antigen were administered intravenously and were infused with 0-5 ml of heparinized saline.
RESULTS
E ffe c ts o f c o r t ic o s te ro id s on th e s e v e r i ty o f a n tig e n -a e ro so l in d u ced -a n a p h y la x is: d e te rm in a tio n o f o p tim a l tim e in te rv a l
Single doses of either cortisone (25 mg/kg, i.m.), prednisolone (5 mg/kg, i.m.) or dexamethasone (4 mg/kg, s.c.) were administered to groups of sensitized guinea-pigs. Separate groups from batches receiving each type of treatment were exposed to the antigen aerosol after intervals of 4, 8, 12, 16, 18, 20 or 24 h. Preconvulsion times were measured. Control groups pretreated with equivalent volumes of the vehicle used in the corticosteroid preparation, were similarly exposed to the aerosol and anaphylactic preconvulsion times were measured. Control and test group responses were compared statistically using Student’s /-test. Results are in Table 1.
Influence o f corticosteroids on anaphylactic bronchoconstriction 171

Table 1. Anaphylactic preconvulsion times in guinea-pigs pretreated with corticosteroids. Reactions induced at various times after treatment. Results expressed as mean preconvulsion times (s) ± standard errors. Control groups treated with appropriate vehicle *
172 R. HICKS
Interval(h)
4Treatment
ControlTest
Cortisone (25 mg/kg) 52-0 ± 5-5 58-0 ± 5-6
Prednisolone (5 mg/kg)
47-0 ± 4-4 47-0 ± 4-7
Dexamethasone (4 mg/kg)
49-8 ± 2-9 55-8 ± 3-7
8 ControlTest
52-0 ± 5-5 65-0 ± 1 1 -4
47-0 ± 4-4 49-7 ± 6-8
49-8 ± 2-9 51-0 ± 3-5
12 ControlTest
29-0 ± 7-0 37-8 ± 3-2
47-0 ± 4-4 43-5 ± 2-2
35-6 ± 4-2 37-6 ± 4-0
16 ControlTest
48-8 ± 3-4, 67-7 ± 6-6
43-5 ± 3-7 50-2 ± 4 - 3
35-6 ± 4-2 58-8 ± 2-2
18 ControlTest
52-0 ± 3-0, 77-2 ± 8-3
28-4 ± 4 - 6 38-0 ± 2-3
51-6 ± 4 0 , 87-8 ± 3-2
20 ControlTest
52-0 ± 5-5 58'0 ± 9-8
43-5 ± 3-7 54-2 ± 2-6
35-6 ± 4-2. 58-3 ± 5-0
24 ControlTest
52-0 ± 5-5 55-0 ± 3-8
43-5 ± 3-7 47-6 ± 5-0
39-8 ± 2-9 51-6 ± 4 0
* denotes significant difference / ><0-05.
Cortisone pretreatment caused significant prolongation of anaphylactic preconvulsion times when reactions were induced 16 and 18 h after its administration. Dexamethasone similarly resulted in significant prolongation of preconvulsion times after 18 and 20 h. No significant effects were observed in animals pretreated with prednisolone.
Influence o f corticosteroid pretreatment on antigen aerosol-induced reactions 18 h later
Groups of sensitized guinea-pigs were pretreated with single doses of various corticosteroids, and, after 18 h, were exposed to the antigen aerosol. Cortisone, hydrocortisone (acetate and hemisuccinate), prednisolone, triamcinolone, fludrocortisone, dexamethasone, betamethasone, paramethasone, or méthylprednisolone, were investigated, and a range of doses of each was used in different groups of animals. Preconvulsion times of treated animals were compared statistically with those of animals in appropriate control groups (vehicle treated). Effects were calculated as percentage prolongations of preconvulsion times. Optical doses and the maximal prolongation effects observed with each compound were as shown in Table 2.
No significant effects were observed with any of the doses of méthylprednisolone or hydrocortisone acetate, administered. At 18 h after pretreatment with each of the other corticosteroids significant prolongation of preconvulsion times were observed with at least one of the dose levels administered. In general, the more potent substances (indicated by lower optimal dosage) caused a greater prolongation of effects.

Table 2. P ro lo n g a tio n o f a n a p h y la c tic p re c o n v u ls io n tim e s 18 h a f te r s in g le d o se c o r t ic o s te r o id a d m in is tra tio n . R e la tio n o f o p tim a l d o se to m a x im a l e ffe c ts
Influence o f corticosteroids on anaphylactic bronchoconstriction 173
DrugCortisoneHydrocortisone (acet.)Hydrocortisone (hemisuccinate)PrednisoloneFludrocortisoneTriamcinoloneMéthylprednisoloneParamethasoneBetamethasoneDexamethasone
Range of doses Optimalinvestigated dose
(mg/kg) (mg/kg)0-1-50 101-0-50 502-0-50 250-5-20 100-5-10 100-5-20 100-5-20 100-2- 8 40-1- 4 20-1- 8 4
Mean prolongation of preconvulsion
times (%) at optimal dosage P
29-3 <0*0522-9 >0-05*49-9 < 0 0 543-5 <0-0565-0 <0-00138-0 < 0 0 522-0 > 0 0 5 *54-1 <0-0142-5 <0-0164-0 <0-001
* Denotes no significant difference from control groups.
E ffe c ts o f c o r tic o s te ro id s in m e p y r a m in e - tr e a te d a n im a ls
Groups of 6 sensitized guinea-pigs were treated with single doses of cortisone (10 mg/kg, i.m.), dexamethasone (4 mg/kg, i.m.) or fludrocortisone (4 mg/kg, i.m.), followed 17 h later with, in each case, a single subcutaneous dose of mepyramine (1 mg/kg). One h after the final treatment, each animal was exposed to the aerosol and anaphylactic preconvulsion times were recorded. Similar investigations were made on animals pretreated solely with mepyramine, and provided control values. Results were as shown in Table 3.
Table 3. E ffe c ts o f c o r tic o s te ro id s on a n a p h y la c tic p reco n vu ls io n tim e s in m e p y ra m in e tr e a te d g u in ea -p ig s . Results recorded as mean preconvulsion times (s) ± standard errors
Preconvulsion timesMepyramine
alone Mepyramine + % ProlongaCorticosteroid (1 mg/kg, s.c.) corticosteroid tion t P
Cortisone (10 mg/kg, i.m.)
.. 158 ± 18 231 ± 34 46 3-28 <0-01
Dexamethasone (4 mg/kg, i.m.)
177 ± 14 409 ± 49 132 6-35 <0-001
Fludrocortisone (4 mg/kg, i.m.)
.. 177 ± 14 340 ± 34 92 4-29 <0-01
Mean preconvulsion times in guinea-pigs treated with mepyramine plus cortisone, fludrocortisone, or dexamethasone, were very significantly longer than those in animals pretreated only with mepyramine. End points were difficult to observe particularly in those most prolonged exposures.
E ffe c ts o f c o r tic o s te ro id s on a n a p h y la c tic b ro n c h o c o n s tr ic to r re sp o n ses
Corticosteroids shown to exert significant influence on aerosol-induced anaphylaxis, were investigated for their ability to produce comparable effects against directly recorded anaphylactic bronchoconstrictor responses in hypersensitive guinea-pigs in v ivo .

174 R. HICKS
Single doses of either cortisone (10 mg/kg, i.m.), dexamethasone (4 mg/kg, i.m.) or fludrocortisone (4 mg/kg, i.m.) were administered to sensitized guinea-pigs. 17 h after treatment the animals were anaesthetized and prepared for artificial ventilation and intravenous infusion. At 18 h after treatment a dose of egg albumen antigen (200 or 500 /xg/kg) was injected intravenously, and the consequent anaphylactic bronchoconstrictor response was recorded. The antigen doses chosen were those which previously were found to induce either small, or large but still sub- maximal, anaphylactic bronchoconstrictor responses in guinea-pigs under similar conditions of sensitization. The severity of bronchoconstrictor responses in corticosteroid-treated animals was compared with those of similar reactions induced in control animals which received pretreatment only with solvent or suspending fluid. It was impracticable to perform all the experiments on the same day, but, to standardize conditions, similar numbers of treated and control animals were investigated in each session. Records of bronchoconstrictor responses were evaluated according to the method of Hicks & Leach (1963). Results are in Table 4.
Table 4. A n a p h y la c tic b ro n c h o c o n s tr ic to r re sp o n se s in g u in ea -p ig s , 18 h a f te r p r e tr e a tm e n t w ith c o r tic o s te ro id s . Severity of responses expressed as % reduction in tidal volume
% reduction intidal volume Number of
Treatment (mean ± s.e.) animals t P
Antigen (200 /xg/kg) Cortisone (10 mg/kg, i.m.) 17-3 ± 5-4 6 1-76 > 0 0 5Control .. 37-7 ± 8-9 7Dexamethasone (4 mg/kg, i.m.) 14-4 ± 4-3 6 2-35 <0-05Control .. 37-7 ± 8-9 7 *
Antigen (500 /xg/kg) Cortisone (10 mg/kg, i.m.) 67-9 ± 1 1 - 7 8 1-41 >0 -05Control 86-9 ± 6-8 8Dexamethasone (4 mg/kg, i.m.) 59-5 ± 8-2 8 2-58 < 0 0 5Control .. 86-9 ± 6-8 8 *Fludrocortisone (4 mg/kg, i.m.) 62-6 ± 8-8 9 2-19 <0-05Control .. 86-9 ± 6-8 8 *
* Denotes significant difference.
Anaphylactic bronchoconstrictor responses induced by either 200 or 500 /xg/kg doses of antigen, were significantly less severe in animals treated with dexamethasone or fludrocortisone, 18 h previously. No significant decrease resulted from the cortisone treatment.
Other sensitized animals received similar pretreatment with corticosteroids, and 17 h later a single injection of mepyramine (1 mg/kg, s.c.) was administered. The animals were anaesthetized, and 18 h after administration of corticosteroids anaphylactic bronchoconstriction was induced and recorded. The antigen dose was 500 /xg/kg. Results are in Table 5.
In control animals treated with mepyramine alone before administration of the challenging dose of antigen, the anaphylactic bronchoconstrictor responses were markedly reduced. In such animals, pretreated also with any one of the corticosteroids, the bronchoconstrictor response severity was reduced even further, being significantly smaller than in animals treated with mepyramine alone.

TOTALOCCLUSION
Influence o f corticosteroids on anaphylactic bronchoconstriction 175
AG AG
F ig . 1. Anaphylactic bronchoconstrictor responses induced by egg albumen antigen A G (500 pg/kg, i.v.) in sensitized, anaesthetized guinea-pigs. Recorded using method of Dixon & Brodie (1903). Record A is from a saline treated control animal. Record B is from an animal pretreated with dexamethasone (4mg/kg, i.m.) 18 h previously.
TOTALOCCLUSION
A AMPLITUDE B
AG AG
Fig. 2. Anaphylactic bronchoconstrictor responses induced by egg albumen antigen A G (500 mg/kg, i.v.) in sensitized, anaesthetized guinea-pigs. Recorded using method of Dixon & Brodie (1903). Animals pretreated with mepyramine (1 mg/kg, s.c.) 1 h before administration of antigen. Record A is from a saline treated control animal. Record B is from an animal pretreated with dexamethasone (4 mg/kg, i.m.) 18 h previously.

Table 5. A n a p h y la c tic b ro n c h o c o n s tr ic to r re sp o n ses in g u in e a -p ig s p r e t r e a te d w ith m e p y ra m in e a n d c o r tic o s te ro id . Antigen administration (500 /zg/kg) 18 h after corticosteroid given intramuscularly and 1 h after mepyramine given subcutaneously. Severity of responses expressed as % reduction in tidal volume
176 R. HICKS
Treatment
% reduction in tidal volume
(mean ± s.e.)Number of
animals t PMepyramine (1 mg/kg) alone 39-1 ± 4-7 8 5-79 <0-001Control ........................ 86-9 ± 6-8 8 *Cortisone (10 mg/kg) +
mepyramine (1 mg/kg) .. 20-4 ± 4-5 7 2-86 <0-05Mepyramine (1 mg/kg) 39-1 ± 4-7 8 *Dexamethasone (4 mg/kg) -F
mepyramine (1 mg/kg) .. 12-8 ± 4-1 6 4-24 <0-01Mepyramine (1 mg/kg) 39-1 ± 4-7 8 *Fludrocortisone (4 mg/kg) +
mepyramine (1 mg/kg) .. 20-7 4- 7-2 8 2-30 < 0 0 5Mepyramine (1 mg/kg) 39-1 ± 4-7 8 *
* Denotes significant difference.
Corticosteroid pretreatment qualitatively modified the character of the anaphylactic bronchoconstriction records, in addition to the suppression of amplitude. As illustrated in Fig. 1 the onset of the response and the position of the peak amplitude was similar in both control and pretreated animals. However, the duration of the response was noticeably less in the corticosteroid-treated animals. In mepyramine- treated animals (Fig. 2), the responses were much modified both in amplitude and character. Presumably as a result of antagonism to the histamine-like component of the reaction, the residual responses had a much slower onset and attained a less pronounced peak at a later time after antigen administration. Additional corticosteroid pretreatment markedly modified the amplitude of these residual responses, but the smooth protracted nature was unchanged.
DISCUSSION
These experiments confirm and extend previous reports that cortisone and related compounds exerted small, but significant, protection against aerosol-induced anaphylaxis in the guinea-pig (Herxheimer & Rosa, 1952; Feinberg, Malkiel & Mclntire, 1953; Goadby & Smith, 1964). It has been shown that significant prolongation of preconvulsion times resulted from single dose pretreatment, optimally effective after an interval of 18 h. Only marginal effects were observed using insoluble corticosteroids in suspension. In contrast, marked anti-anaphylactic effects were exerted by the water soluble hydrocortisone hemisuccinate, while an even greater degree of protection was conferred by those compounds which were both water soluble and more potent glucocorticoids. Early investigations were necessarily limited by the availability of only the less potent and relatively insoluble steroids such as cortisone acetate. This may have been a feature contributing to the inconclusive nature of such experiments in a species which is relatively insensitive to corticosteroids (Hicks, 1969). Another factor contributing to early failures to

demonstrate this effect was the absence of experiments featuring the optimal time interval of 18 h.
It has been demonstrated that administration of fludrocortisone or dexamethasone in single doses, similar to those shown to prolong preconvulsion times and given 18 h before the intravenous doses of antigen, significantly decreased the severity of anaphylactic bronchoconstrictor responses in vivo. The bronchoconstrictor effects were evaluated directly, and compared with submaximal responses in control animals. In 1962, Bush stated that the mechanism whereby cortisone exerted its small protective effect was by the increased tolerance of guinea-pigs to anoxia. An alternative suggestion was that corticosteroids might modify the permeability of lung tissue to the absorption of antigen administered in the form of inhaled aerosol. These possibilities are largely precluded by the fact that the protective influence, at least of the most potent corticosteroids is exerted mainly on the primary response to the anaphylactic reaction rather than any secondary consequence of that response. In addition the effect is independent of the route o f administration of the antigen inducing the reaction.
Mepyramine treatment effected a marked prolongation of anaphylactic preconvulsion times, indicating the participation of a large histamine-like component in the reaction. This is consistent with the observation that release of histamine in anaphylaxis is rapid (Brocklehurst, 1960), as are its stimulant effects on bronchiolar smooth muscle. As preconvulsion time evaluation measures the onset of the early symptoms of anaphylaxis, it may, therefore, be considered that the microshock reactions are, if unmodified, largely due to histamine. An explanation of the mode of action of pretreatment with corticosteroids alone may, therefore, be sought in the possibility of antihistamine effects. Such effects have been reported for high doses of corticosteroids, by Lefcoe (1956), Huidobro (1960), Goadby & Smith (1964), Dawson & West (1965) and particularly for water-soluble corticosteroids by Zicha, Scheiffarth & others (1960, a, b, c). The latter authors showed significant antagonism to the effects of histamine aerosols in guinea-pigs, to be exerted by a wide range of glucocorticoid drugs. Water-soluble esters produced almost immediate effects lasting for a few hours, whereas those of insoluble esters did not appear for several days. It is suggested that the inactivity of cortisone is explained by its lack of antihistamine activity, possibly as a result of its insolubility. The significant anti- anaphylactic effect of dexamethasone is associated with significant antihistamine action.
With mepyramine treated animals, it may be assumed that the contribution of histamine to the total anaphylactic reaction is suppressed (Goadby & Smith, 1964; Collier & James, 1967). Any effect of corticosteroid pretreatment observable in such animals may, therefore, be considered to arise from an influence on the residual response induced by slow reacting substance of anaphylaxis (SRS-A), bradykinin or possibly other mediators. The combined effects of mepyramine with either fludrocortisone or dexamethasone resulted in prolongation of preconvulsion times, and are greater than those expected from a summation of their individual effects. Such a potentiation is similar to that described by Goadby & Smith (1964). The observed effects are thus consistent with a corticosteroid influence upon those components of the anaphylactic reaction whose bronchoconstrictor effects are delayed in onset, but sustained in action, and whose formation or release may possibly come later than that of histamine. In the case of microshock reactions such an influence of cortico
Influence o f corticosteroids on anaphylactic bronchoconstriction 111

178 R. HICKS
steroids would be masked by the predominance of the histamine-like component, unless this is removed by simultaneous antihistamine administration.
Support for this interpretation is also derived from the changes in character of bronchoconstriction records. Treatment with fludrocortisone or dexamethasone accentuated the initial peaks of the anaphylactic responses, giving recoveries that were rapid in comparison to untreated controls. This is consistent with suppression of the later non-histamine response. In mepyramine-treated animals the initial rapid peak response was markedly suppressed and the corticosteroid influence on the delayed and sustained components was revealed.
The suppression of the residual component of guinea-pig anaphylaxis after corticosteroid treatment could be explained by a reduction in the production of smooth muscle stimulant mediators. This suggestion is supported by observations of significant reduction in the quantity of SRS-A in perfusates of anaphylactic lungs from guinea-pigs treated with corticosteroid 18 h previously (Goadby & Smith, 1964; Hicks, 1966).
The relative potencies of the steroids examined closely resemble their relative glucocorticoid potencies. It is of interest to contrast this finding with a previous observation that some mineralocorticoid hormones potentiated the severity of anaphylactic reactions (Hicks, 1968). With the potent mineralocorticoid, fludrocortisone, the anaphylactic properties appear to be more closely associated with the equally potent glucocorticoid properties which it also possesses. The main systemic metabolic effects resulting from administration of high doses of glucocorticoids would be hyperglycaemia (Kovacs & Suffiad, 1968) due to glyconeogenetic and diabetogenic mechanisms. It may be of significance to note reports that insulin hypoglycaemia aggravated anaphylaxis in the rat (Sanyal, Spencer & West, 1959; Dhar & Sanyal, 1963; Adamkiewicz, Sacra & Ventura, 1964) whereas in animals rendered hyperglycaemic with glucose or alloxan the severity of anaphylaxis was reduced.
Glucocorticoid properties are closely correlated with anti-inflammatory effects. Recent reports have implicated lysosomes of polymorphonuclear leucocytes in anaphylactic reactions in the mouse (Treadwell, 1965), rat (Orange, Valentine & Austen, 1967) and in heterologous passive cutaneous anaphylactic reactions in the guinea-pig (Movat, di Lorenzo & others, 1967), as well as a variety of inflammatory conditions. No direct evidence, however, has yet been produced suggesting that polymorphonuclear lysosomal enzymes play any part in active systemic anaphylaxis in the guinea-pig, although this possibility has been implied (Brocklehurst, 1967). Weissmann & Thomas (1966) reported that anti-inflammatory steroids inhibited the release of lysosomal enzymes. Furthermore, it has been suggested that these effects were associated with the marked ability of lysosomes to concentrate within themselves compounds including cortisone and dexamethasone (Allison & Young, 1964). It is also well known that glucocorticoid drugs exert a significant leucopenic action. The association of these facts prompts the speculation that the formation of nonhistamine mediators of systemic anaphylaxis in the guinea-pig may be the result of the release of lysosomal enzymes, possibly of polymorphonuclear neutrophil origin. The anti-anaphylactic suppression of the non-histamine-like component of anaphylaxis by corticosteroids, could thus be explained by an interaction with this hypothetical lysosome involvement.

179Influence o f corticosteroids on anaphylactic bronchoconstriction
Acknowledgements
I should like to express my gratitude to Professor G. D. H. Leach for encouragement and advice during the performance of this work. I should also like to acknowledge the generous contribution of gifts of materials for this work from Boots Pure Drug Co. Ltd., The Upjohn Co., Glaxo Laboratories Ltd., Merck, Sharp and Dohme Ltd., E. R. Squibb & Sons Ltd., Lederle Laboratories, Roussel Laboratories Ltd., and Imperial Chemical Industries (Pharmaceuticals) Ltd. Valuable technical assistance was rendered by Mrs. L. M. Jowett and Messrs. B. Emmett, A. Hiscoe, G. Fisher, K. Wilkinson and C. Stephenson.
REFERENCESAdamkiewicz, V. W., Sacra, P. J. & Ventura, J. (1964). J. Immunol., 92, 3-7.Allison, A. C. & Young, M . R. (1964). Life Sci., 3, 1404-1414.Brocklehurst, W. E. (1960). J. Physiol., Lond., 151, 416-435.Brocklehurst, W. E. (1967). In Modern Trends in Immunology, 2. Editors: Cruikshank, R. &
Weir, D. M., p p . 235-249, London: Butterworth.Bush, I. (1962). Pharmac. Rev., 14, 318^145.Collier, H. O. J. & James, G. W. L. (1967). Br. J. Pharmac. Chemother., 30, 283-301. Dawson, W. & West, G. B. (1965). Ibid., 24, 725-734.D har, H. L. & Sanyal, R. K. (1963). J. Pharm. Pharmac., 15, 628.D ixon, W. E. & Brodie, T. G. (1903). J. Physiol., Lond., 29, 97-173.Feinberg, S. M., Malkiel, S. & McIntire (1953). J. Allergy, 24, 302-308.Goadby, P. & S m it h , W. G. (1964). J. Pharm. Pharmac., 16, 108-114.Herxheimer, H. (1952). J. Physiol., Lond., 117, 251-255.Herxheimer, H. & Rosa, L. (1952). Ibid., 118, 7P.Hicks, R. & Leach, G. D. H. (1963). Br. J. Pharmac. Chemother., 21, 441-449 Hicks, R. (1966). Ph.D. Thesis, University of London.Hicks, R. (1968). J. Pharm. Pharmac., 20, 497-504.Hicks, R. (1969). Ibid., 21, 202-203.Huidobro, H. (1960). J. Physiol., Paris, 52, 121-122.Kovacs, E. M. & Suffiad, K . (1968). Br. J. Pharmac., 32, 262-272.Lefcoe, N. M. (1956). J. Allergy, 26, 352-358.Movat, H. Z., D i Lorenzo, N. L., Taichman, N. S., Berger, S. & Stein, H. (1967). J. Immunol.,
98, 230-235.Orange, R. P., Valentine, M. D . & Austen, K . F. (1967). Science, N.Y., 157, 318-319. Sanyal, R. K., Spencer, P. S. J. & West, G . B. (1959). Nature, Lond., 184, 2020.Treadwell, P. E. (1965). J. Immunol., 94, 692-695.Weissmann, G. & Thomas, L. (1964). Recent Progr. Horm. Res., 20, 215-245.Zicha, L., Scheiffarth, F., Schmid, E., Koschera, H. & Graf, N. (1960a). Arzneimittel-
Forsch., 10, 728-731.Zicha, L., Scheiffarth, F., Schmid, E. & Weschta, W. (1960b). Ibid., 10, 890-893.Zicha, L., Schmid, E., Scheiffarth, F., Graf, N. & Koschera, H. (1960). Ibid., 10, 831-834.
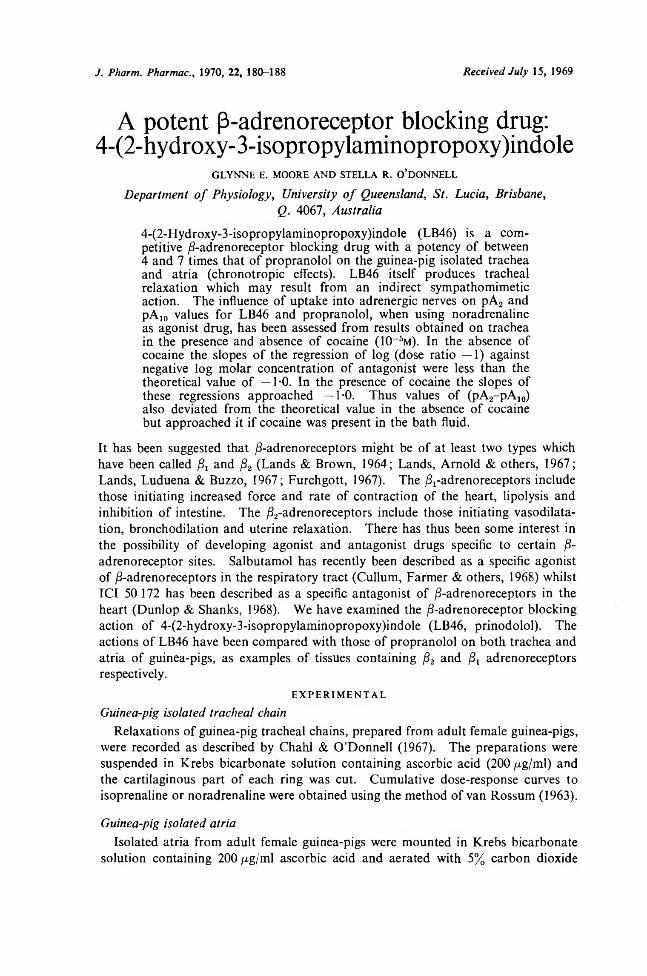
J . P h a r m . P h a r m a c . , 1970, 22, 180-188 R e c e i v e d J u ly 15, 1969
A potent (3-adrenoreceptor blocking drug: 4-(2-hydroxy-3-isopropylaminopropoxy)indole
GLYNNE E. MOORE AND STELLA R. O’DONNELL
D e p a r tm e n t o f P h y s io lo g y , U n iv e rs ity o f Q u een sla n d , S t . L u c ia , B risb a n e ,Q . 4067, A u s tra lia
4-(2-Hydroxy-3-isopropylaminopropoxy)indole (LB46) is a competitive /3-adrenoreceptor blocking drug with a potency of between 4 and 7 times that of propranolol on the guinea-pig isolated trachea and atria (chronotropic effects). LB46 itself produces tracheal relaxation which may result from an indirect sympathomimetic action. The influence of uptake into adrenergic nerves on pA2 and pA10 values for LB46 and propranolol, when using noradrenaline as agonist drug, has been assessed from results obtained on trachea in the presence and absence of cocaine (10_5m). In the absence of cocaine the slopes of the regression of log (dose ratio —1) against negative log molar concentration of antagonist were less than the theoretical value of —1-0. In the presence of cocaine the slopes of these regressions approached —1-0. Thus values of (pA2-pA10) also deviated from the theoretical value in the absence of cocaine but approached it if cocaine was present in the bath fluid.
It has been suggested that jS-adrenoreceptors might be of at least two types which have been called & and /32 (Lands & Brown, 1964; Lands, Arnold & others, 1967; Lands, Luduena & Buzzo, 1967; Furchgott, 1967). The /^-adrenoreceptors include those initiating increased force and rate of contraction of the heart, lipolysis and inhibition of intestine. The /32-adrenoreceptors include those initiating vasodilatation, bronchodilation and uterine relaxation. There has thus been some interest in the possibility of developing agonist and antagonist drugs specific to certain /3- adrenoreceptor sites. Salbutamol has recently been described as a specific agonist of /3-adrenoreceptors in the respiratory tract (Cullum, Farmer & others, 1968) whilst ICI 50 172 has been described as a specific antagonist of /3-adrenoreceptors in the heart (Dunlop & Shanks, 1968). We have examined the /1-adrenoreceptor blocking action of 4-(2-hydroxy-3-isopropylaminopropoxy)indole (LB46, prinodolol). The actions of LB46 have been compared with those of propranolol on both trachea and atria of guinea-pigs, as examples of tissues containing /32 and /3t adrenoreceptors respectively.
EXPERIMENTAL
G u in ea -p ig is o la te d tra c h e a l chain
Relaxations of guinea-pig tracheal chains, prepared from adult female guinea-pigs, were recorded as described by Chahl & O’Donnell (1967). The preparations were suspended in Krebs bicarbonate solution containing ascorbic acid (200 /xg/ml) and the cartilaginous part of each ring was cut. Cumulative dose-response curves to isoprenaline or noradrenaline were obtained using the method of van Rossum (1963).
G u in ea -p ig is o la te d a tr ia
Isolated atria from adult female guinea-pigs were mounted in Krebs bicarbonate solution containing 200 /¿g/'ml ascorbic acid and aerated with 5% carbon dioxide

181A p o te n t fl-a d re n o re c e p to r b lo c k in g d ru g , L B A 6
in oxygen at 31°. The positive chronotropic effects of isoprenaline were recorded using a post office counter activated by a mercury contact. The resting atrial rate per min (i.e. the rate in the absence of agonist) was found by doubling the average of three 30 s counts taken at 1 min intervals. Doses of isoprenaline were then added using the cumulative method of Rossum (1963). After each dose, 1 min was allowed to elapse and then three measurements of the atrial rate were made over the next 3 min. The resulting 4 min interval between successive doses of agonist was adequate for the full effect of each dose to be observed. The response to each dose was taken as the resultant increase in atrial rate (i.e. highest atrial rate observed after each dose minus the resting atrial rate). This was then expressed as a percentage of the maximum increase in rate which could be induced by the agonist.
E x p e r im e n ta l d es ig n s
On both trachea and atria two series of experiments were made using isoprenaline as the agonist drug. In one series LB46 was the antagonist drug and in the other propranolol. After obtaining a control dose-response line to isoprenaline, successive doses of either LB46 (0-002, 0-02, 0-2 and 2-0 ^.g/ml bath fluid) or propranolol (0-02, 0-2, 2-0 and 20-0 /zg/ml bath fluid) were added to the bath. The effect of the antagonist on the responses to isoprenaline was tested 30 min after adding the dose of antagonist.
Further experiments were made on trachea using noradrenaline as the agonist drug, and the effect of doses of LB46 or propranolol was examined as described above. Experiments were then carried out where control dose-response lines to noradrenaline were obtained in the absence, and then in the presence, of cocaine (10~5m ) added to the bath fluid for 30 min in order to block uptake of noradrenaline into adrenergic nerve terminals. The effect on the responses to noradrenaline of successive doses of LB46 or propranolol in the presence of 10~5m cocaine was then tested.
D e te rm in a tio n o f p A va lu es a n d p o te n c y ra tio s
pA values for the antagonist drugs were obtained by a method based on that of Arunlakshana & Schild (1959). The ED50 value (concentration of agonist in the bath required to produce a 50% maximum response) was interpolated from each log dose—% maximum response line fitted by eye. Log (dose ratio-1) for the agonist was then plotted against the negative value of the log molar concentration of antagonist. Dose ratio is the ratio of the ED50 values for the agonist drug obtained in the presence and in the absence of antagonist. Results from all experiments in a series were collected and the best line through the points was calculated by a linear least squares regression. The pA2 value (value of the intercept on the abcissa) was calculated from the values for the slope of the plot and the intercept on the ordinate. The pA10 value (the negative log molar concentration when log (dose ratio-1) equalled 0-95) was also calculated by substitution in the equation for a straight line, y = mx + C.
The potency of LB46 relative to that of propranolol was calculated by taking the antilog of the difference in the pA2 or pAi„ values.
182 GLYNNE E. MOORE AND STELLA R. O’DONNELL
D ru g s
Drugs used were: cocaine hydrochloride, (±)-isoprenaline sulphate; LB46; (—)-noradrenaline acid tartrate; (±)-propranolol hydrochloride. LB46 was provided in ampoules containing 200 /xg/ml LB46 as base with a small amount of citric acid in each ampoule. Therefore propranolol solutions were also prepared as /xg/ml, expressed as weight of base. The doses of antagonist were converted to molar concentrations for calculation of pA values. Doses of all other drugs are expressed as final molar concentration in the bath fluid.
RESULTS
D ir e c t e ffe c ts o f L B 4 6 a n d p ro p r a n o lo l on tra c h e a a n d a tr ia
Propranolol (0-02, 0-2 and 2 0 /xg/ml) had little effect on the resting tone of tracheal muscle. An increase in tone was observed after 20-0 /xg/ml propranolol. In most experiments LB46 (0-002, 0 02, 0-2 and 2-0 /xg/ml) produced a loss of tone which was most marked on addition of the first dose (Fig. 1). Addition of cocaine alone to the bath caused a loss of tone of tracheal muscle, which was particularly marked when noradrenaline was the agonist. Cocaine in the presence of either of the /3-adrenoreceptor blocking drugs caused no loss of tone.
F ig. 1. Isoprénaline antagonism by LB46 on guinea-pig trachea, showing loss of tone of preparation on addition of LB46.
The effects of both LB46 and propranolol on the resting atrial rate after 30 min contact with the tissue are indicated in Table 1. Increasing doses of propranolol caused a marked depression of atrial rate. LB46 also depressed atrial rate but not as much as did propranolol.
A n ta g o n ism o f iso p ren a lin e b y L B 4 6 on tra c h e a a n d a tr ia
pA2 and pA10 values for LB46 were compared with the values for propranolol on both trachea and atria using isoprenaline as agonist drug. For pA values to be valid it is necessary that the log dose—% maximum response line for the agonist be shifted by the antagonist in a parallel fashion to a higher dose range, i.e. the

A p o te n t f t-a d re n o re c e p to r b lo c k in g d ru g , L B 4 6 183
Table 1. R e s tin g a tr ia l r a te (%) a f te r 30 m in c o n ta c t o f tis su e w ith L B 4 6 o r p r o p r a n o lo l
Dose of blocking drug % resting atrial rate ± s.d.*(/xg/ml) LB 46 Propranolol
0-002 87-9 ± 9-9 —
(6)t0-02 66-8 ± 23-1 83-9 ± 7-5
(3) (5)0-2 74-9 ± 21-7 78-0 ± 10-9
(5) (5)2-0 80-3 ± 8-6 65-9 ± 11-7
(5) (5)20-0 24-59
(2 ){
* Standard deviation.f Number of observations.t In 3 other experiments beating stopped.
Fig. 2. Log dose-% maximum response lines to isoprénaline on (a) guinea-pig trachea and (b) guinea pig atria. As the dose of LB46 (0-002, 0-02, 0-2 and 2-0 jag/ml bath fluid) was increased the lines to isoprénaline were shifted parallel to the control line (C ) suggesting a competitive antagonism.

184 GLYNNE E. MOORE AND STELLA R. O’DONNELL
antagonism must be competitive (Gaddum, 1957). Experiments illustrating this for LB46 against isoprenaline on both trachea and atria are shown in Fig. 2. There was no depression o f the maximum response to isoprenaline by LB46, over the dose range used, confirming the competitive nature o f the antagonism.
The regression lines for the values o f log (dose ratio-1) plotted against the negative log molar concentration o f antagonist and calculated from a number o f experiments are illustrated in Fig. 3. The pA 2 and pA 10 values obtained for propranolol on trachea were similar to those obtained on atria. Also, the values obtained for LB46 on trachea were similar to those on atria (Fig. 3). For the action o f propranolol on both trachea and atria the slope o f the line was in close agreement with —1-0 and therefore the pA 2-p A 10 value (0-94 trachea, 0-91 atria) did not deviate markedly from 0-95, the theoretical value for a competitive antagonism. Values for the slope and pA 2-p A 10 (0-91) for the action o f LB46 on atria were also close to theoretical. However on trachea the slope was less than expected (Fig. 3) and the (pA2-p A 10) value was therefore high (1T0).
The potency o f LB46 relative to propranolol calculated from pA 2 values was6-2:1 on trachea and 4-2:1 on atria. The potency ratios calculated from pA10 values were 4-3 : 1 and 4-2 : 1 respectively.
Io
1/1oMo
Log molar concentration LB 46 Propranolol
Fig . 3. Regression lines summarizing the results from 8 separate experiments using LB46 and 5 experiments using propranolol on both trachea (A, B) and atria (C, D), with isoprenaline as the agonist drug. Shows linear relation between log (dose ratio-1) for isoprenaline (ordinate) and negative value of log molar concentration of antagonist drug (abscissa). pA2, pA10 and slope values are respectively: A, 8-81, 7-71, —0-86; B, 8-02, 7-08, —1-01 ; C, 8-64, 7-73, —1-04; D, 8-02, 7-11, —1 05.

185A potent /?-adrenoreceptor blocking drug, LB46
Use o f noradrenaline as agonist drug
It has been suggested that the observed response to some sympathomimetic amines is affected if that amine is taken up by adrenergic nerve terminals in a sympathetically- innervated isolated tissue preparation (Iversen, 1967). This has been studied experimentally on isolated trachea (Chahl & O’Donnell, 1967; Foster, 1967) and on isolated atria (Blinks, 1967). It was o f interest to examine the effect o f uptake of the agonist into adrenergic nerves on the pA 2 and pA 10 values for antagonists. Thus the effects o f LB46 and propranolol on the responses o f trachea to noradrenaline in the absence and in the presence o f cocaine were investigated. It was assumed that the dose o f cocaine used ( 1 0 _ 5 m ) was sufficient to block most o f the uptake o f the amine into adrenergic nerve terminals in this tissue. The results obtained are summarized in Fig. 4. In the absence o f cocaine the slopes o f the regression of log (dose ratio-1) against negative log molar concentration o f antagonist for both LB46 and propranolol were smaller when compared to the equivalent plots for isoprénaline as agonist. In the presence o f cocaine the slopes o f these regressions approached the theoretical value o f —1-0 (see Fig. 4). Consequently, values o f pA 2-p A 10 (1-47 LB46; 1-23 propranolol) deviated from the theoretical value o f 0-95
COo C D
Log molar concentration LB 46 Propranolol
F i g . 4. Regression lines summarizing the results from separate experiments where LB46 or propranolol antagonized the noradrenaline relaxations of trachea in the absence (A, B) or presence (C, D) of cocaine ( 1 0 - 5 m ) . Log (dose ratio-1) for noradrenaline is plotted against negative value of log molar concentration of LB46 or propranolol. pA2, pA™, and slope values are respectively: A, 8-65, 7-18, —0-64 (5 exp.); B, 7-71, 6-48, —0-77 (5 exp.); C, 8-83, 7-91, —1-02 ( 6 exp.); D, 8 03, 7 08, -1-00 (5 exp.).

186 GLYNNE E. MOORE AND STELLA R. O’CONNELL
in the absence o f cocaine but approached it if cocaine was present in the bath fluid (0-92 LB46; 0-95 propranolol). The potency o f LB46 relative to propranolol on the trachea was calculated from the experiments using noradrenaline in the presence o f cocaine. The potency ratio was 6 -3 :1 when calculated from pA 2 values and 6*8:1 from pA10 values.
DISCUSSION
Both propranolol and LB46 fulfilled the various criteria necessary for competitive antagonism of /3-adrenoreceptors on guinea-pig trachea and atria. They produced a parallel shift in the log dose—% maximum response lines to isoprenaline and there was no depression of the maximum response to isoprenaline after high doses of antagonist drug. When the results o f these experiments using isoprenaline were plotted as log (dose ratio-1) against the negative log molar concentration o f antagonist the results were fitted by a straight line. The slopes o f these regressions approached the theoretical value of —1-0, and (pA2-p A 10) values approached the theoretical value o f 0-95 for competitive antagonism except in those experiments on trachea where the antagonism of isoprenaline by LB46 was studied. In these experiments the relatively low slope value (0-86) resulted in an increase in the value o f (pA2-p A 10) to HO. In experiments on trachea where noradrenaline was used as agonist drug, the slopes o f the regression lines were also less than the theoretical value of —1-0 and consequently the values for (pA2-p A 10) were high. These latter deviations from theoretical values were considered to be due to loss o f noradrenaline into adrenergic nerves since, in experiments where cocaine (10~5m) was also present, the values for both the slope and (pA2-p A 10) were close to theoretical. Thus the pA 2 value o f 6-56 for propranolol on trachea quoted by Foster (1966) is probably too low since noradrenaline was used as the agonist drug and its loss by uptake into adrenergic nerves was not prevented.
Various alterations in the resting tone o f tracheal preparations were observed after addition o f some of the drugs. Propranolol had little effect on resting tone except for the 20-0 /xg/ml dose where an increase in tone occurred. This finding agrees with that of Foster (1966) but is in contrast to the observations of Ablad, Brogard & Ek (1967) who describe relaxations of guinea-pig trachea with similar doses o f propranolol. However, they used pilocarpine to induce tone and propranolol might therefore have relaxed the tissues by an antimuscarinic action (Mazurkiewicz, 1968). Cocaine or LB46 alone both caused loss o f tone o f the preparations. The loss o f tone by cocaine was particularly marked when noradrenaline was used as agonist drug. It is possible that a spontaneous release of noradrenaline influences the resting tone o f individual tracheal preparations and that cocaine blocks the re-uptake o f this spontaneously released noradrenaline. The addition o f cocaine together with either LB46 or propranolol caused no loss o f tone. This might be because the (8-adrenoreceptor blocking drugs occupy the /3-adrenoreceptors necessary for cocaine-induced relaxation. The loss o f tone by LB46 alone was particularly marked on addition of the first dose o f drug (usually the 0-002 (u,g/ml dose) and then it was only slightly increased as LB46 was added again. The absence o f this relaxation o f the tissue by LB46 in the presence of cocaine (which itself induces loss o f tone) might suggest that LB46 is an indirect sympathomimetic amine and that its access to noradrenaline storage sites is prevented by the simultaneous presence o f cocaine. The loss o f tone was considered not to

187A potent /3-adrenoreceptor blocking drug, LB46
be due to local anaesthetic activity since LB46 and propranolol are approximately equipotent as local anaesthetics (unpublished results) but propranolol does not depress the tone o f the tissue. I f the relaxation o f the muscle by LB46 were a nonspecific effect, cocaine, by a summation effect, would probably exaggerate and not prevent the relaxation.
It is possible that the loss o f tone o f tracheal preparations following the addition o f LB46 might account for the reduced slope o f the regression o f log (dose ratio-1) against negative log molar concentration LB46 observed using isoprenaline on trachea. The slope o f the regression was not reduced under similar conditions when propranolol was the antagonist. It was assumed that the reduction o f slope was not related to uptake o f agonist into nerves, since isoprenaline has little affinity for this uptake (Hertting, 1964; Iversen, 1967).
Both propranolol and LB46 caused some depression o f resting atrial rate. The effects o f LB46 were not as marked as those o f propranolol, but, if LB46 has some indirect sympathomimetic action, this could cause a physiological antagonism of any direct depressant effects o f LB46 on atrial rate. Our findings with propranolol confirm those o f Blinks (1967) who has previously described the negative chronotropic effects on guinea-pig atria o f propranolol at doses greater than 1 0 ~ 6m with atrial arrest with 1 0 - 4 m propranolol.
I f the receptors for an agonist drug are the same in different tissues then the pA 2 and pA10 values for an antagonist o f these receptors in those tissues should be the same (Arunlakshana & Schild, 1959). The pA2 and pA 10 values for propranolol against isoprenaline were the same on trachea and atria. The pA2 and pA 10 values for LB46 against isoprenaline were also similar on trachea and atria.
The pA 2 or pA 10 values were used to compare the potency o f LB46 and propranolol as /3-adrenoreceptor blocking drugs on these two tissues. I f the slopes of the regression lines agree closely with the theroetical value o f — 1 -0 then the potency ratio should be similar using either the pA 2 or the pA10 values. However, at least two factors in the experiments described might affect the slope, viz. uptake into adrenergic nerves and direct effects of the antagonist on the tissue. Thus there was some variation in potency ratio depending upon the experimental conditions. Nevertheless, LB46 was from 4 to 7 times more potent than propranolol and the potency ratios on trachea and atria could not be considered to be markedly different.
The value of the pA 2 found in this work for propranolol antagonism of the chronotropic effects o f isoprenaline (8-02) was less than the value (8-56) reported by Blinks(1967). This could merely reflect the wide variability in pA 2 values which occurs from experiment to experiment when using adrenoreceptor blocking drugs. Alternatively, it could be because we used a ten fold higher dose o f propranolol than Blinks and other actions o f either the antagonist or the agonist might interfere. It is also possible that complete /3-adrenoreceptor blockade was not attained after a 30 min contact time o f the tissue with propranolol. To examine 3 or 4 doses o f propranolol on one tissue, we were not able to use a longer contact time.
It has thus been concluded that LB46 is a more potent /3-adrenoreceptor blocking drug than propranolol on guinea-pig trachea and atria and is not specific for either tissue. It may have sympathomimetic actions which are manifest as a relaxation o f guinea-pig trachea and which might also obscure direct negative chronotropic effects o f LB46 on guinea-pig atria. pA 2 and pA 10 values have been used to estimate the potency ratio o f the two /3-adrenoreceptor blocking drugs but it is felt that

188 GLYNNE E. MOORE AND STELLA R. O’DONNELL
many factors, such as adrenergic uptake and direct effects o f the blocking drug on the tissue, might influence these values and reduce their reliability.
Since the completion o f the work described in this paper two reports on LB46 have been published. Giudicelli, Schmitt & Boissier (1969) found LB46 to be 5-7 times more potent than propranolol on guinea-pig trachea and atria (inotropic effects) using isoprenaline as agonist. Lubawski & Wale (1969) found LB46 to be 10 times more potent than propranolol on rabbit atria (chronotropic effects) but these authors used pA 2 values obtained using adrenaline as agonist drug which may introduce a variance due to slight loss o f adrenaline into adrenergic nerves. The experiments o f Lubawski & Wale (1969) indicated that LB46 might have weak ^-receptor agonist activity whereas Giudicelli & others (1969) consider that it has no intrinsic /5- sympathomimetic activity.
AcknowledgementsWe would like to thank Miss Sandra L. Whyte for excellent technical assistance,
Dr. I. S. Collins, Sandoz Australia Pty. Ltd., for generous supplies o f LB46, and Imperial Chemical Industries for propranolol. Support for this work by grants from the National Health and Medical Research Council o f Australia and the Asthma Foundation o f Queensland is gratefully acknowledged. A preliminary report on this work was presented to the second meeting o f the Australasian Society o f Clinical and Experimental Pharmacologists in Sydney, Australia, November 28-29, 1968.
REFERENCESÁ b l a d , B., B r o g Ä r d , M. & E k , L. (1967). Acta pharm , to x., 25, Suppl. 2, 9-40. A r u n l a k s h a n a , O. & S c h i l d , H. O. (1959). B r. J . Pharm ac. Chemother., 14, 48-58.B l i n k s , J. R. (1967). Ann. N .Y . Acad. Sei., 139, 673-685.C h a h l , L. A. & O ’ D o n n e l l , S. R. (1967). Europ. J. Pharm ac., 2, 77-82.C u l l u m , V. A., F a r m e r , J. B., J a c k , D. & L e v y , G. P. (1969). B r. J. Pharm ac., 35, 141-151. D u n l o p , D. & S h a n k s , R. G. (1968). Ibid., 32, 201-218.F o s t e r , R. W. (1966). J . Pharm . Pharm ac., 18, 1-12.F o s t e r , R. W. (1967). B r. J . Pharmac. Chemother., 31, 466-482.F u r c h g o t t , R. F. (1967). Ann. N . Y . Acad. Sei., 139, 553-570.G a d d u m , J. H. (1957). Pharm . Rev., 9, 211-218.G iu dicelli, J. F., Schm itt, H. & Boissier, J. R. (1969). J . Pharmac. exp. Ther., 168, 116-126. H ertting , G . (1964). Biochem. Pharmac., 25, 18-33.I v e r s e n , L. L. (1967). The uptake and storage o f noradrenaline in sym pathetic nerves. Cam
bridge University Press.L a n d s , A. M., A r n o l d , A., M c A u l i f f , J. P., L u d u e n a , F. P. & B r o w n , T. G. Jr. (1967).
Nature, Lond., 214, 597-598.L a n d s , A. M. & B r o w n , T. G. Jr. (1964). Proc. Soc. exp. B iol. M ed., 116, 331-333.L a n d s , A. M., L u d u e n a , F. P. & Buzzo, H. J. (1967). L ife Sei., 6 , 2241-2250.L u b a w s k i , I. & W a l e , J. (1969). Europ. J . Pharm ac., 6, 345-348.M a z u r k i e w i c z , I. M. (1968). Archs int. Pharmacodyn. The'r, 171, 136-158.Rossum, J. M. v a n (1963). Ibid., 143, 299-330.

J. Pharm. Pharmac., 1970, 22, 189-192 Received September 25, 1969
The activities of a- and p-adrenoceptive blocking agents in reducing intestinal
relaxation due to sympathetic stimulation in the pithed rat
M. W. PARKES AND CHRISTINE A. GERRARD
Pharmacology Department, Roche Products Ltd., Welwyn Garden City, Herts., U.K.
A pithed rat preparation, stimulated electrically via the pithing rod left in position, was employed to examine the effects o f drugs, administered intravenously, on relaxation o f a loop o f ileum. Relaxation due to injected isoprenaline could be largely blocked by propranolol but that due to nervous stimulation or injected noradrenaline was blocked to only a lesser extent by either propranolol or phenoxybenzamine alone. The combination o f phenoxy- benzamine and propranolol was more effective against relaxation from nervous stimulation than either drug alone but was still not as effective against this as against noradrenaline, or as propranolol alone against isoprenaline. It is concluded that intestinal relaxation after nervous stimulation involves both a- and /3-adrenergic activity, in variable proportions. Adrenoceptive antagonists are not as effective in blocking these receptors as they are for those concerned in relaxation after injected catecholamines.
Gillespie & Muir (1967) described a preparation o f the pithed rat, stimulated electrically in the lumbar region o f the cord through the pithing rod left in position. By this means they were able to study the effects upon blood pressure o f stimulation o f the total lumbar sympathetic outflow. We have used this preparation to study the effects o f drugs upon the relaxation of a loop o f ileum due to such stimulation.
EXPERIMENTALMethod
Sprague-Dawley rats, 25CM00 g, were pithed under ether anaesthesia using a No. 14 plastic-covered metal knitting needle, stripped over the length that would lie in the lumbar region o f the spinal column. Blood pressure was recorded from a catheter in a carotid artery by means o f a Statham transducer. In addition, the abdomen was opened and a small funnel placed over a loop o f ileum, which was tied at its base to a wire stretched across the mouth of the funnel while a thread under the apex o f the loop was tied to a Devices isometric transducer. Blood pressure and intestinal motility were recorded by a Devices two-channel pen recorder.
Electrical stimulation was given as square waves from a Palmer stimulator, at the rate o f 10/s, each o f 2 ms width and 80 V, for periods of 30 s. This was applied between the pithing rod and an indifferent electrode clipped to the skin of one hind- limb. Convulsions were reduced by pretreatment with (+)-tubocurarine, 5 mg/kg, intravenously, as used by Gillespie & Muir, though clonic contractions o f the limb bearing the electrode still occurred. Responses o f blood pressure and ileum to stimulation were rendered more consistent by additional pretreatment with atropine,

190 M. W. PARKES AND CHRISTINE A. GERRARD
1 mg/kg intraperitoneally before pithing and a further 1 mg/kg intravenously later.Drugs were injected via a jugular catheter and the intestinal relaxation following
stimulation compared with that before drug treatment.
RESULTS
The action o f fi-adrenoceptive blocking agents Table 1 and Figs 1 and 2 show the reduction by various doses of propranolol o f the
relaxation of the loop o f ileum due to electrical stimulation and also to the intravenous injection of isoprénaline (1 /xg/kg)— a dose just sufficient to cause a similar degree of relaxation. The effectiveness o f propranolol against stimulation was much less than against injected isoprénaline. Its effectiveness against injected noradrenaline was also less than against isoprénaline.
Table 1. Responses o f a loop o f ileum to injected catecholamines or electrical stimulation o f the lumbar cord in pithed rats treated with a- and ft-adrenoceptive blocking agents. Values are expressed as percentage o f the appropriate control.
Relaxation due to Drug Dose, mg/kg Response, %Isoprenaline, 1 ng/kg .. None 1 0 0
Propranolol I 75-4, 72-32 64-5, 68-4, 61-8. 60-04 46-6, 52-9, 46-65 40-08 31-4
Noradrenaline, 2 ng/kg .. None 1 0 0
Propranolol 2 74-9, 82-3, 70-7. 6 6 - 8
4 58-2, 45-8, 60-68 51-8, 39-9, 34-6
Phenoxybenzamine 2 1 0 0
+ propranolol 2 62-1, 58-8, 60-04 51-4, 50 0, 43-88 38-7, 38-1, 37-5
Electrical stimulation .. None 1 0 0
Propranolol 2 82-8, 86-5, 80-3, 89-84 76-7, 69-4, 75-0, 70-48 54-2, 61-4, 59-7, 57-3
1 0 50-816 43-5, 48-3
Phenoxybenzamine 2 1 0 0
+ propranolol 2 76-2, 66-2, 78-0, 65-6,67-8
4 57-9, 59-3, 61-58 41-4, 43-3, 54-2, 39-8
The action o f v.-adrenoceptive blocking agents
Phenoxybenzamine or phentolamine (1 mg/kg) injected intravenously, reduced intestinal relaxation to electrical stimulation by an extent not reduced further by a second injection. The degree o f reduction was quite variable from one animal to another but two injections o f 1 mg/kg resulted in no more than 23% reduction. The relaxation due to injected noradrenaline was also less than completely blocked by a total o f 2 mg/kg o f phenoxybenzamine. This antagonist was, however, quite ineffective against relaxation from injected isoprenaline.

191Activities o f a- and /8-blocking agents on intestine
150 -
a
mm Hg 0 -
b
Fig. 1. Record of blood pressure (upper trace) and tone of a loop of ileum (lower trace) in a pithed rat. Horizontal bars represent 30 s periods of electrical stimulation of lumbar cord, (a) At arrow: propranolol 2 mg/kg i.v. (b) At arrows: 1, phenoxybenzamine 2 mg/kg, i.v.; 2 , propranolol 2 mg/kg, i.v.
The combined action o f a- and fi-adrenoceptive blocking agents
As shown in Table 1 and Fig. 2, propranolol was more effective in reducing the intestinal relaxation due to electrical stimulation remaining after pretreatment with phenoxybenzamine (2 mg/kg) than when used alone. The dose-response relation may be seen to have moved nearer to that for antagonism of propranolol alone to injected isoprénaline, though the blocking agent did not reach its degree o f effectiveness against the amine (despite the fact that it was frequently acting on a lesser degree of relaxation). When used after phenoxybenzamine, propranolol was also more effective against noradrenaline than when given alone and it may be noted that in this case its effectiveness matched that when used alone against isoprénaline.
DISCUSSION
The results presented here demonstrate that stimulation o f the visceral nerve supply causes relaxation and inhibition o f intestinal motility by processes involving both oc- and /3-types o f receptor. This is in agreement with earlier findings that both a- and /3-adrenoceptive blocking agents are necessary to block intestinal inhibition due to adrenaline or noradrenaline (Ahlquist & Levy, 1959; Furchgott, 1960) or periarterial nerve stimulation (Day & Warren, 1968). The variable extent to which

192 M. W. PARKES AND CHRISTINE A. GERRARD
F ig. 2. Dose-response relations for the antagonism by propranolol to the effects on the tone of a loop of ileum in the pithed rat of: — Intravenous isoprénaline, 1 ¿tg/kg (b = -47-5 ± 9-0; N = 11 ; ED50 = 3-8 (3-2-4-1 ) mg/kg). — Electrical stimulation of the lumbar cord (b = — 44-6± 6-1 ; N = 15; ED50 = 12-3 (10-7-14-3) m g /k g ).------ Electrical stimulation, after phenoxy-benzamine, 2 mg/kg, i.v. (b = —43-1 ± 13-1 ; N = 12; ED50 = 6-2 (5-0-7-6) m g /k g ) .------Intravenous noradrenaline, 2 ¿xg/kg (b = —52-9 ± 21-4; N = 10; ED50 = 5-4 (4-3-6-9) mg/kg).......... Intravenous noradrenaline, 2 /xg/kg, after phenoxybenzamine, 2 mg/kg, i.v. (b = —36-9dt 7-7; N = 9; ED50 = 3-7 (3-3-4-2) mg/kg). The ranges quoted for ED50 values are the calculated 95% fiducial limits.
phenoxybenzamine affected the response to electrical stimulation in different animals suggests that the contributions of a- and /3-actions are variable.
In the presence of maximal amounts of phenoxybenzamine, propranolol was as effective against relaxation after injected noradrenaline as it was, used alone, against relaxation seen after isoprénaline, suggesting that both catecholamines are interacting with the same /3-adrenoceptors. Against relaxation due to electrical stimulation in the presence of complete a-block, however, propranolol was less effective than it was against injected catecholamines. This suggests either that nerve stimulation releases the transmitter in such a way that the /3-receptors are less susceptible to block by propranolol than when they are stimulated by injected catecholamines or that different receptors are involved.
REFERENCESA h l q u is t , R. P. & L e v y , B. (1959). J. Pharmac. exp. Ther., 127, 146-149.Day, M. D. & W a r r e n , P. R. (1 9 6 8 ) . Br. J. Pharmac., 3 2 , 2 2 7 -2 4 0 .
F u r c h g o t t , R. F. (1960). Adrenergic mechanisms, pp. 246-252. Ciba Symposium, Editors: Vane, J. R., Wolstenholme, G. E. W. & O’Connor, M. London: Churchill.
G il l e s p ie , J. S. & M u i r , T. C. (1967). Br. J. Pharmac. Chemother., 30, 78-87.

J. Pharm. Pharmac., 1970, 22, 193-197 Received August 22, 1969
Plasma protein binding of chlorpromazineSTEPHEN H. CURRY
Department o f Pharmacology and Therapeutics, London Hospital Medical College,Turner Street, London, E .\, U.K.
More than 90% of the plasma content of chlorpromazine over a concentration range from 0-008 to 15-1 /xg/ml was bound to human plasma protein. Binding was affected by the pH of the aqueous medium; with few exceptions the higher values were obtained at the higher pH values. Binding was highest in some of the plasma samples from humans, and successively lower in plasma from dogs, rabbits and rats. Binding of chlorpromazine after administration of the drug to psychiatric patients, and after in vitro addition of the drug to plasma, was reversible. Variation in binding in plasma from different humans was marked ; the amount bound varied from91-0 to 99-0%. Thus the variation in the amount free was from1-0-9-0%.
In assessing the significance of concentrations of drugs in plasma, it is essential to consider binding of drugs to plasma protein (Brodie, 1966; Meyer & Guttman,1968). Studies of chlorpromazine distribution in animals (Salzman & Brodie, 1956) have included the observation of high binding to plasma protein, but the phenomenon appears not to have been studied extensively. This report concerns the binding of chlorpromazine to plasma proteins as a function of chlorpromazine concentration, pH, species and reversibility ; these studies contribute towards the understanding of chlorpromazine concentrations in the plasma of psychiatric patients (Curry, 1968a).
EXPERI MENTALMaterials
Samples of chlorpromazine hydrochloride were obtained from Smith Kline and French Laboratories. Radioactive chlorpromazine (35S) was purchased from Radiochemical Centre, Amersham. At the commencement of the experiments this material had a specific activity of 12-7 mCi/mmol and in all experiments allowance was made for decline in specific activity.
Human plasma was obtained from six psychiatric patients and from pooled sources (blood-bank supplies). The psychiatric patients had received chlorpromazine for at least one month previously, in twice daily dosage (range of dose 100-600 mg/day). These patients were suffering from schizophrenia, but no other known disease, and had received no drugs other than chlorpromazine during the previous month. In animal studies, plasma was obtained from an inbred population of healthy Sprague Dawley rats, from an inbred population of healthy albino rabbits, and from three healthy pedigree beagles. All plasma was obtained from citrated blood.
Determination o f protein bindingSamples (2 ml) of plasma containing chlorpromazine were placed in sections of
previously moistened (soaked overnight in a sample of the solvent to be used) Visking dialysis tubing (10 mm wide when flat) knotted at each end. An air bubble was

194 STEPHEN H. CURRY
included to aid mixing. The sack containing the plasma was placed in a stoppered test tube containing 10 ml of OTm phosphate buffer (pH 7-4) (or other suitable solutions in studies of influence of pH). The tube was agitated gently at room temperature until equilibrium was achieved and the material was assayed in the final solutions inside and outside the dialysis membrane. Preliminary experiments, with plasma, demonstrated that equilibration was achieved within 48 h of the commencement of the experiment.
Assay o f chlorpromazineIn experiments in which non-radioactive drug was used, chlorpromazine was
assayed by gas chromatography (Curry, 1968b). The content of the solutions of radioactive chlorpromazine was determined by direct sampling of suitable volumes of the solution into liquid scintillation vials. The liquid scintillation fluid used was prepared from BBOT (2,5-bis-(5-t-butylbenzoxazoyl)thiophene), 0-4%, naphthalene, 0-8% and methylcellosolve, 40%, in toluene. Standard quench corrections were made. In all assays of chlorpromazine, both by liquid scintillation spectrometry and by gas chromatography, fresh standard solutions were used, and concentrations were determined in terms of chlorpromazine hydrochloride.
RESULTS
Over a wide range of concentrations for chlorpromazine in samples of mixed human plasma, determinations of protein binding varied from 91-8-97-0% of the plasma content of drug (Table 1). Binding varied only slightly within the therapeutic concentration range (0-01-1 /xg/ml). There was a tendency to a lower binding value at the highest drug concentration, indicating the possibility of saturation, but it appeared that immense quantities of the drug would be required to occupy all its potential binding sites on plasma protein.
Table 1. Plasma protein binding o f chlorpromazine at various concentrations, Plasma, from a single bottle of mixed human material, containing radioactive chlorpromazine at a number of concentrations, was dialysed as described in the Experimental section. Percentage binding was measured from the ratio of radioactivity in dialysate and plasma
Concentration of chlorpromazine in plasma after dialysis (/¿g/ml)
0-008 0-019 0-039 0-08 0-21 0-4 0 - 8
15-1
% Bound to protein (mean with range on 3-4
determinations in parentheses) 94-9 (93-3-97-0)94-8 (93-9-94-9)93- 7 (91-8-95-4)94- 5 (93-6-95-9)95- 7 (93-0-97-0)94- 8 (94-5-95-2)95- 5 (94-9-96-3)92-0 (91-3-93-6)
Determinations of protein binding of chlorpromazine added to human plasma were affected by the pH of the fluid into which dialysis was made (Table 2). With the unexplained exception of pH 4, binding was higher at higher pH values, and

Table 2. Plasma protein binding o f chlorpromazine at various pH values. Samples from a solution of radioactive chlorpromazine at a concentration of 20 /xg/ml were dialysed against aqueous solutions of various pH value, as described in the Experimental section. Percentage binding was measured from the ratio of radioactivity in dialysate and plasma
Plasma protein binding o f chlorpromazine 195
pH Solvent
% Bound to protein (mean, with range on 3
determinations in parentheses)1-7 0 -0 5 n HC1 6 7-0 (6 6 -0 -6 8 -0 )4 0 1 m Phthalate buffer 8 9-0 (8 9 - 0 - 9 0 0 )4-7 0 -1 m Acetate buffer 8 1-0 ( 8 0 0 - 8 1 - 6 )7 0-1m Phosphate buffer 88-5 (8 7 -0 -8 9 -0 )7-4 0-1m Phosphate buffer 9 1 -0 (9 0 -7 -9 2 -1 )
10 0 -1 m Carbonate buffer 9 8 -9 (9 8 -8 -9 9 -1 )12-5 0 -0 5 n NaOH 9 8 -2 (9 7 -8 -9 8 -4 )
lower at lower pH values. Even when the drug was in solutions of pH 1-7 a large amount was bound.
When chlorpromazine was added to plasma from rats, rabbits and dogs, protein binding of the drug varied from 89-1-95-7% of the plasma content (Table 3). Higher binding than this was recorded in some, but not all, samples of human plasma ; large differences in the binding capacity of various batches of human plasma were noted. Triplicate determinations of binding in one sample of plasma never varied by more than 1-85% from the mean; determinations in samples of plasma from six patients varied from 91-0-99-0%.
Table 3. Plasma protein binding o f chlorpromazine in three species. Plasma from three species was dialysed as in the Experimental section after addition of radioactive chlorpromazine. The percentage binding of chlorpromazine was measured from the ratio of radioactivity in plasma and dialysate samples
Concentration of % Bound to proteinchlorpromazine after (mean, with range on 3
Species dialysis (/tg/ml) determinations in parentheses)Rat .. .. 0-061 89-4 (89-1-89-9)Rabbi t . . 0-076 94-1 (93-8-94-5)Dog .. .. 0 082 95-7 (94-6-97-4)
The reversibility of binding of chlorpromazine to plasma protein was examined in three ways. First, a solution of chlorpromazine was dialysed as described under Experimental ; after determination of the percent bound, the plasma was re-dialysed twice, to give a total of three determinations of protein binding; the three values determined were 95-2, 95-9 and 95-9%. Second, in a pair of experiments, binding was studied by adding chlorpromazine to the buffer solution or to plasma; after equilibration, values of binding were : 94-4% when the drug had transferred from the outside of the membrane to the inside ; and 94-7% when the drug had transferred from the inside of the membrane to the outside. Third, trace quantities of radioactive chlorpromazine were added to two samples of plasma obtained from patients

196 STEPHEN H. CURRY
treated with chlorpromazine. The plasma was dialysed as described in the Experimental section. Percentage binding, measured from the ratio of chlorpromazine assays by gas chromatography in dialysate and plasma, and from the ratio of radioactivity in dialysate and plasma, was respectively 97-7 and 98T% for a chlorpromazine plasma concentration after dialysis of 0-90 /ag/ml, and 98-9 and 99-0% for a concentration of 0-64%. All records were from single assays. Thus the results of binding were similar by the two methods.
The remote possibility that dialysed radioactivity from chlorpromazine was a metabolite, decomposition product or other compound different from chlorpromazine was considered in a specificity experiment (Table 4). Authentic chlorpromazine, and radioactivity in plasma and a dialysate, were shown to distribute similarly between n-heptane containing T5% isoamyl alcohol and aqueous solutions of various pH values. These materials contrasted in this respect with known metabolites and decomposition products of chlorpromazine (Curry, 1968b).
Table 4. Specificity checks for chlorpromazine binding. The radioactivity in a typical pair of dialysate and plasma fractions after a protein binding experiment was totally extracted into n-heptane containing 1-5% isoamyl alcohol from alkaline solutions. The organic layer was separated, and the radioactivity extractable into aqueous solutions of various pH values was determined. Standard data were similarly obtained for a solution of an authentic sample of chlorpromazine. Each figure is a single determination
% Of material in organic layer extracted into aqueous layers
pH of aqueous solutionAuthentic
sample Plasma Dialysate1-7 1 0 0 1 0 0 1 0 0
3-5 85 90 834-2 62 53 6 6
5-0 30 33 405-5 1 3 46-3 0 0 0
DISCUSSION
Chlorpromazine is highly bound to plasma protein. Even at concentrations approaching 20 /xg/ml, 90% of the plasma content of the drug was bound. This resulted in only a slight change in percent binding over the therapeutic range of drug concentration. However, a tendency to saturation was demonstrated, in keeping with established theory concerning the reversibility of binding and the possibility of saturation of binding sites on plasma proteins. The reversibility of the binding was further shown by the ease of removal of drug by dialysis, and by the fact that drug molecules added to plasma equilibrated rapidly between plasma protein and plasma water.
Results of studies of pH-dependency of binding indicated that it is most probably the non-ionized form of the drug that is bound to protein. However, even at pH 1-7, much binding occurred, adding to the evidence that the association constant for binding of the unionized form of the drug to protein is relatively high.

The maximum analytical error recorded in the present studies was ±1-85 in percent bound. In the three pedigree species, binding was significantly greater in the order dogs>rabbits>rats, and the differences were significantly different from the analytical error. The highest values of all were obtained from some of the human samples, but the range in man was wide. It is difficult, in view of this range, to draw any conclusions concerning the relation between binding capacity and species.
AcknowledgementsThe author is grateful to Smith Kline and French Laboratories for the supply of
chlorpromazine; this work was supported in part by contract number PH 43-66-1167 with the United States National Institute of General Medical Sciences.
REFERENCESB r o d ie , B. B. (1966). In Transport Function o f Plasma Proteins. Editors: Desgrez, P. &
Traverse, P. M. Amsterdam: Elsevier.C u r r y , S. H. (1968a). Agressologie, 9, 115-121.C u r r y , S. H. (1968b). Analyt. Chem., 40, 1251-1255.M e y e r , M. C . & G u t t m a n , D. E. (1968). J. pharm. Sci., 57, 895-918.S a l z m a n , N. P. & B r o d ie , B. B. (1956). J. Pharmac. exp. Ther., 118, 46-54.
Plasma protein binding o f chlorpromazine 197

J. Pharm. Pharmac., 1970, 22, 198-201 Received November 3, 1969
A procedure for the analysis of illicit diamorphine samples
A. S. CURRY AND D. A. PATTERSON
Home Office Central Research Establishment, Aldermaston, Reading, Berks, U.K.
A procedure for the analysis of illicit diamorphine samples is outlined, which consists of preliminary examination of the material by infrared spectrophotometry, followed by thin-layer and gas-liquid chromatography. Data for eighteen likely contaminants of samples are recorded.
A number of substances other than diamorphine (heroin) are likely to be present in illicit samples of the drug and the amount of sample available for analysis is likely to be small. Most commonly we find the drug to be present in illicit samples in admixture with caffeine, its degradation products 0 6-acetylmorphine and morphine, and a diluent, but we have also detected in some samples cyclizine, quinine and barbiturates. The presence of codeine and acetylcodeine has also been reported (Nakamura & Ukita, 1962; Nakamura, 1966, 1969). An analytical procedure was therefore devised which allowed analysis of the diamorphine, concurrent identification of likely contaminants, and which required no extraction or concentration before analysis. The procedure described has been used effectively and is applicable to samples of 5-10 mg.
EXPERIMENTAL AND RESULTSInfrared spectroscopy
The whole sample for analysis was ground in an agate mortar and 0-5-1 mg prepared for infrared examination as a pressed potassium bromide disc. Spectra were recorded using a Perkin-Elmer 225 Grating Spectrophotometer.
In all samples examined, at least the six major absorption maxima of the spectrum of diamorphine ion (1765, 1740, 1450, 1370, 1250 and 1180 cm-1) were present. Most samples examined also contained caffeine and a composite spectrum was obtained with contributions at 1700, 1660, 1550, 1485, 1240 and 745 cm-1 from the caffeine. In the few instances where a barbiturate was present in the sample there was absorption in the 1310-1330 cm-1 region, where all barbiturates absorb strongly but caffeine and diamorphine do not. The spectrum of an artificial mixture of diamorphine, barbitone and caffeine (1:1:2) is shown in Fig. 1.
Thin-layer chromatographyThin-layer chromatography of the illicit diamorphine was by an adaptation of
the paper chromatographic system described for bases by Curry & Powell (1954) and which was later extended by Clarke (1962).
An approximately 5% solution of the ground sample was accurately prepared in a stock solution consisting of aqueous dimethylformamide (50%) containing dibenzyl phthalate (2 mg/ml). This was applied to Merck pre-coated cellulose plates (250 ftm) which had previously been dipped in a 5% solution of sodium dihydrogen

Analysis o f illicit diamorphine samples 199
F i g . 1. Spectrum of an artificial mixture of diamorphine HC1 (H), barbitone (B) and caffeine (C) (1:1:2) recorded on a Unicam SP200 instrument.
citrate and dried at 100° for 1 h. The plates were developed in a solution of citric acid (4-8 g) in a mixture of water (130 ml) and n-butanol (870 ml). Components of the illicit diamorphine mixture were located by examination under 254 nm ultraviolet light, followed by spraying with iodoplatinate reagent (platinic chloride, 0-25%, plus potassium iodide, 5%, in water) and then dilute hydrochloric acid.
The Rf values in this system of substances that have been or are likely to be encountered in illicit diamorphine samples are given in Table 1. Of the compounds examined, quinine exhibited a blue fluorescence when viewed under ultraviolet light, and all except caffeine gave a blue coloration with the iodoplatinate spray reagent. Caffeine was located as a pale blue spot on subsequent spraying with dilute hydrochloric acid.
Table 1. R f values o f substances that have been or are likely to be encountered in illicit diamorphine samples, (The system is described in the Experimental section)
Morphine.. .. .. 0-150 6-Acetylmorphine .. 0-20Dihydromorphine .. 0 -20Codeine .. .. .. 0-22Dihydrocodeine .. .. 0 -24O'-Acetylcodeine .. 0-43Cocaine .. .. .. 0-43Diamorphine .. .. 0-43Quinine .. . . .. 0 -60
Caffeine .. .. .. 0-65Pethidine .. .. .. 0-68Ethoheptazine .. .. 073Dextromethorphan .. 0-75Orphenadrine .. 0-75Dextromoramide .. .. 0-76Cyclizine .. .. .. 0-78Dexropropoxyphene . . 0-78Methadone.. .. .. 0-80Dipipanone .. .. 0-83
Gas-liquid chromatographyAnalysis of the solution of illicit diamorphine in aqueous dimethylformamide
prepared earlier for thin-layer chromatography was now made using a Pye 104 Gas Chromatograph at two isothermals (200° and 250°), the dibenzyl phthalate in the solution acting as internal marker and standard. The gas chromatograph was equipped with a flame ionization detector, a Kelvin Electronics Servoscribe Recorder

200 A. S. CURRY AND D. A. PATTERSON
and a Kent Chromalog Integrator. The column was 5 ft glass, i.d. 4 mm, packed with 80-100 mesh acid washed Chromasorb W coated with 3% cyclohexane- dimethanol succinate. A hydrogen pressure of 18 lb/inch2, air 7 lb/inch2, and a nitrogen flow rate of 60 ml/min was used throughout.
Amounts of 1-2 /al of the solution for analysis were injected onto the column with the oven temperature at 200°, integrated peak areas not being measured at this stage. After 30 min the oven temperature was raised to 250° to purge the column. After a further 30 min, 1-2 ¡x\ of the solution for analysis was injected onto the column at the new oven temperature of 250° and with the integrator in operation. The concentration of diamorphine was obtained by calculating the ratio of peak areas of the drug to that of the internal marker and relating this to a previously constructed calibration curve of diamorphine in the same stock solution. Table 2 gives the retention times in minutes of substances that have been or are likely to be encountered in illicit diamorphine samples. Morphine, dihydromorphine and quinine although falling into this category of compounds are not detected under these conditions. The retention time of dibenzyl phthalate, the internal standard, is approximately 20 min. 0 6-Acetylmorphine and 0 6-acetylcodeine were prepared by hydrolysis of diamorphine and acetylation of codeine respectively as previously described (Wright, 1874; Nakamura & Ukita, 1962).
Table 2. Retention times {min) o f substances that have been or are likely to be encountered in illicit diamorphine samples
Compound 2 0 0 ° 250°Pethidine 1-7 —Ethoheptazine .. 3-5 —Orphenadrine .. 3-6 —Cyclizine 5-3 —Dextropropoxyphène 60 —Methadone 6-3 —Dextromethorphan .. 8-3 —Caffeine 11-4 —Cocaine 14-5 2-5Dipipanone .. 20-3 3-20 6-Acetylcodeine — 5-5Dihydrocodeine — 7-2Codeine — 7-40 6-Acetylmorphine .. — 8-4Diamorphine .. . . -- 14-5Dextromoramide • • -- 18-4
DISCUSSION
The procedure for analysis outlined has resulted from the necessity to obtain the maximum information about the components of an illicit diamorphine sample regardless of the minimal amount of material available. The initial examination of the crude material by infrared spectrophotometry is an essential first step because this method of analysis is non-destructive, uses only a small amount of material, and in most instances we have found that it virtually confirms the presence of diamorphine in the sample. Should the infrared spectrum not suggest the presence of the drug, its absence should not be assumed and it would be prudent in this event to continue at least to the thin-layer stage of the procedure.

Our results, with the adaptation to thin-layer of the paper chromatography system of Curry & Powell, parallel those of Haywood & Moss (1968), who, using a similar adaptation but with hand-spread cellulose plates, found that Rf values within a limited range of compounds examined were similar in thin-layer and paper chromatographic systems. Since the Rf values of over 450 alkaloids are recorded for the paper system, the chance of identifying other basic components of an illicit diamorphine sample by use of this more rapid thin-layer adaptation is high. When diamorphine is separated from other contaminants by the thin-layer procedure (and it has been in all our experiments), amounts of 0-5 f ig are readily detected.
We have, in a few cases, found barbiturates in samples. Although their possible presence was indicated from the infrared spectrum of the crude material, their identification was by use of the thin-layer and gas-chromatographic methods of Curry & Fox (1968) and Blackmore & Jenkins (1968) respectively.
A cknowledgementsThanks are accorded to Miss S. C. Watkins and M. G. Ball for technical assist
ance.
Analysis o f illicit diamorphine samples 201
REFERENCESB l a c k m o r e , D . J . & J e n k in s , R. W. (1968). J. forens. Sci. Soc., 8 , 1, 34-37.C l a r k e , E. G. C. (1962). In Methods o f Forensic Science, Editor: Lundquist, F, 1, 1-241.
London and New York : Interscience.C u r r y , A. S. & P o w e l l , H. (1954). Nature, Lond., 173, 1143.C u r r y , A. S. & Fox, R. H. (1968). Analyst, 93, 834.H a y w o o d , P. E. & Moss, M. S. (1968). Ibid., 93, 737-739.N a k a m u r a , G. R. & U k it a , T. (1962). J. forens. Sci., 7, 4, 465-473.N a k a m u r a , G. R. (1966). /. Ass. off. Analyt. Chem., 49, 1086-1090.N a k a m u r a , G. R. (1969). Analyt. Chem., 94, 1124-1126.W r i g h t , C. R. (1874). J. chem. Soc., 27, 1031-1043.

J . P h a rm . P h a r m a c ., 1970, 22, 202-204 R e c e iv e d N o v e m b e r 12, 1969
A note on the determination of dichlorophen and hexachlorophene in mixtures
R . W . D A I S L E Y A N D C . J . O L L I F F
D e p a r tm e n t o f P h a rm a c y , B rig h to n C o lle g e o f T ech n o lo g y , M o u le sc o o m b , B rig h to n 7,S u sse x , U .K .
Dichlorophen and hexachlorophene can be separated and estimated rapidly. Separation was achieved on thin-layer chromatograms using ethyl acetate containing 10% v/v of methanol and silica gel, the appropriate areas for each compound being collected and eluted with methanol. The absorbances of these solutions at 286 and 299 nm respectively were measured and compared with standard curves. Application of the method to several commercial formulations was successful.
The separation from mixtures of dichlorophen and of hexachlorophene has been attempted by Clements & Newburger (1954) who isolated and purified the compounds from a commercial product by extractions and estimated them by ultraviolet absorption. Derry, Holden & Newburger (1961) separated mixtures of p-hydroxybenzoates, dichlorophen and hexachlorophene by partition chromatography followed by spectrophotometric determination. Bravo & Hernandez (1962) claimed to have separated mixtures of dichlorophen and hexachlorophene by thin-layer chromatography using silicic acid and n-heptane saturated with glacial acetic acid. After elution from the plates the isolated compounds were assayed by ultraviolet spectrophotometry. We were unable to reproduce the method of Bravo & Hernandez (1962) so a new chromatographic procedure was devised.
E X P E R I M E N T A L
M a te r ia ls
Dichlorophen (May & Baker, Dagenham) was crystallized once from aqueous methanol and twice from toluene: m.p. 177-8°, E (1%, 1 cm) at 286 nm in methanol solution, 200-0.
Hexachlorophene (R. A. Cripps & Son, Brighton) was crystallized twice from aqueous ethanol and three times from benzene: m.p. 167°, E (1%, 1 cm) at 299 nm in methanol solution, 150-0.
Methanol and ethyl acetate were redistilled.
P ro c e d u re
Glass plates ( 8 x 1 5 cm) were coated with a Merck silica gel PF254 layer, 500 /xm thick, according to Stahl (1956). A known amount (40-100 mg) of dichlorophen and hexachlorophene was dissolved in 10 ml of methanol and 100 p.1 of this solution applied to an activated plate (110° for 30 min) as a streak 1-5 cm from the bottom and sides of the plate using a Hamilton Repeating Dispenser microsyringe.
The chromatogram was run at room temperature (about 22°) using ethyl acetate containing 10% v/v methanol in a glass tank presaturated with the developing solvent until the solvent front was 1 cm from the top of the plate.

D e te rm in a tio n o f d ich loroph en a n d h ex a ch lo ro p h en e 203
The plate was then removed from the tank and dried at 60° for 10 min, and subsequently examined under a short wave ultraviolet lamp, when the substances appeared as dark blue-purple areas against a bright green fluorescent background giving Rf values for dichlorophen of 0-93 and for hexachlorophene of 0-51.
The appropriate areas were scraped off and collected in a ‘thimble’ using a Quickfit T.L.C. Spot Remover and extracted with methanol (40 ml) in a Soxhlet apparatus for 30 min. The resulting methanol solution was cooled to room temperature and adjusted to 50 ml.
The absorbance of the dichlorophen extract was measured at 286 nm and the hexachlorophene extract at 299 nm using a Hilger and Watts Uvispek spectrophotometer, and the values obtained were interpolated in the standard curves.
The reference solution for use in the spectrophotometer was prepared analogously, using silica gel from the same plate.
A s s a y o f c o m m e rc ia l p re p a r a tio n s
Product 1 was an aerosol spray containing dichlorophen 0-25%, hexachlorophene 0-25%, undecenoic acid 2-5%. For this assay, a known amount of the aerosol was collected and the propellant allowed to evaporate, methanol was added and the volume adjusted to give an approximately 1% w/v solution. The sample volume used was 100 p\.
Product 2 was a foot powder containing dichlorophen 0-2%, hexachlorophene 0-5%, sodium polymetaphosphate 4%, light kaolin 20%. Approximately 10 g of the powder was extracted with methanol for 1 h in a Bolton-Revis apparatus, sufficient dichlorophen and hexachlorophene was added and the volume adjusted to give 50 ml of an approximately 1% solution of each component. Sample volume used was 100 ¡il.
Product 3 was a shampoo containing y-hexachlorocyclohexane 0-2% and hexachlorophene 1-0%. 100 p.1 of the shampoo was applied directly to an activatedplate.
R E S U L T S
Ten mixtures containing 5 to llm g/m l of dichlorophen and hexachlorophene were assayed and the deviation % of theoretical was ±1T7% for the dichlorophen and ±1-15% for the hexachlorophene. The assay procedure applied to an aerosol, a foot powder, and a shampoo gave 99-4 and 99-7% of the stated amount of dichlorophen in the aerosol and powder respectively and 101-5, 99-6 and 99-5% for hexachlorophen in the three products.
D I S C U S S I O N
Bravo & Hernandez (1962) used a solvent system consisting of n-heptane saturated with glacial acetic acid, since these are completely miscible, no idea of the composition of their developing solvent could be deduced. Saturation o f the n-heptane with acetic acid B.P. did not lead to the separation of the dichlorophen and hexachlorophene, in fact, the spots hardly moved off the baseline.
Separation was achieved on plates coated with Merck silica gel PF254 using eight solvent systems, most having some disadvantage compared with that chosen: ethyl acetate containing 10% v/v of methanol. Systems containing benzene (95) or toluene (90) with acetic acid (to 100) were held tenaciously on the silica gel after

204 R. W. DAISLEY AND C. J. OLLIFFdevelopment and consequently interfered with the subsequent absorption measurements. On drying the plates after development with those systems and another containing acetic acid 1% v/v, the spots or streaks quickly turned a dark yellow. The system ethyl acetate-methanol 90:10 was the most suitable since both solvents can be obtained pure, are readily volatile and cause no discolouration of the compounds over short periods of time.
Both compounds were determined at their maxima, this being 286 nm for di- chlorophen and 299 nm for hexachlorophene in methanol solution, whereas Bravo & Hernandez (1962) determined both compounds at 290 nm.
R E F E R E N C E S
B r a v o , R. O. & H e r n a n d e z , F. A. (1962). J . C h r o m a t., 7, 1, 60.C l e m e n t s , J. E. & N e w b u r g e r , S. H. (1954). J . A s s . off. a g r ic . C h em ., 37, 190.D e r r y , P. D., H o l d e n , M. & N e w b u r g e r , S. H. (1961). P ro c . s c ie n t. S e c t . T o ile t G o o d s A s s .,
No. 36, 25-28.S t a h l , E. (1956). P h a r m a z ie , 11, 633.

J . P h a r m . P h a r m a c ., 1970, 22, 205-213 R e c e iv e d A u g u s t 19, 1969
The use of boronate derivatives in the characterization of catecholamines and related P-hydroxy-amines by gas liquid
chromatography-mass spectrometryG . M . A N T H O N Y , C . J . W . B R O O K S A N D B . S. M I D D L E D I T C H
Chemistry Department, University o f Glasgow, Glasgow, W.2, U.K.
The gas chromatographic separation of various jS-hydroxy-amines in the form of derived 1,3,2-oxazaborolidines is complemented by a mass-spectrometric study of cyclic boronates of natural catecholamines. These derivatives and their synthetic analogues yield characteristic mass spectra. Closely similar compounds, such as the n-butylboronates of the diastereoisomers (—)-ephedrine and (+)-i/f-ephedrine, give almost identical spectra but can be readily distinguished by their g l c retention times. The same can be said for the positional isomer pairs synephrine and phenylephrine, and for octopamine and 4-deoxynoradrenaline. Mass-spectrometric fragmentation modes are postulated from a comparison of the shifts in the masses of fragment ions corresponding to various substituents in the group of biological amines studied. Additional correlations are derived from studies of methyl-, cyclohexyl- and phenyl- boronates.
Various methods have been published for the separation of ^-hydroxy-amines by gas chromatography ( g l c ) , chiefly in connection with catecholamines and related compounds.
Biological amines of moderate polarity have been separated without prior modification, good resolution being obtained by coating the support with potassium hydroxide (Brochmann-Hansen & Svendsen, 1962; Parker, Fontan & Kirk, 1962; Beckett, Moffat & others, 1967; Beckett, Tucker & Moffat, 1967) or by using high percentages of stationary phase (Zwol, 1966). Other methods usually depend upon the use of derivatives having greatly reduced polarity in order to improve stability and resolution in g l c . Among the modifications described for this purpose are Schiff’s base formation (Brochmann-Hansen & Svendsen, 1962; Beckett, Tucker & Moffat, 1967; Beckett & Wilkinson, 1965); silylation of hydroxyl groups coupled with conversion of the amine to a Schiff’s base or oxazolidine (Clarke, Wilk & others, 1967; Capella & Horning, 1966; Kawai & Tamura, 1967); silylation of hydroxyl groups and primary amino-groups (Sen & McGeer, 1963; Horning, Moss & Horning, 1967); silylation of hydroxyl groups followed by acetylation on the nitrogen atom (Homing, Moss & others 1968); and acetylation of hydroxyl and amino-groups (Brooks & Homing,1964). The formation of trifluoroacetates (Kawai & Tamura, 1968), or the silylation of hydroxyl groups followed by formation of ¿V-heptafluorobutyryl derivatives (Homing & others, 1968), afford products with good electron-capture properties, thus allowing the detection of catecholamines in very small quantities. Many of the above derivatives are of value in mass spectrometry, especially for the more polar hydroxy- amines. The mass spectra of various parent phenethylamines have been studied

206 G. M. ANTHONY, C. J. W. BROOKS AND B. S. MIDDLEDITCH(Teeter, 1966; Reisch, Pagnucco & others, 1968), but have the disadvantage that the molecular ion is of very low abundance in most cases.
Recently we have been examining various cyclic boronates to evaluate their use as derivatives for gas chromatography and mass spectrometry. Among the advantages boronates possess for analytical purposes are (i) the ease of their formation—the reaction taking place in most instances at room temperature without the use of a catalyst; (ii) their selectivity, enabling the proximity of functional groups to be verified ; (iii) their potential value for separating diastereoisomers by glc, as observed with (—)-ephedrine and (+)-i/>-ephedrine (Anthony, Brooks & others, 1969); and (iv) their characteristic mass spectra, usually including molecular ions in appreciable abundance (Brooks, Middleditch & Anthony, 1969). Earlier workers have described the preparative reactions of boronic acids (or their anhydrides) with a variety of bifunctional compounds, including 1,2-diols (Kuivila, Keough & Soboczenski, 1954; Sugihara & Bowman, 1958; Finch & Lockhart, 1962; Bowie & Musgrave, 1963; Ferrier, Prasad & others, 1964; Foster, Haines & others, 1965; Brooks & Watson, 1969) and /3-hydroxy- amines (Pailer & Fenzl, 1961; Pribyl, Louis & Bernstein, 1961), to give cyclic derivatives. Thus catechol readily forms boronates (Fig. la; R = Cl, Bun, Bul, Ph, etc.):
la R lb
Fig. 1. a. General formula of cyclic boronates derived from catechol, b. General formula of cyclic boronates derived from |B-hydroxyphcnethylamines.
similarly the phenylboronate (Fig. lb; R = R' = Me; R" = Ph) of ( —)-ephedrine has been prepared. It was therefore of interest to explore the use of cyclic boronates in the protection of catecholamines for gas chromatography and in their characterization by mass spectrometry. Boronates of various /3-hydroxy-amines, and bisboronates of /3-hydroxy-catecholamines have been prepared. Their glc properties have been found to be satisfactory (Anthony & others, 1969), provided that strongly polar groups are absent. The reactions did not proceed quantitatively under the mild conditions described: the best yields were observed if large substituents were present in the oxazaborolidine ring. Compounds having unsubstituted phenolic groups (e.g. octopamine) gave poorer yields.
E X P E R I M E N T A L
Combined gas chromatography-mass spectrometry was carried out with an LKB 9000 instrument: the ionizing voltage was 70 eV, source temperature 290° and accelerating voltage 3-5 kV. g l c retention data were obtained on a Carlo Erba “Fractovap GB” gas chromatograph with matching silanized glass U-tube columns (6 ft). The stationary phase was 1% OV-17 on Gas Chrom Q (100-120 mesh). n-Alkanes were used as standards.

The n-butylboronates were prepared by treatment of the /3-hydroxy-amine (1 mg), in the form of its free base, hydrochloride, sulphate or tartrate, with n-butylboronic acid (1-1-5 molar equivalents) in pyridine (1 ml) which had been dried and distilled over sodium hydroxide. The free base could be conveniently prepared from the hydrochloride by exposing the pyridine solution of the hydroxy-amine salt to ammonia vapour and separating the precipitated ammonium chloride before derivative formation. For hydroxy-amines, such as isoprenaline sulphate, which were not sufficiently soluble in pyridine, a suitable reaction solvent was dimethylformamide which had been dried by azeotropic distillation with benzene and further distilled over anhydrous sodium sulphate.
In most cases, aliquots of the reaction mixture were injected directly on to the g l c
column. In the reactions involving octopamine and 4-deoxynoradrenaline, cyclic derivatives appeared to be formed in low yield, and vacuum sublimation at 25070-01 mm Hg was used to separate the derivative (in its free-base form) from non-volatile material.
Mass spectrometryThe cyclic nature of boronate derivatives of bifunctional compounds in some cases
directs the mode of mass-spectrometric fragmentation: this is observed for the 2- substituted 1,3,2-oxazaborolidines derived from |8-hydroxy-amines. Although the relative intensity of certain fragments is influenced by the substituent on the boron atom, the general mode of breakdown is the same for the methyl-, n-butyl-, cyclohexyl- and phenyl-boronates studied. The present discussion is concerned mainly with n- butylboronates, which have convenient gas-chromatographic properties (e.g. capacity for resolution of diastereoisomers, combined with moderate retention times). It should be noted that certain ions observed in the mass spectra of n-butylboronates evolve from fragmentation of the n-butyl substituent.
GC-MS o f boronate derivatives o f catecholamines 207
General formula Parent compound SubstituentsR R' R3 R4
/3-Hydroxyphenethy lamine H H H HNorpseudoephedrine Me H H HPhenylpropanolamine Me H H H
Bun R' Pseudoephedrine Me Me H H----T Ephedrine Me Me H H
1 1Octopamine H H H OH4-Deoxynoradrenaline H H OH H
X Synephrine H Me H OHr i i Phenylephrine H Me OH HL X , Normet anephri ne H H OMe OHT V Metanephrine H Me OMe OHR4
Noradrenaline H H Bu"B02
Adrenaline H Me Bun B0 2
Isoprenaline H Pr* Bun B02
3,4-Dihydroxynorephedrine Me H Bun B0 2
Fig. 2. Structural formulae of n-butylboronates of ß-hydroxy-amines.
Fig. 2 shows the general formula of the 2-n-butyl-l,3,2-oxazaborolidines, together with the substituents in the compounds studied.
Postulated representations of the main fragments from the mass spectra of the n- butylboronates of /3-hydroxy-j9-arylethylamines are shown in Fig. 3, and the principal ions observed in the compounds studied are listed in Table 1.

208 G. M. ANTHONY, C. J. W. BROOKS AND B. S. MIDDLEDITCH
* 3
o 2
“ CgCi- CN■o ^VO w cn '
a >-> Si*V«£ H X- vo oo'- "O w 'O w CN CN — CN
Tf w->t 5,00 VO <NO\ CN o 2 © 22 a\ 2 VO M CN i2 00 2 t'~ cn ' co ' Q OO ' Cv vOV w OV \ /f~~
~ ^> scvOOvcNtJ-
> o\ h 9. VO o \C- .z, vo >n oo / X '- ' — CN
- I b I B B b P I ? -oo cN .< + co w in v o ,c>©vocNo o c n j - . — m m r ' ~ O lc ' } c n t ^
«>}s:
£■»—-Si
«■QQ.i£O
“3
«à.
«s:o0
-C)1JC
aS
•§
-O"3
> > x
> 5_0 oo'a n E
I I > > >»n t ì- vo \o ovO cn cn Tf «n*-* i—i ,—1 CN
a x > $
a a > > >
m vo oo Ov vor~~ — — oo co-hi CN _ —
-° _
u > >
o > a a
X =2— CN vo O —■ CN
X> _< £> x> aJ
> > > > >oo vo ov
> >
I I
> >O Sov ©
> > > >
« »-« — OO 00©> OV OV CV CN CN
> >— — CN
Pi oo© «nCN CN
s a x© £ vo ^in vo Tf-1 rt M fN
> > > > a s s > > > l > > I
> >
> > £ £ , > X > > £cn — oovo CN —- N N
> > x x > K I i$ £ > >
X X > S 2cn m
Ili VII
III VII
III VII
VI > VII
VI
CN CN 00 OV t ì- OvCN CN CN — cn
X X > III VII
III VII X a
Ov cvt-cn CN
VOCN 8
cncnr-~CN 8cn
3 C >?—sOvoNov fngcngov m —4) O © — •~~l rr-i —1 vp m Q V ff| Q - * 9 ' " 9 n » t f<1^ ^ l^ V O O Q - E " r - i ^ vfv~ "q ■” CN cn CN rCN 0,CN —, CN 2 <N © CN IÌ CN CN © CN © cn » m f" <*»
&
I E s o e
43aH a Z E
•5 =& 1Q4 S z <
* In
ord
er o
f abu
ndan
ce.

209As can be seen in Table 1, the molecular weight was easily determined in each of the
compounds studied, as a fairly prominent parent ion was obtained in each case. The substituents on C-4 of the oxazaborolidine ring (hydrogen atom or methyl group) can readily be identified by their loss, principally to give ions of type III (Fig. 3). The ratio of 10B to nB in this fragment indicates whether one or two molecules of n-butylboronic acid have been incorporated into the molecule. The nature of the substituents on N-3 (hydrogen atom or a methyl group) can be inferred from the transition IV -> V (Fig. 3) where the group is eliminated as a radical (the exceptional case of the vV-isopropyl derivative, isoprenaline butylboronate, is discussed later).
GS-MS o f boronate derivatives o f catecholamines
♦R. R' R3.R4 ♦R,R'1R3.R4 * R3-r 4
Fig. 3. Postulated representations of the principal fragments from the mass spectrometric breakdown of n-butylboronates derived from j9-hydroxyphenethylamines.
Table 2. GLC retention indices o f n-butylboronates o f ß-hydroxy-ß-arylethy lamines on 1% OV-17
Parent compound /¡-Hydroxy phenethy lamine Norpseudoephedrine Phenylpropanolamine .. Pseudoephedrine Ephedrine Octopamine4-Deoxynoradrenaline ..SynephrinePhenylephrineNormetanephrineMetanephrineNoradrenalineAdrenaline3,4-DihydroxynorephedrineIsoprenaline
Temp. °CRetention
Index140 1799140 1774140 1776140 1782140 1796170 2218170 2203170 2185170 2171190 2315190 2270190 2478190 2438190 2450190 2512

210 G. M. ANTHONY, C. J. W. BROOKS AND B. S. MIDDLEDITCHIn the compounds studied, the substituents on the benzene ring are retained in
fragments of type V, where the hydroxy-amine side-chains are reduced to a common moiety (C2H2N), and of types VI, Via and VIb, which are hydrocarbon fragments. These relatively prominent ions readily indicate the combined molecular weights of the substituents on the benzene ring (cf. Reisch & others, 1968). Certain other fragments arise from the breakdown of hydroxyl and methoxyl substituents on the benzene ring. Thus synephrine gives an ion at m/e = 216 due to loss of -OH. Metanephrine gives a similar ion at m/e = 246 and also one at m/e = 232 due to loss of OMe.
As noted above, the spectra of n-butylboronates contain, sometimes as major ions, fragments dependent on the presence of the n-butyl substituent. Thus, the ion of type X is the base peak in the spectra of /3-hydroxyphenethylamine n-butylboronate, synephrine n-butylboronate and adrenaline bis-n-butylboronate. When this fragment is predominant, the two daughter ions VIII and IX can also be observed. The fragment I appears to arise by loss of Et from the butyl side-chain.
Fig . 4. Mass spectra of n-butylboronates of synephrine and 3,4-dihydroxynorephedrine. Samples were introduced into the mass spectrometer through a 10-ft column packed with 1% OV-17 on Gas Chrom Q. Conditions of measurement were as stated in the Experimental section.
Representative results are depicted in Fig. 4, in which the mass spectra of 3,4- dihydroxynorephedrine bis-n-butylboronate and synephrine n-butylboronate are given and the fragment types indicated.
Isoprénaline n-butylboronate gave only two major fragments. The first (m/e = 328) is presumably due to loss of Me from the isopropyl group on the nitrogen atom. The other predominant peak (m/e = 244) is most likely due to further loss of BunBO (Fig. 5).

GC-MS o f boronate derivatives o f catecholamines 211
m/z = 328 (100 7. ) m / e = 24« (6 67. )
F ig . 5. A postulated fragmentation in the mass spectrometric breakdown o f isoprénaline n-butylboronate.
This transition is verified by a metastable peak at m/e = 181-8.Within the group of compounds studied, substituents in the benzene ring appear to
have little effect on fragmentation, which is accordingly insensitive to positional isomerism in the ring. Consequently, n-butylboronates of octopamine and 4-deoxy- noradrenaline, which have a free phenolic group at the para- and meta-position respectively, cannot be effectively distinguished by their mass spectra. Their retention times are, however, different (Table 2).
Conversely, the n-butylboronates of ephedrine and /3-hydroxyphenethylamine, which cannot be separated under the conditions used, can be detected in the presence of one another by virtue of their different mass spectra. This is illustrated in Table 3, which shows how the peak positions of the two compounds can be located by means of a multiple scanning technique by measuring the heights of the respective base peaks for each scan.
Table 3. The effect o f multiple scanning GC-MS, for a mixture o f ephedrine and ^-hydroxyphene thy lamine as n-butylboronates (10 f t column, 1% O V -\l, 130°).
Retention Index Height of peak (mm) inof scan mass spectrum
m/e = 161 m/e =1784 — 301786 — 741788 1 851791 7 571793 9 301796 9 191798 8 1 0
Gasfiquid chromatographyThe g l c properties of the boronates of -hydroxy-amines (Anthony & others, 1969)
and 1,2- and 1,3-diols (Brooks & others, 1968) have been examined previously in this laboratory. In the series of /3-hydroxyphenethylamines studied, unsatisfactory peaks were obtained in the presence of free phenolic groups, especially for the derivatives of primary amines.
The problem of distinguishing between the diastereoisomers (—)-ephedrine (1R,2S configuration) and (+)-</<-ephedrine (lS ^ S 1 configuration) by g l c has been considered frequently in the literature. The methods so far reported (Brochmann-Hansen & others, 1962; Beckett & others, 1965) have been based on chemical conversion of the

212 G. M. ANTHONY, C. J. W. BROOKS AND B. S. MIDDLEDITCHisomers by reaction with acetone to the corresponding oxazolidines. Although these two hydroxy-amines, as their boronates, cannot be distinguished by mass spectrometry, we have obtained separation of the n-butylboronates by glc with a moderately polar column. The difference in retention behaviour was enhanced by using boronates with substituents bulkier than Bu" on the boron atom. This is illustrated in Table 4.
Table 4. The effect o f different groups on the boron atom (R" in Fig. lb) in resolving the diastereoisomers ephedrine and ¡Jj-ephedrine as their boronate derivatives by GLC
Methyln-Butylt-ButylCyclohexylPhenyl
03 Retention Index (I)
Ephedrine ¿-Ephedrine AI90 1513 1509 4
140 1796 1782 14130 1680 1669 1 1
150 2080 2064 16170 2258 2238 2 0
ConclusionQualitative analysis of catecholamines and related /3-hydroxy-amines after reaction
with n-butylboronic acid is possible by the combined gas chromatography-mass spectrometry technique. The boronic acid reacts under mild conditions both with the /3-hydroxy-amine group to form a 1,3,2-oxazaborolidine ring and with the catechol grouping to form a 1,3,2-dioxaborole ring.
Mass spectrometry gives the molecular weight, indicates the mass of substituents at positions 2 and 4 of the oxazaborolidine ring, and gives the combined molecular weights of substituents on the benzene ring. Diastereoisomers on the oxazaborolidine ring and positional isomers on the benzene ring can be distinguished by GLC by use of a moderately polar stationary phase.
The reaction of n-butylboronic acid with (6-hydroxy-amines as described above is not complete, but occurs without a catalyst. The selectivity of the reagent affords a clear distinction by glc between catecholamines and their methylated analogues (e.g. adrenaline and metanephrine), and between compounds with and without a /3- hydroxy-amine grouping.
A cknowledgementsWe are indebted to the Medical Research Council for a grant supporting this work.
The Carlo Erba gas chromatograph was purchased from a grant by the Scottish Hospital Endowments Research Trust (to C. J. W. B. and Professor T. D. V. Lawrie) and the LKB 9000 instrument from SRC grant B/SR/2398 (to C. J. W. B. and Dr. G Eglinton).
REFERENCESA n t h o n y , G. M ., B r o o k s , C. J. W., M a c l e a n , I. & S a n g s t e r , I. (1969). J. chromât. Sei., 7,
623-631.B e c k e t t , A . H., M o f f a t , A . C., R o w l a n d , M . , T u c k e r , G. T . & W i l k i n s o n , G. R . (1967).
J. Chromat., 30, 199-202.B e c k e t t , A. H., T u c k e r , G. T . & M o f f a t , A. C. (1967). / . Pharm. Pharmac., 19, 273-294. B e c k e t t , A. H. & W i l k i n s o n , G. R. (1965). Ibid., 17, Suppl., 104S-106S.

213Bowie, R. A. & Musgrave, O . C. (1963). J. chem. Soc., 3945-3949.Brochmann-Hansen, E. & Svendsen, A. B. (1962). J. pharm. Sei., 51, 938-941.Brooks, C. J. W. & Horning, E. C. (1964). Analyt. Chem., 36, 1540-1545.Brooks, C. J. W. & Watson, J. (1969). In C. L. A. Harbourn, Gas Chromatography 1968:
Proc. 7th Intern. Symp. Gas Chromatography, Copenhagen, pp. 129-141. London: Institute of Petroleum.
Brooks, C. J. W., Middleditch, B. S. & Anthony, G. M. (1969). Org. Mass Spectrometry, 2, 1023-1031.
Capella, P. & Horning, E. C. (1966). Analyt. Chem., 38, 316-321.Clarke, D. D., Wilk, S., Gitlow, S. E. & Franklin, M. J. (1967). J. Gas Chromat., 5, 307-
310.Ferrier, R. J., Prasad, D., Rudowski, A. & Sangster, I. (1964). J. chem. Soc., 3330-3334.Finch, A. & Lockhart, J. C. (1962). Ibid., 3723-3726.Foster, A. B., Haines, A. H., Inch, T. D., Randall, M. H. & Webber, J. M. (1965). Carbo
hydrate Res., 1, 145-155.Horning, M. G., Moss, A. M. & Horning, E. C. (1967). Biochim. Biophys. Acta, 148, 597-600.Horning, M. G., Moss, A. M., Boucher, E. A. & Horning, E. C. (1968). Analyt. Lett., 1,
311-321.K a w a i , S. & T a m u r a , Z. (1967). Chem. pharm. Bull., Tokyo, 15, 1493-1497.K a w a i , S. & T a m u r a , Z. (1968). Ibid., 16, 699-701, 1091-1094.Kutvila, H. G., Keough, A. H. & Soboczenski, E. J. (1954). J. org. Chem., 19, 780-783.P a i l e r , M. & F e n z l , W. (1961). Monatsh, 92, 1294-1299.Parker, K. D., Fontan, C. R. & Kirk, P. L. (1962). Analyt. Chem., 34, 1345-1346.Pribyl, E. S., Louis, H. & Bernstein, J. (1961). U.S. Pat. 3,137,723.Reisch, J., Pagnucco, R., Alpes, H., Jantos, N. & Möllmann, H. (1968). J. Pharm. Pharmac.,
2 0 , 81-86.S e n , N. P. & M c G e e r , P. L. (1963). Biochim. Biophys. Res. Commun., 13, 390-393.S u g i h a r a , J. M. & B o w m a n , C. M. (1958). J. Am. chem. Soc., 80, 2443-2446.T e e t e r , R. M. (1966). Analyt. Chem., 38, 1736-1740.Zwol, D. E. v a n (1966). J. Chromat., 24, 26-31.
GC-MS o f boronale derivatives o f catecholamines

J . P h a r m . P h a r m a c . , 1970, 22, 214-221 R e c e i v e d M a y 23, 1969
1,2-Disubstituted cyclohexanes as substrates of acetylcholinesterase and muscarinic agents.
A re-investigationJ. B. KAY,*| J. B. ROBINSON, *§ B. COXj AND D. POLKONJAKtlj
* Department o f Pharmacy, and \Department o f Pharmacology, Manchester University,Manchester 13, U.K.
The previously reported high rates of acetylcholinesterase-catalysed hydrolysis of (±)-cis- and (±)-/rans-2-dimethylaminocyclohexyl acetate methiodide (Baldridge, McCarville & Friess, 1955) have been re-investigated, the enantiomers of each geometrical isomer being used. The m-enantiomers were inactive as substrates and the /ra«5-enantiomers were hydrolysed at a very slow rate. These results are confirmed by studies on muscarinic tissue (guinea-pig ileum) in which only a weak stimulatory response was given with the irans-enantiomers (the cw-enantiomers were inactive). With each of the test systems used, the acetylcholine receptor showed an inversion of the “normal” configurational specificity although the enantiomer potency ratio was small, a phenomenon which has been observed in previous reports of inversion of configurational specificity.
Comparative studies of synthetic substrates or inhibitors of the enzyme acetylcholinesterase with their cholinomimetic or cholinolytic activity at the muscarinic receptor have suggested that a close structural similarity exists between the active site of the enzyme and of the muscarinic receptor. Both receptor areas show a marked, and similar, stereoselectivity when interacting with potent asymmetric molecules; for example L(-f-)-acetyl-/3-methylcholine iodide (Beckett, Harper & Clitherow, 1963) and S-(—)-3-acetoxyquinuclidine methiodide (Robinson, Belleau & Cox, 1969) act as substrates for the enzyme and are potent muscarinic agents, whereas their enantiomers are inactive. Similarly, L-(+)-c/'j-2-methyl-4-dimethyl- aminomethyl-l,3-dioxalanmethiodide is the most potent inhibitor of the enzyme and the most potent muscarinic agents of the enantiomeric 2,4-disubstituted 1,3- dioxalans (Belleau & Lacasse, 1964; Belleau & Puranen, 1963; Belleau & Lavoie,1968). [For additional comparative studies see Belleau (1965), Smissman, Nelson & others (1966), Robinson, Belleau & Cox (1969)].
Within this present context, no detailed enzyme kinetic studies (or pharmacological studies) have been performed on (±)-cis-(I) and (±)-?m«^-2-dimethylaminocyclo- hexyl acetate methiodide (II), compounds which are reported to be excellent
Present address: t Thos. Kerfoot & Co. Ltd., Bardsley Vale, Ashton-u-Lyne; § Faculty of Pharmacy, University of Toronto, Toronto, Ontario, Canada; If Department of Pharmacology, University of Sarajevo, Yugoslavia.
O-C O -M e
(I) (II)

215substrates for electric-eel acetylcholinesterase (Baldridge, McCarville & Friess, 1955). Studies of the acetylcholinesterase-catalysed hydrolysis of the latter two substrates have shown that, at their respective optimum substrate concentrations, these compounds are hydrolysed at a slightly faster rate than acetylcholine (at its optimum substrate concentration), the (±)-cw-isomer being the slightly better substrate. This phenomenon has been attributed to a difference in the functional-group separations in the two compounds (N+ to acyl-0 group separation reported as 2-9-3-5A for the trans-isomer and 2-5-2-9A for the ds-isomer, this latter distance more closely approximating to the optimal functional-group separation). However, studies of the conformation of 1,2-disubstituted cyclohexane derivatives make such a view untenable, as, provided the bulky trimethylammonium group does not introduce ring distortion in one of the isomers, the functional group separation should be identical for each isomer (Fig. 1) (approximately 2-9A from Drieding models constructed by the present authors).
Cyclohexanes as substrates o f acetylcholinesterase
H
h - .
O C O I g e
s i , . - N M e 3H " -
H H
v j k
eN M e3
H ' T HH /
H' V
Hs O C O M e
( t ) - c i s -F i g . 1.
( t ) - t r a n s-Thus, before one can adequately discuss any difference in biological activity
between the cis- and trans-isomers (whether interacting with the enzyme or at the muscarinic receptor), it is necessary to know the absolute configuration and biological activity of the individual enantiomers in each pair. The resolution and determination of the absolute configuration of the cis- and trans-2-dimethylaminocyclohexyl acetate methiodide has recently been reported (Kay & Robinson, 1969; Robinson,1970) and the present paper reports the results of studies with the resolved enantiomers as substrates for the enzyme acetylcholinesterase and as stimulants of the muscarinic receptor.
E X P E R I M E N T A L
Substrates o f acetylcholinesteraseBovine erythrocyte acetylcholinesterase (Sigma Chemicals, London) was used
throughout this work. The rates of hydrolysis were measured by the pH-stat method (Alies & Hawes, 1940), with an automatic titrator (type TTTlc) equipped with a recorder (SBR2c) and syringe burette (SBUla) (Radiometer, Copenhagen).
All incubations were carried out in a total volume of 25 ml of enzyme solution previously made 0-04m in MgCl2 and 0-05m in NaCl, in jacketted vessels at 25+ ± 0T° and the pH maintained at 7-4 by the addition of 0-01n NaOH solution. A COa-free nitrogen atmosphere was maintained throughout the experiments. The velocity of the reaction was calculated from the average slope of the recording during the second and third minutes of the incubation.
The results were plotted as Lineweaver-Burk plots (Lineweaver & Burk, 1934) and the Km value for each substrate calculated from the gradient o f the resultant plots.

216 J . B . K A Y , J . B . R O B I N S O N , B . C O X A N D D . P O L K O N J A K
- X I07
Fig. 2. Lineweaver-Burk plot of acetylcholinesterase-catalysed hydrolysis of (± )-!(lS’> 25")-(+)- and (1 jR,2 /?)-(—)-/rani-2 -dimethylaminocylohexyl acetate methiodide.- O - O — (±). —A—A— (lR,2/J)-(-)-. — (lS,2S)-(+)-.
Acetylcholine perchlorate (BDH) was used to standardize the enzyme preparation, which was found to have a Km value of 5.5 X 10⁻⁴ and a Vmax of 2.67 X 10⁻⁶ mol min-1. The results obtained with the synthetic substrates are shown in Fig. 2 and the computed results in Table 1.
Table 1. K m and Fmax values obtained with synthetic substrates
Substrate Km x 104 V m ax X 107 mol min-’Acetylcholine 5-5 26-7(±)-/ra/w-2-Dimethylaminocyclohexyl acetate
methiodide 6 - 8 1-7(15,2S)-(+)-tra«j-enantiomer .. 5-7 M l(\R,2R)-(—)-ira/;i-enantiomer .. 4-9 2 - 1
(±)-c;s-2-Dimethylaminocyclohexyl acetate methiodide Inactive at concentrations
6-5 x 10⁻⁴m to 1-4 x 10_2m
Muscarinic activity-isolated guinea-pig ileum preparationDrugs. Acetylcholine chloride (BDH), atropine sulphate (BDH), hexaméthonium
bromide (Vegolysen) (M & B), histamine acid phosphate (BDH), 5-hydroxytryptamine creatinine sulphate (Koch-Light), mepyramine maleate (M & B), methysergide bimaleate (Sandoz) and nicotine hydrogen tartrate (BDH).
Guinea-pig ileum (3 cm lengths) was suspended in Krebs solution (10 ml) maintained at 36 ± 0-2° and gassed with 5% carbon dioxide in oxygen. Isotonic contractions of the ileum were recorded on a kymograph with a magnification of 8 to 1 and a load on the tissue of 500 mg. Agonist drugs were added to the tissue bath on a3-min dose cycle. Antagonist drugs, when present, were allowed to equilibrate with the ileum for 15 min before addition o f any agonist drug. All drug concentrations referred to in the text are expressed as the final bath concentration (mol).

Cyclohexanes as substrates o f acetylcholinesterase 217RESULTS
(+)-crs-2-Dimethylaminocyclohexyl acetate methiodide was inactive as a muscarinic agent at all the concentrations used. Dose-response curves on the guinea-pig ileum were obtained for acetylcholine, (±)-trans- and (1 J?,27?)-(—)-/ra«j-2-dimethyl- aminocyclohexyl acetate methiodide (Fig. 3 a, b and c respectively). However, the (15,25')-(+)-tra«i'-enantiomer (Fig. 3d) showed only a low activity and a concentration of 8 X 10“4mol produced a contraction which was less than 50% of the acetylcholine maximum. Of the three effective agonists, acetylcholine was the most potent (1-3 x 10⁻⁸ to 1-6 x 10 6 mol). The (lf?,27?)-(—)-/rans-2-dimethyl- aminocyclohexyl acetate methiodide (1-5 x 10“6 to 4-0 x 10_4mol) in the example shown, was four times more potent than the (±)-tra»s-2-dimethylaminocyclohexyl acetate methiodide (6T x 10-6 to 1-6 x 10_3mol).
F ig . 3. Dose-response curves on the guinea-pig ileum. The (lS^SM+Hraiw-enantiomer has only a low activity, 8 x 10- 4 mol producing a contraction less than 50% of the acetylcholine maximum. # , Acetylcholine; ■ , irans-2-dimethylaminocyclohexyl acetate.
The effect of atropine on the contraction of the guinea-pig ileum produced by either acetylcholine, (±)-compound or the (1 Æ,2Æ)-(—)-/ra«.s,-enantiomer is shown in Fig. 4. Atropine in a concentration of 1 X 10~9 mol had a similar inhibitory effect on the contractions produced by all three agonists.
Hexaméthonium, in a concentration of 9-9 X 10_6mol, which produced marked inhibition of the nicotine-induced contraction, was without effect on the contraction produced by the ira«s-racemate.
Mepyramine (concentration 3-5 X 10⁻⁵ mol) produced marked inhibition of the histamine-induced response and methysergide (IT X 10_6mol) reduced the 5- hydroxytryptamine-induced response of the guinea-pig ileum, but these inhibitors were without effect on the contraction produced by (±)-?ra«i-2-dimethylamino- cyclohexyl acetate methiodide.

218 J. B. KAY, J. B. ROBINSON, B. COX AND D. POLKONJAKA maximum contraction of the ileum produced by acetylcholine (5-1 X 10 5 mol
was not modified by any of the antagonists used.
F ig . 4 . T h e e ffe c t o f a t ro p in e o n th e c o n t r a c t io n o f th e g u in e a -p ig i le u m p ro d u c e d b y e ith e r a c e ty lc h o lin e , ( ± ) - c o m p o u n d o r th e ( l i? ,2 /? ) - ( — ) - ir a n j- e n a n t io m e r . A t r o p in e 1 x 10 -9 m o l h a d a s im ila r e ffe c t o n c o n t ra c t io n s p ro d u c e d b y a l l th re e a g o n is ts . # , A c e ty lc h o l in e ; ■ , t r a n s -
2-d im e th y la m in o c y c lo h e x y l a c e ta te m e th io d id e .
DISCUSSIONThe first and most striking observation to be made o f the present work is that
the acetylcholinesterase-catalysed hydrolysis rates of (±)-cis- and (±)-trans-2- dimethylaminocyclohexyl acetate methiodide are very different from previous reports (Baldridge & others, 1955). In the present work the (+)-c;.?-isomer was not hydrolysed by the enzyme and the (rt^-irani-isomer was a very poor substrate for the enzyme, whereas it was previously reported that both the geometrical isomers were hydrolysed at a velocity greater than that of acetylcholine at their respective optimum substrate concentrations.
There are however, certain differences in the experimental conditions employed in the present work which should be noted:
(i) Previous work (Baldridge & others, 1955) was performed on acetylcholinesterase which had been extracted from the brain tissue of electric eel (Electrophorus electricus). The enzyme used in the present work was a commercial enzyme isolated from ox erythrocytes and although the two enzyme preparations are considered to be very similar (Km values for the two enzyme preparations with acetylcholine as substrate, are identical within experimental error), the present authors know of no reports where the two enzyme preparations have been subjected to rigorous comparative studies with synthetic substrates and inhibitors of preferably a rigid/semi-rigid structure.
(ii) The medium used in the present experimental work differs in the concentrations of magnesium chloride and sodium chloride from that reported by Baldridge & others (1955). It has previously been reported (Friess, Wilson & Cabib, 1954) that the activity of electric-eel acetylcholinesterase is dependent upon the concentration of magnesium ions and more recently Changeux (1966) has shown that the

219degree of inhibition of acetylcholinesterase (isolated from Torpedo marmorata) by certain inhibitors can be decreased up to 250 times by the addition o f magnesium ions. These differences in activity of the enzyme and inhibitor-sensitivity of the enzyme to varying concentrations of magnesium ion have been ascribed to reversible aggregation-deaggregation phenomena with higher polymeric forms of the enzyme predominating at low ionic strength (Changeux, 1966). However, assuming that acetylcholinesterase isolated from different sources is identical, it would be surprising if a small change in magnesium ion concentration could change a compound from behaving as an extremely good substrate (i-c/s-isom er) (Baldridge & others, 1955) to having no activity as a substrate whatsoever, especially when acetylcholine was hydrolysed rapidly under both conditions.
The active site o f the enzyme does show some slight degree of stereoselectivity towards the enantiomers of iranj-2-dimethylaminocyclohexyl acetate methiodide, the (lR,2R)-(—)-enantiomer being a slightly better substrate than the (±)-compound and (15,25)-(-)-)-enantiomer.
If it is accepted that there is a structural similarity between the enzyme “active site” and the muscarinic receptor (and considerable evidence has accumulated recently to substantiate this hypothesis, see Belleau & Puranen, 1963, Belleau & Lacasse, 1964, Belleau, 1965, Belleau & Lavoie, 1968, Robinson & others, 1969), then a similar pattern of activities should emerge when the above compounds are tested as muscarinic agents. The (+)-c«-2-dimethylaminocyclohexyl acetate methiodide was, in fact, found to be inactive as a muscarinic agent and the (±)-tra«j-isomer to be only weakly active.
A similar pattern of stereoselectivity to that displayed by the enzyme is also shown by the muscarinic receptor, the (lR,2R)-(—)-iran.y-enantiomer being about four times more potent than the racemate, and the (15',25)-(+)-iranj-enantiomer being unable to elicit a maximal contraction of the guinea-pig ileum preparation even at a concentration of 8 x 10⁻⁴ mol. Thus, the enzyme-catalysed hydrolysis rate studies are substantiated by the low activity displayed by the above compounds towards muscarinic tissue and by the similar pattern of stereoselectivity shown within the two test systems. The only previous report of pharmacological studies with these compounds has shown that (±)-c«-2-dimethylaminocyclohexyl acetate methiodide, at a concentration 1000 times that of acetylcholine, was unable to elicit a response from the frog rectus preparation (Fellman & Fujita, 1962). The absence of any nicotinic activity in either the cis- or irans-isomers has been demonstrated in the present work employing guinea-pig ileum tissue.
A second important feature of the present work comes from a more detailed consideration of the stereoselectivity of the enzyme and muscarinic receptor towards the enantiomers of rrans-2-dimethylaminocyclohexyl acetate methiodide. As can be seen from Table 1 and from the pharmacological results, the more active enantiomer has the (lR,2R)-iran.s-configuration. Previous work has shown that, of compounds displaying a high degree of stereoselectivity at either the acetylcholinesterase “active site” or on the muscarinic receptor, the enantiomer having the L(5)-configuration is the most active, e.g., L(5)-(+)-acetyl-j8-methylcholine (III) (Beckett & others, 1963), l(2S,3R,55^-(+)-muscarine (IV) (Hardegger & Lohse, 1957, Gyermek & Unna, 1958), L(2S,4R)-(+)-ds-2-methyl-4-dimethylaminomethyl-1,3-dioxalanmethohalide (V) (Belleau & Puranen, 1963, Belleau & Lacasse, 1964),S-(—)-3-acetoxyquinuclidine methiodide (VI) (Robinson & others, 1969).
Cyclohexanes as substrates o f acetylcholinesterase

220 J. B. KAY, J. B. ROBINSON, B. COX AND D. POLKONJAKM e H
:i V ' ffl/ C \ y c \ / / NMe3
M e O'
I I I
CH2
H O ,. M e \
H''
H
C H 2\ © NMe3
\ H
IV
M e ,
H H
V
„ M e H0 \ /
/ \ / CH2~ C m / 0
\ ®' N M e 3
V I I I V I I
Some examples of “inversion” of configurational specificity have been reported however, although in such cases the difference in activity between enantiomers is usually very small. For example, d(2R,5R)-(—)-muscarone (VII) is approximately three times more potent than its enantiomer on muscarinic tissue (Gyermek & Unna,1960). D(i?)-(+)-acetyl-a-methylcholine (VIII) is approximately eight times more potent than its enantiomer on muscarinic tissue (guinea-pig ileum) and both enantiomers show similar rates of hydrolysis by the enzyme acetylcholinesterase (Beckett & others, 1963).
These general conclusions are supported within the present work, where, although an inversion of stereoselectivity is shown by both the acetylcholinesterase “active site” and the muscarinic receptor, there is only a small difference in potency between enantiomers. No attempt is made at this time to explain the phenomenon.
Finally, mention should be made of the studies on the isomeric 3-trimethyl- ammonium-2-acetoxy-iranv-decalin halides (IX to XII), although comparison of the results obtained with the results reported in the present paper is difficult due to the large differences in experimental conditions employed (Smissmann & others, 1966).
t ^ ^ C0MeN M e 3
IX
® N M e 3
CO M e
O -C O M e
N M e 3
XO C O -M e
X I X I I
Using electric-eel acetylcholinesterase, it was found that compounds IX and X were inactive as substrates for the enzyme, that compound XI was hydrolysed only very slowly (approx. 1/500th of the rate of acetylcholine under identical concitions) and that compound XII was hydrolysed by the enzyme at a faster rate (^th of the rate of acetylcholine), all compounds being tested as racemates.
It was thus suggested that a /rans-diaxial arrangement of the functional groups presents the closest approximation to the conformation of enzyme-bound

Cyclohexanes as substrates o f acetylcholinesterase 221
acetylcholine (Smissmann & others, 1966). However, the above enzyme-catalysed hydrolyses were performed at only one substrate concentration (9-9 /xmol-ml-1) at pH 6-6 and an unrecorded temperature. Repeating the above studies over a wide concentration range and at a pH more closely approximating to physiological pH may well give a very different indication of the conformation required for optimal rates of enzyme catalysed hydrolysis.
Alternatively, it may be suggested from the above results employing ira/is-decalin derivatives, that the /ra«.y-2-dimethylaminocyclohexyl acetate methiodide enantiomers may be interacting with the active site in the tm«^-diaxial conformation.
However, simple calculations, based on the assumption of the additivity of conformational free-energy values of the substituent groups, suggest that the free- energy difference between the two conformations is approximately 24-3 kJ mol-1 (5800 cal mol-1) in favour of the di-equatorial conformation.
The free energy of binding associated with a series of substrates and inhibitors of acetylcholinesterase is essentially constant at 17-57 ± 2-5 kJ mol-1 (4200 — 600 cal mol-1) (Belleau & Lavoie, 1968). Thus, since the conformational free energy difference between the two lowest energy conformations of /ra«i-2-dimethylamino- cyclohexyl acetate methiodide is not exceeded by the free energy of binding to the enzyme, it would be dangerous, in the absence of accurate experimental data of the free-energy difference between conformations, to postulate the binding of the trans- diaxial conformation to the enzyme. Indeed, it would be more reasonable to assume that the presence of the additional carbocyclic ring in the trans-decalin series, with the consequent possibility of additional hydrophobic bonding occurring with the enzyme surface, has significantly influenced the stereochemical requirement for binding to the enzyme.
A l l e s , G. A. & H a w e s , R. C. (1940). J. biol. Chem., 179, 543-559.B a l d r i d g e , H. D., M c C a r v il l e , W. J. & F r ie s s , S. L. (1955). J. Am. chem. Soc., 77, 739-741. B e c k e t t , A. H., H a r p e r , N. J. & C l it h e r o w , J. W. (1963). J. Pharm. Pharmac., 15, 362-371. B e l l e a u , B. (1965). In Advances in Drug Research, Vol. 2, pp. 89-126. Editors: Harper,
N. J. & Simmonds, A. B. London and N.Y. : Academic Press.B e l l e a u , B . & L a ç a s s e , G. (1 9 6 4 ) . / . mednl Chem., 7 , 7 6 8 -7 7 5 .B e l l e a u , B . & L a v o ie , J . L . (1 9 6 8 ) . Can. J. Biochem., 4 6 , 1 3 9 7 -1 4 0 9 .B e l l e a u , B. & P u r a n e n , J. (1963). J. mednl Chem., 6 , 325-328.C h a n g e u x , J.-P. (1966). Molec. Pharmac., 2, 369-392.F e l l m a n , J. H. & F u j i t a , T. S. (1 9 6 2 ) . Biochim. Biophys. Acta, 56, 2 2 7 -2 3 1 .F r ie ss , S . L . , W il s o n , I. B . & C a b ib , E . (1 9 5 4 ) . J. Am. chem. Soc., 76, 5 1 5 6 -5 1 5 7 .G y e r m e k , L. & U n n a , K. R. (1 9 5 8 ) . Proc. Soc. exp. Biol. Med., 98, 8 8 2 -8 8 5 .G y e r m e k , L. & U n n a , K. R. (1960). J. Pharmac. exp. Ther., 128, 30-36, 37-40.H a r d e g g e r , E. & L o h s e , F. (1957). Helv. chim. Acta, 40, 2383-2389.K a y , J. B. & R o b i n s o n , J. B. (1969). J. chem. Soc. (c), 248-252.L i n e w e a v e r , H. & B u r k , D. (1934). J. Am. chem. Soc., 56, 658-666.R o b i n s o n , J. B. (1970). J. Pharm. Pharmac., 22, 222-223.R o b in s o n , J . B ., B e l l e a u , B . & C o x , B . (1 9 6 9 ) . J. mednl Chem., 12, 8 4 8 -8 5 1 .S m is s m a n , E. E., N e l s o n , W. L., L a P i d u s , J. B. & D a y , J. L. (1966). Ibid., 9, 458-465.
9
O C O -M e
R E F E R E N C E S

J. Pharm. Pharmac., 1970, 22, 222
LETTERS TO THE EDITOR
The absolute configuration of iraws-2-dimethylaminocyclohexyl acetate methiodide: chemical verification
In a recent paper in this series (Kay & Robinson, 1969), the absolute configuration of (—)-cw-2-methylaminocyclohexanol, (—)-cA-2-dimethylaminocyclohexyl acetate methiodide and (—)-c/s-2-dimethylaminocyclohexyl benzoate methiodide was established as {\R.2S) by unambiguous synthesis from (LS',2 /?)-(—)-m-2-hydroxycyclo- hexanecarboxylic acid. The fact that both (—)-trans- and (—)-c/s-2-dimethylamino- cyclohexyl benzoate methiodide displayed plain negative optical rotatory dispersion curves in the region 600-280 nm led us to suggest that these compounds have the same absolute configuration at C-l. Thus, (—)-ira«s-2-dimethylaminocyclohexyl benzoate methiodide [and from the synthetic routes employed (—)-/ra«s-2-dimethylamino- cyclohexyl acetate methiodide] has the (17?,2i?)-configuration. However, the absence of an established “octant rule” relating the ord spectrum of a compound containing an aromatic chromaphore to its absolute configuration (for reviews see Crabbe, 1967; Crabbe & Klyne, 1967), together with the fact that one is dealing here with a non-rigid compound (see Martin-Smith, Smail & Stenlake, 1967), requires the use of chemical methods to unambiguously establish the absolute configuration of the enantiomers of the trans-series. The present paper thus reports the conversion of (lS',2R)-(—)-c/s-2-hydroxycyclohexanecarboxylic acid (I) to (—)-tra«5-2-methyl- aminocyclohexanol (VI) by the route shown.
A sample of partially resolved (—)-cw-2-hydroxycyclohexanecarboxylic acid (I) (optical purity 38%) was converted to (—)-iran.s-2-hydroxycyclohexanecarboxylic acid (II) by a previously reported method (Febrer, Gomis & Pascual, 1964). The product was separated from unreacted ( —)-d.?-isomer by column chromatography of the methyl esters on alumina (Peter Spence, Type H, 100-200 mesh); initially light petroleum (b.p. 30-40°) was used followed by light petroleum (b.p. 30-40°) containing increasing amounts of solvent ether as eluent. Evaporation of each fraction and examination of the residue by infrared* spectroscopy and gas-liquid chromatography! showed that the initial fractions contained a mixture of (-)-c is - and ( - )-trans- isomers, whereas the later fractions contained only methyl (—)-i/ms-2-hydroxycyclo- hexanecarboxylate (III), b.p.10 = 107-108° (optical purity 38%) (Faixat, Febrer & Pascual, 1961).

223The methods employed for the conversion of methyl (—)-tranj-2-hydroxycyclo-
hexanecarboxylate (III) via the (—)-hydrazide (IV) and cyclic urethane (V) to (—)-/rans-2-methylaminocyclohexanol (VI) (optical purity 20%) were as reported for analogous reactions on the co-enantiomers (Kay & Robinson, 1969).
The final product (—)-/ra«s-2-methylaminocyclohexanol (VI) had a infrared spectrum identical to that of an authentic sample of the racemate prepared by the addition of methylamine to cyclohexene oxide (Kay & Robinson, 1969). Thus, ( —)-tranj-2-methylaminocycIohexanol has the (lR,2R)-configuration (this result is not invalidated by the use of only partially resolved materials, as none of the reagents or solvents used was asymmetric), and as the conversion of this compound to ( —)- trarts-2-dimethylaminocyclohexyl benzoate methiodide and (—)-irans-2-dimethyl- aminocyclohexyl acetate methiodide has been previously reported, it follows that these compounds also have the (lR,2R)-configuration. These results agree with the earlier assignment made from the comparison of the ord spectrum of (lR,2S)-(—)- c/s-2-dimethylaminocyclohexyl benzoate methiodide with that of (-)-trans-l- dimethylaminocyclohexyl benzoate methiodide (Kay & Robinson, 1969).
It has previously been suggested that both (±)-cis- and ( ±)-/rani-2-dimethyl- aminocyclohexyl acetate methiodide are good substrates for the enzyme acetylcholinesterase (Baldridge, McCarville & Friess, 1955). It now becomes possible to discuss the activity of each enantiomer when acting as a substrate for the enzyme or as a muscarinic agent in relation to the known stereospecificity patterns exhibited by the active site of the enzyme and the tissue receptor (Kay, Robinson & others,1970).
Department o f Pharmacy, J. B. R obinson}Manchester University,Manchester 13, U.K.July 14, 1969
+ Present address: Faculty of Pharmacy, University of Toronto, Toronto 5, Ontario, Canada.* Characteristic absorptions were shown in the region 800-1000 cm- 1 (liquid film). Methyl
(—)-ci'i-2-hydroxycyclohexanecarboxylate: v max 830, 850, 875 (sh), 895, 925, 975, 988 cm-1; methyl (•—)-/ra«.s-2-hydroxycyclohexanecarboxylate: vmax 845, 860, 870, 895 (sh), 905, 952, 960 and 985 cm-1.
t 6 feet x I inch stainless steel column containing Silicone gum rubber E301 (2-5%) on Chromasorb G AW-DMCS (97-5%), N 2 carrier gas at 19 lb/inch2, column temperature 110°, injector temperature 275°, detector temperature 80°. Retention time, c/j-isomer 7-4 min, trans- isomer 8-4 min.
R E F E R E N C E S
Ba ldridge , H. D., M cC arville, W. J. & F riess, S. L. (1955). J. Am. chem. Soc., 77, 739-741. C rabbe, P. (1967). In Topics in Stereochemistry, Editors: Eliel, E. L. & Allinger, N. L., Vol. 1,
93-198, N.Y.: Interscience.C r a b b e , P. & K lyne, W. (1967). Tetrahedron, 23, 3449-3503.F aixat, A., F ebrer, A. & P ascual, J. (1961). An. R. Soc. esp. Fis. Qulm., 57B, 705-710. F ebrer, A., G omis, P. & P ascual, J. (1964). Ibid., 60B, 671-674.K ay, J. B. & R obinson , J. B. (1969). J. chem. Soc. (c), 248-252.K ay, J. B., R obinson , J. B., Cox, B. & P o lk on jak , D. (1970). J. Pharm. Pharmac., 22, 214-221. M artin-Sm ith , M ., Smail, G. A. & Stenlake, J. B. (1967). J. Pharm. Pharmac., 19, 561-589.
letters to the editor, J. Pharm. Pharmac., 1970, 22, 223

224Determination o f pharmacokinetic parameters for urinary excretion o f sulphafurazole under normal and controlled
alkaline urine conditionsPharmacokinetic parameters for sulphafurazole have been calculated from urinary excretion evidence (Nelson & O’Reilly, 1960) and blood concentration figures (Biinger, Diller & others, 1961) under normal urine conditions, and under controlled acid and alkaline urine conditions from blood concentration estimations (Dettli & Spring, 1966). In our experiments the drug was administered under both normal urine conditions and after an alkali load so as to eliminate diurnal fluctuations in the urinary pH over a period of 48 h and thus examine the effect of these urine conditions on the rate and other constants involved in the urinary excretion of sulphafurazole. The kinetic data was obtained by using the model and differential equations described by Nelson & O’Reilly (1960).
The drug was administered in the form of compressed tablets of which a representative sample was found to contain 101-50% of label claim. Alkaline urine conditions were maintained by ingesting approximately 4 g of sodium bicarbonate 1-5 h before the tablets were taken, followed by 4 g at 3 hourly intervals. One g of drug was administered on a fasting stomach to three healthy male subjects, and no ingestion of food was allowed until at least 2 h after the tablets had been taken. Urine samples were collected hourly for the first 6 h, and thereafter at increasing intervals up to 48 h. Treating the zero-hour sample as a blank, the specimens were assayed for free and total sulphafurazole by the Bratton & Marshall (1939) method. All hydrolysable conjugates were regarded as acetylated drug.
The computed rate and other constants involved in the acetylation and excretion of sulphafurazole are listed in Table 1. F, A and T are the percentages of free, acetylated, and total sulphafurazole respectively, excreted in 48 h. PA is the percentage acetylation, based on the total amount of drug excreted. The theoretical curves, defined by the equations quoted, for subject A are given in Figs 1 and 2. The experimental values are in close agreement with those computed from the equations. This is evident from the fact that most of the experimental data points lie on the computed curves.
As was to be expected, the controlled alkaline urine conditions have a marked effect on the elimination of sulphafurazole. The elimination half-life is reduced from a mean 6-3 h under normal urine conditions to a mean 4-4 h under alkaline urine conditions. The former figure is practically the same as the 6-4 h calculated from the data of Nelson & O’Reilly (1960) for four subjects over a 72 h excretion
Table 1. Parameters for urinary excretion o f sulphafurazole under normal and controlled alkaline urine conditions by human test subjects
letters to the editor, J. Pharm. Pharmac., 1970, 22, 224
ParameterNormal urine conditions
Subject*Alkaline urine conditions
Subject*A (33-64) B (34-82) L (31-77) A (33-64) B (34-82) L (31-77)
k, (h-* 0-0382 0-0395 0-0394 0-0388 0-0481 0-0376k2 (h-q 0-0925 0-1914 0-1152 0-0953 0-1710 0-1257k3 (h-1) 0-0695 0-0729 0-0699 0-1134 0-1173 0-1173K (h-1) 0-1077 0-1124 0-1093 0-1522 0-1654 0-1549F (%) t 50-85 51-51 59-18 63-82 62-04 73-74A (%) 26-53 27-64 32-47 2 1 - 2 1 25-42 23-35T (%) 77-39 79-15 91-65 85-03 87-46 97-09PA (%) 34-28 34-92 35-43 24-94 29-06 24-05t50 (h) 6-43 6-16 6-34 4-55 4-19 4-47
* Within parentheses following the subject’s initial are shown respectively, age, and weight in kg. t For definition see text above.

letters to the editor, J. Pharm. Pharmac., 1970, 22, 225 225
1000
800 bXa>
600 a
¿00
200 -B
E3u
Fig. 1. Computed curves and experimental data points (O, 0 ) for urinary excretion of sulpha-furazole for subject A under controlled alkaline urine conditions. ----- Free drug. —O — Freedrug (cumulative).------Acetylated drug. — 0 — Acetylated drug (cumulative).
Fig. 2. Computed curves and experimental data points ( O , # ) for urinary excretion of sulpha-furazole for subject A under normal urine conditions. ----- Free drug. —O — Free drug(cum ulative).------Acetylated drug. — 0 — Acetylated drug (cumulative).
period. These elimination half-life periods also correlate well with both the 4-7 h at a urinary pH of 8 and the 9-5 h at a urinary pH of 5 that were found by Dettli & Spring (1966) from blood level data, and the average of 6T h under normal urine conditions that was found by Biinger, Diller & others (1961) also from blood level data. Similarly the percentage of drug acetylated is reduced from an average of 34-9 to 26-0% while the percentage of total drug excreted is increased from a mean 82-7% under normal urine conditions to a mean 89-9% under alkaline urine conditions.
We wish to thank the Council for Scientific and Industrial Research for financial aid in this study.
Department o f Pharmaceutics, A. P. G oossensPotchefstroom University for C.H.E., M. C. B. van OudtshoornPotchefstroom, South Africa.October 16, 1969

226 letters to the editor, J. Pharm. Pharmac., 1970, 22, 226R E F E R E N C E S
B r a t t o n , A. C. & M a r s h a l l , E. K., Jr. (1939). J. biol. Chem., 128, 537-550.B ü n g e r , P., D il l e r , W., F ü h r , J. & K r ÜGER-Th ie m e r , E. (1961). Arzneimittel-Forsch., 11,
247-255.D e t t l i , L. & S p r i n g , P. (1966). In: Physico-Chemical Aspects o f Drug Action. Editor: Ariens,
E. J. Vol. 7, pp. 5-32, Oxford: Pergamon.N e l s o n , E. & O ’R e il l y , I. (1960). J. Pharmac. exp. Ther., 129, 368-372.
Plasma protein binding o f tricyclic antidepressive drugsIt has been shown (Yates, Todrick & Tait, 1964) that tricyclic antidepressive drugs inhibit the uptake of 5-hydroxytryptamine (5-ht) by human blood platelets. We have examined the effects of imipramine, chlorimipramine, desipramine and trimi- pramine on this system both in plasma and in protein-free physiological medium (Cooley & Cohen, 1967). The concentrations of the more potent inhibitors used are similar to those found in the plasma of patients on therapeutic dosage.
The results in Fig. 1 show that the platelets in the protein-free medium are more sensitive to the inhibiting action of the drugs than those in plasma. Statistical analysis shows that the slope of the two inhibition (%) : concentration curves for each drug are not significantly different; this permits calculation of the potency ratios between the two media (Finney, 1964). It also suggests that the drug-induced inhibition of uptake of 5-ht by platelets in plasma and buffer is due to the same phenomenon. Furthermore, if the drug-induced inhibition of uptake by the platelets is reduced in the presence of plasma because of pharmacological inactivation of the drugs by protein binding, it allows an assessment of the “percentage free drug” to be calculated. (An alternative explanation, that the treatment which the platelets had received has in some way damaged them and increased their sensitivity, is not supported by evidence since the endogenous platelet 5-ht concentrations and uninhibited uptake remain substantially unaltered on transfer from plasma to buffer.) The “percentage free drug” and the values for the inhibitory potencies in each medium are given in Table 1; also included are figures from a previous investigation (Todrick & Tait, 1969). The inhibitory potencies are expressed as the negative logarithms of the concentration of the drug which causes 50% inhibition of 5-ht uptake (pI50). Our results for “percentage free drug” are within the fairly wide range of results reported by other workers using ultrafiltration and dialysis techniques [Borga, Azarnoff & Sjoqvist, 1968; Bickel & Weder, 1968; Crammer (personal communication) finds approximately 20% free imipramine]. This suggests that these drugs are inactive when bound to plasma protein but proof of this point awaits definitive physico-chemical studies.
Table 1. Calculated “percentage free drug” values and inhibitory potencies in plasma or buffer for four tricyclic antidipressive drugs
pI50
Percentage free drug (with 95% fiducial Buffer Plasma
Plasma (75%)
(Todrick &Drug limits) medium (75%) ta it, 1969)
Imipramine .. 23-8 (18-5-30-4) 6-56 5-94 5-71Desipramine .. 27-0 (23-5-30-8) 5-63 5-05 5-02Chlorimipramine .. 8-4 (7-4—9-6) 7-74 6 - 6 8 6-50Trimipramine .. 15-7 (12-8-18-8) 4-88 4-06 3-92
The composition of the buffer medium (Cooley & Cohen, 1967) was (mmol litre-1) : Na+ 142, K+ 5, Mg++ 0-29, phosphate 45, pH 7-6, glucose 5-5.
Blood was taken from a large group of healthy volunteers.

letters TO the editor, J. Pharm. Pharmac., 1970, 22, 227 227
F i g . 1. Inhibition o f 5 - h t uptake by platelets. Incubation o f platelets was with 5 -h t 1 /¿g/ml a t 37° in 75% plasma ( O), in phosphate buffer ( x ). Drugs tested were imipramine —-—, desipramine - - -, chlorimipramine---------- , trimipramine - • -
In this group of drugs, there is a 400-fold range in inhibitory potency in respect of5-ht uptake but only a three-fold range in our assessed “percentage of free drug” (8-4—27%). Such potency differences cannot therefore be adequately explained in terms of differing percentages of free drug (an idea advanced by Borga & others(1968) as a possible explanation of species differences in sensitivity to drugs of this class). Furthermore, the most potent drug is apparently the most strongly bound to proteins and the least potent drug is the next most strongly bound.
It must be concluded that the differences in potency in this group of drugs depends more on their individual molecular structure than on their degree of binding to circulating proteins. The potency ranking reported here is identical with that found by Carlsson, Corrodi & others (1969) in studies on rat brain hydroxytryptaminergic neurons.
Acknowledgements. The authors are indebted to Dr. A. C. Tait for advice and encouragement, also to Drs. J. L. Crammer and B. Herrmann for helpful criticism of the text. This study was supported by a grant from Geigy (U.K.) Ltd., and by the continued loan of an Aminco-Bowman Spectrophotofluorometer from the Scottish Hospital Endowments Research Trust (Grant No. 111).
Department o f Clinical Research, Iain C. CampbellCrichton Royal Hospital, A rchibald TodrickDumfries, U.K.December 4, 1969
REFERENCES
B i c k e l , M. H. & W e d e r , H. J. (1968). Archs int. Pharmacodyn. Ther., 173, 433-463.B o r g ä , O., A z a r n o f f , D. L. & S jö q v is t , F. (1968). J. Pharm. Pharmac., 20, 571-572. C a r l s s o n , A., C o r r o d i , H., F u x e , K. & H ö k f e l t , T. (1969). Europ. J. Pharmac., 5, 357-366. C o o l e y , M. H. & C o h e n , P. (1967). J. lab. clin. Med., 70, 69-79.F i n n e y , D. J. (1964). Statistical Methods in Biological Assay, 2nd edn. London: Griffin. T o d r ic k , A. & T a it , A. C. (1969). J. Pharm. Pharmac., 21, 751-762.Y a t e s , C. M., T o d r ic k , A. & T a it , A. C. (1964). Ibid., 16, 460-463.

228 letters TO the editor, J. Pharm. Pharmac., 1970, 22, 228The release and detection o f bronchoactive substances
by serially perfused isolated lungsA residual increase in air overflow volume during anaphylaxis of the Konzett Rossler preparation of guinea-pig lungs in vivo occurred after pretreatment of the animal with antagonists of histamine, 5-hydroxytryptamine (5-ht), the Hounslow preparation of slow-reacting substances in anaphylaxis (SRS-A-H), and bradykinin (Collier & James, 1967). This increase was intensified by blockade of ^-receptors for adrenaline and was not prevented by destruction of the central nervous system. That papaverine lessened the residual effect suggested that it was wholly or partly due to bronchoconstriction. Suggested mechanisms, by which this residual broncho- constriction might occur, included the failure of the antagonists used to suppress a known humoral factor and the release of an unidentified factor not susceptible to these antagonists (Collier & James, 1967). A preparation of serially perfused isolated lungs described below has been developed to explore these possibilities.
Guinea-pig lungs were isolated by the technique of Bhattacharya & Delaunois(1955). The guinea-pig was lightly anaesthetized with phenobarbitone (30 mg/kg, i.p.), the trachea was cannulated and artificial ventilation was established with a pump of 5-8 ml stroke volume at a rate of 40 strokes/min. The pulmonary artery and vein were cannulated and the lungs perfused by a peristaltic pump at 8-12 ml/ min with Tyrode solution containing 2-5% w/v polyvinyl pyrrolidone at 37°. The lungs were then excised and suspended in a heating jacket containing water at 37° (Fig. 1). The pressure in the trachea was measured by a pressure transducer in the side-arm of the tracheal cannula. The perfusion pressure was measured by a Statham pressure transducer from a needle inserted above the pulmonary artery. The lungs were suspended from a strain gauge to detect increase in weight and hence oedema formation.
F ig . 1. Diagram to show the arrangement of the apparatus. A, reservoir; B, heating jackets; C, peristaltic pump; D, to Statham pressure transducer; E, strain gauge; F, to respiratory pump; G, to air pressure transducer; Hd, donor lung; Hr, recipient lung; I, slow injection apparatus.

A second pair of lungs (the recipient), taken in the same way from another animal, was suspended in series with the first (the donor), so that the effluent from the donor was perfused through the pulmonary artery of the recipient (Fig. 1). In most experiments the donor lungs were from guinea-pigs that had been sensitized with ovalbumen as previously described (Collier & James, 1967), whereas the recipient preparations were always from non-sensitized animals. Antigen was administered to the donor lungs by injection into the pulmonary artery. Drugs or antigen were administered to the recipient lungs via the reservoir collecting perfusate from the donor preparation (Fig. 1).
In the first experiment, sensitized donors were used. Whereas antigen administered only to the recipient elicited no response, administration of antigen to the donor elicited from it a sharp increase in tracheal pressure, usually accompanied by an increase in perfusion pressure, followed by an increase in weight (Fig. 2, left). Some minutes later, there was an intense increase in the tracheal pressure of the recipient, usually without obvious change in the perfusion pressure or lung weight. This experi-
LETTERS TO the editor, J. Pharm. Pharmac., 1970, 22, 229
Fig . 2. Transfer of humoral factors from a sensitized to a non-sensitized isolated lung. Donor lungs were sensitized to ovalbumen. Recipient lung was not sensitized. Time 1 min. Left- hand panel: EA, 5 mg ovalbumen added to donor perfusate. Right-hand panel: Recipient lung perfused with Tyrode containing 10 fig/ml of mepyramine, 1 /¿g/ml of atropine, 1 fig/ml of methysergide and 100 /¿g/ml of meclofenamate sodium. A 0T% solution of meclofenamate was given in the form of an aerosol to the recipient lung. H, 1 fig histamine; A , 5 fig acetylcholine; HT, 1 fig 5-h t ; B, 1 /ig bradykinin, all added to perfusate to recipient lung only. EA, 5 mg ovalbumen added to perfusate 1 o donor lung.

230ment was made seventeen times, and on sixteen occasions the tracheal pressure response of the recipient was observed. In one experiment, neither donor nor recipient responded to antigen.
In a second experiment, also in seventeen serially perfused preparations, sensitized donors were again used, but the recipient was perfused with mepyramine (10 jug/ml), atropine (1 /xg/'ml), methysergide (1 jug/ml) and meclofenamate sodium (100 jxg/ml). A solution of 0-1% meclofenamate sodium in 0-9% w/v sodium chloride was also administered in an aerosol to the recipient by means of its respiration pump. After this treatment, the recipient was unresponsive to the following agonists: histamine (1 fig), acetylcholine (5 jug); 5-ht (1 jug), bradykinin (1 jug) or of SRS-A-H (0-25-1-0 mg). When antigen was administered to the donor an increase of tracheal pressure occurred in all donors and in fourteen of seventeen recipients, an example is illustrated in Fig. 2, right.
In a control experiment, made at the same time as the second experiment, twelve serially perfused lung preparations were used. The donors lungs were excised from non-sensitized guinea-pigs. No donors responded to antigen and nine of the recipients were also unresponsive; but there was a marginal increase in tracheal pressure in three of the recipients. The difference in the proportion of recipients responding between the control and test preparations was statistically significant (P <0-001).
The bronchoconstriction elicited in non-sensitized lungs by fluid received from sensitized lungs after challenge with antigen can safely be attributed to one or more humoral factors. That, after antagonism of histamine, acetylcholine, 5-ht, kinins and SRS-A-H, the recipient still responded vigorously to fluid from the donor indicates either an overwhelming amount of one or more of these factors was liberated, or that one (or more) other bronchoconstrictor factor(s) was released. Because, in the above experiments, challenge doses of known humoral factors failed to elicit a response from non-sensitized lungs protected by antagonists, the possibility seems the more likely that other unidentified bronchoconstrictor factors are involved. Among candidates for an unidentified factor is prostaglandin which is released in anaphylaxis of isolated guinea-pig lungs (Piper & Vane, 1969) and which, in the guinea-pig in vivo, is a bronchoconstrictor that is not antagonized by meclofenamate (James, 1969). Another possibility is that the substance transmitted to the recipient from the donor is rabbit aorta contracting substance (RCS), which Piper & Vane (1969) have shown to be released from guinea-pig isolated lungs in anaphylaxis. RCS contracts the isolated trachea of the guinea-pig and fenamates do not antagonize this effect, although they block the release of RCS (Piper & Vane,1969). We have not enough evidence to decide between these or other possible humoral factors.
Department o f Pharmacological Research,Division o f Medical and Scientific Affairs,Parke-Davis & Company,Hounslow, Middx, U.K.October 23, 1969
* Present address: Miles Laboratories Ltd., Stoke Poges, Bucks.t Present address: Roussel Laboratories Ltd., Marshgate Lane, London, E.15.
R E F E R E N C E S
B h a t t a c h a r y a , B. K. & D e l a u n o i s , A. L. (1955). Archs int. Pharmacodyn. Ther., 101, 495-501. C o l l ie r , H. O. J. & J a m e s , G. W. L. (1967). Br. J. Pharmac. Chemother., 30, 283-301.J a m e s , G. W. L. (1969). J. Pharm. Pharmac., 21, 379-386.P i p e r , P. J. & V a n e , J. R. (1969). Nature, Lond., 223, 29-35.
letters TO the editor, J. Pharm. Pharmac., 1970, 22, 230
H . O. J. Collier* G . W. Lynn J ames|

231Effects o f two cholinesterase inhibitors on acetylcholine release
from the guinea-pig isolated ileum preparationIn studies measuring the release of acetylcholine from the guinea-pig isolated ileum preparation, Schnieden & Weston (1969) used AW'-di-isopropylphosphorodiamidic fluoride (mipafox) to protect acetylcholine from hydrolysis by cholinesterases of the ileum. These workers found that the values for acetylcholine release in the presence of mipafox were very much lower than those obtained by other workers using eserine.
During the present investigations, values for acetylcholine release have been obtained under similar experimental conditions after treatment of the ileum with either eserine or mipafox. Segments of ileum, 3-4 cm long, were suspended in 10 ml organ baths containing Tyrode solution bubbled with oxygen and maintained at 37 ± 1°. The initial resting tension imposed on the ileum was 1 g. The preparation was washed at 10 min intervals for 1 h before exposure to either eserine or mipafox.
In the first series of experiments, the ileum was bathed in Tyrode containing eserine, 10 /zg/ml, for 30 min, the bath fluid being changed at 10 min intervals. At the end of the next 10 min interval, the bath fluid was withdrawn for assay of acetylcholine content. When the irreversible cholinesterase inhibitor, mipafox, was used in the second series, the ileum was soaked in Tyrode containing mipafox, 10 /^g/ml, for 75 min and washed at 10 min intervals for 1 h. 10 min later, the bath fluid was withdrawn for acetylcholine assay. In a third series of experiments, the ability of both eserine and mipafox to protect a dose of acetylcholine added to the ileum was assessed. The ileum was pretreated with either eserine or mipafox and the resting acetylcholine release determined as described above. Acetylcholine (30 ng) was then added to the bath and 10 min later a sample was withdrawn for assay. The value for the resting release was subtracted from the value obtained for resting + added acetylcholine.
The acetylcholine content of the bath fluid was assayed on the leech dorsal muscle preparation suspended in diluted Tyrode solution containing eserine and morphine (Mumaghan, 1958) and bubbled with oxygen. The active substance in the bath fluid was identified as acetylcholine in the following manner: (i) there was no significant difference between the results of parallel assays on the leech dorsal muscle and guinea-pig isolated ileum preparations; (ii) the activity of samples for assay was inhibited by tubocurarine on the leech dorsal muscle and by atropine on the guinea-pig ileum; (iii) loss of activity of samples occurred after heating in alkaline solution and subsequent neutralization.
The release of acetylcholine from the ileum was expressed as ng/g wet weight ileum in 10 min. In the presence of eserine, the rate o f acetylcholine accumulation in 10 min was 646 ng/g (17 experiments). When mipafox was used, the value was 168 ng/g (16 experiments). When these results were compared using the Mann Whitney “U ” test they were found to be significantly different (P < 0-001). The percentage of acetylcholine added that could be accounted for in the bath fluid after 10 min was 94% in the presence of eserine (5 experiments) and 138% after mipafox treatment (6 experiments).
Table 1 compares the results obtained above with those taken from the publications of other workers who have used eserine or mipafox. Although there are differences in the periods over which acetylcholine collections were made, and in some instances differences in the concentrations of inhibitor used, it is clear that the values for acetylcholine release can be divided into two groups—high release in the presence of eserine and low release after treatment with mipafox.
This difference is difficult to explain. Eserine may produce an increased concentration of acetylcholine in the bath fluid by a mechanism different from its anti-
LETTERS TO the editor, J. Pharm. Pharmac., 1970, 22, 231

232 letters to the editor, J. Pharm. Pharmac., 1970, 22, 232Table 1. Published results for acetylcholine release from guinea-pig ileum treated with
either eserine or mipafox
Inhibitorconcentration
g/ml
Reported acetylcholine release calculated as
ng acetylcholine/g ileum in 10 min ReferenceEserine 2 x 10~6 560 Paton & Zar, (1968)Eserine 10-s 1730 Schaumann, (1957)Eserine 10~5 833 Ogura, Mori & Watanabe, (1966)Eserine 10“5 646 Present studyMipafox 10-5 54 Johnson, (1963)Mipafox 10-5 62 Schnieden & Weston, (1969)Mipafox 10-5 168 Present study
cholinesterase action. Other actions for eserine have been reported (Carlyle, 1963; Werner & Kuperman, 1963). It is possible that mipafox may be interfering with the release of acetylcholine from the ileum, although no evidence for such an action has been reported. A third possibility is that mipafox, which is known to inhibit cholinesterase more effectively than acetylcholinesterase (Aldridge, 1953), does not give complete protection to endogenously released acetylcholine. Eserine, however, an inhibitor of both cholinesterase and acetylcholinesterase (Augustinsson, 1948), is able to give complete protection to endogenous acetylcholine. This suggests that there must be differences between the hydrolysis of endogenous and exogenous acetylcholine by cholinesterase since both eserine and mipafox gave full protection to a standard dose of acetylcholine added to the bath.
Ambache, Freeman & Hobbiger (1969) have provided support for this hypothesis. They showed that the acetylcholinesterase activity of the guinea-pig ileum is mainly localized in Auerbach’s plexus whereas that of butyrylcholinesterase is largely associated with the longitudinal smooth muscle layer.
Department o f Pharmacology,University o f Manchester,Manchester, M 13 9PL, U.K.December 17, 1969
R E F E R E N C E S
A l d r id g e , W. N. (1 9 5 3 ) . B io d ie m . J., 53, 6 2 -6 7 .A mbache, N., F reeman, M. A. & H obbiger, F. (1969). J. P h y s io l ., L o n d ., 200, 50P-51P. Augustinsson, K. B. (1948). A c ta p h y s io l , s c a n d ., 15, Suppl. 52.C a r l y l e , R. F. (1963). B r. J. P h a rm a c . C h em o th er ., 21, 137-149.J ohnson, E. S. (1963). Ibid., 21, 555-568.M urnaghan, M. F. (1958). N a tu re , L o n d ., 182, 317.Ogura, Y., Mori, Y. & Watanabe, Y. (1966). J. P h a rm a c . e x p . T h er., 154, 456-462.Paton, W. D. M. & Zar, M. A. (1968). J. P h y s io l , L o n d ., 194, 13-33.Schaumann, W. (1957). B r. J. P h a rm a c . C h em o th er ., 12, 115-118.S c h n i e d e n , H. & W e s t o n , A. H. (1969). Ib id ., 36, 496-509.W e r n e r , G. & K u p e r m a n , A. S. (1963). In H a n d b . e x p . P h a r m a k ., vol. 15, pp. 570-678. Heidel
berg: Springer.
B. CoxSally E. H ecker A. H. W eston

233Recovery o f the amine uptake-storage mechanism in nerve granules after reserpine treatment: inhibition by axotomy
After a large dose of reserpine, the nerve function recovers centrally (Haggendal & Lindqvist, 1963; 1964) and peripherally (Andén, Magnusson & Waldeck, 1964; Andén & Henning, 1966) 2 or 3 days later while the monoamine levels are still very low. There is, however, a rather sudden rise in the ability of the amine granules to take up and retain amines at the time of functional recovery; it increases to almost normal levels in the adrenal medulla (Lundborg, 1963; Carlsson, Jonason & Rosen- gren, 1963) but only partially in the sympathetic nerves (Andén & others, 1964; Andén & Henning, 1966; Lundborg & Stitzel, 1968) and in the brain (Glowinski, Iversen & Axelrod, 1965). Two hypotheses have been put forward to explain this recovery of the nerve function and the uptake-storage mechanism despite low endogenous amine levels: (1) transport from the cell bodies to the nerve terminals of newly synthesized granules unaffected by reserpine (Dahlstrom, Fuxe & Hillarp, 1965; Dahlstrom & Haggendal, 1966; 1969), and (2) disappearance of minute amounts of very highly bound reserpine from the amine granules (Alpers & Shore, 1969). The hypotheses can be differentiated in an experiment involving interruption of the connections between the cell bodies and the terminals (axotomy). Such an investigation can probably only be made on central monoamine neurons since their terminals, in contrast to those of the peripheral neurons, do not start to degenerate until more than two days after axotomy. For example, the monoamine levels in the caudal spinal cord do not change during the first three days after axotomy of the bulbospinal monoamine neurons to that region by spinal cord transection (Carlsson, Falck & others, 1964; Andén, Haggendal & others, 1964).
Male Sprague-Dawley rats, 180-230 g, had spinal cord transection in the mid- thoracic region during ether anaesthesia. Reserpine was given intraperitoneally in a dose of 5 mg/kg. Careful attempts were made to keep the rectal temperature at 37°. Usually it was only 34-36° in the reserpine treated and transected rats, or1-2° lower than in the controls, and attempts to elevate it resulted in increased mortality. The peripheral but not the central L-3,4-dihydroxyphenylalanine (L-dopa) decarboxylase activity was inhibited by V 1-(DL-seryl)-V2-(2,3,4-trihydroxy- benzyl)hydrazine (Ro 4-4602 50 mg/kg, i.p. 4 | h before death) (Bartholini & Pletscher,1968). In this way, there was an increase in the amount of [3H]noradrenaline formed and accumulated in the central nervous system from 3H-L-dopa (5 /zg/kg, i.v. 4 h before death, 1 /zg/ml, ring 2,5,6-3H, about 30 Ci/mM, Radiochemical Centre in Amersham). Each experimental group consisted of 4-5 rats. The tissue [3H]-
Table 1. Concentrations o f [3H]noradrenaline in different parts o f the rat central nervous system 4 h after treatment with [3H]h-dopa (5 /zg/kg., i.v., 30 min after Ro 4-4602 50 mg/kg, i.p.). At different times before death, mid thoracic transection of the spinal cord was made or reserpine 5 mg/kg was injected i.p., or both. Number of experiments in parentheses. Values in % ± s.e. of those in the first column. Actual concentrations (ng/g ± s.e.) of [3H]noradrenaline within brackets in the first column
LETTERS TO the editor, J. Pharm. Pharmac., 1970, 22, 233
Part of the CNSSection 50 h No reserpine
Section 50 h Reserpine 6 h
Section 50 h Reserpine 50 h
No section Reserpine 50 h
Section 6 h No reserpine
Caudal half of the spinal cord
100 0% (5) [0-071 ± 0-0069]
3-8 ± 0-84 (5) 7-8 ± 1-36(5) 84-8 ± 34-67 (2) 98-7 (1)
Cranial half of the spinal cord
100-0% (5) [0-174 ± 0-0219]
1-6 ± 0-33 (5) 12-7 ± 0-74 (5) 28-7 ± 7-62 (2) 82-1 (1
Whole brain 100-0% (5) 2-8 ± 0-61 (5) 10-6 ± 0-78 (5) 23-0 ± 7-91 (2) 70-6 (1)[0-149 ± 0-0172]

234noradrenaline was determined by liquid scintillation counting after cation exchange chromatography and freeze-drying (Carlsson & Waldeck, 1963).
The results (Table 1) were calculated in each experiment as per cent of those in the sectioned but not reserpine-treated group. Reserpine treatment 6 h before death caused a pronounced reduction of the amount of [3H]noradrenaline accumulated in all parts of the central nervous system. If reserpine had been given 50 instead of 6 h before death to spinal rats, the [3H]noradrenaline was increased in the brain by about 4 times and in the cranial half of the sectioned cord by about 8 times. In the caudal half of the cut spinal cord, the [3H]noradrenaline was increased about twice. The differences between the means of the 50 and 6 h groups were significant at the 0T% level in the brain and the cranial half of the spinal cord and at the 5% level in the caudal half (Student’s /-test).
The content of [3H]noradrenaline formed and accumulated 50 h after reserpine treatment was greater in all parts of the central nervous system of intact rats than in rats with a spinal cord transection, showing that the uptake-storage mechanism could recover at least as much in the caudal spinal cord as in the other parts between 6 and 50 h after reserpine treatment. The difference between the intact and spinal animals was also seen as a more marked return of, e.g., spontaneous motility, reactivity to stimuli and eyebulb protrusion. It was possibly owing to the better condition of the intact rats.
The amount of [3H]noradrenaline accumulated in the caudal half of the cut spinal cord was about the same if the operation was performed 6 or 50 h before death. Therefore it is unlikely that degeneration of the descending bulbospinal neurons to the caudal part of the spinal cord was responsible for the smaller recovery of the uptake-storage mechanism in that region between 6 and 50 h after reserpine treatment.
In conclusion, axotomy markedly inhibited the recovery of the uptake-storage mechanism in the caudal spinal cord after reserpine treatment. Therefore, formation and down transport of new granules appear to be the most important factor in recovery from reserpine, although restoration of old granules probably contributes to recovery.
Supported by the Swedish State Medical Research Council (B70-14X-502-06B, B70-14X-2464-02). For generous gifts of drugs we thank the Swedish Ciba, Ltd. (reserpine) and Hoffmann-La Roche & Co., Ltd., through Dr. A. Pletscher (Ro4-4602). For skilful technical assistance we thank Miss Inger Karlsson and Miss Lena Ramstedt.
Department o f Pharmacology, N.-E. AndenUniversity o f Goteborg, Sweden. P. Lundborg
December 30, 1969
letters to the editor, J. Pharm. Pharmac., 1970, 22, 234
references
A l f e r s , H. S . & S h o r e , P. A. (1969). Biochem. Pharmac., 18, 1363-1372.A n d é n , N.-E., H ä g g e n d a l , J„ M a g n u s s o n , T. & R o s e n g r e n , E. (1964). Acta physiol, scand
62, 115-118.A n d é n , N.-E. & H e n n i n g , M. (1966). Ibid., 67, 498-504.A n d é n , N.-E., M a g n u s s o n , T. & W a l d e c k , B. (1964). Life Sei., 3, 19-25.B a r t h o l i n i , G. & P l e t s c h e r , A. (1968). J. Pharmac. exp. Ther., 161, 14-20.C a r l s s o n , A., F a l c k , B., F u x e , K. & H i l l a r p , N.-Á. (1964). Acta physiol, scand., 60, 112-119. C a r l s s o n , A., J o n a s o n , J. & R o s e n g r e n , E. (1963). Ibid., 59, 474-477.C a r l s s o n , A. & W a l d e c k , B. (1963). Acta pharmac. tox., 20, 47-55.D a h l s t r ö m , A., F u x e , K. & H i l l a r p , N.-Á. (1965). Ibid., 22, 277-292.D a h l s t r ö m , A. & H ä g g e n d a l , J. (1966). J. Pharm. Pharmac., 18, 750-752.

235letters to the editor, J. Pharm. Pharmac., 1970, 22, 235 D a h l s t r o m , A. & H a g g e n d a l , J. (1969). Ibid., 21, 633-638.G lowinski, J., Iversen, L. L. & Axelrod, J. (1966). J. Pharmac. exp. Ther., 151, 385-399. H aggendal, J. & Lindqvist, M. (1963). Acta physiol, scand., 57, 431^436.H aggendal, J. & L indqvist, M. (1964). Ibid., 60, 351-357.Lundborg, P. (1963). Experientia, 19, 479.Lundborg, P. & S t i t z e l , R. E. (1968). Br. J. Pharmac., 33, 98-104.
Cardiac catecholamine levels and blood pressure after chronic treatment with ^-adrenergic blocking agents
The mechanism of the hypotensive effect observed clinically after chronic treatment with /3-adrenergic blocking agents is not yet elucidated. Blockade of the sympathetic supply to the heart (Prichard & Gillam, 1966), direct or centrally mediated vasodilatation (Waal, 1966) and a reduction of cardiac output as a result of a decreased heart rate (Frolich, Tarazi & others, 1968) were suggested as possible explanations.
Some hypotensive agents such as reserpine and guanethidine are believed to elicit their effects partially by depleting noradrenaline in the peripheral adrenergic nerve endings. In this study experiments were performed to establish whether chronic treatment with ^-adrenergic blocking agents would cause changes in endogenous catecholamine levels in the heart, brain and spleen of normotensive, non-anaesthetized rats, and whether there would be any correlation between these changes and the systolic blood pressure.
Wistar rats (150 g to 175 g) (6 rats for each drug) were injected intraperitoneally daily with 3 mg/kg of propranolol, 5 mg/kg of Ko 592 [l-(3-methylphenoxy)-2- hydroxy-3-isopropylaminopropan] or 10 mg/kg of inpea [l-(p-nitrophenyl)-2-iso- propylaminoethanol hydrochloride] for 4 weeks; the dose of each drug was doubled for the subsequent 5 weeks. Concurrently, controls (6 rats) were injected intraperitoneally with 0-5 ml of physiological saline.
Indirect systolic blood pressure was measured weekly (18-20 h after administration of /3-adrenergic blocking agents) from the tail of the non-anaesthetized rat by the use of an occluding cuff and a pneumatic pulse transducer connected to an electro- sphygmograph, and registered on a Grass polygraph by means of a transducer- monitor coupler (E and M Physiograph Instrumentation, Houston, Texas, U.S.A.). This method was reported to be in good agreement with the direct measurements of blood pressure (Maistrello & Matscher, 1969; Baum & Rowles, 1969).
It was established in preliminary experiments that a single dose of propranolol (6 mg/kg), Ko 592 (10 mg/kg) or inpea (20 mg/kg) administered intraperitoneally produced on the average a 79, 64 or 74% blockade respectively of the positive chronotropic effects elicited by 1 p,g/kg of isoprenaline when the latter was administered intraperitoneally 1 h after /3-adrenergic blocking agents. After 18-20 h the blockade was 58, 61 or 63% respectively.
The animals were killed after 9 weeks; the heart, brain and spleen were dissected and placed in liquid nitrogen. Catecholamines were extracted from tissue with acidified n-butanol (Maickel, Cox & others, 1968) and determined by the method of Anton & Sayre (1962). Their amount is expressed in ng/g of tissue and corrected for standard recoveries which ranged from 84 to 92% (average 86%).
Table 1 demonstrates that catecholamine content of the heart was significantly reduced after treatment with propranolol, Ko 592 and inpea by 51, 32 and 56% respectively. The reduction was significantly greater in inpea- and propranolol- treated rats than in those treated with Ko 592. Brain catecholamine content was increased by 29% in Ko 592 treated rats, but reduced by 14% in the inpea treated group. No significant changes were observed after propranolol treatment.

236 letters to the editor, /. Pharm. Pharmac., 1970, 22, 236Table 1. Endogenous catecholamine (CA) content o f rat brain, heart and spleen after
9 weeks o f treatment with /S-adrenergic blocking agents*
Brain Heart Spleen
Treatment
No.of
experiments
CAcontent
ng/gWeight
(g)
CAcontent
ng/gWeight
(g)
CAcontent
ng/gWeight
(g)Control 5 363
±23-41-885±0-04
720±99-7
1-215±0-08
365±36-3
1-635±0-13
Propranolol 5 370±27-5
1-905±0-08
350f±26-6
1-147±0-03
367±35-2
0-744f± 0 - 1 1
Kb 592 6 468f±17-3
1-959±0-03
492f±38-9
1 - 1 2 2
±0034311
±18-20-858f± 0 0 1
INPEA 6 31 If±18-5
2-087±0-06
316f±55-1
1-241±0-05
643f±53-0
0-816f±0-03
* Experimental rats were treated with 3 mg/kg of propranolol, or 5 mg/kg of Ko 592, or 10 mg/kg of i n p e a for 4 weeks; the dose of each |8 -adrenergic blocking agent was doubled for the following 5 weeks. Mean ± s.e. are represented,
t = P < 0-05.
Fig. 1. Systolic blood pressure of non-anaesthetized control rats (O — O) and of non-anaes- thetized rats treated chronically with 3 mg/kg of propranolol (A — A), 5 mg/kg of Ko 592 (O . . . O) and 10 mg/kg of i n p e a (□ — □ ); for 4 weeks; the dose of each drug was doubled for the subsequent 5 weeks. Records were taken first at weekly then at 2 weekly intervals. Mean ± s.e. of 3-6 rats is shown in each case.
Catecholamine content of the spleen was increased in inpea and Ko 592 treated rats by 76 and by 18% respectively. No significant changes were observed after propranolol treatment. Surprisingly, the weights of spleens of all treated animals were significantly reduced compared with controls.
Results of blood pressure measurements are reported in Fig. 1.At the start of experiment (“0” on the abscissa) the average systolic blood pressure
of control and experimental groups did not differ significantly, the range being from 132 ± 3 to 137 ± 3 mm Hg. After 9 weeks of chronic treatment the systolic blood pressure was significantly higher than at the start of experiments in all groups of animals except in Ko 592 treated rats; however, there was no statistically significant difference between control and experimental groups or among the experimental groups themselves.
The significant decrease in the content of endogenous cardiac catecholamines observed presently after chronic treatment with propranolol, Ko 592 and inpea is at variance with previous reports of Westfall (1967a, 1967b) who found no alteration

237in the endogenous noradrenaline level in the heart after seven days of daily intra- peritoneal administration (2 or 10 mg/kg) of propranolol, Ko 592 or MJ 1999, or 6 h after a single injection (10 or 50 mg/kg) of l(+ ) - or d(—)-inpea to normotensive rats. The discrepancies between Westfall’s and our results could have been due to differences in the duration of the treatment with /3-adrenergic blocking agents. In line with our results a significant decrease in endogenous noradrenaline content was found in the rat heart after chronic treatment daily with pronethalol (10 mg/kg). Westfall’s (1967a) findings that chronic treatment with propranolol did not induce changes in endogenous noradrenaline content of spleen are borne out by our own results.
In view of the conflicting reports about the influence of /3-adrenergic blocking agents on noradrenaline uptake in in vivo and in vitro studies (Westfall, 1967b; Iversen, 1965; Foo, Jowett & Strafford, 1968; von Euler & Lishajko, 1968) no conclusion can be reached whether such an action is involved in the reduction we observed in the endogenous noradrenaline content in the heart.
The effect of /3-adrenergic blocking agents on the endogenous catecholamine content of brain and spleen was not consistent in the present study, and it would be difficult to speculate on its significance.
No correlation was found between the changes in endogenous catecholamine level in the heart and blood pressure level of experimental animals. In spite of the significantly lower endogenous catecholamine level of the heart, the systolic blood pressure of rats treated chronically with /3-adrenergic blocking agents did not significantly differ from control animals. This may indicate that the cardiac catecholamine level was still adequate to maintain the proper cardiovascular homeostasis.
This work was supported by the Medical Research Council of Canada. The generous supply of propranolol (Ayerst, McKenna and Harrison), inpea (Selvi and Co.) and Ko 592 (C. H. Boehringer Sohn) is acknowledged with gratitude. Our thanks are to Miss Sheila Carlyle and Mrs. Barbara Amott for their skilful technical assistance.
D ep a rtm en t o f P harm aco logy , I . M. M azurkiewicz-KwileckiF acu lty o f M ed ic in e , A. RomagnoliU niversity o f O ttaw a , O tta w a , C anada.November 18, 1969
letters to the editor, J. Pharm. Pharmac., 1970, 22, 237
REFERENCESA n t o n , A. H. & Sayre, D. F. (1962). J. Pharmac. exp. Ther., 138, 360-375.B a u m , T. & R o w l e s , G. (1969). Archs int. Pharmacodyn. Thér., 177, 179-184.Euler, U. S. v . & Lishajko, F. (1968). Acta physiol, scand., 74, 501-506.Foo, J. W., J o w e t t , A. & S t a f f o r d , A. (1968). Br. J. Pharmac., 34, 141-147.F rölich, E. D ., Tarazi, R. C., D ustan, H. P. & Page, I. H . (1968). Circulation, 37, 417-423. Iversen, L. L. (1965). J. Pharm. Pharmac., 17, 62-64.Maickel, R. P., Cox, R. H ., Jr., Saillant, J. & M iller, F. P. (1968). Int. J. Neuropharmac.,
7, 275-281.M a is t r e l l o , I. & M a t s c h e r , R. (1969). J. appl. Physiol., 26, 188-193.Prichard, B. N . C. & G illam, P. M. S. (1966). Am. J. Cardiol., 18, 387-390.W a a l , H. J. (1966). Clin. Pharm. Ther., 1, 588-598.W e s t f a l l , T. C. (1967a). Archs int. Pharmacodyn. Thér., 167, 69-79.Westfall, T. C. (1967b). Europ. J. Pharmac., 2, 163-168.

238The role of brain catecholamines in morphine analgesic
action in morphine tolerant ratsRecently, evidence for an adrenergic mechanism for the analgesic action of morphine in intact rats was presented (Vedernikov & Afrikanov, 1969). I now describe experiments in tolerant rats which support the role of noradrenaline in morphine analgesia.
The experiments were made on white female rats, 180-230 g, made tolerant to a test dose of morphine (5 mg/kg, s.c.) after 20 days of successive subcutaneous injections of 10 mg/kg of morphine. The analgesic activity was estimated using the change in pain threshold to mechanical pressure of the tail (Sangailo, 1962). By this test, before tolerance to the test dose developed, the pain threshold after morphine was 100 mm Hg (top limit); after tolerance, it was not changed significantly from base value.
Cocaine hydrochloride (50 mg/kg, s.c.), pyrogallol (50 mg/kg, s.c.) given 1 h, or (rb)-tryptophan (400 mg/kg, i.p.) given 4 h before the morphine test dose increased the analgesic’s action on the pain threshold. This increase was about 20 mm Hg. Iproniazid (100 mg/kg, i.p.) given 4 h before the morphine test dose had a similar effect; its administration for three successive days (50, 50, 100 mg/kg) increased the effect of the morphine test dose further, though not significantly. The most pronounced action on the restoration of the ability of the morphine test dose to elevate the pain threshold in groups of 10 rats was possessed by amphetamine (2 mg/kg, s.c.) injected 1 h before morphine. There was an increase of 80 mm Hg in the pain threshold 30 min after injection of morphine, which dropped to 18 mm Hg at 180 min, in animals previously treated for 26 days with morphine (10 mg/kg), but after a further 9 days morphine treatment, the test dose produced a rise in threshold that did not go above 20 mm Hg and that disappeared at 150 min. After 40 days of treatment with 10 mg/kg of morphine, the same dose (10 mg/kg) given as a test dose increasd the threshold to 65 mm Hg at 90 min; this was potentiated by amphetamine to 96 mm Hg at 90 min. On the other hand, disulfiram (50 mg/kg, i.p.) 2 h before 10 mg/kg of morphine significantly decreased the analgesic’s action on pain threshold, while reserpine (1 mg/kg i.p.) or iproniazid (100 mg/kg, i.p.) 4 h before a dose of 15 mg/kg of morphine did not influence the activity of the analgesic significantly.
It seems that the inhibition of any mechanism by which noradrenaline is normally inactivated (monoamine oxidase inhibition by iproniazid, catechol-O-methyltransferase inhibition by pyrogallol, re-uptake inhibition by cocaine) is accompanied by the reappearance of analgesia to the test dose of morphine in tolerant rats. The marked potentiation by amphetamine of the analgesia induced by the morphine test dose can be explained by its action in releasing brain catecholamines; the decrease of this action after the development of tolerance is to be attributed to the loss of ability by morphine to release noradrenaline completely (Maynert, 1967). This concept seems likely since increasing the dose of morphine restored the ability of amphetamine to increase the analgesic action of morphine. Decrease of noradrenaline formation by the inhibition of dopamine-jS-hydroxylase, produced by disulfiram, also weakened morphine’s analgesic action. Iproniazid, in non-tolerant rats decreased the effect of low (2-5 mg/kg) and high (5-0 mg/kg) doses of morphine (Vedernikov & Afrikanov, 1969), while in tolerant rats it intensified the action of the test dose, but produced no effect on the activity of the high morphine dose. In non-tolerant rats (±)-tryptophan did not influence morphine analgesic action significantly, while in tolerant rats it promoted the reappearance of the effect of the morphine test dose on the pain threshold. Reserpine weakened morphine analgesia, in normal rats, but not in rats made tolerant to morphine.
letters TO the editor, J. Pharm. Pharmac., 1970, 22, 238

239Laboratory o f Subcellular Ecology, Yu. P. VedernikovInstitute o f Plant and Animal Ecology,Ural’s Branch o f U.S.S.R. Academy o f Sciences,8 Marta Street, 202, Sverdlovsk, U.S.S.R.October 31, 1969
LETTERS to the editor, /. Pharm. Pharmac., 1970, 22, 239
r e fe r e n c e s
M a y n e r t , E. (1967). Fedn Proc. Fedn Am. Socs exp. Biol., 26, 1111-1114. S a n g a i l o , A. K. (1962). Proc. Sverdlovsk Med. Inst., 35, 5.V e d e r n i k o v , Yu. P. & A f r i k a n o v , 1.1. (1969). J. Pharm. Pharmac., 21, 845-847.
Central nervous system stimulant action of fenfluramine in rabbits
Fenfluramine is an anorexic drug which, although structurally related to amphetamine, has been described as having no central stimulant activity in animals or man (Le Douarec & Schmitt, 1964; Hill & Turner, 1967; Santer, 1968). Recently, Jespersen, Bonaccorsi & Garattini (1969) have shown that, like amphetamine, fenfluramine causes hyperthermia and clear signs of central nervous system excitation in mice treated with a combination of dopa and the monoamine oxidase inhibitor, pheniprazine. Although these experimental conditions are not comparable with those of the normal therapeutic use of fenfluramine, the findings are consistent with recent clinical reports of overdosage indicating that the drug can cause stimulation of the central nervous system in man (Riley, Corson & others, 1969; Gold, Gordon & others, 1969; Fleischer & Campbell, 1969; Campbell & Moore, 1969). Moreover, work in this laboratory has provided direct evidence of a cortical stimulant action of fenfluramine in rabbits.
Male adult rabbits, 3-5-5 kg, were prepared with indwelling stainless steel electrodes, placed superficially on the dura over the motor and occipital areas of the cerebral cortex. After complete recovery from the operation, the animals were trained to sit quietly in stocks for recording of electrocorticograms (ecog). The normal ecog showed an alert pattern, but after the intravenous administration of equi-anorectic doses of dexamphetamine sulphate (2 mg/kg) or fenfluramine hydrochloride (8 mg/kg) further arousal occurred although the effect was slight and barely distinguishable from the response to intravenous saline. In other experiments, to facilitate more quantitative evaluation of this effect, an ecog pattern resembling deep sleep was first produced by the administration of pentobarbitone: under these circumstances, both anorectic drugs showed a clear-cut alerting action.
A comparison of the effects of dexamphetamine sulphate (2 mg/kg), fenfluramine hydrochloride (8 mg/kg) and normal saline (1 ml/kg) injected intravenously 30 min after an intravenous dose of pentobarbitone (20 mg/kg) was made in six rabbits using a cross-over design with an interval of at least two days between drug treatments. Recordings of ecog were taken for 90 min after the administration of dexamphetamine or fenfluramine and their effects during this time were scored on a scale of 0 to 6, ranging from maximal arousal with persistent body movement artefact (score 0), to stage 4 sleep with low frequency, high amplitude records (score 6). Fig. 1 shows the abrupt change from an alert ecog pattern to deep sleep after the administration of pentobarbitone; in contrast to the subsequent gradual lightening of sleep after intravenous saline administration, both dexamphetamine and fenfluramine caused a rapid and complete ecog arousal accompanied by body movement artefacts, widely dilated pupils and intermittent masticatory movements.

240 letters to the editor, J. Pharm. Pharmac., 1970, 22, 240
F i g . 1. Alerting effect of fenfluramine and dexamphetamine on the electrocorticograrn in rabbits. At A, 20 mg/kg of pentobarbitone injected intravenously; at B, intravenous injections of 1 ml/kg of saline (x-x), 2 mg/kg of dexamphetamine sulphate (A - A) or 8 mg/kg of fenfluramine hydrochloride (O - O). Each point represents the mean of four observations ( ± standard error).
This alerting action of fenfluramine on the ecog in rabbits provides further evidence of its amphetamine-like stimulant properties in animals, an observation which is consistent with eeg results obtained in man early during recovery from overdosage.
D ep a rtm en t o f P harm aco logy , Susan R. M ayerJo h n W ye th & B ro th er L td ., P. J. SouthgateH u n terco m b e L a n e S o u th , A. B. W ilsonT aplow , M aidenhead , B erk s , U .K .
January 1, 1970
r eferen cesCampbell, D. B. & M oore, B. W. R. (1969). Lancet, 2, 1307.F leischer, M. R. & Campbell, D. B. (1969). Ibid., 2, 1306-1307.G old, R. G ., G ordon, H. E., D a Costa, R . W. D., Porteous, I. B. & K imber, K. J. (1969).
Ibid., 2, 1306.H ill, R. C. & T urner, P. (1967). J. Pharm. Pharmac., 19, 337-338.Jespersen, S., Bonaccorsi, A. & G arattini, S. (1969). Ibid., 21, 558-559.Le D ouarec, J. C. & Schmitt, H. (1964). Thérapie, 19, 831-841.R iley, I., Corson, J., H aider, I. & Oswald, I. (1969). Lancet, 2, 1162-1163.Santer, N. (1968). Br. med. J., 2, 559.

241Evidence for a centrally mediated hypotensive effect of
L-dopa in the ratIt is well established that administration of L-dopa to experimental animals produces a syndrome which involves effects elicited both from the central and the peripheral nervous system (for references see e.g. Butcher & Engel, 1969a, b; Carlsson, 1969). The influence of L-dopa on blood pressure is complex and shows species variation. Intravenous injection to cats results in a protracted hypertensive effect (Holtz & Palm, 1966) whereas rabbits respond with a decrease in blood pressure after small doses of L-dopa (Gaillard, Schaeppi & Tissot, 1969). On intravenous injection in man, L-dopa may produce increased blood pressure (for references see Holtz & Palm,1966); on the other hand, long term oral administration of L-dopa may result in hypotension (see below).
L-Dopa itself is regarded to be pharmacologically inert (Carlsson, Lindqvist& Magnusson, 1957; Blaschko & Chruschiel, 1960; Carlsson, 1964) and therefore its actions are probably due to its catecholamine metabolites. Several mechanisms are possible, e.g. (1) effects of the metabolites dopamine or noradrenaline, or both, in the central nervous system, either on specific receptors (noradrenaline, dopamine) or indirectly (displacement in catecholamine as well as 5-hydroxytryptamine neurons);(2) analogous actions in the peripheral sympathetic system; (3) combined central and peripheral effects.
Potent inhibitors of dopa-decarboxylase in peripheral tissues but with little effect in the central nervous system have proved to be valuable tools in dissociating central and peripheral actions of L-dopa (Butcher & Engel, 1969a, b) or its oc-methylated analogue, a-methyldopa (Henning, 1969a). This study was undertaken to examine the effects of L-dopa on blood pressure in conscious rats before and after pretreatment with a-hydrazino-a-methyl-/3-(3,4-dihydroxyphenyl)propionic acid (MK 485), a decarboxylase inhibitor with minimal central actions (Porter, Watson & others, 1962; Bartolini & Pletscher, 1969). In an attempt to analyse further the central effects of L-dopa after inhibition of peripheral decarboxylase, we also studied the influence of pretreatment with an inhibitor of dopamine-/3-hydroxylase, FLA-63. This compound has recently been described as a more potent inhibitor of this enzyme than disulfiram to which it is structurally related (Svensson & Waldeck, 1969; Carlsson, A., Corrodi, H., Florvall, L., Ross, S. & Sjoberg, B., unpublished data; cf. Svensson & Waldeck, 1969).
Male Sprague-Dawley rats weighing 250-350 g were used. Mean arterial blood pressure was recorded on a Grass Polygraph using conscious unrestrained animals with in-dwelling arterial catheters (Henning, 1969b). The following drugs were injected intraperitoneally: L-3,4-dihydroxyphenylalanine (L-dopa), a-hydrazino- a-methyl-/3-(3,4-dihydroxyphenyl)propionic acid (MK 485), a disulfiram derivative (FLA-63). For doses and time intervals see below. Tests of significance were conducted by Student’s ¿-test or analysis of variance with two independent criteria of classification.
Injection of L-dopa (50 mg/kg) alone gave a rapid increase in mean arterial blood pressure. At maximal effect 20 min after administration the pressure had increased significantly (P < 0-005) from 117 mm Hg (s.e. = 4-6, n = 9) to 144 mm Hg (s.e. = 4-6, n = 9). The duration of the increase was at least 60 min. After L-dopa the animals showed exophthalmus and piloerection. Increasing doses of L-dopa alone (50-200 mg/kg) never gave decreases in blood pressure but at the highest doses tested the rats rapidly deteriorated and died.
The changes in mean arterial blood pressure induced by L-dopa (200 mg/kg) after pretreatment with MK485 are shown in Fig. 1. MK 485 alone did not seem to
letters to the editor, J. Pharm. P/iarmac., 1970, 22, 241

242 letters to the editor, J. Pharm. Pharmac., 1970, 22, 242
T im e (m in )
F ig. 1. Changes in mean arterial blood pressure in conscious rats (means with s.e.) after the following treatments: L-dopa (200 mg/kg) 30 min after MK 485 (100 mg/kg) (13 experiments; circles); L-dopa (200 mg/kg) 30 min after MK 485 (100 mg/kg) and 60 min after FLA-63 (40 mg/kg) ( 8 experiments; squares); FLA-63 (40 mg/kg) (2-4 experiments; triangles). All drugs were given i.p. The values after L-dopa represent averages of the blood pressure 15-20 min after the injection. All other values are averages of 10 min periods.
influence blood pressure. The hypertensive response to L-dopa was reversed. With minimum 15-20 min after L-dopa there was now a significant lowering of blood pressure when compared to the levels before and after MK 485 (P < 0-001). The duration seemed to be shorter than the hypertensive reaction to L-dopa alone. In spite of the larger dose of L-dopa used, the peripheral sympathomimetic symptoms were less pronounced after pretreatment with MK 485. There was also a slight tendency to a decrease in blood pressure in experiments using 50 mg/kg of L-dopa (not shown here) after pretreatment with MK 485.
As seen in Fig. 1, pretreatment with FLA-63 40 mg/kg abolished the fall in blood pressure after MK 485 plus L-dopa (P > 0-10). FLA-63 alone had no significant effect on blood pressure (Fig. 1). Since this dose of FLA-63 results in a marked inhibition of dopamine-/1-hydroxylase (Svensson & Waldeck, 1969; Carlsson & others, unpublished data) it may be assumed that FLA-63 to a large extent prevented the synthesis of noradrenaline from L-dopa in our experiments. The results thus point to the importance of noradrenergic mechanisms in the hypotensive response to L-dopa after peripheral decarboxylase inhibition. This assumption is supported by preliminary results using spiroperidol, which in a dose of 0-1 mg/kg appears to block the central dopamine but not the noradrenaline receptors in the rat (Andén, N.-E., Butcher, S. C., Corrodi, H., Fuxe, K. & Ungerstedt, U ., unpublished experiments). Pretreatment with this drug (0-1 mg/kg) did not seem to influence the drop in blood pressure caused by L-dopa after MK 485 in the same doses as used in the previous experiments.
In conclusion, the present studies show that systemic administration of L-dopa to rats results in a pronounced increase in mean arterial blood pressure which seems to be due to peripheral actions. At the same time, L-dopa produces a centrally mediated hypotensive action which is unmasked following inhibition of the peripheral metabolism of L-dopa to catecholamines. The results also make it less probable that this central effect is mediated via dopamine but point to the importance of noradrenergic mechanisms, the nature of which is being investigated. Actions of this kind may be involved in e.g. the episodes of postural hypotension or permanent lowering of blood pressure which are sometimes observed during oral treatment of Parkinsonian patients with L-dopa (Caine, Stem & others, 1969; Cotzias, Papavasilion

and Gellene, 1969; Godwin-Austen, Tomlinson & others, 1969; Yahr, Duvoisin & others, 1969).
The work has been supported by grants from the Faculty o f Medicine, University of Göteborg, Göteborg; the Swedish State Medical Research Council (No. B70- 14X-2863-01) and “Läkemedelsindustriföreningen”, Stockholm. For generous gifts o f drugs we are obliged to Merck Sharp & Dohme International (M K 485); AB Astra, Södertälje, Sweden (FLA-63); Janssen Pharmaceutic, Beerse, Belgium (spiroperidol). We are greatly indebted to Mrs. Gunnel Adler, Miss Anna Janson and Miss Ann-Sofie Järnström for skilful technical assistance.
D ep a r tm e n t o f P harm aco logy ,U niversity o f G öteborg,S -40033 , G öteborg , Sw eden .
December 15, 1969R E F E R E N C E S
B a r t o l i n i , G. & P l e t s c h e r , A. (1969). J. Pharm. Pharmac., 21, 323-324.B l a s c h k o , H. & C h r u s c i e l , T. L. (1960). J. Physiol., Lond., 151, 272-284.B u t c h e r , L. L. & E n g e l , J. (1969a). J. Pharm. Pharmac., 21, 615-616.Butcher, L. L. & Engel, J. (1969b). Brain Res., 15, 233-242.Calne, D. B., Stern, G. M., Laurance, D. R., Sharkey, J. & Armitage, P. (1969). Lancet,
1, 744-747.C a r l s s o n , A. (1964). Acta neuroveg., 26, 484-493.C a r l s s o n , A. (1969). Paper read at the Laurentian Conference on L-dopa, Val David, Que.
Canada, November 9-11, 1969.C arlsson, A., Lindqvist, M. & M agnusson, T. (1957). Nature, Lond., 180, 1200.Cotzias, G. C., Papavasilion, P. S. & G ellene, R. (1969). New Engl. J. Med., 280, 337-345. G aillard, J. M., Schaeppi, R. & T issot, R. (1969). Archs int. Pharmacodyn. Ther., 180, 423-437. G odwin-Austen, R. B., T omlinson, E. B., F rears, C. C. & K ok, H. W. L. (1969). Lancet,
2, 165-168.H enning, M. (1969a). Acta pharmac. tox., 27, 135-148.H enning, M. (1969b). Acta physiol, scand., Suppl. 322.H o l t z , P. & P a l m , D. (1966). Ergebn. physiol., 58, 1-580.Porter, C. C., W atson, L. S., T itus, D. C., Totaro, J. A. & Byer, S. S. (1962). Biochem.
Pharmac., 11, 1067-1077.S v e n s s o n , T. H. & W a l d e c k , B. (1969). Europ. J. Pharmac., 7, 278-282.Y a h r , M. D., D u v o i s i n , R. C., S c h e a r , M. J., B a r r e t , R. E . & H o e h n , M. M. (1969). Arch.
Neurol., 21, 343-354.
LETTERS TO the editor, /. Pharm. Pharmac., 1970, 22, 243 243
M. H enning A. R ubenson
Multiple-drop formation in emulsionsThe term “multiple emulsion” has been used to describe the phenomenon in which drops of the disperse phase themselves contain smaller droplets which are normally considered to have the same composition as the continuous phase (Clayton, 1943). Multiple-drops appear to form most readily where an emulsion is inverting fromoil-in-water to the water-in-oil type or vice-versa—conditions under which no one form of the emulsion is favoured (Seifriz, 1925). Various theories have been suggested to explain their formation (Bancroft, 1912; Parke, 1934; Pavlushenko & Yanishevski, 1959).
We have recently been making a phase rule investigation of a model four-component emulsion, and wish to report a case of multiple-drop formation arising from the presence of three liquid phases under certain conditions.
The present case of multiple-drop formation, which is restricted to the three-phase region, indicates the possibility that some of the former reports may arise from a similar cause, since three-phase formation in systems containing surfactants may be

244a common occurrence (Mulley & Metcalf, 1964). The system concerned contains a non-ionic surfactant of the polyoxyalkanol type, C8H17.[OCH.CH2]6.OH (abbreviated to C8E6) (Mulley, 1967), water and two “oils”, dodecane, and n-octanol. Three of these components form two pairs of partially miscible liquids, water-dodecane and water-octanol, other component pairs are miscible in all proportions. The four components form a single pair of partially miscible liquids at low surfactant concentrations, but a third liquid phase at certain higher concentrations above about 1%. This third phase contains a larger proportion of surfactant than either of the two other liquid phases.
Consideration of the possible physical forms which dispersions containing three liquid phases can take, leads to the following conclusions. Where no multiple-drops occur, three forms of a three-liquid phase dispersion are possible. These are systems in which one of the phases is continuous, the two others being dispersed as individual droplets within it. Where multiple-drops are formed, providing no phase exists in both a continuous and dispersed state, a further six dispersion types are possible. In these there is a continuous phase containing drops of a second phase with internal drops of the third. Should a continuous phase also be present as a dispersed phase within droplets of one of the other liquids, then more complex systems may be formed.
According to the phase rule, when three liquid phases occur within a four- component system at a fixed temperature the system is univariant. If the composition is fixed the system automatically becomes invariant. The three liquid phases may be represented, in a regular tetrahedron used to describe the system (Ricci, 1951), by a triangular plane. The apices of the triangle are at points on the surface of the three- phase region, and represent the composition of the individual phases. Any overall composition lying in the same triangular plane forms phases of the same composition, but the relative proportion of each may vary.
Multiple-drop formation was investigated in the three-phase region at 25°. Most of the work was conducted at an overall composition of 5-3% C8E6, 42-9% water, 45-6% dodecane and 6-2% octanol. Separation of the equilibrated phases, followed by analysis, gave their compositions a s :—phase one: 2, 0-57, 88-7 and 8-73; phase tw o: 13-1, 24-5, 49-58, and 12-82; phase three: 0-5, 99-31, 0-12 and 0-07% respectively. Dispersions of various phase-volume ratios were prepared by a gentle hand-shaking technique. The emulsions so formed were finely dispersed, but relatively unstable. Their physical characteristics were examined microscopically. When one phase was present in high proportion (approximately 95%) emulsions belonging to the first three types described above were observed. When the phases were more equal in volume, not only individual droplets of the two disperse phases were present, but also multiple-drops belonging to one or more of the other six possibilities. Multiple- drops where the continuous phase was also present as droplets internal to one of the other phases were likewise observed in the same dispersions. In these complex situations it seems that the number of drops observed belonging to each type is a function of their relative rates of formation and stability.
Multiple-drop formation could be important in emulsion products or in processes involving emulsion formation where components are mainly present in internal droplets and therefore relatively inaccessible; conversely the internal droplets may provide a locus of high concentration of a particular component from which diffusion is restricted. Ordinary emulsions have these properties to some degree, and examples where such effects have been noted include systems containing preservatives (Bean, Konning & Malcolm, 1969) or biologically active compounds (Ghanem, Higuchi & Simonelli, 1969) and in emulsion polymerization (Harkins, 1947). Three-liquid systems may also be of use in solvent extraction and other processes in which partition is important (Christensen, 1962).
letters to the editor, J. Pharm. Pharmctc., 1970, 22, 244

245Postgraduate School o f Studies in Pharmacy, B. A . M ulleyUniversity o f Bradford, J. S. M arlandBradford 7, U.K.December 1 1 , 1969
LETTERS to the editor, J. Pharm. Pharmac., 1970, 22, 245
R E F E R E N C E S
B a n c r o f t , W. C. (1912). J. phys. Chem., 16, 739-758.B e a n , H. S., K ö n n in g , G . H. & M a l c o l m , S. A. (1969). / . Pharm. Pharmac., 21, 173S-181S
and references cited therein.C h r is t e n s e n , J. A. (1962). Acta. chem. scand., 16, 2363-2367.C l a y t o n , W. (1943). The Theory o f Emulsions and their Technical Treatment, 4th edn, p. 252,
London: J. & A. Churchill.G h a n e m , A b d e l - H a l im , H ig u c h i , W. I. & Sim o n e l l i, A. P. (1969). J. pharm. Sei., 58, 165-174. H a r k in s , W. D. (1947). J. Am. chem. Soc., 69, 1428-1444.M u l l e y , B. A. (1967). Non-ionic Surfactants. Editor: Schick, M. J., p. 422, New York:
Marcel Dekker.M u l l e y , B. A. & M e t c a l f , A. D. (1964). J. Colloid Sei., 19, 501-515.Parke, J. B. (1934). J. chem. Soc., 1112-1115.Pavlushenko, I. S. & Yanishevski, A. V. (1959). Zh. prikl. Khim., 32, 1495-1502. Chem.
Abstr., 53, 19479g.R ic c i , J. E. (1951). The Phase Rule and Heterogeneous Equilibrium, p. 390. New York: D. Van
Nostrand.Se if r iz , W. (1925). J. phys. Chem., 29, 738-749.
The use of a compression modulus to describe compactionbehaviour
Several authors, including Carless & Leigh (1969) have used a compression modulus o f the form log (P)/(D) (where P is a function o f axial pressure, and D is a function o f density o f the compact) to describe the compaction behaviour o f particulate materials. The following results may indicate a need for caution in certain instances when using a parameter o f this type.
In a discussion o f the effect o f moisture on the compaction o f sodium chloride at a series o f pressures, Huffine (1953) quoted mean values o f the “ pressing modulus” , d log Pa/dVr proposed by Bal’shin (1938), although the relation between the logarithm of applied pressure P a, and the relative volume Vr was not linear over the entire range o f applied pressure. The “ pressing modulus” was shown to increase when the particulate material was previously exposed to conditions o f elevated humidity. Huffine considered that this implied an increase in the resistance to consolidation o f the compressed material. However, inspection o f Huffine’s data (Table 1) shows that at each applied pressure, the relative volume was greatest for the dry material.
Table 1. Effect o f moisture on the relative volume o f compacts prepared from 24-28 mesh sodium chloride (Huffine, 1953)
Relative humidity of storage for 24 hApplied pressure
(p.s.i.) 0 % 36-4% 54-2% 74-9%1880 1-374 1-355 1-329 1-2789410 1-150 1-126 1-146 1 - 1 0 1
33940 1 - 0 2 0 1 - 0 0 1 1-005 1-01461200 1 - 0 0 1 0-987 0-993 1 - 0 0 1
dlog Pa/dVI 3-17 3-32 3-58 3-67

246 letters to the editor, /. Pharm. Pharmac., 1970, 22, 246
Applied pressure (Pa) kg cm- 2
F ig . 1. The effect of moisture on the relation between the relative volume and the logarithm of applied pressure for sodium chloride (30-40 mesh) A ; dry material compressed in a “conditioned” die, • ; 0-02% moisture, □ ; 0-55% moisture.
During the initial stage o f compaction, consolidation occurs mainly by the relative movement of intact particles. The present results (Fig. 1) demonstrate that at low pressure, the relative volume o f material containing moisture is much lower than that o f a dry compact. This suggests that the formation o f temporary struts, columns and vaults (Endersby, 1940) is minimized by a lubricant effect o f moisture at the die wall and interparticulate boundaries (Shotton & Rees, 1966).
A t higher pressures, when voidage reduction occurs mainly by deformation and fragmentation, the lubricant property o f moisture will have less effect on consolidation, and the slope o f a graph o f relative volume versus logarithm of applied pressure is therefore decreased by moisture. Consequently, the “ pressing modulus” d log Pa/dVr is increased although at all values o f applied pressure the relative volume is lower than for dry material. Accordingly, in such cases it is insufficient to quote values o f the pressing modulus unless the actual relations between pressure and relative volume are also considered. Huffine’s conclusions that moisture increased the resistance to consolidation, and did not exert a lubricant effect, appear to be invalid for this reason.
Sandoz Ltd. J . E. R eesPharmaceutical Research and Development,CH 4002 Basle, Switzerland.November 18, 1969
r e f e r e n c e s
B a l ’s h in , M. Yu. (1938). Vest. Metalloprom., 18, 124-137.C arless , J. E. & L e ig h , S. (1969). Paper B.21 presented to Fédération Internationale Pharmaceutique, 29th International Congress of Pharmaceutical Sciences, London, September 7-12. E n d e r s b y , V. A. (1940). Proc. Am. Soc. Test Mats, 40,1154-1173.H u f f in e , C. L. (1953). Ph.D. Thesis, Columbia University.Sh o t t o n , E. & R ees, J. E. (1966). J. Pharm. Pharmac., 18, Suppl., 160S-167S.

247The prediction of the tensile strength of tablets
Pharmaceutical tablets usually consist o f more than a single ingredient, but there appears to be no way o f quantitatively predicting the properties o f the tablets from a consideration o f the properties o f the individual components, even for a simple system. We have found for a single material, lactose, which exists in 3 forms, a- anhydrous, ^-anhydrous and a-monohydrate, that it is possible to predict the strength o f tablets prepared from mixtures o f the three forms from measurements o f the strength o f tablets prepared from the individual components.
Tablets were prepared from 0-5 g. o f each o f the 3 forms o f lactose (particle size 0-32 fim) and from 2 and 3 component mixtures o f the different forms. The compaction was made at several loads at slow rates with an Instron Physical Testing Instrument modified to take a 1-27 cm flat-faced punch and die system.
The tablets produced were subjected to the diametral compression test described by Fell & Newton (1968). A typical example o f tensile failure is shown in Fig. 1. To
LETTERS TO the editor, J. Pharm. Pharmac., 1970, 22, 247
Fig. 1. A typical example of tensile failure of the tablet submitted to the diametral compression test.
Fig. 2A. The tensile strength of lactose tablets prepared at different compaction loads. O = a-anhydrous. X = /¡-anhydrous. # = a-monohydrate.
B. The tensile strength of tablets prepared from mixtures of a- and /¡-anhydrous lactose at 2 0 0 0 kg compaction load.
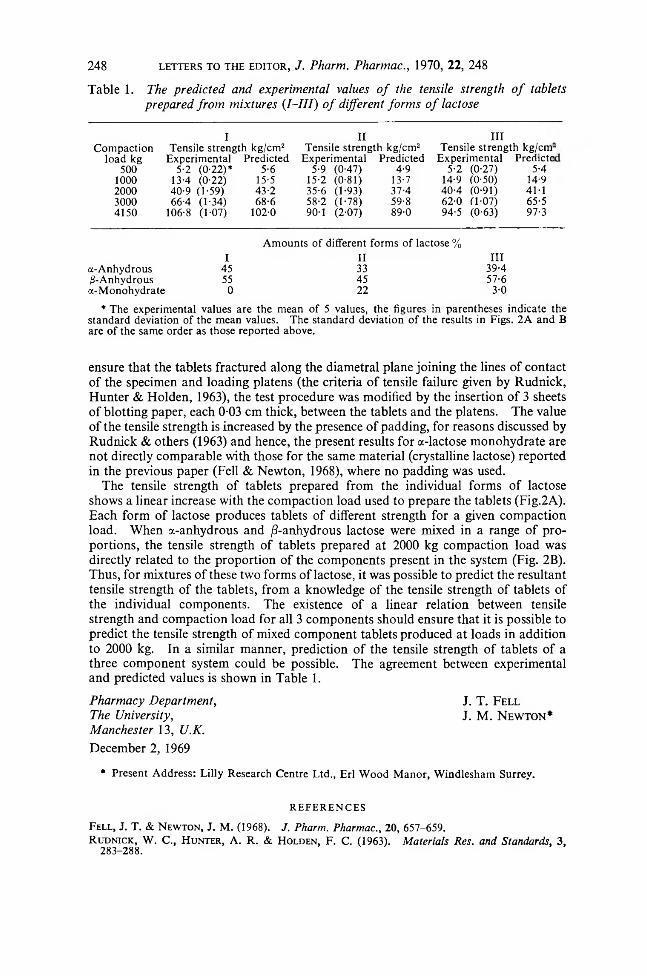
Table 1. The p re d ic te d an d experim en ta l values o f the tensile strength o f ta b le ts p rep a red fro m m ix tu res ( /- / / /) o f different fo rm s o f lactose
248 letters to the editor, J. Pharm. Pharmac., 1970, 22, 248
I II IIICompaction Tensile strength kg/cm2 Tensile strength kg/cm2 Tensile strength kg/cnr
load kg Experimental Predicted Experimental Predicted Experimental Prediete500 5-2 (0-22)* 5-6 5-9 (0-47) 4-9 5-2 (0-27) 5-4
1 0 0 0 13-4 (0-22) 15-5 15-2 (0-81) 13-7 14-9 (0-50) 14-92 0 0 0 40-9 (1-59) 43-2 35-6 (1-93) 37-4 40-4 (0-91) 4M3000 66-4 (1-34) 6 8 - 6 58-2 (1-78) 59-8 62-0 11-07) 65-54150 106-8 (1-07) 1 0 2 - 0 90-1 (2-07) 89-0 94-5 (0-63) 97-3
Amounts of different forms of lactose %I II III
a-Anhydrous 45 33 39-4/3-Anhydrous 55 45 57-6a-Monohydrate 0 2 2 3-0
* The experimental values are the mean of 5 values, the figures in parentheses indicate the standard deviation of the mean values. The standard deviation of the results in Figs. 2A and B are of the same order as those reported above.
ensure that the tablets fractured along the diametral plane joining the lines o f contact o f the specimen and loading platens (the criteria o f tensile failure given by Rudnick, Hunter & Holden, 1963), the test procedure was modified by the insertion o f 3 sheets o f blotting paper, each 0-03 cm thick, between the tablets and the platens. The value o f the tensile strength is increased by the presence o f padding, for reasons discussed by Rudnick & others (1963) and hence, the present results for a-lactose monohydrate are not directly comparable with those for the same material (crystalline lactose) reported in the previous paper (Fell & Newton, 1968), where no padding was used.
The tensile strength o f tablets prepared from the individual forms o f lactose shows a linear increase with the compaction load used to prepare the tablets (Fig.2A). Each form o f lactose produces tablets of different strength for a given compaction load. When a-anhydrous and /3-anhydrous lactose were mixed in a range o f proportions, the tensile strength o f tablets prepared at 2000 kg compaction load was directly related to the proportion o f the components present in the system (Fig. 2B). Thus, for mixtures o f these two forms o f lactose, it was possible to predict the resultant tensile strength o f the tablets, from a knowledge o f the tensile strength o f tablets of the individual components. The existence o f a linear relation between tensile strength and compaction load for all 3 components should ensure that it is possible to predict the tensile strength o f mixed component tablets produced at loads in addition to 2000 kg. In a similar manner, prediction o f the tensile strength o f tablets o f a three component system could be possible. The agreement between experimental and predicted values is shown in Table 1.
P harm acy D epartm en t,The U niversity,M an ch ester 13 , U .K .
December 2, 1969
* Present Address: Lilly Research Centre Ltd., Erl Wood Manor, Windlesham Surrey.
J. T. F ell J . M. N ew ton*
r e f e r e n c e s
F e l l , J. T. & N e w t o n , J. M. (1968). J. Pharm. Pharmac., 20, 657-659.R u d n ic k , W. C., H u n t e r , A. R. & H o l d e n , F. C. (1963). Materials Res. and Standards, 3,
283-288.

T h e P h a r m a c e u t i c a l
P r e s s1 7 B l o o m s b u r y S q u a r e , L o n d o n , W . C . 1 .
P H A R M A C E U T IC A L H ANDBO O KIncorporating the Pharmaceutical Pocket Book 18th edition85369 063 4A n E x tra P h arm acopoe ia C om pan ion V o lu m eProvides for quick reference in one convenient volume a vast amount of miscellaneous information likely to be needed by all those whose work is concerned with drugs and medicines. A detailed list of contents is available on request.To be published February 1970.720 pages. £3 10s. post free
BR IT ISH P H A R M A C E U T IC A L CO D EX 196885369 056 1Official in United Kingdom since March 3, 1969, replacing the B.P.C. 1963 and its 1966 Supplement.An international reference work providing up-to-date information on drugs and drug formulations, immunological products, human-blood products, surgical ligatures and sutures, and surgical dressings.1550 pages. £7 post free.
E X T R A PH A RM A C O PO EIA (Martindale)85369 014 6 Edited by R. G. T odd The world’s most comprehensive guide to drugs and medicines in current use. “ A complete reference library, an extensive filing system, a great mass of digested and ordered information, in one readily accessible, well indexed and excellently printed volume.” 25th edition, complete in one volume.1840 pages. 154s. 6d. post free
D RU G ID EN TIFIC A TIO N85369 0 12 XC. A . Johnson , A. D. T hornton-Jones A scheme for the identification of organic chemicals used in medicine and pharmacy. An Extra Pharmacopoeia Companion Volume.144 pages. 35s. lOd. post free.
• • • • • • • • • • • • • • • • • • • • • • • • •
A n I n t r o d u c t i o n • t o t h e C h e m i s t r y o f 3
T h e A l k a l o i d s {
A . M ck illo p BSc, P h D . OA lk a lo id C h e m is try Is p re s e n te d b o th in te rm s o f £ g e n e ra l p r in c ip le s and b y m eans o f d e ta ile d illu s - m t r a t iv e e x a m p le s . P ro b le m s , in c lu d in g fu l ly w o rk e d £ s o lu tio n s , h ave been chosen and o rg a n ise d t o e x t e n d f th e re a d e r 's u n d e rs ta n d in g and a p p re c ia t io n . a
408 52473 I 212 Pages line diagrams Limp 3 4 s O
P h a r m a c e u t i c a l C h e m i s t r y - 2 •
In te rn a tio n a l U n io n o f P u re an d • A p p lie d C h e m is try •R e s e a rc h -le v e l pap ers p re s e n te d a t th e S econd J : In te rn a t io n a l S y m p o s iu m o n P h a rm a c e u tic a l C h e m - J .' is try h e ld in M u n s te r /w e s t f . G e rm a n y , 22-26 Ju ly 5 1968. •408 89481 4 265 pages illustrated 6 0 s £
Available from leading booksellers or: ■■
T h e B u t t e r w o r t h G r o u p •8 8 K in g s w a y London W C 2 •
U W I S TC a r d i f f
University of Wales Institute of Science and Technology
W ELSH SCHOOL OF P H A R M A C Y L E C T U R E R S
PH A R M A C EU T IC A L C H EM IST R Y — in the Physical and Analytical fields.
A PPLIED PH A R M A C O LO G Y
Salary range £1240 to £2045 (bar) to £2850, with F.S.S.U .
Details and form (to be returned by 20th March, quoting Ref. JPP) obtainable from Personnel Officer, UW IST, Cardiff, C F 1 3NU.

V o lu m e 22 Num ber 3 March 1970
153-169
170-179
180-188
189-192
193-197
198-201
202-204
205-213
214-221
222-223
224-226
226-227
228-230
231-232
233-235
235-237
238- 239
239- 240
241-243
243-245
245-246
247-248
Original PapersA. S. V. BURGEN, J. C. METCALFEThe application of nuclear magnetic resonance to pharmacological problemsR. HICKSThe influence of corticosteroid pretreatment on anaphylactic bronchoconstriction in the guinea-pigGLYNNE E. MOORE, STELLA R. O’DONNELLA potent ^-adrenoreceptor blocking drug: 4-(2-hydroxy-3-isopropylaminopropoxy)indoleM. W. PARKES, CHRISTINE A. GERRARDThe activities of a - and /3-adrenoceptive blocking agents in reducing intestinal relaxation due to sympathetic stimulation in the pithed rat STEPHEN H. CURRYPlasma protein binding of chlorpromazineA. S. CURRY, D. A. PATTERSONA procedure for the analysis of illicit diamorphine samplesR. W. DAISLEY, C. J. OLLIFFA note on the determination of mixtures in dichlorophen and hexachloropheneG. M. ANTHONY, C. J. W. BROOKS, B. S. MIDDLEDITCHThe use of boronate derivatives in the characterization of catecholamines and related ^-hydroxy-amines by gas liquid chromatography-mass spectrometry J. B. KAY, J. B. ROBINSON, B. COX, D. POLKONJAK1,2-Disubstituted cyclohexanes as substrates of acetylcholinesterase and muscarinic agents. A re-investigation
Letters to the EditorJ. B. ROBINSONThe absolute configuration o f /ra/w-2-dimethylaminocyclohexyl acetate methiodide : chemical verificationA. P. GOOSSENS, M. C. B. VAN OUDTSHOORNDetermination o f pharmacokinetic parameters for urinary excretion o f sulphafurazole under normal and controlled alkaline urine conditionsIAIN C. CAMPBELL, ARCHIBALD TODRICKPlasma protein binding o f tricyclic antidepressive drugsH. O. J. COLLIER, G. W. LYNN JAMESThe release and detection o f bronchoactive substances by serially perfused isolated lungsB. COX, SALLY E. HECKER, A. H. WESTONEffect o f two cholinesterase inhibitors on acetylcholine release from guinea-pig isolated ileum preparationN.-E. ANDÉN, P. LUNDBORGRecovery o f the amine uptake-storage mechanism in nerve granules after reserpine treatment: inhibition by axotomyI. M. MAZURKIEWICZ-KWILECKI, A. ROMAGNOLICardiac catecholamine levels and blood pressure after chronic treatment with (3-adrenergic blocking agentsYU. P. VEDERNIKOVThe role o f brain catecholamines in morphine analgesic action in morphine tolerant ratsSUSAN R. MAYER, P. J. SOUTHGATE, A. B. WILSONCentral nervous system stimulant action o f fenfluramine in rabbitsM. HENNING, A. RUBENSONEvidence for a centrally mediated hypotensive effect o f L-dopa in the ratB. A. MULLEY, J. S. MARLAND Multiple-drop formation in emulsionsJ. E. REESThe use o f a compression modulus to describe compaction behaviourJ. T. FELL, J. M. NEWTONThe prediction o f the tensile strength o f tablets
-4.flJEl. 2513