Analysis for Natural Gas and Similar Gaseous Mixtures by Gas ...
Upload
khangminh22Category
view
0download
0
Journal of Natural Gas Science and Engineering 96 (2021) 104271
Available online 30 September 20211875-5100/© 2021 The Authors. Published by Elsevier B.V. This is an open access article under the CC BY license (http://creativecommons.org/licenses/by/4.0/).
Energy efficiency and environmental measures for Floating Storage Regasification Units
Manuel Naveiro a,*, Manuel Romero Gomez b, Ignacio Arias Fernandez b, Alvaro Baalina Insua b
a Energy Engineering Research Group, University Institute of Maritime Studies, ETSNM, University of A Coruna, Paseo de Ronda 51, A Coruna, 15011, Spain b Energy Engineering Research Group, University Institute of Maritime Studies, Nautical Sciences and Marine Engineering Department, ETSNM, University of A Coruna, Paseo de Ronda 51, A Coruna, 15011, Spain
A R T I C L E I N F O
Keywords: Floating storage regasification unit Energy Efficiency Design Index Energy Efficiency Operational Indicator Carbon footprint Liquefied natural gas
A B S T R A C T
In view of the need to reduce greenhouse gas emissions from the maritime sector, this paper proposes design and operation indicators for the assessment of Floating Storage Regasification Unit (FSRU) energy efficiency and carbon footprint. Such indicators are applied to the study of five regasification systems: seawater system without recondenser (Case 0), seawater system (Case 1), open-loop propane system (Case 2), closed-loop water-glycol system (Case 3) and open-loop system with Organic Rankine Cycle (ORC) (Case 4). Of the regasification systems installed in FSRUs, Case 1 proves most energy efficient, closely followed by Case 2. If the cold energy of liquefied natural gas (LNG) were to be exploited in the regasification process, Case 4 would present an Energy Efficiency Design Index (EEDI) 41.25% lower than that of Case 1, whilst positioned at the opposite end of the scale is Case 3 with an EEDI of 347.98% higher. The Carbon Footprint Design Index (CFDI), in comparison with the EEDI, further includes emissions deriving from the methane slip from dual fuel engines and the CO2 capture ratio factor for the possible implementation of Carbon Capture and Storage (CCS) systems. In the cases analysed, the CFDI with a methane slip of 5.5 g/kWh represents an increase of 4–28% with regard to the EEDI.
1. Introduction
The Fourth International Maritime Organization (IMO) greenhouse gas (GHG) Study published in 2020 relates a rise in shipping GHG emissions of 9.6% between the years 2012–2018. Should no further measures be taken to cut shipping emissions, these are projected to rise from 90% of the 2008 value in 2018 to 90–130% in 2050 for a number of plausible long-term energy and economic scenarios (IMO, 2021a). Thus, in 2018, the IMO published the Initial Strategy on the reduction of GHG emissions, with the objective to reduce maritime transport GHG emis-sions by at least 50% by 2050 compared to 2008 levels (IMO, 2018a). Fulfilment of the IMO’s ambitious goals require a range of solutions such as more stringent measures related to energy efficiency in the design and operation of ships, the installation of innovative technologies that reduce emissions, and the uptake of low and zero carbon fuels.
Considering the IMO’s concern to reduce GHG emissions, the use of natural gas (NG) in the maritime sector as an alternative to marine gas oil (MGO) or heavy fuel oil (HFO) may prove beneficial whilst zero carbon emission fuel technologies remain to be implemented. NG is the
fossil fuel that emits the least CO2 per kilogram of fuel, owing to the high hydrogen-carbon ratio of its main component, methane (Mokhatab et al., 2014). Moreover, it barely contains traces of sulphur and NOx emissions in internal combustion engines significantly drop if the reac-tion is carried out with lean mixtures, thereby complying with Tier III in emission control areas (ECAs) without adopting exhaust-gas treatment systems. In recent years, however, there has been some debate about the suitability of NG as an alternative to current liquid fuels (Pavlenko et al., 2020; Schuller et al., 2019). This is due to the small amount of methane that does not react in the engine combustion process (methane slip) and is released directly into the atmosphere, contributing to CO2 equivalent emissions. The methane slip is of particular importance in four-stroke low pressure injection dual fuel (LPDF) engines (lean-burn), these being the shipping industry’s most popular NG engine technology worldwide (Pavlenko et al., 2020; Ushakov et al., 2019). It is of concern to companies in the industry, who are continually seeking to improve the combustion process and propose new technologies (MAN B&W, 2016; Wartsila, 2020).
Although mandatory energy efficiency measures adopted by the IMO apply to different vessel types, those that operate stationarily are not
* Corresponding author. E-mail addresses: [email protected] (M. Naveiro), [email protected] (M. Romero Gomez), [email protected] (I. Arias Fernandez), alvaro.
[email protected] (A. Baalina Insua).
Contents lists available at ScienceDirect
Journal of Natural Gas Science and Engineering
journal homepage: www.elsevier.com/locate/jngse
https://doi.org/10.1016/j.jngse.2021.104271 Received 29 May 2021; Received in revised form 18 August 2021; Accepted 28 September 2021
Journal of Natural Gas Science and Engineering 96 (2021) 104271
2
included, as is the case of Floating Production Storage and Offloading (FPSOs), Floating Liquefied Natural Gas (FLNG) Units, Floating Storage Units (FSUs) and Floating Storage Regasification Units (FSRUs). More-over, methods for the evaluation of energy efficiency are flawed when assessing GHG total emissions. The negative effect caused by the methane slip is not taken into account for NG-fuelled vessels, nor is the reduction of CO2 emissions for those ships that adopt carbon capture and storage (CCS) technologies (Ekanem Attah and Bucknall, 2015; Lee et al., 2021).
FSRUs carry out the regasification process of liquefied natural gas (LNG), which is transported by LNG vessels at a temperature of − 160 ◦C and pressure slightly above atmospheric, and offload the NG in super-critical conditions to the gas pipeline network for subsequent con-sumption by users (Mokhatab et al, 2014, 2018). Regasification vessels cannot be considered as a complete substitute for conventional regasi-fication terminals, but are a cost-effective alternative for specific pro-jects that allow a quick and convenient delivery of gas (Norrgård, 2018; Songhurst, 2017). Since the delivery of the first regasification vessel in 2005, a total of 38 were constructed by the end of 2020. Although the first FSRUs were new-build or conversions of LNG vessels with steam
turbine propulsion systems, today it is common to install an electric propulsion system known as dual fuel diesel electric (DFDE) (IGU, 2020). In this system, four-stroke LPDF engines generate all the power required by the ship’s auxiliary services and electric propulsion motors.
Given the IMO’s ambition to reduce GHG emissions, design and operating indicators to determine the energy efficiency and carbon footprint of any vessel type are absolutely essential. This not only es-tablishes emission limits depending on the ship type, but also allows assessment of the impact of new technologies related to GHG emission reduction. The indexes and indicators proposed by the IMO, however, are limited to energy efficiency and are invalid for those vessels that are not engaged in cargo transport, as is the case with FSRUs. Thus, methods to evaluate the energy efficiency and the carbon footprint of FSRUs are proposed in the present paper, both at the design stage and operation phase. No previous work has been published on regasification vessels to this end. Herein, indicators are applied in the analysis of the main regasification system types installed in this vessel type according to their work loop: systems that employ seawater as a heat source in the rega-sification process (open loop); and systems that employ steam produced in the boilers (closed loop). A total of five cases are evaluated, one of
Nomenclature
Symbols ηG average efficiency of the generators (− ) CCCCS CO2 capture (kg) CF carbon factor (− ) D distance in nautical miles (nm) PAEeff net auxiliary power of innovative technology (kW) Q heat transfer rate (kW) Vref reference speed (kn) fccs carbon capture ratio (− ) feff disponible factor of innovative technology (− ) m mass flow rate (kg/s) h specific enthalpy (kJ/kg) FC fuel consumption (kg/s) H enthalpy (kJ) ME methane emissions (kg) MS methane slip (g/kWh) P,W power (kW) SFC specific fuel consumption (kg/kWh) f correction factor (− ) v specific volume (m3/kg) ρ density (kg/m3)
Subscripts and Superscripts AE auxiliary engines ME main engine n natural RB regasification boilers w weather
Abbreviations AC/NGH after cooler/natural gas heater BOG boil off gas BOR boil off rate CCS carbon capture and storage CEDI Carbon Emissions Design Index CFDI Carbon Footprint Design Index CFOI Carbon Footprint Operational Indicator CFRI Carbon Footprint Regasification Indicator CII Carbon Intensity Indicator DC drain cooler
DFDE dual fuel diesel electric DO diesel oil EEDI Energy Efficiency Design Index EEOI Energy Efficiency Operational Indicator EERI Energy Efficiency Regasification Indicator EEXI Energy Efficiency Existing Ship Index FDF forced draught fan FLNG floating liquefied natural gas FPSO floating production, storage and offloading FSRU floating storage regasification unit FSU floating storage unit FT feed tank FV forcing vaporizer GCU gas combustion unit GHG greenhouse gas GWP global warming potential HFO heavy fuel oil HP high pressure IHS Information Handling Services IMO International Maritime Organization LD low duty LHV lower heating value LNG liquefied natural gas LPDF low pressure injection dual fuel MGO marine gas oil MX mixer NG natural gas ORC organic Rankine cycle P pump PE propane evaporator PH preheater R recondenser S separator SEEMP Ship Energy Efficiency Management Plan SW seawater T steam trap or turbine TH trim heater V valve VP vaporizer WGH water-glycol heater
M. Naveiro et al.

Journal of Natural Gas Science and Engineering 96 (2021) 104271
3
which includes an LNG cold energy exploitation system for power generation.
2. Measurement of the energy efficiency for typical vessels
Regulations on energy efficiency for international shipping were not published by the IMO until July 2011 with Resolution MEPC.203 (62) (IMO, 2011). The amendments adopted included a new chapter to MARPOL Annex VI: Chapter 4 - Regulations on energy efficiency for ships. The regulations came into force on January 1, 2013 and involve the application of two mandatory measures: the Energy Efficiency Design Index (EEDI) for new ships and the Ship Energy Efficiency Management Plan (SEEMP) for all ships. Further to the amendments to
MARPOL Annex VI, the IMO has published, and continues to periodi-cally update, guidelines regarding the calculation of the EEDI reference levels (required EEDI), the calculation method and EEDI certification in new ships (attained EEDI), as well as the preparation of the SEEMP.
At present, there are only two methods of measuring a ship’s energy efficiency: the EEDI, applicable to the design stage and prior to delivery of the ship; and the Energy Efficiency Operational Indicator (EEOI), formulated to evaluate the efficiency of vessels in operation. Both methods present the ship’s CO2 emissions from the work of transporting the cargo. The IMO is currently developing the Energy Efficiency Existing Ship Index (EEXI) and the Carbon Intensity Indicator (CII) (IMO, 2021b). The EEXI is expected to be quite similar to the EEDI: there will be a required EEXI and attained EEXI but applied to all built ships. The CII, however, will constitute an annual operational rating, which will be verified against a required CII. Depending on the proximity, a rating will be recorded in the ship’s SEEMP to indicate a major superior (A), minor superior (B), moderate (C), minor inferior (D) or inferior (E) performance level. Vessels rating classification D for three consecutive years or E in one year will need to submit a corrective action plan to put forward how the objective CII would be achieved.
2.1. Energy Efficiency Design Index (EEDI)
With few exceptions, all new ships built as of January 2013 with a gross tonnage of 400 and above with conventional mechanical propul-sion that are not considered fixed or floating platforms (FPSO, FSU …) are required to calculate the attained EEDI; a value that must be under or equal to the required EEDI. Existing ships that have undergone major conversions affecting energy efficiency are also subject to EEDI deter-mination (IMO, 2017).
2.1.1. Attained EEDI Generally, the EEDI formula can be represented by the following
terms:
where [MECO2 ] is the CO2 emissions from the main engines, [AECO2 ] is the CO2 emissions from the auxiliary engines, [PTICO2 ] is the CO2 emissions from the power shaft motor, [IEET AECO2 red.] is the CO2 emissions reduction from the innovative energy efficient technologies for the auxiliary engines, [IEET MECO2 red.] is the CO2 emissions reduction from the innovative energy efficient technologies for the main engines, and [TW] is the transport work.
If the terms of Eq. (1), are broken down, the equation to calculate of the attained EEDI (EEDIattained) is:
where nME is the number of main engines, fj is a correction factor that allows taking into account the ship’s specific design elements, PME(i) is 75% of the installed nominal power (MCR) of each main engine deducting the power consumed by the shaft generators (kW), CFME(i) is the non-dimensional conversion factor between fuel consumption and CO2 emissions (gCO2/gfuel) for each main engine, SFCME(i) is the certified specific fuel consumption (g/kWh) of each main engine at 75% of the MCR power (83% for LNG carriers with diesel-electric or steam turbine propulsion systems), PAE is the auxiliary engine power required to sup-ply the normal maximum load at sea (kW), CFAE is the non-dimensional conversion factor between fuel consumption and CO2 emissions (gCO2/ gfuel) for auxiliary engines, SFCAE is the weighted average certified specific fuel consumption of the auxiliary engines at 50% of the MCR (75% of the MCR if PAE is determined using the electrical power table), nPTI is the number of electric engines coupled to the shaft, PPTI(i) is 75% of the nominal power consumed by each engine coupled to the shaft divided by the weighted average efficiency of the generator(s) (83% for steam turbine propulsion systems), neff is the amount of innovative energy efficient technologies, feff(i) is the availability factor of an inno-vative energy efficient technology, PAEeff(i) is the auxiliary engine power reduction due to innovative electrical energy efficient technologies (measured at power PME(i)), Peff(i) is the power of the innovative me-chanical energy efficient technologies for propulsion at 75% of the main engine power (kW), fi is the capacity factor for any technical/regulatory limitation on capacity, fc is the cubic capacity correction factor, fl is the factor for general cargo ships equipped with cranes and other cargo- handling related devices to compensate for a ship’s deadweight loss, Capacity is the deadweight (t) (gross tonnage for passenger ships and
EEDI(gCO2
t nm
)=[MECO2 ] + [AECO2 ] + [PTICO2 ] − [IEET AECO2 red.] − [IEET MECO2 red.]
[TW], (1)
EEDIattained =
(∏nME
j=1fj
)(∑nME
i=1PME(i)CFME(i)SFCME(i)
)⏞⏟⏟⏞[MECO2 ]
+ (PAECFAESFCAE)⏞⏟⏟⏞
[AECO2 ]
fifcfl(Capacity)fwVref⏟ ⏞⏞ ⏟
[TW]
+
((∏nME
j=1fj
∑nPTI
i=1PPTI(i) −
∑neff
i=1feff (i)PAEeff (i)
)CFAESFCAE
)⏞ ⏟⏟ ⏞[PTICO2 ]− [IEET AECO2 red.]
−(∑neff
i=1feff (i)Peff (i)CFME(i)SFCME(i)
)⏞⏟⏟⏞[IEET MECO2 red.]
fifcfl(Capacity)fwVref⏟ ⏞⏞ ⏟
[TW]
, (2)
M. Naveiro et al.

Journal of Natural Gas Science and Engineering 96 (2021) 104271
4
cruise ships), fw is a non-dimensional coefficient that indicates the decrease in speed in representative sea conditions in terms of the wave height and frequency and the wind speed (value equal to 1.00 for the calculation of the attained EEDI) and Vref is the vessel speed (kn), measured in deep water in the condition corresponding to the Capacity with the propulsive power PME(i) and in favourable weather conditions (IMO, 2018b).
Most of the parameters involved in the EEDI computation are determined in accordance with the guidelines given in MEPC.308 (73) (IMO, 2018b). Document MEPC.1/Circ.815 (IMO, 2013a) is compli-mentary to the previous resolution, providing guidelines for the instal-lation of innovative energy efficient technologies. Moreover, if the EEDI is determined considering the impact of meteorological conditions (EEDIweather), MEPC.1/Circ.796 (IMO, 2012) details the calculation of fw.
2.1.2. Required EEDI The IMO established four phases (the penultimate one currently in
force) to reduce CO2 emissions from maritime transport. Initially, these phases would progressively reduce the required EEDI relative to the reference level established in phase 0, attaining a decrease of 30% (phase 3) as of January 2025. This date, however, has been brought forward to April 2022 for most vessel types. For containerships of 200 000 deadweight tonnage and above, the reduction in CO2 emissions increases to 50% (IMO, 2021b).
The required EEDI (EEDIrequired) is determined based on the ship type and cargo capacity with the below formula:
EEDIrequired =
(
1 −X
100
)
ab− c, (3)
where a and c are constants dependent on vessel type, listed in Table 2 of Regulation 21 of MARPOL Annex VI, X is the reduction factor that is determined by the phase in effect and b is the deadweight (t) or the gross tonnage in the case of cruise passenger ships having non-conventional propulsion (IMO, 2017).
The constants a and c of each vessel type are determined from a regression analysis performed by plotting an estimated index value of EEDI against deadweight for several existing ships included in the In-formation Handling Services (IHS) Fairplay database in accordance with the IMO guidelines for reference lines (IMO, 2013b, 2013c). The sample comprises the existing ships with a gross tonnage of 400 and above delivered in the period from January 1, 1999 to January 1, 2009 (for ro-ro cargo and ro-ro passenger ships from January 1, 1998 to January 1, 2010). Fig. 1 shows the curves of the required EEDI, depending on the phase and deadweight, for the particular case of LNG vessels.
2.2. Energy Efficiency Operational Indicator (EEOI)
In the SEEMP preparation guidelines (IMO, 2016), the IMO recom-mends the voluntary use of the EEOI as an instrument for monitoring vessel and fleet efficiency. The equation of EEOI for a voyage (period between departures) is defined as:
EEOI =∑
jFCjCF,j
mcargoD, (4)
where j is the fuel type, FC is the mass of consumed fuel, CF is the fuel mass to CO2 mass conversion factor for fuel, mcargo is the cargo carried (t) or work done (number of TEU or passengers) or gross tonnes for pas-senger ships and D is the distance (nm) corresponding to the cargo carried or work done (IMO, 2009).
The drawback of Eq. (4) is its exclusive application to laden voyages. On a ballast voyage, the EEOI calculation results in a division by zero. To determine the mean value of indicator (EEOI) for a period or number of laden and ballast voyages, the EEOI is calculated as:
EEOI =∑
i∑
jFCijCF,ij∑
imcargo,iDi, (5)
where i is the voyage number (IMO, 2009).
3. Methods of measuring the energy efficiency and carbon footprint of FSRUs
Although most FSRUs are fitted with a propulsion system to provide a more versatile solution in the NG value chain and operate as LNG vessels, MARPOL Annex VI energy efficiency regulations do not apply to these vessels when performing their main function: the stationary stor-age and regasification of LNG. It is therefore not possible to determine the EEDI or EEOI of an FSRU with the equations provided in section 2 of the document issued by the IMO.
The EEDI and EEOI use fuel consumption to measure a ship’s CO2 emissions and could thus be considered environmental indicators. These parameters, however, do not allow for the calculation of CO2 emissions from ships with CCS technologies, since emission reduction is exclu-sively associated with systems that reduce the power produced by the main or auxiliary engines. Furthermore, they do not take into account GHG emissions other than CO2. With electric power generation systems for FSRUs, it is common to install four-stroke LPDF engines, which present a high methane slip. For these reasons, the EEDI and EEOI are
Table 1 General specifications of the model FSRU.
Item Value
Type of LNG storage tanks MARK III, maximum vapour pressure of 0.7 bar (g) and BOR of 0.15%
Cargo capacity 170 000 m3
Type of LD compressor 2 stage centrifugal compressor with pre-cooling Maximum/baseload
regasification capacity 750 mmscfd/500 mmscfd
Propulsion system DFDE Engines 3 x Wartsila 12V50DF (11.4 MW)
1 x Wartsila 6L50DF (5.7 MW)
Table 2 Specific energy consumption of 50DF engines from test runs report.
Load (%) Specific energy consumption (kJ/kWh)
Natural gas Pilot DO
25 11 922.7 234.4 50 9286.7 77.2 75 8258.4 30.1 100 7665.4 19.2
Fig. 1. EEDI required for LNG carriers as a function of phase and deadweight (a = 2253.7, c = 0.471 (IMO, 2017)).
M. Naveiro et al.

Journal of Natural Gas Science and Engineering 96 (2021) 104271
5
not adequate environmental indicators when evaluating the carbon footprint of FSRUs.
Indicators to assess the energy efficiency and carbon footprint rele-vant to FSRUs are proposed below.
3.1. Calculation of EEDI
Similar to the EEDI calculation for conventional ships, an operating point or reference condition needs to be specified for FSRU energy ef-ficiency assessment. In this case, the design conditions of the regasifi-cation system at the baseload regasification capacity are taken. As a general rule, the baseload regasification capacity can be defined as the flow of regasified NG provided by all but one regasification modules.
The proposed EEDI for FSRUs is defined by the following terms:
EEDI(gCO2
MJ
)=[RBCO2 ] + [AECO2 ] + [GCUCO2 ] − [IEET AECO2 red.]
[RE], (6)
where [RBCO2 ] is the CO2 emissions from the regasification boilers, [AECO2 ] is the CO2 emissions from the auxiliary engines, [GCUCO2 ] is the CO2 emissions from the gas combustion units (GCUs), [IEET AECO2 red.] is the CO2 emissions reduction from the innovative energy efficient tech-nologies for the auxiliary engines, and [RE] is the regasification energy.
The [RBCO2 ] term is calculated as:
[RBCO2 ] = QsteamCFRBSFCRB = QsteamCFRB1
LHVFηRB, (7)
where Qsteam is the heat flow rate produced by the regasification boilers in baseload regasification condition, CFRB is the conversion factor be-tween the boilers’ fuel consumption and the CO2 emissions, and SFCRB is the average specific fuel consumption of the regasification boilers weighted by the heat flow rate. Alternatively, the SFCRB can be deter-mined from the lower heating value of the fuel (LHVF) and the weighted average efficiency of the regasification boilers (ηRB).
The [AECO2 ] term is determined as:
[AECO2 ] =PAECFAESFCAE, (8)
where PAE is the power to develop by the auxiliary engines without the innovative energy efficient technologies that reduce the auxiliary power, CFAE is the conversion factor between the auxiliary engine fuel consumption and the CO2 emissions, and SFCAE is the weighted average specific fuel consumption of the auxiliary engines.
The PAE is estimated by the consumed electric power in baseload regasification condition (Ploads) divided by the average efficiency of the generator(s) weighted by power (ηG), as suggested by Eq. (9).
PAE =Ploads
ηG. (9)
The Ploads is calculated with the electric power table that includes the continuous and intermittent loads operating at the baseload regasifica-tion capacity. As a rule of thumb, the intermittent loads represent 5–10% of the continuous loads.
The average product CFAESFCAE for different engines and fuels used is calculated as:
CFAESFCAE =
∑i∑
jPiCFjSFCij∑
iPi, (10)
where i represents the engine, j is the fuel type, and Pi is the power developed by each engine.
The [GCUCO2 ] term is:
[GCUCO2 ] =CFGCUmGCU , (11)
where CFGCU is the conversion factor between the GCUs’ fuel con-sumption and the CO2 emissions, and mGCU is the boil off gas (BOG)
consumption of the GCUs. Currently, the regasification systems installed in FSRUs include a recondenser that condenses the BOG not consumed by the engines or boilers (excess BOG). Therefore, if the BOG recon-denser capacity (mR) is greater than the excess BOG, the GCUs do not need to be operated and the mGCU is equal to zero.
To calculate the value of mGCU, the follow equation can be applied:
mGCU = mBOG −(PAE − PAEeff
)SFCAE − mR, (12)
where mBOG is the BOG extracted from the LNG cargo tanks, and PAEeff is the net auxiliary power generated by the innovative technologies.
The mBOG is estimated from the mass balance of the cargo tanks as follows:
mBOG = mBOG,n −vLNG
vBOG
(mNG + mBOG,n
), (13)
where mBOG,n is the natural BOG mass flow, vLNG is the LNG specific volume, vBOG is the BOG specific volume, and mNG is the regasified NG mass flow.
The natural BOG mass flow (mBOG,n) is defined as (Romero Gomez et al., 2015):
mBOG,n =BOR Vtk ρLNG, (14)
where BOR is the boil-off rate, Vtk is the total cargo volume, and ρLNG is the LNG density.
The [IEET AECO2 red.] term is calculated as:
[IEET AECO2 red.] =PAEeff CFAESFCAE. (15)
The PAEeff is defined as:
PAEeff =∑neff
i=1feff (i)PAEeff (i), (16)
where feff(i) and PAEeff(i) are the availability factor and the net auxiliary power generated of each innovative energy efficient technology, respectively.
The [RE] term is:
[RE] = mNG(hNG − hLNG), (17)
where mNG is the mass flow of NG at baseload regasification capacity, hNG is the specific enthalpy of the regasified NG and hLNG is the specific enthalpy of saturated liquid at the temperature of the LNG contained in the storage tanks with the composition of the regasified NG.
Substituting Eqs. (7), (8), (11), (15) and (17) in Eq. (6) yields:
EEDIattained =QsteamCFRBSFCRB +
(PAE − PAEeff
)CFAESFCAE + CFGCUmGCU
mNG(hNG − hLNG).
(18)
3.2. Calculation of energy efficiency operational indicators
The Energy Efficiency Regasification Indicator (EERI), a measure-ment of FSRU energy efficiency when regasifying at any given moment, can be defined as:
EERI(t) =∑
jmj(t)CFj
mNG(t)(hNG(t) − hLNG(t)), (19)
where j is the fuel type, mj is the fuel mass flow, mNG is the mass flow of regasified natural gas, hNG is the specific enthalpy of the regasified natural gas and hLNG is the specific enthalpy of saturated liquid at the temperature of the LNG contained in the storage tanks with the same composition as the regasified natural gas.
The EERI mean value over a given period of time (EERI) is:
M. Naveiro et al.

Journal of Natural Gas Science and Engineering 96 (2021) 104271
6
EERI =1
t2 − t1
∫t2
t1
EERI(t)dt. (20)
Eq. (20) only allows assessment of the mean value if the regasifica-tion system operates continuously (mNG(t) > 0). The general equation for determining the average energy efficiency in a regasification oper-ation (EEOI), that is, the complete regasification of an LNG cargo (period between two loading operations), can be defined as:
EEOI =∑
jFCjCF,j
HNG − HLNG, (21)
where HNG y HLNG are the enthalpy values during the regasification operation of the regasified NG and LNG, respectively.
The average EEOI calculation (EEOI) for a period of time or number of regasification operations is:
EEOI =∑
i∑
jFCijCF,ij∑
iHNG,i − HLNG,i, (22)
where i is the regasification operation number.
3.3. Calculation of Carbon Footprint Design Index (CFDI)
The Carbon Footprint Design Index (CFDI) can be determined from the EEDI. An intermediate index, the Carbon Emissions Design Index (CEDI), is also provided, however, for a clearer understanding of the calculation method. This index evaluates FSRU CO2 emissions, while taking the installation of CCS systems into consideration.
With regard to the EEDI, the inclusion of CCS systems in the CEDI implies the modification of [IEET AECO2 red.] and the addition of a term related to the decrease of CO2 emissions in regasification boilers. Thus, the CEDI can be defined as:
where [ICRT AECO2 red.] is the CO2 emission reduction from the innova-tive carbon reduction technologies for the auxiliary engines and [ICRT AECO2 red.] is the CO2 emission reduction from the innovative car-bon reduction technologies for the regasification boilers.
The [ICRT AECO2 red.] term is calculated as:
[ICRT AECO2 red.] =(PAEeff + fCCSAE
(PAE − PAEeff
))CFAESFCAE, (24)
where fCCSAE is the CO2 capture ratio of CCS systems for auxiliary engines.
The [ICRT RBCO2 red.] term is determined as:
[ICRT RBCO2 red.] = QsteamfCCSRBCFRBSFCRB = QsteamfCCSRBCFRB1
LHVFηRB,
(25)
where fCCSRB is the CO2 capture ratio of CCS systems for regasification
boilers. Substituting Eqs. (7), (8), (11), (17), (24) and (25) in Eq. (23) yields:
Eq. (26) can be expressed in terms of the EEDI as:
CEDI =EEDI −fCCSRBQsteamCFRBSFCRB + fCCSAE
(PAE − PAEeff
)CFAESFCAE
mNG(hNG − hLNG).
(27)
The CFDI is determined based on the CEDI as:
CFDI =(PAE − PAEeff
)(GWPCH4 − (1 − fCCSAE)CFCH4 )MSAE
mNG(hNG − hLNG)+ CEDI, (28)
where GWPCH4 is the global warming potential of methane and MSAE is the average methane slip weighted by the power generated in the auxiliary engines.
3.4. Calculation of carbon footprint operational indicators
Similar to the EERI, the Carbon Footprint Regasification Indicator (CFRI) determines the CO2 equivalent emissions per unit of regasifica-tion energy at a given time as:
CFRI(t) =∑
jmj(t)CFj + mCH4 (t)(GWPCH4 − CFCH4 ) − mCCSRB(t) − mCCSAE(t)mNG(t)(hNG(t) − hLNG(t))
,
(29)
where mCCSRB y mCCSAE are CO2 mass flows captured by the CCS systems of regasification boilers and auxiliary engines, respectively, and mCH4 is the mass flow of methane in auxiliary engine exhaust gases.
The average CFRI (CFRI) is calculated as:
CFRI(geqCO2
MJ
)=
1t2 − t1
∫t2
t1
CFRI(t)dt. (30)
The Carbon Footprint Operational Indicator (CFOI) is:
CFOI =∑
jFCjCF,j + ME(GWPCH4 − CFCH4 ) − CCCCSRB − CCCCSAE
HNG − HLNG, (31)
where CCCCSRB y CCCCSAE are respectively the masses of CO2 captured by the CCS systems of the regasification boilers and auxiliary engines, and
ME is the methane emissions from the auxiliary engines in units of mass. The mean CFOI (CFOI) is defined as:
CFOI =∑
i∑
jFCijCF,ij + MEi(GWPCH4 − CFCH4 ) − CCCCSRB,i − CCCCSAE,i∑
iHNG,i − HLNG,i.
(32)
CEDI(gCO2
MJ
)=[RBCO2 ] + [AECO2 ] + [GCUCO2 ] − [ICRT AECO2 red.] − [ICRT AECO2 red.]
[RE], (23)
CEDI =(1 − fCCSRB)QsteamCFRBSFCRB + (1 − fCCSAE)
(PAE − PAEeff
)CFAESFCAE + CFGCUmGCU
mNG(hNG − hLNG). (26)
M. Naveiro et al.

Journal of Natural Gas Science and Engineering 96 (2021) 104271
7
4. Case studies
Five regasification systems are considered for analysis with the model FSRU: seawater system without recondenser (Case 0); seawater system (Case 1); open-loop propane system (Case 2); closed-loop water- glycol system (Case 3); and open-loop system with ORC (Case 4). Case 0 comprises an open loop system wherein the recondenser is limited to a suction drum as with the first regasification vessels (Janssens, 2006; Lee et al., 2005). Thus, any BOG generated in the tanks which exceeds en-gine consumption is burned in a GCU. Cases 1, 2 and 3 typify regasifi-cation systems installed in FSRUs (Eum et al., 2011; Madsen et al., 2010; Samsung Heavy Industries, 2014), while Case 4 is a modification of Case 2 to include a system that takes advantage of the LNG cold energy with an architecture similar to that proposed by different researchers and Mitsui OSK Lines (MOL) (Lee and Choi, 2016; Mitsui O.S.K. Lines, 2020; Yao et al., 2016; Yoon-Ho, 2019a, 2019b). The Aspen HYSYS program is used for the analysis of the systems.
4.1. Specifications of the model FSRU
The model ship features those characteristics typical to FSRUs that have been built over the last decade. Table 1 contains the basic speci-fications of the model FSRU, while Table 2 lists the specific energy consumptions of internal combustion engines for each fuel (NG and pilot DO) depending on the load, obtained from engine test runs.
4.2. Case 0 seawater regasification system without recondenser
Fig. 2 is a basic outline for the study of Case 0, with the components being reduced to a representative unit. A generic description of the process follows, split in two parts: the LNG flow in the regasification process; and the flow of the BOG generated in the tanks.
The LNG (state 1) contained in the storage tank is driven by the feed pump (P-1) to the suction drum (SD). Before entry, the LNG (state 2) passes through valve V-1, in which the pressure drops take place (state 3). The LNG (state 4) exiting the bottom of the suction drum increases in pressure in the booster pump (P-2) before entering the vaporizer (VP). The LNG temperature increases in the vaporizer (state 5) until attaining
the value required for the export of NG (state 6). Moreover, the vapor-izer receives seawater (state 20) discharged by the pump of the same fluid (P-3) and decreases in temperature (state 21) by 5 ◦C compared to that of the environment (state 19).
The BOG (state 11) generated in the storage tank is mixed with the BOG (state 10) from the forcing vaporizer (FV). The latter is only used in cases where engine consumption exceeds the BOG generated in the tanks. In any case, the BOG (state 12) is cooled down to a temperature of − 120 ◦C (state 13) in the mixer (MX). The cooling process is performed by spraying the LNG (state 8) supplied by the fuel gas pump onto the BOG flow. This pump also supplies the LNG (state 9) to the forcing vaporizer if required. In the separator (S), the liquid phase (state 14) is removed from the cooled BOG. Next, the low duty compressor (LD) in-creases the pressure of the BOG (state 15) coming from the separator and, subsequently, the high-pressure BOG temperature (state 16) is conditioned in the after cooler/natural gas heater (AC/NGH). Lastly, part of the BOG (state 17) is consumed by the engines, while the excess (state 18) is burned in the GCU.
4.3. Case 1 seawater regasification system
Fig. 3 depicts the schema of Case 1, which is practically identical to Case 0. The main difference is owing to the replacement of the suction drum with a recondenser (R). This component allows the condensation of excess BOG, provided that the LNG flow supplied by the feed pump is sufficient for the LNG (state 4) in the booster pump suction to remain as a subcooled liquid.
4.4. Case 2 open-loop propane regasification system
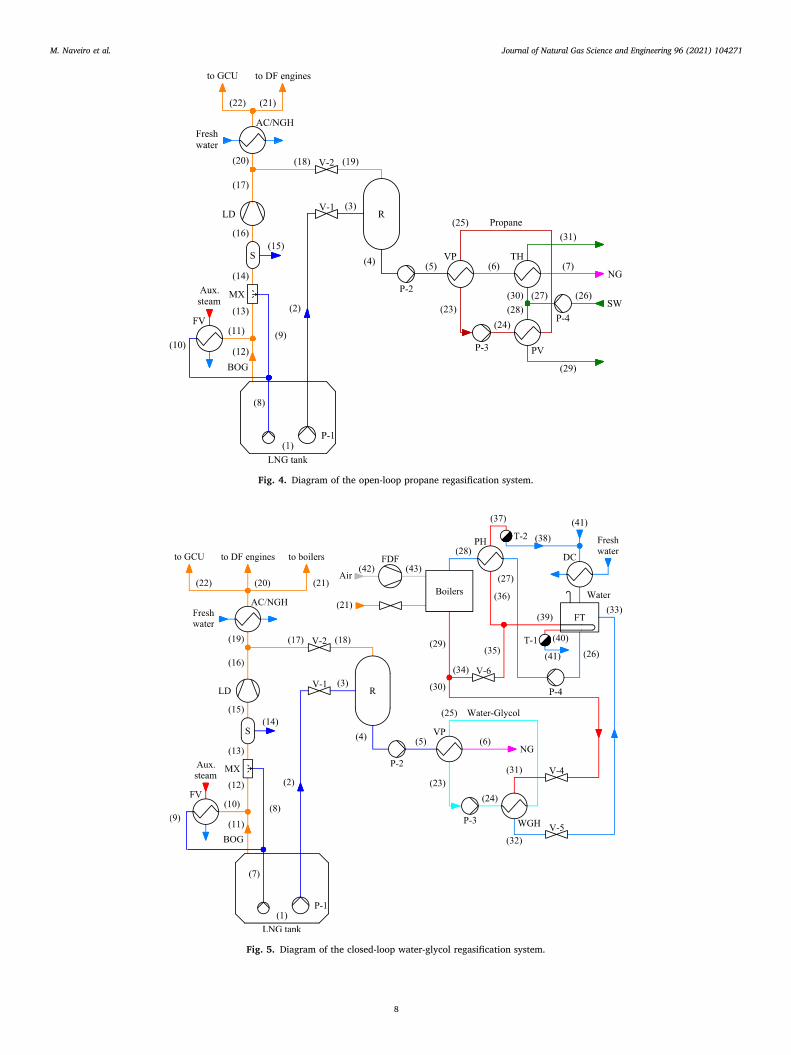
Fig. 4 illustrates the layout of Case 2 under study. This case comprises an open-loop regasification system fitted with a propane intermediate circuit in the heat transfer process between the seawater and LNG to reduce the risk of seawater freezing. Propane (state 25) in wet vapour conditions enters the vaporizer (VP), where the propane temperature drops until reaching liquid state (state 23). The fluid is then driven by the propane pump (P-3) towards the propane vaporizer (PV). Here, the propane (state 24) increases in temperature and exits (state 25) with a
Fig. 3. Diagram of the seawater regasification system.
Fig. 2. Diagram of the seawater regasification system without recondenser.
M. Naveiro et al.
Journal of Natural Gas Science and Engineering 96 (2021) 104271
8
Fig. 4. Diagram of the open-loop propane regasification system.
Fig. 5. Diagram of the closed-loop water-glycol regasification system.
M. Naveiro et al.

Journal of Natural Gas Science and Engineering 96 (2021) 104271
9
vapour quality approaching 0.8, then returning to the LNG vaporizer. The NG (state 6) exiting the vaporizer at a temperature of approximately − 20 ◦C needs to increase in temperature in the trim heater (TH) before export to shore (state 7).
4.5. Case 3 closed-loop water-glycol regasification system
A basic diagram of Case 3 is illustrated in Fig. 5. Unlike the previous cases, the LNG temperature increase is performed with steam generated in the boilers by means of an intermediate fluid (water-glycol) in a liquid state that operates in a closed circuit. The steam, condensate and feed water circuits are described below.
The high pressure saturated steam (state 29) produced in the boilers is used in the regasification process (state 30) and in the preheating of the feed water (state 34). The latter drops in pressure (state 35) in valve V-6 before circulating part of the flow (state 36) towards the preheater (PH) and the remaining (state 39) towards the feed tank coil (FT). The steam bound for the regasification process flows through control valve V-4, slightly decreasing in pressure (state 31). Next, the steam is condensed (state 32) in the water-glycol heater (WGH) and returns
(state 33) to the feed tank through valve V-5. The condensate extracted by traps T-1 and T-2 (states 41 and 38), subsequent to decreasing in temperature in the drain cooler (DC), returns to the same tank. Lastly, the feed pump (P-4) drives the water through the preheater towards the
Fig. 6. Diagram of the open-loop regasification system with ORC.
Table 3 Natural gas composition measured on board an FSRU.
Component Mole fraction
Methane (CH4) 0.89018 Nitrogen (N2) 0.00007 Carbon dioxide (CO2) 0.00000 Ethane (C2H6) 0.07974 Propane (C3H8) 0.02291 i-Butane (i-C4H10) 0.00322 n-Butane (n-C4H10) 0.00371 i-Pentane (i-C5H12) 0.00014 n-Pentane (n-C5H12) 0.00002 n-Hexane (n-C6H14) 0.00001
Table 4 General conditions of regasification systems.
Parameter Value
LNG tank pressure 1.16325 bar BOG temperature before the mixer − 100 ◦C Natural gas mass flow rate 111.19 kg/s Regasified natural gas pressure 85 bar Regasified natural gas temperature 10 ◦C Alternator efficiency 95% Pumps isentropic efficiency 80% Pumps electromechanical efficiency 90% Feed pump discharge pressure 9 bar Booster pump discharge pressure 110 bar LD isentropic efficiency 55% LD electromechanical efficiency 80% BOG temperature after the mixer − 120 ◦C LD discharge pressure 6 bar Recondenser pressure 5.5 bar Minimum temperature difference in heat exchanger 5 ◦C
Table 5 Parameter assumptions for Case 2.
Parameter Value
Natural gas pressure loss through the vaporizer 23 bar Natural gas temperature at the vaporizer outlet − 20 ◦C Propane pump suction pressure 3.5 bar Propane pump discharge pressure 6 bar Propane pressure at the vaporizer inlet 5.5 bar Propane vapour quality at the propane vaporizer outlet 0.8 Propane temperature at the vaporizer outlet − 15 ◦C
M. Naveiro et al.

Journal of Natural Gas Science and Engineering 96 (2021) 104271
10
boiler. With regard to the boiler combustion process, the LD compressor provides the BOG consumed in the process (state 21), while the air (state 43) is supplied by the forced draft fan (FDF).
4.6. Case 4 open-loop regasification system with ORC
Fig. 6 shows the layout of Case 4, which unlike Case 2 includes an ORC cycle. The main difference is the inclusion of a turbine (T) coupled to an electric generator (G) between the LNG vaporizer and the propane vaporizer. Furthermore, the fluid (state 25) at the propane vaporizer outlet is in saturated vapour conditions.
4.7. Assumptions
The following conditions are assumed for the case studies:
• Steady-state energy and mass balances for all components except the cargo tanks. The potential and kinetic effects are neglected. The generated BOG is determined with Eqs. (13) and (14). The compo-nents do not exchange heat with the environment (adiabatic), with the exception of the cargo tanks.
• The GERG 2008 equation of state is used to calculate the LNG properties. The LNG reference composition in the calculation of the design indexes is of 100% methane. Table 3 shows the composition of a measured LNG for comparison purposes.
• Negligible auxiliary boiler fuel consumption. Engine economisers are considered to be capable of supplying the auxiliary steam system demand.
• Lower heating value of the LNG and DO applied in the calculation of the design indexes of 48 000 and 42 700 kJ/kg, respectively. CO2 emission factors for LNG and DO of 2.750 and 3.206 (IMO, 2018b).
• Engine methane slip reference value of 5.5 g/kWh (IMO, 2020; Pavlenko et al., 2020).
• Reference GWP (100 years) for methane of 28. 20-year GWP of 84 (Huang et al., 2013).
• Power consumption of auxiliary services of 2050.9 kW, exempting those components that directly intervene in the regasification pro-cess. If the GCU is used, a fan consumption of 416.9 kW is added.
• Table 4 contains all other general parameters applied.
The following conditions apply to open-loop regasification systems (Cases 0, 1, 2 and 4):
• Seawater is treated as pure water. Therefore, the properties are determined with the IAPWS-95 formulation.
• The ambient temperature of seawater is of 15 ◦C. • The temperature of the seawater discharged by the ship is a
maximum of 5 ◦C lower than that of the environment. • The discharge pressure of the seawater pumps is 7.5 bar. The
seawater circuit pressure drop is primarily in the heat exchangers. • Tables 5 and 6 contain the parameters considered in Cases 2 and 4,
respectively.
Lastly, the following conditions are established in the closed-loop water-glycol system:
• Water-glycol properties are determined with the Peng-Robinson equation of state. The concentration on a mass basis of ethylene glycol in water is 30%.
• Air is treated as an ideal gas. The composition is 21% oxygen and 79% nitrogen (molar basis).
• Water is in a saturated liquid state at the inlet of the traps. The traps perform isenthalpic expansion until the drain cooler pressure is reached.
• Table 7 depicts all other conditions taken for Case 3.
5. Results and discussion
5.1. Design indexes
Fig. 7 illustrates the EEDI and CFDI results obtained for each of the
Table 6 Parameter assumptions for Case 4.
Parameter Value
Natural gas pressure loss through the vaporizer 23 bar Natural gas temperature at the vaporizer outlet − 20 ◦C Propane pump suction pressure 1.5 bar Propane pressure drop in heat exchangers 0.5 bar Propane vapour quality at the propane vaporizer outlet 1 Expander isentropic efficiency 80% Expander electromechanical efficiency 90%
Table 7 Closed-loop water-glycol regasification system conditions.
Parameter Value
FDF electromechanical efficiency 90% FDF isentropic efficiency 80% Flue gas pressure loss through the boiler 0.05 bar Boiler efficiency 90% Excess air 10% Water-glycol pump suction pressure 3.5 bar Water-glycol pump discharge pressure 6 bar Water-glycol pressure at the vaporizer inlet 5.5 bar Water-glycol temperature at the vaporizer inlet 90 ◦C Water pressure at the feed tank 1.01325 bar Water temperature at the feed tank 90 ◦C Water temperature at the pre-heater outlet 135 ◦C Saturation pressure at steam dome 29 bar Steam pressure at the water-glycol heater inlet 25.5 bar Water pressure at the water-glycol heater outlet 2.5 bar Water temperature at the water-glycol heater outlet 25 ◦C Heating steam pressure 9 bar Water temperature at the condenser outlet 90 ◦C
Fig. 7. Results of EEDI and CFDI.
Table 8 Engine load sharing as a function of the power delivered. Power demand on engines (Weng), maximum engine power of 6L50DF (W6L,max) and maximum engine power of 12V50DF (W12V,max).
Conditions Load sharing
6L50DF 12V50DF
Weng < 80 % W6L,max Weng –
80 % W6L,max < Weng < 80 % W12V,max – Weng
80 % W6L,max < Weng
Weng < 12.5 % W6L,max + 80 % W12V,max
12.5 % W6L,max Weng − W6L
12.5 % W6L,max + 80 % W12V,max < Weng Weng − W12V 80 % W12V,max
M. Naveiro et al.

Journal of Natural Gas Science and Engineering 96 (2021) 104271
11
cases studied. Of the regasification systems installed in FSRUs, Case 1 delivers the lowest EEDI. That is, is the most energy efficient system, followed closely by Case 2. The fitting of an ORC to exploit the LNG cold energy, as in Case 4, would reduce the EEDI by 41.25% compared to Case 1. At the other end of the scale is Case 3, whose EEDI is 347.98% greater in comparison to the same reference case. The CFDI, with an engine methane slip of 5.5 g/kWh, is approximately 25–28% higher than the EEDI in Cases 1, 2 and 4. This value is reduced to 20.50 and 4.72% in Cases 0 and 3, respectively, as a result of high BOG consumption by equipment other than engines: that is, the GCU in Case 0 and the rega-sification boiler in Case 3. The aforementioned increases more than double those obtained with the reference GWP if the 20-year GWP of methane is used.
To establish a required EEDI or CFDI in FSRUs, it is advisable to create reference lines based on the operating loop: one for open-loop systems and another for closed-loop systems. The NG flow under base-line regasification conditions could be used as an independent variable in determining the required EEDI. The impact of certain variables on the calculation of design indexes, such as the load considered in the specific fuel consumption of the engines, the LNG composition, the methane slip and the installation of CCS, is shown below.
5.1.1. Effect of specific fuel consumption at constant and variable engine loads on the EEDI calculation
The EEDI is examined in the five cases for three situations based on the engine load considered in the calculation of the specific BOG and DO consumption: fixed specific consumption at 75% load, fixed specific consumption at 50% load and specific consumption based on engine power delivery. The latter represents the most realistic condition, in which the power is distributed among the engines taking into account 3rd order polynomial regressions established to determine the specific consumption of each fuel as a function of the load with the data in
Table 2. The load sharing is established to minimise fuel consumption within an operational range of between 12.5 and 80% of the maximum load, as per Table 8.
Fig. 8 presents the EEDI calculated in each case for the above three situations. In Case 0, the EEDI is barely affected. This is owing to the BOG generated in the tanks being completely burned, either in the en-gines or in the GCU. In Cases 1 and 2, however, at a fixed load of 75%, the EEDI drops by approximately 5% with respect to the variable load situation. If a 50% load is considered, the value increases by 7%. In Case 3, BOG consumption (boiler and engines) is high enough to use the forcing vaporizer. Consequently, there is no excess BOG and the recondenser acts as a suction drum. Moreover, CO2 emissions derive mainly from the BOG burned in the boiler. Thus, a fixed or variable engine load has little influence on the determining the EEDI for Case 3. Lastly, in Case 4, the EEDI decreases by 13% calculated with a fixed load of 75% with respect to the variable load situation, while the EEDI with fixed load of 50% only decreases by 0.30%. In Case 4, the engines selected are not the most suitable for the FSRU: an engine with a maximum power of between 6L50DF and 12V50DF, such as the 9L50DF, is required.
In most of the cases studied, with the exception of Case 4, the EEDI calculated for a 75% fixed load is most similar to that obtained for the variable load situation. It is therefore a sound approximation to deter-mine the EEDI. However, the CO2 emissions are slightly optimistic, reducing the EEDI value by up to 5%. In this regard, although the EEDI calculation in variable load condition is more complex, it gives a more moderate and realistic value with engine operation.
5.1.2. Effect of LNG composition on the EEDI calculation Fig. 9 and Table 9 provide, respectively, the EEDI and the
calculation-relevant parameters for each case based on two LNG com-positions: 100% methane and the composition of Table 3. In Cases 1, 2 and 3 the measured LNG composition represents a maximum 0.53% increase in the EEDI compared to that of pure methane. In Cases 0 and 4, however, the differences increase by 30.74 and 6.61%, respectively. The increase in Case 0 is owing to the effect of the LNG density in deter-mining the BOG generated in the tank and, thus, the excess BOG burned by the GCU. The total BOG consumed by the engines and GCU differs by 23.40% between the two compositions considered. The impact of the regasification process energy must be added to this, which is approxi-mately 6% lower for the measured LNG in all of the cases considered. In Case 4, the measured LNG composition negatively impacts the power produced by the ORC, hence the power to be delivered by the engines slightly increases. Therefore, the difference in the EEDI value is pri-marily attributable to the difference in energy of the regasification process. In Cases 1, 2 and 4 the regasified NG undergoes slight fluctu-ations in composition due to the mixing of LNG and BOG in the recon-denser, resulting in a small modification to the calculation of the regasification energy. In the worst case (Case 4), this difference is barely 0.03% with respect to the value obtained with the composition of the LNG stored in the tank.
5.1.3. Effect of methane slip and GWP on the CFDI calculation Fig. 10 shows the variation in CFDI with the methane slip of the
engines in a range from 0 to 10 g/kWh for all five case studies. The impact of the methane slip is more significant in open-loop regasifica-tion systems, as per Fig. 11a (100-year GWP) and 11b (20-year GWP). Although the study has assumed a fixed reference value for the methane slip, such value being that proposed by the IMO and researchers, this parameter in fact depends on the engine load. Manufacturers, however, do not usually include such data in the information provided on engines. Despite this, Wartsila considers that a representative methane slip value for a new four-stroke LPDF engine would be 2.8 g/kWh (Wartsila, 2020). The increase in CFDI with respect to the EEDI calculated with the methane slip of 2.8 g/kWh is 45.45% lower, if compared to the increase obtained using the reference value for each of the case studies.
Fig. 8. Effect of specific fuel consumption at fixed and variable engine loads on the EEDI calculation.
Fig. 9. Effect of LNG composition on the EEDI calculation.
M. Naveiro et al.

Journal of Natural Gas Science and Engineering 96 (2021) 104271
12
5.1.4. Effect of CO2 capture ratio on the CFDI calculation The proposed cases do not comprise any CCS system, although
Fig. 12 demonstrates the impact of CO2 capture factor in the CFDI calculation. The application of CCS systems in Case 3 make it possible to achieve emission levels similar to those of open-loop systems, provided the system is able to capture over 80% of the CO2 emissions from boilers and engines. If these systems are only used in the engines (Case 3a) the decrease in CFDI is minimal in comparison with Case 3b, in which the CCS systems are applied exclusively to the boiler. In the case of allowing for 100% capture of boiler emissions, however, Case 3b presents a lower CFDI than that of open-loop regasification systems, with the exception of Case 4. Fig. 13a and 13b illustrate the drop in CFDI owing to CO2 capture for the baseline GWP and the 20-year GWP, respectively. The higher the GWP of methane, the lower the decrease in CFDI. This is of particular importance in open-loop regasification systems (Cases 0, 1, 2 and 4).
Despite the benefits of reduced carbon emissions brought about by the installation of CCS systems, results do not take into account the effect caused by the installation of these systems in an FSRU. For example, an increase in power consumption would generate higher engine methane emissions and, thus, a higher CFDI. Therefore, these results are valid only in the case of CCS systems that do not significantly alter the energy demand of the FSRU.
5.2. Operational indicators The instantaneous operational indicators (EERI and CFRI) are
determined on a similar basis as design indexes, except implementing the LNG composition of Table 3 and considering the lower heating value of the BOG dependent on its composition. Fig. 14 depicts the EERI and CFRI obtained for each of the cases studied. The results much resemble those obtained under design conditions.
Table 9 Parameters relevant to EEDI calculation for each case.
Case PAE − PAEeff (kW) BOG cons. (kg/h) DO cons. (kg/h) Reg. Energy (kW)
LNG Methane LNG Methane LNG Methane LNG Methane
0 10 324.85 10 820.16 3270.07 2649.99 13.56 13.49 81 188.73 86 106.92 1 9883.72 10 379.42 1770.01 1872.12 12.38 13.61 81 205.62 86 106.92 2 10 003.44 10 511.50 1797.26 1895.38 12.85 13.67 81 205.32 86 106.92 3 7432.55 7899.12 7993.14 8450.34 6.99 6.47 81 188.73 86 106.92 4 5707.73 5654.88 1103.65 1097.02 10.29 10.41 81 213.12 86 106.92
Fig. 10. Effect of methane slip on the CFDI calculation.
Fig. 11. Increase in CFDI due to methane slip: a) GWP 100, b) GWP 20.
Fig. 12. Effect of CO2 capture ratio on the CFDI calculation.
M. Naveiro et al.

Journal of Natural Gas Science and Engineering 96 (2021) 104271
13
By way of example for EEOI and CFOI application, Table 10 proposes a hypothetical 8-day regasification operation with Case 1 regasification system. The data required for the calculation of the indicators, computed with the Aspen HYSYS, are listed in Table 11. The regasification oper-ation EEOI and CFOI results are presented in Table 12. The findings are unfavourable if these indicators are compared with the EERI and CFRI. The EEOI is 36.84% higher than the EERI, while the CFOI increases 28.94% compared to the CFRI (19.85% with a 20-year GWP). The reason is mainly because the FSRU does not regasify NG on the last day and so the excess BOG must be burned in the GCU.
The use of the EEOI in reality, besides the fuel flow meters (BOG and DO) that are usually fitted on any vessel, implies the installation of a regasification energy meter(s) to determine the value on the basis of the composition, mass flow, pressure and temperature of the regasified NG, and the temperature of the LNG stored in the tank. If the CFOI is to be calculated, meters for reading methane emissions in engine exhausts must also be included.
6. Conclusions
Given the need to reduce GHG emissions from the shipping sector, the present paper proposes novel methods to evaluate the energy and environmental efficiency of FSRUs. Such methods are used to assess five regasification systems: seawater system without recondenser (Case 0), seawater system (Case 1), open-loop propane system (Case 2), closed- loop water-glycol system (Case 3) and open-loop system with ORC (Case 4). The following conclusions can be drawn:
• Current EEDI and EEOI formulas, as proposed by the IMO, are not applicable to vessels such as FSRUs that operate in stationary mode, nor do they consider the installation of CCS systems or the impact of the methane slip.
Fig. 13. CFDI reduction due to CO2 capture ratio: a) GWP 100, b) GWP 20.
Fig. 14. EERI and CFRI results.
Table 10 Regasified natural gas flow in the regasification operation.
Days Natural gas flow (mmscfd)
1–3 500 4 750 5 500 6 750 7 250 8 0
Table 11 Relevant parameters for EEOI and CFOI calculation.
Day BOG cons. (kg)
DO cons. (kg)
Methane emissions (kg)
Reg. Energy (MJ)
1 40 928.49 297.14 1304.53 7 016 210.95 2 40 928.49 297.14 1304.53 7 016 210.95 3 40 928.49 297.14 1304.53 7 016 210.95 4 53 042.29 211.88 1779.06 10 522 184.68 5 40 928.49 297.14 1304.53 7 016 210.95 6 53 042.29 211.88 1779.06 10 522 184.68 7 27 199.78 215.33 829.77 3 510 356.71 8 124 355.47 138.56 342.89 0.00
Table 12 EEOI and CFOI results.
EEOI (gCO2/MJ) CFOI (gCO2e/MJ) CFOIGWP 20 (gCO2e/MJ)
22.14 26.91 37.50
M. Naveiro et al.

Journal of Natural Gas Science and Engineering 96 (2021) 104271
14
• The proposed EEDI, defined as CO2 emissions per regasification en-ergy, is applicable to the five cases under study. Of the regasification systems installed in FSRUs, Case 1 delivers greatest efficiency, closely followed by Case 2. If a simple ORC is incorporated to exploit LNG cold energy, the EEDI pertaining to Case 4 is 41.25% lower than Case 1. In contrast, the EEDI of Case 3 is 347.98% greater than Case 1.
• Assessment of the impact of the engine load on the specific fuel consumption in the EEDI calculation was performed for three con-ditions: 75% fixed load, 50% fixed load and variable load with the power generated by the engines to minimise fuel consumption. The variable load condition is the most realistic from the ship’s opera-tional standpoint. A 75% fixed load condition estimates a value close to that of variable load, but then the EEDI is lower. In contrast, the 50% fixed load condition achieves an excessively conservative EEDI in open-loop regasification systems, with the exception of Case 4. Therefore, the most suitable condition to evaluate the EEDI, despite its complexity, is that of variable load.
• The impact of the LNG composition on the EEDI is analysed for two compositions: 100% methane and an LNG composition measured on board an FSRU. With the exception of Cases 0 and 4, the LNG composition has barely any effect on the EEDI. The measured LNG composition significantly increases the BOG generated in the tanks. This results in the excess BOG having to be burned in a GCU in regasification systems without recondenser, as in Case 0, producing an EEDI 30.74% above that of LNG with pure methane. LNG composition in regasification systems with energy exploitation af-fects the ORC power production. In Case 4, the measured LNG de-livers an EEDI 6.64% higher than that of pure methane. It would be suitable to establish a reference composition, as well as an equation of state, to determine the NG properties in the EEDI formula, espe-cially if it is intended to further validate the attained EEDI after constructing the FSRU.
• The proposed CFDI, in comparison with the EEDI, further includes CO2 equivalent emissions produced by the methane slip from dual fuel engines and the CO2 capture ratio factor for the possible installation of CCS systems in regasification engines or boilers. The CFDI, compared with the EEDI, with an engine methane slip of 5.5 g/ kWh is approximately 25–28% higher in Cases 1, 2 and 4. This value drops to 20.50 and 4.72% in Cases 0 and 3, respectively, due to the high BOG consumption by equipment other than engines (GCU and regasification boiler). If the 20-year GWP of methane is applied, the mentioned figures are more than twofold.
• CCS systems can significantly reduce closed-loop regasification sys-tem carbon emissions. If the capture ratio exceeds 80%, a CFDI similar to that obtained for open-loop systems can be achieved.
• In order to establish a required EEDI or CFDI for FSRUs, it is advis-able to create reference lines based on the operating loop: one for open-loop systems and another for closed-loop systems. The NG flow in baseline regasification conditions could be used as an independent variable to determine the required EEDI.
• To instantaneously evaluate energy efficiency and the carbon foot-print (EERI and CFRI), the operational indicators obtain values approaching those of the design values with measured LNG, as the lower heating value is considered variable with the BOG composi-tion. Measurement of these indicators and of the EEOI and CFOI implies the installation of measurement devices for the burned DO and BOG, the composition of the NG sent to shore, regasification energy and methane present in the engine exhaust gases.
In order to reduce GHG emissions from the maritime sector, methods must be established to allow for assessment of these emissions in all vessel types, including those that are not engaged in freight trans-portation. Thus, besides monitoring emissions and establishing limit values, assessment of the impact of new technologies, such as residual energy exploitation systems, CCS systems and even the use of low- or
zero-carbon fuels, is also allowed for.
Credit author statement
M. Naveiro: Writing – original draft preparation, Conceptualization, Methodology, Visualization, Software, Writing – review & editing, Su-pervision. M. Romero.: Conceptualization, Writing – review & editing, Supervision. I. Arias: Writing – review & editing. A. Baalina: Writing – review & editing.
Declaration of competing interest
The authors declare that they have no known competing financial interests or personal relationships that could have appeared to influence the work reported in this paper.
Acknowledgments
Funding for open access charge: Universidade da Coruna/CISUG.
References
Ekanem Attah, E., Bucknall, R., 2015. An analysis of the energy efficiency of LNG ships powering options using the EEDI. Ocean. Eng. 110, 62–74. https://doi.org/10.1016/ j.oceaneng.2015.09.040.
Eum, Y., Kim, S., Doh, K., Ha, M., 2011. Eco-friendly LNG SRV: completion of the regas trial. Int. Gas Res. Conf. Proc. 4, 2791–2803.
Huang, J., Mendoza, B., Daniel, J.S., Nielsen, C.J., Rotstayn, L., Wild, O., 2013. Anthropogenic and natural radiative forcing. Clim. Chang. 2013 Phys. Sci. Basis Work. Gr. I Contrib. to Fifth Assess. Rep. Intergov. Panel Clim. Chang. 9781107057, 659–740. https://doi.org/10.1017/CBO9781107415324.018.
IGU, 2020. 2020 world LNG report, world LNG report. IMO, 2021a. Fourth IMO GHG Study 2020 Executive Summary. IMO, 2021b. MEPC 76/3 CONSIDERATION and ADOPTION of AMENDMENTS to
MANDATORY INSTRUMENTS - Draft Amendments to MARPOL Annex VI. IMO, 2020. MEPC 75/7/15 Reduction of GHG Emissions from Ships: Fourth IMO GHG
Study 2020 - Final Report. IMO, 2018a. MEPC.304(72) Initial IMO Strategy on Reduction of GHG Emissions from
Ships. IMO, 2018b. MEPC.308(73) 2018 Guidelines on the Method of Calculation of the
Attained Energy Efficiency Design Index (EEDI) for New Ships. IMO, 2017. MARPOL Consolidated Edition 2017. IMO, 2016. MEPC.282(70) 2016 Guidelines for the Development of a Ship Energy
Efficiency Management Plan (SEEMP). IMO, 2013a. MEPC.1/Circ.815 Guidance on Treatment of Innovative Energy Efficiency
Technologies for Calculation and Verification of the Attained EEDI. IMO, 2013b. MEPC. 231(65) 2013 Guidelines for Calculation of Reference Lines for Use
with the Energy Efficiency Design Index (EEDI). IMO, 2013c. MEPC.233(65) 2013 Guidelines for Calculation of Reference Lines for Use
with the Energy Efficiency Design Index (EEDI) for Cruise Passenger Ships Having Non-conventional Propulsion.
IMO, 2012. MEPC.1/Circ.796 Interim Guidelines for the Calculation of the Coefficient Fw for Decrease in Ship Speed in a Representative Sea Condition for Trial Use.
IMO, 2011. MEPC.203(62) Amendments to MARPOL Annex VI on Regulations for the Prevention of Air Pollution from Ships by Inclusion of New Regulations on Energy Efficiency for Ships.
IMO, 2009. MEPC.1/Circ.684 Guidelines for Voluntary Use of the Ship Energy Efficiency Operational Indicator (EEOI).
Janssens, P., 2006. The development of the first Energy Bridge regasification vessel. In: Offshore Technol. Conf. 2006 New Depths, vol. 3, pp. 2052–2063. https://doi.org/ 10.4043/18398-ms. New Horizons.
Lee, J.H., Janssens, P., Cook, J., 2005. LNG regasification vessel - the first offshore LNG facility. In: Proc. Annu. Offshore Technol. Conf. 2005-May, pp. 325–333. https:// doi.org/10.4043/17161-ms.
Lee, S., Choi, B.C., 2016. Thermodynamic assessment of integrated heat recovery system combining exhaust-gas heat and cold energy for LNG regasification process in FSRU vessel. J. Mech. Sci. Technol. 30, 1389–1398. https://doi.org/10.1007/s12206-016- 0246-y.
Lee, S., Yoo, S., Park, H., Ahn, J., Chang, D., 2021. Novel methodology for EEDI calculation considering onboard carbon capture and storage system. Int. J. Greenh. Gas Control 105, 103241. https://doi.org/10.1016/j.ijggc.2020.103241.
Madsen, P.H.S., Karsten, D., Strande, R., 2010. Intermediate fluid vaporizers for LNG re- gasification vessels, SRVs and FSRU’s. Proc. Annu. Offshore Technol. Conf. 3, 2185–2198. https://doi.org/10.4043/20809-ms.
MAN, B.&W., 2016. The Flexible Dual-Fuel Solution. Mitsui O.S.K. Lines, 2020. MOL and DSME Obtain AIP for Design of FSRU “Cryo-Powered
Regas” System - Development of New Technology to Reduce Environmental Impact -.
M. Naveiro et al.

Journal of Natural Gas Science and Engineering 96 (2021) 104271
15
Mokhatab, S., Mak, J.Y., Valappil, J.V., Wood, D.A., 2014. Handbook of liquefied natural gas, handbook of liquefied natural gas. Elsevier. https://doi.org/10.1016/C2011-0- 07476-8.
Mokhatab, S., Poe, W.A., Mak, J.Y., 2018. Handbook of Natural Gas Transmission and Processing: Principles and Practices, Handbook of Natural Gas Transmission and Processing: Principles and Practices. Elsevier, Oxford. https://doi.org/10.1016/ C2017-0-03889-2.
Norrgård, J., 2018. LNG terminals – land-based vs. floating storage and regasification technology. Wartsila Tech. J.
Pavlenko, N., Comer, B., Zhou, Y., Clark, N., Rutherford, D., 2020. The Climate Implications of Using LNG as a Marine Fuel. ICCT Working Paper 2020-02.
Romero Gomez, J., Romero Gomez, M., Lopez Bernal, J., Baalina Insua, A., 2015. Analysis and efficiency enhancement of a boil-off gas reliquefaction system with cascade cycle on board LNG carriers. Energy Convers. Manag. 94, 261–274. https:// doi.org/10.1016/j.enconman.2015.01.074.
Samsung Heavy Industries, 2014. S-REGAS Regasification System (Brochure). Schuller, O., Kupferschmid, S., Whitehouse, S., Hengstler, J., 2019. Life Cycle GHG
Emission Study on the Use of LNG as Marine Fuel, Report.
Songhurst, B., 2017. The outlook for floating storage and regasification units (FSRUs). Oxford, United Kingdom. https://doi.org/10.26889/9781784670894.
Ushakov, S., Stenersen, D., Einang, P.M., 2019. Methane slip from gas fuelled ships: a comprehensive summary based on measurement data. J. Mar. Sci. Technol. 24, 1308–1325. https://doi.org/10.1007/s00773-018-00622-z.
Wartsila, 2020. Cutting Greenhouse Gas Emissions from LNG Engines [WWW Document]. URL, 11.4.20. https://www.wartsila.com/media/news/06-04-2020- cutting-greenhouse-gas-emissions-from-lng-engines.
Yao, S., Liu, H., Tang, L., Ye, Y., Zhang, L., 2016. Thermodynamic analysis and optimization for cold energy utilization based on low temperature rankine cycle of LNG-FSRU regasification system. Int. J. Simulat. Syst. Sci. Technol. 17, 35.1–35.9. https://doi.org/10.5013/IJSSST.a.17.30.35.
Yoon-Ho, L., 2019a. LNG-FSRU cold energy recovery regasification using a zeotropic mixture of ethane and propane. Energy 173, 857–869. https://doi.org/10.1016/j. energy.2019.02.111.
Yoon-Ho, L., 2019b. Thermo-economic analysis of a novel regasification system with liquefied-natural-gas cold-energy. Int. J. Refrig. 101, 218–229. https://doi.org/ 10.1016/j.ijrefrig.2019.03.022.
M. Naveiro et al.
Copyright © 2022 FDOKUMEN