Journal of KONES 2018 No. 2 Vol. 25 ISSN 1231-4005
8
Journal of KONES Powertrain and Transport, Vol. 25, No. 2 2018 ANALYSIS OF SELECTED SIMULATED FAILURE OF A RECIPROCATING COMPRESSOR USING COMPUTER DIAGNOSTIC SYSTEM Rafał Krakowski Gdynia Maritime University, Faculty of Marine Engineering Morska Street 83, 81-225 Gdynia, Poland tel.: +48 58 5586398, fax: +48 58 5586 399 e-mail: [email protected] Abstract In the article, the problems of selected failures that may occur during operation of positive displacement compressors and possible reasons for their occurrence were described. It also included methods for checking performance and diagnostics, with particular emphasis on research using an electronic indicator. Possible mechanical damages of air compressors for various applications have also been characterized. Non-destructive diagnostic methods were described to detect and diagnose damage, taking into account their suitability and limitations in their application. In the further part of the article selected tests results of air compressor, specially adapted to simulation of failures were presented. The test stand has been equipped with sensors for measuring the pressure and temperature of the compressed gas and the sensor of the angular position of the compressor shaft, allowing examining the impact of damage on compressor working parameters. The result of the research was to compare the compressor indicator diagrams in the operational condition, with the simulated failure, and between different failures and to learn the changes of processes taking place inside the cylinder during the compressor’s work cycle. All the test results could be observed in real time, besides the diagnostic software, supporting the tests, made it possible to record measurements. In the described software, it is possible to compare the courses for different cases, to then make a comparative analysis of the results obtained in the state of functional and simulated disability. Keywords: piston compressor, test stand, diagnostic system, simulated malfunctions 1. Introduction The elements of reciprocating compressors are exposed to various types of wear processes caused by various internal factors as well as environmental conditions. The problem of compressors failure is very complex and it is important to know the construction, operation principle, and symptoms of the compressor’s malfunctioning already at the stage of education. It is assumed that the efficiency status corresponds to the situation in which all the components included in the compressor work correctly and only the maximum pressure is changed. The state of failure corresponds to the situation in which, for example, elements such as a suction valve, a discharge valve or a dirty air purifier work incorrectly [7]. One of the ways of understanding the anomalies in the compressor is the performance and analysis of the compressor indicators and diagrams of the simulated malfunctions, and then their comparison with the results obtained in the operational condition. 2. Failures of reciprocating compressors The problem of proper operation and diagnostics of marine auxiliary equipment, including air compressors, is very important in the context of the operation of the entire ship engine. Improper operation of the compressor may result in the failure to start main and auxiliary piston combustion engines and overdrive of main engines – if they are reversible. In addition, compressed air is used to perform many other activities, such as blowing kingston, blowing out the injector cooling ISSN: 1231-4005 e-ISSN: 2354-0133 DOI: 10.5604/01.3001.0012.2800
-
Upload
khangminh22 -
Category
Documents
-
view
1 -
download
0
Transcript of Journal of KONES 2018 No. 2 Vol. 25 ISSN 1231-4005

Journal of KONES Powertrain and Transport, Vol. 25, No. 2 2018
ANALYSIS OF SELECTED SIMULATED FAILURE OF A RECIPROCATING COMPRESSOR
USING COMPUTER DIAGNOSTIC SYSTEM
Rafał Krakowski
Gdynia Maritime University, Faculty of Marine Engineering Morska Street 83, 81-225 Gdynia, Poland
tel.: +48 58 5586398, fax: +48 58 5586 399 e-mail: [email protected]
Abstract
In the article, the problems of selected failures that may occur during operation of positive displacement compressors and possible reasons for their occurrence were described. It also included methods for checking performance and diagnostics, with particular emphasis on research using an electronic indicator. Possible mechanical damages of air compressors for various applications have also been characterized. Non-destructive diagnostic methods were described to detect and diagnose damage, taking into account their suitability and limitations in their application. In the further part of the article selected tests results of air compressor, specially adapted to simulation of failures were presented. The test stand has been equipped with sensors for measuring the pressure and temperature of the compressed gas and the sensor of the angular position of the compressor shaft, allowing examining the impact of damage on compressor working parameters. The result of the research was to compare the compressor indicator diagrams in the operational condition, with the simulated failure, and between different failures and to learn the changes of processes taking place inside the cylinder during the compressor’s work cycle. All the test results could be observed in real time, besides the diagnostic software, supporting the tests, made it possible to record measurements. In the described software, it is possible to compare the courses for different cases, to then make a comparative analysis of the results obtained in the state of functional and simulated disability.
Keywords: piston compressor, test stand, diagnostic system, simulated malfunctions
1. Introduction
The elements of reciprocating compressors are exposed to various types of wear processescaused by various internal factors as well as environmental conditions. The problem of compressors failure is very complex and it is important to know the construction, operation principle, and symptoms of the compressor’s malfunctioning already at the stage of education. It is assumed that the efficiency status corresponds to the situation in which all the components included in the compressor work correctly and only the maximum pressure is changed. The state of failure corresponds to the situation in which, for example, elements such as a suction valve, a discharge valve or a dirty air purifier work incorrectly [7]. One of the ways of understanding the anomalies in the compressor is the performance and analysis of the compressor indicators and diagrams of the simulated malfunctions, and then their comparison with the results obtained in the operational condition.
2. Failures of reciprocating compressors
The problem of proper operation and diagnostics of marine auxiliary equipment, including aircompressors, is very important in the context of the operation of the entire ship engine. Improper operation of the compressor may result in the failure to start main and auxiliary piston combustion engines and overdrive of main engines – if they are reversible. In addition, compressed air is used to perform many other activities, such as blowing kingston, blowing out the injector cooling
ISSN: 1231-4005 e-ISSN: 2354-0133DOI: 10.5604/01.3001.0012.2800

R. Krakowski
system and CO2 fire-fighting installation, powering the ship’s automation systems, or driving pneumatic tools. The compressors’ failures may result from improper operation, negligence of service activities and the use of compressors in places where it has not been adapted. We also cannot exclude manufacturing defects that arise during the production process, but these are rare cases. Damage to the compressors is also dependent on the way they are used, most often compressors have the task of compressing air or refrigerant compressors. Finding the reasons for compressor failure in the second case is definitely more difficult, because it may result not only from the disadvantages of the compressor itself, but also from bad cooperation with the cooling installation. The compressors are mostly driven by electric motors, which also fail and may impede or prevent the compressor [1]. The cause of damage to the electric motor may be a lack of phase, bad selection of the motor to the compressor, incorrect connection to the power supply, incorrect voltage. In addition, the electric motor may break down due to mechanical malfunctions of the motor by seizing bearings or compressors. We can divide the damage into electrical and mechanical ones. The mechanical ones include, among others, the failure of the lubrication system, overheating of the compressors, too low a compressor temperature, or damage to the timing and valves [3, 5]. 3. Diagnosis methods for reciprocating compressors
Diagnostics is a set of methods and means for assessing the technical condition of technical devices. The state of the device can be evaluated according to indirect and direct measures. The geometrical dimensions of its elements, the geometry of their cooperation and strength characteristics, which are the features of the device’s state, can be a direct measure of a machine’s technical condition. In order to examine the quality of the device’s functioning and the scale of consumption processes, indirect measures are used for this purpose. It is based on the comparison of measurable quantities, related to the technical condition features, the tested device to the set of measurements of the reference device, working in accordance with the requirements. The life cycle of each machine is reflected by the curve shown in Fig. 1, with the help of which it is possible to predict the failure of the device at a given time. The life of the machine is limited by the destructive influence of external and internal factors, so the state of machine wear on the curve changes. In the first phase, a large failure rate is caused by the fact that the device elements may have hidden defects. The defects resulting from manufacturing or assembly defects are revealed during commissioning. Thanks to the exchange of device elements, it operates in the second phase characterized by low failure rate and stable operation. At the end of the machine’s life cycle, it enters the third phase in which the failure rate increases due to wear and aging of the material. This graph allows you to specify the need to replace device components [4].
Fig. 1. Machine life cycle [2]
192

Analysis of Selected Simulated Failure of a Reciprocating Compressor Using Computer Diagnostic System
The best way to ensure safe, reliable, efficient, and economical operation of the reciprocating compressor is to monitor its operation and take appropriate steps dependent on registered changes in its operation. Modern diagnostic devices allow measuring many factors essential for compressor operation and earlier detection of possible defects. The earlier they are noticed, the lower the chance of critical damage and unexpected shutdown of the device. Security is also increased and costs associated with repair are reduced. Deficiencies, however, may have similar symptoms making it difficult to diagnose properly, and the ambient conditions of the compressor may be variable, thus affecting its operation and causing false alarms. Detected changes occurring in the compressor’s work cycle must therefore be properly diagnosed. In order to diagnose the state of the machine in operational diagnostics, the symptoms of the state depend on the operating parameters, for example: pressure, temperature, or power. Diagnostic methods can be divided into stimulatory and passive. In stimulation methods to obtain results it is necessary to use a stimulator that is a light beam, an ultrasound wave, a magnetic field or X-ray radiation. The diagnosis also uses residual processes inherent in the operation of each device, including thermal, electrical, vibration and acoustic processes as well as analysis of impurities contained in lubricating oils. Both stimulation and residual tests belong to the operational diagnostics, allowing for testing the machine in continuous operation [2].
The most important diagnostic methods of compressors include: – diagnostic thermovision enabling control over the state of wear of internal and external
machine elements,– vibroacoustic diagnostics, widely used in preventive maintenance of devices, because the work
of rotating machines and those performing reciprocating motion is accompanied by vibrationsthat have a negative effect on some machine elements,
– acoustic emission based on the detection of elastic waves occurring inside the loaded material,resulting from the release of energy accumulated in the material through microdamages;diagnostics using acoustic emission are used in non-destructive and non-destructive detectionof damages, wear and tests of the material destruction process.Still another method used in the research and presented in this article is to indicate the
reciprocating compressor using an indicator measuring the parameters of its work. The result is an indicator graph showing the variation of the instantaneous pressure in the space of the compressor cylinder, depending on the momentary position of the crankshaft or piston, and thus the gas volume. This graph is a curve showing the variation of pressure in the working space usually during one operating cycle in the pressure-volume diagram, allowing determining the condition and properties of the compressor [4].
4. Research object
The tests were carried out on a two-cylinder, single-stage WAN S1P-36 air compressor with a row of cylinders, spray-lubricated, and air-cooled, shown schematically in Fig. 2. The test stand for the compressor is equipped with an indicator connected to a computer measuring system, which makes it possible to create an indicator diagram.
It belongs to the group of positive displacement compressors, i.e. those in which the pressure increase takes place by reducing its volume. The compressor is used, for example, for commercial purposes in both land and sea applications. The drive system of the compressor is an AC electric motor that transmits the drive to the crank-crank system via a belt transmission. After compression, the air passes through the oil separator to the tank. From the tank, it can be directed either to the gas meter or to the throttling orifice in order to determine the instantaneous actual capacity of the compressor. Such parameters as the maximum compression pressure, cylinder volume, temperature of the compressed gas and the speed of the compressor through the measuring system are sent to the computer with the appropriate diagnostic software. The software, in addition to the possibility of creating indicator diagrams, both pressure-volume and pressure –
193

R. Krakowski
Fig. 2. WAN S1P-36 air compressor and a diagram of a laboratory test stand 1 – two-cylinder reciprocating compressor, 2 – electric motor, 3 – electricity meter
4 – computer, 5 – measuring system, 6 – air tank, 7 – gas meter, 8 – measuring orifice
the rotation angle of the shaft, also displays the rotational speed of the compressor. The compressor has also been equipped with the instrumentation to simulate some inefficiencies occurring during the work of reciprocating compressors: increased compressor suction resistance, suction leaks, leakage at the discharge. In addition, it is possible to increase the clearance volume with the possibility of its regulation being a method of efficiency regulation. In the described software, it is possible to compare the courses for different cases and to calculate the area of the chart occupied using the numerical integration method [6].
The presented laboratory stand enables simulation of the most common failures in the work of reciprocating compressors. As a result of tests carried out at this stand, indicator diagrams showing pressure changes in the compressor cylinder as a function of the displacement volume (rotational angle of the rotational shaft) operating in operational condition and with selected failures can be obtained. Then, you can compare the obtained indicator diagrams, which allow you to make a diagnostic assessment and draw conclusions as to further exploitation.
5. Examples of research results
The discussed laboratory stand enables simulation of the most common failures in operation of reciprocating compressors in practical operation.
Indicator diagrams, compression pressures, compressed air temperature and compressor speed are read directly from the computer monitor, while the actual capacity of the compressor should be determined using a gas meter and stopwatch or calculated using the formula (2). In order to obtain the actual capacity of the compressor Q [m3/h] it was necessary to calculate the difference in liquid levels in the differential manometer Δh [mm] according to dependence. Differential pressure:
9.81 ( ) [Pa]1000h
p m pγ γ∆ ⋅∆ = ⋅ − , (1)
where: Δp – differential pressure [Pa], Δh – differential in the manometric liquid height in the differential manometer [mm], γm – specific gravity of the manometer liquid [kg/m3], γp – specific gravity of the intermediate fluid over the manometric liquid [kg/m3].
Volumetric flow rate: 2 3
10.0039986 [m /h]pQ d vα ε= ⋅ ⋅ ⋅ ⋅ ∆ ⋅ , (2)
where: Q – volumetric flow rate [m3/h],
194

Analysis of Selected Simulated Failure of a Reciprocating Compressor Using Computer Diagnostic System
α – number of flow [–] ε – number of expansion [–] d – diameter of the Venturi section [mm], v1 – specific volume of the liquid before the Venturi [m3/kg].
Sample calculations: – Δh = 139 mm, γm = 999.8 kg/m3, γp = 1.2 kg/m3:
3 3139 mm 9.81 kg kg999.8 1.2 1169.093 Pa
1000 m mp⋅ ∆ = ⋅ − =
,
– α = 0.736, ε = 0.993, d = 12.3 mm, v1 = 0.833 m3/kg:3
2 3m0.0039986 0.736 0.993 (12.3 mm) 1169.093 Pa 0.833 13.8 m /hkg
Q = ⋅ ⋅ ⋅ ⋅ ⋅ =
5.1. Increased flow resistance at the compressor suction
Figure 3 shows the reading of the registered pressure course as a function of the crank angle of the reciprocating compressor crankshaft, where the curve for higher maximum pressure refers to the compressor operating in the operational state, and for the lower maximum pressure to the compressor with simulated malfunction.
Fig. 3. Indication diagrams of the undamaged compressor and simulated damage of increased suction resistance
The phenomenon of increased compressor suction resistance is characteristic of a soiled suction filter. This failure limited the flow of air through the suction line, reducing the actual capacity of the compressor from 13.2 m3/h to 11.4 m3/h. There was also a reduction in the maximum delivery pressure from 7.83 bar to 7.39 bar, most probably due to the reduction of the amount of gas sucked into the compression chamber. The suction stroke starts later than in the compressor operating correctly and at lower pressure, while the transition between the suction and compression curve is more rounded. The pressure in the cylinder increases more slowly and in the delivery stroke, by the earlier opening of the valves, it does not reach the required values. The expansion of air contained in the clearance volume occurs faster, but the expansion stroke lasts longer, because the suction valves open at a higher negative pressure.
195
.
, ,
R. Krakowski
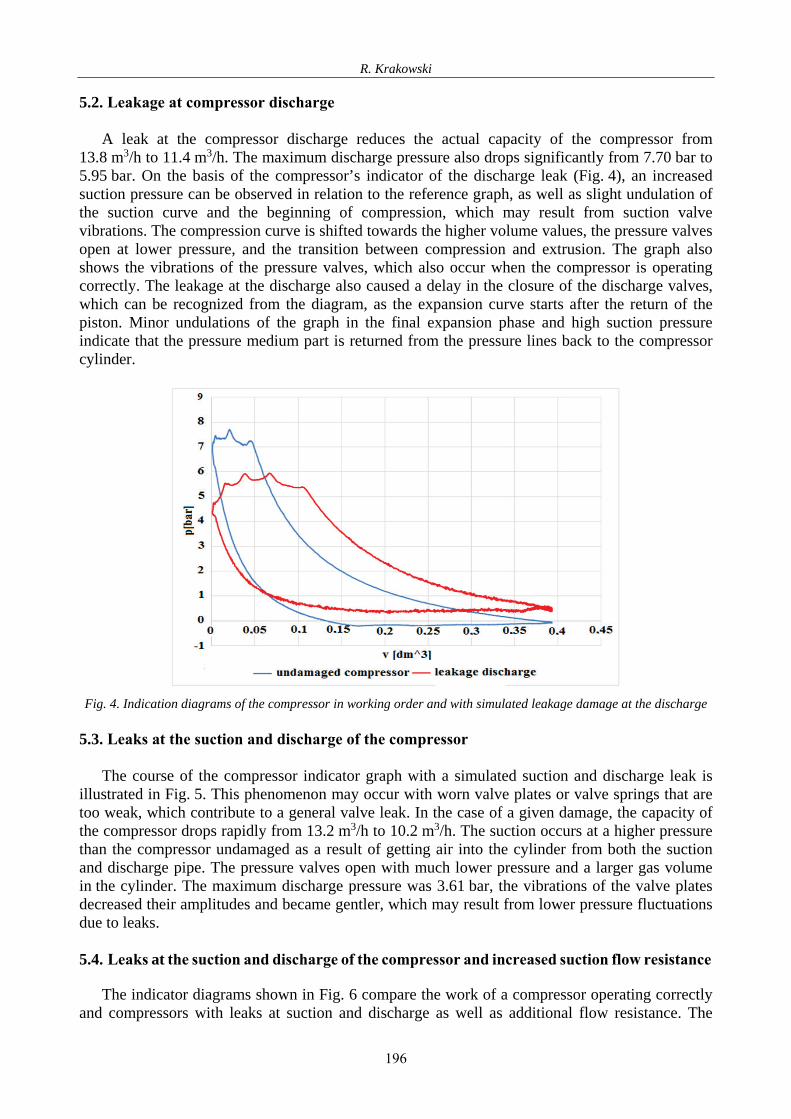
5.2. Leakage at compressor discharge
A leak at the compressor discharge reduces the actual capacity of the compressor from 13.8 m3/h to 11.4 m3/h. The maximum discharge pressure also drops significantly from 7.70 bar to 5.95 bar. On the basis of the compressor’s indicator of the discharge leak (Fig. 4), an increased suction pressure can be observed in relation to the reference graph, as well as slight undulation of the suction curve and the beginning of compression, which may result from suction valve vibrations. The compression curve is shifted towards the higher volume values, the pressure valves open at lower pressure, and the transition between compression and extrusion. The graph also shows the vibrations of the pressure valves, which also occur when the compressor is operating correctly. The leakage at the discharge also caused a delay in the closure of the discharge valves, which can be recognized from the diagram, as the expansion curve starts after the return of the piston. Minor undulations of the graph in the final expansion phase and high suction pressure indicate that the pressure medium part is returned from the pressure lines back to the compressor cylinder.
Fig. 4. Indication diagrams of the compressor in working order and with simulated leakage damage at the discharge
5.3. Leaks at the suction and discharge of the compressor
The course of the compressor indicator graph with a simulated suction and discharge leak is illustrated in Fig. 5. This phenomenon may occur with worn valve plates or valve springs that are too weak, which contribute to a general valve leak. In the case of a given damage, the capacity of the compressor drops rapidly from 13.2 m3/h to 10.2 m3/h. The suction occurs at a higher pressure than the compressor undamaged as a result of getting air into the cylinder from both the suction and discharge pipe. The pressure valves open with much lower pressure and a larger gas volume in the cylinder. The maximum discharge pressure was 3.61 bar, the vibrations of the valve plates decreased their amplitudes and became gentler, which may result from lower pressure fluctuations due to leaks.
5.4. Leaks at the suction and discharge of the compressor and increased suction flow resistance
The indicator diagrams shown in Fig. 6 compare the work of a compressor operating correctly and compressors with leaks at suction and discharge as well as additional flow resistance. The
196

Analysis of Selected Simulated Failure of a Reciprocating Compressor Using Computer Diagnostic System
Fig. 5. Indication diagrams of the compressor in working order and with simulated leakage damage at suction and discharge
Fig. 6. Indication diagrams of the compressor in working order and with simulated leakage failure at suction and discharge as well as suction resistance
combination of these inefficiencies resulted in low real efficiency; the damaged compressor reached 9 m3/h or 4.2 m3/h less than properly operating compressor. The maximum discharge pressure of 3.59 bar also decreased, from 7.82 bar of the undamaged compressor, it is also slightly less than in the case of self-leaks (3.61 bar). Comparing the diagrams with leaks on suction and discharge as well as with leaks and additional resistance, slight changes are visible. The suction pressure is lower, and has values close to a properly operating compressor, at the end of the suction stroke starting to increase which is characteristic of increased suction resistance. There are slight vibrations on the suction curves and the beginning of compression, which are caused by leaks at the discharge, but they are not as large as in the case of only such disability. Compression ends at 3.1 bar pressure, extrusion occurs at numerous valve vibrations, which have a greater
197

R. Krakowski
amplitude than a compressor with suction and discharge leaks. Indicator diagram of a damaged compressor combines the features of all three individual failures, so that the compressor in this state has the worst performance of both the efficiency and maximum pressure of the compressor.
6. Conclusions
1) The laboratory stand of the reciprocating compressor was built to investigate the impact ofselected failures on selected operating parameters. It has been properly instrumented with therequired sensors and modernized to enable a diagnostic examination of the compressor’stechnical condition. The introduced changes allow for simulation of compressor failures mostfrequently encountered in practice, to which, among others, there are damaged suction anddischarge valves, or a dirty air filter.
2) The compressor works with diagnostic software that allows real-time observation ofabnormalities in its operation on the monitor screen and learning the symptoms of individualdisabilities on the indicator diagrams. In order to detect damages correctly, the obtained datafor analysis are complemented with additional parameters, such as the temperature of thecompressed gas or the rotational speed of the compressor shaft. Diagnostic software throughthe possibility of superimposition of indicator diagrams definitely facilitates the diagnosticanalysis of the compressor and allows on the basis of their recognition of symptoms indicatingthe occurrence of disability. In addition, indicator diagrams allow you to check theperformance and the assessment of the technical condition of the machine.
3) As a single simulated malfunction, the leakage on the compressor had the greatest impact onthe compressor operation. It caused the biggest drops in both the maximum discharge pressureand the actual efficiency of the compressor. Connecting simulated malfunctions resulted ina drop in efficiency and discharge pressure. The decrease was smaller than the sum of thedecreases from particular connected failures, and larger than in the case of a single disability.The worst performance was the compressor with simulated three damages: leaks at the suction,leaks at the discharge and increased suction resistance.
References
198
Manuscript received 25 January 2018; approved for printing 27 April 2018
[1] Becerra, J. A, Jimenez, F. J., Torres, M., Sanchez, D. T., Carvajal, E., Failure analysis of
reciprocating compressor crankshafts, Engineering Failure Analysis, pp. 735-746, Sevilla 2011.
[2] Blata, J., Juraszek, J., Metody diagnostyki technicznej, teoria i praktyka, Technická univerzita Ostrava, Ostrawa 2013.
[3] Bloch, H. P., Geitner, F. K., Machinery failure analysis troubleshooting, Gulf Publishing Company, Houston, Texas 2012.
[4] Czech, J., Wybrane metody i narzędzia diagnostyki obiektów technicznych, Diagnostyka, No. 1, pp. 8-12, 2011.
[5] Gieras, M., (red.), Technika sprężonego powietrza, Atlas Copco Airpower NV, Wilrijk 2011. [6] Kolibski, T., Przystalski, Ł., Instrukcja obsługi stanowiska i oprogramowania do badania
sprężarki tłokowej, Enamor, Gdynia 2013. [7] Młynarczak, A., Mechanizmy i urządzenia okrętowe, ćwiczenia laboratoryjne, Wydawnictwo
Akademii Morskiej w Gdyni, Gdynia 2010.