Vol. 9 No.2 Februari 2019 ISSN: 2087 - 4669 - Universitas ...
Upload
khangminh22Category
view
3download
0
ISSN 2245-408X
Vol. 4, No. 2 (2015)

EDITORS-IN-CHIEF
Børge Obel, Aarhus University, DenmarkCharles C. Snow, Penn State University, United States
ASSOCIATE EDITORS
Richard M. Burton (Point of View Articles), The Fuqua School of Business, Duke University, United StatesDorthe Døjbak Håkonsson (Translational Articles), Aarhus University, DenmarkSamina Karim (Research Articles), Boston University, United StatesPeter Klaas (Translational Articles), Aarhus University, DenmarkPhanish Puranam (Research Articles), INSEAD, SingaporeMetin Sengul (Point of View Articles), Carroll School of Management, Boston College, United States
EDITORIAL BOARD
Linda Argote, Carnegie Mellon University, United StatesCarliss Baldwin, Harvard Business SchoolMichael Beer, Harvard Business School, United StatesJulian Birkinshaw, London Business School, United KingdomMagnus Broundal, VELUX A/S, DenmarkAnne Bøllingtoft, Aarhus University, DenmarkLaura B. Cardinal, C. T. Bauer College of Business, University of Houston, United StatesTimothy N. Carroll, University of South Carolina, United StatesJoe Cheng, Australian School of Business, University of New South Wales, AustraliaLex Donaldson, University of New South Wales, AustraliaDiem Ho, IBM, FranceGeorge P. Huber, University of Texas, United StatesSirkka Jarvenpaa, University of Texas, USA and Aalto University, FinlandThorbjørn Knudsen, University of Southern Denmark, DenmarkTobias Kretschmer, Ludwig-Maximilians-Universität München, GermanyKristina Lauche, Nijmegen School of Management, Radboud University Nijmegen, NetherlandsChristopher Lettl, Vienna University, AustriaZhiang John Lin, University of Texas at Dallas, United StatesJohn A. Mathews, Macquarie University, MGSM, AustraliaRaymond E. Miles, University of California, Berkeley, United StatesGeorges Romme, Eindhoven University of Technology, NetherlandsHenk W. Volberda, Erasmus University, NetherlandsCharles Williams, Bocconi University, Italy
EDITORIAL OFFICE
Marianne Sejthen, Aarhus University, DenmarkMorten Bygvraa Rasmussen, Aarhus University, Denmark
www.jorgdesign.net

Journal of Organization DesignISSN: 2245-408X© 2015 by Organizational Design Community
TABLE OF CONTENTS
INTRODUCTIONIntroduction .............................................................................................................................1Børge Obel and Charles Snow
ORGANIZATION ZOOValve’s Way ..........................................................................................................................2-4Phanish Puranam and Dorthe Døjbak Håkonsson
In the Shadow of the Crowd: A comment on “Valve’s Way” ..............................................5-7Carliss Y. Baldwin
What Lessons Should We Learn From Valve’s Innovative Management Model? ...............8-9Julian Birkinshaw
Valve Corporation: Strategy Tipping Points and Thresholds ...........................................10-11Teppo Felin
Valve’s Way: Vayward, Visionary, or Voguish? ...............................................................12-15Nicolai J. Foss and Magdalena Dobrajska
It works – I know it works ...............................................................................................16-17Lars Kolind
Valve’s Organization: Opportunities and open questions ................................................18-19Georg von Krogh and Nina Geilinger
Valve Corporation: Composing Internal Markets ............................................................20-21Todd R. Zenger
Closing Thoughts & Open Questions ..............................................................................22-23Phanish Puranam and Dorthe Døjbak Håkonsson
RESEARCH ARTICLECombining Theoretical Perspectives on theOrganizational Structure-Performance Relationship .......................................................24-37Starling David Hunter III
TRANSLATIONAL ARTICLEActivating Global Operating Models:The bridge from organization design to performance ......................................................38-47Amy Kates and Gregory Kesler
POINT OF VIEW ARTICLENetworks, Clusters, and Small Worlds: Are they related? ...............................................48-53Luca Giustiniano and Chiara D’Alise
1 Journal of Organization DesignJOD, 4(2): 1-1 (2015)DOI: 10.7146/jod.21047© 2015 by Organizational Design Community
INTRODUCTION
Beginning with this issue of JOD (v. 4, #2), we are launching a periodic series called “Organization Zoo.” Conceived by Associate Editors Dorthe Døjbak Håkonsson and Phanish Puranam, Organization Zoo is intended to analyze new or unusual organizational forms. The objective of the series is to examine organizations that have recently appeared, or which would be considered as outliers compared to traditional organizations, in order to learn more about what particular organizational forms can do as well as their drawbacks.
Each edition of Organization Zoo will be built on a case. The organization zoo already has many animals, but sometimes a new or unusual animal appears. We want to describe this new animal and how it behaves, and we want to analyze rare animals to make certain that we fully understand them. First, the case will be presented, and then several commentators will offer their thoughts and opinions about the organization. We hope that the case and its commentators’ observations will provide readers with a rich understanding of a new or unusual form of organizing.
If you are aware of an example of a new or radically different form of organizing, we encourage you to contact Dorthe ([email protected]) or Phanish ([email protected]). They will be happy to work with you to develop your case. As the Organization Zoo series evolves, we hope it will offer JOD readers many interesting and valuable lessons about organizing.
Børge ObelCharles SnowCo-Editors

2 Journal of Organization DesignJOD, 4(2): 2-4 (2015)DOI: 10.7146/jod.20152© 2015 by Organizational Design Community
VALVE’S WAYPHANISH PURANAM • DORTHE DØJBAK HÅKONSSON
Abstract: What can we learn from outliers? While statisticians rightly warn us against their non-representativeness, we believe it is also true that thinking carefully about what makes them atypical may improve our understanding of the typical case. This is the premise behind the Organization Zoo series. Valve Corporation (Valve) is an unusual firm. It is a rare example of a firm that appears to operate without any formal hierarchy in its organization. What can we learn about the viability of authority hierarchies from Valve’s way of organizing? We wrote a brief account of Valve based on public information sources and asked several renowned organizational experts to comment on this unusual firm. We asked them to write a short commentary on what the Valve example means for organizational theorists and practitioners. Thankfully, they all accepted, and we are excited to present the results of their thinking in this first “exhibit” in the Organization Zoo.
Keywords: New forms of organizing, organizational forms, non-hierarchical organizations, self-organizing teams, boss-less organizations
Valve Corporation (Valve) is a global leader in the video game software industry. In many ways, Valve constitutes an unusual or even improbable form of organizing, whose functioning seems to be at odds with much received wisdom on how organizations should work. And yet function it does, and quite well at that.
Valve was founded in 1996 by two ex-Microsoft employees and had grown to about 400 employees in 2014.1 Valve is behind highly successful video games such as Half-Life and Counter Strike, the world’s largest online gaming portal Steam, and the widely used game programming environment, Source, through which it allows users to modify (or “mod”) its games. In 2014, Valve was privately held and estimated to be worth upwards of USD 2 billion. Its estimated revenue per employee was higher than that of Google, Amazon, or Microsoft. Valve describes itself as non-hierarchical. As one employee noted in a blog:
If most of the value is now in the initial creative act, there’s little benefit to traditional hierarchical organization that’s designed to deliver the same thing over and over, making only incremental changes over time. What matters is being first and bootstrapping your product into a positive feedback spiral with a constant stream of creative innovation. Hierarchical management doesn’t help with that, because it bottlenecks innovation through the people at the top of the hierarchy, and there’s no reason to expect that those people would be particularly creative about coming up with new products that are dramatically different from existing ones – quite the opposite, in fact. So Valve was designed as a company that would attract the sort of people capable of taking the initial creative step, leave them free to do creative work, and make them want to stay. Consequently, Valve has no formal management or hierarchy at all.2
There are no job titles, no job descriptions, and no employees called “bosses” in Valve. Instead, employees are encouraged to work on “what interests them and what brings value to Valve.”
1 This account of Valve is drawn entirely from secondary sources and closely follows that of P. Puranam, “Managing without authority: Notes on the romance and reality of non-hierarchical organizations.” Available at http://papers.ssrn.com/sol3/papers.cfm?abstract_id=24959102 http://blogs.valvesoftware.com/abrash/valve-how-i-got-here-what-its-like-and-what-im-doing-2/

Phanish Puranam • Dorthe Døjbak Håkonsson Valve’s Way
3
SELF-ORGANIZING VIA SELF-SELECTION At Valve, employees are free to choose how to use their time and talents. Every employee can initiate projects and choose which projects to work on. As a consequence, self-selected teams of individuals form spontaneously around topics of interest. There is no manager or system architect to oversee or control these choices. The official employee handbook is subtitled: “A fearless adventure in knowing what to do when no one’s there telling you what to do.” In making their decisions on which team to join and how much time to devote to the various competing projects, employees take into account not only their own interest in particular projects and teams but also the decisions of others. Because Valve employees are rewarded for their contributions, there is an incentive to be part of successful projects. Projects perceived as risky may not be able to attract talent and thus may not be adequately staffed. Team size and composition are constantly in flux, reflecting which projects are believed to be “hot.”
INFORMAL LEADERSHIP AND COMMUNICATION Teams at Valve do not have formally assigned leaders. Projects do have “leads”, but they are chosen by informal consensus. Insiders claim there is neither prestige nor money attached to the label. Each project makes its own decisions about testing, check-in rules, how often to meet, and what the goal is and how to get there. Employees are empowered to the extent that they can “ship” their own products (provided two or more other employees agree). There is no separate marketing or quality assurance department in Valve. The company does not have any formal top down or lateral communication channels. It is up to the individual employees to talk to others in the company to find out what is happening. To coordinate with each other, employees simply move their wheeled workstations to be physically proximate to team members.
DISPUTE RESOLUTION THROUGH CONSENSUS Dispute resolution at Valve is mostly handled through consensus. An employee stated on a blog:
We’re all human, so teams sometimes argue (and sometimes passionately) about what to do and how to do it, but people are respectful of each other and eventually get to a consensus that works. There are stresses and more rigid processes when products are close to shipping, especially when there are hard deadlines for console certification (although shipping for the PC is much more flexible, thanks to Steam). Sometimes people or teams wander down paths that are clearly not working, and then it’s up to their peers to point that out and get them back on track.3
All decision-making is initially attempted within the team, with peers outside the team getting involved if this does not work.
BONUSES FOR TOP PERFORMERS Employee performance is assessed by means of a peer-reviewed performance system where peers review others’ performance and rank them. Top performers receive generous bonuses and raises. Pay is very high by industry standards.
FORMAL AUTHORITY AND EMPLOYMENT RELATIONSHIPS Technically, Valve is not hierarchy-free because the founder-owner, Gabe Newell, has formal authority over his employees. He can fire an employee but an employee cannot fire him. The employee handbook acknowledges this, tongue in cheek, when it defines the founder as follows: “Gabe Newell – Of all the people at this company who aren’t your boss, Gabe is the MOST not your boss, if you get what we’re saying.”
Another domain in which the founder exercises considerable authority is in hiring. After taking extreme care with multiple rounds of interviewing by many employees, as well as 3 http://blogs.valvesoftware.com/abrash/valve-how-i-got-here-what-its-like-and-what-im-doing-2/
Phanish Puranam • Dorthe Døjbak Håkonsson Valve’s Way
4
performing the usual due diligence that precedes any hire, Valve’s founder makes the final decision. However, Valve does have a nearly flat formal authority hierarchy, and Newell also seems to have delegated a lot of his authority to enable employees to make their own decisions on how to organize.
SIMILAR SPECIMENS There are other examples of non-hierarchical organizations like Valve. Perhaps the oldest is W.L. Gore and Associates, the maker of Gore-Tex fabric. Also, Morning Star makes tomato paste using low-skilled workers. Both firms eschew a formal managerial hierarchy. But it is in the world of software start-ups, inspired as they are by Valve and the open-source ethos, that there appears to be a lot of interest building towards non-hierarchical organizational models. GitHub, which offers a sophisticated system for managing distributed software development, claims its objective is to “maximize happiness” and was valued at $750 million in its Series A valuation. Menlo Innovations, a software development and consulting business has its developers work in pairs – two to a keyboard – writing code together and switching partners every fortnight or so, and says it is in the “business of joy.” Neither has a managerial hierarchy.
A CHALLENGE TO HIERARCHY? What are we to make of the success of non-hierarchical formal organizations like Valve? Do they offer a new blueprint for organization design that is likely to be more acceptable in an egalitarian Zeitgeist? Is there anything fundamentally new here? Impressive as Valve is, several potential problems perhaps lurk beneath the surface – these are problems beyond those that would arise for any atypical system of organizing, such as the missing ladders of status, opportunity, and mentoring, and associated difficulties of interfacing with a hierarchy- infested labor market. First, there is the problem of possible under- and over-provision of effort (not only within the teams but also at the level of the firm). Since rewards are peer- driven, individuals may want to work on visible rather than truly promising projects. This has an increasing return dynamic that may crowd out truly useful projects. Second, there is a question about scalability. It is worth noting that all start-ups look like self-selected teams but switch to conventional authority hierarchies as they grow. Does that mean there are natural limits on scale for this kind of organization? Could this form of organizing work in a public limited company? In a brownfield context? Third, while leaders in Valve are those who acquire popularity, this may lead to “in-crowd” phenomena and give rise to cliques. Social inertia may lead to team composition and even division of labor being determined by history rather than what is appropriate for the task at hand. Being overruled (or even ostracized) by a community of peers may not necessarily feel better than being overruled by a boss. In fact, does the boss not serve as a symbolic common focal point of dislike that unites the subordinates? Fourth, the speed of decision-making may be slower as consensus takes time and does not guarantee a stopping point for a discussion (unlike vertical escalation, which does).
Perhaps there are other problems at Valve, but the question remains: what are we as organization design theorists to make of Valve’s way?
PHANISH PURANAM ProfessorINSEAD-SingaporeE-mail: [email protected]
DORTHE DØJBAK HÅKONSSONAssociate ProfessorAarhus UniversityE-mail: [email protected]

5 Journal of Organization DesignJOD, 4(2): 5-7 (2015)DOI: 10.7146/jod.20176© 2014 by Organizational Design Community
IN THE SHADOW OF THE CROWDA COMMENT ON VALVE’S WAYCARLISS Y. BALDWIN
There are many ways to exercise authority. Perrow (1986), in his review of March and Simon’s Organizations (1958), offers a threefold classification of the ways authority can be exercised in organizations: (1) direct, “fully obtrusive” controls such as giving orders and direct monitoring; (2) bureaucratic controls such as defined specializations, roles, and hierarchy; and (3) “control of the cognitive premises underlying action.” Valve ostentatiously makes little use of direct authority. It downplays bureaucracy, although in fact many bureaucratic controls are in place. Instead, the legal authority vested in the owners of the company (especially the majority shareholder, Gabe Newell) is used quite extensively to set the premises of action and thus unobtrusively channel employees’ efforts and communication patterns into a highly productive configuration. The sustained high profits of the company, and its ability to attract and retain talented software developers, are testimony to the success of this organizational model. At the same time, contextual variables – in particular Valve’s identity as a video game creator and the fact of a single majority shareholder – are also critical factors contributing to its success. As a result, even within the software industry, the range of companies for which this organizational model is appropriate is quite limited.
Puranam and Håkonsson (2105) have provided a succinct overview of Valve’s public face as presented in corporate publications such as the Handbook for New Employees (Valve Corporation, 2012) and employee blogs. The most obvious anomaly at Valve is the absence of direct, obtrusive authority over the effort of employees. The authority to direct the work of employees is the legal right of any employer (ALI, 2007). It is also the foundation of two influential theories of the firm (Simon, 1951; Williamson, 1975). Yet Valve publicly and emphatically disavows this right.
VALVE IS DIFFERENTI would like to look more closely at Valve’s special position in the software world. Valve makes and distributes video games. Games are a leisure time activity, an entertainment, a form of art, and for some people, an addiction. Large numbers of people “pay to play”, and Valve is in direct contact with many of them. (Valve claims the ability to reach 25 million gamers through the Steam distribution platform.) Video games have considerable intrinsic value to gamers, and the subset of the gaming population that is capable of creating or modifying games obtains both use value and prestige from their creations. Although I am not aware of any formal study, it is rumored that, just as scientists accept lower pay to work at universities (Stern, 2004), many software developers will accept lower pay to work at game studios. For a significant subset of people with coding skills, it is more interesting and personally satisfying to be able to say “Yeah, I programmed the explosions for Real Action Game X,” than “Yeah, I programmed the payments system for Bank Y.”
What this means is that the human capital available to Valve outside the employment relationship is much larger than that of a typical company, including most software companies. Great numbers of people are willing and able to work on Valve’s projects without contract, for free. In this respect, Valve resembles an open source software community – with the
Carliss Y. Baldwin In the Shadow of the Crowd:A comment on “Valve’s Way”
6
key difference that, at its core, it is a profit-making enterprise. This shadow workforce also constitutes a fairly overt threat to Valve’s employees and layoffs have occurred.1
Valve’s employees, at least those who code for a living, must provably do something the crowd cannot do. Shirking, if it compromises one’s productivity, is not an option. Solving mundane problems does not warrant continued employment. Trying but failing to solve difficult problems is probably not a good idea either, unless your work is considered strategic and you are sure of the backing of your peers.
Thus, as a company, Valve enjoys an unusually favorable position in its labor market. It can crowdsource many features of a game for free from avid customers. It can pick and choose its employees from a deep pool of talented people who see intrinsic value and artistic merit in games and/or derive pleasure from solving problems posed by game construction. In these circumstances, there is simply no need to use direct authority for coercive purposes. Direct authority – giving orders and checking up on effort – is a blunt motivator that often backfires by alienating workers, making them sullen and resistant.
Whether it is in software or some other line of business, a company that can access large amounts of skilled effort for free for transient or mundane jobs and pick and choose its permanent employees on the basis of their intrinsic motivation, talent, and “fit” with the organization does not need to use direct authority as a motivator. Indeed, Valve is not alone in this respect: Freeland and Zuckerman (2014) argue that, to elicit identification, high- performing enterprises in the modern economy generally must make visible commitments to limit their use of hierarchical authority, especially direct supervision and close surveillance. Thus, the challenge for Valve’s senior managers, particularly Newell, is to get the balance of “unobtrusive controls” just right, so as to elicit “consummate performance” from its employees (Freeland & Zuckerman, 2014; March & Simon, 1958; Perrow, 1986).
In summary, a parsimonious explanation of Valve’s employment practices is as follows: (a) Valve has access to low-cost (free) human resources for much of its work and therefore can afford to be choosy in selecting its permanent workforce; (b) within its boundaries, Valve aspires to be a high-performance enterprise able to elicit identification and “consummate performance” from employees; and (c) high-performing enterprises generally commit to limit their use of direct authority and close surveillance because these practices alienate employees, undercutting their performance. Therefore, as a high-performing enterprise, Valve does not use direct authority or close surveillance as management tools but relies instead on selective recruitment and various other unobtrusive controls to direct the work of its employees. This argument can explain Valve’s peculiar and happy circumstances, but it does not speak to the general question of organization design for software firms. In particular, what advice can we give software companies that are not surrounded by a large crowd of people eager to work for free? What about companies that do not aspire to “consummate performance” but perhaps only to “competent performance” or “competitive performance?” Does direct authority work in these cases? We must look beyond Valve and its very special circumstances for answers to these questions.
REFERENCES American Law Institute (ALI). 2007. Restatement of the Law, Third, Agency. American Law
Institute Publishers, St. Paul, MN.Freeland RF, Zuckerman E. 2014. The problems and promises of hierarchy: A sociological
theory of the firm. Mimeo.March JG, Simon HA. 1958. Organizations. Wiley, New York, NY.Perrow C. 1986. Complex Organizations: A Critical Essay. McGraw-Hill, New York, NY.Puranam P, Håkonsson DD. 2015. Valve’s way. Journal of Organization Design 4(2): 2-4.Simon HA. 1951. A formal theory of the employment relationship. Econometrica 19(3): 293-
305.Stern S. 2004. Do scientists pay to be scientists? Management Science 50(6): 835-853.Valve Corporation. 2012. Handbook for New Employees. http://www.valvesoftware.com/
1 http://www.forbes.com/sites/danielnyegriffiths/2013/02/13/layoffs-at-valve-senior-staff-among-rumoredreported-departures/

Carliss Y. Baldwin In the Shadow of the Crowd:A comment on “Valve’s Way”
7
company/Valve_Handbook_LowRes.pdf. Accessed on January 8, 2015. Williamson OE. 1975. Markets and Hierarchies: Analysis and Antitrust Implications. Free
Press, New York, NY.
CARLISS Y. BALDWIN ProfessorHarvard Business SchoolE-mail: [email protected]

8 Journal of Organization DesignJOD, 3(2): 8-9 (2014)DOI: 10.7146/jod.20175© 2014 by Organizational Design Community
WHAT LESSONS SHOULD WE LEARN FROM VALVE’S INNOVATIVE MANAGEMENT MODEL?JULIAN BIRKINSHAW
Valve is a fascinating example of a company experimenting with a new way of working – one in which there are no traditional managers, and where employees are encouraged to take direct responsibility for choosing their own projects and completing them in an efficient and effective way. Of course, Valve is not alone in pushing a “manager free” model. Zappos (owned by Amazon) is currently experimenting with a similar model they call “holacracy”, and moving further back in time there are such classic examples as W.L. Gore and Associates’ “lattice structure”, Oticon’s “spaghetti organization”, and Brazilian industrial products company, Semco. Nonetheless, Valve’s experiments are note worthy because they are ambitious, visible, and so far very successful.
Let me offer three comments about Valve’s Way, one practical, the other two more academic in nature. Practically speaking, Valve’s unusual model works in large part because the company is still relatively small. Puranam and Håkonsson (2015) point out some of the risks of Valve’s management model (people focusing effort on the wrong projects, duplication of effort, informal hierarchies emerging that marginalize some people, and slow consensus-building). I would expect these risks to compound with growth, and at some point (perhaps it has already been reached) the risks will outweigh the benefits, at which point the solution is to impose some sort of formal structure. For example, the company could divide itself – amoeba-like – into two or three separate companies, or it could create some low-touch processes for reviewing projects, hiring new people, or resolving disputes. This would be part of the natural evolution of the company and would help it to continue growing. Without such changes, Valve’s most senior people will find themselves spending all their time resolving disputes, fighting fires, and trying (perhaps vainly) to create coherence in the company’s offerings.
From an academic perspective, Valve is valuable to the research community because it allows us to see what might be possible. We all have our pet theories about how the world works, and the best way of verifying or falsifying them is when companies “stress test” them for us. For example, hierarchy is a basic principle of organizing, but depending on your viewpoint hierarchy might be a mode of coordinating economic activity, a means of exerting control over workers, or a fundamental attribute of any social structure. By building a company without a formal hierarchy, Valve provides evidence to enrich our theories. It seems likely that some sort of informal hierarchy is taking shape in the company, in the absence of a formal one. It also seems that alternative modes of coordination, based on mutual adjustment, are emerging in place of the traditional top-down mode.
A related point is that Valve, as a gaming company growing up in the Internet era, has access to knowledge-sharing technologies that earlier management pioneers such as Semco and Oticon could only dream of. I don’t know enough about the specifics of this case, but it seems likely that it is easier to coordinate activities in a bottom-up way today than it was twenty years ago. If informally run organizations used to hit their limits at around 100 employees back then, perhaps that limit has now risen to 200 or 300 people? This would be an interesting proposition to test. However, Valve also reminds us that there are limits to the

Julian Birkinshaw What Lessons Should We Learn From Valve’s Innovative Management Model?
9
power of technology in organizations. Take the case of hiring, for example, which has been a challenge at Valve. Information technology might speed up the initial screening process, but the key parts of the hiring process cannot be done without high levels of human interaction.
The second theoretical issue I would like to note is about the rhetorical aspects of Valve’s new way of working, and how such ideas spread. Valve has received a lot of publicity for its manager-less model, in large part because journalists, consultants, and academics are always on the lookout for novel and progressive practices. This is a good thing, for the most part, but it is not without its problems. For example, it is too early to say for sure whether Valve’s model actually works: perhaps the company is performing well despite its model; perhaps its employees are behaving unusually well because they are in the public eye (a large-scale Hawthorne Experiment); perhaps the charisma of CEO Gabe Newell is garnering as much attention as company performance. As researchers, we should be cautious in our attributions. A separate concern is that we probably do not agree what is novel about the Valve model. The company is a Rorschach test for the research community: each of us looks at it through our own lens and sees what we want to see. I see Valve as a story about management innovation; others might focus on organization design, incentive systems, governance, information technology, employee engagement, and so on.
One could argue that this is not a problem, as any organization, by its nature, can be viewed through multiple lenses, all equally valid. But the real problem is that these lenses are often applied on the basis of limited evidence. Most of us have only second-hand information about what Valve is up to, and the net result is likely to be a disconnect between rhetoric and reality. Arguably, this is what has happened to celebrated cases like Semco, Oticon, Morning Star, and W.L. Gore and Associates. Students and readers of the Harvard Business Review become so enchanted with the hype around these companies that they end up disillusioned when they encounter these companies in reality or when company performance dips. And this, in turn, is unhelpful to the research community, as it reduces the legitimacy of our theories.
These risks cannot be avoided entirely, but they can certainly be mitigated by careful analysis and reflection. One simple rule of thumb is that we should all conduct some primary data collection – a couple of interviews, for example – before volunteering a theory about an unusual company such as Valve. This approach should ensure that our ideas do not get too far out of line from the real-life phenomena we are purporting to study.
REFERENCESPuranam P, Håkonsson DD. 2015. Valve’s way. Journal of Organization Design 4(2): 2-4.
JULIAN BIRKINSHAWProfessorLondon Business SchoolE-mail: [email protected]
10 Journal of Organization DesignJOD, 3(2): 10-11 (2014)DOI: 10.7146/jod.20157© 2014 by Organizational Design Community
VALVE CORPORATIONSTRATEGY TIPPING POINTS AND THRESHOLDSTEPPO FELIN
Valve Corporation represents an intriguing case study of flat structure and self-organization (Puranam & Håkonsson, 2015). The structures and practices of Valve, of course, are not new. But the company provides an interesting experiment and illustration that powerfully highlights how organization design can impact individual and collective behavior, strategy, and performance.
For the past two years, I have used Valve’s Handbook for New Employees (Valve Corporation, 2012) as a case study with MBA students and executives. The Valve case illustrates many important concepts related to organization design and strategy. For example, Valve is a nice example of infusing the market mechanism into hierarchy (Foss, 2003; Zenger & Hesterly, 1997). The company utilizes high-powered incentives and peer mechanisms to reward, lure, and retain top talent. The company can also be seen as a form of polyarchy (Knudsen & Levinthal, 2007; Sah & Stiglitz, 1986), where individuals can pursue initiatives at their own discretion without fear of managerial intervention. Puranam and Håkonsson (2015) also touch on a number of other principles illustrated by Valve.
What is new about the structures and practices of Valve? Last year I interviewed a key informant (the primary author of Valve’s Handbook) to learn more about the company (Felin & Powell, 2014). The interview provided rich details about Valve’s structures and practices, including some novel aspects that are worth further consideration. What intrigued me most about Valve was its use of the “rule of three.” This rule requires that at least three individuals within the organization agree that a particular initiative, product idea, or project is worth pursuing before it is launched. Not only should three individuals agree about the value of the project, but they also need to be willing to join and work on the project. Thus, unlike polyarchies (in their pure form), Valve has instituted a practice where individuals cannot pursue projects on their own. Every initiative and project requires a threshold level of social support – in effect, creating a tipping point (of three individuals) for action.
Valve’s rule of three for initiating a project is interesting in a number of ways. The need to recruit or incorporate at least three people to start a project creates a kind of initial social proof about both the possibility and feasibility of a potential project (Felin & Powell, 2014). If three people think an idea is worthwhile – and are willing to “vote with their feet” to join and work on the project – this creates a signal about the potential value of the project. In fact, individuals within the company are encouraged to constantly be thinking about and scanning for those projects that might create the most value for themselves and the organization.
The rule of three also creates a mechanism whereby an individual’s initial ideas are likely to morph and improve through social interaction. The need for social interaction can lead to improvements and changes in the nature of the initial idea and project itself as well as the consideration of adjacent opportunities beyond the purview of any one individual. The rule of three demands social interaction, which in turn unleashes a valuable set of processes: brainstorming, pitching and recruiting, consensus building, discussion, negotiation, and learning. Thus, a form of collective wisdom accrues as individuals interact with others, and the project idea evolves toward the threshold of three.
The rule of three, and the associated need to recruit and interact with others, also ensures that ideas are vetted more carefully. The rule can be seen as providing a much-needed check on cognitive biases that might hamper individuals. Individuals suffer from a host of biases

Teppo Felin Valve Corporation: Strategy Tipping Points and Thresholds
11
that may lead to poor project selection and decision-making, including confirmation bias, attentional biases, blind spots, and overconfidence. The recruitment of others onto a project can dampen the effect of these individual biases, as project or product ideas are vetted and scrutinized by others.
Adding the social factor to decision-making and project selection does not ensure that biases disappear completely. Beyond individual biases, a host of social biases can also detrimentally impact decision-making and project evaluation and selection. For example, individuals – even within small social circles – might suffer from an in-group or shared information bias. Furthermore, social interaction and peer recruitment onto projects might happen based on homophily. That is, there is a natural tendency for human interaction to occur on the basis of similarity on demographic or value-related factors, which can hamper the extent to which sufficiently diverse ideas are introduced and considered.
I directly asked Valve respondents about any concerns that they might have about these types of social biases. They argued that because they hire the very top talent in their industry – and aggressively pay and incentivize them – that these individuals might be less susceptible to such biases. Perhaps so – research has shown that there are individual differences in biases, where some are less prone to certain types of biases than others (Stanovich, 2011). Mistakes are inevitable (and even encouraged) as Valve, after all, operates in a dynamic and uncertain technology environment where experimentation and trial-and-error are part of the process of innovation.
In conclusion, Valve has created a seemingly dynamic, self-organizing ecosystem where strategies and opportunities emerge endogenously as individuals imagine, interact, and self-select to create projects and joint value. I find the more general principle of strategy tipping points and thresholds – as Thorbjørn Knudsen and I tried to model in the context of entrepreneurship and strategy (Felin & Knudsen, 2012) – to be interesting and worth careful consideration. How individuals “vote with their feet,” both within and across organizational settings, is important from a strategic perspective. Tipping points and thresholds associated with self-selection and the mobility of human capital, I believe, can serve a number of functions: a signal of value, a decision heuristic, a source of managerial insight, and even a way of validating and implementing strategies. Thus, I think Valve’s rule of three, and the more general idea of strategy tipping points and thresholds, provides an intriguing opportunity for future work at the nexus of organization design and strategy.
REFERENCESFelin T, Knudsen T. 2012. A theory of nascent entrepreneurship and organization. Managerial
and Decision Economics 33: 409-426.Felin T, Powell T. 2014. Organization design and capabilities. Working Paper, Oxford
University, UK.Foss NJ. 2003. Selective intervention and internal hybrids: Interpreting and learning from the
rise and decline of the Oticon spaghetti organization. Organization Science 14: 331-349.Knudsen T, Levinthal D. 2007. Two faces of search: Alternative generation and alternative
evaluation. Organization Science 18: 39-54.Puranam P, Håkonsson DD. 2015. Valve’s way. Journal of Organization Design 4(2): 2-4.Sah RK, Stiglitz JE. 1986. The architecture of economic systems: Hierarchy and polyarchy.
American Economic Review 76: 716-727.Stanovich KE. 2011. Rationality and the Reflective Mind. Oxford University Press, Oxford,
UK.Valve Corporation. 2012. Handbook for New Employees.Zenger TR, Hesterly WS. 1997. The disaggregation of corporations: Selective intervention,
high-powered incentives, and molecular units. Organization Science 8: 209-222.
TEPPO FELINProfessorUniversity of OxfordE-mail: [email protected]
12 Journal of Organization DesignJOD, 4(2): 12-15 (2015)DOI: 10.7146/jod.20162© 2015 by Organizational Design Community
VALVE’S WAYWAYWARD, VISIONARY, OR VOGUISH?NICOLAI J. FOSS • MAGDALENA DOBRAJSKA
Puranam and Håkonsson (2015) challenge us to ponder what we as organization design theorists make of Valve’s way (see also Jeppesen, 2008). We believe that Valve, in spite of its radical vision, does not represent a challenge to fundamental organization design theory and that it is questionable to what extent it represents a new blueprint for organization design, despite it being consistent with an “egalitarian Zeitgeist” (Puranam, 2014). In fact, managerial authority may be of increasing importance rather than the opposite (Guadalupe, Li, & Wulf, 2015). Thus, Valve is, and will remain, an outlier, albeit a voguish one.
HOW UNUSUAL IS VALVE’S WAY, REALLY?Valve is just one example, albeit a radical one, of a spate of companies that have adopted flat hierarchies with widely distributed decision authority, project organization, high-powered incentives, and/or employee ownership of assets. Already in the 1980s, Wisconsin’s Johnsonville Sausage slashed managerial oversight and put quality control, personnel management, customer relations, and even business expansion in the hands of worker-managed teams. As CEO Ralph Stayer (1990) declared, “My job was to put myself out of a job.” The so-called “spaghetti organization” in the Danish hearing-aid producer, Oticon, which was adopted in 1991 (and partially abandoned in 1996) is an early example with many features similar to Valve (even down to the mobile trolleys). Foss and Klein (2014) refer to such examples as “wikified companies”, using the wiki-prefix to denote the loosely structured, bottom-up, egalitarian structure popularized by the Wikipedia encyclopedia and touted by management thinkers and consultants.
In fact, over the last two to three decades the popular management literature has been replete with proclamations of the impending death of managerial authority (e.g., Hamel, 2014; Kastelle, 2013; Peters, 1994; Semler, 1989). We remain skeptical of such arguments. One reason is that the exemplary companies are often special and therefore unrepresentative cases. Consider Valve. This is a company that by virtue of the nature of the products it develops, produces, and selects is able to locate many interdependencies within organizational units of the company, namely, the individual project. (Of course, reputational interdependencies remain, and all projects draw on corporate resources.) This means that the externalities associated with task and outcome interdependencies are, to a large extent, internalized within projects (games), and such a “modular” design means less demand for managerial intervention. Valve is an example of an organization where a modular design of its product is reflected in a modular design of the organization (Sanchez & Mahoney, 1996). Employees are likely to be similar in terms of backgrounds, education, lifestyle choices, and so on. As a result, fault lines (van Knippenberg et al., 2011) in project teams are less likely to arise, and peer effects (Kandel & Lazear, 1992) presumably do a good job of addressing problems of moral hazard within projects. High-powered incentives also help. Because there are no fixed hierarchical positions and change is constant, there are no endowment and loss effects that may introduce organizational inertia (Kahneman, Knetsch, & Thaler, 1990).
From an organization design perspective, the particular organizational form used by Valve is hardly surprising. This is the kind of company where such a design would be viable (and by implication, less viable in more traditional companies) (Foss, 2003).

Nicolai J. Foss • Magdalena Dobrajska Valve’s Way: Vayward, Visionary, or Voguish?
13
LATENT DESIGN CHALLENGESWhile so far Valve appears to have been a success, we do not think the Valve design is without latent problems. An immediate observation is that there is no functional specialization. For example, the absence of a marketing department may have negative consequences for the development of competencies in support functions such as marketing or sales (this is relevant to the scalability problem mentioned by Puranam and Håkonsson, 2015).
However, perhaps a more serious problem has to do with project selection. The modular organizational design of Valve removed managerial oversight not only from coordination within projects but also coordination and resource allocation across projects. Selection of projects with high potential, and termination of unsuccessful projects, are key strategic decisions made in firms. Typically, firms develop well-defined sets of decision criteria and processes to discriminate among promising and excessively risky projects. They also develop organizational structures such as committees or hierarchies to govern those decisions. In Valve, such decisions are delegated to the employees and rest upon several mechanisms.1
In a flat, project-based organization with self-selection into projects, these mechanisms include popularity of a project among employees, likeability and reputation of colleagues already involved in a project, interpersonal climate and conflicts among employees, and the visibility of a project. The personal characteristics of individuals, or the extent to which certain people like each other, may overshadow the true potential of a project or may even compromise its success. Thus, the process of signaling project value gets noisy, and the application of unbiased criteria potentially gets compromised – and arguably more so than in a traditional hierarchical structure.
The lack of a hierarchical structure in Valve does not mean that performance of employees is not being assessed; hierarchical monitoring is substituted with monitoring by peers. Performance bonuses are based on reviews by peers, while in traditional organizations performance is assessed more or less objectively by a boss, sometimes supplemented by 360 degree feedback. Being assessed by peers gives strong incentives not only to deliver high performance to a project but also to comply with social norms in the firm. Assessment by peers may be an effective tool to keep shirking at bay, as reputation among peers becomes important (Kandel & Lazear, 1992). Valve has apparently developed strong social norms for cooperation and for providing strong individual contributions.
While peer assessment may often be more accurate than supervisory assessment because of its superior access to person-specific information, it has its drawbacks. First, social skills, interpersonal relationships, and reputation become more important than in traditional organizations. To some extent, these assets arise as side effects of interaction in and across projects. However, investing in those assets is also a choice, and employees will undertake such investments (which may be seen as a special case of rent-seeking, involving peers rather than superiors). Second, these processes introduce feelings of loyalty and other emotions that may distort the assessment of projects. Because people are prone to a bias of overestimating the quality of ideas of outspoken, extroverted team members while underestimating the thoughts of more introverted colleagues, productive but introverted employees may not realize their full potential. Third, the lack of a formal hierarchy provides plenty of room for the formation of an informal hierarchy. As a former Valve employee confided, Valve “felt a lot like high school” (Warr, 2013):
It is a pseudo-flat structure where, at least in small groups, you’re all peers and make decisions together. But the one thing I found out the hard way is that there is actually a hidden layer of powerful management structure in the company and it felt a lot like high school. There are popular kids that have acquired power in the company, then there’s the trouble makers, and everyone in between.
While formal hierarchy inside Valve is absent, formal authority held by the owner, Gabe Newell, is highly visible in the firm. Newell signals his authority, organizational values,
1 The precise allocation of the many decision rights that attach to projects (i.e., initiating, executing, monitoring, and terminating) is not entirely clear from the case description, and this may be critical.
Nicolai J. Foss • Magdalena Dobrajska Valve’s Way: Vayward, Visionary, or Voguish?
14
and the culture of appreciating high performers through high wages, a strict and elaborate recruitment process, and also dismissing redundant employees.2
BEYOND VALVEValve can do without much formal authority, we submit, because of the particular nature of its processes and products. In general, when activities are highly time-dependent, key knowledge is concentrated within the management team, and there is a need for internal coordination because of interdependencies, the case for managerial authority is strong (Foss & Klein, 2014). While timing the launch of games seems to be important, these conditions do not seem to describe Valve well. This raises the issue of the generalizability of Valve’s organizational design to other companies and industries. Valve is and will remain an outlier.
And yet, Valve is a stark illustration of the fact that while managerial authority is here to stay, the nature of managerial authority may be changing. For many everyday business activities, employees no longer need a boss to direct them to tasks or to monitor their progress. In fact, such involvement can be demotivating (Robinson & Rousseau, 1994). In a company characterized by dispersed knowledge residing inside the heads of highly qualified specialists, leaders need to let go of the notion that things should be managed from the top (Dobrajska, Billinger, & Karim, forthcoming). Managers need to move away from specifying methods and processes in favor of defining the principles they want people to apply or the goals they want people to meet. In other words, they can design the rules of the game without specifying the actions of the players. Besides establishing the organization’s guidelines for rewards, instruction, rules, and communication, managers need to convey a general understanding of “how things are done here” to help employees react effectively to changes and unexpected occurrences. Effective leaders are good at defining such frameworks. Letting organizational culture emerge and percolate on its own, without deliberate structure and design, can lead to a number of problems not the least of which is a rough-and-tumble culture that favors certain employees at the expense of others, which Valve seems to exemplify (Miller, 2014).
REFERENCES Dobrajska M, Billinger S, Karim S. Forthcoming. Delegation within hierarchies: How
information processing and knowledge characteristics influence the allocation of formal and real decision authority. Organization Science
Foss NJ. 2003. Selective intervention and internal hybrids: Interpreting and learning from the rise and decline of the Oticon spaghetti organization. Organization Science 14: 331-349.
Foss NJ, Klein PG. 2014. The myth of the wikified company. MIT Sloan Management Review 56(1): 73-81.
Guadalupe M, Li H, Wulf J. 2015. Who lives in the c-suite? Organizational structure and the division of labor in top management. Management Science 60: 824-844.
Hamel G. 2014. This is how bureaucracy dies. Fortune (April 16).Jeppesen LB. 2008. Valve software: Innovative user communities as part of a business model.
Working Paper, Copenhagen Business School. Kahneman D, Knetsch JL, Thaler RH. 1990. Experimental tests of the endowment effect and
the Coase theorem. Journal of Political Economy 98: 1325-1348.Kandel E, Lazear EP. 1992. Peer pressure and partnerships. Journal of Political Economy
100: 801-817.Kastelle T. 2013. Hierarchy is overrated. Harvard Business Review Blog (November 30).Miller C. 2014. “Yes, Silicon Valley, sometimes you need more bureaucracy,” New York
Times (April 30). Peters T. 1994. Liberation Management. Ballantine Books, New York, NY. Puranam P. 2014. Managing without authority: Notes on the romance and reality of boss-less
firms. http://papers.ssrn.com/sol3/papers.cfm?abstract_id=2495910.Puranam P, Håkonsson DD. 2015. Valve’s way. Journal of Organization Design 4(2): 2-4.Robinson SL, Rousseau DM. 1994. Violating the psychological contracts: Not the exception
2 http://www.forbes.com/sites/danielnyegriffiths/2013/02/13/layoffs-at-valve-senior-staff-among-rumoredreported-departures/

Nicolai J. Foss • Magdalena Dobrajska Valve’s Way: Vayward, Visionary, or Voguish?
15
but the norm. Journal of Organizational Behavior 15: 245-259.Sanchez R, Mahoney JT. 1996. Modularity, flexibility, and knowledge management in
product and organization design. Strategic Management Journal 17: 63–76.Semler R. 1989. Managing without managers. Harvard Business Review (September-
October). Stayer R. 1990. How I learned to let my workers lead. Harvard Business Review (November-
December). van Knippenberg D, Dawson JF, West MA, Homan AC. 2011. Diversity faultlines, shared
objectives, and top management team performance. Human Relations 64: 307-336.Warr P. 2013. Former Valve employee: “It felt a lot like high school.” Wired Magazine (http://
www.wired.com/2013/07/wireduk-valve-jeri-ellsworth/). Accessed on December 10, 2014.
NICOLAI J. FOSSProfessorCopenhagen Business School, Norwegian School of Economics, Warwick Business SchoolE-mail: [email protected]
MAGDALENA DOBRAJSKA Assistant ProfessorCopenhagen Business SchoolE-mail: [email protected]
16 Journal of Organization DesignJOD, 5(2): 16-17 (2015)DOI: 10.7146/jod.20177© 2015 by Organizational Design Community
IT WORKS – I KNOW IT WORKSLARS KOLIND
Valve is the prototype knowledge-based company because its organizational design fosters creativity, action, fast learning, and high productivity. I experienced a similar organization about 15 years before Valve, at Oticon, the Danish hearing aid manufacturer which dropped bosses, titles, departments, and most of the bureaucracy and paperwork that slows down work. As in Valve, the value-creation was spectacular: 60% growth in market value each year for a ten-year period.
Valve and Oticon made similar discoveries: Setting employees free and allowing them to choose what they want to do and who they want to work with, comes at a price. Making decisions takes longer because more people are involved and because employees are seeking consensus. Coordination may be less efficient because there may be more teams working on the same issues. But the advantages can be much bigger: Employees are more motivated and dedicated to what they do. There are no excuses for failure, and there are no managers to burden employees with reports and other bureaucracy. Plus, there is no need to budget for management overhead; managers work on projects just like everybody else.
Valve seems to be purpose-driven. The company strives to develop and distribute the best games possible with the ultimate goal of making gamers happy. For me personally, games are not the most important thing in life, but for gamers, they are. Going through the Valve website, I have no doubt that games come first and profit comes second.
Valve actively uses its corporate culture as a recruitment tool. Here is what its website says about people:
We’ve been boss-free since 1996. Imagine working with super smart, super talented colleagues in a free-wheeling, innovative environment – no bosses, no middle management, no bureaucracy. Just highly motivated peers coming together to make cool stuff. It’s amazing what creative people can come up with when there’s nobody there telling them what to do.
This philosophy works, at least in my experience. The most talented and enthusiastic people will queue up to work at a company like Valve. They will expect a fair return but not necessarily the maximum return. The fact that employee compensation is tied to peer review assures that compensation will be perceived as fair, and probably will be fair in reality.
With successes in companies such as Oticon, Valve, Semco (Brazil), W.L. Gore and Associates, Alibaba, and Xiaomi, it may seem surprising why not every knowledge-based firm learns from these examples and applies the same management model. I am not surprised, however, for these reasons:
1. Companies such as Valve need leaders who are willing to give way – to step back and serve their organization instead of commanding it. There are very few such leaders available, and those who are of that type seldom get the opportunity to take charge. Boards are afraid to take the risk of betting on them.
2. Companies such as Valve need employees who are willing to engage – not just to be physically present and do what they are told to do. Labor unions do not favor that kind of behavior.
3. Companies such as Valve need leaders who are willing to accept failures as long as employees learn from them. Conventional Western management culture punishes mistakes instead of learning from them.
4. Companies such as Valve need owners who are willing to sacrifice short-term profit for long-term value building. In particular, listed companies are so scared of analysts and shareholders that they take the easy road: Profit now and leave the future to your successor.

Lars Kolind It works – I know it works
17
My current work is focused on China. Most Chinese CEOs are averse to the management practices of Valve, Oticon, and similar companies, but at the same time they admire Jack Ma at Alibaba and similar management mavericks. What they have not yet understood is that Jack Ma and other successful Chinese managers run their companies in a way that looks more like Valve than conventional Chinese management. The day they learn it, Western companies will have a hard time competing.
LARS KOLINDAuthor and consultantCopenhagen, DenmarkE-mail: [email protected]
18 Journal of Organization DesignJOD, 4(2): 18-19 (2015)DOI: 10.7146/jod.20159© 2015 by Organizational Design Community
VALVE’S ORGANIZATIONOPPORTUNITIES AND OPEN QUESTIONSGEORG VON KROGH • NINA GEILINGER
Valve is a very interesting case study! The company shares many features with open source software projects. In Valve, as in the open source world, the focus is on creating advanced technologies and letting developers self-select projects and tasks. Self-selection seems to work particularly well in an environment where technology development itself has a coordinating function. In software development, people have a strong bond of common knowledge based on design philosophies and approaches, language and terminology, and engineering tasks. In most cases, they also share a similar educational background and/or development experience that helps them implement creative ideas in physical machines and graphic environments. Developers rarely rely on detailed instructions from higher-level managers because they already have the implicit knowledge of what needs to be done. When inconsistent views about development come to the forefront, they are best reconciled where the knowledge resides: with the experts. Moreover, it appears that Valve has uncovered how developers’ self-selection of projects and tasks can be a powerful motivator to unleash their creativity.
How does Valve’s flat hierarchy impact other aspects of its organization? The media have claimed that an uncontrollable “hidden layer of powerful management” arose in Valve to fill the power gap created by its absence of formal management and that this hidden management led to the formation of cliques and the troubling discontinuation of more radical projects. We suspect, however, that informal hierarchies form and influence decisions wherever people come together and that the flat hierarchy at Valve was not the sole reason why certain projects were abandoned. While we do not have hard evidence, we suspect that the tolerance of conflict and discussion in flat hierarchies enabled, rather than prevented, radical innovation at Valve. Valve’s recent development away from a pure video game developer toward a hardware company and its reinvention of the entire video game market with its platform Steam, indicate that Valve’s non-standard form of organizing may not have hampered radical innovation in products, technologies, and business models. In fact, it may have facilitated such innovation.
We suggest that the key question to ask in the case of Valve is how leadership fills the void left by the absence of many of the functions and tasks that exist within a traditional hierarchy. For example, it may be that at Valve, developers exercise distributed leadership rather than authority-based, top-down leadership. Developers in teams share leadership roles and responsibilities, with fluid authority based on tasks, knowledge, and interests (von Krogh, Nonaka, & Rechsteiner, 2012). Such self-driven leadership means that each team member must have the capacity to temporarily act as a leader. Over time, team members get to know each other, and relationships evolve and ease the rapid succession of authority. Yet, to become leaders and gain authority, team members must share their knowledge and reveal their interests. By doing so, team members can take on leadership activities in ways that are both comprehensible and legitimate.
Furthermore, the case of Valve holds an important lesson for us as management scholars: be sensitive to the role of technology in organizing. We need to determine which coordination technologies (e.g., project support tools, wikis, engineering tools) Valve’s employees use and how such technologies reinforce distributed leadership within Valve’s flat hierarchy. We must understand how often simple and lightweight tools replace formal communication channels. Such findings will help us strengthen the link between organization design and technology. Technology clearly cannot replace face-to-face coordination completely. In Valve’s offices,
Georg von Krogh • Nina Geilinger Valve’s organization: Opportunities and open questions
19
new project team members still roll their desks together. This physical presence may in fact be what enables distributed leadership.
We think that empowerment enhances creativity and experimentation, and that consensus building through distributed leadership could be an ideal approach for resolving conflict. However, such practices also carry risks. Consensus building is time consuming, and organizations with distributed leadership may appear less agile. They may even appear to lack resolve or consistency toward external stakeholders. Consider a recent example on Valve’s platform, Steam. Valve removed a game called Hatred, which was created by another video game development company, from Greenlight (Steam’s community area, where users can vote on which new games should be sold in the main digital store). Valve later added the game again after its CEO reviewed the decision internally and concluded that the decision to remove the game was not a “good” one. In a recreational products market, such inconsistencies might not seriously endanger a business; at most, they may lead to a short-term uproar in the media and the user community. However, when an organization’s resolve and consistency in decision-making are critical to its customers’ welfare and the firm’s legitimacy, image, and identity, some natural limits to distributed leadership and consensus building may emerge. Many software firms facing such constraints implement strict quality assurance, heavy legal compliance procedures, and the formal testing of products throughout the development cycle – elements that Valve seems not to have prioritized in its culture. As management scholars, we should ask how distributed leadership fares in firms building critical software for business organizations (e.g., transaction systems or secure trading in banks). Such firms may implement flat hierarchies and distributed leadership in some parts of their value chain (e.g., in R&D) but only in combination with more traditional designs and top-down leadership in other parts (e.g., in production, sales, and marketing).
Finally, the question about scalability remains an open one. Flat hierarchies may be rare in industries other than IT and in large corporations (well-known exceptions exist, such as Ricardo Semler’s Semco or Pentagram). However, the story may be more intricate than one of structural design or technology. The open source phenomenon has repeatedly demonstrated that flat hierarchies can support massive and stable technology development that coordinates thousands of users and contributors. A cardinal principle of such organizations seems to be a role-model founder who walks the talk, stands strongly behind the principles of distributed leadership and empowerment, and imprints those principles upon the organization’s identity (e.g., GitHub or Wikipedia). Such founders seem to infuse their organizations with distributed leadership and do so by practically demonstrating how such leadership can work. That is no small feat!
REFERENCES von Krogh G, Nonaka I, Rechsteiner L. 2012. Leadership in organizational knowledge
creation: A review and framework. Journal of Management Studies 49(1): 240–277.
GEORG VON KROGH ProfessorETH ZurichE-mail: [email protected]
NINA GEILINGER Ph.D. CandidateETH ZurichE-mail: [email protected]

20 Journal of Organization DesignJOD, 4(2): 20-21 (2015)DOI: 10.7146/jod.20155© 2015 by Organizational Design Community
VALVE CORPORATIONCOMPOSING INTERNAL MARKETSTODD R. ZENGER
Discussions of the Valve Corporation are always enlightening. The skeptic wonders how much is rhetoric and recruiting ploy and how much is real. Is there clear evidence that this organizational design actually works – that it is efficient in this setting? While revenues per employee are quite remarkable, cause and effect are unclear. Is “boss-less-ness” the cause of high sales per employee or simply the result of high sales per employee, fueled from earlier success? The same question could be asked of Google’s unusual organizational approach. Is Google’s success the result of its extensive autonomy granted to employees, or is its past success the enabling cause of such autonomy? Such questions, of course, are empirically unanswerable here. I therefore set them aside and assume this organizational specimen is efficient – well-suited to its environment – and proceed with further commentary.
It is tempting to observe Valve and ask the question: how do they operate so well without bosses – with so little hierarchy? However, for me the key question is: why do they operate with any hierarchy whatsoever? What advantage is gained from this limited form of integration? Why employ game developers rather than contract for their output or services as is common in book, film, and music production? Given the efforts to replicate the look and feel of a market with high-powered incentives and the free-flowing match of individuals to projects, why does Valve bother with integrating this activity at all?
There is no shortage of gamers willing to participate in development and no shortage of opportunities to outsource. Valve’s recent willingness to undertake layoffs despite their success suggests they are also not promoting an environment of job security or guaranteed employment.1 Instead, Valve seems intent on replicating the market internally as best it can. But, again, why not just crowdsource or contract for the work? The answer seems non-obvious, and I can offer only speculation as to what Gabe Newell perceives as the advantage. I suspect it is quicker access to talent, a more streamlined approach to matching talent to projects, and greater capacity to facilitate the cooperation and coordination across projects and developers required to build Stream as a robust game portal. I am not convinced any of these advantages are enormously compelling, which explains Valve’s efforts to primarily replicate markets within its organizational walls.
Their apparent success in doing so takes us then to the next and to my taste the most interesting question. How does Valve get away with adding so little hierarchy and instead composing within the firm so many of the central features of markets? How does the firm so closely link pay to performance, thereby providing wide, market-like pay variance? How does the firm avoid meddling bosses? How does the firm generate this fluid matching of people to projects? These are outcomes not easily achieved inside most organizations. For instance, wide pay variance linked to subjectively assessed performance yields rampant social comparison costs in most organizations (Nickerson and Zenger, 2008). Individuals, in response to what they perceive as unfair pay, lobby managers, diminish their effort, cease their employment, or sabotage the efforts of others. Moreover, within firm boundaries managers meddle and employees aggressively politick to alter pay or change work assignments (Milgrom and Roberts, 1988). How does Valve avoid these standard impediments to the selective infusion of market-like incentives?
In my mind, the answer partly reflects the nature of the work. Game development is a rather modular, decomposable activity (Baldwin, 2008; Simon, 1962; Nickerson and Zenger, 1 http://www.forbes.com/sites/danielnyegriffiths/2013/02/13/layoffs-at-valve-senior-staff-among-rumoredreported-departures/

Todd R. Zenger Valve Corporation: Composing Internal Markets
21
2004). Project groups are small; individual efforts and performance are relatively observable; and projects are rather independent of one another. But, arguably even more important, Valve succeeds because it adopts a bundle of complementary design elements, aided by rather measurable individual performance, that enable the infusion of market elements (see Zenger, 2002; Zenger and Hesterly, 1997). The absence of bosses, aggressive market-like pay, self selection to projects, and peer evaluation all function as design complements. The absence of a boss assigning pay or allocating projects curbs costly politicking over variance in rewards. There is simply no one to lobby, thereby removing an important cost associated with pay variance. The absence of bosses also ensures that there is also no one to blame for low performance, as each individual chooses both her projects and her effort. Peer assessments of performance and the resulting assignment of pay also remove targets for costly lobbying and politics. All of the above are complemented by the modular nature of work and the relative observability of performance. It is difficult to conceive of this model being successful in work setting where all projects, problems, and efforts are highly interdependent and require extensive coordination.
All of the comments above point to the origins of this design’s rarity. First, for much of what Valve does, the design seems to hold only a marginal advantage over simply using the market. Second, the feasibility of the design and its potential advantage is likely limited to settings where work is highly decomposable, and individual performance rather observable. Third, replicating Valve is not an a la carte design endeavor. It instead requires the skillful adoption of a host of complementary design choices. While such work conditions are not necessarily rare, and others may learn from Valve’s skillful implementation, this trio of demands likely dooms the design to “rare breed” status in the “organizational zoo.”
REFERENCESBaldwin C. 2008. Where do transactions come from? Modularity, transactions, and the
boundaries of the firm. Industrial and Corporate Change 17: 155-195.Milgrom P, Roberts J. 1988. An economic approach to influence activities in organizations.
American Journal of Sociology 94: 154-179.Nickerson JA, Zenger TR. 2004. A knowledge-based theory of the firm: The problem-solving
perspective. Organization Science 15: 617-622. Nickerson JA, Zenger TR. 2008. Envy, comparison costs, and the economic theory of the
firm. Strategic Management Journal 29(13): 1429–1449.Simon HA. 1962. The architecture of complexity. Proceedings of the American Philosophical
Society 106: 467-482.Zenger TR. 2002. Crafting internal hybrids, complementarities, common change initiatives,
and the team-based corporation. International Journal of Economics and Business 9: 79-95.
Zenger TR, Hesterly WS. 1997. The disaggregation of corporations: Selective intervention, high-powered incentives, and molecular units. Organization Science 8: 209-222.
TODD R. ZENGER ProfessorUniversity of UtahE-mail: [email protected]

22 Journal of Organization DesignJOD, 4(2): 22-23 (2015)DOI: 10.7146/jod.20154© 2015 by Organizational Design Community
CLOSING THOUGHTS AND OPEN QUESTIONSPHANISH PURANAM • DORTHE DØJBAK HÅKONSSON
Our goal in putting the spotlight on Valve Corporation is to stimulate thinking about what (if anything) this specimen in the zoo of organizational forms teaches us. We thank our panel of distinguished commentators for kindly (and sportingly) joining us in this exercise. So is Valve simply unusual? Or is it also instructive? The commentators, to our gratification, seem to argue that it is both.
Baldwin, Birkinshaw, Foss & Dobrajska, and Zenger each set out several arguments as to why Valve, while instructive, may be difficult to replicate because it occupies an unusual (and small) portion of the space of possible models of organizing (Puranam, Alexy, & Reitzig, 2014). As Zenger puts it, Valve may constitute a “rare breed” in the organization zoo. Valve makes software and, in particular, gaming software. Its costs of prototyping and of large-scale production are small. Its task architecture is decomposable (making modularity attractive), and there is a supply of enthusiasts who would potentially do for free what employees do for pay. These conditions may make formal authority less necessary but, paradoxically, more powerful in Valve because of its unusual labor market conditions, as Baldwin and Zenger point out. Further, Valve is a privately held and intentionally small organization, and it is unclear if its recipes for organizing carry over to larger, publicly listed organizations with growth pressures. The slowness of dispute resolution, possible biases in resource allocation arising from informal hierarchies, and cliques that could emerge to take the place of formal structure are possible reasons that restrict Valve’s organization from spreading to larger firms.
Felin, Kolind, and Krogh & Geilinger emphasize broad applicable principles that they believe may transcend the particular context of Valve. These include principles of distributed leadership (which, interestingly, evolutionary psychologists tell us may approximate the style of leadership that was prevalent in our hunter-gatherer past (van Vugt, 2006), the “tipping point” created by simple quorum rules to de-bias individual decisions, and the empowering effect of autonomy on knowledge workers. Baldwin, as well as Foss and Dobrajska, agree on the idea that the combination of high-quality talent and an organizational commitment to abstain from micro-management can be powerful, but they remain cautious about how often this combination is practically feasible (or even, as Zenger points out, necessary).
Birkinshaw cautions us about reading too much into an account of Valve’s functioning based purely on publicly available data. Certainly, our own account did not have the benefit of any primary data (though Felin’s commentary, which did, suggests that the broad contours of what we described are accurate or at least consistent with what company spokespersons say).1 This also raises an interesting question as to how deep one would have to go into an organization’s workings before considering its structure as an interesting hypothesis about organizing (as opposed to representing evidence on its effectiveness).
In our research, we have found it useful to reproduce in the behavioral laboratory a purported model of organizing in order to understand its causal structure and the necessary and sufficient conditions that allow an organization to divide labor into self-organizing teams (Raveendran, Puranam, & Warglien, forthcoming) and to decentralize resource allocation (Kotha et al., 2015). However, there is no doubt that much can be learned from taking an in-depth, ethnographic perspective on organizations like Valve. Indeed the commentators, through their expressed optimism or pessimism about the replicability of Valve’s model,
1 For the record, we did approach the company to request participation/commentary. We have had a very valuable correction on facts, which we gratefully acknowledge, but not yet a commentary at the time of going to press.
Phanish Puranam • Dorthe Døjbak Håkonsson Closing thoughts & Open Questions
23
have given students of organization a set of interesting research questions, with several mechanisms to elucidate and propositions to test. We hope this exchange provokes further experimentation, modelling, and data collection to address a fundamental question in the science of organizations: how does authority work, and when is it necessary?
REFERENCESKotha R, Nai J, Narayanan J, Puranam P, Zhi J. 2015. Comparing decentralized and centralized
resource allocation decisions: Experimental evidence. Working Paper.Puranam P, Alexy O, Reitzig, M. 2014. What’s new about new forms of organization?
Academy of Management Review 39(2): 162-180.Raveendran M, Puranam P, Warglien M. Forthcoming. Object salience in the division of
labor: Experimental evidence. Management Sciencevan Vugt M. 2006. Evolutionary origins of leadership and followership. Personality and
Social Psychology Review 10(4): 354-371.
PHANISH PURANAM ProfessorINSEAD-SingaporeE-mail: [email protected]
DORTHE DØJBAK HÅKONSSONAssociate ProfessorAarhus UniversityE-mail: [email protected]

24 Journal of Organization DesignJOD, 4(2): 24-37 (2015)DOI: 10.7146/jod.16781© 2015 by Organizational Design Community
COMBINING THEORETICAL PERSPECTIVES ON THE ORGANIZATIONAL STRUCTURE-PERFORMANCE RELATIONSHIPSTARLING DAVID HUNTER III
Abstract: Much of the literature linking organization structure to performance falls into two broad research streams. One stream concerns formal structure – the hierarchy of authority or reporting relationships as well as the degree of standardization, formalization, specialization, etc. The impact of formal structure and other elements of organization design on performance is typically contingent on factors such as strategic orientation, task characteristics, and environmental conditions. The other research stream focuses on informal structure – a network of interpersonal and intra-organizational relationships. Properties of informal structure are typically shown to have a more direct (less contingent) impact on organizational performance. Despite these pronounced differences in the conceptualization of organization structure, considerable overlap and complementarity exist between the two research streams. In this article, I compare and contrast a pair of exemplars from each stream – the information processing perspective and the social network perspective – with respect to their conceptualizations of organization structure and its relationship to performance. Several recommendations for future research that combines the two approaches are offered.
Keywords: Organization structure, formal organization, informal organization, contingency theory, information processing, social networks
Over the last several decades, numerous studies have examined the relationship between organizational structure and performance. Those studies may be broadly divided into two research streams. In one stream, the conceptualization of structure is formal: it is a hierarchical pattern of authority relationships that varies along key and measurable structural dimensions such as centralization, formalization, vertical and horizontal differentiation, span of control, and specialization. A broad range of theories and perspectives adopt this conceptualization. They include, but are not limited to, contingency theory (Donaldson, 2001), information processing perspective (Burton & Obel, 1998; Galbraith, 1974), complementarity theory (Milgrom & Roberts, 1995), configuration theory (Doty, Glick, & Huber, 1993; Ketchen et al., 1997), resource-based view of the firm (Markides & Williamson, 1996), decision theory (Huber & McDaniel, 1986), and managerial and organizational cognition (Wood & Bandura, 1989).
Running concurrently to this stream of research is one that has linked informal structure within organizations to the effectiveness or performance of individuals (Cummings & Cross, 2003), groups and teams (Cross & Cummings, 2004; Hansen, 1999), and to larger organizational subunits (e.g., Shaw et al., 2005; Tichy, Tushman, & Fombrun, 1979). Unlike the formal structure research stream, with its emphasis on prescribed reporting relationships and their correlates, here structure is defined by informal networks of voluntary social interactions and relationships, including information sharing, advice seeking, interpersonal communication, and friendship ties (see Kilduff & Krackhardt, 2008, for a recent review).

Starling David Hunter III Combining Theoretical Perspectives on the Organizational Structure-Performance Relationship
25
Although research from both streams often appears in the same journals, there is nothing approaching consensus concerning the nature of the structure-performance relationship. Building such consensus might usefully begin with a discussion of the many similarities and complementarities between the two approaches. Toward that end, I focus my attention on two of the best-known and most representative exemplars of each stream: the information processing and the social network perspectives. The remainder of the article is organized as follows. The next section contains an overview of the information processing perspective on organization structure and design. It is followed by a similar summary of the social network perspective. Both of these sections contain descriptions of each perspective’s key assumptions, concepts, commonly used measures, and empirical research. The fourth section applies concepts and measures from each approach to a case study, including a comparison of the formal and informal structures of the same organization. The section after the case analysis identifies common themes across the two research streams and suggests directions for future research. The final section is the conclusion.
INFORMATION PROCESSING PERSPECTIVE Information acquisition, its processing and dissemination throughout the organization – these are central concerns of the information processing perspective on organization design (Daft & Lengel, 1986; Tushman & Nadler, 1978). As such, the key “design problem is to create an organizational design that matches the demand for information processing with the information processing capacity” (Burton & Obel, 1998: 7). According to Galbraith (1974), the principal determinant of this problem is task uncertainty: “the greater the uncertainty of the task, the greater the amount of information that has to be processed between decision-makers” (Galbraith, 1974: 10). Task uncertainty is itself a function of other factors including an organization’s technology, size, culture, and strategy as well as characteristics of its external environment (Burton, Lauridsen, & Obel, 2002).
Typical of this perspective’s definition of design are Burton & Obel’s (2004) six sets of parameters: (1) configuration, (2) complexity, (3) centralization, (4) coordination and control mechanisms, (5) formalization, and (6) incentives. According to those authors, configuration “specifies the general principle for dividing the work, breaking the tasks into subtasks and coordinating activities...(and) the overall units that are the basis for making decisions and communicating with each other” (p. 46). The most well known of the structural configurations that they describe are the functional, divisional, and matrix structures. Whereas configuration establishes the basis for the division of labor, complexity establishes the configuration’s “breadth, depth, and dispersion” (p. 73). These three dimensions are operationalized as (a) horizontal differentiation (the number of departments, units, or subunits in an organization), (b) vertical differentiation (the number of levels in the organizational hierarchy), and (c) spatial differentiation (“the geographical dispersion of the activities in the organization” (p. 77). The third of the six design parameters is centralization, which is “the degree to which formal authority to make decisions is concentrated in an individual, unit, or level” (p. 80). Its measure is the degree of “direct involvement” that top management has in “gathering and interpreting the information they use in decision-making” and the degree to which this group “directly controls the execution of a decision” (p. 80). A related concept is span of control, which refers to “the number of workers directly supervised by an administrator” (Bell, 1967: 100). The latter three elements of organization design, as defined by Burton & Obel (2004), are coordination and control mechanisms, formalization, and incentives. Broadly speaking, all three encompass a wide range of systems, processes, roles, practices, policies, and interventions, any of which may influence a design’s structural properties and/or information processing capacity.
Empirical Research in the Information Processing Perspective
Several empirical studies conducted within the information processing perspective have examined the relationship between the aforementioned formal structure variables and organizational performance. While a full review of that literature is beyond the scope of this article, two important trends are noteworthy. The first concerns variation in the unit

Starling David Hunter III Combining Theoretical Perspectives on the Organizational Structure-Performance Relationship
26
of analysis. Structure includes the design of departments and functions (e.g., Alexander & Randolph, 1985), business units and divisions (e.g., Olson, Slater, & Hult, 2005), and the organization as a whole (e.g., Nandakumar, Ghobadian, & O’Regan, 2010). The second trend concerns the nature of the relationship between the structural parameters and performance. In short, it is almost always contingent. That is, the effect of structure on performance is almost always a function of its alignment or fit with other important organizational factors. For example, consistent with Miles & Snow’s (1978) contingency model, Ramaswamy, Flynn, and Nilakanta (1993) reported that only certain combinations of “product-market strategy” and decentralization of decision-making were positively related to performance (measured by sales growth and return on assets).
Similarly, other research studies have found a wide variety of contingent relationships: the relationship between decentralization and financial performance moderated by “performance aspirations” (Richardson et al., 2002); decentralization and the performance of manufacturing plants mediated by the presence of “time-based manufacturing practices” (Nahm, Vonderembse, & Koufteros, 2003); formalization and financial performance mediated by “supply chain process variability” and moderated by “environmental uncertainty” (Germain, Claycomb, & Droge, 2008); organizational structure (mechanistic or organic) and firm performance moderated by “business-level strategy” (cost-leadership or differentiation) (Nandakumar, Ghobadian, & O’Regan, 2010); decentralization and firm performance moderated by the “explicitness of strategy articulation” (Love, Priem, & Lumpkin, 2002); decentralization and financial performance moderated by “organizational functioning” (the presence and/or prevalence of integrating mechanisms, worker empowerment, training, and cross-functional design teams) (Andersen & Jonsson, 2006); organizational structure (decentralized or bureaucratic) and the effectiveness and timeliness of the product development process moderated by “product innovativeness” (Olson, Walker, & Ruekert, 1995); multi-divisional structure and rate of return moderated by the firm’s “diversification strategy” (vertical integration, related diversification, or unrelated diversification) (Hoskisson, 1987); configuration (divisional or functional structure) and financial performance moderated by the level of “decentralization” (Hill & Pickering, 1986); structure (vertical participation, horizontal participation, and formalization) and unit-level performance moderated by “technology” (uncertainty, stability, and variability) (Alexander & Rudolph, 1985); span of control and performance moderated by “task difficulty” (Bohte & Meier, 2001); and both formalization/specialization and organizational performance moderated by “dynamism” of the firm’s economic environment (Sine, Mitsuhashi, & Kirsch, 2006).
In addition, examples of multi-variable contingency relationships include (a) Olson, Slater, & Hult (2005) who found overall firm performance to be a function of the degree of fit among the structure of the marketing function, the function’s strategic emphases, and the overall business strategy; (b) Khandwalla (1973) who found that firm profitability was a function of the positive association between eight organizational variables including vertical integration, decentralization, and the type of organizational configuration (divisional vs. functional); and (c) Jennings & Seaman (1994: 459) who found that the relationship between strategy (prospector, defender, analyzer), organizational structure (organic or mechanistic), and performance to be moderated by the degree of firm “adaptation…a period of gradual, long-continued, and incremental change in response to environmental conditions.”
Now we turn to the social network perspective on organization design – one with initially different but ultimately complementary assumptions, methods, and measures.
SOCIAL NETWORK PERSPECTIVEThe social network perspective on organization design takes as its starting point the fact that human beings are “social creatures” embedded in “networks of relations” with others that are instrumental to the accomplishment of “many of life’s tasks”, both within and outside of formal organizational settings (Kilduff & Krackhardt, 2008: 1). According to this view, it is both the “formal relations of authority” and the “informal links…across departmental and hierarchical boundaries” that holds business organizations together and enables them to accomplish their goals. Numerous structural parameters first developed in the broader

Starling David Hunter III Combining Theoretical Perspectives on the Organizational Structure-Performance Relationship
27
literature on social network analysis have been applied to the network analytic approach to organization design. Among the most relevant concepts for our purposes are centrality, connectivity, similarity, and hierarchy.
Centrality measures indicate the relative importance or influence of nodes or actors within a network (Bonacich, 1987; Borgatti, 2005). Two of the most commonly employed measures of centrality are degree centrality and between-ness centrality. The former is simply a count of the number of links or connections that one node has to others in the network. For example, a node A with links to three others named B, C, and D would have a degree centrality equal to three. Between-ness centrality is a measure of the frequency with which a node lies on the shortest paths connecting all nodes in a network to all other nodes. The greater the number of these paths upon which a node lies, the greater is its between-ness centrality.
Measures of connectivity indicate the extent to which nodes or actors in a network are directly connected to one another. One basic and commonly employed measure is density, which is the ratio of the number of connections between pairs of nodes to the number of possible connections (Wasserman & Faust, 1994). In a network of five nodes, where connections are not directed, there are ten possible pairs of nodes. If only five pairs of those nodes are connected, then the density of the network is 50 percent. A second measure of connectivity is a network’s diameter, which is the longest of the shortest paths between any pair of nodes in the graph (Knoke & Yang, 2008).
As for measures of equivalence, two nodes in a network are considered structurally equivalent if they are connected in the same ways to one or more other nodes in the network (Sailer, 1978). A less restrictive form of similarity is “regular” equivalence which requires only that two nodes are analogously related to equivalent others (Wasserman & Faust, 1994). For example, all branch managers in a banking organization relate to their subordinate shift managers in the same way although none of them supervise the same shift managers.
The measures of hierarchy consist of four mutually exclusive and sufficient graph theoretical dimensions (GTD) of hierarchical structures with proposed calculations for each (Krackhardt, 1994). In short, the four measures capture the degree to which a given structure differs from the ideal or “pure hierarchical structure” or “out-tree” (p. 93). The first of the four measures is connected-ness: the greater the proportion of actors that are connected in the same component, the more hierarchical is the structure. The second dimension is reciprocity. Reciprocity implies equality, something that is not inherent in hierarchy. As such, the greater the number of ties that are reciprocated, the less hierarchical is the structure. The third dimension, efficiency, concerns the number of in-bound links per node when authority relationships are directed from superior to subordinate or the number of out-bound links when the direction is reversed. To the degree that each node – except that of the ultimate boss – has more than one such link, the less hierarchical is the structure. The final measure of hierarchy is the unity of command. In short, every pair of employees in a hierarchical network has one node in common that directs ties to both of them. Put another way, they have one node in common in their respective chains of command. In the case of a formal organization structure, any third person higher in the hierarchy to whom they both defer is their “upper bound” (p. 99). There can be several such upper bounds for any pair of employees. In a formal organization chart, the least upper bound of a given pair of employees is “the closest boss who has formal authority over both of them.” The greater the number of pairs of nodes that do not have a least upper bound, the less hierarchical is the structure.
Empirical Research in the Social Network Perspective
In the last few decades, several studies have examined the effects of the afore-mentioned measures of social (informal) structure in organizations on a variety of measures of organizational performance. Typical examples of empirical research at the group, team, and business-unit levels include analyses of the effects of (a) centrality and density in an inter-personal communication network on business-unit sales (Shaw et al., 2005); (b) centrality of leaders in a friendship network on group performance (Mehra et al., 2006), (c) density in a knowledge-sharing network on team performance (Reagans, Zuckerman, & McEvily, 2004); (d) hierarchy in an interpersonal communication network on work group performance
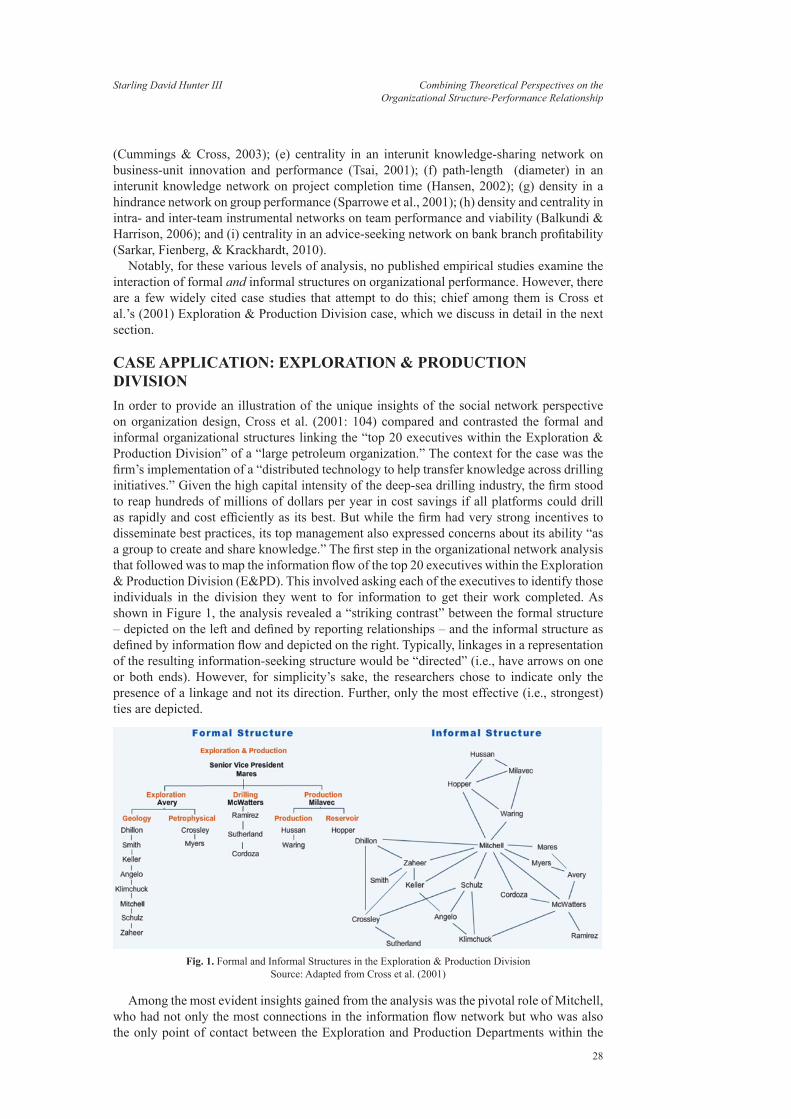
Starling David Hunter III Combining Theoretical Perspectives on the Organizational Structure-Performance Relationship
28
(Cummings & Cross, 2003); (e) centrality in an interunit knowledge-sharing network on business-unit innovation and performance (Tsai, 2001); (f) path-length (diameter) in an interunit knowledge network on project completion time (Hansen, 2002); (g) density in a hindrance network on group performance (Sparrowe et al., 2001); (h) density and centrality in intra- and inter-team instrumental networks on team performance and viability (Balkundi & Harrison, 2006); and (i) centrality in an advice-seeking network on bank branch profitability (Sarkar, Fienberg, & Krackhardt, 2010).
Notably, for these various levels of analysis, no published empirical studies examine the interaction of formal and informal structures on organizational performance. However, there are a few widely cited case studies that attempt to do this; chief among them is Cross et al.’s (2001) Exploration & Production Division case, which we discuss in detail in the next section.
CASE APPLICATION: EXPLORATION & PRODUCTION DIVISIONIn order to provide an illustration of the unique insights of the social network perspective on organization design, Cross et al. (2001: 104) compared and contrasted the formal and informal organizational structures linking the “top 20 executives within the Exploration & Production Division” of a “large petroleum organization.” The context for the case was the firm’s implementation of a “distributed technology to help transfer knowledge across drilling initiatives.” Given the high capital intensity of the deep-sea drilling industry, the firm stood to reap hundreds of millions of dollars per year in cost savings if all platforms could drill as rapidly and cost efficiently as its best. But while the firm had very strong incentives to disseminate best practices, its top management also expressed concerns about its ability “as a group to create and share knowledge.” The first step in the organizational network analysis that followed was to map the information flow of the top 20 executives within the Exploration & Production Division (E&PD). This involved asking each of the executives to identify those individuals in the division they went to for information to get their work completed. As shown in Figure 1, the analysis revealed a “striking contrast” between the formal structure – depicted on the left and defined by reporting relationships – and the informal structure as defined by information flow and depicted on the right. Typically, linkages in a representation of the resulting information-seeking structure would be “directed” (i.e., have arrows on one or both ends). However, for simplicity’s sake, the researchers chose to indicate only the presence of a linkage and not its direction. Further, only the most effective (i.e., strongest) ties are depicted.
Fig. 1. Formal and Informal Structures in the Exploration & Production Division Source: Adapted from Cross et al. (2001)
Among the most evident insights gained from the analysis was the pivotal role of Mitchell, who had not only the most connections in the information flow network but who was also the only point of contact between the Exploration and Production Departments within the

Starling David Hunter III Combining Theoretical Perspectives on the Organizational Structure-Performance Relationship
29
E&PD, and one of two connecting links between the Exploration Department and the Drilling Department. A discussion with the executive team revealed that Mitchell had become so central partly because of his reputation for “expertise and responsiveness.” The result was that both the number of information requests he received and the number of projects in which he found himself involved had become excessive. Eventually, he became a bottleneck in the information flow, slowing down the entire E&PD and increasing his own stress levels. Not surprisingly, one of the first proposed interventions was to reallocate to other E&PD members some of the information requests coming to Mitchell.
A second insight of the analysis was that Mares, the Senior Vice President, was more peripheral to the information flow network than expected. It is not uncommon for executives, over time, to become less accessible to their subordinates and less knowledgeable about their activities. However, Mares further contributed to his peripheral position through his lack of responsiveness.
A third insight from the case analysis was the complete separation of the Production Department (Milavec, Hopper, Hussan, and Waring) from the Drilling Department (McWatters, Sutherland, Cordoza, and Ramierz) and the existence of only a single link to the Exploration Department – via Mitchell. Interviews with E&PD executives revealed that several months before the analysis took place, the Production Department had been moved to a different floor in the same building. The network analysis revealed that the physical separation had resulted in fewer “serendipitous meetings” than when all three departments were co-located on the same floor.
Below, the dozen-plus measures common to the information processing and social network perspectives are applied to the E&PD case in order to better understand their shared and unique insights.
Centrality
First among the social network measures considered above was degree centrality, the number of links associated with a given node in a network. In the above depiction of the informal structure, degree centrality ranges from a high of ten (Mitchell) to a low of one (Ramirez, Sutherland, and Smith). The remaining members of the organization have between two and five links to other actors, with the average being 3.2 links. When the formal structure is instead represented as a network of directed reporting relationships, as depicted in Figure 2, Mares is seen to have three inbound links while Avery, McWatters, and Milavec have ten, three, and three links, respectively. They each have one outbound link to their superior, Mares. Their sixteen subordinates all have a degree centrality of one because they each report only to their own boss. Thus, we can see here that span of control (the number of direct reports a manager has) is analogous to, or perhaps is a special case of, degree centrality (the number of inbound and/or outbound links to a given node). In the information processing perspective, span of control is used to quantify the number of direct reports a given manager has. As shown in the formal structure above, Mares is the head of E&PD and has three direct reports – Avery, McWatters, and Milavec – and thus a span of control of three. In sum, these three direct reports have a span of control of ten, three, and three, respectively.

Starling David Hunter III Combining Theoretical Perspectives on the Organizational Structure-Performance Relationship
30
Fig. 2. Formal Structure of the Exploration & Production Division Represented as a Network of Directed Reporting Relationships.
Source: Adapted from Cross (2008) and Cross et al. (2001)
The second centrality measure was between-ness centrality, a quantity based on the number of times a node is found on the shortest paths connecting all other nodes. In the informal structure, Mitchell has the highest between-ness centrality (112.2), followed by McWatters (31.3), Zaheer (27.7), Hopper (24.5), and Schulz (21.3). The six members with the lowest between-ness centrality are Milavec (0.50), followed by Sutherland, Smith, Hussan, Cordoza, and Ramirez, all of whom had between-ness scores of zero. In the formal structure, again represented as a network of reporting relationships, only the three department heads – Avery, McWatters, and Milavec – have non-zero between-ness scores. Avery has the highest score (10.0) among them because he lies on the path between all ten of his subordinates and the rest of the organization. Because they have the same number of subordinates, McWatters and Milavec have equal between-ness centrality scores of three. It should be noted that since the formal structure is comprised of directed linkages, all paths end with Mares, the most senior member of the organization. However, if the relationship is bi-directional – reflecting the fact that information flows both ways between superiors and subordinates – then all nodes can be reached by all other nodes, and Mares’ between-ness centrality becomes second only to that of Avery. Notably, in this example, the between-ness centrality of an actor is partially a function of position in the formal structure – all paths lead to Mares who is at the top of the formal hierarchy – but, more importantly, a function of position in the informal structure – Avery is lower in the hierarchy but is found on a greater number of paths because he has more direct reports.
Cohesion
The first of the measures of cohesion is density, which is calculated as the number of links divided by the number of possible links. Recall that the reporting relationship is not reciprocal – reporting relationships only go in one direction. As such, in the formal structure of the E&PD, density is equal to (n-1)/(n*(n-1)) = 19/(20*19) = 1/20. This quantity is significant because n-1 is the minimum number of links required to connect n nodes. Although at least two other of the network perspective’s archetypal configurations can do this – the line and the star – the former is impractical among organizations of the size typically studied by analysts and scholars while the latter is typically not observed in groups of more than ten members. Thus, in practice, the reporting relationship – at least in its ideal form – is the only one that includes all members in such a sparsely connected (i.e., low-density) network. By contrast, the density of the non-directed informal structure is 16.8 percent, which is over three times that of the formal structure.
The second measure of cohesion is diameter – the maximum shortest path distance between any pair of nodes in the graph. In the informal structure, the diameter is five and there are

Starling David Hunter III Combining Theoretical Perspectives on the Organizational Structure-Performance Relationship
31
four pairs of nodes at this distance from one another – Avery and Sutherland, Milavec and Sutherland, Ramirez and Sutherland, and Hussan and Sutherland. In the formal structure with directed reporting relationships, the diameter is only two. That quantity is equal to one less than the value of the structure’s vertical differentiation which, as mentioned previously, is a measure of the number of hierarchical levels.
Equivalence
The two measures of structural similarity are regular and structural equivalence. Two or more nodes are said to be structurally equivalent if they have the exact same connections to other nodes. In the formal structure above, the subordinates of each department head have the same pattern of connections – they each have one tie to their common superior. Specifically, the ten subordinates of Avery are structural equivalents; the three subordinates of McWatters are structural equivalents; and the three subordinates of Milavec are structural equivalents. The three department heads themselves are not structurally equivalent, however, because while they do have a common tie to their mutual superior – Senior Vice President Mares – they do not have identical ties to others. Instead, these three are regular equivalents; they have analogous patterns of links to equivalent others. In management parlance, regular equivalents are known as “opposite numbers” because they hold analogous but not identical positions within the structure. Thus, all of the subordinates of the three department heads are regular equivalents because they all occupy similar positions in the structure, just not identical connections.
In general, incidences of regular and structural equivalence are much less frequent and difficult to identify in informal structures. An examination of the informal structure panel of Figure 1 indicates that there is only one pair of structural or regular equivalents – Myers and Mares who are both connected only to Mitchell and Avery. According to UCINet (Borgatti, Everett, & Freeman, 2002), a popular network analysis software program, the three other groups are nearly, but not exactly, structural equivalents in the informal structure – Ramirez and Cordoza (Drilling), Milavec and Hussan (Production), and Waring and Hopper (Production). Notably, even though this is an informal structure, the members of each pair of near-equivalents belong to the same department in the formal structure. There are also three groups that are close to being regular equivalents: McWatters (Drilling) and Hopper (Production); Avery (Exploration), Dillon (Exploration), and Ramirez (Drilling); and Schulz and Zaheer (Exploration). Here, only the latter group has all members in the same department in the formal structure.
As shown in Table 1, all 32 ties in the informal network are classified according to their role in the formal structure (Column 1) and the specific parties to each pair, by department (Column 2). As the tabulation indicates, just over half of the links (17 of 32) are among structural equivalents in the formal structure (i.e., between subordinates of the same superiors). Another seven links are between superiors and their subordinates. Thus, three-quarters of the links in this example are between bosses and their subordinates or among the subordinates themselves. Another five links are between regular equivalents (i.e., between people occupying the same position in the hierarchy but in different departments and thus with different superiors). Lastly, there are just three links that cut across either a hierarchical and/or departmental boundary. This suggests that, on the whole, formal relationships – or, more specifically, the equivalences defined by the reporting relationship – may be strong predictors of informal ones. Notably, it is these last eight links that Cross and Cummings (2004) found to be positively related to individual-level performance. Specifically, they found a significant and positive relationship between the number of ties an individual has to other departments and the individual’s performance. They also hypothesized a similar relationship between individual performance and ties that span hierarchical levels but found only partial support.

Starling David Hunter III Combining Theoretical Perspectives on the Organizational Structure-Performance Relationship
32
Table 1. Classification of Links in the Informal Network of the Exploration & Production Division
Roles in the Formal Structure
Specific Parties to the Links Count
Structural equivalents in the formal structure (subordinates of the same superiors)
Production Department (headed by Milavec):• Hopper & Waring; Hopper & HussanExploration Department (headed by Avery):• Mitchell & Dillon; Mitchell & Zaheer; Mitchell & Schulz;
Mitchell & Myers; Mitchell & Keller; Dillon & Crossley; Dillon & Zaheer; Smith & Zaheer; Keller & Angelo; Angelo & Schulz; Angelo & Klimchuck; Klimchuck & Schulz; Crossley & Schulz; Zaheer & Keller; Zaheer & Crossley
17
Superior and subordinates Production Department (headed by Milavec):• Milavec & Waring; Milavec & Hopper; Milavec & HussanDrilling Department (headed by McWatters):• McWatters & Ramirez; McWatters & CordozaExploration Department (headed by Avery):• Avery & MyersSenior VP Mares to Exploration Department:• Mares & Avery
7
Regular equivalents in the formal structure (members of different departments but the same hierarchical level)
Exploration Department to Drilling Department:• Crossley & Sutherland; Mitchell & Cordoza; Avery &
McWattersExploration Department to Production Department:• Mitchell & Hopper; Mitchell & Waring
5
Non-equivalents separated by hierarchical and/or departmental boundary
Exploration Department to Drilling Department:• Mitchell & McWatters; Klimchuck & McWattersWithin the Exploration Department:• Mares & Mitchell
3
Hierarchy
In this case example, the formal structure of the E&PD meets all of the conditions of a “pure hierarchical structure,” as we would expect. As such, the score of each of Krackhardt’s (1994) four graph theoretical dimensions is equal to 1.0, the highest possible score. As for the informal structure, its connected-ness score is also 1.0 because all of the employees are reachable by all others in the network, though by paths of varying lengths. The reciprocity or hierarchy score is zero, the lowest possible score, because all of the connections were assumed to be bi-directional. If the ties had been directed in this network, then the reciprocity score would have been higher. The efficiency score is less than one (0.924), indicating that the average number of outbound links exceeds what would be expected for the corresponding formal structure. Lastly, the least upper bounded-ness (LUB) score is 1.0, indicating that for every pair of nodes there is one that directs ties to both of them. When each of the 32 ties was randomly assigned a direction, the connected-ness and efficiency scores of the informal structure remained unchanged. The hierarchy score rose 0.01 to 0.934, and the LUB score dropped slightly from one to 0.983. More important than the specific scores, however, is the fact that the four GTD scores establish a quantitative basis upon which the informal structure may be compared to the formal one.
DISCUSSION AND RESEARCH RECOMMENDATIONS The most notable aspect of the preceding analysis is the near-complete bifurcation in the relationships studied in the two perspectives on organization design. For decades, the information processing perspective has focused primarily upon aspects of the formal organization structure – namely, the pattern of reporting relationships plus configuration, centralization, specialization, and formalization, as well as the integrating mechanisms that help to match information processing capacity with demand. The social network perspective, in marked contrast, has focused on what seems like every meaningful interpersonal and intra-organizational relationship except reporting and authority: friendship, knowledge sharing, communication, information seeking, hindrance, socializing, and so on. This is a curious omission and almost certainly not accidental. But accident or no, what’s important is that,

Starling David Hunter III Combining Theoretical Perspectives on the Organizational Structure-Performance Relationship
33
at present, we have no empirical study that has modeled both formal and informal structure as a network and linked them to performance at the group/team or business-unit level. The remainder of this section discusses how and why a multiplex or mixed relationship approach may afford fruitful new avenues of investigation for both perspectives.
Benefits of the Information Processing Perspective
The principal benefits of the information processing perspective begin with the inclusion of network analytical terminology and methods into its own conceptual vocabulary. Specifically, this would entail broadening the set of terms used to define organization design itself, design fit and misfit therein, and design strategies. Concerning organization structure, to the well-known and thoroughly studied terms like centralization, differentiation, formalization, etc. can be added several others from the network approach, some of which are similar in whole or part, some of which are complementary, and some of which have no obvious analog. For example, recall that when the formal structure is represented as a network, as in Figure 2, vertical differentiation – measured as the number of levels in the hierarchy – is equal to one plus half of the network diameter. Further, recall that the term span of control is a special case of degree centrality and thus is applicable to relationships other than reporting and authority. At a more conceptual level, recall that the departmentalization and division of labor that characterizes formal structure results in a set of relationships between them that the network approach refers to broadly as equivalence. Lastly, perhaps the most immediately useful and applicable concept from the network perspective may be Krackhardt’s (1994) four graph theoretical dimensions (GTD) of hierarchical structure, which allow any number of organizational structures to be quantified and compared to an ideal standard.
The inclusion of network concepts and methods may also have benefits for the information processing perspective’s understanding of design misfits (i.e., the mismatch between the actual design and the one that is prescribed by its many determinants) (Burton & Obel, 2004). For example, in a sample of 252 Danish firms, Burton, Lauridsen, & Obel (2002) found the existence, though not the number, of a broad range of contingency and situational misfits to be associated with lower return on assets. In a similarly constructed sample, Håkonsson et al. (2012) examined the performance consequences of a specific subset of misfits – those between organizational climate and leadership style – and found them to be associated with lower ROA than corresponding fits. Also in this study, the scale used for leadership style contained no items related to the leader’s informal or interpersonal relationships with subordinates, let alone their pattern or structure. The network literature, however, has considered this question. Cummings and Cross (2003), for example, found that the existence of “structural holes” (Burt, 1992) in the leader’s communication network to be associated with lower group performance. Future research on leadership style-related design misfits could consider whether the structure of the informal networks surrounding the leader speaks to the matter of style, and if so, what effects this has on organizational performance.
The matter of design strategies can also be favorably influenced by an embrace of the network perspective. Recall that while the information processing perspective has a well-developed and theoretically grounded typology of design strategies and integrating mechanisms, it lacks methods to display them in the context of organizational charts (Daft, Murphy, & Willmott, 2010). Were these interventions to be viewed from a network perspective, a potential solution might be forthcoming. Only a few assumptions or recognitions would need to be made. The first would be to conceptualize structure as comprised, firstly, of individuals linked by multiple relationships – reporting, friendship, information seeking, etc. – rather than as individuals in departments or groups linked only by the reporting relationships of their heads (Pearce & David, 1983; Tichy & Fombrun, 1979). The second is to recognize the reporting relationship as one channel, though not the only one, through which information may be exchanged between the individuals that comprise the organization. By extension, the integrating mechanisms and design strategies like direct contact, liaison roles, cross-functional teams, integrating roles, etc. represent information channels not just across hierarchical and departmental boundaries but also between individuals located at different levels and in different departments. Furthermore, as shown earlier, any number of affective
Starling David Hunter III Combining Theoretical Perspectives on the Organizational Structure-Performance Relationship
34
and instrumental ties can also be mapped onto formal structure and be studied as conduits for the flow of information or other resources across vertical and horizontal boundaries.
Finally, recall that the motivation behind most network-centric design strategies is to decrease the path distance that information must travel between individuals in a network. This has obvious analogies to downsizing and delayering in organizational restructuring. But it also has implications for the information processing perspective’s motivation, which is to match information processing capacity to demand. This is accomplished by either reducing the demand for information processing or by increasing the organization’s capacity to process information. In short, reducing path distance in an information-seeking network, for example, would seem to be an instance of reducing demand. Future research might undertake a more detailed and systematic comparison of the design strategies and integrating mechanisms of both approaches with the aim of unifying them into a single typology.
Benefits of the Social Network Perspective
The use of a mixed-network approach may also have positive implications for research on informal networks in organizational settings, particularly those investigating the effect of information-intensive linkages like knowledge sharing, advice seeking, and information-exchange relationships on performance. Apparently without exception those studies have not considered the information-processing role and capacity of the formal reporting relationship. And as the E&PD case analysis indicated, overlap can exist among reporting or formal and informal ties in intra-organizational networks. At a minimum, therefore, the inclusion of formal reporting relationships in an otherwise informal network results in a greater number of ties. A greater number of ties with the number of nodes held constant spells higher density and average degree centrality, as well as changes in connected-ness, between-ness centrality, diameter, constraint, etc. Whether these changes are trivial or significant depends on the specifics of both the network under study and the nature of the research questions concerning it. More importantly, however, are the potential implications for information processing and exchange in the organization, both of which are antecedents of performance. For example, Sitar (2012) studied the reporting relationship in relation to one informal network (information seeking and sharing). In her study of 109 employees in 12 units of a Slovenian manufacturing firm with a mechanistic organization structure, she found that an actor’s immediate supervisor was also the most likely person to provide the employee with advice, help on the job, new knowledge, and to collaborate with the employee on the solution of problems. Similarly, Soda and Zaheer (2012: 760) found “consistency” between informal structure (advice seeking) and “formalized and documented procedures and workflows” to be positively related to measures of individual performance. Future research in organization design from both perspectives should focus on the joint effect of formal and informal structures on performance, particularly at the divisional or business-unit level, which is under-studied relative to individual and group/team-level performance.
CONCLUSIONThe purpose of this article was two-fold. The first objective was to show that the information processing and the social network perspectives on organization design have many points of similarity, particularly with respect to their respective conceptual vocabularies. The second objective was to show that these similiarties might also prove complementary, at least as it concerns research on the structure performance relationship. How that might be accomplished was partially demonstrated through the application of several of the similar concepts to a well-known and widely cited case study (Cross et al., 2001). Most importantly, it was shown that when informal linkages are included, the path distances over which information flows through the organization are reduced relative to the distance as measured by the formal structure alone. Perhaps the best demonstration of any complementary between formal and informal structure would be evidenced by empirical research that directly tests for a relationship between these path-distance reducing effects of informal linkages and organizational performance.

Starling David Hunter III Combining Theoretical Perspectives on the Organizational Structure-Performance Relationship
35
REFERENCESAlexander JW, Randolph WA. 1985. The fit between technology and structure as a predictor
of performance in nursing subunits. Academy of Management Journal 28(4): 844-859.Andersen JA, Jonsson P. 2006. Does organization structure matter? On the relationship
between structure, functioning and effectiveness. International Journal of Innovation and Technology Management 3(2): 237-263.
Balkundi P, Harrison DA. 2006. Ties, leaders and time in teams: Strong inference about network structure’s effects on team viability and performance. Academy of Management Journal 49(1): 49-68.
Bell GD. 1967. Determinants of span of control. American Journal of Sociology 73(1): 100-109.
Bohte J, Meier KJ. 2001. Structure and the performance of public organizations: Task difficulty and span of control. Public Organization Review 1(3): 341-354.
Bonacich P. 1987. Power and centrality: A family of measures. American Journal of Sociology 92(5): 1170-1182.
Borgatti SP. 2005. Centrality and network flow. Social Networks 27(1): 55-71.Borgatti SP, Everett MG, Freeman LC. 2002. UCINET 6.0 for Windows: Software for Social
Network Analysis.Burt RS. 1992. Structural Holes: The Social Structure of Competition. Harvard University
Press, Cambridge, MA.Burton RM, Lauridsen J, Obel B. 2002. Return on assets loss from situational and contingency
misfits. Management Science 48(11): 1461-1485.Burton RM, Obel B. 1998. Strategic Organizational Diagnosis and Design: Developing
Theory for Application. Kluwer Academic Publishers, Boston, MA.Burton RM, Obel B. 2004. Strategic Organizational Diagnosis and Design: The Dynamics
of Fit. 3rd edition. Kluwer Academic Publishers, Boston, MA.Cross R, Cummings JN. 2004. Tie and network correlates of individual performance in
knowledge-intensive work. Academy of Management Journal 47(6): 928-937.Cross R, Parker A, Prusak L, Borgatti SP. 2001. Knowing what we know: Supporting
knowledge creation and sharing in social networks. Organizational Dynamics 30(2): 100-120.
Cummings JN, Cross R. 2003. Structural properties of work groups and their consequences for performance. Social Networks 25(3): 197-210.
Daft RL, Lengel RH. 1986. Organizational information requirements, media richness and structural design. Management Science 32(5): 554-571.
Daft RL, Murphy J, Willmott H. 2010. Organization Theory and Design. Cengage Learning, Boston, MA.
Donaldson L. 2001. The Contingency Theory of Organizations. Sage, Thousand Oaks, CA.Doty DH, Glick WH, Huber GP. 1993. Fit, equifinality, and organizational effectiveness: A
test of two configurational theories. Academy of Management Journal 36(6): 1196-1250.Galbraith JR. 1974. Organization design: An information processing view. Interfaces 4(3):
28-36.Germain R, Claycomb C, Dröge C. 2008. Supply chain variability, organizational structure,
and performance: The moderating effect of demand unpredictability. Journal of Operations Management 26(5): 557-570.
Granovetter M. 1973. The strength of weak ties. American Journal of Sociology 78(6): 1360-1380.
Håkonsson DD, Burton RM, Obel B, Lauridsen JT. 2012. Strategy implementation requires the right executive style: Evidence from Danish SMEs. Long Range Planning 45(2): 182-208.
Hansen MT. 1999. The search-transfer problem: The role of weak ties in sharing knowledge across organization subunits. Administrative Science Quarterly 44(1): 82-111.
Hansen MT. 2002. Knowledge networks: Explaining effective knowledge sharing in multiunit companies. Organization Science 13(3): 232-248.
Hill CWL, Pickering JF. 1986. Divisionalization, decentralization and performance of large
Starling David Hunter III Combining Theoretical Perspectives on the Organizational Structure-Performance Relationship
36
United Kingdom companies. Journal of Management Studies 23(1): 26-50.Hoskisson RE. 1987. Multidivisional structure and performance: The contingency of
diversification strategy. Academy of Management Journal 30(4): 625-644.Huber GP, McDaniel RR. 1986. The decision-making paradigm of organizational design.
Management Science 32(5): 572-589.Jennings DF, Seaman SL. 1994. High and low levels of organizational adaptation: An
empirical analysis of strategy, structure, and performance. Strategic Management Journal 15(6): 459-475.
Ketchen DJ, Combs JG, Russell CJ, Shook C, Dean MA, Runge J, Lamoureux S. 1997. Organizational configurations and performance: A meta-analysis. Academy of Management Journal 40(1): 223-240.
Khandwalla PN. 1973. Viable and effective organizational designs of firms. Academy of Management Journal 16(3): 481-495.
Kilduff M, Krackhardt D. 2008. Interpersonal Networks in Organizations: Cognition, Personality, Dynamics, and Culture. Cambridge University Press, Cambridge, UK.
Knoke D, Yang S. 2008. Social Network Analysis (Vol. 154). Sage, Thousand Oaks, CA.Krackhardt D. 1994. Graph theoretical dimensions of informal organizations. Computational
Organization Theory 89(112): 123-140.Love LG, Priem RL, Lumpkin GT. 2002. Explicitly articulated strategy and firm performance
under alternative levels of centralization. Journal of Management 28(5): 611-627.Markides CC, Williamson PJ. 1996. Corporate diversification and organizational structure: A
resource-based view. Academy of Management Journal 39(2): 340-367.Mehra A, Dixon AL, Brass DJ, Robertson B. 2006. The social network ties of group leaders:
Implications for group performance and leader reputation. Organization Science 17(1): 64-79.
Miles RE, Snow CC. 1978. Organizational Strategy, Structure, and Process. McGraw-Hill, New York, NY.
Milgrom P, Roberts J. 1995. Complementarities and fit strategy, structure, and organizational change in manufacturing. Journal of Accounting and Economics 19(2): 179-208.
Nahm AY, Vonderembse MA, Koufteros XA. 2003. The impact of organizational structure on time-based manufacturing and plant performance. Journal of Operations Management 21(3): 281-306.
Nandakumar MK, Ghobadian A, O’Regan N. 2010. Business-level strategy and performance: The moderating effects of environment and structure. Management Decision 48(6): 907-939.
Olson EM, Slater SF, Hult GTM. 2005. The performance implications of fit among business strategy, marketing organization structure, and strategic behavior. Journal of Marketing 69(3): 49-65.
Olson EM, Walker OC, Ruekert RW. 1995. Organizing for effective new product development: The moderating role of product innovativeness. Journal of Marketing 59: 48-62.
Pearce JA, David FR. 1983. A social network approach to organizational design-performance. Academy of Management Review 8(3): 436-444.
Ramaswamy SN, Flynn EJ, Nilakanta S. 1993. Performance implications of congruence between product-market strategy and marketing structure: An exploratory investigation. Journal of Strategic Marketing 1(2): 71-92.
Reagans R, Zuckerman E, McEvily B. 2004. How to make the team: Social networks vs. demography as criteria for designing effective teams. Administrative Science Quarterly 49(1): 101-133.
Richardson HA, Vandenberg RJ, Blum TC, Roman PM. 2002. Does decentralization make a difference for the organization? An examination of the boundary conditions circumbscribing decentralized decision-making and organizational financial performance. Journal of Management 28(2): 217-244.
Sailer LD. 1978. Structural equivalence: Meaning and definition, computation and application. Social Networks 1(1): 73-90.
Sarkar A, Feinberg SE, Krackhardt D. 2010. Predicting profitability using advice branch bank networks. Statistical Methodology 7(3): 429-444.
Starling David Hunter III Combining Theoretical Perspectives on the Organizational Structure-Performance Relationship
37
Shaw JD, Duffy MK, Johnson JL, Lockhart DE. 2005. Turnover, social capital losses, and performance. Academy of Management Journal 48(4): 594-606.
Sine WD, Mitsuhashi H, Kirsch DA. 2006. Revisiting Burns and Stalker: Formal structure and new venture performance in emerging economic sectors. Academy of Management Journal 49(1): 121-132.
Sitar A. 2012. Influence of organization on connected learning of individuals in organizations. Doctoral Dissertation. University of Ljubljana, Faculty of Economics. Ljubljana, Slovenia. 284 pages.
Soda G, Zaheer A. 2012. A network perspective on organizational architecture: Performance effects of the interplay of formal and informal organization. Strategic Management Journal 33(6): 751-771.
Sparrowe RT, Liden RC, Wayne SJ, Kraimer ML. 2001. Social networks and the performance of individuals and groups. Academy of Management Journal 44(2): 316-325.
Tichy NM, Fombrun C. 1979. Network analysis in organizational settings. Human Relations 32(11): 923-965.
Tichy NM, Tushman ML, Fombrun C. 1979. Social network analysis for organizations. Academy of Management Review 4(4): 507-519.
Tsai W. 2001. Knowledge transfer in intraorganizational networks: Effects of network position and absorptive capacity on business unit innovation and performance. Academy of Management Journal 44(5): 996-1004.
Tushman ML, Nadler DA. 1978. Information processing as an integrating concept in organizational design. Academy of Management Review 3(3): 613-624.
Wasserman S, Faust K. 1994. Social Network Analysis: Methods and Applications (Vol. 8). Cambridge University Press, Cambridge, UK.
Wood R, Bandura A. 1989. Social cognitive theory of organizational management. Academy of Management Review 14(3): 361-384.
STARLING DAVID HUNTER IIIProfessorCarnegie Mellon University in QatarE-mail: [email protected]
38 Journal of Organization DesignJOD, 4(2): 38-47 (2015)DOI: 10.7146/jod.18122© 2015 by Organizational Design Community
ACTIVATING GLOBAL OPERATING MODELSTHE BRIDGE FROM ORGANIZATION DESIGN TO PERFORMANCE AMY KATES • GREGORY KESLER
Abstract: This article introduces the concept of activation and discusses its use in the implementation of global operating models by large multinational companies. We argue that five particular activators help set in motion the complex strategies and organizations required by global operating models.
Keywords: Matrix organization, global operating model, organization design, activating global operating models
Companies that compete globally must have sophisticated strategies and plans for sustaining competitive advantage in the face of new challenges, ongoing technological change, and uncertain economic and regulatory environments. Large multinational companies must balance the need for both global and local perspectives in decision-making. As a result, executives of these companies need to design organizations that are as sophisticated as their strategies. Yet, the complexity of designing and managing global operating models is often a source of frustration to mid- and senior-level leaders. This article discusses five factors that yield success in activating a global operating model. Activators provide leadership teams at all levels with a way of bridging the gap between complex organizational designs and business performance.
We define activation as the deliberate and adaptive creation of new work, decisions, and business outcomes gained through the repetition and refinement of management processes and interactions over time, enabled by well-designed organizational arrangements and collaborative mindsets. Based on our experience in working with large multinational firms, we believe that five particular activators help to set a global operating model in motion and to sustain it.
GLOBAL OPERATING MODELA global operating model (GOM) is the means to manage complexity, tension, and the need for both leverage and agility in large multinational companies. It is the artful combination of organizational structures, processes, governance mechanisms, metrics, and reward systems that tie together center-based business and functional teams with far-flung geographic teams in order to execute complex business strategies around the world. A GOM is intended to structure interactions at those strategic nodes that will build and utilize needed organizational capabilities. GOMs are typically composed of three elements:
• Geographic market units (regions, countries, or country clusters)• Global business units (products, brands, categories, or customer segments)• Global operating and support functions (R&D, supply chain, marketing, IT, HR,
finance, etc.)Companies as diverse as Nike, Procter & Gamble, Deere & Co., Medtronic, PepsiCo,
Unilever, IBM, Levi-Strauss, and Royal Dutch Philips have created successful global

Amy Kates • Gregory Kesler Activating the Global Operating Model:The bridge from organization design to performance
39
operating models and consider their worldwide matrix organizations to be sources of competitive advantage. Some leadership teams inhabit these models as though they are second nature. Others struggle mightily. No company has completely solved the problems of bringing complex operating models to life, but many have made significant progress. Studying these companies can be productive – there are reasons some deliver superior results while others seem to have real problems.
WHY ORGANIZATION IS AS IMPORTANT AS STRATEGY Profitable growth comes not from a firm’s articulated strategy but rather its actual strategy, which is reflected in how the organization’s resources are allocated. Outdated capabilities, structures, and decision-making processes get in the way of implementing good intentions and block attention to new sources of growth. In effect, the backward pull of structure, if left unattended, can inhibit even the best of strategic plans.
CEOs of large multinational companies can build the bridge from strategy to structure to performance through organizational capabilities. Enterprise-wide capabilities are difficult to build, but are also difficult for competitors to copy. Organizational capabilities are cultivated by the intentional arrangement of structure, process, metrics, and talent. Capabilities are a distinct source of competitive advantage that enable both the rapid execution of strategy and the envisioning of new strategic options. Most of the critical capabilities that drive growth – innovation, brand building, shared resources – are formed at the intersections of business units, functions, and geographic markets as shown in Figure 1 below.
Fig. 1. Growth occurs at the intersections of businesses, functions, and geographies
The global operating model embodies the promise of the matrix organization – that a company can have it all: robust global products and brands, local market responsiveness, and cost-effective functional processes and systems. But, the reality is that many senior executives in companies trying to execute global strategy struggle to meet any of these objectives. It is not because managers do not want to make the matrix work; they have not been set up to achieve enterprise-wide success. Michael Canning, CEO of Duke Corporate Education, notes: “CEOs discuss how their companies have perfected the art of working in silos. But, collaboration across business units remains challenging because people are not properly incentivized, and no single business unit will bear the burden of investing in collaboration” (Canning, 2015).
ACTIVATIONThe pull to greater complexity in global strategy and organization, and all the challenges that come with it, is powered by the need for new sources of growth in diverse geographic markets across multi-product divisions with increasingly demanding customers who have lots of technology at their fingertips (Galbraith, 2014). After working closely with more than 20 large U.S. and European-based global companies (ranging in size from $3-65 billion) during the past ten years, we have concluded the problem is not in the fundamental design of
Amy Kates • Gregory Kesler Activating the Global Operating Model:The bridge from organization design to performance
40
their operating models. The challenge is ineffective and incomplete activation. Despite large-scale, well-funded change initiatives, sophisticated communication programs, and countless worldwide leadership summits, the hard work of bringing these complex organization designs to life often lacks focus or is not sustained over the three or more years that it typically takes to fully embed new ways of working.
We are frequently invited into companies a year or two after they have made a substantial organizational change in response to a strategic redirection. We encounter frustration that the new operating model – which is often quite logical and compelling – is not resulting in the predicted business performance. As we look across the companies we have studied and worked with, we see a common set of symptoms that indicate incomplete activation:
• Excess hierarchical layers and duplicated work make the organization slow and internally focused.
• Global product teams and functions are overlaid on the existing regional (commercial) organizations without making adjustments in legacy P&L structures, creating unproductive friction.
• Power issues remain unresolved across global business units, regional teams, and functional units.
• Global functions are designed to do yesterday’s work, often independently from the needs of the business.
• Leaders do not know how and are not motivated to work in a matrix – metrics and reward systems do not reinforce enterprise thinking.
• The corporate executive committee continues to act as a group of individual leaders, each focused on their own business versus the needs of the enterprise.
Activation is different from the design and implementation task. These are both somewhat static and time-bound activities. Activation starts with design, and is dependent on good implementation, but goes beyond the “go-live” date. With activation, there is learning and adjustment that can only come through leaders and managers engaging horizontally across organizational boundaries through a series of business decision-making cycles, and then analyzing and reflecting on outcomes. Finally, activation is achieved when the necessary modifications in structures, processes, metrics, or behaviors are made based on this learning. Consider a simplified example of a fashion apparel company to illustrate the definitions and concepts associated with the activation process.
Strategy and growth choices: A U.S.-based fashion company wants to expand its brand into Asia and move from its core women’s clothing and shoe collection to adjacent categories (men’s clothing, accessories, fitness, etc.).
Global operating model: The shift is from a single business run out of the home region with two categories to multiple regions and multiple categories supported by global functions.
Organization design: The company establishes U.S., European, and Asian regional leadership, new global category teams, and end-to-end global functional management delivered through region-based staff. “Collection integration” is identified as a key process to enable the new organizational model. The collection integration process will involve local merchants as well as designers from across the categories in each phase of design to ensure alignment on the core brand message, infusion of local innovations and tastes into global decisions, and sharing of patterns and themes across the categories.
Implementation: Regional and category roles are designed and staffed. The collection integration process is laid out in detail including participants, routines, and decision rights.
Activation: Over the next 24 months, the process for creating an integrated collection is run three times per year. Following each session, there is an after-action review, and all aspects of the process and results are assessed. Modifications are made to participation, timelines, and decision processes. Metrics are adjusted to drive and reward the right collaborative behaviors. The collection-integration process becomes a dynamic forum for strategic and operational conversations and decisions to take place at the nodes where unique value can be captured. This is an example of how a well-designed and tended process allows a company to gain the rewards of strategic complexity.

Amy Kates • Gregory Kesler Activating the Global Operating Model:The bridge from organization design to performance
41
Depending upon the pace of the business and the opportunities for leaders to engage in various decision cycles, full activation of a global operating model can take several years as activation is an adaptive and dynamic activity.
FIVE KEY ACTIVATORS Our consulting work and research reveal five activators for accelerating business results in a global operating model. We believe these activators are what differentiate companies that gain sustainable results from their global operating model from those that do not. The activators are sorted against three outcomes: the right connections, the right conversations, and the right know-how. See Figure 2.
Fig. 2. The five activators of the global operating model
The Right Connections
Establishing an organizing logic that fits the strategy is fundamental to organization design (Donaldson, 2014). The basic structural options, however, are limited. All global organizations are built around combinations of global products, brands, or customer groups; regional or local geographic market units; and global operating and support functions. The design task is to define the working connections among these groups. Integration is fundamental to the global operating model, and most managers are presented with scores of opportunities to connect with colleagues across the organization. Management time is scarce, so the right connections should be designed to make collaboration as efficient as it can be (Kesler & Kates, 2011). Two of the five activators help assure that the right connections are wired into the organization.
Activator #1: value-adding hierarchical layers. Make sure that hierarchical layers do not overlap in responsibility and create unnecessary complexity. Two years into the rollout of its global operating model, Heineken, the worldwide brewing company, discovered confusion in the working roles of global brand teams and commercial regions, due largely to overlapping responsibilities between the region and country-level management (see Figure 3). This problem is common in global organizations. It is important to establish one operating-unit layer of organization and a single value-added layer for consolidating functional work. This ensures that:
• The fewest possible layers are established, each with a unique value-adding contribution, which facilitates delegation, empowerment, and faster vertical decision-making.
• An anchor layer is established to be the primary owner of profit and loss, and this layer becomes the key focus for partnerships between global and regional units, being careful that this work is not duplicated in other layers of the organization.

Amy Kates • Gregory Kesler Activating the Global Operating Model:The bridge from organization design to performance
42
• Infrastructure and support activities are consolidated where possible and not replicated at multiple levels, reducing complexity and cost.
Fig. 3. Heineken’s global brand teams had to interact with multiple layers of commercial and P&L units at both the region and country levels in the company’s older
operating model.
The Coca-Cola Company provides another example of the need to adhere to the principle of unique, value-adding layers. In late 2014, senior leaders announced a company-wide initiative to establish an anchor layer of management in its international markets. Large clusters of countries, known as divisions, became the anchor operating-unit layer. The company eliminated its regional-group layer in order to create a direct connection between field divisions and global brand and category teams. The changes were designed to “rewire our organization for faster and more effective decision-making,” said CEO Muhtar Kent in an internal memorandum to employees (Esterl, 2014). The Coca-Cola system had become a complex web where big ideas, driven from the center, had to be negotiated with each region, and often country-level general managers, before they could be executed. By having the center-based marketers interact directly with countries or small clusters of countries, brand building and product expansion ideas can be driven more quickly around the world.
The anchor layer is where authority is located to make short- and long-term trade-offs. By removing the regional layer, Coca-Cola placed the anchor layer close to the consumer. Now the center marketers provide global direction, but only after interaction with local marketers who are in close contact with consumer trends. In this business, a regional marketing view did not add value.
Activator #2: innovation and execution networks. Build formal networks of global and local capability with guidance from the center. This ensures that:
• Ideas move not just from the center to the operating units but also across business units and geographies to generate innovation.
• The enterprise can provide strong, coordinated leadership from the center without relying on reporting relationships, for greater agility in the regions.
• Investments in people and systems are leveraged for the good of the entire company. • Execution for initiatives is owned by the network, creating better accountability for
results.Keith Weed, the chief marketing officer at Unilever, and his colleagues at EffectiveBrands,
have argued that marketing, as a capability, has now become too important to be managed solely by the marketing function (Arons, van den Driest, & Weed, 2014). Today’s marketing capability can only be fully realized by engaging the entire organization in pursuing the brand’s purpose, integrating marketing with other functions, and ensuring that global, regional, and local marketing teams work interdependently. The same idea can be extended to the management of initiatives like innovation or key account management. To leverage innovation investments – to make them “go-forward compatible” and be relevant to customers in more than one region – businesses such as Nike, Medtronic, and Deere & Co. engage product developers from several regions to work with each other, often facilitated by a corporate team, against a shared agenda and targets. Common goals, methods, and tools are the integrator, the centripetal force that allows the work to be center-led not centralized.

Amy Kates • Gregory Kesler Activating the Global Operating Model:The bridge from organization design to performance
43
The center has an important role in the network, but it is not the dominant role. Leadership is often rotated in robust, global networks. For example, PepsiCo connects global category managers with regional commercial and marketing managers from developed and developing markets. Any operating unit in the network might be designated as the lead for creating the content for a given innovation initiative. An operating unit or function in the network often assumes the lead when it has a major stake in the outcome, has the talent to lead the work, and is willing to invest resources. Some businesses or regions within the network may commit to launch the new product or brand idea early in the process and share in the funding. Other units may serve as a test market for the new idea. While some operating units in the network may completely opt out of a given initiative, other units may pick up the content once it is developed and adapt it locally. These “coalitions of the willing” are built on trust and a culture of mutual interdependence. There is no chief marketing officer at PepsiCo.
The Right Conversations
The purpose of organization design is to shape “strategic conversations” (Liedtka, 2010). The metaphor of organization as conversation recognizes the organization as a set of dynamic patterns of thought and behavior that cannot be separated from the realities of human interaction. This is in contrast to the common metaphor of organization as machine, a set of blueprints that aim for control (Suchman, 2011). Trying to perfect the organization as a machine only creates stress, blame, and defensiveness when events inevitably stray from the plan. For example, the response to the uncertainty of global complexity must be mindful participation in real-time problem-solving, not the rote following of prescribed decision rights. The “right” conversations require managers that have the right skills, mindsets, and behaviors, but these exchanges can be fostered through design of smart operating mechanisms. There are two critical activators that lead to the right conversations.
Activator #3: the business handshake. In one sense, an organization is made up of a series of requests and promises between people (Sull & Spinosa, 2007). The most important of these are what we call the “business handshake”, which can be characterized as follows:
• It is the agreement across organizational boundaries on what results will be delivered and how.
• Goals are shared completely. The partners co-own the business customer and/or the consumer, they co-develop strategy, and they co-own the results.
• An integrated planning process connects strategic plans, including operating targets and budgets, and – in the handshake – it connects the partners across business lines, geographies, and functions.
Once interlocking targets and resource plans are set, the principals in the handshake own the execution of those plans. They will need to (a) align rewards and metrics, (b) develop a performance-management cadence that pulls the players together to manage results at the right level of detail and with the right frequency, and (c) create access to the same data for all partners, ensuring a single source of information and knowledge to empower smart trade-offs.
At Royal Philips, global-local target setting conversations are structured around the organizational nodes in the matrix that deliver the most value against the strategy. With its 20 global product businesses (the business-unit anchor layer) and its 17 key market clusters (the market anchor layer), a planning grid can be laid out for what CEO Frans van Houten refers to as the more than 300 possible “business-market combinations.” The Pareto principle is applied to focus on those 20 percent of the cells in the grid that will deliver something close to 80 percent of the growth target for the company. For example, the oral health market in Brazil, where people brush their teeth three times a day, is an outstanding business-market combination for Sonicare toothbrushes. To exploit this opportunity requires targeted and collaborative investment in innovation, brand building, and commercial excellence. The worldwide head of Sonicare and the commercial head of Brazil co-own the plan for growth, similar to the illustration in Figure 4.
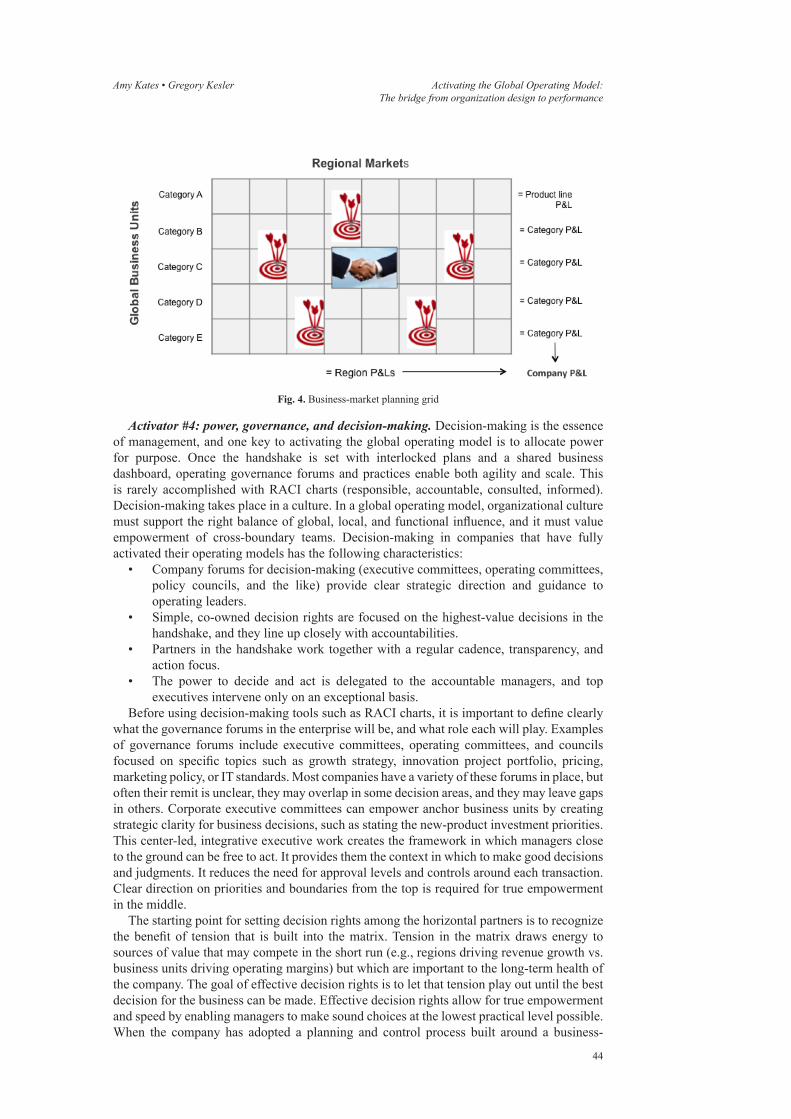
Amy Kates • Gregory Kesler Activating the Global Operating Model:The bridge from organization design to performance
44
Fig. 4. Business-market planning grid
Activator #4: power, governance, and decision-making. Decision-making is the essence of management, and one key to activating the global operating model is to allocate power for purpose. Once the handshake is set with interlocked plans and a shared business dashboard, operating governance forums and practices enable both agility and scale. This is rarely accomplished with RACI charts (responsible, accountable, consulted, informed). Decision-making takes place in a culture. In a global operating model, organizational culture must support the right balance of global, local, and functional influence, and it must value empowerment of cross-boundary teams. Decision-making in companies that have fully activated their operating models has the following characteristics:
• Company forums for decision-making (executive committees, operating committees, policy councils, and the like) provide clear strategic direction and guidance to operating leaders.
• Simple, co-owned decision rights are focused on the highest-value decisions in the handshake, and they line up closely with accountabilities.
• Partners in the handshake work together with a regular cadence, transparency, and action focus.
• The power to decide and act is delegated to the accountable managers, and top executives intervene only on an exceptional basis.
Before using decision-making tools such as RACI charts, it is important to define clearly what the governance forums in the enterprise will be, and what role each will play. Examples of governance forums include executive committees, operating committees, and councils focused on specific topics such as growth strategy, innovation project portfolio, pricing, marketing policy, or IT standards. Most companies have a variety of these forums in place, but often their remit is unclear, they may overlap in some decision areas, and they may leave gaps in others. Corporate executive committees can empower anchor business units by creating strategic clarity for business decisions, such as stating the new-product investment priorities. This center-led, integrative executive work creates the framework in which managers close to the ground can be free to act. It provides them the context in which to make good decisions and judgments. It reduces the need for approval levels and controls around each transaction. Clear direction on priorities and boundaries from the top is required for true empowerment in the middle.
The starting point for setting decision rights among the horizontal partners is to recognize the benefit of tension that is built into the matrix. Tension in the matrix draws energy to sources of value that may compete in the short run (e.g., regions driving revenue growth vs. business units driving operating margins) but which are important to the long-term health of the company. The goal of effective decision rights is to let that tension play out until the best decision for the business can be made. Effective decision rights allow for true empowerment and speed by enabling managers to make sound choices at the lowest practical level possible. When the company has adopted a planning and control process built around a business-
Amy Kates • Gregory Kesler Activating the Global Operating Model:The bridge from organization design to performance
45
market handshake, there is a context for decision rights, and they can provide real guidance for leaders.
The Right Know-How
The characteristics of the global, boundary-spanning leader have been examined in-depth over the past decade or more (Ernst & Chrobot-Mason, 2010). In companies that fully activate their global operating model, a pipeline of matrix-ready leadership is the sum of embedded selection and development practices, clearly defined behavioral criteria, and deep commitment to talent development at the top of the hierarchy.
Activator #5: matrix-ready leaders. Leaders who succeed in the global matrix are selected and developed for their learning agility, influence skills, and ability to engage in the tensions among naturally competing priorities (Osland & Bird, 2012). No amount of formal process, aligned objectives, or decision-rights documents will bring the global operating model to life without the right leadership behaviors and relationships. In companies that make their operating model work:
• Global leaders are able to manage conflicts between global and local business (and functional) objectives across the matrix.
• Relationships and social capital – which are the foundation for effective leadership in all organizations – are strengthened and valued.
• Collaboration and working across all types of boundaries become the cultural norm for leaders.
The matrix that underlies a global operating model requires strong leaders that can manage multiple teams, influence peers without authority, and proactively align competing agendas. The success of a global operating model depends largely on competent leaders who are willing and able to navigate the power dynamics inherent in a complex organization. Building a global talent pipeline is a core capability for companies that want to activate a global operating model. Clear talent objectives drive the right talent-development focus. Procter & Gamble provides a good example. Senior-level talent is needed in three broad areas: (a) global business units, (b) market development regions, and (c) functions and services. Talent depth is measured in each area, and strategies are built to close projected gaps.
The best global leadership systems develop people and the organization simultaneously (Tichy et al., 1992). No other business process has more impact on shaping culture than company-wide talent-development forums. Calibration and development councils can become the control center for activating the global operating model if used well. As an executive team at the top does the work of getting to know its talent by evaluating individuals with a common yardstick and vocabulary, they begin to calibrate a shared set of expectations about what global leadership looks like in their company. As senior executives plan moves among promotable candidates, they learn to trust, and they play more of an enterprise leadership role, often becoming a more collaborative leadership team. For many companies, these talent review discussions help to shift the role of each senior executive from being focused on the performance of his or her own unit to committing a portion of his or her attention to shared leadership of the enterprise. By investing in the talent conversation, they are “being the change”, working together to activate the global operating model.
In our work with global companies, we have found that learning programs can also play a major role in developing leaders, especially in the midst of a transition to a new operating model. Such sessions help people understand the new organizational intentions and reassure them that the challenges they are experiencing are normal and expected. When education and awareness are combined with skill building and the opportunity to successfully co-create with new colleagues, managers are more open to taking personal risks to change behavior. Three kinds of learning, when woven together, have the simultaneous effect of developing the organization and its leaders: (a) understanding the fundamentals of matrix logic; (b) building trusting relationships and networks, and (c) co-creating robust management processes and operating mechanisms. Such learning is best delivered as case-based, action-learning workshops that diagnose the health of the organization while enabling leaders to succeed in the matrix. In this way, the workshops support activation by serving as a feedback loop
Amy Kates • Gregory Kesler Activating the Global Operating Model:The bridge from organization design to performance
46
of input and insight to executives regarding what course corrections need to be made to the change management plan.
CONCLUSION The power of the five activators is in their interdependence and mutual reinforcement. For example, no matter how motivated and skilled a set of managers is, if the organization has not provided the forums and processes to connect and have the right conversations, a lot of well-intentioned individual effort will be wasted. Conversely, no amount of reengineering of business processes will make up for a management team that is unwilling or unable to engage in collaborative behavior. The activators also work together at a more subtle level. For example, identification of the anchor layer sets up who needs to come together in the business unit/region handshake. Well-designed target setting and performance review meetings build trust and social capital over time. Functions that are designed explicitly as an integrative mechanism help to move talent around the world, creating a pipeline of ready leaders able to engage in innovation and execution networks.
The right organization design is a critical part of successful strategy execution. Design, however, is not enough. Activation of the global operating model is the bridge to performance. Activation is the deliberate and adaptive creation of new work, decisions, and business outcomes gained through the repetition and refinement of management processes and interactions over time, enabled by well-designed organizational arrangements and collaborative mindsets. In large multinational companies, full activation may take three years or more. During that time, leadership needs to continue to build horizontal capabilities made up of effective processes, governance mechanisms, collaborative networks, and the right leadership skills and behaviors. The five activators framework provides a road map for assessing current realities and setting concrete plans for the activation of complex, global operating models.
Acknowledgements: We want to thank Dorthe Døjbak Håkonsson for recommending that we introduce the activator concept to the organization design literature. We describe the full activation process in Gregory Kesler and Amy Kates, The Bridge from Design to Performance: Five Ways to Activate a Global Operating Model (Wiley, 2015).
REFERENCESArons MdeS, van den Driest F, Weed K. 2014. The ultimate marketing machine. Harvard
Business Review (July-August).Canning M. 2015. From collaboration to choreography. Dialogue (March 4), Duke Corporate
Education, Duke University, Durham, NC.Donaldson L. 2014. Fit – the key to organizational design. Journal of Organization Design
3(3): 38-45.Ernst C, Chrobot-Mason D. 2011. Boundary Spanning Leadership: Six Practices for Solving
Problems, Driving Innovation, and Transforming Organizations. McGraw-Hill, New York, NY.
Esterl M. 2014. At Coke, newest flavor is austerity. Wall Street Journal (December 23). http://www.wsj.com/articles/at-coke-newest-flavor-is-austerity-1419352337.
Galbraith JR. 2014. Designing Organizations: Strategy, Structure, and Process at the Business Unit and Enterprise Levels. Jossey-Bass, San Francisco, CA.
Kesler G, Kates A. 2011. Leading Organization Design: How to Make Organization Design Decisions to Drive the Results You Want. Wiley, New York, NY.
Liedtka J. 2010. Strategic conversations at Suncorp Commercial Insurance. Darden Business Publishing, University of Virginia, Charlottesville, VA.
Osland JS, Bird A. 2012. Process models of global leadership development. In M.E. Mendenhall et al., Global Leadership: Research, Practice, and Development. 2nd edition: 97-112. Routledge, New York and London.
Suchman AL. 2011. Organizations as machines, organizations as conversations: Two core metaphors and their consequences. Medical Care 49: 43-48.

Amy Kates • Gregory Kesler Activating the Global Operating Model:The bridge from organization design to performance
47
Sull DN, Spinosa C. 2007. Promise-based management: The essence of execution. Harvard Business Review (April): 1-10.
Tichy NM, Brimm MI, Charan R, Takeuchi H., 1992. Leadership development as a lever for global transformation. In V. Pucik, N.M. Tichy, and C.K. Barnett (eds.), Globalizing Management: Creating and Leading the Competitive Organization: 47-60. Wiley, New York, NY.
AMY KATESOwner Kates Kesler Organization ConsultingE-mail: [email protected]
GREGORY KESLEROwner Kates Kesler Organization ConsultingE-mail: [email protected]

48 Journal of Organization DesignJOD, 4(2): 48-53 (2015)DOI: 10.7146/jod.20478© 2015 by Organizational Design Community
NETWORKS, CLUSTERS, AND SMALL WORLDSARE THEY RELATED?LUCA GIUSTINIANO • CHIARA D’ALISE
Abstract: In recent years, many industries have seen the rise of new inter-organizational forms. Among those new forms, organizational networks, clusters, and small worlds are attracting increasing interest, both in academic research and management practice. While economic theory considers such forms to be market failures, organization theory highlights their potential positive effects on the participating organizations. The organizational literature often uses the terms “networks”, “clusters”, and “small worlds” as synonymous even though there are differences between them. Moreover, given the sometimes-spontaneous emergence of these organizational forms, the extent to which they can be designed is not always clear. This article discusses the characteristics of networks, clusters, and small worlds; their operational parameters; and how these organizational forms are related. Further, we identify the role of design in these types of organizations.
Keywords: Networks, clusters, small worlds, organization design, new organizational forms
In recent years, many industries have seen a rise in business networks and other inter-organizational and cooperative arrangements. Organizational networks and other inter-organizational forms, such as clusters and small worlds, are gaining momentum, both in academic debate and management practice (Molina-Morales et al., 2015). Economic theories view inter-organizational forms as alternatives to markets and hierarchies or as market failures (e.g., transaction cost economics, agency theory, and the property rights approach). By contrast, the resource-based view of the firm (Wernerfelt, 1984) has explicated the win-win properties of networks. Although the resource-based theoretical perspective has a more positive view of business networks, its focus on the characteristics of the individual firm – its resources and capabilities – limits its analytical and explanatory power.
We believe that resource dependence theory (Pfeffer & Salancik, 1978) can provide further insights into business networks because of its greater explanatory power regarding cooperation between or among organizations. The resource dependence view characterizes the organization as an open system, dependent on resources and contingencies in the environment. In this view, the focus on resources switches from the intra-firm level to the inter-organizational level, as well as from resource availability to the acquisition of resources via negotiation. According to Pfeffer (1987: 26-27):
Organizations are not autonomous, but rather are constrained by a network of interdependencies with other organizations… [so] organizations take actions to manage external interdependencies, although such actions are inevitably never completely successful and produce new patterns of dependence and interdependence.
Thus, resource dependence theory posits that many of the resources that every organization needs originate from the environment. Organizational networks allow resource sharing across organizations, and a network of complementary firms may be a solution for overcoming a competence gap. Further, we maintain that forming a network organization does not merely mean negotiating the acquisition of existing resources. Rather, new jointly determined resources can be generated through cooperation. The stock of knowledge available to a focal

Luca Giustiniano • Chiara D’Alise Networks, Clusters, and Small Worlds:Are they related?
49
node in a network results from the combination of two elements: the knowledge owned by the nodes linked to the focal node and the new knowledge created through relationships with those nodes. By shifting the focus from the single firm (node) to the relations and interactions between firms, we recognize the existence of exchange processes involving products and services, information, and knowledge. By focusing on the value of the interactions, the benefits of networks, clusters, and small worlds can be interpreted more fully.
RELEVANCE OF NETWORKS AND OTHER COOPERATIVE FORMS TO ORGANIZATION DESIGNIn addition to competition, cooperation has emerged as a model for efficient resource allocation, shifting the focus to the exchange relationship and the inter-firm alignment of complementary assets, resources, and activities (Dyer & Singh, 1998). In this vein, the analysis of networks may answer the call for juxtaposing resource dependence theory (RDT) with other theoretical lenses to examine organizational interdependencies not included in its original formulation (Hillman, Withers, & Collins, 2009). Although RDT is able to explain networks, new cooperative inter-organizational forms have emerged. Networks, clusters, and small worlds are sometimes discussed as synonymous, without any clear demarcation. A better understanding of these forms can aid research on both organizational boundaries (Burton, 2013; Lomi, 1997) and inter-organizational exchanges found in newer organizational forms such as collaborative communities (Fjeldstad et al., 2012; Miles et al., 2009). Do clusters or small worlds have different characteristics and yield different benefits from traditional networks? Can resource dependence theory usefully interpret the dynamics of clusters and small worlds?
Responding to these questions is timely and consistent with the growing levels of complexity and interdependence of organizations and their environments under the pressures of globalization, technological development, and the faster pace of economic life. Within this setting, as Burton (2013: 42) has pointed out, “Organization design theory and practice must keep pace with increased complexity and interdependence.” We believe that networks, clusters, and small worlds have different features that affect the relations between them. Networks obtain performance benefits due to their flexibility, the variety of capabilities that can be assembled, and their economies of scope and experience (Miles & Snow, 1994). Clusters, defined as spatial networks, yield superior benefits due to two characteristics: geographic localization and the vertical heterogeneity of the nodes (Porter, 1998, 2000). Furthermore, the more integrated the cluster is in a small-world network structure, the higher the cluster’s performance (Watts, 1999). Organization design can focus on the inter-firm relations, and through a multi-level perspective and micro–macro bridges, combine different levels of analysis. We therefore aim to pave the way for the study of “clusters of clusters” and the combination of intra-cluster and inter-cluster dynamics.
The reconsideration of resource dependence theory for the understanding of networks, clusters, and small worlds fits with many contributions in the Journal of Organization Design. For example, RDT is consistent with boundary-crossing organizational strategy as defined by Burton (2013: 43): “In the end, organizations must have a strategy which links the outside and inside, and that strategy must be continually adjusted to fit the changing environment.” Similarly, in discussing “supra-firm” designs, Mathews (2012: 42) notes:
…the scope of organization design has expanded steadily from work-flow issues and job specifications to firm-level considerations and now to supra-firm industrial structures, where such issues as modularity and clustering loom large. The impetus for this development lies partly in the fact that some supra-firm designs clearly work better than others.
The investigation of networked forms is consistent with the concept of consilience (Puranam, 2012), aimed at explaining phenomena occurring at one level of aggregation based on knowledge about lower-order phenomena. Therefore, we can infer that changing the unit of analysis and assuming a multi-level perspective could be important in understanding organizational phenomena. We advocate a shift in analysis from the whole network to single clusters and vice versa.

Luca Giustiniano • Chiara D’Alise Networks, Clusters, and Small Worlds:Are they related?
50
A focus on cooperation allows for the explanation of inter-firm variation in performance (innovation rates, financial results, etc.) in line with traditional economic explanations. The added value lies in the incorporation of sociological factors and the consideration of networks as informational structures, conduits for knowledge spillovers, and sources of knowledge generation. The main contributions can be summarized as the focus on (a) relations among actors, (b) multi-level analysis, and (c) micro–macro bridging. Regarding the focus on relations among actors, we argue that organizations are not atomistic entities but rather are actors whose economic actions and performance are influenced by their context – by the network of inter-organizational relations in which they are embedded. Consequently, there is a need to understand the interaction of each unit of analysis within its wider context. We argue that inter-organizational ties have an important role in shaping firm behavior and outcomes. Regarding multi-level analysis, we maintain that it is important to analyze the structure of a networked system at different levels: single actor, ties, groups of actors (nodes’ attributes and structure), and the overall network. The analysis of networks, clusters, and small worlds has to be conducted at different levels of aggregation. This approach also allows for micro–macro bridging: small-scale interactions are translated into large-scale patterns, and these in turn feed back into small groups. This allows researchers to capture the interactions of any individual unit within its larger domain.
NETWORKS, CLUSTERS, AND SMALL WORLDS: A POTENTIAL INTEGRATION In the past few decades, there has been an upsurge of interest in the role of networks, variously considered as metaphors, methods, or objects of new theory. Economic sociologists define a network as a form of organized economic activity that involves a set of nodes (e.g., individuals or organizations) linked by a set of relationships (Granovetter, 1973) that can be extended to customer–supplier relationships, interlocking directorates, relationships among individual employees, strategic alliances, and other types of relationships (Snow & Fjeldstad, 2015).
The advantage a node can derive from a network (the node’s payoff) is a function of its position in the network or of the structure of the network (structural capital) rather than of individual relationships (Borgatti & Foster, 2003). Therefore, the study of different potential network structures, including the small-world structure, is an attempt to identify which type of network can maximize benefits for the nodes. The network structure is a channel between firms for resource sharing (the combination of knowledge, skills, and physical assets among firms) and for knowledge flows (e.g., information conduits through which news of technical breakthroughs, new insights into problems, and tacit information acquired through learning by doing travel from one firm to another) (Uzzi, 1997). Networks allow access (a broader information screen), timing (early receipt of relevant information), and referral (legitimization of the node through information) (Burt, 1992). Even though some studies have demonstrated the positive effects of inter-firm alliances on patenting (e.g., Ahuja, 2000; Uzzi, 1997), the effects of specific elements of the network structure (sparse vs. dense structure, or structural holes) on innovation remain ambiguous.
The use of a contingency approach can shed some light on this issue. We posit that clusters favor the application of a contingency approach in networks through consideration of specific characteristics of the nodes, while the small world is a specification of the structure of the network. Therefore, both concepts can provide insights into explaining the innovation effects of networks.
The concept of a network is more general than that of a cluster; the latter can be simplified as an aggregation of different actors in a localized network, implying two distinctive characteristics: vertical node heterogeneity and geographic localization. Clusters might well result in greater benefits in terms of innovation, such as for innovative research in biomedicine originating in regional clusters in the United States and in Europe. With respect to vertical nodal heterogeneity, clusters comprise various actors occupying different positions in the supply chain, from downstream to upstream: firms, universities, research institutes, and other institutions. The success of regions like Silicon Valley comes from specialized

Luca Giustiniano • Chiara D’Alise Networks, Clusters, and Small Worlds:Are they related?
51
complementarities arising between neighboring firms, something that cannot be accounted for in simple capital and labor terms in a production function (Mathews, 2012). Clusters allow the integration of agents characterized by different skills, competencies, and assets, enabling the generation of new ideas. With regard to geographic localization, innovation is spurred by several elements, such as local externalities, proximity to cross-fertilization and the sharing of know-how, access to human capital, and the availability of infrastructures (e.g., facilities and transportation).
Despite the vast literature on clusters, scholars seem to converge on other substantive elements, such as the existence of formal and/or informal inter-organizational relationships and a common aim to be reached collectively within a specific domain (e.g., fields of knowledge, competencies, and technologies). Yet, there are critical questions that remain: Do all clusters have a positive impact on innovation? Is there any single characteristic of clusters that is the ultimate driver of innovation? We suggest that answers can be obtained by adopting the small-world perspective in analyzing the outcomes of clusters.
The small-world network structure is made up of a local structure with high density integrated into a wider random network, and the coexistence of short-range and long-range connections (Watts & Strogatz, 1998). The main characteristics of a small-world network are: the network is sparse in the sense that each node is connected to an average of only k other nodes n; it is decentralized in that there is no dominant central point to which most other networks are directly connected; and it is highly clustered (Watts, 1999). So far, researchers studying small-world networks have focused on a single “organization”, suggesting that it can be broken into subgroups or semiautonomous subunits. We instead advocate introducing a new application of small worlds in which the subgroups are “single clusters” and the organization constitutes “all the clusters considered together.” The small-world structure is characterized by dense clusters, or hubs, randomly connected to other clusters by weak ties in a sparse structure. Consequently, we suggest expanding the focus to inter-cluster dynamics and not just intra-cluster dynamics, thereby enriching cluster concepts with a network perspective.
It is not only important to consider descriptions of the cluster itself (e.g., through social network analysis), but also how the cluster is connected to a wider network. Here, the question is: Are the characteristics of the specific cluster suitable for spurring innovation, considering both the intra-cluster and inter-cluster levels? The answer requires a picture of the comprehensive network “structure”, considering both intra-cluster and inter-cluster ties. Previous research has suggested that the more integrated the cluster is in a small-world network structure, the higher the cluster’s innovation performance (D’Alise, Giustiniano, & Peruffo, 2014). In fact, the small-world network structure could provide an intermediate solution between sparse structures (e.g., open networks) and dense structures (e.g., closed networks), resulting in complementarity, with firms benefitting from inter-firm resource pooling and cooperation.
Within this framework, small-world networks represent intermediate configurations able to solve the trade-off problem between open and closed networks. The bridging ties with other clusters allow outside exploration with access to heterogeneous and novel ideas, while the high density of clusters allows the effective exploitation of ideas and intra-cluster exploration. A small-world network can be decomposed in terms of each cluster’s density (actual number of direct ties between nodes as a ratio of the maximum possible number of ties), and the presence of structural holes (Burt, 1992) between one cluster and other clusters. Dense and sparse configurations coexist at different scales and levels of the network in a multi-scaled cluster. Closure allows the value buried in a structural hole to be realized, effectively implementing new ideas captured from outside the cluster.
IMPLICATIONS FOR ORGANIZATION DESIGNWe posit that a flourishing stream of research can be developed by integrating concepts derived from the literature on networks, clusters, and small-world structures. Their integration can be effective in focusing on inter-firm relations and adopting a multi-level perspective. We suggest that networks that have both clustering and some amount of linkage between them –

Luca Giustiniano • Chiara D’Alise Networks, Clusters, and Small Worlds:Are they related?
52
cluster-spanning bridges – spur each cluster’s innovation. We also suggest analyzing clusters using a network perspective, in particular a small-world network perspective, to detect the impact on innovation. It would be useful to study small-world networks, identify their connection with a cluster’s innovation output, and complete the model with contingencies related to the nodes’ characteristics.
As resource dependence theory and contingency theory share a number of fundamental assumptions related to the effects of environmental uncertainty and demand dependencies (Hillman, Whiter, & Collins, 2009), we believe that the investigation of new inter-organizational forms would contribute to their concomitant explanatory power. In the same vein, organization design can contribute to the definition of the best mix in business partnerships based on networks.
REFERENCESAhuja G. 2000. Collaboration networks, structural holes, and innovation: A longitudinal
study. Administrative Science Quarterly 45(3): 425-455.Borgatti SP, Foster PC. 2003. The network paradigm in organizational research: A review and
typology. Journal of Management 29(6): 991-1013.Burt RS. 1992. Structural Holes. Harvard University Press, Cambridge, MA.Burton R. 2013. The future of organization design: An interpretative synthesis in three themes.
Journal of Organization Design 2(1): 42-44. DOI: http://dx.doi.org/10.7146/jod.7363D’Alise C, Giustiniano L, Peruffo E. 2014. Innovating through clusters. International Journal
of Engineering Business Management 6(28): 1-14.Dyer JH, Singh H. 1998. The relational view: Cooperative strategy and resources of
interorganizational competitive advantage. Academy of Management Review 23: 660-679.Fjeldstad ØD, Snow CC, Miles RE, Lettl C. 2012. The architecture of collaboration. Strategic
Management Journal 33(6): 734-750.Granovetter MS. 1973. The strength of weak ties. American Journal of Sociology 78(6):
1360-1380.Hillman AJ, Withers MC, Collins BJ. 2009. Resource dependence theory: A review. Journal
of Management 35(6): 1404-1427.Lomi A. 1997. Markets with hierarchies and the network structure of organizational
communities. Journal of Management and Governance 1: 49-66.Mathews JA. 2012. Design of industrial and supra-firm architectures: Growth and
sustainability. Journal of Organization Design 1(2): 42-63.Miles RE, Miles G, Snow CC, Blomqvist K, Rocha H. 2009. The I-form organization.
California Management Review 51(4): 61-76.Miles RE, Snow CC. 1994. Fit, Failure, and the Hall of Fame: How Companies Succeed or
Fail. Free Press, New York, NY. Molina-Morales FX, Belso-Martínez JA, Más-Verdú F, Martínez-Cháfer L. 2015. Formation
and dissolution of inter-firm linkages in lengthy and stable networks in clusters. Journal of Business Research 68(7): 1557–1562. DOI: 10.1016/j.jbusres.2015.01.051
Pfeffer J. 1987. A resource dependence perspective on interorganizational relations. In M.S. Mizruchi and M. Schwartz (eds.), Intercorporate Relations: The Structural Analysis of Business: 22-55. Cambridge University Press, Cambridge, UK.
Pfeffer J, Salancik GR. 1978. The External Control of Organizations: A Resource Dependence Approach. Harper & Row, New York, NY.
Porter ME. 1998. Clusters and the new economics of competition. Harvard Business Review (Nov/Dec): 77-90.
Porter ME. 2000. Location, competition, and economic development: Local clusters in a global economy. Economic Development Quarterly 14(1): 15-34.
Puranam P. 2012. A future for the science of organization design. Journal of Organization Design 1(1): 18-19.
Snow CC, Fjeldstad ØD. 2015. Network paradigm: Applications in organizational science. In J.D. Wright (ed.), International Encyclopedia of the Social & Behavioral Sciences, 2nd ed., Vol. 16: 546-550. Elsevier, Oxford, UK.

Luca Giustiniano • Chiara D’Alise Networks, Clusters, and Small Worlds:Are they related?
53
Uzzi B. 1997. Social structure and competition in interfirm networks: The paradox of embeddedness. Administrative Science Quarterly 42(1): 35-67.
Watts DJ. 1999. Small Worlds: The Dynamics of Networks Between Order and Randomness. Princeton University Press, Princeton, NJ.
Watts DJ, Strogatz SH. 1998. Collective dynamics of “small-world” networks. Nature 393(6684): 440-442.
Wernerfelt B. 1984. A resource-based view of the firm. Strategic Management Journal 5(2): 171-180.
LUCA GIUSTINIANODepartment of Business and Management LUISS Guido Carli UniversityE-mail: [email protected]
CHIARA D’ALISEDepartment of Business and ManagementLUISS Guido Carli UniversityE-mail: [email protected]
Copyright © 2022 FDOKUMEN