Journal of Business and Social Review in Emerging Economies
463
Journal of Business and Social Review in Emerging Economies ISSN: 2519-089X ISSN (ONLINE): 2519-0326 Patron: Prof. Dr. Hayat Muhammad Awan, President, Center of Sustainability Research and Consultancy Pakistan Editor in Chief: Assoc Prof Dr Abdul Halim Abdul Majid, Universiti Utara Malaysia, Malaysia Managing Editors: Prof Dr Ghulam Shabir, University of Central Punjab, Lahore, Pakistan Associate Editors: Prof. Dr. Muhammad Hanif Akhtar, Bahauddin Zakariya University Multan, Pakistan Assoc. Prof. Dr. Noman Ahmad Abbasi, Bahauddin Zakariya University Multan, Pakistan Prof Dr Noor Azniza bt Ishak, Universiti Utara Malaysia, Malaysia Dr Muhammad Amsal Sahban, STIM Lasharan Jaya Institute, Indonesia Dr. Sulaman Hafeez Siddiqui, The Islamia University of Bahawalpur, Pakistan Vol. 6, Issue 4, December 2020 © 2020 The authors, under a Creative Commons Attribution- NonCommercial 4.0 www.globalcsrc.org, [email protected]
-
Upload
khangminh22 -
Category
Documents
-
view
0 -
download
0
Transcript of Journal of Business and Social Review in Emerging Economies

Journal of Business and Social Review in Emerging Economies ISSN: 2519-089X
ISSN (ONLINE): 2519-0326
Patron: Prof. Dr. Hayat Muhammad Awan, President, Center of Sustainability
Research and Consultancy Pakistan
Editor in Chief: Assoc Prof Dr Abdul Halim Abdul Majid, Universiti Utara Malaysia,
Malaysia
Managing Editors: Prof Dr Ghulam Shabir, University of Central Punjab, Lahore, Pakistan
Associate Editors: Prof. Dr. Muhammad Hanif Akhtar, Bahauddin Zakariya University
Multan, Pakistan
Assoc. Prof. Dr. Noman Ahmad Abbasi, Bahauddin Zakariya University
Multan, Pakistan
Prof Dr Noor Azniza bt Ishak, Universiti Utara Malaysia, Malaysia
Dr Muhammad Amsal Sahban, STIM Lasharan Jaya Institute, Indonesia
Dr. Sulaman Hafeez Siddiqui, The Islamia University of Bahawalpur, Pakistan
Vol. 6, Issue 4, December 2020
© 2020 The authors, under a Creative Commons Attribution-
NonCommercial 4.0 www.globalcsrc.org,

Journal of Business and Social Review in Emerging Economies
Vol. 6, Issue 4,
September 2020 DOI:
10.26710/jbsee.v6i1
© 2020 The authors, under a Creative Commons Attribution-
NonCommercial 4.0 First floor, Naseer Building, Outside Pakgate Multan
60000
Pakistan.
www.globalcsrc.org, [email protected]
Copyright Policy ©
This work is licensed under a Creative Commons Attribution-Non Commercial 4.0 International License. There is
no restriction on the non-commercial use of the content of this journals, however, it is mandatory to cite the
author(s) names and the publisher.
ISSN: 2519-089X
ISSN (ONLINE): 2519-0326
INTRODUCTION
Journal of Business and Social Review in Emerging Economies (ISSN: 2519-089X & eISSN: 2519-
0326) is a peer-reviewed research journal published bi-annually by CSRC Publishing, Center for
Sustainability Research and Consultancy Pakistan. The journal is independently managed by the
advisory board and associate fellows of CSRC comprising of distinguished faculty at higher
education institutions. The journal aims to cover topics and issues in various sub-areas of business,
social and behavioral sciences in context of emerging and developing economies. Purpose is to
highlight the theoretical and practical issues faced by businesses and society in these economies. The
journal specially welcomes submissions which cover the topical areas related to sustainable business
and society.
SCOPE AND MISSION
Issues of sustainable economic development are mainly interwoven into economic policies and
dynamics of business markets in emerging and developing economies. With this background JBSEE
aims to be a premier forum for policy and theoretical discussion of high impact research in emerging
economies.
The journal aims to cover topics and issues in various sub-areas of business, social and behavioral
sciences in context of emerging and developing economies. Purpose is to highlight the theoretical
and practical issues faced by businesses and society in these economies. The journal specially
welcomes submissions which cover the topical areas related to sustainable business and society.
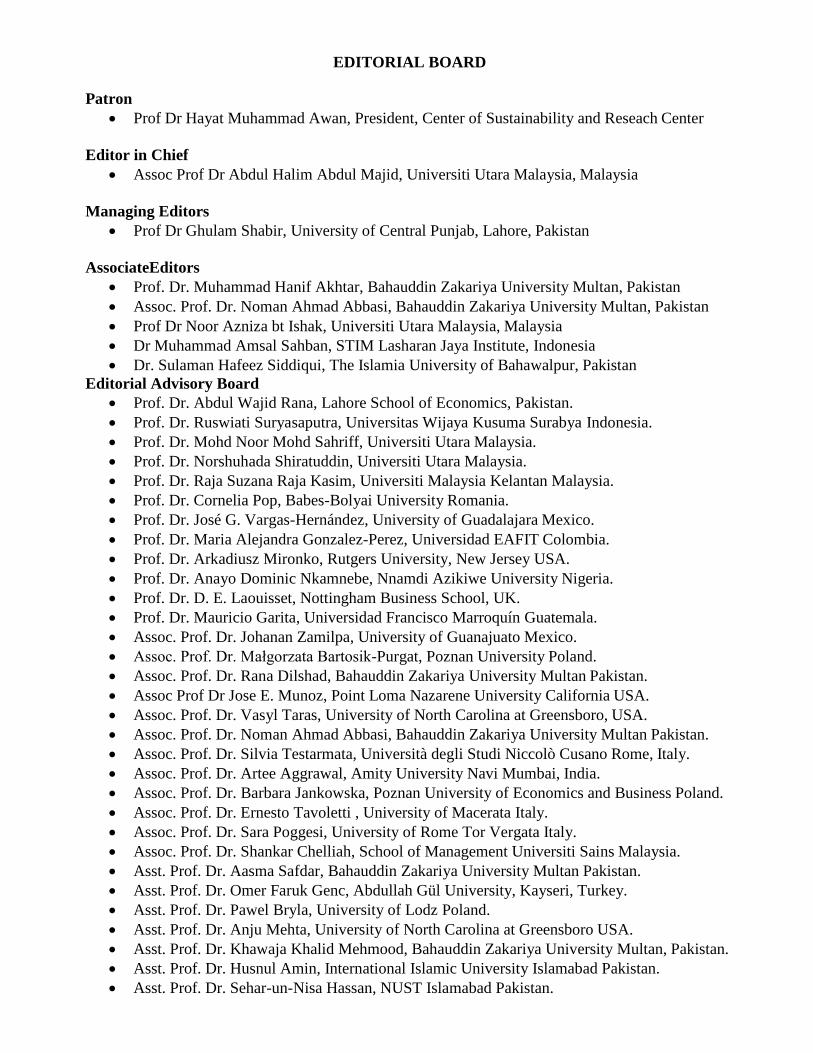
EDITORIAL BOARD
Patron
Prof Dr Hayat Muhammad Awan, President, Center of Sustainability and Reseach Center
Editor in Chief
Assoc Prof Dr Abdul Halim Abdul Majid, Universiti Utara Malaysia, Malaysia
Managing Editors
Prof Dr Ghulam Shabir, University of Central Punjab, Lahore, Pakistan
AssociateEditors
Prof. Dr. Muhammad Hanif Akhtar, Bahauddin Zakariya University Multan, Pakistan
Assoc. Prof. Dr. Noman Ahmad Abbasi, Bahauddin Zakariya University Multan, Pakistan
Prof Dr Noor Azniza bt Ishak, Universiti Utara Malaysia, Malaysia
Dr Muhammad Amsal Sahban, STIM Lasharan Jaya Institute, Indonesia
Dr. Sulaman Hafeez Siddiqui, The Islamia University of Bahawalpur, Pakistan
Editorial Advisory Board
Prof. Dr. Abdul Wajid Rana, Lahore School of Economics, Pakistan.
Prof. Dr. Ruswiati Suryasaputra, Universitas Wijaya Kusuma Surabya Indonesia.
Prof. Dr. Mohd Noor Mohd Sahriff, Universiti Utara Malaysia.
Prof. Dr. Norshuhada Shiratuddin, Universiti Utara Malaysia.
Prof. Dr. Raja Suzana Raja Kasim, Universiti Malaysia Kelantan Malaysia.
Prof. Dr. Cornelia Pop, Babes-Bolyai University Romania.
Prof. Dr. José G. Vargas-Hernández, University of Guadalajara Mexico.
Prof. Dr. Maria Alejandra Gonzalez-Perez, Universidad EAFIT Colombia.
Prof. Dr. Arkadiusz Mironko, Rutgers University, New Jersey USA.
Prof. Dr. Anayo Dominic Nkamnebe, Nnamdi Azikiwe University Nigeria.
Prof. Dr. D. E. Laouisset, Nottingham Business School, UK.
Prof. Dr. Mauricio Garita, Universidad Francisco Marroquín Guatemala.
Assoc. Prof. Dr. Johanan Zamilpa, University of Guanajuato Mexico.
Assoc. Prof. Dr. Małgorzata Bartosik-Purgat, Poznan University Poland.
Assoc. Prof. Dr. Rana Dilshad, Bahauddin Zakariya University Multan Pakistan.
Assoc Prof Dr Jose E. Munoz, Point Loma Nazarene University California USA.
Assoc. Prof. Dr. Vasyl Taras, University of North Carolina at Greensboro, USA.
Assoc. Prof. Dr. Noman Ahmad Abbasi, Bahauddin Zakariya University Multan Pakistan.
Assoc. Prof. Dr. Silvia Testarmata, Università degli Studi Niccolò Cusano Rome, Italy.
Assoc. Prof. Dr. Artee Aggrawal, Amity University Navi Mumbai, India.
Assoc. Prof. Dr. Barbara Jankowska, Poznan University of Economics and Business Poland.
Assoc. Prof. Dr. Ernesto Tavoletti , University of Macerata Italy.
Assoc. Prof. Dr. Sara Poggesi, University of Rome Tor Vergata Italy.
Assoc. Prof. Dr. Shankar Chelliah, School of Management Universiti Sains Malaysia.
Asst. Prof. Dr. Aasma Safdar, Bahauddin Zakariya University Multan Pakistan.
Asst. Prof. Dr. Omer Faruk Genc, Abdullah Gül University, Kayseri, Turkey.
Asst. Prof. Dr. Pawel Bryla, University of Lodz Poland.
Asst. Prof. Dr. Anju Mehta, University of North Carolina at Greensboro USA.
Asst. Prof. Dr. Khawaja Khalid Mehmood, Bahauddin Zakariya University Multan, Pakistan.
Asst. Prof. Dr. Husnul Amin, International Islamic University Islamabad Pakistan.
Asst. Prof. Dr. Sehar-un-Nisa Hassan, NUST Islamabad Pakistan.

Dr. Diana Bank Weinberg, Berlin School of Economics and law (HWR), Germany.
Dr. Muhammad Haroon Hafeez, Bahauddin Zakariya University Multan Pakistan.
Dr. Waheed Asghar, Technical Education and Vocational Training Authority Punjab Pakistan.
Dr. Otega Okinono, Delta State University, Nigeria.
Dr. Muhammad Rizwan, Middlesex University Business School, London.
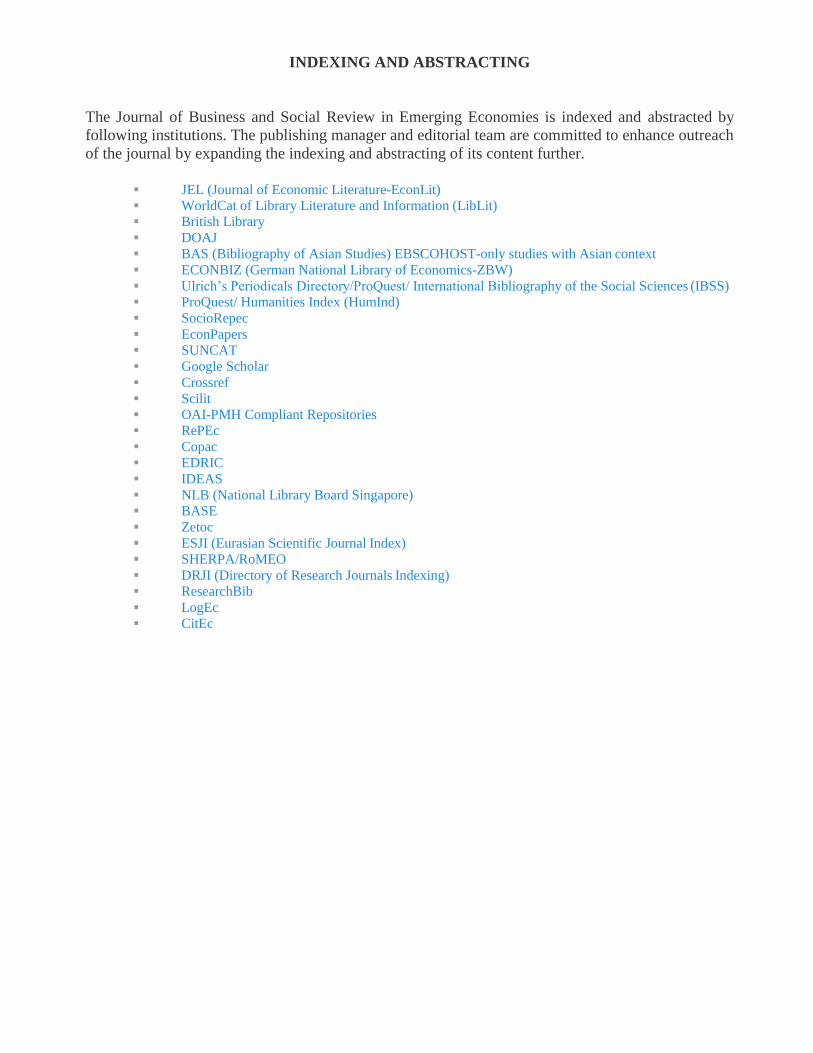
INDEXING AND ABSTRACTING
The Journal of Business and Social Review in Emerging Economies is indexed and abstracted by
following institutions. The publishing manager and editorial team are committed to enhance outreach
of the journal by expanding the indexing and abstracting of its content further.
JEL (Journal of Economic Literature-EconLit)
WorldCat of Library Literature and Information (LibLit)
British Library
DOAJ
BAS (Bibliography of Asian Studies) EBSCOHOST-only studies with Asian context
ECONBIZ (German National Library of Economics-ZBW)
Ulrich’s Periodicals Directory/ProQuest/ International Bibliography of the Social Sciences (IBSS)
ProQuest/ Humanities Index (HumInd)
SocioRepec
EconPapers
SUNCAT
Google Scholar
Crossref
Scilit
OAI-PMH Compliant Repositories
RePEc
Copac
EDRIC
IDEAS
NLB (National Library Board Singapore)
BASE
Zetoc
ESJI (Eurasian Scientific Journal Index)
SHERPA/RoMEO
DRJI (Directory of Research Journals Indexing)
ResearchBib
LogEc
CitEc

Journal of Business and Social Review in Emerging Economies
TABLE OF CONTENTS
Volume 6 Issue 4 December 2020
Composite Appraisal of Women Development in Selected Thirty-six 1227-1236
Countries with Special Focus on Pakistan: Applying Grey Incidence
Analysis Model
Tehmina Fiaz Qazi, Abdul Basit, Waheed Asghar, Abdul Aziz Khan Niazi
Environmental Disclosures and Environmental Management Strategies – 1237-1253
A study of Pakistani Listed companies
Waris Ali, Muhammad Abdul Basit Memon, Muhammad Mudassar Anwar, Rehana Kouser
Parental Satisfaction and Involvement in the Provision of Early Childhood 1255-1266
Special Education to their Young Children with Deafness
Ghulam Fatima, Misbah Malik, Samina Ashraf
Media Framing of Pandemics: A Case Study of the Coverage of COVID-19 1267-1275
in Elite Newspapers of Pakistan
Ayesha Siddiqua, Ghulam Shabir, Atif Ashraf, Ammad Khaliq
Corporate Social Responsibility for Competitive Advantage in Project 1277-1288
Management: Evidence from Multinational Fast-Food Companies in Pakistan
Mariam Sohail, Shahid Iqbal, Waheed Asghar, Syed Arslan Haider
Assessing the Mediating Role of Organization Learning Capability between 1289-1301
the Relationship of Green Intellectual Capital and Business Sustainability
Muhammad Rizwan Sabir, Muqqadas Rehman, Waheed Asghar
Service Quality and Customer Retention in Malaysian Commercial Banks 1303-1312
Chim Weng Kong, Maria Abdul Rahman
The Impact of Covid- 19 Pandemic on Mental Well-Being of Health Care 1313-1322
Workers: A Multicenter Study
Nabila Hassan, Hina Akmal Memon, Noreen Hassan, Shobha Luxmi, Farhat Sultana
The Impact of China-Pak Economic Corridor (CPEC) on Pakistan Stock 1323-1333
Exchange (PSX)
Muhammad Mudasar Ghafoor, Zahid Hussain, Muhammad Yasir Saeed
Extent of Integration in Agriculture Supply Chain: The Public Sector 1335-1351
Stakeholders perspective
Nadir Munir Hassan, Muhammad Nauman Abbasi
Police Brutality and Reforms in Pakistan 1353-1359
Najma Sadiq, Ume Laila, Tahir Mehmood, Tooba Rehan Haqqi
Horrors of Class System: A Marxist Critique of Mansfield’s Doll’s House 1361-1367
Sidra Ahmad, Selina Aziz, Salman Amin
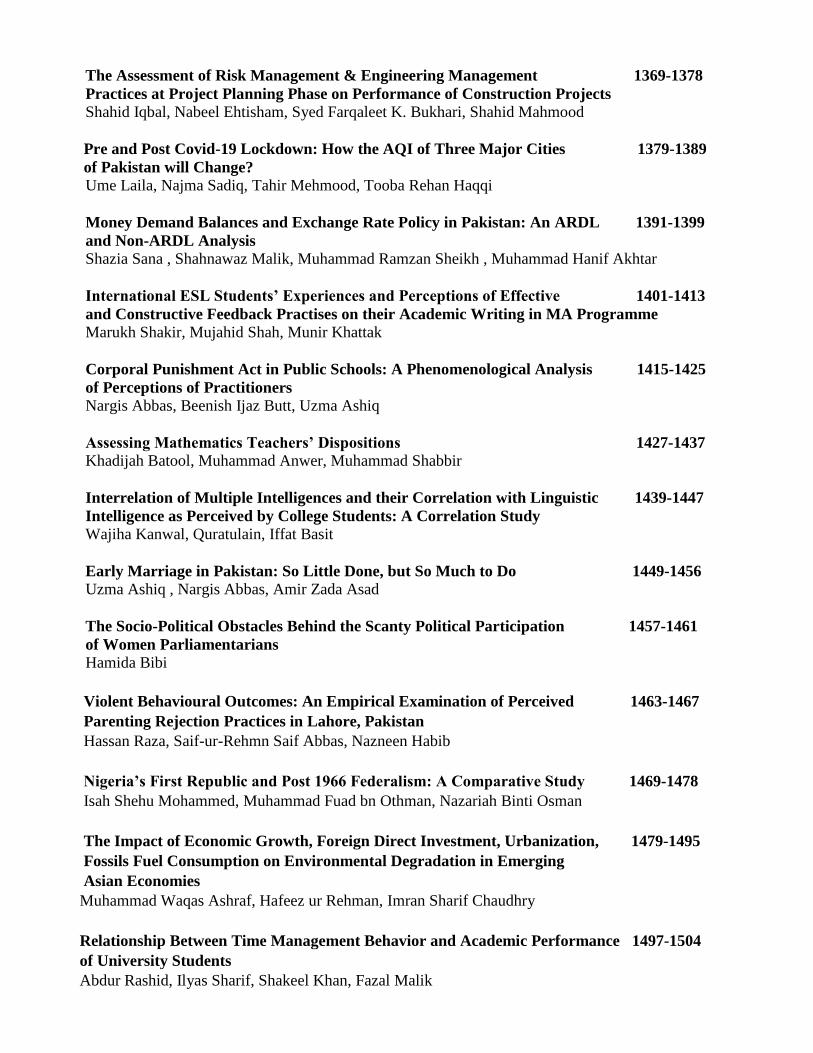
The Assessment of Risk Management & Engineering Management 1369-1378
Practices at Project Planning Phase on Performance of Construction Projects
Shahid Iqbal, Nabeel Ehtisham, Syed Farqaleet K. Bukhari, Shahid Mahmood
Pre and Post Covid-19 Lockdown: How the AQI of Three Major Cities 1379-1389
of Pakistan will Change?
Ume Laila, Najma Sadiq, Tahir Mehmood, Tooba Rehan Haqqi
Money Demand Balances and Exchange Rate Policy in Pakistan: An ARDL 1391-1399
and Non-ARDL Analysis
Shazia Sana , Shahnawaz Malik, Muhammad Ramzan Sheikh , Muhammad Hanif Akhtar
International ESL Students’ Experiences and Perceptions of Effective 1401-1413
and Constructive Feedback Practises on their Academic Writing in MA Programme
Marukh Shakir, Mujahid Shah, Munir Khattak
Corporal Punishment Act in Public Schools: A Phenomenological Analysis 1415-1425
of Perceptions of Practitioners
Nargis Abbas, Beenish Ijaz Butt, Uzma Ashiq
Assessing Mathematics Teachers’ Dispositions 1427-1437
Khadijah Batool, Muhammad Anwer, Muhammad Shabbir
Interrelation of Multiple Intelligences and their Correlation with Linguistic 1439-1447
Intelligence as Perceived by College Students: A Correlation Study
Wajiha Kanwal, Quratulain, Iffat Basit
Early Marriage in Pakistan: So Little Done, but So Much to Do 1449-1456
Uzma Ashiq , Nargis Abbas, Amir Zada Asad
The Socio-Political Obstacles Behind the Scanty Political Participation 1457-1461
of Women Parliamentarians
Hamida Bibi
Violent Behavioural Outcomes: An Empirical Examination of Perceived 1463-1467
Parenting Rejection Practices in Lahore, Pakistan
Hassan Raza, Saif-ur-Rehmn Saif Abbas, Nazneen Habib
Nigeria’s First Republic and Post 1966 Federalism: A Comparative Study 1469-1478
Isah Shehu Mohammed, Muhammad Fuad bn Othman, Nazariah Binti Osman
The Impact of Economic Growth, Foreign Direct Investment, Urbanization, 1479-1495
Fossils Fuel Consumption on Environmental Degradation in Emerging
Asian Economies
Muhammad Waqas Ashraf, Hafeez ur Rehman, Imran Sharif Chaudhry
Relationship Between Time Management Behavior and Academic Performance 1497-1504
of University Students
Abdur Rashid, Ilyas Sharif, Shakeel Khan, Fazal Malik

Determinants of Customer Perception about adoption of Islamic 1505-1516
Insurance (Takaful) in Pakistan
Areeba Khan, Hafiz Abdur Rashid, Rana Muhammad Shahid Yaqub, Saba Abbas
Measuring Pakistan’s Legislative Preparedness against COVID-19: A 1517-1524
Critical Study of Newly Promulgated Law
Jibran Jamshed, Ammara Mujtaba, Muhammad Waqas Javed, Syed Wajdan Rafay Bukhari
Socio-Economic and Political Impacts of Vocational Trainings on Tribal 1525-1541
Community of Pakistan
Sami Ullah, Zilakat Khan Malik
Social Media Marketing and Committed Customer: Analyzing the Underlying 1543-1560
role of Customer Commitment in Developing Country Context
Hafiz Muhammad Usman Khizar, Rana Muhammad Shahid Yaqub, Tasawar Javed, Shanayyara
Mahmood
Strategic Dimensions of CPEC: Role of Regional and International Powers 1561-1569
Muhammad Ijaz Latif, Muhammad Tayyab Zia
A Comparative Study of Perjury in Legal System of Pakistan and Islamic Law 1571-1579
Rashida Zahoor, Muhammad Fahad Anwar, Muhammad Asif Safdar, Jibran Jamshed
Implicit Change Leadership, Affective Commitment to Change, and the 1581-1593
Mediating Role of Organizational Trust
Sarfraz Ahmed Dakhan, Sheraz Rajput, Tariq Aziz , Khalil Ahmed Channa
Awareness on Islamic Banking: An Investigation on Women Entrepreneurs 1595-1609
in Quetta
Saba Raja, Jameel Ahmed, Kaneez Fatima
Sectarianism in Pakistan: A Statistical Analysis of Problems of Shia Hazara 1611-1620
Community of Quetta
Gulshan Majeed
Mechanism Between Organizational Support Factors and Motivation to 1621-1630
Transfer: Mediating Role of Self-Efficacy
Zeshan Ahmer, Muhammad Aamir, Majid Ali, Muhammad Usman
A Descriptive Analysis of Compensation Offerings and its Impact on Turnover 1631-1651
Intentions of Educational Managers of Punjab
Majid Ali , Muhammad Ramzan, Rizwan Qaiser Danish
The Development of a Questionnaire to Measure the Institutional Performance 1653-1663
in Higher Education Institutions
Gulshan Fatima Alvi, Nazma Bibi, Mahwish Safder
University Readiness and University Adjustment: Lived Experience of 1665-1672
First-generation University Students
Waqas Ahmad, Sadaf Mahmood, Muhammad Shabbir, Nazia Malik

Effect of Practices Executed by Monitoring Education Assistants on 1673-1679
Elementary School Teachers’ Mental Health
Sumaira Munawar, Khadija Sittar, Misbah Malik

Journal of Business and Social Review in Emerging Economies Vol. 6, No 4, December 2020
1227
Volume and Issues Obtainable at Center for Sustainability Research and Consultancy
Journal of Business and Social Review in Emerging Economies ISSN: 2519-089X (E): 2519-0326
Volume 6: No. 4, 2020
Journal homepage: www.publishing.globalcsrc.org/jbsee
Composite Appraisal of Women Development in Selected Thirty-six Countries
with Special Focus on Pakistan: Applying Grey Incidence Analysis Model
1Tehmina Fiaz Qazi, 2Abdul Basit, 3Waheed Asghar, 4Abdul Aziz Khan Niazi 1Hailey College of Banking and Finance, University of the Punjab, Lahore, Pakistan,
[email protected] 2Lahore Institute of Science & Technology, Lahore, Pakistan, [email protected]
3Director in Technical Education and Vocational Training Authority,Government of the Punjab,
Lahore, Pakistan, [email protected]; [email protected] 4Institute of Business & Management,University of Engineering & Technology, Lahore, Pakistan,
ARTICLE DETAILS ABSTRACT History Revised format: November 2020 Available Online: December 2020
Aim of the study is to appraise women development in selected
thirty-six countries with special reference to Pakistan. The
design of the study comprises of survey of literature, data
elicitation and analysis. The study uses grey incidence analysis
model (usually known as Grey Relational Analysis or simply
GRA). The model has been applied on the secondary data
extracted from the website of World Development Indicators
(WDI). The countries included in the analysis have been
selected on the basis of availability of data. From the result of
GRA it can be learnt that thirty-six countries of the world are
classified into seven different categories. There are five
countries (namely Estonia, Hungary, Slovak Republic, Thailand
and Ecuador) categorized as countries having exceptionally high
women development, whereas, five countries under each next
ensign (very high, high, moderate, low and very low). There are
six countries (namely Tanzania, Madagascar, Cote d'Ivoire,
Pakistan, Nigeria and Afghanistan) categorized under the ensign
of exceptionally low. Pakistan fall under the ensign of
exceptionally low. This study is designed on an original country
level data extracted from very reliable source and the results of
the study are useful for regulators, researchers, NGOs and other
stakeholders of the phenomenon by way of providing deeper
and new information.
© 2020 Center for Sustainability Research and Consultancy Pakistan
under a Creative Commons Attribution-NonCommercial-ShareAlike
4.0
Keywords Countries, grey incidence
analysis model, GRA, women
development and Pakistan.
JEL Classification
M10, M14
Corresponding author’s email address: [email protected]
Recommended citation: Qazi, T. F., Basit, A., Asghar, W. & Niazi, A. A. K. (2020). Composite
Appraisal of Women Development in Selected Thirty-six Countries with Special Focus on Pakistan:
Applying Grey Incidence Analysis Model. Journal of Business and Social Review in Emerging
Economies, 6(4), 1227-1236
1. Introduction
Women play key role in economic and social development of any country. They play vital role in

Journal of Business and Social Review in Emerging Economies Vol. 6, No 4, December 2020
1228
nutrition security, generating income and improving standard of living. They also play significant
role in agriculture. Women are primary caretakers of children and elders in almost every society.
Women development is a hot topic of research in domain. There is influx of research studies on the
topic viz Iqbal et al. (2016) carried a comprehensive study to assess gender disparities across 167
economies of the world by taking the component (i.e. providing incentive to work, using property,
going to court, building credit, access to institutions, getting job and violence protection) of WBL
legal gender disparity measure and proclaimed a high degree of legal gender disparity. Islam et al.
(2018) gathered data from 59,000 firms of 94 economies and concluded that prevailing unequal laws
discourage women participation and empowerment in top managerial positions of private sectors
firms. Morgan and Pritchard (2019) discussed in detail gender matters in hospitality and emphasized
on highlighting the issues of neglecting female ability despite of rise of feminism. Oladokun et al.
(2018) analyzed data of 1502 from south-east and 5024 women from north-east of Nigeria to assess
the levels of women assets ownership and bolstered that education plays a pertinent role in owning
women assets ownership. A lot of work has also been done in Pakistan concerning women
development like a study of women entrepreneurship by Qazi, Niazi, Basit and Hameed (2020). But
the authors could not find any study that has compared women development at country level using a
composite mathematical approach like grey incidence analysis model. Since it is a hot topic therefore
a country level multi criteria analysis is call of the day in order to provide comprehensive and deeper
new information to stakeholders. To be more specific there is a severe need of comparing the women
development among different countries on objective basis. The objectives of the study are: i) to
develop a theoretical framework for country level analysis of women development, ii) to rank the
countries on the basis of grey relational grade, iii) evaluate the position of Pakistan qua other
countries and iv) discuss the results qua reality. Major research questions are: i) how the countries
rank against each other on the basis of women development? ii) where do Pakistan stand among its
counterparts? In order to address the issue and attain the objectives of the study there are many
alternate methodologies viz TOPSIS, VIKOR, SWARA, AHP, GRA, ISM, SEM etc. This study uses
GRA since it seems to be the most appropriate method for analyzing the secondary data of multi
alternative cum multi attribute phenomenon. Remaining part of the article is arranged as literature
review, theoretical framework, methodology, results & discussions and concluding remarks.
2. Literature Review
Women development is highly researched area, there exists a plethora of research on the
phenomenon. The authors have reviewed many studies relevant to the topic. While during the survey
of research it was envisaged on authentic websites of research like ScienceDirect, JStor, Wiley-
Blackwell, Taylor & Francis, etc. Relevant studies that are necessary to set out the outset of the study
are reported in this article. Avalanche of published literature can be witnessed on women
development across the globe including: identifying the capabilities of women’s leadership and
sustainable development in Colombia (Barrios et al., 2020), exploring the relationship between
female directorship and firm performance in France (Bennouri et al., 2018) gender inequality in
assets ownership in Latin America (Deere et al., 2010), wage gaps of female-male among salaried
workers in India (Deshpande et al., 2018; Lee & Wie, 2017; Menon & Rodgers, 2009), uncovered
opportunities and barriers of female employment in sports in UK (Forsyth et al., 2019), women
segregation in tourism employment in APEC region (Hutchings et al., 2020), women empowerment
in East Africa (Miedema et al., 2018), women empowerment in Nepal (O'Hara & Clement, 2018),
women asset ownership in rural south-east and north-east Nigeria (Oladokun et al., 2018),
participation of Saudi women in development index (Omair et al., 2020), gender wage gap in Mexico
(Popli, 2013), gender wage discrimination in Pakistan (Sabir & Aftab, 2007; Yasmin, 2009), gender
wage inequality between 1992-2014 in Sri Lanka (Seneviratne, 2020), role of female directors and
stock price in China (Shahab et al., 2020), women’s social and financial empowerment in Pakistan
(Tahir et al., 2018) and gender wage gap in Philippines (Zveglich Jr. et al., 2019). Bennouri et al.
(2018) examined the data of 394 French firms and affirmed that there is a positive relationship
between female board directorship and firm performance; similar finding have been found by Nekhili
& Gatfaoui (2013) and Peni (2014). Likewise, Chen et al. (2018); Chen at al. (2019) and Ullah et al.
(2020) asserted that female board representation has positive impact on firm performance
particularly for those firms who intend to be creative and innovative.del Carmen Triana et al. (2019)

Journal of Business and Social Review in Emerging Economies Vol. 6, No 4, December 2020
1229
argued that educational background of top management team and inter-organizational strategic
alliance support for moderation between strategic change and senior management gender diversity.
Deshpande et al. (2018) found male-female wage discrimination among salaried workers in India
wherein female are likely to be paid less. Forsyth et al. (2019) identified barriers and opportunities of
female employment in sports and bolstered that gender inequality is still need to be addressed in
educational sports related settings. Hutchings et al. (2020) gathered data form tourism sector of 21
Asia-Pacific Economic Cooperation (APEC) member economies and concluded that there is clear
segregation of women in tourism employment across the economies due to intersectionality and
cultural barriers. Salahodjaev and Jarilkapova (2020) collected data from 176 countries between
1990-2015 and buttressed that female parliamentarism has significant socio-economic results as
increased political empowerment of female is vital to the reduction of deforestation levels for
different income ranks in both developed and developing nations. Seneviratne (2020) examined
gender wage inequality in Sri Lanka between 1994-2014 and revealed following results: i) shrink in
gender wage inequality due to women’s human capital improvement, ii) overestimate gain in
equality and iii) underestimate gender wage gap. Diederen et al. (2002) and Shinbrot et al. (2019)
uncovered potential challenges and contributions for women leadership in sustainable development
including: lack of self-confidence and patriarchal structure to refrain women to become leader. Tahir
et al. (2018) stated that despite of taking initiative of Benazir Income Support Program (BISP) to
alleviate the poverty and empower the women, there is no significant improvement is found in
women’s empowerment socially and financially. Zeb and Ihsan (2020) found significant relationship
between innovation, entrepreneurship and entrepreneurial performance. They argued that there is
direct relationship between innovation and performance; innovation mediates the relationship;
moreover, entrepreneurial qualities (i.e. need for achievement and risk-taking propensity) have
significant effect on both entrepreneurial performance and innovation. Zveglich Jr. et al. (2019)
affirmed that conservative proxies in Philippines undervalue the efforts of gender differences in work
experience while discussing gender wage gap. From the aforementioned review following theoretical
framework has been derived.
3. Theoretical Framework
Theoretical framework of a study fixes the limits of variables, data set, alternates and criteria
(Abend, 2008). Here alternates are the selected countries whereas the criteria are the variables
concerning the women development in each country. The nomenclature, operational definition, unit
of measurement and acceptable characteristics of every criterion is expounded in Table 1.
Table 1: Descriptions of Variables
The close observation of the variables listed in Table 1 possess the characteristics of larger is the
best. However, the unit of measurement of the variables are different. The criteria taken to account
for building the theoretical framework of the study was decided on the basis of availability of data on
the variables.
4. Methodology
Code Variable of Women Development Measure Criteria
1 Female Life Expectancy at Birth Years Larger is the
best
2 Female Account ownership at a financial institution or with a
mobile-money-service provider
% of population ages
15+
Larger is the
best
3 Female wage and salaried workers % of females
employment
Larger is the
best
4 Firms with female participation in ownership % of firms Larger is the
best
5 Female share of employment in senior and middle management % Larger is the
best
6 Women in parliaments % of total seats Larger is the
best
7 Nondiscrimination clause mentions gender in the constitution 1=yes; 0=no Larger is the
best

Journal of Business and Social Review in Emerging Economies Vol. 6, No 4, December 2020
1230
This study follows positivist research philosophy and deductive approach. It is a country level
secondary data based descriptive study. Overall design of the study consists of literature survey, data
elicitation and analysis. The data has been obtained from World Development Indicators (WDI),
2020. On the website of WDI, 2020 complete data of thirty-six countries and seven different
variables was available which has been used for the purpose of investigation. The analysis of the
study is based on grey system theory advanced by Julong Deng (1989). Out of this theory grey
incidence analysis model has been used as a method of investigation. This model proceeds step wise
as given in following section (Hamzaçebi & Pekkaya, 2011; Kuo et al., 2008; Tayyar et al., 2014;
Wu, 2002; Zhang et al., 2011).
5. Grey Incidence Analysis Model (GIAM)
Following steps of GIAM were used to access the best performer among different countries of the
world:
Step 1: Created a data set and established decision matrix of data set using following formula:
𝑥𝑖(𝑘) = [𝑥1(1)𝑥1(2) ⋯ 𝑥1(𝑚)
⋮ ⋱ ⋮𝑥𝑛(1)𝑥𝑛(2) ⋯ 𝑥𝑛(𝑚)
] (1)
Table 2: Original Set of Women Development Data
Sr. Country 1 2 3 4 5 6 7
1 Afghanistan 66 7.2 4.3 2.2 4.3 28 0
2 Albania 80 38 44 13 29 30 1
… ………. … … … … … … …
… ………. … … … … … … …
26 Pakistan 68 7 25 12 4.2 20 1
27 Poland 82 88 84 40 38 29 0
… ………. … … … … … … …
… ………. … … … … … … …
35 Turkey 80 54 64 25 17 17 1
36 Zambia 66 40 12 50 29 18 1 Source of Data: (World Development Indicators (WDI), 2020)
Step 2: Created reference series and comparison matrix using formula:
𝑥0 = [𝑥0(𝑘) … … … … . . 𝑥0(𝑛)] (2)
Reference series is formed with identifying best alternative from normalized matrix which is added
to decision matrix to make a comparison among alternatives.
Table 3: Reference Sequence and Comparable Sequences
Sr. Country 1 2 3 4 5 6 7
0 Reference Sequence 82 98 94 70 54 61 1
1 Afghanistan 66 7.2 4.3 2.2 4.3 28 0
2 Albania 80 38 44 13 29 30 1
… ………. … … … … … … …
… ………. … … … … … … …
26 Pakistan 68 7 25 12 4.2 20 1
27 Poland 82 88 84 40 38 29 0
… ………. … … … … … … …
… ………. … … … … … … …
35 Turkey 80 54 64 25 17 17 1
36 Zambia 66 40 12 50 29 18 1
Step 3: Created a normalized matrix using the following formulas for larger is the best/acceptable:
𝑥𝑖∗(𝑘) =
𝑥𝑖(0)
(𝑘)−𝑚𝑖𝑛𝑥𝑖(0)
(𝑘)
𝑚𝑎𝑥 𝑥𝑖(𝑜)
(𝑘)−𝑚𝑖𝑛𝑥𝑖(𝑜)
(𝑘) (3)
Table 4: Normalized Comparable Sequences
Sr. Country 1 2 3 4 5 6 7
0 Reference Sequence 1.0000 1.0000 1.0000 1.0000 1.0000 1.0000 1.0000

Journal of Business and Social Review in Emerging Economies Vol. 6, No 4, December 2020
1231
1 Afghanistan 0.4074 0.0022 0.0000 0.0000 0.0020 0.4310 0.0000
2 Albania 0.9259 0.3407 0.4426 0.1593 0.4980 0.4655 1.0000
… ………. … … … … … … …
… ………. … … … … … … …
26 Pakistan 0.4815 0.0000 0.2308 0.1445 0.0000 0.2931 1.0000
27 Poland 1.0000 0.8901 0.8885 0.5575 0.6787 0.4483 0.0000
… ………. … … … … … … …
… ………. … … … … … … …
35 Turkey 0.9259 0.5165 0.6656 0.3363 0.2570 0.2414 1.0000
36 Zambia 0.4074 0.3626 0.0858 0.7050 0.4980 0.2586 1.0000
For example, Afghanistan: female life expectancy at birth, larger is the best
𝑥1∗(1) =
𝑥10(1) − 𝑚𝑖𝑛 𝑥1
0(1)
𝑚𝑎𝑥 𝑥10(1) − 𝑚𝑖𝑛 𝑥1
𝑜(1)=
66 − 55
82 − 55= 0.4074
Step 4: Deviation sequence is calculated by using this formula: ∆0𝑖 (𝑘) = |𝑥0
∗(𝑘) − 𝑥𝑖∗(𝑘)| (3)
For biggest deviation following formula is used: Δ𝑚𝑎𝑥 = 𝑚𝑎𝑥
∀𝑗∈𝑖 𝑚𝑎𝑥
∀𝑘 |𝑥0
∗(𝑘) − 𝑥𝑗∗(𝑘)| = 1 (4)
For smallest deviation following formula is used: Δ𝑚𝑖𝑛 = 𝑚𝑖𝑛
∀𝑗∈𝑖 𝑚𝑖𝑛
∀𝑘 |𝑥0
∗(𝑘) − 𝑥𝑗∗(𝑘)| = 0 (5)
Table 5: Deviation Sequences
Sr. Country 1 2 3 4 5 6 7
0 Reference Sequence 0.0000 0.0000 0.0000 0.0000 0.0000 0.0000 0.0000
1 Afghanistan 0.5926 0.9978 1.0000 1.0000 0.9980 0.5690 1.0000
2 Albania 0.0741 0.6593 0.5574 0.8407 0.5020 0.5345 0.0000
… ………. … … … … … … …
… ………. … … … … … … …
26 Pakistan 0.5185 1.0000 0.7692 0.8555 1.0000 0.7069 0.0000
27 Poland 0.0000 0.1099 0.1115 0.4425 0.3213 0.5517 1.0000
… ………. … … … … … … …
… ………. … … … … … … …
35 Turkey 0.0741 0.4835 0.3344 0.6637 0.7430 0.7586 0.0000
36 Zambia 0.5926 0.6374 0.9142 0.2950 0.5020 0.7414 0.0000
For example, Afghanistan: female life expectancy.
△01 (1) = |𝑥0∗(1) − 𝑥1
∗(1)| = |1 − 0.4074| = 0.5926
Step 5: Grey relational co-efficient is calculated by using this formula based on values of normalized
sequence. Term 𝜉is distinguishing co-efficient between 0 and 1 the usual value of which is 0.5 in
literature.
𝛾[𝑥0∗(𝑘), 𝑥𝑖
∗(𝑘)] =∆𝑚𝑖𝑛 +𝜉Δ𝑚𝑎𝑥
𝑥0𝑖(𝑘)+𝜉Δ𝑚𝑎𝑥 , 0 < 𝛾[𝑥𝑜
∗(𝑘), 𝑥𝑖∗(𝑘)] ≤ 1 (6)
Table 6: Grey Relational Co-efficient
Sr. Country 1 2 3 4 5 6 7
0 Reference Sequence 1.0000 1.0000 1.0000 1.0000 1.0000 1.0000 1.0000
1 Afghanistan 0.4576 0.3338 0.3333 0.3333 0.3338 0.4677 0.3333
2 Albania 0.8710 0.4313 0.4729 0.3729 0.4990 0.4833 1.0000
… ………. … … … … … … …
… ………. … … … … … … …
26 Pakistan 0.4909 0.3333 0.3939 0.3689 0.3333 0.4143 1.0000
27 Poland 1.0000 0.8198 0.8177 0.5305 0.6088 0.4754 0.3333
… ………. … … … … … … …
… ………. … … … … … … …
35 Turkey 0.8710 0.5084 0.5992 0.4297 0.4023 0.3973 1.0000
36 Zambia 0.4576 0.4396 0.3536 0.6289 0.4990 0.4028 1.0000
Journal of Business and Social Review in Emerging Economies Vol. 6, No 4, December 2020
1232
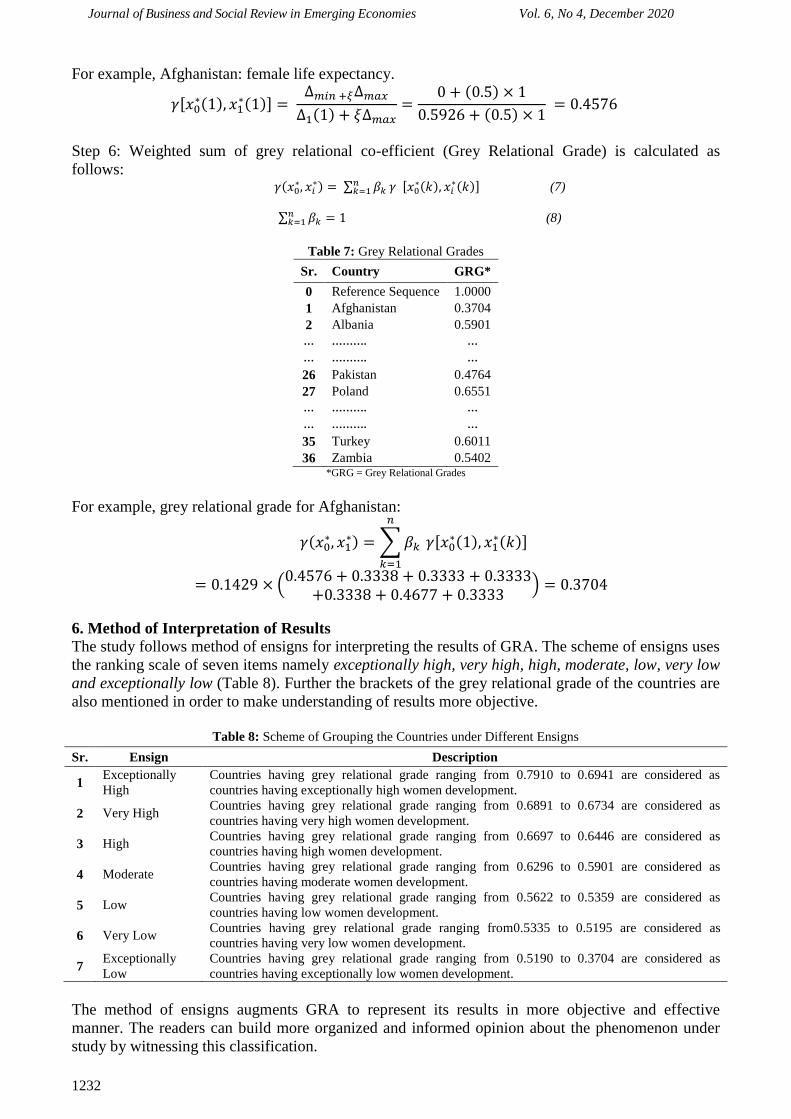
For example, Afghanistan: female life expectancy.
𝛾[𝑥0∗(1), 𝑥1
∗(1)] = ∆𝑚𝑖𝑛 +𝜉Δ𝑚𝑎𝑥
Δ1(1) + 𝜉∆𝑚𝑎𝑥=
0 + (0.5) × 1
0.5926 + (0.5) × 1 = 0.4576
Step 6: Weighted sum of grey relational co-efficient (Grey Relational Grade) is calculated as
follows: 𝛾(𝑥0
∗, 𝑥𝑖∗) = ∑ 𝛽𝑘
𝑛𝑘=1 𝛾 [𝑥0
∗(𝑘), 𝑥𝑖∗(𝑘)] (7)
∑ 𝛽𝑘𝑛𝑘=1 = 1 (8)
Table 7: Grey Relational Grades
Sr. Country GRG*
0 Reference Sequence 1.0000
1 Afghanistan 0.3704
2 Albania 0.5901
… ………. …
… ………. …
26 Pakistan 0.4764
27 Poland 0.6551
… ………. …
… ………. …
35 Turkey 0.6011
36 Zambia 0.5402 *GRG = Grey Relational Grades
For example, grey relational grade for Afghanistan:
𝛾(𝑥0∗, 𝑥1
∗) = ∑ 𝛽𝑘
𝑛
𝑘=1
𝛾[𝑥0∗(1), 𝑥1
∗(𝑘)]
= 0.1429 × (0.4576 + 0.3338 + 0.3333 + 0.3333
+0.3338 + 0.4677 + 0.3333) = 0.3704
6. Method of Interpretation of Results
The study follows method of ensigns for interpreting the results of GRA. The scheme of ensigns uses
the ranking scale of seven items namely exceptionally high, very high, high, moderate, low, very low
and exceptionally low (Table 8). Further the brackets of the grey relational grade of the countries are
also mentioned in order to make understanding of results more objective.
Table 8: Scheme of Grouping the Countries under Different Ensigns
The method of ensigns augments GRA to represent its results in more objective and effective
manner. The readers can build more organized and informed opinion about the phenomenon under
study by witnessing this classification.
Sr. Ensign Description
1 Exceptionally
High
Countries having grey relational grade ranging from 0.7910 to 0.6941 are considered as
countries having exceptionally high women development.
2 Very High Countries having grey relational grade ranging from 0.6891 to 0.6734 are considered as
countries having very high women development.
3 High Countries having grey relational grade ranging from 0.6697 to 0.6446 are considered as
countries having high women development.
4 Moderate Countries having grey relational grade ranging from 0.6296 to 0.5901 are considered as
countries having moderate women development.
5 Low Countries having grey relational grade ranging from 0.5622 to 0.5359 are considered as
countries having low women development.
6 Very Low Countries having grey relational grade ranging from0.5335 to 0.5195 are considered as
countries having very low women development.
7 Exceptionally
Low
Countries having grey relational grade ranging from 0.5190 to 0.3704 are considered as
countries having exceptionally low women development.
Journal of Business and Social Review in Emerging Economies Vol. 6, No 4, December 2020
1233
7. Results & Discussion
Results: Gauging the women development of a society is a vital issue for countries since they are
complementary wheel to the cart of economy. The issue of time to time country-wide comparative
assessment of women development is a research worthy and ever current issue. Therefore, the study
aimed to compare women development in selected thirty-six countries and evaluation of position of
that of Pakistan as against these countries. Selection of countries and variables representative to
women development have been decided on the basis of availability of the data. Technique of data
analysis is grey incidence analysis model. The study provides the deeper understanding of
phenomenon. The results of the study are represented in Table 9.
Table 9: Results of Grey Relational Analysis
Country GRG* Rank Country GRG* Rank
Reference Sequence 1 0 Sri Lanka 0.6150 18
Exceptionally High Turkey 0.6011 19
Estonia 0.7910 1 Albania 0.5901 20
Hungary 0.7208 2 Low
Slovak Republic 0.7119 3 Cambodia 0.5622 21
Thailand 0.7020 4 Montenegro 0.5596 22
Ecuador 0.6941 5 Romania 0.5570 23
Very High Zambia 0.5402 24
Namibia 0.6891 6 Myanmar 0.5359 25
Nicaragua 0.6871 7 Very Low
Bolivia 0.6856 8 Ethiopia 0.5335 26
Latvia 0.6811 9 India 0.5303 27
Dominican Republic 0.6734 10 Nepal 0.5251 28
High Ghana 0.5210 29
Serbia 0.6697 11 Bangladesh 0.5195 30
North Macedonia 0.6647 12 Exceptionally Low
Mongolia 0.6616 13 Tanzania 0.5190 31
Poland 0.6551 14 Madagascar 0.5133 32
Rwanda 0.6446 15 Cote d'Ivoire 0.4816 33
Moderate Pakistan 0.4764 34
Honduras 0.6296 16 Nigeria 0.4712 35
Bosnia and Herzegovina 0.6204 17 Afghanistan 0.3704 36
*GRG = Grey Relational Grades
The study has classified thirty-six countries of the world into seven different categories (Table 8).
From the result of GRA it can be learnt that there are five countries (namely Estonia, Hungary,
Slovak Republic, Thailand and Ecuador) categorized as countries having exceptionally high women
development. Accordingly, there are five countries under each next ensign (very high, high,
moderate, low and very low). There are six countries (namely Tanzania, Madagascar, Cote d'Ivoire,
Pakistan, Nigeria and Afghanistan) categorized under the ensign of exceptionally low. Pakistan fall
under the category of exceptionally low.
Discussion: With the objective of gauging the country level women development, the study
investigated the issue as afresh. Using the GRA, thirty-six countries have been compared on the basis
of seven variables in a composite mathematical modeling. In the multitude of variables evaluating
simultaneously in one mathematical equation is different approach form that of the contemporary
studies. The variables used in this study are different on many counts from the contemporary
literature. The study has been conducted in different context and it is tilted towards ascertainment of
women development in Pakistan qua other countries. However, the results of the study are consistent
with contemporary literature in general Table 10.
Table 10: Comparison of results of the present study with prior studies in the literature
Studies Focus of Study Variables Methodology
Current study Country level comparison
of women development
Female Life Expectancy, female account
ownership, female wage, firms with female
participation, female share of employment,
Grey incidence
analysis model

Journal of Business and Social Review in Emerging Economies Vol. 6, No 4, December 2020
1234
women in parliaments, nondiscrimination
clause in law
Sakellariou
(2004)
Gender earnings
differentials
Returns to education by gender, gender
earnings differentials Quantile regression
Jayasuriya
and Burke
(2013)
Does women political
representation affects
economic growth
Gross domestic product, per capital, women
in parliament, economic growth.
System generalized
method
Kitching et al.
(2017)
Barriers and opportunities
of female employment in
golf sport
Barriers include administration & play in “a
man’s world”, difficult to get top
position/job
Semi-structured
interview,
interpretivist approach
Islam et al.
(2018)
Nondiscrimination in law
and disempowerment of
women
Ownership, labor market barriers, access to
finance, registration of business, ownership
of property
Enterprise survey
8. Concluding Remarks
Gauging the women development of a society is a vital issue. The issue of time to time country-wide
comparative assessment of women development is a research worthy and ever current issue. This
study has compared thirty-six selected countries on the basis of indicators of women development
using grey incidence analysis model. As a result GRA has classified thirty-six countries of the world
into seven different categories. It can be learnt that there are five countries (namely Estonia,
Hungary, Slovak Republic, Thailand and Ecuador) categorized as countries having exceptionally
high women development. Accordingly, five countries under each next ensign (very high, high,
moderate, low and very low), whereas, six countries (namely Tanzania, Madagascar, Cote d'Ivoire,
Pakistan, Nigeria and Afghanistan)are categorized exceptionally low. Pakistan fall under the category
of countries having exceptionally low women development. The study contributes a country wise
grey relational grade that ranks the countries as against their rivals. This study also contributed a lot
of new information by way of aforementioned classification of countries under different ensigns. It is
designed on an original country level data extracted from very reliable source and the results of the
study are useful for regulators, researchers, NGOs and other stakeholders of the phenomenon by way
of providing deeper and new information. This study also has some limitations. Firstly, it is a
secondary data based on cross sectional study, therefore, future researches may use primary data
and/or longitudinal design. Secondly, the study uses the data set of WDI, therefore, generalizability
of the study is accordingly limited. The future researches should use different data set on similar
framework of study. Thirdly, the study used grey incidence analysis model. The results of which
must be verified with other mathematical/statistical methodologies. Fourthly, it is an analysis of
selected thirty-six countries because of the availability of data, therefore, it is suggested to extend
future studies to more countries. Lastly, we have used equal weights for the variable, future
researchers may use different weights calculating by the way of expert opinion, AHP, or Entropy
method.
References
Abend, G. (2008). The meaning of ‘theory’. Sociological theory, 26(2), 173-199.
Barrios, L. M., Prowse, A., & Vargas, V. R. (2020). Sustainable development and women's
leadership: A participatory exploration of capabilities in Colombian Caribbean fisher
communities. Journal of Cleaner Production, 264, 121277.
Bennouri, M., Chtioui, T., Nagati, H., & Nekhili, M. (2018). Female board directorship and firm
performance: What really matters?. Journal of Banking & Finance, 88, 267-291.
Chen, J., Leung, W. S., Song, W., & Goergen, M. (2019). Why female board representation matters:
The role of female directors in reducing male CEO overconfidence. Journal of Empirical
Finance, 53, 70-90.
Chen, J., Leung, W. S., & Evans, K. P. (2018). Female board representation, corporate innovation
and firm performance. Journal of Empirical Finance, 48, 236-254.
Deere, C. D., Alvarado, G. E., & Twyman, J. (2010). Poverty, headship, and gender inequality in
asset ownership in Latin America. Gender, Development and Globalization Program, Center
for Gender in Global Context, Michigan State University.
del Carmen Triana, M., Richard, O. C., & Su, W. (2019). Gender diversity in senior management,
strategic change, and firm performance: Examining the mediating nature of strategic change
in high tech firms. Research Policy, 48(7), 1681-1693.
Journal of Business and Social Review in Emerging Economies Vol. 6, No 4, December 2020
1235
Deshpande, A., Goel, D., & Khanna, S. (2018). Bad karma or discrimination? Male-female wage
gaps among salaried workers in India. World Development, 102, 331-344.
Diederen, P., van Meijl, H., & Wolters, A. (2002). Innovation and farm performance: The case of
Dutch agriculture. In Innovation and firm performance (pp. 73-85). Palgrave Macmillan,
London.
Forsyth, J. J., Jones, J., Duval, L., & Bambridge, A. (2019). Opportunities and barriers that females
face for study and employment in sport. Journal of Hospitality, Leisure, Sport & Tourism
Education, 24, 80-89.
Hamzaçebi, C., & Pekkaya, M. (2011). Determining of stock investments with grey relational
analysis. Expert Systems with Applications, 38(8), 9186-9195.
Hutchings, K., Moyle, C. L., Chai, A., Garofano, N., & Moore, S. (2020). Segregation of women in
tourism employment in the APEC region. Tourism Management Perspectives, 34, 100655.
Iqbal, S., Islam, A., Ramalho, R., & Sakhonchik, A. (2016). Unequal before the law: Measuring legal
gender disparities across the world. Women’s Studies International Forum, 71, 29-45.
Islam, A., Muzi, S., & Amin, M. (2018). Unequal Laws and the Disempowerment of Women in the
Labour Market: Evidence from Firm-Level Data. The Journal of Development Studies, 55(5),
822-844.
Jayasuriya, D. S., & Burke, P. J. (2013). Female parliamentarians and economic growth: Evidence
from a large panel. Applied Economics Letters, 20(3), 304-307.
Julong, D. (1989). Introduction to grey system theory. The Journal of grey system, 1(1), 1-24.
Kitching, N., Grix, J., & Phillpotts, L. (2017). Shifting hegemony in ‘a man’s world’: Incremental
change for female golf professional employment. Sport in Society, 20(11), 1530-1547.
Kuo, Y., Yang, T., & Huang, G. W. (2008). The use of grey relational analysis in solving multiple
attribute decision-making problems. Computers & industrial engineering, 55(1), 80-93.
Lee, J.-W., & Wie, D. (2017). Wage structure and gender earnings differentials in China and India.
World Development, 97, 313–329.
Menon, N., & Rodgers, Y. (2009). International trade and the gender wage gap: New evidence from
India’s manufacturing sector. World Development, 37(5), 965-981.
Miedema, S. S., Haardörfer, R., Girard, A. W., & Yount, K. M. (2018). Women’s empowerment in
East Africa: Development of a cross-country comparable measure. World Development, 110,
453-464.
Morgan, N., & Pritchard, A. (2019). Gender Matters in Hospitality (invited paper for ‘luminaries’
special issue of International Journal of Hospitality Management). International Journal of
Hospitality Management, 76, 38-44.
Nekhili, M., & Gatfaoui, H. (2013). Are demographic attributes and firm characteristics drivers of
gender diversity? Investigating women's positions on French boards of directors. Journal of
Business Ethics, 188(2), 227–249.
Niazi, A. A. K., Qazi, T. F., Hameed, R., & Basit, A. (2020). How They Get Stuck? Issues of
Women Entrepreneurs: An Interpretive Structural Modeling Approach. Paradigms, 14(1), 73-
80.
O'Hara, C., & Clement, F. (2018). Power as agency: A critical reflection on the measurement of
women’s empowerment in the development sector. World Development, 106, 111-123.
Oladokun, Y. O., Adenegan, K. O., Salman, K. K., & Alawode, O.O. (2018). Level of asset
ownership by women in rural North-East and South-East Nigeria. Women's Studies
International Forum, 70, 68-78.
Omair, M., Alharbi, A., Alshangiti, A., Tashkandy, Y., Alzaid, S., Almahmud, R., ... &Binhazzaa, S.
(2020). The Saudi women participation in development index. Journal of King Saud
University-Science, 32(1), 1233-1245.
Peni, E. (2014). CEO and Chairperson characteristics and firm performance. Journal of Management
and Governance, 18(1), 185-205.
Popli, G. K. (2013). Gender wage differentials in Mexico: A distributional approach. Journal of the
Royal Statistical Society: Series A (Statistics in Society), 176(2), 295-319.
Sabir, M., & Aftab, Z. (2007). Dynamism in the gender wage gap: Evidence from Pakistan. The
Pakistan Development Review, 46(4), 865-882
Journal of Business and Social Review in Emerging Economies Vol. 6, No 4, December 2020
1236
Sakellariou, C. (2004). The use of quantile regressions in estimating gender wage differentials: a case
study of the Philippines. Applied Economics, 36(9), 1001-1007.
Salahodjaev, R., & Jarilkapova, D. (2020). Women in parliament and deforestation: cross-country
evidence. Journal for Nature Conservation, 55, 125830.
Seneviratne, P. (2020). Gender wage inequality during Sri Lanka’s post-reform growth: A
distributional analysis. World Development, 129, 104878.
Shahab, Y., Ntim, C. G., Ullah, F., Yugang, C., & Ye, Z. (2020). CEO power and stock price crash
risk in China: Do female directors' critical mass and ownership structure
matter? International Review of Financial Analysis, 68, 101457.
Shinbrot, X. A., Wilkins, K., Gretzel, U., & Bowser, G. (2019). Unlocking women’s sustainability
leadership potential: Perceptions of contributions and challenges for women in sustainable
development. World Development, 119, 120-132.
Tahir, M. W., Kauser, R., Bury, M., & Bhatti, J. S. (2018, May). ‘Individually-led’or ‘female-male
partnership’ models for entrepreneurship with the BISP support: The story of women's
financial and social empowerment from Pakistan. Women's Studies International Forum, 68,
1-10.
Tayyar, N., Akcanlı, F., Genç, E., & Erem, I. (2014). Evaluating the financial performance of
companies operating in the field of informatics and technology registered in BIST by
analytical hierarchy process (AHP) and gray relational analysis (TIA) method. Accounting
and Finance Journal, 61, 19-40.
Ullah, F., Jiang, P., Shahab, Y., Li, H. X., & Xu, L. (2020). Block ownership and CEO
compensation: does board gender diversity matter? Applied Economics, 52(6), 583-597.
World Development Indicators. (2020). Retrieved April 15, 2020, from
http://wdi.worldbank.org/tables
Wu, H.H. (2002). A comparative study of using grey relational analysis in multiple attribute decision
making problems. Quality Engineering, 15(2), 209-217.
Yasmin, B. (2009). Trade liberalization and the lead role of human capital and job attributes in wage
determination: The case of Pakistans labor market. Lahore Journal of Economics, 14(1), 1-
37.
Zeb, A., & Ihsan, A. (2020). Innovation and the entrepreneurial performance in women-owned small
and medium-sized enterprises in Pakistan. Women's Studies International Forum, 79, 102342.
Zhang, S. F., Liu, S. Y., & Zhai, R. H. (2011). An extended GRA method for MCDM with interval-
valued triangular fuzzy assessments and unknown weights. Computers & Industrial
Engineering, 61(4), 1336-1341.
Zveglich Jr, J. E., van der Meulen Rodgers, Y., & Laviña, E. A. (2019). Expected work experience
and the gender wage gap: A new human capital measure. Economic Modelling, 83, 372-383.

Journal of Business and Social Review in Emerging Economies Vol. 6, No 4, December 2020
1237
Volume and Issues Obtainable at Center for Sustainability Research and Consultancy
Journal of Business and Social Review in Emerging Economies ISSN: 2519-089X (E): 2519-0326
Volume 6: No. 4, December 2020
Journal homepage: www.publishing.globalcsrc.org/jbsee
Environmental Disclosures and Environmental Management Strategies – A
Study of Pakistani Listed Companies
1Waris Ali, 2Muhammad Abdul Basit Memon, 3Muhammad Mudassar Anwar, 4Rehana
Kouser 1Associate Professor Department of Business Administration, University of Sahiwal, Sahiwal,
Pakistan, [email protected] 2Assistant Professor, Department of Business Administration, Sukkur IBA University, Sukkur,
Pakistan, [email protected] 3Assistant Professor, Department of Commerce, University of Kotli, Kotli, Pakistan,
[email protected] 4Professor, Department of Commerce, Bahauddin Zakariya University, Multan Pakistan
ARTICLE DETAILS ABSTRACT History Revised format: November 2020 Available Online: December 2020
The main purpose of this paper is to understand the
environmental disclosure by listed companies of Pakistan in the
light of legitimacy theory. Furthermore, it highlights the
environmental management strategies pursued by them. This
research used a content analysis research method to codify the
reported information in the annual reports into the environment
related themes. The data analysis results revealed that the
sampled companies appear to give little importance to
environmental issues. The companies which have disclosed
mainly reported about ‘environmental pollution’, ‘energy’, and
‘conservation of natural resources’ themes; and provided
declarative types of disclosure about them. As for as
environmental strategies are concerned only a few non-financial
companies have followed proactive environmental strategies and
made real efforts to address environmental issues. These results
seem to reflect that the companies have disclosed environment
related information in the annual reports in order to legitimize
their existence.
© 2020 Center for Sustainability Research and Consultancy Pakistan
under a Creative Commons Attribution-NonCommercial-ShareAlike
4.0
Keywords Environmental Disclosure,
Environmental Management
Strategies, Developing
Country, Legitimacy Theory
JEL Classification
M10, M14
Corresponding author’s email address: [email protected]
Recommended citation: Ali, W., Memon, M. A. B., Anwar, M. M. & Kousar, R. (2020).
Environmental Disclosures and Environmental Management Strategies – A study of Pakistani Listed
companies. Journal of Business and Social Review in Emerging Economies, 6(4), 1237-1253
1. Introduction
Since the last 30 years, the environmental impact of companies’ activities has become a matter of
great concern for various parties in a society for example environmental groups, customers, local
communities, legislators, and public authorities. The societal demands for safe and clean
environment, along with environmental regulations, have forced companies to undertake and
implement extensive environmental management programs (see Alcaraz-Quiles et al., 2014). These

Journal of Business and Social Review in Emerging Economies Vol. 6, No 4, December 2020
1238
institutional pressures have greatly influenced the large companies’ environmental disclosure and
environmental management strategies (see Brown and Deegan, 1998; Cormier and Magnan, 2003).
This paper investigates the environmental reporting practices and environmental management
strategies of listed companies of Pakistan. Environmental disclosure constitutes a part of what is
generally called Corporate Social Responsibility (CSR hereafter) disclosure. CSR disclosure is
defined as the voluntary provision of information about a corporation’s interaction with its natural
and social environment (see Guthrie and Parker 1989, Deegan and Gordon 1996, Hackston and
Milne 1996, O’Dwyer 2002). CSR disclosure has four dimensions: environment, human resources,
products and consumers, and community involvement (see Hackston and Milne, 1996; Branco and
Rodrigues, 2008). As mentioned earlier, this study focuses on environmental disclosure which
actually indicates that how an organization treats and interacts with its natural environment.
Previous disclosure studies have pointed out that the disclosure of environmental information is a
country dependent phenomenon as studies on different countries produced different results (see Gray
et al., 1995a; Islam and Deegan, 2008). This is perhaps the valid reason for presenting disclosure
results from another developing country context i.e. Pakistan. Tsang (1998) pointed out that most of
the extant literature about environmental disclosure focused on developed countries. The similar was
echoed by Newson and Deegan (2002), Belal and Momin (2009), and Fifka (2013) stating that most
of the disclosure studies focused on the experience of Australia, the United States, and the Europe.
Studies such as: Tsang (1998) have argued that developing countries are at a greater risk in
environmental areas due to the low level of interest of relevant publics in environmental issues. It is
really precarious to generalize the results of developed countries over developing countries.
Scholarships such as: Gray et al., (1996) and De-Villiers and Van-Staden (2006) have argued that
studies on social and environmental disclosure are very necessary in developing country contexts due
to the presence of multinationals in these countries. Therefore this study is set out to examine the
environmental disclosure by listed companies from a developing country context i.e. Pakistan and
also highlights the environmental management strategies pursued by them.
This research contributes to the existing literature in the following ways.
It adds to the environmental disclosure literature about the developing countries in general
and about Pakistan in particular as the academic research has identified the need for more
studies in the field of CSR disclosure in the context of other developing countries (see
Ghazali, 2007; Belal & Momin, 2009; Haji, 2013; Kansal et al., 2014).
It also contributes to the literature by highlighting the environmental management strategies
pursued by the listed companies of Pakistan as previous disclosure literature mainly focuses
on describing environmental disclosures (see Deegan and Gordon, 1996; Albertini, 2014).
It adds to the literature by examining the quality of disclosure by categorising the
environmental disclosure into general (i.e. aims and intentions indicators) and specific
categories (performance indicators). Studies that examine the quality of disclosure award
highest score to specific disclosure (see Cormier & Magnan, 2005; Bouten et al., 2011; Laan-
Smith et al., 2005; Van Staden & Hooks, 2007).
The remainder of this paper is organized as: the next section presents the literature review and the
second section describes the context of this study. The third section discusses the theoretical
framework of this research followed by its methodology. The penultimate section discusses the data
analysis results. The last section provides the discussion of results.
2. Environmental Disclosure Studies in Developing Countries
Previous studies on developing countries predominantly focused on Malaysia, South Africa, Taiwan,
and India (Amran & Devi, 2008; Haniffa & Cooke, 2005; Huang & Kuang, 2010; Singh & Ahuja,
1983) and largely reported descriptive types of disclosures (e.g. Savage, 1994; Belal & Momin,
2009; Sobhani et al., 2009; Mahadeo et al., 2011b). These studies have shown that developing
country companies are more concerned about human resource related activities than community
involvement and environment related issues (e.g. Belal, 2001; Gao et al., 2005; Haniffa & Cooke,
2005; Ratanajongkol et al., 2006). It has also been found that these companies paid considerably less
attention to environmental issues as compared to the companies in developed countries (Belal &
Journal of Business and Social Review in Emerging Economies Vol. 6, No 4, December 2020
1239
Owen, 2007; Elijido-Ten, 2009). The factors examined by the studies in developing countries fall
within the categories of company characteristics, general contextual factors and internal contextual
factors. In the company characteristics category, consistent with the developed countries, the most
commonly examined determinants are corporate size, corporate industry, and corporate financial
performance and found them to be influencing CSR disclosure (see Singh & Ahuja, 1983; Haniffa &
Cooke, 2005; Tagesson et al., 2009). In the general contextual category, consistent with the
developed countries, national contextual factors resulted in variation in CSR disclosure among the
developing countries (see Williams, 1999; Kamla, 2007; Wanderley et al., 2008). Further, CSR
reporting agenda in developing countries is derived by external forces/powerful stakeholders e.g.
international buyers (see Belal & Owen, 2007; Islam & Deegan, 2008), foreign investors (Teoh &
Thong, 1984; Belal & Owen, 2007; Khan et al., 2013; Chiu & Wang, 2014), international media
(Islam & Deegan, 2008), international regulatory bodies i.e. World Bank (see Rahaman et al., 2004),
and government regulations (see Tsang, 1998; Amran & Devi, 2007 & 2008; Huang & Kung, 2010).
Furthermore, in contrast to developed countries, corporations in developing countries perceive a little
pressure from the local public for CSR disclosure (see Belal & Owen, 2007; Belal & Cooper, 2011;
Momin & Parker, 2013). In the internal contextual factors category intention to build company image
(see Belal & Owen, 2007; Momin & Parker, 2013), cost of reporting CSR information (Mitchell &
Hill, 2009; Belal & Owen, 2007), non-availability of CSR data and a lack of motivation (De-Villiers,
2003; Mitchell & Hill, 2009) do influence CSR disclosure in developing countries.
3. Pakistani Context
Pakistan is a South Asian developing country. It is an economically weak country and facing many
social (e.g. illiteracy, unemployment, poverty and weak law enforcement etc.) and environmental
(e.g. environmental pollution and waste mismanagement etc.) problems. Every government, except
the government led by ‘Pakistan Peoples Party (PPP)’ in 1972-77, followed the principles of a
market economy and focused on industrial growth. In the last six decades (1955/56 to 2010/11)
manufacturing and the other sectors (excluding agriculture sector) of Pakistan have experienced
overall average annual growth of 6.40% and 5.50% respectively (Pakistan Bureau of Statistics,
2011). As a result, 648 large public (financial and non-financial) companies now operate in Pakistan
and are listed at different stock exchanges of Pakistan, including KSE, LSE, and ISE (SECP, 2011).
The growth in different sectors resulted in an average annual GDP growth of 4.87% in the last six
decades (Pakistan Bureau of Statistics, 2011) and resulted in an increase in GNI per capita from $340
in 1980 to $1260 in 2012. In addition to this, manufacturing and other sectors (excluding agriculture
sector) accommodate 53.35%1 of the employed persons in Pakistan (see Pakistan Bureau of
Statistics, 2011).
Despite corporations’ contribution to the national economy, some corporations have caused, among
others, various environmental problems in the country. According to SDPI (2012) 20% of the
registered industries in Pakistan are considered highly pollution intensive and creating environmental
pollution. It can also be seen from the example of leather tanneries, an export oriented industry of
Pakistan, found to be involved in polluting the water which resulted in massive protest from the local
community (see Lund-Thomsen & Nadvi, 2010). Similarly, a survey by the federal environmental
protection agency showed that leather tanneries located in Kasur and Sialkot are discharging
effluents having chrome concentration 182-222mg/litre that is much higher than the standard level of
the government i.e. 1mg/litre (PEPA, 2005a).
To govern the corporate environmental issues, the regulatory framework of Pakistan consists of
various laws. The main laws regarding the protection of the environment are the Environmental
Protection Act 1997, the Pakistan Penal Code 1860, and the Factory Act 1934. Under these rules and
regulations, certain guides and standards have been established to protect the environment, including
the control of pollution and hazardous waste. These laws are implemented by the Environmental
1 44.65% of employed persons are working in the agriculture sector of Pakistan (see Pakistan Bureau
of Statistics, 2011).

Journal of Business and Social Review in Emerging Economies Vol. 6, No 4, December 2020
1240
Protection Agency (EPA), a department working under the Ministry of Climate Change of Pakistan.
The laws mentioned above require companies, among others, to protect the environment rather than
requiring companies to disclose information about the actions taken to protect environmental rights.
The disclosure regulatory framework of Pakistan consists of the Companies Ordinance 1984, the
International Financial Reporting Standards (IFRS), the Accounting and Financial Reporting
Standards (AFRS) and the Codes of Corporate Governance (see SECP, 2014), and mainly focus on
the reporting of financial information and pays little attention to the disclosure of environmental
performance. Although the SECP has introduced a law (i.e. CSR order 2009), which requires
companies to disclose information about their CSR activities. The CSR Order 2009 only highlights
the general items which may be reported by a company to express its CSR performance in the annual
report (see CSR Order, 2009) rather than specifying the format of CSR report and indicators to be
reported by a company, as is the case in financial reporting, in order to demonstrate their
accountability to a broad stakeholders other than shareholders. This Order requires listed companies
of Pakistan to report only two items about environmental issues (see CSR Order, 2009). This
highlights that there is insufficient regulatory requirements to govern corporate environmental
disclosure in Pakistan. It has been argued that Pakistan lacks effective state mechanisms to control
environmental pollution in the country (Asian Development Bank, 2006). It has also been reported
that the Pakistani government lacks capacity (and sometime political will) for monitoring the social
and environmental performance of companies (see Lund-Thomsen et al., 2006; SDPI, 2012). The
above discussion demonstrates that the legal system of Pakistan recognises the protection of
environmental rights, but the enforcement of these laws is seen as weak in Pakistan.
In the absence of effective state mechanisms to control corporate environmental pollution various
groups (e.g. the NGOs, media, and employees etc.) in Pakistan have demanded companies to adopt
socially responsible behaviour. This may drive companies operating in Pakistan, as noted in other
developing countries such as: Bangladesh (see Islam and Deegan, 2008; Belal and Owen, 2007), to
address their associated social and environmental problems. In the increasing demands from various
groups in the society, the companies may disclose their CSR related information including
environmental disclosure in order to legitimize their continued existence.
4. Theoretical Framework
In this research both legitimacy theory and literature on environmental strategies serve as a
framework. Legitimacy theory is used to explain environmental disclosures by the listed companies
of Pakistan while the literature on environmental management strategies is used as a guide to
determine environmental strategies pursued by them. Legitimacy theory views an organization as a
part of a broader social system (under social contract see Shocker & Sethi, 1974) where an
organization has influence on and influenced by the other actors, part of the social system (see Islam
and Deegan, 2008; Reverte, 2009). To remain the part of a social system a corporation is expected to
conform to the norms, values, and beliefs of the given system (see Deegan and Unerman, 2011). A
corporation is considered as a legitimate company if the actions/practices taken by the corporation do
conform to the expectations of the society in which the firm is operating (see O’Donovan, 2002). On
the other hand, if a society’s perception about the corporation’s actions does not match with the
society’s expectations a legitimacy gap will occur (see O’Donovan, 2002) that may bring negative
consequences to that firm e.g. consumers boycott of a company’s products and/or public
demonstrations against the company and/or result in governmental fines etc. (see Deegan and
Unerman, 2011). To minimize the legitimacy gap, a company may opt different strategies for
example ‘to educate the society’, ‘to alter the society’s perceptions about the corporate activities’, ‘to
alter the society’s expectations about the corporate activities’, and ‘to divert the attention from the
main issue of concern’ (Lindblom, 1993). These strategies may be targeted to gain, maintain, or
repair legitimacy (Suchman, 1995) and each of the strategy requires disclosure of information (see
Dowling and Pfeffer 1975). Thus under this theory, CSR disclosure is considered as a tool to
conform to the expectations of the society (see Branco and Rodrigues, 2008) in order to gain,
maintain, or repair legitimacy.
Journal of Business and Social Review in Emerging Economies Vol. 6, No 4, December 2020
1241
Legitimacy can be understood in detail from a study by Suchman (1995) who identified three types
of legitimacy: pragmatic legitimacy, moral legitimacy, and cognitive legitimacy. Pragmatic
legitimacy rests on the self-interested calculations of an organization’s most immediate audience and
the immediate audience is involved in direct exchange with an organization. According to Clarkson
(1995) customers, suppliers, employees, and the local group (the government and the local
communities) are involved in transaction with the firm so these groups can be considered as a firm’s
immediate audience. Moral legitimacy relies on managerial judgment that organizational activities
are “the right thing to do” or organizational activities are promoting societal welfare (Mahadeo et al.,
2011b; Suchman, 1995). In securing moral legitimacy companies disclose pro-social activities and/or
show their alliance with social imperatives (e.g. alleviation of poverty) (Mahadeo et al., 2011b).
Further, to explain the moral legitimacy Suchman (1995) discussed sub-constructs: consequential
legitimacy (judged based on what the organization has accomplished e.g. amount of donation,
amount of pollution reduced, and amount of waste handled etc.), procedural legitimacy (based on
embraced socially accepted techniques and procedures e.g. adopting best practices to help the
needy), and structural legitimacy (based on the presence of morally accepted structural
characteristics e.g. CSR department, CSR committee, and quality control department etc.). The third
form of legitimacy is not based on interest or evaluation but based on managers’ cognition. This type
of legitimacy can be achieved through conforming to established standards and models of ethics
prevalent in that society (Mahadeo et al., 2011). Thus, from the above discussion, it can be argued
that the disclosure of different types of information by a company can be seen as an attempt to gain
pragmatic, moral, and/or cognitive legitimacy.
5. Literature on Environmental Management Strategies
To determine the environmental management strategies implemented by corporations, academic
research has presented several frameworks which mainly fall into two categories: sequential and non-
sequential approach to environmental management (Albertini, 2014). Sequential approach to
environmental management consists of several stages ranges from non-compliance to proactivity (see
Hunt and Auster, 1990; Roome, 1992). A ‘non-compliance’ strategy occurs when a company has not
developed an environmental policy at all either intentionally or by managerial default to address the
requirements of law and social pressures (Albertini, 2014). The non-compliance environmental
strategy of a corporation can be determined by the number of indicators such as environmental
penalties, accidents, or lawsuits regarding non-compliance with regulatory requirements (Thomas,
2001; Lorraine et al., 2004).
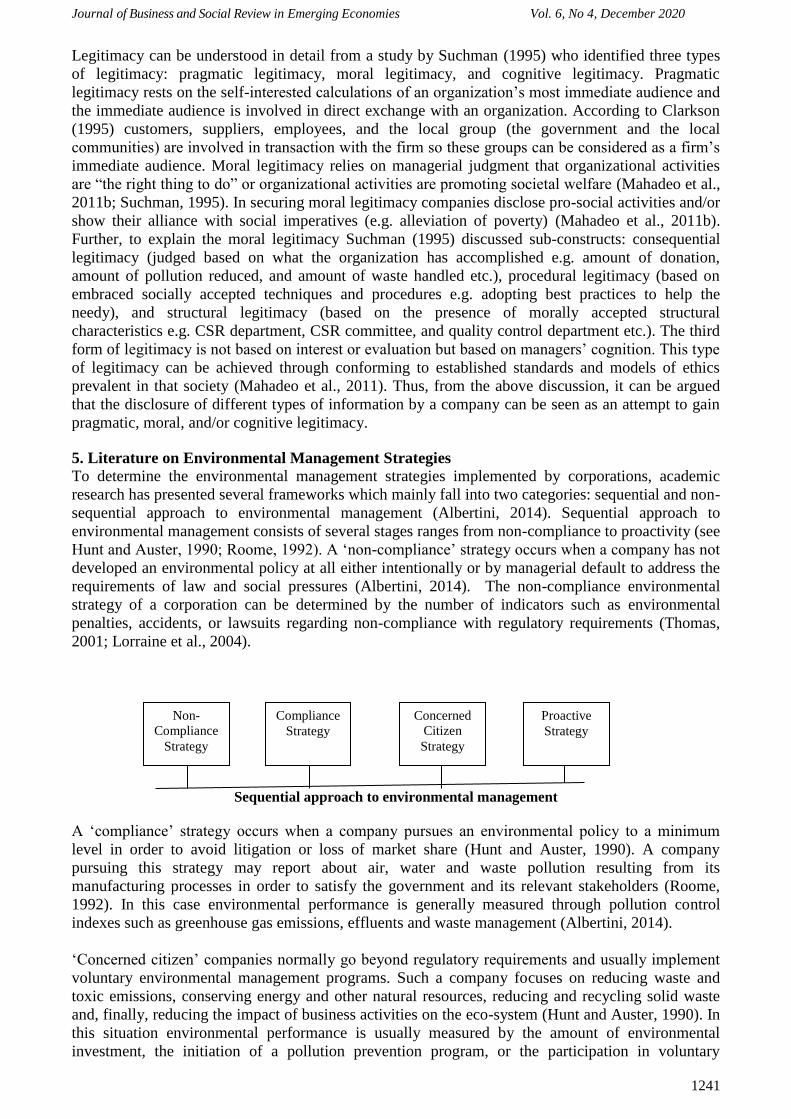
Sequential approach to environmental management
A ‘compliance’ strategy occurs when a company pursues an environmental policy to a minimum
level in order to avoid litigation or loss of market share (Hunt and Auster, 1990). A company
pursuing this strategy may report about air, water and waste pollution resulting from its
manufacturing processes in order to satisfy the government and its relevant stakeholders (Roome,
1992). In this case environmental performance is generally measured through pollution control
indexes such as greenhouse gas emissions, effluents and waste management (Albertini, 2014).
‘Concerned citizen’ companies normally go beyond regulatory requirements and usually implement
voluntary environmental management programs. Such a company focuses on reducing waste and
toxic emissions, conserving energy and other natural resources, reducing and recycling solid waste
and, finally, reducing the impact of business activities on the eco-system (Hunt and Auster, 1990). In
this situation environmental performance is usually measured by the amount of environmental
investment, the initiation of a pollution prevention program, or the participation in voluntary
Non-
Compliance
Strategy
Compliance
Strategy
Concerned
Citizen
Strategy
Proactive
Strategy

Journal of Business and Social Review in Emerging Economies Vol. 6, No 4, December 2020
1242
environmental management programs (Albertini, 2014).
A ‘proactive’ company places great emphasis on environmental management systems by focusing on
development of capabilities regarding waste minimisation and green product design (Hunt and
Auster, 1990). The implementation of such environmental management systems (EMS) is made to
enhance corporate environmental performance (Hassel et al., 2005). In this case environmental
performance can be judged by several indicators such as the proportion of output generated using
less pollution intensive processes, environmental training of employees, the number of eco-friendly
products produced, and the modification in manufacturing processes (Albertini, 2014).
In non-sequential approach to environmental performance, companies choose their environmental
commitments and pursue approaches with regard to different environmental issues at present
(Christmann and Taylor, 2002). Such a company can have an opportunistic attitude towards
environmental issues and can adopt a restrained, speculative, or conditional commitment (Albertini,
2014). In the case of opportunistic strategies, environmental performance is mostly measured by
widespread disclosure about environmental awards, cleaner practices, environmental standards, and
partnership with non-governmental organizations (Albertini, 2014). In summary environmental
management strategies pursued by companies, whether sequential or non-sequential, are reported
through CSR disclosure indictors. Despite several environmental management strategies discussed
above, Albertini (2014) has only used three strategies: compliance, opportunistic, and proactive in
order to make the analysis simple. Consistent with Albertini (2014), this research also rely on these
strategies for the analysis of environmental disclosure made by listed companies of Pakistan. As
mentioned earlier, a compliance strategy is measured by the amount of water and energy consumed,
the number of environmental penalties, the extent of waste management, and/or the amount of
effluents discharged. An opportunist strategy is measured by environmental charter or sponsorship,
environmental awards, and extra financial rating, while a proactive strategy is measured by a
proportion of output generated using less pollution intensive processes, environmental training of
employees, the number of eco-friendly products produced and the modification of manufacturing
processes.
6. Methodology
This research uses a content analysis research method to codify the reported information in the
annual reports into the environment related themes. The environmental disclosure instrument was
developed from Hackston and Milne (1996) and later on updated based on the environmental
information reported in the annual reports of thirty leading companies of Pakistan. The final
environmental disclosure instrument consists of five themes: environmental pollution control
programs, preservation of natural resources, conservation of energy, aesthetics development
programs, and other environment related information. Each theme has further three categories: aims,
actions, and performance indicators, which serve as a base for examining the quality of
environmental disclosure. Aims/ intentions category covers companies’ policies and general types of
disclosures about a theme. The action category covers activities performed by a company to
accomplish its aims/intentions. The performance category contains information about the inputs (e.g.
amount and time spent on the protection of environment etc.), the outputs (e.g. number of people
benefited and pollution reduced etc.) and the third party evidences (e.g. environmental awards and
survey results etc.) (for details see Vuontisjärvi 2006, Bouten et al., 2011). The aims and actions
categories of a theme consist of declarative types of disclosure whereas the performance category of
a theme covers both monetary and non-monetary quantitative evidences. The types of information
disclosed about a theme can be better explained by the following examples. For example: a
corporation reports that they are committed to reduce pollution and that they have installed a carbon
collection plant, worth Rs.50million, which reduced 20 tons of carbon dioxide (tCO2e). With the
help of this example, the following table explains the three types of information.
Table 1: Types of information about a theme
Example Aims/Intentions Actions Performance
Item 1 To reduce
pollution
Installation of carbon
collection plant
Reduced 20tCO2e (measured in
outcome terms) & Rs.50million

Journal of Business and Social Review in Emerging Economies Vol. 6, No 4, December 2020
1243
(measured in input term)
After the finalization of this research instrument, it was used by the two coders to code the
environment related information in the annual reports of listed companies selected into the sample.
This research selected a sample of 120 listed companies (see Table 3) by including all the companies
whose annual reports were available for the year 2011 on their respective websites or on the KSE
website. This research used Krippendorf’s Alpha statistical measure to check inter coder reliability
and the results showed convincing evidence of inter-coder reliability because all the environment
related themes have Krippendorf’s Alpha value greater than 0.851 (for interpretation see Table 2).
The discrepancies found between the two coders were later resolved through mutual discussion. The
annual reports were selected as a source of information for content analysis due to their easily
accessibility and credibility. Annual reports were also used as source of information for content
analysis in the previous disclosure studies (see Amran & Devi 2007; Belal 2001; Hackston & Milne
1996; Haniffa & Cooke 2005). One important point to mention here is that the quantity of
environmental disclosure is measured, as consistent with the previous studies (see Hackston and
Milne, 1996; Sobhani et al., 2009), by counting the number of sentences reported to express a
company’s environment related efforts.
Table 2: Krippendorff’s Alpha Value Interpretation
Table 3: The Sample Description
Description Number of companies
Manufacturing Firms: Manufacturer of textiles, chemicals, foods, non-
metallic minerals, electrical equipments, motor vehicles, trailers and semi-
trailers, refined petroleum products, basic metals, papers, pharmaceuticals,
tobacco, and rubber and plastics products
67 (55.83%)
Financial and Insurance Firms: Banks, insurance, and Modarba
companies
41 (34.17%)
Other firms: Companies involved in supplying electricity, gas, steam and
air conditioning and companies involved in transportation and storage,
extraction of crude petroleum and natural gas, telecommunications, and
construction of buildings
12 (10%)
Total Firms 120 (100%)
7. Data Analysis Results
The data analysis results revealed that 47% of the sampled companies reported about environmental
issues and they reported on average 4.94 (standard deviation 12.78) sentences. The sampled
companies gave more attention to ‘environmental pollution’ theme (28%) followed by ‘energy’
(12%), ‘conservation of natural resources’ (8%), and ‘aesthetics’ theme (4%). In addition, 39% of the
companies disclosed other environmental related information. The results indicated that the most
commonly reported indicators are: the commitment to protect the environment (38%), the intention
to abate pollution (18%), and the intention to complying with environmental rules and regulations
(14%). The results also showed that sampled companies gave relatively more attention to the aims
and actions indicators than to the performance indicators. The attention in now paid to each theme of
environmental disclosure.
Krippendorff’s Alpha Value Interpretation
<0 Poor agreement
0.0 – 0.20 Fair agreement 0.21 - 0.40 Slight agreement 0.61 – 0.80 Substantial agreement 0.81 – 1.00 Almost perfect agreement
Adopted from Seppanen (2009)
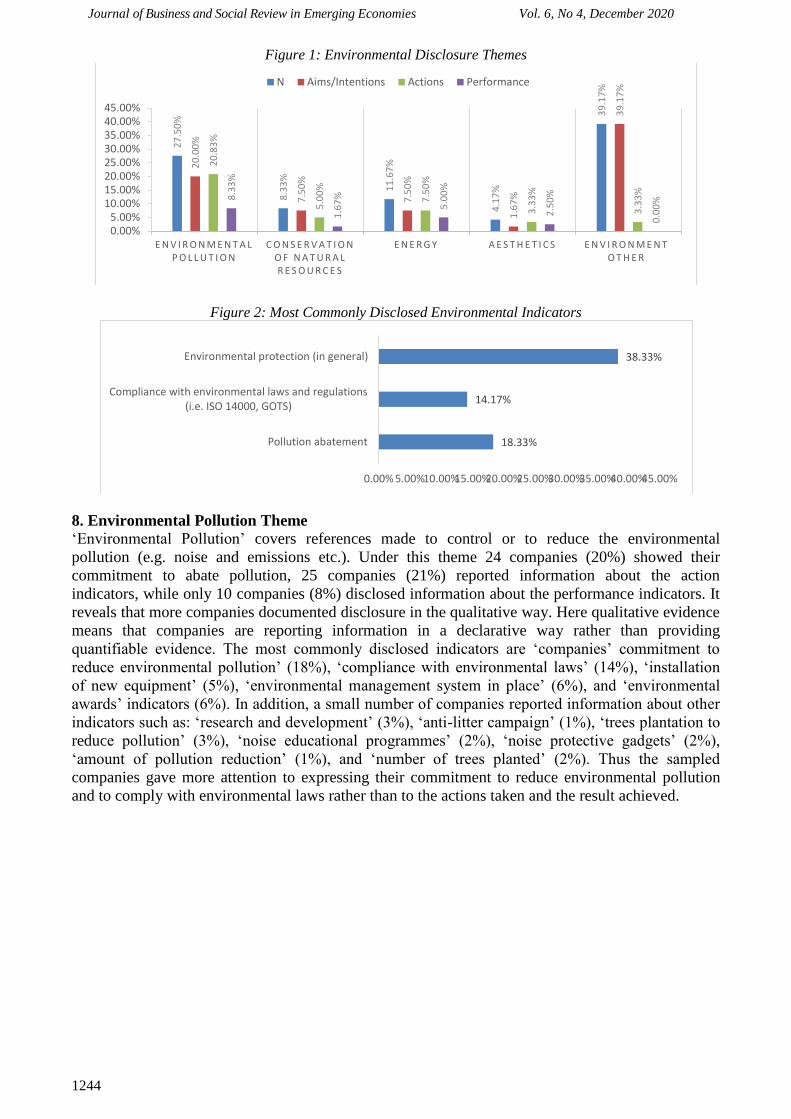
Journal of Business and Social Review in Emerging Economies Vol. 6, No 4, December 2020
1244
Figure 1: Environmental Disclosure Themes
Figure 2: Most Commonly Disclosed Environmental Indicators
8. Environmental Pollution Theme
‘Environmental Pollution’ covers references made to control or to reduce the environmental
pollution (e.g. noise and emissions etc.). Under this theme 24 companies (20%) showed their
commitment to abate pollution, 25 companies (21%) reported information about the action
indicators, while only 10 companies (8%) disclosed information about the performance indicators. It
reveals that more companies documented disclosure in the qualitative way. Here qualitative evidence
means that companies are reporting information in a declarative way rather than providing
quantifiable evidence. The most commonly disclosed indicators are ‘companies’ commitment to
reduce environmental pollution’ (18%), ‘compliance with environmental laws’ (14%), ‘installation
of new equipment’ (5%), ‘environmental management system in place’ (6%), and ‘environmental
awards’ indicators (6%). In addition, a small number of companies reported information about other
indicators such as: ‘research and development’ (3%), ‘anti-litter campaign’ (1%), ‘trees plantation to
reduce pollution’ (3%), ‘noise educational programmes’ (2%), ‘noise protective gadgets’ (2%),
‘amount of pollution reduction’ (1%), and ‘number of trees planted’ (2%). Thus the sampled
companies gave more attention to expressing their commitment to reduce environmental pollution
and to comply with environmental laws rather than to the actions taken and the result achieved.
27
.50
%
8.3
3%
11
.67
%
4.1
7%
39
.17
%
20
.00
%
7.5
0%
7.5
0%
1.6
7%
39
.17
%
20
.83
%
5.0
0%
7.5
0%
3.3
3%
3.3
3%8.3
3%
1.6
7%
5.0
0%
2.5
0%
0.0
0%
0.00%5.00%
10.00%15.00%20.00%25.00%30.00%35.00%40.00%45.00%
E N V I R O N M E N T A L P O L L U T I O N
C O N S E R V A T I O N O F N A T U R A L R E S O U R C E S
E N E R G Y A E S T H E T I C S E N V I R O N M E N T O T H E R
N Aims/Intentions Actions Performance
18.33%
14.17%
38.33%
0.00% 5.00%10.00%15.00%20.00%25.00%30.00%35.00%40.00%45.00%
Pollution abatement
Compliance with environmental laws and regulations(i.e. ISO 14000, GOTS)
Environmental protection (in general)
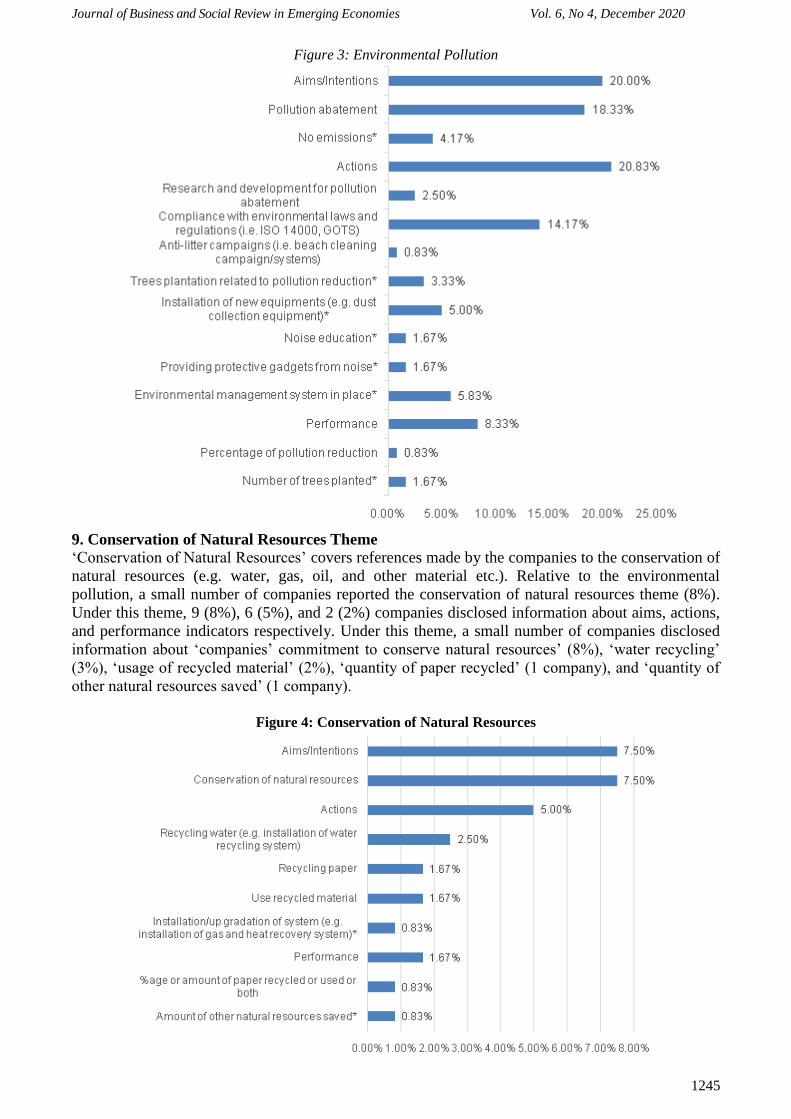
Journal of Business and Social Review in Emerging Economies Vol. 6, No 4, December 2020
1245
Figure 3: Environmental Pollution
9. Conservation of Natural Resources Theme
‘Conservation of Natural Resources’ covers references made by the companies to the conservation of
natural resources (e.g. water, gas, oil, and other material etc.). Relative to the environmental
pollution, a small number of companies reported the conservation of natural resources theme (8%).
Under this theme, 9 (8%), 6 (5%), and 2 (2%) companies disclosed information about aims, actions,
and performance indicators respectively. Under this theme, a small number of companies disclosed
information about ‘companies’ commitment to conserve natural resources’ (8%), ‘water recycling’
(3%), ‘usage of recycled material’ (2%), ‘quantity of paper recycled’ (1 company), and ‘quantity of
other natural resources saved’ (1 company).
Figure 4: Conservation of Natural Resources

Journal of Business and Social Review in Emerging Economies Vol. 6, No 4, December 2020
1246
Figure 5: Energy
10. Energy Theme
‘Energy’ theme encompasses references related to firms’ efforts to save/conserve energy and firms’
efforts for the renewable energy (e.g. wind energy and solar energy etc.). Under this theme, 9
companies (8%) reported about their commitment to conserve energy, 8 (8%) companies reported
about the actions taken by them to conserve energy, and 6(5%) companies disclosed performance
indicators. Under this theme, companies disclosed about the efficient usage of energy in
manufacturing process (2%), the usage of waste material for energy production (3%), the usage of
renewable energy (2 companies), the up-gradation of system (2 companies), the expanses made on
the energy conservation programmes (2 companies), the quantity of energy saved (3 companies), the
energy shortage awareness programmes (1 company), and the energy saving results (1 company).
11. Aesthetics Theme
‘Aesthetics’ theme covers references related to firms’ efforts to beautify the environment (broadly)
or to make the factory green (narrowly). Relative to the other environmental disclosure themes, a
small number of companies made disclosure about this theme (4%). Under this theme, the companies
reported about ‘their intention to make the factory green’ (2%), ‘the sponsorship of gardening and
flower competition’ (1 company), ‘plantation of trees’ (3 companies), and ‘number of trees planted’
(3 companies).

Journal of Business and Social Review in Emerging Economies Vol. 6, No 4, December 2020
1247
Figure 6: Aesthetics
Figure 7: Environment Other
12. ‘Environment other’ Theme
‘Environment other’ theme covers issues related to the environment, not covered by the other
environmental disclosure themes. Under this theme, a large number of companies reported about
‘their commitment to protect the environment’ (38%) and ‘the environmental awareness programmes
(e.g. earth day celebration, world environmental day) carried out by them’ (4%).
13. Environmental Disclosure and Legitimacy Theory
The data analysis results revealed that 47% of the sampled companies reported, on average, 4.94
(standard deviation 12.78) sentences about the environmental issues and mainly focused on
‘environmental pollution’, ‘energy’ theme, and ‘conservation of natural resources’ theme. The results
indicated that the maximum support was received by the commitment to protect the environment in
general (38%) followed by the intention to abate the pollution (18%), and the intention to complying
with environmental rules and regulations (14%). Contrary to the above indicators, none of the
performance indicators was supported by at least 10 companies. This indicates that the listed
companies made qualitative (or declarative) types of disclosure about the environmental issues. This
result is consistent with an environmental disclosure study conducted in South Africa, a developing
country, where the sampled listed companies made more general disclosure than specific disclosure
(see De Villiers and Van Staden, 2006). This result is also consistent with another study conducted
by Mahadeo et al. (2011b) where Mauritius, another developing country, listed companies also made
environmental disclosure in the declarative way. Some authors in the disclosure field have argued
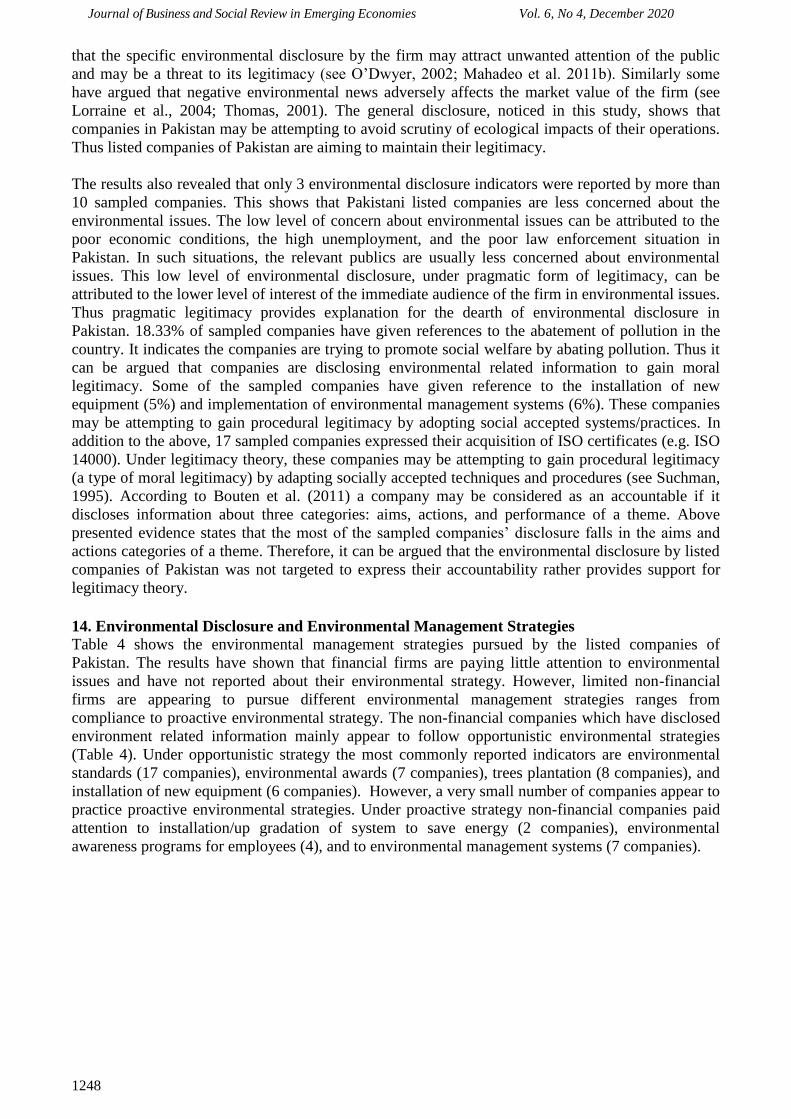
Journal of Business and Social Review in Emerging Economies Vol. 6, No 4, December 2020
1248
that the specific environmental disclosure by the firm may attract unwanted attention of the public
and may be a threat to its legitimacy (see O’Dwyer, 2002; Mahadeo et al. 2011b). Similarly some
have argued that negative environmental news adversely affects the market value of the firm (see
Lorraine et al., 2004; Thomas, 2001). The general disclosure, noticed in this study, shows that
companies in Pakistan may be attempting to avoid scrutiny of ecological impacts of their operations.
Thus listed companies of Pakistan are aiming to maintain their legitimacy.
The results also revealed that only 3 environmental disclosure indicators were reported by more than
10 sampled companies. This shows that Pakistani listed companies are less concerned about the
environmental issues. The low level of concern about environmental issues can be attributed to the
poor economic conditions, the high unemployment, and the poor law enforcement situation in
Pakistan. In such situations, the relevant publics are usually less concerned about environmental
issues. This low level of environmental disclosure, under pragmatic form of legitimacy, can be
attributed to the lower level of interest of the immediate audience of the firm in environmental issues.
Thus pragmatic legitimacy provides explanation for the dearth of environmental disclosure in
Pakistan. 18.33% of sampled companies have given references to the abatement of pollution in the
country. It indicates the companies are trying to promote social welfare by abating pollution. Thus it
can be argued that companies are disclosing environmental related information to gain moral
legitimacy. Some of the sampled companies have given reference to the installation of new
equipment (5%) and implementation of environmental management systems (6%). These companies
may be attempting to gain procedural legitimacy by adopting social accepted systems/practices. In
addition to the above, 17 sampled companies expressed their acquisition of ISO certificates (e.g. ISO
14000). Under legitimacy theory, these companies may be attempting to gain procedural legitimacy
(a type of moral legitimacy) by adapting socially accepted techniques and procedures (see Suchman,
1995). According to Bouten et al. (2011) a company may be considered as an accountable if it
discloses information about three categories: aims, actions, and performance of a theme. Above
presented evidence states that the most of the sampled companies’ disclosure falls in the aims and
actions categories of a theme. Therefore, it can be argued that the environmental disclosure by listed
companies of Pakistan was not targeted to express their accountability rather provides support for
legitimacy theory.
14. Environmental Disclosure and Environmental Management Strategies
Table 4 shows the environmental management strategies pursued by the listed companies of
Pakistan. The results have shown that financial firms are paying little attention to environmental
issues and have not reported about their environmental strategy. However, limited non-financial
firms are appearing to pursue different environmental management strategies ranges from
compliance to proactive environmental strategy. The non-financial companies which have disclosed
environment related information mainly appear to follow opportunistic environmental strategies
(Table 4). Under opportunistic strategy the most commonly reported indicators are environmental
standards (17 companies), environmental awards (7 companies), trees plantation (8 companies), and
installation of new equipment (6 companies). However, a very small number of companies appear to
practice proactive environmental strategies. Under proactive strategy non-financial companies paid
attention to installation/up gradation of system to save energy (2 companies), environmental
awareness programs for employees (4), and to environmental management systems (7 companies).
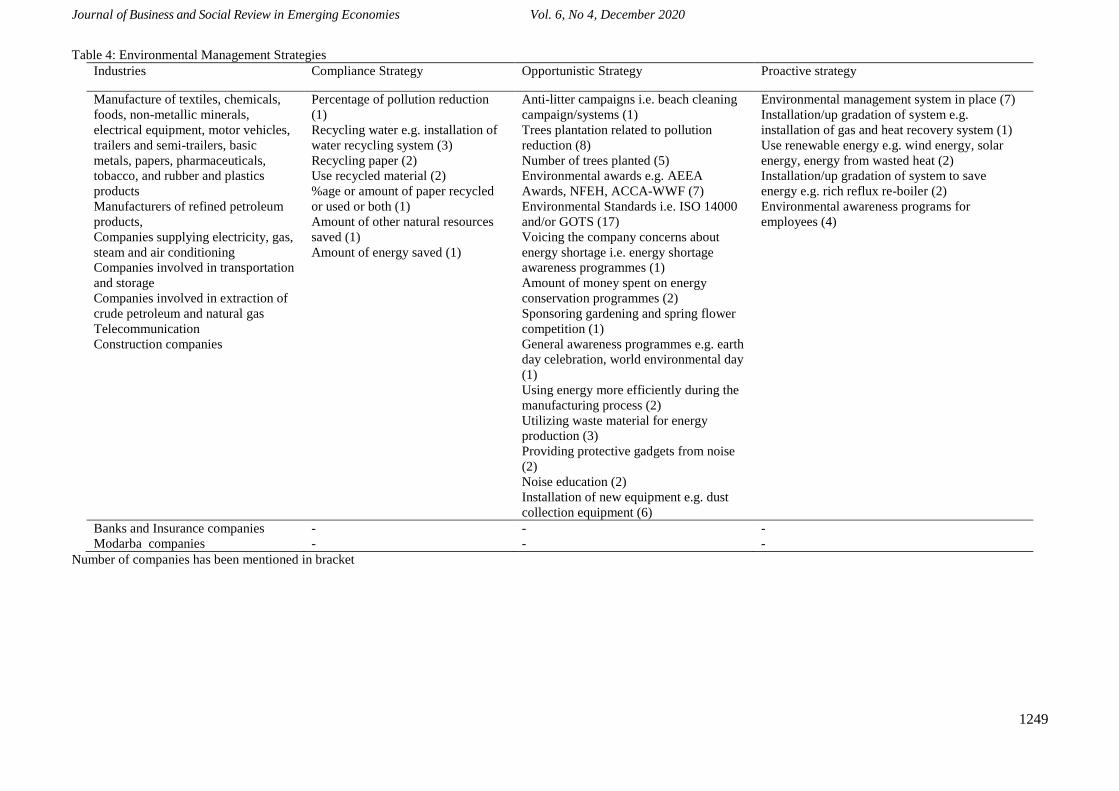
Journal of Business and Social Review in Emerging Economies Vol. 6, No 4, December 2020
1249
Table 4: Environmental Management Strategies Industries Compliance Strategy Opportunistic Strategy Proactive strategy
Manufacture of textiles, chemicals,
foods, non-metallic minerals,
electrical equipment, motor vehicles,
trailers and semi-trailers, basic
metals, papers, pharmaceuticals,
tobacco, and rubber and plastics
products
Manufacturers of refined petroleum
products,
Companies supplying electricity, gas,
steam and air conditioning
Companies involved in transportation
and storage
Companies involved in extraction of
crude petroleum and natural gas
Telecommunication
Construction companies
Percentage of pollution reduction
(1)
Recycling water e.g. installation of
water recycling system (3)
Recycling paper (2)
Use recycled material (2)
%age or amount of paper recycled
or used or both (1)
Amount of other natural resources
saved (1)
Amount of energy saved (1)
Anti-litter campaigns i.e. beach cleaning
campaign/systems (1)
Trees plantation related to pollution
reduction (8)
Number of trees planted (5)
Environmental awards e.g. AEEA
Awards, NFEH, ACCA-WWF (7)
Environmental Standards i.e. ISO 14000
and/or GOTS (17)
Voicing the company concerns about
energy shortage i.e. energy shortage
awareness programmes (1)
Amount of money spent on energy
conservation programmes (2)
Sponsoring gardening and spring flower
competition (1)
General awareness programmes e.g. earth
day celebration, world environmental day
(1)
Using energy more efficiently during the
manufacturing process (2)
Utilizing waste material for energy
production (3)
Providing protective gadgets from noise
(2)
Noise education (2)
Installation of new equipment e.g. dust
collection equipment (6)
Environmental management system in place (7)
Installation/up gradation of system e.g.
installation of gas and heat recovery system (1)
Use renewable energy e.g. wind energy, solar
energy, energy from wasted heat (2)
Installation/up gradation of system to save
energy e.g. rich reflux re-boiler (2)
Environmental awareness programs for
employees (4)
Banks and Insurance companies
Modarba companies
-
-
-
-
-
-
Number of companies has been mentioned in bracket
Journal of Business and Social Review in Emerging Economies Vol. 6, No 4, December 2020
1250
15. Discussion and Conclusion
The purpose of this article is to describe the quality of environmental disclosure and associated
environmental management strategies. The data analysis results revealed that the sampled companies
paid least attention to environmental aspects and focused on limited themes such as ‘environmental
pollution’, ‘energy conservation’, and ‘conservation of natural resources’. The mainly reported
indicators are the commitment to protect the environment in general (38%), the intention to abate the
pollution (18%), and the intention to complying with environmental rules and regulations (14%).
Contrary to the above indicators, none of the performance indicators was supported by at least 10
companies. This indicates that the listed companies made qualitative (or declarative) types of disclosure
about the environmental issues. This result is consistent with the studies conducted in other developing
countries such as South Africa, Bangladesh, and Mauritius and pointed out that listed companies have
made environmental disclosure in the declarative way (see De Villiers and Van Staden, 2006; Belal,
2001; Mahadeo et al., 2011b). This result in contrary to the studies conducted in developed countries
which point out that companies in developed countries appear to disclose both declarative and
quantitative information (see Cormier & Magnan, 2003; Cormier et al., 2005; Bouten et al., 2011). The
difference in types of disclosures can be attributed to the difference in magnitude of pressures from
various stakeholders in developed and developing countries. The same has been pointed out by the
recent research of Ali et al., (2017). They stated that developed countries companies are prone to
pressures from various internal and external stakeholders such as shareholders, investors, creditors,
regulators, environmentalists, and the media, while in developing countries CSR (environmental)
disclosure is influenced by the pressure of only external forces/powerful stakeholders such as: as
international buyers, foreign investors, international media and international regulatory bodies (e.g. the
World Bank). They also stated the companies in developing countries perceive little pressure from the
general public regarding disclosure of CSR information.
The sampled companies mainly appear to report positive information and self-laudatory in nature. This
result confirms the findings of the research where companies tend to disclose declarative or narrative
disclosure and avoid reporting negative information (Hackston and Milne, 1996). In this way
environmental disclosure seems to be a tool to maintain legitimacy (Cho and Patten, 2007; Cho et al.,
2010). Companies aiming to gain or maintain legitimacy may use communication strategies including
financial reports disclosures to influence social perceptions (Lindblom, 1994; Deegan, 2002).
Companies’ activities may affect a large number of stakeholders including shareholders, investors,
customers, employees, and government etc. A company’s long term survival depends on a firm’s ability
to legitimize its activities in the context where the company is operating. Thus, managers as a
consequence attempt to manage public impressions through positive and self-laudatory disclosures.
Focusing on the environmental management strategies, financial firms paid little attention to the
management of environmental issues. This may be attributed to low levels of pressures from various
stakeholders regarding protection of environment as financial companies are not dealing with
environmentally sensitive material. Further a small number of non-financial companies in Pakistan
followed proactive environmental management strategies thus corporations in Pakistan appear to
approach environmental problems with Band-Aid solutions despite highest media attention, huge
settlement cost for environmental claims and increased emphasis to environmental matters in the world
particularly in the developed countries. A little emphasis to proactive environmental management
strategies by corporations may be attributed to a lack of public demand for environmental management,
insufficiency of environmental regulations and weak law enforcement mechanisms in Pakistan. Recently
the incorporation of environmental management agenda into the election manifesto by the political
parties in Pakistan, particularly Pakistan Tareek-e-Insaf, has broadened the scope of corporations’
obligations. Thus it is the right time for corporation to reconsider their environmental management
efforts and to ascertain that they are fully prepared and protected. Previous scholarship have argued that
the sustainability of long-term profits requires investment in preventive environmental management
programmes and the failure to do so may leave a company at a disadvantage as compared to its

Journal of Business and Social Review in Emerging Economies Vol. 6, No 4, December 2020
1251
counterparts with better foresight (see Hunt and Auster, 1990). The previous studies have also shown
that the environmental disasters made by Shell Ltd. resulted in loss of alluring contracts regarding oil
extraction (see Deegan and Unerman, 2011). Further consumers’ repudiation of Exxon credit cards, due
to the public reaction, after the Alaskan oil spill is another example showing that how an environmental
disaster directly influenced corporate performance (Hunt and Auster, 1990). These findings suggest that
companies operating in developing countries in general and Pakistan in particular need take proactive
measures to handle environmental related issues in order to avoid future settlement cost.
This research is not free from limitations. The results of this research cannot be generalised to non-listed
companies of Pakistan as this research analyses the annual reports of listed companies only. This
research used data from the annual reports published in the year 2008 which is unable to present the
current picture of environmental management practices of listed companies of Pakistan. The research
also highlights some areas for the future research. This research mainly relies on the annual reports of
corporations published in 2008, which may give the partial picture of corporate environmental
disclosure. Thus the future research should use latest environmental disclosure data published in both the
annual reports and on corporate websites. The future research should focus on the factors influencing the
environmental disclosure. The understanding of such factors may help the policy makers to implement
environmental management programs in the country. Further, future researcher should also compare the
environmental disclosures practices of local and multinational companies. This will enable the
researchers to trace out the impact of international exposure on environmental disclosure practices.
Furthermore, they should collect the longitudinal data to determine the increase in environmental
disclosure with the passage of time. The future research should also be focused on the other dimensions
of CSR disclosure: human resource, products and consumers, and community involvement disclosure
because focusing only on the environmental disclosure gives the partial picture of corporations’ assumed
social responsibilities.
References
Albertini, E. (2014). A Descriptive Analysis of Environmental Disclosure: A Longitudinal study of
French companies. Journal of Business Ethics, 121(2), 233-254
Alcaraz-Quiles, F. J., Navarro-Galera, A., & Ortiz-Rodríguez, D. (2014). Factors influencing the
transparency of sustainability information in regional governments: An empirical study, Journal
of Cleaner Production, 82(1), 179-191.
Amran, A., & Devi, S. S. (2007). Corporate social reporting in Malaysia: A political theory perspective.
Malaysian Accounting Review, 6(1), 19-44.
Amran, A., & Devi, S. S. (2008). The impact of government and foreign affiliate influence on corporate
social reporting: The case of Malaysia. Managerial Auditing Journal, 23(4), 386-404.
Asian Development Bank. (2006). Country synthesis report on urban air quality management: Pakistan.
Philippines: Asian Development Bank and the Clean Air Initiative for Asian Cities (CAI-Asia)
Centre.
Belal, A. R. (2001). A study of corporate social disclosures in Bangladesh. Managerial Auditing Journal,
16(5), 274-289.
Belal, A. R., & Cooper, S. (2011). The absence of corporate social responsibility reporting in
Bangladesh. Critical Perspectives on Accounting, 22(7), 654-667.
Belal, A. R., & Momin, M. (2009). Corporate social reporting (CSR) in emerging economies: a review
and future direction. Research in accounting in emerging economies, 9, 119-143.
Belal, A. R., & Owen, D. L. (2007). The views of corporate managers on the current state of, and future
prospects for, social reporting in Bangladesh: An engagement-based study. Accounting, Auditing
& Accountability Journal, 20(3), 472-494.
Bouten, L., Everaert, P., Van Liedekerke, L., De Moor, L., & Christiaens, J. (2011). Corporate social
responsibility reporting: A comprehensive picture? Accounting Forum, 35(3), 187-204.
Branco, M. C., & Rodrigues, L. L. (2008). Factors influencing social responsibility disclosure by
Portuguese companies. Journal of Business Ethics, 83(4), 685-701.

Journal of Business and Social Review in Emerging Economies Vol. 6, No 4, December 2020
1252
Brown, N., & Deegan, C. (1998). The public disclosure of environmental performance information—a
dual test of media agenda setting theory and legitimacy theory. Accounting and Business
Research, 29(1), 21-41.
Chiu, T., & Wang, Y. (2014). Determinants of social disclosure quality in Taiwan: An application of
stakeholder theory. Journal of Business Ethics, 121(1), 1-20.
Christmann, P., & Taylor, G. (2002). Globalization and the environment: Strategies for international
voluntary environmental initiatives. Academy of Management Executive, 16(3), 121–135.
Clarkson, M. E. (1995). A stakeholder framework for analyzing and evaluating corporate social
performance. Academy of Management Review, 20(1), 92-117.
Cormier, D., & Magnan, M. (2003). Environmental reporting management: A continental European
perspective. Journal of Accounting and Public Policy, 22(1), 43–62.
Cormier, D., Magnan, M., & Van Velthoven, B. (2005). Environmental disclosure quality in large
German companies: Economic incentives, public pressures or institutional conditions? European
Accounting Review, 14(1), 3-39.
Cowen, S. S., Ferreri, L. B., & Parker, L. D. (1987). The impact of corporate characteristics on social
responsibility disclosure: A typology and frequency-based analysis. Accounting, Organizations
and society, 12(2), 111-122.
CSR Order. (2009). Companies (Corporate Social Responsibility) General Order, 2009 by Securities and
Exchange Commission of Pakistan
De Villiers, C. J. (2003). Why do South African companies not report more environmental information
when managers are so positive about this kind of reporting?. Meditari Accountancy Research,
11(1), 11-23.
De Villiers, C., & Van Staden, C. J. (2006). Can less environmental disclosure have a legitimising
effect? Evidence from Africa. Accounting, Organizations and Society, 31(8), 763-781.
Deegan, C., & Gordon, B. (1996). A study of the environmental disclosure practices of Australian
corporations. Accounting and business research, 26(3), 187-199.
Deegan, C., & Unerman, J. (2011). Financial accounting theory (2nd ed.). London: McGraw-Hill.
Deegan, C., Rankin, M., & Voght, P. (2000). Firms' disclosure reactions to major social incidents:
Australian evidence. Accounting Forum, 24(1), 101-130.
Dowling, J., & Pfeffer, J. (1975). Organizational legitimacy social values and organizational behaviour.
Pacific Sociological Review, 18(1), 122-136.
Elijido-Ten, E. (2009). Can stakeholder theory add to our understanding of Malaysian environmental
reporting attitudes? Malaysian Accounting Review, 8(2), 85-110.
Fifka, M. S. (2013). Corporate Responsibility Reporting and its Determinants in Comparative
Perspective–a Review of the Empirical Literature and a Meta‐analysis. Business Strategy and the
Environment, 22(1), 1-35.
Gao, S. S., Heravi, S., & Xiao, J. Z. (2005). Determinants of corporate social and environmental
reporting in Hong Kong: A research note. Accounting Forum, 29(2), 233-242.
Ghazali, N. A. (2007). Ownership structure and corporate social responsibility disclosure: some
Malaysian evidence. Corporate Governance: The international journal of business in
society, 7(3), 251-266.
Gray, R., Kouhy, R., & Lavers, S. (1995). Corporate social and environmental reporting: a review of the
literature and a longitudinal study of UK disclosure. Accounting, Auditing & Accountability
Journal, 8(2), 47-77.
Gray, R., Kouhy, R., & Lavers, S. (1995a). Corporate social and environmental reporting: A review of
the literature and a longitudinal study of UK disclosure. Accounting, Auditing & Accountability
Journal, 8(2), 47-77.
Gray, R., Owen, D., & Adams, C. (1996). Accounting and accountability: Changes and challenges in
corporate social and environmental reporting. London: Prentice-Hall.
Guthrie, J., & Parker, L. D. (1989). Corporate social reporting: A rebuttal of legitimacy theory.
Accounting & Business Research, 19(76), 343-352.
Hackston, D., & Milne, M. J. (1996). Some determinants of social and environmental disclosures in
Journal of Business and Social Review in Emerging Economies Vol. 6, No 4, December 2020
1253
New Zealand companies. Accounting, Auditing & Accountability Journal, 9(1), 77-108.
Haji, A. A. (2013). Corporate social responsibility disclosures over time: Evidence from Malaysia.
Managerial Auditing Journal, 28(7), 647-676.
Halme, M., & Huse, M. (1997). The influence of corporate governance, industry and country factors on
environmental reporting. Scandinavian Journal of Management, 13(2), 137-157.
Haniffa, R. M., & Cooke, T. E. (2005). The impact of culture and governance on corporate social
reporting. Journal of Accounting & Public Policy, 24(5), 391-430.
Hassel, L., Nilson, H., & Nyquist, S. (2005). The value relevance of environmental performance.
European Accounting Review, 14(1), 41–61.
Huang, C., & Kung, F. (2010). Drivers of environmental disclosure and stakeholder expectation:
Evidence from Taiwan. Journal of Business Ethics, 96(3), 435-451.
Hunt, C. B., & Auster, E. R. (1990). Proactive environmental management: Avoiding the toxic trap.
Sloan Management Review, 31(2), 7–18.
Islam, M. A., & Deegan, C. (2008). Motivations for an organisation within a developing country to
report social responsibility information. Accounting, Auditing & Accountability Journal, 21(6),
850-874.
Kamla, R. (2007). Critically Appreciating Social Accounting and Reporting in the Arab Middle East: A
Postcolonial Perspective. Advances in International Accounting, 20(1), 105-177.
Kansal, M., Joshi, M., & Batra, G. S. (2014). Determinants of corporate social responsibility disclosures:
Evidence from India. Advances in Accounting, 30(1), 217-229.
Khan, A., Muttakin, M. B., & Siddiqui, J. (2013). Corporate governance and corporate social
responsibility disclosures: Evidence from an emerging economy. Journal of business
ethics, 114(2), 207-223.
Laan Smith, J., Adhikari, A., & Tondkar, R. H. (2005). Exploring differences in social disclosures
internationally: A stakeholder perspective. Journal of Accounting and Public Policy, 24(2), 123-
151.
Lindblom, C. K. (1993). The implications of organizational legitimacy for corporate social performance
and disclosure. Critical Perspectives on Accounting Conference, New York.
Lorraine, N. H., Collison, D. J., & Power, D. M. (2004). An analysis of the stock market impact of
environmental performance information. Accounting Forum, 28(1), 7–26.
Lund-Thomsen, P., & Nadvi, K. (2010). Global value chains, local collective action and corporate social
responsibility: A review of empirical evidence. Business Strategy and the Environment, 19(1), 1-
13.
Lund-Thomsen, P., Mansur, A., & Lotia, H. (2006). Corporate social responsibility and sustainability of
donor-financed interventions in the south: The case of Pakistan. Corporate Citizenship in
Developing Countries, Copenhagen Business School Press, Copenhagen
Mahadeo, J. D., Oogarah-Hanuman, V., & Soobaroyen, T. (2011b). Changes in social and
environmental reporting practices in an emerging economy (2004–2007): Exploring the
relevance of stakeholder and legitimacy theories. Accounting Forum, 35(3), 158-175.
Mahadeo, J., Oogarah-Hanuman, V., & Soobaroyen, T. (2011). A longitudinal study of corporate social
disclosures in a developing economy. Journal of Business Ethics, 104(4), 545-558.
Mitchell, C. G., & Hill, T. (2009). Corporate social and environmental reporting and the impact of
internal environmental policy in South Africa. Corporate Social Responsibility and
Environmental Management, 16(1), 48-60.
Newson, M., & Deegan, C. (2002). Global expectations and their association with corporate social
disclosure practices in Australia, Singapore, and South Korea. The International Journal of
Accounting, 37(2), 183-213.
O’Donovan, G. (2002). Environmental disclosures in the annual report: Extending the applicability and
predictive power of legitimacy theory. Accounting, Auditing & Accountability Journal, 15(3),
344-371.
O'Dwyer, B. (2002). Managerial perceptions of corporate social disclosure: An Irish story. Accounting,
Auditing & Accountability Journal, 15(3), 406-436.
Journal of Business and Social Review in Emerging Economies Vol. 6, No 4, December 2020
1254
Pakistan Bureau of Statistics. (2011). Pakistan statistical year book 2011. Islamabad: Government of
Pakistan.
PEPA. (2005a). Brief of environmental concerns-Pakistan scenario. Islamabad: Pakistan Environmental
Protection Agency.
Rahaman, A. S., Lawrence, S., & Roper, J. (2004). Social and environmental reporting at the VRA:
Institutionalised legitimacy or legitimation crisis? Critical Perspectives on Accounting, 15(1),
35-56.
Ratanajongkol, S., Davey, H., & Low, M. (2006). Corporate social reporting in Thailand: The news is all
good and increasing. Qualitative Research in Accounting & Management, 3(1), 67-83.
Reverte, C. (2009). Determinants of corporate social responsibility disclosure ratings by Spanish listed
firms. Journal of Business Ethics, 88(2), 351-366.
Roome, N. (1992). Developing environmental management strategy. Business Strategy and the
Environment, 1(1), 11–24.
Savage, A. A. (1994). Corporate social disclosure practices in South Africa: A research note. Social and
Environmental Accounting, 14(1), 2–4.
SDPI (2012). Environmental challenges and constraints to policy issues for sustainable industrial
development in Pakistan. Islamabad, Pakistan: Sustainable Development Policy Institute.
SECP. (2011). Securities and Exchange Commission of Pakistan annual report 2011. Karachi, Pakistan:
Securities and Exchange Commission of Pakistan.
SECP. (2014). The company law division: Securities and exchange commission of pakistan. Retrieved
February 14, 2014, Retrieved from http://www.secp.gov.pk/CLD/cld_index.asp
Seppanen, M. (2009). Empirical classification of resources in a business model concept. Intangible
Capital, 5(2), 102-124.
Shocker, A., & Sethi, S. (1974). An approach to incorporating social preferences in developing
corporate action strategies, in Sethi, S. P. (ed.) the unstable ground: Corporate social policy in a
dynamic society. Melville: California. pp 67-80.
Singh, D. R., & Ahuja, J. M. (1983). Corporate social reporting in India. The International Journal of
Accounting, 18(2), 151-169.
Sobhani, F. A., Amran, A., & Zainuddin, Y. (2009). Revisiting the practices of corporate social and
environmental disclosure in Bangladesh. Corporate Social Responsibility & Environmental
Management, 16(3), 167-183.
Suchman, M. C. (1995). Managing legitimacy: Strategic and institutional approaches. Academy of
Management Review, 20(3), 571-610.
Tagesson, T., Blank, V., Broberg, P., & Collin, S. (2009). What explains the extent and content of social
and environmental disclosures on corporate websites: A study of social and environmental
reporting in Swedish listed corporations? Corporate Social Responsibility & Environmental
Management, 16(6), 352-364.
Thomas, A. (2001). Corporate environmental policy and abnormal stock price returns: An empirical
investigation. Business Strategy and the Environment, 10(3), 125–134.
Tsang, E. W. (1998). A longitudinal study of corporate social reporting in Singapore: The case of the
banking, food and beverages and hotel industries. Accounting, Auditing & Accountability
Journal, 11(5), 624-635.
Van Staden, C. J., & Hooks, J. (2007). A comprehensive comparison of corporate environmental
reporting and responsiveness. British Accounting Review, 39(3), 197-210.
Vuontisjärvi, T. (2006). Corporate social reporting in the European context and human resource
disclosures: An analysis of Finnish companies. Journal of Business Ethics, 69(4), 331-354.
Wanderley, L., Lucian, R., Farache, F., & Sousa Filho, J. (2008). CSR information disclosure on the
web: A context-based approach analysing the influence of country of origin and industry sector.
Journal of Business Ethics, 82(2), 369-378.
Williams, S. M. (1999). Voluntary environmental and social accounting disclosure practices in the Asia-
Pacific region: An international empirical test of political economy theory. The International
Journal of Accounting, 34(2), 209-238.

Journal of Business and Social Review in Emerging Economies Vol. 6, No 4, December 2020
1255
Volume and Issues Obtainable at Center for Sustainability Research and Consultancy
Journal of Business and Social Review in Emerging Economies ISSN: 2519-089X (E): 2519-0326
Volume 6: No. 4, 2020
Journal homepage: www.publishing.globalcsrc.org/jbsee
Parental Satisfaction and Involvement in the Provision of Early Childhood Special
Education to their Young Children with Deafness
1Ghulam Fatima, 2Misbah Malik, 3Samina Ashraf,
1Associate Professor, Institute of Education and Research, University of the Punjab, Lahore-Pakistan
[email protected] 2Assistant Professor, Institute of Education and Research, University of the Punjab, Lahore-Pakistan
[email protected] 3Assistant Professor, Department of Special Education, University of the Punjab, Lahore-Pakistan
ARTICLE DETAILS ABSTRACT History Revised format: November 2020 Available Online: December 2020
This qualitative study was planned to investigate into parental
satisfaction and engagement in the availability of Early Childhood
Special Education (ECSE) to their deaf young children studying in
Govt. Deaf and Defective Hearing Schools (GDDHS) in Punjab,
Pakistan. The parents of 989 deaf young children constituted the
population of study. A representative sample of parents of eighty-two
children who gave their consent to participate in the study was taken
from ten schools at district level located in four zones of the Punjab. A
semi structured and open ended interview protocol consisting of three
parts (Part 1=Demographic information about children and their
parents, Part 2= Parental Contentment, Part 3= Engagement of
parents) was employed. The interviews were recorded on audio tape,
Afterwards, transcription was made and codes were assigned.
Thematic analysis was done and data was presented in tabulated form.
Frequencies were run. Major findings showed that majority of parents
were not contented with speech, speech reading, and reading
identification skills in their children. Majority of them were not
involved in teaching to their children due to being illiterate. They had
no guidance about teaching to their young deaf children. On the basis
of results, suggestions to Punjab Special Education Department were
made. © 2020 Center for Sustainability Research and Consultancy Pakistan under a
Creative Commons Attribution-NonCommercial-ShareAlike 4.0
Keywords Parents, satisfaction, parental
involvement, ECSE, deaf
young children
JEL Classification
M12, M14
Corresponding author’s email address: [email protected]
Recommended citation: Fatima, G., Malik, M. & Ashraf, S. (2020). Parental Satisfaction and
Involvement in the Provision of Early Childhood Special Education to their Young Children with
Deafness. Journal of Business and Social Review in Emerging Economies, 6(4), 1255-1266
1. Introduction
Since the decade of 1960, there has been a growing notion about the difficulties and challenges that
children with special needs have during the early years of life. Much emphasis has been placed upon the
first few years of life as a critical period and time for great learning to take place. During the late 1950s

Journal of Business and Social Review in Emerging Economies Vol. 6, No 4, December 2020
1256
and early 1960s, pioneer efforts (Bloom, 1964; Kirk, 1958) gave birth to the idea that external
experiential and environmental factors could greatly influence and enhance the course of a child’s
development. In 1965, the national Head Start Program created a new public focus on the importance of
early education. Head Start was created on the sound foundations of civil rights advocacy and on
untiring efforts of US public and private sector institutions working on early childhood education
programs. President Lyndon B. Johnson takes its credit for his endeavours on War on Poverty in 1960.
He declared the formation of Head Start in a special message to Congress on 12th January, 1965. His
main concern was on the development of early childhood education programs to educate the
disadvantaged children early (Hinitz, 2014; Fatima, 2015). Head Start proved a milestone in preschool
education. For the first time large numbers of young children were exposed to mass screening programs
that had the potential for identifying and perhaps remediating problems at an early age (Hinitz, 2014;
Caldwell, 1973). Pakistan came into being on August 14, 1947. The significance of early years
education for special need children in Pakistan was recognized in The Pakistan Educational Conference
(1947) in the following words: “Children between the ages of 3 and 6 needed attention in special
schools. Government might give a lead in opening a few pre-primary schools, their provision should be
left mainly to private agencies (p.20).”
The following education policies consisting Report of the Commission on National Education (1959,
Chapter: 16, pp.257-259), and National Education Policy and Implementation Programme (1979, p.28-
29) stressed on the training and education of special need children. In coming years, National Policy for
Persons with Disabilities (2002) clearly stressed the equivalent rights, prospects, and availability of
medical, educational, social, psychological, vocational education, employability, and placement of
special persons without any discrimination. It is also commendable that the training and education of
parents and communities to recognize special needs of persons with disabilities was focused. Unluckily,
much attention was not paid on educating and training the parents of special need children. National
Plan of Action (2006) laid emphasis on urgent identification of special needs and delivery of early
services of intervention to young special need children. The term Early Childhood Development (ECD)
was used in this regard. National Education Policy (2009) clearly acknowledged the significance of early
years. It mandated “one-year pre-primary education for all children between 3-5 years of age and two
year specialised training for teachers in dealing with young children”. The National Education Policy
(1998-2010) openly declared “kachi” as the initial class in schools of primary education, but due to non-
availability of facilities, and services, this project has not been materialised so far (Abidi, 2015; Fatima,
2015).
Globally speaking, involvement of parents of children with deafness in the programs of early
intervention, and early education in schools is greatly supported and appreciated. Parent and family
focused approaches and models (Kirkwood, 2016; Calderon &Greenberg, 1997; Roush &Matkin, 1994)
are being used on a large scale. The Individuals with Disabilities Education Act (IDEA), reauthorized in
1997, authorizes parents to get involved in the process of decision-making in their child’s education. The
parents are encouraged to take active part not only in the educational planning but also in placement
related decisions for their children with special needs. Congress also emphasized to conduct joint parent-
professional training to clarify the roles of all stake holders in the education of children (Margolis,
1998). Many researches on parental involvement with children with special needs have also highlighted
that parents play an indispensible role in the teaching of academic, language, motor, social, and
vocational skills (Innocenti& Taylor, 1998;Leyser, 1985). Calderon and Greenberg (1993) investigated
that child’s functioning is expressively influenced by functioning of mothers and coping strategies.
These findings were supported by the ratings of objective teachers. Children of parents having better
skills in problem solving were rated by teachers as better adjusted and more capable than children of
parents with poor problem solving skills. Additionally, socio economic status of parents regarding their
children’s education and communication needs was positively correlated with the reading achievement
of their children. Musselman and Kircaali-Iftar (1996) studied the spoken language development of 20
children with deafness. Out of 20, 10 children were having unpredictably high spoken language skills,
Journal of Business and Social Review in Emerging Economies Vol. 6, No 4, December 2020
1257
and 10 were with unpredictably low spoken language scores relative to the background and training. A
number of variables were consistent with higher spoken language skills, and, one of them was direct
instruction by parents. Collected data exhibited that parents having children with high spoken language
skills conceived deafness as a challenge to be defeated. Contrary to this, parents having children with
low spoken language skills might have viewed it as a disparity to be adjusted. The authors concluded
that aspects of family functioning work together with other educational interventions to affect their
child’s development.
2. Rationale of the Study
A considerable research is available on poor reading, writing, mathematical skills in students with
deafness (Akhtar&Inam, 2005 ;Galaudet Research Institute, 2005; Wahid &Ishfaq, 2000;Stinson &
Walter, 1997). Moreover, the skills of speech, and speech reading in young children are also not
developed despite attending deaf schools for many years (Parveen, 2007; Latif&Watto, 2005; Hart
&Risley, 1995). Ultimately, persons with deafness are unemployed, or under employed (Ahmed
&Rehman, 2006;Blanchfield, Feldman, Dunbar, &Gardner, 2001; MacLeod-Gallinger, 1992;
Schreodel& Geyer, 2000). Keeping in view the graveness of problem, it was conceived to find the root
causes in ECSE program being run in Government Deaf & Defective Hearing Schools in Punjab.
3. Objectives of the Study
Parents, being the most important stake holders, were considered to have share in the emergence of the
problem. In connection to this, present study was conducted to have a look into parental satisfaction and
involvement in the provision of ECSE to their deaf young children.
4. Questions of the Study
The following questions were sought by the study:
1. What is the satisfaction level of parents with the provision of ECSE to their deaf young children?
2. To what extent the parents are involved in providing ECSE to their deaf young children?
3. What measures can be taken for the improvement of ECSE program?
4. How can the involvement of parents in the provision of ECSE be increased?
5. Method
5.1 Design and Procedure
It was a qualitative study in nature as data were collected by conducting interviews with the parents of
deaf young children. The population of study included the parents of all 989 deaf young children
studying in 34 Government Deaf & Defective Hearing Schools established in 31 districts in the Punjab.
5.2 Participants
A sample of parents of 82 deaf young children, who confirmed their attendance on the scheduled date
and day, was taken from 10 districts (Lahore, Gujranwala, Gujrat, Jhelum, Sialkot, MuzaffarGarh, Dera
Ghazi Khan, ,Rawalpindi, Mianwali, and Sahiwal) in four zones of the Punjab province.
6. Instrumentation
An interview protocol consisting of three parts: (Part 1: demographics of parents and children; Part 2:
questions on parental satisfaction; Part 3: questions on parental involvement) was developed. Six aspects
of ECSE for deaf young children i.e. speech, speech reading, reading recognition, writing, mathematics,
parental guidance and counselling were included in the interview protocol on the basis of literature
review. Part 1 included description about sample districts, children, parents, their age, qualification,
profession, number of children with deafness, and monthly income. Part 2 comprised eight open- ended
questions. Part 3 including five open-ended questions was about parents’ own involvement in and
contribution to the development of their deaf young children. The validity of the instrument was assured
by taking opinions of five experts in deaf field.
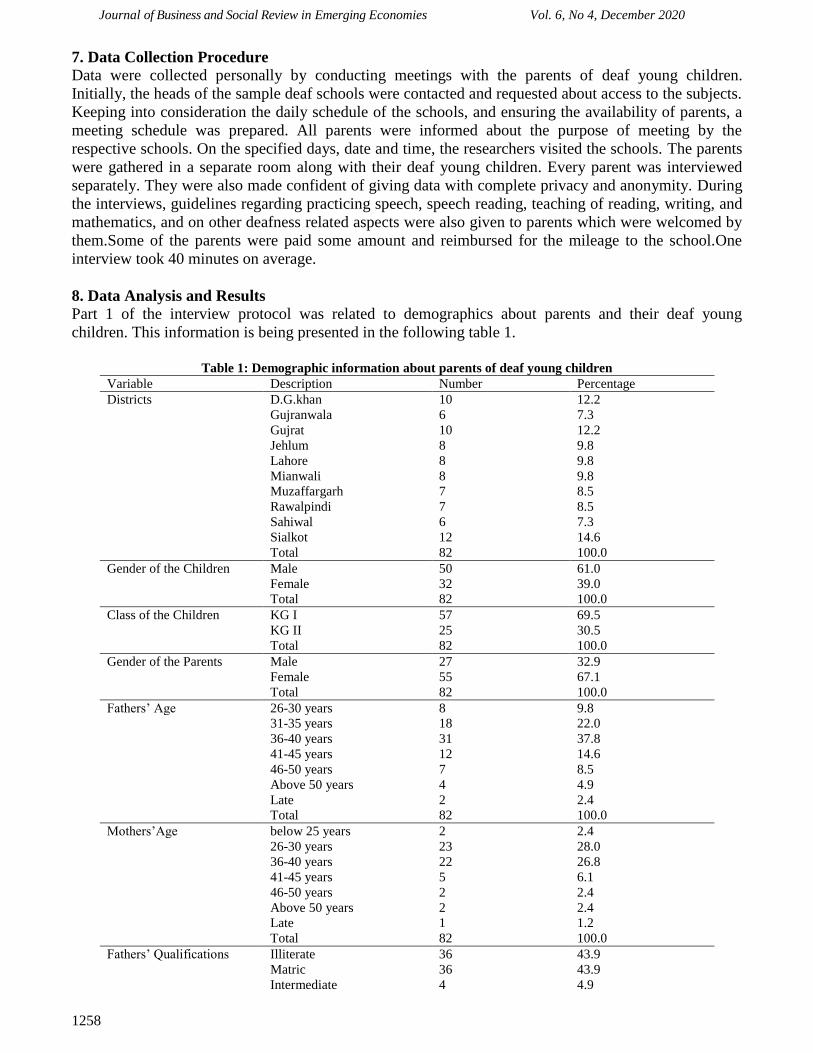
Journal of Business and Social Review in Emerging Economies Vol. 6, No 4, December 2020
1258
7. Data Collection Procedure
Data were collected personally by conducting meetings with the parents of deaf young children.
Initially, the heads of the sample deaf schools were contacted and requested about access to the subjects.
Keeping into consideration the daily schedule of the schools, and ensuring the availability of parents, a
meeting schedule was prepared. All parents were informed about the purpose of meeting by the
respective schools. On the specified days, date and time, the researchers visited the schools. The parents
were gathered in a separate room along with their deaf young children. Every parent was interviewed
separately. They were also made confident of giving data with complete privacy and anonymity. During
the interviews, guidelines regarding practicing speech, speech reading, teaching of reading, writing, and
mathematics, and on other deafness related aspects were also given to parents which were welcomed by
them.Some of the parents were paid some amount and reimbursed for the mileage to the school.One
interview took 40 minutes on average.
8. Data Analysis and Results
Part 1 of the interview protocol was related to demographics about parents and their deaf young
children. This information is being presented in the following table 1.
Table 1: Demographic information about parents of deaf young children
Variable Description Number Percentage
Districts D.G.khan 10 12.2
Gujranwala 6 7.3
Gujrat 10 12.2
Jehlum 8 9.8
Lahore 8 9.8
Mianwali 8 9.8
Muzaffargarh 7 8.5
Rawalpindi 7 8.5
Sahiwal 6 7.3
Sialkot 12 14.6
Total 82 100.0
Gender of the Children Male 50 61.0
Female 32 39.0
Total 82 100.0
Class of the Children KG I 57 69.5
KG II 25 30.5
Total 82 100.0
Gender of the Parents Male 27 32.9
Female 55 67.1
Total 82 100.0
Fathers’ Age 26-30 years 8 9.8
31-35 years 18 22.0
36-40 years 31 37.8
41-45 years 12 14.6
46-50 years 7 8.5
Above 50 years 4 4.9
Late 2 2.4
Total 82 100.0
Mothers’Age below 25 years 2 2.4
26-30 years 23 28.0
36-40 years 22 26.8
41-45 years 5 6.1
46-50 years 2 2.4
Above 50 years 2 2.4
Late 1 1.2
Total 82 100.0
Fathers’ Qualifications Illiterate 36 43.9
Matric 36 43.9
Intermediate 4 4.9
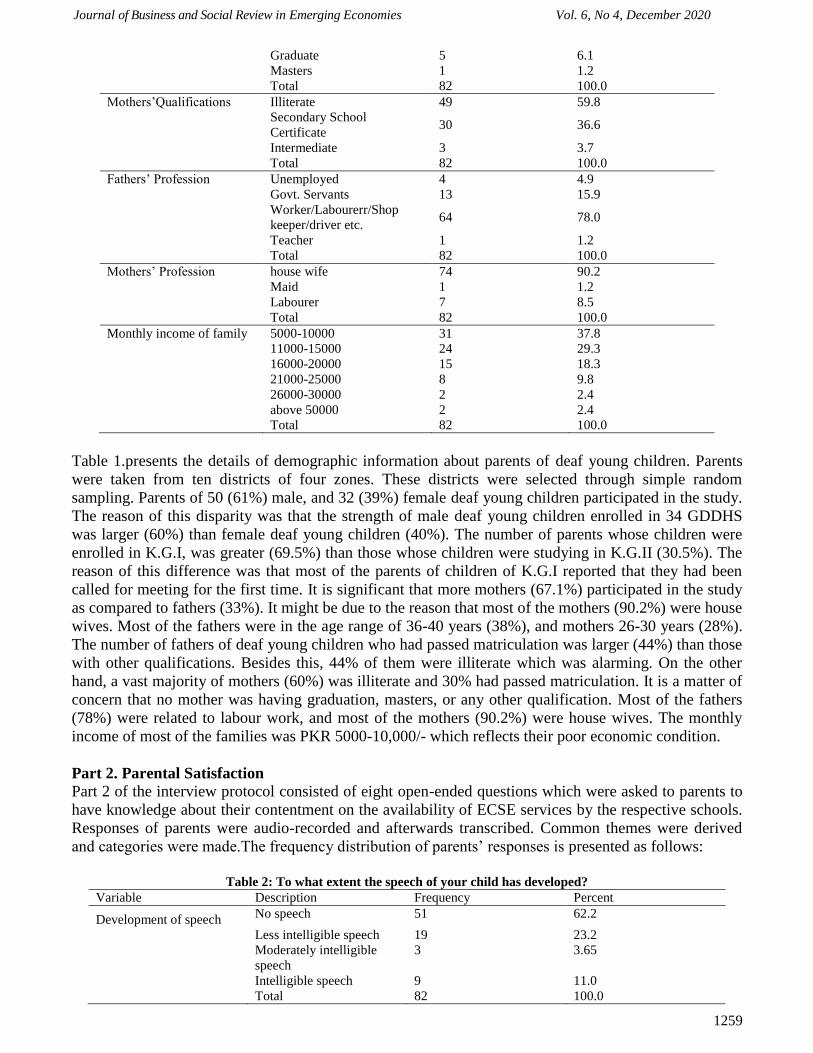
Journal of Business and Social Review in Emerging Economies Vol. 6, No 4, December 2020
1259
Graduate 5 6.1
Masters 1 1.2
Total 82 100.0
Mothers’Qualifications Illiterate 49 59.8
Secondary School
Certificate 30 36.6
Intermediate 3 3.7
Total 82 100.0
Fathers’ Profession Unemployed 4 4.9
Govt. Servants 13 15.9
Worker/Labourerr/Shop
keeper/driver etc. 64 78.0
Teacher 1 1.2
Total 82 100.0
Mothers’ Profession house wife 74 90.2
Maid 1 1.2
Labourer 7 8.5
Total 82 100.0
Monthly income of family 5000-10000 31 37.8
11000-15000 24 29.3
16000-20000 15 18.3
21000-25000 8 9.8
26000-30000 2 2.4
above 50000 2 2.4
Total 82 100.0
Table 1.presents the details of demographic information about parents of deaf young children. Parents
were taken from ten districts of four zones. These districts were selected through simple random
sampling. Parents of 50 (61%) male, and 32 (39%) female deaf young children participated in the study.
The reason of this disparity was that the strength of male deaf young children enrolled in 34 GDDHS
was larger (60%) than female deaf young children (40%). The number of parents whose children were
enrolled in K.G.I, was greater (69.5%) than those whose children were studying in K.G.II (30.5%). The
reason of this difference was that most of the parents of children of K.G.I reported that they had been
called for meeting for the first time. It is significant that more mothers (67.1%) participated in the study
as compared to fathers (33%). It might be due to the reason that most of the mothers (90.2%) were house
wives. Most of the fathers were in the age range of 36-40 years (38%), and mothers 26-30 years (28%).
The number of fathers of deaf young children who had passed matriculation was larger (44%) than those
with other qualifications. Besides this, 44% of them were illiterate which was alarming. On the other
hand, a vast majority of mothers (60%) was illiterate and 30% had passed matriculation. It is a matter of
concern that no mother was having graduation, masters, or any other qualification. Most of the fathers
(78%) were related to labour work, and most of the mothers (90.2%) were house wives. The monthly
income of most of the families was PKR 5000-10,000/- which reflects their poor economic condition.
Part 2. Parental Satisfaction
Part 2 of the interview protocol consisted of eight open-ended questions which were asked to parents to
have knowledge about their contentment on the availability of ECSE services by the respective schools.
Responses of parents were audio-recorded and afterwards transcribed. Common themes were derived
and categories were made.The frequency distribution of parents’ responses is presented as follows:
Table 2: To what extent the speech of your child has developed?
Variable Description Frequency Percent
Development of speech No speech 51 62.2
Less intelligible speech 19 23.2
Moderately intelligible
speech
3 3.65
Intelligible speech 9 11.0
Total 82 100.0

Journal of Business and Social Review in Emerging Economies Vol. 6, No 4, December 2020
1260
Table 2.shows that majority of the parents (62.2%) responded that their children had no speech. The
parents of 19 children (23.2%) told that the speech of their children was less intelligible restricted to
only bilabial sounds. Only 3 (3.65%) parents were of the view that their children had moderately
intelligible speech consisting of a few words of daily use. The parents of nine children (11%) told that
their children had intelligible speech. It is worth mentioning here that most of these parents, whose
children had got some intelligible speech, reported that they had been hiring the services of speech
therapists of private sector, but, due to heavy charges, they had discontinued taking speech sessions.
They were now practicing those speech lessons at home.
Table 3: To what extent speech reading skills of your child have developed?
Variable Description Frequency Percent
Development of speech
reading skills
No speech reading 65 79.3
Speech reading of few
words
15 18.3
Good speech reading 2 2.4
Total 82 100.0
Table 3.shows that most of the parents (79.3%) responded that the speech reading skill of their children
was not developed. Parents of 15 children (18.3%) reported that their children could do speech reading
of a few words. Parents of only two children (2.4%) answered that the speech reading skill of their
children was good. It means that the area of teaching speech reading to deaf young children was being
ignored in schools.
Table 4: How much your child has developed reading skills?
Variable Description Frequency Percent
Development of reading
skills
Can’t read 35 42.7
Can read alphabets only 37 45.1
Can read words 10 12.2
Total 82 100.0
Table 4.depicts that parents of 37 (45.1%) deaf young children reported that their children could read
alphabets only whereas parents of 43% children answered that their children could not read anything.
Additionally, parents of 10 (12.2%) children informed about their children’s ability to read words. In
other words, the number of children who had developed reading skill was small.
Table 5: How much your child has developed writing skill?
Variable Description Frequency Percent
Development of writing
skills
Can’t write 4 4.9
Can copy alphabets 48 58.5
Can write alphabets
independently
19 23.2
Can write words 11 13.4
Total 82 100.0
Table 4.shows that parents of 48 (58.5%) deaf young children responded that their children could copy
alphabets. Parents of 19 (23.2%) children were of the view that their children could write alphabets
independently. The parents of 11 (13.4%) children reported that their children could write words,
whereas the parents of only 4 (5%) children informed that their children were not able to write anything.
It shows that majority of deaf young children were at the stage of copying alphabets only. Contrary to
this, syllabus of classes K.G.I and K.G.II consisted of alphabets, words, and sentences. Parents’
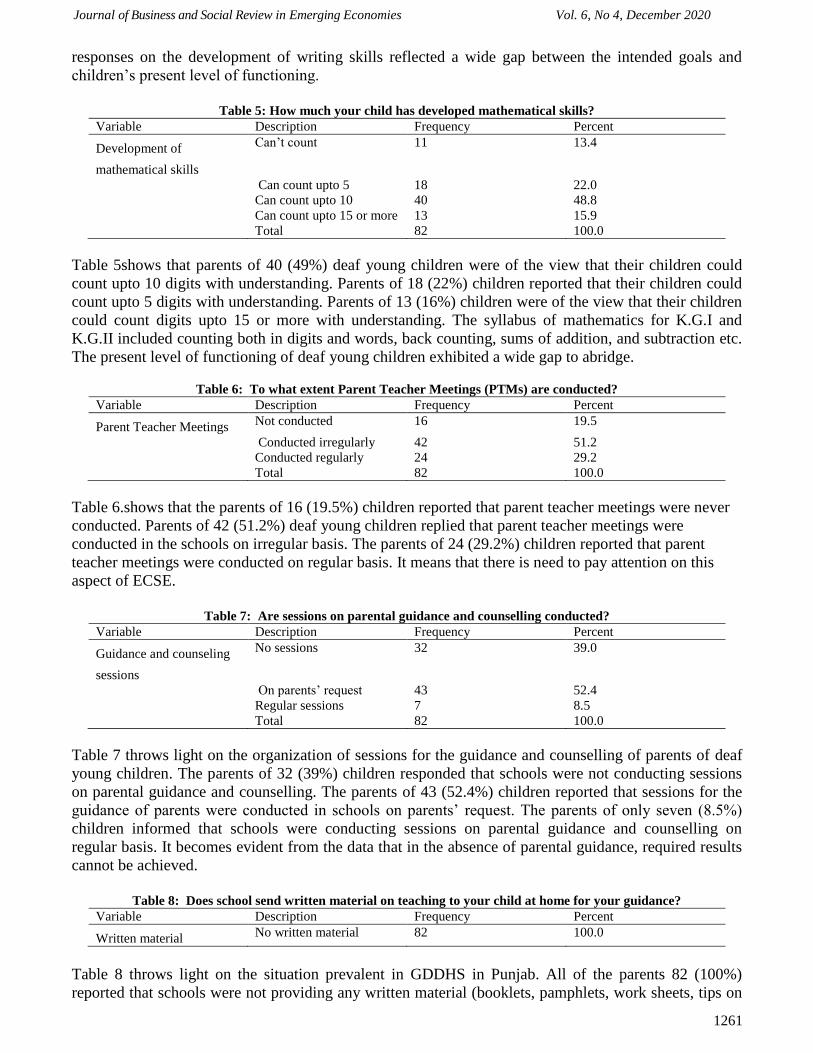
Journal of Business and Social Review in Emerging Economies Vol. 6, No 4, December 2020
1261
responses on the development of writing skills reflected a wide gap between the intended goals and
children’s present level of functioning.
Table 5: How much your child has developed mathematical skills?
Variable Description Frequency Percent
Development of
mathematical skills
Can’t count 11 13.4
Can count upto 5 18 22.0
Can count upto 10 40 48.8
Can count upto 15 or more 13 15.9
Total 82 100.0
Table 5shows that parents of 40 (49%) deaf young children were of the view that their children could
count upto 10 digits with understanding. Parents of 18 (22%) children reported that their children could
count upto 5 digits with understanding. Parents of 13 (16%) children were of the view that their children
could count digits upto 15 or more with understanding. The syllabus of mathematics for K.G.I and
K.G.II included counting both in digits and words, back counting, sums of addition, and subtraction etc.
The present level of functioning of deaf young children exhibited a wide gap to abridge.
Table 6: To what extent Parent Teacher Meetings (PTMs) are conducted?
Variable Description Frequency Percent
Parent Teacher Meetings Not conducted 16 19.5
Conducted irregularly 42 51.2
Conducted regularly 24 29.2
Total 82 100.0
Table 6.shows that the parents of 16 (19.5%) children reported that parent teacher meetings were never
conducted. Parents of 42 (51.2%) deaf young children replied that parent teacher meetings were
conducted in the schools on irregular basis. The parents of 24 (29.2%) children reported that parent
teacher meetings were conducted on regular basis. It means that there is need to pay attention on this
aspect of ECSE.
Table 7: Are sessions on parental guidance and counselling conducted?
Variable Description Frequency Percent
Guidance and counseling
sessions
No sessions 32 39.0
On parents’ request 43 52.4
Regular sessions 7 8.5
Total 82 100.0
Table 7 throws light on the organization of sessions for the guidance and counselling of parents of deaf
young children. The parents of 32 (39%) children responded that schools were not conducting sessions
on parental guidance and counselling. The parents of 43 (52.4%) children reported that sessions for the
guidance of parents were conducted in schools on parents’ request. The parents of only seven (8.5%)
children informed that schools were conducting sessions on parental guidance and counselling on
regular basis. It becomes evident from the data that in the absence of parental guidance, required results
cannot be achieved.
Table 8: Does school send written material on teaching to your child at home for your guidance?
Variable Description Frequency Percent
Written material No written material 82 100.0
Table 8 throws light on the situation prevalent in GDDHS in Punjab. All of the parents 82 (100%)
reported that schools were not providing any written material (booklets, pamphlets, work sheets, tips on
Journal of Business and Social Review in Emerging Economies Vol. 6, No 4, December 2020
1262
teaching to children) to parents of deaf young children.
Part 3. Parental Involvement
Part 3 of the interview protocol was about parents’ own involvement in and contribution to the
development of their deaf young children. The analysis of this part is presented as follows:
Table 9: Do you give practice of speech lessons to your child at home?
Variable Description Frequency Percent
Practice of speech No practice 26 31.7
No knowledge about
methods
29 35.4
Practice speech 27 32.9
Total 82 100.0
Practicing speech lessons to deaf young children at home is a matter of great concern. Table 9 shows
that parents of 26 (32%) children answered that they did not practice speech to their children at home.
Parents of29 (35.4%) children reported that they had no knowledge about practicing speech to their
children at home. Parents of 27 (33%) children were of the view that they used to practice speech to
their children at home. It means that parents of only 27 (33%) children out of 82 were practicing speech
at home.
Table 10: Do you give your child training in speech reading?
Variable Description Frequency Percent
Training in speech reading No training 53 64.6
Effort with no response 12 14.63
Training in speech reading
regularly
17 20.7
Total 82 100.0
Table 10presents responses of parents about practicing speech reading to their children at home. The
parents of 53 (65%) deaf young children responded that they had no concept of speech reading and
resultantly they were not giving any training to their children at home. The parents of 12 (15%) children
informed that they used to try to teach speech reading to their children, but, they did not give response.
The parents of only 17 (21%) children were of the view that they used to give training on regular basis
and their children had started giving good response. It means that majority of parents of deaf young
children (79%) were not able to teach their children the skill of speech reading which would have
resulted in deficiency in this area.
Table 11: Do you teach your child reading recognition of alphabets and words?
Variable Description Frequency Percent
Teaching of reading
recognition
No reading recognition 63 76.8
Don’t know the method 7 8.5
Teaching reading
recognition through speech
12 14.6
Total 82 100.0
Table 11 throws light on the responses of parents about teaching of reading recognition to their deaf
young children. Parents of 63 (77%) children responded that they did not teach their children reading
recognition of alphabets and words included in their syllabus. Parents of 12 (15%) children informed
that they used to teach their children reading recognition of alphabets and words through speech whereas
the parents of seven (8.5%) children reported that they did not know how to teach reading recognition to
Journal of Business and Social Review in Emerging Economies Vol. 6, No 4, December 2020
1263
their deaf young children. It shows that parents of only 12 (15%) children were helping their children in
developing reading recognition skill. Contrary to this, parents of 70 (85%) deaf young children were not
contributing to the development of reading skills in their children.
Table 12: Do you teach your child writing of alphabets and words?
Variable Description Frequency Percent
Teaching of writing No training 11 13.4
Supervising in doing home
work
54 65.9
Giving practice in writing 17 20.7
Total 82 100.0
Table 12 presents the responses of parents of deaf young children about teaching of writing skills to their
deaf young children. The parents of 11 (13.4) children expressed their inability in teaching writing of
alphabets and words to their children. Parents of 54 (66%) children reported that their involvement was
restrictedonly to supervising their children during doing their home work. Parents of 17(21%) children
were of the view that they used to practice writing of alphabets and words to their children. It means that
majority of the parents were involved in guiding their children just in completing their home work.
Extra efforts were being made by parents of only 17 (21%) deaf young children.
Table 13: Do you teach your child mathematics at home?
Variable Description Frequency Percent
Teaching of mathematics No teaching of
mathematics
16 19.5
Supervising in doing home
work
44 53.7
Teaching with material 22 26.8
Total 82 100.0
Table 13 shows that parents of 16 (20%) children expressed their inability in teaching mathematics to
their children. Parents of 44 (54%) deaf young children used to supervisethem in doing their
mathematics home work. The parents of 22 (27%) children were teaching them mathematical concepts
with the help of material. In other words, most of the parents showed their involvement in teaching
mathematics to their children.
9. Discussion
This research study examined the parental satisfaction on and involvement in the major aspects (speech,
speech reading, reading, writing, mathematics, and guidance and counselling) of ECSE for their deaf
young children. Individuals with Disabilities Education act (IDEA), reauthorized in 1997, has given
parents the right to indulge in the planning of individual educational plan, and placement decision for
their children with disabilities. One of the key themes of the 1997 amendments to the act is emphasis on
parent involvement in the provision of special education to their children with special needs. In
congruence to this, National Policy for Persons with Disabilities (2002), a first ever policy of its kind in
Pakistan, has stressed the training of parents for the education of their special needs children. Contrary
to this, the data taken from the parents highlights that parental involvement in the education of their deaf
young children was not on satisfactory level. Moreover, Parent Teacher Meetings (PTMs), and guidance
& counselling sessions were being conducted on a very limited scale. It shows that National Plan of
Action, 2006, which was formulated for the implementation of National Policy for Persons with
Disabilities (2002), is not very successful in enforcing the policy deliberations in its true spirit.
Musselman and Kircaali-Iftar (1996) found that children with unpredictably high spoken language skills
were those whose parents were directly engaged in their studies. In consistent to this, the present study

Journal of Business and Social Review in Emerging Economies Vol. 6, No 4, December 2020
1264
represents that parents of deaf young children were not involved on a large scale in teaching to their
children due to being unfamiliar with the instructional methods. As a result, their children were not
exhibiting better performance in academics. Here, the performance of deaf schools is also questionable
which are not making arrangements for the involvement and training of parents in the educational
process of their deaf young children (Humphries, Kushalnagar,Mathur, Napoli, Rathmann and Smith,
2019).
Calderon and Greenberg (1993) and Calderon, Greenberg, and Kusche (1991) reported that maternal
functioning and coping factors significantly affect a child’s functioning. Additionally, socio economic
status of parents was positively correlated with their deaf children’s reading achievement. These
findings are consistent with those of the present study which highlights poor socio economic status of
parents, especially, of mothers who represent higher rate (60%) of illiteracy. The remaining 37% had
passed Secondary School Certificate (S.S.C.) Exam, and only 4% had the qualification of Intermediate.
There was not even a single mother with college or university education. As a result, the deaf young
children were lagging behind in developing speech, speech reading, reading recognition, writing, and
mathematical skills.
Irrespective of the parental engagement in the education of their deaf young children, their satisfaction
on the provision of academic support extended by the schools does matter. As reported by them in
interviews, it is evident that deaf young children (62%) were having no speech, and only 11% children
had developed intelligible speech. Similarly, 79% children had not developed speech reading skill,
whereas, only 2% children had learnt good speech reading. In addition to this, only 12% children could
have read words and 13% could have write words included in their syllabus. As far as mathematical
skills are concerned, only 16% children could count upto 15 or more with understanding. The academic
level of children reported by their parents poses a question mark on the performance of schools because
as compared to the prescribed syllabus, the achievement level of children, as reported by their parents is
very low.
10. Implications of the Study
On the basis of data collected from parents in the form of interviews, results, and points considered in
the discussion portion, the following points are worth mentioning:
1. The study has serious implications regarding the performance of schools for deaf children as
parents of deaf young children are not satisfied with the services provided to their children.
As the speech related skills of deaf young children are not developed, it is imperative to focus
on these areas through employing speech therapists, and monitoring their performance
according to a set pattern.
2. As parents are not satisfied with the academic condition of their children, teachers’
instructional practices need to be improved. Refresher courses pertaining to the areas of
ECSE, should be conducted.
3. Training courses for parents on speech, speech reading, teaching of reading, writing, and
mathematics need to be organized through arranging the payment for travelling and daily
allowances.
4. For the guidance of parents, sessions should be conducted on regular basis.
5. As the parents are having low socio economic status, reimbursement for mileage should be
made when they are invited for Parent Teacher Meetings or guidance and counselling
sessions.
6. To reduce illiteracy rates among mothers, adult literacy enhancement campaigns should be
launched by the Ministry of Education and Special Education which will ultimately bring
about change in the academic condition of deaf young children.
References
Abidi, S. (2015).Early childhood education in Pakistan.The Daily Jang, p.7.

Journal of Business and Social Review in Emerging Economies Vol. 6, No 4, December 2020
1265
Ahmed, F. &Rehman, S. (2006).A study of the reading problems faced by the children with hearing
impairment at middle level. Unpublished masters thesis, Department of Special Education,
University of the Punjab, Lahore.
Akhtar, N. &Inam, S. (2005).A study of problems of hearing impaired children and its
implications on their education. Unpublished masters thesis, Department of Special Education,
University of the Punjab, Lahore.
Blanchfield, B.B., Feldman, J.J., Dunbar, J. L.,& Gardner, E.N. (2001). The severely to profoundly
hearing impaired population in the United States: prevalence estimates and demographics.
Journal of the American Academy of Audiology, 12 (4), 183-9.
Blythe S.F. Hinitz (2014), Head Start, A bridge from past to future, Young Children. www.naeyc.org/yc
Bloom, B.S. (1964).Stability and change in human characteristics. New York: Wiley.
Calderon, R., & Greenberg, M. (1993). Considerations in the adaptation of families with school-aged
deaf children. In M. Marschark& D. Clark (Eds.), Psychological perspectives on
deafness.Hiilsdale, NJ: Lawrence Erlbaum.
Calderon, R., & Greenberg, M. (1997). The sffectiveness of early intervention for deaf and hard-of-
hearing children. In M.J.Guralnick (Ed.), The effectiveness of early intervention: Directions for
second generation research. Baltimore, MD: Brookes.
Calderon, R., Greenberg, M.T., &Kusche, C. (1991). The influence of family coping on the cognitive
and social skills of deaf children. In D. Martin (Ed.), Advances in
cognition,education, and deafness (pp.195-200). Washington, DC: Gallaudet Press.
Caldwell, B.M. (1973). The importance of beginning early. In J.B. Jordan & R. F. Dailey(Eds.), Not all
little wagons are red. Arlington, Virginia: Council for Exceptional Children.
Gallaudet Research Institute. (2005). Regional and National Summary Report of Data from 2003–2004
Annual Survey of Deaf and Hard of Hearing Children and Youth. Washington, DC, GRI:
Gallaudet University.
Government of Pakistan (1947).Proceedings of The Pakistan Educational Conference 1947. Karachi:
Ministry of the Interior (Education Division).
Government of Pakistan (1959).Report of the Commission on National Education 1959. Islamabad:
Ministry of Education.
Government of Pakistan (2002).National policy for persons with disabilities 2002. Islamabad: Ministry
of Women Development, Social Welfare and Special Education.
Government of Pakistan (2006).National plan of action 2006 to implement the national policy for
persons with disabilities. Islamabad: Ministry of Social Welfare and Special Education
(Directorate General of Special Education).
Government of Pakistan (2009).National Education Policy, 2009,Islamabad: Ministry of Education.
Hart, B.,&Risley, T.R.(1995).Meaningful differences in the everyday experience of young American
children. Baltimore, MD: Paul H. Brookes Publishing Co.
Humphries, T., Kushalnagar, P., Mathur, G., Nepoli, D.J., Rathmann, C., & Smith, S. (2019). Support
for parents of deaf children: Common questions and informed, evidence-based answers.
International Journal of Pediatric Otorhinolaryngology, 118, 134-142.
Innocenti, M. S., & Taylor, M.J. (1998).Using longitudinal Head Start data to examine the
predictiveness of mother characteristics on child outcomes: Findings from the Head Start Success
Study.Poster presented at the Head Start’s Fourth National Research Conference, July,
Washington, DC.
Kirk, S.A. (1958). Early education of the mentally retarded. Urbana: University of Illinois Press.
Kirkwood, D (2016). Understanding the power of parental involvement. Retrieved from
https://www.naeyc.org/resources/blog/understanding-power-parent-involvement
Latif, U. &Watto, S.M. (2005).A study of effectiveness of written language as a communication process
among the children with hearing impairment. Unpublished masters thesis, Department of Special
Education, University of the Punjab, Lahore, Pakistan.
Leyser, Y. (1985). Parent involvement in school: Asurvey of parents of handicapped students.
Contemporary Education, 57, 38-43.

Journal of Business and Social Review in Emerging Economies Vol. 6, No 4, December 2020
1266
MacLeod-Gallinger, J. E. (1992). The career status of deaf women.American Annals of the Deaf, 137,
315–325.
Margolis, L.S. (1998). IDEA mandates increased parent involvement. Endeavor, Fall issue.
Musselman, C., &Kircaali-Iftar, G. (1996). The development of spoken language in deaf
children: Explaining the unexplained variance. Journal of Deaf Studies and Deaf Education,1,108-121.
Parveen, Z. (2007). The study of the problems faced by the teachers of children with hearing impairment
in teaching English language. Unpublished masters thesis, Department of Special Education,
University of the Punjab, Lahore, Pakistan.
Roush, J., &Matkin, N.D. (1994).Infants and toddlers with hearing loss.Baltimore, MD:Grune&
Stratton.
Schroedel, J.G., & Geyer, P.D.(2000). Long-term career attainments of deaf and hard of hearing college
graduates: Results from a 15-year follow-up survey. American Annals of the Deaf 145,303–314.
Stinson, M., & Walter, G. (1997).Improving retension for deaf and hard of hearing students: What the
research tells us. Journal of American Deafness and Rehabilitation Association, 30, 14-23
Wahid, Z. &Ishfaq, S. (2000). A study of the perceptions of the Punjab University teachers about the
academic capabilities of hearing impaired children. Unpublished masters thesis, Department of
Special Education, University of the Punjab, Lahore.

Journal of Business and Social Review in Emerging Economies Vol. 6, No 4, December 2020
1267
Volume and Issues Obtainable at Center for Sustainability Research and Consultancy
Journal of Business and Social Review in Emerging Economies ISSN: 2519-089X (E): 2519-0326
Volume 6: No. 4, December 2020
Journal homepage: www.publishing.globalcsrc.org/jbsee
Media Framing of Pandemics: A Case Study of the Coverage of COVID-19 in Elite
Newspapers of Pakistan
1Ayesha Siddiqua, 2Ghulam Shabir, 3Atif Ashraf, 4Ammad Khaliq 1Lecturer, Department of Mass Communication, National University of Modern Languages, Islamabad,
Pakistan, [email protected] 2Professor, Faculty of Media and Communication Studies, University of Central Punjab, Lahore,
Pakistan, [email protected] [email protected] 3Assistant Professor, Faculty of Media and Communication Studies, University of Central Punjab,
Lahore, Pakistan, [email protected] 4Multimedia and Broadcast Journalist, BBC
ARTICLE DETAILS ABSTRACT History Revised format: November 2020 Available Online: December 2020
Considering the outbreak of Corona pandemic as a case study the
article explores the dominant frames used in the coverage of COVID-
19 pandemic by the Pakistani English e papers. The media framing is
analyzed through qualitative inductive content analysis of the
COVID-19 related news stories published in the e papers of Dawn
and Express Tribune. Three broad themes emerged as a result of the
inductive content analysis which included Scientific Development
related to Pandemic; Scale of Pandemic; Social and Economic Impact
of Pandemic. The results indicated that the coverage by the e papers
was mostly aimed at educating the readers; difficult jargon related to
medicine was mostly avoided and where the use of jargon was
unavoidable it was properly explained. Most of the stories were
developing in nature as the pandemic itself was unfolding at a very
fast pace during the selected time frame. The news related
information was mostly compiled in a manner which was meant to
both warn the readers and the policy makers about the growing scale
of the pandemic. The coverage also provided recommendations for
the revival of economic and social activities which were halted
because of the COVID-19 pandemic.
© 2020 Center for Sustainability Research and Consultancy Pakistan under
a Creative Commons Attribution-NonCommercial-ShareAlike 4.0
Keywords Pandemic; Media Framing;
Coronavirus (COVID-19); e
papers
JEL Classification
M0, M1
Corresponding author’s email address: [email protected]
Recommended citation: Siddiqua, A., Shabir, G., Ashraf, A. & Khaliq, A. (2020). Media Framing of
Pandemics: A Case Study of the Coverage of COVID-19 in Elite Newspapers of Pakistan. Journal of
Business and Social Review in Emerging Economies, 6(4), 1267-1275
1. Introduction
The threats of Global pandemics are considered as the most serious threats to the contemporary human
societies (Davis, 2005; Elbe, 2010; Fidler, 2004). The actual idea of pandemic is quite threating for the
whole world as the challenges related to controlling and mapping the disease are not limited to the
immediate location of the outbreak. The post-world war optimism of the developed world sent the threat
Journal of Business and Social Review in Emerging Economies Vol. 6, No 4, December 2020
1268
of pandemics to the history books because of the evolution of vaccines, anti-viral medications and
antibiotics (Abraham, 2007; Dry and Leach, 2010). But the spread of fatal infections which became resistant to
prevalent antibiotic treatments (Abraham, 2007; Dry and Leach, 2010) made even the western developed
world realize about the intensity of its vulnerability. In the cases of Ebola, SARS and H1N1 flu the
consequences of epidemics were manifested in a multifold manner because of the enhanced levels of
global connectivity (Pieri, 2019).
The Coronavirus disease (COVID-19) illustrated that how a pandemic which started in China could
travel so fast to the rest of the world while causing widespread havoc and panic across the globe.
Patients infected with COVID-19 were prone to respiratory illness ranging from mild to moderate. As
per the World Health Organization’s directives “the best way to prevent and slow down transmission is
to be well informed about the COVID-19 virus, the disease it causes and how it spreads” (World Health
Organization, 2020). The emphasis on the acquisition of information regarding the virus made it
possible not only for the media to give the issue tremendous amount of coverage but also allowed the
audience to be more attentive and receptive towards all sorts of available information. COVID -19 was
speculated to emerge from a wild life market of China situated at the city of Wuhan in the year 2019.
Although a report by EU has accused China of manipulating the information regarding the crisis but
China rejected all such accusations along with rejecting the call for any independent investigation
regarding the origin of the virus (Coronavirus: China rejects call for probe into origins of disease, 2020).
The role of mass media in the time of pandemics can be viewed extremely critical not only with respect
to creating awareness about the disease but also in terms of enhancing the chances of better survival of
the contemporary human societies. This paper attempted to comprehend the development of media
frames in the coverage of COVID-19 along with analyzing the patterns through which the impact and
risks related to COVID-19 were presented in the e papers of the mainstream English press of Pakistan.
The significance of the study lies in its focus to comprehend the evolution and development of frames
which were dominantly used by the Pakistani press to tackle the humanitarian crisis which emerged
because of the COVID -19 pandemic.
2. Media Coverage of Pandemics
In the unpredictable times of pandemic spread the role of media gains greater attraction as it sets the
agenda for public debate and at the same time helps people in knowing about the risks related to the
pandemic. The outbreak of corona pandemic coincided with a time in evolution when the sources of
information dissemination have become most sophisticated and the acquisition of information itself has
acquired the position of one of the most valued entities.
The significant role of media in case of pandemics cannot be undermined as the mechanisms of
scrutiny by the World Health Organization (WHO) are themself dependent on the information provided by
different sources of media, along with official communication channels (Dry, 2010). Studies on the media
coverage of pandemics have also incorporated innovative ways of operationalizing data gathered from
posts, tweets, blogs and social media. The early detection of health crisis had also incorporated the
technique of sentiment analysis (Schulz et al., 2013). The dependence on media was also significant for
its potential to guide in the case of absence or failure of formal support systems and also to communicate
health and emergency related messages to different segments of the society. A research conducted by
Time Magazine showed that compared to the English language print coverage of Ebola epidemic in
2018 the articles published on COVID-19 were considerably greater in number (Ducharme, 2020).
Luther & Zhou (2005) examined the media framing of SARS virus by the Chinese and U.S. print
media and they concluded that the dominant frames used for covering the SARS virus included
responsibility, human interest, leadership, conflict and economic consequences.
Although the significance of social media analysis holds a vital position but the coverage of national
newspapers still played a significant role in shaping the policy and public discussions on matters
pertaining to health emergencies (Dry and Leach, 2010). The connection between health communication

Journal of Business and Social Review in Emerging Economies Vol. 6, No 4, December 2020
1269
and journalism is often examined through the lens of framing. Scheufele and Tewksbury (2007) asserted
that framing can be understood as an assumption in terms of how news is portrayed in the media is
bound to have an influence on how it is perceived by the audience. The issues that received more
information were also considered more important by the members of audience as the media not only
tells us what to think but also what to think about (Entman, 1993). Entman (2007) further asserted that
classification of media frames can be divided into different categories with respect to the functions they
perform. These functions can be classified with respect to defining the problem, mapping out causal
interpretations, and providing recommendations. The concept of framing has been widely employed by
researchers across a wide range of themes. Frames can be interpreted as a sequence of cognitive schemes
through which we perceive, communicate, organize and prioritize the information regarding certain
issues while keeping the context in view (Pieri, 2009). It is through the process of framing that media
attains the ability to attract attention towards a particular issue (Entman, 2007). In terms of health crisis
especially in the scenario of COVID-19 pandemic media framing helped in imparting significance to the
information regarding pandemic (Liu & Kim, 2011). Prospect theory by Kahneman & Tversky (1979)
also suggested that the messages containing gain-frames like accentuating the benefits of hand washing
were highly likely to be more persuasive than the messages containing loss-frames like accentuating the
risks of virus as a result of not washing hands. The study at hand is exploratory in nature as not much
synchronized literature was available regarding the media framing of pandemics in general and COVID-
19 framing in particular.
3. Methodology
The study aimed at exploring the dominant frames used in the coverage of COVID-19 by the Pakistani
English e papers. In the wake of COVID-19 pandemic the sales of hard copies of newspapers
decreased as they were considered a possible source of infection. Resultantly the online readership of
the newspapers grew. Newspaper media coverage of pandemics in both print and online mediums has
continued to influence the framing of policy and public debates (Wald, 2008; Stephenson and Jamieson,
2009; Dry and Leach, 2010). Entman (1993) while explaining the process of framing asserted that “to
frame is to select some aspects of a perceived reality and make them more salient in a communicating
text, in such a way as to promote a particular problem definition, causal interpretation, moral
evaluation, and/or treatment recommendation for the item described” (p.52).
The coverage was analyzed through qualitative inductive content analysis of the COVID-19 related
news stories published in the e papers of Dawn and Express Tribune. The stories published from the
time period of 01 April, 2020 to 30th April 2020 were retrieved from the Lexis Nexus database. The
time period was significant because of the increase in the number of COVID-19 patients in Pakistan.
Total 45 stories were retrieved. Among the selected stories 20 stories comprised of Daily Dawn and 15
stories comprised of the Daily Express Tribune. The unit of analysis was every individual story. The
selected stories were analyzed through the process of careful open coding as a result of which three
key themes emerged with respect to the coverage of COVID-19 pandemic which included Scientific
Development related to Pandemic; Scale of Pandemic; Social & Economic Impact of the Pandemic.
4. Findings
The recurrent themes which emerged as a result of open coding are discussed in detail along with the
dominantly employed frame categories.
4.1 Scientific Development Related to Pandemic
Stories falling under the theme of scientific development incorporated frame categories related to
definition of the pandemic; medical updates; health related precautions; development of vaccines; new
findings regarding the causes and symptoms of COVID-19.
In a story published in Dawn regarding the development of Corona Virus vaccine the World Health
Organization said that it will supervise the research about COVID- 19 treatment in Pakistan especially to
comprehend the effectiveness of malaria drugs in the corona treatment. The story also dealt with the

Journal of Business and Social Review in Emerging Economies Vol. 6, No 4, December 2020
1270
mutation aspect of the virus as it mutates while travelling from one population to another (WHO
oversees research to develop corona treatment in Pakistan, 2020).
In a similar story published in the Express Tribune, the successful genome sequencing carried out by
University of Karachi was reported. The story also reported that the sequencing was carried out to
comprehend the genetics of Corona virus and the whole process was done under the supervision of both
young and senior Pakistani doctors (Pakistan carries out whole genome sequencing to help combat
COVID-19, 2020).
In the time of a pandemic with such common symptoms an obvious challenge was to get oneself tested.
In a related story published in Dawn a step-by-step guide was shared with the readers for how to get
their COVID-19 related symptoms checked in Pakistan. The story incorporated the versions of health
professionals to explain the process through which a person can be tested for COVID-19. In the first step
in case of any manifested symptoms the patient was advised to visit any public or private hospital which
was designated by the government. At the designated hospital the doctor will check the patient in order
to determine broadly if he or she may be suffering from coronavirus. In case the doctor rules out the
option of corona virus the patient will be asked to go back. In case the doctor concludes that the patient
has corona symptoms a swab of his saliva will be taken and sent for testing. Further the story also stated
that at government facilities the test would be done free of cost. Along with the government designated
facilities it was also mentioned that some of the private labs were also conducting tests against a certain
fee (Here’s how you can get checked for coronavirus in Pakistan, 2020).
In another story published in Dawn the usefulness and legitimacy of world Health Organization (WHO)
was questioned with reference to the pandemic spread and the steps taken to contain its harmful effects
(“WHO and COVID-19”, 2020). In a story published in The Express tribune the issue of disposal of
hospital waste was highlighted ( Ahmed, 2020). The story stated that the contaminated medical waste of
hospitals in Karachi posed a serious threat in terms of increasing the infection rate. The complaints of
the hospital staff were also made part of the story in which they asserted that they were not provided
with any special instructions with respect to dumping the waste of the infected patients. The story also
gave background information on how the disposal of medical waste had remained an unresolved issue in
Pakistan even in the pre corona scenario. The public hospitals’ representatives, on the contrary, assured
that hospital waste was properly disposed of. Infection Control Society of Pakistan also endorsed the
point of view of the hospital staff by asserting that the possibility of the spread of COVID-19 virus from
the highly contaminated waste was very high (Ahmed, 2020).
Thus the news stories falling under this theme were mostly meant to educate the readers so that they can
have a very clear idea of the problem that they are dealing with. The writing style of these stories was
mostly kept simplistic. The difficult jargon related to medicine was mostly avoided and where the use
of jargon was unavoidable the jargon was properly explained.
4.2 Scale of Pandemic
Stories falling under the theme of “Scale of Pandemic” incorporated frame categories related to mapping
the evolving trends in domestic infection cases; facts and figures related to infected, recovered patients
and critically ill patients; number of pandemic related deaths; mode of transmission of COVID-19.
In a story filed from Karachi the increasing number of corona cases in some parts of Karachi was
highlighted. The areas of Karachi which reported the highest number of corona cases were emphasized
including Gulshan-i-Iqbal, North Nazimabad and Saddar. The story also included the facts that patients
with underlying health conditions like diabetes and hypertension were more prone to succumb to the
disease. The district wise breakdown of the corona patients in Sindh was also made part of the story.
“The data showed that while most cases were reported among the age-group 20-29 years (21pc)
followed by age-group 30-39 years (19pc), people at the age of 70 and above are the most severely
affected age group followed by 60-69 years….whereas the gender wise analysis showed that 70pc

Journal of Business and Social Review in Emerging Economies Vol. 6, No 4, December 2020
1271
patients were men whereas 30pc were women” (Illyas, 2020). The stories like these which were rich in
data helped in prioritizing the areas and parts of population which need to be focused in order to
effectively deal with the COVID-19 breakout in terms of policy formulation.
In another story the “highest single day tally” related to COVID- 19 cases till April 19, 2020 were
reported by The Express Tribune. The story started with the background information regarding the
corona virus and then moved on to the current situation which stated that 1,137 patients were reported
till date (April 19: Sindh record highest single-day tally of Covid-19 cases, 2020). In a similar story
published by Dawn a detailed graphical story was reported when the number of deaths crossed 100 in
Pakistan and how it took Pakistan among the world’s 40th country to be severely effected by COVID-19
(Junaidi, 2020). The story further reported deaths and scale of pandemic province wise in Pakistan.
In an opinion story published in The Express Tribune the writer warned about the ever increasing scale
of COVID-19 pandemic and how Pakistan is extremely vulnerable with its inadequate hygiene and
health systems (Ahmar, 2020). The writer of the story also drew a comparison between the
government’s claims of containing the virus and the competing ground realities. The challenges of social
distancing in densely populated localities along with ever increasing income pressures faced by the
middle and lower middle classes were also highlighted in the story. The “inability” of the people sitting
in power to enforce right measures was linked to the increasing levels of frustration among the people.
The writer further elaborated on the social and psychological implications of the pandemic faced by
different segments of the Pakistani society (Ahmar, 2020).
Thus the stories falling under this theme mostly comprised of the unfolding information regarding the
pandemic. Most of the stories were developing in nature as the pandemic itself was unfolding itself at a
very fast pace. The information was mostly compiled in manner which was meant to warn both the
readers and the policy makers about the tremendously growing scale of the pandemic.
4.3 Social & Economic Impact of the Pandemic
The stories falling under the theme of social and economic impact comprised of the frame categories
related to recommendations for reviving the economy crisis; social distancing; lockdown; charity;
apathy; foreign help; economic impact of the pandemic at domestic and international level; economic
relief to individuals and small and large scale enterprises by the government.
In a story published in Dawn the Prime Minister of Pakistan urged the Pakistani nation to donate for the
Coronavirus Relief Fund as the funds will be utilized to provide relief to the segments of the society who
are hit hardest because of the coronavirus lockdown measures. Along with asking for donations the
Pakistani Prime Minister also urged the youth to step forward in these difficult times and provide
essentials and food items to the struggling strata and also play their part in minimizing the effects of
corona virus. For this purpose the registration of youngsters in the PM’s Corona Tiger Force was also
encouraged (Covid-19 relief fund: PM urges people to donate so government can take care of those in
need, 2020).
In a story published in The Express Tribune the alliance between China and Pakistan was highlighted as
China pledged more help for Pakistan in order to fight the corona pandemic. The story was filed in the
backdrop of the meeting between Pakistani Foreign Minister Shah Mahmood Qureshi and the Chinese
Ambassador to Pakistan Yao Jing. As the Pakistani FM congratulated the Chinese Ambassador over
“successfully dealing with the pandemic” the Chinese Ambassador asserted that China “would
continue its support for its iron brother” (China pledges more help to Pakistan in fight against corona
pandemic, 2020).
A story published in Dawn focused on the different strategies that can be adopted by the freelancers to
survive their businesses during the pandemic (Saleem, 2020). As a result of the massive layoffs in the
Journal of Business and Social Review in Emerging Economies Vol. 6, No 4, December 2020
1272
job market the sources of income generation for freelancers were also equally dried up because of the
loss of the clientele. The story educated the freelancers regarding certain steps that can be taken to
minimize the effects of economic downturn for the freelancers. The recommendations included
reviewing the business tools and expenses, exploring alternative options of financing, harnessing
business network, transferring the work to online platforms, optimizing work space and routine,
encouraging flexibility, focusing on innovation and investing in the development of skills (Saleem,
2020).
The impact of coronavirus on the economy was discussed at length in another story published by The
Express Tribune (Rehman, 2020). The story also incorporated the information regarding conspiracy
theories through which the crisis is seen not as targeted towards public health rather seen as a
“politically motivated agenda to transform the global economy”. The adverse effects of lockdown on
Pakistani economy could result in the squeezed livelihood opportunities for small and medium
businesses and daily wage earners in particular. The story also correlated the effects of closure of
businesses, industries, transport and airports to the overall condition of the economy. The story
reiterated the fact that although Pakistan’s economy has withstood many challenges in the past but
the current situation requires more apt public policy and its implementation (Rehman, 2020).
The details regarding smart lockdowns and its effectiveness in dealing with Covid-19 spread was
discussed at length in a story published in Dawn (“Smart lockdowns lead to effective handling of Covid-
19 in Pakistan”, 2020). The decline in the number of COVID related deaths was attributed to the smart
lockdown strategy in Pakistan. The acknowledgment in this regard was made by the Medical
Microbiology and Infectious Diseases Society of Pakistan. The story further stated that the isolation
centers which were established in Karachi and Lahore were not used to their full capacity owing to smart
lockdown strategy. In a similar story published in The Express Tribune the government’s strategy to
“ease lockdown” was related to the reporting of lesser number of cases in comparison to the projected
number of cases (“April 29: Govt prepares to ease lockdown, considers 15, 525 Covid-a9 cases as below
projections”, 2020). The story stated that Pakistan despite being close to China remained relatively free
from virus for a much longer period of time but the number of cases spiked as pilgrims who returned
from Iran tested positive for COVID-19.
The stories falling under this theme mostly comprised of the direct human interest stories as they dealt
with areas which directly affected the everyday life of individuals in terms of their economic and social
preferences. The stories also provided recommendations for the economic and social revival of the
Pakistani society in particular and the world at large.
The recurrent themes in the selected content and the dominant frame categories employed for framing
COVID-19 pandemic by the Pakistani media are summarized in the following figure:
Themes Dominant Frame Categories
Scientific Development related to pandemic
Defining the pandemic; medical updates; health related
precautions; development of vaccines; new findings
regarding the causes and symptoms of pandemic
Scale of Pandemic
Trends of domestic infection cases; mode of pandemic
transmission; facts and figures related to infected;
statistics related to patients (recovered and critically ill);
number of pandemic related deaths;
Social & Economic Impact of the Pandemic
Recommendations for reviving the economy crisis;
social distancing; lockdown; charity; apathy; foreign
help; economic impact of the pandemic at domestic and
Journal of Business and Social Review in Emerging Economies Vol. 6, No 4, December 2020
1273
international level; economic relief
5. Discussion and Conclusion
Effective and timely communication strategies by the health and government departments for public
awareness have mostly played a pivotal role in handling pandemic situations. The media framing of
these strategies helps the public in adopting required precautions to control the outbreak along with
limiting the mortality and morbidity rates. As Barry (2009) rightly pointed that “ in the next influenza
pandemic, be it now or in the future, be the virus mild or virulent, the single most important weapon
against the disease will be a vaccine. The second most important will be communication” (p. 1039). The
connection between health communication and journalism is often examined through the lens of
framing. Scheufele and Tewksbury (2007) asserted that framing can be understood as an assumption that
how news is portrayed in the news is bound to have an influence on how it is perceived by the audience.
Entman (1993) while explaining the process of framing said that “to frame is to select some aspects of a
perceived reality and make them more salient in a communicating text, in such a way as to promote a
particular problem definition, causal interpretation, moral evaluation, and/or treatment recommendation
for the item described” (p.52). Thus framing is one of the most frequently applied theories in terms of
comprehending the coverage of disasters (Durham, 1998; Haider-Markal, Delehanty, & Beverlin, 2007).
Media framing also traces its origin to cognitive psychology as framing heavily relies on the ideas,
concepts and feelings which are stored in human memory in the form of a node and connected to each
other through semantic tracks (Price & Tewksbury, 1997). Resultantly the way health issues are framed
in the media has impact on the audiences’ comprehension of those particular health issues.
Entman (1993) asserted that the issues which received more information were also considered more
important by the members of audience as the media not only tells us what to think but also what to think
about The study analyzed the dominant frames used in the coverage of COVID 19 pandemic by the e
versions of the mainstream English press of Pakistan. Three broad themes emerged as a result of the
inductive content analysis which included Scientific Development related to pandemic; Scale of
Pandemic; Social and Economic impact of Pandemic.
Stories falling under the theme of scientific development incorporated frames related to defining the
pandemic; medical information; health related precautions; development of vaccines; new findings
regarding the causes and symptoms of COVID-19. The news stories falling under this theme were
mostly meant to educate the readers as factually and as succinctly as possible. Stories falling under the
theme of “Scale of Pandemic” incorporated frames related to mapping the evolving trends in domestic
infection cases; facts and figures related to infected, recovered and critically ill patients; number of
pandemic related deaths; mode of transmission of COVID-19. The stories falling under this theme
mostly comprised of the unfolding information regarding the pandemic. The information was mostly
compiled in manner which was meant to warn both the readers and the policy makers about the
tremendously growing scale of the pandemic. The stories falling under the theme of Social and
Economic impact of pandemic comprised of the recommendations related to revival of the economic and
social activities; social distancing; lockdown; charity; apathy; foreign help; economic impact of the
pandemic at domestic and international levels; economic relief to individuals and small and large scale
enterprises. Thus the study supported the view that it is through the process of framing that media attains
the ability to attract attention towards a particular issue (Entman, 2007). In terms of health crisis
especially in the scenario of COVID-19 pandemic media framing helped in imparting significance to the
information regarding pandemic (Liu & Kim, 2011).
Although this research was mostly exploratory in nature because of the unfolding patterns of the
pandemic coverage during the selected time period but it helped the researchers in locating the following
areas for future inquiry:

Journal of Business and Social Review in Emerging Economies Vol. 6, No 4, December 2020
1274
Role of Journalists and reporters in health emergencies as front line workers
Dependence of public policy makers on media framing in matters related to public health
Media coverage of pandemics and its effects on stimulating strokes of panic and fear among the
audience
References
Abraham T (2007) Twenty-First Century Plague: The Story of SARS. Baltimore, MD: John
Hopkins University Press.
Ahmar, M. (2020, April 17). As the pandemic crisis deepens. The Express Tribune. Retrieved from
https://tribune.com.pk/story/2199641/6-pandemic-crisis-deepens/
Ahmed, T. (2020, April 16). No SOPs for disposal of Covid-19 waste in Sindh. The Express
Tribune. Retrieved from https://tribune.com.pk/story/2198989/no-sops-disposal-covid
19-waste-sindh
April 19: Sindh record highest single-day tally of Covid-19 cases. (2020, April 19). The Express
Tribune. Retrieved from https://tribune.com.pk/story/2201667/1-live-new-cases-reported
punjab-islamabad-nationwide-tally-hits-7993/
Barry, J. M. (2009). Pandemics: avoiding the mistakes of 1918. Nature, 459(7245), 324-325
China pledges more help to Pakistan in fight against corona pandemic. (2020, April 09). The
Express Tribune. Retrieved from https://tribune.com.pk/story/2194377/1-china-pledges
help-pakistan-corona-fight/
Coronavirus: China rejects call for probe into origins of disease. (2020, April 24). BBC News.Retrieved
from https://www.bbc.com/news/world-asia-china-52420536
Covid-19 relief fund: PM urges people to donate so govt can take care of those in need. (2020, April
01). Dawn. Retrieved from https://www.dawn.com/news/1545558
Davis M (2005) .The Monster at Our Door: The Global Threat of Avian Flu. New York: The New
Press.
Durham, F. D. 1998. News frames as social narratives: TWA Flight 800. Journal of
Communication, 48(4): 100–117.
Dry S and Leach M (eds) (2010) Epidemics: Science, Governance and Social Justice. London:
Earthscan.
Ducharme, J. (Feb 07, 2020). News Coverage of Coronavirus in 2020 is Very Different Than it Was
For Ebola in 2018. Time. Retrieved from https://time.com/5779872/coronavirus ebola-
news coverage/
Elbe ,S. (2010) Security and Global Health. Cambridge: Polity Press.
Entman, R . (1993) . Framing: Toward clarification of a fractured paradigm. Journal of
Communication 43(4): 51–58.
Entman R (2007) Framing bias: Media in the distribution of power. Journal of Communication
57: 163–173.
Fidler D (2004) SARS, Governance and the Globalization of Disease. New York: Palgrave
Macmillan.
Govt prepares to ease lockdown, considers 15,525 Covid-19 cases as below projections. Dawn.
Retrieved from https://tribune.com.pk/story/2209564/new-cases-reported-punjab national-tally-
hits-14885
Here’s how you can get checked for coronavirus in Pakistan. (2020, April 01). Dawn. Retrieved from
https://www.dawn.com/news/1538338
Haider-Markel, D. P., Delehanty, W. and Beverlin, M. 2007. Media framing and racial attitudes in the
aftermath of Katrina. Policy Studies Journal, 35: 587–605.
Illyas, F. (2020, April, 11). Gulshan, Saddar report highest number of Covid-19 cases in Karachi. Dawn.
Retrieved from https://www.dawn.com/news/1548197/gulshan-saddar-report highest
number-of-covid-19-cases-in-karachi
Junaidi, I. (2020, April 15). Pakistan becomes 40th country with 1oo COVID-19 deaths. Dawn.
Retrieved from https://www.dawn.com/news/1549287
Journal of Business and Social Review in Emerging Economies Vol. 6, No 4, December 2020
1275
Kahneman, D. and Tversky, A. 1979. Prospect theory: An analysis of decision under
risk. Econometrica, 47: 263–291.
Liu, B. F., & Kim, S. (2011). How organizations framed the 2009 H1N1 pandemic via social and
traditional media: Implications for US health communicators. Public Relations
Review, 37(3), 233-244.
Luther, C. and Zhou, X. 2005. Within the boundaries of politics: News framing of SARS in China
and the United States. Journalism and Mass Communication Quarterly, 82: 857 872.
Pakistan carries out whole genome sequencing to help combat COVID-19. (2020, April, 01). The
Express Tribune. Retrieved from https://tribune.com.pk/story/2188185/1-pakistan
carries-whole-genome sequencing-help-combat-covid-19/
Pieri, E. (2019). Media Framing and the Threat of Global Pandemics: The Ebola Crisis in UK Media
and Policy Response. Sociological Research Online, 24(1), 73-92.
Price, V., Tewksbury, D. and Powers, E. 1997. Switching trains of thought: The impact of news frames
on readers’ cognitive responses. Communication Research, 24: 481–506
Rehman, F. Covid-19 and impact on economy. The Express Tribune. Retrieved from
https://tribune.com.pk/story/2202021/2-covid-19-impact-economy/
Schulz A, Thanh T, Paulheim H, et al. (2013) A fine-grained sentiment analysis approach for
detecting crisis related microposts. In: Proceedings of the10th international ISCRAM
confer- ence 2013 (ed T Comes, F Fiedrich and S Fortier, et al.), Baden.
Scheufele, D. A., & Tewksbury, D. (2007). Framing, agenda setting, and priming: The evolution of
three media effects models. Journal of communication, 57(1), 9-20.
Saleem, H. (2020, April 02). 10 Strategies to help your freelance business survive the COVID-19
Pandemic. Dawn. Retrieved from https://www.dawn.com/news/1544130
Smart lockdowns lead to effective handling of Covid-19 in Pakistan. (April 11, 2020). Retrieved from
https://www.dawn.com/news/1573697
Stephenson N and Jamieson M (2009) Securitising health: Australian newspaper coverage of
pandemic influenza. Sociology of Health and Illness 4: 525–539.
WHO oversees research to develop corona treatment in Pakistan. (2020, April 16). Dawn. Retrieved
fromhttps://www.dawn.com/news/1549628/who-oversees-research-to develop-corona-
treatment-in-pakistan
WHO and COVID -19. (April 19, 2020). Dawn. Retrieved from
https://www.dawn.com/news/1550454
World Health Organization. (2020, April 25). Coronavirus. Retrieved fromhttps://www.who.int/health-
topics/coronavirus#tab=tab_1

Journal of Business and Social Review in Emerging Economies Vol. 6, No 4, December 2020
1276
Journal of Business and Social Review in Emerging Economies Vol. 6, No 4, December 2020
1277
Volume and Issues Obtainable at Center for Sustainability Research and Consultancy
Journal of Business and Social Review in Emerging Economies ISSN: 2519-089X (E): 2519-0326
Volume 6: No. 4, December 2020
Journal homepage: www.publishing.globalcsrc.org/jbsee
Corporate Social Responsibility for Competitive Advantage in Project
Management: Evidence from Multinational Fast-Food Companies in Pakistan
1Mariam Sohail, 2Shahid Iqbal, 3Waheed Asghar, 4Syed Arslan Haider 1PhD Scholar, Department of Management,Superior University, Lahore Campus, Pakistan,
[email protected] 2Assistant Professor, Management Studies Department,Bahria University, Islamabad Campus, Pakistan,
[email protected] 3Director in Technical Education and Vocational Training Authority, Government of the Punjab, Lahore,
Pakistan, [email protected]; [email protected] 4PhD Scholar, Department of Management, Sunway University Business School (SUBS),
Sunway University, Selangor Darul Ehsan, Malaysi, [email protected]
ARTICLE DETAILS ABSTRACT History Revised format: November 2020 Available Online: December 2020
The aim of current articleis to examine the relationship between
corporate social responsibility and competitive advantage in Project
Management. This research used “Quantitative Methods” in which
data was collected from five multinational fast-food companies of
Pakistan by use of Likert Scale questionnaire. A sample of 80 persons
was selected by using random sampling technique who are engaged
in the selection and execution of corporate social responsibility
activities. Data was statistically analyzed using the SPSS software
version 20.Findings indicate that most of the multinational fast-food
companies of Pakistan are engaged in corporate social responsibility
practices. So, there is significant positive relationship between
corporate social responsibility and competitive advantage.
© 2020 Center for Sustainability Research and Consultancy Pakistan under
a Creative Commons Attribution-NonCommercial-ShareAlike 4.0
Keywords Corporate social
responsibility; Competitive
advantage; Multinational
companies; Competitors;
Project Management;
Stakeholders
JEL Classification
M10, M14
Corresponding author’s email address: [email protected]
Recommended citation: Sohail, M., Iqbal, S., Asghar, W. & Haider, S. A. (2020). Corporate Social
Responsibility for Competitive Advantage in Project Management: Evidence from Multinational Fast-
Food Companies in Pakistan. Journal of Business and Social Review in Emerging Economies, 6(4),
1277-1288
1. Introduction
Nyuur, Ofori and Amponsah (2019) states that organizations now-a-days are concerned for stakeholders
and social issues and want to become good corporate citizens. Ağan et al. (2016) discussed that the
honor of an organization depends on the directing values of an organization. Lee et al. (2016) said that
organizations have become superior economic institutions of the world from respective ambiguity over
the last one and a half century. Prior studies also indicated that in modern business world organizations
are interested in ethics and values are considered an important element of success (Solomon, 2016;
Farooq et al., 2020). Moreover, organizational values are continually fluctuating because of various
Journal of Business and Social Review in Emerging Economies Vol. 6, No 4, December 2020
1278
elements.
Corporate social responsibility (CSR) contains the actions by which minimum responsibilities of an
organization to the stakeholders are raised (Alshbili &Elamer, 2020). Social responsibility means
constructive contribution of an organization to the society.CSR is the involvement of an organization in
the actions by using its resources that would assist the society (Noor et al., 2020). CSR helps in building
a constructive and long-term relations with the society. If an organization is working for the welfare of
the society i.e. giving donations, they will have to pay less tax as donations for these activities are
exempt from tax and this decreases the burden of tax on an organization. Although, competitive
advantage (CA) is the organizational ability to consume its rare resources and skills in the selection and
execution of schemes (Shaukat, Qiu & Trojanowski, 2016). CA supports organizations to yield higher
profits as compared to their competitors, increase the market share and lead in the industry.The CSR is a
valuable approach which helps the organizations in getting a competitive advantage over its rivals and
researchers are interested in this topic (Farooq et al., 2020, Noor et al., 2020).
Therefore, the purpose of this study is to explore the CSR activities of the multinational fast-food
companies in Pakistan and to investigate the relationship between corporate social responsibility and
competitive advantage. The previous studies in this field had determined the role of corporate social
responsibility in determination of competitive advantage for multinational fast-food organization. But
this report will cover the future concerns of fast-food companies to use the extent of corporate social
responsibility to build strategies for Pakistan. It is important for the fast-food organization, so to drive
the ideas and assist in selection of CSR activities that construct strategies either for short term or for
long term.
2. Literature Review
2.1 Corporate Social Responsibility The concept corporate social responsibility (CSR) is an important ethical issue which organizations
should consider while making decisions (Jesús Herrera Madue, 2016). A business term CSR evolved in
the last years of twentieth century when a large number of organizations diverted their attention to the
effect of organizational actions on environment and society (Ahmad, Shafique & Jamal, 2020). Though,
CSR is gaining importance now-a-days. Essentially, CSR is the responsibility of an organization to its
society, especially the responsibility to its stakeholders and those who affect the organizational decisions
and practices (Mahmood &Alsayegh, 2020).CSR is the activities of an organization in addition to its
core expertise that are operated to provide benefit to the society. CSR is associated with the actions in
which minimum responsibilities of an organization to the stakeholders exceeds which are described by
rules (Arslanb & Demirtaşc, 2016). It is valuable for the organizations to work for the welfare of society
by using its resources. The society is an essential component of the organization which provides human
resources, consumers, raw materials and investors (Schulz & Flanigan, 2016). Organizations give
extensive response of goodwill to the society which is tangible and measurable(Bakhsh, Mahmood &
Mahmood, 2019).
Organizations should examine their CSR practices by using the similar plans that direct their important
business decisions. Organizations will determine that CSR is not only a cost, restriction, or a charitable
act but can also lead to innovation, opportunity and competitive (Odipo& Njeru, 2016).CSR is the
motive to support and obligate organizations to accept more accountability for their conduct (Advantage,
2020). Organizations take their responsibilities of providing employment, eradicating favoritism and
preventing pollution (Joscha Nollet, 2015). Furthermore, CSR is a concept in which organization takes
the responsibility of helping the society and the monetary concerns of its investors (Wójcik,
2016).Recent study by Waple, & Brachle (2020) specified that CSR contains four components:
philanthropic, legal, social and economic responsibility shown in pyramid form where philanthropic is at
the top and it follows legal, social and economic responsibility directed towards the bottom of an
organization. Economic responsibility is central obligation of an organization regarding organizational

Journal of Business and Social Review in Emerging Economies Vol. 6, No 4, December 2020
1279
profits by satisfying the wants and requirements of customers (Bakhsh et al., 2019). Legal responsibility
is the obligation of an organization to follow law. An organization that performs the social responsibility
practices, we will state that it follows the principles related to the business ethics. Philanthropic
responsibility considers that organizations are good corporate citizens and add to the resources of
society. CSR includes two important elements: transparency and responsibility. No doubt the basic
purpose of organizations is to perform financially and to earn profits but they are also responsible to the
stakeholders.
Additionally, the subject of discussion in the CSR field is that an organization survives with the aim of
earning profit or to seek other activities. According to the stakeholders approach the main purpose of the
organization is to work for the welfare of their stakeholders (Zhang et al., 2020). An organization should
perform the functions that are related with profit and also be the good corporate citizen. Organizations
should keep in mind that how their functions and polices will influence the employees, environment,
community and society (Lu et al., 2020).
2.2 Competitive Advantage
Competitive advantage (CA) is the organization’s ability to obtain expertise in order to operate in a
better way as compared to its competitors and to supply best quality goods and services than their rivals
(Saeidi et al., 2015).CA is the picture in which an organization generates greater economic value than its
competitors (Zhao et al., 2019). Economic value is the difference between full economic cost of goods
or services and advantage perceived by a buyer of organizational goods or services. There will be the
competitive equality when an organization generates the same economic value as its competitors or there
will be competitive disadvantage when an organization generates less economic value than its
competitors (Nyuur et al., 2019).
According to (Opilo, Mulili & Kimani., 2018) CA is a valuable asset for an organization as it guarantees the
progress of an organization even if the performance of economy is poor. If an organization has selected
its own market segment and is superior to its rivals because of its cost, it will be a market leader and
customers will prefer this brand.CA is that how organizations achieve their targets while competing with
other rivals (Su et al., 2016). To achieve their goals organizations must outperform than their
competitors in the industry. In this case organizations could not fulfill the wants of their customers
efficiently and they could charge high prices to increase their profits. Similarly, if an organization is
cost-effective, it would charge low price to its customers which will lead to increase in revenues (Aksak
et al., 2016).Organizations not only get competitive advantage over its rivals but also they sustain it for a
long time. According to the (Lee et al., 2016), that it’s the competitive advantage because of which
customers prefer the products of a company over its competitors. Organizations can get sustainable CA
by using generic strategies such as cost leadership, differentiation and focus (Yin & Jamali, 2016).
Multinational fast-food organizations have various important channels to achieve competitive advantage.
(Wickert et al.,2016), described that an organization uses cost leadership strategy in which it produces
the goods at low cost to achieve more profits than its competitors. Organizations can also use
differentiation strategy in which they offer unique products or services to customers than their
competitors. In focus strategy, organizations concentrate on a narrow segment of the market and in this
segment cost leadership or differentiation is achieved and finally this market segment will be less
appealing for the rivals. Organizations can also get competitive advantage by using their resources.
Some of the resources can generate advantage for an organization as favorable organizational prestige,
brand equity, organizational ability to consume resources efficiently like delivery of the products is
speedy than rivals.
2.3 Corporate Social Responsibility and Competitive Advantage
Various studies have been conducted on CSR (JoschaNollet, 2015; Alshbili et al., 2020).Prior studies
examined the relationship between CSR and competitive advantage and stated that every organization
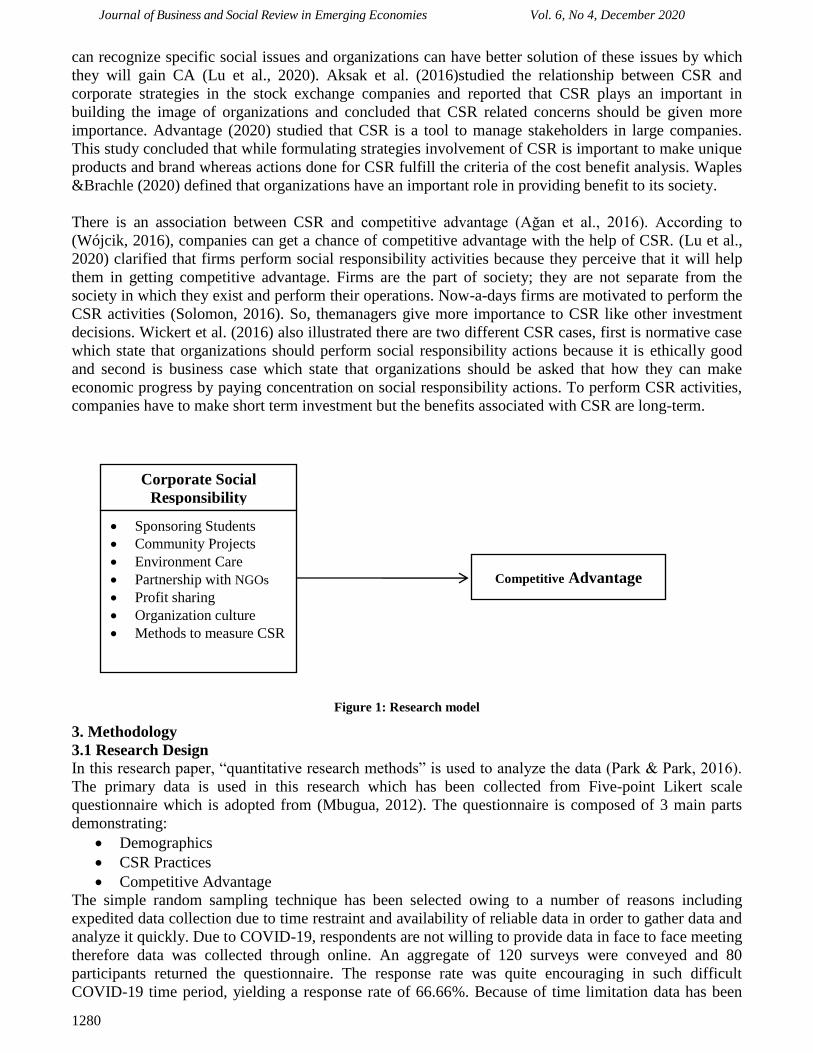
Journal of Business and Social Review in Emerging Economies Vol. 6, No 4, December 2020
1280
can recognize specific social issues and organizations can have better solution of these issues by which
they will gain CA (Lu et al., 2020). Aksak et al. (2016)studied the relationship between CSR and
corporate strategies in the stock exchange companies and reported that CSR plays an important in
building the image of organizations and concluded that CSR related concerns should be given more
importance. Advantage (2020) studied that CSR is a tool to manage stakeholders in large companies.
This study concluded that while formulating strategies involvement of CSR is important to make unique
products and brand whereas actions done for CSR fulfill the criteria of the cost benefit analysis. Waples
&Brachle (2020) defined that organizations have an important role in providing benefit to its society.
There is an association between CSR and competitive advantage (Ağan et al., 2016). According to
(Wójcik, 2016), companies can get a chance of competitive advantage with the help of CSR. (Lu et al.,
2020) clarified that firms perform social responsibility activities because they perceive that it will help
them in getting competitive advantage. Firms are the part of society; they are not separate from the
society in which they exist and perform their operations. Now-a-days firms are motivated to perform the
CSR activities (Solomon, 2016). So, themanagers give more importance to CSR like other investment
decisions. Wickert et al. (2016) also illustrated there are two different CSR cases, first is normative case
which state that organizations should perform social responsibility actions because it is ethically good
and second is business case which state that organizations should be asked that how they can make
economic progress by paying concentration on social responsibility actions. To perform CSR activities,
companies have to make short term investment but the benefits associated with CSR are long-term.
Figure 1: Research model
3. Methodology
3.1 Research Design
In this research paper, “quantitative research methods” is used to analyze the data (Park & Park, 2016).
The primary data is used in this research which has been collected from Five-point Likert scale
questionnaire which is adopted from (Mbugua, 2012). The questionnaire is composed of 3 main parts
demonstrating:
Demographics
CSR Practices
Competitive Advantage
The simple random sampling technique has been selected owing to a number of reasons including
expedited data collection due to time restraint and availability of reliable data in order to gather data and
analyze it quickly. Due to COVID-19, respondents are not willing to provide data in face to face meeting
therefore data was collected through online. An aggregate of 120 surveys were conveyed and 80
participants returned the questionnaire. The response rate was quite encouraging in such difficult
COVID-19 time period, yielding a response rate of 66.66%. Because of time limitation data has been
Competitive Advantage
Corporate Social
Responsibility
Sponsoring Students
Community Projects
Environment Care
Partnership with NGOs
Profit sharing
Organization culture
Methods to measure CSR

Journal of Business and Social Review in Emerging Economies Vol. 6, No 4, December 2020
1281
collected within three months (i.e. February 2020 to April 2020) for this study. Population for this
research consists of managers, project managers working in five multinational fast-food organizations.
The SPSS version 26.0 software was used for analyzing the responses received from the respondents to
confirm the data reliability and further analysis (Pallant, 2020).
Out of these respondents, 61% were male and 39% were female, as the presence of women in
construction projects in Pakistan is quite low. The majority of the sample fell within the ages of 21–30
years old. With respect to the educational level, large numbers of respondents are Master degree holders.
Also, the respondents of current study had majority Forty-six (58%) employees have work experience of
1-5 years, twenty-nine (36%) employees have work experience of 6-10 years and five (6%) employees
have work experience of 11-15 years. All these work experiences of employees were in their current
organizations.
Table 1: Descriptive Analysis
Frequency Percent
Gender Male 49 61
Female 31 39
Age 21-30 39 49
31-40 24 30
41-50 17 21
Qualification Intermediate 5 6
Bachelor 19 24
Master 56 70
Experience 1-5 years 46 58
6-10 years 29 36
11-15 years 5 6
3.2 Corporate Social Responsibility Practices
8% employees responded that their organizations sponsor to the brilliant and needy students to a very
great extent, 25% employees responded that their organizations sponsor students to a great extent and
59% employees responded that their organizations sponsor students to a moderate extent.
Figure 2: Sponsoring Students
44% employees responded that their organizations are involved in community projects to a very great
extent, 52%employees responded that their organizations are involved in community projects to a great
extent and 4% employees responded that their organizations are connected with community projects to a
moderate extent.

Journal of Business and Social Review in Emerging Economies Vol. 6, No 4, December 2020
1282
Figure 3: Community Projects
46% employees responded that their organizations do environment care to a very great extent because
their production processes are environment friendly, 51% employees responded that their organizations
do environment care to a great extent and 3% employees responded that their organizations do
environment care to a moderate extent.
Figure4: Environment Care
56% employees responded that their organizations have partnership with NGOs in different activities to
a very great extent, 34% employees responded that their organizations have partnership with NGOs to a
great extent and 6%employees responded that their organizations have partnership with NGOs to a
moderate extent.
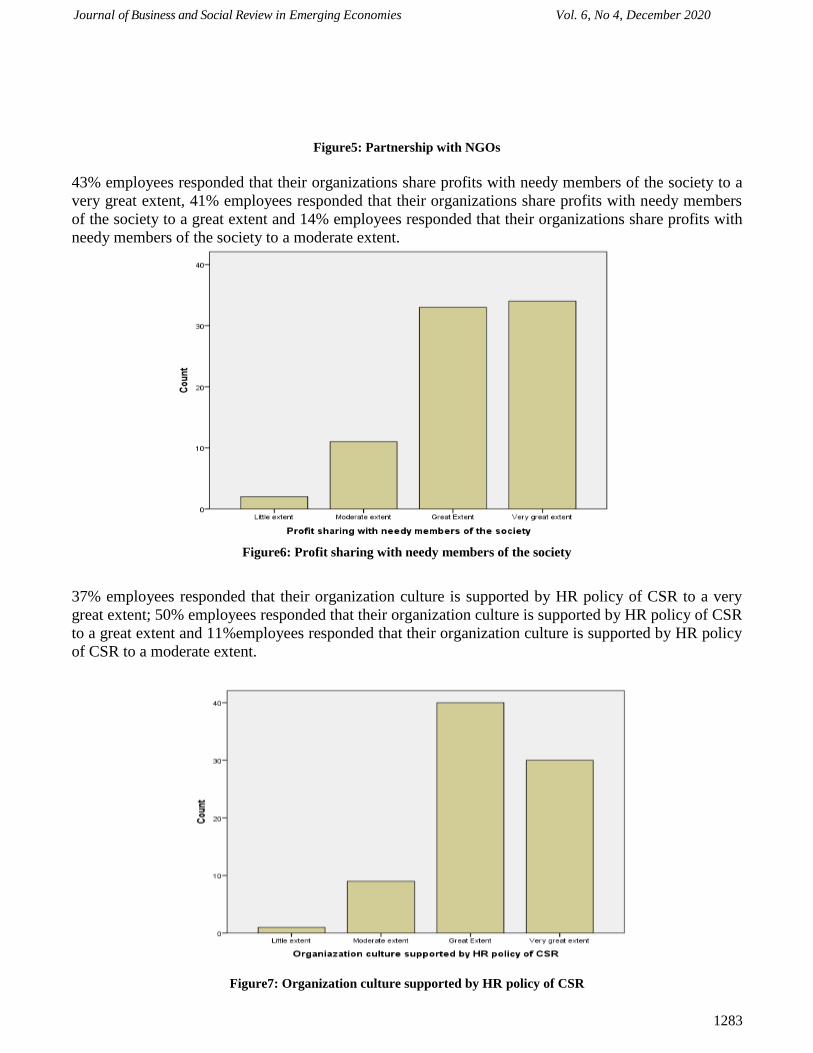
Journal of Business and Social Review in Emerging Economies Vol. 6, No 4, December 2020
1283
Figure5: Partnership with NGOs
43% employees responded that their organizations share profits with needy members of the society to a
very great extent, 41% employees responded that their organizations share profits with needy members
of the society to a great extent and 14% employees responded that their organizations share profits with
needy members of the society to a moderate extent.
Figure6: Profit sharing with needy members of the society
37% employees responded that their organization culture is supported by HR policy of CSR to a very
great extent; 50% employees responded that their organization culture is supported by HR policy of CSR
to a great extent and 11%employees responded that their organization culture is supported by HR policy
of CSR to a moderate extent.
Figure7: Organization culture supported by HR policy of CSR

Journal of Business and Social Review in Emerging Economies Vol. 6, No 4, December 2020
1284
26% employees responded that their organizations have methods to measure CSR obtaining desired
results to a very great extent, 50% employees responded that their organization have methods to measure
CSR obtaining desired results to a great extent and 24% employees responded that their organization
have methods to measure CSR obtaining desired results to a moderate extent.
Figure 8: Methods to measure CSR obtaining desired results
The findings indicate that multinational fast-food companies of Pakistan are actively engaged in the
corporate social responsibility practices.
3.3 Relationship between CSR and Competitive Advantage
Pearson correlation coefficient test was appliedtofind the relationship between corporate social
relationship and competitive advantage. This statistical test measures whether there is any association
between CSR and competitive advantage.
Table 1 represents the correlations between corporate social responsibility and competitive advantage.
There is significant positive relationship between CSR and competitive advantage (r = 0.605, p = .000).
Thus, we can say that the multinational companies which are actively engaged in CSR will get the
competitive advantage over its rivals. Table 2: Correlation Analysis
4. Conclusion
The findings of the paper indicate that most of the multinational fast-food companies in Pakistan are
engaged in corporate social responsibility practices. They are voluntarily engaged in these activities.
Pearson correlation coefficient was used to find the association between CSR and competitive advantage
Corporate Social Responsibility
Competitive Advantage
Pearson Correlation .605**
Sig. (2-tailed) .000
N 80
**. Correlation is significant at the 0.01 level (2- tailed).

Journal of Business and Social Review in Emerging Economies Vol. 6, No 4, December 2020
1285
which represent that there is significant positive relationship between CSR and competitive advantage.
Multinationals which are involved in CSR practices will have more competitive advantage as compared
to the companies which are not involved in CSR practices.
5. Limitations of the Study
There were limited resources available for this research such as shortage of finance and time. Small
sample size is also the limitation of this study. Only quantitative method of research was used in which
questionnaires were distributed among the employees of five multinational fast-food companies and
results were statistically analyzed but there is also need of qualitative research to get more detailed
information of the topic.
6. Future Research Suggestions
Further study is needed to confirm the relationship between corporate social responsibility and
competitive advantage and to overcome the limitations of current research. Future research can be done
by conducting interviews of human resource managers of the multinational fast food companies to get
their perceptions and views about CSR and competitive advantage. Industries other than fast food can be
studied to find out the strength of relationship between CSR and competitive advantage in each industry.
References
Advantage, C. (2020). Corporate Social Responsibility. CSR and Socially Responsible Investing
Strategies in Transitioning and Emerging Economies, 65.
Ağan, Y., Kuzey, C., Acar, M. F., &Açıkgöz, A. (2016). The relationships between corporate social
responsibility, environmental supplier development, and firm performance. Journal of Cleaner
Production, 112, 1872-1881.
Ahmad, S., Shafique, O., & Jamal, W. N. (2020). Impact of Perceived Corporate Social Responsibility
on Banks’ Financial Performance and the Mediating Role of Employees’ Satisfaction and
Loyalty in Pakistan. Journal of Accounting and Finance in Emerging Economies, 6(3), 765-774.
Aksak, E. O., Ferguson, M. A., &Duman, S. A. (2016). Corporate social responsibility and CSR fit as
predictors of corporate reputation: A global perspective. Public Relations Review, 42(1), 79-81.
Alshbili, I., &Elamer, A. A. (2020). The influence of institutional context on corporate social
responsibility disclosure: a case of a developing country. Journal of Sustainable Finance &
Investment, 10(3), 269-293.
Arslanb, A. A. A. A., &Demirtaşc, Ö. (2016). A strategic influence of corporate social responsibility on
meaningful work and organizational identification, via perceptions of ethical leadership.
Procedia-Social and Behavioral Sciences, 235, 259-268.
Bakhsh, A., Mahmood, Z., & Mahmood, A. B. (2019). An International Investigation of the Institutional
Factors Driving Sustainability Assurance. Journal of Business and Social Review in Emerging
Economies, 5(2), 367-378.
Farooq, Q., Liu, X., Fu, P., & Hao, Y. (2020). Volunteering sustainability: An advancement in corporate
social responsibility conceptualization. Corporate Social Responsibility and Environmental
Management. Retrieved from: https://doi.org/10.1002/csr.1893
Jesús Herrera Madue, M. L. (2016). Relationship between corporate social responsibility and
competitive performance in Spanish SMEs: Empirical evidence from a stakeholders’ perspective.
BRQ Business Research Quarterly, 55-72.
JoschaNollet, G. F. (2015). Corporate Social Responsibility and Financial Performance: A non-linear
and disaggregated approach. Business and Society Review, 237-256.
Lee, E. M., Lee, H. J., Pae, J. H., & Park, S. Y. (2016). The important role of corporate social
responsibility capabilities in improving sustainable competitive advantage. Social Responsibility
Journal. 12 (4), 642-653. Retrieved from: https://doi.org/10.1108/SRJ-11-2015-0163
Lu, J., Ren, L., Zhang, C., Rong, D., Ahmed, R. R., &Streimikis, J. (2020). Modified Carroll’s pyramid
of corporate social responsibility to enhance organizational performance of SMEs industry.
Journal of Cleaner Production, 271, 122456.
Journal of Business and Social Review in Emerging Economies Vol. 6, No 4, December 2020
1286
Mahmood, Z., &Alsayegh, M. F. (2020). The Governance of Corporate Sustainability in the Middle
East: Preliminary Insights. Journal of Business and Social Review in Emerging Economies, 6(2),
715-731.
Mbugua, T. W. (2012). Corporate social responsibility and competitive advantage in multinational food
and beverage companies in Kenya (Doctoral dissertation). Retrieved from:
http://erepository.uonbi.ac.ke:8080/xmlui/handle/123456789/10696
Nie, N. H., Bent, D. H., & Hull, C. H. (1975). SPSS: Statistical package for the social sciences, 227.
Noor, A., Farooq, M., Yamin, M., & Khan, S. N. (2020). Corporate Social Responsibility and its Nexus
with Firm Performance and Institutional Ownership: An Emerging Market Context. Journal of
Business and Social Review in Emerging Economies, 6(2), 845-858.
Nyuur, R. B., Ofori, D. F., &Amponsah, M. M. (2019). Corporate social responsibility and competitive
advantage: A developing country perspective. Thunderbird International Business Review, 61(4),
551-564.
Odipo, B. A., & Njeru, A. W. (2016). To examine the influence of market place as a factor of corporate
social responsibility on competitive advantage within pharmaceutical companies in Kenya.
International Journal of Academic Research in Business and Social Sciences, 6(7), 130-141.
Opilo, P. M., Mulili, B., & Kimani, S. (2018). Corporate social responsibility and competitive advantage
perspectives from employees of Safaricom Kenya Limited. Journal of Marketing and
Communication, 1(2), 1-21.
Pallant, J. (2020). SPSS survival manual: A step by step guide to data analysis using IBM SPSS.
Routledge.
Park, J., & Park, M. (2016). Qualitative versus quantitative research methods: Discovery or
justification?.Journal of Marketing Thought, 3(1), 1-8.
Saeidi, S. P., Sofian, S., Saeidi, P., Saeidi, S. P., &Saaeidi, S. A. (2015). How does corporate social
responsibility contribute to firm financial performance? The mediating role of competitive
advantage, reputation, and customer satisfaction. Journal of business research, 68(2), 341-350.
Scherer, C. W. (2016). Walking and Talking Corporate Social Responsibility: Implications of Firm Size
and Organizational Cost. Journal of Management Sciences.
Schulz, S. A., & Flanigan, R. L. (2016). Developing competitive advantage using the triple bottom line:
A conceptual framework. Journal of Business & Industrial Marketing. 31 (4), 449-458.
Retrieved from: https://doi.org/10.1108/JBIM-08-2014-0150
Shaukat, A., Qiu, Y., &Trojanowski, G. (2016). Board attributes, corporate social responsibility strategy,
and corporate environmental and social performance. Journal of Business Ethics, 135(3), 569-
585.
Solomon, G. T. (2016). External Determinants and Financial Outcomes of an Eco-friendly Orientation in
Smaller Manufacturing Firms. Journal of Small Business Management, 5–25.
Su, W., Peng, M. W., Tan, W., & Cheung, Y. L. (2016). The signaling effect of corporate social
responsibility in emerging economies. Journal of business Ethics, 134(3), 479-491.
Waples, C. J., &Brachle, B. J. (2020). Recruiting millennials: Exploring the impact of CSR involvement
and pay signaling on organizational attractiveness. Corporate Social Responsibility and
Environmental Management, 27(2), 870-880.
Wickert, C., Scherer, A. G., & Spence, L. J. (2016). Walking and talking corporate social responsibility:
Implications of firm size and organizational cost. Journal of Management Studies, 53(7), 1169-
1196.
Wójcik, P. (2016). How creating shared value differs from corporate social responsibility. Journal of
Management and Business Administration. Central Europe, 24(2), 32-55.
Yin, J., & Jamali, D. (2016). Strategic corporate social responsibility of multinational companies
subsidiaries in emerging markets: Evidence from China. Long Range Planning, 49(5), 541-558.
Zhang, Q., Cao, M., Zhang, F., Liu, J., & Li, X. (2020). Effects of corporate social responsibility on
customer satisfaction and organizational attractiveness: A signaling perspective. Business Ethics:
A European Review, 29(1), 20-34.
Zhao, Z., Meng, F., He, Y., & Gu, Z. (2019). The influence of corporate social responsibility on

Journal of Business and Social Review in Emerging Economies Vol. 6, No 4, December 2020
1287
competitive advantage with multiple mediations from social capital and dynamic capabilities.
Sustainability, 11(1), 218.
Appendix:
1) Questionnaire Section A: General Information
1. Gender
Male ( ) Female ( )
2. What is your age group?
21-30 ( ) 31-40 ( ) 41-50 ( ) 50+ ( )
3. What is your level of education?
Intermediate ( )Bachelor( ) Master ( )
4. How many years of work experience do you have in this organization?
Section B: Corporate Social Responsibilities Practices
To what extent does your company is engaged in each of the following Corporate Responsibility
practices
1. Sponsoring brilliant but needy students.
Not at all Little extent Moderate extent Great Extent Very great extent
1 2 3 4 5
2. Community projects such as drilling bore holes for the semi-arid and arid areas.
Not at all Little extent Moderate extent Great Extent Very great extent
1 2 3 4 5
3. Care for the environment through use of environment friendly production processes.
Not at all Little extent Moderate extent Great Extent Very great extent
1 2 3 4 5
4. Partner with Non-Governmental Organizations’ in various activities.
Not at all Little extent Moderate extent Great Extent Very great extent
1 2 3 4 5
5. Share profits with under privileged members of the society through initiatives that
explicitly state this.
Not at all Little extent Moderate extent Great Extent Very great extent
1 2 3 4 5
6. Have an organization culture reinforced through the Human resource policy of fostering
CSR in the day to day running of the organization.
Not at all Little extent Moderate extent Great Extent Very great extent
1 2 3 4 5
7. Have a think tank within the organizations strategy to deliberately choose and execute CSR
activities.
Not at all Little extent Moderate extent Great Extent Very great extent
1 2 3 4 5
8. Have a budgetary allocation in its financial planning cycle for achieving CSR activities
Not at all Little extent Moderate extent Great Extent Very great extent
1 2 3 4 5
9. Projects aimed at uplifting the orphans, sick and the homeless.
Not at all Little extent Moderate extent Great Extent Very great extent
1 2 3 4 5
10. Economically empowering community through establishing products that allow businesses
to thrive.
Not at all Little extent Moderate extent Great Extent Very great extent
1 2 3 4 5
11. Mechanisms of measuring effectiveness of CSR achieving desired outcome e.g.
benchmarking, balance score card.
Not at all Little extent Moderate extent Great Extent Very great extent
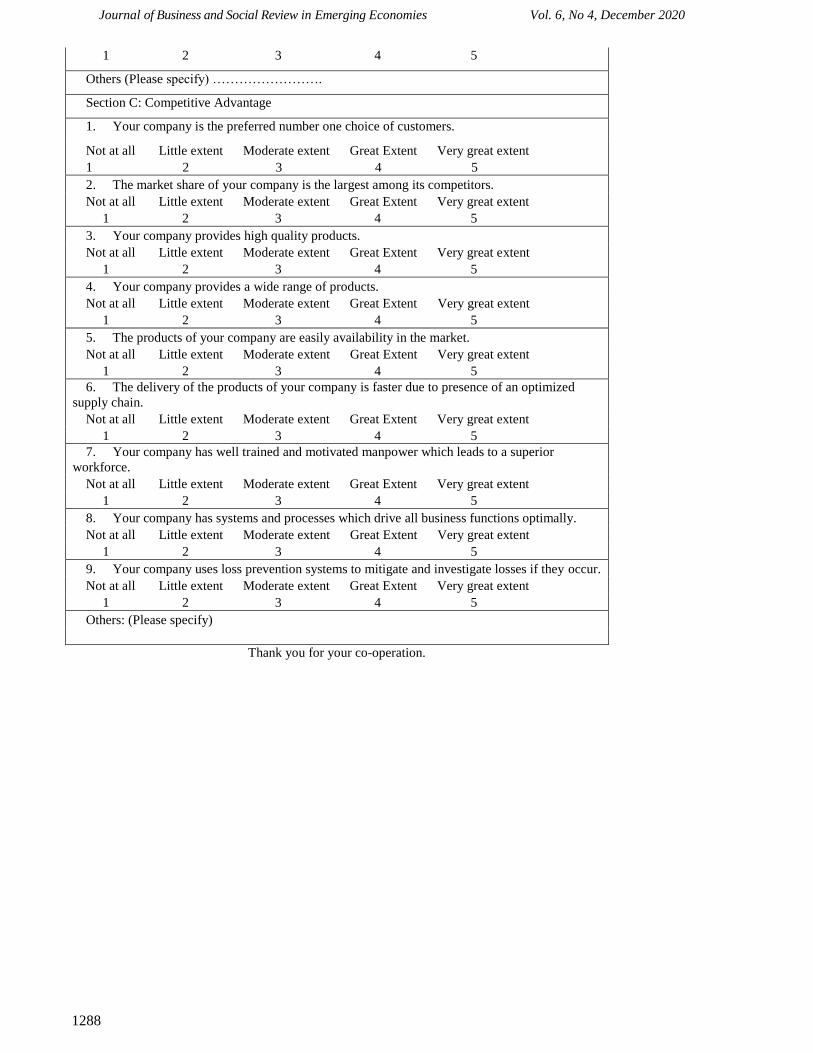
Journal of Business and Social Review in Emerging Economies Vol. 6, No 4, December 2020
1288
1 2 3 4 5
Others (Please specify) …………………….
Section C: Competitive Advantage
1. Your company is the preferred number one choice of customers.
Not at all Little extent Moderate extent Great Extent Very great extent
1 2 3 4 5
2. The market share of your company is the largest among its competitors.
Not at all Little extent Moderate extent Great Extent Very great extent
1 2 3 4 5
3. Your company provides high quality products.
Not at all Little extent Moderate extent Great Extent Very great extent
1 2 3 4 5
4. Your company provides a wide range of products.
Not at all Little extent Moderate extent Great Extent Very great extent
1 2 3 4 5
5. The products of your company are easily availability in the market.
Not at all Little extent Moderate extent Great Extent Very great extent
1 2 3 4 5
6. The delivery of the products of your company is faster due to presence of an optimized
supply chain.
Not at all Little extent Moderate extent Great Extent Very great extent
1 2 3 4 5
7. Your company has well trained and motivated manpower which leads to a superior
workforce.
Not at all Little extent Moderate extent Great Extent Very great extent
1 2 3 4 5
8. Your company has systems and processes which drive all business functions optimally.
Not at all Little extent Moderate extent Great Extent Very great extent
1 2 3 4 5
9. Your company uses loss prevention systems to mitigate and investigate losses if they occur.
Not at all Little extent Moderate extent Great Extent Very great extent
1 2 3 4 5
Others: (Please specify)
Thank you for your co-operation.

Journal of Business and Social Review in Emerging Economies Vol. 6, No 4, December 2020
1289
Volume and Issues Obtainable at Center for Sustainability Research and Consultancy
Journal of Business and Social Review in Emerging Economies ISSN: 2519-089X (E): 2519-0326
Volume 6: No. 4, December 2020
Journal homepage: www.publishing.globalcsrc.org/jbsee
Assessing the Mediating Role of Organization Learning Capability between the
Relationship of Green Intellectual Capital and Business Sustainability
1Muhammad Rizwan Sabir, 2Muqqadas Rehman, 3Waheed Asghar, 1Ph.D. scholar, Superior University, Lahore, Pakistan, [email protected]
2Director, IBA, University of the Punjab, Lahore, Pakistan, [email protected]
3Director, TEVTA,Punjab, Lahore, Pakistan, [email protected]
ARTICLE DETAILS ABSTRACT History Revised format: November 2020 Available Online: December 2020
There has been a lot of debate on intellectual capital and its
dimensions, except green intellectual capital (GIC). The economic
benefit of business not only eliminates the neediness of the region
but also invigorate the prosperity in the area; however, the heat of
financial interest among business competitor causes social inequality
and destruction of the environment. This paper is novel conception
due to the lack in prior studies as many did not focus on the
relationship between green intellectual capital (green human capital,
green structural capital and green relational capital) and business
sustainability (BS) in the context of a developing country; Pakistan
to assess the mediating role organization learning capability (OLC)
between the relationship of GIC and BS. The current study tried to
link two theories, natural resource-based view and intellectual
capital-based view (NRBV& ICBV), to conceptualize the intangible
resources that lead to business sustainability by assimilating the
"green" into conventional intellectual capital namely green
intellectual capital. Data were collected from 154 SME
manufacturing companies in Lahore, Pakistan. The simple random
sampling technique used for data collection. SPSS and AMOS
software is used for data analysis. The results show that all three
dimensions of green intellectual capital effect on business
sustainability. While discussing the mediation role of organizational
learning capability, OLC mediates the relationship between human
capital and business sustainability. Furthermore, OLC does not play
a mediation role between structural capital, relational capital, and
business sustainability. Finally, this study described limitations as
well as future directions
© 2020 Center for Sustainability Research and Consultancy Pakistan under
a Creative Commons Attribution-NonCommercial-ShareAlike 4.0
Keywords Green Intellectual Capital,
Green Human Capital,
Green Structural Capital,
Green Relational Capital,
Business Sustainability,
Organization Learning
Capability
JEL Classification
M10, M14
Corresponding author’s email address: [email protected]
Recommended citation: Sabir, M. R., Rehman, M. & Asghar, W. (2020). Assessing the Mediating Role
of Organization Learning Capability between the Relationship of Green Intellectual Capital and
Business Sustainability. Journal of Business and Social Review in Emerging Economies, 6(4), 1289-
1301
Journal of Business and Social Review in Emerging Economies Vol. 6, No 4, December 2020
1290
1. Introduction
The topic of Sustainability is getting more attention and interest in academics as well as practitioners.
There has been seen extensive deliberation and discussion regarding the conception of Sustainability. A
wide range of discussion is available on the significance of Sustainability along with the different ways
and means which is used for achieving and retaining it. The profits which are concerned about the
activities economically done in business is increasing the prosperity as well as the conditions of living
all over the world; nonetheless, it is leading towards the destructing the environment along with
inequality in society which is caused directly or indirectly (Sullivan et al., 2018). The research
conducted by Gong et al. (2018), indicated that the destruction in the environment is taking place and it
has measured that almost 60% of the environmentally friendly systems have been besmirched on a
global level. There is a need to take the step for solving the problems which are existing in the
environment; if it is not solved, then it will be increasing and continue to worsen the situation. On the
other hand, several companies are not considering the problems by saying that these are not due to the
activities of an organization which is impacting the environment, and they are just ignoring the issue.
Moreover, all the firms were not agreeing on the concept of Sustainability. The backgrounds and
scenarios of business are same as it was in the past, it has turned to be more different from the previous
landscape of business because the resources are limited, the use of technology is increasing, the markets
are developing, and the updated models used in the business is interfering the traditional methods
(Sullivan et al., 2018).The concept regarding Sustainability was firstly applied to deal through the
destruction and degradation in the natural environment along with its negative influence on the health of
human beings, societal wellness, and the growth in the economy. The "World Commission has defined
the term on Environment and Development (WCED, 1987)" which is pointing out that the concept of
Sustainability is referred as to the "development that meets the needs of the present generation without
compromising the ability of future generations to meet their own needs." This is used in literature
extensively and also applied to the three main results, named "economic, social, and environmental."
The issue needs quick attention; it should be discussed in the different firms, countries, and regions
because these all are changing a begun to use updated and diverse ways. They are vigorously observing
the different and innovative ways out which should be implemented to minimize the negative influence
of activities of humans on the environment along with improving the health of the public in which the
citizens are living and reaping profit. Nevertheless, numerous firms are still not sure about the steps they
need to take and what kind of strategies they should use to deal with it. The regulation and actions taken
by the government are not sufficient and adequate for the implementation of Sustainability in firms. For
dealing with the shift in the environment, the firms need to develop a strategy which is discretionary
however it is compulsory and significant for all of the organization operating in the market (Ray and
Grannis, 2015). In connection with the previous discussion, the different research studies have been
undertaken by many researchers which includes adopting the eco-friendly innovation (Aboelmaged and
Hashem, 2019), environmentally friendly management of human resource (Zaid et al., 2018), ecological
supply chain (Jabbour and Jabbour, 2016), ecofriendly purchasing (Zhang et al., 2018) as well as low
development of carbon (Ma et al., 2019).
The trend of research is increasing in the eco-friendly activities of the business. Besides this, investing in
intellectual capital (IC) is also related to protecting the environment, which is indicated as "green
intellectual capital (GIC)," which is taking into account both gaining and sustaining competitive edge
and meeting the needs of environmental management. Additionally, according to the research study of
Mårtensson and Westerberg (2016), the authors emphasized how the organization is developing for the
in house skills and abilities with using the last characteristic and features of the strategy of environment.
Disappointingly, the elements of in house skills and capabilities are absent in preventing the
environment (Cleff and Rennings, 1999; Sharma and Correa, 2005). Intellectual capital is a mixture of
all the intangible resources (Stewart, 1991), and these resources have the firm which is playing an
important role in the organization more willingly than tangible nature resources (Allameh et al., 2010).
In the new body of knowledge, the association in the IC, and the performance of the firm has been
developed. Conversely, GIC is not much known in the researchers and practitioners. It is worth noting
Journal of Business and Social Review in Emerging Economies Vol. 6, No 4, December 2020
1291
that the conception of GIC is a probable and credible solution regarding the concerns of Sustainability,
which has been debated in the above discussion. In 2008, Chen, in his research study, firstly acquaint
with the conception GIC and the researcher mentioned that it would be used in making continuous
improvements in the competitive advantage of the company. GIC is indicated as an entirety of the
resources which is tangible or the association of knowledge, which is protecting the environment as well
as modernization (Chang and Chen, 2012; Chen, 2008; Huang and Kung, 2011). The three key aspects
of GIC are known as "green human capital (GHC), green structural capital (GSC), and green relational
capital (GRC)."
The central theories of "Natural Resource-Based View (NRBV)," which is presented by Hart (1995)
along with the "Capital-based View (ICBV)" developed by Reed et al. (2006), was used in the
comprehensive research study. The theory of NRBV is complementing the theory, which is related to the
resource-based view (RBV) presented by Penrose (1959). Hart, in his research, indicated that the
resources and skills in the environment are essential for an organization in obtaining a competitive
advantage is helpful for the firm in the present day as well as in the future. However, from Hart (1995),
the theory of RBV is not taking into account the linkage in the natural environment and the firm. Apart
from this, the resources of an intangible organization are playing a crucial part in valuing the strategic
resources as well as the skills and abilities of the company.
On the other hand, there are some problems and issues in measuring the intangible resources of the
organization, which is recognized by the researcher like Bontis (1998). The researchers tried to
overcome the restricted assess on measuring the intangible side of the resources by presenting ICBV,
which is identified as the models for measurement of capital (Reed et al., 2006). In the main, the model
of ICBV focused on the resources which are intangible in nature or the resources that have intellectual
nature, and these are divided into three main categories, which are named as "namely human capital,
structural capital and relational capital." The current research study is trying to associate the said
theories for conceptualizing the intangible resources, which is leading towards the sustainable business
organization with using the integration of green intellectual capital in the traditional intellectual capital.
The current study will be undertaken for accessing the links of green intellectual capital and the
Sustainability of the business. This study was conducted to access the green intellectual capital-business
sustainability linkage.
According to the research of Mishal et al. (2017) and Cavicchi and Vagnoni (2017), the researchers
suggested that for enhancing the Sustainability of the firm intellectual capital is playing a vital role in the
organization. On the contrary, earlier research scholars have also proclaimed that the intellectual capital
of the firm is leading towards innovation (Allameh, 2018) and also improving the repute and
productivity (Bontis et al., 2018). Chen (2011) claimed the popularity of the conception of green politics
in the present corporate world. Numerous firms are trying their best to be a highly sustainable
organization. Previous research studies observed that the GIC is providing a detailed insight,
understanding, and information, which is helping the supervisors and owners of the organization in
achieving the best financial performance (Erinos and Rahmawati, 2017) along with the eco-friendly
competitive advantage (Firmansyah, 2017). As a result, it is very significant to create a link in the green
intellectual capital and Sustainability of business.
2. Literature Review and Hypothesis Development
2.1 Green Human Capital and Business Sustainability
According to the point of view of Wright et al. (1994), the researchers recommended that the human
capital of the organization is playing an essential role in sustaining the competitive advantage of the
organization. From the viewpoint of Subramaniam and Youndt (2005), the capital-related with the
human is a leading resource which is playing a crucial role in the success of the organization for the
reason that the skills and abilities which are possessed by the employees of the organization are
significant for sustaining a business organization in the corporate world that is changing rapidly.
Journal of Business and Social Review in Emerging Economies Vol. 6, No 4, December 2020
1292
Additionally, the theory of Human capital is stating that the skills and abilities which is possessed by the
employees are directly related to the productivity of the organization (Davidsson and Honig, 2003).
When the employee has a high level of skills and capabilities, it has more chances to be more productive
as compared to the company in which the employee is less capable. As the current era is more focused
on the knowledge, so it is requiring that the organization has the personnel, workforces, administrators,
and individual who are solving the problems of the organization to be well-informed and experienced.
When the employees are acquiring more knowledge, it will help them in improving their skills. It will be
beneficial for the employee to be more productive and enhance their work quality, which will increase
productivity (Luthans and Youssef, 2004). At present, the aspect of the environment cannot be ignored
by the business. Therefore, GHC role and its impact on the Sustainability of business must be examined.
The findings of the study of Yong et al. (2019) showed that GHC is positively influencing the eco-
friendly management of human resources. Likewise, the study of Erinos and Rahmawati (2017)
concluded that the relation between GRC and financial performance is positive. In the meantime, the
study of Chen and Chang (2013) also found that the association in GHC and eco-friendly innovation
performance is also positive. The study of Huang and Kung (2011) indicated that GIC is helping the
business to follow the worldwide regulations regarding the environment and creating value for the
company. Additionally, Akhtar et al. (2015) stressed that for achieving Sustainability, human capital is
significant. Nonetheless, there is a lack of research that has examined the interrelation in GHC and
Sustainability of business. The research hypothesis of the current study is that:
H1: The association in the green Human Capital and Business Sustainability is positive.
2.2 Green Structural Capital and Business Sustainability The previous study of Widener (2006) proclaimed that when the structures and processes of any firm are
weak, the organization cannot be successful. Likewise, when the organization has structural capital that
is strong, then it has a more reassuring environment, which is motivating the personnel in learning new
information (Florin et al., 2002). The previous studies indicated that structural capital is playing an
essential role in the performance of the organization (Bontis et al., 2000; Hsu and Wang, 2012).
Moreover, it is necessary for the business that they should develop a structure of environment that is
stable and helping to resolve the challenges in climate. It consists of the inside policies (Lee et al.,
2015), and practices used in managing low carbon (Raar, 2015; Singh, 2015). Additionally, the eco-
friendly culture will help in improving the sales of the organization and decrease the cost (Mehta and
Chugan, 2015). Much previous research showed that there is a positive and significant association in the
ecological structural capital and the outcomes of the business. According to the study of Chen (2008)
and Firmansyah (2017), the studies found that there is an interrelation in the competitive advantage and
green structural capital. In the study of Huang and Kung (2011), the results indicated that the link in the
GSC and activities related to commitment and competency of the environment is favorable. The study of
Delgado-Verde et al. (2014) revealed that the green capital of the organization is positively associated
with the eco-friendly innovation of the product. The findings of Erinos and Rahmawati (2017) research
showed that GSC is positively affecting financial performance. Furthermore, Akhtar et al. (2015) found
that structural capital is playing a significant part in achieving Sustainability. Nonetheless, there is no
research study conducted which has examined the interrelation of the GSC and Sustainability of
business. So, the hypothesis of the present study is that:
H2: The interrelation in the Green Structural Capital and Business Sustainability is positive.
2.3 Green Relational Capital and Business Sustainability
By using the relational capital (RC), the information within the partners is shared. The stakeholders of
the organization can provide vital information to the firm. Nelson and Winter (1982) stressed that when
collaboration with the partners is high than the firm is likely to have better routine work. The theory of
Social Exchange suggests that the link in RC and transaction is comprising of a sophisticated
advancement of personal as well as the structure of organization within the company. According to
MorganHunt (1994), one of the critical characteristics of the association in the social exchange is faith.
When the relationship in partners is based on trust, then the stimulation and learning are enhanced (Doz,

Journal of Business and Social Review in Emerging Economies Vol. 6, No 4, December 2020
1293
1990), and it will increase the performance of the company (Bonner and Walker, 2004). Many
companies who are operating manufacturing concerns are trying to build a strong relationship with the
suppliers to develop the required skills and abilities, which will lead to decreasing the cost of product
and also increase the productivity of the firm (Walter, 2003). Furthermore, strong links will help achieve
the goals of the environment (Bicknell and Mcmanus, 2006). Niesten et al. (2016) indicated that the big
corporation in the companies, government, and the other institutes is increasing the Sustainability of
society. In the recent research of Dickel et al. (2018), it is stated that when the partners are collaborating
using green practices, it is increasing the consciousness in many stakeholders that will lead towards
minimizing the uncertainty of the environment. Yusoff et al. (2019) claimed that the sharing of
knowledge and corporation in the stakeholders is playing a significant role in adopting the approach of
Sustainability. Numerous studies highlighted that ecofriendly relational capital is positively connected
with productivity. The study of Chen (2008) and Firmansyah (2017) also concluded that competitive
advantage and GRC are closely linked. Correspondingly, the study of Huang and Kung (2011) examined
that the GRC is has a positive association with the competency of the environment and activities of
organization related to commitment. According to Erinos and Rahmawati (2017), the influence of GRC
is positive on financial performance. From the research findings of Yong et al. (2019), it is highlighted
that the relation in the GRC and ecofriendly management of human resources is positive. Further,
Akhtar et al. (2015) revealed that for achieving Sustainability, the role of relational capital is vital.
Nevertheless, there is no research conducted to examine the association in the GRC and the suitability of
business. So the hypothesis is that:
H3: Green Relational has a positive influence on Business Sustainability
2.4 Organizational Learning Capability as a Mediator between Green Intellectual Capital and
Business Sustainability
For examining the role of mediator of the variable of organizational learning capability (OLC), different
research studies have been undertaken. The research studies of (Agostini et al., 2017; Akgun, Keskin &
Bryne, 2007) is showing the work. According to the research study of Hsu and Fang (2009), the
interrelation in IC, OLC, and the performance of the development in the new product was analyzed. The
findings revealed that intellectual capital, as well as the human capital, is enhanced in the development
of the new product by using the OLC. The study of Akgun, Keskin, and Bryne (2007) examined the
OLC as a mediator in the emotional capability and innovation in the product. The results highlighted that
the OLC is playing the role of partial mediator in the innovation of product and emotional capability.
According to Nattrass & Altomare (1999), OLC is playing a significant role in enhancing the
Sustainability of business. The ecofriendly intellectual capital will be influencing the Sustainability of
business in a better way when the organizational learning capability will play the role of mediator. So
the hypothesis is drawn from the literature is that:
H4: Organization Learning Capability mediates the relationship between GIC and BS.
3. Methodology:
The hypotheses that can be described as the relationships between variables in the proposed model will
be evaluated using a quantitative method. The current research uses the survey research approach to
address research issues during the discussion of research design. The time horizon for this analysis is
cross-sectional since the data are collected once in a while. This principle of research was better
considered because the mindset of the respondent does not change during the response. The simple
random sampling technique used for data collection. The target respondents received a total of 550
questionnaires. There are two data collection phases in this study. The first stage of data collection was
carried out by a self - administered questionnaire between January and March 2020. 154 SMEs
manufacturing sector from Lahore, Pakistan, has been selected. The questionnaires were distributed
among employees of SMEs accompanied by a cover letter. In two weeks, they were asked to reply and
complete the questionnaire. The second data collection phase was distributed within a period of two
months (April 2020 to May 2020) by an additional 320 questionnaires. The mailed and online
techniques were used. The answer to the questionnaire was provided to the respondents for two weeks.

Journal of Business and Social Review in Emerging Economies Vol. 6, No 4, December 2020
1294
The total number of respondents is 341, who returned the questionnaire. However, 40 of the
questionnaires were incomplete and deleted. For the final analysis, a total of 301 questionnaires have
been included, with a 62% response rate.
3.1. Measurements
Green intellectual capital is composed of green human capital (GHC) and green structural capital (GSC)
and green relational capital (GRC) with a total of 18 items, which have been adapted from Huang and
Kung (2011). The measurement scale was measured on a 5-point Likert scale, ranging from 1 (strongly
disagree) to 5 (strongly agree). This scale was used in previous studies (Firmansyah, 2017; Omar et al.,
2017). Chow and Chen (2012) have introduced a scale of business Sustainability. The respondents were
asked to evaluate the outputs of the company, which have a total number of items of 22, concerning
three key aspects-economic, social and environmental. Organization learning capability has 15 items
which are adopted by Chiva et al., (2007) and champs et al., (2011)
4. Analysis
4.1 Correlation Coefficient
The correlation coefficient provides a precise analysis of a particular variable. It will be from -1.00 to
+1.00 this correlation coefficient. The value of the correlation coefficient of 0.5-1.0 is considered
significant in line with Pallant (2011) and implies that there is a strong relationship between an
independent and a dependent variable. Table 1 below indicates that the independent variables and the
dependent variable have a strong correlation. This analysis thus reveals that green structural capital and
green human capital has a clear positive relation, with a minimal association between 0.061.
Table No 1: Correlation matrix
4.2. Reliability
e reliability test alpha value is used for the measurement of internal coherence in each of the variables in
each item. Alpha values above 0.7 are acceptable; however, the value above 0.8 is preferable (Pallant,
2011). Table 2 below shows that the alpha of Cronbach ranges between 0.704 and 0.817 each variable,
which indicates a perfect internal consistency.
Table No 2: Reliability analysis
4.3 Multicollinearity
A multicollinearity measure of the multi - regression variables set is the variance inflation factor (VIF)
and tolerance. VIF over 10 and tolerance value under 0.1 indicates that there are high multiple
correlations with other variables and suggest multicollinearity possibilities (Pallant, 2011). Table 3
shows that all independent variables are below 10, and the tolerance is above 0.1, according to the
following results from VIF. Diagnostic tests also indicate that the presumption of multicollinearity is not
infringed.
1 2 3 4 5
Business Sustainability (BS) 1
Green Relational Capital (GRC) 0.074 1
Green Structural Capital( GSC) 0.116** 0.077 1
Organization Learning Capability (OLC) 0.623** 0.089* 0.074 1
Green Human Capital (GHC) 0.384** 0.075 0.061 0.561** 1
Variable No of
items
Cronbach alpha
Business Sustainability (BS) 22 .817
Green Relational Capital (GRC) 5 .745
Green Structural Capital( GSC) 8 .771
Organization Learning Capability (OLC) 15 .775
Green Human Capital (GHC) 5 .704
Overall reliability 55 .873

Journal of Business and Social Review in Emerging Economies Vol. 6, No 4, December 2020
1295
Table 3: Multicollinearity
Variables Collinearity statistics
Tolerance VIF
Green Relational Capital (GRC) .986 1.014
Green Structural Capital( GSC) .989 1.011
Organization Learning Capability (OLC) .682 1.467
Green Human Capital (GHC) .684 1.461
4.4 Confirmatory factor analysis (CFA)
The CFA is a particular form of factor analysis, most widely used for social research. Confirmatory
Factor Analysis (CFA) It is different from Exploratory Factor Analysis (EFA) since the measurements
of a building consistent with researchers ' understanding of the nature of the building (or factor) are
used. The goal of CFA is, therefore, to test if the data fit a hypothesized measuring model. CFA is a
crucial element in the measuring model in SEM that is used before modeling the structural model to
obtain an acceptable model fit. CFA ran in two ways: individual CFA and pooled CFA (Chong et al.,
2014). Fitting model measures can be obtained to assess how well the proposed model has captured
covariance between all items or measurements in the model. All unnecessary items are either removed
or restricted in latent constructions. Loading factor, absolute fitness indexes, incremental, and
parsimonious must reach acceptance level. Tables 3 and 4 demonstrate that loading factors for items of
variables are far higher than the recommended values of 0.30. In the present analysis, 10 items of
business sustainability have been omitted because of low weights in regression. 6 organization learning
capability items were excluded due to low regression weights.
Factor loadings of business sustainability, organizational learning capability, and green structural
capital Table 4: Factor Loadings
Business sustainability Organization learning
capability
Green structural capital
Items Factor loading Items Factor
loadings
Items Factor
loadings
BS1 0.369 OLC3 0.423 GSC1 0.334
BS2 0.558 OLC7 0.524 GSC2 0.451
BS3 0.635 OLC8 0.560 GSC3 0.547
BS4 0.568 OLC9 0.570 GSC4 0.562
BS5 0.489 OLC10 0.392 GSC5 0.507
BS6 0.576 OLC11 0.671 GSC6 0.653
BS7 0.673 OLC12 0.639 GSC7 0.587
BS8 0.488 OLC13 0.461 GSC8 0.644
BS9 0.452 OLC15 0.439
BS11 0.362
BS13 0.305
BS15 0.335
Factor loadings of green human capital and green relational capital Table 5: Factor Loadings
Green Human capital Green relational capital
Items Factor loadings Items Factor loadings
GHC1 0.650 GRC1 0.536
GHC2 0.782 GRC2 0.439
GHC3 0.361 GRC3 0.697
GHC4 0.475 GRC4 0.515
GHC5 0.384 GRC5 0.620
5. Model fit indices
The fit indices are parsimonious and are tailored to most of the above. We can be modified to equate
models with different dynamics (equal coefficient numbers). You penalize fewer slothful models,

Journal of Business and Social Review in Emerging Economies Vol. 6, No 4, December 2020
1296
making them superior to simpler models. The more intricate the model, the lower the index fit.
Parsimonious indices include PRATION, PCLOSE, PGFI, PNFI, PNF2, PCFI, but Bollen (1989)
reported that such a cut is arbitrary, although there are thumb-rules for acceptance of the model fit.
Carmines and McIver (1981), for instance, state that CMIN should be acceptable in the 2:1-3:1 range.
Kline (1998) says that 3 or fewer is acceptable, and others allow values of up to 5 to be considered to fit
the model, whereas others emphasize 2 or lower. In the case of RMSEA, if its value is less than or equal
to 0.05, it provides well if it exceeds or equals 0.08. However, RMSEA > = 0.6 as the cutoff or suit
model suggested by Hu and Bentler (1999). A 0.85 CFI is more fitting when 0.70 suits the best model
of the previous model. The GFI value is appropriate if, as suggested by (Kim, 2007; Yang, 2006), the
cost is higher than 0.85. All the benefits that are given in the table below are in an acceptable range. Table No 6: Confirmatory factor analysis (CFA)
Variables Chi-square CFI GFI RMSEA
Threshold values <3 >0.90 >0.850 <0.08
Business Sustainability (BS) 2.601 .924 .956 0.057
Green Relational Capital (GRC) 1.583 .997 .996 0.034
Green Structural Capital( GSC) 2.323 .968 .980 0.051
Organization Learning Capability (OLC) 2.790 .949 .970 0.060
Green Human Capital (GHC) 1.155 .999 .998 0.018
6. Structural equational modeling (SEM)
SEM is a method for predictive testing and assessment of causal relations by integrating mathematical
and qualitative variables (Wright, 1921). SEM enables confirmatory and exploratory modeling that is
suitable for analytical and theoretical testing. Confirmatory modeling typically begins with a hypothesis
expressed in a causal model. To determine the relations among concepts in the model, the concepts
employed in the model must then be applied. The model is tested with the measuring data obtained to
assess how well the model fits the data.
The causal assumptions in the model are often false and can be checked against the data. With an initial
SEM theory, the corresponding model can be specified inductively, and the free parameter values can
also be estimated using data. SEM 's strengths include the ability to build latent variables: variables that
are not directly measured in the model, but estimated from multiple measured variables, each predicted
to "tap" latent variables. The model can thus expressly capture measurement unreliability in the
template, which theoretically allows precise estimation of structural relationships between latent
variables. Exceptional cases of SEMs are factor analyses, path analyzes, and regression.
Table No 7: Structural equational modeling (SEM):
7. Mediation analysis
To confirm the type of mediation, Bootstrap is an essential part of structural equation modeling. It also
enables researchers to evaluate the stability of parameter estimates, which can be used in cases where
significant and multivariate typical assumptions are not supported. Two models must be built to
implement this approach, one with the existence of a mediator and the other with the existence of a
mediator. The form of intervention shall be checked according to the recording results explicitly and
indirectly.
Hypothesis Estimates P-value Result
GHC BS .144 *** Supported
GSC BS .141 .003 Supported
GRC BS .071 .048 Supported

Journal of Business and Social Review in Emerging Economies Vol. 6, No 4, December 2020
1297
Fig 1: Research model in the context of Pakistan and hypothesis testing
Table No 8: Mediation analysis
8. Discussion
To solve the issues prevalent in the environment, the ecofriendly strategies must be adopted quickly.
Different researchers have recognized that the GIC will be very much beneficial (Huang and Kung,
2011). Nonetheless, the association in GIC and BS is not studied. So the study will be useful to fill the
gap by examining the impact of "GIC dimensions, namely GHC, GSC, and GRC, on BS". For collecting
the data, 154 SMEs in the manufacturing sector, which are operating a business in Lahore is selected.
The findings revealed that the connection in the GHC and BS is significant. The result matched with the
previous research of Chen and Chang (2013) and (Yong et al. (2019). As the results of these studies
showed that the GHC is contributing to increasing the performance of the organization. Another finding
revealed that the association of GSC with the BS is positive. The results are consistent with the past
research by Chen, (2009), who concluded that the interrelation in competitive advantage and GSC is
significant. The early research has also proved that the structural capital is contributing towards a
sustainable business (Akhtar et al., 2015). The last results of the study showed that the influence of GRC
on the BS is positively significant. The results are aligned with the numerous previous researches (Chen,
2008) that the contribution of GRC is significant towards the performance of the organization.
Additionally, the researcher Akhtar et al. (2015) also concluded that there is a correlation in
Sustainability and relational capital.
The mediating effect of OLC between GHC and BS is thus accepted. H4a was, therefore, accepted.
Perhaps the plausible reason for manufacturing small and medium-sized companies to accept the
challenges of protecting and retaining good human resources, especially for environmental protection. In
the relationship between green structural capital (GSC) and BS, OLC has no mediating effect. H4b has
therefore been rejected. Insignificant findings from this study show that accumulated environmental
protection knowledge may be smaller as financial and physical constraints are lacking. This study finally
found that OLC does not mediate the link between GRC and BS. The good relations between staff and
other stakeholders are believed to bring a major change in sharing knowledge with them. The lack of
funding may restrict the SMEs to build the relationship between employees and other stakeholders.
9. Limitations of the study
There is some limitation that has been faced by the existing research study. One limitation of the study
was that it was conducted in a country that is developing and on SMEs in the manufacturing sector of
Pakistan. So the generalization of the study is limited in scope. The cross-sectional data was used, which
is not providing insight into the changes in the components of GIC over time. The size of the sample of
the research was small, which is not providing a conformity of results. Despite the limitations, the study
has provided some significant results which have provided insight into the GIC and the Sustainability of
business in the SME manufacturing industries of Lahore, Pakistan. It is providing a direction to the
Hypothesis Standardized
total effect
Standardized
direct effect
Standardized
indirect effect
Results
GHC-OLC-BS .107*** .189*** .065*** Partial Mediation
GSC-OLC-BS .123*** .361*** .017(NS) No Mediation
GRC-OLC-BS .132(NS) .063(NS) .026(NS) No Mediation

Journal of Business and Social Review in Emerging Economies Vol. 6, No 4, December 2020
1298
future researchers who are planning to examine the significance of GIC on the Sustainability of
business.
10. Suggestions for future study
Notwithstanding a few limits of the study, this can be taken up in different directions. The future
researcher can take up other sectors of the industry for examining the association in GIC and the
Sustainability of business. The sector of services can be examined too in future research. The study can
be undertaken in other emerging countries by taking up similar and different sectors. The study can be
conducted using the approach of longitudinal study for investing the change in the variables with a
period of time. It will be helpful for the researcher to improve the GIC role on the Sustainability of
business. Other variables can also be added for getting the more extensive and wide perspective
regarding the factors which is influencing the dependent variable of the study.
11. Conclusion
The model which is presented in the study is guiding for the SMEs in the manufacturing sector for
determining the influence of different dimensions of GIC on BS. The new strategies of the environment
will be used for opening up updated opportunities for the companies to achieve Sustainability. The
model can be helpful for the firms to make improvements in their skills with which the cleaner
manufacturing can be achieved along with using the different strategies of GIC the business can achieve
Sustainability. Additionally, the findings highlighted that the GSC, as well as the GRC, is positively
correlated with Sustainability. There the business should focus on these dimensions of GIC.
References
Aboelmaged, M., & Hashem, G. (2019). Absorptive capacity and green innovation adoption in SMEs:
The mediating effects of sustainable organisational capabilities. Journal of Cleaner
Production, 220, 853-863.
Agostini, L., Nosella, A., & Filippini, R. (2017). Does intellectual capital allow improving innovation
performance? A quantitative analysis in the SME context. Journal of Intellectual Capital.
Akgün, A. E., & Keskin, H. (2014). Organisational resilience capacity and firm product innovativeness
and performance. International Journal of Production Research, 52(23), 6918-6937.
Akhtar, C. S., Ismail, K., Hussain, J., & Umair-ur-Rehman, M. (2015). Investigating the moderating
effect of family on the relationship between entrepreneurial orientation and success of enterprise:
case of Pakistani manufacturing SMEs. International Journal of Entrepreneurship and Small
Business, 26(2), 233-247.
Akhtar, C. S., Ismail, K., Ndaliman, M. A., Hussain, J., & Haider, M. (2015). Can intellectual capital of
SMEs help in their sustainability efforts. Journal of Management Research, 7(2), 82.
Akhtar, C. S., Ismail, K., Ndaliman, M. A., Hussain, J., & Haider, M. (2015). Can intellectual capital of
SMEs help in their sustainability efforts. Journal of Management Research, 7(2), 82.
Alegre, J., & Chiva, R. (2008). Assessing the impact of organizational learning capability on product
innovation performance: An empirical test. Technovation, 28(6), 315-326.
Ali, U., Noor, M., Khurshid, M. K., & Mahmood, A. (2015). Impact of firm size on earnings
management: A study of textile sector of Pakistan. European Journal of Business and
Management, 7(28).
Allameh, S. M. (2018). Antecedents and consequences of intellectual capital. Journal of Intellectual
Capital.
Allameh, S. M., & Abbas, S. K. (2010). The relationship between knowledge management practices and
innovation level in organizations: case study of sub-companies of selected corporations in the
city of Esfahan. Journal of Business Case Studies (JBCS), 6(1).
Becker, M. C. (2003). The concept of routines twenty years after Nelson and Winter (1982). A review of
the literature. Industrial and Corporate Change, 643-677.
Bollen, K. A. (1989). A new incremental fit index for general structural equation models. Sociological
methods & research, 17(3), 303-316.

Journal of Business and Social Review in Emerging Economies Vol. 6, No 4, December 2020
1299
Bontis, N. (1998). Intellectual capital: an exploratory study that develops measures and
models. Management decision.
Bontis, N., & Fitz‐enz, J. (2002). Intellectual capital ROI: a causal map of human capital antecedents
and consequents. Journal of Intellectual capital.
Bontis, N., Keow, W. C. C., & Richardson, S. (2000). Intellectual capital and business performance in
Malaysian industries. Journal of intellectual capital.
Cai, W., Lai, K. H., Liu, C., Wei, F., Ma, M., Jia, S., ... & Lv, L. (2019). Promoting sustainability of
manufacturing industry through the lean energy-saving and emission-reduction strategy. Science
of the Total Environment, 665, 23-32.
Cavicchi, C., & Vagnoni, E. (2017). Does intellectual capital promote the shift of healthcare
organizations towards sustainable development? Evidence from Italy. Journal of Cleaner
Production, 153, 275-286.
Chen, B. B., & Chang, L. (2012). Adaptive insecure attachment and resource control strategies during
middle childhood. International Journal of Behavioral Development, 36(5), 389-397.
Chen, C. J., Liu, T. C., Chu, M. A., & Hsiao, Y. C. (2014). Intellectual capital and new product
development. Journal of Engineering and Technology Management, 33, 154-173.
Chen, Y. S., James Lin, M. J., & Chang, C. H. (2006). The influence of intellectual capital on new
product development performance–the manufacturing companies of Taiwan as an example. Total
Quality Management and Business Excellence, 17(10), 1323-1339.
Cleff, T., & Rennings, K. (1999). Determinants of environmental product and process
innovation. European environment, 9(5), 191-201.
Cousins, P. D., Handfield, R. B., Lawson, B., & Petersen, K. J. (2006). Creating supply chain relational
capital: The impact of formal and informal socialization processes. Journal of operations
management, 24(6), 851-863.
Cui, Z., Zhang, H., Chen, X., Zhang, C., Ma, W., Huang, C., ... & Gao, Q. (2018). Pursuing sustainable
productivity with millions of smallholder farmers. Nature, 555(7696), 363-366.
Davidsson, P., & Honig, B. (2003). The role of social and human capital among nascent
entrepreneurs. Journal of business venturing, 18(3), 301-331.
Del Giudice, M., Maggioni, V., Cruz-González, J., López-Sáez, P., Navas-López, J. E., & Delgado-
Verde, M. (2014). Directions of external knowledge search: investigating their different impact
on firm performance in high-technology industries. Journal of Knowledge Management.
Dingemanse, N. J., Dochtermann, N., & Wright, J. (2010). A method for exploring the structure of
behavioural syndromes to allow formal comparison within and between data sets. Animal
Behaviour, 79(2), 439-450.
Firmansyah, A. (2018). Pengaruh green intellectual capital dan manajemen lingkungan organisasi
terhadap green organizational identity dan dampaknya terhadap green competitive
advantage. Substansi: Sumber Artikel Akuntansi Auditing dan Keuangan Vokasi, 1(1), 183-219.
Firmansyah, I., Spiller, M., De Ruijter, F. J., Carsjens, G. J., & Zeeman, G. (2017). Assessment of
nitrogen and phosphorus flows in agricultural and urban systems in a small island under limited
data availability. Science of the Total Environment, 574, 1521-1532.
Hart, S. L., & Dowell, G. (2011). Invited editorial: a natural-resource-based view of the firm: fifteen
years after. Journal of management, 37(5), 1464-1479.
Hsu, L. C., & Wang, C. H. (2012). Clarifying the effect of intellectual capital on performance: the
mediating role of dynamic capability. British Journal of Management, 23(2), 179-205.
Hsu, Y. H., & Fang, W. (2009). Intellectual capital and new product development performance: The
mediating role of organizational learning capability. Technological Forecasting and Social
Change, 76(5), 664-677.
Hu, L. T., & Bentler, P. M. (1999). Cutoff criteria for fit indexes in covariance structure analysis:
Conventional criteria versus new alternatives. Structural equation modeling: a multidisciplinary
journal, 6(1), 1-55.
Huang, C. L., & Kung, F. H. (2011). Environmental consciousness and intellectual capital
management. Management decision.
Journal of Business and Social Review in Emerging Economies Vol. 6, No 4, December 2020
1300
Huang, C. L., & Kung, F. H. (2011). Environmental consciousness and intellectual capital
management. Management decision.
Huang, C. L., & Kung, F. H. (2011). Environmental consciousness and intellectual capital
management. Management decision.
Jabbour, C. J. C., & de Sousa Jabbour, A. B. L. (2016). Green human resource management and green
supply chain management: Linking two emerging agendas. Journal of Cleaner Production, 112,
1824-1833.
Jiang, F., Li, T., Li, Y., Zhang, Y., Gong, A., Dai, J., ... & Hu, L. (2018). Wood‐based nanotechnologies
toward sustainability. Advanced Materials, 30(1), 1703453.
Kanwal, A., & Rajput, A. (2016). A transaction cost framework in supply chain relationships: a social
capital perspective. Journal of Relationship Marketing, 15(1-2), 92-107.
Khalique, M., Bontis, N., Shaari, J. A. N. B., Yaacob, M. R., & Ngah, R. (2018). Intellectual capital and
organisational performance in Malaysian knowledge-intensive SMEs. International Journal of
Learning and Intellectual Capital, 15(1), 20-36.
Kim, S. K., Davison, M. L., & Frisby, C. L. (2007). Confirmatory factor analysis and profile analysis via
multidimensional scaling. Multivariate Behavioral Research, 42(1), 1-32.
Kor, Y. Y., & Mahoney, J. T. (2004). Edith Penrose's (1959) contributions to the resource‐based view of
strategic management. Journal of management studies, 41(1), 183-191.
Lee, S. Y. (2015). The effects of green supply chain management on the supplier’s performance through
social capital accumulation. Supply Chain Management: An International Journal.
Lin, C. Y., Chen, F., Huang, J. C., Chen, W. C., Liou, Y. A., Chen, W. N., & Liu, S. C. (2008). Urban
heat island effect and its impact on boundary layer development and land–sea circulation over
northern Taiwan. Atmospheric Environment, 42(22), 5635-5649.
Liu, C. L. E., Ghauri, P. N., & Sinkovics, R. R. (2010). Understanding the impact of relational capital
and organizational learning on alliance outcomes. Journal of World Business, 45(3), 237-249.
Loh, C. H., Weng, J. H., Liu, Y. C., Lin, P. Y., & Huang, S. K. (2011). Structural damage diagnosis
based on on-line recursive stochastic subspace identification. Smart materials and
structures, 20(5), 055004.
Luthans, F., & Youssef, C. M. (2004). Human, social, and now positive psychological capital
management: Investing in people for competitive advantage.
Mårtensson, K., & Westerberg, K. (2016). Corporate environmental strategies towards sustainable
development. Business Strategy and the Environment, 25(1), 1-9.
McIver, J., & Carmines, E. G. (1981). Unidimensional scaling (No. 24). Sage.
Mehta, K., & Chugan, P. K. (2015). Green HRM in pursuit of environmentally sustainable
business. Pursuit of Environmentally Sustainable Business (June 1, 2015). Universal Journal of
Industrial and Business Management, 3(3), 74-81.
Menguc, B., & Ozanne, L. K. (2005). Challenges of the “green imperative”: A natural resource-based
approach to the environmental orientation–business performance relationship. Journal of
Business Research, 58(4), 430-438.
Morgan, R. M., & Hunt, S. D. (1994). The commitment-trust theory of relationship marketing. Journal
of marketing, 58(3), 20-38.
Omar, M. K., Mohd Yusoff, Y., & Kamarul Zaman, M. D. (2019). The effect of organizational learning
capability as a mediating variable in the relationship between green intellectual capital and
business sustainability: evidence from the manufacturing sector. International Journal of
Academic Research in Business and Social Sciences, 9, 337-352.
Pallant, J. (2011). SPSS Survival Manual 4th edition: A step by step guide to data analysis using SPSS
version 18. Maidenhead, Berkshire: Open University Press. Retrieved on from http://www.
allenandunwin. com/spss.
Ray, A. D., & Grannis, J. (2015). From planning to action: implementation of state climate change
adaptation plans. Michigan Journal of Sustainability, 3.
Reed, K. K., Lubatkin, M., & Srinivasan, N. (2006). Proposing and testing an intellectual capital‐based
view of the firm. Journal of management studies, 43(4), 867-893.
Journal of Business and Social Review in Emerging Economies Vol. 6, No 4, December 2020
1301
Reed, K. K., Lubatkin, M., & Srinivasan, N. (2006). Proposing and testing an intellectual capital‐based
view of the firm. Journal of management studies, 43(4), 867-893.
Reed, K. K., Lubatkin, M., & Srinivasan, N. (2006). Proposing and testing an intellectual capital‐based
view of the firm. Journal of management studies, 43(4), 867-893.
Sharma, S., & Aragon-Correa, J. A. (2005). Corporate Environmental Strategy and Competitive
Advantage-New Perspectives in Research on Corporate Sustainability. New title edition.
Subramaniam, M., & Youndt, M. A. (2005). The influence of intellectual capital on the types of
innovative capabilities. Academy of Management journal, 48(3), 450-463.
Sullivan, K., Thomas, S., & Rosano, M. (2018). Using industrial ecology and strategic management
concepts to pursue the Sustainable Development Goals. Journal of Cleaner Production, 174,
237-246.
Tai-Ning, Y., Hsiao-Chen, C., Shou-Yen, L., & Chiao-Lun, T. (2011). Knowledge creation and
intellectual capital on securities investment services. African Journal of Business
Management, 5(3), 924-933.
Widener, S. K. (2006). Associations between strategic resource importance and performance measure
use: The impact on firm performance. Management Accounting Research, 17(4), 433-457.
Yong, J. Y., Yusliza, M. Y., Ramayah, T., & Fawehinmi, O. (2019). Nexus between green intellectual
capital and green human resource management. Journal of cleaner production, 215, 364-374.
Yong, J. Y., Yusliza, M. Y., Ramayah, T., & Fawehinmi, O. (2019). Nexus between green intellectual
capital and green human resource management. Journal of cleaner production, 215, 364-374.
Yong, J. Y., Yusliza, M. Y., Ramayah, T., & Fawehinmi, O. (2019). Nexus between green intellectual
capital and green human resource management. Journal of cleaner production, 215, 364-374.
Yong, J. Y., Yusliza, M. Y., Ramayah, T., & Fawehinmi, O. (2019). Nexus between green intellectual
capital and green human resource management. Journal of cleaner production, 215, 364-374.
Yusoff, Y. M., Omar, M. K., & Zaman, M. D. K. (2019). Practice of green intellectual capital. Evidence
from Malaysian manufacturing sector. In IOP Conference Series: Materials Science and
Engineering (Vol. 469, No. 1, p. 012008). IOP Publishing.
Yusoff, Y. M., Omar, M. K., & Zaman, M. D. K. (2019). Practice of green intellectual capital. Evidence
from Malaysian manufacturing sector. In IOP Conference Series: Materials Science and
Engineering (Vol. 469, No. 1, p. 012008). IOP Publishing.
Yusoff, Y. M., Omar, M. K., Zaman, M. D. K., & Samad, S. (2019). Do all elements of green
intellectual capital contribute toward business sustainability? Evidence from the Malaysian
context using the Partial Least Squares method. Journal of Cleaner Production, 234, 626-637.
Yusoff, Y. M., Omar, M. K., Zaman, M. D. K., & Samad, S. (2019). Do all elements of green
intellectual capital contribute toward business sustainability? Evidence from the Malaysian
context using the Partial Least Squares method. Journal of Cleaner Production, 234, 626-637.
Yusoff, Y. M., Omar, M. K., Zaman, M. D. K., & Samad, S. (2019). Do all elements of green
intellectual capital contribute toward business sustainability? Evidence from the Malaysian
context using the Partial Least Squares method. Journal of Cleaner Production, 234, 626-637.
Yusoff, Y. M., Omar, M. K., Zaman, M. D. K., & Samad, S. (2019). Do all elements of green
intellectual capital contribute toward business sustainability? Evidence from the Malaysian
context using the Partial Least Squares method. Journal of Cleaner Production, 234, 626-637.
Zaid, A. A., Jaaron, A. A., & Bon, A. T. (2018). The impact of green human resource management and
green supply chain management practices on sustainable performance: An empirical
study. Journal of Cleaner Production, 204, 965-979.

Journal of Business and Social Review in Emerging Economies Vol. 6, No 4, December 2020
1302

Journal of Business and Social Review in Emerging Economies Vol. 6, No 4, December 2020
1303
Volume and Issues Obtainable at Center for Sustainability Research and Consultancy
Journal of Business and Social Review in Emerging Economies ISSN: 2519-089X (E): 2519-0326
Volume 6: No. 4, December 2020
Journal homepage: www.publishing.globalcsrc.org/jbsee
Service Quality and Customer Retention in Malaysian Commercial Banks
1Chim Weng Kong, 2Maria Abdul Rahman 1PhD Candidate, School of Business, Universiti Utara Malaysia, [email protected]
2Senior Lecturer, College of Business, School of Business Management, Universiti Utara Malaysia,
ARTICLE DETAILS ABSTRACT History Revised format: November 2020 Available Online: December 2020
This conceptual paper explores the contribution of service quality on
banks’ customer retention. Customer is the core factors to any
business industry and there is no exception for the banking industry.
Customers will only retain with the same bank provided there is a
quality service. Service comes in the form of how the bank’s
employee treats the customers and from physical facilities and other
tangibles used in banking transactions. Contribution of service quality
is indefinite and without it, firm’s business will lose out to other
banks. Banks not only compete with other banks but banks’ branches
as well. The importance of the banking business cannot be neglected
as it has contributed to Malaysia Gross Domestic Products in term of
service industry. Service is not similar with goods or physical
products as it is intangible and only can be experienced during the
process of selling or buying. Good quality service must be prioritized
in helping retaining customers even with the Industrial Revolution 4.0
where it is “a mechanism that is controlled or monitored by computer-
based”. Contribution of human capital which is cannot be separated in
term of knowledge, friendly approach and ethical help in delivering
quality service. One of the methods can be applied by the bank is the
commitment of monitoring and servicing customer requirements to
deliver high levels of service quality for total customer satisfaction.
© 2020 Center for Sustainability Research and Consultancy Pakistan under a
Creative Commons Attribution-NonCommercial-ShareAlike 4.0
Keywords Service quality, Customer
Retention, Satisfaction, Banks
JEL Classification
M10, M14
Corresponding author’s email address: [email protected]
Recommended citation: Kong, C. W. & Rahman, M. A. (2020). Service Quality and Customer
Retention in Malaysian Commercial Banks. Journal of Business and Social Review in Emerging
Economies, 6(4), 1303-1312
1. Introduction
For businesses, focusing on customers have a tangible benefit. Customers are the sources of revenue to
the company to meet the bottom line. Moreover, if the company is able to retain the customers, the
continuous stream of revenue can be generated. Looking back to 1990s, Dawkins and Reichheld
highlighted the distinct of customer retention into one of the reputable marketing strategies. According
to these authors customer retention strategies can be used not only banking but in a wide range of
industries. Customer retention should be emphasized by the banking industry since bringing in new
customers cost five times more compare to the cost of retained customers. According to Noel Yee, Tracy

Journal of Business and Social Review in Emerging Economies Vol. 6, No 4, December 2020
1304
Yun and Jackie Yau (2013) customer retention owing from the aggregate of satisfaction during the
purchase process and company should keep on improving customer satisfaction. Only one out of twenty-
five unsatisfied customers will express the dissatisfaction and happy customers will tell four to five
customers about the satisfaction, but unsatisfied customers will tell nine to twelve customers about the
unsatisfactory experiences (Hundre, Raj Kumar, and Dileep Kumar, 2013).
Mecha, Martin, and Ondieki (2015) the long-term effect of customer retention is on the customer value
and firms capitalized on this phenomenon as it brings the firm profits. In the annual financial reports of
Malaysia’s individual bank, profitability of the banks has been fluctuating for the past decade (appendix
A). The effect of the bank’s mergers has automatically created an enlarged customer based where
revenue should be increased or improved. As mentioned by Lai, Ling, Eng, Cheng, and Ting (2015), the
merged bank has benefited from the increased economies of scale and therefore reduce its operation
cost. Subsequently the merged bank is able to take in more profit and hence increase shareholders’
wealth. Regrettably, profit of some banks remains constant or even decreased as compared to the
preceding year.
Aik, Hassan, Hassan, and Mohamed (2015) the conclusions of the study on merger exercise is the
operating performance improve significantly after the merger compared to before the merger.
Furthermore, from the preceding studies, the running cost to attract new customers is five to ten times
more compared to maintaining an existing customer (Hundre et al., 2013; Mecha et al., 2015).
Notwithstanding the outcome, banks should look beyond retaining customers, but also the need of
attracting new ones to replace customers that left. With this, it will maximize the profits while
minimizing the operating cost.
Arokiasamy (2013) put forward that service quality proves the firm’s ability to fulfil customers’ demand
and want. Organization must improvise service rendered in order to meet customers’ demand since it is
the vital point to compete in the market. On the other hand, Appannan, Doraisamy, and Hui (2013) state
that banks are lagging in several areas, which include delay in answering customer calls, queuing time,
how an employee greets the customers, whether information received by customers was accurate and
adequate, and any follow-up by the bank’s employee. Some banks even outsourced their service quality
survey to other professional companies while some are carried out itself to determine where the bank
service quality stands.
Banks are competing intensely in this highly competitive environment to offer quality-oriented services
according to customers’ expectations. Determining the level of service quality allows banks to
understand customers’ needs and wants. Offering excellent quality service to customers nowadays in the
business environment is crucial due to the intense competition. The add-ons of the advantages of quality
service will boost the company’s image, enhance customer retention, attracting potential customers
through word-of-mouth and in the long run increase the company profit (Osman and Sentosa, 2014).
According to Appannan et al., (2013), service quality is important to satisfy customers theoretically and,
or empirically. This has been proven in various industries that comprise of service industries. In the
banking industry, products are homogeneous and the only way for banks to differentiate is through
outstanding service quality that satisfy the customers and leave an impression. They note that service
quality is a vital factor to influence customers’ satisfaction level in banking. Quality in banking is a
multi-variable concept which consists of convenience reliability, service portfolio and most importantly
the employee delivering the service.
Service quality starts with relationship establishment before any delivering of business transaction. As
mentioned by Al-Alak (2014) research, as the quality of relationship increases between the service
provider and customers, it will have a significant influence on the customer’s behaviour in terms of
continuity of the relationship and word-of-mouth promotion. Lau, Cheung, Lam, and Chu (2013)

Journal of Business and Social Review in Emerging Economies Vol. 6, No 4, December 2020
1305
globalization has changed customer behaviour about banking industry and the way of running the
banking operation has become more dynamic and competitive. They highlight the introduction of new
methods of delivering services such as automated teller machines (ATM), phone and internet banking.
Alnsour (2013) the changes of recent environmental factors like the unexpected increase of competition
and the changing of customers’ perspective, make marketing strategies change from “offensive
marketing”, getting new customers as priority to “defensive marketing”, which concentrate on customer
retention.
Customer satisfaction has been treated as a critical factor on holding customers in a long-term duration
in relationship marketing literature. Thus, in any service failure encountered by a customer, the most
important step to undertake is to restore the customer’s satisfaction (Siu, Zhang and Yau, 2013).
Therefore, this conceptual paper will touch on the importance of service quality to be delivered in order
to meet customers’ satisfaction that can help banks to retain their existing customers and prevent these
customers from being attracted by competitors.
2. Literature Review
The cost of customer acquisition is much higher than customer retention and a small increase in
retention rates could drive large profit increases (Chang and Zhang, 2016). As mentioned earlier,
customer retention is a critical factor in achieving customer satisfaction (Alnsour, 2013). These
statements are strong enough to describe the importance of customer retention to any firm. To these
previous researches, customer retention plays a significant role not only in the banking industry but
others as well, in terms of meeting the bottom line. For bank’s sustainability and performance
improvement purposes, banks require the contribution of repeat purchase from customers that generate
revenue. Thus, customer retention continues to be the dominant factor that allow any firm to be
competitive in the business industry.
Banking business has been confronted by issues in customer retention due to establishment of banks
branches, introduction of new service delivery, changes of customers’ need and the banking
environment as whole. Mecha et al. (2015) customers are moving from one bank to another looking for
one bank that fit their needs. It is a challenge for the manager to build close relationships to retain
existing customers who are at the same time, being lured by other banks. Once the competitors are able
to build a close relationship with the customers, the chances of getting back the customers will be low.
Hence, customer retention has been one of the goals of relationship marketing where initial contact rely
on the relationship to be continued.
Hettiarachchy, and Samarasinghe (2016) define customer retention as “the longevity of a client’s
relationship with a product and/or service providing firm”. Once there is an establishment of relationship
between bank and customers, banks’ employees are able to market additional products with quality
service to retain the customers. Service quality must be felt by customers the moment they step into the
banks and business transactions need relationship to be continued.
Relationship building champion the use of interaction between the service provider and customer
through face-to-face communication. Added in with quality service, chances of competitors attracting
firm’s existing customers will be minimized. Tan, Hamid, and Chew (2016) banks that able to provide
quality service have the advantages in marketing activities since improved service quality lead to the
increase of revenue, opportunity of cross-sell, expanded market share and lastly higher customer
retention rates. Banks acknowledge that they must compete in a more efficient way through the
satisfying service quality. Syaqirah, and Faizurrahman (2014) conducted a research on hotel’s room
service quality using three stars hotels in Malaysia. They concluded that service quality is important as
delivering exceptional service will bring customers a higher satisfaction, which denote the element of
customer retention and thereafter increase the firm’s profit. Similar with the banking industry, where
customers must experience its services during the purchase process, then they can judge the service.
Journal of Business and Social Review in Emerging Economies Vol. 6, No 4, December 2020
1306
There are numerous past researches on customer retention or on customer loyalty that examine different
types of variables that contribute to customer retention in various service business industry, which
include banking (e.g. Siu et al., 2013; Arokiasamy, 2013; Zeyad, and Wahab, 2013; Wang, Hsu, and
Chih, 2014; Syaqirah, and Faizurrahman, 2014; Kandampully, et al., 2015; Mecha et al., 2015; Osman
and Sentosa, 2016). Some of the exploration on customer retention include research on multichannel of
service delivery, service failure recovery, service quality and impact of satisfaction to customers.
According to these researches, banks are interested on providing new technology associated with service
quality, rather than traditional delivery functions. The introduction of technology has changed retail
banking significantly with the development of new ranges of products and improvement of delivery
channels.
The contribution of service quality attracts many researchers due to its influence on the business industry
since decades ago. Parasuraman, Berry, and Zeithaml, 1991 study (as cited in Bose and Gupta, 2013)
proposed SERVQUAL as a measurement that evaluate the actual service quality rendered by service
provider to the expected service quality by customers. According to the study, there are five dimensions
to measure service quality foreseen by the customers. They also state the dimensions are related to three
additional Ps of service marketing mix which include people, physical evidence, and process. Another
fact pointed by them is “a general tenet in marketing and business holds that high-quality goods and
services are favoured in the market”. High quality performance produces assessable benefits in terms of
profit, cost savings, and market share.
SERVQUAL is a multiple-item instrument with five dimensions: tangible, reliability, responsiveness,
assurance, and empathy. Physical facilities, equipment and appearance of personnel are classified as
tangibles and the remaining dimensions are classified under customer-based performance measure. It is
more on the human interaction that bank employee provides to the customers. They define service
quality as the difference between customer’s expectations for the performance of a service before the
service is endured and their perception on the service received. Intangible services are the most difficult
to be evaluated due to customers’ various perception and satisfaction levels. A quality service accepted
by one customer may not be perceived as good quality by another.
Khan and Fasih, (2014) research examine satisfaction and loyalty through service quality in the banking
industry by applying only 4 dimensions of tangible, reliability, assurance, and empathy which exclude
responsiveness. The research conclusion is that service quality and all the dimensions tested have a
significant and positive linkage to customer satisfaction and loyalty. Their findings also state that service
is a non-stop process interaction between service providers and customers in an intangible activity which
arrange “premium solutions” to customers that include physical and financial resources. In fact, banks
are providing physical services such as ATM for deposits and withdrawal and the convenience of brick
and mortar services in rural areas or for customers who are not familiar with technology. Generally, the
usefulness of ATM is it can be used by customers from different banks.
Osman and Sentosa (2014) research on the understanding of mediating effect of customer satisfaction on
service quality and loyalty relationship in Malaysia commercial banks. The results showed that service
quality enhances customer satisfaction in Malaysian commercial banking industry, which all the
hypotheses testing was supported. The results translate into the relationship between customer
satisfaction and profitability and is linked to customers’ satisfaction that influences customer loyalty.
The research conclude that satisfied customers will make repeat purchases and a small percentage of
customers will leave for the competitor.
Kandampully et al. (2015) define loyalty as attitudinal loyalty where it is the commitment of customers
to perform any repeat purchase or visitation to the same providers in the future for chosen products or
services, although there are influences from others. The definition is similar with the definition of
customer retention where customers establish a continuous relationship with a product or service
Journal of Business and Social Review in Emerging Economies Vol. 6, No 4, December 2020
1307
provider. Therefore, for this conceptual study it does not attempt to differentiate the two definitions.
It is of paramount importance to treat customer retention as the primary marketing strategy for the bank.
Past literatures have supported that service quality indeed help the bank’s performance, but it is not
responding or aligning with the increase of customer base due to the bank’s mergers. The inconsistence
of bank’s performance if not due to service quality, it may possible due to other factors such as
demography of customers especially in term of customer’s income.
3. Customer Retention
Edward and Sahadev (2013) the cost on capturing new customers is higher compare to the lower cost of
retained customers which helps the profit of the firm. For service-oriented businesses like banking, a
customer retention program is recommended due to the cross-sell opportunities and stream of revenue.
One of the definitions by Hundre, Kumar, and Kumar (2013) customer retention is providing or meeting
what customers want and as expected by them. Banks help customers meet their financial objective
whether in term of investment or getting a loan. The banks need to exceed customers’ expectations in
order to convert them into devoted loyalists to the banks.
Kandampully et al. (2015) generating and sustaining customers to be retained in the firms assists in
creating long-term and mutually beneficial relationship. They also highlight that retained customers will
not be easily attracted by competitors which display a firm commitment by customers. Customers
agreeable to the higher price show great purchasing intention and unwillingness to switch to
competitors. Thus, retained customers can produce continuous high revenue that help banks meet the
bottom line. However, banks must acknowledge that customers’ expectations on service quality grow
higher as the years pass.
There are several advantages when firms are applying customer retention in terms of economic benefits
such as the customers’ tenure with the firm is longer, repeated purchases due to a longer tenure, and
most of all is the referral by these retained customers (Coussement, 2014). Customers providing referrals
through positive word-of-mouth are much stronger than banks’ self-promotions. However, if customers
promote negative word-of-mouth, the impact is substantial. Therefore, the more customers and firms
understand each other, it will result in the maintenance costs of their relationship to fall and hence,
pushing up the net present value of retained customers. Accordingly, Mecha et al. (2015) pointed out
that banks should intensify the customer retention strategies with more effective methods such as
customer service and produce innovative products that are unlike the rest of the competitors.
From the past literatures on customer retention, it may describe that a low customer retention scenario is
like “continue supplying oxygen to leaked tyre”. The goal will never be reached, and it will cause the
bank’s operation cost to remain high which affect the bank’s profit. Hundre, et al. (2013) for a company
with a small customers base, losing a few customers is tantamount to crippling the company. Banks with
a huge customer base does not translate to the bank being about to make more profits if the bank’s
customers continue to leave for their competitors because of the lack of consistent service quality from
the bank’s employees.
Bank’s employees do not just sell the product, but they also develop relationships with the customers
and educate them. Only then will the customers feel the service quality difference between the bank and
its competitors. Banks that employ customer retention strategies often find it an efficient process due to
the long-term relationship where customers already have the indication of interest on the products. Some
customers may already have the impulse to buy and with a little force, the sales can be concluded. It is
easier for the customers to make decision when they already capitalize on their purchase and service
quality experience with the banks. Plus, Mecha et al. (2015) state firms need to distinguish its products
to make competitors irrelevant and by carrying out such a move, sales will be increased and certainly
survive in the market. Hence, it is important that banks treat customer retention as a sustainable business

Journal of Business and Social Review in Emerging Economies Vol. 6, No 4, December 2020
1308
model which is in the arsenal for sustainable growth.
Customer retention is not only about the service products (Hundre et al., 2013) and they strongly feel
that it is about how servicing existing customers and the way a reputation is created within and across
the market-place. Additionally, customers expect to be treated on a more personalized or individualistic
basis, given the demographic background and household income. Banks should not sell the products but
the features instead.
Mecha et al. (2015) opine that service to the customers is one of the certain methods to apply customer
retention. They explain to understand the customers and their needs with outstanding service is what
they require where customers feel it is worth of the continuous relationship. Therefore, when customers
have full confidence on the firm, their purchase intentions will be surged (Wang, Hsu, and Chih, 2014).
4. Service Quality
If customer satisfaction is the main reason of customer retention, banks should portray its products or
service quality the moment a consumer walks into the bank’s premise. The first contact is critical to the
consumer before they turn into customers. Siu et al. (2013) customer satisfaction is an accumulation
over certain number of meeting experiences and the firm shall continue to improve customer satisfaction
through service quality for customer retention. For that reason, service quality has become one of the
major researches by academics to explore.
Definition of service quality defined by Paul, Mittal, and Srivastav (2016) is the differences of actual
service performance received and customer’s expected service performance prior to the service. There is
a positive effect on the performance of profit for the firm that lead to the competitive advantages due to
the improved service quality. To enhance better service quality whether in term of employees’ service or
technology, banks have introduced more technology to customers. Technology has significantly
facilitated the creation of new service products like ATMs. Setting-up self-service terminals at one
corner in the branch for 24-hours banking transactions are some of the enhanced banking facilities.
Banks need to monitor these technologies equipment to avoid any break-downs that affect service
quality. All these introductions have provided new methods of how banks deliver services to customers.
Nevertheless, in internet banking services there is a “chat” function where customers can communicate
online with bank’s employee. The traditional service that require human involvement is still needed,
where financial matters are concerned.
Service quality is one of the crucial elements in building the success and becoming one of the rivals of
any business organization. Osman and Sentosa (2016) banking business can be differentiated from the
competitors by offering better service quality to the customers. And service quality is one of the reasons
that will decide the success in the banking business. As defined by Osman and Sentosa (2016) service
quality is an act or execution which make customers to receive the benefit. Banks must aware that it
needs to portray different approaches when employees sells service products to customers.
The factor of service quality is where customer can feel the satisfaction and marketing textbooks have
encouraged marketers to utilize this element to differentiate itself from the competitors and the
competing brand (Appannan et al., 2013). It is impossible for the banks to be differentiated as every
bank has homogeneous products. Hence, it is the bank’s management responsibility to differentiate itself
or among the bank’s branches through service quality. Service quality is one of the critical substances
that affect customers’ satisfaction level in the banking industry and providing service is not only from
the front office employees or sales team but from the operation employees up to the manager. Each
employee represents the company and should provide the best of quality service to customers.
To draw the attention and thereafter retain the customers, service quality is one of the crucial elements
(Islam, Ahmed, and Razak, 2015). The research conducted by them is in Malaysia Islamic banking,

Journal of Business and Social Review in Emerging Economies Vol. 6, No 4, December 2020
1309
service quality has been treated as a sensible requirement in this stiff banking competition and for the
expansion of market share and profit, banks need to produce superior service quality. Lau et al. (2013)
banks are spending more time on service quality for the purpose of getting competitive advantage in
term of increasing revenue and customer retention or loyalty from the customers. Furthermore, service
quality expected by customers is rising due to the easily available of information in terms of
advertisement from any banks and this allow customers to compare. And Khan and Fasih (2014)
research has stated that researchers from all over the world maintain that by providing quality service
will lead to strengthening the competitive advantage to any business industry.
Service quality is a continuous effort and all employees should have the commitment to do the same.
Lau et al. (2013) normally customers purchase from firm due to the service provided and being assured
for certain privileges. Providing quality service is not only for short term periods but for future
purchases as well. Khan and Fasih (2014) the competence of a firm to foresee the future needs of
customers represents the service quality and this will enhance the satisfaction of customers and the
retention rate of the firm. Paul et al. (2016) explains that if customers are satisfied with the service, it
shows in their mental state, where customers make a comparison of their purchase expectation prior to
the purchase with the actual perception on after the purchase process.
Osman, Mohamad, and Mohamad (2016) there are many past researches on banking industry such as
Greece, India, China, Taiwan and Iran which indicate that service quality plays a great influence and one
of the important roles that make customers loyal to the bank. Despite that, research by Sheng-Qiang and
Xue-Mei (2010) (as cited by Osman et al., 2016) state that tangible in service quality dimension has no
significant impact on loyalty. Therefore, researchers must be aware that different countries have
different cultures.
5. Conclusion and Recommendation
Chang, and Zhang (2016) there are various studies that proved that a small increase of customer
retention created a large increase on profits. It has been proven from the past researches, customer
retention is indeed the main element for business industry to perform or can be sustained provided there
is some infrastructure that helps. With customer retention, banks revenue will be increased due to the
repeat purchase and this in turn increase the profit for the bank. Moreover, retained customers help in
providing free word-of-mouth referral to attract new customers. Words from satisfied customers carry
more weight compared to the influences activated by the employees of the firm.
Mergers between the banks have enlarged their customer base. With fewer banks in the market,
competition is expected to lessen but it still exists, just that it has shifted from between banks to between
branches. However, there is the possibility of customers shift to another bank due to other reasons.
Hettiarachchy and Samarasinghe (2016) “a firm with effective customer retention have the capability to
convinces their clients to stay with the firm”. Customer retention definition given by Syaqirah, and
Faizurrahman (2014) is customers willingness to remain with the same service provider. Banks must
utilize any marketing gimmicks and strategy as well as utilizing the manpower of the employees to
retain any existing customers due to the advantages of customer retention are so great that banks and
other business industries should implement it as soon as possible.
For performance improvement, banks need to provide the element of quality service by fulfilling the
needs of customers. An empirical study by Osman et al. (2016) define service quality as what customer
going to receive from what they are willing to pay for instead of what supplier enclosed. Regardless
what type of customers, banks have the obligation to fulfil customers’ financial needs by providing
quality service consistently or additional services. Khan and Fasih (2014) specifically for the banking
business, additional or premium service quality act as a crucial role for customers to assess the
performance of the bank and it is a critical point of customer satisfaction and loyalty.
Journal of Business and Social Review in Emerging Economies Vol. 6, No 4, December 2020
1310
The important issue of this conceptual paper is the contribution of service quality put forward to
customers by the bank for the purpose of customer retention. Service quality, no matter how great the
product and the benefits or how influential the seller, one of the matters that customers are most likely to
remember is the direct communication they have with the firm, where human interaction plays a crucial
part. As long as quality service provided exceeds customers’ expectations, customers will be satisfied,
and this led to the intention of repeat purchase. As such, Syaqirah and Faizurrahman (2014) the
consequence on assessment of service quality can be proven when a firm providing excellent quality
service can leads to customers’ satisfaction and thereafter customer retention with higher profitability.
Revenue is generated through service quality where profit is concerned, and it is from retained
customers. However, complaints cannot be avoided, and the management should handle the complaints
process with care. The application of service recovery must be applied by the banks. During the service
recovery process banks management collects additional information to be analysed and, fix the root
cause to avoid re-occurrence. All the information collected will be utilized for future marketing
purposes. Notwithstanding the above, management should investigate further if even service quality
with premium has been implemented by the bank and each of the employee is giving the quality service
and yet the profit still fluctuates, it is time to analyse the operation cost of the bank.
References:
Aik, N. C., Hassan, M. K., Hassan, T., & Mohamed, S. (2015). Productivity and Spillover effect of
merger and acquisitions in Malaysia. Management Research Review, 38(3), 320-344.
Al-Alak, B. A. (2014). Impact of marketing activities on relationship quality in the Malaysian banking
sector. Journal of Retailing and Consumer Services, 21(3), 347-356.
Alnsour, M. S. (2013). How to retain a bank customer: A qualitative study of Jordanian banks relational
strategies. International Journal of Marketing Studies, 5(4), 123.
Appannan, S., Doraisamy, B., & Hui, T. X. (2013). Customer perception on service quality of
commercial banks: A Case Study in Penang, Malaysia. Academic Research International, 4(5),
459.
Arokiasamy, A. R. A. (2013). The impact of customer satisfaction on customer loyalty and intentions to
switch in the banking sector in Malaysia. The journal of commerce, 5(1), 14-21.
Bose, S., & Gupta, N. (2013). Customer perception of services based on the SERVQUAL dimensions: A
study of Indian commercial banks. Services Marketing Quarterly, 34(1), 49-66.
Chang, C. W., & Zhang, J. Z. (2016). The effects of channel experiences and direct marketing on
customer retention in multichannel settings. Journal of Interactive Marketing, 36, 77-90.
Coussement, K. (2014). Improving customer retention management through cost-sensitive
learning. European Journal of Marketing, 48(3/4), 477-495.
Edward, M., & Sahadev, S. (2011). Role of switching costs in the service quality, perceived value,
customer satisfaction and customer retention linkage. Asia Pacific Journal of Marketing and
Logistics, 23(3), 327-345.
Hettiarachchy, B. S., & Samarasinghe, D. S. R. (2016). Influence of Relationship Marketing on
Customer Retention in Sri Lankan Banking Industry (13th International Conference on Business
Management 2016).
Hundre, S., Kumar, P. R., & Kumar, G. D. (2013). Customer Retention--Key to Success for
Organization: A Case Study of Banking Industry. Research Journal of Agricultural Science, 4.
Hundre, S., Kumar, P. R., & Kumar, G. D. (2013). Customer Retention--Key to Success for
Organization: A Case Study of Banking Industry. Research Journal of Agricultural Science, 4.
Islam, R., Ahmed, S., & Razak, D. A. (2015). Identifying the gaps between customer expectations and
perceptions on service quality dimensions of Islamic banks in Malaysia. International Journal of
Quality and Service Sciences, 7(4), 424-441.
Journal of Business and Social Review in Emerging Economies Vol. 6, No 4, December 2020
1311
Kandampully, J., Zhang, T., & Bilgihan, A. (2015). Customer loyalty: a review and future directions
with a special focus on the hospitality industry. International Journal of Contemporary
Hospitality Management, 27(3), 379-414.
Khan, M. M., & Fasih, M. (2014). Impact of service quality on customer satisfaction and customer
loyalty: Evidence from banking sector. Pakistan Journal of Commerce and Social Sciences, 8(2),
331.
Lai, K. Y., Ling, T. P., Eng, T. K., Cheng, L. S., & Ting, L. F. (2015). Financial Performance of
Malaysia Local Banks: During Period of Pre-Merger and Post-Merger. Journal of Economics,
Business and Management, 3(9), 826-830.
Lau, M. M., Cheung, R., Lam, A. Y., & Chu, Y. T. (2013). Measuring service quality in the banking
industry: a Hong Kong based study. Contemporary Management Research, 9(3).
Mecha, E. K., Martin, O., & Ondieki, S. M. (2015). Effectiveness of customer retention strategies: A
case of commercial banks, Kenya. International Journal of Business and Management, 10(10),
270.
Noel Yee, Tracy Jun and Jackie Yau, (2013). The Roles of Justice and Customer Satisfaction in
Customer Retention: A Lesson from Service Recovery. J Bus Ethics, 114:675–686 DOI
10.1007/s10551-013-1713-3.
Osman, Z., & Sentosa, I. (2014). Influence of Customer Satisfaction on Service Quality and Customer
Loyalty Relationship in Malaysian Commercial Banking Industry.
Osman, Z., Mohamad, L., & Mohamad, R. K. (2016). An Empirical Study of Direct Relationship of
Service Quality, Customer Satisfaction and Bank Image on Customer Loyalty in Malaysian
Commercial Banking Industry.
Paul, J., Mittal, A., & Srivastav, G. (2016). Impact of service quality on customer satisfaction in private
and public sector banks. International Journal of Bank Marketing, 34(5), 606-622.
Siu, N. Y. M., Zhang, T. J. F., & Yau, C. Y. J. (2013). The roles of justice and customer satisfaction in
customer retention: A lesson from service recovery. Journal of Business Ethics, 114(4), 675-686.
Syaqirah, Z. N., & Faizurrahman, Z. P. (2014). Managing customer retention of hotel industry in
Malaysia. Procedia-Social and Behavioral Sciences, 130, 379-389.
Tan, L. H., Hamid, S. R., & Chew, B. C. (2016). Service quality audit based on conceptual gaps model
of service quality: a case study of top three largest local bank in Malaysia. International Journal
of Productivity and Quality Management, 18(1), 99-115.
Wang, K. Y., Hsu, L. C., & Chih, W. H. (2014). Retaining customers after service failure recoveries: a
contingency model. Managing Service Quality, 24(4), 318-338.
Zeyad, M., & Ab Wahab, N. (2013). Factors affecting customer loyalty in Islamic banking: Evidence
from Malaysian Banks. International Journal of Business and Social Science, 4(7).
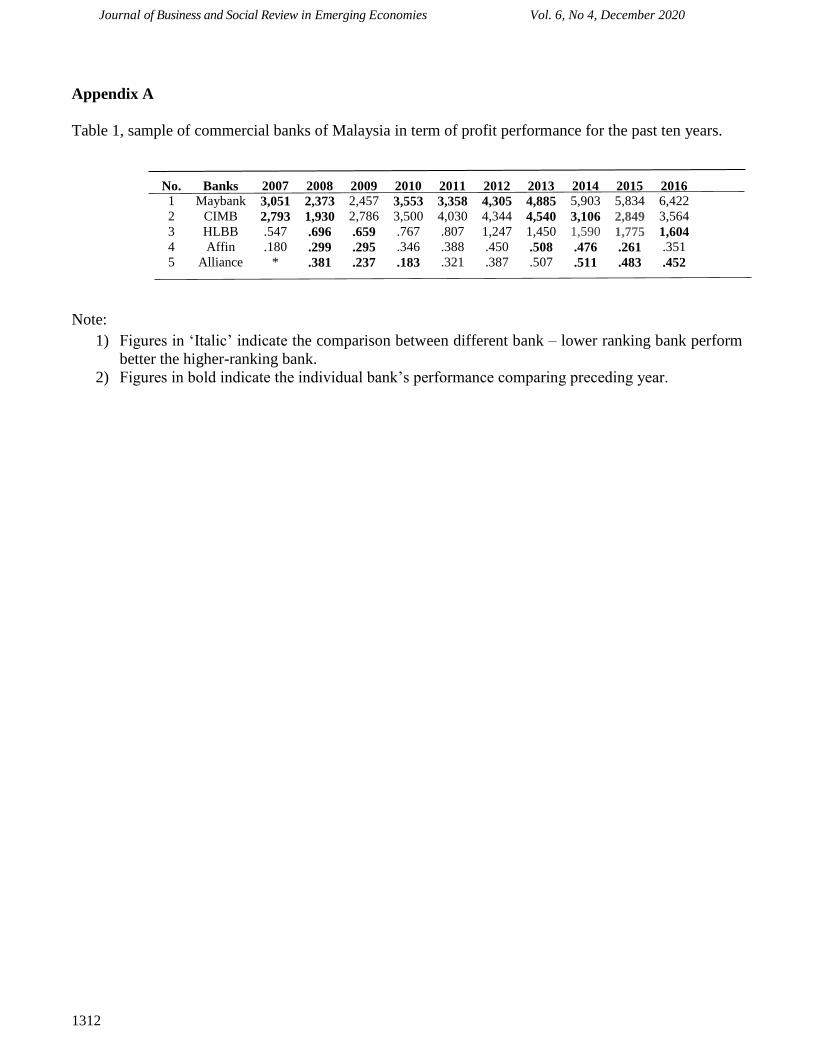
Journal of Business and Social Review in Emerging Economies Vol. 6, No 4, December 2020
1312
Appendix A
Table 1, sample of commercial banks of Malaysia in term of profit performance for the past ten years.
Note:
1) Figures in ‘Italic’ indicate the comparison between different bank – lower ranking bank perform
better the higher-ranking bank.
2) Figures in bold indicate the individual bank’s performance comparing preceding year.
No. Banks 2007 2008 2009 2010 2011 2012 2013 2014 2015 2016
1 Maybank 3,051 2,373 2,457 3,553 3,358 4,305 4,885 5,903 5,834 6,422
2 CIMB 2,793 1,930 2,786 3,500 4,030 4,344 4,540 3,106 2,849 3,564
3 HLBB .547 .696 .659 .767 .807 1,247 1,450 1,590 1,775 1,604
4 Affin .180 .299 .295 .346 .388 .450 .508 .476 .261 .351
5 Alliance * .381 .237 .183 .321 .387 .507 .511 .483 .452

Journal of Business and Social Review in Emerging Economies Vol. 6, No 4, December 2020
1313
Volume and Issues Obtainable at Center for Sustainability Research and Consultancy
Journal of Business and Social Review in Emerging Economies ISSN: 2519-089X (E): 2519-0326
Volume 6: No. 4, December 2020
Journal homepage: www.publishing.globalcsrc.org/jbsee
The Impact of Covid- 19 Pandemic on Mental Well- Being of Health Care Workers:
A Multi-Centre Study
1Nabila Hassan, 2Hina Akmal Memon, 3Noreen Hassan, 4Shobha Luxmi, 5Farhat Sultana 1Assistant Professor, OBGYN, Liaquat University of Medical and Health Sciences (LUMHS),
Jamshoro, Pakistan, [email protected] 2Women Medical Officer, OBGYN, Liaquat University of Medical and Health Sciences, (LUMHS),
Jamshoro, Pakistan, [email protected] 3Lecturer, Business Administration, Federal Urdu University of Arts and Technology, (FUUAST)
Karachi, Pakistan, [email protected] 4Assistant Professor, Infectious disease, Dow University of Health Sciences, Karachi, Pakistan,
[email protected] 5Assistant Professor, OBGYN, Liaquat University of Medical and Health Sciences (LUMHS),
Jamshoro, Pakistan, [email protected]
ARTICLEDETAILS ABSTRACT History Revised format: November 2020 Available Online: December 2020
The study determines the effect of fear of being infected on anxiety
and influence of anxiety on the disturbance of their mental well-being
and to analyze the indirect effect of anxiety between fear of being
infected and mental well-being. Cross-Sectional study carried out in
the month of July 2020, by conducting a survey from health care
workers (Doctors, Nurses and Trainees) covering hospitals from the
region of Hyderabad, Jamshoro and Karachi. Analysis of the data
done using two-step method of Structural Equation Model (SEM)
approach. The findings of the study supported the positive and
negative relationship fear of being infected to anxiety and anxiety to
mental wellbeing respectively. In addition, the indirect relationship of
anxiety also supported. Numerous unanswered queries pertinent to
COVID-19 pandemic, and dubious situation leads towards huge size
of disturbance in the lives of health care workers across the globe,
therefore literature entails the necessity for researchers to study
various factors that could have influence on mental well-being of an
individual . The majority of relevant literature focused on mental
well-being is from China, Europe, USA and other developed
countries, however, fewer studies focused on South Asian region in
general, and Pakistan in particular. So, present study fills the gap to
unearth the factors of well-being for Pakistani health care workers.
Pakistan have so far lost the lives of 58 healthcare providers to
COVID-19 in the country and still counting while 240 healthcare
providers are hospitalized. So there is intense need to study effect of
mental well-being on health care workers as there is a need to save
the survivors.
©2020 Center for Sustainability Research and Consultancy Pakistan under a
Creative Commons Attribution-Non Commercial-Share Alike 4.0
Keywords Mental Well- Being, COVID-
19, Fear of being infected,
Anxiety
JEL Classification
I1, I3

Journal of Business and Social Review in Emerging Economies Vol. 6, No 4, December 2020
1314
Corresponding author’s email address: [email protected]
Recommended citation: Hassan, N., Memon, H. K., Hassan, N., Luxmi, S. & Sultana, F. (2020). The
impact of Covid- 19 Pandemic on Mental Well- Being of Health Care Workers: A Multi-Centre Study.
Journal of Business and Social Review in Emerging Economies, 6(4), 1313-1322.
1. Introduction
Human history corroborates that an outburst of any pandemic results in multiple human causalities, a
large number of suspected patients, the wave of uncertainty and deep down fear. The outbreaks of
infectious diseases have been greater threat on human health and wellbeing since ages (Duncan,
Schaller, & Park, 2009). The emergence of a novel type of corona virus, named as COVID-19, initially
from Wuhan, China in December 2019 later on involving almost the whole world evoked immense
challenges. This sheer speed of both the land extension and the unexpected increment in quantities of
cases astonished and immediately overpowered health and public health services(Wu & McGoogan,
2020).
COVID-19 caused by a beta coronavirus named SARS-CoV-2 that affects the lower respiratory tract
(Sohrabi et al., 2020) transmitted through respiratory droplets taking equal time for incubation and
generation as SARS Corona virus (Wilson & Chen, 2020). On 22 of February year 2020, World Health
Organization (WHO) confirmed COVID-19, a Public Health Emergency of International Concern and
afterward it declared as Pandemic and By July 23, 2020, globally more than 200 counties/regions have
reported rising toll of infection, morbidity and mortality.
Situation in Pakistan is alarming as well as number of active cases has surged to more than 400 million
cases with more than 8000 fatalities (Waris, Khan, Ali, Ali, & Baset, 2020). As this pandemic was new,
many of the health workers were not ready for it (Haq, Shafiq, & Sheikh, 2020).Globally the Healthcare
workers(HCWs) are facing different problems related to their physical health, mental health and safety
(Li, Song, Wong, & Cui, 2020). It is true for Pakistan where economic problems, limited facilities and
infrastructure, with lack access to personal protective equipment (PPEs) and proper training such as
donning and doffing pose the health care workers at greater risk being infected. (Haq et al., 2020).
As a result, many healthcare workers are contracting infection and some others who remain in contact
with those positive cases are going to self-quarantine creating pressure in hospital and tertiary care units.
An initial report revealed, as many as 765 healthcare workers including doctors (440), nurses (111) and
paramedics (215) have tested positive for COVID 19 up till june 2020. (Harris, Bhatti, Buckley, &
Sharma, 2020). There are also reports that healthcare workers once contracting disease are also infecting
other healthy patients. Situation becomes worse when news of deaths of healthcare workers due to
COVID 19 reported. This led to nervousness and anxiety for health care workers while examining their
patients with positive COVID 19, resulting in severe mental disturbance (Satici, Saricali, Satici, &
Griffiths, 2020). This reflects that "The flare-up of Corona Virus illness 2019 (COVID-19) might be
upsetting. Dread and nervousness, fear and anxiety about a disease can be overpowering for health care
workers”. (CDC-Report) Notably, research endeavors concerning COVID-19 pandemic needed to create
proof driven methodologies to diminish unfavorable mental effects and mental indications (P. Li et al.,
2020).
The development of COVID-19 pandemic might prompt psychological trouble, nervousness and fear
may lead to harmful stereotypes (Bangalore et al., 2020). Hence, it is important to pay adequate attention
towards the mental wellbeing of health care workers through actualizing ways to encourage it at
numerous degrees of experience during this unprecedented time of COVID-19 pandemic (Huang et al.,
2020). Overall, experts around the globe are emphasizing on uplifting the mental wellbeing of public
suffered by rising magnitude and intensity of COVID-19 pandemic (Chen et al., 2020; Rajkumar, 2020)
but there is a dire need to uplift the mental well-being of health care workers who are actually dealing
with the patients. This pandemic situation worldwide is representing a genuine threat to wellbeing due to
fear of being infected, economic downturn and unavailability of clinically affirmed vaccines or specific
therapeutic medications accessible for COVID-19.
Journal of Business and Social Review in Emerging Economies Vol. 6, No 4, December 2020
1315
This scenario poses numerous unanswered queries pertinent to COVID-19 pandemic, and consequently,
the dubious situation leads towards huge size of disturbance in the lives of Health care workers across
the globe, which entails the necessity for researchers to study various factors that could have influence
on mental wellbeing of an individual (Chen et al., 2020)
The contribution of this research towards relevant literature is twofold. Firstly, this study is first attempt
to examine the underlying relationship between fear, anxiety and mental wellbeing in a single study in
the context of COVID-19 Pandemic. Secondly, majority of relevant literature focused on China, Europe,
USA and other developed countries, however, fewer studies focused on South Asian region in general,
and Pakistan in particular.
Fear of being infected reflects people general tendency to perceive themselves vulnerable
to infections and risk of being contaminated with viruses (Stürmer, Rohmann, Mazziotta, Siem, &
Barbarino, 2017) suggested as Fear is an adaptive response in the presence of danger. However, when
threat is uncertain and continuous, as in the current coronavirus disease (COVID-19) pandemic, fear can
become chronic and burdensome. Chinese study finding indicates confronted with the COVID-19
epidemic, HCWs including doctors and frontline workers feel very anxious about getting infected and
had a great psychological distress and anxiety. The nurses were more conscious about being infected at
work than doctors, technicians and support personnel, which cause the sky-high level of anxiety,
excessive fatigue, depressions and tensions. As a result quality of work found seriously affected.
Moreover, the study sturdily marked the acute level of distress and anxiety because of the fear of being
infected apparently it seems that there are no significant difference in mental condition between HCWs
with or without self-infection (Dai, Hu, Xiong, Qiu, & Yuan, 2020). Another study on Thai discovered
same psychological impacts over mental health and work performance. Surprisingly most HCWs found
overawed by a frightening nightmare to them, depression, lack of attentiveness and greater anxiety.
These emotions proved somehow good, as they lead towards more appropriate infection prevention
practices but still number of HCWs were not willing and were not satisfied to accept new patients
infected by COVID-19 or to see them admitted. However, the most crucial part is that the HCWs are
found vague for not giving reasonable attend towards their tasks and not putting their required
concentration at their work, raising issues on patient’s safety and health.(Anucha Apisarnthanarak et al.,
2020). (Jungmann & Witthöft, 2020) emphasized specifically on analyzing the factors related to anxiety
and the similar relationship where COVID-19 pandemic sit for adverse behaviors. The existing situation
of coronavirus (SARS-CoV-2) pandemic is becoming the reason of mental and physical anxiety and
high fatality with major impact on quality of life. Therefore, on the ground of the preceding studies, it is
hypothesized that:
H1: Fear of being infected positively related to Anxiety
World Health Organization define mental well-being as an ability to live, work and appreciate diversion
in a network where one has a feeling of belongingness and support, and the capacity to make meaningful
contributions. The study of (Roy et al., 2020)expressed the effect of massive anxiety during pandemic
situation specifically on Indian population, reported the massive reaction by people of all domains. This
situation was determined from the time when media was broadcasting constantly through borders to
possess every one up-to-date about the pandemic situation, which affect mental health due to anxiety,
depression, fatigue and distress. . A Study from China by (Ahmed et al., 2020) indicates that anxiety
remains negatively associated with mental wellbeing. Lock down and self-isolation significantly raised
mental health problem with hazardous and harmful alcohol use. The study further added that the
youngsters showed lowest mental well-being and provided psychiatric treatment to improve the well-
being. Another study on health care workers and frontline staff highlighted that as COVID-19 pandemic
is generating a massive health care problem that can reflect in different ways affecting their mental well-
being as depression anxiety leads towards excessive sensation of aloneness, injurious liquor and drug
use, self-harm or suicidal activities (Zaka, Shamloo, Fiorente, & Tafuri, 2020).
H2: Anxiety negatively related to mental well-being
Corona virus is affecting the life of the people overall. It makes a feeling of fear and lead to stress,

Journal of Business and Social Review in Emerging Economies Vol. 6, No 4, December 2020
1316
nervousness and ultimately to mental issues. As indicated by Center for Disease Control and Prevention
(CDC) Fear and anxiety about a disease can be overpowering. Another study by (Desclaux, Diop, &
Doyon, 2017) , (Jeong et al., 2016)found the participants having fears about their own health or fears of
infecting others including their family members. They likewise turned out stressed in the event that they
encountered any physical symptoms conceivably identified with the disease and fear that the symptoms
could reflect having the infection kept on recognized with mental results. The study of (Evanoff et al.,
2020) deliberated professional and private issues linked with psychological comfort and acknowledged
stress, anxiety, depression, work-exhaustion, burnout, and reduced comfort between faculty and staff at
a university and academic medical center during the SARS-CoV-2 pandemic. The frequency of unease,
melancholy, and work exhaustion slightly advanced amongst clinicians than non-clinicians. Between all
employees, anxiety, depression, and high work fatigue autonomously related with community or clinical
exposure to COVID-19 fear of infection. Additionally, age below 40 and a vast number of family or
home with stress also allocated with just handful outcomes. The study suggests that the mental well-
being and health negatively affected of clinical and non-clinical staff during this pandemic situation due
to depression and anxiety created.
H3: Anxiety negatively mediates the relationship between Fear of being infected and mental well-
being
Figure- 1 demonstrate the conceptual framework of the present study
Figure-1 Model of the study
Source: Researcher
2. Methods and Methods
The present study carried out with Cross-Sectional Research Design whereby the data collected over the
month of July 2020 by conducting a survey from health care workers (Doctors, Nurses and Trainees)
covering 12 hospitals from the region of Hyderabad, Jamshoro and Karachi. The primary data collected
using convenience non-random sampling technique. For this study the ethical standards were strictly
considered while performing procedures in studies comprised of human participants. The 7-item scale of
fear of being infected” adapted from the work of (Ahorsu et al., 2020). 5-item scale of Anxiety adopted
from the work of (Lee, 2020). 14-item scale of Mental Well-Being adopted from the work of Warwick–
Edinburgh (2007) (Tennant et al.). For testing the significance and relevance of path coefficients, partial
least square (PLS-SEM) approach employed using SMART PLS 3.0 (Henseler, Ringle, & Sarstedt,
2015).
Table -1 indicate the demographic details of the present study
Table 1: Demographic Details
GENDER
Frequency Percent
Male 119 31.81
Female 255 68.18
Total 374 100.0
AGE
Frequency Percent
Less than 28 54 14.43
28- 35 120 32.08
36-43 145 38.77
Above 43 55 14.72
Total 374 100.0
HOSPITAL

Journal of Business and Social Review in Emerging Economies Vol. 6, No 4, December 2020
1317
Source: Researcher
3. Results
As the table-2 indicated, the outer loadings and Composite Reliability more than satisfactory as all the
values are higher than 0.50 establishing indicator reliability (F. Hair Jr, Sarstedt, Hopkins, & G.
Kuppelwieser, 2014) and 0.70 establishing internal consistency reliability (Hair, Black, Babin,
Anderson, & Tatham, 2006) respectively. The average variance extracted values for all constructs are
greater than 0.5 (Hair et al., 2006) and hence establishes the convergent validity.
Table 2: Reliability and Validity
CONSTRUCT
ITEMS
OUTER
LOADINGS
COMPOSITE
RELIABILITY
AVERAGE VARIANCE
EXTRACTED
Anxiety
ANX1 0.767
0.912 0.674
ANX2 0.845
ANX3 0.793
ANX4 0.860
ANX5 0.836
Fear of being
infected
FOI1 0.745
0.850 0.889
FOI2 0.752
FOI3 0.662
FOI4 0.787
FOI5 0.750
FOI6 0.830
Mental
well being
MWB1 0.670
0.925 0.934
MWB10 0.720
MWB11 0.633
MWB12 0.613
MWB13 0.727
MWB14 0.757
MWB2 0.710
MWB3 0.691
MWB4 0.699
Frequency Percent
Civil Hospital 40 10.69
Agha Khan Hospital 26 06.96
St. Elizabeth 32 08.56
Sindh Government 30 08.03
Isra Hospital 26 06.95
Lady Dufferin Hospital 19 05.08
MaaJee Hospital 26 06.95
Dow University of health
sciences Karachi
37 09.89
Red Crescent Hospital 34 09.09
Liaquat University Hospital,
Jamshoro
31 08.29
Sehat 34 09.09
City Care Hospital 39 10.42
Total 374 100.0
DESIGNATION
Frequency Percent
Doctor 154 0
Nurse 122 0
Trainee 98 0
Total 374 100.0

Journal of Business and Social Review in Emerging Economies Vol. 6, No 4, December 2020
1318
MWB5 0.749
MWB6 0.743
MWB7 0.788
MWB8 0.718
MWB9 0.704
Source: Researcher
Illustrated in figure-2 the measurement model (representing outer loading and beta coefficient) on
SMART PLS software.
Figure-2 Outer Model (Smart PLS)
Source: Researcher
As specified in table -3 all the HTMT values are below 0.85 (Henseler et al., 2015) ascertained
discriminant validity Table 3 Discriminant validity
1 2 3
Anxiety
Fear of being Infected 0.546
Mental Well-Being 0.366 0.119
Source: Researcher
In the study the bootstrapping method with 5000 re samples (Hair, Hult, Ringle, & Sarstedt, 2017) via
Bias-Corrected and Accelerated (BCA) Bootstrap with one tailed test where significance level is 0.05
employed .

Journal of Business and Social Review in Emerging Economies Vol. 6, No 4, December 2020
1319
Table 4: Significance & Relevance of Path Coefficients
Original
Sample (STDEV) |O/STDEV| P Values 5.00% 95.00%
Fear of being Infected Anxiety 0.481 0.054 8.955 0.000 0.387 0.563
Anxiety Mental Well-Being -0.352 0.062 5.701 0.000 -0.443 -0.237
Fear of being Infected AnxietyMental Well-Being -0.169 0.031 5.516 0.000 -0.221 -0.12
Source: Researcher
Table- 4 specifies that fear of being infected is positively and significantly associated to anxiety and
anxiety of HCWs is negatively associated with mental wellbeing indicating increase in anxiety with
reduce their mental well-being and significance presence of anxiety as a mediator between the
relationship(F. Hair Jr et al., 2014; Preacher & Hayes, 2008)
Figure-3 Inner Model (Smart PLS)
Source: Researcher
From figure-3 it is clear that present study model explains 49.2% of total variance in anxiety and 35.7%
in mental wellbeing exhibited moderate level of R-square. Study indicates the predictive relevance of the
model.
4. Discussion
This finding is in line with literature that there exist psychological impacts of COVID-19 pandemic
outbreak on healthcare workers. As stated in a recent study (Dai et al., 2020) that corona virus anxiety
was lowest when individuals use adaptive emotion regulation strategies (acceptance and putting into
perspective). Due to this pandemic situation, health care workers have a great fear of being infected
leading to depression, anxiety and excessive fatigue. As stated by (Anucha Apisarnthanarak et al., 2020)
that “Although these emotions are proved to be good, as they lead towards more appropriate infection
prevention practices but still number of HCWs were not willing and were not satisfied to accept new

Journal of Business and Social Review in Emerging Economies Vol. 6, No 4, December 2020
1320
patients infected by COVID-19 or to see them admitted”. It is evident that there are a high number of
HCWs affected by various psychological ailments however the most crucial part is that the HCWs are
found vague for not giving reasonable attend towards their tasks and not putting their required
concentration at their work, that can raise issues of patient’s safety and health.
The current study has found a negative relationship of anxiety and mental well-being. At the extent
mental well-being expected to be improved by providing valuable supportive information related to self-
quarantine and social distancing to overcome but this was not the case for health workers as they are
continuously examining their patients with fear of being infected leading anxiety. They further confess
sleeplessness and mental disturbance due to the resultant anxiety. A study on mental well-being
identified that an indication of improvement in mental well-being showed peoples' willingness and
positive response to follow governmental guidelines to cope up the difficult situation but an outcome in
reality significantly affects mental health problem due to frustration, depression, anxiety and distress
(Roy et al., 2020). Both the government and health care agencies are responsible for protecting the
psychological well-being of health care communities all over the world and ensuring a healthy work
environment. Since there is a high prevalence of psychological trauma consequences among HCWs due
to this pandemic; it is imperative to invest resources to promote the mental health welfare of frontline
professionals. Older participants experienced greater well-being and a lower level of stress compared to
younger ones. Doctors reported more stress than trainee and nurses. Anxiety had a strong effect on the
overall well-being of physicians. As it is stated (Zaka et al., 2020) that COVID 19 Pandemic creates
mental illness, anxiety, depression, stress which reflect due to fear of being infected.
The current study has found a negative mediating relationship of anxiety between fear of being infected
and mental well-being which is in line with literature. The HCW’s found afraid of less precautionary
measures used by the patients and this non co-operative attitude of patients found leading further into a
high level of depression , exhaustion and fear for the HCWs. As stated by (A. Apisarnthanarak et al.,
2020) the HCWs who are suffering from pandemic situation are fenced by a fear of being infected with
suspected or confirmed COVID-19 patients, as they are absurdly exposed reported psychological
distress. Furthermore, we find out that this crucial situation is making the anxiety stronger in HCWs, .as
in lined by (Jungmann & Witthöft, 2020) that COVID 19 pandemic is becoming the reason of mental
trauma. As an outcome panel(Ahmed et al., 2020)defined that this current situation significantly affects
mental health problem like frustration, depression and distress.
5. Conclusion
Development and spread of COVID-19 prompt psychological trouble, nervousness, and fear so
emphasizing on uplifting the mental wellbeing of health care workers. The findings of the study
supported the positive and negative relationship fear of being infected – anxiety and anxiety – mental
wellbeing respectively. This research has certain limitations; first, it is hard to measure hundred percent
views of any health care workers. As the perception is the individual expression which in hidden as it
inside view or state of mind of participant, this could be ascertain only through the responses attempted
by individual in the pandemic situation. Further, the survey conducted considering certain geographical
region that might reflect bias. The outcomes cannot be generalized so it is suggested for prospect
scholars and researchers to include the other geographical sectors, with a larger population. Moreover
the work can be broaden with additional moderating and mediating variables using other variables like
emotional exhaustion, depression, mental illness, insomnia etc.
References
Ahmed, M. Z., Ahmed, O., Aibao, Z., Hanbin, S., Siyu, L., & Ahmad, A. (2020). Epidemic of COVID-
19 in China and associated Psychological Problems. Asian journal of psychiatry, 102092.
Ahorsu, D. K., Lin, C.-Y., Imani, V., Saffari, M., Griffiths, M. D., & Pakpour, A. H. (2020). The fear of
COVID-19 scale: development and initial validation. International Journal of Mental Health and
Addiction. doi:https://doi.org/10.1007/s11469-020-00270-8

Journal of Business and Social Review in Emerging Economies Vol. 6, No 4, December 2020
1321
Apisarnthanarak, A., Apisarnthanarak, P., Siripraparat, C., Saengaram, P., Leeprechanon, N., & Weber,
D. J. (2020). Impact of Anxiety and Fear for COVID-19 Toward Infection Control Practices
Among Thai Healthcare Workers. Infection Control & Hospital Epidemiology, 1-6.
doi:https://doi.org/10.1017/ice.2020.280
Apisarnthanarak, A., Apisarnthanarak, P., Siripraparat, C., Saengaram, P., Leeprechanon, N., & Weber,
D. J. (2020). Impact of anxiety and fear for COVID-19 toward infection control practices among
Thai healthcare workers. Infect Control Hosp Epidemiol, 1-2. doi:10.1017/ice.2020.280
Bangalore, S., Sharma, A., Slotwiner, A., Yatskar, L., Harari, R., Shah, B., . . . Alviar, C. L. (2020). ST-
segment elevation in patients with Covid-19—a case series. New England Journal of Medicine.
doi:https://doi.org/10.1056/nejmc2009020
Chen, N., Zhou, M., Dong, X., Qu, J., Gong, F., Han, Y., . . . Wei, Y. (2020). Epidemiological and
clinical characteristics of 99 cases of 2019 novel coronavirus pneumonia in Wuhan, China: a
descriptive study. The lancet, 395(10223), 507-513. doi:https://doi.org/10.1016/S0140-
6736(20)30211-7
Dai, Y., Hu, G., Xiong, H., Qiu, H., & Yuan, X. (2020). Psychological impact of the coronavirus disease
2019 (COVID-19) outbreak on healthcare workers in China. MedRxiv.
doi:https://doi.org/10.1101/2020.03.03.20030874
Desclaux, A., Diop, M., & Doyon, S. (2017). Fear and Containment. The Politics of Fear: Médecins
Sans Frontières and the West African Ebola Epidemic, 209-234.
Duncan, L. A., Schaller, M., & Park, J. H. (2009). Perceived vulnerability to disease: Development and
validation of a 15-item self-report instrument. Personality and Individual differences, 47(6), 541-
546. doi:https://doi.org/10.1016/j.paid.2009.05.001
Evanoff, B. A., Strickland, J. R., Dale, A. M., Hayibor, L., Page, E., Duncan, J. G., . . . Gray, D. L.
(2020). Work-related and Personal Factors Associated with Mental Well-being during COVID-
19 Response: A Survey of Health Care and Other Workers. MedRxiv.
doi:https://doi.org/10.1101/2020.06.09.20126722
F. Hair Jr, J., Sarstedt, M., Hopkins, L., & G. Kuppelwieser, V. (2014). Partial least squares structural
equation modeling (PLS-SEM) An emerging tool in business research. European Business
Review, 26(2), 106-121. doi:https://doi.org/10.1108/EBR-10-2013-0128
Hair, J. F., Black, W. C., Babin, B. J., Anderson, R. E., & Tatham, R. L. (2006). Multivariate data
analysis (Vol. 6). In: Upper Saddle River, NJ: Pearson Prentice Hall.
Hair, J. F., Hult, G. T. M., Ringle, C. M., & Sarstedt, M. (2017). A primer on partial least squares
structural equation modeling (PLS-SEM) (Vol. null): Sage.
Haq, M. I. U., Shafiq, F., & Sheikh, H. (2020). Potential Barriers Amongst Health Care Professionals
(HCPs) of Pakistan in Managing COVID 19 patients. Pakistan Journal of Medical Sciences,
36(COVID19-S4). doi:https://doi.org/10.12669/pjms.36.COVID19-S4.2753
Harris, M., Bhatti, Y., Buckley, J., & Sharma, D. (2020). Fast and frugal innovations in response to the
COVID-19 pandemic. Nature Medicine, 1-4. doi:https://doi.org/10.1038/s41591-020-0889-1
Henseler, J., Ringle, C. M., & Sarstedt, M. (2015). A new criterion for assessing discriminant validity in
variance-based structural equation modeling. Journal of the academy of marketing science,
43(1), 115-135. doi:https://doi.org/10.1007/s11747-014-0403-8
Huang, C., Wang, Y., Li, X., Ren, L., Zhao, J., Hu, Y., . . . Gu, X. (2020). Clinical features of patients
infected with 2019 novel coronavirus in Wuhan, China. The lancet, 395(10223), 497-506.
doi:https://doi.org/10.1016/S0140-6736(20)30183-5
Jeong, H., Yim, H. W., Song, Y.-J., Ki, M., Min, J.-A., Cho, J., & Chae, J.-H. (2016). Mental health
status of people isolated due to Middle East Respiratory Syndrome. Epidemiology and health,
38. doi:https://doi.org/10.4178/epih.e2016048
Jungmann, S. M., & Witthöft, M. (2020). Health anxiety, cyberchondria, and coping in the current
COVID-19 pandemic: Which factors are related to coronavirus anxiety? Journal of Anxiety
Disorders, 102239. doi:https://doi.org/10.1016/j.janxdis.2020.102239
Lee, S. A. (2020). Coronavirus Anxiety Scale: A brief mental health screener for COVID-19 related
anxiety. Death studies, 44(7), 393-401. doi:https://doi.org/10.1080/07481187.2020.1748481

Journal of Business and Social Review in Emerging Economies Vol. 6, No 4, December 2020
1322
Li, P., Fu, J.-B., Li, K.-F., Liu, J.-N., Wang, H.-L., Liu, L.-J., . . . Tang, A. (2020). Transmission of
COVID-19 in the terminal stages of the incubation period: A familial cluster. International
Journal of Infectious Diseases, 96, 452-453. doi:https://doi.org/10.1016/j.ijid.2020.03.027
Li, X., Song, Y., Wong, G., & Cui, J. (2020). Bat origin of a new human coronavirus: there and back
again. Science China Life Sciences, 63(3), 461-462. doi:https://doi.org/10.1007/s11427-020-
1645-7
Preacher, K. J., & Hayes, A. F. (2008). Asymptotic and resampling strategies for assessing and
comparing indirect effects in multiple mediator models. Behavior research methods, 40(3), 879-
891.
Rajkumar, R. P. (2020). COVID-19 and mental health: A review of the existing literature. Asian journal
of psychiatry, 102066.
Roy, D., Tripathy, S., Kar, S. K., Sharma, N., Verma, S. K., & Kaushal, V. (2020). Study of knowledge,
attitude, anxiety & perceived mental healthcare need in Indian population during COVID-19
pandemic. Asian journal of psychiatry, 102083. doi:https://doi.org/10.1016/j.ajp.2020.102083
Satici, B., Saricali, M., Satici, S. A., & Griffiths, M. D. (2020). Intolerance of uncertainty and mental
wellbeing: serial mediation by rumination and fear of COVID-19. International Journal of
Mental Health and Addiction. doi:https://doi.org/10.1007/s11469-020-00305-0
Sohrabi, C., Alsafi, Z., O’Neill, N., Khan, M., Kerwan, A., Al-Jabir, A., . . . Agha, R. (2020). World
Health Organization declares global emergency: A review of the 2019 novel coronavirus
(COVID-19). International Journal of Surgery. doi:https://doi.org/10.1016/j.ijsu.2020.02.034
Stürmer, S., Rohmann, A., Mazziotta, A., Siem, B., & Barbarino, M. L. (2017). Fear of infection or
justification of social exclusion? The symbolic exploitation of the Ebola epidemic. Political
Psychology, 38(3), 499-513. doi:https://doi.org/10.1111/pops.12354
Tennant, R., Hiller, L., Fishwick, R., Platt, S., Joseph, S., Weich, S., . . . Secker, J. & Stewart-Brown,
S.(2007). The Warwick-Edinburgh mental well-being scale (WEMWBS): development and UK
validation. Health and Quality of life Outcomes, 5(1), 63. doi:https://doi.org/10.1186/1477-7525-
5-63
Waris, A., Khan, A. U., Ali, M., Ali, A., & Baset, A. (2020). COVID-19 outbreak: current scenario of
Pakistan. New Microbes and New Infections, 100681.
doi:https://doi.org/10.1016/j.nmni.2020.100681
Wilson, M. E., & Chen, L. H. (2020). Travellers give wings to novel coronavirus (2019-nCoV). In:
Oxford University Press.
Wu, Z., & McGoogan, J. M. (2020). Characteristics of and important lessons from the coronavirus
disease 2019 (COVID-19) outbreak in China: summary of a report of 72 314 cases from the
Chinese Center for Disease Control and Prevention. Jama, 323(13), 1239-1242.
doi:https://doi.org/10.1001/jama.2020.2648
Zaka, A., Shamloo, S. E., Fiorente, P., & Tafuri, A. (2020). COVID-19 pandemic as a watershed
moment: A call for systematic psychological health care for frontline medical staff.
doi:https://doi.org/10.1177%2F1359105320925148

Journal of Business and Social Review in Emerging Economies Vol. 6, No 4, December 2020
1323
Volume and Issues Obtainable at Center for Sustainability Research and Consultancy
Journal of Business and Social Review in Emerging Economies ISSN: 2519-089X (E): 2519-0326
Volume 6: No. 4, December 2020
Journal homepage: www.publishing.globalcsrc.org/jbsee
The Impact of China-Pak Economic Corridor (CPEC) on Pakistan Stock Exchange
(PSX)
1Muhammad Mudasar Ghafoor, 2Zahid Hussain, 3Muhammad Yasir Saeed, 1Director, University of the Punjab, Jhelum Campus, Jhelum. Pakistan, [email protected]
2Faculty Member, FMS, National Textile University, Faisalabad. Pakistan, [email protected] 3PhD Scholar, Department of Management Sciences, Preston University, Islamabad,
ARTICLE DETAILS ABSTRACT History Revised format: November 2020 Available Online: December 2020
Purpose: The study aims to find out the impact of CPEC project on
volatility and growth of Pakistan stock exchange PSX-100. The
CPEC is a significant subset and southern corridor of (SREB) which
consists of three economic corridors (Rana, 2015). The investment
in CPEC projects not only accelerates Pakistan and Chinese
economy but also anticipated to have significant effects on Pakistan
stock exchange PSX. Design/Methodology/Approach: The
methodology of event study proposed by Bremer and Sweeney
(1991). The methodology of Cox and Peterson (1994) used to
identify the effects of events related to CPEC projects and stock
market returns. Findings: The results indicated that the volatility of
PSX-100 has low in post CPEC as compared to pre CPEC era
showing a positive effect of CPEC on PSX in the form of stable
PSX 100 returns in post CPEC announcement era.
Implications/Originality/Value: The results of this empirical study
provide important implications to overseas investors, corporations
and regulators.
© 2020 Center for Sustainability Research and Consultancy Pakistan under
a Creative Commons Attribution-NonCommercial-ShareAlike 4.0
Keywords CPEC, Pakistan Stock
Exchange, Stock volatility
and One Belt One Road
JEL Classification
M0, M1
Corresponding author’s email address: [email protected]
Recommended citation: Ghafoor, M. M., Hussain, Z., & Saeed, M. Y. (2020). The Impact of China-
Pak Economic Corridor (CPEC) on Pakistan Stock Exchange (PSX). Journal of Business and Social
Review in Emerging Economies, 6(4), 1323-1333
1. Introduction
In 2013, Chinese president Xi Jinping has announced a bigger regional vision of connecting Asia with
Europe, Middle East and Africa known as “One Belt One Road” (OBOR) and Pakistan signed an MOU
with china for the developmental project of CPEC (Ranjan, 2015; Benthany, 2015). China-Pakistan
Economic Corridor (CPEC) holds a significant portion of this initiative and the step towards
actualization of this project was officially implemented in 2015 when Chinese president visit Pakistan
and announce a $46 billion investment commitment for CPEC and signed. 51 agreements (Khan, 2015).
CPEC consists of mega projects related to energy, road infrastructure, improvements in existing railroads
along with development of new ones and optical fiber (OHK, 2015). CPEC is expected to strengthen
Journal of Business and Social Review in Emerging Economies Vol. 6, No 4, December 2020
1324
Pakistan and Chinese economy by speeding up both economies’ growth.
CPEC which is the southern corridor of second developmental proposal of China (SREB) will be
consisting of road and rail infrastructure. It will start from Guangzhou, that is the third largest city of
China and passes from the western area of china and finally after passing from xinjiang unite the
Kashgar city of China with Pakistan’s Khunjarab Pass. From this place the china will connect its
southern corridor with the Gawadar port which provides china a way forward to the Indian’s ocean,
Arabian and Persian gulf (Rana, 2015; Sahgal, 2015).
Its impact on economy can be measured by volatility in stock exchange of Pakistan (Ghani and Sharma,
2018). According to (Economy Watch, 2019), stock market returns are the earnings that business person
earns by investing into the stock market. Stock market returns can be in the form of direct profits or in
the form of dividends and bonuses that are awarded by the company to its shareholders on the scheduled
time. Further the website expresses that Return through the stock market can be earned through
dividends awarded by companies by the fixed period of time due on announcement. Company offers
dividend from the amount of profit they earn to their shareholders. Dividend is treated as the primary
source of earning profit from Stock Markets. Another source, in the secondary market, shareholder can
generate profit by purchasing shares a lower price and selling them at higher in the stock market. The
returns in the stock market are not fixed. The returns vary according to the market conditions and its risk
in the trading. It can be positive or negative which depends on various internal as well as external factors
of locally or globally or both. The Stock market volatility represents the amount of vagueness or
insecurity with respect to changes in stock value. In case of lower volatility, stock’s value does not swing
intensely.
Very few academic studies have examined the effects of CPEC on stock market performance. (Bahoo,
Saeed, Iqbal & Nawaz, 2018) has studied the impact of CPEC on stock market by taking four economic
factors including trade, investment, energy and infrastructure and found that CPEC has positive impact
on stock market. Sharma & Ghani, 2018 has studied the effects of CPEC on shareholders wealth by
using standard event methodology and taking three key events of CPEC. On the basis of average and
cumulative stock’s returns, they found a significant positive impact of CPEC agreement on KSE 100
index. Yeung, Pang and Aman, 2019 has examined the impact of CPEC on Pakistan and Shanghai stock
exchange by using the methodology of event studies and found that the initial announcement has
stronger and positive effects on the PSX than the subsequent announcements. Moreover, they found that
the announcement short term effects are more significant in the PSX than the Shanghai stock exchange.
The reason for the difference occurs due to the size of the economies of Pakistan and China. As per our
best knowledge, very few studies have been conducted to examine the effects of CPEC announcements
on stock exchange and market returns. So, this study is proposed to find the pre and post CPEC
announcements effects on PSX 100 index volatility by using the methodology of event study proposed
by Bremer and Sweeney (1991). The methodology of Cox and Peterson (1994) used to identify the
effects of events related to CPEC projects and stock market returns.
The rest of the paper consists of four sections. Section 1 explains, Literature Review which includes
GARCJ and stock market volatility, OBOR, CPEC impact on other sectors. Further three sections
comprised of research methodology, research analysis, results and finally conclusion and future
recommendations.
2. Literature Review
2.1 GARCJ and Stock volatility
Engle (1982) has proposed GARCH patterns which have been used by various researchers to examine
conditional variances and volatility in earlier research. (Attari & Safdar, 2013) used this pattern to
examine the volatility of stock market and macroeconomic variables. It has also been used by Ahmed &
Suliman, (2011) to study market volatility. GARCH patterns can also be used to study market volatility

Journal of Business and Social Review in Emerging Economies Vol. 6, No 4, December 2020
1325
based on impact of an event or an announcement.
Beta parameter ought to be invariant for that time period when constantly aggravated returns are figured.
Progressively, be that as it may, the experimental confirmation demonstrating the change in each stock
with the change in beta with the shift in the differencing interim (Hawawini, Cohen, Maier, Schwartz, &
Whitcomb, 1993). (McCord & Tole, 1977) found that a high volatility fund, as measured by the slope of
the relapse line (beta), is relied upon to accomplish higher rates of return when the market is up and
greater negative rates of return when the market is down than would a fund with a lower beta. (Ali,
Rafiq, & Gul, 2015) T-Bills are treated as the economic kit to sustain and retain liquidity in country.
Liquidity has its own effect on business system and which makes it an important factor in the
macroeconomic landscape. Treasury bills from SBP or Government performs dual function of
maintaining the liquidity as well as it helps to control and make inflation low. Authors have considered
macroeconomic variables to be more important in influencing offer rates and bid rates of treasury bills.
The paper applied Risk Averse Preferred Habitat model (Heuson, 1998) by using term premiums as
explained variables. The macroeconomic variable authors have chosen are price stocks, money supply,
CPI and Prime rate. Authors have used theoretical framework and designed hypothesis. Data collected
from secondary sources like, State Bank of Pakistan, IMF, World Bank, and PSX. Prime rate KIBOR is
found to be the most major determinant of Treasury bills and rest of other variables found insignificant.
(Nyawata, 2012) Study is about the role of Central Banks whether they should use T-Bills or Central
Banks for irksome liquidity in the banking system. As being recognized the reason for using treasury
bills by Central Banks, the research concludes T-bills are the best option to be utilized because of the
macroeconomic favors for the economy as a whole. Author concluded that while making decision to
choose T-bills, following suggestions should be keep in mind: a) Operational Independence of the
Central Banks; b) Market Development; c) Strengthening the implementation of the monetary policy.
(Hussain, Zaman, & Ahmad, 2015) investigated the association between stock market returns and
macroeconomic variables with reference to Pakistan. Authors have used the monthly observations from
January 2001 to June 2011. To check the instability of stock returns, authors have applied
heteroscedasticity. New impact cure graph describes that with negative shocks leads to high risks as
comparison of positive shocks on the same degree. Researchers have concluded though ARDL model
that stocks market instability rely on macroeconomic variables as are inflation. REER and oil prices.
Whereas, supply of money and industrial output negatively impact the stock market.
2.2 China Pakistan Economic Corridor (CPEC)
OBOR (One Belt One Road) as it consists of transport and related infrastructure. CPEC’s is part of
overall OBOR initiative. Total projects are of 54 billion USD, but overall worth is about $900 bn and
more than 20 countries are contributors in China Pakistan Economic Corridor. OBOR consist of multiple
corridors including following
● China and Pakistan (China Pakistan Economic Corridor (CPEC)
● China Myanmar Thailand Corridor
CPEC is treated as the game changes for Pakistan as well as for the region as well. Overall CPEC
comprises of following main projects:
● Gwadar Port (Estimated Cost US $800 Million)
● Energy Projects (24) (Estimated Cost US $ 34.4 billion) Thermal and Renewable
● Infrastructure (4 projects) (Estimated Cost US $ 9.8 billion)
● 30 Special Economic Zones (SEZ)
The total estimated time for the completion of CPEC is 15 years. Analysis predicted that CPEC will
boost Pakistan’s GDP by 2% or above and GDP growth rate by 5% (IMF). Because of higher exports
Journal of Business and Social Review in Emerging Economies Vol. 6, No 4, December 2020
1326
Balance of Payment will be accretive. FDI will increase due to import of heavy machineries to
approximation of 10% or more (Hashmey, 2016).
2.3 Impact of CPEC on Different Sectors of Stock Exchange
Investment in Pakistan stock exchange and shanghai stock exchange influenced by announcement of 54
billion USD by Chinese president for the implementation of CPEC (Wolf, 2016). Impact of CPEC on
the different sectors of Pakistani economy has discussed below:
2.4 CPEC Impact on Banking Sector
Governor State Bank of Pakistan, Ashraf Mehmood said Chinese and Pakistan banks will work together
to achieve their “financial mix” for the ease of availability of funds for investors under CPEC (SBP
Annual Report, 2016). (Hashmey, 2016) $45 billion USD is usual to be financed through Chinese banks
to Pakistan. Whereas, deposits of local banks are predicted to grow by 90 billion USD and their loans
about 54 billion USD and loans to CPEC by local banks of Pakistan are 9 billion USD. Big banks of
Pakistan especially HBL and UBL are expected to gain from CPEC. Habib bank of Pakistan as its MOU
with industrial and Commercial Bank China and also is going to open its branches in China as well. Also
ICBC has signed MOU with United Bank of Pakistan to use their banking expertise in Pakistan.
(International, CPEC to Attract Banking Sector: SCB Chief, 2016) Bill Winters, SCB CEO announced to
double their business due to the CPEC announcement. He stated that CPEC has huge potential to attract
more investment and can benefit the banking industry as well.
2.5 CPEC impact on Cement Sector
Due to CPEC announcement, lots of construction work has been started which gave a boom to the cement
industry of Pakistan (News, Aug 8, 2016). Experts/Analysts have predicted that China Pakistan
Economic Corridor will boost cement demand by 1.5 to 3.0 million tons per annum. As internationally,
the main ingredient’s cost of Coal in the cement production has been decreased by $50 per ton and
decrease in electricity charges portrays a favorable picture for the boost of cement industry. In the first
half of 2016, cement industry witnessed 15-16% growth of about 2 million tons and for the second half
of 2016, experts have predicted that cement production will grow by 10 to 15% that is 4 million tons.
Domestic market growth is also witnessed for cement, it is due to because of more private housing and
commercial constructions, well maintain security and government spending on infrastructure and
development. (Admin, 2016) According to CEO of Luck Cement Mr. Muhammad Ali Tabba, “CPEC is
not a three but a ten year project and it’s not just road connectivity, there are Special Economic Zones,
new industries, shifting of industries form China to Pakistan. As per capita level rises, people would
demand more housing, more institutions, new schools, colleges, hospitals, because the buying power
will increase which leads to higher demand of cement”. He further added that his company planned to
increase their cement production form 7.5 million tons to 15 million tons by 2020. Lucky cement has
invested $200 million for their new plant to meet their future needs.
2.6 CPEC impact on Automobile Sector
(International Auto Industry Eyes Production of 0.5 Million Units in Five Years, 2016). Now, the
production of auto industry of Pakistan is about to 225,000 units of per year. Thereafter, the CPEC
announcement, it is grown up by 500,000 units to the next five years. PAAPAM chairman gave example
of motorcycle industry which witnessed boom of twenty two times growth from 87,000 units to
21,000,000 units. (Iqbal, 2016) Author concluded that OBOR, once continue its operations, the main
receiver of CPEC should be the automobile industry. The cheap labor and Chinese Automobile
companies can come to start its local production in Pakistan. The Government of Pakistan has worked to
give huge tax concessions to Chinese companies to work in Gwadar, and will received tax exemptions
up to 40 years. Representative from Foton group with Finance Minister and showed their keen interest in
investing Pakistani auto industry. Another Chinese partner to German’s BMW Brilliance China Auto
said that Chinese automobile companies are planning to invest in Pakistan and has designed plan to
install assembly Plants there. It will benefit to explore more as it will provide easier access to local

Journal of Business and Social Review in Emerging Economies Vol. 6, No 4, December 2020
1327
market than operating it from China.
3. Research Methodology
The Bremer and Sweeney (1991) proposed methodology has been adopted to examine the events effects.
The methodology of Cox and Peterson (1994) also used to identify the effects of events related to CPEC
projects and stock market returns. Events with actual dates have been taken as a sample. Long and short
term event windows of 41 days has been used (-20, +20), 21 days (0, +20),11 days (-5, +5), 6 days (0, -5),
5 days (-2, +2), 3 days (0, +2), (-1, +1) and 2 days (0, +1) The event windows are used to assist and
compare before and after situation in the event to draw a conclusion of the particular study.
Pakistan stock returns = LN (CI/PI)
The current adjustment at close of market (PSX) which are divided by previous adjustment at close of
market (PSX). The Standard Deviation takes place and indicates the value of PSX returns from starting
level of LN before the start of event window.
S.D = R1: RI (ϵw)
The S.D meant for Standard Deviation and RI1 is the first value of PSX returns. The RI (ϵw) is the sign
of RI (market return value of PSX before event window). This is the measure of the ratio in between the
values occurring in this rang and Standard Deviation which is deviation the data from its standard. ER is
an estimate of the expected returns of the data.
ER=Average (
The expected return ratio of the PSX between the first value of PSX returns and also the first value in the
event window. The ratio of the PSX between the second value of PSX returns and also the second value
in the event window. Thereafter, the selection of Meta event AR can be calculated.
AR (Abnormal Return) = Actual returns–ER (expected returns) T-Stat =AR of
every day in event window/S.D
AAR = AR/ Number of days in Event Window T-Stat = AAR/ S.D Hydro China Dawood Wind Farm(Gharo, Thatta) Estimated Cost (US $ Million) 112.65 and UEP Wind Farm
(Jhimpir, Thatta), Estimated Cost (US $ Million) 250
Financial Closed (FC) achieved on March 27, 2015
Event Window (-20, +20) (0, +20)
AAR -0.00074 0.004049
Sig -0.0927 0.489582
Event Window (-5, +5) (0 , +5)
AAR -0.00084 0.003482
Sig -0.1028 0.421025
Event Window (-2, +2) (0, +2)
AAR -0.00744 -0.00524
Sig -0.90561 -0.56654
Event Window (-1, +1) (0, +1)
AAR -0.02446 -0.02982
Sig -2.97332 -3.22611
Sachal Wind Farm (Jhimpir, Thatta), Estimated Cost (US $ Million) 134
Financial Closed (FC) achieved on December 18, 2015
Event Window (-20, +20) (0, +20)
AAR -0.00221 -0.00303
Sig -0.24055 -0.32291
Event Window (-5, +5) (0 , +5)
AAR -0.00127 -0.00171

Journal of Business and Social Review in Emerging Economies Vol. 6, No 4, December 2020
1328
Sig -0.13565 -0.1818
Event Window (-2, +2) (0, +2)
AAR 0.000892 -0.00497
Sig 0.095291 -0.53764
Event Window (-1, +1) (0, +1)
AAR -0.00075 -0.00706
Sig -0.08011 -0.76333
Suki Kinari Hydropower Station, Naran, Khyber Pukhtunkhwa, Estimated cost (1707 US $Million)
Financial Close achieved on 31st December 2016
Event Window (-20, +20) (0, +20)
AAR 0.001709 -0.00054
Sig 0.223035 -0.07354
Event Window (-5, +5) (0 , +5)
AAR 0.003071 0.002687
Sig 0.414219 0.364937
Event Window (-2, +2) (0, +2)
AAR 0.0038 0.004652
Sig 0.515775 0.503201
Event Window (-1, +1) (0, +1)
AAR 0.006494 0.009023
Sig 0.881073 0.976052
CPHGC 1,320MW Coal-Fired Power Plant, Hub, Balochistan, Estimated Cost (US $ Million) 1912.2
Ground breaking ceremony held on 21 March 2017
Event Window (-20, +20) (0, +20)
AAR -0.00226 -0.00255
Sig -0.32152 -0.36987
Event Window (-5, +5) (0 , +5)
AAR -0.00208 -0.00267
Sig -0.30136 -0.38765
Event Window (-2, +2) (0, +2)
AAR 0.001232 0.000283
Sig 0.178861 0.030657
Event Window (-1, +1) (0, +1)
AAR 0.002582 0.001679
Sig 0.374737 0.181676
300MW Imported Coal Based Power Project At Gwadar, Pakistan
LOI was issued on 26th May 2017
Event Window (-20, +20) (0, +20)
AAR -0.00285 -0.007
Sig -0.38878 -0.91821
Event Window (-5, +5) (0 , +5)
AAR -0.00576 -0.01553
Sig -0.76673 -2.03717
Event Window (-2, +2) (0, +2)
AAR -0.00412 -0.01047

Journal of Business and Social Review in Emerging Economies Vol. 6, No 4, December 2020
1329
Sig -0.54209 -1.13289
Event Window (-1, +1) (0, +1)
AAR -0.00614 -0.00839
Sig -0.80343 -0.90802
Sahiwal 2x660MW Coal-Fired Power Plant, Punjab Estimated Cost (US $ Million) 1912.2
Project Completed in 28th October 2017
Event Window (-20, +20) (0, +20)
AAR -0.00136 -0.00116
Sig -0.12637 -0.1034
Event Window (-5, +5) (0 , +5)
AAR -0.00233 -0.0003
Sig -0.20849 -0.02675
Event Window (-2, +2) (0, +2)
AAR -0.00561 -0.00535
Sig -0.5019 -0.57862
Event Window (-1, +1) (0, +1)
AAR -0.0148 -0.01848
Sig -1.32471 -1.9994
2×660MW Coal-Fired Power Plants At Port Qasim Karachi
Second Unit Commercial Operation Date (COD) 25th April 2018
Event Window (-20, +20) (0, +20)
AAR -0.00101 -0.00306
Sig -0.08547 -0.26148
Event Window (-5, +5) (0 , +5)
AAR -0.00187 -0.00384
Sig -0.15857 -0.32836
Event Window (-2, +2) (0, +2)
AAR 0.001458 -0.00218
Sig 0.124278 -0.23618
Event Window (-1, +1) (0, +1)
AAR 0.000829 -0.00435
Sig 0.070733 -0.47081
Karot Hydropower Station Estimated Cost (US $ Million) 1698.26
Financial Close achieved on 22nd February 2017.
Event Window (-20, +20) (0, +20)
AAR -0.00222 -0.0017
Sig -0.31335 -0.24304
Event Window (-5, +5) (0 , +5)
AAR -0.00321 -0.00189
Sig -0.45299 -0.26954
Event Window (-2, +2) (0, +2)
AAR -0.00326 -0.00183
Sig -0.46438 -0.19842
Event Window (-1, +1) (0, +1)
AAR -0.00085 -0.00129
Sig -0.12087 -0.13932

Journal of Business and Social Review in Emerging Economies Vol. 6, No 4, December 2020
1330
Rahimyar Khan Imported Fuel Power Plant 1320 MW
On April 28, 2017, the Cabinet Committee on Energy headed by Prime Minister Nawaz Sharif directed the
Ministry of Water and Power to immediately initiate a process for inclusion of Rahim Yar Khan
coal plant on the CPEC priority list with imported fuel
Event Window (-20, +20) (0, +20)
AAR 0.000599 0.001048
Sig 0.08651 0.142708
Event Window (-5, +5) (0 , +5)
AAR 0.002509 0.003376
Sig 0.347684 0.459878
Event Window (-2, +2) (0, +2)
AAR -0.00632 -0.00745
Sig -0.86229 -0.80581
Event Window (-1, +1) (0, +1)
AAR -0.00923 -0.00959
Sig -1.26086 -1.03698
Gwadar East-Bay Expressway
Groundbreaking ceremony of Eastbay Expressway was held on 22nd November 2017 by Prime
Minister
Event Window (-20, +20) (0, +20)
AAR -0.00131 -0.00175
Sig -0.11724 -0.15673
Event Window (-5, +5) (0 , +5)
AAR -0.00266 -0.0034
Sig -0.23837 -0.30409
Event Window (-2, +2) (0, +2)
AAR -0.00276 -0.00229
Sig -0.24708 -0.24748
Event Window (-1, +1) (0, +1)
AAR -0.00024 -0.00332
Sig -0.0212 -0.35955
Pilot Project Of Digital Terrestrial Multimedia Broadcast (DTMB)
PC-1 of the Demonstration project approved by CDWP on 2nd May 2018.
Event Window (-20, +20) (0, +20)
AAR -0.00135 -0.00255
Sig -0.11444 -0.22091
Event Window (-5, +5) (0 , +5)
AAR -0.00289 -0.00594
Sig -0.2466 -0.5153
Event Window (-2, +2) (0, +2)
AAR -0.00373 -0.00667
Sig -0.32314 -0.72134
Event Window (-1, +1) (0, +1)
AAR -0.0055 -0.00785
Sig -0.47714 -0.8495
Expansion And Reconstruction Of Existing Line ML-1

Journal of Business and Social Review in Emerging Economies Vol. 6, No 4, December 2020
1331
Commercial Contract for Preliminary Design signed on 15th May, 2017
Event Window (-20, +20) (0, +20)
AAR 0.00193 0.000721
Sig 0.227462 0.088489
Event Window (-5, +5) (0 , +5)
AAR 0.001521 0.00236
Sig 0.180078 0.289815
Event Window (-2, +2) (0, +2)
AAR -7.3E-05 0.001444
Sig -0.0086 0.156152
Event Window (-1, +1) (0, +1)
AAR 0.000438 -0.00016
Sig 0.053347 -0.01732
Table 1 indicates the test results of Event Financial Closed (FC) occurred on March 27, 2015 - Hydro
China Dawood Wind Farm (Gharo, Thatta), Sachal Wind Farm (Jhimpir, Thatta), Suki Kinari
Hydropower Station , Naran, Khyber Pukhtunkhwa, Karot Hydropower Station Estimated and Rahimyar
Khan Imported Fuel Power Plant 1320 MW. The average daily abnormal returns (AR) around the -20 to
+20, -5 to +5 , -2 to + 2 and -1 to +1 trading intervals at 1st event. The event was indicated at multiple
days are highly significant at the significance level .05. The AAR abnormal average returns due to
announcement of various events i.e CPHGC 1,320mw coal-fired power plant, HUB, Balochistan,
300mw imported coal based power project at Gwadar, Pakistan, Sahiwal 2x660mw coal-fired power
plant, Punjab, 2×660mw coal-fired power plants at port Qasim Karachi to around various trading
intervals are highly significant at .05 level of significance. The PSX-100 returns are highly significant
and positive in reflection of abnormal returns over selective (-20, +20), (-5, +5), (-2, +2), (-1, +1) at
level of trading intervals of the events. The Gwadar east-bay expressway, pilot project of digital
terrestrial multimedia broadcast (dtmb) and expansion and reconstruction of existing line ml-1 have
positive effects on expected cash flows of the PSX-100 returns.
4. Conclusion
This study focus to find that the growth rate of Pakistan stock exchange (PSX) stock market returns has
been driven by CPEC factor. Study found that the stock market volatility has been reduced at time when
Chinese president announced 54 billion USD investments for the implementation of CPEC project in
Pakistan. We found that volatility has decreased in post CPEC compared to pre CPEC. In post CPEC era
the volatility of Pakistan stock exchange (PSX) has been reduced and PSX market anticipated to become
more stable in the long run. Pakistan stock exchange become more favorable and stable stock market to
invest in for resident investors, overseas Pakistani, multinationals and corporations in post CPEC
scenario. The result of CPEC announcement and other related events indicates the significance of trade
agreements in OBOR developmental proposals. Furthermore, these agreements will provide landmark to
invite other countries in the region i.e. India, Iran and other Central Asian states. The CPEC is actually
the road map towards global perspectives. The South and central Asian region are less connected of the
globe. The CPEC will open up the new avenues in between the South and central Asian region.
5. Limitations and Future Directions
This study has been conducted by taking data of only two years earlier than CPEC official
announcement and two years after CPEC announcement. However most early harvest projects are
expected to be completed by 2018. Future research needs to be carried out after early projects
completion and study its relation with the stock exchange volatility. A comparative stock market
analysis could be carried out in future to study the impact on regional stock markets and their volatility.
References

Journal of Business and Social Review in Emerging Economies Vol. 6, No 4, December 2020
1332
Ahmed, A. E. M., & Suliman, S. Z. (2011). Modeling stock market volatility using GARCH models
evidence from Sudan. International Journal of Business and Social Science, 2(23), 114–128.
Ali, S., Rafiq, M., & Gul, S. (2015). What Determines the Yields for Treasury Bills in Pakistan?
FWU Journal of Social Sciences., 9(1), 6.
Allen-Ebrahhimian, Bethany (22.4.2015), China Loves Pakistan … but Most Chinese Don’t, Foreign
Policy (FP
Attari, M. I. J., Safdar, L. (2013). The relationship between macroeconomic volatility and the stock
market volatility: Empirical evidence from Pakistan. Pakistan Journal of Commerce and Social
Sciences, 7(2), 309-320.
Bahoo, S., Saeed, S., Iqbal, J., Nawaz, S. (2018). Role of China-Pakistan economic corridor in
Pakistan’s trade, investment, energy, infrastructure, and stock market. JISR-MSSE, 16(1), 63–83.
Bremer, M., & Sweeney, R. J. (1991). The reversal of large stock price decreases. The Journal of
Finance, 46(2), 747–754.
Cox, D. R., & Peterson, D. R. (1994). Stock returns following large one‐day declines: Evidence on
short‐term reversals and longer‐term performance. The Journal of Finance, 49(1), 255–267.
Economy Watch. (2010, November 23). Retrieved from Economy:
http://www.economywatch.com/stock-markets-in-world/retums.html Last Accessed on : 15th Jan
2017.
Engle, R. F. (1982). Autoregressive conditional heteroskedasticity with estimates of the variance of
United Kingdom inflation. Econometrica, 50(4), 987–1007.
Ghani, I. W., Sharma, R. (2018). China-Pakistan economic corridor agreement: Impact on shareholders
of Pakistani firms. International Journal of Economics and Finance, 10(1), 148–158.
Grauer, R. R. (1981). Investment Policy Implications of the Capital Asset Pricing Model. The Journal of
Finance, 36(1), 127-141.
Hashmey, S.(2016). China Pakistan Economic Corridor: Implications for Pakistan's Economy and
Sectors. Asia Money (p. 63). Top Securities Pakistan.
Hawawini, G. A., Cohen, K. J., Maier, S. F., Schwartz, R. A., & Whitcomb, D. K. (1983).
Estimating and Adjusting for the Intervalling-Effect Bias in Beta. Management Science, 29(1), 135-148.
Hrvorova, B. (2002, 5). Treasury Bills and their Valuation. Biatec, 10, 3. Retrieved from
http://www.nbs.sk/img/Documents/BIATEC/BIA05_02/28_30.pdf Last Accessed on : 15th Jan
2017
Hussain, M., Zaman, B. U., & Ahmad, N. (2015, January). Relationship Between Stock Market
Volatality And Macro Economic Variables: Pakistan Evidence. Pakistan Business Review, 21.
Retrieved from http://www.pbriobm.edu.pk/wp-content/uploads/2016/01/1- Nisar-Ahmed.pdf
Last Accessed on : 15th Jan 2017
International, T. N. (2016, February 02). CPEC To Attract Banking Sector: SCB Chief. Karachi, Sindh,
Pakistan: The News International. Retrieved from https://www.thenews.com.pk/print/96880-
CPEC-to-attract-banking-sector-SCB -chief Last Accessed on: 15th Jan 2017.
International, T. N. (2016, March 29). Auto Industry Eyes Production of 0.5 Million Units in Five Years.
(T. N. International-Business, Ed.) Karachi, Sindh, Pakistan: The News International. Retrieved
from https://www.thenews.com.pk/print/108631-Auto-industry- eyes-production-of-05- million-
units-in-five-years Last Accessed on: 15th Jan 2017
Iqbal, A. (2016, October 01). CPEC and Automotive Sector in Pakistan. The Business Recorder.
Retrieved from http://www.brecorder.com/supplements/88/89627/ Last Accessed on : 15th Jan 2017
Jostova, G., & Philipov, A. (2005). Bayesian Analysis of Stochastic Betas. The Journal of Financial and
Quantitative Analysis, 40(4), 747-778.
Khan, Aarish U. (January 2015), Pak-China Economic corridor: The hopes and reality, Spotlight,
Institute of Regional Studies: Islamabad, Pakistan. http://irs.org.pk/spotlight/spjan15.pdf
Laughhunn, D. J., & Sprecher, C. R. (1977). Probability of Loss and the Capital Asset Pricing Model.
Financial Management, 6(1), 18-25.
Journal of Business and Social Review in Emerging Economies Vol. 6, No 4, December 2020
1333
Levhari, D., & Levy, H. (1981). Capital asset pricing model & the horizon: reply. The Review of
Economics and Statistics, 63(4), 637-638.
Liquidity: The Main Considerations. International Monetary Fund, 12(40), 39. Retrieved from
https://www.imf. org/external/pubs/ft/wp/2012/wp1240.pdf Last Accessed on : 15th Jan 2017
McCord, S. 0., & Tole, T. M. (1977). Portfolio Risk: A Review of Theory and Empirical
Evidence. Nebraska Journal of Economics and Business, 16(4), 75-89.
Merton, R. C. (1973). An Intertemporal Capital Asset Pricing Model. Journal of econometric society,
41(5), 867-887.
Mukherjee, D., & Metia, S. (2001). Capital Asset Pricing Model When Data Is Skewed. The Indian
Journal of Statistics Series B (1960-2002), 63(1), 108-121.
Naylor, T. H., & Tapon, F. (1982). The Capital Asset Pricing Model: An Evaluation of Its Potential As a
Strategic Planning. Management Science, 28(10), 1166-1173.
News, P. C. (2016, August 8th). 3M Tons Of Cement Demand Created Through CPEC. Lahore, Punjab,
Pakistan. Retrieved from http://pakchinanews.pk/3m-tons-of-cement-demand- created-through-
cpec/ Last Accessed on : 15th Jan 2017
Nyawata, 0. (2012, January). Treasury Bills and/or Central Bank Bills for Absorbing Surplus OHK
(15.6.2015), “A Silk Road for the 21st century: About the impact of China’s One Belt,
One Road project”, Orangefield Hong Kong (OHK). http://www.orangefield.com/blog/a- silk-road-for-
the-21st-century-about-the-impact-ofchina-s-one-belt-one-road-project
Rana, Shahbaz (17.5.2015), China-Pakistan Economic Corridor: Lines of development – not lines of
divide, The Express Tribune.
Rana, Shahbaz (26.7.2015), Eastern CPEC route unfeasible: report, The Express Tribune.
http://tribune.com.pk/story/926582/economic-corridor-eastern-cpec-route-unfeasible/
Ranjan, Alok (May 2015), The China-Pakistan economic corridor: India’s options. ICS Occasional
Paper #10, Institute of Chinese Studies & Research Scholar, South Asian Studies, School of
International Studies, Jawaharlal Nehru University, Delhi.
http://www.icsin.org/uploads/2015/06/05/31e217cf46cab5bd9f15930569843895.pdf
Sahgal, Arun (24.4.2015), China – Pakistan economic corridor: Changing dynamics of Southern Asia
– Analysis, Eurasia review. http://www.eurasiareview.com/24042015- china-pakistan-economic-
corridor changingdynamics-of-southern-asia-analysis/
Saleem, K. (2007). Modeling time varying volatility and asymmetry of Karachi stock exchange (KSE).
Available at SSRN 964898 https://papers.ssrn.com/sol3/papers.cfm?abstract_id=964898
State Bank of Pakistan annual report, (2016). Retrieved from
http://www.sbp.org.pk/reports/annual/arFY16/Anul-index-eng-16.htm
Tiezzi, Shannon (20.2.2014), China, Pakistan flesh out new ‘economic corridor. The
Diplomat.http://thediplomat.com/2014/02/china-pakistan-flesh-out-new-economic- corridor/
Ze, Shi (18.10.2014), “One Road & One Belt & new thinking with regard to concepts and practice”,
Presentation at the 30th Anniversary Conference of the Schiller Institute, Frankfurt, Germany.
http://newparadigm.schillerinstitute.com/media/one-road-and-one- belt-and-new-thinkingwith-
regard-to-concepts-and-practice/

Journal of Business and Social Review in Emerging Economies Vol. 6, No 4, December 2020
1334
Journal of Business and Social Review in Emerging Economies Vol. 6, No 4, December 2020
1335
Volume and Issues Obtainable at Center for Sustainability Research and Consultancy
Journal of Business and Social Review in Emerging Economies ISSN: 2519-089X (E): 2519-0326
Volume 6: No. 4, December 2020
Journal homepage: www.publishing.globalcsrc.org/jbsee
Extent of Integration in Agriculture Supply Chain: The Public Sector Stakeholders
Perspective
1Nadir Munir Hassan, 2Muhammad Nauman Abbasi 1Department of Business Administration, Air University, Multan, Pakistan, [email protected]
2Institute of Management Sciences, Bahauddin Zakariya University, Multan, Pakistan,
ARTICLE DETAILS ABSTRACT History Revised format: November 2020 Available Online: December 2020
Purpose: Integrating network factors (i.e. Actors, Activities, and
Resources), help organizations in achieving superior supply
chain performance. Despite reasonable evidence on positive
relationship between SCI and SCP, there exists sufficient
contradiction on universal integration of chains. This paper is a
qualitative exploratory study, which based on the network
perspective intends to explore the current and required levels of
supply chain integration among actors, activities, and resources
in the agriculture supply chain of Pakistan.
Design/Methodology/Approach: The data was collected
through in depth semi-structured interviews from public sector
stake holders of agriculture sector (i.e. From Thirteen wings of
Ministry of Agriculture) across Pakistan. The current and
required extent of supply chain integration was measured at three
levels, i.e. strategic (long-term), tactical (medium-term) and
operational (short-term) as suggested by (Childerhouse & Towill,
2011). Findings: The research results indicate that the
relationship between supply chain integration and supply chain
performance is a contextual phenomenon and significantly varies
among Network factors. This study and its findings are expected
to add into the literature of supply chain integration and its
impact on supply chain performance.
© 2020 Center for Sustainability Research and Consultancy Pakistan
under a Creative Commons Attribution-NonCommercial-ShareAlike
4.0
Keywords Supply Chain Integration,
Extent of Supply Chain
Integration, Agri Food Value
Chain, Network Perspective,
Supply Chain Performance.
JEL Classification
M0, M14
Corresponding author’s email address: [email protected]
Recommended citation: Hassan, N. M. & Abbasi M. N. (2020). Extent of Integration in Agriculture
Supply Chain: The Public Sector Stakeholders perspective. Journal of Business and Social Review in
Emerging Economies, 6(4), 1335-1351
1. Introduction
The term ‘supply chain management’ reflects the flow of information, materials, money and products
from both within and across the supply chains, starting from public sector stakeholders to final
customers, in pursuit of achieving lasting performance (Mentzer, Flint, & Hult, 2001). Over the years,

Journal of Business and Social Review in Emerging Economies Vol. 6, No 4, December 2020
1336
managing supply chains have attained fabulous attention by both academicians and practitioners. Most
recently, it has been defined as the set of tools and techniques used for managing supply chain activities
for effective coordination to improve overall supply chain performances (Kusi-Sarpong, Sarkis, &
Wang, 2016; Liu, Bai, Liu, & Wei, 2017). The significance of integration between actors, activities and
resources of a supply chain has become indispensable for the survival of the firms. In today’s highly
competitive world, it is evident that businesses compete as supply chains rather than as stand-alone
companies (Christopher, 2016).
The concept of ‘integration’ is a vital facet of supply chain management. Surprisingly, the outcomes of
previous studies does not authenticate the universal (only positive) relationship between SCI and SC
performance. For example, (Flynn, Huo, & Zhao, 2010) and (Germain & Iyer, 2006) explained that there
exists sufficient clarity on potential positives of SCI yet a number of researchers are of the view that
there exists reasonable inconsistency in findings related to its impact on supply chain performance.
Likewise, many researchers are of the view that the benefits generated from integration might not be
generalized rather remained contextual in nature (Turkulainen, 2008; Wong, Boon-Itt, & Wong, 2011).
Interestingly, scholars have conceptualized and measured SCI differently, including strength, scope
(Fawcett & Magnan, 2002; Flynn et al., 2010; Frohlich & Westbrook, 2001), duration and/or depth
across the chains. Researchers have also identified that integration among the number of individuals on
multiple hierarchical stages and from different corporate standings makes the integration work better
(Barnes, Naudé, & Michell, 2007; Mackelprang, Robinson, Bernardes, & Webb, 2014). Furthermore, it
also evident from the literature that for the exceptional gains, supply chains must be managed as
networks. The network is a flat organization form, involving interaction among network partners rather
than multi-layered functions (Cravens & Piercy, 1994). Networks as cited by (Harland, 1996), consist of
factors like, actors, resources and activities, which if integrated properly can cause sufficient supply
chain performance.
Most recently, Wong et al. (2011) recommended, the need for additional research on the interaction
between supply chain performance and dimensions of SCI, and also the effect of additional
contingencies on SCI. Similarly, Tarifa-Fernandez and De Burgos-Jiménez (2017) expressed that it’s
time to understand and conduct research on SCI and its relation with performance concerning contextual
factors, under which it will work more effectively. Accordingly, this study aimed to explore the variant
levels of supply chain integration among actors, activities, and resources in agriculture supply chains.
Based on the network perspective, this study identifies the role of agri-based public sector stakeholders
in attaining the desired extent of integration with some of their key supply chain members, particularly,
farmers and input suppliers. It is believed that knowing the desired extent (current and required) of
integration will not only help to depute resources accordingly rather it will also help to maximize supply
chain performance. To our utmost knowledge, no such research has been conducted earlier to address
this critical gap especially with reference to Pakistan and hence the outcomes of this study provide
valuable insights to all relevant stakeholders, i.e. academia, practitioners and policymakers.
2. Literature Review
Ever rising operational complexities for firms, shrinking product life cycles, and an increased desire for
improved customer service has brought the attention of scholars and researchers towards understanding
the concept of supply chain management (SCM) (Davis, 1993). Likewise, back in the 1990’s, companies
started to identify their business environment from the supply chain perspective and to build effective
supply chains that operate according to the best SCM practices (e.g. Stevens (1989). Since, the term
SCM coined in the literature (Handfield & Nichols, 2002; Oliver & Webber, 1982; Stevens, 1989),
researchers are consistently investigating its different aspects.
To proceed with, Bechtel and Jayaram (1997) categorized supply chain literature into four school of
thoughts, which includes; The functional chain awareness school, The linkage school, The information
Journal of Business and Social Review in Emerging Economies Vol. 6, No 4, December 2020
1337
school and The integration/process school. Among these four, integration schools gain fabulous
attention by the majority of the researchers. For example, (Mentzer, DeWitt, et al., 2001), while
explaining integration school, have classified supply chains as direct, extended, and ultimate supply
chains. It was anticipated that besides increasing supply chain alliances and integration, coordination
initiatives are expected to move beyond internal linkages, towards the establishment of a connection
between suppliers, customers and then supply networks. This reflects the origination of seeing supply
chains from linear relations to more dynamic and complex relations like networks.
2.1 Network Perspective
A network is a system shaped by core factors (e.g. actors, activities and resources) that join the number
of linked firms (Jraisat, 2016). A network is referred to as a set of links among a group of actors (Jarillo,
1988; Jarosz, 2000; Ritter & Gemünden, 2004), and these links cause connections with other network
factors to provide with a two-way interaction for overall performance. Most of earlier researches, for
example, (Anderson, Håkansson, & Johanson, 1994; Koops, Mollenkopf, & Zwart, 2002; Ritter &
Gemünden, 2004) state the need for effective management of key network factors including actors,
activities, and resources and interaction between these to generate even better positives. This depicts, to
manage the supply chains successfully, one will have to see chains from the prism of network
perspective. Moreover, to make the supply chain networks work proficiently, there is a definite need to
observe the interaction among network components. For example, Wilson (1995), Mikkola (2008) and
Sluyts, Matthyssens, Martens, and Streukens (2011) considered value chains as supply networks and
suggested it as a source of competitive advantage.
However, research has been scarce regarding the appropriate extent of integration within supply chain
networks, and that, networks without being integrated won’t generate the expected outcomes.
2.2 Supply Chain Integration (SCI) and Supply Chain Performance (SCP)
Supply chain integration (SCI) is defined as the extent to which a firm strategically collaborates with its
supply chain members and collaboratively administrates intra- and inter-organizational processes (Flynn
et al., 2010). SCI reflects the multi-organizational networks in sync with governing the flow of products,
services, information and finances from top to bottom (Ellram & Cooper, 2014). Likewise, from the lens
of information processing theory, SCI becomes the source of better quality, and well versed decision
making, by making stakeholders within firms and across chains to communicate effectively (Hendijani
& Saei, 2020). Without any doubt SCI has appeared to be the key theme (Lee and Billington (1992) and
making the researchers to dig deep into the concept and to better understand its connection with SCP.
Interestingly, speculating what must be integrated, and how it must be integrated directs one to reason
the difficulty associated with defining the given concept of SCI (Mohamed & Hassan, 2019). In
literature, it is observed as a unidimensional (Cousins & Menguc, 2006) as well as a multidimensional
construct (Morash & Clinton, 1998; Stank, Keller, & Daugherty, 2001). Furthermore, researchers have
realized the strategic importance of SCI and have empirically observed the interaction between multiple
aspects of SCI and several performance streams (Devaraj, Krajewski, & Wei, 2007; Frohlich &
Westbrook, 2001; Schoenherr & Swink, 2012). In present-day business settings, integration is regarded
as a viable strategy for individuals, firms and industries looking for sufficient performances (Li & Chen,
2018). While, to better implement, integration must widely be considered as a multidimensional variable
(Flynn et al., 2010), because it incorporates cooperation, collaboration, information sharing and
partnership, through functions, customers and suppliers.
Similarly, SCI is explained in terms of its scope, starting from the focal firm, internal processes, till
external integration (Doering, De Jong, & Suresh, 2019). To develop a better understanding and
theoretical realities related to the concept of integration, (Autry, Rose, & Bell, 2014) elaborates
integration from operational coordination (i.e. activities in support of planning, information exchanges,
Journal of Business and Social Review in Emerging Economies Vol. 6, No 4, December 2020
1338
and system integration) to tactical cooperation (i.e. recognition and achievement of mutually beneficial
activities) and finally a strategic collaboration and integration (i.e. establishment and maintaining of
collaborative relationships)..
Keeping in mind the changing scope and intensity of integration within and across supply chain
networks, it has become equally important to observe the connection between different extents of
integration and its impact on supply chain performance. For example, its believed, that an integrated
supply chain not only helps in reducing the cost for a focal firm, rather it causes notable benefits for its
channel members as well. Considering the importance of SCI and its domains, in making supply chain
networks perform better, it is observed that usually successful firms are those that align their internal
processes with external channel members and customers within their supply chains (Frohlich &
Westbrook, 2001; Graham, Zailani, & Rajagopal, 2005). Similarly, aligning processes, also means, that,
firms, that can assemble resources in a comparatively, different manner, may reap an advantage over
firms, which aren’t willing to do the same (Ganbold, Matsui, & Rotaru, 2020).
Moreover, (Leuschner, Rogers, & Charvet, 2013), based on a meta-analysis, observed a positive
relationship between SCI and SCP whilst, other studies, witnessed inverse relationship. Similarly, to
better understand supply chain performance, it is described as the strength of a supply chain to
economically perform its activities, while reducing the cost of operations, with the ultimate goal of
meeting customers and channel members desires (Green & Inman*, 2005).
From literature, it is evident that one cannot measure supply chain performance from any single
perspective or context, rather supply chains need to be considered, as a system and networks.
Considering, the performance of all these activities and elements, across supply chain network, will help
in reaching out to the full potential of overall supply chain performance (Rehman, Khan, Kusi-Sarpong,
& Hassan, 2018). In sync with these studies, (Zhao, Huo, Selen, & Yeung, 2011) suggested that
intensity/span of SCI between multiple dimensions of SCP can differ, because, it is a contextual
phenomenon, and need to be reevaluated across value chains. Even though, a handful of researches have
propagated a positive relationship between SCI and SCP, still there exists a gap in the given stream
(Song, Song, & Sun, 2019). Additionally, this study propagates that not all levels, extents and types of
SCI are required to be made use of on all occasions. This understanding is in line with the research work
of (Flynn et al., 2010), wherein, they suggested different configurations and arcs of SCI based on three
broader dimensions, i.e. internal, supplier and customer integration.
According to a contingency perspective, manufacturers need to adopt a specific extent or arc of
integration to synchronize specific dimensions of SCI with its environment (Visnjic, Wiengarten, &
Neely, 2016). Consequently, the configuration perspective states that performance is a product of
consistency between different configurations of SCI, and its environment to reach required performance
outcomes (Flynn et al., 2010). There are industries and sectors, like agricultural, automotive, chemical,
textile, pharmaceutical, etc. which have different down and upstream dynamics, so players in such
sectors might use different (Frohlich & Westbrook, 2001) and unbalanced configurations of supply
chain integrations (Flynn et al., 2010). Despite of considering the extensively worked, viewpoints on
SCI and its impact on SCP, it is important to realize that results on the above given relationship are still
relatively inconclusive. This lack of clarity is because of the different outcomes generated by selecting
multiple dimensions of integration and performance (Wiengarten, Li, Singh, & Fynes, 2019). This is
why the given study explores the appropriate extent of SCI among AVC’s channels members.
For the given purpose, this study incorporates, four primary elements & multiple extent of integration to
measure the current & required level of integration among network components, i.e. actors, activities,
and resources. The aim is to provide a theoretical foundation for measuring the benefits bestowed by
optimal level of SCI on the overall performance of AFVC in Pakistan. Unfortunately, identifying an
optimal level of integration remained a neglected area especially regarding network perspective, which

Journal of Business and Social Review in Emerging Economies Vol. 6, No 4, December 2020
1339
is assumed to be one of the identifiable reasons behind overall agricultural performance across the
country.
2.3 SCI and Agri-Food Value Chain
Pakistan is an agriculture based country with 23.4 million hectares cultivable land and is among the
largest producer and supplier of many agri-products, like, cotton, wheat, sugarcane, mango, citrus,
oranges, oilseeds, rice, etc. During 2017-18, agriculture sector observed a remarkable growth of 3.81%
as compared to previous years (2016-17; 2.07%) and (2015-16; 0.15%) (Economic Survey of Pakistan,
2017-18). This stemmed from higher yields, fertilizer take off, pest control, etc. however, the real credit
goes to the government policies and initiatives, like, availability of quality seed, attractive prices, credit
facilities, trainings and guidance, etc. Unfortunately, Pakistani agriculture/food supply chain is quite
vulnerable and it lack innovation, value addition, new product development, packaging and marketing.
Such, a fragmented structure sheds light on the need for the appropriate implementation of integration
among agri-food value chain. Nonetheless, the presence of private sector is somewhat encouraging as
they are striving hard to integrate activities related to collection, transportation, storage, assembling
within and outside the country.
A number of scientific studies have favored the need for vertical integration of agribusiness activities,
and its role in decreased production cost, among channel members of the agricultural supply chain
(Birthal, Joshi, & Gulati, 2005). On the other hand, Porter (1985) states that competitive advantage
within the agricultural supply chain is vested in networking by chain actors. The multi-dimensional
performance of agri-food chains is purely a product of contextual supply chain configuration i.e. the
insight into the type and where about of network factors and their integrated flow (de Keizer et al.,
2017).
However, realizing the sufficient level of SC-SCI configuration for agri-food chains is a complicated
issue, due to certain ingrained complexities associated with food products and processes (Soto-Silva,
Nadal-Roig, González-Araya, and Pla-Aragones (2016). The availability of a number of agri-oriented
resources including, fertile land, well-irrigated plains and a variety of seasons makes Pakistan favorable
for the agriculture industry. Yet, Kahn and Mentzer (1998), arguments regarding, scarcity of integration
among various stakeholders in agri-chains, results in overall inefficiency of agricultural system,
resulting in high post-harvest losses, quality deterioration, and high cost of commodity transfer,
information symmetry and lack of transparency cannot be unnoticed.
The pace of adoption of SCI and responsiveness towards the needs of respective channel members of the
agriculture chain in Pakistan, is passive in nature in comparison to prevailing trends elsewhere. That’s
why the given study, propagates the idea of understanding the importance of integration among network
actors of AFVC in Pakistan, and that blind and mindless implementation of SCI can also result in
unidentified cost of stakeholders. It means that it is unavoidable to develop a consensus on the required
level of integration across the agricultural supply chain in Pakistan. Because it has widely been
acknowledged, that the proactive approach towards integrative relationships can act as a vital source of
competitive advantage for overall supply chains across the globe (Power, 2005) and agricultural value
chains are no different.
3. Research Methodology
The given study aimed to get insight into the current and required level of SCI between public sector
stakeholders and some of their key supply chain partners, i.e. input suppliers and growers, etc.
Considering the contextual nature of supply chain integration, and differences in industrial norms
(Kostova & Roth, 2002), this study intends to conduct case study of agriculture public offices of
Pakistan. Based on the network perspective, an attempt has been made to identify the role of agri-based
public sector stakeholders in attaining desirous level of integration with their supply chain partners. The
public sector stakeholders’ perspective was recorded and analyzed to build an understanding of the
impact of varying extent of SCI on the overall performance of the agriculture supply chains.

Journal of Business and Social Review in Emerging Economies Vol. 6, No 4, December 2020
1340
As propagated by (R. Yin, 2003), case study method is frequently used as a data collection tool in
practical fields like management. So, using the case study method, multiple participants of AFVC in
Pakistan, were interviewed. The detail regarding participants is given in Table No. 1. Later on, interview
data from one interviewee was triangulated with those from other interviews.
In the given study, SCI is operationalized and measured through information sharing, collaborative
approaches, joint decision making and system coupling, as prescribed by (Ellinger, Keller, & Hansen,
2006; Flynn et al., 2010; Narasimhan & Das, 2001). Existing literature suggests, SCI as a multi-level
longitudinal phenomenon and it evolves over an extended period. In this evolving process, supply chain
partners interact with each other both in the internal and external business environment, which is also
dynamic in nature. Therefore, there was a need to take into consideration the time orientation of the
relationships (integration) which remained under observation. Hence, the case study method has been
opted. It also helped us to present a detailed outlook of the phenomenon under study and also to describe
the context in which it takes place (Halinen & Törnroos, 2005). By opting for the technique of
triangulating the multiple data sources, the data collection and analysis cover up the longitudinal
dynamics of the SCI.
While, the extent of integration is measured through three levels, i.e. strategic, tactical, and operational
across three dimensions of network perspective (Autry et al., 2014), i.e. activities, resources, and actors,
i.e. public sector stakeholders, input suppliers and growers.
4. Data Collection & Analysis
In line with the previous studies, R. K. Yin (2015), the respondents were thoughtfully selected to gain
in-depth and diversified perspectives regarding the extent of integration between supply chain partners.
The respondents were selected, only if he/she is directly involved and/or understand the organizational
strategy regarding execution of integration with their channel members. In simple words, respondents of
the given study can be labeled boundary spanners of the case offices. The normal time for each
interview was around 60-90 minutes. Notes were taken to develop the interview reports. Ambiguous
responses were clarified through a proper follow-up phone calls, and formal emails. Likewise, basic data
was gathered from websites, news coverages and published material. The profiles of the companies, are
as follows:
Table 1. Specifications of Respondents (Public Sector Stakeholders
Public Office Industry Interviewee’s Position
Directorate General Agriculture
(Water Management)
Agriculture
Department of Punjab
Deputy Director
Directorate General Agriculture (Field) AD-GoP Assistant Agricultural Engineer
Directorate General Agriculture
(Research), AARI, Faisalabad.
AD-GoP Assistant Director
Directorate General Agriculture
(Pest Warning & Quality Control of Pesticides)
AD-GoP Assistant Director Agriculture
Directorate General Agriculture (Extension & AR) AD-GoP Deputy Director Agriculture
Directorate General Soil Survey of Punjab AD-GoP Deputy Director General Soil
Survey of Punjab
Directorate of Agriculture (Economics &
Marketing)
AD-GoP EADA (E&M)
Directorate of Agricultural (Information) AD-GoP Assistant Agriculture Info.
Officer
Federal Seed Certification and Registration
Department (FSC&RD)
Ministry of National Food
Security and Research
Regional Director
Agriculture Policy Institute (API) MNFS & R Director General
Pakistan Agricultural Storage & Services
Corporation (PASSCO)
MNFS & R GM Field Wing
Economic Wing MNFS & R Economic Consultant
National Fertilizer Development Centre (NFDC) MNFS & R Research Officer

Journal of Business and Social Review in Emerging Economies Vol. 6, No 4, December 2020
1341
The content analysis was deployed for data analysis. Initially, data coding (an analytical tool, letting data
indexed for analysis purpose, and linking it with the main research idea) was coupled with initial codes
generated through themes extracted from literature review, observation, and by making use of interview
manuscript. Likewise, the given process is followed by refinement of shortlisted themes, to avoid
repetition.
Moreover, the process of coding and analysis resulted into 20 first order themes in order to measure the
extent of SCI, which then resulted into even brief 15 second order themes, ending up into four aggregate
dimensions. The comprehensive, dimensions extracted are the mechanisms/activities associated with
SCI, helpful in forming theoretical relation with the given study. Table 2, presents snapshot of 1st
order/sub-categories, 2nd order/generic-categories and aggregated/main categories of SCI.

Journal of Business and Social Review in Emerging Economies Vol. 6, No 4, December 2020
1342
Table 2. Data Coding: 1st, 2nd Orders and SCI Themes
First-Order/Sub Categories Second-Order/Generic Themes Aggregate/Main Themes (SCI)
Integrated Information Sharing on new Agricultural Varieties. Creating Varieties & Exportable Surplus Information sharing
Information Exchange regarding Sustainable Generation of
Exportable Surplus.
Educating Stakeholders on Conservation of Natural Resources. Sustainable Value Addition
Shared Technology, for Smooth flow of Information. Shared Communication Technology for
Information Sharing on Researchable Issue To Generate follow up on Researchable Issues/Problems.
Improvement & Transfer of Water Management Technology. Water Management Collaborative Activities
Joint Development of Objectives and Responsibilities. Policy Making for Agricultural Growth
Joint Improvement of Marketing System to Ensure, Agricultural
Growth.
Coming Together with Farmers in Regulatory Aspects.
Collaborative Conduct of Research & Development Research & Development
Mutual Adaption of Modern Agricultural Technology. Technological Adaption
Procurement, Processing, Production, Multiplication, Marketing
and Distribution of Quality Agricultural Inputs.
Provision of Quality Inputs
Joint Development of Logistics processes. Logistics Management Joint Decision Making
Anticipating & Resolving their Operative/Emergent Field
Problems.
Advisory Services
Conservation of Resources through Renewable Tools. On Field Sustainability
To Contribute towards the Cost of any Experiment or Technical
Research related to Agriculture.
Research Financing
Harmonized Data Sharing to Manage Produce. Strategic Reserves Management System Coupling
Collaboration on Price Control of Agricultural Produce. Pricing
Provision of Facilities, & Establishment of New Markets. New markets Development & management
through Market Committee’s Governance Initiatives through on market committee’s.
Journal of Business and Social Review in Emerging Economies Vol. 6, No 4, December 2020
1343
5. Findings and Discussion
This study intends to explore the current and required extent of SCI among actors, activities, and
resources in the agriculture supply chain. Based on the network perspective, the given study explains the
role of agri-based public sector stakeholders in attaining integration with their supply chain partners, i.e.
growers and input suppliers.
5.1 Supply Chain Activities: Extent of Integration with Farmers and Input Suppliers.
As described earlier, the extent of SCI was measured among four supply chain activities, i.e. information
sharing, joint decision making, collaborative activities, and system coupling. Next section, present a
brief overview regarding the extent of integration on each supply chain activity.
5.2 Information Sharing: Current & Required Extent of SCI
The information-sharing has always been at the cornerstone for achieving the required level of
performance. Interviewers were asked to explain the current and required level of integration (in the
context of information sharing) with growers and input suppliers.
It was revealed that different public sector stakeholders use different information sharing tools, however,
commonly used are; regular seminars & workshops, village-level training programs, published material,
dedicated TV and Radio programs (3000 talks, 1500 agricultural messages, & 2000 agricultural news
bulletins/ per annum), documentaries (normally broadcast on a special event, like, agri-festival, Kisan-
Dost Mela, etc.), Agriculture Help Line (0800-15000 and 0800-29000), SMS-Email Alerts,
Websites/Portals, and Social Media (Facebook, WhatsApp, YouTube, Twitter), etc. Furthermore, type of
information sharing include, harvesting and post-harvest issues, pest control, yield output per hectare,
irrigation related issues, agri-loans/agri-financing, marketing, agri-research related issues, and issues
associated to execution of research output, etc. Additionally, it was pointed out that contact through
relevant staff, including, field officers, agricultural engineers and agriculture researchers are maintained
on a regular basis. To ensure smooth flow of information, public sector stakeholders schedule meetings
of the Technical Advisory Board and Agriculture Task Force with farmers and input suppliers, once in
three months and once a month respectively.
During interviews, Director of Agriculture Research, explained that;
“we share information regarding emerging varieties of crops, vegetables and fruits with relevant
stakeholders quite frequently”.
Likewise, Deputy Director at the Department of Agriculture Extension, disclosed that;
“….. our responsibility is to ensure seamless flow of information [on protecting plants from all forms of
impure infringements to increase the yield for local consumption and export]”.
Educating growers and input suppliers regarding adoption of emerging ways of plowing, use of
appropriate inputs, and adoption of new technologies, like, use of plastic bags, cardboard, cushions,
proper hygienic and insect-proof stores, environment-friendly logistics etc. were marked as mandatory
activities for information sharing.
Similarly, Assistant Director, Department of Pest Warning & Quality Control, comment that;
“they guide growers & agri-dealers, on right selection, safe handling and effective use of suitable
agricultural inputs, adoption of proper spraying method and integrated pest management techniques in
collaboration with National Fertilizers Development Center, and Punjab Seed Corporation”.
In a similar tune, while explaining the role of the Department of Agriculture Marketing Information
Service, Marketing Officer told that;
“we have been successful in establishing Agriculture Marketing Information Service (AMIS) to enhance
the efficiency of agriculture marketing system through the provision of timely reliable and useful market
Journal of Business and Social Review in Emerging Economies Vol. 6, No 4, December 2020
1344
information for all stakeholders”.
Based on the above stated information and remarks of the interviewer’s public sector stakeholders are
successful in establishing integration at the Tactical level with growers, however, they feel it should be
extended to the strategic level. Amazingly, integration with input suppliers was marked at a strategic
level and recommended to be maintained.
5.3 Collaborative Activities & Joint Decision Making: Current & Required Extent of SCI According to (Kahn & Mentzer, 1998), collaboration, interaction and joint decision making are a couple
of basic ingredients of integration, wherein, joint decision making is a shared settlement by which
multiple departments and parties within and across the chain reflect their readiness to deal in inter-
organizational collaboration (Shou, Li, Park, & Kang, 2017).
Encouragingly, public sector stakeholders involve growers and input suppliers in collaborative projects.
Moreover, they engage them in decision making in areas like, procurement, processing, production,
multiplication, research output, marketing and distribution of quality seeds. Some of the common
collaborative projects include, National Program for Improvement of Watercourses in Pakistan (Phase-
II), Pilot Testing of Innovative Technologies to improve Water Usage, Virtual Meetings, Crop
Insurance, Establishment of Small Tree System (STS), etc.
In this regard, Regional Director FSC & RD, told that;
“Department of Federal Seed Certification & Registration in collaboration with Department of Punjab
Seed Corporation, has established 27 field offices and laboratories throughout Pakistan ….. we welcome
our partners [farmers and input suppliers] to visit these facilities and maximize their agri-output”.
FSC&RD is a third-party service provider and has the mandate to regulate the quality of seeds of various
crops under the legal provisions. To promote water stewardship, Federal Water Management Cell and
Directorate General of Water Management collaborate in policy formulation regarding
land/infrastructure development.
During the interview, Deputy Director, Department of Agriculture Water Management revealed that;
“….. with various small farmers, we are working together (especially in Punjab province) for the
adoption of modern technology, that include, drip/sprinkler design, lift irrigation system design, LASER
land leveling, tunnel farming, watercourse designing, irrigation scheduling, etc.”.
Adding further, he stressfully claimed that;
“….. togetherness will lead to the accomplishment of our core objective, i.e. more crop per drop ……
however, we [all partners] have to overcome our [financial and operational] constraints”.
It is also worth noting that at the market level, the Department of Agriculture Economics & Marketing
has successfully introduced the digital rate board at 27 different locations in Punjab.
While, illustrating, one of the public officer comment;
“… to help them [farmers] to better manage their operative problems, we [Department of Adaptive
Research] use outcomes of applied research”.
For this purpose, eight Adaptive Research Farms and six adaptive research stations were established. As
cost remained the major concern in applied research, public sector institutions like, Punjab Agriculture
Research Board, Directorate of Agriculture Field and Research collaborate with private sector input
suppliers and they jointly sponsor many research projects.
The above stated examples of joint decision making and co-investments (in some key projects) reflect

Journal of Business and Social Review in Emerging Economies Vol. 6, No 4, December 2020
1345
strategic collaboration between public sector stakeholders and their supply chain partners, including
some growers and input suppliers. Likewise, such success based stories demands a similar level of
integration to be attained in other core areas like, transportation, storage, etc. as the same was
highlighted during interviews.
5.4 System Coupling & Incentive Alignment: Current & Required Extent of SCI
To maximize the gains, coupling of production processes, such as continuous replenishment between
manufacturers, just-in-time (JIT), and Kanban between manufacturers and their external partners have
been frequently suggested. Such relation oriented spending in system coupling doesn’t only enable the
integration of both information and physical flows, rather it helps in increasing the trust and
commitment between channel members, and resultantly intensifies the cooperative behavior (Lui, Wong,
& Liu, 2009).
When asked, about harmonized data sharing, for helping stakeholders in managing their produce,
General Manager Field Wing, responded;
“we at the department of agriculture, storage and service corporation and agriculture economic wing,
deal in the collection, compilation and dissemination of agricultural statistics in its quest to
ensure national food security by maintaining strategic reserves of different food grain commodities
providing the same to deficit provinces”.
Adding further, he pointed out;
“…. it is our prime responsibility to ensure consistent supply [of food] to armed forces and maintain
international food bank on behalf of the federal government”.
In this regard, one of the exemplary initiatives is the establishment of “Agro Food Processing (AFP)
Facility”, wherein, departments help growers in finding markets for their crops/grains. They even
engage the private sector to ensure its plausible distribution and consumption and to take all necessary
measures to minimize agri-food wastage.
Similarly, Deputy Director, Department of Agriculture Economics and Marketing, shared that they have
established market committees with the mandate to regulate the sale and purchase of agricultural
produce, collection and dissemination of market information, provision of facilities to all stakeholders,
enforce price control mechanisms, establish new markets (wherever required), guide and help farmers
and input suppliers in adopting international food standards.
Despite of such efforts, still the current extent of integration stands at the tactical level with growers and
operational with input suppliers. For better supply chain performance, strategic level has been
recommended. Generally, it is believed that a higher level of integration can help to reap the real
benefits. However, it can only be achieved, if all parties will willingly cooperate. Conversely, with input
suppliers, both operational and tactical levels of integration were declared sufficient.
5.5 Resource Sharing: Extent of Integration with Farmers and Input Suppliers
The extent to which resources are joined by the channel members affects the overall performance and its
outcomes across the chains (Christensen & Klyver, 2006). In literature, resources have been classified
into four groups i.e. physical resources (i.e. includes facilities that help the internal and external
exchanges), financial resources (e.g. monetary support and new resources), personnel resources (e.g.
expert opinions and guidelines) and informational resources (e.g. information dissemination both within
and across channel members) (Ritter, 1999). It has been observed that actors share their resources in a
way, which inspires the channel members in their relationship and helps them to reach their objectives
and develop useful connections within the network (Jraisat, 2016).
During interviews, it was revealed that multiple resource sharing mechanisms have been established. For

Journal of Business and Social Review in Emerging Economies Vol. 6, No 4, December 2020
1346
example, the Department of Agriculture Extension, under the “Kitchen Gardening Program” provide
subsidized seed kits to growers at approachable places. Similarly, the Department of Agriculture
Extension & Adaptive Research provides trainings on different topics to both growers and input
suppliers for their capacity building. Likewise, state-of-the-art and well-equipped laboratories with the
latest technologies have been established in eight (08) divisions and twenty-eight (28) districts of
Punjab. Farmers and input suppliers can avail laboratory facilities for various analyses regarding plants,
pests, soil and water resources. In addition to advisory services, agri-equipment, like, land levelers,
bulldozers and other agri-utensils are being provided to growers under the Directorate of Agriculture
Field. To strengthen collaboration, the Department of Farm Water Management guide efficient usage of
water reserves, reduction of water evaporation, control on operational losses and water seepage, etc.
Another valuable contribution is the installation of Digital Rate Boards in twenty-seven (27) different
markets.
Table 3. Portray interesting insights regarding the extent of integration between public sector
stakeholders, farmers and input suppliers.
Table 3. Extent of Integration Concerning Resources
NATURE OF
RESOURCES PHYSICAL FINANCIAL PERSONAL INFORMATIONAL
SHARED
WITH
FARMERS
Current level of SCI
S T O S T O S T O S T O
r
Required level of SCI
S T O S T O S T O S T O
SHARED
WITH INPUT-
SUPPLIERS
Current level of SCI
S T O S T O S T O S T O
Required level of SCI
S T O S T O S T O S T O
Note: - S: Strategic Level, T: Tactical Level, O: Operational Level

Journal of Business and Social Review in Emerging Economies Vol. 6, No 4, December 2020
1347
Despite of above measures, the management of public sector stakeholders believes that at present
resource sharing with farmers and input suppliers is restricted at the tactical level. While, answering the
question that integration should be extended to the strategic level? The majority of respondents were of
the views that the desired results can be attained by engaging farmers in collaborative projects, however,
they seem satisfied with the level of integration with input supplier Commenting further, Assistant
Director [AE&AR], pinpointed;
“that directorates and the connected departments working under the Department of Agriculture, Punjab
desire to strengthen weaker partners, i.e. farmers as compared to established input suppliers. However,
any worth mentioning collaborative project by input supplier can be welcomed”.
In addition to physical resource sharing, the debates regarding integration for financial resources depict
that due to financial constraints, farmers are far away from research initiatives. Though, Punjab
Agriculture Research Board provides funds for research activities still the management believe that
funding is not sufficient to fulfill the need of the farmers across the province. However, to increase agri-
input, soft loans are being provided to farmers along with necessary information/education to adopt
emerging technologies including drip irrigation, tunnel farming, etc.
To gain success, the Punjab Government sponsor 10,000/- rupees per acre for water storage ponds.
Additionally, some projects, like, Punjab Irrigated-Agriculture Productivity Improvement Project,
National program for improvement of watercourses in Pakistan, High-Efficiency Irrigation System
(government subsidizes 60 percent of total system cost for installation of HEIS on up to 15 acres, while,
the remaining costs are contributed by the beneficiary farmers) are hallmark projects and reflect the
tactical level of integration between public sector stakeholders and farmers. On the other hand, agri-
input suppliers also seem active. They sponsor basic farming (limited level), offer discounts to farmers,
conduct seminars, organize workshops and festivals and take research initiatives. Additionally, logistics
support, stocking, dealing and negotiation with wholesalers are some other financial support extended by
input suppliers. Such financial collaborations between AFVC helps in generating overall supply chain
performance. It is further revealed that designated employees including, directors, assistant directors,
agriculture officers, agricultural engineers, field officers/staff remain in touch with key players on
multiple levels and layers of the agriculture value chain. For example, agricultural officers and field
assistants engage farmers on a daily basis for training, advisory services, sample collection for soil and
water, pest scouting, distribution of seed kits, etc. One of the Director added;
“….. they ensure a seamless and consistent flow of information with their key users. They believe their
success heavily relies on on-time information dissemination regarding research activities, market rates,
proper stock places and other infrastructural requirements.
Adding further, he said;
“….. we depute inspectors to maintain farmer’s registration, test quality, price check and delist firms
engaged in low-quality fertilizers, pesticides and seeds”.
All these measures are to extend services and to facilitate local farmers and agri-input suppliers.
5.6 Constraints in achieving the Desired Extent of SCI
Once it was probed that why public sector stakeholders remained unable to attain the desired extent of
integration, three major hurdles were emphasized, i.e. scarcity of resources, limited access to updated
technologies, and lack of willingness on the part of both the growers and input suppliers to make use of
the facilities provided by the Government of Pakistan. Additionally, lack of trust and motivation, high
illiteracy, communication gap, limited funds, etc. were highlighted as hurdles to attain desired results.
5.7 Supply Chain Integration and its Impact on Supply Chain Performance
The performance management index proposed by Dweiri and Khan (2012) was used to measure the
impact of SCI on SCP. To comprehend the picture, few glimpse are presented below;
“ ….. efforts are paying off and the same is evident from the quality and surplus production of multiple
Journal of Business and Social Review in Emerging Economies Vol. 6, No 4, December 2020
1348
crops, fruits and vegetables” [Director General Agriculture Policy Institute (API)].
“ ….. I can confidently claim that [due to consistent trainings], today, our growers are capable to meet
international standards, rejection rate [has] significantly reduced, and our exports increased [Assistant
Director Agriculture (Research)].
“…… logistical protocols are independently managed, so it sometimes, affects the profits
inversely”[Deputy Director, Agriculture (Extension & AR)].
“ ….. farmers in Pakistan, don’t stock much, as they can’t afford [due to perishability], hence, serious
efforts needed to build storage [cold chains] to avoid wastages, ensure inventory turnover and to reduce
lead time [GM Field Wing (PASSCO)].
“Despite of all efforts, channel members inability to comply and/or distrust [on public offices] surely
damage overall performance [Economic Consultant, Economic Wing]”
Though, above comments give some insights, however, financial gain is the ultimate predictor of the
overall performance. Unfortunately, no solid (quantitative) or measureable outcomes can be extracted
from the discussions, however, general statistics (like, 3.81% growth for the year 2017-18 compared to
previous year’s 2.07% & 0.15% for the year 2016-17 & 2015-16, speak favorable.
6. Conclusion
To our utmost knowledge, this study is among rare studies, wherein, the role of public sector
stakeholders in collaborating with their supply chain partners, i.e. growers/farmers and input suppliers
has been identified. Based on inputs from the interviewers, this study provides some significant and
useful insights. Firstly, to attain desirous performance, SCI across AFVC is inevitable. Secondly, SCI is
observed as a contextual phenomenon, and it’s not less than a theoretical myth that only the utilization
of higher intensity of SCI leads to higher supply chain performance. Thirdly, the extent of SCI can
practically be measured on three possible extents, i.e. strategic, tactical and operational. Lastly, desirous
performance can be attained through active involvement of supply chain actors, activities and resources.
Furthermore, the results highlight that public sector stakeholders are using multiple means to share all
possible resources, including, personal, financial, physical and informational with their supply chain
partners. Despite of limitations, there are a number of agri-based collaborative projects which can be
marked as ‘integration landmarks’, for example, the Kitchen Gardening Program, Punjab Irrigated-
Agriculture Productivity Improvement Project, National Program for Improvement of Water Courses,
High-Efficiency Irrigation System, etc. Similarly, the efforts of public sector stakeholders are highly
appreciable especially for establishing mechanisms for sharing useful information and research output
both with growers and input suppliers. The efforts are not limited to information sharing rather agri-
partners are collectively engaged in joint decision making and collaborative projects. Interestingly, the
extent of integration varies significantly among activities, resources, and actors, and that’s how the
outcomes of this study add valuable insight in the existing series of supply chain literature especially
regarding network perspective.
Considering the significance of networks, most of the researchers, like, (Anderson et al., 1994; Koops et
al., 2002; Ritter & Gemünden, 2004) have stated the need for effective management of key network
factors and interaction between these to generate better positives. The outcomes of this study confirms
that different extents of integration are required along various supply chain activities to generate overall
supply chain performance. This understanding is somehow in line with the research work of Flynn et al.
(2010), wherein, different configurations and arcs of SCI have been suggested. Similarly, as per
contingency perspective, where manufacturers make use of a certain extent of integration with a desire
of harmonizing the particular SCI and the environment in which it is utilized (Flynn et al., 2010;
Wiengarten et al., 2016), this study also advocates that blind use of high level of SCI, without
considering contextual factors, may not generate desirous performance. Finally, this study considered
the need for implementing the required extent of SCI beyond the dyadic level, to the network level. This
was prescribed, because of the ever-rising need for establishing the productive AFVC’s specifically in
developing countries in a desire to expand agriculture output.
Journal of Business and Social Review in Emerging Economies Vol. 6, No 4, December 2020
1349
The comparison of given studies’ results with those of others, clearly revealed that one can’t
overestimate the role of SCI in causing SCP. The effect of SCI on performance can only be examined, if
all the contingencies and configurations are kept under consideration. Else, the use of SCI can backfire,
in the form of unprecedented cost, resulting in losses for firms in particular and overall supply chains as
a whole. Moving forward, the outcomes of this study strengthened the preposition that SCI is a
contextual phenomenon. This study considered AFVC of Pakistan, with an assumption, that it is one of
the most segregated and critical value chains of all, and universal (high level) implementation of SCI
must not be useful in all cases. A number of contextual factors, like a variety of players involved,
perishability and nature of the product, the unpredictability of weather and instability in governmental
policies, etc. may demand different extent of integration among actors, activities and resources of the
supply chain network.
This study extends managerial understanding regarding appropriate levels of SCI among supply chain
partners. More specifically, understanding the required extent of SCI can assist firms and supply chain
partners to save their energies and resources for future gains. Like others, this study also has some
limitations, which set the tone for futuristic researches in the field of SCI. Future researchers can
consider a longitudinal data, which may give them more comprehensive insights. The geographical
(Pakistan) and sectorial (agriculture) scope may raise questions on the generalizability of the results.
Hence, knowing the current and required extent of integration by studying diversified sectors across
multi-echelons supply chains can help to generalize the results. Similarly, quantitative frameworks
grounded from literature, hypothesizing SCI and SCP and empirical verifications can produce deeper
and valuable insights.
References
Anderson, J. C., Håkansson, H., & Johanson, J. (1994). Dyadic business relationships within a business
network context. Journal of marketing, 58(4), 1-15.
Autry, C. W., Rose, W. J., & Bell, J. E. (2014). Reconsidering the supply chain integration–Performance
relationship: In search of theoretical consistency and clarity. Journal of Business logistics, 35(3),
275-276.
Barnes, B. R., Naudé, P., & Michell, P. (2007). Perceptual gaps and similarities in buyer–seller dyadic
relationships. Industrial Marketing Management, 36(5), 662-675.
Bechtel, C., & Jayaram, J. (1997). Supply chain management: a strategic perspective. The International
Journal of Logistics Management, 8(1), 15-34.
Birthal, P. S., Joshi, P. K., & Gulati, A. (2005). Vertical coordination in high-value commodities:
Implications for smallholders. Retrieved from
Childerhouse, P., & Towill, D. R. (2011). Arcs of supply chain integration. International Journal of
Production Research, 49(24), 7441-7468.
Christensen, P. R., & Klyver, K. (2006). Management consultancy in small firms: how does interaction
work? Journal of Small Business and Enterprise Development.
Christopher, M. (2016). Logistics & supply chain management: Pearson UK.
Cousins, P. D., & Menguc, B. (2006). The implications of socialization and integration in supply chain
management. Journal of Operations Management, 24(5), 604-620.
Cravens, D. W., & Piercy, N. F. (1994). Relationship marketing and collaborative networks in service
organizations. International Journal of Service Industry Management, 5(5), 39-53.
Davis, T. (1993). Effective Supply Chain Management, Sloan Mgmt: Rev.
de Keizer, M., Akkerman, R., Grunow, M., Bloemhof, J. M., Haijema, R., & van der Vorst, J. G. (2017).
Logistics network design for perishable products with heterogeneous quality decay. European
Journal of Operational Research, 262(2), 535-549.
Devaraj, S., Krajewski, L., & Wei, J. C. (2007). Impact of eBusiness technologies on operational
performance: the role of production information integration in the supply chain. Journal of
Operations Management, 25(6), 1199-1216.
Doering, T., De Jong, J., & Suresh, N. (2019). Performance effects of supply chain integration: The
relative impacts of two competing national culture frameworks. Cogent Business &
Management, 6(1), 1610213.
Journal of Business and Social Review in Emerging Economies Vol. 6, No 4, December 2020
1350
Dweiri, F., & Khan, S. A. (2012). Development of a universal supply chain management performance
index. International Journal of Business Performance and Supply Chain Modelling, 4(3-4), 232-
245.
Ellinger, A. E., Keller, S. B., & Hansen, J. D. (2006). Bridging the divide between logistics and
marketing: facilitating collaborative behavior. Journal of Business logistics, 27(2), 1-27.
Ellram, L. M., & Cooper, M. C. (2014). Supply chain management: It's all about the journey, not the
destination. Journal of Supply Chain Management, 50(1), 8-20.
Fawcett, S. E., & Magnan, G. M. (2002). The rhetoric and reality of supply chain integration.
International Journal of Physical Distribution & Logistics Management, 32(5), 339-361.
Flynn, B. B., Huo, B., & Zhao, X. (2010). The impact of supply chain integration on performance: A
contingency and configuration approach. Journal of Operations Management, 28(1), 58-71.
Frohlich, M. T., & Westbrook, R. (2001). Arcs of integration: an international study of supply chain
strategies. Journal of Operations Management, 19(2), 185-200.
Ganbold, O., Matsui, Y., & Rotaru, K. (2020). Effect of information technology-enabled supply chain
integration on firm's operational performance. Journal of Enterprise Information Management.
Germain, R., & Iyer, K. N. (2006). The interaction of internal and downstream integration and its
association with performance. Journal of Business logistics, 27(2), 29-52.
Graham, G., Zailani, S., & Rajagopal, P. (2005). Supply chain integration and performance: US versus
East Asian companies. Supply Chain Management: An International Journal.
Green, K., & Inman*, R. (2005). Using a just-in-time selling strategy to strengthen supply chain
linkages. International Journal of Production Research, 43(16), 3437-3453.
Halinen, A., & Törnroos, J.-Å. (2005). Using case methods in the study of contemporary business
networks. Journal of Business Research, 58(9), 1285-1297.
Handfield, R. B., & Nichols, E. L. (2002). Supply chain redesign: Transforming supply chains into
integrated value systems: FT Press.
Harland, C. M. (1996). Supply chain management: relationships, chains and networks. British Journal of
management, 7(s1).
Hendijani, R., & Saei, R. S. (2020). Supply chain integration and firm performance: the moderating role
of demand uncertainty. Cogent Business & Management, 7(1), 1760477.
Jarillo, J. C. (1988). On strategic networks. Strategic management journal, 9(1), 31-41.
Jarosz, L. (2000). Understanding agri-food networks as social relations. Agriculture and human values,
17(3), 279-283.
Jraisat, L. (2016). A network perspective and value added tasks: the case of agri-food value chain. Asia
Pacific Journal of Marketing and Logistics, 28(2), 350-365.
Kahn, K. B., & Mentzer, J. T. (1998). Marketing’s integration with other departments. Journal of
Business Research, 42(1), 53-62.
Koops, S., Mollenkopf, D., & Zwart, T. (2002). Food supply chains: Are efficiency and responsiveness
mutually exclusive? Journal on chain and network science, 2(1), 7-18.
Kostova, T., & Roth, K. (2002). Adoption of an organizational practice by subsidiaries of multinational
corporations: Institutional and relational effects. Academy of management journal, 45(1), 215-
233.
Kusi-Sarpong, S., Sarkis, J., & Wang, X. (2016). Assessing green supply chain practices in the Ghanaian
mining industry: A framework and evaluation. International Journal of Production Economics,
181, 325-341.
Lee, H. L., & Billington, C. (1992). Managing supply chain inventory: pitfalls and opportunities. Sloan
management review, 33(3), 65-73.
Leuschner, R., Rogers, D. S., & Charvet, F. F. (2013). A meta‐analysis of supply chain integration and
firm performance. Journal of Supply Chain Management, 49(2), 34-57.
Li, W., & Chen, J. (2018). Backward integration strategy in a retailer Stackelberg supply chain. Omega,
75, 118-130.
Liu, W., Bai, E., Liu, L., & Wei, W. (2017). A framework of sustainable service supply chain
management: A literature review and research agenda. Sustainability, 9(3), 421.

Journal of Business and Social Review in Emerging Economies Vol. 6, No 4, December 2020
1351
Lui, S. S., Wong, Y.-y., & Liu, W. (2009). Asset specificity roles in interfirm cooperation: Reducing
opportunistic behavior or increasing cooperative behavior? Journal of Business Research,
62(11), 1214-1219.
Mackelprang, A. W., Robinson, J. L., Bernardes, E., & Webb, G. S. (2014). The relationship between
strategic supply chain integration and performance: a meta‐analytic evaluation and implications
for supply chain management research. Journal of Business logistics, 35(1), 71-96.
Mentzer, J. T., DeWitt, W., Keebler, J. S., Min, S., Nix, N. W., Smith, C. D., & Zacharia, Z. G. (2001).
Defining supply chain management. Journal of Business logistics, 22(2), 1-25.
Mentzer, J. T., Flint, D. J., & Hult, G. T. M. (2001). Logistics service quality as a segment-customized
process. Journal of marketing, 65(4), 82-104.
Mikkola, M. (2008). Coordinative structures and development of food supply chains. British Food
Journal, 110(2), 189-205.
Mohamed, E., & Hassan, A. (2019). How Does Complexity Affect the Relationship Between Supply
Chain Integration and Firm Performance?: A Conceptual Framework. International Journal of
Service Science, Management, Engineering, and Technology (IJSSMET), 10(2), 22-37.
Morash, E. A., & Clinton, S. R. (1998). Supply chain integration: customer value through collaborative
closeness versus operational excellence. Journal of Marketing Theory and Practice, 6(4), 104-
120.
Narasimhan, R., & Das, A. (2001). The impact of purchasing integration and practices on manufacturing
performance. Journal of Operations Management, 19(5), 593-609.
Oliver, R. K., & Webber, M. D. (1982). Supply-chain management: logistics catches up with strategy.
Outlook, 5(1), 42-47.
Porter, M. E. (1985). Competitive advantage: creating and sustaining superior performance. 1985: New
York: Free Press.
Power, D. (2005). Supply chain management integration and implementation: a literature review. Supply
Chain Management: An International Journal.
Rehman, S. T., Khan, S. A., Kusi-Sarpong, S., & Hassan, S. M. (2018). Supply chain performance
measurement and improvement system: a MCDA-DMAIC methodology. Journal of Modelling
in Management, 13(3), 522-549.
Ritter, T. (1999). The networking company: antecedents for coping with relationships and networks
effectively. Industrial Marketing Management, 28(5), 467-479.
Ritter, T., & Gemünden, H. G. (2004). The impact of a company's business strategy on its technological
competence, network competence and innovation success. Journal of Business Research, 57(5),
548-556.
Schoenherr, T., & Swink, M. (2012). Revisiting the arcs of integration: Cross-validations and
extensions. Journal of Operations Management, 30(1-2), 99-115.
Shou, Y., Li, Y., Park, Y. W., & Kang, M. (2017). The impact of product complexity and variety on
supply chain integration. International Journal of Physical Distribution & Logistics
Management, 47(4), 297-317.
Sluyts, K., Matthyssens, P., Martens, R., & Streukens, S. (2011). Building capabilities to manage
strategic alliances. Industrial Marketing Management, 40(6), 875-886.
Song, G., Song, S., & Sun, L. (2019). Supply chain integration in omni-channel retailing: a logistics
perspective. The International Journal of Logistics Management, 30(2), 527-548.
Soto-Silva, W. E., Nadal-Roig, E., González-Araya, M. C., & Pla-Aragones, L. M. (2016). Operational
research models applied to the fresh fruit supply chain. European Journal of Operational
Research, 251(2), 345-355.
Stank, T. P., Keller, S. B., & Daugherty, P. J. (2001). Supply chain collaboration and logistical service
performance. Journal of Business logistics, 22(1), 29-48.
Stevens, G. C. (1989). Integrating the supply chain. International Journal of Physical Distribution &
Materials Management, 19(8), 3-8.
Tarifa-Fernandez, J., & De Burgos-Jiménez, J. (2017). Supply chain integration and performance
relationship: a moderating effects review. The International Journal of Logistics Management.
Turkulainen, V. (2008). Managing cross-functional interdependencies-the contingent value of
integration: Teknillinen korkeakoulu.

Journal of Business and Social Review in Emerging Economies Vol. 6, No 4, December 2020
1352
Visnjic, I., Wiengarten, F., & Neely, A. (2016). Only the brave: Product innovation, service business
model innovation, and their impact on performance. Journal of product innovation management,
33(1), 36-52.
Wiengarten, F., Li, H., Singh, P. J., & Fynes, B. (2019). Re-evaluating supply chain integration and firm
performance: linking operations strategy to supply chain strategy. Supply Chain Management:
An International Journal.
Wilson, D. T. (1995). An integrated model of buyer-seller relationships. Journal of the Academy of
marketing Science, 23(4), 335-345.
Wong, C. Y., Boon-Itt, S., & Wong, C. W. (2011). The contingency effects of environmental uncertainty
on the relationship between supply chain integration and operational performance. Journal of
Operations Management, 29(6), 604-615.
Yin, R. (2003). Case study research: design and methods,(3rd) Sage Publications. Thousand Oaks,
California, 2278-0181.
Yin, R. K. (2015). Qualitative research from start to finish: Guilford Publications.
Zhao, X., Huo, B., Selen, W., & Yeung, J. H. Y. (2011). The impact of internal integration and
relationship commitment on external integration. Journal of Operations Management, 29(1-2),
17-32.
Journal of Business and Social Review in Emerging Economies Vol. 6, No 4, December 2020
1353
Volume and Issues Obtainable at Center for Sustainability Research and Consultancy
Journal of Business and Social Review in Emerging Economies ISSN: 2519-089X (E): 2519-0326
Volume 6: No. 4, December 2020
Journal homepage: www.publishing.globalcsrc.org/jbsee
Police Brutality and Reforms in Pakistan
Najma Sadiq1, Ume Laila2, Tahir Mehmood3, Tooba Rehan Haqqi4
1Assistant Professor, Head of the Department, Department of Mass Communication, School of Social
Sciences and Humanities (S3H), National University of Sciences and Technology (NUST), Islamabad,
Pakistan, [email protected] 2Assistant Professor, Government & Public Policy, School of Social Sciences and Humanities (S3H),
National University of Sciences and Technology (NUST), H-12 Sector, Islamabad, Pakistan,
[email protected] 3Assistant Professor, Department of Communication studies, BahaUddin Zakariya University, Multan,
Pakistan, [email protected] 4 Graduate Public Administration, Department of Government & Public Policy, National University of
Sciences and Technology (NUST), H-12 Sector, Islamabad, Pakistan, [email protected]
ARTICLE DETAILS ABSTRACT History Revised format: November 2020 Available Online: December 2020
Police Brutality has become one of the most important highlight
around the globe. This study qualitatively investigates the form of
police violence existent in Pakistan and also how this violence is
related with the reforms enunciated. Through investigation it has
been seen that the police of Pakistan are more into bribery and
misuse of power than it is there to serve the nation and provide
national security. This study shall highlight important issues
prevalent and will also provide recommendations through which
issues can be resolved.
© 2020 Center for Sustainability Research and Consultancy Pakistan under
a Creative Commons Attribution-NonCommercial-ShareAlike 4.0
Keywords Police, Police Brutality,
Pakistan, Police Reforms
JEL Classification
M10, M1
Corresponding author’s email address: [email protected]
Recommended citation: Sadiq, N., Laila., U., Mehmood, T. & Haqqi, T. R. (2020). Police Brutality
and Reforms in Pakistan. Journal of Business and Social Review in Emerging Economies, 6(4), 1353-
1359
1. Introduction
Police department is an integral department in any state in order to maintain law and order in the
country. Pakistan being a democratic state has established a separate police department in order to
protect the citizens of the country. Specialized training schools have been established which train the
police officers in a way that they can sustain any danger and face challenges with bravery; not only that
highest standards of merit are maintained in recruiting along with numerous perks and benefits endowed
to the police personnel at all levels. The personnel are also given on-the-job training to keep them up to
date. The force is fully equipped with latest machinery and are fully technologized in order to curb any
violence prevalent in the society.
When the police department was discovered, it was believed that through this modern criminology shall
advent and through this new horizon the old forms of policing shall be laid to rest (Alan, 2005-2006) . It
Journal of Business and Social Review in Emerging Economies Vol. 6, No 4, December 2020
1354
was believed that the department is of local nature meaning it shall by all means work for the commo
statemen but never it had been thought that this essential department would one day rise and become a
robust institute that shall only be working for the elites and power. Despite investing abundant resources
in this department, the results are not satisfactory. The police in here has become a violent force rather
than a discipline maintaining department. Violence in police is a contradictory term, yet this ferocity is
growing at a reckless speed. Such a type of violence in easy words can be referred to as misuse or mal
exercising of power. The situation prevailing in United states has opened eyes of Pakistani people who
have now started to talk and investigate about the ongoing brutality in Pakistan. George Floyd’s video
has caused a rage all around the world and this is the first time ever when people in Pakistan have started
to support this issue through social media and thus have participated at international forum. This
incident has exposed the real face of police and has led people to rethink the need for constabularies. Tip
top preparing schools have been built up for the cops. Despite the courses of action fit as fiddle up these
officials as the gatekeepers of the general population, the country is at times rewarded to the updates on
a hardhearted killing on account of these very men.
It might not be wrong to say that the police department needs well trained, and physically and mentally
perfect officers. Apart from these qualities, morale must be the topmost priority while selecting the
officers (Gockce, 1945) . A lot of time is required to inject high moral standards into a person. The then,
it was deemed and believed that a moral person is a just person but now, the modernized world has
thrown back this quality and which can easily be seen in the police department also. It was once a time
when police constables had the best of attitude and behavior, but all of the essence is now lost and seems
like can never be restored back.
1.1 Research Focus
This essay shall investigate following important factors behind this violence
1. Relevance between different brutality cases
2. Factors behind police violence in Pakistan
3. Fate of police reforms enunciated in 2002
The purpose of this research is to evaluate the factors that are hyping the police violence and the
significance of topic lies in the fact that no such research has been yet carried out to draw out the
relevance between the reforms enunciated and how well did these reforms contributed to reduce the
prevailing brutalities.
2. Literature Review Police incarceration has become a norm in United States. Many black Africans are laid to rest due to
immense culture of racism amongst white people and it might not be wrong to say that the U.S. criminal
system is almost always silent on such issues and have had never supported the black Africans against
this brutality (Taylor, 2013) . The question then arises has there any reforms been initiated in order to
curb this brutality or not? The question does stands out and it can easily be stated that no such reforms
have come to light. The US department of Justice should consider the fact of humanity and start working
against this brutality and should work hard enough to pledge rights for the black Africans (Chaney &
Robertson, 2013).
Terrorizing poor has become quite easy and a normal thing especially for the police officers. The protest
carried out by Tamil-Nadu fishermen against the installation of nuclear power plant at the coastal lines
was subjected to serious torture and anguish that by any means they had to back off from the protest
(Kumar, 1985) . But can all this brutality and homicide against poor and mostly the religion of Islam
justifiable? Can the events of 1962 in Los Angeles be justifies when 7 of the Muslims were laid to rest
by the police when they had not even committed the slights of the slight crime. But its clearly evidential
that the political authorities were quiet powerful in overcoming and shadowing these events and till date
no such effort has ever been made to give due rights to those innocent Muslims (Knight, 1994).
In some cases like China, police department is the most loyal where they work day and night to
administer and resolve the cases, but here in China the work load on police officers is so vast that this

Journal of Business and Social Review in Emerging Economies Vol. 6, No 4, December 2020
1355
has become the matter of frustration and has become difficult for them to accomplish set goals (E.
SCOGGINS & O'BRIEN, 2016) . Unlike this in Japan it is believed that the police department might be
much worst than it even appears to be. Three most galvanizing corruptions have been observed in this
department which requires a lot of attention (Johnson, 2003). Little to no research has been carried out in
Pakistan to evaluate and find the reasons behind the prevailing conditions in the police department. In a
research carried out by Mukarram Ali Khan, he has pointed out the police brutality in Pakistan
explaining the different forms in which it exists and has justified by giving reasons and pointing out
incidents which has led to such circumstances. On taking interviews, the stakeholders jagged out
different states and forces which have started to worsen the police department conditions (Mukaram,
2014). In another research chapter, by Zubair Nawaz Chattha and Sanja KutnjakIvković, they have
highlighted police misconduct and have justified the prevailing condition by mentioning certain
socioeconomic and political conditions which are heeding the viciousness (Zubair & Sanja).
In an article named “Police and Policing in Pakistan” by Fasihuddin, the researcher has pointed out the
effects of Police Order 2002 and to what extent it has created drastic changes in the police sector. The
author has also explained the structural problems still prevalent in the organization. Comprehensively,
the author believes that apart from 1886 police order no reforms have created a positive impact or has
improved the police sector. Certain suggestions are also presented which can easily be incorporated in
order to improve and enhance the functional capacity of this important sector (Fasihuddin, 2019).
Abbas Ahsan in his article “Police Reforms: Public Perception and Introspection” clearly mentions that
there is a dire need of reforms in the police sector of Pakistan. He believes that integrity and
accountability are the two missing factors in this sector and hence require a lot of attention. The author
believes that the reforms shall not be fruitful unless and until the perception of public related to the
police is known. He confidently points out that the negative perception of people regarding the police
sector truly reflects the reality of this sector and unless and until the policy makers truly understand the
insight of public no such reforms can be enunciated (Ahsan, 2019, pp. 155-162).
Aftab and Baloch have investigated the nature of the foundations on which the Sindh Policing system
has been laid. In their article “Policing Colonization The Evolution and Role of Sind Police and the
Views of Sir Charles Napier on the Administration of Criminal Justice in Sind” evaluates the working
capacity of the Sindh Police prior to the formation of Pakistan. They believe that the British policing
system did had some drawbacks including the operational deficiencies as well as a lot of influence of the
jagir system has been seen. The authors believe that the present Sind Police system still has these
deficiencies and thus a lot of improvement is required (Aftab & Dost, 2019).
Paul Petzschmann in his brief article pointed out the major institutional setbacks after carrying out a
survey. The Author in his article “Police Reform in Pakistan A Victim of Foreign Security Aid?” claims
that the police sector started to deteriorate after the reforms enunciated by former President Musharraf.
He believes that the only thing Pakistani police is good at is to combat Talibanization or to fight war
against the terror. he also puts a question before the government that whether the police reforms were
implemented to modify the sector or to attract the foreign aid. He articulates that the true essence of
police department has been lost and that essential reforms are required in terms of training so that the
officers get to know that the main thing is to provide security to general public and not to protect the
politicians and borders (Paul, 2010).
3. Research Methodology
This research follows qualitative approach and investigates into different scenarios reported in news and
other articles talking in detail about the police brutality. Also, posted documents of Police Ordinance
have been obtained from the website of Law Enforcement Agencies. The documents have been reflected
and studied thoroughly before framing a contextual relationship between how the fate of PO 2002 has
been subjected to threat.

Journal of Business and Social Review in Emerging Economies Vol. 6, No 4, December 2020
1356
4. Analysis
The Following part now discuses in detail the three objectives of this research. The analysis is purely
descriptive in nature, followed by relevant examples and cases where necessary.
4.1 Police Reforms and its Fate
After independence Pakistan had established a criminal justice system under which police department
was destined to provide security to the nation. With the passage of time this division started to come
under different influences, majorly the political influence. With the interference of ruling political
authority corruption and red tapes began to increase and thus police department’s efficiency began to
diminish. Till date this department is sheerly involved in crooked activities. Upon considering the
diminishing health of the department the federal government decided to introduce certain reforms in this
department. The police reforms 2002, enunciated on 14th august 2002, were the hallmark as officials
along with nation though that this decision will finally allow them to put trust on the constabularies. The
police order at that time imposed legal obligations on the police authorities to execute and exercise their
powers justly and that they were destined to exhibit highest standards of morality, professionalism,
nationalism and of course justice. Perceiving that these officials shall remain friendly certain autonomies
and immunities were also granted to shelter police officials. But soon after provinces were given
autonomy to make their own decision except Punjab the remain three provinces drafted and
implemented their own Police orders. This created a rift in the police officials all over the country who
were not bound by one contract rather subjected to different regulations.
The legitimacy of the Police Order 2002 (CDPI, 2013) became questionable soon after the 18th
amendment. The authorities tried their level best to restore uniformity in police regulations all over the
country but failed to do so. However, it was then decided that Model Police Law 2018 should be
applicable in provinces was flexible enough to accommodate the requirements of the provinces and the
Police Order 2002 be applicable only on Islamabad. But things stand out very clear; there was an
absolute lack of political will due to which these reforms could not be enforced. Without having a
uniform codified system applied all over the country efficiency, effectiveness and justice cannot be
achieved in the criminal justice system. Recently, Islamabad High Court called a hearing in which the
matter of non-implementation of PO-2002 was discussed. Chief Justice Minhallah demanded reasons
along with evidences regarding why this reform had not been enforced despite promulgated 18 years
ago, but to utmost surprise they authorities very cleverly shifted the blame onto the civil government
claiming that such reforms do not cohere with the thinking and requirements of general public. Having
said that they also demanded to abolish this reform constitutionally and let provinces decide the fate of
police department on their own. But in my opinion, this is not a way to deal with issues. The
constitutionally promulgated reforms should not be called off this easily only because the political
authorities cannot have their personal motives fulfilled. It should be noted that until and unless politics is
separated from police department nothing can be changed.
Moreover, the 2002 and other so-called modernized police reforms failed due to antagonism and
hostility of Civil Bureaucracy. These reforms restricted the control of district magistrate over the police
and hence faced unwarranted backlashes. The bureaucracy then made serious efforts not to implement
such reforms and exerted extreme pressure on the political elite and other concerned agencies to amend
the new legislation. Hence here the point is raised that if such kind of corrupt officials keep on enjoying
the positions falsely and disregard the true essence of bureaucracy then the departments under
establishment can never be reformed and can never be corruption free.
4.2 Relevance between Different Brutality Cases
Police brutality has now become a global phenomenon. Every day almost new cases related to police
harshness emerge. From the video that went viral of George Floyd numerous questions have cam
forward in the domestic media calling out and challenging the concerned authorities to look for the
rampant police brutality here in Pakistan. It is evidential form the incidents that police authorities have
had disregarded the norms and values of justice system and have shown inhumane attitude while
subjecting the common man to the brutal behavior letting it be verbal abuse or torturing in-custody
Journal of Business and Social Review in Emerging Economies Vol. 6, No 4, December 2020
1357
criminals to death. Not only that they have also defied and disregarded the constitutional and
fundamental human rights but there exists no law which would subject them to inquiries.
Such frequencies have shown the real face of the police department and have indicated that the police
have started to misuse the brand or name which they should be using to serve the people. an inflexion
point and many Americans can completely relate. The ongoing protests in America do have a 100%
relevance to what is happening here in Pakistan but the difference lies in a way that there people took the
case onto the streets while here in Pakistan nobody has that freedom to go against the police brutality
and speak openly on media. Staring from the incident that occurred in 2018, when Naqeeb ullah mehsud
was killed by super intended in Karachi claiming that he was involved in certain terrorist activities. A
wave of anger had swept around the country at that time, but nobody was able to acquire justice for the
young lad because police had started to threaten deceased’s family. Many NGO’s and other human
rights organizations called for investigations but of no use; soon after the case was closed, and no
interrogations were carried out on the part of SP police Karachi. Another incident which occurred in
Lahore where police constables tortured a mentally challenged person to death and again despite many
efforts those constables could not be held accountable. Recently, in Karachi a frontline doctor was shot
twice by a policeman and upon confrontation with the higher authorities they claimed that, the
policeman had some psychic problem so he cannot be dragged into the court of law of inquiries. So here
comes the question if he had been a mentally ill person what he was doing in the police department.
Again, law remained silence and could not stand up for the frontline doctor who risked his life in this
pandemic.
Certain relevance can be drawn in these cases. In all the three scenarios its clear that the police had
misused the power and immunity endowed upon them and simultaneously the weak justice system was
unable to held accountable these people. In almost 90% of the cases it’s a weak or person belonging to
marginalized groups who are subjected to the police violence. In the remaining 10% the police mal-used
their powers. Here in Pakistan police considers themselves above law and that they have power to do
ANYTHING without being accountable before the law. These situations arise because of the weak
judicial system which just plays a puppet show and remains silent before the political influences and
other powerful establishments.
4.3 Factors behind Police Violent in Pakistan
The police brutality prevalent in USA is because of the racial differences. Almost 99% of people
subjected to this violence are the black Americans. But here in Pakistan there are numerous other factors
which gave rise to the police ferocity. Upon investigation the results turned out to not so surprising. The
main factors which have heeded up the situation include:
1. Lack of proper training, knowledge and resources
2. Lack of proper funding, which leads to low salaries and thus enhancing the frustrations.
3. Meager working; which means that the people working in police department are not been
provided with certain way outs, only they must do is to listen to orders of their bosses.
4. Absence of coordination between the law enforcement agencies which makes the police
department all in all. Lack of synchronization also leads to no controlling agency/power over the
department.
5. Recommendations
As things can never be left out alone similarly this vicious department of the society cannot be left out to
erode on its own. Frequently, police are part of the problem, as opposed to be its solution. Similarly, in
most cases the police officers turn out to be way too corrupt defying and disregarding all sorts of
requirements of justice. In other circumstances the nation does not trust the constabularies; but every
problem has a solution. There exist some opportunities through which things or moreover department
can be revamped. Following are some recommendations through which police department can be set on
the road to progress.
FIRSTLY, the government should restrict the powers of police by enforcing the already present Article
14 of constitution which decrees that "no action detrimental to the life, liberty, body, reputation or
Journal of Business and Social Review in Emerging Economies Vol. 6, No 4, December 2020
1358
property of any person shall be taken except in accordance with law" and that no person "shall be
deprived of life or liberty save in accordance with law" (GOP, 1973) . Through administering this
provision police department will be considered under law and not above the eyes of law. “Criminal
Procedure Code (1898), the Maintenance of Public Order Ordinance (1960), and the recently enacted
Protection of Pakistan Act (2014), all contribute to a legal framework that protects the police from
accountability” moreover, QUALIFIED IMMUNITY, which gives them an escape goat to misuse
designated powers and no one will be questioning them. In my opinion this should be eliminated from
the system as it makes the police different from all of us and it must be made sure that any person who
does bad should reap the fruit of his doings.
SECONDLY, the police department here in Pakistan should be demilitarized. By demilitarize it means
that the department must be restricted, and it should be made sure that none of the officials are using
federal funds to buy equipment that are out of the scope for the department. For instance, police raid
houses with heavily equipped guns, they should be restricted to baton; charge and pistols not more than
that. Also, enough instruction should be given to them so that they know when and how to use such
things. THIRDLY, any police officer who comes across such heinous crime of brutally killing and
torturing a criminal or as stated in the above examples these police officers must be prosecuted, dragged
in the court of law, charge them as hard as the prosecutor can and then finally should be given
punishment in accordance to what the penal code says regarding the murder/torture to death. Unless and
until such actions are taken in the past cases, no police officer shall abide by misusing the powers. It’s
now in the hands of the criminal justice system either it decides to feed the officials or serve the nation
without any discrimination. FOURTHLY, although the following recommendation should be employed
on all departments but particularly in the police division. This sector should be made free from the
political influence and interference. For so long politicians have started to fuel and bribe police officials
and have for so long kept them as their pets. Such misdealing inhibits the common man to completely
trust the police and acquire any sort of help.
FIFTHLY, the criminal justice system should be revamped at priority basis and should be made more
responsive to the victims. In order to revamp this system a quantitative approach of statistical analysis
should be adopted which will, through surveys, allow the judiciary to investigate the reasons behind the
violence and the trend. Moreover, the justice system should be strong enough to held accountable
officials and must not fear someone because of the position the hold in the society. If a case of brutality
comes forward the justice department should compel the police authorities to provide data of the official
attempting such brutality and then the trial should be carried out. If in case the justice system fails to do
so a condition should be levied that the justice department shall not be receiving any sort of federal
funding to run the department.
6. Conclusion
This essay does not aim to highlight and spread negativity about the police department; but the reason
behind writing this essay is to make sure that the concerned authorities find a way forward and get a
chance to restore this subdivision. “The strength and legitimacy of the police forces depends upon how
morally they perform the duty; one such is the example of the police force of Georgia. People living
there do not abide by the rules and regulations just because of the fear that they might lose their lives-
instead, they listen to a traffic warden, or a constable, or a senior official, out of respect for the law, and
respect for the symbol of the State that their uniform represents. Unfortunately, in Pakistan, this ethical
dilemma of the police department has worn out. For now, the people of Pakistan are at war: with the
militant, and with a police force that frequently acts in the same manner that militants do. This model is
as unjustifiable, and it is time for meticulous members within the police force to retrieve the promise of
their profession and restate themselves as sympathetic and empathetic guardians of nation”. Moreover, if
we really want to make the police department really effective we need to incorporate three things;
measuring the performance of the department against a set criterion, maintain completely audited
records which may be used at any time in order to measure the performance, and lastly methodologies
which must be adopted by each and every individual of the department to make things possible (D.
Parrat, 1938).

Journal of Business and Social Review in Emerging Economies Vol. 6, No 4, December 2020
1359
References
Aftab, N., & Dost, A. B. (2019). Policing Colonisation The Evolution and Role of Sind Police and the
Views of Sir Charles Napier on the Administration of Criminal Justice in Sind. Pakistan Journa
of Criminology .
Ahsan, A. (2019). Police Reforms: Public Perception and Introspection . Pakistan Journal of
Criminology .
Alan, D. (2005-2006). Not Your Father's Police Department: Making Sense of the New Demographics
of Law Enforcement. Journal of Criminal Law and Criminology .
CDPI, P. (2013, March). Retrieved from http://www.cpdi-pakistan.org/wp-
content/uploads/2013/04/Police_Order_2002_e.pdf
Chaney, C., & Robertson, R. V. (2013). Racism and Police Brutality in America. Journal of African
American Studies, 480-505.
D. Parrat, S. (1938). How Effective Is a Police Department? The Annals of the American Academy of
Political and Social Science, 153-164.
E. SCOGGINS, S., & O'BRIEN, K. J. (2016). China's Unhappy Police. Asian Survey, 225-242.
Fasihuddin. (2019). Police and Policing in Pakistan . Pakistan Journal of Criminology ,
http://www.pjcriminology.com/publications/police-and-policing-in-pakistan/.
Gockce, B. W. (1945). Morale in a Police Department. Journal of Criminal Law and Criminology, 215-
219.
GOP. (1973). Constitution of Pakistan .
Johnson, D. T. (2003). Above the Law? Police Integrity in Japan. Social Science Japan Journal, 19-37.
Knight, F. (1994). Justifiable Homicide, Police Brutality, or Governmental Repression? The 1962 Los
Angeles Police Shooting of Seven Members of the Nation of Islam. The Journal of Negro
History, 182-196.
Kumar, K. G. (1985). Police Brutality Besieges Ecology: National Fishermen's March. Economic and
olitical Weekly, 1155.
Mukaram, K. (2014). Police Violence in Pakistan: Forms and Justifications. Research Gate.
Paul, P. (2010). Police Reform in Pakistan A victin of Foreugn Security Aid? . Pakistan Journal of
Criminology .
Taylor, C. (2013). INTRODUCTION: AFRICAN AMERICANS, POLICE BRUTALITY, AND THE
U.S. CRIMINAL JUSTICE SYSTEM. The Journal of African American History, 200-204.
Zubair, N. C., & Sanja, K. I. (n.d.). Police Misconduct: The Pakistani Paradigm. In The Contours of
Police Integrity (p. chapter 10). Sage books.

Journal of Business and Social Review in Emerging Economies Vol. 6, No 4, December 2020
1360
Journal of Business and Social Review in Emerging Economies Vol. 6, No 4, December 2020
1361
Volume and Issues Obtainable at Center for Sustainability Research and Consultancy
Journal of Business and Social Review in Emerging Economies ISSN: 2519-089X (E): 2519-0326
Volume 6: No. 4, December 2020
Journal homepage: www.publishing.globalcsrc.org/jbsee
Horrors of Class System: A Marxist Critique of Mansfield’s Doll’s House
1Sidra Ahmad, 2Selina Aziz, 3Salman Amin
1Department of English, Foundation University, Islamabad, Pakistan, [email protected] 2Department of English, Foundation University, Islamabad, Pakistan, [email protected]
3Department of Arts and Media, Foundation University, Islamabad, Pakistan, [email protected]
ARTICLE DETAILS ABSTRACT History Revised format: November 2020 Available Online: December 2020
The current paper talks about the horrors of the inescapable class
system that has us hooked blindly. The basic issue lies in the fact that
the society we live in and grow operates on the system of class
consciousness. The rich /bourgeoisie class uses and abuses the low or
poor class to attain maximum benefits from them, whereas the poor
or the proletariat have no choice except to be manipulated by the rich
class for the cost of labor, for they know that it is the only step
towards survival and it lies in manipulation. The rich class has
become totally dependent on the proletariat and they know they
cannot move without and out of it. As the society is designed and
planned on unequal footings so, on the one hand, the rich class has
found a medium to exploit the labor class but at the same time the
proletariat are not allowed to interact with them and furthermore
there are bleak chances of unification as the lower/labor class is itself
a stigma in the eyes of the bourgeoisie.
© 2020 Center for Sustainability Research and Consultancy Pakistan under
a Creative Commons Attribution-NonCommercial-ShareAlike 4.0
Keywords Bourgeoisie, Proletariat,
economic power,
commodification,
superstructure, ideology,
class consciousness,
dialectical and historical
materialism.
JEL Classification
M0, M1
Corresponding author’s email address: [email protected]
Recommended citation: Ahmad, S., Aziz., S. & Amin, S. (2020). Horrors of Class System: A Marxist
Critique of Mansfield’s Doll’s House. Journal of Business and Social Review in Emerging Economies,
6(4), 1361-1367
1. Introduction
Karl Marx is attributed to the formulation of his revolutionary theory which is termed as Marxism. Marx
was curious in knowing that how human beings are shaped and how relationships in the society formed.
According to Barry (1995), “The aim of Marxism is to bring about a classless society, based on the
common ownership of the means of production, distribution, and exchange” (p. 106). One class is
getting maximum benefits and enjoying all the facilities of life and is getting richer day by day while the
other class is deprived of all the basic needs and have to face continuous exploitation of the controllers.
As quoted by Barry (1995) “Marxism sees progress coming about through the struggle for power
between different social classes” (p. 108).
2. Statement of the Problem
It has become the order of the day to exploit the proletariat and attain maximum benefits from them as
they belonged to the suppressed strata of society. The proletariat are in the continuous struggle mode and
both of the antagonistic forces cannot get along with each other because of opposing interests.
3. Objectives

Journal of Business and Social Review in Emerging Economies Vol. 6, No 4, December 2020
1362
The main objective is:
1. To determine whether the bond of unification exists between the bourgeoisie and the proletariat.
4. Research Question
The question that will be explored in the analysis part is
Q. Can the bond of unification exist between the proletariat and bourgeoisie?
5. Literature Review Dr.L.Amutha in the article “Class Consciousness with reference to Katherine Mansfield’s The Doll’s
House” has talked about the class consciousness which complicates and upsets the balance of society.
According to Amutha the class in which a person is born becomes his permanent identity and it gets
really difficult for him to maintain his social prestige in society if he is born to a lower class. The
malpractices become evident from the character of Aunt Beryl as she contemplates the Kelvey sisters
not fit for sighting the dazzling and attractive things in life as they are the daughters of a washerwoman
and a jailbird so they are subject to hatred and victimization. As Amutha (2018) portrays the behavior of
Aunt Beryl by writing “ Her behavior clearly expressed that she viewed the Kelvey sisters as poor and
unworthy of viewing something as beautiful and expensive as the doll’s house” (p.14).
Sahin Kiziltas while writing about The Review of The Doll’s House by Katherine Mansfield through the
Philosophy of Louis Pierre Althusser states that it is only the prerogative of the governing body to
construct boundaries around the better sort and the excluded ones by means of ideological apparatuses.
Kiziltas (2014) quoted Althusser and states that “ …an ideology always exists in an apparatus and its
practice or practices. This existence is material” (p.128). The elites set the roles for the working class
and they are not allowed to break, reshape and navigate the roles. The ultimate destination of the
working class is to remain there where they are since ages because their identity is fixed and they cannot
climb the corporate ladder because of the social structures and the stereotyping of the society towards
them. The so-called high gentry of the society does not absorb the fact that the member of a working-
class can have beautiful articles/ items and is in the same position as that of the elites. They deny the
working class the right of intermingling with the rich class as has been witnessed and that because of
established ideologies. Aunt Beryl banned the Kelveys from communicating with the Burnell’s and
restrict them to enter their house and on the other hand the mother of Kelveys forbade them to fuse and
get along with the Burnells as she is very much well aware of her boundaries which exerts a negative
impact on the personalities of the Kelveys making them alienated, shaky and fearful from society.
Kiziltas tried to establish the fact that due to the undue and unreasonable burden and stress exerted on
the working class by the elites, the working class is bound to follow the philosophy of the governing
bodies. Kilitaz stated that
“The society takes the shape through the goals of the class” (136).
Altinay Ozan in his article “Althusser’s Ideological state apparatuses and literary criticism” suggests that
ideological state apparatus functions simultaneously with the repressive state apparatus. As Ozan states
about Althusser that for him, people are the by-product and commodity with no harmony and identity of
their own. Talking about Karl Marx, Altinay is of the view that for Marx the poor class is determined by
the bourgeoisie. Ozen quoted Althusser (1970) and writes in Ideological State Apparatuses and Literary
criticism that “superstructure is determined by the base” (p.1). For Althusser, there are other factors
besides superstructure and base and he gave the term “interpellation” for it. Ozen while reviewing
Althusser's perspective commented that every human /person is not a commodity but possesses their
own individuality and existence.
6. Methodology
The research would be a qualitative one. The text of the Doll’s House will be explored for content,
themes and context. It will be carried out with the help of books and material available on the internet.
Marxism would be the model of study. The paper is written to highlight the most pertinent fact that
domination and dictatorship of the capitalist lead to the conflict between the two opposing forces. Many
researchers have explored ideology, class consciousness and ideological apparatus, I will be analyzing
“The Doll’s House” in totality and loopholes in the economic system as viewed by Marx.

Journal of Business and Social Review in Emerging Economies Vol. 6, No 4, December 2020
1363
7. Analysis
It is true that the class struggle has been observed since time immemorial. The story, “The Doll’s House”
seems to be the reflection of Mansfield’s own life. Barry (1995) found “A writer’s social class and its
prevailing ideology (outlook, values, tacit, assumptions, half-realized allegiances, etc.) have a major
bearing on what is written by a member of that class (p. 107). She was born to a middle-class family at
the time when the class distinction was common and had a closer glimpse of that aura. Dobie (2012)
commented, “Named for the assumption that a text will reflect the society that has produced it” (p. 80).
Society is a social construct that can be shaped and reshaped by humans.Barry (1995) beautifully
explained such phenomenon by writing, “To Tennyson the Keatsian world of romance, to Browning the
Italian springtime; both are revolting backward, trying to escape from the contradiction of the class for
whom they speak” (p.105).
The Doll’s House, reflect the clear-cut division of two classes’ i-e between bourgeois and proletariat and
stressed the fact that all the bounties are for the elites. The text informs us about the children of two
classes, Burnells and Kelveys. The Burnells are the children of the upper class while the Kelveys
belonged to the lower strata of society which truly conveys the idea that the superstructures are the
parasite on base. They do the work for the elite class but still denied the basic needs and rights which is
the structured view of reality. The Burnell girls because they belonged to the upper class and due to their
social status are proud, show off and cruel. They are used to of the elegant life-style and fond of
glamorous items. Mansfield (2012) shares even the slightest of the details regarding the doll’s house and
writes, “There stood the doll’s house, a dark, oily, spinach green, picked out with bright yellow. It’s two
solid little chimneys glued on the roof, were painted red and white, and the door, gleaming with yellow
varnish, was like a little slab of toffee” (p.135).
It is rightly said that powerful people are occupying the sources of the universe. Karl Marx gave
importance to the socio-economic class. As Tyson (2006) found “Marxists analysis of human events and
productions focus on relationships among socioeconomic classes, both within a society and among
societies, and explain all human activities in terms of the distribution and dynamics of economic power”
(p. 54). As the upper class is privileged and can afford to buy things that the other people or the poor
people cannot even dream of. The gifts presented to the Burnells even are so gaudy and expensive
which is depicted in the story, where the doll’s house is opened and the children were amazed to see the
beauty of the doll’s house. Mansfield (2012) quoted “All the rooms were prepared. There were pictures
on the walls, painted on the paper, with gold frames complete. Red carpet covered all the floors except
the kitchen” (p. 136).
The story can be aptly rated as the story of the capitalistic society where the cruelties of the upper class
are exposed. The Burnells are believed to be active, superior, cultured, sensible and energetic while the
Kelveys are believed to be strange, dirty, lazy, uncultured and backward. Mansfield has made every
effort to show Kelveys as inferior or othered because they belonged to the working class. A rigid sort of
class distinction is seen where the working class is seen suffering because of the weak status. As Mary
Shelly pointed out in Frankenstein the attitude of the rich class and aptly described them as monsters.
The law of living requires and demands that if you want to interact with people, you need to be
belonging to the same class, otherwise you will be rejected. The same situation is faced by Kelveys as
they belonged to the lower class and could not have those attractions or the socioeconomic conditions
which the Burnells enjoy so they were rejected and out-casted by everybody. Nagarajan (2006)
highlights “People are divided primarily by their differences in socioeconomic conditions” (p. 225). It is
the requirement of surviving in the world full of the bourgeoisie, that if you want to compete with
somebody, you need to be in the same position. As the Kelveys were living below the poverty line so
they were bound to suffer and faced isolation in the school from everyone. Mansfield (2012) highlights
the situation of Kelveys by saying, “And the only two who stayed outside the ring were the two who
were always outside, the little Kelveys (p. 137).
The text indicates that power is based on wealth and material possessions. People in society are attracted
Journal of Business and Social Review in Emerging Economies Vol. 6, No 4, December 2020
1364
to wealth and material possessions. The wealthier or rich a person is, the more respect, he has in society.
People are impressed by outward appearances. If somebody has wealth and enjoying the facilities of life,
then he thinks that he is superior and undermines others. Burnells are enjoying such power because they
have been given a big doll’s house. It’s the doll’s house that makes the Burnell girls powerful and raises
their economic conditions. Nagarajan (2006) quoted “Economic power is behind all institutions”
(p.223). The doll’s house has become a reason for domination by the Burnell girls. The house is
responsible for creating the gap between the rich and the poor which can never be abridged. By showing
the doll’s house to other students or to other girls in their social circle, they can boast about their class
and wealth in front of the people. Dobie(2012) states “Those who control production have a power base;
they have many ways to ensure that they will maintain their position” (p.82). As economy functions as a
base which can be observed where the Burnell children could not resist telling others about their doll’s
house. Mansfield (2012) found “They burned to tell everybody, to describe, to…well…to boast about
their doll’s house before the school bell rang” (p. 136).
The commodification of things is observed, as Marx is of the view that it’s the attitude of things not for
the purpose of utilizing but to impress others. The Burnell girls are a victim of society’s emphasis on
significant value. They were always in a race to impress the people belonging to their class. They do this
in order to be get noticed by the people and to remain in limelight. The Burnell girls want to boast about
their economic and social standing in front of the other girls. They had to follow the norms of society in
order to exist in that social set up. The Doll’s House is the medium to show off their wealth and
ownership. They cannot live without doing this. The phrase “The girls of her class” is used by Mansfield
to highlight that the Burnells really belonged to the high social order. The Doll’s house was the focal
point of all eyes. Seldon, Widdowson, and Brooker (2005) pointed out “Human history will in some
sense determine the whole cultural life of the society” (p.83).
A sort of double marginalization is observed in the text. First of all, the Kelveys are poor and secondly,
they belonged to the lower strata of society so they are alienated from society which shows the unjust
ways of the world and society. As the Burnells belonged to the upper class so they think that everything
is made for them. They can enjoy all the luxuries because they are only made for them. The Burnells are
of the opinion that as they are born in the privileged class, so they deserved the best of everything and
the Kelveys because of their social status or position deserved to be outlawed and have no ownership of
anything. They will be controlled by the rich class. According to Karl Marx, it’s the elite or the upper
class that has become usurpers and blackmailers. The upper class in the text have their own circle and
shell and they only liked to interact with the girls who are from the capitalist background as that of them.
They do not like to intermingle with the lower class as they are forbidden and eventually, Mansfield
(2012) noticed that state and portrays in her short story as “The line had to be drawn somewhere. It was
drawn at the Kelveys (p. 137). According to Marx, it is not fate but the economic conditions that has
played a part to make them helpless, powerless and defenseless to enjoy the status as the Burnell’s were
enjoying.
Reading of the story indicates pride and prejudiced against the lower class. The Burnells took pride in
belonging to the upper class and owning a doll’s house. They are prejudiced towards Kelveys as they do
not belong to the same class. Seldon, Widdowson, and Brooker (2005) opined in the book “The material
interest of the dominated social class determines how people see human existence, individual and
collective” (p.62). From the text it can be easily noticed that the Kelveys are misrepresented. They are
believed to be the tabooed subject by everyone. They were thought of uncultured, spoilt and ill-
mannered.
It is true that the tools of production determine value. As written by Dobie (2012) “The moving force
behind human history is its economic systems, for people’s lives, are determined by their economic
circumstances (p.82). We can see in the story that the proletariat is repressed and oppressed by everyone.
Although these proletariat work for the bourgeoisie still they have to bear the contempt of the elites. The
bourgeoisie is dependent on proletariats and have their own material gains or benefits. They are forced
to work for the bourgeoisie but still are hated by the elites and treated as if they are not acceptable in

Journal of Business and Social Review in Emerging Economies Vol. 6, No 4, December 2020
1365
society. Dobie (2012) commented, “As they take on less attractive jobs to pay back what is owed, they
are even less acceptable in the corridors of wealth and power” (p.84).
The Marxist critics noticed some serious loopholes in the economic system. A harsh reality is observed
which is quoted by Mansfield (2012) in her short story as “The truth was that they were dressed “in bits”
given to her by the people for whom she worked” (p.137). The Kelveys were bound to wear the tits or
bits given to them by the people. The problem is that there is a socioeconomic gulf between haves and
have-nots that can never be abridged which proves Nagarajan’s (2006) concept of class struggle which
he has highlighted “History is a class struggle” (p.225). The Kelveys belonging to the proletariat were
stereotyped and had to face severe criticism from the elites and were badly tortured. They were given the
lesson by the bourgeoisie that they deserved to be oppressed and suppressed and had to face the
inequalities created by the capitalists. They were believed to be insignificant or mere dots having no
value. As Lena targets the Burnells which Mansfield (2012) quoted “Is it true you’re going to be a
servant when you grow up, Lil Kelvey” (p.138). The bourgeoisie thinks that as their parents have done
manual labor, the next generation would do the same which depicts that they in a way are snatching their
rights to progress. Dialectical materialism comes to play here and according to which people’s actions
and reactions are the results of the materialist society, they live in. Dobie (2012) writes, “An imbalance
of goods and power among people or manipulation of the worker by the bourgeoisie and will point out
the injustice of that society” (p.87). The working class is controlled by the elites. They are used and
misused by the people in their own ways with the result that the outcome of it leads to the naming of the
working class as the commodity for the bourgeoisie. As Barry (1995) explains “People become things”
(p.105). The proletariats have to suffer at each and every step and are exploited by the upper class badly
which results in alienation. They are alienated from society and the elites are usurping their chances of
survival. The circulation of money and hold of power remain in the hands of one class which leads to
classism and alienation in society. As the Kelvey girls belonged to the working class, they were
considered to be inferior and given a shut-up call by everybody. Mansfield (2012) quoted their situation
as “The Kelveys were shunned by everybody” (p.139).” Their economic conditions differentiate and
forced them to disconnect with society and suffer for nothing. Tyson (2006) writes, “The majority of the
global population who lived in substandard conditions and have always performed manual labor” (p.54).
Had the Kelvey sisters been enjoying the luxurious items and have no disgracing marks like that of
incompatible economic conditions, they would definitely be in a better position which means that it is
the game of socio-economic conditions. The more sound and financially stable you are and can afford
material possession, the more respectable and honorable you become in the eyes of people.
The society depicted in the text has taken all the chances and opportunities from the proletariats which
resulted in the unending sufferings especially when it comes to Kelveys. The goods and the wealth are
unevenly distributed between two strata of society which is a negative consequence and results in
repression of many. Aunt Beryl gets annoyed when Kezia tried to abridge the gulf between the rich and
the poor. Aunt Beryl could not stand this and seems to be burning with anger. Mansfield (2012) quoted
the situation “You are not allowed to talk to them” and “She stepped into the yard and shooed them out
as if they were chickens” (p.142). The bitter comments of Aunt Beryl are enough to identify the type of
society in which they were living where cruelty and snobbery are regarded as acceptable behavior. As
quoted by Selden, Widdowson, and Brooker (2005) “The proletariat and the working class are always
subjugated by the bourgeoisie. The rich control the resources, and the wealth of a nation” (p.225).
The ideology presented in society is that of powerful people. The exploitation of the upper class leads to
the formation of ideologies in society. According to Marxist critics like Selden, Widdowson and
Brooker (2005) found “Ideology in Marxism means a system of beliefs using which human beings make
sense of the world they live in” (p. 225). The text seems to be glamorizing the powerful people to show
their standing and place in society. The working class is strictly controlled by the bourgeoisie, giving
them the message that they are not free in any case. The text supports the values of capitalism that the
cruel controlling class or bourgeoisie is always there to rule over them. The Kelveys were the scapegoat
of the class distinction. They are described with animal images at every stage. They were not allowed to
live in the society in a respectable way with their heads high rather had to face public humiliation by the

Journal of Business and Social Review in Emerging Economies Vol. 6, No 4, December 2020
1366
elites. Dobie (2012) commented, “An ideology, dictated by the dominant class, functions to secure its
power” (p.86). They were called by animal images. Our Else was called little white owl which reflects
the social behavior of people and in a way, it also denotes that they are not welcomed in their social
scale. There are occasional associations when the animals are connected with the two Kelveys. Once
“Else” is compared with little “white owl” and another time, both are said to be “little two stray cats”
and Aunt Beryl treats, “Those little cats as if they were chickens” (Mansfield,2012, p. 139).
The Doll’s house represents the ideology of the bourgeoisie that the working class deserves the
luxurious items and the proletariats deserved to be oppressed. As Marx is of the opinion that powerful
people keep their positions in society and try to suppress and oppress the working class and believed that
they deserved oppression. The inside view of the Doll’s House determines that it is not at all to be used
by the proletariats, rather the rich (The Burnells) should have them because it matches their
personalities. Nagarajan (2006) explains, “life is not determined by consciousness but consciousness by
life” (p.223).
It is true that society has the potential to be treated equally and unified, though at the start of the story
we could see that the Doll’s house was freshly painted and giving a smell. The child narrator says, “And
perhaps the smell of paint could have gone off by the time it had to be taken in” and the smell of the
paint was quite enough to make anyone seriously ill. The smell of the paint basically reflects the sting or
the hatred of the bourgeoisie towards the proletariat. It also determines that the bourgeoisie are a misfit
in society that’s why they had to suffer alienation at the hands of modern society and don’t deserve to be
happy. As Nagarajan (2006) explains “The personality of man is represented as disintegrated; he is
shown to be solitary, asocial, and unable or unwillingly to enter into a happy communion with fellow
human beings” (p.227).
It’s the lamp and Kezia that tries to shake off all the inequalities. The lamp being a particular item
brought meaning to the story because due to the historic background these lamps were manufactured by
hardworking laborers and are purchased by wealthy, so the lamp represents the division between the
classes even though its beauty is appreciated no matter what social class you belonged. According to
Marx, these working proletariats are individuals who sell their labor power for wages and who do not
own the means of production and argues that they were responsible for creating the wealth of society but
ironically treated with contempt and disdain by society. The remark of “Our Else” at the end “I seen the
little lamp” (Mansfield,2012, p. 143). When the others kept reminding her of class status, Kezia insists
on her thought of equality to the prejudiced views of the members of her social class and by doing so she
is trying to break the social hierarchy of class inequalities. The innocent world of a child who does not
really understand the reasons and the deeper social meaning of all this stand opposite the rule-governed
the world of the adults. The lamp becomes the harbinger between Kezia and Our Else. The lamp is the
ray of hope between two classes so that they can be treated on equal grounds. The girls admired and
appreciated the innocent lamp which put both of them in the same situation and similar status which is a
direct hint or a hit on society that how it is unbalanced and dissimilar but it does have the unifying
power and characteristics. It is a social leveler. As quoted by Nagarajan (2006) “The power structures
can only be altered by the coming together of the proletariat, forgetting its division”(p.225).
8. Conclusion
Kezia says at the end of the story, “You can come and see our doll’s house if you want to,” and Lil
answered, “Your ma told our ma you wasn’t to speak to us.” It reflects social distinctions and unfairness
on the part of society where because of the status, the children are not allowed to talk to the higher class
or Burnells. They knew better than to come anywhere near the Burnells” (Mansfield, 2012, p. 137). It is
the ideology that promotes false consciousness. From the story, Mansfield tried to established that power
is based on wealth and material possessions. Society has the power to be unified but the bourgeoisie
never liked this to happen because if there is a concept of classless society then both will be judged on
equal grounds and this is not possible.
References
Journal of Business and Social Review in Emerging Economies Vol. 6, No 4, December 2020
1367
Amutha.L.(2018). Class Consciousness with reference to Mansfield’s Doll’s House. Language in
India,18:3, 12-17
Barry, Peter. (1995). Beginning Theory: An Introduction to Literary and Cultural Theory (2nd ed.).
Manchester, Uk: University Press
Bowens, Tyneisha.,Caroll, Ben., Dowell, Leilani., Everett, Elena., Fry, Julie.,… Strobino, Dante.
(1974). What is Marxism all about. New York: Worldview Forum
Dobiee, Ann. (2015). Theory into Practice: An Introduction to Literary Criticism (3rd ed.). Stanford, CT:
Cengage Learning
Gaunce, Julia., Mayr, Suzette., Lepan, Don., Mather, Majorie and Miller, Bryanne. (2012). The Broad
view Anthology of short Fiction (2nd ed.). Canada: Broadview Press
Kiziltaz, Sahin. (2014). The Review of the doll's House’ by Katherine Mansfield Through the philosophy
of Louis Althusser. Ataturk Universitiesi Sosyal Bilimler Engitusu Dergisi,18(2): 127-137
Lois, Tyson. (2006). Critical Theory Today: A User-Friendly Guide (2nd ed.). New York, London:
Routledge
Nagarajan, MS. (2006). English Literary Criticism and Theory: An Introductory History. India:
Longman Press
Ozen, Altinay. (1971). Althusser Ideological State Apparatuses Literary Criticism. London: 121-131
Selden, Widdowson, and Brooker (2005). A Reader’s Guide to Contemporary Literary Theory (5th ed.).
Great Britain, Uk: Longman Press
Shelly, Marry. (1989). Frankenstein. New York: UP

Journal of Business and Social Review in Emerging Economies Vol. 6, No 4, December 2020
1368

Journal of Business and Social Review in Emerging Economies Vol. 6, No 4, December 2020
1369
Volume and Issues Obtainable at Center for Sustainability Research and Consultancy
Journal of Business and Social Review in Emerging Economies ISSN: 2519-089X (E): 2519-0326
Volume 6: No. 4, December 2020
Journal homepage: www.publishing.globalcsrc.org/jbsee
The Assessment of Risk Management & Engineering Management Practices at
Project Planning Phase on Performance of Construction Projects
1Shahid Iqbal, 2M. Nabeel Ehtisham, 3Syed Farqaleet K. Bukhari, 4Shahid Mahmood
1Assistant Professor, Management Studies Department, Bahria University, Islamabad Campus, Pakistan,
[email protected] 2Managing Director, All Seasons Seed Corporation, Sahiwal, Pakistan, [email protected]
3MS (Project Management) student, Management Studies Department, Bahria University, Lahore
Campus, Pakistan, [email protected] 4Lecturer, Institute of Aviation studies, University of Management and Technology, Lahore, Pakistan,
ARTICLE DETAILS ABSTRACT History Revised format: November 2020 Available Online: December 2020
Project Risk management is known as an important workout for the
achievement of desired objectives for the construction projects.
Success in construction project is quantified by attaining its enactment
in terms of project quality, project cost, project time, project safety.
Construction projects in Pakistan, typically in the whole world have a
high risk of being pointedly late and over budget. However, a bit of
schedule and cost related risks are unavoidable in any construction
project around the world. It was found out that the engineers were
generally nominated earlier the design phase of any project. Due to
this reason maximum projects did not get the advantage from SMEs at
the planning stage of the project. This study also supports that project
managers who are engineers be involved in construction projects site
selection, in preliminary budget and schedule development by using
good Engineering Management Practices.
© 2020 Center for Sustainability Research and Consultancy Pakistan under a
Creative Commons Attribution-NonCommercial-ShareAlike 4.0
Keywords Project Risk Management;
Engineering Management,
Project Planning;
Construction Project Success
JEL Classification
M10, M11
Corresponding author’s email address: [email protected]
Recommended citation: Iqbal, S., Ehtisham, N., Bukhari, S. F. K. & Mahmood, S. (2020). The
Assessment of Risk Management & Engineering Management Practices at Project Planning Phase on
Performance of Construction Projects. Journal of Business and Social Review in Emerging Economies,
6(4), 1369-1378
1. Introduction
The motivation for this research is to have an in-depth analysis of a relationship between Risk
management and project Performance. Focused area of research was risk management at planning phase
and its overall effect on Construction Projects in Pakistan. A lot of work has already been done on the
field of risk management related to performance of construction projects. Mostly the managing risks on
construction projects is consider as part of project execution. But effect of Risk Management at
planning stage is yet the area in Pakistani construction projects which need more intensive research in
order to accomplish momentous performance. Due to the reason that the construction industry is one of
the fastest growing industry of Pakistan with rate of 12.1% & contributing 2.4% to the GDP of the
country [State Bank of Pakistan (SBP) 2018], so the risk management at planning stage should be
examined exploited to see the effect on project performance (Haider & Kayani, 2020). Therefore, there

Journal of Business and Social Review in Emerging Economies Vol. 6, No 4, December 2020
1370
is huge room of improvement and research gap is present to increase the performance of construction
projects by analyzing the effect of risk management at planning phase of projects in Pakistan. Planning
is actually vital part of a project concerning performance of project & project success (Ahsan et
al.,2020). It is a continuous and repeatable course throughout project life cycle. (Idoro, 2012). Previous
research recommended that the companies must expand the performance by keeping this core phase of
planning in mind (Lemma, 2014). Risk identification is an iterative process throughout the project
lifecycle that includes the project team, project stakeholders and senior management affected by or who
may affect the project outcome, and lastly external entities who can comment on the process of the risk
identification on the basis of their past experience (Wysocki, 2004). Early identification of risks at
planning phase or a tender of construction project and evaluating their comparative importance, the
project management may be improved to decrease the risks and allot them to the groups who are best
able to control them or engage them should they happen (Iqbal et al., 2020). Studies must be carried out
at initial phases in the project life cycle, earlier choices are made to remain with the project (Thompson
and Perry, 1992).
2. Literature Review
2.1 Project Risk Identification
Project Risk management is 01 of the 9th “knowledge areas” disseminated by the PMI - “Project
Management Institute”. PMBOK® Guide identifies the 09 “knowledge areas” distinctively for almost all
projects. Risk Management is a difficult/crucial feature of the project management.
Fig 1: Project Risk Management overview
The Management of risk in the construction project setting is a complete & systematic method for the
categorizing, scrutinizing and retorting to risks to accomplish the project aims & objectives (PMI, 2008;
ICE, 2005). Main choices and influence on the high-quality of preparation and choice of construction
should be complete at the initial phase of a project, Using the risk management and Engineering
Management Practices at this initial phase of the project is very imperative (Eskesen, Tengborg,
Kampmann, & Veicherts, 2004).
The risk inspection & Engineering Management methods have been defined by numerous authors
(Cretu, 2011; Chapman C, 2003; Ahmed, 2007, Klemetti, 2006; Smith NJ, 2006). The identification of
Risks contains the appreciation of likely risk event in the construction project & clarification of the risk
accountabilities (Wang, Dulaimi, & Aguria, 2004). To identify & restraint any project risks is so critical
phase in controlling of the efficacious projects (Iqbal et al., 2020). According to “Practice Standard for
Project Risk Management” (PMI,2009, p. 25) “risk cannot be succeeded except it is first renowned. So,
afterward risk management process targets to classify all the intelligible risks to project objectives,
though, it is very difficult to distinguish/find out all the risks at the start of a project”
2.2 Engineering Management Practices
The Engineering Management (EM) practices had been used all over the world from hundreds of years,
Though, the academics and construction industry had used the practices Engineering Management (EM)
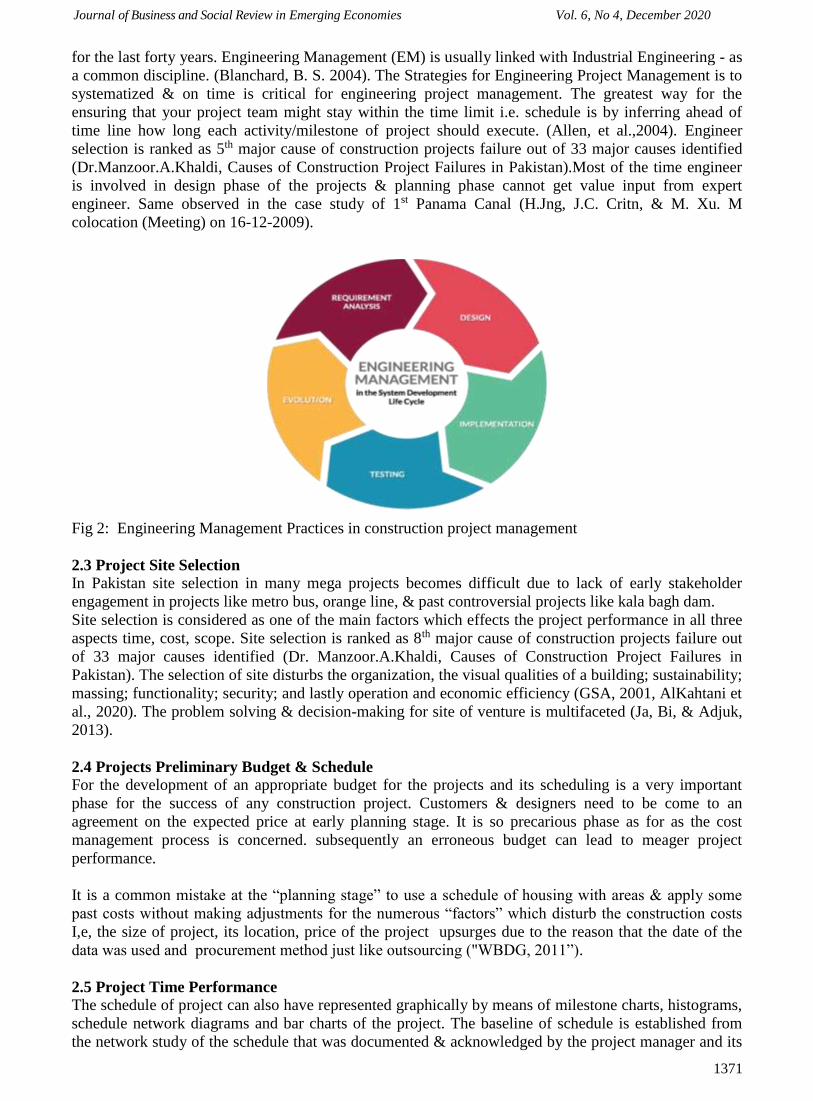
Journal of Business and Social Review in Emerging Economies Vol. 6, No 4, December 2020
1371
for the last forty years. Engineering Management (EM) is usually linked with Industrial Engineering - as
a common discipline. (Blanchard, B. S. 2004). The Strategies for Engineering Project Management is to
systematized & on time is critical for engineering project management. The greatest way for the
ensuring that your project team might stay within the time limit i.e. schedule is by inferring ahead of
time line how long each activity/milestone of project should execute. (Allen, et al.,2004). Engineer
selection is ranked as 5th major cause of construction projects failure out of 33 major causes identified
(Dr.Manzoor.A.Khaldi, Causes of Construction Project Failures in Pakistan).Most of the time engineer
is involved in design phase of the projects & planning phase cannot get value input from expert
engineer. Same observed in the case study of 1st Panama Canal (H.Jng, J.C. Critn, & M. Xu. M
colocation (Meeting) on 16-12-2009).
Fig 2: Engineering Management Practices in construction project management
2.3 Project Site Selection
In Pakistan site selection in many mega projects becomes difficult due to lack of early stakeholder
engagement in projects like metro bus, orange line, & past controversial projects like kala bagh dam.
Site selection is considered as one of the main factors which effects the project performance in all three
aspects time, cost, scope. Site selection is ranked as 8th major cause of construction projects failure out
of 33 major causes identified (Dr. Manzoor.A.Khaldi, Causes of Construction Project Failures in
Pakistan). The selection of site disturbs the organization, the visual qualities of a building; sustainability;
massing; functionality; security; and lastly operation and economic efficiency (GSA, 2001, AlKahtani et
al., 2020). The problem solving & decision-making for site of venture is multifaceted (Ja, Bi, & Adjuk,
2013).
2.4 Projects Preliminary Budget & Schedule
For the development of an appropriate budget for the projects and its scheduling is a very important
phase for the success of any construction project. Customers & designers need to be come to an
agreement on the expected price at early planning stage. It is so precarious phase as for as the cost
management process is concerned. subsequently an erroneous budget can lead to meager project
performance.
It is a common mistake at the “planning stage” to use a schedule of housing with areas & apply some
past costs without making adjustments for the numerous “factors” which disturb the construction costs
I,e, the size of project, its location, price of the project upsurges due to the reason that the date of the
data was used and procurement method just like outsourcing ("WBDG, 2011”).
2.5 Project Time Performance
The schedule of project can also have represented graphically by means of milestone charts, histograms,
schedule network diagrams and bar charts of the project. The baseline of schedule is established from
the network study of the schedule that was documented & acknowledged by the project manager and its

Journal of Business and Social Review in Emerging Economies Vol. 6, No 4, December 2020
1372
team as the baseline with start dates and end dates. The baseline is an important component in
controlling and managing schedule.
The performance is assessed using techniques such as “SV - schedule variance”, “SPI- schedule
performance index” & EVM - earned value management These methods support to weigh the degree of
“SV - schedule variance”. The “CCM critical chain method” associates the sum of buffer outstanding to
the amount of buffer needed to protect the delivery date (PMI, 2008).
2.6 Project Cost Performance
“Cost is very significant factors of a project success throughout the life cycle of project management”
(Azhar et al., 2008). Gido & Clements (2003) stated cost as the most important parameter in project
management and widely accepted in industry and literature. Earned Value Analysis (EVA) is used to
analyze the cost performance of projects.
The task spending which originates from the arranging cycle must be practical, feasible, and developed
on authoritatively arranged expenses and articulation of work. The financial backing ought to
incorporate best gauges, chronicled expenses or modern designing measures as premise. The budget
must recognize planned necessities of manpower, “MR - management reserve”.
Execution results measures are quantitative dimensions & include such things as, working cost, working
amount, working nature and time-to-finish (Kerzner, 2009). It can be very easy or very complex when
monitoring the project cost. In project management, one should also study the desires of all project
stakeholders related to cost of project (Gido antd Clements, 2003).
Execution results measures are quantitative dimensions & include such things as, working cost, working
amount, working nature and time-to-finish (Kerzner, 2009).
Figure 3: Research Model
H1: Project Risk identification at project planning phase is (+ive) positively related with
Project success.
H2: Engineer Management Practices are (+ive) positivity associated with Project Success.
H3: Project Site Selection is (+ive) positivity associated with Project success.
H4: Project Preliminary Budget and Schedule is (+ive) positivity associated with Project
success.
3. Research Methodology
The proposed study is design to get opinions from project managers, consulting engineers, architects,
quantity surveyors & contractors with respect to project risk management and schedule and cost
performance in project planning phase. In order to collect primary data questionnaire was adapted.
Online survey was used out of various available approaches to collect data for the research study. Online
questionnaire was distributed to the respondents through Email and WhatsApp. A survey method has
Project Risk Identification
Project Performance
Time
Cost
Engineering Management
Practices
Project Site Selection
Projects Preliminary
Budget & Schedule

Journal of Business and Social Review in Emerging Economies Vol. 6, No 4, December 2020
1373
been used extensively prior as well, so the respondents are comfortable in answering survey questions.
All responses are collected through online questionnaire as respondents were uneasy to fill the hardcopy
of the questionnaire.
3.1. Population
The population of the research study consist of registered engineers, project managers and professionals
related to construction industry in Pakistan. The key clients in construction industry are Water and
Power Development Authority of Pakistan (WAPDA), Planning and Development (P&D) Punjab,
Sindh, KPK, Baluchistan, Azad Jammu Kashmir & Gilgit Baltistan (AJ&K, GB) and Irrigation
Department of Pakistan. The main contractors working in construction industry of Pakistan are Descon
Engineering ltd, Banu Mukhtar Contracting ltd, Frontier Works Organization and many more. The main
consultants in construction industry of Pakistan are Descon Engineering ltd, SMEC Pakistan, Pakistan
Engineering Services (PES), Mott MacDonald Pakistan (MMP). The regularity authorities are Public
Procurement Regulatory Authority PPRA, Provisional Government Regulatory Authorities.
The sampling frame consist of engineers/ architects, project managers, and senior managers working at
mega construction projects. The targeted population for sampling of data involves client, contractor and
consultant of the following Projects Gulpur Hydro Power Project (AJ&K), Kurram Tangi Multi-Purpose
Dam (KPK), Guddu Barrage (Punjab). Karot Dam Project (AJ&K), Wind Farm (Sindh) Six to Twelve
Mega Projects of Pakistan’s Construction Industry.
3.2. Place of Study
The research study was conducted on five to ten mega construction projects of Pakistan. Almost one
mega project from each region of the country.
3.3. Sample Size
Hair et. al. (2006)” the choice of sample size is representing of your target respondents effectively as it
is difficult for the researcher to get the sample from whole population”. Some researchers think that
sample size should not be very small or very large and should be within suitable range of 100 to 200
samples for proper data analysis. Green (1991)” sample size may be identified from the number of
independent variables used in the research study”. Cohen (1968) says that “larger is better”. “Some of
the researchers have developed the rule of thumb for selecting 10-15 samples collection for each
independent variable” (Field 2012). So therefore, a sample size of 5 to 10 mega construction projects
with overall 200 samples was proposed for the research study. A total of 215 responses were received
with 100% background from construction industry.
3.4. Data Collection Tool
Survey technique was adopted for the collection of data. Questionnaire was made accessible in hard
printed formatted as well as electronically for respondent convenience. Instruction regarding the
questionnaire were mentioned on it to remove any ambiguity. The questionnaire did not contain identity,
personal contact information, information related to company confidentiality so that the research
respondents do not feel hesitation to fill the online questionnaire.
3.5. Data Processing and Analysis
Analysis is a collaborative process by which answers are studied to see whether the results are related to
each research question (Backstrom & Hursh-Cesar, 1981). Data Analysis is a technique of gathering,
converting, validating, and modeling the data with purpose of determining the required information. The
results so acquired are communicated, proposing conclusions, and supporting decision-making.
Quantitative analysis of data contains the calculation of frequencies of variables and variances between
variables. A quantitative approach is usually related with discovering evidence to either accept or reject
the hypotheses we have framed at the former phase of our research process. Statistical Package for
Social Sciences (SPSS) was used to perform quantitative statistical analysis for questionnaire.
Regression and correlation tests were performed to examine the connection between the independent and
dependent variables involved in the research study.

Journal of Business and Social Review in Emerging Economies Vol. 6, No 4, December 2020
1374
A Sample size of 6 to 12 mega construction projects with overall 250 samples was proposed for the
research study. A total of 215 valid responses were received with 100% background from construction
industry as shown in the table below: Response Table (a) Stats
N Valid 215
Missing 0
3.6. Data Analysis Technique
The method of data analysis includes gathering of the data, its arrangement, descriptive statistics,
frequency statistics and analysis of respondent’s demographics, calculating reliability measures, and
performing the correlation. SPSS was used for the analysis. Hypotheses were verified and tested by
applying regression and correlation analysis.
3.7. Project Risk Identification and Project Performance
The below given data indicates that “Project Risk Identification: was a good independent variable for
Project Performance. In this analysis where variable “Project Risk Identification” is independent variable
and dependent variable is “Project Performance”, the value of adjusted R square is (.174) which shows
the fitness of this model. β value is (.425) which implies that 49.4% of variations occur in the dependent
variable due to 1% change in the independent variable. The “F” Value (30.606) shows that the
hypothesis is acceptable because the value of “T” is greater than “2” which is 4. 528. Model is fit
because significance value is 0.00 which shows the significant relationship of both variable i.e.
Independent variable and dependent variable. β value is also in permissible range. So, the model is an
excellent depiction of result. Hence, therefore hypothesis H1 is accepted.
Mod Summary(RI)
Mod (R) (R) Squr. Adjusted R Squr.
Std. Error of the
Estim.
1 .425a .178 .167 2.95322
a. Predic: (Const), RI
3.8. Engineering Management Practices
shows the results of reliability test, which shows the value of Cronbach’s (α) .763 for the no of items 13
used, which is in threshold limit and validates that the data is reliable. Table highlights the descriptive
Statistics of engineer/architect selection (EAS), as shown in the table engineer/architect selection
achieved mathematical mean of 3.9013 and standard deviation of .49765. Skewness and kurtosis are also
in permissible range.
Mod Sum of Squr. df Mean Squr. F Sig.
1 Reg 176.730 1 177.730 20.505 .000b
Resi 868.108 249 8.668
Total 1055.691 250
a. Depend Vari: PRJPER
b. Predic: (Const), RI
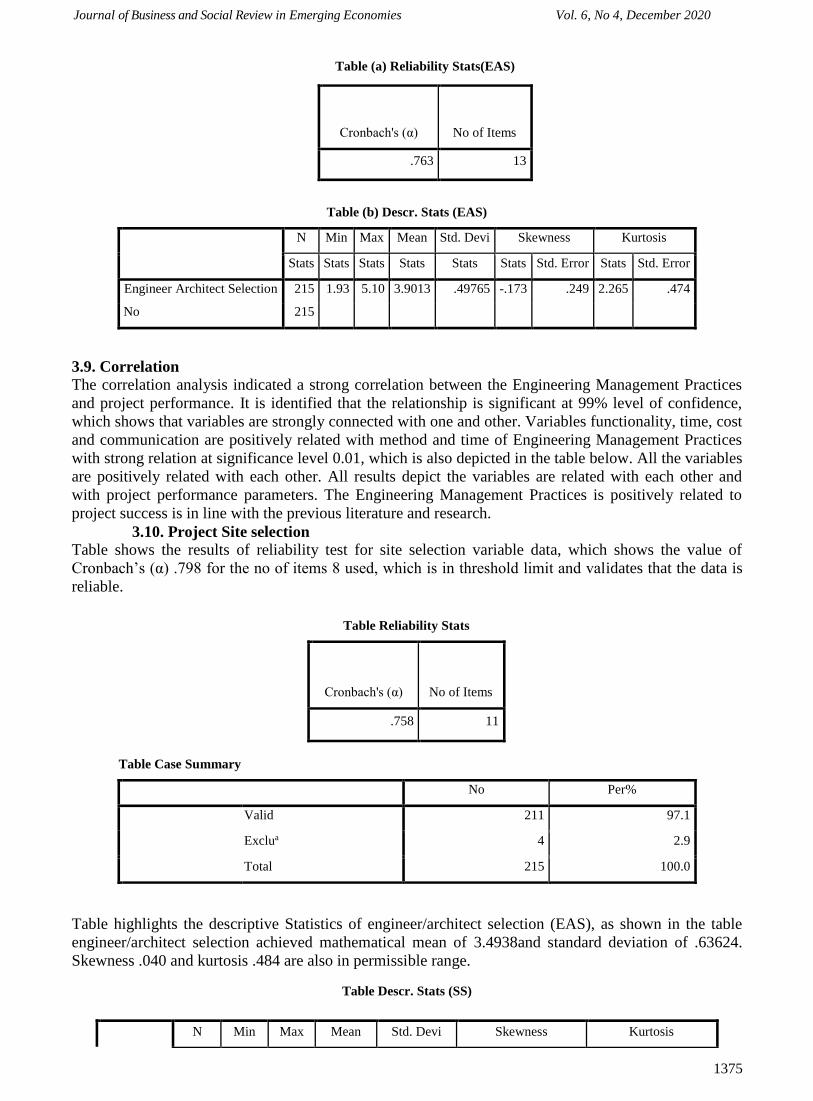
Journal of Business and Social Review in Emerging Economies Vol. 6, No 4, December 2020
1375
Table (b) Descr. Stats (EAS)
N Min Max Mean Std. Devi Skewness Kurtosis
Stats Stats Stats Stats Stats Stats Std. Error Stats Std. Error
Engineer Architect Selection 215 1.93 5.10 3.9013 .49765 -.173 .249 2.265 .474
No 215
3.9. Correlation
The correlation analysis indicated a strong correlation between the Engineering Management Practices
and project performance. It is identified that the relationship is significant at 99% level of confidence,
which shows that variables are strongly connected with one and other. Variables functionality, time, cost
and communication are positively related with method and time of Engineering Management Practices
with strong relation at significance level 0.01, which is also depicted in the table below. All the variables
are positively related with each other. All results depict the variables are related with each other and
with project performance parameters. The Engineering Management Practices is positively related to
project success is in line with the previous literature and research.
3.10. Project Site selection
Table shows the results of reliability test for site selection variable data, which shows the value of
Cronbach’s (α) .798 for the no of items 8 used, which is in threshold limit and validates that the data is
reliable.
Table Case Summary
No Per%
Valid 211 97.1
Exclua 4 2.9
Total 215 100.0
Table highlights the descriptive Statistics of engineer/architect selection (EAS), as shown in the table
engineer/architect selection achieved mathematical mean of 3.4938and standard deviation of .63624.
Skewness .040 and kurtosis .484 are also in permissible range.
Table Descr. Stats (SS)
N Min Max Mean Std. Devi Skewness Kurtosis
Table (a) Reliability Stats(EAS)
Cronbach's (α) No of Items
.763 13
Table Reliability Stats
Cronbach's (α) No of Items
.758 11
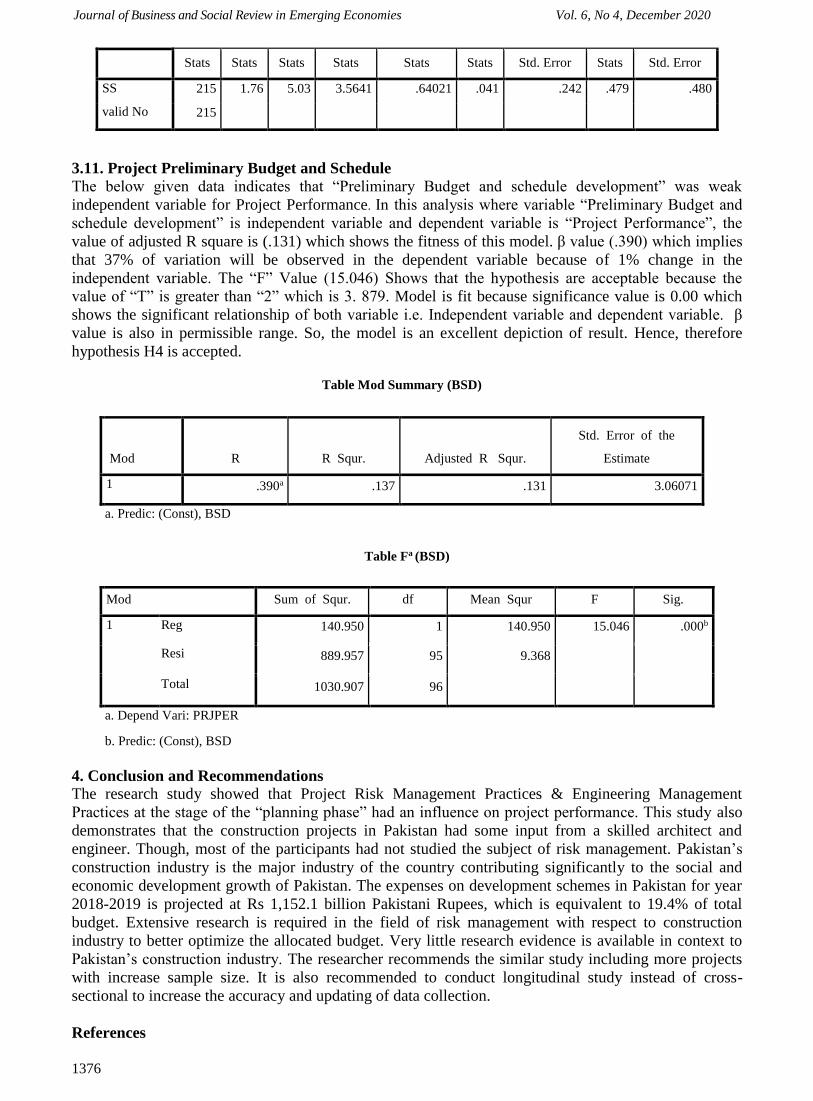
Journal of Business and Social Review in Emerging Economies Vol. 6, No 4, December 2020
1376
Stats Stats Stats Stats Stats Stats Std. Error Stats Std. Error
SS 215 1.76 5.03 3.5641 .64021 .041 .242 .479 .480
valid No 215
3.11. Project Preliminary Budget and Schedule
The below given data indicates that “Preliminary Budget and schedule development” was weak
independent variable for Project Performance. In this analysis where variable “Preliminary Budget and
schedule development” is independent variable and dependent variable is “Project Performance”, the
value of adjusted R square is (.131) which shows the fitness of this model. β value (.390) which implies
that 37% of variation will be observed in the dependent variable because of 1% change in the
independent variable. The “F” Value (15.046) Shows that the hypothesis are acceptable because the
value of “T” is greater than “2” which is 3. 879. Model is fit because significance value is 0.00 which
shows the significant relationship of both variable i.e. Independent variable and dependent variable. β
value is also in permissible range. So, the model is an excellent depiction of result. Hence, therefore
hypothesis H4 is accepted.
Table Mod Summary (BSD)
Mod R R Squr. Adjusted R Squr.
Std. Error of the
Estimate
1 .390a .137 .131 3.06071
a. Predic: (Const), BSD
Table Fa (BSD)
Mod Sum of Squr. df Mean Squr F Sig.
1 Reg 140.950 1 140.950 15.046 .000b
Resi 889.957 95 9.368
Total 1030.907 96
a. Depend Vari: PRJPER
b. Predic: (Const), BSD
4. Conclusion and Recommendations
The research study showed that Project Risk Management Practices & Engineering Management
Practices at the stage of the “planning phase” had an influence on project performance. This study also
demonstrates that the construction projects in Pakistan had some input from a skilled architect and
engineer. Though, most of the participants had not studied the subject of risk management. Pakistan’s
construction industry is the major industry of the country contributing significantly to the social and
economic development growth of Pakistan. The expenses on development schemes in Pakistan for year
2018-2019 is projected at Rs 1,152.1 billion Pakistani Rupees, which is equivalent to 19.4% of total
budget. Extensive research is required in the field of risk management with respect to construction
industry to better optimize the allocated budget. Very little research evidence is available in context to
Pakistan’s construction industry. The researcher recommends the similar study including more projects
with increase sample size. It is also recommended to conduct longitudinal study instead of cross-
sectional to increase the accuracy and updating of data collection.
References
Journal of Business and Social Review in Emerging Economies Vol. 6, No 4, December 2020
1377
Ahmed, A., Kayis, B., & Amornsawadwatana, S. (2007). A review of techniques for risk management in
projects. Benchmark International Journal, 14(1), 22-36
Ahsan, Z., Haider, S. A., Kayani, U. N., & Nawaz, S (2020). Impact of Ambidextrous Leadership on
Project Success with the Mediating Role of Innovation and Moderating Role of Self-Efficacy.
Abasyn Journal of Social Sciences. 13(1).
AlKahtani, N., Iqbal, S., Sohail, M., Sheraz, F., Jahan, S., Anwar, B., & Haider, S. (2020). Impact of
employee empowerment on organizational commitment through job satisfaction in four and five
stars hotel industry. Management Science Letters, 11(3),
Allen, T. J., & Sosa, M. L. (2004). 50 years of engineering management through the lens of the IEEE
transactions. Transactions on Engineering Management, 51(4), 391 395.
Assaf, S., & Al-Hejji, S. (2006). Causes of delay in large construction projects. International Journal of
Project Management, 24(4), 349-357. Retrieved from Central Development Working Party
(CDWP,2018)
Blanchard, B. S. (2004). System Engineering Management. John Wiley & Sons
Choge, K. J., & Muturi, W. M. (2014). Factors affecting adherence to cost estimates: A survey of
construction projects of Kenya National Highways Authority. International Journal of Social
Sciences and Entrepreneurship, 1, 689-705.
Dvir, D., Raz, T., & Shenhar, A. J. (2003). An empirical analysis of the relationship between project
planning and project success. International journal of project management, 21(2), 89-95.
Eskesen, S. D., Tengborg, P., Kampmann, J., & Veicherts, T. H. (2004). Guidelines for tunnelling risk
management, International Tunnelling Association (19(3)).
Fageha, M. K., & Aibinu, A. A. (2014). A Procedure for Involving Stakeholders when Measuring
ProjectScope Definition Completeness at Pre-project Planning Stage. AIPM NATIONAL 2014
CONFERENCE PROCEEDINGS, 1-8. Retrieved from
Flanagan, R., Norman, G., & Chapman, R. (2006). Risk management and construction (2nd ed.). Oxford:
Blackwell Publisher
Gitau lm, 2015.the effects of risk management at project planning phase on performance of construction
projects in rawanda. A dissertation of MS thesis.
GSA (2001). The Site Selection Guide (1st ed.). Washington DC: AIA.
Haider, S. A., & Kayani, U. N. (2020). The impact of customer knowledge management capability on
project performance-mediating role of strategic agility. Journal of Knowledge Management.
https://doi.org/10.1108/JKM-01-2020-0026
Hyunju Jeong, John C. Crittenden, and Ming Xu Messner Meeting on Dec 16, 2009. Panama Canal case
study.
ICE (2005). RAMP - Risk Analysis and Management for Projects: A Strategic Framework for Managing
Project Risk and its Financial Implications (2nd ed.). London: Thomas Telford Publishing
Idoro, G. (2012). Evaluating levels of project planning and their effects on performance in the Nigerian
construction industry. Construction Economics and Building, 9(2), 39-50
Iqbal, S., Bukhari, S. F. K., Riaz, A. R., & Haider, S. A. (2020). Assessment of Sustainable Competitive
Advantages and Influences through Project Management Practices of Construction Industry of
Pakistan. Journal of Business and Social Review in Emerging Economies, 6(3), 1199-1209.
Iqbal, S., Rehman, K., Asghar, W., & Haider, S. A. (2020). Comparative Analysis of Effective Project
Governance Practices and Benefit Realization Management for the Successful Execution of
Projects in NGO Industry. Journal of Accounting and Finance in Emerging Economies, 6(4).
Kaplan, S. (1997). The words of risk analysis. Risk Analysis (17), pp. 407-417.
Kerzner, H. (2009). Project Management: A systems approach to planning, scheduling, and controlling
(10th ed.). New Jersy: John Wiley and Sons.
Lemma, T. (2014). The role of project planning on project performance in Ethiopia. A Dissertation of
MA Thesis.
Morris, P., & Hough, G. H. (1988).The Anatomy of Major Projects: A Study of the Reality of Project
Management (1st ed.). New York: Wiley
Murphy, D. C., Baker, B. N., & Fisher, D. (1974). Determinants of project success, Grant No. NGR 22-
003-028 for National Aeronautics and Space Administration, Management Institute, School of
Management, Boston College, Boston, MA

Journal of Business and Social Review in Emerging Economies Vol. 6, No 4, December 2020
1378
Olwale, Y. A., & Sung, M. (2010). Inhibiting factors and mitigating measures in practice.Construction
Management and Economics,28, 509-526.
Parker, D., & Mobey, A. (2004). Action research to explore perceptions of risk in project management.
International Journal of Productivity and Performance Management, 53(1), 18-32.
PMI (2018). Project Management Body of Knowledge (PMBOK Guide) (6th ed.) Pennsylvania, USA:
Project Management Institute In
Raz, T., & Michael, E. (2001). Use and benefits of tools for project risk management. International
journal of project management, 19(1), 9-17.
Regulation, 2010 for Procurement of Consultancy Services. State Bank of Pakistan (SBP) 2018, third
quarterly report.
Wallace, P., & Blumkin, M. (2007). Major Construction Projects: Improving Governance and Managing
Risks. Retrieved from www.deloitte.com
Wang, S. Q., Dulaimi, M. F., & Aguria, M. Y. (2004). Risk Management Framework for Construction
Projects in Developing Countries. Construction Management Economi cs, 22(3), 237-252.
WAPDA Progress report, 2018 http://www.wapda.gov.pk/index.php/projects/hydro-power/under-
construction/kurram-tangi-dam
Zhang, H. (2007). A redefinition of the project risk process: Using vulnerability to open up the event-
consequence link. International journal of project management, 25(7), 694- 701.
Zhou, P. X., Zhang, G. M., & Wang, J. (2007). Understanding the Key Risks in Construction Projects in
China. International Journal of Project Management, 25, 601-614.
Journal of Business and Social Review in Emerging Economies Vol. 6, No 4, December 2020
1379
Volume and Issues Obtainable at Center for Sustainability Research and Consultancy
Journal of Business and Social Review in Emerging Economies ISSN: 2519-089X (E): 2519-0326
Volume 6: No. 4, December 2020
Journal homepage: www.publishing.globalcsrc.org/jbsee
Pre and Post Covid-19 Lockdown: How the Aqi of Three Major Cities of Pakistan
will Change? Ume Laila1, Najma Sadiq2, Tahir Mehmood3, Tooba Rehan Haqqi4
1Assistant Professor, Government & Public Policy, School of Social Sciences and Humanities (S3H),
National University of Sciences and Technology (NUST), H-12 Sector, Islamabad, Pakistan,
[email protected] 2Assistant Professor, Head of the Department, Department of Mass Communication, School of Social
Sciences and Humanities (S3H), National University of Sciences and Technology (NUST), Islamabad,
Pakistan, [email protected] 3Assistant Professor, Department of Communication studies, BahaUddin Zakariya University, Multan,
Pakistan, [email protected] 4 Graduate Public Administration, Department of Government & Public Policy, National University of
Sciences and Technology (NUST), H-12 Sector, Islamabad, Pakistan, [email protected]
ARTICLE DETAILS ABSTRACT History Revised format: November 2020 Available Online: December 2020
Pakistan being in the list of developing countries has shown
tremendous response towards the control of pandemic COVID-19.
This paper evaluates the pre and post COVID 19 lockdown situation of
air quality and provides an evidence of the air quality amid the
lockdown and how it started to improve. The air quality indexes of
three major cities of Pakistan i.e. Karachi, Islamabad and Lahore are
compared, taking into account the indexes before and after the
imposition of lockdown. The city wide presence of major pollutants
like Sulphur Dioxide and Nitrogen Dioxide also reduced. The results
show how taking serious measures can help in reducing the air
pollution and help the environment to restore. Following analytical
approach and situational analysis certain inferences have been drawn
that the air quality index has worsen, and the atmospheric condition
have turn out to be shoddier than the pre-pandemic situation. In the
last section certain policy recommendations have been provided in
order to maintain a healthy air quality.
© 2020 Center for Sustainability Research and Consultancy Pakistan under a
Creative Commons Attribution-NonCommercial-ShareAlike 4.0
Keywords COVID-19 Lockdown, Air
Pollution, Air Quality Index,
Karachi AQI, Islamabad AQI,
Lahore AQI
JEL Classification
M0, M12
Corresponding author’s email address: [email protected]
Recommended citation: Laila., U., Sadiq, N., Mehmood, T. & Haqqi, T. R. (2020). Police Brutality
and Reforms in Pakistan. Journal of Business and Social Review in Emerging Economies, 6(4), 1379-
1389
1. Introduction
The new year 2020 came along with Global Health Emergency due to the Covid-19 (coronavirus)
pandemic. With the reckless spread of the virus, countries started to observe lockdowns, and obviously,
Pakistan also had to do so. Starting from Karachi in late February the major cities like Islamabad,
Lahore Peshawer, etc imposed curfews and lockdowns. With this decision, nearly all production houses
were shut down, air transport was restricted, the commercial sector dumped, people started to work and
Journal of Business and Social Review in Emerging Economies Vol. 6, No 4, December 2020
1380
school from home which meant no traffic on roads. The environmental revamping has become a by-
product of this pandemic and the major component of this is the improving air quality index of a
country like Pakistan, the catalog of which had fallen to hazardous levels (Pakistan Air Quality Index
and Air Pollution Information, 2020). The case of improvement is not only in Pakistan but all over the
world. This study shall keep in focus the three main cities of Pakistan which happen to be the busiest
and the most polluted cities of Pakistan. The research shall focus on the comparison of pre and post
AQIs of the three cities.
2. Literature Review
Various authors have tried to investigate how lockdowns due to COVID have impacted the
environmental conditions of either the specific area or the impact is worldwide. Saeida, Deepak and
Mustansar have explained in their article, Environmental Perspective of COVID-19, that due to the
reduced economic activities the condition of water and air is improving day by day. Quoting directly
from the article, the authors have used the following words to explain the situation prevalent around the
world "All over the world, flights have been canceled and transport systems have been closed. Overall,
the economic activities have been stopped and stock markets dropped along with the falling carbon
emission. However, the lockdown of the COVID-19 pandemic caused the air quality in many cities
across the globe to improve and drop in water pollutions in some parts of the world" (Saeida, Deepak, &
Mustansar, 2020) . Not only this Rui and Acheng in their article "Does Lockdown reduces Air
Pollution?" have discussed the atmospheric condition of 44 cities in Northern China. They claim that
due to the travel restrictions imposed the concentration of pollutant gases has declined by 24%
(maximum). Apart from this other factor which proved beneficial for atmospheric restructuring include
less human mobility and reduced consumption and production. After careful analysis, the study revealed
that the Air Quality Index of Northern China decreased by 7.80% during the lockdown period (Rui &
Acheng, 2020) . In a separate article named “Air Quality Change In Seoul, South Korea Under Covid-19
Social Distancing: Focusing On PM2.5” by Beom-Soon Han and others, have augmented the reduction
of PM2.5 particles and other air pollutants within 30-day time period. They have compared these results
with that of 5-yreared data and concluded that social distancing has contributed in reducing the long-
range pollutants transmission (Han, et al., 2020) . Chang and Gong have discussed the Air Quality
variation in different regions. In the article “ Air Quality Variation in Wuhan, Daegu, and Tokyo during
the Explosive Outbreak of COVID-19 and Its Health Effects” have iterated the positive effects due to
the pandemic. The have proclaimed that the air quality of these three places have improved by analyzing
the health conditions of 10-year old children, which is evidential from the fact that the time period of
allergic airway infection in children has increased, meaning now it takes a lot of time to reach to the
acute level (Ma & Kang, 2020) . If at one point COVID 19 has had negative implications on the
humanity it has for sure created some positive impacts for the mother nature. Considering the
atmospheric conditions of India alone it has been observed that the atmosphere has revived due to the
restricted human activities and reduced emissions (lShubham, Jingsi, Hongliang, & Sri, August 2020)
(Jain & Tanya, 2020) (Kumari, 2020) . European countries began to monitor the NOx composition over
the region and found out vast difference of concentration of nitrogen oxides in atmosphere during
lockdown and without lockdown (Menut, Bessagnet, & Siour, Nov 2020) . Similarly, Spain and
Barcelona carried out the largest experiment of time during the covid lockdown and experienced 75%
reduction of pollutants in the environment which resultantly has improved the AQI of the two cities
(Baldasano, Nov 2020).
2. Methods
2.1 Location Description
Islamabad is the capital of Pakistan and is the federally administrated capital. It is the 9th largest city
and has a population of around 3.1 million. It covers an area of 906.5 km2 and has a humid subtropical
climate with five seasons and heavy rainfalls. Islamabad is the port for immense air traffic and normal
road traffic (Pak, 2017).
Karachi the largest city of Pakistan is the capital of Sindh province. It is a cosmopolitan city covering an
area of 3780 km2 and has a total of 1.4 million population. It is the coastline of Pakistan and has hot

Journal of Business and Social Review in Emerging Economies Vol. 6, No 4, December 2020
1381
desert climate and receives little to no rainfall. The Jinnah Intl. Airport Karachi is the busiest airport and
receives a total of 7.2 million passengers. same is the situation of the road network, where thousands of
vehicles remain on the road and thus creating traffic problems (Gov, 2016) .
Lastly, Lahore, the Metropolitan city of Pakistan is the capital of Punjab province and is the 2nd largest
city after Karachi. Lahore covers an area of 1772 km2 with 1.1 million population and has a semi-arid
climate with heavy rainfalls and thunderstorms. the city of Lahore receives average rate of air and road
transport, and is a home for most of the VIP flights (GOV, 2014).
3. Results and Discussion
3.1 Pre Covid Air Quality Index
Air Quality Index tells the number of intoxicants present in the air and how to fit or unfit is the air to
breathe. According to WHO, nearly 4.2 million people around the globe lose their lives due to inhalation
of unhealthy air and in the past 1 year Pakistan has recorded 2000 deaths due to lungs disease which the
people contracted by inhaling unhealthy air (Global Health Observatory Data, 2020). Talking about the
situation of Air Quality Index December 2019 (US Consulate Air Pollution Pakistan, 2019-2020) of
three major cities of Pakistan i.e. Islamabad, Karachi, and Lahore, when every sector was working at an
optimal level the maximum and minimum levels of Air Quality Index were as follows:
CITY Islamabad Lahore Karachi
MINIMUM INDEX 78
MODERATE LEVEL
171
UNHEALTHY LEVEL
102
UNHEALTHY LEVEL
MAXIMUM INDEX 213
VERY UNHEALTHY
LEVEL
478
HAZARDOUS LEVEL
210
VERY UNHEALTHY
LEVEL
Table 1: Air Quality Index of Islamabad, Lahore, Karachi December 2019 (Source: Real-Time Air Quality Index)
The above table clearly shows how bad was the air condition in December 2019, the index reaching the
hazardous levels. But the situation did begin to improve after the lockdown was imposed. The indexes
dropped drastically, and the Quality of Air began to improve. The level of air pollutants in the
atmosphere began to decline as no more factories were emitting hazardous SO2, neither the aircraft and
vehicles were combusting their fuels and producing NO2 and other sources of carbon footprints were
minimized. This improvement was traced by the real-time satellites. According to the Real-Time Index,
the air quality of the cities Islamabad, Lahore, and Karachi has improved in April and May, when the
lockdown was at the peak point. For simplicity of this graph maximum values of PM 2.5 have been
taken, which reveals a sharp improvement in the air Quality Index. Furthermore, it should be noted that
before the lockdown, the unhealthy levels of Air Quality used to remain for 10to15 days but after the
imposition of the lockdown the maximum level reached was only for one day (US Consulate Air
Pollution Pakistan, 2019-2020).

Journal of Business and Social Review in Emerging Economies Vol. 6, No 4, December 2020
1382
Figure: Graphical representation of the Air Quality Index (PM 2.5) Of Islamabad, Lahore, Karachi, 2019-20.
(Source: Real-Time Air Quality Index)
3.2 Post Lockdown Air Quality Conditions
Despite this revamping, the real question comes "will the situation be the same after the lockdown is
hauled up?" the answer is NO. There are numerous reasons behind this answer which shall be discussed
in detail. Firstly, after calling off this lockdown, the production houses will resume their work. By
production house, it means all sorts of factories from textiles to steel mills to brick kilns every
workshop. This is fine because economic activity must resume now and then, but the thing which is
alarming for us is the factories that will be operating and producing commodities at a faster rate. More
production means more combustion of fuel to run the machines and thus increased the dumping of
wastes and by-products. Not only that, recently the factories are working day and night to meet the loss
incurred by them from February till May which means extra power consumption and hence again a
shortage of electricity. The shortage of electricity in Pakistan is a different subject hence keeping it
aside, but the main problem which needs not to be ignored is the pollutants released in the atmosphere
by the factories.
3.3 Increased SOx Presence in Atmosphere
The textile industry in Pakistan has resumed its production. To meet the online orders and other
demands in the market, the factories are functioning for up to 14 hours thus emitting dangerous
chemicals into the air. The major proportion is of Sulphur Dioxide, other toxins include Nitrogen
Dioxide and Suspended Particulate Matter (SPM) ( Various Pollutants Released into Environment by
Textile Industry, 2012) . These pollutants are the major reason that spikes the air pollution. The
enhanced proportion of Sulphur dioxide does not only decline the quality of air index but also imposes
the threat on the people prone to asthma and other diseases related to the lungs. This situation is
witnessed in China too after the lockdown was lifted and the economic activity was resumed. Through
the following picture, captured from NASA’s official website, the SO2 presence over China's North
region shows the emission due to resumed factory production. The three pictures below demonstrate
three different days and similarly three different cases of SO2 presence over the Pakistani Region. It
should be kept in mind that the complete lockdown was only called off in the region of Islamabad and
Lahore but not in Karachi. The first picture illustrates blue covering which is the minimum level of SO2
presence in the atmosphere (Atmospheric Composition of Sulphur Dioxide , 2020) . This is the accepted
levels of Sulphur Pollutant which at minimum effects the Air Quality Index. But the situation started to
deteriorate once the factories started operating and the color suddenly changes from blue to green.
Although up till green the Sulphur presence in the atmosphere is deemed not to be dangerous the
inference here which can be drawn is that within 10 days the concentration is increasing radically hence
I assume that within a month or so the Sulphur concentration will again reach the hazardous
concentration that is 3.85 Column Mass and above; this concentration of Sulphur has been reached by

Journal of Business and Social Review in Emerging Economies Vol. 6, No 4, December 2020
1383
China. The Centre for Research on Energy and Clean Air (CREA) in China has published a report
showing a sharp increase in the SO2 presence over the region where the factories are operational. CREA
claims that by comparing the accumulation of SO2 in May-June 2019 and May-June 2020 revealed that
the levels have exceeded the pre-pandemic era. CREA now fears that if some controlling policies are not
implemented the situation might go worse which may prove to be alarming for the people living in there
(Lauri, 2020).

Journal of Business and Social Review in Emerging Economies Vol. 6, No 4, December 2020
1384
Figure: Global SO2 presence in the atmosphere (Source: Global Modeling and Assimilation Office NASA)
3.4 Increased NOx Presence in Atmosphere
The Prime Minister of Pakistan has issued a notice to lift all air travel restrictions by June 15th, which
means that from then onwards all the airlines will be operating their respective flights and not only the
national flag carrier. Like other industries, the airline industry is the most affected one and has seen a
major financial setback. After the restrictions are called off, airlines will be operating many flights to fill
the fiscal deficit. Not only that people stranded all over Pakistan especially shall continue their travel.
Aircraft emit various pollutants due to the combustion of various fuels and mainly diesel. This
combustion releases toxic pollutants which include Carbon Dioxide, Oxides of Sulphur, Oxides of
Nitrogen, unburnt Hydrocarbons, Carbon Monoxide, and Particulate Matter (European Aviation
Environmental Report, 2017) . Carbon Dioxide and Oxides of Nitrogen are the two pollutants that form
the major proportion of emission by combustion. But the recent studies reveal that percentage of
Nitrogen Oxides emitted by aircraft in the atmosphere is increasing incredibly as compared to Carbon
Dioxide. For the past three months from 23rd March 2020 till 15th June 2020, all the domestic flights
were canceled, only the chartered international flights were being operated by Pakistan International
Airline and all other airlines were shut down. In this period at most 35 flights had been operated, which
is only 10 percent of the flights which come in and out of Pakistan in a day. It should be noted that in
this period the levels of Nitrogen Oxide had been reduced as revealed by the satellites of NASA, but
once all airliners are operating the situation won't be the same. The levels of Nitrogen Oxide will
increase sharply and thus the Air Quality Index of each city might face an alarming situation.
But this pollutant is not only restricted to the aircraft or jetliners. It is also released by the combustion in
vehicles. After the lockdown is elevated, all business activities and corporate sector will resume
working. Since 26th February in Karachi and from 13Th March 2020 in Islamabad and Lahore,
everyone was working from home and people were going out only to buy necessities. Least intercity
travels had been observed with many people quarantining themselves at home. But once the offices
reopen and the corporate sector continues its working, people will have to rejoin their offices. Not only

Journal of Business and Social Review in Emerging Economies Vol. 6, No 4, December 2020
1385
that, due to the fear of contagion pandemic virus, but many people will also avoid using public transport
and will surely be using their private conveyance. Which means more vehicles on the road with more
traffic jams. This is what Kate Abnett has discussed in her article regarding the situation of pollutants in
China after the lockdown is called off. She says that the concentration of some pollutants has risen way
above what China had in the same days last year. She says that the situation of air quality in China began
to worsen when the people started to drive their private cars to work instead of using the monorails and
other public transport. The traffic jams in densely populated areas are causing threats and reports claim
that over 1500 people are vulnerable to death due to the inhalation of intoxicants mainly nitrogen oxides
(Kay, 2020) .
Moreover, the satellites of NASA have revealed a sweeping of NO2 present in the troposphere above
Pakistan. The environmentalists of NASA claim that this reduction in the pollutants is merely due to the
reduced use of aerosols, and combustible liquids (Global Nitrogen Dioxide Monitoring, Pakistan, 2020) .
But the following figures retrieved from NASA’s official websites explain the situation of Nitrogen
Dioxide present in the troposphere of 3 major cities. The graphs present below each satellite image
shows the increasing trend on Nitrogen Oxides in the atmosphere post-travel (both air and ground)
restrictions are lifted, for the ease of understanding and purpose of comparison, the time between April
and June has been highlighted.
Figure: Satellite Capture of NOx Presence Over Lahore City (Source: NASA)
Figure: Graph of NOx Emissions in Lahore City (Source NASA)

Journal of Business and Social Review in Emerging Economies Vol. 6, No 4, December 2020
1386
Figure: Satellite Capture of NOx Presence Over Islamabad City (Source: NASA)
Figure: Graph of NOx Emissions in Islamabad City (Source NASA)
Figure: Satellite Capture of NOx Presence Over Karachi City (Source: NASA)
Figure: Graph of NOx Emissions in Karachi City (Source NASA)
On comparing the NOx condition of all the three cities, it is evidential that due to lifting of lockdown
Journal of Business and Social Review in Emerging Economies Vol. 6, No 4, December 2020
1387
and allowing air travel to and from Lahore and Islamabad the emissions have an increasing trend,
whereas by looking into the case of Karachi the emissions are at a constant rate as the smart lockdown is
still in place.
4. CONCLUSION
These arguments are only valid to the point if no radical step is either taken by the relevant authorities or
the individuals themselves. It should also be noted that these are mere projections based on the past track
record of what the air quality was in Pakistan and a collar drawn while considering the post-lockdown
atmospheric situation in China. But nothing is impossible in this world. Pakistan has a lot more potential
than other countries to make it a better place to live and a region having a healthy atmospheric condition.
For this, the environmental agencies along with the relevant ministry must work hard and draw certain
policies that shall prove beneficial for the country and our future generations. Certain policy
recommendations are given below:
Policy#1: All Commercial Activities to Be Restricted Between 9 Am. To 5 Pm.
If the government restricts all the commercial activities (including malls and other shopping arcades)
between 0900-1700 hrs, this will be beneficial for Pakistan not only in the environmental aspect but
economically also. By restricting the activities in these hours, the energy consumption will be least as
daylight illuminates and reduces the need for electricity to 10-20%, in return Pakistan shall not be facing
any sorts of “Electricity Shortfalls”. Not only that the traffic jams in the peak hours can be avoided as
the traffic shall be evenly distributed all over the day.
Policy#2: Controlling the Air Traffic
The air traffic should be restricted. This can be done by limiting the number of international flights
landing in and taking off from all over Pakistan in a day. For instance, if 100 aircraft of international
airlines land here in Pakistan, reduce the traffic by permitting let's say only 50 flights in a day. This will
not only be helpful for the domestic airlines as they will get a chance to operate flights but will also
reduce the combustion emissions from the aircraft.
Policy#4: Turning Towards Renewable Energy Finally, is moving towards renewable energy, moreover solar energy. Pakistan has the potential of
producing 100,000 MW of electricity from solar energy. Islamabad is in the province of Punjab where it
experiences about 5.0-5.5 kWh/m2/day of normal solar radiations that are considered best rays to
operate solar cells. If in Islamabad alone solar panels are installed it can operate about 500,000
streetlights of 400 MW which can replace the sodium lights mounted. Apart from this many small
localities that are far from the national grid can be facilitated by solar energy. According to a given
estimate, if solar panels are installed in the outskirts of Islamabad, they can lighten up to 40,000 villages
24/7 that are not provided with electricity even for about 10 hours in a day (Intikhab, F, F, & Fayyaz,
December 2012). Pakistan has a capacity to fight against any difficult situation. If proper remedies are
taken the good air quality can be maintained even after all economic activities are resumed. As this
paper has taken a situational approach thing might turn out to be different than the analysis but still in
order to provide a habitable place for the future generation certain remedial actions must be taken by the
government and by the individuals themselves.
References
Various Pollutants Released into Environment by Textile Industry. (2012, May). Retrieved from Fibre 2
Fashion: https://www.fibre2fashion.com/industry-article/6262/various-pollutants-released-into-
environment-by-textile-industry.
Atmospheric Composition of Sulphur Dioxide . (2020, May-June 30th-12th). Retrieved from Global
Modelling and Assimilation Office, NASA : https://fluid.nccs.nasa.gov
Baldasano, J. M. (Nov 2020). COVID-19 lockdown effects on air quality by NO2 in the cities of
Barcelona and Madrid (Spain). Science of Total Environment .
European Aviation Environmental Report. (2017). Retrieved from European Union Aviation Safety
Agency: https://www.easa.europa.eu/eaer/topics/overview-aviation-sector

Journal of Business and Social Review in Emerging Economies Vol. 6, No 4, December 2020
1388
Global Health Observatory Data. (2020). Retrieved from World Health Organization :
https://www.who.int/gho/phe/outdoor_air_pollution/burden/en/
Global Nitrogen Dioxide Monitoring, Pakistan. (2020). Retrieved from National Aeronautics and Space
Administration: https://so2.gsfc.nasa.gov/no2/no2_index.html
GOV, P. (2014). Facts anf Figures- Lahore. Retrieved from Lahore Development Authority :
https://www.lda.gop.pk/
Gov, P. (2016). Facts and Figures- Karachi. Retrieved from Karachi Development Authority:
http://www.kda.gos.pk/Contents.aspx?id=103
Grace. (2020, may ). CBS Interactive Inc. Retrieved from CBS News : https://www.cbsnews.com/news
Han, B.-S., Park, K., Kwak, K.-H., Park, S.-B., Jin, H.-G., Moon, S., . . . Baik, J.-J. (2020). Air Quality
Change in Seoul, South Korea under COVID-19 Social Distancing: Focusing on PM2.5.
International Journal on Environmental Health and Public Research .
Intikhab, U., F, A. A., F, K., & Fayyaz, A. (December 2012). Estimation of Solar Energy Potential for
Islamabad, Pakistan. Research Gate .
Jain, S., & Tanya, S. (2020). Social and Travel Lockdown Impact Considering Coronavirus Disease
(COVID-19) on Air Quality in Megacities of India: Present Benefits, Future Challenges and Way
ForwardJi. Special Edition: Aerodol Air QUality, 1222-1236.
Kay, A. (2020, may 18 ). Reuters Environment . Retrieved from Reuters :
https://www.reuters.com/article
Kumari, P. (2020). Impact of lockdown measures during COVID-19 on air quality– A case study of
India. International Journal of Environmental Health Research .
Lauri, M. (2020). China’s air pollution overshoots pre-crisis levels for the first time. Centre for Research
on Energy and Clean Air .
lShubham, S., Jingsi, G., Hongliang, Z., & Sri, H. (August 2020). Effect of restricted emissions during
COVID-19 on air quality in India. Science of the total environment.
Ma, C.-J., & Kang, G. (2020). Air Quality Variation in Wuhan, Daegu, and Tokyo during the Explosive
Outbreak of COVID-19 and Its Health Effects. International Journal on Evironment Research
and public Health.
Menut, L., Bessagnet, B., & Siour, G. (Nov 2020). Impact of lockdown measures to combat Covid-19 on
air quality over western Europe. Science of the Total Environment .
Pak, G. (2017). Facts And Statistics Islamabad. Retrieved from Capital Development Authority-
Islamabad: http://www.cda.gov.pk/about_islamabad/vitalstats.asp
Pakistan Air Quality Index and Air Pollution Information. (2020). Retrieved from Empowering the
World to breath clean air- IQAir: https://www.iqair.com/pakistan
PAQIM. (2019-2020, December-May). Islamabad US embassy: Real-Time AQI. Retrieved from Real
Time Air Quality Index Pakistan: https://aqicn.org/city/pakistan/Islamabad/us-embassy/
PAQMI. (2019-2020, December-May ). US Embassy Karachi Real Time AQI. Retrieved from Pakistan
Real Time Air Quality Index : https://aqicn.org/city/pakistan/Karachi/us-embassy/
PAQMI. (2019-2020, December-May). US Embassy Lahore Real Time AQI. Retrieved from Pakistan
Real Time Air Quality Index : https://aqicn.org/city/pakistan/Lahore/us-embassy/
Rui, B., & Acheng, Z. (2020). Does lockdown reduce air pollution? . ELsevier; Science DIrect.
Saeida, S., Deepak, R., & Mustansar, H. (2020). Environmental Perspective of COVID-19 . Elsevier,
Science Direct .
US Consulate Air Pollution Pakistan. (2019-2020, December-May). Retrieved from Real Time Air
Quality Index: https://aqicn.org

Journal of Business and Social Review in Emerging Economies Vol. 6, No 4, December 2020
1389
Volume and Issues Obtainable at Center for Sustainability Research and Consultancy
Journal of Business and Social Review in Emerging Economies ISSN: 2519-089X (E): 2519-0326
Volume 6: No. 4, December 2020
Journal homepage: www.publishing.globalcsrc.org/jbsee
Money Demand Balances and Exchange Rate Policy in Pakistan: An ARDL and
Non-ARDL Analysis
1Shazia Sana, 2Shahnawaz Malik, 3Muhammad Ramzan Sheikh, 4Muhammad Hanif Akhtar 1PhD Student, The Women University Multan, Pakistan, [email protected]
2Professor (Rtd), Department of Economics, The Women University, Multan, Pakistan,
[email protected] 3Associate Professor, School of Economics, Bahauddin Zakariya University, Multan, Pakistan,
[email protected] 4Professor, Department of Commerce, Bahauddin Zakariya University, Multan, Pakistan,
ARTICLE DETAILS ABSTRACT History Revised format: November 2020 Available Online: December 2020
This paper investigates the impact of exchange rate changes
across money demand balances in Pakistan by applying the linear
and non-linear ARDL approaches. The study not only examines
the impact of exchange rate changes across demand for money
but also attempts to analyze whether demand for money is stable
or not? For an estimation of money demand function, yearly time-
series data have been used from the year 1972 to 2019. Findings
of the linear ARDL model disclose that exchange rate and
demand for money balances are positively and significantly
associated with each other. Moreover, results of the non-linear
ARDL model reveal that positive and negative exchange rate
shocks have mixed effects on money demand. The results of the
asymmetric test also demonstrate that exchange rate changes have
symmetric effects on money demand while stability test results
propose that money demand remains stable in Pakistan.
© 2020 Center for Sustainability Research and Consultancy Pakistan
under a Creative Commons Attribution-NonCommercial-ShareAlike 4.0
Keywords Exchange rate, Money
demand, ARDL, NARDL
JEL Classification
E41, O24
Corresponding author’s email address: [email protected]
Recommended citation: Sana, S., Malik, S., Sheikh, M. R. & Akhtar, M. H. (2020). Money Demand
Balances and Exchange Rate in Pakistan: A Time Series Analysis. Journal of Business and Social
Review in Emerging Economies, 6(4), 1389-1399
1. Introduction
Nominal exchange rate is defined as the rate at which one currency is exchanged for the other. Exchange
rate, which is fixed by monetary authorities, using the foreign exchange reserves, is called fixed
exchange rate while the one determined through the supply and demand for currency in foreign
exchange markets, is called flexible exchange rate. Countries, especially developing countries have aim
to stabilize the exchange rate because stable exchange rate is very meaningful for the achievement of
sustainable progress (Edwards, 1989; Berka and Devereux, 2010) while the unstable exchange rate
caused the distortion in the trade, investment, inflation and trade balance (Xiaopu, 2002; Eichengreen,
2008). Exchange rate is regarded as an intermediate policy variable that affects the economy through its
impact on the domestic currency and inflation, capital flows, financial stability, external sector and
exports and imports of the country. Exchange rate changes may affect the comparative prices and the
spending level of the persons and firms if the wealth has a large share of foreign currency. Exchange rate

Journal of Business and Social Review in Emerging Economies Vol. 6, No 4, December 2020
1390
may affect the economy via two different ways: depreciation and appreciation (Hanif et al., 2016).
Pakistani rupee was connected with the Pound in early 1971. In 1971, Pakistan pegged its currency with
US dollar. Pakistan adopted the managed floating exchange rate that was helpful to minimize the
difference between official and market rate. In Pakistan financial sector transformation improved the
banking system by increasing the share of private sector in the banking business in 1991. Multiple
exchange rate system has adopted by Pakistan in 1998 through three different exchange rates, official
exchange rate2, Floating interbank rate3 and Composite rate4. In 1999, Pakistan was integrated multiple
exchange rate system in which rupee is fixed with US dollar and flexible within some limits. But in
2000, Pakistan had adopted the freely floating exchange rate by removing the limits on the exchange
rate. Banks had adopted their own exchange rate. Managed floating exchange rate was adopted by the
Pakistan during the period 1982 to 2010 and Pakistani rupee was continuously depreciated about 700%
from its start against the US dollar. So, Pakistani rupee’s value continuously decreases. The exchange
rate among rupee and US dollar was 10.39 in 1982 that reached to 85.75 in 2010 that was considered
about more than 700% decline in the value of rupee. That showed the large variation in the rupee dollar
exchange rate. There were two main point of views of exchange rate determination and forecasting. First
view is concerned with the determination of exchange rate through the demand and supply of the
currency by using the balance of payment information. Second view is concerned with the relative stock
of financial asset means financial asset of one country in terms of other country. The previous research
work of exchange rate is based on the balance of payment approach and monetary approach including
interest rate parity, QTM and money demand function (Saeed et al., 2012). Demand for money is very
important function of the monetary policy. So monetary authorities control the monetary aggregates for
the effective monetary policy. In small open economy like Pakistan, foreign interest rate and exchange
rate determined the demand for money domestically under floating exchange rate system. Mundell
(1963) was the first who introduced the relationship among the exchange rate and demand for money
and explained that changes in the capital flows and foreign trade may cause to the changes in the
demand for money function (Anwar and Asghar, 2012).
Theoretical background on money demand was started from the classical tradition. Classical view about
the concept of money demand is divided into different parts, such as Pigou and Cambridge University
economists. According to the Cambridge University economists, demand for money is defined as the
people demand for money holdings. They explained choice determined determinants of real demand for
money and it is called cash balance approach of money demand. Keynes determined the demand for
money with additional variable of interest rate with negative relation. Post-Keynesian provided the
various explanations about the money demand. Money as a medium of exchange function explain the
transection purpose of money demand with certainty whereas the precautionary demand for money
introduced the transaction demand for money with uncertainty. Cash-in-advanced function also explain
the medium of exchange function. Asset function investigates the role of demand for money in the
portfolio management. Asset role of demand for money was advocated by the overlapping generations
models. Money is considered as consumer goods like other goods in the consumer demand approach
(Sriram and Adams, 1999).
Money demand is positively related to the exchange rate and the reason behind the positive relation
between money demand and exchange rate is that if there is excess supply of money, this excess supply
results in form of deficit in the balance of payments. Then there will be an automatic depreciation of the
nation’s currency. It will lead to increase the prices and thus demand for money will also increase. To
absorb the excess supply of money, the demand for money increases sufficiently to absorb this excess
supply. According to the Monetary Approach of exchange rate5. Exchange rate have positive impact on
2Exchange rate in which Pakistani rupee was pegged with US Dollar in fixed rate 3 Commercial bank estimates its exchange rate first time 4 It is the combination of official exchange rate and floating interbank rate 5 Monetary approach under Exchange rate was presented by Robert Mundell and Harry Johnson at the end of 1960
and it was fully developed during 1970.
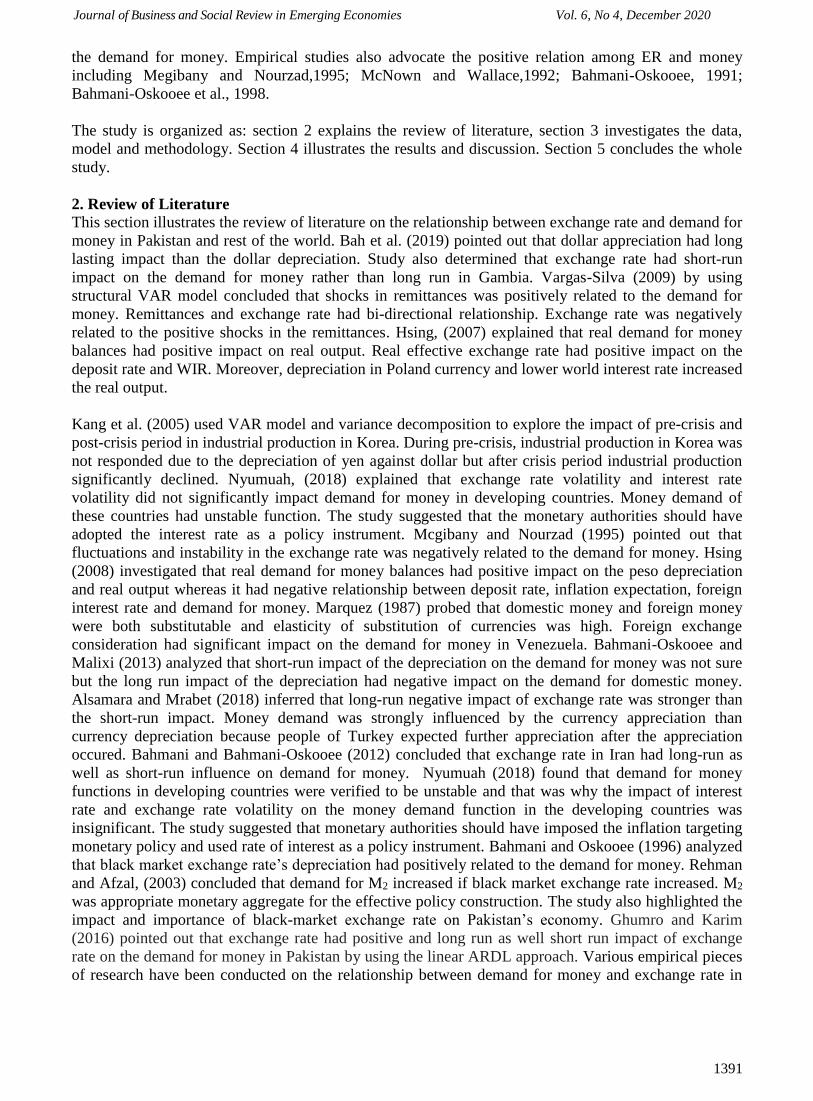
Journal of Business and Social Review in Emerging Economies Vol. 6, No 4, December 2020
1391
the demand for money. Empirical studies also advocate the positive relation among ER and money
including Megibany and Nourzad,1995; McNown and Wallace,1992; Bahmani-Oskooee, 1991;
Bahmani-Oskooee et al., 1998.
The study is organized as: section 2 explains the review of literature, section 3 investigates the data,
model and methodology. Section 4 illustrates the results and discussion. Section 5 concludes the whole
study.
2. Review of Literature This section illustrates the review of literature on the relationship between exchange rate and demand for
money in Pakistan and rest of the world. Bah et al. (2019) pointed out that dollar appreciation had long
lasting impact than the dollar depreciation. Study also determined that exchange rate had short-run
impact on the demand for money rather than long run in Gambia. Vargas-Silva (2009) by using
structural VAR model concluded that shocks in remittances was positively related to the demand for
money. Remittances and exchange rate had bi-directional relationship. Exchange rate was negatively
related to the positive shocks in the remittances. Hsing, (2007) explained that real demand for money
balances had positive impact on real output. Real effective exchange rate had positive impact on the
deposit rate and WIR. Moreover, depreciation in Poland currency and lower world interest rate increased
the real output.
Kang et al. (2005) used VAR model and variance decomposition to explore the impact of pre-crisis and
post-crisis period in industrial production in Korea. During pre-crisis, industrial production in Korea was
not responded due to the depreciation of yen against dollar but after crisis period industrial production
significantly declined. Nyumuah, (2018) explained that exchange rate volatility and interest rate
volatility did not significantly impact demand for money in developing countries. Money demand of
these countries had unstable function. The study suggested that the monetary authorities should have
adopted the interest rate as a policy instrument. Mcgibany and Nourzad (1995) pointed out that
fluctuations and instability in the exchange rate was negatively related to the demand for money. Hsing
(2008) investigated that real demand for money balances had positive impact on the peso depreciation
and real output whereas it had negative relationship between deposit rate, inflation expectation, foreign
interest rate and demand for money. Marquez (1987) probed that domestic money and foreign money
were both substitutable and elasticity of substitution of currencies was high. Foreign exchange
consideration had significant impact on the demand for money in Venezuela. Bahmani-Oskooee and
Malixi (2013) analyzed that short-run impact of the depreciation on the demand for money was not sure
but the long run impact of the depreciation had negative impact on the demand for domestic money.
Alsamara and Mrabet (2018) inferred that long-run negative impact of exchange rate was stronger than
the short-run impact. Money demand was strongly influenced by the currency appreciation than
currency depreciation because people of Turkey expected further appreciation after the appreciation
occured. Bahmani and Bahmani-Oskooee (2012) concluded that exchange rate in Iran had long-run as
well as short-run influence on demand for money. Nyumuah (2018) found that demand for money
functions in developing countries were verified to be unstable and that was why the impact of interest
rate and exchange rate volatility on the money demand function in the developing countries was
insignificant. The study suggested that monetary authorities should have imposed the inflation targeting
monetary policy and used rate of interest as a policy instrument. Bahmani and Oskooee (1996) analyzed
that black market exchange rate’s depreciation had positively related to the demand for money. Rehman
and Afzal, (2003) concluded that demand for M2 increased if black market exchange rate increased. M2
was appropriate monetary aggregate for the effective policy construction. The study also highlighted the
impact and importance of black-market exchange rate on Pakistan’s economy. Ghumro and Karim
(2016) pointed out that exchange rate had positive and long run as well short run impact of exchange
rate on the demand for money in Pakistan by using the linear ARDL approach. Various empirical pieces
of research have been conducted on the relationship between demand for money and exchange rate in

Journal of Business and Social Review in Emerging Economies Vol. 6, No 4, December 2020
1392
different groups of countries like developed and developing countries and provided different results.
Rest of studies apply various econometric techniques mostly simple linear ARDL technique. However,
these previous studies have not applied non-linear ARDL to examine the results of positive and as well
as negative shocks effect of exchange rate on the demand for money which has been applied in this
paper.
3. Model Data and Methodology The following model is money demand and exchange rate model, which estimates the impact of official
exchange rate on the money demand with other independent variable which are GDP per capita growth,
lending rate, inflation, federal fund rate.
2 ( , , , , )M G f GDPG LR INF FFR ER (1)
The econometric representation of the model is:
2 0 1 2 3 4M G GDPG LR INF FFR ER (2)
Where:
M2G = Broad money (% of GDP)
GDPG= GDP growth (annual %)
LR= Lending interest rate (%)
INF= Inflation, consumer prices (annual %)
FFR= Federal Fund Rate (annual %)
ER= Official exchange rate (LCU per US$, period average)
To estimate the money demand function time series data are used from 1972 to 2019 for Pakistan. Data
on GDPG, INF, M2G and ER are collected from World Development Indicators. Data on LR are
collected from Handbook of Statistics on Pakistan Economy and data on FFR are collected from Federal
Reserve System, USA. Linear and non-linear ARDL methodology is used for the estimation.
4. Results and Discussions To explore the relationship between exchange rate and money demand balances, some empirical results
have been discussed.
4.1 Descriptive Statistics and Correlation Analysis This section explains descriptive statistics and correlation analysis of money demand and other
variables. Descriptive statistic is very beneficial for explaining the basic characteristics of the data.
Descriptive statistic is helpful for the handling and describing the large data. Descriptive analysis
describes about the central tendencies like mean and median, measure of dispersions through max, min
value and standard deviation. Measure of symmetries are skewness and Kurtosis. Descriptive statistics
of key variables is presented in Table 1.
Table 1: Descriptive Statistics of Money Demand Balances and other Selected Variables (1972-
2019)
Mean Median Max Min SD
Skew
Kurt JB
Prob.
Obs.
M2G 45.66 44.86 59.04 34.00 6.82 0.40 2.21 2.54 0.28 48
GDPG 4.79 4.84 10.22 0.81 2.10 0.10 2.75 0.21 0.90 48
LR 11.59 11.41 15.42 6.99 2.06 -0.28 2.54 1.04 0.59 48
INF 9.01 7.88 26.66 2.53 5.21 1.50 5.43 29.77 0.00 48
FFR 5.13 5.05 16.49 0.09 3.92 0.66 3.10 3.46 0.18 48
ER 46.55 33.86 150.04 8.68 37.01 0.83 2.74 5.64 0.06 48
Source: Authors’ calculations
The central tendencies of M2G mean value is 45.66 and median value is 44.86 which are approximately
same because both represents the average values of M2G. GDPG’s mean value is 4.79 and median value
is 4.84. Maximum value of M2G is 59.04 and minimum value is 34.00 and the range is 25.04 which is
difference between the maximum value and minimum value. Same as the GDPG’s maximum value is
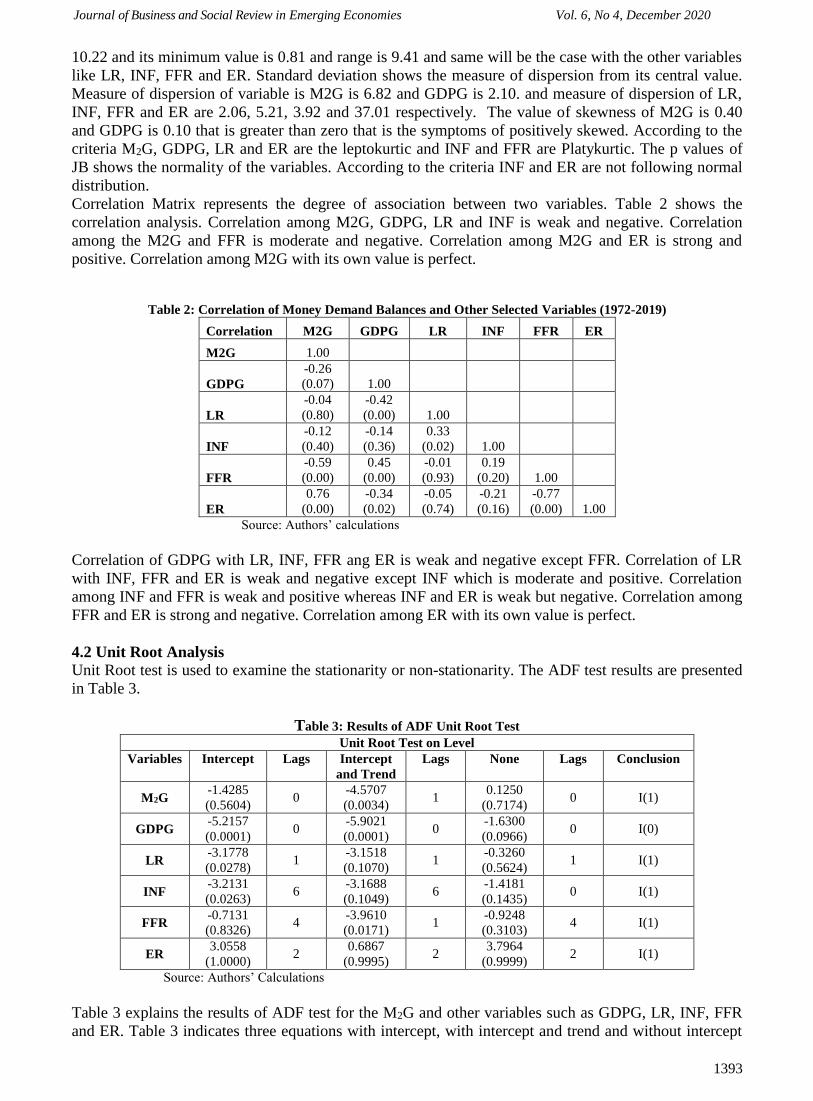
Journal of Business and Social Review in Emerging Economies Vol. 6, No 4, December 2020
1393
10.22 and its minimum value is 0.81 and range is 9.41 and same will be the case with the other variables
like LR, INF, FFR and ER. Standard deviation shows the measure of dispersion from its central value.
Measure of dispersion of variable is M2G is 6.82 and GDPG is 2.10. and measure of dispersion of LR,
INF, FFR and ER are 2.06, 5.21, 3.92 and 37.01 respectively. The value of skewness of M2G is 0.40
and GDPG is 0.10 that is greater than zero that is the symptoms of positively skewed. According to the
criteria M2G, GDPG, LR and ER are the leptokurtic and INF and FFR are Platykurtic. The p values of
JB shows the normality of the variables. According to the criteria INF and ER are not following normal
distribution.
Correlation Matrix represents the degree of association between two variables. Table 2 shows the
correlation analysis. Correlation among M2G, GDPG, LR and INF is weak and negative. Correlation
among the M2G and FFR is moderate and negative. Correlation among M2G and ER is strong and
positive. Correlation among M2G with its own value is perfect.
Table 2: Correlation of Money Demand Balances and Other Selected Variables (1972-2019)
Correlation M2G GDPG LR INF FFR ER
M2G 1.00
GDPG
-0.26
(0.07) 1.00
LR
-0.04
(0.80)
-0.42
(0.00) 1.00
INF
-0.12
(0.40)
-0.14
(0.36)
0.33
(0.02) 1.00
FFR
-0.59
(0.00)
0.45
(0.00)
-0.01
(0.93)
0.19
(0.20) 1.00
ER
0.76
(0.00)
-0.34
(0.02)
-0.05
(0.74)
-0.21
(0.16)
-0.77
(0.00) 1.00
Source: Authors’ calculations
Correlation of GDPG with LR, INF, FFR ang ER is weak and negative except FFR. Correlation of LR
with INF, FFR and ER is weak and negative except INF which is moderate and positive. Correlation
among INF and FFR is weak and positive whereas INF and ER is weak but negative. Correlation among
FFR and ER is strong and negative. Correlation among ER with its own value is perfect.
4.2 Unit Root Analysis
Unit Root test is used to examine the stationarity or non-stationarity. The ADF test results are presented
in Table 3.
Table 3: Results of ADF Unit Root Test Unit Root Test on Level
Variables Intercept Lags Intercept
and Trend
Lags None Lags Conclusion
M2G -1.4285
(0.5604) 0
-4.5707
(0.0034) 1
0.1250
(0.7174) 0 I(1)
GDPG -5.2157
(0.0001) 0
-5.9021
(0.0001) 0
-1.6300
(0.0966) 0 I(0)
LR -3.1778
(0.0278) 1
-3.1518
(0.1070) 1
-0.3260
(0.5624) 1 I(1)
INF -3.2131
(0.0263) 6
-3.1688
(0.1049) 6
-1.4181
(0.1435) 0 I(1)
FFR -0.7131
(0.8326) 4
-3.9610
(0.0171) 1
-0.9248
(0.3103) 4 I(1)
ER 3.0558
(1.0000) 2
0.6867
(0.9995) 2
3.7964
(0.9999) 2 I(1)
Source: Authors’ Calculations
Table 3 explains the results of ADF test for the M2G and other variables such as GDPG, LR, INF, FFR
and ER. Table 3 indicates three equations with intercept, with intercept and trend and without intercept
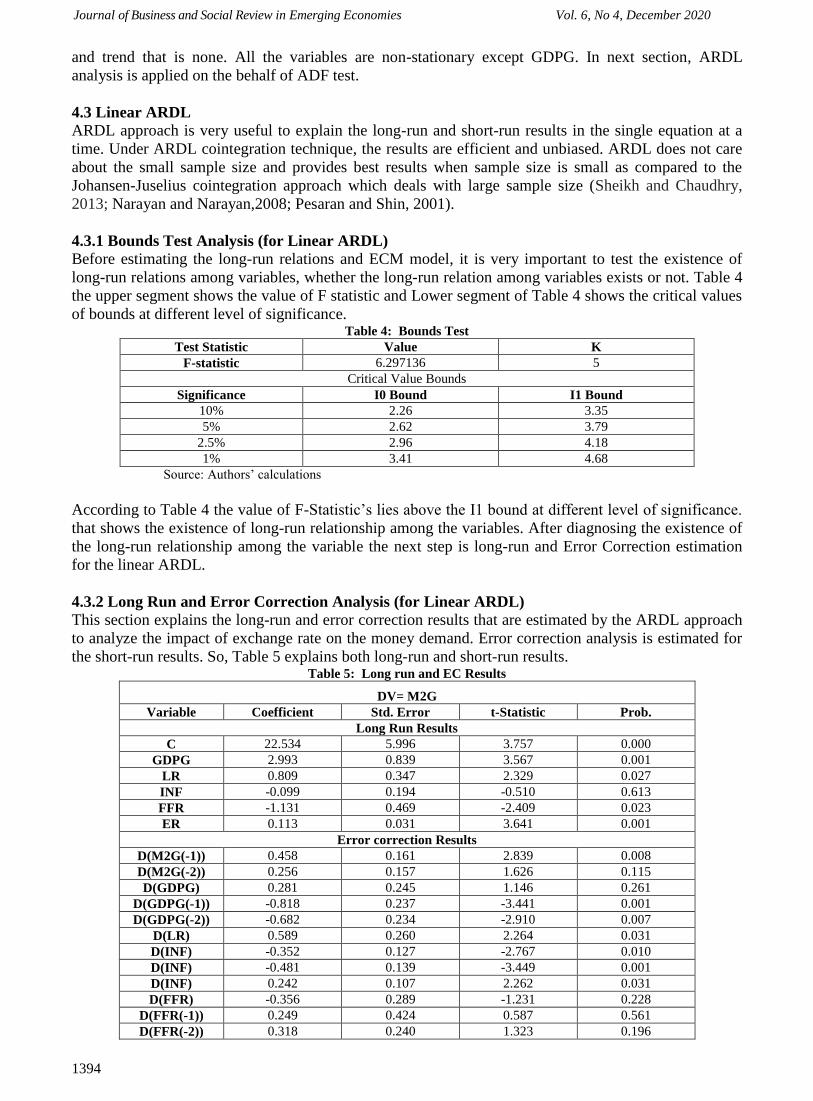
Journal of Business and Social Review in Emerging Economies Vol. 6, No 4, December 2020
1394
and trend that is none. All the variables are non-stationary except GDPG. In next section, ARDL
analysis is applied on the behalf of ADF test.
4.3 Linear ARDL
ARDL approach is very useful to explain the long-run and short-run results in the single equation at a
time. Under ARDL cointegration technique, the results are efficient and unbiased. ARDL does not care
about the small sample size and provides best results when sample size is small as compared to the
Johansen-Juselius cointegration approach which deals with large sample size (Sheikh and Chaudhry,
2013; Narayan and Narayan,2008; Pesaran and Shin, 2001).
4.3.1 Bounds Test Analysis (for Linear ARDL)
Before estimating the long-run relations and ECM model, it is very important to test the existence of
long-run relations among variables, whether the long-run relation among variables exists or not. Table 4
the upper segment shows the value of F statistic and Lower segment of Table 4 shows the critical values
of bounds at different level of significance. Table 4: Bounds Test
Test Statistic Value K
F-statistic 6.297136 5
Critical Value Bounds
Significance I0 Bound I1 Bound
10% 2.26 3.35
5% 2.62 3.79
2.5% 2.96 4.18
1% 3.41 4.68
Source: Authors’ calculations
According to Table 4 the value of F-Statistic’s lies above the I1 bound at different level of significance.
that shows the existence of long-run relationship among the variables. After diagnosing the existence of
the long-run relationship among the variable the next step is long-run and Error Correction estimation
for the linear ARDL.
4.3.2 Long Run and Error Correction Analysis (for Linear ARDL) This section explains the long-run and error correction results that are estimated by the ARDL approach
to analyze the impact of exchange rate on the money demand. Error correction analysis is estimated for
the short-run results. So, Table 5 explains both long-run and short-run results. Table 5: Long run and EC Results
DV= M2G
Variable Coefficient Std. Error t-Statistic Prob.
Long Run Results
C 22.534 5.996 3.757 0.000
GDPG 2.993 0.839 3.567 0.001
LR 0.809 0.347 2.329 0.027
INF -0.099 0.194 -0.510 0.613
FFR -1.131 0.469 -2.409 0.023
ER 0.113 0.031 3.641 0.001
Error correction Results
D(M2G(-1)) 0.458 0.161 2.839 0.008
D(M2G(-2)) 0.256 0.157 1.626 0.115
D(GDPG) 0.281 0.245 1.146 0.261
D(GDPG(-1)) -0.818 0.237 -3.441 0.001
D(GDPG(-2)) -0.682 0.234 -2.910 0.007
D(LR) 0.589 0.260 2.264 0.031
D(INF) -0.352 0.127 -2.767 0.010
D(INF) -0.481 0.139 -3.449 0.001
D(INF) 0.242 0.107 2.262 0.031
D(FFR) -0.356 0.289 -1.231 0.228
D(FFR(-1)) 0.249 0.424 0.587 0.561
D(FFR(-2)) 0.318 0.240 1.323 0.196

Journal of Business and Social Review in Emerging Economies Vol. 6, No 4, December 2020
1395
D(ER) 0.082 0.034 2.392 0.024
CointEq(-1) -0.728 0.152 -4.769 0.000
Source: Authors’ calculations
GDPG has meaningful and positive impact on money demand. The reasons behind the positive relation
among GDPG and money demand are as follows: Firstly, as GDP increases it leads to increase
transactions demand for money that is the part of total money demand so, demand for money increases.
Secondly, due to increase in GDP, people become more wealthier and want to hold more assets in their
portfolio so, demand for money increases. The positive relation among GDPG and money demand is
explained by various theories of demand for money including Classical, Cambridge approach, Keynes’
liquidity preference theory, Friedman’s modern quantity theory of money6 advocated the positive
relation of income level with demand for money. It is also empirically justifiable in many studies like
Marquez,1987; Mousa, 2010; Magibany and Nourzad,1995; Bahmani-Oskooee and Malixi,1991.
Lending Rate is also significant and positively related to the demand for money. Interest rate is
positively related to the demand for money if individuals has interest-bearing portfolio that found the
most important part of monetary aggregate Doornik et al. (1998). Many studies have presented the
positive relation among the interest rate and demand for money see for example Qayyum, 2001, 2005;
Arestis and Demetriades, 1991; Leeper and Gordon, 1992.
Table 5 shows the negative impact of inflation on money demand. The reason behind the negative
relation among the inflation rate on the demand for money is if inflation increases, it decreases the in the
real value of money and in this situation, people do not want to hold money in their portfolio so demand
for money decreases. Qayyum, 2001, 2005 found the negative association between inflation and money
demand. Federal Fund Rate represents the negative but significant impact on money demand. It reflects
that an increase in the foreign interest rate leads to decrease in the demand for money. The reason behind
the negative relation among them is that when the Federal Fund Rate increases, foreign currency become
more profitable so, demand for foreign currency increases and demand for domestic currency decreases.
The results are verified by Mousa, 2010.
Exchange rate has also significant and positive impact on money demand. The reason behind the
positive relation between exchange rate and money demand is that if there is excess supply of money,
this excess supply results in form of deficit in the balance of payments. Then there will be an automatic
depreciation of the nation’s currency. It will lead to increase the prices and thus demand for money will
also increase. To absorb the excess supply of money, the demand for money increases sufficiently to
absorb this excess supply. According to the monetary approach of exchange rate, exchange rate has
positive impact on the demand for money. Empirical studies also confirm the positive relation among
ER and M2G including Megibany and Nourzad, 1995; McNown and Wallace,1992; Bahmani-
Oskooee,1991; Bahmani-Oskooee et al.,1996.
Error correction results describes the speed of adjustment and short-run results. the coefficient value of
error correction term is -0.728 which is significant and indicates that seven months are required for the
adjustment process in short run to restore equilibrium.
4.3.3 Stability Tests (for Linear ARDL)
Stability test investigates about the stability of the model. In order to examining the stability of the
model CUSUM and CUSUM of Squares have used with 5 % level of significance. The model is stable
if the values lies within the bands and if the values crosses the bands means data have large variations
and model is not stable.
Figure 1: Stability of Money demand Balances
6See Friedman (1995).

Journal of Business and Social Review in Emerging Economies Vol. 6, No 4, December 2020
1396
-20
-15
-10
-5
0
5
10
15
20
1980 1985 1990 1995 2000 2005 2010 2015
CUSUM 5% Significance
-0.4
-0.2
0.0
0.2
0.4
0.6
0.8
1.0
1.2
1.4
1980 1985 1990 1995 2000 2005 2010 2015
CUSUM of Squares 5% Significance According to Figure 1, the model is stable in the first figure of CUSUM at 5% level of significance,
because the values lies between the upper and lower bands from 1980 to 2015. The second figure of the
CUSUM of squares shows that model is stable because the values fluctuate between the upper and lower
bands from 1980 to 2015. In year 2003, negligible instability is observed but overall model is stable.
4.4 Non-Linear ARDL Analysis
Granger and Yoon (2002) presented the concept of hidden cointegration in time series. Hidden
cointegration means two time are cointegrated with their negative and positive aspect. Standard linear
form of cointegration (symmetric) is the special case of the hidden cointegration and hidden
cointegration shows the asymmetric or non-linear cointegration. After that Schorderet (2003) introduced
the bivariate asymmetric cointegration regression to examine the hidden cointegration. Furthermore, in
recent research, Shin et al. (2011) presented the asymmetric ARDL used negative and positive partial
sum to diagnose the asymmetric impact in long and short run.
Asymmetric ARDL like symmetric ARDL have same assumptions such as, ARDL gave accurate result
in small sample size as compared to the other econometric technique, ARDL can’t apply if any variable
have I(2), ARDL can apply when variables are I(0) or I(1), and even mixture of I(0) and I(1),
appropriate lag length, serially uncorrelated error term and model must be stable (Katrakilidis and
Trachanas, 2012).
4.4.1 Bounds Test Analysis (For Non-Linear ARDL)
It is very important to test the existence of long-run relations among variables, whether the long-run
relation among variables exists or not. Bounds test is used to diagnose the existence of the long-run
relation among variables. Bound test is same for linear and non-linear ARDL. Table 6: Bounds Test (Non-Linear ARDL)
Test Statistic Value K
F-statistic 3.513672 10
Critical Value Bounds
Significance I0 Bound I1 Bound
10% 1.83 2.94
5% 2.06 3.24
2.5% 2.28 3.5
1% 2.54 3.86
Source: Authors’ Calculations
Table 6 explain the detection of long-run relationship existence. According to the table, the long-run
relationship among variables exists as F statistics is greater than the upper bound.
4.4.2 Long Run and Error Correction Analysis (For Non-Linear ARDL)
This section explains the results the long-run and error correction estimate that is estimated for the Non-
linear ARDL model approach.
Table 7 explains the long-run and short-run results of non-ARDL. Both a 1% positive and a 1% negative
shock to GDPG have positive and significant impact on the demand for money. It means that when 1 percent
positive shock is given to GDPG, demand for money rises by 9.5 percent and while 1 percent negative shock
to GDPG increases the demand for money by 3.6 percent. That clearly explains that the magnitude of
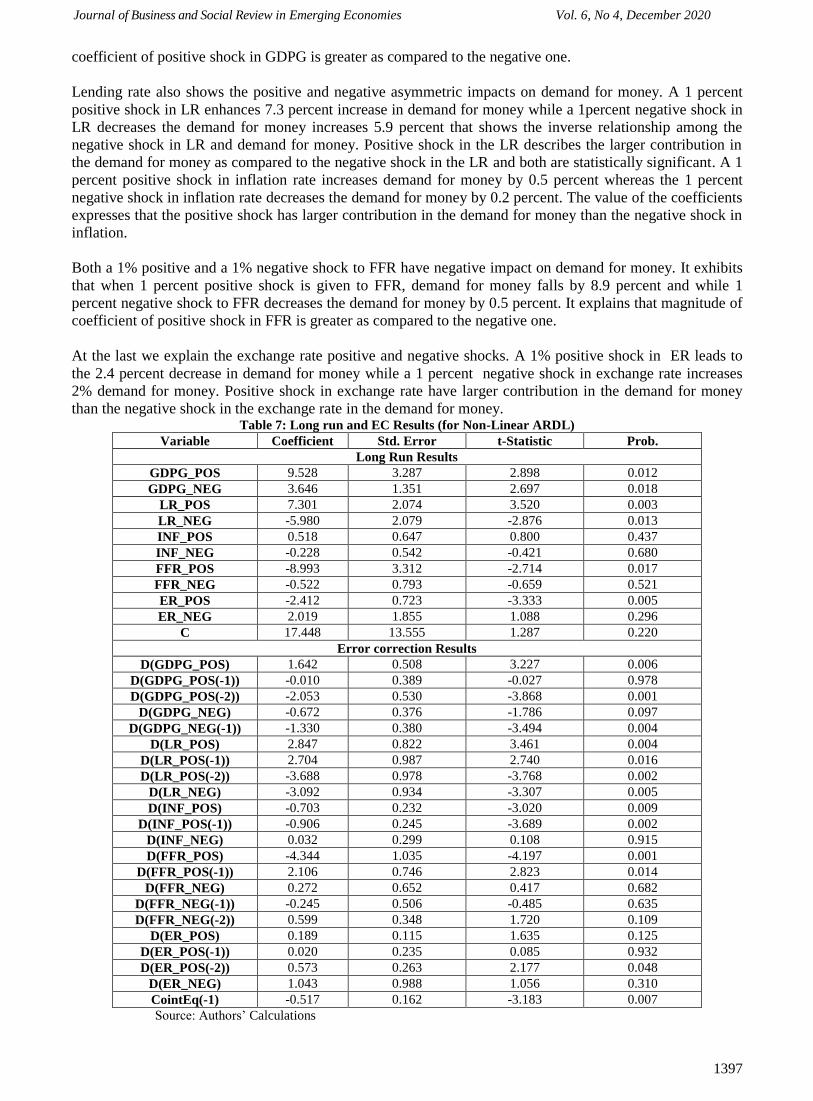
Journal of Business and Social Review in Emerging Economies Vol. 6, No 4, December 2020
1397
coefficient of positive shock in GDPG is greater as compared to the negative one.
Lending rate also shows the positive and negative asymmetric impacts on demand for money. A 1 percent
positive shock in LR enhances 7.3 percent increase in demand for money while a 1percent negative shock in
LR decreases the demand for money increases 5.9 percent that shows the inverse relationship among the
negative shock in LR and demand for money. Positive shock in the LR describes the larger contribution in
the demand for money as compared to the negative shock in the LR and both are statistically significant. A 1
percent positive shock in inflation rate increases demand for money by 0.5 percent whereas the 1 percent
negative shock in inflation rate decreases the demand for money by 0.2 percent. The value of the coefficients
expresses that the positive shock has larger contribution in the demand for money than the negative shock in
inflation.
Both a 1% positive and a 1% negative shock to FFR have negative impact on demand for money. It exhibits
that when 1 percent positive shock is given to FFR, demand for money falls by 8.9 percent and while 1
percent negative shock to FFR decreases the demand for money by 0.5 percent. It explains that magnitude of
coefficient of positive shock in FFR is greater as compared to the negative one.
At the last we explain the exchange rate positive and negative shocks. A 1% positive shock in ER leads to
the 2.4 percent decrease in demand for money while a 1 percent negative shock in exchange rate increases
2% demand for money. Positive shock in exchange rate have larger contribution in the demand for money
than the negative shock in the exchange rate in the demand for money. Table 7: Long run and EC Results (for Non-Linear ARDL)
Variable Coefficient Std. Error t-Statistic Prob.
Long Run Results
GDPG_POS 9.528 3.287 2.898 0.012
GDPG_NEG 3.646 1.351 2.697 0.018
LR_POS 7.301 2.074 3.520 0.003
LR_NEG -5.980 2.079 -2.876 0.013
INF_POS 0.518 0.647 0.800 0.437
INF_NEG -0.228 0.542 -0.421 0.680
FFR_POS -8.993 3.312 -2.714 0.017
FFR_NEG -0.522 0.793 -0.659 0.521
ER_POS -2.412 0.723 -3.333 0.005
ER_NEG 2.019 1.855 1.088 0.296
C 17.448 13.555 1.287 0.220
Error correction Results
D(GDPG_POS) 1.642 0.508 3.227 0.006
D(GDPG_POS(-1)) -0.010 0.389 -0.027 0.978
D(GDPG_POS(-2)) -2.053 0.530 -3.868 0.001
D(GDPG_NEG) -0.672 0.376 -1.786 0.097
D(GDPG_NEG(-1)) -1.330 0.380 -3.494 0.004
D(LR_POS) 2.847 0.822 3.461 0.004
D(LR_POS(-1)) 2.704 0.987 2.740 0.016
D(LR_POS(-2)) -3.688 0.978 -3.768 0.002
D(LR_NEG) -3.092 0.934 -3.307 0.005
D(INF_POS) -0.703 0.232 -3.020 0.009
D(INF_POS(-1)) -0.906 0.245 -3.689 0.002
D(INF_NEG) 0.032 0.299 0.108 0.915
D(FFR_POS) -4.344 1.035 -4.197 0.001
D(FFR_POS(-1)) 2.106 0.746 2.823 0.014
D(FFR_NEG) 0.272 0.652 0.417 0.682
D(FFR_NEG(-1)) -0.245 0.506 -0.485 0.635
D(FFR_NEG(-2)) 0.599 0.348 1.720 0.109
D(ER_POS) 0.189 0.115 1.635 0.125
D(ER_POS(-1)) 0.020 0.235 0.085 0.932
D(ER_POS(-2)) 0.573 0.263 2.177 0.048
D(ER_NEG) 1.043 0.988 1.056 0.310
CointEq(-1) -0.517 0.162 -3.183 0.007
Source: Authors’ Calculations

Journal of Business and Social Review in Emerging Economies Vol. 6, No 4, December 2020
1398
4.4.3 Presence of Asymmetry based on Wald Test
This section investigates the presence of Asymmetries of variables based on Wald test. Table 8
examines the asymmetries of independent variables GDPG, LR, INF, FFR and ER for the non-linear
ARDL. Table 8: Wald Test
Null Hypothesis F-Statistic Prob.
GDPG_POS = GDPG_NEG = 0 9.6259 0.006
LR_POS = LR_NEG = 0 0.4727 0.628
INF_POS = INF_NEG = 0 5.069 0.023
FFR_POS = FFR_NEG= 0 9.597 0.002
ER_POS = ER_NEG = 0 2.049 0.168
Source: Authors’ Calculations
Table 8 presents the results of Wald Test to diagnose the presence of asymmetric effects on dependent
variable. GDPG, INF are FFR are asymmetric because we have rejected the Ho which shows that there
is no asymmetry while for LR and ER we have found symmetric effects because we are unable to reject
the null hypothesis.
4.4.4 Stability Tests (For Non-linear ARDL)
Stability Test for non-linear ARDL, which explains that the model is stable or not. To check the stability
CUSUM and CUSUM of Squares test is used
Figure 2: CUSUM and CUSUM of Squares test
-12
-8
-4
0
4
8
12
07 08 09 10 11 12 13 14 15 16 17 18 19
CUSUM 5% Significance
-0.4
0.0
0.4
0.8
1.2
1.6
07 08 09 10 11 12 13 14 15 16 17 18 19
CUSUM of Squares 5% Significance According to the CUSUM and CUSUM of Squares test the model is stable at 5% level of significance
because the values lies between the upper and lower bands.
5. Conclusion This paper investigates the determinants of demand for money in Pakistan by using time series data from
1972 to 2019. The study has applied linear and non-linear ARDL techniques to explore the impact of
exchange rate, GDPG, lending rate, foreign interest rate and inflation rate on money demand. Long-run
results extracted from linear ARDL technique show that the impact of GDPG, lending rate and exchange
rate are significant and have positive impact on money demand whereas the inflation is insignificant and
have negative impact on the demand for money. Moreover, foreign interest rate is significant and have
negative impact on money demand. The results divulge that the money demand function is stable in
Pakistan and exchange rate changes have positive and strong impacts on demand for money. Results of
the NARDL exhibit that positive shocks in exchange rates decrease the money demand while the
negative shocks tend to augment the demand for money. Furthermore, the asymmetric test shows that
exchange rate changes have symmetric effects on money demand.
References Alsamara, M., & Mrabet, Z. (2019). Asymmetric impacts of foreign exchange rate on the demand for
money in Turkey: new evidence from nonlinear ARDL. International Economics and Economic
Policy, 16(2), 335-356.
Anwar, S., & Asghar, N. (2012). Is demand for money stable in Pakistan? Pakistan Economic and
Social Review, 1-22.
Arestis, P., & Demetriades, P. O. (1991). Cointegration, error correction and the demand for money in
Cyprus. Applied Economics, 23(9), 1417-1424.
Bah, K., Khan, K., Aziez, A. T. N., & Kishwar, (2019). A. Do Exchange Rate Changes Have

Journal of Business and Social Review in Emerging Economies Vol. 6, No 4, December 2020
1399
Asymmetric or Symmetric Effects on the Demand for Money in the Gambia.
Bahmani, S. (2013). Exchange rate volatility and demand for money in less developed countries.
Journal of Economics and Finance, 37(3), 442-452.
Bahmani, S., & Bahmani–Oskooee, M. (2012). Exchange rate volatility and demand for money in Iran.
International Journal of Monetary Economics and Finance, 5(3), 268-276.
Bahmani-Oskooee, M. (1996). The black-market exchange rate and demand for money in Iran. Journal
of Macroeconomics, 18(1), 171-176.
Bahmani-Oskooee, M., & Malixi, M. (1991). Exchange rate sensitivity of the demand for money in
developing countries. Applied Economics, 23(8), 1377-1384.
Berka, M., Devereux, M. B. (2010) "What Determines European Real Exchange Rates?" Federal
Reserve Bank of Dallas, Globalization and Monetary Policy Institute, Working Paper No. 46.
Doornik, J. A., Hendry, D. F., & Nielsen, B. (1998). Inference in cointegrating models: UK M1
revisited. Journal of economic surveys, 12(5), 533-572.
Edwards S., (1989). Real Exchange Rates, Devaluation and Adjustment: Exchange Rate Policy in
Developing Countries, Cambridge, Mass: MIT Press.
Eichengreen, B. (2008) The Real Exchange Rate and the Economic Growth" Commission on Growth
and Development, Working Paper No. 4.
Ghumro, N., & Karim, M. Z. A. (2016). The effects of exchange Rate on Money demand: Evidence
from Pakistan the effects of exchange Rate on Money demand: Evidence from
Pakistan. International Research Journal of Social Sciences, 5(4), 11-20.
Granger, C.W., Yoon, G., 2002. Hidden cointegration. University of California, Working Paper 2002–02
Hanif, M. N., Iqbal, J., & Khan, I. N. (2016). Global Commodity Prices and Inflation in a Small Open
Economy (No. 76). State Bank of Pakistan, Research Department.
Hsing, Y. (2007). Impacts of financial stock prices and exchange rates on the demand for money in
Poland. South East European Journal of Economics and Business, 2(1), 7-13.
Hsing, Y. (2008). Impacts of the exchange rate and the foreign interest rate on the Argentine money
demand function. Applied Economics Letters, 15(1), 35-39.
Kang, S., Kim, S., & Wang, Y. (2005). The effects of the yen/dollar exchange rate on the Korean
economy. International Journal of Finance & Economics, 10(2), 167-183.
Katrakilidis, C., & Trachanas, E. (2012). What drives housing price dynamics in Greece: New evidence
from asymmetric ARDL cointegration. Economic Modelling, 29(4), 1064-1069
Leeper, E. M., & Gordon, D. B. (1992). In search of the liquidity effect. Journal of Monetary
Economics, 29(3), 341-369.
Marquez, J. (1987). Money demand in open economies: A currency substitution model for Venezuela.
Journal of International Money and Finance, 6(2), 167-178.
Mcgibany, J. M., & Nourzad, F. (1995). Exchange rate volatility and the demand for money in the US.
International Review of Economics & Finance, 4(4), 411-425.
McNown, R., & Wallace, M. S. (1992). Cointegration tests of a long-run relation between money
demand and the effective exchange rate. Journal of International money and Finance, 11(1),
107-114.
Mousa, N. Y. A. (2010). Monetary policy and the role of exchange rate: the case of Jordan (Doctoral
dissertation, University of Birmingham).
Mundell, R. A. (1963), Capital mobility and stabilization policy under fixed and flexible exchange rates.
Canadian Journal of Economics and Political Science, Volume 29(4), pp. 475-485.
http://www.jstor.org/stable/139336
Narayan, P.K. and Narayan, S. (2008). Does military expenditure determine Fiji’s exploding debt levels?
Defence and Peace Economics, 19(1) 77–87.
Nyumuah, F. S. (2018). The impacts of interest rate and exchange rate volatilities on the demand for
money in developing economies. International Journal of Economics and Finance, 10(3), 56-69.
Pesaran, H. M., Shin, Y., Smith, R. J. (2001). Bounds Testing Approaches to the Analysis of Long-Run
Relationships. Journal of Applied Econometrics, vol. 16: 289-326.
Pesaran, M. H., Shin, Y., & Smith, R. J. (1996). Testing for the ‘Existence of a Long-run Relationship'
(No. 9622). Faculty of Economics, University of Cambridge.
Qayyum, A. (2005). Modelling the demand for money in Pakistan. The Pakistan Development Review,
Journal of Business and Social Review in Emerging Economies Vol. 6, No 4, December 2020
1400
233-252.
Qayyum, A., & Nishat, M. (2001). Sectoral Analysis of the Demand for Real Money Balances in
Pakistan [with Comments]. The Pakistan Development Review, 953-966.
Rehman, H. U., & Afzal, M. (2003). The black-market exchange rate and stability of demand for money
in Pakistan: A cointegration analysis. Pakistan Economic and Social Review, 13-28.
Saeed, A., Awan, R. U., Sial, M. H., & Sher, F. (2012). An econometric analysis of determinants of
exchange rate in Pakistan. International Journal of Business and Social Science, 3(6), 184-196.
Schorderet, Y., 2003. Asymmetric Cointegration. University of Geneva.
Sheikh, M. R., & Chaudhry, I. S. (2013). The Determinants of Defense Expenditures in Pakistan and
India: An ARDL Bounds Testing Approach. Pakistan Journal of Social Sciences (PJSS), 33(1). Sriram, M. S. S. (1999). Survey of Literatureon Demand for Money: Theoretical and Empirical Work
with Special Reference to Error-Correction Models. International Monetary Fund.
Vargas‐Silva, C. (2009). The tale of three amigos: Remittances, exchange rates, and money demand in
Mexico. Review of Development Economics, 13(1), 1-14.
Xiaopu Z. (2002). Equilibrium and Misalignment: An Assessment of the RMB Exchange Rate from
1978 to 1999, Center for Research on Economic development and Policy Reform Working
Paper, No 127.
Journal of Business and Social Review in Emerging Economies Vol. 6, No 4, December 2020
1401
Volume and Issues Obtainable at Center for Sustainability Research and Consultancy
Journal of Business and Social Review in Emerging Economies ISSN: 2519-089X (E): 2519-0326
Volume 6: No. 4, December 2020
Journal homepage: www.publishing.globalcsrc.org/jbsee
International ESL Students’ Experiences and Perceptions of Effective and
Constructive Feedback Practises on their Academic Writing in MA Programme
1Marukh Shakir, 2Mujahid Shah, 3Munir Khattak 1Assistant Professor, Abdul Wali Khan University Mardan, Pakistan
2Assistant Professor, Abdul Wali Khan University Mardan, Pakistan, [email protected] 3Assistant Professor, Department of English, University of Labella, Pakistan
ARTICLE DETAILS ABSTRACT History Revised format: November 2020 Available Online: December 2020
This paper investigates students’ experiences, perceptions,
understanding and interpretation of different types of feedback. For
this purpose, qualitative interviews were conducted from ten ESL
(not having English as their native language) students regarding
different types of feedback that had they received on their academic
assignments; the effects and potential of those feedback on their
learning and writing, and the factors causing difficulties in their
effective use of those feedback. According to the findings, all
participants expressed their satisfaction with support in the form of
feedback in improving their academic writing but also showed some
reservations in effectively exercising them. The findings revealed that
the interviewees received feedback in varied modes, however, mostly
in written form; from tutors; and after the submission of assignments,
and less in oral form; from peers; during the writing processes; and
before the submission of assignments. Conclusions are drawn and
limitation and suggestions for future research are addressed in the
light of the findings.
© 2020 Center for Sustainability Research and Consultancy Pakistan under
a Creative Commons Attribution-NonCommercial-ShareAlike 4.0
Keywords ESL students, Academic
Writing, MA Programme,
Effective, Constructive
JEL Classification
M0, M10
Corresponding author’s email address: [email protected]
Recommended citation: Shakir, M., Shah, M. & Khattak, M. (2020). International ESL Students’
Experiences and Perceptions of Effective and Constructive Feedback Practises on their Academic
Writing in MA Programme.. Journal of Business and Social Review in Emerging Economies, 6(4),
1401-1413
1. Introduction
The significant, central and decisive role of feedback in L2 writing field for the development of student
learning process, their motivation and writing skills related to L2 has been widely recognised in L2
writing field (Hounsell, 2003; K. Hyland & F. Hyland, 2006). Ramsden (2003) opines that effective
comments on students’ work are indicative of quality teaching. Hounsell (2003: 67) states that we learn
faster, and much more effectively, when we have a clear sense of how well we are doing and what we
might need to do in order to improve’. Gibbs & Simpson (2004) highlighted the significance of feedback
being timely, understandable and acted upon by students.
Feedback is a significant and primary aspect of EFL/ESL writing programs around the world. The
research studies are not clearly positive regarding the role of feedback in L2 writing development (K.

Journal of Business and Social Review in Emerging Economies Vol. 6, No 4, December 2020
1402
Hyland & F. Hyland, 2006). It is usually viewed by teachers that its full potential is not made use of by
them (ibid). Students are mostly dissatisfied with the feedback they get because they either find it
difficult to interpret it (Chanock, 2000), lacking specific advice to improve (e.g. Higgins et al., 2001), or
it has a potentially adverse effect on students’ confidence and self-perception (James, 2000). Inspired by
such feedback-oriented research and a recommendation by Poverjuc (2011) for future research to
investigate the students’ perceptions of effective feedback practises on academic writing, I conducted a
small-scale empirical research based on the students’ interviews (explained in detail later). This
provided me with an opportunity to compare my findings with the previous feedback oriented research,
and thus offered the basis for stronger conclusions and suggestions for improving students’ long term
writing skills. It also helped me in examining the relevance of feedback in another context (Higher
Education context in UK). Moreover, it helped me identify new variables that may affect them. It must
be kept in mind that this paper only deals with feedback for writing tasks; so wherever feedback is
mentioned, the context is exclusively that of written work.
1.1 The Current Study
Feedback is a social process that may be interpreted in different ways (Carless, 2006). This study
examines the value of feedback in terms of informing students about their academic performance
(though not in terms of correcting their writing), in terms of students’ experiences and perceptions of
different types of feedback they receive in different modes during their master’s course, in terms of the
difficulties they faced while they have engaged with those feedbacks, and in terms of their perceptions
of effective feedback for improving their writing skills. In other words, to explore and exemplify how
international ESL students experience, perceive, understand and interpret the assignments feedback
process, the different modes of feedback in this study refers to the input and responses that students
receive on or about their academic assignments from their tutors in the form of;
- Written remarks on the drafts or finalised assignments.
- Any verbal feedback (e.g. during the development of ideas) prior to or after the submission of
assignments.
- Feedback in different modes such as explicit/implicit, oral/written, and specific/detailed.
The motivation for this study also comes from my personal experiences during my M.A in Applied
Linguistics, from feedback I received about assignments, and from talking to peers about it. I
experienced that in majority of cases in M.A, students do not get feedback, which has the potential to
allow them to revise the draft paper. Mostly they get feedback after the submission of assignments
which may undermine the basic purpose of feedback. Most importantly, in my opinion, the value of
feedback lies in utilising the feedback constructively for development e.g. when students get feedback
what do they do with that feedback? Where does it go? What is its value for them? What do they think
of it?
2. Literature Review
Feedback, in educational context, is usually conceptualized as fulfilling both ‘evaluative’ and
‘educative’ functions (Dochy& McDowell 1997). From an evaluative perspective, feedback provides
students with information regarding her/his performance attempt at a task (Hounsell, 1987). In terms of
educative function, feedback supports students’ development and facilitates task improvement (Hester
2001). Fleming (1999) contends that marking student scripts is an important quality event in students’
lives. Such feedback can have various functions such as an advice for improving the current assignment,
advice for improving the following assignments and justifying or explaining a grade (Carless, 2006).
Tutors invest quite a lot of time in the feedback of this nature but the important point is to ask: what are
the impact of such feedback on students and how might they relate to further learning? (ibid). According
to Carless, students are usually motivated by and interested in marks and they do not bother much about
the written feedback they get on their papers after submission of assignments (Carless, 2006). Feedback
on assignments might have quite variable and mostly unpredictable effects on students (Lizzio&Keithia,
2008). Young (2000) has identified the “potentially problematic nature of students’ personal reactions to
feedback on assignments” (e.g. decrease in self-esteem, academic confidence) in higher education
context.

Journal of Business and Social Review in Emerging Economies Vol. 6, No 4, December 2020
1403
2.1 Students’ Perceptions of Feedback on Academic Assignments
Students acknowledge feedback on assignments as important in the identification of their weaknesses
and strengths, enhancement of motivation and improvement of their future grades (F. Hyland, 2000).
Research reveals significant findings with regard to the nature of feedback which encompasses direct
versus indirect feedback, written versus oral feedback, form versus content, combined and detailed
feedback as explained ahead.
Regarding direct versus indirect feedback, in a study Ferris (2006) discovered that students used direct
feedback more effectively and consistently than indirect feedback, possibly as it simply involves
copying the tutor’s suggestions into the next draft of their papers(K. Hyland & F. Hyland, 2006). Robb
et al. (1986) found minimum long-term gains in case of indirect feedback as compared to direct
feedback practices. Williams (2004) found more uptake of teacher’s advice in terms of revisions when
teacher’s suggestions were explicit.
With regard to written and oral feedback, findings on students’ feedback preferences mostly reveal that
ESL students greatly value tutor’s written feedback and continuously rate it more highly than oral
feedback (Leki 1991; Enginarlar 1993; Ferris 1995). Gibbs and colleagues indicate, for instance, that
students might not consider oral comments asfeedback as much as they do written comments (Gibbs et
al., 2003).
In case of form and content feedback, although some findings indicate that students want tutor’s
feedback on their grammatical errors, most studies show that they want tutors to give them feedback on
the ideas and content in their writing as well (Hedgcock&Lefkowitz, 1996). Students also favour
receiving written suggestions in combination with other sources such as conferences (Hedgcock &
Lefkowitz 1994).
When it comes to detailed feedback, Leki (2006), for instance, while looking at feedback received by L2
graduate students in a US university, interviewed students to seek their opinions regarding the value of
written feedback in development of their academic literacy. Most students showed their desire to have
even more detailed feedback, particularly one helping them in identifying problems and giving them
information about academic expectations.
2.2 Difficulties in Using Feedback and Constructive and Effective Feedback Practises
Feedback contribution both in terms of its immediate effect on revisions to drafts and of students long
term development of writing skills is still not very clear (K. Hyland & F. Hyland, 2006). Some
difficulties might pertain to the following reasons;
2.3 Incomprehensibility of Feedback
Students may misunderstand, misinterpret or ignore tutor’s comments when revising drafts (Ferris 1995;
Conrad & Goldstein 1999). It might also happen that they may have understood the issues pointed out
but are incapable of coming up with an appropriate revision(Ferris 1997; Conrad & Goldstein 1999),
sometimes causing them to simply delete the offending text to avoid the problems pointed out (F.
Hyland 1998).
2.4 Tutor’s Language
Higgins (2000) argues that mostly students are unable to understand and correctly interprets feedback
comments. Feedback is usually delivered in an academic discourse (language in which teacher’s
comments is encoded) that is not completely accessible to students.
2.5 Negative Feedback
Negative feedback may have harmful effect on writer’s (students) confidence (F. Hyland & K. Hyland
2001). However, mostly tutors try to mitigate the impact of their comments and criticisms by using
question forms, hedges which might promote a supportive pedagogical environment, though its indirect
approach carries the risk that students may misinterpret or miss the point of the feedback (K. Hyland &

Journal of Business and Social Review in Emerging Economies Vol. 6, No 4, December 2020
1404
F. Hyland 2006).
2.6 Cultural Issues
It has been argued that some L2 learners experience cultural constraints about their “engaging
informally with authority figures” such as tutors or critically analysing tutor’s remarks, which might
result in students unreflectively and passively incorporating the tutor’s suggestions into their work
(Goldstein & Conrad 1990).
2.7 A Review of Literature Identifies Certain Features of Effective Feedback Messages Such as
2.7.1 Feedback on Drafts
Commentary on drafts might serve more immediate pedagogical goals i.e. development of writing as
compared to that given on the final version (K. Hyland & F. Hyland, 2006). Feedback on the drafts was
utilised more by the students who tended to improve their papers, a conclusion reached by Ferris (1997)
while looking at ESL students’ first and second drafts of papers during his investigation into the
relationship between teacher feedback and student revision. Zamel, for example, also endorses teachers’
comments on ideas in earlier drafts (Zamel 1985). Higginset al. (2002) contends, ‘feeding forward’
increases the effectiveness of ‘feeding back’ as ‘feeding forward’ provides an immediate chance of
acting on advice. Thus, comments on drafts were more helpful than feedback on the final version after
submission (ibid).
2.7.2 Detailed Comments
Detailed and longer text specific remarks were discovered resulting in more positive revisions (Ferris,
1997). Conrad & Goldstein (1999), in their research on students feedback, discovered that comments
dealing with details in the content were revised successfully by the students about half the time as
opposed to superficial corrections such as spelling and formatting.
2.7.3 Combined Feedback
Conrad & Goldstein (1999) & F. Hyland (1998) noticed a close link between written and oral feedback
observing that the points in written feedback can be better reinforced in student-teacher oral interactions.
For many learners oral feedback following written feedback has the potential to allow for negotiation
and interpretation of feedback (Hyland & Hyland, 2006).Master (1995) found that feedback was
effective when complemented with discussions. Goldstein and Conrad (1990) discovered that students
who negotiated meaning in conferences were able to carry out better and extensive revisions to their
writing than those who did not. Williams (2004) who found more uptake of teacher’s advice when
students negotiated and actively participated in the conferences also supported this finding.
2.7.4 Negotiations and Interaction
Williams (2004) points out that negotiation are crucial for text-based revisions. Patthey, Chavez & Ferris
(1997) examined some teachers’ writing conferences with eight students and found a link between the
topics discussed in the conferences and students subsequent revisions of their drafts. They discovered
that all eight students utilised the tutor’s suggestions in their revisions.
2.7.5 Positive Feedback
It is commonly proposed that feedback, including both positive and negative elements, will be more
effective, with the former i.e. the positive comments enhancing the possibility of accepting the latter, i.e.
the negative comments (F. Hyland & K. Hyland 2001). The inclusion of a positive component (e.g.
encouragement, praise) in a feedback has been asserted to contribute in mitigating the potentially
negative impact of a negative feedback on motivation and self-esteem (Lizzio et al. 2003).
2.7.6 Clarity of Feedback
At the basic level, feedback needs to be clearly understood by the students if theyare to make use ofit
(Lizzio&Keithia, 2008). Students sometimes report difficulty about ‘making sense’ of comments
(Norton & Norton 2001) or ‘translating’ academic language (Chanock 2000). Besides, there is also some

Journal of Business and Social Review in Emerging Economies Vol. 6, No 4, December 2020
1405
evidence suggesting apotential discrepancy between the meaning or intention of academics’ feedback on
assignments and its interpretation by students (Lea &Steirer 2000).
3. Methodology
The data for this study data was collected within the Higher education context in UK. The study
revolves around ten mixed international non-native ESL students doing M.A in modern languages in the
Humanities Department belonging to different Asian and European countries.
The data was collected through ‘‘Qualitative interviews’’ (Rubin & Rubin, 1995) in order to probe
deeply into ‘‘people’s more personal, private, and special understandings’’ (Arksey& Knight, 1999: 4).
Semi-structured interviews were used with the participants with an interview guide prepared beforehand
(see Appendix A). Students were chosen by using convenient sampling method where “a certain group
of people [were] chosen for study because they [were] available” (Fraenkel&Wallen, 2003: 103). The
interviewees were on the same course as mine and so were easily accessible to me. Secondly, I had
already established good rapport with them required for interviews to effectively engage them in a
reasonable discussion.
Detailed contextual and educational background of these students was not felt important to be provided
because the purpose of the study is to elucidate the different perceptions held by these students about
feedback practises and their background information might make them easily identifiable which goes
against the ethics of research.
Students were requested to participate on the basis of their willingness and my understanding of their
ability to contribute insights to the study. Interviews were then scheduled for a day and time according
to the participant’s convenience. The interviews were audio recorded with participants’ permission.
Consistent with the purpose of the study, questions in the interview guide focused on students
interpretations of tutors’ feedback, how they reacted toward those, which type of feedback practises they
found useful in terms of informing their writing, what problems they confronted in processing those
feedback. As is a common practise with semi-structured interviews, the sequence and exact phrasing of
the questions were not fixed (Zhu, 2004). The general and already set up lead questions were asked first
mostly followed up by more specific questions in order to elicit further information. At the end of each
interview, interviewees were asked to comment, share or suggest anything they believed could be
relevant to the study.
A total of ten interviews were collected, one from each respondent, each of which lasted from around 30
to 40 minutes. My role during the interviews was “to raise questions, rephrase the questions if necessary,
listen to the responses, prompt for further information, ask for clarifications, check with the interviewees
my interpretation of their responses, and answer respondents’ questions (ibid: 33).
4. Data Analysis
The audio-recorded interviews were then transcribed and analysed followed by coding and
categorisation of data. The prominent themes and patterns were identified. The interview data were
analysed by utilising procedures recommended by Arksey & Knight (1999) for analysis of qualitative
interviews. First, a representative sample of two interviewees comments were analysed and initial
coding content categories were developed. The resultant initial coded categories were then applied to the
rest of sample i.e. to the comments of the other three students. I would analyse each theme followed by
comparing evidence from the other data sets. In order to create sense of the themes, I followed the
recursive “process of interpreting data, drawing tentative conclusions and returning to the raw data to
seek evidence which confirmed or disconfirmed a particular line of thinking” (Carless, 2006: 222).
Several categories emerged as a result of transcripts coding which is mentioned and explained below in
discussion. After having developed an argument from the themes, I reported to the respondents aspects
of the data that I found surprising, puzzling, or interesting asking them to judge my interpretations or
elaborate their views thus using their point of views to increase the authenticity of my research findings
(ibid)
Journal of Business and Social Review in Emerging Economies Vol. 6, No 4, December 2020
1406
5. Findings and Discussion The analysis of the interviews transcripts revealed that interviewees, similar to the previous research
findings (e.g. Poverjuc, 2011) received feedback in varied modes. However, in this study feedback was
received mostly in written form from tutors and after the submission of assignments and less in oral
form, from peers, during the writing processes and before the submission of assignments. Further, these
transcripts indicated that the feedback aimed at mainly providing comments on their weaknesses in the
current assignment. Three main themes emerged from the above-mentioned analytic procedures. These
were; students’ perceptions of different types of feedback practises, difficulties confronted by them in its
successful use, and their perceptions of effective feedback practises. These themes have been “discussed
separately for convenience of exposition, but there is also considerable interplay between them, with
some points carrying relevance for more than one theme” (Carless, 2006: 223) also reflecting few
concerns recognised in the broader feedback literature. In order to maintain participants’ anonymity,
they have been identified with capital alphabets. Although, the transcripts contain a lot of other useful
insights about feedback practises all of which are not possible to be mentioned and discussed here on
account of space constraints and so a much focused discussion is provided here. Thus, few quotations
relevant to the research focus have been included at relevant places instead of the whole transcription.
5.1 Students’ Perceptions of Feedback Practices on Academic Assignments
Consistent with the previous research findings, all the ten participants in this study showed their
satisfaction with the idea of feedback practises in terms of indirectly improving their writing in the long
run by informing them of their shortcomings in the current assignments. According to them, they would
revisit their assignments particularly when the current assignment would have a similar requirement or
section to that of the previous one. One student reported that in order to improve the current work, if he
had performed well in a specific area in some previous assignment, he would try to use it in another
assignment. For instance, once he obtained a useful feedback from his tutor regarding referencing, and
he then used that assignment as a sort of template for future trials at referencing.
Definitely yes they [comments] were useful because they showed me what mistakes I did and
what I forgot about and what would help me to avoid committing the same mistakes in the next
assignment. Once I got a comment on how to make reference so [….] in my following
assignments I was very careful about referencing and did correct referencing (A).
Feedback helped me in future assignments. When you do the next assignment, you remember
that it was incorrect in previous assignment; so you avoid repeating it again just as I gave you
referencing example. (A)
Another student reported that her old assignments had helped her a lot in improving her subsequent
assignments.
Of course the feedback has helped me a lot in my other assignments. I have a clear idea about
what my tutors are looking for and want of me. (D)
These excerpts reveal that students learnt to extend their current competence through the guidance of a
more knowledgeable expert (Vygotsky, 1978). All the ten students (just three students are quoted for
special reasons) acknowledged the fact of using their written feedback for feed-forward purposes in
subsequent assignments such as regulating their writing behaviours and informing their following
assignments in the light of previous feedback (Poverjuc, 2011).
In terms of type, mentioned below are few quotes from participants which along with their perceptions
about feedback practices in general also show their preferences for and satisfaction with direct, written,
detailed and content focused tutors’ feedback consistent with the previous research findings. These types
are categorized separately for greater readability.
Direct feedback: By direct feedback, I mean feedback which explicitly highlights and criticizes the
problem whilst indirect feedback suggests reconsiderations or hedges criticism. Two students exhibited
their liking for direct feedback as they felt it easy to process it and does not require many efforts to

Journal of Business and Social Review in Emerging Economies Vol. 6, No 4, December 2020
1407
understand what is required of them.
I always liked direct feedback. I don’t like feedback which requires lot of thinking as comments
in question form provided by some tutors as I found it hard to reach to the right answer; so it
would be better if tutor directly tell me the point. (D)
I will go for direct feedback as I don’t want to be left wandering about issues in the writing (E).
The words “wandering” and “lot of thinking” suggest their avoidance of mental exertion required in
reflection on feedback.
Written: Two students’ favoured written feedback more, possibly due to the fact that oral feedback is
hard to remember as evidenced from the following quote. For example;
I will not go for it [oral feedback] because sometimes you change your mind during writing up of
assignments and sometimes you forget what the guideline is, what the teacher wants you to do
exactly (B).
Or possibly because they can relate written feedback with their written work recursively at any time as it
stays permanently as verified below by a student;
Written feedback for me is better as I can go through and check my assignments and see what I
did was ok or not (A).
Negotiation: Two students showed their desire for discussion on feedback they receive. For example one
student reported;
For me oral feedback is good as I can discuss my ideas with them [tutors] (B).
Here I will interpret ‘Oral’ to mean discussion based on the meaning in this sentence.
The other said;
Feedback makes a sense and is more fruitful when you discuss it thoroughly (C).
Detailed: Most students showed their desire to have even more detailed feedback, particularly feedback
helping them in identifying problems and giving them information about academic expectations. Two of
my participants affirmed the same fact as revealed in their responses such as;
Those with more details will be helpful which could tell me some solution about how to correct
and improve my mistake (A).
I go for detailed comments which could give me some idea how to remove my mistakes and how
I can improve (B).
Content: One of my interviewee regarded content feedback more valuable for her as is visible from her
quote;
For me the most important thing is the content feedback. It is something that makes sense
actually for improving my writing and teaches me writing skill (E).
By content, when asked, she meant relating to structure and ideas.
5.2 Difficulties in Using Feedback
Also, my research findings confirm the research findings regarding difficulties. But here again the
findings are divided into more detailed categories for clarity though the results are almost similar. In
response to the questions asking students to identify problems or hurdles in using feedback, students
indicated some feedback aspects as representing barriers in its effective use such as;
5.3 Lack of Sufficient Feedback
Two students described their experience of feedback mostly as limited which does not tell them much
about their weak areas.
Comments on the assignments seem more of assessment and less of a tool to help us to improve
our writing. Comments are to the point and limited (D).
Those with more details will be helpful which could tell me some solution about how to correct

Journal of Business and Social Review in Emerging Economies Vol. 6, No 4, December 2020
1408
and improve my mistake (A).
This might be due to institutional constraints and responding to the assignment in terms of assessed
piece of work that students hardly receive feedback other than a grade(Carless, 2006).
5.4 Nature of Feedback
Three students found it harder to grasp what the tutor meant by a certain comment because of the
language and handwriting. For example, one student expressed it as follows:
I try to make sense of the comment but sometimes it’s so vague and general that I can hardly
understand what they want to say. It’s very disturbing. (A)
Sometimes I cannot read some written comments that the marker writes, so I don’t know and
don’t understand what the marker wants me to do, the language is not clear […] In order to find
them helpful, I should be able to read and understand them so the language should be clear to me
in order to get benefit of those comments (E).
I at times found the handwriting incomprehensible when feedback was given on the hardcopy.
(D)
5.5 Variation in Tutors’ Preferences
Two students showed strong reservations about different tutors marking things differently.
Sometimes one tutor says why I quoted old sources, and when I use recent sources in another
assignment then the tutor says why I did not not make any reference to some old source (C).
Once one tutor gave me feedback to pay attention to structure. The other said structure is not that
important but the ideas (E).
5.6 Lack of Connection between Assignments
Two students commented that tutors’ comment had not really helped them much in improving their
writing as they were specific to the current assignment and so was not of much use to provide support
for doing better in other assignments for different modules. One student’s quote is presented here as
example;
Well every assignment is different from the other. I didn’t find that feedback useful which talks
just about assignment that is checked. Most comments I have got were about the ideas in my
current submitted assignment and not about the organisation, layout, logical sequence which
could improve my writing in the long run as feedback about ideas are just limited to that
particular assignment and ends with that (C).
5.7 Unavailability of Feedback on Drafts
When asked whether they approach tutors on their own, one student responded that
Initially I had been trying to get tutors consultation on drafts assignments but they showed little
interest, Ifeel them usually avoiding. May be they are very busy; so they stop trying then or they
may think that few students are receiving more support than others. (B)
Tutors are usually busy to allow us to discuss our ideas before submitting assignments (C).
Providing detailed feedback might be difficult because of large class sizes and lack ofsufficient time
(Carless, 2006).
5.8 Students’ Perceptions of Effective Feedback
Effective feedback was perceived in four main forms: Comments on drafts, related to transferable skills,
combined feedback, some positive comments when providing critical comments and recognizing effort
invested by students. Respondents associated positive feedback to their resultant motivation level.
Tutors’ advice on draft assignments were believed by these students as a particularly significant source
of ‘feed forward’ (Higgin et al., 2002) as providing an immediate chance of acting on advice. They

Journal of Business and Social Review in Emerging Economies Vol. 6, No 4, December 2020
1409
further argued that comments on drafts were more helpful than feedback on the final version after
submission. This belief was expressed in the following comment made by a student.
Feedback before the submission would be better as I can go through those comments and will
take care of them and will take them seriously […..]. I will use all comments during the
assignment […..]. (B)
One student mentioned below also stated that if a teacher had spent some time commenting on drafts
before the submission, they would expect briefer feedback to be given on the final version which proves
utilisation of feedback on the part of student.
If I get feedback before submission, then I expect just few comments after the submission
because I will use all comments, all feedback during doing my assignment; so I will not expect
many comments after the submission of my assignments (A).
End or sing the significance of feedback supporting transferable learning, one student remarked that
feedback could be more beneficially directed to general skills which can be transferred to other contexts
such as paragraph development, cohesion and coherence, logical organization, clarity and conciseness,
sentence structure, mechanics, citations and referencing. This supports a point forwarded by Knight and
Yorke (2003), that although many tutors give a lot of feedback on specifics, it is the general feedback
that has more power to stimulate learning. Such feedback possesses the potential to ‘feedforward’, into
following tasks instead of feeding back into the completed assignments.
I didn’t find the feedback useful as I rarely found comments about the organisation, layout,
logical sequence which could improve my writing in the long run as feedbacks are just limited to
the topic in that particular assignment and ends with that (C).
5.9 Combined Feedback
Three students favoured consultations and discussions after they got marks on final assignments. For
example,
It would be valuable if the tutors talk to us and discuss about our assignments after marking. I
think it would be more effective for our development and learning (C).
5.10 Positive Comments
Regarding positive comments two students reported;
I really appreciate some positive comments even if my assignment is not completely up to their
expectations as it really keeps my motivation intact as I have invested a lot of time on it and
definitely expect at least some reward (E).
I do a lot of hard work on assignments and do expect some acceptance of it in return (D).
Higgins et al. (2001), points out that ‘the student makes an emotional investment in an assignment and
expects some “return” on that investment’ (p. 272) and negative feedback can be threatening to students’
motivation.
The data gathered and analysed in this study echo confirmed most of the findings highlighted in the
previous research in respect of students’ appreciating the practises of feedback and facing almost the
same issues with regard to the sources of difficulties in processing feedback. This includes the nature of
feedback, language employed by the tutors, appropriate timings, individual differences and variations in
tutor’s preferences for marking. However, unlike previous research, my findings did not suggest cultural
differences as a hurdle for the participants.
This might possibly be because my study was not in depth enough to reveal such concerns or it might be
due to the small sample size to attribute differences to culture. Beyond that, my research findings also

Journal of Business and Social Review in Emerging Economies Vol. 6, No 4, December 2020
1410
illuminated students’ perceptions regarding effective feedback practises not addressed previously (to my
knowledge). So, my study revealed some perspectives of students concerning effective feedback
practises such as comments on drafts, combined feedback (written feedback followed by discussions),
positive feedback and feedback related to transferable skills.
6. Conclusion
Interested by significance of feedback practices in improving students’ writing and written texts, their
development as academics and the issues regarding effectiveness of feedback and driven by my personal
motivation, this small scale empirical study was carried out in order to analyze the perceptions and
experiences of M.A international ESL students in a master's programme An argument was made on the
basis of this study’s findings about how the process of feedback could be possibly made more
constructive, useful and effective. All participants expressed their satisfaction with such support
(feedback) in improving their academic writing though they also showed some reservations in
effectively exercising them.
These results raised tutors’ awareness, to some extent: 1) of the potential difficulties, attached with
feedback practises, in the light of above mentioned students’ experiences with different types of
feedback and 2) the significance of creating various opportunities to make feedback practises more
valuable by bearing in mind the above-mentioned students’ perceptions of effective feedback practises.
Results suggest that only one type of feedback in a single mode should not preferred rather multiple
types of feedback adapted to individual students needs and context could be useful for students.
Although, this is a very small-scale study with few participants providing just a glimpse regarding
feedback practises so generalizations and big conclusions cannot be drawn from it. However, the study
still provides useful insights, which becomes the basis for some of the following implications for
practice.
6.1 Some Implications for Practice
Generally speaking, the present findings may offer some guidance about students’ expectations of
effective feedback practises which might serve to sensitize tutors regarding potential of valuable
feedback. Some specific points worth-mentioning could be those of the tutors;
- The ones who aim at providing developmental feedback should try to balance ‘assignment
specific’ comments with more ‘transferable’ feedback (Lizzio&Keithia, 2008)
- The ones who aim at encouraging students might try not just to acknowledge achievements, but
also to recognize the effort invested, regardless of outcomes (ibid).
- If tutors are constrained by time and workload, instead of organising one to one discussion
session, could arrange about 30 mins whole-class optional tutorial for general feedback on the
assignments which would possibly be more interactive and thus more useful (Carless, 2006).
- Regarding tutors choice of appropriate style and language in their feedback which can facilitate
students’ writing development, tutors require to weigh their selection of comments (K. Hyland &
F. Hyland, 2006).
- If possible teachers should tailor their feedback to suit each student preferences and needs(Ferris
et al., 1997; F. Hyland 2001).
- If tutors could spare some time and organise opportunities where feedback on assignments in
progress may be provided, this would definitely be a valuable form of feedback such as those
provided in LING 6001 at group level and in LING 6011 at individual level in my M.A course.
This may invite further research seeking students’ perceptions, who have received such support,
regarding the effectiveness of such practises. There is also a need of carrying out in depth
research on the said issues regarding feedback to reach some sound conclusions.
References:
Arksey, H., & Knight, P. (1999).Interviewing for social scientists. Thousand Oaks, CA: Sage
Publications.
Chanock, K. (2000). Comments on essays: do students understand what tutors write? Teaching in
Higher Education, 5(1), 95–105.

Journal of Business and Social Review in Emerging Economies Vol. 6, No 4, December 2020
1411
Conrad, S. M. & Goldstein, L. (1999). Student revision after teacher written comments: Text,
contexts and individuals. Journal of Second Language Writing, 8(2), 147–180.
David, C. (2006). Differing perceptions in the feedback process.Studies in Higher Education, 31(2),
219-233.
Dochy, F.J., & McDowell, L. (1997).Assessment as a tool for learning.Studies in Educational
Evaluati on, 23: 279–298.
Enginarlar, H. (1993). Student response to teacher feedback in EFL writing.System, 21(2), 193–
204.
Fathman, A. K., &Whalley, E. (1990). Teacher response to student writing: Focus on form versus
content. In Kroll (Ed.), Second Language Writing: Research Insights for the Classroom.
(pp.178-90). Cambridge: CUP.
Ferris, D. (1995). Student reactions to teacher response in multiple-draft composition
classrooms.TESOL Quarterly, 29(1), 33–53.
Ferris, D. (1997). The influence of teacher commentary on student revision.TESOL Quarterly, 31(2),
315–339.
Ferris, D. (2006). Does error feedback help student writers? New evidence on the short- and long-
term effects of written error correction. In K. Hyland & F. Hyland (Eds.), Feedback in second
language writing: Contexts and issues (pp.81-104). New York: Cambridge University Press.
Ferris, D. &Hedgcock, J. (2005).Teaching ESL composition: Purpose, process, and practice.
Mahwah, NJ: Lawrence Erlbaum.
Ferris, D., Pezone, S., Tade, C., &Tinti, S. (1997). Teacher commentary on student writing:
Descriptions and implications. Journal of Second Language Writing, 6(2), 155– 182.
Fraenkel, J. R., Wallen, N. E., & Hyun, H. H. (1993).How to design and evaluate research in
education. Maidenhead: McGraw-Hill HE.
Gibbs, G. & Simpson, C. (2004).Conditions under which assessment supports students’
learning.Learning and Teaching in Higher Education, 1, 3–31.
Gibbs, G., Simpson, C. & Macdonald, R. (2003).Improving student learning through changing
assessment-a conceptual and practical framework. Paper presented to EARLI
conference. Padova.
Goldstein, L. (2001). For Kyla: What does the research say about responding to ESL writers. In T.
Silva & P. Matsuda, (Eds.), On second language writing. Mahwah, NJ: Lawrence Erlbaum, 73–
90.
Goldstein, L. (2006). Feedback and revision in second language writing: Contextual, teacher, and
student variables. In K. Hyland & F. Hyland (Eds.), Feedback in second language
writing: Contexts and issues (pp. 185-205). New York: Cambridge.
Goldstein, L. & Conrad, S. (1990). Student input and negotiation of meaning in ESL writing
conferences. TESOL Quarterly, 24(3), 443–460.
Hedgcock, J. &Lefkowitz, N. (1994). Feedback on feedback: Assessing learner receptivity to teacher
response in L2 composing. Journal of Second Language Writing, 3(2), 141–163.
Hedgcock, J. &Lefkowitz, N. (1996). Some input on input:Two analyses of student response to
expert feedback in L2 writing. The Modern Language Journal, 80(3), 287–308.
Hester, V. (2001).Responding to student writing: locating our theory-practice mong communities.
Paper presented at the 52nd Annual Meeting of the Conference on College Composition and
Communication. Denver.
Hounsell, D. (1987). Essay writing and the quality of feedback.In J.T.E. Richardson, M. Eysenck, &
D.W. Piper Milton Keynes (Eds.), Student learning research in education and cognitive
psychology. Buckingham: SRHE/Open University Press.
Hounsell, D. (2003). Student feedback, learning and development.In M. Slowey& D. Watson (Eds.),
Higher education and the lifecourse. Maidenhead: Open University Press.
Higgins, R. (2000) ‘Be more critical’: rethinking assessment feedback, paper presented to British
Educational Research Association Conference, Cardiff University, 7–10 September. Retrieved
on May 20 from: http://www.leeds.ac.uk/educol/documents/00001548.htm
Higgins, R., Hartley, P. & Skelton, A. (2001).Getting the message across: the problem of
communicating assessment feedback.Teaching in Higher Education, 6(2), 269–274.
Journal of Business and Social Review in Emerging Economies Vol. 6, No 4, December 2020
1412
Hyland, F. (1998).The impact of teacher written feedback on individual writers.Journal of Second
Language Writing, 7(3), 255–286.
Hyland, F. (2000). ESL writers and Feedback: Giving more autonomy to students. Language
Teaching Research, 4(1), 33–54.
Hyland, F. (2001). Providing effective support: investigating feedback to distance language
learners. Open Learning, 16(3), 233–247.
Hyland, K. (2000). Disciplinary discourses: social interactions in academic writing. London:
Longman.
Hyland, F., & Hyland, K. (2001).Sugaring the pill: praise and criticism in written feedback.
Journal of Second Language Writing, 10, 185–212.
Hyland, K. & Hyland, F. (2006).Feedback on second language students' writing.Language
Teaching, 39, 83-101.
Hyland, K. & Hyland, F. (Eds.) (2006).Feedback in second language writing: Contexts and issues.
New York: Cambridge University Press.
James, D. (2000). Making the graduate: perspectives on student experience of assessment in higher
education. In A. Filer (Ed.), Assessment: social practice and social product. London:
RoutledgeFalmer
Lea, M.R., &Steirer, B. W. (2000). Student writing and staff feedback in higher education: an
academic literacy approach. In M. Lea and B. Steirer (Eds.), Students’ writing in higher
education: new contexts. Buckingham: SRHE/Open University Press.
Leki, I. (1991). The preferences of ESL students for error correction in college level writing
classes. Foreign Language Annals 24(3), 203–218.
Leki, I. (2006). "You cannot ignore": L2 graduate students' experience of and responses to written
feedback practices within their disciplines. In K. Hyland & F. Hyland (Eds.), Feedback in
second language writing: Contexts and issues (pp. 266-285). New York: CUP.
Lizzio, A., &Keithia, W. (2008). Feedback on assessment: students’ perceptions of quality and
effectiveness. Assessment & Evaluation in Higher Education, 33(3), 263–275.
Lizzio, A., Wilson, K., Gilchrist, J., &Gallois, C. (2003).The role of gender in the construction and
evaluation of feedback effectiveness.Management Communication Quarterly, 16, 341–379.
Master, P. (1995). Consciousness Raising and Article Pedagogy. In D. Belcher & G. Braine (Eds.),
Academic Writing in a Second Language: Essays in Research and Pedagogy (pp. 183-205).
Norwood, NJ: Ablex.
Norton, L.S., & Norton, J. C. W. (2001).Essay feedback: how can it help students improve their
academic writing? Paper presented at First International Conference of the European
Association for the Teaching of Academic Writing across Europe (EATAW). Gronigen.
Orsmond, P., Merry, S. &Reiling, K. (2005). Biology students’ utilization of tutors’ formative feedback:
a qualitative interview study. Assessment & Evaluation in Higher Education, 30(4), 369-386
Patthey-Chavez, G., & Ferris, D. (1997).Writing conferences and the weaving of multi-voiced texts in
college composition.Research in the Teaching of English, 31(1), 51–90.
Ramsden, P. (2003). Learning to teach in higher education (2nd ed). London: Routledge Falmer.
Robb, T., Ross, S. &Shortreed, I. (1986).Salience of feedback on error and its effect on EFL writing
quality.TESOL Quarterly, 20(1), 83–93.
Rubin, H., & Rubin, I. (1995).Qualitative interviewing: The art of hearing data. Thousand Oaks,
CA: Sage Publications.
Saito, H. (1994). Teachers’ practices and students’ preferences for feedback on second language
writing: A case study of adult ESL learners. TESL Canada Journal, 11(2), 46–70.
Vygotsky, L. (1978) Mind in Society: The Development of Higher Psychological Processes.
Cambridge, MA: Harvard.
Williams, J. (2004). Tutoring and revision: Second language writers in the writing center.
Journal of Second Language Writing, 13(3), 173–201.
Young, P. (2000). I might as well give up: self-esteem and mature students feelings about
feedback on assignments. Journal of Further and Higher Education, 24, 409–418.
Zamel, V. (1985).Responding to student writing.TESOL Quarterly, 19(1), 79–101.
Zhu, W. (2004). Faculty views on the importance of writing, the nature of academic

Journal of Business and Social Review in Emerging Economies Vol. 6, No 4, December 2020
1413
writing, and teaching and responding to writing in the disciplines. Journal of Second
Language Writing, 13 , 29–48.

Journal of Business and Social Review in Emerging Economies Vol. 6, No 4, December 2020
1414

Journal of Business and Social Review in Emerging Economies Vol. 6, No 4, December 2020
1415
Volume and Issues Obtainable at Center for Sustainability Research and Consultancy
Journal of Business and Social Review in Emerging Economies ISSN: 2519-089X (E): 2519-0326
Volume 6: No. 4, December 2020
Journal homepage: www.publishing.globalcsrc.org/jbsee
Corporal Punishment Act in Public Schools: A Phenomenological Analysis of
Perceptions of Practitioners
1Nargis Abbas, 2Beenish Ijaz Butt, 3Uzma Ashiq 1Assistant Professor, Department of Education, University of Sargodha, Pakistan,
[email protected] 2Assistant Professor, Department of Social Work, University of Sargodha, Pakistan,
[email protected] 3Lecturer, Department of Social Work, University of Sargodha, Pakistan, [email protected]
ARTICLE DETAILS ABSTRACT History Revised format: November 2020 Available Online: December 2020
Corporal punishment (CP) is a conspicuous and serious matter of
Pakistani schools. In response to this prevalent social problem the
government of Pakistan like other countries has legislated against
corporal punishments through Corporal Punishment Act, 2010 which
restricts CP of every type in all educational institutes of the country.
The said policy was promulgated to secure the child rights in the
country but the flip side of the policy presents a different picture.
This paper aims at investigating challenges faced by of the
elementary public-school teachers as policy practitioners about the
ban on corporal punishment by the government. This paper is based
on qualitative social research methodology and used
phenomenological research approach. Phenomenological interviews
were used to collect the data until data reached at saturation. The data
was analyzed by following the overall process guided by Creswell.
Major derived themes from data were Perceptions of teachers
regarding ban on Corporal Punishment, Post Corporal Punishment
Legislation Challenges and Opinion of teachers regarding
Government policy on CP followed by several sub-themes. It was
concluded that the state vision to promote child welfare is hardly seen
through its policies as at the end the welfare of the target group must
be assured not doubted.
© 2020 Center for Sustainability Research and Consultancy Pakistan
under a Creative Commons Attribution-NonCommercial-ShareAlike
4.0
Keywords Corporal punishment,
teachers, students, discipline,
state
JEL Classification
M10, M12
Corresponding author’s email address: [email protected]
Recommended citation: Abbas, N., Butt, B. I. & Ashiq, U. (2020). Corporal Punishment Act in Public
Schools: A Phenomenological Analysis of Perceptions of Practitioners. Journal of Business and Social
Review in Emerging Economies, 6(4), 1415-1425
1. Introduction
Corporal punishment is a documented problem of several societies around the globe. In schools,
corporal punishment (CP) considers to be an effective solution for children for the sake of guidance. The
cane is most common gadget in this regard of child betterment. In Asia, Europe and the European
colonies this cane was also known as junior or light cane that used to be compulsory in the classroom in
the 19th to 20th centuries, to oversee young school children. Another term “spanking” is also found in

Journal of Business and Social Review in Emerging Economies Vol. 6, No 4, December 2020
1416
literature which means “hitting a child on their buttocks or extremities using an open hand” (Gershoff &
Grogan-Kaylor, 2016, pg. 453) However, in Human Rights Activists’ vision, corporal punishment is a
torture. In their observation physical punishment is a form of domestic violence as well as child abuse to
defend human rights. While, for South Asian children, the corporal punishment is a usual concept in
their routine life of at domestic level, in institutes, at work and in neighborhoods. Although, the
Convention on the Rights of the Child (CRC) states that young ones are respectable having equal right to
honor and respect. Whereas, in South Asian countries CP is thought to be mandatory for child’s
development, to aid in cognition and to maintain order (UNICEF, 2012). Such is the commonly
observed belief in public sector schools of this region like India, Pakistan, Bangladesh, Nepal and
Afghanistan. In contrast to the above said situation, defenders of physical punishment assert that
utilization of sticks is responsible for extraordinary outcomes in children. Absence of corporal
punishment, when students will reach till high school, they will be more rebellious and the school would
slide into chaos (Mararike, 2005). Fournier (2004), a French educational expert, supported physical
punishment by saying that spanking should alone not be used in education. The USA Criminal Code
explains power to be used by a parent, a guardian or any other responsible person consider in their
honest opinion when it is gravely needed for looking after or advantage of that young one in order to
rectify his/her misconduct. Moreover, defenders of corporal punishment claim that those students give
best who receive corporal punishment and they believed without corporal punishment pupils become
more disrespectful by the time that come to high school level (Marairke, 2005). It is believed that
teacher's corporal punishment is a source of maintaining discipline and shaping the behavior of children.
Customary ways of life provide conformity to the effectiveness of corporal punishment (Raj, 2011).
Traditional believe about the concept of corporal punishment confirmed that it is the best way to shape
the behavior of children (Shmueli, 2010).
On contrary, an extensive body of research also revealed corporal punishment as an ineffective way of
handling the matter rather it is detrimental, destructive and injurious to the personality of the child.
Corporal punishment or canning in earlier years of school causes high level of aggression, anxiety,
depression, anger and sometime serious psychological issues with the students in later years of school
and even in their practical life (Gershoff et al., 2018, Gershoff et al., 2019). Corporal punishment makes
the children aggressive, anti-social and lemmatizes their internal skills. Further, these effects persist
across the cultural, familial and geographical boundaries. As Gershoff (2002) concluded about the long-
term effects of corporal punishment. Corporal punishment increased child delinquency, moral
internalization, as well as antisocial and aggressive behavior among children.
Pakistan has signed the UN pact on the entitlement of children, mentioning all judicial and management
steps should be taken to assure law making for providing defense of children (UNCRC, 1990). However,
in case of Pakistan, corporal punishments have occupied schools for nearly more about one and half
century. In this case, multiple incidents had been reported from government/non-government schools,
maracas) wherever punishments are institutionally deep-seated. Moreover, it is estimated that due to CP
nearly 35,000 Pakistani students are unable to continue their education and out of every five students,
four are susceptible to fathers/mothers, instructors and elders (Hadi, 2014).
Corporal punishment is a conspicuous and serious matter of Pakistani secondary institutes. It is obvious
from documented report as, “Corporal punishment remained dominant in enormous number of
secondary institutes with sticks, shoes, scales, iron bars and poles. For most of times this beating
resulted in complicated injuries and the reason behind this punishment was unavailability of required
textbook, mistaken answer to a question and incomplete assigned work (Human Rights Commission of
Pakistan, 2003, p. 308).
In response to this prevalent social problem the government of Pakistan like other countries has
legislated against corporal punishments through Corporal Punishment Act, 2010 which defines corporal
punishment under section 3.2 as
Corporal punishment of every type is outlawed in all educational institutes either formal
or informal, government or non-government institutes, and in government based or non-
government children supervision centers such as foster homes or any of such sorts.
But in the next section 3.3 it is stated that
Journal of Business and Social Review in Emerging Economies Vol. 6, No 4, December 2020
1417
Disciplinary steps and reforms that concerning the children must be carried out without
influencing that child’s self-esteem and never should any action of corporal punishment
be taken that demolishes a child’s physical or psychological well-being or sentiments of a
child.
The private sector schools, prior to this act, have already taken actions and prohibited the physical
punishment to the students in order to maintain their standards with American and European system of
education. While, there are mixed views of teachers on the ban of corporal punishment in schools,
especially in public schools running under the supervision of government. Some of the public-school
teachers favored this ban and they felt that it is a good sign because it reduces fear among student and
enhances their critical and analytical thinking. It also reduces drop out ratio because many students leave
school due to the fear of punishment. On the other hand, some of the participants were against this ban.
According to them, it is needed because without the fears of punishment student don’t obey the rules and
regulation, it also has negative effects on their study.
The government of Pakistan has taken social and administrative measures to ban corporal punishment in
all educational institutions and raise the slogan "Maar Nahi Piyar" to secure the right of children against
corporal punishment. In this regard, various efforts were made. A bill was presented the National
assembly of Pakistan to make the provisions for the prohibition of the Corporal punishment against
children entitled “Prohibition of Corporal Punishment Bill, 2014”. On the provincial level, provincial
governments of provinces of Pakistan also took the initiatives to stop the corporal punishments in the
schools. For example, in 2016, government of Sindh passed the bill of corporal punishment which later
promulgated as an Act No. VII of 2017 “Sindh Prohibition of Corporal Punishment Act, 2016”.
Similarly, the government of Khyber Pakhtunkhwa also initiated the decision to ban on the corporal
punishment and enforced the act “The Khyber Pakhtunkhwa Child Protection and Welfare Act, 2010”
(Khyber Pakhtunkhwa Act No. XIII of 2010).
Corporal punishment is a matter of concern for the students, teachers, school administration and the
policy makers. As it is a common practice of schools to punish the students when their discipline and
academic achievement is in danger. But to secure the physical, social and psychological rights of
children, CP has been banned by the Government of Pakistan like other countries. But the flip side of
this situation may present a different picture. When the said policy is seen in case of school discipline, it
is prohibited to a teacher to physically punish a student and at the same time they have to develop them
as disciplined and civilized member of the society. Such situation has created a challenge for the teacher,
as his perception and belief may affect his commitment to practice this ban in true letter and spirit. This
arises the question that how do policy practitioners perceive the ban on corporal punishment? What
problems are related to policy practitioners regarding corporal punishment ban in secondary education
institutes? To answer these research queries, the present work explained and explored the efficiency of
Corporal Punishment Policy in district Sargodha.
2. Objectives of the Study
The research work was comprised of following objectives.
1. To investigate the perception of the teachers as policy practitioners regarding ban enacted by the
government on corporal punishments in schools.
2. To explore the factors which hindered the policy practitioners to implement the corporal
punishment.
3. Methodology
To explore the said issue, a qualitative phenomenological research approach was used. Therefore, a
criterion sampling technique was adopted for this study because it is the suitable strategy to get rich
information from a smaller number of participants which are selected on the predetermined criteria. Here
in this paper, the predetermined criteria was the ten years of working experience in public elementary
schools. There are seven tehsils in the Sargodha district, therefore, at first stage three tehsils were
selected which were having greatest number of elementary schools, these were Sargodha (141 schools),
Silanwali (57 elementary schools) and Kotmomin (40 elementary schools).
Journal of Business and Social Review in Emerging Economies Vol. 6, No 4, December 2020
1418
Afterwards, 10 teachers fulfilling the criteria of the study from ten schools from each tehsil were
selected. Total 30 teachers were interviewed till the saturation of the data occurred. These
phenomenological interviews were primarily based on open-ended questions. The duration for each
interview was 40 to 50 minutes, and a prior permission from the school heads and consent of the
interviewees were obtained.
The data was analyzed by following the overall process guided by Creswell (2013). The similar ideas
and themes were generated from the data and was presented through the major themes.
4. Results & Discussion
The themes were emerged from the 30 interviews collected from the public sector elementary school
teachers. The interviewees were requested to express their perception about the ban on corporal
punishment. The major themes and the sub theme emerged from collected data are explained in this
section.
4.1 Theme 1: Perceptions of Teachers regarding Ban Corporal Punishment
Before the ban on corporal punishment, it was considered as a method of discipline that creates fear
among child and increases a child's capability to be an independent and responsible individual. In the
public elementary schools, corporal punishment was the major tool to keep the children in control.
Conventional corporal punishment is not in practice now a days as the disciplinary actions in most of the
schools. It has been replaced by the alternative forms of the punishments such as; community services,
additional study assignments after school time, in-school suspension etc.
4.2 Sub Theme 1: Behind the Curtain: Practice or Ban
It was found that most of the teachers of the public elementary school applying corporal punishment
instead of its ban to control the class. In their view, without corporal punishment they cannot maintain
the class discipline means. Although corporal punishment is banned in schools, there are no hard and
fast rules to monitor this in our schools. There are many other ways to punish the children e.g. gives
them mental stress, discriminatory behavior, slapping, and abusing, etc. In Pakistani cultural context,
there are many laps in the socialization of children in the household and society level. Children are
trained in a say they don't bother anything without the fear of punishment at both household and school
level. When were asked about the practice of corporal punishment in their school, most of them were of
the view that;
Yes, sometimes, I practice corporal punishment because we cannot handle the students in
the class so I prefer to use mild corporal punishment. It is done on school’s directions
which permit us to punished students without any harm.
Another participant explained
Yes, it is practiced in our school and I had also practiced it because it used by the teachers
when all method became fail to improve the academic performance of students, so I
prefer to use corporal punishment for some students.
Some other stated as,
No, there is no use of corporal punishment in our school and all of the teachers in our
school are restricted to treat with students in a lenient way.
Although many teachers explained their practice of using corporal punishment, others are following the
ban.
4.3 Sub Theme 2: Personal Views of Teachers about Corporal Punishment
It has generally assumed that corporal punishment is essential to for students to learn discipline and
helps them to achieve educational tasks during the academic session. The discipline is considered as a
branch of teaching that improves self-discipline and helpful in personality development. However,

Journal of Business and Social Review in Emerging Economies Vol. 6, No 4, December 2020
1419
corporal punishment is necessary or not necessary for discipline maintenance, in this context participants
gave their personal views and explained that
Yes, I think corporal punishment is necessary to maintain the discipline because students
do not obey the teachers without punishment that's why punishment is necessary to
control the harsh behavior of students. When schools paddled children who misbehave,
the children behave better. Therefore, I believed if teachers will leave corporal
punishment it will spoil the students.
Another opined that,
According to me up to some extent, it is necessary to maintain the discipline at school
because sometimes you cannot control the student behave accordingly. They don't
understand your point and don’t obey you so; I consider corporal punishment is necessary
for some times.
Another explained that
No, I never ever think that corporal punishment is necessary for any institution to
maintain the discipline not only for our institution but all other educational institutions or
madrassa physical punishments do not fit properly, but, I believe we use alternative
method of discipline instead of corporal punishments so, as it is in Islam against the use
of physical force and our Holy Prophet PBUH also used the way of love to convince
people and our religious also teach this thing. If we use physical force to maintain the
discipline it creates a negative impact on children and they teach this thing or practice at
home that's why I have never favored the use of corporal punishment in any institutions.
Another clarified that
Corporal punishment is not needed because it damages the personality of student and
students are discouraged when teacher or give any other kind of punishment. I know that
it is difficult to maintain discipline without punishment, but I use different strategies to
manage it. I think that it is the right decision of the government for the welfare of
students. It is good because due to corporal punishment students become rebels and it
affects their study so I believe that you can teach moral values; ethics to students instead
of punishment’ ever since punishment is most dangerous for the student's career and also
for the nation.
Another teacher explained that
It is a good step and it also encourages the slogans of "Maar Nahi Pyaar" because
sometimes teachers used so much punishment to handle students because they think the
punishment is the only way to control the students and it also effects on the student mind,
as a result, they even deviate from their goal in spite of being better.
Most of the teachers replied that corporal punishment is necessary to improve the condition of
students. They also said that it should be applied only when all other alternative disciplinary measures
are failing to improve the discipline condition.
4.4 Sub Theme 3: Corporal Punishment Ban and Practitioner’s Awareness
When respondents were asked about the Corporal Punishment Act, 2010, they stated that,
Yes, I know about the corporal punishment Act 2010 that imposed ban on corporal
punishment. The punishment was banned for students because at that time a lot of
incidences happened related to child’s corporal punishment. Even some children died due
to the excess of corporal punishment. So, the government passed the rule and make this

Journal of Business and Social Review in Emerging Economies Vol. 6, No 4, December 2020
1420
Act for child protection, and according to this act, teachers follow the "Maar Nahi Piyar"
policy to deal with students in school.
Another opined,
Yes, I am aware of this I have read many times this slogan" Maar Nahi Piyar" (love
instead of punishment) written on the walls and boards of schools. But I am not aware of
enacted law by the government.
Another participant explained that
I know about in the news that corporal punishment is outlawed. But, I do not have any
exact evidence of the prohibition.
Another respondent said,
The law passed by the National Assembly could not apply in every context.
I have seen in an update that corporal punishment is not allowed, but, our school
administrator had not given any information on the prohibition of corporal punishment.
We use corporal as usual.
Most of the participants stated that they have no clear information about the ban and very few
participants are aware of this law.
5. Theme 2: Post Corporal Punishment Legislation Challenges
The data from the interviews revealed that there is a lot of problem and challenges faced by the teachers
for the implementation of the ban on corporal punishment.
5.1 Sub Theme 1: Post Corporal Punishment Legislation Problems of Teachers
The ban on the corporal punishment create problems for teachers as they cannot maintain discipline or
enhance the performance of students as compared to before the ban so it also affects the teacher's
performance as well. Some teachers indicated that,
I also perceived various challenges in the implementation of the policy because after the
ban on corporal punishment I face negative attitude of the students in form of
misbehavior and get poor performance because the students have no fear of punishment
or they become careless.
I think teachers feel powerless after the ban. The rule that we cannot expel students has
created so much disorder in schools that we cannot perform our essential duties. Further,
they consider that the new discipline pattern is not in the best interest of students. It has
become increasingly difficult for teachers to discipline and motivate students to work
hard in their studies.
Many participants explained that in our society the ban of punishment created many problems
regarding discipline and education performance of students. But now the problem is fear of school
administration revolves around FIR and fine in case of using corporal punishment. In this context, some
teachers indicated that
They avoid corporal punishment to protect the positive image of their school because
they are afraid about police involvement on the school campus as the news spread rapidly
on mass media.
Another explained that
Journal of Business and Social Review in Emerging Economies Vol. 6, No 4, December 2020
1421
I think alternative measures are good, but the problem is that teachers are not properly
applying these alternatives as compared to corporal punishment because this was simply
presented to educators without training.
Another teacher indicated that
Ban on corporal punishment is not fruitful for students’ personality grooming in schools. As I
notice that after the ban of corporal punishment, students use to talk to us in a frank manner
which was not observed previously. Even some students make fun of teachers and they cannot
say anything due to this ban. Teaching is the most respectful profession and as teachers we are
used to receive respect always so on such moments we feel, helpless, disgraced and angry. But
we have to control over anger because no such complaint is received by the school
administration. We are teachers but we feel as students of this generation lead us.as a result,
students are missing the required socialization f their time.
5.2 Sub-theme 2: Current Discipline Condition in Public Elementary Schools
Corporal punishment is given to the students to maintain discipline and their performance. The purpose
of corporal punishment is also to correct the behavior of children and maintain and order in the school.
Many participants explained that after the ban of a corporal punishment a lot of issues regarding
discipline occurred. In this context, a teacher explained that
It is very difficult for me to maintain discipline in class and I have faced serious cases of
indiscipline by the students. There are a lot of cases of student's misbehavior and they
beat another innocent fellow student when I go out the class. Now they have no fear of
punishment thus maintaining the discipline is quite difficult in the class.
It is clear from the above statement by the teacher that it is difficult to maintain discipline in
class in the absence of corporal punishment. Other teachers opined that
"I think before this ban students were paying more attention to their studies and were
well-disciplined because they have a fear of punishment, but after the ban, they feel free
from punishment and not attend a lesson attentively or do not perform better in the class.
But now the students misbehaved with teachers because they know the teacher cannot
punish them. This behavior of students is very bad for the student's future".
"I perceived that before the ban teachers were freely punishing their students, how much
they want they punish, and sometimes some teachers used very worst methods for
discipline, but after the ban, I use alternative strategies of discipline to maintain and one
rule the students. Because now teachers cannot easily just a slap to students because they
have a fear that they can be arrested in case of corporal punishment".
No, but sometimes if any student behaves rudely, I can handle this situation with different
techniques like counseling. Children in the primary section are in search of love. If they
do not find love, or if they find harsh words or harassment from someone then they show
misbehaved sometimes. So, I handle this situation very calmly. I show them care, love
and benevolence. Because I think the teacher should handle this situation very carefully.
Most of the participants indicated that they are facing difficulties to ensure discipline in class
after the ban on corporal punishment. Some teachers were frustrated to give up the responsibility of
maintaining discipline in class because they think the alternative discipline measure is not working
effectively as corporal punishment. On the other hand, some public elementary school teachers
mentioned that their class discipline is good because they use small curriculum activities to engage the
students in class.

Journal of Business and Social Review in Emerging Economies Vol. 6, No 4, December 2020
1422
5.3 Theme 3: Opinion of Teachers regarding Government Policy on CP
The majority of the participants did not support the ban on corporal punishment as they were of the view
that this ban increased indiscipline in schools. Consequently, all of the participants specified that light
punishment should be needed enough to change unwanted behavior. But they also argued that
punishment should never take a severe form.
5.3.1 Sub Theme 1: Perceptions of Teacher’s towards Policy Implementation
The purpose of this theme is to explain the teachers’ perceptions about the policy which imposes ban on
corporal punishment. The data revealed that most of the teachers were not contented with the ban on
corporal punishment. As many of them mentioned that,
No, I am not satisfied with the government policy and government should not ban it
totally because if the child has no fear of punishment they cannot take an interest in the
study so I believe that rules must be flexible that teacher would not beat the student
harshly but they create fear of punishment in their heart through light punishments.
I think government policy regarding the ban on corporal punishment is not suitable for
existing situations because now students become spoiled due to social media so
sometimes teachers required punishing them but it should not exceed to beating.
The participants revealed that policy to ban corporal punishment is creating difficulties for
teachers to maintain discipline because some of the teachers are not trained to use another alternative
method of discipline.
Some other public elementary school teachers pointed out that present corporal punishment
policy is a good initiative by the government. They further explained that
Yes, I am satisfied somehow because it is good for those government schools where
teacher taking extra advantages or badly beat; thus creating a bad effect on student’
health.
Teachers opined that government policy on corporal punishment ban is one-sided because it only
favors students. They think that before the ban on corporal punishment they can easily tackle students'
learning and behavior problems. Though after this legislation, now they are facing many problems
regarding discipline management in class. So they believe it has affected the whole school environment.
5.3.2 Sub Theme 2: Participants' Opinion regarding the Modification of Policy
When teacher as policy practitioners were asked about the modification of policy, they opined that
Yes, according to my opinion, it should be modified because every policy has some
positive or negative impact after its implementation so its non-beneficial aspects should
be modified. Moreover teachers’ opinion should also be included in policy formulation.
Another said that
Government should modify such policy and should not generalize it. The action should be taken
for only those teachers who physically injure the student, but not for those who use such light
punishment that enhances the performance of the student".
Some other participants mentioned that
Yes, I think it should be changed and punishment should allow during the school because
nowadays children become spoiled so light punishment should be allowed for their rude
behavior
Some participant favored such corporal punishment policy as they explained
Journal of Business and Social Review in Emerging Economies Vol. 6, No 4, December 2020
1423
No, I think, so it is good policy or never change it because it helps me to establish a
positive learning relationship with students that based on mutual respect and respect for
the right of the other.
Teachers are in the favor of modification of policy and they also wanted to be a part of policy
formulation.
5.3.3 Sub-theme 3: Participants Suggestion regarding the Policy Implementation and Modification
When teachers were asked to give suggestion regarding the policy implementation and modification
most of them presented the following suggestion
I suggest that mild corporal punishment should be allowed in schools and must be applied
by the teachers because students do not pay attention in their studies without punishment.
I think the mild corporal punishment is an effective and successful way of maintaining
discipline and strengthening students' academic achievement because the students
complete their homework and perform well in daily/weekly inspections as a result of light
corporal punishment. Therefore, I believe that mild corporal punishment should be
applied.
I suggested that policy implementation should be in such a manner that students and
teacher do not feel humiliation in adopting such polices or teacher must be guided how to
face learner or behavior problem of students.
I would like to suggest that the government should build a practical mechanism to follow
the practice of educational policies in school. Further, I believe a teacher should be taught
in a humble and lenient way and avoid harsh punishment because which thing is possible,
that can be done by the lenient way so why we use harsh and hard way. There should be
legal action against those and schools where harsh punishments constantly used.
Another participant suggested that
I think after the ban on corporal punishment government should invest more for the
training of the teachers to raise their knowledge on making their teaching effective and
attractive through the use of other alternative discipline methods to cope up with this
serious problem.
The most of the teachers recommended that corporal punishment should be reduced, but not be banned
because teachers generally felt disempowered in their ability to handle the class. In explaining the reason
of it, they opined that the mild punishment may provoke fear and respect for teachers among them which
will help in improving the learners’ academic achievement. Furthermore, they added that remidial
classes, additional work assignments, daily or weekly assessments would be in practice as an effective
strategies to tackle the behavioral issues of the students and those who show poor performance.
Moreover, the government should implement policy in such a way that is acceptable for both students
and teachers. They believed that the use of mild corporal punishment to manage class discipline does not
go against any law and it played an important role in increasing the performance of students at the
primary school level.
7. Conclusion
Corporal punishment of students in different countries has been perceived as a serious concern of the
governments resulted in the implementation of corporal punishment policy which strictly bans such
punishments. The same scenario was observed in Pakistan when it banned corporal punishment under
Corporal Punishment Act, 2010. Though the policy was implemented to save children from cruel
punishments at different places, we discussed it at primary school level. The purpose of this article was
to study the perception and the problems faced by the teachers as policy practitioners with regard to ban
on corporal punishment. They confront certain challenges and face problems in its implementation. The

Journal of Business and Social Review in Emerging Economies Vol. 6, No 4, December 2020
1424
conclusion of this paper reveals that the said policy was implemented by the state as rights-based
principle. As Pakistan was a signatory of international treaties so it had to implement such policies under
the international umbrella. It followed the pattern of other countries that banned CP without realizing the
consequences. Moreover, the pressure groups like child welfare non-profit organization lays a great
stress on state to pass such laws. Some groups consider media as a pressure group; but it has just a
catalytic action in the society. To be more concise, the state vision to promote child welfare is hardly
seen through its policies as at the end the welfare of the target group must be assured not doubted.
During the policy formulation, the policy stakeholder’s opinion is always welcomed to secure the
chances of its success; but it was not the case in corporal punishment policy. Teachers as one of the
stake-holder are of corporal punishment policy; are seen mostly reactive with corporal punishment
policy. It is an imposed model which does not include teachers’ opinion as they are the policy
practitioners and have to face the consequences of the policy first. If by chance there is teachers’
inclusion for some policy discussions, teacher’ union representatives are called who are selected on
votes not due to teaching performance. Despite the fact physical social and mental torture should not be
allowed, teachers are vulnerable when they have to deal with a group of students without the
authorization of discipline maintenance. Their authorization in the public elementary schools is
restricted to a level that they are not allowed to socialize the students against their will. This creates
desperateness in this auspicious profession. In the light of these conclusions, it may be suggested that
government might address the problem of corporal punishment in school by having a broader
recognition of the problem. The cases of different children might be dealt differently by a collaborative
group of teachers, parents and administration. The policy should deal the school students in different
manner to secure their future. The policy should be amended to facilitate the teachers and maintain the
discipline of the schools.
References Creswell, J. W. (2013). Qualitative inquiry and research design: choosing among five approaches (2nd
Ed.). Thousand Oaks, CA: Sage.
Fournier., J. L. (2004). Mouchons nos morveux, Pour ou contre la fessée. Livre de Poche Paris: SARI.
Gershoff, E. T., & Grogan-Kaylor, A. (2016). Spanking and child outcomes: Old controversies and new
meta-analyses. Journal of Family Psychology, 30, 453–469.
Gershoff, E. T., Goodman, G. S., Miller-Perrin, C. L., Holden, G. W., Jackson, Y., & Kazdin, A. E.
(2018). The strength of the causal evidence against physical punishment of children and its
implications for parents, psychologists, and policymakers. American Psychologist, 73(5), 626–
638
Gershoff, E. T. & Bitensky, S. H. (2007). “The case against corporal punishment of children:converging
evidence from social science research and international human rights law and implications for
U.S. public policy. Psychology, Public Policy and Law. 13(4): 231-272.
Gershoff, E. T., Goodman, G. S., Miller-Perrin, C., Holden, G. W., Jackson, Y., & Kazdin, A. E. (2019).
There is still no evidence that physical punishment is effective or beneficial: Reply to Larzelere,
Gunnoe, Ferguson, and Roberts (2019) and Rohner and Melendez-Rhodes (2019). American
Psychologist, 74(4), 503–505. https://doi.org/10.1037/amp0000474
Hadi, H. (2014). Corporal punishment: heralding discipline or psychological ill health? JPMS Medical
Blogs. Retrieved from https://ecommons.aku.edu/pakistan_fhs_son/297
Mararike, C. (2005). Spare the rod, save the child. Johannesburg IRIN.
Raj, L. (2011). Understanding corporal punishment in India. Career Educator: An Interdisciplinary
Education Journal, 1 (1), 3-18.
Shmueli, B. (2010). Corporal Punishment in the Educational System versus Corporate Punishment by
Parents: A Comparative View. Law and Contemporary Problems, 73, 281-320.
UNICEF (2012). Child discipline: The challenges and progress. Retrieved from
http://www.childinfo.org/discipline.html.
Sindh Provincial Assembly (2017). Retrieved from
http://www.pas.gov.pk/uploads/acts/Sindh%20Act%20No.VII%20of%202017.pdf on May 05,
2019.

Journal of Business and Social Review in Emerging Economies Vol. 6, No 4, December 2020
1425
KPK Child Protection Act (2010). Retrieved from
http://kp.gov.pk/uploads/2016/02/2._Child_Protection_and_Welfare_Act,_2010_.pdf
On May 05, 2019.
Pakistan National Assembly (2010). Retrieved from
http://www.na.gov.pk/uploads/documents/1397730810_455.pdf on May 05,

Journal of Business and Social Review in Emerging Economies Vol. 6, No 4, December 2020
1426
Journal of Business and Social Review in Emerging Economies Vol. 6, No 4, December 2020
1427
Volume and Issues Obtainable at Center for Sustainability Research and Consultancy
Journal of Business and Social Review in Emerging Economies ISSN: 2519-089X (E): 2519-0326
Volume 6: No. 4, December 2020
Journal homepage: www.publishing.globalcsrc.org/jbsee
Assessing Mathematics Teachers’ Dispositions
1Khadijah Batool, 2Muhammad Anwer, 3Muhammad Shabbir 1Phd Scholar, University of Education Lahore, Pakistan, [email protected]
2Assistant Professor University of Education Lahore, Pakistan, [email protected] 3Assistant Professor, Govt. College University Faisalabad, Pakistan, [email protected]
ARTICLE DETAILS ABSTRACT History Revised format: November 2020 Available Online: December 2020
The study was aimed at comparison mathematics teacher’s
dispositions at secondary level. The research was conducted to
distinguish the difference of disposition among teachers on male and
female basis as well as on their academic qualification base. One
hundred and twenty teachers who were teaching mathematics at
secondary level were selected. Data were gathered through stratified
sampling technique by administering the questionnaire. The results
indicated a statistical difference exist among mathematics teachers on
gender basis and also with respect to their qualifications as well
within groups. When comparing the mean scores results of the study
depicted a significant effect of gender and qualification on teacher’s
dispositions towards mathematics. (p<.05). The results of this
research indicated that bulk of teachers had significant difference of
dispositions towards self, students and insignificant difference of
disposition towards colleagues. In addition, the in-service teachers’
DIPS vary and also significant on the basis of their qualifications. It
is recommended that larger sample should be taken from public and
private school to check and improve teacher’s dispositions. This
study should also be carried out on college and university level to
assess and enhance teachers’ dispositions.
© 2020 Center for Sustainability Research and Consultancy Pakistan under
a Creative Commons Attribution-NonCommercial-ShareAlike 4.0
Keywords theoretical models, standards
of disposition, disposition.
JEL Classification
M0, M1
Corresponding author’s email address: [email protected]
Recommended citation: Batool, K., Anwer, M. & Shabbir, M. (2020). Assessing Mathematics
Teachers’ Dispositions. Journal of Business and Social Review in Emerging Economies, 6(4), 1427-
1437
1. Introduction
Disposition can be defined in terms of trust which motivates someone to act and react (Biber, Tuna, &
Incikabi, 2013). Mathematical disposition identifies an individual's psychological capacity. According to
(Beyers) 2011 Mathematical disposition is divided into 3 perspectives (1) Cognitive, (2) Affective, and
(3) Conative. The National Research Council explains mathematical disposition as the inclinations
towards mathematics and consider it both valuable and advantageous, to accept that getting mathematics
knowledge is profitable, and to help an individual to consider himself as an oneself to be a powerful
student and practitioner of math" (2001, p. 131) dispositions of teachers most probably reveal educators
professional skills and techniques. It shows instructors' frames of mind, conduct and set of qualities is
reliant on their expert learning. The National Accreditation Council for Teacher Education (2001)

Journal of Business and Social Review in Emerging Economies Vol. 6, No 4, December 2020
1428
describes "beliefs, potentials, responsibilities, and expert morals that impact practices toward pupils,
families, partners, and organizations that influence pupils learning, inspiration, and advancement and
also the teacher's very own proficient development". “Qualities of people, such as frames of mind,
convictions, interests, appreciative nature, qualities, and abilities to modify according to change"(Taylor
and Wasicsko ,2000). Disposition is a framework of conduct which is often shown in the nonattendance
of stress that is a conscious and unconscious one.
A report from European Commission highlights (Eurydice, 2011) Change activities in mathematics are
an immediate reaction to the manners in which subject was being taught (Cobb, Wood, Yackel, 2012).
Researchers depicting an old mathematics classroom, in which procedural type issues are both taught
and learnt. Cobb (2012) expressed that "mathematics in institutions regularly has the nature of
guidelines or principles and rules for some pupils," rather than an attention on understanding
mathematics ideas. Additionally, Boaler (2016) who did research on two schools that utilized various
instructional practices, in the school that engaged with old practices, critical thinking in classrooms.
Researching on non-contextual reading material issues may likewise pupils are occupied with study
related material.
It is proposed that these kinds of procedural mathematical exercises center around low level intellectual
abilities, for example, reviewing, , or recognizing numerical figures. Such exercises infrequently request
that pupils to go beyond the techniques so they might be difficult to understand conceptual things
(Bushman and Bushman 2004).
Besides, Boaler's (2016) research featured, pupils in the conventional study hall frequently pay attention
to teachers’ lectures and afterward rehearsed the issues that were displayed by the instructor. In such
sequence such as questions, and assessment, pupils don't generally examine arithmatics thoughts, nor do
they build mathematics conceptual understandings, yet are associated with what Richards (2011) called
such a number talk which includes the discourse.
Sometimes students may not involve in classroom discussions. In this way they cannot get the
advantages that can be achieved by communicating, for example, to get a chance to explain one's
mathematical thinking. The responsibility of a teacher in classrooms is to deliver knowledge clarify
thoughts, explain processes and give them time to rehearse the methods (Hiebert, 2007).
It is stated that educators in such customary classrooms show strategies or calculations by demonstration
methods for pupils (Bushman and Bushman, 2014). In these study halls, pupils frequently have to listen
carefully what is said by teacher while the instructor is the practitioner (Lockhead, 2011). This may be
called as educators are just delivering knowledge while pupils get it. In Boaler's (2002) study, despite
the fact that the instructors in conventional study halls knew the courses, they were committed also. Old
mathematical study halls are portrayed by instructor focused action, (for example,) utilizing strategies,
rules, or methods to tackle issues.
1.1 A Critique of Traditional School Mathematics
Teachers of arithmetic criticized the old method of teachings mathematics (Boaler, Wiliam, & Brown
2007). They have utilized such terminology as process related comprehension and theoretical
understanding to allude to the information probably created in conventional and change conditions. This
part intends to clarify what analysts think by theoretical and practical agreement and it was necessary to
comprehension and applied comprehension for thinking chances.
Developing teachers’ teaching techniques in analytical thinking, to improve students’ dispositions
towards arithmetic reasoning.
1.2 Switching Process Comprehension to Conceptual Understanding It is recognized the "cycle of comprehension" as connecting mental portrayals through thinking
(Sierpinska, 2014). Skemp (2006) contended for two sorts of comprehension in arithmetic, "social
Journal of Business and Social Review in Emerging Economies Vol. 6, No 4, December 2020
1429
comprehension" (reasonable) and "instrumental comprehension" (procedural). It would be "depicted as
'rules short of reasons', short of understanding for some pupils, educators consider such regulations, and
capacity to utilize it, was what they implied by 'understanding'. Skemp (2006) explained about learning
social science, expressing it "comprises of working up an applied structure (diagram) from which its
holder can (on a fundamental level) produce a boundless number of plans for getting from beginning
stage inside his pattern to any completing point"
2. Theoretical Models and Definitions
The inclusion of disposition evaluation in the NCATE standards created a rush to assess a quality not yet
fully operationalized. While this rush may have clouded efforts to establish a coherent understanding of
the concept, it also initiated a discussion in which all schools of education have a vested interest (Borko,
2007). Grounding this discussion is a body of literature establishing various theoretical approaches
recommended for teacher education institutions to consider in developing definitions, educational
experiences, and assessments of dispositions.
2.1 Theoretical Models
Some arguments about the nature of dispositions vary along a spectrum between dispositions
characterized as innate and immutable traits, and dispositions 9 characterized as subject to growth and
development. The existence of an identifiable set of traits and that all students, who represent the entire
spectrum of personality traits, will benefit academically from a homogeneous set of teachers possessing
that one limited set of traits (Burant et al., 2007). At the other end of the spectrum, the adoption of
disposition assessment assumes that teacher education practices influence teaching dispositions
(Koeppen & Davison-Jenkins, 2006).
Another conceptual struggle is between characterizing dispositions as a distinct construct, versus seeing
them as interwoven with knowledge and skills. Knowledge and skills are believed to influence
dispositions because individuals avoid activities and environments, they believe exceed their
capabilities, while they readily undertake positively challenging activities and select environments, they
judge themselves capable of managing (Bandura, 1997; Hasslen & Bacharach, 2007). While expanding
the knowledge and skills in teacher candidates can influence their dispositions, pre-existing dispositions
may be what motivates them to seek professional knowledge and skills (Diez, 2007).
2.2 Defining Dispositions While opponents to the inclusion of disposition assessment in teacher preparation claim there is no
agreed upon definition of dispositions, and that existing definitions developed for NCATE requirements
are vulnerable to each academy’s biases (Borko et al., 2007), there are several definitions in use which
do not vary greatly.
Dispositions are qualities which are rooted in 13 qualities such as behaviors, attitudes, standards, and
dogmas thought to be taken as practices we select (Eberly et al., 2007). Similarly, dispositions tend to be
defined at the teacher education level as characteristics associated with desirable attitudes and beliefs,
especially those associated with the desire to teach diverse learners equitably and effectively. As
mentioned in an earlier discussion of the limitations of previous studies, definitions of dispositions vary
in their balance between actions or observed behaviors, and the beliefs and attitudes presumed to be the
motives behind those behaviors (Covaleskie, 2007).
Definitions of dispositions are linked to definitions of effective teaching, such as caring, fairness,
respect, enthusiasm, and reflective practice (Edwards & Edick, 2006). In any case, dispositions involve
awareness, inclination, and reflection on thinking and behavior, not just thinking, or just behavior
(Schussler, 2006). An early definition of disposition considered it a summary of observed behavior and
the likelihood of its continued occurrence (Katz & Raths, 1985).
This definition did not characterize dispositions as a root cause of behaviors, but as a description of
behaviors and their relative incidence in certain situations. These behaviors included dispositions to
Journal of Business and Social Review in Emerging Economies Vol. 6, No 4, December 2020
1430
suspend judgment, seek help when needed, and accept professional advice, and were recommended as
goals for teacher education programs. Katz and Raths called them habits of mind, meaning these
behaviors were so well practiced that responses were automatic, no longer requiring 14 concentrated
thought. Such dispositional goals should be focused exclusively on behaviors related to effective
teaching in the classroom (1985). Aligned with the moral perspective is the definition of ethical teaching
as the demonstration of specialized attitudes and values which certify equality and impartiality in
interactions towards pupils, people, colleagues, and participants of the community (Sileo et al., 2008).
Defining disposition in the context of developing an educational philosophy (Brown, 2007) presents its
own set of complications. Disposition can be defined as the nature of responses to diverse learners, and
the skill demonstrated in those responses, or as the underlying set of beliefs and attitudes held by that
teacher, that presumably cause the desired responses. In practice, however, no reliable inference can be
made either way.
A teacher may have the desired beliefs and attitudes, but simply lack the skill to realize goals for
equitable academic gains. Another teacher may not have the desired attitudes or beliefs, but teach
skillfully in response to the fact that such behavior forms a basis for evaluation. So the disposition to
respond in a particular way does not necessarily imply a particular philosophy, nor does a particular
philosophy necessarily predict the disposition to respond to students in desired ways (Covaleskie, 2007).
An exploratory study of teacher beliefs casts dispositions in a construct of academic optimism, a general
construct grounded in positive psychology. Academic optimism is composed of efficacy, trust, and
academic emphasis (spending more time on educational responsibilities), is positively connected with
student achievement. The related teacher behaviors were dispositional optimism, student-centered
actions, beliefs and classroom management, and willingness to work beyond contract hours.
Academically optimistic teachers believe they can contribute in students’ effective learning by giving
students on their own capacities of solving problems and to work hard to get success. (Hoy, 2008) The
cognitive, cultural and experimental approach to dispositions leads to a definition of dispositions as the
cognitive and affective attributes that filter one’s knowledge, skills, and beliefs, and influence the
actions a teacher takes in the classroom or professional setting. These attributes are differentiated from
factors and qualities of effective teaching, which may be due to dispositions, but are not dispositions
themselves (Thornton, 2006). Preparing teachers to respond to diverse student populations cannot be
reduced to a set of dispositions; it requires a broad approach including knowledge, understanding how
children learn, pedagogical expertise, the abilities to diagnose difficulties and tap into resources and
strengths, and proficiency with assessments. These qualities compose the disposition to teach all learners
equitably (Villegas, 2007). The three descriptors that arise frequently in the InTASC and NCATE
documents – 1) fair-mindedness, 2) the faith that every student could study, and 3) respect for diversity –
tend to be the foundation for most working definitions of disposition.
Teacher education units are permitted to add other professional dispositions, but must articulate them in
their frameworks, and systematically assess them based on observable behaviors in educational settings.
These dispositions must have merit in educational practice (Koeppen & Davison-Jenkins, 2006); 16
consequently, disposition definitions draw heavily on characteristics of effective teaching. They draw
particularly on observable teaching behaviors. Because belief statements have little link to efficacy, and
personality traits are relatively immutable, attempting to directly assess dispositions themselves is
unhelpful and potentially risky. Additionally, the inference of particular beliefs based on observed
behavior is questionable at best (Burant et al., 2007; McNight, 2004). Finally, restricting definitions of
dispositions to observable behaviors could prevent legal problems resulting from unfair biases.
2.3 Standards for Teacher Dispositions Literature in the educator disposition consists of individual institutions reporting their process in
operationalizing these dispositions, designing instructional activities for their development, and
implementing assessments. These reports suggest some similarities in processes experienced around the
country. Once a faculty agreed upon a working definition of dispositions, teacher education programs
generally chose specific dispositions for course goals. These goals led to assessments of behaviors

Journal of Business and Social Review in Emerging Economies Vol. 6, No 4, December 2020
1431
ranging from those believed to be indicative of general professionalism, such as punctuality, meeting
deadlines, and dressing professionally (L'Allier, Elish-Piper, & Young, 2007), to behaviors believed to
be indicative of less tangible ideals, such as an orientation toward social justice (Villegas, 2007). Once
items were selected for instruction and assessment of pre-service teachers, then studies were conducted
in attempts to validate either the items themselves as constructs of disposition, or to validate
measurement instruments. This section summarizes these reports, working from a framework of the
applicable principles in the InTASC draft standards, and looking at three general areas: the desired
dispositions, the teaching skills or behaviors that exemplify those dispositions, and the teacher education
instructional practices being developed to foster growth in both skills and dispositions. (There are ten
standards in all, but this review omits those that are not represented in the literature.)
3. Objectives of the Study This study will be conducted:
1. To assess dispositions of mathematics teacher’s at secondary schools.
4. Research Questions
The research questions will be investigated given below:
1. What is the level of teacher’s dispositions?
2. Do the teachers differ in their dispositions on the basis of gender?
3. Do the teachers differ in their dispositions on the basis of their qualification?
5. Research Methodology
The nature of the research is quantitative. Data was gathered by using survey. The sample was selected
in quantitative phase. The population for this study was more than 800, therefore, selected sample was
120 teachers.
5.1 Quantitative Phase
For quantitative phase, two stage stratified random sampling technique was used. At first stage, the
schools were selected randomly from different districts. From each district twenty male and twenty
female schools were selected. Therefore, one hundred and twenty teachers from secondary schools were
selected.
Table 1
T-test scores difference between male and female group on sub-scales
Groups N Mean Score SD t-value Sig.
Disposition
Male 120 117.18 15.364 -3.238 .001
Female 120 123.79 16.282
Self
Male 120 50.03 7.864 -3.605 .000
Female 120 53.66 7.712
Colleagues
Male 120 15.16 2.846 -.605 .546
Female 120 15.39 3.123
Student
Male 120 51.98 7.150 -2.860 .005
Female 120 54.74 7.780
P<0.05, P>0.05 for colleagues
Above table shows that there was significance difference in the mean score of male of (M=117.18,
SD=15.364) and female (M=123.79, SD=16.282) at p<0.05. It shows that, both groups have significance
difference between mean scores of gender. So it can be concluded that male and female have significant
difference mean scores on disposition. Whereas there was no significance difference in the mean score
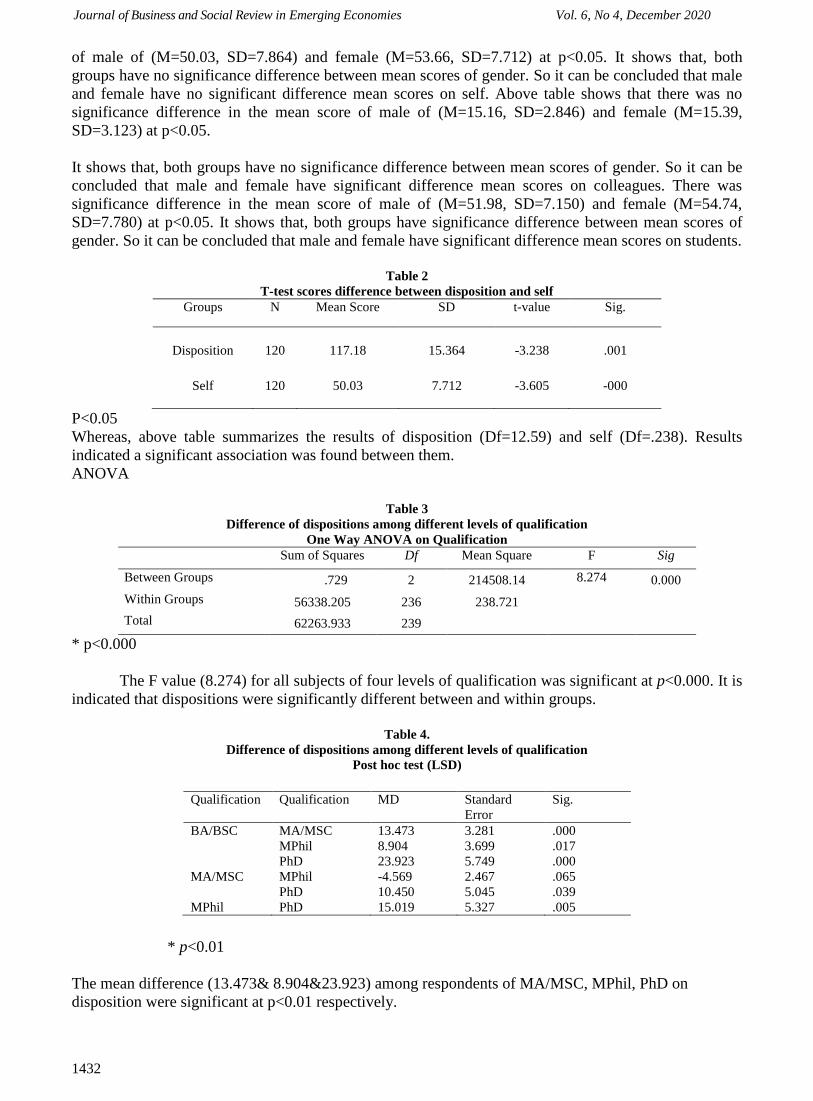
Journal of Business and Social Review in Emerging Economies Vol. 6, No 4, December 2020
1432
of male of (M=50.03, SD=7.864) and female (M=53.66, SD=7.712) at p<0.05. It shows that, both
groups have no significance difference between mean scores of gender. So it can be concluded that male
and female have no significant difference mean scores on self. Above table shows that there was no
significance difference in the mean score of male of (M=15.16, SD=2.846) and female (M=15.39,
SD=3.123) at p<0.05.
It shows that, both groups have no significance difference between mean scores of gender. So it can be
concluded that male and female have significant difference mean scores on colleagues. There was
significance difference in the mean score of male of (M=51.98, SD=7.150) and female (M=54.74,
SD=7.780) at p<0.05. It shows that, both groups have significance difference between mean scores of
gender. So it can be concluded that male and female have significant difference mean scores on students.
Table 2
T-test scores difference between disposition and self
Groups N Mean Score SD t-value Sig.
Disposition
120
117.18
15.364
-3.238
.001
Self
120
50.03
7.712
-3.605
-000
P<0.05
Whereas, above table summarizes the results of disposition (Df=12.59) and self (Df=.238). Results
indicated a significant association was found between them.
ANOVA
Table 3
Difference of dispositions among different levels of qualification
One Way ANOVA on Qualification
Sum of Squares Df Mean Square F Sig
Between Groups 5925.729 2 214508.14 8.274 0.000
Within Groups 56338.205 236 238.721
Total 62263.933 239
* p<0.000
The F value (8.274) for all subjects of four levels of qualification was significant at p<0.000. It is
indicated that dispositions were significantly different between and within groups.
Table 4.
Difference of dispositions among different levels of qualification
Post hoc test (LSD)
* p<0.01
The mean difference (13.473& 8.904&23.923) among respondents of MA/MSC, MPhil, PhD on
disposition were significant at p<0.01 respectively.
Qualification Qualification MD Standard
Error
Sig.
BA/BSC MA/MSC 13.473 3.281 .000
MPhil 8.904 3.699 .017
PhD 23.923 5.749 .000
MA/MSC MPhil -4.569 2.467 .065
PhD 10.450 5.045 .039
MPhil PhD 15.019 5.327 .005

Journal of Business and Social Review in Emerging Economies Vol. 6, No 4, December 2020
1433
Table 5.
Difference of dispositions among different levels of qualification
Sum of Squares Df Mean Square F Sig
Between Groups 1578.931 3 526.310 2.047 .108
Within Groups 60685.003 236 257.140
Total 62263.933 239
* p>.108
The F value (2.047) for all respondents of four levels of qualification with dispositions was
significant at p>.108 It is evident that post-hoc test was used on it.
6. Results and Discussion
This research discovered teachers’ dispositions towards arithmetic’s with respect to their four sub-scale.
Also, the study aimed at comparing the results of this study with previous similar study there were
noticeable variances between men and women in their dispositions towards mathematics. Therefore,
educators might undervalue women‟ arithmetic skills by means of to display additional arithmetic
anxiety than men if they have extraordinary capacity (Kyriacou & Goulding, 2006). In the US, study
suggestion specifies that gender break in arithmetic accomplishment were being thinning (Perie, Moran,
& Lutkus, 2005) so females touched uniformity with males in arithmetic and calculations (Hydea &
Mertzb, 2009).
The non-significant male and female variance in numerical capability on other side in concurrence with
past investigation discoveries (Awofala and Anyikwa, 2014; Fatade, Nneji, Awofala and Awofala, 2012)
in up-to-date arithmetic among prospective mathematics instructors and grown-up students however
negated other past discoveries (Awofala, 2011; Ozofor, 2001; Ogunkunle, 2007) which uncovered the
presence of huge male and female contrasts in mathematics. Then again, the critical male and female
variance impact on school students‟ presentation in arithmetic’s re-repeated the deteriorating speech that
guys were preferable in arithmetic over females.
Samuelsson (2010) found that there was no critical impact of male and female on every one of the
elements of numerical capability. The suggestion of the current investigation discoveries with respect to
sex is that male and female orientation contrasts in numerical capability are not, at this point significant
yet that ordinary contrasts may in any case exist in execution in arithmetic. This distinction may be the
variance in study on gender basis as a rule supported the male and female study in the arithmetic lecture
hall.
In this piece of research there was also seen a difference between of dispositions on gender basis.
Furthermore post hoc results signifies difference among teachers qualification such as BA/BSC,
MA/MSC. MPhil, PhD. This concurred the discoveries of Wu (2008) that appeared the theoretical
comprehension, practical familiarity, key competence were related. The little relationship between the
measurements of numerical capability appeared unique. The findings coincide by the conclusion of
Samuelsson (2010) which shown little and noteworthy associations relationship between such abilities
but relationship among theoretical comprehension and vital competency were extraordinary.
Attitude plays a vital role in teachers practices in a way what one belief or thinks he does the same.
Behavior means how a person thinks, acts and reacts which also has positively and negative influence on
teacher’s performance, his strategies, lesson planning and pupils achievements (Omolara & Adebukola,
2015). It was further revealed that there was significant strong positive correlation was existed between
teachers’ disposition and teaching methods at p≤0.05 level of significance. Disposition is an important
thing of 21st century higher order thinking abilities required for critical thinking and in favor of its
procedure (Beyer, 1987; Facione, 1998).
More emphasis is on enhancing dispositions qualities should be given prime importance (Çubukçu,
Journal of Business and Social Review in Emerging Economies Vol. 6, No 4, December 2020
1434
2006). The aim of research to find out mathematics teacher’s disposition with four subscales. Research
identified arithmetic teachers have found significant statistical difference towards dispositions self and
students except colleagues. The results were quite similar with the finding of Çetinkaya (2011). But
there were some researchers who have different finding such as Tümkaya (2011), found experienced had
significant high scores than new ones on self-assurance. Whereas, Akgün and Duruk (2016) found that
any significant association among male and female basis, grade institutions factor with dispositions.
Comparable outcomes were apparent with the results (Zayıf, 2008). Çetinkaya (2011), stated that
feminine understudies are altogether greater than boy’s understudies on liberality reality-chasing scales
scores. Additionally set up that administration mathematics educators' manner levels show huge contrast
dependent on sex for female understudies in receptiveness subscale (Yenice, 2011).
7. Recommendations
Research looked at mathematics teachers dispositions at secondary level in Govt. schools in Pakistan. It
is suggested that population could be size larger for forthcoming researches and it could be applied to
other level of teachers in different subjects as well as in private and public schools as well. Researchers
should investigate further factors that may enhance development of dispositions in mathematics
teachers.
References
Akgun, A., & Duruk, U. (2016). The Investigation of Preservice Science Teachers' Critical Thinking
Dispositions in the Context of Personal and Social Factors. Science Education
International, 27(1), 3-15.
Awofala, A. O. A. & Anyikwa, B. E. (2014). Assessing adult learners‟ numeracy as related to gender
and performance in arithmetic. New Approaches in Educational Research, 3(2), 83-92.
doi:10.7821/near.3.2.83-92.
Awofala, A. O. A. (2011). Is gender a factor in mathematics performance among Nigerian senior
secondary students with varying school organization and location? International Journal of
Mathematics Trends and Technology, 2(3), 17-21.
Bandura, A. (1997). Exercise of personal and collective efficacy in changing societies. In A. Bandura
(Ed.), Self-efficacy in changing societies (pp. 1-45). New York: Cambridge University Press.
Barhier & W. R. Speer (Eds.), Motivation and disposition: Pathways to learning mathematics (pp.
69-80). Reston, VA: The National Council of Teachers of Mathematics.
Beyers, J. (2011). Student dispositions with respect to mathematics: What current literature says. In D. J.
Beyer, B. (1987). Practical strategies for the teaching of thinking. Boston: Allyn and Bacon.
Biber, A. C., Tuna, A., & Incikabi, L. (2013). An investigation of critical thinking dispositions of
mathematics teacher candidates. Educational Research, 4(2), 2141–5161. Retrieved from
http://www.interesjournals.org/ER
Boaler, Jo. “Exploring the Nature of Mathematical Activity: Using Theory Research and ‘Working
Hypotheses’ to Broaden Conceptions of Mathematics Knowing.” Educational Studies in
Mathematics 51 (July 2002): 3–21.
Boaler, J., Wiliam, D., & Brown, M. (2007). Students’ experiences of ability grouping: Disaffection,
polarisation and the construction of failure. British Educational Research Journal, 26, 631–648.
Boaler J 2016. Mathematical mindsets: Unleashing students’ potential through creative Math,
inspiring messages and innovative teaching. San Francisco, CA: Jossey-Bass.
Borko, H., Liston, D., & Whitcomb, J. A. (2007). Apples and fishes: The debate over dispositions in
teacher education. Journal of Teacher Education, 58(5), 359-364.
Burant, T. J., Chubbuck, S. M., & Whipp, J. L. (2007). Reclaiming the moral in the dispositions debate.
Journal of Teacher Education, 58(5), 397-411.
Burant, T. J., Chubbuck, S. M., & Whipp, J. L. (2007). Reclaiming the moral in the dispositions debate.
Journal of Teacher Education, 58(5), 397-411.
Journal of Business and Social Review in Emerging Economies Vol. 6, No 4, December 2020
1435
Brown, A. T., 3rd. (2007). What is your philosophical disposition? Standard X: The teacher has
developed an in-depth foundational philosophy. Philosophy of Education Yearbook, 199-208.
Bushman, J. (2004). Instruction that fits. Principal Leadership, 5(2), 28–33. Retrieved from
http://search.proquest.com/docview/233322983?accountid=13380
Cetinkaya, B. (2011). Sustainable supply chain management: practical ideas for moving towards
best practice. Springer Science & Business Media.
Cubukcu, F. (2006). Student teachers’ perceptions of teacher competence and their attributions
for success and failure in learning. The Journal of International Social Research, 3(10), 213-217.
Cobb, P., Yackel, E., & Wood, T. (2012). The teaching experiment classroom. In P. Cobb & H.
Bauersfeld (Eds.), The emergence of mathematical meaning: interaction in classroom cultures
(pp. 130–161). Retrieved from http://www.eblib.com
Covaleskie, J. F. (2007). Knowledge, skills, and dispositions: Do I need a philosophy of education, too?
Philosophy of Education Yearbook, 209-211. 97
Diez, M. E. (2007). Looking back and moving forward: Three tensions in the teacher dispositions
discourse. [Feature Article]. Journal of Teacher Education, 58(5), 388- 396.
Eberly, J. L., Rand, M. K., & O'Connor, T. (2007). Analyzing Teachers' Dispositions towards Diversity:
Using Adult Development Theory. [Feature Article]. Multicultural Education, 14(4), 31-36.
Edwards, S., & Edick, N. (2006). Dispositions Matter: Findings for At-Risk Teacher Candidates.
[Feature Article]. The Teacher Educator, 42(1), 1-14. 98 Fein, A. H. (2004). What's Good for
the Goose . . . Inconsistency In the NCATE Standards? [Feature Article]. Multicultural
Education, 11(4), 54-55.
Eurydice, 2011, Mathematics Education in Europe: Common Challenges and National Policies,
Education, Audiovisual and Culture Executive Agency, European Commission. Available at:
http://eacea.ec.europa.eu/education/eurydice.
Facione, P. A. (1998). Critical thinking: What it is and why it counts – A reference paper.Milbrae, CA:
The California Academic Press. Retrieved from
www.insightassessment.com/pdf_files/what&Why98.pdf
Fatade, A. O., Nneji, L. M., Awofala, A. O. A. & Awofala, A. A. (2012). Mode of entry and gender as
determinants of Nigerian pre-service teachers‟ performance in degree mathematics and science
courses. International Journal of Mathematics Trends and Technology, 3(3), 103-109.
Hasslen, R. C., & Bacharach, N. (2007). Nurturing Multicultural Competence in an Early Childhood
Graduate Teacher Licensure Program. [Feature Article]. Action in Teacher Education, 29(1), 32-
41.
Hiebert, J. et al., (2007). Making sense. Teaching and learning mathematics with understanding.
Portsmouth, NH: Heinemann.
Hoy, A. W. (2008). Teacher's academic optimism: The development and test of a new construct.
[Feature Article]. Teaching and Teacher Education, 24(4), 821-835.
Hydea, J.S. & Mertzb, J.E. (2009). Gender, culture, and mathematics performance. Retrieved from http:
/ /tctvideo. madison.com/uw/gender.
Koeppen, K. E., & Davison-Jenkins, J. (2006). Do You See What I See? Helping Secondary Preservice
Teachers Recognize and Monitor Their Teacher Dispositions. [Feature Article]. Action in
Teacher Education, 28(1), 13-26.
Katz, L. G., & Raths, J. D. (1985). Dispositions as goals for teacher education. Teaching and Teacher
Education, 1(4), 301-307.
Kyriacou, C., & Goulding, M. (2006). Mathematics education: a systematic review of strategies to raise
pupils’ motivational effort in key stage 4 mathematics. London: University of London, Institute
of Education, Social Science Research Unit, EPPI-Centre [Online] Available at:
http://eppi.ioe.ac.uk/cms/LinkClick.aspx?fileticket=rOESCjDkP0c%3d&tabid=714&mid=1646
&language=en-US [Accessed 4 February 2011].
L'Allier, S. K., Elish-Piper, L., & Young, E. E. (2007). Evaluating candidate dispositions in advanced

Journal of Business and Social Review in Emerging Economies Vol. 6, No 4, December 2020
1436
reading certification programs: The road ahead is here. Reading Research and Instruction, 46(2),
151-174.
Lockhead, J. (2011). Making math mean. In E. Von Glasersfeld (Ed.), Radical constructivism in
mathematics education (pp. 75–87). Hingham, MA: Kluwer.
National Council for Accreditation of Teacher Education (NCATE). (2009, 2001). NCATE 2009
Standards. Washington, DC: author.
Ogunkunle, L. A. (2007). Effects of gender on mathematics achievement of students in constructivist
and non-constructivists groups in secondary school. ABACUS, Journal of Mathematical
Association of Nigeria, 32(1), 41-50.
Omolara, S. R., & Adebukola, O. R. (2015). Teachers' Attitudes: A Great Influence on Teaching and
Learning of Social Studies. JL Pol'y & Globalization, 42, 131.
Ozofor, N. M. (2001). Effect of two modes of computer aided instruction on students’ achievement and
interest in statistics and probability. Unpublished Ph.D. Thesis, University of Nigeria, Nsukka,
Nigeria.
Perie, M., Moran, R., & Lutkus, A.D. (2005). NAEP 2004 trends in academic progress three decades of
student performance in reading and Mathematics. Washington D. C. National Center for
Education Statistics.
Richards, L. (2011). Rigorous, rapid, reliable and qualitative? Computing in qualitative method. The
American Journal of Health Behavior, 26(6), 425–436.
Samuelsson, J. (2010). The impact of teaching approaches on students‟ mathematical proficiency in
Sweden, International Electronic Journal of Mathematics Education, 5(2), 61-77.
Sierpinska, A. (2014). Understanding in mathematics. London, UK: The Falmer Press.
Sileo, N. M., Sileo, T. W., & Pierce, T. B. (2008). Ethical Issues in General and Special Education
Teacher Preparation: An Interface with Rural Education. [Feature Article]. Rural Special
Education Quarterly, 27(1/2), 43-54.
Skemp, R. R. (2006). Relational understanding and instrumental understanding, Mathematics Teaching,
77, 20–26.
Schulte, L., Edick, N., Edwards, S., & Mackiel, D. (2004). The Development and Validation of the
Teacher Dispositions Index. Omaha: University of Nebraska
Schussler, D. L. (2006). Defining Dispositions: Wading Through Murky Waters. [Feature Article]. The
Teacher Educator, 41(4), 251-268.
Taylor, R., & Wasicsko, M. (2000). The dispositions to teach. Southern Region Association of
Teacher Educators Conference. Lexington.
Thornton, H. (2006). Dispositions in Action: Do Dispositions Make a Difference in Practice? [Feature
Article]. Teacher Education Quarterly, 33(2), 53-68. Villegas, A. M. (2007). Dispositions in
Teacher Education: A Look at Social Justice. [Feature Article]. Journal of Teacher Education,
58(5), 370-380.
Tümkaya, S. (2011). Comparison of college science major students’ learning styles and critical thinking
disposition. Journal of Kırşehir Education Faculty, 12 (3), 215-234.
Villegas, A. M. (2007). Dispositions in Teacher Education: A Look at Social Justice. [Feature Article].
Journal of Teacher Education, 58(5), 370-380.
Wu, Z. & An, S. (2008, July). Using the model-strategy-application approach to developing pre-service
teachers’ knowledge and assessing their progress in math methods courses. Paper presented at
11th International Congress on Mathematics Education. Monterrey, Mexico.
Wu, Z. & An. S. (2007, January). Sharpening teaching ability in mathematics classrooms. Paper
presented at Association of Mathematics Teacher Educators (AMTE) 11th Annual Conference.
Irvine, CA.
Yenice, N. (2011). Investigating pre-service science teachers’ critical thinking dispositions and
Problem solving skills in terms of different variables, Educational Research and Reviews, 6,
497-508.

Journal of Business and Social Review in Emerging Economies Vol. 6, No 4, December 2020
1437
Zayif, K. (2008). Critical thinking disposition of pre-service teachers. (Unpublished master thesis).
Abant İzzet Baysal University, Bolu, Turkey.

Journal of Business and Social Review in Emerging Economies Vol. 6, No 4, December 2020
1438
Journal of Business and Social Review in Emerging Economies Vol. 6, No 4, December 2020
1439
Volume and Issues Obtainable at Center for Sustainability Research and Consultancy
Journal of Business and Social Review in Emerging Economies ISSN: 2519-089X (E): 2519-0326
Volume 6: No. 4, December 2020
Journal homepage: www.publishing.globalcsrc.org/jbsee
Interrelation of Multiple Intelligences and their Correlation with Linguistic
Intelligence as Perceived by College Students: A Correlation Study
1Wajiha Kanwal, 2Quratulain, 3Iffat Basit 1Assistant Professor, Department of Education, University of Wah, Wah Cantt, Pakistan,
[email protected] 2Assistant Professor, Baluchistan University of Engineering and Technology, Khuzdar, Pakistan 3Assistant Professor, Baluchistan University of Engineering and Technology, Khuzdar, Pakistan
ARTICLE DETAILS ABSTRACT History Revised format: November 2020 Available Online: December 2020
The present study was concerned to determine Interrelation of
Multiple Intelligences and their correlation with linguistic
intelligence as perceived by college students. All the students of
intermediate level studying in Islamabad Model Colleges was the
population of this study. The 1000 students were selected as sample
by using simple random sampling technique Questionnaire for
students was used to collect the data. Experts were involved for
validation of research instrument. The reliability was measured
through pilot testing on 100 students. Researcher used SPSS
advanced version to analyze the quantitative data. Mean, Standard
Deviation, and Pearson Coefficient Correlation were used to analyze
the data. The results of the study showed that moderate inter-
correlation exists between verbal/linguistic and logical/mathematical
intelligences and. It was suggested that teachers may use all the
Multiple intelligences during the teaching-learning process to
promote their development.
© 2020 Center for Sustainability Research and Consultancy Pakistan under
a Creative Commons Attribution-NonCommercial-ShareAlike 4.0
Keywords Multiple intelligences,
logical-mathematical
intelligence, Visual-spatial
intelligence, Bodily-
kinesthetic intelligence,
Interpersonal intelligence,
interpersonal intelligence,
JEL Classification
M11, M12
Corresponding author’s email address: dr. [email protected]
Recommended citation: Kanwal, W., Quratulain. & Basit, I. (2020). Interrelation of Multiple
Intelligences and their Correlation with Linguistic Intelligence as Perceived by College Students: A
Correlation Study. Journal of Business and Social Review in Emerging Economies, 6(4), 1439-1447
1. Introduction
With the technique of mental cerebrum technology as the ones accepted norms to training, teachers carry
discover a top tempo charmed via way of means of serving understudies make considering techniques.
How college students envision want rework into Pretty a lot this is only a glimpse of something large
large over what they consider. MI concept offers an Ideal affiliation with selecting getting a manage on
approximately understudies' highbrow aptitudes. The 8 insights with inside the version want assist
themselves highbrow limits.
Thus, to make any or at for them with inside the guides delineated to beyond components might be on
empowering the ones enhancements of understudies' capacity to think. MI may also an possibility to be
useful, in any case, on gander this is only a glimpse of somthing large, particularly In how mi tenet
applies of the zone's (Bowell, 2004; Chen, 2007) This studies changed into designed as Relationship
of Linguistic intelligence with Multiple Intelligences: A Correlation observe at Collage college students

Journal of Business and Social Review in Emerging Economies Vol. 6, No 4, December 2020
1440
Actually studies to test the connection among a couple of intelligences with linguistic intelligence. The
main objectives of the study were to determining students perceived levels of multiple intelligences and
Identifying the correlation between Linguistic Intelligence with other multiple intelligences
Hypotheses
1. H01 “There is no significant relationship between Linguistic Intelligence and Logical
Mathematical Intelligence of students at higher secondary level”.
2. H02 “There is no significant relationship between Linguistic Intelligence and
Bodily/kinesthetic Intelligence of students at higher secondary level”.
3. H03 “There is no significant relationship between Linguistic Intelligence and visual/Spatial
Intelligence of students at higher secondary level”.
4. H04 “There is no significant relationship between Linguistic Intelligence and Musical
Intelligence of students at higher secondary level”.
5. H05 “There is no significant relationship between Linguistic Intelligence and Intrapersonal
Intelligence of students at higher secondary level”.
6. H06 “There is no significant relationship between Linguistic Intelligence and Interpersonal
Intelligence of students at higher secondary level”.
2. Review of Related Literature
The phonetic Knowledge embarrasses verbal articulation via numerous dialects, so that it will speak
round your thoughts similarly because it desires to apprehend others.( Checkley, 1997) The etymological
perception lets in humans to speak with the universe via language via vernacular. Specialists epitomize
this velocity over it is made structure. Students who exhibits hobby in rhymes, making jokes etc. surely
tents to talk their inward notion via way of means of the use of languages. It consists of verbal exchange
through gestures to illustrate linguistic highbrow competence. (Gardner, 1919).
Reasonable logical know-how permits people to apply and understand dynamic relations. Researcher,
mathematicians, furthermore scientists all rely in advance this insight. Individuals with an astoundingly
generated shrewd numerical know-how draw close the essential standards whch leads them to nation
each a part of a comprehensive causal framework, like a researcher or an analyst does. This kind of
intelligence may also facilitate mathematicians to manipulate numbers, quantities and different
comparable activities. (Checkley, 1999).
Musical intelligence refers back to the capacity to ruminate in track, functionality to listen melodious
patterns, distinguish among numerous musical melodies, reminisce them, and likely manage them.
People with resilient musical intelligence can't simplest keep in mind track without difficulty however
they even can not get it out in their minds, it is very pervasive. Remarkably, there's commonly an
affective affiliation among feelings and the track; likewise musical and mathematical intelligences might
also additionally stake not unusualplace philosophy.
Young people having this type of intelligence are commonly interested by making a song an gambling
musical gadgets like beating drums etc. They are frequently particularly greater aware about sounds and
descants that others might also additionally neglect. People with musical intelligence relatively greater
respect track and musical composition and performance. Melodic awareness is the potential to suppose
in track, have to have the capacity to concentrate designs, apprehend them, evaluation them, and
possibly manage them. ".
Campanulated (1997) recommends that teachers who want to enhance melodic highbrow competence
camwood sing a rap or a song that explains the ones topics (Checkley, 1997). Portrays melodic
quickness the "track keen" people experience approximately track, tuning in for examples, perceiving,
recalling, and controlling them. They are first-class thru resonances for remembering tuning for
moreover making resonances for instance, to such an volume that melodies, rhythms, designs, what
greater numerous varieties of sound associated outpouring. They have the capacity to apply inductive
moreover deductive reasoning are greater understand institutions up data (Lazaer, 2002).

Journal of Business and Social Review in Emerging Economies Vol. 6, No 4, December 2020
1441
Spatial intelligence joins the restrict need to understand the visible fact impeccably and to carry out
modifications likewise changes upon one's very own beginning acknowledgments via intellectual
imagery. Down to earth views from ensuring spatial cleverness consolidate tasteful structure, map
perusing, moreover an terrific clothier would require each the modern capacities and also specific foul
accomplishing.
An car laborer or clothier, then again, does not convincing clarification modern What's steadily tasteful
capacities need to discover the final results need to a stalling engine (Gardner, 1999). Spatial awareness
pastime the "photo keen" relatives want the restrict will cope with the spatial globe over their minds. In
this way, they growth satisfactory seemingly what is steadily have a tendency need to sift via their
thinking about spatially (Lazaer, 2000).
Portrays that significant sensation perception licenses people to apply all alternatively and simply the
ones particular figures to make outcomes or take care of problems. Competitors, specialists, artists,
choreographers, and specialties people constantly on the use of physical sensation perception activity.
The ability is also disposed towards must do population endeavors Inevitably Tom's investigative
manufacture fashions as confined forming reports, who toss deteriorated piece of a paper with repeat in
addition to precision under waste baskets in extra of these space (Gardner, 1999.
Gardner (1999) Relational understanding engages people should apprehend exasperate differentiations,
some thing like others aims. Instructors, guardians, legislators, clinicians and gives people rely
investigating relational acumen pastime. Researchers display this acumen pastime once they prosper as
for little collecting effort, at what time they come to be aware about react of the temperaments because
putting forward their companion's in addition to schoolmates, through their thoughtfully persuade people
teacher's affirmation concerning their convincing motivation in the direction of more second be meant to
finish the ones schoolwork obligations. Relational astuteness comprehends diverse people. It's a
capability we at want, regardless are a top rate at the off risk which you could an instructor, clinician,
income rep, or lawmaker. Any character who can wish for others want have to an possibility to
successful of relational encircle (Checkley,1997.
Intrapersonal means what your identification is, the issue that you can do, what you need to do, the way
you react ought to matters, which matters to hold away from, moreover which matters will skim towards
(Gardner, 1999). gift one of the maximum clean preparations of phrases. Those taking in fashion
composing suggests an awesome display for phrases that want assist comparable, but without a doubt
unique. Explanation from affirming that is critical to a comprehension for problems in steerage
arrangement. Those an considerable phase putting length that separates the ones phrases slanting
fashion, taking in approach, taking in tendency highbrow fashion is that degree on which they will be
considered clarified. Styles: Classifications, thoughts (Curry,1991, Riding and Cheema, 1991).
MI principle facilities around a first rate type of understudies' perception underlined via way of means
of Davis, (1991) expressed that it elevates diverse techniques to learn. Due to rigid instructional plan,
great numbers college students lose redirections to in a direct outcome. Every child has inherent
abilities, be that during our informational establishment's instructive module first-class fixated on
verbal/phonetic and consistent/medical cleverness. Instructors ought to have the ability of examine the
ones inward global approximately every person, in order make on the other hand increase every
youngster's distinctiveness with accommodating them a perfect approach for education. Additionally
see distinctiveness likewise reliably convincing motivation to make cautious for every thrilling
difference.
Different intellectual capacity hypothesis is robust to instructors to get it contrasts from ensuring each
character makes every one's capacity and plausibility and get-togethers supply becoming mindfulness
regarding the individuals who are being all through peril starting with educational dissatisfaction.

Journal of Business and Social Review in Emerging Economies Vol. 6, No 4, December 2020
1442
Instructors' idea might also additionally make him is land at perceiving some thing like differentiation to
understudies' learning, and the one-of-a-kind knowledge (Zepke, 1997).
3. Methodology
3.1 Participants
Sample of the study was extracted by using simple random sampling technique hence twenty Federal
Highr Secondary Colleges were selected. Amongst 48000 students enrolled in these colleges total 1000
students (50 students per college) were chosen in order to collect data for the study.
3.2 Instrumentation
Howard Gardner’s multiple intelligences test was selected as data collection instrument. It was adapted
according to study requirement therefore it was presented to three experts to ascertain its validaty.
Research tool was then pilot tested and after that it was administered to the selected sample
Questionnaire of this study was consist of 44 statements. Gardner’s seven multiple intelligences 5 on LI
, 10 on L/MI, 6 on V/SI, 6 on B/KI, 3 on MI, 4 on IPI ( intra personal intelligence), 10 on II (
interpersonal intelligence). Pearson ‘r’ Correlation was employed to analyse data.
4. Findings
Table 1
Inter-Correlation among Various Multiple intelligence (N = 1000)
Cognitive Styles 1 2 3 4 5 6 7
Linguistic Intelligence 1
Logical/ Mathematical Intelligence 0.26* 1
Bodily/kinesthetic Intelligence 0.16* 0.25* 1
Vision/Spatial Intelligence 0.23* 0.17* 0.41* 1
Musical Intelligence 0.15* 0.03 0.26* 0.20* 1
Intrapersonal Intelligence 0.16* 0.18* 0.18* 0.17* 0.25* 1
Interpersonal Intelligence 0.26* 0.16* 0.38* 0.30* 0.23* 0.30* 1
*Correlation is significant at the 0.01 level
Table 1 describes the inter-correlation among various multiple intelligences as perceived by students.
The highest correlation exists between Bodily/kinesthetic Intelligence and Vision/Spatial Intelligence (r
= 0.38, p ≤ .01). The lowest correlation exist between Logical Mathematical Intelligence and Musical
Intelligence (r = 0.03, p ≤ .01).
H01: “There is no significant relationship between Linguistic Intelligence and Logical Mathematical
Intelligence of students at higher secondary level”.
Table 2.
Correlation between Linguistic Intelligence and Logical Mathematical Intelligence mean score.
Variables N Mean SD Pearson ‘r’ Sig (2-tailed)
Linguistic 1000 16.81 3.678 0.261 0.000
Logical Mathematical 1000 38.23 6.841
“Correlation is significant at the 0.01 level (2-tailed)”
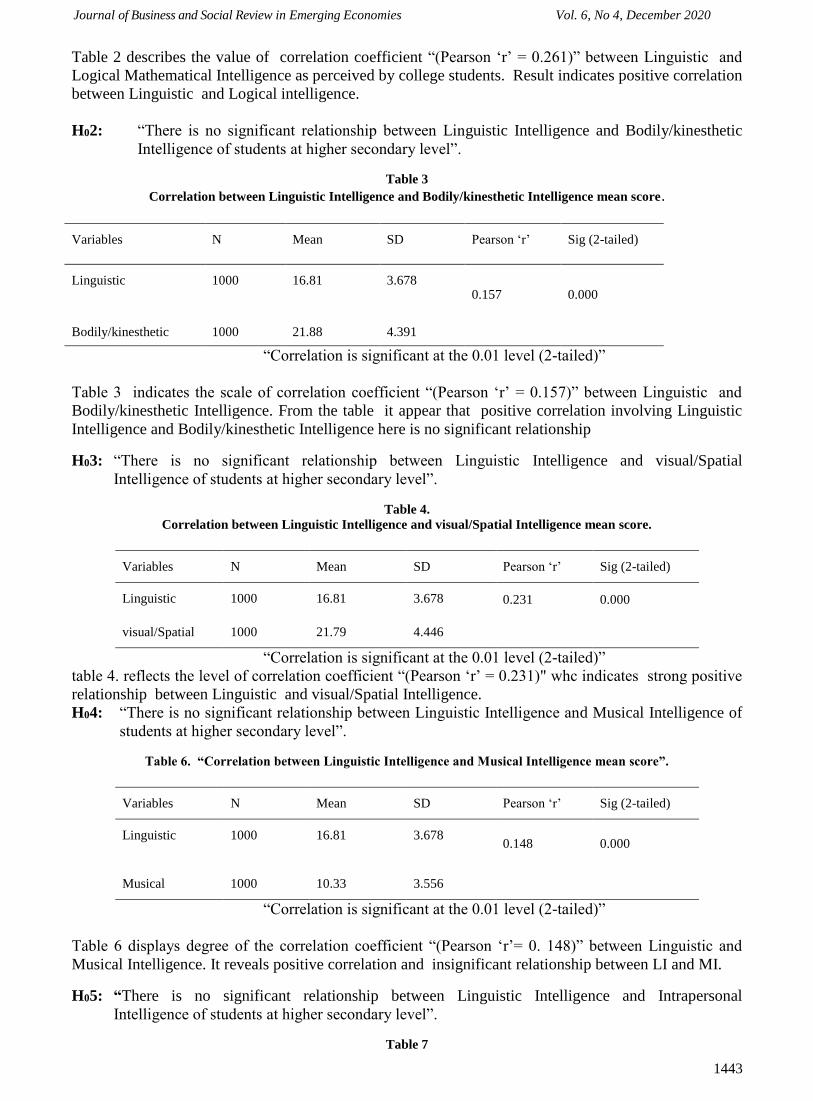
Journal of Business and Social Review in Emerging Economies Vol. 6, No 4, December 2020
1443
Table 2 describes the value of correlation coefficient “(Pearson ‘r’ = 0.261)” between Linguistic and
Logical Mathematical Intelligence as perceived by college students. Result indicates positive correlation
between Linguistic and Logical intelligence.
H02: “There is no significant relationship between Linguistic Intelligence and Bodily/kinesthetic
Intelligence of students at higher secondary level”.
Table 3
Correlation between Linguistic Intelligence and Bodily/kinesthetic Intelligence mean score.
Variables N Mean SD Pearson ‘r’ Sig (2-tailed)
Linguistic 1000 16.81 3.678 0.157 0.000
Bodily/kinesthetic 1000 21.88 4.391
“Correlation is significant at the 0.01 level (2-tailed)”
Table 3 indicates the scale of correlation coefficient “(Pearson ‘r’ = 0.157)” between Linguistic and
Bodily/kinesthetic Intelligence. From the table it appear that positive correlation involving Linguistic
Intelligence and Bodily/kinesthetic Intelligence here is no significant relationship
H03: “There is no significant relationship between Linguistic Intelligence and visual/Spatial
Intelligence of students at higher secondary level”.
Table 4.
Correlation between Linguistic Intelligence and visual/Spatial Intelligence mean score.
Variables N Mean SD Pearson ‘r’ Sig (2-tailed)
Linguistic 1000 16.81 3.678 0.231 0.000
visual/Spatial 1000 21.79 4.446
“Correlation is significant at the 0.01 level (2-tailed)”
table 4. reflects the level of correlation coefficient “(Pearson ‘r’ = 0.231)" whc indicates strong positive
relationship between Linguistic and visual/Spatial Intelligence.
H04: “There is no significant relationship between Linguistic Intelligence and Musical Intelligence of
students at higher secondary level”.
Table 6. “Correlation between Linguistic Intelligence and Musical Intelligence mean score”.
Variables N Mean SD Pearson ‘r’ Sig (2-tailed)
Linguistic 1000 16.81 3.678 0.148 0.000
Musical 1000 10.33 3.556
“Correlation is significant at the 0.01 level (2-tailed)”
Table 6 displays degree of the correlation coefficient “(Pearson ‘r’= 0. 148)” between Linguistic and
Musical Intelligence. It reveals positive correlation and insignificant relationship between LI and MI.
H05: “There is no significant relationship between Linguistic Intelligence and Intrapersonal
Intelligence of students at higher secondary level”.
Table 7

Journal of Business and Social Review in Emerging Economies Vol. 6, No 4, December 2020
1444
Correlation between Linguistic Intelligence and Intrapersonal Intelligence mean score
Variables N Mean SD Pearson ‘r’ Sig (2-tailed)
Linguistic 1000 16.81 3.678 0.156 0.000
Intrapersonal 1000 14.98 3.240
“Correlation is significant at the 0.01 level (2-tailed)”
Table 7 clarify that the degree of correlation coefficient “(Pearson ‘r’ = 0.156)”shows strong positive
correlation with Linguistic and Intrapersonal Intelligence as perceived by collage students. They have no
significant relationship between LI and Intrapersonal Intelligence.
H06: There is no significant relationship between Linguistic Intelligence and Interpersonal Intelligence
of students at higher secondary level.
Table 8
Correlation between Linguistic Intelligence and Interpersonal Intelligence mean score
Variables N Mean SD Pearson ‘r’ Sig (2-tailed)
Linguistic 1000 16.81 3.678 0.264 0.000
Interpersonal 1000 41.90 5.992
“Correlation is significant at the 0.01 level (2-tailed)”
Table 6 specify that level of correlation coefficient “(Pearson ‘r’ = 0. 264)” disccloses positive
correlation between Linguistic and Interpersonal Intelligence.
5. Discussion
College students have special stage of intelligence which distinguish them from every different. A
comparative and essential stance on outcomes and findings of the observe said that LI and L LI and
B/KI have superb correlation however no great courting exist among each classes of intelligence.
Research with the aid of using Deary, et al., (2007), helps the result of prenent observe It is likewise
inconsonance with the outcomes of who observed sturdy and superb courting among
logical/mathematical intelligence and educational success. Furnham, Hosoe, & Tang (2002), observed of
their studies, that the respondents taken into consideration that verbal, logical and spatial intelligence
exemplify proper intelligence . Therefore the null speculation rejected. Both don't have any great
relation at the bases of statistical analysis. Here the outcomes of the observe showed the declare of
Gardner. He says that despite the fact that a couple of intelligences are separate gadgets however they
assist every different on every occasion a process is performed. The researcher additionally observed a
slight affiliation among verbal/linguistic, logical/mathematical intelligence and educational success.
Result of the observe is in consonance with, Siti, M. et al (2013), he observed in his observe a great
superb correlation among verbal/linguistic, logic/mathematical intelligences and educational success of
the college students. It is proved from the findings of this studies that there may be a great courting
among Linguistic Intelligence and Bodily/kinesthetic Intelligence. Therefore the null speculation that
right here isn't any significant courting among Linguistic Intelligence and Bodily/kinesthetic Intelligence
of college students at better secondary stage became customary at the bases of statistical analysis.
Our findings are supported with the aid of using the preceding researches that have been performed on
same variables which gift observe focused upon. The outcomes of Deary, et al., (2007), who observed a

Journal of Business and Social Review in Emerging Economies Vol. 6, No 4, December 2020
1445
great superb correlation among perceived verbal-linguistic intelligence and bodily/kinesthetic
intelligence. As said above the findings of the studies that there may be great courting among Linguistic
Intelligence and visual/Spatial Intelligence. Hence, the null speculation that right here isn't any
significant courting among Linguistic Intelligence and visual/Spatial Intelligence of college students at
better secondary stage became rejected at the bases of statistical analysis. Furthermore, there may be
great courting among Linguistic Intelligence and Musical Intelligence. Thus the null speculation that
tright here isn't anyt any significant courting among Linguistic Intelligence and Musical Intelligence of
college students at better secondary stage became rejected at the bases of statistical analysis.
Moreover, the findings of this studies suggests that there may be great courting among Linguistic
Intelligence and Intrapersonal Intelligence. So the null speculation that tright here isn't anyt any
significant courting among Linguistic Intelligence and Intrapersonal Intelligence of college students at
better secondary stage became rejected on the idea of statistical analysis.
The findings of this studies additionally proved that there may be great courting among Linguistic
Intelligence and Interpersonal Intelligence. therefore the null speculation that tright here isn't anyt any
significant courting among Linguistic Intelligence and Interpersonal Intelligence amongst college
students at better secondary stage became customary on the idea of statistical analysis.
6. Conclusions and Recommendations
Overall the study was conducted to examine self perception of college students of both science and arts
group studying at higher secondary level, about seven multiple intelligences proposed by Harward
Gardner.
The degree of correlation coefficient among Linguistic Intelligence, Logical Mathematical Intelligence,
Bodily/kinesthetic Intelligence, Spatial Intelligence, Musical Intelligence, Intra Personal Intelligence and
Inter Personal Intelligence mean score was significant. It was concluded that positive correlation exist
among all multiple intelligences as perceived by higher secondary school students.
As present study explored that all caregories of intelligence may have positive impact on academic
achievement of students so it is recommended that teacher may consider these intelligences while
planning their lessons.
Further more, experimental studies may possibly be carried out study in perspective of diverse
demographic variable like age groups, geographical area, eacademic programs etc. in order to explore
actual interelation among all multiple intelligences with each other and their correlation with linguistic
intelligences.
*Respected Editor
The following article is taken from chapter-4 from thesis work of Dr.Qurat Ul AIN., which was
submitted to the Higher Education Commission of Pakistan due to which the similarity index is above
from the required, it is also mentioned that the following work was not published in any journal before.
References
Anastasi,A.(1983c).what do intelligence tests measure? In S.B. Anderson& J.S. Helmick
(Eds.), On educational testing . San Francisco: Jossey-Bass.
Beishuizen, J. J., & StoutJ'csdiJ'k E T (1999) Study strategies In a computer assisted study
environment. Learning and Instruction, 9(3), 281-30 I.
Blythe. T., & Gardner, H. (J 990). A school for all intelligences. Educational Leadership,
Bouton, D.A. (1997). Operationalizing Multiple intelligences theory with adolescent Bulletin, 80
Psychology, 68,427-441.
Bloomington, IN: Phi Delta Kappan Educational Foundation, (ED 356 277) (highly
recommended )
Cambpell ,L & Cambpell (2000)' Multiple Intelligences and student achievement: Success

Journal of Business and Social Review in Emerging Economies Vol. 6, No 4, December 2020
1446
Stories.
Campbell ,L & Campbell (1999) Multiple Intelligences and Student Achievement: success
stories from six schools, Alexandria, VA: Association for supervision and
curriculum Development.
Campbell, B., Campbell, L .and Dickinson(1996) Teaching and learning through Multiple
Intelligences Needham Heights, MA: Allyn & Bacon.
curriculum Development.
Cano-Garcia, F., & Hughes, E. H. (2000). Learning and Thinking Styles: An Analysis of Their
Interrelationship and Influence on Academic Achievement. Educational Psychology:
An International Journal of Experimental Educational Psychology, 20(4), 413-430.
Checkley, K. (1997) The first seven and the eight intelligence: A conversation with Howard
Gardner. Educational Leadership: Teaching for multiple intelligence. ASCD V.
55, #1, Setember 1997, 8-13.
Chen, J. (2004) Theory of multiple intelligences: Is it a scientifictheory? Teachers College
Record, 106(1), 17-23.
Clark, (2001) Learning styles vary for adult student. Lana Ivanitskaya Executive Director,
Organizational Research.
Claxton, C. S., & Murrell, P. H. (1988). Learning Styles. ERIC Digest (EDO-HE-88- 6).
Tennessee: ERIC Clearinghouse on Higher Education, Washington, DC. Oftice of
Educational Research and Improvement (ED), Washington, DC.
Curry, L, (1991), Patterns of learning style across selected medical specialties Educational
Psychology, 11,247-278.
Curry, Lynn. (1983). An Organization of learning style theory and constructs. ERIC Document,
Carroll, J.B. (1993). Human cognitive abilities: A survey of factor-analytic studies. Cambridge:
Cambridge University Press.
Davidson, G, V., & Savenye, W.S. (1992). How do learning styles relate to performance in a
computer applications course? Journal of Research on computing in Education,
24(1), 348-358.
Davidson, J.E. (1990). Intelligence recreated. Educational Psychologist, 25(3-4), 337-354.
Davis, Russel. (1991). Learning How to learn: Technology, the Seven Multiple Intelligences and
Learning. California: (ERIC Document Reproduction Service No. ED 338214).
Educational Research Journal, 13, (1) 3-22
Dunn, R., & Griggs, S. (1998) Learning Styles: Link between teaching and learning.In Dunn, R.
& Griggs, S.(Eds.), Learning styles and the nursing profession (pp. 11-23). New
York: NLN press. I
Day, J. D., Engelhardt,J. L., Maxwell, S. E. & Bolig, E. E. (1997). Comparison of static and
dynamic assessment procedures and their relation to independent performance.
Journal of Educational Psychology.
EIlison, L. (1992). Using multiple intelligences to set goals. Educational Arlington Public
schools Web Page. http://Www.surfaquarium.com/im.htm
Feuerstein, R., Feuerstein, R., & Gross, S. (1997). The learning potential Assessment Device. In
D. P. Flanagan, J. Genshaft, & P. L. Harrison (Eds.), Contemporary Intellectual
assessment: Theories, tests, and issues. New York: Guilford.
Gigerenzer, G. (2004). Dread risk, September 11, and fatal traffic accidents. Psychological
science, 15.
Gardner, H. (1983). Frames of mind: The theory of multiple intelligences. New York: Basic
Books.
Gigerenzer; G., Todd, P. M., & The ABC Research group (1999). Simple heuristics that make us
smart. New York: Oxford University Press.
Gardner, H. (1999). Intelligence Reframed: Multiple Intelligence for the 21st century. New York,
NY: Basic Books.
Gardner, H. (2004). Audiences for the theory of multiple Intelligences. Teachers College Record,
106(1), 212-220
Guilford, J. L. (1954). The nature of human intelligence. New York: McGraw-Hill. Herrmann,

Journal of Business and Social Review in Emerging Economies Vol. 6, No 4, December 2020
1447
N. (1982). The Creative brain. NASSP Bulletin, 31-45.
https://www.verywellmind.com/gardners-theory-of-multiple-intelligences-2795161
http://www.ascd.org/publications/educational-leadership/sept97/vol55/num01/The-First-Seven.-.-.-and-

Journal of Business and Social Review in Emerging Economies Vol. 6, No 4, December 2020
1448

Journal of Business and Social Review in Emerging Economies Vol. 6, No 4, December 2020
1449
Volume and Issues Obtainable at Center for Sustainability Research and Consultancy
Journal of Business and Social Review in Emerging Economies ISSN: 2519-089X (E): 2519-0326
Volume 6: No. 4, December 2020
Journal homepage: www.publishing.globalcsrc.org/jbsee
Early Marriage in Pakistan: So Little Done, but So Much to Do
1Uzma Ashiq, 2Nargis Abbas, 3Amir Zada Asad 1Lecturer, Department of Social work, University of Sargodha, Pakistan, [email protected]
2Assistant Professor, Department of Education, University of Sargodha, Pakistan,
[email protected] 3Department of Social work, Univerity of Peshawar, Pakistan,
ARTICLE DETAILS ABSTRACT History Revised format: November 2020 Available Online: December 2020
Marriage is a human social institution which lays the foundation of a
family as a unit of a society. It has been happening in human
societies since the dawn of the creation but with varying degree of
celebrations, customs and traditions, modes and manners etc. It is
regarded as a moment of celebration and joys not only for the couple
who are going to lock in weddings, but in many parts of the world, it
is a moment of joy and celebration for the blood relatives as well as
the entire community. Unfortunately, it does not happen always
especially in the case of early marriage. In such case, it does not give
such a cause of celebrations to the wedding couple rather it imposes
on them without their consent or informed consent. The practice of
early marriages has been in vogue from time immemorial, but all its
negative impacts whether social, economic, physical or
psychological, are realized since the late 20th century. This literature
based article highlights the concept, practice, causes and
consequences of the child marriages with special reference to
Pakistani society. It was concluded that by increasing literacy rate
among the people and through educating them, the issue of early
marriages may be minimized/dealt.
© 2020 Center for Sustainability Research and Consultancy Pakistan under
a Creative Commons Attribution-NonCommercial-ShareAlike 4.0
Keywords Maternal mortality; Poverty;
illiteracy; School drop-out
rate, Cultural value
JEL Classification
M0, M1
Corresponding author’s email address: [email protected]
Recommended citation: Ashiq, U., Abbas, N. & Asad, A. Z. (2020). Early Marriage in Pakistan: So
Little Done, but So Much to Do. Journal of Business and Social Review in Emerging Economies, 6(4),
1449-1456
1. Introduction
Marriage is a human social institution which lays the foundation of a family as a unit of a society. It has
been happening in human societies since the dawn of the creation but with varying degree of cultures,
customs, religious norms, traditions etc. These various elements further vary from region to region, tribe
to tribe and sometimes family to family. Generally, marriage age of a girl is related with the
commencement of her puberty, which may be variant in different parts of the world. For example, in
Asian countries usually girls attain their puberty before their teenage due to climate and racial factors
(Butts & Sheifer, 2010). In addition, due to religious obligations against premarital sexual relationship,
marriage of the girl is preferred as soon as she attains her puberty. However, marriage at this age before
adolescence is considered as the early marriage. To have a clear idea of what constitutes an early
marriage, it is important to have a valid definition of the term. Internationally, an early marriage is
Journal of Business and Social Review in Emerging Economies Vol. 6, No 4, December 2020
1450
understood as said by United Nations (1998),
“a marriage or wed lock wherein one or both of the marrying partners are a
‘child’ and internationally a child is understood as a person less than eighteen years
of age unless the law applicable to the child, majority is attained earlier”.
In Pakistan, however, under the century old law known as The Child Marriage Restraint Act 1929
“A marriage is a child marriage if the male is under eighteen years of age and/or
the female is under sixteen” (Shaukat, 2015, p. 201).
Therefore, the practice and concept of a child and early or child marriage differs from one country to
another. Moreover, according to a UN report, six hundred thousand children-brides/ groom in Pakistan
are married every year or 1650 children per day (United Nations Organization, 2013). Quoting a report
of a national NGO the Blue Veins, the Express Tribune, an online daily reported that;
“About 60 million children were married around the world during 2014 which
were under the age of 18 years. Out of this number 24% (144,000,00) were from
rural Pakistan and 18% (108,000,00) from urban Pakistan” which means a total of
2,520,0000 children in Pakistan were married (Express Tribune, 2013).
Another report confirms these statistics and says that 21% of the brides in Pakistan are married before
eighteen years (United Nations, 2015), while another report of this International Organization marking
the nineteen years period (from 1987 to 2005), reported that in urban region of Pakistan total child
marriages reaches to 21% of the children population, while in rural areas, the figures go well above 37%
giving an average of 32% of all the marriages of the underage population (GOV, 2015).
A United Nation report quoted by The Dawn Newspaper reported that in ten years (marking 2011-2020)
over 140 million children will become child-brides and grooms. It is apprehended that if this level of
child marriages remains constant, 14.2 million children annually or 39,000 daily will be married out in
their childhood. The same report also has estimated that out of the 140 million children who will be
married out, 50 million will be less than 15 years of age (Dawn, 2015).
In 2012, print media in Pakistan reported 75 such cases and out of this number, 43 per cent children
were 11-15 years old while 32 per cent were too young for marriage that were between the ages of 6-10
years. In 2008-2009, 24,228 children of 10-14 years and 10, 29,784 children of 15-19 years were
reportedly married. This is a tip of the iceberg as mostly, such marriages are never reported (Express
Tribune, 2015). Even the approximate numbers of such weddings cannot be made available due to poor
official statistics compilation and data collection. A best example of this official negligence can be that
Pakistan could not conduct population census for the last seventeen years (since after 1998) which could
help to comprehend the issue. Moreover, the Pakistan Demographic and Health Survey 2006-07,
mentioned that that 50 percent of the girls at age of 15-18 years were either expecting or already mothers
(Government of Pakistan, 2007).
In the most report of Save the Children recent statistics reported by Tribune Express (2020); it was
stated that;
“Pakistan is ranked 88th out of the 144 countries where underage marriages,
compounded by discriminatory social norms, affect large numbers of girls. In
Pakistan, because early marriage is attributed to poverty and the lack of education,
women suffer at multiple stages of their lives”.(Seema Shakeel, 2020).
1.1 Province Wise Practice of Early Marriages
According to a UNICEF report, the early marriages practice in Pakistan is concentrated in the country-
side as compared to the cities so much so that 58% females and 18% males of the country-side marry
before 20 years, while 27% girls and 5% boys get marry in the cities. Not only there exists a difference
between rural and urban areas, there is marked difference in the statistics of early marriages between the
four federating units of Pakistan namely Punjab, Sindh, Kheber Pakhton Khwah (KPK) and Baluchistan.

Journal of Business and Social Review in Emerging Economies Vol. 6, No 4, December 2020
1451
The regional statistics shows that Sindh province on the top of the pre-20 marriages with 72% females
and 26% males in the selected sample (Government of Pakistan, 2015). Similarly, Baluchistan is the
second after Sindh in terms of pre-20 year marriages in the rural set up with 22% males and 63%
females. Moreover, urban areas of Baluchistan have a lead in early marriages with 9% males and 56%
females for the same age group (Government of Pakistan, 2015).
Meanwhile, KPK is the third in this regard, as 63 % rural women are married out before attaining 20
years age. In this province, the rural men of the same age group have the least figures of 8% who are
married. Punjab province has a record of having most males and females who get marry in their post-20
both in urban and rural set up (Government of Pakistan, 2015). While the pre-20 figures for such
marriages are 50% for rural and 20% for urban areas of Punjab. As a trend, men in cities of Punjab
marry even in their thirties. A little number (4% ) marry in their pre-20 (UNFPA, 2012). These figures
are blurred by the custom of “Pet Lekhai” in southern Punjab where a girl child is betrothed for
exchange before she is born or still in the womb, a consequence of the custom of exchange marriage or
marriage by purchase (Shaukat, 2015).
1.2 Causes of Early Marriage
Early marriages in Pakistan are based on cultural customs, traditions and the customary
practices. Culturally, there is a number of modes of marriage including marriage by exchange, marriage
by purchase (to settle debts and disputes), arranged marriages, elopement or court marriages etc. In the
exchange mode (Vani or Watta Satta) of marriage a young daughter or sister is mostly exchanged for a
women (wife) irrespective of the age of the bride-groom or number of already existing wives and such
marriage can take place without any publicity, sanctioned by a Jarga or Panchayat (A local judiciary
system in pakistan). Other reasons include the traditional tribal and feudal structure and social
organization of the society, unawareness of the general masses about the corrosive effects of early
marriages and the extreme poverty (Tremayne, 2006). Again, Child marriage is a subject of morality and
not legislation (Stevenson, 2017). How come morality be legislated?
The ongoing controversy among the clergy, the civil society and the state has made an issue out of a
problem. Mostly, it is misinterpreted that religion and the clergy is on the back of the problem and
perpetuating it but it should be noted that Islam has nothing to do with minor things like child marriage
(Lau, & Ho, 2018; Liepert, 2011). At least it has declared a rule of marriage that is puberty and that is it.
Islam does not say how long after the onset of puberty a marriage is valid or invalid. The other important
reason is poverty. If we examine the causative factors of early marriages in Pakistan, poverty emerges as
another major cause effecting the child/early marriage situation in a number of ways viz-a-viz the mode
of marriage particularly (Ogwumike & Ozughalu, 2018). Here are listed some of the major causes
below.
1.3 Economic Constraints due to Poverty
Feeding a mouth by a poor father or mother is extremely difficult for a family. The best way to adjust
such a situation is the early marriage of the daughter so that the family can save rather than spending on
her living and education. In many poor families, the marriage by purchase or sale and exchange is
prevalent. In marriage by purchase a human being becomes a ‘slave’ than a wife and she is subjected to
all forms of violence including sexual relations. If, for example, poor family wants to marry a son, they
have either to pay the bride price or will exchange a daughter for a daughter-in-law. The exchange
marriage is also means of acquiring wife by a widower or a person want to have a second or third wife
irrespective of the age differentials. Not only the purchase mode becomes a family matter but in some
cases in southern Punjab like, in Cholistan desert, it becomes a clan’s responsibility to acquire a wife for
a young male member. In this case, the entire clan contribute towards the cost of the bride price and the
custom is known as Phorhi (Shaukat, 2015).
1.4 Honour and Safety of the Grown Up Girls
In poor families, if father and mother or both go for work, it is difficult for the family to leave such a
grown up girl at home unattended. In such cases, either the girl has to be put to child labour or be
Journal of Business and Social Review in Emerging Economies Vol. 6, No 4, December 2020
1452
married out earlier to safe guard her chastity. In this aristocratic and feudalistic culture, it is difficult for
poor people to save their girls from exploitation by the upper class. We read every day these like stories
in newspapers and can infer that there is a relationship between female chastity and family honour which
conditions the poor parents in particular to marry out girls child earlier to avoid sexual molestation of a
girl and the resultant loss of family honour (SPARC, 2013).
1.5 The Phenomenon of Child Mortality
Some years ago, in Pakistan, child mortality was rampant and it is still nearly 314/1000 live births in
interior Sind (UNICEF, 2015). Parents were never sure of the survival of their children particularly the
male children. In order to satisfy their internal love and affection, parents use to marry their male
children in particular very early to see them in the wedding dress or SEHRA ON THEIR HEADS. Now
a days due to slow down of the child mortality, the trend of early marriage has also slowed down.
1.6 Consequences of Child Marriage
We have discussed the causes and said that parents consider cultural, social and financial aspects to wed
their daughters at an early age. Unfortunately, what is not considered, are the consequences that such
early marriages can have on young girls. Over the last few decades, a decrease has been observed in the
frequencies of early marriages but this decrease is less for girls than boys (Bhattacharyya, 2016). The
consequences of child marriages are many and disastrous in terms of the physical and psychological
health of the girl in particular, literacy level among the school age children, school drops outs etc (Liu,
Holmes & Zhang, 2018). The following are some of the negative aspects of early marriages with respect
to Pakistan.
1.7 Child Mortality
One such consequence is that of early childbirth which, directly results in greater vulnerability related to
biological and physiological complications. Researches show that for a mother under the age of 18 the
fatality rate of her child is 60 percent greater than those of a child whose mother is above the age of 19
(UNFPA, 2012). Even if such children survive, they will have low birth weight and are mal-nourished.
This will cause the stunting of the child's physical and mental growth.
1.8 Deprivation from Childhood
The age of 8-12 years is the age of plays and enjoyments for the children irrespective of the financial
status of the family and parents. By forcing such children into a wed lock means they are assigned ‘adult
roles’ and they are no more children. This is unnatural and is tantamount to snatching the God gifted
childhood from the innocent children who are not yet ready to shoulder the hard facts of life. The young
girls are separated from their familiar surroundings, and are isolated and alienated.
1.9 Maternal Mortality
There has been a close relationship between early pregnancies and the increased risk of premature
abortions and complicated labour, low birth-weight and a higher chance of child and maternal mortality
(Judith, 1995). Pakistan has already highest child and maternal mortality rate in the region. This high
rate can only be attributed to Pregnancy-related complications among 15-19 year-old girls in particular.
According to experts there is a 20 to 200 percent greater chances of maternal deaths among women aged
15-19 than women who marry in the age between 20 and 24 years (Express tribune, 2013). According
to Center for Reproductive Law and Policy (1999) the main causes of these maternal deaths are:
“hemorrhage, sepsis, pre-eclampsia/eclampsia7 and obstructed labour. Unsafe abortion is the other major
risk for teenage women – most of those affected are unmarried”
The World Health Organization and the UN department of Economic and Social affairs have explained
the relationship between early marriages and maternal mortality as “Child wives fall ill and frequently
die which explaining the highest maternal deaths in many countries" (United Nations Organization, 7 In gynecological terminology a Fistula is a rupture or hole or passage between organs specifically between the feminine vagina and the rectum or between the vagina and the urinary bladder mostly caused by an obstructed or delayed labor. This is a very troublesome problem where women have no control over the urine or stool
Journal of Business and Social Review in Emerging Economies Vol. 6, No 4, December 2020
1453
2000). It is now proved that young girls, who gestate before 15years of age, are at risk of death five
times greater than girls gestate after 20 years of age8
1.10 Gynecological Complications
Teen pregnancy, particularly below 15 years of age, brings disastrous consequences for young women.
In the teen early or pregnancies, there is every likely hood of an increased risk of Obstetric Fistula* as
their small pelvis and the tender birth canal obstructs the smooth delivery or labour. Such pre-15 years
mothers have 88% chances of such fistula (Nour, 2006). Fistula is a very painful, infectious
complication wherein the victim has no control over urine and stool, a disability not only causing
physical agonies but socially a shame as the patient cannot stay with people due to unbearable smell. In
most cases such women are shunned not only by the community but by the husband as well, if not
repaired through a prolonged surgical procedure (Cook et al., 2004).
1.11 Emotional and Mental Effects
Like adult women, a teenager girl is not able to fulfill the expectations of her husband and in-laws
effectively which leads to domestic discords in the form of verbal, psychological as well as physical
abuse of the girl. Mental health of the girls here becomes a huge cause of concern, as the victims of such
torture often become hysteric. These young girls who are either sold or exchanged for marriage in
particular, are not allowed to meet their parents or visit their maternal houses and end up feeling
estranged in their new surroundings. There is no psychological support and consolation to these mentally
estranged victims. These circumstances take a turn for the worst when the uneducated and traditional
mind-set of the communities misunderstand the girl's plight and take it as some form of paranormal
influence. Girls are often thought to be possessed by Jinn's (evil spirits) and are taken to local traditional
healers Aamil or Mulla or soothsayers who mostly, inflict severe physical torture upon these young girls
to drive out the evil spirit or Jinns (Baig, 2010).
Early marriages also hinder personality development and physical growth of the teen agers as a the child
has to undergo constant physical, intellectual and emotional changes before attaining mental adulthood.
In Pakistan the differential in marriages is high and child brides are sometimes married to much older
men and making the girls are subjected to submission towards their older husband as towards father and
mother in own home. Consequently, intimacy between them may be a joy and satisfaction for the
husband but may be a labour for the young girl.
Another associated problem with this mismatch is the risk of becoming widow in a very young age is
also writing on the wall as the older husband has to leave this world earlier as a natural phenomenon
(Abbas et al., 2020). Resultantly, the young widow girl may face many socio-economic challenges. This
means a widow is left with her orphan children. Such young widows remain unhappy due to their long
inability to support the family and make such girls to attempt suicides or elopement with young males
which ultimately lead to their killing known as “honor Killing” and even unhappy after remarriage.
1.12 Illiteracy, Drop-Out and Low Education
The most disastrous effect of such marriage is the low literacy level of women. In Pakistan, the women
literacy rate is already deplorable and we are constantly adding un-educated women to the existing lot.
Early marriages leave the young girls dropped-out from the school or compel her to leave her education
incomplete (Wahab et al., 2018). Mentally capable and intelligent girls, who can do well in academics
and can have a rewarding career in life, are forced to drop out. It is now established that there correlation
between child marriages and a low literacy level. It is a matter of common observation that in both, rural
as well as urban Pakistan, 60% girls who never attended a school are married before their 20th birth day.
There is always a decrease in early marriage with increase in educational level. Sample surveys reveal
that even primary level of education decreased the intensity of early marriage by 19% ( from 68 to 49

Journal of Business and Social Review in Emerging Economies Vol. 6, No 4, December 2020
1454
percent) for girls while nine years of education decreased the intensity of early marriages up to 33% and
over ten years or secondary and higher secondary level education reduced early marriages to 13%.
Similar can be the case for boys as well. It is researched that 29% boys who never attended school
married before 20 while primary level of schooling reduced the percentage of early marriages of males
to 14% and high school or college level education reduced the intensity of early marriages among boys
to 8% (Population Council, 2015).
1.13 Population Growth Child marriage are also a cause of higher rate of population growth as the teenage brides are in a more
fertile age and start to bear children from a young age till late age. Early marriages lead to higher
fertility rate and hence higher population growth rate.
“The earlier they [young girls] get married, the more child-bearing years they have” (Dakuyo & Jean,
2010)
Girls who are married early, are mostly unaware of contraception methods nor can discuss it with
husband or mothers-in-law because producing more children is always the choice of the parents-in-law.
Consequently they have mostly unplanned gestations. This contributes towards Pakistan’s already
burgeoning population.
2. Conculsion and Recommendations
The trend of early marriages in Pakistan encompasses the factors like; physical & socio-cultural security
of girls, and girl child. It produces the fear among the parents of daughters in terms of girl child abuse,
rape, late marriages or unmarried old age daughter. Socially, value system of Pakistani society demands
sex segregated society and any kind of sexual or emotional involvement of girls before marriage is
strictly punishable in the society. Keeping these circumstances in view, parents prefer early marriages of
their daughters. Amongst the physical issues, the cases of girl rape are still prevailing in the community
around us. When such incident happens, it ruins the reputation of the whole life of a girl as well as of her
whole family, and in result, no one is willing to marry her. Culturally, raising a daughter is considered as
‘watering a neighboring tree’ (Malik, 2005) hence she is thought of an economic burden and
consequently she needs to be married as she reaches puberty. On the other hand, the parents’ decisions
of their daughter’s early marriages is resulting in increased chances of many health hazards and sexual
transmitted diseases among the families.
The solution of this trend is, firstly to render awareness about health believes and concerns of the people
regarding overall health issues due to early marriage. The organizations working for this issue, scholars
and govt may have necessitation’s to amend these issues. To address this issue of early marriage due to
economic burden, poverty prevention/reduction strategies among girl child families’ may be another
way out. This idea may be achievable through the introduction of small business, entrepreneurship and
cottage industry which will ultimately not only empower to the families of girl child but also to the girls
in itself in the long run.
In nut shell to attain this goal step by step programmes can be introduced, like at first hand there is need
to deal with belief system of families for the girl child as a burden and source of threat to the respect of
family in case of any miss happenings. Secondly, there is immense need of inculcating awareness of
rights of the girls among the parents. Thirdly, skill development and enhancement programmers for girls
and fourthly, small loans strategies for small business and entrepreneurship should be provided by
government especially in remote areas. Last but not the least we can connect the families of girl child to
outer developed world through social media and motivate them properly to tackle the prevailing early
marriage problem. If the issue should not be deal at earliest and urgent bases it may lead to a
voluenarable group of child wife’s and potential mothers of mentally and physically disordered new
borns.
But the flip side of the picture has another angle which reveals the measures taken by the government of
Pakistan to deal with the security of early girls’ marriage issue. Keeping in view the severity of physical

Journal of Business and Social Review in Emerging Economies Vol. 6, No 4, December 2020
1455
and socio-cultural security of girl child, the government has promulgated legislation like Hudood
Ordinance (rape), 1979. Further it has fixed the marriage age as 18+ to empower women and to secure
women health issues through Muslim family Law Ordinance, 1961. But the good governance of the
policy and implementation of law in its true soul are still lacking in the country and no serious actions
are taken in all the cases of early marriages. There is a strict need to create awareness among the citizens
by the Government organizations (GOs) and NGOs. Further the rule of law in case of rape crime need to
be enforced in the country.
References
Abbas, N., Abrar ul Haq, M., Ashiq, U., & Ubaid, S. (2020). Loneliness Among Elderly Widows and Its
Effect on Social and Mental Well-being. Global Social Welfare, 7(3), 215-229.
https://doi.org/10.1007/s40609-020-00173-5
Baig, Q. (2010). Adolescent Girls Empowerment: Real Life Accounts of Victims of Early Marriage,
(Islamabad: Rutgers) p.19.
Bhattacharyya, R. (2016). Street violence against women in India: Mapping prevention strategies. Asian
Social Work and Policy Review, 10(3), 311-325.
Center for Reproductive Law and Policy (1999). Implementing Adolescent Reproductive Rights through
the Convention on the Rights of the Child. Washington DC, p.3.
Cook, R. J., Dickens, B. M., and Syed. S. (2004). Obstetric Fistula: The Challenge to Human rights.
International Journal of Gynecology and Obstetrics 87(1),72-77.
https://doi.org/10.1016/j.ijgo.2004.07.005
Dakuyo, Jean L. (2010). Early Marriages and Fertility (Burkina Faso: National Population Advisory
Council), p.19.
Dawn. (2015, January 30). Anti-child marriage law. DAWN Newspaper, Retrieved on October, 25 from
https://www.dawn.com/news/1160326
Express Tribune, (2015, October 13). Child marriage: The scourge of Khyber-Pakhtunkhwa. Retrieved
from https://tribune.com.pk/story/971791/day-of-the-girl-child-child-marriage-the-scourge-of-
khyber-pakhtunkhwa
Express Tribune (2013, January 2). Child Marriage in Pakistan. Retrieved on November, 12, 2020 from
https://tribune.com.pk/story/488062/child-marriage-in-pakistan
Government of Pakistan. (2007). Demographic and Health Survey of Pakistan, 2006-7. Islamabad:
Population Census Bureau, p.111
Government of Pakistan, (2015). Pakistan Statistics retrieved on November, 12, 2015 from
http://www.UNICEF.org/infobycountry/pakistan_pakistan_statistics.html (Study report Child
Marriage in Pakista: A Taboo), p.1.
Judith, S (1995). Adolescent Health: Reassessing the Passage to Adulthood. World Bank Discussion
(Paper no. 272), Washington DC.
Lau, Y. K., & Ho, W. M. (2018). Family‐centered kindergarten social work services in Hong Kong: A
pilot project. Asian Social Work and Policy Review. 12(2), 116-126.
https://doi.org/10.1111/aswp.12144
Liepert, D. (2011, January 29). Rejecting the Myth of Sanctioned Child Marriage in Islam [Web log
post]. Retrieved January 05, 2018, from https://www.huffingtonpost.com/dr-david-
liepert/islamic-pedophelia_b_814332.html
Liu, T., Holmes, K., & Zhang, M. (2018). Better educational inclusion of migrant children in urban
schools? Exploring the influences of the population control policy in large Chinese cities. Asian
Social Work and Policy Review, 12(1), 54-62.
Malik, A. H. (2005). Sociology of Gender Relations. Multan: Teachers Students Welfare Forum.
Nour, N. M. (2006). Health Consequences of Child Marriage in Africa. Emerging Infectious
Diseases, 12(11), 1644-1649. https://dx.doi.org/10.3201/eid1211.060510.
Ogwumike, F. O., & Ozughalu, U. M. (2018). Empirical evidence of child poverty and deprivation in
Nigeria. Child Abuse & Neglect, 77, 13-22.
Population Council (2015) Adolescents and Youth in Pakistan 2001-2010: A Nationally Representative
Survey, Retrieved on December,12. 2015. from http://www.popcouncil.org

Journal of Business and Social Review in Emerging Economies Vol. 6, No 4, December 2020
1456
Seema Shakeel (2020, January 17). Child Marriage. Express Tribune. Retrieved from
https://tribune.com.pk/letter/2138701/6-child-marriage-9.
Shaukat, A., (2015) The Changing Roles and Status of Women in Cholistan, Pakistan. (Peshawar
University: Unpublished Ph.D. thesis), p.201.
Shaukat, A., (2015) The Changing Roles and Status of Women in Cholistan, Pakistan. (Peshawar
University: Unpublished Ph.D. thesis), p.201.
SPARC (2013). Society for the Protection of the Rights of the Child: Child Marriage. Islamabad: p.1
Stevenson, K. (2017). ‘Not Just the Ideas of a Few Enthusiasts’: Early Twentieth Century Legal
Activism and Reformation of the Age of Sexual Consent. Cultural and Social History, 14(2),
219-236.
Tremayne, S., (2006). Modernity and early marriage in Iran: A view from within. Journal of Middle
East Women's Studies. 2(1), 65–94
UNICEF. (2015). The State of the World’s Children 2014 . New York: UNICEF.
UNFPA. (2012). Child Marriage profile: Pakistan, 2012. Retrieved on 10 October 2020 from
http://www.khubmarriage18.org/sites/default/files/statistical_information/Child%20marriage-
Profile%20for%20Pakistan-UNFPA.pdf
United Nations. (1998). Convention on the Rights of the Children. Geneva: UNICEF.
United Nations (2015). The State of the World’s Children 2015.New York: UNICEF, P.15.
United Nations Organization (1991). The World’s Women 1990 (UN Department of Economic and
Social Affairs: New York. p.5.
United Nations Organization (2000). Adolescent Sexuality, Safe Motherhood Fact Sheet 2000 WHO:
Geneva.
United Nations Organization. (2013). Women aged 20 to24 married before 18(in thousands) UNICEF
Council on Foreign Relations (Statistics and Monitoring Section, Division of Policy and
Strategy, 2013).
Wahab, H. A., Bunyau, W., & Rezaul Islam, M. (2018). Microcredit for rural poverty alleviation and
social well‐being: A study of Sabah, Malaysia. Asian Social Work and Policy Review, 12(1), 4-16.
Journal of Business and Social Review in Emerging Economies Vol. 6, No 4, December 2020
1457
Volume and Issues Obtainable at Center for Sustainability Research and Consultancy
Journal of Business and Social Review in Emerging Economies ISSN: 2519-089X (E): 2519-0326
Volume 6: No. 4, December 2020
Journal homepage: www.publishing.globalcsrc.org/jbsee
The Socio-Political Obstacles behind the Scanty Political Participation of Women
Parliamentarians
1Hamida Bibi 1Lecturer in Bacha Khan Medical College Mardan, Khyber Medical University Peshawar, KP, Pakistan,
ARTICLE DETAILS ABSTRACT History Revised format: November 2020 Available Online: December 2020
The current study was conducted to indicate the numerous factors
active behind the scanty political participation of women
parliamentarians in parliamentary processions. For the collection of
data for the current study, women parliamentarians and women’s
rights activists were interviewed. Semi-structured in-depth interview
was used as research tool for data collection. For the analysis of data,
the tool of Thematic Analysis, developed by Braun and Clarke
(2015), was used. The findings of the study highlight some socio-
political obstacles such as the lack of educational adeptness and
political shrewdness, representing minority or reserved quota, the
patriarchal and male-dominant model of politics, party politics, etc.
are impeding the effective participation of women parliamentarians.
All this has upset to work freely and securely dissuading women’s
political achievements. In the light of the findings of the study, the
author recommends society changing its attitude towards women
politics. Women participation in politics ought to be encouraged at
the cost of the abolition of patriarchy in politics. The government
should help women parliamentarians. In order to be adept and astute,
special trainings and sessions shall be arranged for women
parliamentarians. Political parties should clearly policy in this regard
avoiding party politics and the supremacy of some political figures.
© 2020 Center for Sustainability Research and Consultancy Pakistan under
a Creative Commons Attribution-NonCommercial-ShareAlike 4.0
Keywords Politics, Participation,
Patriarchy, Parliament,
Women,
JEL Classification
M10, M14
Corresponding author’s email address: [email protected]
Recommended citation: BiBi, H. (2020). The Socio-Political Obstacles behind the Scanty Political
Participation of Women Parliamentarians. Journal of Business and Social Review in Emerging
Economies, 6(4), 1457-1461
1. Introduction
Political participation as a voter entails a variety of activities, viz. political thinking, political
propagation, political campaigning, multitudes’ mobilization and political proselytization, funds’
donation, joining political parties, and, above all, vote cast in an election. (Teorell, Torcal & Montero,
2007). All this is performed to make a hey in the formation of public policies. On the contrary, political
participation — as a parliamentarian — means presenting rhetoric on issues of public interest, initiating
bills, questioning and raising objections on bills, moving resolutions, forwarding motions, calls on the
government, petitions, etc. on the floor of parliament.
Since the inception of the organized–cum-political human society and parliamentary government,

Journal of Business and Social Review in Emerging Economies Vol. 6, No 4, December 2020
1458
despite an immensurable swell in their populace, women’s political participation — both as
parliamentarians and voters — is minimal (Lawless & Fox, 2001). According to Zardari (2018), in 2015,
around the world, only 22.1% women became part of parliament. It took immensurable efforts on behalf
of women populace to achieve suffrage — the right to vote. Philosophers, feminists, and women rights
activists have time and again reiterated the significance of women’s participation in politics, government
and policy making for the mitigation of their grievances in numerous spheres of life. Different socio-
economic-cum-statal factors impede women’s political participation. The socio-cultural division and
dissemination of power, resources and activities between men and women is uneven and partial tilted
towards men. This predilection has anchored women’s mobility, education, political participation and
economic activities ensuing women’s dependency and men’s power in social, political, and economic
arenas (Paxton, Hughes & Barnes, 2020).
Contrariwise, besides these frequent impediments obstructing women’s political participation as voters,
sundry encumbrances thwart political participation of women parliamentarians on the floor of assembly.
According to Lodhi (2019), lousy education and unripened political skills shrink political participation
of women parliamentarians. Quality education, critical thinking, rhetoricalness, and highly ripened-cum-
polished political skills are the prerequisites for satisfactory parliamentary performance. Weak self-
image deluges women parliamentarians mulling over their political views, initiations and performances
causing the psychiatric condition of inferiority and insignificance.
According to Bano (2009), women’s participation in parliamentary affairs is minimal. In the
parliamentary session of 2003-2004, women parliamentarians raised only 7% questions, moved only
12% resolutions, and passed only 7% motions out of the total parliamentary questions, resolutions and
motions. For the authoress, party politics is all that subdues auspicious participation of women
parliamentarians. The stage is always sabotaged by some eminent politicians of a party peripheralizing
the women legislators.
A study titled “Sexism, harassment and violence against women in parliaments in Europe” was
conducted by Union (2018) to indicate the different impediments women face in parliament. Data for the
study was collected from 123 women — 42 parliamentary staff and 81 MPs — from 45 countries in
Europe through vis-à-vis interviews. The findings of the study show that out of the 123 women:
1. 85.2% suffered psychological violence
2. 49.6% received threats of battering, rape and death
3. 58.2% received cyber attacks on social media
4. 67.9% suffered sexist, gendered, stereotypical and abusive comments on their posts on social
media
5. 24.7% suffered sexual harassment
6. 14.8% suffered physical harassment.
7. 13.5% faced economic violence — the denial of funds, salaries, allowances, etc.
The melancholic part of the findings were knowing the fact that out of all these anti women crimes,
69.2% were perpetrated by male parliamentarians. As the repercussions of these crimes, 33.3% of these
women parliamentarians stated that these acts of violence have mitigated our freedom of expression
making us more cautious in our parliamentary sayings and doings. Because of the online cyber attacks,
women parliamentarians have reduced — if not ended — sharing political ideas and achievements on
social media. Above all, these acts of violence have drastically reduced women’s participation in
parliamentary affairs. Besides affecting women parliamentarians, these acts of violence have
discouraged neophyte politicians impeding their way unto politics and parliament. Sexism, harassment
and violence against women in parliament are, maximally, politically motivated aimed at mitigating
women’s political participation.
According to Khan and Naqvi (2020), after entering into the parliament on reserved seats, women
parliamentarians no more remain public representatives. They have to discuss party agendas ignoring
women’s issues. Party politics hinder women’s participation in parliament. Women — those entering

Journal of Business and Social Review in Emerging Economies Vol. 6, No 4, December 2020
1459
into parliament through reserved quota — lack their own constituencies. Henceforth, they are the de
facto representatives of political parties not masses. This lack of constituency and entry to the parliament
on reserved quota devalues women parliamentarians. Having their own constituencies, the elected
parliamentarians, in comparison to those entered to parliament through reserved quota — consider
themselves more entitled to participate in parliamentary processions. Besides, Environment for women
parliamentarians is hostile and unfriendly. As per statistics by the authoresses, 30% of women
parliamentarians were forced to silence by their male counterparts, 11% suffered verbal abuse, 6%
received physical threats, and 26% suffered cyber attacks and defamatory remarks on social media.
In her article titled “Empty women seats in parliament” Zardari (2018) has limelighted the misogynistic
demeanor and comportment of our parliament upsetting the participation of women parliamentarians.
With the sparse representation of 20% — inclusive of the 17% reserved quota — women
parliamentarians have invariably tholed misogyny and sexism. The instances are frequent: in 1993,
Sheikh Rasheed passed derogatory remarks against Benazir Bhutto. In 2016, Shireen Mizari suffered
defamatory remarks from Khwaja Asif. The abusive language of Maulana Fazlu Rehman and his party
against PTI women is yet prevalent. All these hardships have barred the active participation of women
parliamentarians.
In its study titled “Sexism, harassment, and violence against women parliamentarians”, Union (2016)
claims psychological, sexual, physical and economic violence against women prevailing in parliaments.
The contributing factors are political rivalry, women rights activism, being in opposition, being young,
and belonging to minority or reserved quota. These acts of violence have multifaceted impact. Majority
of the victims are distressed fearing their safety and that of their family. Besides, these acts of violence
impede one’s ability to properly execute mandates and openly express opinions drastically mitigating the
participation of women parliamentarians in parliamentary processions.
In her study titled “causes of meager participation of women parliamentarians in Khyber Pakhtunkhwa
assembly; and the way out”, Bibi (2019) has indicated numerous efficacious political, socio-cultural,
economic and statal factors extenuating women parliamentarians’ active participation in the parliament.
The lack of own constituencies, the poor strength of women in parliament, economic dependence and
hurdles, socio-cultural constraints, lack of political skills, and the patriarchal-cum-male-dominant
politics bar women’s active participation in the parliamentary processions.
2. Objectives of the Study
Following are the objectives of the study:
1. To know the different socio-political reasons behind the scanty participation of women
parliamentarians in the parliamentary processions.
2. To suggest ways to improve the participation of women parliamentarians in the parliamentary
processions.
3. Research Methodology
The current study was conducted to indicate the numerous factors active behind the scanty political
participation of women parliamentarians in parliamentary processions in Khyber Pakhtunkhwa,
Pakistan. For the collection of data for the current study, 10 women parliamentarians and women’s
rights activists were interviewed. Semi-structured in-depth interview was used as research tool for data
collection. For the analysis of data, the tool of Thematic Analysis, developed by Braun and Clarke
(2015), was used.
4. Findings and discussion
4.1 Reserved Quota and the Lack of Constituency
Providing a sense of ownership, reasonability and utility, a constituency is considered a power base for
parliamentarians legitimizing their parliamentary endeavors. The findings of the study show that being a
minority or a reserved quota parliamentarian bars one’s parliamentary participation. The reserved quota
parliamentarians are disposed at the directives of the party politics. They are manipulated to vindicate
Journal of Business and Social Review in Emerging Economies Vol. 6, No 4, December 2020
1460
the vested interests of the political parties. Having no constituency to represent, the minority and
reserved quota parliamentarians have little why to engross in parliamentary processions. This political
impedance has downright upset women’s parliamentary participation further exacerbating the anterior
aggravated situation.
4.2 Patriarchal and Male-Dominant Politics
The findings of the study show that the patriarchal model of politics and male dominance in parliament
have dismally lowered the participation of women parliamentarians in parliamentary processions.
Around the globe, figures infer that men enact an overall 81% of the parliamentary populace. In the
political spheres, men are overrepresented outnumbering women populace. Besides, the patriarchal
model and mindset of politics persist in our political structures. It is a socio-political structure that
determines women as subservient to men adjudging them incapable of wielding liability and power. This
portrayal of incompetency, unintelligence, subserviency and submissiveness has been hampering
women’s efficacy in political arena. Domestic labor and restrictions and regulations from males have
also barred women’s political endeavors.
Besides the alleged perception of submissiveness and incompetency, the scarce women populace in
parliamentary rows find it hard to partake in parliamentary processions which has, in turn, downright
subdued women’s political profiles. The patriarchal-cum-prejudiced disposition and demeanor of the
peers discourage and bar the political endeavors of women parliamentarians the impact of which echoes
in a chain. Dejected over this elegiac political performance, the masses, in turn, resultantly, avoid
patronizing women’s candidature.
4.3 Socio-Cultural Barriers and Non-Formal Institutions
The findings of the study imply that socio-cultural taboos, expectation and norms are downright
subduing the political participation of women parliamentarians in parliamentary processions. For a
woman, going to the outdoor male dominant venues and partaking in the gendered political endeavors
are all deemed culturally tabooed. Adopting their standards of demeanor according to the societal
expectation upsets and interdicts the political endeavors of women parliamentarians. Besides, the
combined segregation of male and female parliamentarians has also been questioned.
Besides, some informal-institutionary gatherings and efforts precede parliamentary sessions. Being
arranged and held in the non-formal institutions like Hujra, Masjid, hotel, etc. religion and the socio-
cultural norms forbid the participation of women parliamentarians in these gatherings. Summarily,
owing to the fact that they have to heed both their political profiles and societal expectation, women
parliamentarians teeter about parliamentary political endeavors and the fulfillment of social codes of
conduct.
4.4 Poor Education and the Lack of Political Skills
The findings of the study show that poor education and the lack of political astuteness hamper the
effective participation of women parliamentarians in parliamentary processions. According to Ferris,
Kolodinsky and Treadway (2007), “political skills are the ability to effectively understand others and use
knowledge to influence others enhancing the achievement of objectives”. Having strong political skills
enables one to perform effectively valuing political profiles in turn. Parliamentary rhetoric, bills
initiation, raising objections, questioning, moving resolutions, etc. require knowledge and strong
political dexterity. The findings infer women parliamentarians’ lack of education and political
shrewdness upset their partaking in parliamentary sessions. As grave national issues are presented on the
floor of the House, they require resourceful scholarship and political competency. This gap of
scholarship and political proficiency prompts many parliamentarians to silencing and few to occupy the
stage.
5. Conclusion and Recommendation
Inefficacious and scanty political participation of women parliamentarians is prevalent around the globe
with varying obstacles behind. Women parliamentarians’ role and participation is observed as less
significant in comparison to their male peers. In the current study, women parliamentarians’ experiences
Journal of Business and Social Review in Emerging Economies Vol. 6, No 4, December 2020
1461
have been gauged to assess varying socio-political factors hampering their effective political
performances. The findings of the study highlight some socio-political obstacles such as the lack of
educational adeptness and political shrewdness, representing minority or reserved quota, the patriarchal
and male-dominant mode of politics, party politics, impeding the effective participation of women
parliamentarians. These findings are based upon the interviews of women parliamentarians and women’s
rights activists. All this has upset to work freely and securely dissuading women’s political
achievements. Benefitting from politics and the redressal of women-related issues, viz. gender
discrimination, women illiteracy and violence against women, require women empowerment and
maximal political participation. With the current outlook and demeanor towards women,
modernization’s tag would be unfit on our shoulders.
In the light of the findings of the study, the author recommends society changing its attitude towards
women politics. Women participation in politics ought to be encouraged at the cost of the abolition of
patriarchy. The government should help women parliamentarians. In order to be adept and astute, special
trainings and sessions shall be arranged for women parliamentarians. Political parties should clearly
policy in this regard avoiding party politics and the supremacy of some political figures.
References
Bano, S. (2009). Women in parliament in Pakistan; Problems and potential solutions. Women’s Studies
Journal, 23(1), 19.
Bibi, H. (2019). “Causes of Meager Participation of Women Parliamentarians in Khyber Pakhtunkhwa
Assembly; and way out”. Central Asia, 84(Summer), 125-136
Clarke, V., Braun, V., & Hayfield, N. (2015). Thematic analysis. Qualitative psychology: A practical
guide to research methods, 222-248.
Khan, A., & Naqvi, S. (2020). Dilemmas of Representation: Women in Pakistan’s Assemblies. Asian
Affairs, 1-21.
Kolodinsky, R. W., Treadway, D. C., & Ferris, G. R. (2007). “Political skill and influence effectiveness:
Testing proportions of an expanded ferris and Judge (1991) model”. Human Relations 60, no. 12
(2007): 1747-1777.
Lawless, J. L., & Fox, R. L. (2001). Political participation of the urban poor. Social problems, 48(3),
362-385.
Lodhi (2019). Challenges and issues to elected women parliamentarians to deliver effective
parliamentary services: a case study of Punjab assembly’, m. Phil Thesis, National University of
Modern Languages, Islamabad.
Paxton, P.M., Hughes, M. M., & Barnes, T. (2020). Women, politics, and power: A global perspective.
Rowman & Littlefield Publishers.
Teorell, J,. Torcal, M., & Montero, J.R. (2007). 13 Political participation. Citizenship and involvement
in European democracies: A comparative analysis, 334.
Union, I.P. (2016). Sexism, harassment and violence against women in parliaments in Europe.
Union, I.P. (2018). Sexism, harassment and violence against women in parliaments in Europe.
Zardari (2018). Empty women seats in parliament. The express Tribune.

Journal of Business and Social Review in Emerging Economies Vol. 6, No 4, December 2020
1462

Journal of Business and Social Review in Emerging Economies Vol. 6, No 4, December 2020
1463
Volume and Issues Obtainable at Center for Sustainability Research and Consultancy
Journal of Business and Social Review in Emerging Economies ISSN: 2519-089X (E): 2519-0326
Volume 6: No. 4, December 2020
Journal homepage: www.publishing.globalcsrc.org/jbsee
Violent Behavioral Outcomes: An Empirical Examination of Perceived Parenting
Rejection Practices in Lahore, Pakistan
1Hassan Raza, 2Saif-ur-Rehman Saif Abbasi, 3Nazneen Habib
1&2Department of Sociology, International Islamic University, Islamabad, Pakistan,
[email protected] 3Department of Sociology, University of Azad Jammu & Kashmir, Muzaffarabad, Pakistan
ARTICLE DETAILS ABSTRACT History Revised format: November 2020 Available Online: December 2020
Across the cultures, parenting or child-rearing practices are
considered as the concrete behaviors towards the developmental
process of rearing or socialization of the children. The study splits
the conception of parenting practices among two domains as parental
acceptance and parental rejection, depending on the behavioural
outcomes under investigation. The cross sectional research was
conducted on young males attending colleges in Lahore, Pakistan to
understand that how parental rejection dimensions of parenting
manifest the violent behavioral outcome among male college
students. The research within the Pakistani indigenous culture on
parenting practices and its inter-relationship between youth violent
behavioural outcomes provide stems from the theoretical anchorage
in the socio-psychological works. The sample of 816 male students
from public colleges of Lahore was included to collect the responses
through self-administered questionnaire as a tool of the study. The
results indicated that measures of perceived parental rejection
accounts variations in the violent behavioural outcomes of the young
male students for 26.2% (R2 = 0.262). The study suggests that
positive parenting interventions may cause to reduce the risk factors
(i.e. violent behavioral practices) among youth.
© 2020 Center for Sustainability Research and Consultancy Pakistan under
a Creative Commons Attribution-NonCommercial-ShareAlike 4.0
Keywords Parenting Practices,
Parental Rejection, Violent
Behaviour.
JEL Classification
M10, M12
Corresponding author’s email address: [email protected]
Recommended citation: Raza, H., Abbas, S. R. S. & Habib, N. (2020). Violent Behavioural Outcomes:
An Empirical Examination of Perceived Parenting Rejection Practices in. Journal of Business and Social
Review in Emerging Economies, 6(4), 1463-1467
1. Introduction
Researchers highlighted the significance of the inter-relationship between perceived parenting rejection
practices and behavioural outcomes among children (Peterson & Hann, 1999). However, the debate on
the adaptive and maladaptive parenting practices for one’s cultural context has been linked to
operationalize the conceptions (Barnhart et al., 2013). For instance, the researchers argued the linkages
between harsh/strict parenting (i.e. maladaptive in Europe and America) and maladaptive behavioural
outcomes among the children (Maccoby & Martin, 1983), while association of such parenting practices
with risk behavior in Asian families (Leung et al., 1998; Rudy & Grusec, 2006).
Researchers in the family studies have recognized that parenting practices are expected to contribute in
the process of developmental behavioural outcomes among children (Peterson & Hann, 1999; Kotchick

Journal of Business and Social Review in Emerging Economies Vol. 6, No 4, December 2020
1464
& Forehand, 2002). Parents, as major agents in the process of socialization, have been considerably
significant to rear or socialize their children to adapt with the prevalent and acceptable values and
normative practices in the society (Aneshensel, 2005). Scholars have studied parenting practices with
violent behavioural outcome extensively (Campaert, Annalaura, & Menesini, 2018; Manzoni &
Schwarzenegger, 2018; Acar, Uçuş, & Yıldız, 2017; Knerr, Gardner, and Cluver, 2013; Gilbert et al.,
2009; Howells & Rosenbaum, 2007; Gershoff, 2002; Chang et al., 2003; Pianta & Harbers, 1996).
Neverthless, the study explores the uncovered or neglected aspect of parenting dimensions especially
within the reference of South Asian heritage and Pakistani cultural context.
Across the countries, the studies have highlighted numerous factors that lead to the prevalence of violent
behavioural outcomes among youth members in the society. For instance, the study conducted in six
countries has significantly associated parental mal-practices in the child-rearing process and violence as
the behavioural outcome among children (Manzoni & Schwarzenegger, 2018; Howells & Rosenbaum,
2007; Durant et al., 1999). The researchers have also documented the use of physical punishment or
harsh parenting practices could become more consistent predictor of violent behavioural outcomes
among children especially young males (Acar, Uçuş, and Yıldız, 2017; Pianta & Harbers, 1996; Loeber
et al., 1990).
The current study attempts to see the linkages of parental rejection measures (i.e. –ve reinforcements)
and the violent behavioral outcomes among young male students. However, it has been very keenly
observed within the Pakistani cultural context that parents right after the matriculation level of education
(i.e. 10th grade students) of their children lose their monitoring and control as compared to school level.
This developmental stage could arise questions on the parental creditability for the rearing process of
their children. This study is particularly designed to address those questions which linked violent
behavioural outcomes of the male youth members and parenting rejection practices measures.
2. Methodology
The study was conducted on the sample of 816 male students at public sector colleges of Lahore with
97% C.I and 3% margin of error for the calculation of sample. The study used a standardized Parental
Acceptance and Rejection Questionnaire (PARQ) as a tool after validation in the local context. The list
of boy’s public colleges was collected by the office of Director Colleges, Lahore. The students at
intermediate level of education through filled out the questionnaire with standard instructions written on
it, administered in the class timings by their teachers. Moreover, the reliabilities of the scales used were
reported as high cronbach scores i.e. greater than 0.70 in all scales.
3. Results Table 1: Demographics of male students at public sector colleges of Lahore, Pakistan
Variable N (%)
Study year at college (Higher Secondary)
1st year 451 (55%)
2nd year 365 (45%)
Residential pattern
Urban 502 (62%)
Rural 314 (38%)
Family System
Nuclear Family 368 (45%)
Joint Family 448 (55%)
Monthly Family Income (in Pak. Rupees)
Up to 20,000 323 (40%)
20,001 to 40,000 310 (38%)
40,001 to 60,000 113 (14%)
Above 60,000 70 (8%)
Table 1 depicts the demographics of male students at public sector colleges of Lahore, Pakistan. There
were more than half of the respondents (451, 55%) who got them enrolled in the 1st year of higher
secondary school level and slightly less than half of the respondents (365, 45%) were enrolled in 2nd
year at higher secondary school. The significant majority (502, 62%) of the respondents who belong to

Journal of Business and Social Review in Emerging Economies Vol. 6, No 4, December 2020
1465
urban residential pattern and little less than two fifth of the respondents (314, 38%) were living in the
rural areas at the time of enrollment at public sector colleges of Lahore. In addition, there were 368
(45%) of the students were from nuclear family system and 448 (55%) were extended or joint family
system. The results illustrates that more than three fourth of the sample consists within the monthly
family income group having Rs. 40000 or less income. However, there was very minute sampled
population having more than Rs. 60000 income.
Table No. 2: Relationship between –ve parental Rejection practices and violent behavioural outcomes among male
students in public sector colleges
Violent Behaviour
Hostility/Aggression 0.459**
Indifference Neglect 0.470**
Undifferentiated Rejection 0.457**
Correlation significant at 0.01*
Table 2 showed the relationship between parental rejection measures with the violent behavioural
outcomes among male students. The findings illustrate positive and significant relationship among
perceived hostility/aggression parenting practices and violent behavioural outcomes among young males
at public sector colleges of Lahore (r=0.459, p<0.01). Moreover, there was a statistically significant
relationship between perceived indifference neglect practices for child-rearing and violent behavioral
outcomes among male students (r=-0.0.470, p<0.01). In addition, the positive and statistically significant
correlation was reported among perceived undifferentiated parenting rejection practices and violent
behavioural outcomes among male students (t=0.457 p<0.01).
4. Main Effect Model
To see the effect of parental rejection measures on the violent behavioural outcomes among make
students of public sector colleges of Lahore, simple linear regression was applied to observe the
variations among the variables. The results indicated that parenting rejection measures, altogether
accounts for 26.2% (R2 = 0.262) variations in the violent behavioural outcomes of young males at public
sector colleges. However, beta (β) values among the three measures of parenting rejection practices were
statistically significant with violent behavioural outcomes.
Table 3: Effect of Parental Rejection measures on the violent behavioral outcome among students
Variables Beta (Standardized) Sig. Value
Hostility/Aggression 0.459 0.001***
Indifference Neglect 0.470 0.001***
Undifferentiated Rejection 0.457 0.007**
F-Value 8.322
R2 0.262
Adjusted R2 0.260
Note ***=p<.001, **=p<.01
5. Discussion & Conclusion
The present study examines the effect of parenting rejection practices on the youth violent behavioural
outcomes among male students in Lahore, Pakistan. Major study hypothesis of the study states the
parenting rejection measures contributed towards the violent behavioural outcomes among young male
students in public sector college of Lahore. The study splits into three measures of parenting rejection
practices (i.e. hostile, indifference neglect, and rejection practices), as they are considered to be more
significant dimensions for the development of violent behaviors among young one’s especially emerging
adults (Grusec 2011; Patterson 2002).
Journal of Business and Social Review in Emerging Economies Vol. 6, No 4, December 2020
1466
The results of the study reported that there is a significant effect of parenting rejection measures on
violent behavioural outcomes among male youth students. The current study supports the notion that
children learn violent behavior from their parents while disengaging them morally by the result of poor
parenting practices such as aggressive, neglecting, and rejected parenting practices. Whenever children
experience harsh disciplinary parenting practices, they may learn to believe that victims can be punished
for their own misconducts and wrong doings. The study also supported the view of linkages between
poor parenting practices and moral disengagements among young or adolescents, where harsh discipline
or parental rejection/neglect may socialize children with more likely to appear moral disengagements
among them and resultantly aggressive or violent behaviors emerge due to these engagements (Maas,
Herrenkohl, & Sousa, 2008).
The findings of the current research depict that parenting rejection measures accounts for 26.2%
variations for the developmental outcomes of violent behavior. There is a significant and consistent need
to improve the parenting interventions which may diminish the risk factors in developing violent
behavioural outcomes. However, the interventions may particularly be enhanced within the domain of
parental awareness (knowledge), parental attitudes, and parent-child interactions for better outcomes.
Furthermore, more rigorous parenting programs in terms of contextualization, especially within problem
families, at the local and national level to prevent the risk behavioural outcomes which could be more
effective, acceptable and feasible to strengthen the family structures. Nevertheless, the process that links
parenting rejection and violent behavior among youth and how other mediators and moderators become
relevant for studying needs to be better understood for developing the violent or aggressive behaviours
among young or adolescents.
References
Acar, I. H., Uçuş, Ş., & Yıldız, S. (2019). Parenting and Turkish children’s behaviour problems: the
moderating role of qualities of parent–child relationship. Early Child Development and
Care, 189(7), 1072-1085.
Barnhart, C. M., Raval, V. V., Jansari, A., & Raval, P. H. (2013). Perceptions of parenting style among
college students in India and the United States. Journal of Child and Family Studies, 22(5),
684-693.
Campaert, K., Nocentini, A., & Menesini, E. (2018). The role of poor parenting and parental
approval for children’s moral disengagement. Journal of Child and Family Studies, 27(8),
2656-2667.
Chang, L., Schwartz, D., Dodge, K. A., & McBride-Chang, C. (2003). Harsh parenting in relation to
child emotion regulation and aggression. Journal of family psychology, 17(4), 598.
DuRant, R. H., Smith, J. A., Kreiter, S. R., & Krowchuk, D. P. (1999). The relationship between early
age of onset of initial substance use and engaging in multiple health risk behaviors
among young adolescents. Archives of pediatrics & adolescent medicine, 153(3), 286-291.
Gershoff, E. T. (2002). Corporal punishment by parents and associated child behaviors and
experiences: a metaanalytic and theoretical review. Psychological Bulletin, 28(4), 539
579.
Gilbert, R., Widom, S. C., Browne, K., Fergusson, D., Webb, E., & Janson, J. (2009). Burden and
consequences of child maltreatment in high-income countries. The Lancet, 373(9657), 68–81
Grusec, J. E. (2011). Socialization processes in the family: social and emotional development. Annual
Review of Psychology, 62, 243–69.
Howells, N. L., & Rosenbaum, A. (2007). Effects of perpetrator and victim gender on negative
outcomes of family violence. Journal of Family Violence, 23(3), 203–209.
Knerr, W., Gardner, F., & Cluver, L. (2013). Improving positive parenting skills and reducing harsh
and abusive parenting in low-and middle-income countries: A systematic review. Prevention
science, 14(4), 352-363.
Kotchick, B. A., & Forehand, R. (2002). Putting parenting in perspective: A discussion of the
contextual factors that shape parenting practices. Journal of child and family
studies, 11(3), 255-269.

Journal of Business and Social Review in Emerging Economies Vol. 6, No 4, December 2020
1467
Leung, K., Lau, S., & Lam, W. L. (1998). Parenting styles and academic achievement: A cross
cultural study. Merrill-Palmer Quarterly (1982-), 157-172.
Loeber, R., Brinthaupt, V. P., & Green, S. M. (1990). Attention deficits, impulsivity, and hyperactivity
with and without conduct problems: Relationships to delinquency and unique contextual
factors. In R. J. McMahon & R. DeV. Peters (Eds.), Behavior disorders of adolescence:
Research, intervention, and policy in clinical school settings (pp. 39–62). New York: Plenum.
Maas, C., Herrenkohl, T. I., & Sousa, C. (2008). Review of research on child maltreatment and
violence in youth. Trauma, Violence, & Abuse, 9(1), 56-67.
Maccoby, E. E., & Martin, J. A. (1983). Socialization in the context of the family: Parent child
interaction. Handbook of child psychology: formerly Carmichael's Manual of child
psychology/Paul H. Mussen, editor.
Manzoni, P., & Schwarzenegger, C. (2019). The influence of earlier parental violence on juvenile
delinquency: The role of social bonds, self-control, delinquent peer association and moral
values as mediators. European Journal on Criminal Policy and Research, 25(3), 225-239.
Patterson, G. R. (2002). The early development of coercive family process. In J. B. Reid, G. R.
Patterson & J. Snyder (Eds.), Antisocial behavior in children and adolescents: A
developmental analysis and model for intervention (pp. 25–44). Washington, DC:
American Psychological Association.
Peterson, G. W., & Hann, D. (1999). Socializing children and parents in families. In Handbook of
marriage and the family (pp. 327-370). Springer US.
Pianta, R. C., & Harbers, K. L. (1996). Observing mother and child behavior in a problem solving
situation at school entry: Relations with academic achievement. Journal of School Psychology,
34, 307–322.
Rudy, D., & Grusec, J. E. (2006). Authoritarian parenting in individualist and collectivist groups:
Associations with maternal emotion and cognition and children's self
esteem. Journal of Family Psychology, 20(1), 68.

Journal of Business and Social Review in Emerging Economies Vol. 6, No 4, December 2020
1468

Journal of Business and Social Review in Emerging Economies Vol. 6, No 4, December 2020
1469
Volume and Issues Obtainable at Center for Sustainability Research and Consultancy
Journal of Business and Social Review in Emerging Economies ISSN: 2519-089X (E): 2519-0326
Volume 6: Issue 4 December 2020
Journal homepage: www.publishing.globalcsrc.org/jbsee
Nigeria’s First Republic and Post 1966 Federalism: A Comparative Study
1Isah Shehu Mohammed, 2Muhammad Fuad bn Othman, 3Nazariah binti Osman
Chief Lecturer, Head of General Studies Department, Federal Polytechnic, Bauchi - Nigeria
[email protected] 2Professor, Assistant Vice Chancellor and Dean, School of International Studies, Universiti Utara,
Malaysia, [email protected] 3Senior Lecturer, Deputy Dean, School of International Studies, Universiti Utara, Malaysia
ARTICLE DETAILS ABSTRACT History: Revised format: November 2020 Available Online: December 2020
Objective: The objective is to make a comparative study of the
Nigeria’s First Republic (1954-1966) and the post 1966 federalism.
The two periods saw Nigeria practicing federalism with different
power sharing and governmental components arrangements. The
study is significant at this time of search for a viable federalism,
incessant agitations for restructuring the Nigerian state, and
increasing threats to her unity and cohesion over the federal
arrangement. Methodology: The study used non-numerical,
secondary and historically documented sources to collect data and
also used the historical method and practical events in Nigeria’s
journey of federalism to analyse the data. Result: In the First
Republic, it was a fiscal federalism with greater regional autonomy
and limited constitutional powers to the Central Government, while
the post 1966 federalism had more and strategic powers
constitutionally allocated to the Central Government. First
Republic federalism was more disciplined in financial and residual
matters and power with greater autonomy and competition between
regions which greatly fostered development and accountability
among them, with less constitutional frictions between the Central
and Regions. Implication: The study fills an existing gap in the
study of Nigeria’s federalism viz-a-viz more calls for restructuring
and or true federalism, number of units and devolution of
constitutional powers, corruption, slow and discouraged
development, which result in over reliance on statutory allocations
from the Centre, and intensifies struggle for resource control,
although it on the other hand controversially guarantees the unity of
the Nigerian state.
© 2020 Center for Sustainability Research and Consultancy
Pakistan under a Creative Commons Attribution-NonCommercial-
ShareAlike 4.0
Keywords: Autonomy, Constitution, Federalism, First Republic, Nigeria, Power
JEL Classification:
M10, M38
Corresponding author’s email address: [email protected]
Recommended citation: Mohammed, I. S., bn Othman, & Binti Osman, N. (2020). Nigeria’s First
Republic and Post 1966 Federalism: A Comparative Study. Journal of Business and Social Review in

Journal of Business and Social Review in Emerging Economies Vol. 6, No 4, December 2020
1470
Emerging Economies, 6(4), 1469-1478
1. Introduction
States and nations have historically been characterized by the search for, evolution, adoption or
adaptation of varying and systems of government relative to their socio-economic, political, geo-
physical and historical peculiarities. For Nigeria as well, the search has also been determined and
influenced by these factors, but gruesomely affected by colonialism (1861-1960). Colonialism not only
affected the search, but made a significant impact on the state, political system and the society in such a
way that departure from it has become near impossible, especially with regards to the burdens of
colonial history (Unegbu 2003:41-48), experience and engravings which Nigeria has been battling with
since her amalgamation - British colonialism and in the post independence era. One of such burdens is
the federal system of government which became imperative to both the colonialist and Nigerian
nationalists on the eve of and after the independence in 1960.
From 1954 to date through the battle and carrying the burdens of the colonial history, Nigeria has since
October 1954 been under the federal system, (except for General Ironsi’s regime, January-July, 1966),
but still battling with choice of the most feasible federal arrangement for its heterogeneous make-up.
With those - colonialism, independence and heterogeneities of the Nigerian nation have altogether been
shaping the post independence era and destiny (Suleiman & Maiangwa, 2017:262). The past 64 years
have been experimental in the practice of federalism, yet not a single mode of its adoption or adaption
has been commonly reached by the stakeholders.
This study explores and compares the two major periods of practicing federalism in Nigeria – the 1954-
1966 (late Colonial period, First Republic, early independence and Republican era), and the post 1966
federalism largely determined and influenced by the Nigerian military in addition to other factors.
1.1 Statement of the Problem
Nigeria federalism is confronted with varying challenges which are more often not based on the
conception and or traditions of the conventional federalists, and which therefore, require contemporary,
situational and unique approaches and actions other than those conventional principles (Othman, Osman
& Mohammed, 2019; Mohammed & Aisha, 2020; Adedeji & Ezeabasili, 2018:167); Adoption or
adaption and operation of feasible federalism, including states creation and revenue allocation have been
the main challenges confronting the growth and development of Nigeria (Ahmed, Falaye, Oloni, &
Okeke, 2017:1; Shagari, 2001; 273 & 276); The failure to address, arrive at compromised and popular
federal structure has led to ‘tragic policy failure’ in Nigeria, while openness, responsibility and
responsiveness among the levels of the Nigerian federalism have remained only elusive and poorest in
performance ranking (Friedman, 2018:165; Anderson, 2012).
With the much bound colonial heritages, Nigerians have failed to forge ahead and resolve disunity,
ethno-regional and religious antagonism and conflicts (Saidu, Rasheed, Zakuan & Yusoff, 2019;
George, Yusuff & Cornelius, 2017; Suleiman & Maiangwa, 2017:273; Fessha, (2017; Mohammed &
Aisha, 2020); British colonial legacies have resulted in transformed religious, ethno-regional and
political identities for the Nigerian state, and the greatest challenge to federalism and nation-building;
Although ethno-federalism was initially regarded as the solution to Nigeria’s heterogeneous
composition, it is still responsible for the ethno-religious sentiments in the later Nigeria, particularly
among the common men (Suleiman & Maiangwa, 2017:269; Ejobowah, 2010); The minority issue is
also key to discussions on Nigerian federalism, but has lingered on and hit the federal structure and
operation since the inception of the Nigerian state system (Usuanlele & Ibhawoh, 2017:2). The
conglomeration of these problems have resulted in calls for restructuring (centred on fiscal federalism)
the country, as well as the attendant manipulation and hijack of the calls by the ethno-religious, regional
elites and politicians, among others.
1.2. Background of the Study The controversial, but un-ignorable statement by Verjee (2017: ix) that ‘anyone who claims to understand
Nigeria is either deluded, or a liar’ has a significant impact. Nigeria, the leading West African and African

Journal of Business and Social Review in Emerging Economies Vol. 6, No 4, December 2020
1471
state is also the largest single black federal democracy in the world. It is strategic in both the regional,
continental and world affairs, especially for its political significance to the regional security, the
Commonwealth, global oil market and economy, and its large population of over 193m people (Idris,
2018; Mohammed & Aisha, 2017; NBS, 2016). Nigeria is the result of the amalgamation of numerous
heterogeneous, geo-political, ethno-religious and political entities by the British colonial masters in
1914. Hence the earlier admission that the name Nigeria ‘is only an English expression of which has
been made to comprehend a number of natives covering about 500,000 square miles of territory of the
world’ (Lugard, 1906:7). All these however, began when Africans (who then had no say) and their lands
were apportioned among the then world imperial powers at the Berlin Conference, 1884-1885
(Usuanlele & Ibhawoh, 2017:1). The composition of the amalgamated Nigeria transcends beyond
ethnicity and religion, but also geography, history, culture, civilization and worldview, among others.
From the first day of its amalgamation, Nigeria has deliberately and otherwise, been engaged in the
search for the popular and feasible means of being together and nationhood amidst the heterogeneities
and colonial bondage. One of such has been the adoption of federalism in the mid 1950’s, which is a
means of resolving conflicts among citizens and levels of government, especially in heterogeneous states
(Amusan, Saka & Omede, 2017:3; Deng, Deng, Deng & Jimenez, 2008). It has therefore not been an
easy journey for Nigeria through the nationhood through the over 106 years of amalgamation. However,
despite the challenges, as maintained, ‘the construction of Nigerian nation, its resilience in the face of
historical and geographical adversity, and its progress following the unexpected traumas of the post-
independence era, are enduring testaments to its people and proof of its promise’ (Levan & Ukata,
2018:1). Furthermore, the British policy of indirect rule required homogeneity and establishment of
tribal hierarchies and those resulted in the post-colonial bond and reconfiguration of ethno-religious and
geo-political problems in the former colonies. This necessitates the continuous battle with the challenges
of unity and cohesion among the former colonies, especially Nigeria (Usuanlele & Ibhawoh, 2017:2).
Many instances influenced the choice of federalism for Nigeria, including the colonialists themselves
and the 1953/54 London/Lagos Constitutional Conference which agreed to among others to institute
fiscal arrangements in a new constitution and a federal system of government for Nigeria (Shehu &
Buba, 2016:89-90). Similarly, Sir Tafawa Balewa (Tafawa Balewa, 1962:2) had in that respect
maintained that:
I am pleased to see that we have all agreed that the federal system is, under the present
conditions, the only basis on which the Nigeria can remain united. We must recognize
our diversity and the peculiar conditions under which the different communalities live in
this country. To us in Nigeria therefore unity in diversity is a source of great strength, and
we must do all in our power to see that this federal system of government is maintained
and strengthened.
Although from the late 1940s and early 1950s, political organisations and parties were formed mainly
based on ethno-regional lines which greatly influenced and shaped the political atmosphere of the
Nigerian state, the ‘tenuous consensus’ was reached by both colonial masters and the then Nigerian
politicians/regional leaders that federalism would be the best for Nigeria, especially with respect to its
heterogeneous character (Usuanlele & Ibhawoh, 2017:5).
Similarly, the 1994/95 Abacha Constitutional Conference Committee in its final Report observed and
recommended that Nigeria should adopt a federal system with central government having substantial
distribution of powers and autonomy with coordinate functions/powers in order to maintain unity and
autonomy among the Nigerian communities, and also beneficial to the heterogeneity of Nigeria and
sustain its unity in diversity; ensure participation in governance; minimize fears of domination; and
foster development. The Conference also recommended operation of federalism with clear demarcation
of the powers, equitable distribution of economic and political powers between the centre and the other
units, strong and independent Judiciary, and economically viable components units that would not be so
much dependent on the Centre and central resources (Dinneya, 2006; THISDAY, 1998. November 17,
pp. IXLIV).

Journal of Business and Social Review in Emerging Economies Vol. 6, No 4, December 2020
1472
On the other hand, the history and practice of federalism in Nigeria has been both dominated and hit by
the Nigerian military. Despite the political scientists submission, especially from the Western world, that
military rule is incompatible to federalism because of the absence of popular participation in
governance, non-democratic character and unbinding and less accountability to the electorate. However,
all the Nigerian military regimes, but one (Ironsi) have adopted federalism and sought to improve its
practice at varying levels and degrees (Elaigwu, 2017:11-12). This means the Nigerian military have
despite their authoritarian character, been able to work with federalism at varying degrees.
1.3 Conceptualisation and Review
Despite the existence and usage of theories on federalism (Mohammed & Aisha, 2020), it has no any
universally accepted and full pledged theory and no state has been able to practically adopt all the
principles of federalism in its traditions (Mohammed & Aisha, 2020; Elaigwu, 2017:7; Burgress,
2006:1). Thus for Ayoade in Elaigwu & Akindele (1996:40), ‘Federalism is dialectical. It is necessitated
by the emotions of love and hate. The success of federal experiment is a function of equilibrium between
both feelings’. However, Wheare (1963) identifies the basis of federalism as the existence of a written
constitution, constitutional division of powers, and autonomy of the respective units in exercise of
powers and functions. In reality, Nigerian federalism and its inherent characters have raised and
encouraged springing and proliferation of ethno-religious militia groups that threaten the sustenance and
prosperity of both the federal arrangement and the state system (Babawale, 2001). Similarly, the desire
and clamour for fiscal federalism has in addition to corruption and elite manipulation, been also a
generator and determinant of resource control conflict, heated debates, and eruption of violent struggles,
especially in the oil producing areas of Nigeria (Aka, 2017; Charles, 2013; Salami, 2011; Arowola,
2011).
For Nigeria, fear of domination has since the inception of the federalism and later the creation of 12
states in 1967, generated fear, mistrust and suspicion among the majority groups on one hand, and on the
other, the Niger-Delta region composed of numerous and ethnic groups in a complex environmental set-
up stricken by fear of domination of one another and resource conflict (Othman, Osman & Mohammed,
2019; Mohammed, Othman & Osman, 2019). So also to the Middle-Belt/Central Nigerian minorities on
the Northern part and those have been a thorn to the Nigerian federalism (Levan, 2018). For Elaigwu &
Erim (1996:1), there are 5 contrasting perspectives on Nigerian federalism as: the federalism was
imposed on Nigeria by the British, it was British policy of divide and rule, that federalism or
confederalism is invariable to Nigeria’s heterogeneous composition, federalism is a compromise among
Nigerians, and a mixture of centrifugal and centripetal factors. The military has similarly been dominant
in the Nigerian federalism ever since the January 1966 coup and hand hence, played the most significant
role in shaping the federalism through Decrees, Edicts, States and Local Government creations, and
revenue allocation among others. Thus resulting to and entrenching what Elaigwu (2017) terms as
Military Federalism.
1.4 Perils of Nigerian Federalism
The peculiar perils of Nigerian federalism have from pre-independence to date characterized and
complicated it with several instances, occurrences and recurrences – oil rent dependent economy,
difficult colonial burden of history and heritages, ethno-regional politics, recurrence of violence, rise of
ethnic militias and separatist tendencies, and elites’ competition and manipulation of state power and
resources (Levan, 2013; Mohammed, et al, 2019). Added to that, Nigeria is a resource rent dependent
federation with over dependence on oil which is explored from the Niger-Delta – an area already heated
with minorities’ suspicion, fear and resentment of the majority apart from resource conflict (Amusan, et.
al., 2017:3). Although substantial revenue has been realized over the years since the discovery and
exploration of oil in Nigeria, not much in commensurate with the generated revenue has been achieved
in terms infrastructural, and socio-economic development. Instead, only few and privileged elites have
access to the oil resources and what accrues from it thereby resulting in violence, pervasive corruption
and negligence and near crash of the non-oil sectors, and mortgaging the oil resources and revenue at the
expense of stability, development and prosperity of Nigeria (Mohammed, Saidu & Aisha, 2018;
Amusan, et. al, 2017:18).

Journal of Business and Social Review in Emerging Economies Vol. 6, No 4, December 2020
1473
The search for a popular federalism in Nigeria is greatly influenced by the desire of the resource-rich
areas, communities and regions that largely depend resource rent in order to control such resources
endowed in their areas, especially oil (Othman, et al., 2019; Amusan, et. al., 2017:4). Thus federalism
and oil resource constitute a volatile mix, as there often arise tensions (vertical and horizontal) over the
distribution and management of rents accruable to the state from crude oil (Anderson, 2012). This is in
company of the fears of the minority groups under the Nigerian state and federalism as the Willink
Commission (1958) outlined and included the domination of government by the ethno-regional
majorities; social fears and grievances; economic discrimination; discrimination in public recruitments,
posts, and services; changes in regional legal systems; maintaining public order and the individual
citizens’ freedom; religious intolerance; and native authorities and traditional rulers (Usuanlele &
Ibhawoh, 2017:2; Elaigwu, 2017:46). These are in addition to two other critical perils to Nigerian
federalism – imbalanced political structure between the Northern and Southern regions which results in
mutual fear, suspicion, rivalry and ethno-regional nationalism; and the fear between the major ethnic
groups on one hand and the minority groups fears of the majority (Hausa/Fulani, Igbo and Yoruba) on
the other (Elaigwu, 2017:46).
One of the central fears of domination lies in the North’s dominance in terms of population,
geographical size, endowed material resources (apart from oil), and its pre-colonial historio-religious
civilisation and political background, and prominence over the Southern region during colonialism,
despite being (the North) late in colonization and considered educationally backward (Mohammed,
2018; Othman, et al., 2019). Suffice to say that for over two millennia, Northern region of Nigeria has
been politically, commercially, and intellectually on the outer peripheries of the Mediterranean and the
Middle-East. There were routes through the Sahara which linked the Coptic speaking Egypt, Phoenician
Carthage, and the Roman Empire to peoples around Lake Chad and on the Great Plains to the West and
the East of the Lake. While the then shores of the Sokoto Caliphate extended to as far and wide as Dori
and Liptako in Burkina with commercial, religious and diplomatic relations (Last in Levan & Utaka,
2018:19 & 22).
The other perils of federalism in Nigeria revolve around over dependence on oil resource as a means of
revenue, dominance of the central government with lion’s share from the allocation of the revenue
accruing to the federation, incessant disagreements and conflicts over revenue allocation, and poor fiscal
relations among the units, North-South fear of hegemony, and failure to adhere to the established
constitutional provisions in the practice of the federalism (Mohammed, et. al., 2018; Ewetan,
2012:1084). As a result of the above, the various Nigerian regimes have used granting autonomy to the 3
later 4 regions of Nigeria, more States and Local Governments, re-distribution and review of revenue
allocation formula, bi-cameralism, among others, in order to absorb the shocks of the federalism (Levan,
2018; Friedman, 2018:165).
3. Comparative Structure – 1954-1966 and Post 1967 Federalism
The operation of Nigerian federalism can be practically divided into phases of the pre and First Republic
(1954-66); and post 1966 which also extends to the present (2020), and including the military eras.
Although the First Republic federalism under this study also covered the last part of pre-independence
(1954-60), the January 1966 coup had disrupted not only the federal system, but also the proscribed
democratic First Republic itself. For the post 1966 federalism, it was largely an imposition of the
military regimes of Generals Gowon, Murtala/Obasanjo, Buhari, Babangida, Abacha and Abdussalam,
except for the civilian Shehu Shagari’s Second Republic (1979-1983). The Shagari’s Second
Republic/regime itself inherited all its structures of federalism from the ousted military regime of
Generals Murtala/Obasanjo who successfully built on what General Gowon’s military regime had earlier
established – a federalism with strong Centre and weak 12 States each with their Provinces and later 19
States and 301 Local Government Areas (Mohammed & Aisha, 2020; Mohammed, et al., 2018).
4. 1954-1966 Constitution of the Federation/Federal Republic of Nigeria
The 1954-66 federalism was the result of the various constitutional conferences, in Lagos, London,
Ibadan, compromises and colonial influences driven by the desire for independence, regional political,
economic, geo-ethnic security and autonomy, but the military was not part of the negotiations. Under the

Journal of Business and Social Review in Emerging Economies Vol. 6, No 4, December 2020
1474
1954-66 federalism/constitutional power sharing in Nigeria, there were three Lists - Exclusive, Co-
current and Residual Lists for the Federal/Central Government only, the 3 (later 4) Regions and the
Federal Government together, and the for the Regions only and respectively. There were altogether 44
items under the Exclusive List as: Aviation, Currency, Extradition, Accounts of the Federation, Defence,
Customs and Excise, among others. There was also the Con-current List with 28 items which included:
Arms and Ammunitions, Registration of Business names, among others. The Residual List for the
Regions (each) comprised of any matter not included in the 44 and 28 Exclusive and or the Con-current
legislative Lists. The constitutional arrangement of power-sharing was with weak Central Government
with limited exclusive powers and Strong Regions with enormous Residual powers. Therefore, Nigeria
was a federation with Federal/Central Government and 4 Regions among whom the constitutional
powers were allocated and devolved.
The 1954-66 federalism was operated with Parliamentary Democracy with offices of Prime Minister and
Ceremonial President; a non-Republican Constitution, until October, 1963; three and later four Regions
– West, East, and North, and later the Mid-West; Premiers and Ceremonial Governors for each Region;
constitutional power-sharing which granted greater autonomy to the Regions; division of constitutional
powers/legislative lists into the Exclusive (Federal or Central Government only), Con-current (Federal
and Regional Governments together), Residual (Regions only). It was also federalism operated with
Collective Responsibility, Fusion of Powers, Dissolution of the Parliament, no cross-carpeting for the
legislators; each Region had a Premier and an Executive Council, a Ceremonial Governor and Bi-
cameral Regional Legislature (Houses of Chiefs and Assembly) comprising of nominated and elected
members respectively; the tenure for the Executive and Legislators was 5 years at both the Central and
Regional levels (all tenures were renewable after every 5 years, but without limit).
The federal Prime Minister, Regional Premiers, and the parliamentarians could be removed from office
through Vote of No Confidence and or Dissolution of the Parliament; there was no Separation of Powers
between the Executive and the Parliament at the Central and Regional levels; the 1959 and 1964 Central
Governments were both formed through Coalition and or Alliance between the Northern Peoples
Congress (NPC) and the National Council of Nigerian Citizens NCNC in the famous 1959-1964
NPC/NCNC Coalition; and the Northern Peoples Congress NPC and Nigeria National Democratic Party
(NNDP) Alliance of 1964 popularly known as the Nigeria National Alliance (NNA) respectively
(Mohammed, Aisha & Saidu, 2018:59, 66, 68). The military had no role/influence in making/enacting
the Constitution/federal system between 1954 and 1966, but strictly colonial and indigenous politicians’
makings. Similarly, the 1954-1966 federal arrangement gave both the Central and Regional
Governments the autonomous powers to each, have Central and Regional Constitutions, Coat of Arms,
Police, substantial of their respective control resources, revenue generation and expenditure
(Mohammed & Aisha, 2020).
The federal powers were exercised together by the federal Prime Minister as the Executive Head of the
Government, the Governor-General (later) Ceremonial President as the Head of State and Commander
in Chief of the Nigerian Armed Forces, and the Federal Parliament which comprised of bi-cameral
legislature from December 1959 with 312 (later 320) Representatives and 44 Senators.
5. The Post 1966 Federalism
For the post 1966 federalism, it was wholly a making and an imposition by the Nigeria Military resulting
from the circumstances and events of the January and July 1966 coups, the abrogation of the former
Federal System and Constitution, imposition of a Unitary Government, the assassination of General
Ironsi and the Nigerian Civil-War. Thus there were Decrees No. 24 of May 1999, No. 14 of 1988, No. 3
of 1994, etc. It was military and centralist federalism (Elaigwu, 2017), with dominance of the Nigerian
Military in both the political process and activities, and governance. Instead of the former 4 Regions
(North, East, West and the Mid-West), 12 States and Provinces, 19 States and 301 Local Government
Areas (LGAs), 21, 30 and 36 States with 768 LGA and 6 Area Councils (AC); three tier federalism with
Federal/Central, States and Local Governments as units/levels of the Nigerian federation (Section 3 [1-
4], 7[1-6], First Schedule [Part I], & II of the 1999 Constitution of the Federal Republic of Nigeria). It
has been a Presidential System of Government with tenure of 4 years and renewable once (Section

Journal of Business and Social Review in Emerging Economies Vol. 6, No 4, December 2020
1475
130[1] of the Constitution of the Federal Republic of Nigeria, 1999); the President is the Head of State,
Government and Commander in Chief of the Armed Forces of the Federal Republic of Nigeria and can
be removed from office through Impeachment (Section 130[2], 135, 143 of the Constitution of the
Federal Republic of Nigeria, 1999).
Although it is a general position in the post 1966 federalism that with allocation of most and strategic
powers (Exclusive) to the Central Government, the States are rendered weak and then dependent on the
Centre for funds allocations, strategic legislations, among others, stability of income from the statutory
allocations to the states has empowered the States in such ways that they exercise substantial influence
and control over national resources and revenue distribution (Levan, 2018; Section 162 (3 & 4) of the
Constitution of the Federal Republic of Nigeria, 1999).
The 1999 Constitution of Nigeria comprises of 68 items under the Exclusive List for the Federal/Central
Government as well as any other matters that incidental and or supplementary to those in this List on
which the National Assembly has jurisdiction to make laws on; 30 items under the Con-current List and
the Residual List (matters not covered in the Exclusive and Con-current Lists) for the States (Second
Schedule [Section 4], Part II; Fourth Schedule [Section 7] of the Constitution of the Federal Republic of
Nigeria, 1999). Similarly, in the provisions of the 1999 Constitution of Nigeria, there exists a
hierarchical order of levels and relations among the Central, States and the Local Governments which
then confers enormous constitutional (Exclusive) powers on the Central Government over the States and
Local Governments (Adedeji, 2017). There are currently 768 LGA; and 6 Area Councils for the Federal
Capital Territory, Abuja (Section 3 [1-7] & First Schedule [I & II] of the Constitution of Nigeria, 1999).
The post 1966 federalism has been wholly Republican (including such acclamations by the Military),
bearing the name of the Federal Republic of Nigeria during both the Military and civilian democratic
regimes. For the civilian democratic regimes (Presidents Shagari, Obasanjo, Yar’Adua, Goodluck, and
currently Muhammadu Buhari), the federalism operates with the principles of Separation of Powers,
Independence of the Judiciary, Checks and Balance and a more centralist tendency in constitutional
allocation of powers, among others. Similarly, that federal system has federal powers exercised by the
offices of the President (Head of State and Government/Chief Executive Officer, and Commander in
Chief of the Nigerian Armed Forces), and the National Assembly. The post 1966 National Assembly
comprised of 1979-1983 – 96 Senators and 450 Representatives (Shagari, 2001:249); 1989-1993 – 91
Senators and 589 Representatives; from 1999 to date, 109 Senators and 360 Members for the Federal
House of Representatives (Sections 49 & 77[1] of Constitution of the Federal Republic of Nigeria,
1999).
By comparison, the Legislative items under the Con-current Powers in the 1954-66 Federalism and
Constitution, but moved to Exclusive Powers in the post 1966 federalism include: Arms and
Ammunitions, Bankruptcy and Insolvency, Drugs and Poison, Finger Prints, National Parks, Prisons,
among others (Second Schedule [Part II, 1999 Constitution of the Federal Republic of Nigeria]). While
the pre 1966 federalism and Constitution allocated those to the Con-current Lists/powers which
conferred enormous powers on the three and later four Regions in addition to the bulk of Residual
Powers not covered by the Exclusive and Con-current Lists. By implication, in the 1954-66 Nigerian
federalism, there were 44 and 28 items for the Exclusive and Con-current powers, and for the post 1966,
especially the current 1999 Constitution, 68 and 30 items are respectively under the Exclusive and Con-
current lists, while all the others are reserved for the Residual List. Furthermore, the 68 items covered all
the strategic and grey areas of Mines and Minerals, Revenue, Military, External Affairs, Security,
Defence, International Relations, Arms and Ammunitions, Census, Internal Affairs (Prisons,
Immigration, Customs, and Police), Labour and Trade Unions and Minimum Wages, among others.
6. The Way Forward
Although Nigeria has been practicing federalism for over 66 years, it is yet to arrive at any nationally
agreed arrangement of the federal structure. It is imperative that Nigerians must first understand that
different countries practice federal system based on their peculiar differences and as such make unique
arrangements for the practice of same. Issues of transparency and good governance are key to achieving

Journal of Business and Social Review in Emerging Economies Vol. 6, No 4, December 2020
1476
success in the practice of whatever federal arrangement arrived at. It would certainly not be much easy
to return to the First Republic federal structure, but its certain elements are still relevant and can be used
to arrive at a popular structure for the present. While differences have to be accommodated in the federal
set up, insignificant differences should be de-emphasised so as to give way forward. The tendency of the
Central Government taking up much of the strategic powers should also re-directed so that the
component parts may also have significant power exercise in the system. States should also enjoy further
autonomy in control of their resources so as to reduce the extents of corruption and over dependence on
the allocation from the Centre. The Central Government should largely concentrate on powers that have
to do with ensuring and consolidating the unity of Nigerian state such as Census, Citizenship, and
Passport among others, thereby leaving other powers to the components for better management and
services delivery.
7. Summary and Conclusion
There is no doubt on the position of politicians, scholars and other stakeholders that the only system that
could hold Nigeria as one and united entity at the moment is federalism. The choice of the federalism
and its character, however, largely depend on a common stand reached by Nigerians. Two major federal
arrangements were each tested and each has its both sides of strength and weaknesses. The First
Republic and post 1966 federalism are on the opposite sides in terms of power (Weak Centre and Strong
Regions; Strong Centre and Weak States), Resource Control and Allocation. On the aspects of other
auxiliary parts of federalism, the two have also been on opposite sides – Parliamentary Democracy,
among others. However, there is a greater peril of failing to comply with the principles establishing the
federalism more in the post 1966 than the First Republic federalism, although such are at varying
degrees dependent upon circumstances and geo-political and economic settings as well as the leadership
commitment.
As far as revenue generation and allocation is concerned, the First Republic Regions were more viable
and accountable in generation and management of their resources than the post 1966 federalism
characterized by over dependence on the Centre, slow development, incessant resource conflict and
corruption. For the post 1966 units of federalism, and especially the States and Local Governments,
there is little or no difference in terms of quality service delivery to the people between the resource rich
States and Local Governments on one hand, and the other considered to be poor or not oil producing
States.
Nigerians have the choice of the federal arrangement to make. However, what determines the success or
failure largely depends on compliance with the established principles guiding the operation of the
federalism in relation to constitutional provisions. At any rate, those virtues of federalism – tolerance,
accommodation, compromises, and heterogeneity must be wholly embraced and upheld for Nigeria to
move on as one united entity.
References
Adedeji, A. O (2017). Federal solution and Nigeria’s democracy. Journal of Social Science and Public
Policy. 7(1).
Adedeji, A. O., & Ezeabasili, I. E. (2018). Restructuring and clamour for true federalism in Nigeria: A
comparative analysis. Advances in Social Sciences Research Journal, 5(2), 160-168.
Ahmed, A. V., Falaye, A. J., Oloni, F. E., & Okeke, J. (2017). Fiscal federalism and economic growth in
Nigeria. Nigerian Journal of Banking, Finance and Entrepreneurship Management, 3(2). 1-
20.
Aka, P. C. (2017). Why Nigeria needs restructuring now and how it can peacefully do it. Denv. Journal
of International Law & Policy, 46, 123.
Amusan, L., Saka, L., & Omede, A. J. (2017). Sovereign wealth fund and fiscal federalism in Nigeria
(2011–14): An assessment of contending issues. Regional & Federal Studies, 27(4), 441-
463.
Anderson, G. (ed.) (2012), Oil and gas in federal countries. Ontario: Oxford University Press.
Arowolo, D. (2011). Fiscal federalism in Nigeria: theory and dimensions. Afro Asian Journal of
Social Sciences, 2(2), 1–21.
Babawale, T. (2001). The rise of ethnic militias, de-legitimisation of the state, and the threat to Nigerian
federalism. West Africa Review, 3(1).
Journal of Business and Social Review in Emerging Economies Vol. 6, No 4, December 2020
1477
Burgess, M. (2006). Comparative federalism: Theory and practice. London: Routledge.
Charles, N. (2013). Fiscal federalism in Nigeria: Addressing issues of resource control. International
Journal of Advances in Management and Economics, IJAME, 2(6).
Constitution of the Federal Republic of Nigeria, 1999. Lagos: Government Printer.
Deng, F. M., Deng, D. J. Deng, D. K., & Jimenez, V. (2008). Identity, diversity, and constitutionalism in Africa. Washington, DC: United States Institute of Peace.
Dinneya, G. (2006). Political economy of democratisation in Nigeria. Lagos: Concept Publications
Ejobowah, B. J. (2010), Territorial pluralism: assessing the ethno-federal variant in Nigeria. Regional
and Federal Studies, 20(2), 251–274.
Elaigwu, J. I. & Akindele, R. A. (eds). (1996). Foundations of Nigerian federalism: 1960- 1995. Abuja:
National Council on Inter Governmental Relations.
Elaigwu, J. I. (2017). The politics of federalism in Nigeria. London: Adonis & Abbey Publishers.
Ewetan O.O (2012). Fiscal federalism in Nigeria: Theory and practice. International Journal of
Development and Sustainability. 1(3).
Fessha, Y. T. (2017). The original sin of Ethiopian federalism. Ethnopolitics, 16(3), 232-245.
Friedman, A. B. (2018). States, Countries, and Peoples: A comparative look at bicameralism in African
federal States. Fletcher F. World Affairs. 42(2), 165.
George, O., Yusuff, K. M., & Cornelius, N. (2017). The good, the bad, and the ugly in the melting pot:
The challenges of Nigerianising diversity management. Equality, Diversity and Inclusion:
An International Journal, 36(3), 238-254.
Idris, N. M. (2018). Some comparisons between the Nigerian and South African fiscal regimes regarding
an individual’s tax residence. Obiter, 39(1), 76-84.
Levan, A. C. (2017). Reciprocal retaliation and local linkage: Federalism as an instrument of opposition
organizing in Nigeria. African Affairs, 117(466), 1-20.
LeVan, A. C., & Ukata, P. (eds.). (2018). The Oxford Handbook of Nigerian Politics. Oxford: Oxford
University Press.
Lugard, F. L. S. (1906). A tropical dependency: An outline of the ancient history of Western Sudan with
an account of the modern settlement of Northern Nigeria. New York: Barnes and Nobles.
Mohammed, I. S., Othman, M. F. B. and Osman, N. B. (2019). Uncovering the systematic genocide
against the Hausa-Fulani and Muslims groups in Nigeria. Journal of Business and Social
Review in Emerging Economies, 5 (2), 247-262. https://10.26710/jbsee.v5i2.826
Mohammed, I. S. & Aisha, A. A. (2020). Federalism: An overview of the Nigerian perspective. Beau
Bassin, Mauritius: Lambert Academic Publishing.
Mohammed, I. S. & Aisha, A. A. (2017). Introduction to Nigeria’s foreign policy and international
relations. Saarbrücken, Deutschland: Lambert Academic Publishing.
Mohammed, I. S. (2018). Integrated profile of northern Nigeria. Beau Bassin, Mauritus: Lambert
Academic Publishing.
Mohammed, I. S., Aisha, A. A., & Saidu, A. (2018). Nigerian political development. Beau Bassin,
Mauritius: Lambert Academic Publishing.
Last, M. (2018). From Borno to Sokoto: Meaning and Muslim identities in Northern Nigeria. In A. C.
Levan & P. Utaka (eds.). A tropical dependency: An outline of the ancient history of Western
Sudan with an account of the modern settlement of Northern Nigeria (pps. 19-32). New
York: Barnes and Nobles.
National Bureau of Statistics (NBS). (2016). Social statistics report 2016. Abuja, Nigeria: National
Bureau of Statistics (NBS).
Onyishi, A. O., & Iwundu, I. E. (2017). Fiscal federalism and local government revenue
base. International Journal of Communication, 12(1), 78-103.
Othman, M. F. B., Osman, N. B. & Mohammed, I. S., (2019). Restructuring Nigeria: the dilemma and
critical issues. Journal of Business and Social Review in Emerging Economies, 5(1), 79-98.
https://doi/10.26710/jbsee.v5i1.567
Salami, A. (2011), Taxation, revenue allocation and fiscal federalism in Nigeria: issues, challenges and
policy options. Economic Annals, LVI (189), 27–50.
Saidu, B., Rasheed, Z. H., Zakuan, U. A. B. A. and Yussoff, K. Z. B. H. (2019). Restructuring and the
dilemma of state police in Nigeria: to be or not to be? Journal of Business and Social Review

Journal of Business and Social Review in Emerging Economies Vol. 6, No 4, December 2020
1478
in Emerging Economies. 5(1), 41-50. https://doi/10.26710/jbsee.v5i1.554
Shagari, S. (2001). Shehu Shagari: Beckoned to serve, an autobiography. Ibadan: Heinemann
Educational Books.
Shehu, I. M. & Buba, A. (2016). Basics of Nigerian citizenship and Government education.
Saarbrücken, Deutschland: Lambert Academic Publishing.
Shehu, I. M., Othman, M. F. B., Osman, N., B., (2017). Ethno-religious and regional rivalry in Nigeria:
An old and creeping trend. Asian Journal of Multidisciplinary Studies, 5(5), 14-23.
Suleiman, M. D., & Maiangwa, B. (2017). Nigeria and the ‘making’ of combative identities. African
Identities, 15(3), 260-277.
Tafawa Balewa, A. (1962). Mr. Prime Minister. Lagos: Government Printer.
THISDAY. 1998. November 17. Vol. 4, No. 1305. (pps. I-IXLIV);
Unegbu, O. C. (2003). Nigeria: bellwether of African democracy. World Policy Journal, 20(1), 41-47.
Usuanlele, U., & Ibhawoh, B. (Eds.). (2017). Minority Rights and the National Question in Nigeria.
Springer.
Verjee, A. (2017). Nigeria: a new history of a turbulent century. International Affairs, 93(5), 1278-1279.
Wheare, K.C (1963). Federal Government. London: Oxford University press.

Journal of Business and Social Review in Emerging Economies Vol. 6, No 4, December 2020
1479
Volume and Issues Obtainable at Center for Sustainability Research and Consultancy
Journal of Business and Social Review in Emerging Economies ISSN: 2519-089X (E): 2519-0326
Volume 6: No. 4, December 2020
Journal homepage: www.publishing.globalcsrc.org/jbsee
The Impact of Economic Growth, Foreign Direct Investment, Urbanization, Fossils
Fuel Consumption on Environmental Degradation in Emerging Asian Economies
1Muhammad Waqas Ashraf, 2 Hafeez ur Rehman, Imran Sharif Chaudhry 1PhD Scholar, Department of Economics, University of Management and Technology Lahore, Pakistan,
[email protected] 2Chairman, Department of Economics, University of Management and Technology Lahore-Pakistan,
[email protected] 3Director, School of Economics, Bahauddin Zakariya University Multan, Pakistan, [email protected]
ARTICLE DETAILS ABSTRACT History Revised format: November 2020 Available Online: December 2020
The current examination ascertains the impact of foreign direct
investment, urbanization, economic growth, fossil fuel
consumption on carbon emissions in eleven rising Asian
economies. Panel data has been scrutinized from 1990 to 2018,
and (ARDL)/PMG model is executed. The outcomes of the
model exemplify that in these growing Asian economies, the
triumph to cultivate economic growth, foreign direct investment,
urbanization and fossil fuels are bestowing CO2 emissions and
deteriorating the environmental circumstances at the regional
level. Moreover, the conclusions emphasis that foreign direct
investment is a source of environmental humiliation and
increases carbon emissions at the regional level. Furthermore,
outcomes of the investigate also confirms the existence of (EKC)
in these eleven emerging Asian economies. The study also
suggest that by lessening the consumption of fossil fuel energy
and encouragement of an environmental responsive economic
growth policy will be suitable for the affluence in these emerging
developing Asian economies and also the rest of world..
© 2020 Center for Sustainability Research and Consultancy Pakistan
under a Creative Commons Attribution-NonCommercial-ShareAlike
4.0
Keywords Environmental Kuznut Curve
(EKC), Carbon dioxide
emissions, Fossil fuel,
Urbanization, Environmental
Degradation
JEL Classification
M2, M21
Corresponding author’s email address: [email protected]
Recommended citation: Ashraf, M. W., Rehman, H. & Chaudhry, I. S. (2020). The Impact of
Economic Growth, Foreign Direct Investment, Urbanization, Fossils Fuel Consumption on
Environmental Degradation in Emerging Asian Economies. Journal of Business and Social Review in
Emerging Economies, 6(4), 1479-1495
1. Introduction
Among other challenges, most important tasks in the world is environmental degradation. Basically with
the passage of time, increase in economic activities and economic growth leads to generate economic
degradation (Perman et al., 2003). There are so many factors, which are responsible for environmental
degradation and creates pollution by carbon dioxide emissions (Jacobson, 2008). Economic activity is
the key factor of environmental disrepair. In other words, swift economic development and additional
production in these emerging economies have to bear the overheads of environmental degradation
(Shehbaz et al., 2016). Economic growth intended to change the global climate, predominantly through

Journal of Business and Social Review in Emerging Economies Vol. 6, No 4, December 2020
1480
use of fossil fuel (non-renewable) resources. Eeconomic activity was one of the key factors for the
increase in global warming in the middle of the 20th century in these Asian economies (IPCC 2018).
The consumption of energy was low in Asian economies in 1960,s but the economic reforms and
sprawling of urban population in late 1970,s and in 1980,s enhance the use of energy in this
region.These factors increase the environmental degradation in this region and the rest of the world
(Guttikunda et al, 2003). With augmented carbon emissions from the households, the threat of toxicities
such as pneumonia and other breathing deseases increased (Hanif 2018b). In addition, the volume of
ejection comprises anthropogenic factors (for example urbanisation, FDI, population size and per capita
GDP). Amplified carbon dioxide evacuation donates to a variety of diseases, including cardiovascular
and respiratory complaints (WHO 2016). Social and economic actions are esteemed, which decline the
stability of heat and energy exchanges over the Globe.
The mesosphere of the universe has changed environment, which is often categorized as "global
warming." Humanistic activities have contributed to intensified atmospheric carbon dioxide ( CO2),
predominantly by the energy usage specially for production targets (Maranga et al. 2010). There have
not been reliable and consistent outcomes from earlier studies on environmental degradation,
urbanization and carbon emissions at regional level. Thus, further work is required. The outcomes of a
region or a sole country can not be revealed globally because of multifaceted geographical and socio-
economic circumstances. Here, we will investigate the effect of economic growth, urbanization, FDI,
fossil fuel consumption on carbon emissions/emanations in Asian emerging countries. Sprinkling
literature on carbon emissions and environmental degradation in different regions has dazed the effect
of economic growth, including Apergis and Ozturk (2015), Wang et al. ( 2016), Nasreen et al. ( 2017).
Empirical evidence is uncertain, especially as regard of successful policy suggestions in the emerging
economies of Asia. So present study has a remarkable association between the urbanization, fossil fuel
energy, GDP and CO2 emanations/emissions.
0.0E+00
2.0E+09
4.0E+09
6.0E+09
8.0E+09
1.0E+10
1.2E+10
0.0E+00
2.0E+12
4.0E+12
6.0E+12
8.0E+12
1.0E+13
1.2E+13
Bangladesh
China
Indonesia
India
Malays
ia
Nepal
Pakista
n
Philippines
Sri Lanka
Thailand
Turkey
CO2 GDP
The economic growth trend in emerging but less developed countries in 2018 shows that nonlinear
trend. The china has the largest share of GDP which was 10797222227694.5. The second highest GDP
was 68358370 in India. The third one followed by Indonesia which was 1146844815417. The graphical
explanation also shows that in 2018 the emission of CO2 of these Countries, the highest carbon dioxide
emitter was Malaysia (254368367.421025 million ton), on second level China (9928444878.45 million
ton) and lowest level is Nepal (9178807.276219 million ton) on third level, respectively. These data
showed that in 2018 China the top economic growth with highest carbon dioxide emitter.

Journal of Business and Social Review in Emerging Economies Vol. 6, No 4, December 2020
1481
0.0E+00
2.0E+09
4.0E+09
6.0E+09
8.0E+09
1.0E+10
1.2E+10
0.0E+00
4.0E+10
8.0E+10
1.2E+11
1.6E+11
2.0E+11
2.4E+11
Bangladesh
China
Indonesia
India
Malays
ia
Nepal
Pakista
n
Philippines
Sri Lanka
Thailand
Turkey
CO2 FDI
The FDI trend in emerging but less developed countries in 2018 shows that nonlinear trend. The China
has the largest share of FDI which was 235365050036.341. The second highest FDI was
42117450737.2644 in India. The third one followed by Indonesia which was 18909826043.5105.
0.0E+00
2.0E+09
4.0E+09
6.0E+09
8.0E+09
1.0E+10
1.2E+10
0
200,000,000
400,000,000
600,000,000
800,000,000
1,000,000,000
BangladeshChina
IndonesiaIndia
Malaysia
Nepal
Pakista
n
Philippines
Sri Lanka
Thailand
Turkey
CO2 UP
The Urban population trend in emerging but less developed countries in 2018 shows that nonlinear
trend. The china has the largest share of Urban population which was 823827650. The second highest
Urban population was 460295677 in India. The third one follow ed by Indonesia which was 148084795.
Our data sample contains of eleven emerging countries from Asia. All of these economies are from the
top twenty FDI hosting economies from last twenty years. These emerging countries encompass their
reserve by remittance and foreign direct investment. These countries are more liberal in trade openness
and due to trade openness multinational companies transfer their production infrastructure and
technologies. The level of trade openness and other globalization process these countries are still in
primary stage of development but their pace are very speedy. In 2008 financial crises these economies
had speedy adjustment process due to strong financial institution. Due to above mentioned reasons these
selected countries are emerging economies in Asia.
The outcomes were estimated with the help of panel data collected from 11 emerging Asian economies
from 1990 to 2018. Section 2 provides data and methodology, Section 3 presents estimates and results,
Section 4 interprets results, Section 5 concludes, and highlights the main policy consequences of the
research.
Journal of Business and Social Review in Emerging Economies Vol. 6, No 4, December 2020
1482
2. Literature Review
Assessing the impact of Urbanization, fossil fuels energy consumption, economic growth, FDI, on
environmental dilapidation is one of the immensely vital areas of research. In this concern, several
efforts have been made by conducting empirical studies by paneling the different income / regional
groups and using time series data of different countries. The empirical validation of (EKC) hypothesis is
also confirmed in quantity of studies by using panel data and time series of different countries / regions.
Some studies which have discussed these features of environmental research are discussed below:
Acaravci (2010) explored the relation amongst CO2 emanations, energy ingesting and economic growth
in nineteen European economies between 1960 and 2005. The researchers found that the variables were
definitely interlinked. In adding , the study demonstrated the analysis of the inverted U-shaped EKC,
particularly in Italy and Denmark.
The Error Correction Model ( ECM) was implemented and this study found that there is a two-
directional connection amongst the variables. Attari and Ataria (2011) evaluate the affiliation amongst
Energy ingesting and economic growth among 1971 and 2008 through a regional analysis of Pakistan,
India and China. Globally, the CO2 emissions rate is 51.35%, but Pakistan has the lowest rate of 85.85%
compared to India and China which was88.18% and 87.53% respectively. Pakistan has high population
growth rate, low per capita GDP but low CO2 emissions compared to China and India. Sharma (2011)
observed the commitment to CO2 emissions in sixty nine economies by using panel data. To examine
those determining CO2 emissions, 69 countries were divided into three subcategories in high , medium
and low-income economies. The study originate that urban population has a negative influence on CO2
emanations in middle and low-income countries. Arouri et al. (2012) assessed the association among
CO2 emanations, energy ingesting and GDP in Central and North African economies from the period of
1981 to 2005.
It determined that the long-term correlation in energy ingesting with CO2 emanations is important and
positive and GDP is a quadratic connection with CO2 emanations for the entire world. The data estimate
also showed the EKC shaped as inverted U. Remuald (2012) studied the connection between CO2
growths per capita for the period of 1970 to 2004 for 5 countries. The estimation of panel data showd
that education is not a factor in CO2 emission growth but education is a factor in pollution growth.
GMM-system estimation technique is used in this study. Chen and Huang (2013) analyzed the data of
1981-2009 to find out the connection amongst CO2 emanations, urbanization, FDI, and energy ingesting
for the N-11 nations. The results showed a extensive association between carbon emanations and
economic growth using panel co-integration. Additionally, urban population has a important and
negative relationship with carbon emanations. Sedorsky (2014) explored 16 developing countries and
used STIRPAT model from 1971 to 2009.
Practical results suggested a positive correlation among energy intensity, per capita GDP, population
size and carbon emanations. While the use of urbanization depends on the method of assessment, may
be a positive or negative connection. Cetin and Ecevit (2015) deliberated the relationship among energy
ingesting, urbanization, and environmental deprivation in 19 sub-Saharan countries between 1985 and
2010. As a result, it has been revealed that the main source of environmental degradation in these 19
sub- Saharan is energy consumption and urbanization.
This study acknowledged the long-term connection amongst the variables applying panel co-integration
assessments. The outcomes of the Error Correction Model (VECM) showed that there are two reasons
between long-term urbanization and both energy ingesting and CO2 emanations. Alam et al. (2016)
detected the consequence of energy ingesting, income and population growth on CO2 discharges by
applying annual data from 1970 to 2012 for Indonesia, India, China and Brazil. CO2 emanations has
optimistic and significant influence with increase in consumption of energy and income in all four
countries. The outcome of populace growth on CO2 emanations was significant for Brazil and India but
inconsequential for Indonesia and China. Hypothesis of inverted- EKC was also initiate in China,
Indonesia and Brazil but not in India. Smruti and Dash (2017) detected the relationship among FDI,
energy intensity, urbanization and CO2 emanations during 1980 to 2012 of 18 republics in South Asia.
Journal of Business and Social Review in Emerging Economies Vol. 6, No 4, December 2020
1483
The researchers divided the 17 countries into three sub categories on the basis of income them as middle
and low income countries. This investigate divided the nations on the foundation of per capita income. A
co-integration association is found between energy intensity, fossil fuel, FDI, urban population and
Carbon emanations in middle income nations. The results indicated that energy ingesting significantly
increased by the CO2 emissions and incline to create to green house problem in the South Asian
Countries. Hanif (2017) inspected the nexus of energy, economics and the environment in Caribbean
Latin American countries.
The study aimed to discover the influence of fossil fuel ingesting, oil-based imports, electricity
consumption, and increase of urban population on environmental collapse. The researcher used the
System Generalized Method (SGM) for the period (1990-2015) with two-stage estimator included in a
panel of 20 middle and 20 lower middle income nations. The results indicated that the expansion of oil
imports, fossil fuel ingesting and urban population is contributing meaningfully to ecological
degradation and also established the reveled U-shaped association among CO2 emission and GDP per
capita. This study expored that renewable energy resources could support to encounter growing energy
demand and reduce trade deficits by reducing oil imports to developing countries in Caribbean Latin
American countries. Sakiru and Mulali (2018) investigated the impact of FDI on environmental
dilapidation by scrutinize 20 countries.
The results showd that FDI has not any outcome on environmental dilapidation indicators, carbon
footprints and ecological footprint. The results further explored that energy ingesting, GDP, and
urbanization played key contributors to environmental degradation. The results exposed that FDI and
urbanization enhance effluence in the developing countries but they alleviate pollution in developed
countries. Hanif, (2018) analyzed “the effect of economic growth on energy ingesting and urban
population on CO2 emission in sub-Saharan Africa.
The results of study showed the positive and significant influence of economic growth, ingesting of
fossil fuels, urban expansion, and renewable energy on environmental dilapidation in evolving nations
of sub-Saharan African. In this study (GMM) was adapted on 34 sub-Saharan African economies for the
period of 1995-2015. Results described that ingesting of fossil fuels for extension of metropolitan zones
and cooking are meaningfully causal to CO2 emission and air pollution. Inverted-U shaped relationship
among per capita economic growth and CO2 emission has also found. Empirical analysis also confirmed
Environmental Kuznets Curve (EKC) in low- income and middle emerging economies of Sub Saharan
Africa.
The study suggested that renewable energy replacements improve air value by monitoring CO2 emission
and depressing the direct interface of household’s noxious gases and use of renewable energy alternative
help the economies to attain viable development goals”. Shehbaz, et al. (2019) observed the relation
amongst FDI and CO2 emanation from 1990-2015 for the Middle East and the North African region. The
researcher applied GMM (Generalized Method Moments) for Pollution Haven Hypothesis (PHH)
testing. N-shaped connotation found amongst FDI and CO2 emanations. GDP and CO2 emissions has
inverted- U and N-shaped relationship and thus satisfied the Environmental Kuznets Curve. Hanif, et al.
( 2019) studied FDI, fossil fuels and economic growth that directed to Carbon dioxide emanations in
developing countries in asia. Asia's fastest-growing economy is facing increasing environmental
problems. Fossil fuels increase the emission of CO2.
FDI in developing economies are important source of CO2 emanations. Results confirmed the Pollution
Haven Hypothesis and rejected the Halo effect by hypothesis. Panel data were used from 1990 to 2013
and the ARDL bound approach was applied. This study revealed a optimistic and significant influence
of boosting economic growth, fossil fuels and FDI on CO2 emanations and environmental degradation.
The study also identified the existence of the EKC. The study concluded that reducing fossil fuel
consumption and promoting environmental friendly economic growth strategies in developing countries
will be beneficial. Chaudhry et al. (2020) inspected the association amongst economic development,
urbanization of CO2 emanations, population size in the economies of the South Asian Association for

Journal of Business and Social Review in Emerging Economies Vol. 6, No 4, December 2020
1484
Regional Cooperation ( SAARC) for the period 1994-2013. In this investigation, an enhanced STIRPAT
model along a fixed effect regression estimation is used. Practical results have shown that size of
population and high carbon emanations per capita are the main drivers in SAARC economies. There is a
U-shaped affiliation amongst urban population and CO2 emanations. As urban population increases, CO2
emanations initially decreases and then increases with urbanisation. Prior studies observed the
connections between urban development, energy usage and Carbon emissions in developed, developing
and low-developed economies.
A few preferred studies were mentioned in this report. In addition, a few papers addressed the dissimilar
directions in Asian countries for economic degradation.In addition, not one of the prior studies visibly
discovered the correlation between urban development, fossil fuels energy usage, GDP, FDI and carbon
emissions and the overall effect on CO2 emissions in Asia's emerging economies.
Keeping all these dynamics into review, this study empirically endeavors to discover the association
between GDP, urbanization, fossil fuels energy consumption, FDI, and carbon emissions in emerging
economies of Asia. Moreover, these economies have been taken into consideration, because these
emerging economies of Asia have a few collective features such as growing population, enormous
energy consumption, rising urban development and industrialization in the 1990s. By means of this, the
existing investigation anticipates to cover the accessible gap in literature. Moreover, this empirical study
efforts to inspect, whether rate of urban development, energy usaged, GDP, FDI make easy to CO2
emissions and environmental degradation in emerging economies of Asia.
3. Methodology and Data Description
Present study discussed the impact of economic growth, Urbanization, fossil fuel consumption, FDI on
environmental dilapidation in the Asian developing economies. Panel data has been taken from the
“World Bank Development Indicators 2018”. This study has assimilated yearly panel data for the period
from 1990 to 2018. Data is collected from 11 emerging Asian economies (Bangladesh, Indonesia, China, India, Turkey, Malaysia, Philippines, Pakistan, Nepal, Thailand, Sri Lanka and time period is taken from 1990 to 2018.
3.1 Description of the Variables
3.1.1.Carbon Emissions (CO2)
Log of CO2 emissions per capita per metric ton is used as dependent variable. The supposition is that
economic progress donates to carbon emanations/emissions and also scrutinize Environmental Kuzzet
Curve (EKC) relationship. According to the theory, economic growth donates to CO2
emissions/emanations and these CO2 emissions/emanations follow reversed U-shaped (EKC)
relationships. In preceding studies Shahbaz et al. (2013); Hanif (2018); Sabori (2013) had been used
these variables in their studies.
3.1.2.Economic Growth (GDP)
Economic growth is enumerated by taking the log of yearly per capital GDP rate. Shahbaz et al. (2013),
Hanif (2017) and Ahmed and Doe (2017) have also used economic growth as Regressor or independent
variable. One of the supposition of this study is that real GDP per capita growth contributes to CO2
secretions.
3.1.3. Economic Growth Squared (GDP2)
Log of Square of the real GDP is used to measure the EKC hypothesis. Shahbaz et al. (2013); Ahmed
and Long (2012); EKC has also constructed a square of GDP in their model to check the hypothesis. The
evidence of the study is that the suqared of GDP per capita is negatively correlated with carbon
emissions.
3.1.4. Fossil fuels usage (FFU) Fossil fuels usage are recorded as annual energy consumption. Hanif (2019); Ahmad and Du (2017); and
Lau et al. ( 2014) used fossil fuel to inspect the properties of usage of energy on CO2 emanations. The
use of fossil fuel energy is speculated to upsurge carbon emissions/emanations.

Journal of Business and Social Review in Emerging Economies Vol. 6, No 4, December 2020
1485
3.1.5. Foreign Direct Investment (FDI) Foreign direct investment net income (BoP, current US dollars) is being used to assess its impact on
CO2 emissions. Then it is converted into real terms by dividing with GDP deflator according to the
previous research by Lau et al. (2014); Cole (2004); and Zarsky, (1999). In previous studies, there are
both positive and negative effects of FDI on CO2 emissions. In some studies FDI indicates a lessening in
CO2 emanations and proves the halo effect hypothesis.
3.1.6. Urbanization (URP) In this study researcher has used log of urban population as percentge of total population to measaure the
impression on carbon emissions. This is also used in the prior studies of Ahmed and Du (2017) and
Hanif and Santos (2017). It is estimated that increasing population escalate carbon emanations.
3.2 Model Specification To scrutinize the effect of fossil fuel consumption, economic growth, FDI and urbanization on CO2
emanations/environmental degradation. The current study exercises the EKC hypothesis which is based
on Kuznets’(1995) hypothesis. Kuznets initially found inverted U-shaped relation among CO2
emanations and economic growth. While the same impression is used to validate the association between
economic growth and the environment, the expression "environmental Kuznets curve" was designed. By
“EKC” hypothesis, Economic growth firstly increases CO2 emanations, but in future, instead of gaining
a sure turning point, it increases economic growth and reduces CO2 emanations.
The econometric form of the model is based on prior studies by Hanif and Santos (2017 a) and Shahbaz
et al. ( 2012) can be described as follows:
𝐶𝑂2 = 𝑓 (𝐺𝐷𝑃, 𝐺𝐷𝑃2, ∅) … … … … … … … (1)
Equation (1) ∅ expressions an unknown factor (such as FDI, urban population and fossil fuel energy
consumption ) and their probable impact on carbon emissions and equation becomes:
CO2 = 𝑓 (𝐺𝐷𝑃, 𝐺𝐷𝑃2, 𝑈𝑅𝑃, 𝐹𝐹𝑈, 𝐹𝐷𝐼) … … … … … … … … (2)
CO2 = CO2 emanations/emissions per capita
GDP = Gross Domestic Product Per capita
GDP2 = Squared of Gross Domestic Production
URP = Urban population to the percentage of total population in millions
FFU = Annual consumption of fossil fuels (kg of oil equivalent per capita)
FDI = Foreign Direct Investment (BoP, current US$)/ GDP deflator/total population
The econometric model to assess the results can be transcribed as:
𝐶𝑂2𝑖𝑡 = 𝛽0 + 𝛽1𝐺𝐷𝑃𝑖𝑡 + 𝛽2𝐺𝐷𝑃𝑖𝑡2 + 𝛽𝑛∅𝑖𝑡 + 𝑈𝑖𝑡
… … … … … … (3)
To estimate the results and the extended form of the EKC hypothesis can be printed as:
𝑙𝑛𝐶𝑂2𝑖𝑡 = 𝛽0 + 𝛽1𝑙𝑛𝐺𝐷𝑃𝑖𝑡 + 𝛽2𝑙𝑛𝐺𝐷𝑃2𝑖𝑡 + 𝛽3𝑙𝑛𝐹𝐹𝑈𝑖𝑡 + 𝛽4𝑙𝑛𝐹𝐷𝐼𝑖𝑡 + 𝛽5𝑙𝑛𝑈𝑅𝑃𝑖𝑡+ 휀𝑖𝑡 … … … … … … (4)
Here t represents time when i represent the country. The lower case letters symbolize variable logarithmic
changes. In addition, the individual error term is used in Equation (4) εit and it implies that errors are
distributed identically (i.i.d.). The individual errors or time fluctuating errors.
In Equation ( 4), logit model is used as it is assumed that GDP Per capita and CO2 excretions will not
have a relationship that is linear but may have a relationship that is exponential. In addition, to lessen the
issue of multicollinearity the researcher used log traformation. Natural logs are used to examine the
effects of independent variables on environmental degradation (carbon emissions). Equation ( 4) presents
a long-term association between regressing and regressing variables. In order to use the PMG/ARDL
model, it is necessary to add short-term dynamics to the long-term equation ( 4); this is given as an
equation ( 5).

Journal of Business and Social Review in Emerging Economies Vol. 6, No 4, December 2020
1486
△ 𝑙𝑛𝐶𝑂2𝑖𝑡 = 𝜃0 + ∑ 𝜃1𝑗 △ 𝑙𝑛𝐶𝑂2𝑡−𝑗
𝑘
𝑗=1
+ ∑ 𝜃2𝑗 △ 𝑙𝑛𝐺𝐷𝑃𝑡−𝑗
𝑘
𝑗=0
+ ∑ 𝜃3𝑗 △ 𝑙𝑛𝐺𝐷𝑃2
𝑡−𝑗
𝑘
𝑗=0
+ ∑ 𝜃4𝑗 △ 𝑙𝑛𝐹𝐹𝑈𝑡−𝑗
𝑘
𝑗=0
+ ∑ 𝜃5𝑗 △ 𝑙𝑛𝐹𝐷𝐼𝑡−𝑗
𝑘
𝑗=0
+ ∑ 𝜃6𝑗 △ 𝑙𝑛𝑈𝑅𝑃𝑡−𝑗
𝑘
𝑗=0
+ 𝛽1𝑙𝑛𝐶𝑂2𝑖𝑡−1 + 𝛽2𝑙𝑛𝐺𝐷𝑃𝑖𝑡−1 + 𝛽3𝑙𝑛𝐺𝐷𝑃2𝑖𝑡−1 + 𝛽4𝑙𝑛𝐹𝐹𝑈𝑖𝑡−1 + 𝛽5𝑙𝑛𝐹𝐷𝐼𝑖𝑡−1
+ 𝛽6𝑙𝑛𝑈𝑅𝑃𝑖𝑡−1 + 휀𝑖𝑡 − − − − − − − − − − − − − − − − − − − − − − − − − − − − − − − − − − − −(5)
In eqution (5), △ shows the first difference operator, βs embodies the long run coefficient, θs present
the short term coefficient, and εit shows for the commonly distributed error with mean zero. Moreover,
in order to prevent long-term co-integration, there is null hypothesis of no co-integrtion mong the
variables. The alternative hypothesis on the other hand is that there exist a contegration amongst the
variables.
Pedroni test is used to examine the the null hypothesis, F-statistics of test are observed to inspect the
association of dependence and the mutual alliance between the independent variables and the analyzed
F- Compare statistical comparisons with key values formed by Pesaran et al. (2001). Once the long-term
association is documented, then a random error correction procedure is devised here, which adds speed
to the adjustment or model to add speed to the short-term to long-term transition.
∆ln𝐶𝑂2𝑖𝑡 = 𝛽0 + ∑ 𝛼𝑖1 ∆ln𝐶𝑂𝑡−𝑖 +
𝑛
𝑖=1
∑ 𝛾2𝑖 ∆ln𝐺𝐷𝑃𝑖𝑡−1 +
𝑛
𝑖=1
∑ 𝜎3 ∆ln𝐺𝐷𝑃𝑖𝑡−12 +
𝑛
𝑖=1
∑ 𝜃4 ∆ln𝐹𝐹𝑈𝑖𝑡−1 +
𝑛
𝑖=1
∑ 𝜏5 ∆ln𝐹𝐷𝐼𝑖𝑡−1
𝑛
𝑖=1
+ ∑ 𝜔6 ∆ln𝑈𝑅𝑃𝑖𝑡−1 + 𝛽1 𝑙𝑛𝐺𝐷𝑃𝑖𝑡
𝑛
𝑖=1
+ 𝛽2 𝑙𝑛𝐺𝐷𝑃𝑖𝑡2 + 𝛽3 𝑙𝑛𝐹𝐹𝑈𝑖𝑡 + 𝛽4 𝑙𝑛𝐹𝐷𝐼𝑖𝑡 + 𝛽5 𝑙𝑛𝑃 + 𝛿𝐸𝐶𝑖𝑡−1 + 𝑈𝑖𝑡
Here, 𝛿 regulate the coefficient of the ECT and to confirm the co-integration association. The value of
ECT is predicted negative sign and also statistically significant.
Variables and data source description
𝐕𝐚𝐫𝐢𝐚𝐛𝐥𝐞𝐬 𝐏𝐫𝐨𝐱𝐢𝐞𝐬 𝐃𝐞𝐬𝐜𝐫𝐢𝐩𝐭𝐢𝐨𝐧𝐬 𝐒𝐨𝐮𝐫𝐜𝐞𝐬 𝐨𝐟 𝐝𝐚𝐭𝐚 𝐑𝐚𝐧𝐠𝐞𝐬 𝐨𝐟 𝐝𝐚𝐭𝐚 𝐄𝐧𝐯𝐢𝐫𝐨𝐧𝐦𝐞𝐧𝐭𝐚𝐥 𝐝𝐞𝐠𝐫𝐚𝐝𝐚𝐭𝐢𝐨𝐧 CO2 Carbon Dioxide WDI &World development Atlas 1990 − 2018
𝐄𝐜𝐨𝐧𝐨𝐦𝐢𝐜 𝐆𝐫𝐨𝐰𝐭𝐡 GDP Gross Domestic Product World development indicator 1990 − 2018 𝐈𝐧𝐯𝐞𝐬𝐭𝐦𝐞𝐧𝐭 FDI Foriegn Direct Investment World development indicator 1990 − 2018
𝐄𝐧𝐞𝐫𝐠𝐲 𝐜𝐨𝐧𝐬𝐮𝐦𝐩𝐭𝐢𝐨𝐧 FFU Fossils Fuels WDI &Global Energy Statistical book 1990 − 2018 𝐓𝐞𝐜𝐡𝐧𝐨𝐥𝐨𝐠𝐲 UP Urbanization World development indicator 1990 − 2018
All variables data are taken from world development indicators, world development atlas and Global
Energy statistical book year 2019. All variables are used in log form.
4. Analysis of Results
4.1 Summary Statistics
The researcher reported the Summary statistics of all the variables in table 1. Fossil fuels energy
consumption (FFU), FDI and urban population (URP) are weakly associated with the CO2 emissions .
Table 1
Summary Statistics
CO2 FFU FDI GDP URP
Mean 2.04 63.83 0.70 3031.70 38.05
Median 1.00 63.55 0.25 1821.18 33.84
Maximum 7.94 96.94 6.29 13853.10 73.61
Minimum 0.03 5.05 -0.64 354.257 8.85
Std. Dev. 1.99 22.22 1.12 2966.64 16.44
Note: author's own calculation
4.2. Testing of Multicollinearity
In this estimation correlation method is applied to check the issue of multicollinearity . The outcomes of
the correlation coefficients demonstrate the correlation amongst the variables. The outcomes indicate
that fossil fuels energy usage (FFU) , FDI, GDP per capita (GDP) and urban population (URP) are
inadequately connected with the dependent variable " CO2 emissions" .

Journal of Business and Social Review in Emerging Economies Vol. 6, No 4, December 2020
1487
Table 2: Correlation Matrix
LCO2 LFFU LFDI LGDP LURP
LCO2 1.00 LFFU 0.81 1.00
LFDI 0.81 0.63 1.00 LGDP 0.86 0.61 0.78 1.00
LURP 0.83 0.77 0.62 0.78 1.00 Noted: author's own calculation.
The values of (VIF) is shown in Table 3 below. The value of the VIF fluctuates from 1.592 to 3.840,
which means that there is no matter of multicollinearity in the evaluated model.
Table 3: Variance Inflation Factor(VIF)
LCO2 LFFU LFDI LGDP LURP
LCO2 -
LFFU 2.915 -
LFDI 1.468 1.201 -
LGDP 1.102 1.064 1.093 -
LURP 1.024 1.091 1.717 1.124 -
4.3. Testing for Stationarity
To evaluate the reliability of the results and to avoid the spurious results, the researcher applied the unit
root tests for stationary status of the variables in the panel data series, because non-stationary variables
produce ambiguous results. The results are elaborate in Table 4
Table 4: Summary of Panel Unit Root
Levin-Lin-Chu test IPS-W test
Variables At Level At Difference At Level At Difference
Stats P-value Stats P-value Stats P-value Stats P-value Order
LCO2 -1.54 0.064 -5.09 0.0000 1.41 0.9200 -7.20 0.0000 I(1)
LFFU -0.59 0.0000 -3.46 0.0000 -3.59 0.0000 -4.74 0.0000 I(0)
LFDI -5.80 0.0000 -9.45 0.0000 -5.95 0.0000 -11.02 0.0000 I(0)
LGDP 1.72 0.957 -4.00 0.0000 7.57 0.9999 -5.15 0.0000 I(1)
LGDP2 2.41 0.992 -3.37 0.0000 8.45 0.9999 -4.65 0.0000 I(1)
LURP -4.14 0.0000 0.97 0.8350 -2.42 0.0070 1.85 0.9680 I(0)
Note: author's own calculation
In table 4 the outcomes show that the CO2 emission, GDP and GDP2 are stationary at first difference and
co-integration order is I(I), while fossil fuels consumption FFU, FDI and URP variables are stationary at
level and co-integration order is I(0). Therefore, it can be recognized that the variables have mixed order
of integration; thus, for co-integration testing Pedroni co-integration test is used. Co-integration method
is appropriate for large data set. In small sample data set, result may display excessive unpredictability.
In distinction, the ARDL bound test righteous belongings for small sample data (Saboori & Sulaiman,
2013; Zhang & Gao, 2016). PMG/ARDL model is used to estimate the impact of FDI, GDP, URP and
FFU on CO2 emissions in the selected emerging Asian economies.
4.4. Testing of Panel Dependence
A lot of tests are provided in the prior work to learn about cross-sectional dependence on panel results,
and the most widely used tests are Baltgi Feng, pacers (2004 A, B), Scaled LM (2004), Breusch and
Pagan (1980) and Kao Bias based scaled LM (2012) are incorporated in different studies. The
aforementioned assessment outcomes are listed in Table 5. Complete findings are reported in the table
below did not support cross-sectional dependency, suggesting that the first generation panel root test is

Journal of Business and Social Review in Emerging Economies Vol. 6, No 4, December 2020
1488
more suitable for implementation. Table 5
Test Statistics P. value
Breusch Pagan LM 41.76 0.9050
Pesaran CD test 1.63 0.1020
4.5 Testing for Heteroscedasticity
To test heteroscedasticity of the model, we used Bresush- Pagan test. The outcomes are following.
Table 6: Results for Heteroscedasticity
Joint-chi2 test F-statistics P-Value
0.6488 -0.429
4.6 Testing for Serial Correlation
The serial correlation is verified using Langrangian Multiplier Test. Here it is considered null hypothesis
that there is no serial correlation in model. The results are reported in table 7. The result shows
acceptance of the serial correlation in the model by null assumption.
Table 7: Results for Serial Correlation
Prob. > chi2 test F-statistics P-Value
1.22 0.292
4.7 Functional Form
The functional form specification is verified using Joint-Jarque Bera test. The null hypothesis is
considered that there is no misspecification in functional form of the model. The results are reported in
table 8. The result shows acceptance of the serial correlation in the model by null assumption.
Table 8: Results for Functional Form
Prob. > chi2 test F-statistics P-Value
0.52 0.824
4.8 Pedroni Co-Integration Testing
The Pedroni-test is being used to underpin the co-integration of GDP, GDP2 fossil fuels energy usage
(FFU), urbanization (URP), FDI and CO2 emissions. The results of this test are described in Table 9.
Here, the outcomes of the test validates a co-integration association of dependent and independent
variables. Moreover, Kao test also validate the co-integration relationship. The null hypothesis is
considered that there is no co-integration exist in the model.
Table 9: Results of Pedroni Co-integration Test
Testing for presence of association amongst the variables in the model
Test- Statistics t-statistic P-Value
Panel v-statistic -1.929 (0.976)
Panel rho-statistic 1.509 (0.934)
Panel PP-statistic -3.115*** (0.000)
Panel ADF-statistic -1.391* (0.082)
Group rho-statistic 2.533 (0.994)
Group PP- statistic -4.044*** (0.000)
Group ADF-statistic -1.5055 ** (0.066)
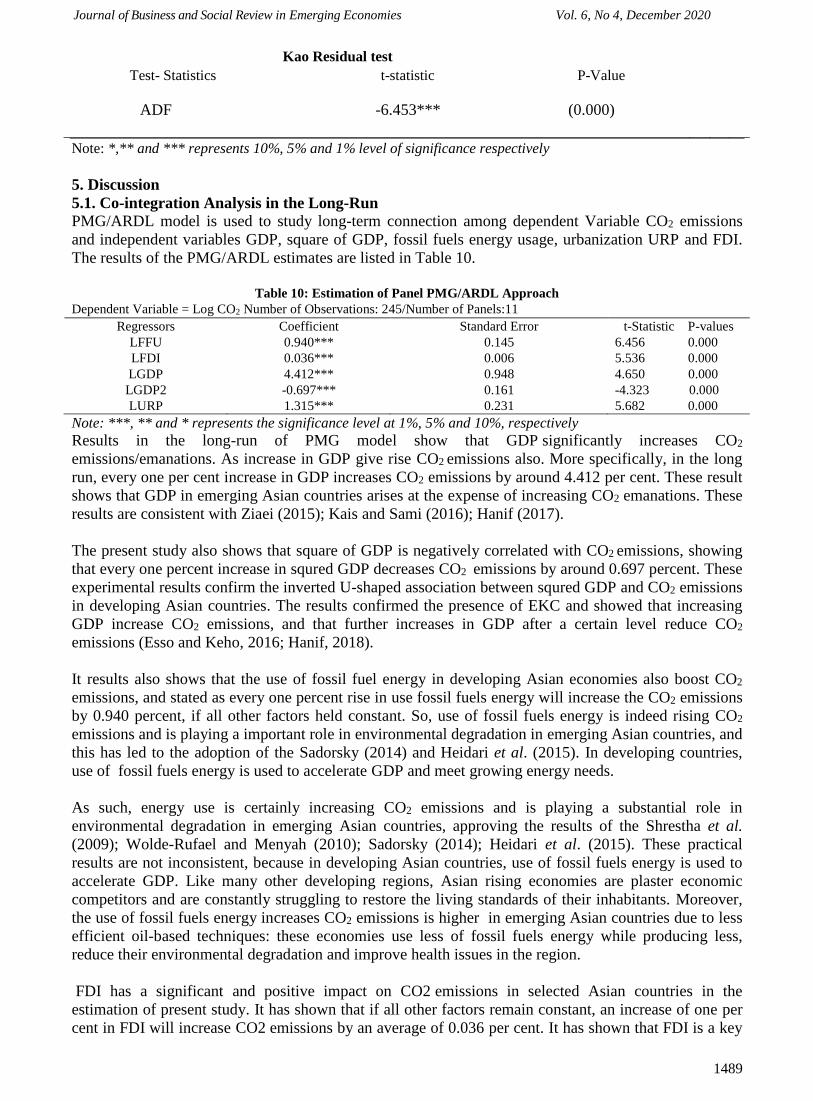
Journal of Business and Social Review in Emerging Economies Vol. 6, No 4, December 2020
1489
Kao Residual test
Test- Statistics t-statistic P-Value
ADF -6.453*** (0.000)
Note: *,** and *** represents 10%, 5% and 1% level of significance respectively
5. Discussion
5.1. Co-integration Analysis in the Long-Run
PMG/ARDL model is used to study long-term connection among dependent Variable CO2 emissions
and independent variables GDP, square of GDP, fossil fuels energy usage, urbanization URP and FDI.
The results of the PMG/ARDL estimates are listed in Table 10.
Table 10: Estimation of Panel PMG/ARDL Approach
Dependent Variable = Log CO2 Number of Observations: 245/Number of Panels:11
Regressors Coefficient Standard Error t-Statistic P-values
LFFU 0.940*** 0.145 6.456 0.000
LFDI 0.036*** 0.006 5.536 0.000
LGDP 4.412*** 0.948 4.650 0.000
LGDP2 -0.697*** 0.161 -4.323 0.000
LURP 1.315*** 0.231 5.682 0.000
Note: ***, ** and * represents the significance level at 1%, 5% and 10%, respectively
Results in the long-run of PMG model show that GDP significantly increases CO2
emissions/emanations. As increase in GDP give rise CO2 emissions also. More specifically, in the long
run, every one per cent increase in GDP increases CO2 emissions by around 4.412 per cent. These result
shows that GDP in emerging Asian countries arises at the expense of increasing CO2 emanations. These
results are consistent with Ziaei (2015); Kais and Sami (2016); Hanif (2017).
The present study also shows that square of GDP is negatively correlated with CO2 emissions, showing
that every one percent increase in squred GDP decreases CO2 emissions by around 0.697 percent. These
experimental results confirm the inverted U-shaped association between squred GDP and CO2 emissions
in developing Asian countries. The results confirmed the presence of EKC and showed that increasing
GDP increase CO2 emissions, and that further increases in GDP after a certain level reduce CO2
emissions (Esso and Keho, 2016; Hanif, 2018).
It results also shows that the use of fossil fuel energy in developing Asian economies also boost CO2
emissions, and stated as every one percent rise in use fossil fuels energy will increase the CO2 emissions
by 0.940 percent, if all other factors held constant. So, use of fossil fuels energy is indeed rising CO2
emissions and is playing a important role in environmental degradation in emerging Asian countries, and
this has led to the adoption of the Sadorsky (2014) and Heidari et al. (2015). In developing countries,
use of fossil fuels energy is used to accelerate GDP and meet growing energy needs.
As such, energy use is certainly increasing CO2 emissions and is playing a substantial role in
environmental degradation in emerging Asian countries, approving the results of the Shrestha et al.
(2009); Wolde-Rufael and Menyah (2010); Sadorsky (2014); Heidari et al. (2015). These practical
results are not inconsistent, because in developing Asian countries, use of fossil fuels energy is used to
accelerate GDP. Like many other developing regions, Asian rising economies are plaster economic
competitors and are constantly struggling to restore the living standards of their inhabitants. Moreover,
the use of fossil fuels energy increases CO2 emissions is higher in emerging Asian countries due to less
efficient oil-based techniques: these economies use less of fossil fuels energy while producing less,
reduce their environmental degradation and improve health issues in the region.
FDI has a significant and positive impact on CO2 emissions in selected Asian countries in the
estimation of present study. It has shown that if all other factors remain constant, an increase of one per
cent in FDI will increase CO2 emissions by an average of 0.036 per cent. It has shown that FDI is a key

Journal of Business and Social Review in Emerging Economies Vol. 6, No 4, December 2020
1490
source of high CO2 emissions in selected Asian countries.
Although we believe that FDI play a significant impact on income and job creation in Asian countries,
this assistance can be compensated for in terms of the negative externalities of foreigners and the fitness
of their residents. This result therefore identifies the need for emerging Asian countries to adopt the
undesirable environmental characteristics of FDI. Otherwise, environmental degradation could set the
stage for the end of the economic depression and could make previous growth unsustainable (Henderson
and Millimet, 2007; He, 2006).
These consequences present a positive and statistically significant relation between the urban populace
and CO2 emanations in developing countries in Asia. Exactly, every one percent increase in the urban
population increases CO2 emissions by 1.315 percent, if all other factors remain constant. Since when
the urban population grows, it increases industrialization, which in turn increases the CO2 emissions and
economic downturn of Asian economies. This result is in line with the results of Rafiq et al. (2016),
Hanif and Gago-de-Santos (2017).
5.2. Co-integration Analysis in Short-run Relationship:
PMG/ARDL model is employed to study the association of energy used, GDP and FDI with CO2
emanations in the short-run. The results are in table 11.
Table:11 Estimates of Panel PMG/ARDL Approach in the Short Run
Dependent Variable = Log CO2 Number of Observations: 245/Number of Panels:11
Regressors Coefficient Standard Error t-Statistic P-values
dlog CO2(-1) 0.977*** 0.011 85.924 0.000
dlog FFU 0.712*** 0.142 5.013 0.000
dlog FFU(-1) -0.715 0.135 -5.274 0.220
dlog FDI -0.007 0.006 -1.216 0.225
dlog FDI(-1) 0.006 0.005 1.140 0.225
dlog GDP -0.084 1.208 -0.070 0.944
dlog GDP(-1) 0.128 1.213 0.106 0.914
dlog GDP2 0.115 0.169 0.680 0.496
dlog GDP2(-1) -0.119 0.171 -0.697 0.486
dlog URP 0.749* 0.428 1.751 0.081
dlog URP(-1) -0.748* 0.426 -1.755 0.080
C -0.103 0.186 -0.556 0.578
Note: ***, ** and * represents the significance level at 1%, 5% and 10%, respectively.
In table 11, 0.977 percent of CO2 emanations in a specific time period is accompanying with a 1%
increase in CO2 emissions in the past. Furthermore, in the short term, use of fossil fuels (FFU) energy
and urbanization (URP) has a statistically significant impact on CO2 emissions. results show that if
every one percent increase in FFU helps to emit 0.712 percent of CO2 in the short term, if all other
factors remain constant. One percent increase in urbanization will increase the CO2 emissions 0.749
percent. More over, GDP and FDI do not play a significant role in lowering CO2 emissions in the short
run. Table: 12
Panel Error Correction Model
Dependent Variable = Log CO2 Number of Observations: 245/Number of Panels:11
Regressors Coefficient Standard Error t-Statistic
△log FFU 0.920885 0.521635 1.765384
△log FDI -0.004874 0.006874 -0.709031
△dlog GDP 8.164744 14.22678 0.57390
△dlog GDP2 -1.346438 2.272279 -0.59255
△dlog URP 12.21799 8.780549 1.391484
𝐸𝐶𝑡−1 -0.3031*** 0.1330 -2.27816 Note: ***, ** and * represents the significance level at 1%, 5% and 10%, respectively. Here △ is a first difference operator.
Finally , the outcomes of the error correction demonstrate that the term error correction (ECt-1) is
statistically significant and negative. The consequence of the lagged error correction term authorizes the
long-term association of fossil fuels energy used, economic growth, urbanization and FDI with carbon
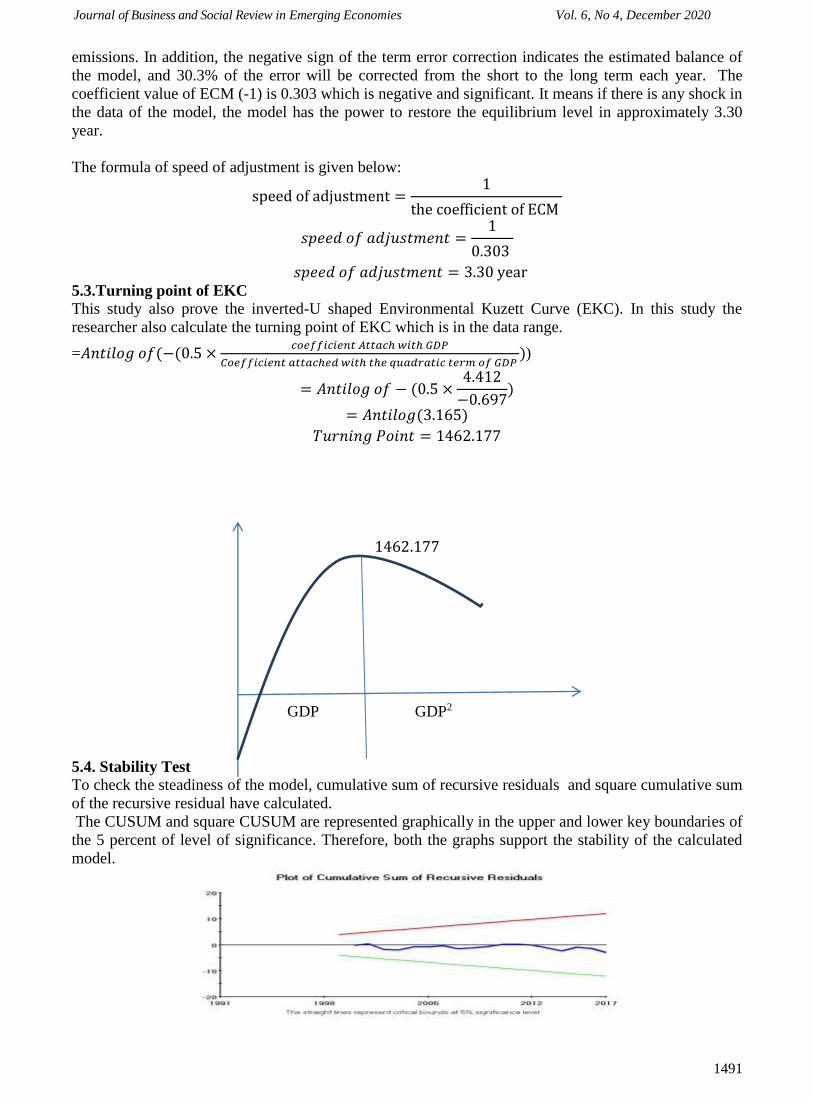
Journal of Business and Social Review in Emerging Economies Vol. 6, No 4, December 2020
1491
emissions. In addition, the negative sign of the term error correction indicates the estimated balance of
the model, and 30.3% of the error will be corrected from the short to the long term each year. The
coefficient value of ECM (-1) is 0.303 which is negative and significant. It means if there is any shock in
the data of the model, the model has the power to restore the equilibrium level in approximately 3.30
year.
The formula of speed of adjustment is given below:
speed of adjustment =1
the coefficient of ECM
𝑠𝑝𝑒𝑒𝑑 𝑜𝑓 𝑎𝑑𝑗𝑢𝑠𝑡𝑚𝑒𝑛𝑡 =1
0.303
𝑠𝑝𝑒𝑒𝑑 𝑜𝑓 𝑎𝑑𝑗𝑢𝑠𝑡𝑚𝑒𝑛𝑡 = 3.30 year
5.3.Turning point of EKC
This study also prove the inverted-U shaped Environmental Kuzett Curve (EKC). In this study the
researcher also calculate the turning point of EKC which is in the data range.
=𝐴𝑛𝑡𝑖𝑙𝑜𝑔 𝑜𝑓(−(0.5 ×𝑐𝑜𝑒𝑓𝑓𝑖𝑐𝑖𝑒𝑛𝑡 𝐴𝑡𝑡𝑎𝑐ℎ 𝑤𝑖𝑡ℎ 𝐺𝐷𝑃
𝐶𝑜𝑒𝑓𝑓𝑖𝑐𝑖𝑒𝑛𝑡 𝑎𝑡𝑡𝑎𝑐ℎ𝑒𝑑 𝑤𝑖𝑡ℎ 𝑡ℎ𝑒 𝑞𝑢𝑎𝑑𝑟𝑎𝑡𝑖𝑐 𝑡𝑒𝑟𝑚 𝑜𝑓 𝐺𝐷𝑃 ))
= 𝐴𝑛𝑡𝑖𝑙𝑜𝑔 𝑜𝑓 − (0.5 ×4.412
−0.697)
= 𝐴𝑛𝑡𝑖𝑙𝑜𝑔(3.165)
𝑇𝑢𝑟𝑛𝑖𝑛𝑔 𝑃𝑜𝑖𝑛𝑡 = 1462.177
1462.177
GDP GDP2
5.4. Stability Test
To check the steadiness of the model, cumulative sum of recursive residuals and square cumulative sum
of the recursive residual have calculated.
The CUSUM and square CUSUM are represented graphically in the upper and lower key boundaries of
the 5 percent of level of significance. Therefore, both the graphs support the stability of the calculated
model.

Journal of Business and Social Review in Emerging Economies Vol. 6, No 4, December 2020
1492
6. Conclusion
This research has reinforced the suggestions that economic growth, fossil fuels energy ingestion,
urbanization and (FDI) foreign direct investment validate the production of carbon emissions in rising
economies of Asia. However the influence of population growth (urbanization) on carbon productions is
also create an optimistic impact, this has not verified significant results in the short-run. The technique
of the analysis has emphasized the long-run and short-run impacts. The main findings of the study are:
Increase in GDP give rise CO2 emissions also. These results are consistent with Ziaei (2015); Kais and
Sami (2016); Hanif (2017). The results also shows that square of GDP is negatively correlated with
CO2 emissions. The results confirmed the presence of EKC and showed that increasing GDP increase
CO2 emissions, and that further increases in GDP after a certain level reduce CO2 emissions (Esso and
Keho, 2016; Hanif, 2018).
It results also shows that the use of fossil fuel energy in developing Asian economies also boost CO2
emissions, use of fossil fuels energy is indeed rising CO2 emissions and is playing a important role in
environmental degradation in emerging Asian countries, and this has led to the adoption of the Sadorsky
(2014) and Heidari et al. (2015). In developing countries, use of fossil fuels energy is used to accelerate
GDP and meet growing energy needs. Approving the results of the Shrestha et al. (2009); Wolde-Rufael
and Menyah (2010); Sadorsky (2014); Heidari et al. (2015). FDI has a significant and positive impact
on CO2 emissions in selected Asian countries in the estimation of present study. This result therefore
identifies the need for emerging Asian countries to adopt the undesirable environmental characteristics
of FDI. Otherwise, environmental degradation could set the stage for the end of the economic depression
and could make previous growth unsustainable (Henderson and Millimet, 2007; He, 2006). When the
urban population grows, it increases industrialization, which in turn increases the CO2 emissions and
economic downturn of Asian economies. This result is in line with the results of Rafiq et al. (2016),
Hanif and Gago-de-Santos (2017).
7. Limitations
The latest data of other environmental gases and impact of other source of Energy can be estimated.
These results are estimated with just PMG/ARDL techniques. This study considers just eleven emerging
Economies.
8. Suggestion
Future research can be extended by applying latest year data of carbon emission and other greenhouse
gases and energy sources can be disaggregated and impact on human beings. The estimation can be
made by using latest econometrics techniques such as DOLS or FMOLS. The results can be made on
region wise and different Economies.
Journal of Business and Social Review in Emerging Economies Vol. 6, No 4, December 2020
1493
Reference
Acaravci, A. & Ozturk, I.(2013). On the relationship between energy consumption, CO2
emissions and economic growth in Europe. Energy , 35(12):5412–20.
Ahmad, K., & Long, W. (2012). Environmental Kuznets curve and Pakistan: an empirical analysis. Proc
Econ Finanan, 1-14. Ahmad N, Du L. Effects of energy production and CO2 emissions on economic growth in Iran: ARDL
approach. Energy 2017;123:521e37.
Alam, A., Azam, M., Abdullah, A. B., Malik, I. A., Khan, A., Hamzah, T. A. A. T., Zaman.
(2016). Environmental quality indicators and financial development in Malaysia: unity in
diversity. Environmental Science and Pollution Research, 22(11), 8392–
8404. doi:10.1007/s11356-014-15
Al-Mulali, U., & Ozturk, I.(2015). The effect of energy consumption, urbanization, trade openness,
industrial output, and the political stability on the environmental degradation in the MENA
(Middle East and North African) region. Energy 84:382–389.
Al-Mulali, U., Wai, C.W., Ting, L.S., & Mohammed, A.H. (2015). Investigating theenvironmental
Kuznets curve (EKC) hypothesis by utilizing the ecological footprint as an indicator of
environmental degradation. Ecol Indicat , 48.
Arouri, M. E. H., Youssef, A. B., M’henni, H., & Rault, C. (2012). Energy consumption, economic
growth and CO2 emissions in Middle East and North African countries. Energy Policy, 45,
342e349.
Baltagi, B. H., Feng, Q., & Kao, C. (2012). A Lagrange Multiplier test for cross-sectional dependence in
a fixed effects panel data model. Journal of Econometrics, 170(1), 164–177.
Breusch TS, Pagan AR (1980) The Lagrange multiplier test and its applications to model specification in
econometrics. Rev Econ Stud 47(1):239–253
Cetin, M. & Ecevit, E. (2015). Urbanization energy consumption and CO2 emission in Sub-Saharan
countries: a panel co-integration and causality analysis. J Econ Dev Stud 3(2), 66–76
Chaudhry, I. S., Baloch, Z. A., Tan, Q., Iqbal, N., Mohsin, M., Abbas, Q. &Iqbal, W. (2020). Trilemma
assessment of energy intensity, efficiency, and environmental index: evidence from BRICS
countries. Environmental Science and Pollution Research. doi:10.1007/s11356-020-09578-3
Chen, J-H. & Huang, Y-F. (2013). The study of the relationship between carbon dioxide and economic
growth. J Int Glob Econ Stud, 6(2),45–61.
Cole, M.A. (2004). Trade, the pollution haven hypothesis and the environmental Kuznets curve:
examining the linkages. Ecol Econ , 48(1),71-81.
Esso LJ, Keho Y. Energy consumption, economic growth and carbon emissions: Co-integration and
causality evidence from selected African countries. Energy 2016;114:492e7.
Guttikunda SK et al, (2003). The contribution of megacities to regional sulfur pollution in Asia. Atmos
Environ 2003;37(1):11–22.
Hanif, I. (2017). Economics-energy-environment nexus in Latin America and the Caribbean. Energy,
141, 170–178.
Hanif, I.(2018). Energy consumption habits and human health nexus in Sub-Saharan Africa. Environ
Sci Pollut Control Ser, 1-12.
Hanif, I. (2018a). Impact of fossil fuels energy consumption, energy policies, and urban sprawl on
carbon emissions in East Asia and the Pacific: a panel investigation. Energy Strategy Rev, 21,
16–24
Hanif, I. & Gago-de-Santos, P. (2017). The importance of population control and macroeconomic
stability to Reducing environmental degradation: an empirical test of the environmental Kuznets
curve for developing countries. Environ Dev, 23(3),1–9.
Hanif, I., Aziz, B.& Chaudhry, I.S. (2019a). Carbon emissions across the spectrum of renewable and
nonrenewable energy use in developing economies of Asia. Renew Energy, 143, 586–595
Hanif, I., Raza, S.M.F., Gago-de-Santos, P. & Abbas, Q. (2019b). Fossil fuels, foreign direct
investment, and economic growth have triggered CO2 emissions in emerging Asian economies:
some empirical evidence. Energy, 171, 493–501
Heidari, H., Katircio_glu, S.T. & Saeidpour, L.(2015). Economic growth, CO2 emissions, and energy
consumption in the five ASEAN countries. Int J Electr Power Energy Syst, 64, 785-791.
Journal of Business and Social Review in Emerging Economies Vol. 6, No 4, December 2020
1494
He, J.(2006). Pollution haven hypothesis and environmental impacts of foreign direct investment: the
case of industrial emission of sulfur dioxide (SO2) in Chinese provinces. Ecol Econ , 60(1), 228-
245.
Henderson, D.J. & Millimet, D.L.(2007). Pollution abatement costs and foreign direct investment
inflows to the US states: a nonparametric reassessment. Rev Econ Stat ,89(1),178-183.
IPCC. (2007). Climate change 2007—mitigation of climate change. Contribution of working group III to
the fourth assessment report of the Intergovernmental Panel on Climate Change. Retrieved
September 2018, from https://www.ipcc.ch/site/assets/uploads/2018/03/ar4_wg2_full_report.pdf.
Kais S, Sami H. An econometric study of the impact of economic growth and energy use on carbon
emissions: panel data evidence from fifty-eight countries. Renew Sustain Energy Rev
2016;59:1101e10.
Kuznets S. Economic growth and income inequality. Am Econ Rev 1955;45(1): 1e28.
Kao, C. (1999). Spurious regression and residual-based tests for cointegration in panel data.
Journal of Econometrics,90(1), 1-44.
Lau, L.S., Choong, C.K. & Eng, Y.K.(2014). Investigation of the environmental Kuznets curve for
carbon emissions in Malaysia: do foreign direct investment and trade matter? Energy Policy, 68,
490-507.
Lee, S. & Oh, D.W.(2015). Economic growth and the environment in China: empirical evidence
using prefecture-level data. China Econ Rev, 36, 73-85.
Levin, A., C.F. Lin and C.S.J. Chu (2002) “Unit root tests in panel data: asymptotic and finite-
sample properties”, Journal of Econometrics, 108, 1-24.
Maranga, E., Mugabe, P. H., & Bagine, R. K. (2010). Concepts, theories and principles of natural
resources management. In W. D. Ochola, P. C. Sanginga, & I. Bekalo (Eds.), Managing Natural
Resources for Development in Africa: A Resource Book. Ottawa: IDRC.
Menyah, K. & Wolde-Rufael, Y.(2010). CO2 emissions, nuclear energy, renewable energy and
economic growth in the US. Energy Policy, 38(6).
N. Apergis, I. Ozturk, Testing environmental Kuznets curve hypothesis in Asian countries, Ecol. Indicat.
52 (2015) 16e22.
Pedroni, P. (2004). Panel cointegration: asymptotic and finite sample properties of pooled time
series tests with an application to the PPP hypothesis. Econometric theory, 20(3), 597-
625.
Perman, R., & Stern, D. I. (2003). Evidence from panel unit root and cointegration tests that the
environmental Kuznets curve does not exist. Australian Journal of Agricultural and Resource
Economics, 47(3), 325-347.
Pesaran MH, Shin Y, Smith RJ. Bounds testing approaches to the analysis of level relationships. J Appl
Econom 2001;16(3):289e326.
S. Nasreen, S. Anwar, I. Ozturk, Financial stability, energy consumption and environmental quality:
evidence from South Asian economies, Renew. Sustain. Energy Rev. 67 (2017) 1105e1122.
Saboori, B. & Sulaiman, J.(2013). CO2 emissions, energy consumption and economic growth in
Association of Southeast Asian Nations (ASEAN) countries: a cointegration approach.
Energy,55, 813-822.
Sadorsky, P. (2014). The effect of urbanization on CO2 emissions in emerging economies. Energy Econ,
41,147–153.
Shahbaz, M., Loganathan, N., Muzaffar, A.T., Ahmed, K. & Jabran, M.A. (2016). How urbanization
affects CO2 emissions in Malaysia? The application of STIRPAT model. Renew Sustain Energy
Rev, 57, 83–93.
Shahbaz, M., Tiwari, A.K. & Nasir, M.(2013). The effects of financial development, economic growth,
coal consumption and trade openness on CO2 emissions in South Africa. Energy Policy, 61,
1452-1459.
Sharma, S.S. (2011). Determinants of carbon dioxide emissions: empirical evidence from 69 countries.
Appl. Energy, 88(1), 376–82.
Shrestha, R.M., Anandarajah, G. &Liyanage, M.H.(2009). Factors affecting CO2 emission from the
power sector of selected countries in Asia and the Pacific. Energy Policy, 37(6), 2375-2384.
Smurti and Dash (2017). The effect of urbanization, energy consumption, and foreign direct investment

Journal of Business and Social Review in Emerging Economies Vol. 6, No 4, December 2020
1495
on the carbon dioxide emission in the SSEA (South and Southeast Asian) region. Renew Energy
70 (2017), 96–106.
Wang P, Wu W, Zhu B, Wei Y. Examining the impact factors of energy-related CO2 emissions using
the STIRPAT model in Guangdong Province, China. Appl Energy 2013;106:65e71.
Zarsky, L.(1999). Havens, halos and spaghetti: untangling the evidence about foreign direct investment
and the environment. Foreign Dir. Invest. Environ.,13(8), 47- 74.
Zhang L, Gao J. Exploring the effects of international tourism on China's economic growth, energy
consumption and environmental pollution: evidence from a regional panel analysis. Renew
Sustain Energy Rev 2016;53: 225e34.
Ziaei SM. Effects of financial development indicators on energy consumption and CO2 emission of
European, East Asian and Oceania countries. Renew Sustain Energy Rev 2015;42:752e9.

Journal of Business and Social Review in Emerging Economies Vol. 6, No 4, December 2020
1496

Journal of Business and Social Review in Emerging Economies Vol. 6, No 4, December 2020
1497
Volume and Issues Obtainable at Center for Sustainability Research and Consultancy
Journal of Business and Social Review in Emerging Economies ISSN: 2519-089X (E): 2519-0326
Volume 6: No. 4, December 2020
Journal homepage: www.publishing.globalcsrc.org/jbsee
Relationship between Time Management Behavior and Academic Performance of
University Students
1Abdur Rashid, 2Ilyas Sharif, 3Shakeel Khan, 4Fazal Malik 1Lecturer, Department of Education, Shaheed Benazir Bhutto University, Sheringal Dir Upper, Pakistan
2Lecturer, Quaid-e-Azam College of Commerce, University of Peshawar, Pakistan,
[email protected] 3Lecturer Institute of Management Studies, University of Peshawar, Pakistan
4 PhD Scholar, Management Science, Qurtuba University of Science and Technology, Peshawar,
Pakistan
ARTICLE DETAILS ABSTRACT History Revised format: November 2020 Available Online: December 2020
Effective time management leads to greater academic
performance and reduces stress, strain and anxiety among
students, however, students facing difficulties to keep a balance
between their academic life and personal-social life. This study
aims to examine the self-perceptions of undergraduate students’
time management behaviour by using Time Management
Behaviour Scale (TMBS) developed by Macan, Shahani,
Dipboye and Phillips (1990). The scale consisted of 34 rating
items ranges from very often true to seldom true. The population
of the study consisted of all undergraduate students studying in
the academic session 2018-19 at public sector general category
universities in Malakand division. By using stratified sampling
technique a sample of 1050 undergraduate students were selected
from the sampled universities. Students were also asked to
provide their CGPA in their previous semester. Both descriptive
and inferential statistics were used to analyze the data. It was
found that prospective teachers have moderate to high level of
time management skills. Significant relationship was found
between undergraduate students’ time management behaviour
and academic performance. It was recommended that university
administration should orient students to enhance their time
management behaviour by arranging seminars, workshops and
conferences to enhance their time management skills.
© 2020 Center for Sustainability Research and Consultancy Pakistan
under a Creative Commons Attribution-NonCommercial-ShareAlike
4.0
Keywords Time Management Behaviour,
Under Graduate Students,
Public Sector Universities,
CGPA
JEL Classification
M0, M1
Corresponding author’s email address: [email protected]
Recommended citation: Rashid, A., Sharif, I, Khan, S. & Malik, F. (2020). Relationship between Time
Management Behavior and Academic Performance of University Students. Journal of Business and
Social Review in Emerging Economies, 6(4), 1497-1504
1. Introduction
Journal of Business and Social Review in Emerging Economies Vol. 6, No 4, December 2020
1498
Balduf (2009) recognized that poor time management leads to academic underachievement while Britton
and Tesser (1991) mentioned as good time management guarantees higher academic achievement of
college students. Further, they found that 67% undergraduate students perceived time management as
their most crucial problem. Moreover, they found that self-reported time management predicts academic
achievement and particularly short-range planning predict grade point average of college students.
George, Dixon, Stansal, Gelb and Pheri (2008) recognized that good time management skills may be
proved as key to academic success. They found that time management is a significant predictor of
academic achievement. In addition, they found that time management is the sole predictor of university
students CGPA and also related to academic and personal success. Similarly, Misra and McKean (2000)
stated that strategies adopted by students aimed to improve their effective utilization of time are
recommended as support to increase academic achievement. They also found a negative correlation
between time management and academic stress. Rabin, Fogel and Nutter-Upham (2011) found that 30%
to 60% undergraduate university students regularly post pone their academic tasks. Similarly, Seo
(2012) mentioned that undergraduate university students usually cram and “pulling and nighters” before
an academic task. Hess, Sherman and Goodman (2000) mentioned that procrastination is also predictor
of academic achievement.
Time is one of the precious resources that higher education intuitions students must possess. The way
through which individuals manage their time may influence their academic performance (Claessens, Van
Eerde, Rutte, & Roe, 2004). Effective time management leads to greater academic performance and
reduces stress, strain and anxiety among students, however, students facing difficulties to keep a balance
between their academic life and personal-social life (Adams & Blair 2019). The way through which
students manage their time may influence their academic achievement, personal and social life and
future or employment life (Macan et al., 1990; Britton & Tesser, 1991; Kearns & Gardiner, 2007). Thus
it is very essential for the students to allocate and manage their time and meet the deadlines (Al Khatib,
2014).
Some universities in the world offer time management training programmes for their students during
their studies (Covic, Adamson, Lincoln, & Kench, 2003). The main purpose of such initiatives is to
improve their learning and grades. Grades or marks in the universities depend on the completion of
different varieties of tasks. These tasks may be completed in a given time framework or deadline,
including the length or period of the task and priorities of the task. Grades or marks are given to the
students on the basis of completion of these multiple tasks depending on their quality and effort put in
by the students. Britton and Tesser (1991) rightly pointed that students’ marks or their grade point
average would be expected to be influenced by their time management skills. Thus students need to be
conscious to manage their time effectively and efficiently to obtain high grades. Both Macan et al.,
(1990) and Britton and Tesser (1991) found that students’ time management ability is directly related to
their academic performance. Generally, a student with successful and productive time management skill
would have better grades and experience less stress related to their academic life. Britton and Tesser
(1991) concluded that university students’ time management skills accounted for 36% of the variance
with their grade point average. Macan et al., (1990) concluded that college students with more perceived
control of time found to be more satisfied than those who haven’t control over time. Macan (1994)
claimed that practices like setting goals, scheduling events, making to-do list and preferences for
organization enable an individual to gain mastery over how they utilize their time.
The literature shows mixed findings regarding the relationship between students’ time management
skills and their academic achievement. Many studies have been conducted in different fields and levels
of education including medical, engineering, general college students, business students, school students
and university students but no single study has been conducted in the local setting to find out the
relationship between undergraduate students’ time management on their academic achievement. To fill
this gap in the existing literature, the present study has been sought to seek the answers of the following
research questions.
1. What is the time management behaviour level of undergraduate students in public sector
universities of Malakand division?
Journal of Business and Social Review in Emerging Economies Vol. 6, No 4, December 2020
1499
2. What is the extent of relationship between students’ time management behaviour and academic
achievement?
2. Research Methodology
The present study was based on quantitative (descriptive survey) research design. Cross-sectional survey
design was used to collect data from the respondents. As the study focused on seeking undergraduate
students’ time management level level and also finds the relationship between students’ time
management behaviour and their academic achievement, therefore, correlational research design was
used to analyze the data. Thus it was a cross-sectional survey and analytical in nature (Cohen, Manion,
& Morrison, 2007). From scattered population survey is considered the best way to gather information
from the respondents in an analytical study because it allows the researcher to find the relationship that
exist between variables to be studied (Bryman, 2008; Cohen, Manion, & Morrison, 2013). Therefore, the
researchers adopted the above stated method for collection and analysis of data in this study.
The population of the study consisted of all undergraduate students of three public sector universities of
Malakand division. The sample of the study consisted of 1200 students through non-proportionate
stratified sampling technique. From each university 400 undergraduate students were conveniently
selected. A total number of twelve hundred survey packets (questionnaires) were distributed among
undergraduate students of three public sector universities in Malakand division. Each survey packet was
accompanied by a covering letter inviting participation in the survey, describing purposes of the study
and ensuring confidentiality and anonymity for the institution and students. Twelve hundred filled
questionnaires were received from the respondents as the researchers personally collected the data from
these universities.
This study used Macan et al., (1990) four factors scale which has been widely used by different
researchers in different parts of the world to measure students’ perception about time management
behaviour. There were many reasons of using this scale as it is an easy, understandable, valid, and
reliable and used by dozen of researchers to measure the time management behaviour of the school,
college and university students of different fields like medical, engineering, business, petroleum and
general students. For convenience of the students the scale was translated into Urdu language, so that
students can understand it and would be able to understand the concepts and give exact response. This
scale has four factors related to setting goals and priorities, mechanics of scheduling and planning,
preference for organization, and perceived control of time. The scale consisted of 35 five points Likert
scale ranging from “seldom true” to “very often true”. Out of 34 items 10 items were related to the first
factor setting goals and priorities, 11 were related to the second factor mechanics of scheduling and
planning, 08 items were related to the third factor preferences for organization and 05 items were related
to perceived control of time.
As it was an adopted questionnaire and has been used by different researchers in different fields in
different countries of the world. Therefore, it is a valid questionnaire. The questionnaire was first pilot
tested on students in a university and responses were found satisfactory. Participants were asked to
respond on Five-Point Likert scale ranging from “seldom true” to “very often true” having values of 5,
4, 3, 2, and 1 respectively. The Cronbach alpha value (.83) for the pilot test indicated that the instrument
was highly reliable. The reliability values for TMBS were found more than 0.70 thresholds, which show
satisfactory level of statistical testing for social sciences (Cohen et al., 2007: 506; Tesfaw, 2014).
3. Data Analysis
The researchers analyzed the collected data by using both descriptive and inferential statistical tests. In
descriptive statistics the researchers used mean scores of each dimension and overall scores of students’
time management behaviour; and standard deviation of each dimension and overall scores of students’
time management behaviour were used. As the data was showing normal curve distribution, therefore,
the researchers used Pearson’s Product-Moment co-efficient correlation (r) was used as inferential
statistics. To interpret the mean scores, the researcher used mean score 3.0 as midpoint mark (Iqbal,
2010; Ghazi, 2004; Nguni, 2005: 125; Hukpati, 2009: 34; Tesfaw, 2014). It was assumed by the

Journal of Business and Social Review in Emerging Economies Vol. 6, No 4, December 2020
1500
researchers that the item or dimension which has mean score greater than midpoint 3.0 demonstrate the
evidence of students’ time management behaviour. Thus the item or dimension having mean score
greater than the midpoint (M>3), was interpreted as above average level of observance of time
management behaviour. The researchers assumed that the higher the mean score, the greater the
observance of time management behaviour.
The researchers also interpreted the value of Pearson product-moment correlation coefficient (r) between
students’ time management behaviour scores based on Field’s (2009) interpretation. According to
Field’s (2009), the values of r which lies between .10 to .29 was interpreted as weak relationship; the
value of r lies between .30 to .49 was interpreted as moderate level; and the value of r lies between .50 to
1.0 was interpreted as high or strong relationship. The researchers fed the collected data into data sheet
for analysis in Statistical Package for Social Sciences (SPSS) version 22.0.
Table 01: Sample profile of the participants
Demographic Variables Frequency Percentage
Gender
Male 732 61
Female 468 39
Age
≤ 20 Years 907 75.58
> 20 Years 293 24.42
Current Semester
2nd 301 25.08
4th 404 33.66
6th 307 25.58
8th 188 15.66
The above table represents the sample profile of the undergraduate students. Among the obtained data of
1200 students, 61 were male and 39 were female, which indicates that more male students has
participated in the study. Among the sample students, 75.58 were less than or equal to the age of 20
while 24.42 have greater than 21 years old. Thus comparatively more students have participated in the
study were of less than 20 years old. Out of 1200 students, 25.08 % students of second semester; 33.66%
students of fourth semester; 25.58% students of sixth semester and 15.66% students of eighth semester
students have participated in the study. The number of fourth semester students was found higher than
that of second, sixth, and eighth semester’s students respectively, who participated in the study.
Table 02: Time management behaviour level of undergraduate students
TMBS Constructs n Mean Standard Deviation
Setting goals and priorities 1200 2.69 0.860
Mechanics of scheduling and planning 1200 2.80 0.654
Preference for organization 1200 2.76 0.689
Perceived control of time 1200 2.81 0.792
Overall TMBS 1200 2.76 0.712
The above table shows the mean and standard deviation scores of the different dimensions of students’
time management behaviour. Perceptions of undergraduate students regarding “perceived control of
time” were observed to have the maximum mean value (2.81) which shows that this dimension has the
maximum level of observance among the four dimensions of time management behaviour. On the other
hand “setting goals and priorities” was observed to have the minimum mean score (2.76) which shows
the lowest level of observance among the four dimensions of time management behaviour. As the mean
scores for different dimensions of time management behaviour was found less than the midpoint 3.0,
therefore, undergraduate students’ time management behaviour level have below average level of
observance.
Table 03: Relationship between TMBS constructs and Academic Performance of Students
Variables Relationship SGP MTM PFO PCT TMBS AP
Setting Goals
and Priorities
Pearson
Correlation 1

Journal of Business and Social Review in Emerging Economies Vol. 6, No 4, December 2020
1501
Sig. (2-tailed)
N 200
Mechanics of
Time
Management
Pearson
Correlation .427** 1
Sig. (2-tailed) .000
N 199 199
Preference for
Organization
Pearson
Correlation .662** .505** 1
Sig. (2-tailed) .000 .000
N 440 199 200
Perceived
Control of
Time
Pearson
Correlation .247** .329** .452** 1
Sig. (2-tailed) .000 .000 .000
N 4400 199 200 200
Time
Management
Behavior Scale
Pearson
Correlation .791** .716** .859** .674** 1
Sig. (2-tailed) .000 .000 .000 .000
N 199 199 199 199 199
Academic
Performance of
Students
Pearson
Correlation .189** .294** .175* .228** .289** 1
Sig. (2-tailed) .007 .000 .013 .001 .000
N 200 199 200 200 199 200
SGP=Setting Goals and Priorities, MTM= Mechanics of Time Management, PFO=Preference for
Organization, PCT=Perceived Control of Time, TMBS=Time Management Behavior Scale and
AP=Academic Performance
The above table revealed the correlation matrix among different dimensions of TMBS and also the
relationship of each dimension with students’ academic performance. The values of co-efficient of
correlation among different dimensions of TMBS were ranging from weak to strong relationship. The
relationship between all dimensions of TMBS and students’ academic performance were found
statistically positive weak significant at the .05 level of significance. It shows that with the increase in
time management behaviour of students accompanies with the increase in academic performance. In
other words, the higher the level of students’ time management behaviour the greater the academic
achievement of the students.
4. Discussion
The present study found that the undergraduate students of universities have below average level of time
management behaviour. The mean scores for different dimensions of the time management behaviour
showed that undergraduate students have below average level of tendencies towards setting goals and
priorities, mechanics of time management, preference for organization and perceived control of time.
The mean score for perceived control of time was found to be greater than that of the other time
management behaviour dimensions while setting goals and priorities has minimum level of observance
among the four dimensions of the time management behaviour scale. This implies that undergraduate
students were generally more conscious about their time use. They tried their best to complete the task
within the allotted period of time. They tried to follow the schedule and do not waste time in
unimportant tasks. They felt difficulty in setting goals and priorities tasks; they can’t plan and manage
their time for short and long term goals. Similarly, they felt difficulty in making to-do list and cannot
priorities the tasks on urgency basis. As a result they failed to have good academic scores. These results
have been testified by many researchers who found that students would like to be organized but fail to
have any strategies to help themselves (Kelly, 2002; Adams & Blair, 2019). The mean scores of the
different dimensions of time management behaviour scale showed that undergraduate students have
trouble with SGP, MTM, PFO and PCOT. Strategies like keeping a log of activities, keeping an
appointment book, reviewing daily activities, making to-do list will help the students to plan and keep
them on track to feel more in control of their time and more able to estimate the needed time to
accomplish tasks (Adams & Blair, 2019; Pozdeeva, 2019).
The study also finds positive weak significant relationship between different dimensions of time
management behaviour scale and students’ academic achievement. This implies that students having

Journal of Business and Social Review in Emerging Economies Vol. 6, No 4, December 2020
1502
good time management behaviour tend to have better grades. On the other hand, students have poor time
management behaviour will have low grades. The literature shows mixed findings regarding the
relationship between time management and academic performance. Some researchers found direct
relationship between students’ time management skills and academic achievement while other has
regretted the positive relationships between these two constructs. The findings of the study have been
testified by many other researchers who found that time management was positively related with
students academic performance (Adams & Blair, 2019; Kearns & Gardiner, 2007; Macan et al., 1990;
McKenzie & Gow, 2004; Trueman & Hartley). Thus, it is evident that these times management
behaviour i.e. SGP, MTM, PFO and PCOT lead to an improvement in academic performance of the
students. Students having greater academic performance are better at managing their space and time.
5. Conclusions
Based on the findings, this study concludes that undergraduate students have below average level of
time management behaviour level. Universities students find it difficult to set goals and priorities;
schedule their time for different tasks; have well-organized workplace; make to-do list; feeling in control
of time; being procrastinated and not able to estimate the needed time to accomplish tasks. The study
also confirmed that students’ time management behaviour significantly positively correlated with their
academic performance. Students having better time management behaviour tend to have higher grade
point average.
6. Recommendations
The researchers have recommended that it is the joint responsibility of the teachers, administration and
policy makers to provide students an overview of the main strategies to develop enhance the time
management skills of students particularly the first year students when they newly enter in a higher
education setting and know less about the academic matters. The university students must study the
books related to time management which may lead them to better understanding of the concept of time
management strategies which may be useful to utilize their time more productively. It is suggested that
university administrators must arrange seminars and workshops for students on practical tips on how to
manage time for different activities in order to reduce mental stress and enhance academic performance.
References
Adams, R. V., & Blair, E. (2019). Impact of time management behaviors on undergraduate engineering
students’ performance. SAGE Open, 9(1), 2158244018824506.
Al Khatib, A. S. (2014). Time Management and Its Relation to Students’ Stress, Gender and Academic
Achievement among Sample of Students at Al Ain University of Science and Technology,
UAE. International Journal of Business and Social Research, 4(5), 47-58.
Balduf, M. (2009). Underachievement among college students. Journal of Advanced Academics, 20,
274-294.
Britton, B. K. & Tesser, A. (1991). Effects of time-management practices on college grades.
Bryman, A. (2008). Why do researchers integrate/combine/mesh/blend/mix/merge/fuse quantitative and
qualitative research. Advances in mixed methods research, 87-100.
Claessens, B. J., Van Eerde, W., Rutte, C. G., & Roe, R. A. (2004). Planning behavior and perceived
control of time at work. Journal of Organizational Behavior: The International Journal of
Industrial, Occupational and Organizational Psychology and Behavior, 25(8), 937-950.
Cohen, L., Manion, L., & Morrison, K. (2007). Observation. Research methods in education, 6, 396-
412.
Cohen, L., Manion, L., & Morrison, K. (2013). Research methods in education. Rutledge.
Journal of Business and Social Review in Emerging Economies Vol. 6, No 4, December 2020
1503
Covic, T., Adamson, B., Lincoln, M., & Kench, P. (2003). Health science students' time organization
and management skills: A cross-disciplinary investigation. Medical teacher, 25(1), 47-53.
Field, A. (2009). Discovering statistics using SPSS. Sage publications.
George, D., Dixon, S., Stansal, E., Gelb, S.L., & Pheri, T. (2008). Time diary and questionnaire
assessment of factors associated with academic and personal success among university
undergraduates. Journal of American College Health, 56, 706-715.
Ghazi, S. R. (2004). Job Satisfaction of Elementary School Head Teachers (Toba Tek Singh) in the
Punjab. . (Ph. D Thesis). Faculty of Advanced Integrated Studies and Research (Education),
NUML, Islamabad, Pakistan.
Hess, B., Sherman, M. F. & Goodman, M. (2000). Eveningness predicts academic procrastination: The
mediating role of neuroticism. Journal of Social Behavior & Personality, 15(5), 61-74.
Hukpati, C. (2009). Transformational leadership and teacher job satisfaction: A comparative study of
private and public tertiary institutions in Ghana. Master’s Thesis, University of Twente,
Netherlands.
Iqbal, A. (2010). A Comparative Study of the Impact of Principals’ Leadership Styles on the Job
Satisfaction of Teachers. (Ph. D Thesis). Institute of Education & Research, University of the
Punjab, Lahore, Pakistan.
Journal of Educational Psychology, 83(3), 405-410.
Kearns, H., & Gardiner, M. (2007). Is it time well spent? The relationship between time management
behaviours, perceived effectiveness and work‐related morale and distress in a university
context. High Education Research & Development, 26(2), 235-247.
Kelly, W. E. (2002). Harnessing the river of time: A theoretical framework of time use efficiency with
suggestions for counselors. Journal of Employment Counseling, 39(1), 12-21.
McKenzie*, K., Gow, K., & Schweitzer, R. (2004). Exploring first‐year academic achievement through
structural equation modelling. Higher Education Research & Development, 23(1), 95-112.
Misra, R., & McKean, M. (2000). College students’ academic stress and its relation to their anxiety, time
management, and leisure satisfaction. American Journal of Health Studies, 16, 41-51.
Nguni, S. C. (2005). A study of the effects of transformational leadership on teachers’ job satisfaction,
organizational commitment and organizational citizenship behaviour in Tanzanian primary and
secondary schools. (Ph. D Dissertation), Radboud University Nijmegen, Netherlands.
Pozdeeva, E. S. (2019). STUDENTSTIME MANAGEMENT IN HIGHER EDUCATION: REVIEW
OF THE LITERATURE. Наука и человечество, 1(1), 65-99.
Rabin, L., & Fogel, J. N.-U. (2011). Academic procrastination in college students: The role of self-
reported executive function. Journal of Clinical and Experimental Neuropsychology, 33, 344-
357.
Seo, E. (2012). Cramming, active procrastination and academic achievement. Journal of Social
Behaviour and Personality, 40, 1333-1340.
Tesfaw, T. A. (2014). The relationship between transformational leadership and job satisfaction: The
case of government secondary school teachers in Ethiopia. Educational Management
Administration & Leadership, 42(6), 903-918.

Journal of Business and Social Review in Emerging Economies Vol. 6, No 4, December 2020
1504
Trueman, M., & Hartley, J. (1996). A comparison between the time-management skills and academic
performance of mature and traditional-entry university students. Higher education, 32(2), 199-
215.

Journal of Business and Social Review in Emerging Economies Vol. 6, No 4, December 2020
1505
Volume and Issues Obtainable at Center for Sustainability Research and Consultancy
Journal of Business and Social Review in Emerging Economies ISSN: 2519-089X (E): 2519-0326
Volume 6: No. 4, December 2020
Journal homepage: www.publishing.globalcsrc.org/jbsee
Determinants of Customer Perception About Adoption of Islamic Insurance
(Takaful) in Pakistan
1Areeba Khan, 2Hafiz Abdur Rashid, 3Rana Muhammad Shahid Yaqub, 4Saba Abbas 1IBMAS, The Islamia University of Bahawalpur, Pakistan, [email protected]
2Assistant Professor, Hailey College of Commerce, University of the Punjab, Lahore, Pakistan,
[email protected] 3IBMAS, The Islamia University of Bahawalpur, Pakistan, [email protected]
ARTICLE DETAILS ABSTRACT History Revised format: November 2020 Available Online: December 2020
The purpose of this study is to assess the response level of
individuals concerning Islamic Insurance in Pakistan and to measure
its outreach and most pertinent factors affecting customer selection of
Islamic Insurance. It also seeks to make informed recommendations
on empowering frameworks for the establishment of Takaful
insurance through relevant marketing campaigns in Pakistan. The
impact of factors like Customer Awareness, Consumer Satisfaction,
Risk Perception, Compatibility and Religiosity was checked on
Adoption of Islamic Insurance in Pakistan, with the presence of
Social Influence as a mediating variable. Data were collected through
questionnaire administered to 300 respondents, representing the
Muslim community from urban as well as rural areas, of Pakistan.
Partial least square-structural equation modeling (PLS-SEM) through
Smart PLS3 was used to examine the relationships among pertinent
factors in this study. The findings suggest that most respondents are
either not aware of Takaful as an insurance and investment option, or
do not understand the concept altogether. This study suggests that
Islamic insurance organizations should focus on awareness
campaigns as an essential marketing strategy and dedicated resources
to reach prime customer segments in general and fulfil the need to
inform people about their products and services through clear
understanding of principles of Shariah compliance. The findings of
this research have important implications for Takaful companies as
well as regulators and general insurance customers.
© 2020 Center for Sustainability Research and Consultancy Pakistan under
a Creative Commons Attribution-NonCommercial-ShareAlike 4.0
Keywords Takaful; Islamic Insurance;
PLS Smart; Customer
perception, Adoption, Social
Influence
JEL Classification
M10, M14
Corresponding author’s email address: [email protected]
Recommended citation: Khan, A., Rashid, H. A., Yaqub, R. M. S. & Abbas, S. (2020). Determinants
of Customer Perception About Adoption of Islamic Insurance (Takaful) in Pakistan. Journal of Business
and Social Review in Emerging Economies, 6(4), 1505-1516
1. Introduction
The past decade has seen the rapid emergence and growth of the Islamic financial services sector, which
has obtained wide acknowledgment and recognition. Since its emergence, the worldwide Islamic finance
industry has extended further than the conventional Islamic economic boundaries of the major industrial

Journal of Business and Social Review in Emerging Economies Vol. 6, No 4, December 2020
1506
economy and has grown significantly (Abdullah, & Abd Rahman, 2018; Tan & Lim, 2019; ). Nowadays,
Islamic Finance is not anymore a niche product used in a special market but is currently offered in more
than 60 countries.
Internationally, the insurance market in developed countries is well-reputed and highly flourished
(Souiden & Jabeur, 2015). In particular, the Altuntas, Berry-Stölzle, and Hoyt (2011) record shows that
Japanese citizens invest from their annual income of about 8.6 percent ($ 3,472) in the insurance
division. Also, the record emphasizes that the market share of 79.1 percent of the Japanese insurance
market, 69 percent in France and the UK and 43 percent in the USA. The insurance industry in
emerging countries is in its starting point. Countries like Turkey, Tunisia, and Algeria, show 15.6
percent, 13.2 percent, and 7.5 percent of market share of over-all insurance industry claimed by Islamic
Insurance (Takaful) (Outreville, 2018).
In Pakistan, the takaful industry is growing with existing and new players contemplating the introduction
of Shiah-compliant products. This is the beginning of a major transformation in which the Sharia-
compliant insurance solutions may eventually become available to most Muslim people in the country.
This further emphasizes the importance of study for Islamic consumer preferences. It is the consumer
preferences that have given them the option to enjoy high-quality products and services. Also, Pakistani
insurance companies allow customers to request insurance products and services that best suit their
needs. Consumers have a lot of options to browse. Therefore, general and Islamic insurers need to
compete more with the best products and services they can offer their customers. However, the
possibilities do not arise incidentally. Many important questions must be discussed to ensure the
credibility and acceptance of Takaful's bright future. Consequently, Takaful suppliers should be smart
about their position in the product production phase which can meet market demands and respond
positively to other mitigating factors that may reduce the tendency of Takaful subscribers.
Furthermore, the awareness of the Takaful related products is still low in Pakistan as compared to other
countries and poses a vital concern for Takaful providers (Jamshidi, Hussin, & Wan, 2015). The
perception that Takaful is similar to conventional insurance exhibits how little Pakistanis know about the
Takaful mechanism (Akhter & Khan, 2017).
The above-given background has triggered the need for further investigation on the contributing factors
that might influence the tendency to subscribe to a Takaful plan or products.
2. Literature review and prepositioning
"Islamic Insurance is a framework through which the members give part of the entirety of their
commitments which are utilized to pay claims for losses endured by a portion of the members. The
organization's job is confined to dealing with the insurance tasks and contributing to the insurance
commitments." (Grassa, 2013).
The act of Takaful agreement and business will be in coherence with the Islamic idea of shared co-
operation based on the standards of al-Mudharabah, which is allowable as indicated by Allah (SWT),
and is completed dependent on the just and true intention to guarantee the member with financial
protection from unforeseen future material hazard. Later on, for a Takaful exchange to get legal and
enforceable, it ought to be liberated from unlawful components, for instance, usury, extortion, and
ahead.
Takaful practices the idea of risk sharing, while the general insurance practice depends on risk transfer
(Kasim, Htay, & Salman, 2016). In Takaful, risk sharing among members is decided by taking at the
danger support. This reserve is a Tabarru (gift, donation), or commonly contributed finance. It is utilized
to pay claims for any outstanding losses or surplus. The excess is shared among the participants just as
the operator does, oppose to the allowing of the Takaful model and Islamic law. The basic concept of
Takaful is the idea of proportionate sharing, designed to promote association and solidarity between
members and the community.
Journal of Business and Social Review in Emerging Economies Vol. 6, No 4, December 2020
1507
In 2005, the Islamic State Council enacted the guidelines of the Islamic insurance policy. In Pakistan,
the concept of Takaful is very old; though its relevant effects may be new. In 1983, the Pakistani
government encouraged the Islamic Ideology Council of Pakistan to suggest an Islamic insurance policy.
From that point on, Islamic insurance faced a variety of conversational difficulties because of its
complications and the non Shariah compliant environment. In 2005, the Islamic State Council set up
standards for the Islamic insurance policy in the country. A large takaful organization, particularly the
Pak-Kuwait Takaful limited company commenced their operations in 2006 based on Wakala-Waqf
model. The SECP in recent times gave license to five more life insurance companies to elevate the
market (Hanif & Iqbal, 2017).
Of estimated 200 million Pakistani people, access to insurance is very low when most people are left
unprotected and unaware. Access to information in this scenario is the biggest challenge. As 75 percent
of our people fall into the low-income bracket, the only viable consumer segment found in the insurance
industry and Takaful is 25 percent of people who earn high, are educated, and have controlled access to
their property. This still leaves a great percentage of unexploited consumers who are opting for
voluntary exclusion from insurance.
By and large, the Takaful sector is at its evolving level over time, the industry will also need to produce
products that show innovation, compatibility and transparency of Takaful to build new market sections.
That will make the Takaful industry a default defense option and a viable tool for investment and
securitization.
2.1 Adoption of Islamic Insurance
In the present research Adoption to Islamic Insurance (ADII) is a dependent variable used to identify the
reasons why people have accepted or are interested in Islamic Insurance and the factors that contributing
to its adoption. Arifin and Yazid (2018) refer to various factors affecting the adoption of Islamic
insurance including aqilah and planning.
Shariah scholars have been open about the contradictions in their beliefs about Insurance framework in
Islam. Takaful is permissible as a vehicle, but Sharia sources provide a complete overview of the basics
of framework, rules and regulations, failure to comply with which would render the vehicle
inadmissible (Morrison, 2014).
2.2 Customer awareness
The level of awareness about the Islamic Insurance product in urban areas of metropolitan cities,
however, the greater part of the consumers is unaware of the Islamic financial products (Coolen-Maturi,
2013). Awareness means people develop their interest in certain issues and participate (Husin & Ab
Rahman, 2016a).
In this study, Awareness is defined as knowledge level and approach of customers towards Islamic
products and services of insurance companies. The first stage of acceptance of any product or service is
awareness. It is therefore unthinkable that the adoption of any product would take place unless one
knows about it. Awareness is therefore fundamental to the use of insurance products and services as it
opens up a way to stimulate customer curiosity. Without awareness, there would be no customer action.
L. Xu, Prybutok, and Blankson (2019) have identified awareness as a powerful factor that directs
customer towards the acceptance or rejection of a particular product. Similarly, Bashir (2019) observed
that creating awareness among consumers about a product or service remains a key factor in its
acceptance.
Literature reports the link between variables awareness and customers’ acceptance and acceptance of a
particular product, services, or idea (Hanafi, Kasim, & Diyana, 2019). Based on the literature as
discussed, the following hypothesis is developed:
H1: There exists a significant relationship between Customer awareness and Islamic Insurance
adoption.”

Journal of Business and Social Review in Emerging Economies Vol. 6, No 4, December 2020
1508
2.3 Consumer Satisfaction”
Consumers' fulfilment can be viewed as a client's evaluation of the outcomes that they have obtained in
collaboration with the organization, which results from the customer's pre-purchase surveys of
anticipated performance with real performance (Hamzah, Ishak, & Nor, 2015).
Consumers can think and choose Insurance options that will give them greater flexibility in terms of the
materials and management are constantly educated about the commercial value due to the proliferation
of new strategies (Narwal & Sachdeva, 2013). Samir Roushdy and Ali (2017) state that customer
satisfaction is significant as they are the ones who be responsible for customer service and affect
customer understanding of Takaful. Based on the literature as discussed, the following hypothesis is
developed:
H2: There exists a significant relationship between Customer satisfaction and Islamic Insurance
adoption.
2.4 Risk Perception
Perceived risk is defines as nature and the amount of the uncertainty faced by the customer in his effort
to make use of Islamic bank products or services. Tamer Asaad (2016) reports that the perceived risk of
innovation is related to adoption of Islamic insurance services whereas other studies have shown a
negative relationship between perceived risk and adoption (Guillemette, Hussein, Phillips, & Martin,
2015; Mariadas & Murthy, 2017).
Depending on the services of the leading insurance system, any type of service by Islamic insurance
should be easy to read and use. The perceived ease of use can be explained as the “level of ease
associated with system use”, which helps and encourages customers to embrace and implement new
programs (Thaker et al., 2019).
Based on the literature, the following hypothesis is developed:
H3: There exists a significant relationship between risk perception and Islamic Insurance adoption.
2.5 Compatibility
Compatibility refers to the level to which Islamic insurance products and services are seen as consistent
with customer beliefs and values. It is also regarded as the harmony of insurance products and services
in human justice, insurance practice, and the belief of recipients.
Perceived compatibility has been predicted to provide an impact on innovation adoption. The direct
effect of this variable has been reported on individual behavior. Many studies have reported the
relationship between compatibility and acceptance of a product or service. The relationship was
guaranteed especially as positive and significant. Studies by Sidharta, Mentari, Wafaretta, and Nuraini
(2017); Naicker and Van Der Merwe (2018) have revealed a positive relationship between compatibility
and acceptance of Islamic insurance. Previous studies in various ways have confirmed the potential for
adoption of new products or ideas if the new ones are considered to be in line with their beliefs,
practices, current values, social system, and their values and lifestyles (Obeid & Kaabachi, 2016; Liu &
Yi, 2017). Previous researches have noted that compatibility has a positive and significant relationship
on the acceptance of Islamic insurance (Ali, Yaacob, & Haji, 2018). Based on the literature as discussed,
the following hypothesis is developed:
H4: There exists a significant relationship between compatibility and Islamic Insurance adoption.
2.6 Religiosity
The definition of religiosity is the level of a person that believes in God, built on his or her faithfulness
and love of religion (Zakaria et al., 2016).
Journal of Business and Social Review in Emerging Economies Vol. 6, No 4, December 2020
1509
Religiosity is characterized by emotions, exhibition, and a gathering of people. Religiosity was seen as
one of the significant components in the determination of Islamic Insurance with the ultimate goal of
acquisition of items and for the assumption.
From the researches of Mathras, Cohen, Mandel, and Mick (2016), it is established that religion could
influence customer psychology and behavior through beliefs, customs, qualities, and community. The
Muslims are urged to buy Islamic insurance in light of the fact that the product is based on Islamic
standards. That idea has characterized the items and administrations as “halal” and it conforms with the
Muslim religion (Siala, 2013). Based on the literature as discussed, the following hypothesis is
developed:
H5: There exists a significant relationship between religiosity and Islamic Insurance adoption.
2.7 Mediating Role of Social Influence”
It is observed that the people may change their behavior because of the influence of a group of people or
individuals. It is stated that people may consider the opinion of others and may influence their decision
to do or not to do something (Husin et al., 2016).
Choosing the insurance commitment depends on five key decisions that include the proposal of partners,
the reputation of the insurance, the cost of managing the accounts, the people considering, and the
availability of credit. In the context of Islamic insurance, social influence has 53% of the functionality
and is effective and positive. People choose Islamic insurance because society expects it from them
(Echchabi et al., 2016). SI contributes to consumer loyalty through references, family members, and
friends (Badowska, 2017; Beldad & Hegner, 2018; Herawati & Tjahjono, 2020).
Based on the literature as discussed, the following hypotheses are formulated:
H6: Social Influence significantly mediates the relationship between customer awareness and Islamic
Insurance adoption.
H7: Social Influence significantly mediates the relationship between customer satisfaction and Islamic
Insurance adoption.
H8: Social Influence significantly mediates the relationship between risk perception and Islamic
Insurance adoption.
H9: Social Influence significantly mediates the relationship between compatibility and Islamic
Insurance adoption.
H10: Social Influence significantly mediates the relationship between religiosity and Islamic Insurance
adoption.
3. Method
Determining the appropriate research strategy allows the analyst to build interactive tools for data
collection and analysis. The study is descriptive in nature and quantitative methodology is applied by
obtaining a list of questions from the previous investigations.
Table 3.1: Description of Variables Variables
Name
Variables
code
Description
Investigation tool
References
Customer
Awareness
CA Awareness is a perception and customer
information about any particular product,
service, or situation.
Questionnaire
(Safari, 2019)
Consumer
Satisfaction
CS Customer satisfaction response, the extent
to which the completion is satisfactory or
unpleasant.
Questionnaire
(Mariadas &Murty,2017)

Journal of Business and Social Review in Emerging Economies Vol. 6, No 4, December 2020
1510
Risk
Perception
RP The perceived risk can be defined as the
level and type of uncertainty consumers
experience in his or her attempt to use a
particular product or service.
Questionnaire
(Thaker et al, 2019)
Compatibility COM Compatibility is defined as the level at
which an innovation is considered to be in
line with existing values, past
experiences, and potential recipients'
needs.
Questionnaire
(Latip et al, 2017)
Religiosity REL Religiosity is defined as the feelings,
actions, and experiences of individuals.
Questionnaire
(Obeid & Kaabachi,
2016)
Social
Influence
SI Social influence is peer pressure, people
perceiving it from their families, social
groups, and surroundings, which
influence their choice of behavior.
Questionnaire
(Bodibe et al, 2016)
Adoption of
Islamic
insurance
Adopt Takaful is a Shariah way to protect
yourself and your family from future
financial losses.
Questionnaire (Schmidt, 2019)
Convenience sampling is most common in Islamic finance research. The main reason for choosing this
method is the lack of feedback from individuals, as individuals are completely unaware of the concept.
Based on the convenience sampling, 300 respondents were selected and the impact of independent
variables (awareness of the Islamic insurance system, customer satisfaction, compatibility, perceived
risk, and social influence) was analyzed on the dependent variable (adoption of Islamic insurance)
through administration of the questionnaire.
The instruments consists of 25 items were modified from the existing body of literature (Mariadas &
Murthy, 2017; Safari, 2019; Schmidt, 2019; Thaker et al., 2019). All the items were estimated on five
points Likert scale. The instrument is divided into two segments. The first segment manages access to
socio-demographic data about the respondents and the second segment focuses on seven variables,
including one dependent, one mediating, and five independent variables. This section was linked to the
collection details using five indicators that influence the acceptance of Islamic Insurance.
The use of the Smart-Partial Least Square Structural Equation Modeling (Smart PLS-SEM) method of
analysis as a second-generation method of analysis was employed to examine the data. PLS-SEM was
used to analyze the relationship of varying degrees and it is a more sophisticated multivariate data
analysis to measure unobservable variables and to minimize measurement error (Chin, 1998). To sum it
up, the Smart PLS-SEM technique has the advantage of analyzing a sample of various degrees,
minimizing measurement error, and also serve as the source of confirmatory and exploratory analysis
(Henseler et al., 2014).
4. Findings and discussion
The initial phase in PLS-SEM is the measurement model evaluation. Reliability (factor loadings),
internal consistency reliability (Cronbach's alpha) (composite reliability CR), construct validity (average
variance extracted AVE), and discriminant validity (Fornell and Lacker (F and L) were run and
analysed. The measurement outcomes were acquired after the running algorithm is SmartPLS and are
presented in Table 4.1.
Table 4.1 also exhibits the Cronbach's alpha for six factors of adoption of Islamic Insurance in Pakistan.
The alpha qualities ran from 0.772 to 0.871, more than the base model of 0.60 Cronbach's alpha which
represents the rule of thumb for a reliability test as per Byrne and Van de Vijver (2010). Data analysis
confirms the instrument is highly reliable because internal consistency is seen among all factors.
In this research, convergent validity was evaluated by factor loading, Composite Reliability (CR), and

Journal of Business and Social Review in Emerging Economies Vol. 6, No 4, December 2020
1511
Average Variance Extracted (AVE) (Fornell & Larcker, 1981). Confirmatory Factor Analysis (CFA) is
directed to evaluate the factor loading of variables. As per this standard, the convergent validity of the
measurement model can be surveyed by the Average Variance Extracted (AVE) and Composite
Reliability (CR).
Table 4.1: Construct Validity and Reliability Construct Items Factor loading Cronbach’s
Alpha
(α)
CR AVE
Customer
Awareness
CA1 0.723 0.721 0.768 0.631
CA2 0.639
CA3 0.806
Customer
Satisfaction
CS1 0.763 0.604 0.774 0.537
CS2 0.788
CS3 0.664
Risk Perception RP1 0.586 0.648 0.787 0.687
RP3 0.803
RP4 0.691
RP5 0.691
Compatibility COM1 0.672 0.633 0.803 0.578
COM2 0.835
COM3 0.769
Religiosity REL1 0.684 0.725 0.816 0.582
REL2 0.724
REL3 0.561
REL4 0.712
REL5 0.745
Social Influence SI1 0.796 0.697 0.832 0.623
SI2 0.757
SI3 0.814
Adopt of Islamic
Insurance
Adopt1 0.712 0.684 0.807 0.515
Adopt2 0.785
Adopt3 0.781
Adopt4 0.570
Table 4.2: Discriminant Validity Adopt CA COM CS REL RP SI
Adopt 0.717
CA 0.422 0.726
COM 0.642 0.398 0.762
CS 0.271 0.355 0.432 0.740
REL 0.592 0.378 0.591 0.396 0.688
RP 0.517 0.501 0.548 0.524 0.531 0.697
SI 0.657 0.381 0.623 0.335 0.641 0.597 0.789
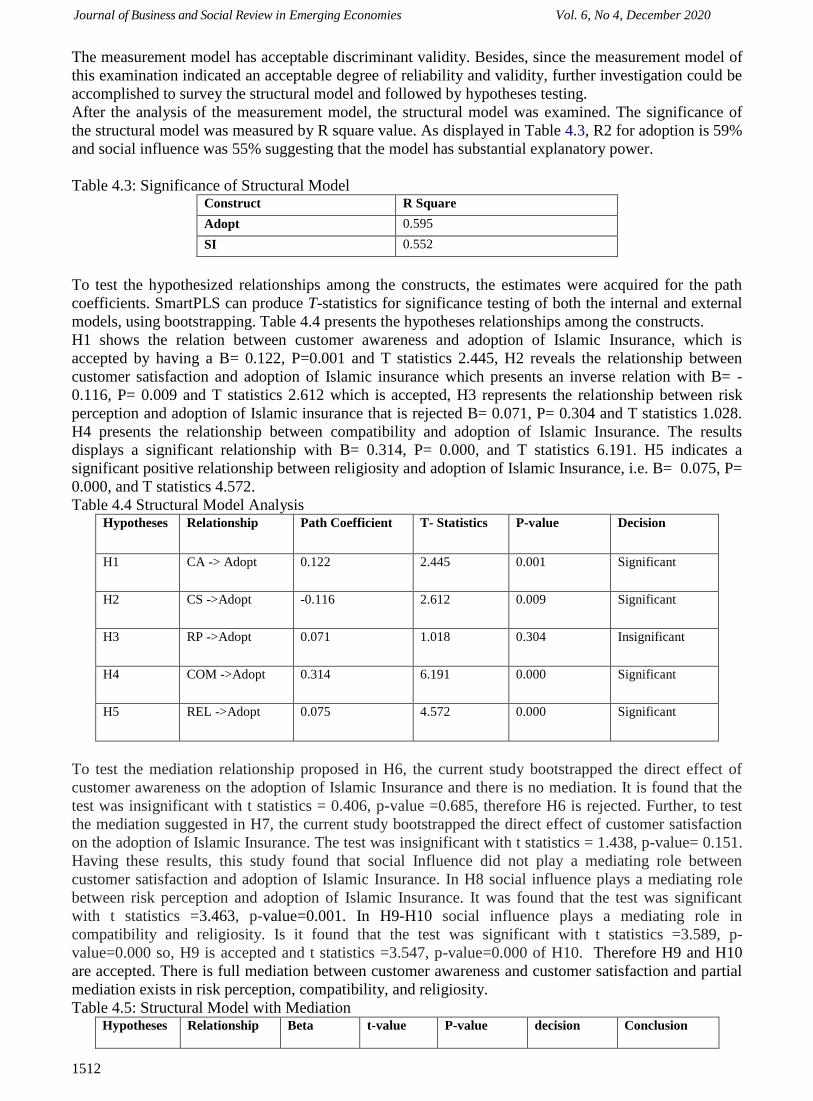
Journal of Business and Social Review in Emerging Economies Vol. 6, No 4, December 2020
1512
The measurement model has acceptable discriminant validity. Besides, since the measurement model of
this examination indicated an acceptable degree of reliability and validity, further investigation could be
accomplished to survey the structural model and followed by hypotheses testing.
After the analysis of the measurement model, the structural model was examined. The significance of
the structural model was measured by R square value. As displayed in Table 4.3, R2 for adoption is 59%
and social influence was 55% suggesting that the model has substantial explanatory power.
Table 4.3: Significance of Structural Model Construct R Square
Adopt 0.595
SI 0.552
To test the hypothesized relationships among the constructs, the estimates were acquired for the path
coefficients. SmartPLS can produce T-statistics for significance testing of both the internal and external
models, using bootstrapping. Table 4.4 presents the hypotheses relationships among the constructs.
H1 shows the relation between customer awareness and adoption of Islamic Insurance, which is
accepted by having a B= 0.122, P=0.001 and T statistics 2.445, H2 reveals the relationship between
customer satisfaction and adoption of Islamic insurance which presents an inverse relation with B= -
0.116, P= 0.009 and T statistics 2.612 which is accepted, H3 represents the relationship between risk
perception and adoption of Islamic insurance that is rejected B= 0.071, P= 0.304 and T statistics 1.028.
H4 presents the relationship between compatibility and adoption of Islamic Insurance. The results
displays a significant relationship with B= 0.314, P= 0.000, and T statistics 6.191. H5 indicates a
significant positive relationship between religiosity and adoption of Islamic Insurance, i.e. B= 0.075, P=
0.000, and T statistics 4.572.
Table 4.4 Structural Model Analysis Hypotheses Relationship Path Coefficient T- Statistics P-value Decision
H1 CA -> Adopt 0.122 2.445 0.001 Significant
H2 CS ->Adopt -0.116 2.612 0.009 Significant
H3 RP ->Adopt 0.071 1.018 0.304 Insignificant
H4 COM ->Adopt 0.314 6.191 0.000 Significant
H5 REL ->Adopt 0.075 4.572 0.000 Significant
To test the mediation relationship proposed in H6, the current study bootstrapped the direct effect of
customer awareness on the adoption of Islamic Insurance and there is no mediation. It is found that the
test was insignificant with t statistics = 0.406, p-value =0.685, therefore H6 is rejected. Further, to test
the mediation suggested in H7, the current study bootstrapped the direct effect of customer satisfaction
on the adoption of Islamic Insurance. The test was insignificant with t statistics = 1.438, p-value= 0.151.
Having these results, this study found that social Influence did not play a mediating role between
customer satisfaction and adoption of Islamic Insurance. In H8 social influence plays a mediating role
between risk perception and adoption of Islamic Insurance. It was found that the test was significant
with t statistics =3.463, p-value=0.001. In H9-H10 social influence plays a mediating role in
compatibility and religiosity. Is it found that the test was significant with t statistics =3.589, p-
value=0.000 so, H9 is accepted and t statistics =3.547, p-value=0.000 of H10. Therefore H9 and H10
are accepted. There is full mediation between customer awareness and customer satisfaction and partial
mediation exists in risk perception, compatibility, and religiosity.
Table 4.5: Structural Model with Mediation Hypotheses Relationship Beta t-value P-value decision Conclusion
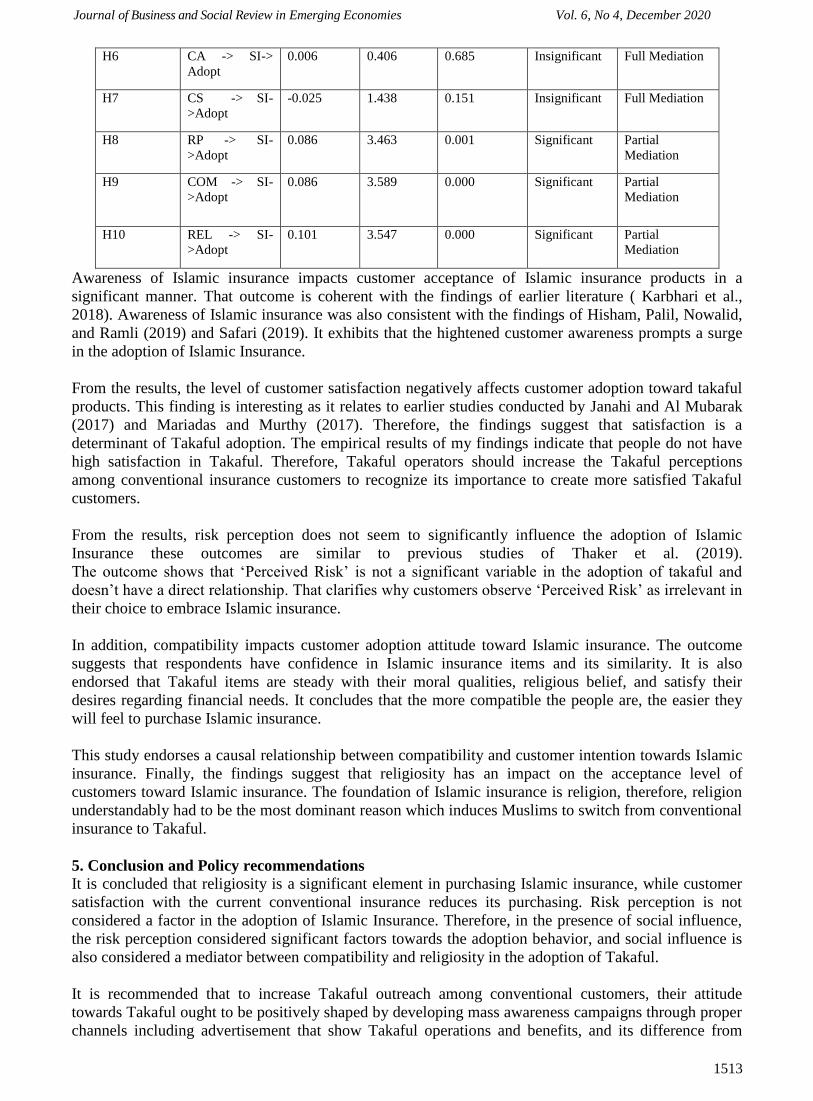
Journal of Business and Social Review in Emerging Economies Vol. 6, No 4, December 2020
1513
H6 CA -> SI->
Adopt
0.006 0.406 0.685 Insignificant Full Mediation
H7 CS -> SI-
>Adopt
-0.025 1.438 0.151 Insignificant Full Mediation
H8 RP -> SI-
>Adopt
0.086 3.463 0.001 Significant Partial
Mediation
H9 COM -> SI-
>Adopt
0.086 3.589 0.000 Significant Partial
Mediation
H10 REL -> SI-
>Adopt
0.101 3.547 0.000 Significant Partial
Mediation
Awareness of Islamic insurance impacts customer acceptance of Islamic insurance products in a
significant manner. That outcome is coherent with the findings of earlier literature ( Karbhari et al.,
2018). Awareness of Islamic insurance was also consistent with the findings of Hisham, Palil, Nowalid,
and Ramli (2019) and Safari (2019). It exhibits that the hightened customer awareness prompts a surge
in the adoption of Islamic Insurance.
From the results, the level of customer satisfaction negatively affects customer adoption toward takaful
products. This finding is interesting as it relates to earlier studies conducted by Janahi and Al Mubarak
(2017) and Mariadas and Murthy (2017). Therefore, the findings suggest that satisfaction is a
determinant of Takaful adoption. The empirical results of my findings indicate that people do not have
high satisfaction in Takaful. Therefore, Takaful operators should increase the Takaful perceptions
among conventional insurance customers to recognize its importance to create more satisfied Takaful
customers.
From the results, risk perception does not seem to significantly influence the adoption of Islamic
Insurance these outcomes are similar to previous studies of Thaker et al. (2019).
The outcome shows that ‘Perceived Risk’ is not a significant variable in the adoption of takaful and
doesn’t have a direct relationship. That clarifies why customers observe ‘Perceived Risk’ as irrelevant in
their choice to embrace Islamic insurance.
In addition, compatibility impacts customer adoption attitude toward Islamic insurance. The outcome
suggests that respondents have confidence in Islamic insurance items and its similarity. It is also
endorsed that Takaful items are steady with their moral qualities, religious belief, and satisfy their
desires regarding financial needs. It concludes that the more compatible the people are, the easier they
will feel to purchase Islamic insurance.
This study endorses a causal relationship between compatibility and customer intention towards Islamic
insurance. Finally, the findings suggest that religiosity has an impact on the acceptance level of
customers toward Islamic insurance. The foundation of Islamic insurance is religion, therefore, religion
understandably had to be the most dominant reason which induces Muslims to switch from conventional
insurance to Takaful.
5. Conclusion and Policy recommendations
It is concluded that religiosity is a significant element in purchasing Islamic insurance, while customer
satisfaction with the current conventional insurance reduces its purchasing. Risk perception is not
considered a factor in the adoption of Islamic Insurance. Therefore, in the presence of social influence,
the risk perception considered significant factors towards the adoption behavior, and social influence is
also considered a mediator between compatibility and religiosity in the adoption of Takaful.
It is recommended that to increase Takaful outreach among conventional customers, their attitude
towards Takaful ought to be positively shaped by developing mass awareness campaigns through proper
channels including advertisement that show Takaful operations and benefits, and its difference from
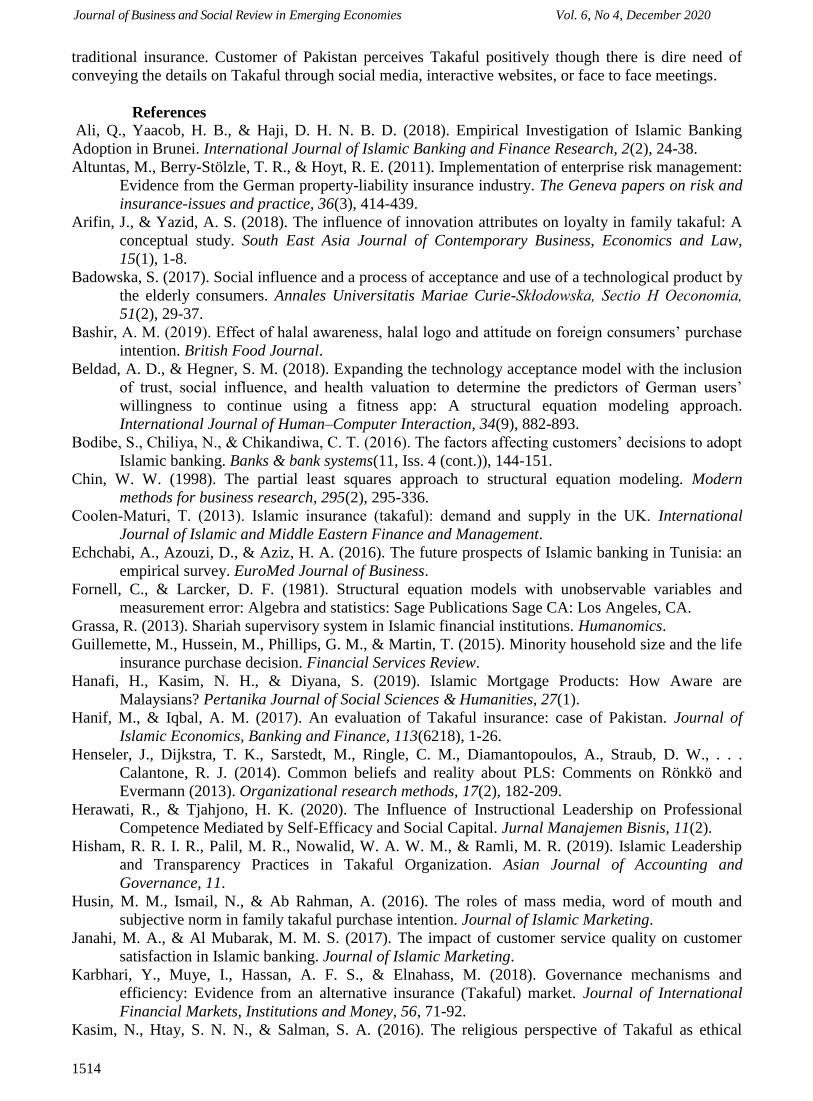
Journal of Business and Social Review in Emerging Economies Vol. 6, No 4, December 2020
1514
traditional insurance. Customer of Pakistan perceives Takaful positively though there is dire need of
conveying the details on Takaful through social media, interactive websites, or face to face meetings.
References
Ali, Q., Yaacob, H. B., & Haji, D. H. N. B. D. (2018). Empirical Investigation of Islamic Banking
Adoption in Brunei. International Journal of Islamic Banking and Finance Research, 2(2), 24-38.
Altuntas, M., Berry-Stölzle, T. R., & Hoyt, R. E. (2011). Implementation of enterprise risk management:
Evidence from the German property-liability insurance industry. The Geneva papers on risk and
insurance-issues and practice, 36(3), 414-439.
Arifin, J., & Yazid, A. S. (2018). The influence of innovation attributes on loyalty in family takaful: A
conceptual study. South East Asia Journal of Contemporary Business, Economics and Law,
15(1), 1-8.
Badowska, S. (2017). Social influence and a process of acceptance and use of a technological product by
the elderly consumers. Annales Universitatis Mariae Curie-Skłodowska, Sectio H Oeconomia,
51(2), 29-37.
Bashir, A. M. (2019). Effect of halal awareness, halal logo and attitude on foreign consumers’ purchase
intention. British Food Journal.
Beldad, A. D., & Hegner, S. M. (2018). Expanding the technology acceptance model with the inclusion
of trust, social influence, and health valuation to determine the predictors of German users’
willingness to continue using a fitness app: A structural equation modeling approach.
International Journal of Human–Computer Interaction, 34(9), 882-893.
Bodibe, S., Chiliya, N., & Chikandiwa, C. T. (2016). The factors affecting customers’ decisions to adopt
Islamic banking. Banks & bank systems(11, Iss. 4 (cont.)), 144-151.
Chin, W. W. (1998). The partial least squares approach to structural equation modeling. Modern
methods for business research, 295(2), 295-336.
Coolen‐Maturi, T. (2013). Islamic insurance (takaful): demand and supply in the UK. International
Journal of Islamic and Middle Eastern Finance and Management.
Echchabi, A., Azouzi, D., & Aziz, H. A. (2016). The future prospects of Islamic banking in Tunisia: an
empirical survey. EuroMed Journal of Business.
Fornell, C., & Larcker, D. F. (1981). Structural equation models with unobservable variables and
measurement error: Algebra and statistics: Sage Publications Sage CA: Los Angeles, CA.
Grassa, R. (2013). Shariah supervisory system in Islamic financial institutions. Humanomics.
Guillemette, M., Hussein, M., Phillips, G. M., & Martin, T. (2015). Minority household size and the life
insurance purchase decision. Financial Services Review.
Hanafi, H., Kasim, N. H., & Diyana, S. (2019). Islamic Mortgage Products: How Aware are
Malaysians? Pertanika Journal of Social Sciences & Humanities, 27(1).
Hanif, M., & Iqbal, A. M. (2017). An evaluation of Takaful insurance: case of Pakistan. Journal of
Islamic Economics, Banking and Finance, 113(6218), 1-26.
Henseler, J., Dijkstra, T. K., Sarstedt, M., Ringle, C. M., Diamantopoulos, A., Straub, D. W., . . .
Calantone, R. J. (2014). Common beliefs and reality about PLS: Comments on Rönkkö and
Evermann (2013). Organizational research methods, 17(2), 182-209.
Herawati, R., & Tjahjono, H. K. (2020). The Influence of Instructional Leadership on Professional
Competence Mediated by Self-Efficacy and Social Capital. Jurnal Manajemen Bisnis, 11(2).
Hisham, R. R. I. R., Palil, M. R., Nowalid, W. A. W. M., & Ramli, M. R. (2019). Islamic Leadership
and Transparency Practices in Takaful Organization. Asian Journal of Accounting and
Governance, 11.
Husin, M. M., Ismail, N., & Ab Rahman, A. (2016). The roles of mass media, word of mouth and
subjective norm in family takaful purchase intention. Journal of Islamic Marketing.
Janahi, M. A., & Al Mubarak, M. M. S. (2017). The impact of customer service quality on customer
satisfaction in Islamic banking. Journal of Islamic Marketing.
Karbhari, Y., Muye, I., Hassan, A. F. S., & Elnahass, M. (2018). Governance mechanisms and
efficiency: Evidence from an alternative insurance (Takaful) market. Journal of International
Financial Markets, Institutions and Money, 56, 71-92.
Kasim, N., Htay, S. N. N., & Salman, S. A. (2016). The religious perspective of Takaful as ethical

Journal of Business and Social Review in Emerging Economies Vol. 6, No 4, December 2020
1515
insurance. Mediterranean Journal of Social Sciences, 7(4), 96.
Latip, M., Yahya, M., & Junaina, M. (2017). Factors Influencing Customer's Acceptance of Islamic
Banking Products and Services. Ikonomika, 2(1), 1-18.
Liu, P., & Yi, S.-p. (2017). The effects of extend compatibility and use context on NFC mobile payment
adoption intention Advances in Human Factors and System Interactions (pp. 57-68): Springer.
Mariadas, P. A., & Murthy, U. (2017). Factors Influencing the Adoption of Islamic Banking in
Malaysia. International Journal of Business and Management, 12(11), 187-193.
Mathras, D., Cohen, A. B., Mandel, N., & Mick, D. G. (2016). The effects of religion on consumer
behavior: A conceptual framework and research agenda. Journal of Consumer Psychology,
26(2), 298-311.
Morrison, S. (2014). Shariah boards and the corporate governance of Islamic banks in the United
Kingdom. Journal of Islamic Economics, Banking and Finance, 113(3250), 1-14.
Naicker, V., & Van Der Merwe, D. B. (2018). Managers’ perception of mobile technology adoption in
the Life Insurance industry. Information Technology & People.
Abdullah, A., & Abd Rahman, S. (2018). Knowledge And Application Of Islamic Financial Planning
Among Small And Medium Enterprises Halal Operators In Peninsular Of Malaysia. Journal of
Business Innovation, 2(1), 14-24.
Obeid, H., & Kaabachi, S. (2016). Empirical investigation into customer adoption of Islamic banking
services in Tunisia. Journal of Applied Business Research (JABR), 32(4), 1243-1256.
Outreville, J. F. (2018). Culture and Life Insurance Ownership: Is It an Issue? Journal of Insurance
Issues, 41(2), 168-192.
Safari, M. (2019). A Conceptual Model to Explain Key Factors Affecting Islamic Banking Acceptance
Among Banks and Financial Services’ Customers. South Asian Journal of Marketing &
Management Research, 9(7), 13-29.
Schmidt, A. P. (2019). The impact of cognitive style, consumer demographics and cultural values on the
acceptance of Islamic insurance products among American consumers. International Journal of
Bank Marketing.
Seah, C. L., Tan, Y. X., Ong, K. Y., Lim, C. H., & Choong, J. B. (2017). Factors that affect non-Muslim
customers preference against Islamic deposit products in Malaysia. UTAR.
Siala, H. (2013). Religious influences on consumers' high-involvement purchasing decisions. Journal of
services marketing.
Sidharta, E. A., Mentari, S., Wafaretta, V., & Nuraini, U. (2017). Attitude and perception towards Sharia
insurance product. International Journal of Business and Commerce, 6(5), 11-23.
Souiden, N., & Jabeur, Y. (2015). The impact of Islamic beliefs on consumers’ attitudes and purchase
intentions of life insurance. International Journal of Bank Marketing.
Tamer Asaad, D. (2016). Antecedents of Channel Choice in Business-To-Business Professional
Services: Focus on the Insurance Sector. Journal of Marketing Management, 4(2), 35-48.
Thaker, M. A. B. M. T., Pitchay, A. B. A., Thaker, H. B. M. T., & Amin, M. F. B. (2019). Factors
influencing consumers’ adoption of Islamic mobile banking services in Malaysia. Journal of
Islamic Marketing.
Zakaria, Z., Azmi, N. M., Hassan, N., Salleh, W. A., Tajuddin, M., Sallem, N., & Noor, J. M. M. (2016).
The intention to purchase life insurance: A case study of staff in public universities. Procedia
Economics and Finance, 37(16), 358-365.

Journal of Business and Social Review in Emerging Economies Vol. 6, No 4, December 2020
1516

Journal of Business and Social Review in Emerging Economies Vol. 6, No 4, December 2020
1517
Volume and Issues Obtainable at Center for Sustainability Research and Consultancy
Journal of Business and Social Review in Emerging Economies ISSN: 2519-089X (E): 2519-0326
Volume 6: No. 4, December 2020
Journal homepage: www.publishing.globalcsrc.org/jbsee
Measuring Pakistan’s Legislative Preparedness against COVID-19: A Critical Study
of Newly Promulgated Law
1Jibran Jamshed, 2Ammara Mujtaba, 3Muhammad Waqas Javed, 4Syed Wajdan Rafay Bukhari 1Assistant Professor, Department of Law, Islamia University of Bahawalpur, Pakistan
[email protected] 2Lecturer, Bahria University Islamabad, Pakistan, [email protected]
3Lecturer, School of Law, Quaid-i-Azam University, Islamabad, Pakistan, [email protected] 4Lecturer, University Law College, University of Sargodha, Pakistan, [email protected]
ARTICLE DETAILS ABSTRACT History Revised format: November 2020 Available Online: December 2020
Background: Since December 2019, the COVID-19 pandemic
has challenged the international community on health and
legislative fronts. The widespread disease needs an effective
response from the health-care system as well as the legislative
framework. Pakistan is facing a challenge from the under-
developed health-care system as well as a lack of awareness
about the available laws to deal with the issue. Awareness about
the relevant laws is a precursor to the establishment of rule of
law. This study will doctrinally analyse the national laws of
Pakistan to make the response more effective. The awareness
about the relevant laws will supplement the healthcare response
against the pandemic of COVID-19. Since Pakistan is a
federation and healthcare is a provincial subject, therefore the
study limits itself to the laws of Punjab, the largest populated
province of Pakistan. Objectives: This study will analyse the
available healthcare laws to deal with the recent outbreak of
COVID-19. The focus will remain on the doctrinal measurement
of the effectiveness of The Punjab Infectious Diseases
(Prevention and Control) Act 2020 (PIDA) vis-à-vis already
existing laws. It will also highlight the salient features of the
PIDA 2020 along with its effectiveness to deal with the current
pandemic. Method: The study benefits from documentary
analysis of legal documents. The method is nearer to the
doctrinal research method in law. The study will shape itself into
two parts. First will be lax lata that will ascertain what is the
relevant healthcare law to deal with infectious diseases like
COVID-19. The next step will be lax ferenda where the study
will propose how it can become more effective to deal with the
issue. The research will opt black letter approach. Conclusion:
This study finds that the adoption of PIDA 2020 is in spirit with
dealing with the pandemic of the COID-19. The law has shown
positive trends in protecting the population from the widespread
impact of the diseases. The World Health Organization has
appreciated Pakistan’s methods and strategies against the first
wave of the COVID-19 with reference to response in Punjab, the
largest province of Pakistan..
Keywords Legislative Preparedness,
COVID-19, Promulgated Law,
Pakistan
JEL Classification
M10, M12
Journal of Business and Social Review in Emerging Economies Vol. 6, No 4, December 2020
1518
© 2020 Center for Sustainability Research and Consultancy Pakistan
under a Creative Commons Attribution-NonCommercial-ShareAlike
4.0
Corresponding author’s email address: [email protected]
Recommended citation: Jamshed, J., Mujtaba, A., Javed, M. W., & Bukhari, S. W. R. (2020).
Measuring Pakistan’s Legislative Preparedness against COVID-19: A Critical Study of Newly
Promulgated Law. Journal of Business and Social Review in Emerging Economies, 6(4), 1517-1524
1. Introduction
The outbreak of the COVID-19 pandemic has been an unprecedented challenge for the global economy,
health, and rule of law. On 30 January 2020, The World Health Organization (WHO) declared the
COVID-19 outbreak as “Sixth Public Health Emergency Services (SPHEC)”(Bilgin et al., 2020). The
deadly disease originated from Mainland China after the report of the first cases from Wuhan City of
China in Hubei Province in December 2019. The disease was named as Severe Acute respiratory
syndrome coronavirus 2 (SAR-Co V-2) for the reason of leading to severe respiratory infections and
pneumonia (She J. et al., 2020). The root of the infection is often argued; however, it is believed to start
from the local seafood market in Wuhan and it got transmitted to the visitors. This initial endemic turned
into a global pandemic in a very short period (Zu ZY et al., 2019; Millan, 2020).
The COVID-19 which is more commonly known as Coronavirus spread at a rapid pace all over the
world from China. This new virus is related to Severe Acute Respiratory Syndrome (SARS) and Middle
East Respiratory Syndrome (MERS). The severity and effects of this deadly virus are varying and
different in each country and each region (Tang, 2000). It is also interesting to note that this is not the
first outbreak of Coronavirus. SARS-Co V (Severe Acute Respiratory Syndrome Coronavirus) and
MERS-Co V) Middle East Respiratory Syndrome Coronavirus outbreak was the previous coronavirus
outbreaks (Zhou, 2020).
On 26 February 2020, the first case of COVID-19 has been confirmed by the Government of Pakistan in
Provincial Capital Province Sindh i.e. Karachi. On the same day, another case was confirmed in
Islamabad, Federal Capital, by the Federal Ministry of Health (Ali et al., 2020). Within 15 days, after the
first case was confirmed, Coronavirus spread rapidly, and the total number of COVID-19 cases reached
20 in different parts of the country. All the reported cases have travel histories from Iran, Syria, and the
UK (Waris et al., 2020). On 12 February 2020, the National Action Plan for Preparedness & Response to
Corona Virus Disease Pakistan was presented by the Ministry of National Health Services. The aim was
to control the spread of disease and strengthen the Pakistan and its society for effective and swift
response against COVID-19 (Waris et al., 2020).
Apart from preventive measures and scientific research, the states have started taking legislative
measures to curtail the spread of the deadly virus. Effective legislation and its implementation have been
significant for the containment of COVID-19. Many developing countries have outdated laws regarding
infectious diseases before the advent of COVID-19. To beef up its response against the outbreak, Punjab
and other provinces of Pakistan have introduced laws to stop the mass outspread of the virus.
2. Methodology
As mentioned in the summary above, the study benefits from documentary analysis techniques. The
legal issues need analysis vis-à-vis primary and secondary sources of laws. While primary sources with
context to Pakistan, a Common Law country, are legislations and case laws. For these reasons, the
fundamental primary sources or documents remain legislations such as The Punjab Epidemic Diseases
Act 1958 (PEDA 1958), Pakistan Penal Code 1860 (PPC 1860), The Punjab Infections Diseases
(Prevention and Control) Ordinance 2020 (PIDA 2020). The secondary sources used are books, research
articles, and data published by the Government and Non-Government Organization.
As the documentary analysis technique is close to doctrinal research methods in legal research, where a
researcher examines an issue based on already existing doctrine, the study uses black-letter approach.

Journal of Business and Social Review in Emerging Economies Vol. 6, No 4, December 2020
1519
The study will be desk-based to analyse the effectiveness of laws dealing with infectious diseases
including the outbreak of the COVID-19, the effectiveness of laws, and what can be possibly done to
make them more effective.
3. Objectives of the Study
The followings are the main objectives this study aims to achieve.
1- Awareness of the law is significant for creating the rule of law in society. Therefore, this study
will create awareness about the legal framework in Punjab, Pakistan to control the infectious
disease with special reference to the COVID-19.
2- To critically examine and analyze the effectiveness of the Punjab Infectious Diseases (Prevention
and Control) Act 2020 which deals with COVID-19 and other infectious diseases in the Province
of Punjab
3- To compare this new law with the previous legislation dealing with COVID-19
4- To suggest how to enforce the laws effectively.
4. Background
Almost half of the population of Pakistan resides in Punjab, a densely populated province of Pakistan
(Pakistan Bureau of Statistics, 2020). The COVID-19 has challenged the government of Punjab at
economic, healthcare, and administrative levels. With the highest population density in Pakistan, the
possibility of a larger impact o the COVID-19 was on the cards. To deal with the issue, there was an
urgent need to promulgate a new and effective law to curtail the outspread of the COVID-19. Before the
spread of COVID-19, The Punjab Epidemic Diseases Act 1958 primarily dealt with the control of
infectious diseases including the COVID-19. Being an outdated law, it was not effective and hence
Government of Punjab decided to repeal that law and promulgated The Punjab Infectious Diseases
(Prevention and Control) Ordinance 2020 to deal with modern challenges posed by the COVID-19. On
11 August 2020, the provincial assembly adopted the Punjab Infectious Diseases (Prevention and
Control) Act 2020 (PIDA 2020).
To build the context, this study will explore the limitations of the repealed Punjab Epidemic Diseases
Act 1958.
4.1 The Framework of the Punjab Epidemic Diseases Act of 1958 (PEDA 1958)
The legislative framework for controlling infectious diseases was adopted during the year 1958. The law
provided the government to take certain measures to stop the spread of infectious diseases. In this
regard, PEDA 1958 aimed to consolidate the laws relating to the prevention of the spread of dangerous
epidemic diseases in Punjab Province as provided in the preamble of PEDA 1958. Section 2 of the act
empowered the government, if threatened with outbreak of any dangerous epidemic disease, it may to
adopt “measures and by public notice prescribe such temporary regulations to be observed by the public
or any person or class of persons as it shall deem necessary to prevent the outbreak of such disease or
the spread” (S.2, PEDA 1958).
This law empowered the Provincial Government to take all necessary steps when there is a danger of an
epidemic disease outbreak. According to that law, the Provincial Government is empowered to inspect
any person who is suspected of being infected with any such disease and the person can also be
segregated in any hospital temporarily. The District Coordination Officer (DCO) was given power by
this act to exercise all powers on behalf of the Provincial Government. Although it was also clarified
that all such powers delegated by the Provincial Government shall be subject to such restriction,
limitations, and conditions, as specified by the Provincial Government spread (S.2, PEDA 1958).
According to section 3 of the PED Act 1958, “any person disobeying any regulation or order made
under this act shall be deemed to have committed an offense punishable under section 188 of the
Pakistan Penal Code”. Section 188 of the Pakistan Penal Code describes the punishment for
disobedience to order duly promulgated by a public servant. anyone who violates the section 188 of
Pakistan Penal Code, “be punished with simple imprisonment for a term which may extend to one month
or with a fine which may extend to six hundred rupees, or with both: and if any such disobedience
causes or tends to cause danger to human life, health or safety or causes or tends to cause a riot or affray,
Journal of Business and Social Review in Emerging Economies Vol. 6, No 4, December 2020
1520
shall be punished with imprisonment of either description for a term which may extend to six months, or
with fine which may extend to three thousand rupees or with both” (S.188, PPC 1860).
PEDA 1958 was brief legislation that contains only 4 sections and it was not ready to deal with the
multi-facet challenges posed by the COVID-19. It only contains general provisions regarding the powers
of the provincial government to take some actions against the spread of infectious disease. There were
no details, specifications, procedures, and specialized bodies provided in that act to deal with serious
threats like COVID-19. The Act provides insignificant punishment for those who violate it hence fail to
create effective deterrence. It was not capable to deal effectively with the infections diseased like
COVID-19 and that is the reason it was repealed by the Punjab Infectious Diseases (Prevention and
Control) Act 2020.
4.2 The Domain and Scope of Punjab Infectious Diseases (Prevention and Control) Act 2020
To deal with the outbreak of the COVID-19 effectively, PIDA 2020 was promulgated on 27th March
2020. According to the preamble of PIDA 2020, the law is passed to provide for the prevention and
control of infectious diseases in the Punjab and matters related to it. Although the COVID-19 is not
mentioned anywhere in the preamble or the Ordinance, yet it was promulgated to control specifically the
spread of Coronavirus in Punjab.
In the beginning, this law defines some important designations like Potentially Infectious Person,
Director General Health, Secretary, and Notified Medical Officer. According to section 2 (g) of PIDA
2020, the “Potentially Infectious Person” as a “person who is suspected to be infected or contaminated
with an infectious disease; or is a risk that such person might spread, infect or contaminate other persons
with an infectious disease; or has arrived from or through an area affected by an infectious disease
within fourteen days or such other period as may be specified by the secretary immediately preceding
the date of his arrival”. The period of 14 days is specifically mentioned in this definition which makes it
clear that the immediate concern of this law is to combat COVID-19.
In this law, the secretary and Director General Health are given special roles with specific powers. The
Director-General Health is the Director General Health Services, Punjab (S.2b, PEDA 2020), and
Secretary is defined as Secretary to the Government, Primary and Secondary Healthcare Department
(S.2j, PEDA 2020). Notified Medical Officer is a medical officer notified for this Act by the Secretary
(S.2j, PEDA 2020). In simple words, he is the Doctor who will have very important duties and powers in
relation to this Law. According to 3(a) of PEDA 2020, “The Secretary may with the approval of Chief
Minister, by notification in the Official Gazette, declare that the incidence of transmission of infectious
diseases poses a serious and imminent threat to public health in the whole or any part of Punjab”. The
same section also provides that the secretary after approval of the Chief Minister can revoke a
declaration made by him. It also binds the secretary to get advice from Director General Health
regarding the declaration or revocation of Disease along with at least two eminent epidemiologists
appointed by the Chief Minister. Under this, the secretary is empowered to impose a duty upon all
registered medical practitioners in Punjab to treat cases of infection or contamination. it means the
Government can impose duties in case of infection emergency on any doctor/medical practitioner
weather Private or Government. Similarly, the Secretary is empowered to declare any medical facility in
Punjab to be a treatment center for specific infectious diseases whether private or government. “A
registered medical practitioner shall include a registered medical practitioner, not in employment of
Government, and the term health facility shall be deemed to include a clinic, hospital, diagnostic
laboratory, and any other facility engaged in the provision of health services and not owned, financed,
managed or run by the Government” (S.4, PEDA 2020).Section 7 of PIDA 2020, empowers the
Director-General Health to “issue direction prohibiting or imposing one or more requirements or
restrictions in relation to the holding of an event or gathering for a specific period”. Director-General
Health can restrict the specific gathering or event concerning the number of people etc. He can impose
these restrictions on the owner or occupier of premises for an event, organizers of the event, or another
person who is holding such an event.
Journal of Business and Social Review in Emerging Economies Vol. 6, No 4, December 2020
1521
Section 8 of PIDA 2020 stated that The Director General is also empowered “to issue directions
prohibiting or imposing one of more requirements or restrictions in relation to the entry into, exit from
or location of persons in premises for specific period”. This power is given to the DG Health in order to
contain the infection if it has already spread into specific areas. A specific place can be sealed and its
entry and exit points are restricted for a specific period. Similarly, Deputy Commissioner of the
concerned area may on the advice of the secretary, issue directions prohibiting or imposing requirements
or restriction in relation to the entry into, exit from, or location of the person, goods, vehicles, vessels,
and other means of transportation in any area for a specific period. It is important to note that Smart
Lockdowns by the Government of Pakistan during the COVID-19 pandemic are imposed under the
above-mentioned sections. This ordinance makes it obligatory for the potentially infectious person to
move and remain in a specific place for a specific time. According to the Act, “A notified medical
officer may, after having informed the potentially infectious person of the reasons for doing so, direct
such person to proceed to a specified place that is suitable for screening and assessment and remains
there for a specific period”. If a potential infection person refuses to follow the advice of a Medical
officer, the person can be moved to that specific place by the Police through the concerned Head of the
District Police Officer. He can be moved to that specific place for forty-eight hours for screening and
assessment in normal circumstances. A notified Medical officer may “impose upon a potential infectious
person one or more screening requirements to assess the level of risk of infection or contaminating to
others and carry out such assessment”. According to section 11 of PIDA, “the potentially infectious
person is bound to answer every question related to his health and travel history. He is also bound to
produce any document with may be required in assessing his health, to allow personal examination like
measurement of body temperature and other physical conditions, and to give biological sample by an
appropriate mean”.
The Notified Medical Officer plays a key role in this law. He is entrusted with many important duties
and given many powers to fulfill his duties effectively. According to section 12 of PIDA 2020, Where
after the screening and assessment, the potentially infectious person found to be infected or
contaminated, the notified Medical Officer may require such a person.
To undertake further screening and assessment
Be retained at a specific place for a specific period
Be retained at a specific place in isolation
Restrict his movements or travel including travels within and inside Province
Restrict his activities including work or business
Restrict his contact with other persons
This section provides the period of restriction up to 14 days under normal circumstances. The medical
officer can direct the Police Officer to enforce the directions.
Although notified Medical Officer has given many powers under this law yet there are some restrictions,
pre-conditions, and manners provided in this law for the exercise of this power by the notified Medical
Officers and Police Officers. According to section 14 of PIDA 2020, “It is the duty of every person who
knows or believes or has reason to know or believe, that a person under his care, supervision, or control
is suffering from an infectious disease or is contaminated, to report such case to the notified medical
officer immediately”. Hence this law made it compulsory for all residents of Punjab Province to provide
information to the Government regarding any person who might be infected so that authorities can make
proper arrangements for the containment of infection.
According to section 17 of the Act, “a person commits an offense if he fails without reasonable excuse
to comply with any direction, reasonable instruction, duty, requirement, or restriction imposed upon him
under the Ordinance”.The punishment provided is, “A first-time offender shall, under this section, be
punished with imprisonment for a term not exceeding two months or a fine not exceeding fifty thousand
rupees or both. If a person is guilty of a repeat offense under this section, he can be punished with
imprisonment for a term not exceeding six months or a fine not exceeding one hundred thousand rupees
or both”.

Journal of Business and Social Review in Emerging Economies Vol. 6, No 4, December 2020
1522
This Ordinance also differentiates between the offense committed by an individual and a body corporate.
Where an offense under this section is committed by a body corporate, the fine for the first offense shall
not be less than fifty thousand rupees and not exceeding two hundred thousand rupees, and the fine for a
repeat offense shall be between one hundred thousand rupees (minimum) and three hundred thousand
rupees (maximum). There is a difference between the fine imposed on individuals and body corporate.
There are more strict punishments for those who violate certain sections of this Ordinance. If a
potentially infectious person fails to comply with the duties imposed on him by Medical Officer or
provides false information to the medical officer or obstructs a person who is exercising the powers
conferred on him under this law than he is liable for strict punishments. According to section 18, “a
person guilty of first offence be punished with imprisonment for a term not exceeding three months or a
fine not exceeding fifty thousand rupees or both, and a person guilty of a repeat offence be punished
with imprisonment for a term not exceeding one year or fine not exceeding one hundred thousand rupees
or both. The offence for running away from a place of retention has more serious consequences. Under
this law, if a person runs away or attempts to run away while being moved to or kept at a place under
this law, the first offence is punished with imprisonment for a term not exceeding six months or a fine
not exceeding fifty thousand rupees or both, repeat offence be punished with imprisonment for a term
not exceeding six months or a fine not exceeding fifty thousand rupees or both”.
This comprehensive punishment provided in this law is one of its many positive aspects. The minimum
and maximum amount of fine are also provided in this law for different offences which means even a
court cannot impose any other amount of fine outside these limits. The limitation on the discretion of the
court is according to the modern standard of punishments and it not only curtails the arbitrary powers of
courts but also minimize the misuse of this law. A Magistrate of first-class is empowered to take
cognizance of or try an offence under this Ordinance. All the offences under this law shall be tried in
court in summary trials as provided in the Code of Criminal Procedure 1898. The Summary Procedure
provided in this Law for the offences makes it sure that courts can decide the matters in time.
4.3 Synergizing the PIDA 2020 by the Pakistan Penal Code 1860 regarding the Infectious Diseases
The laws dealing with the control of infectious diseases can be synergized by the relevant provisions in
the PPC 1860, federal legislation. The code is a substantive criminal law containing offences and their
punishments. Being a federal law, it is also enforceable in the Province of Punjab like all other provinces
of Pakistan. It contained some provisions which are related to the prevention of infectious diseases and
provide punishments for those who violate. For instance, the section 269 of PPC provides “that whoever
unlawfully or negligently does any act which is, and which he knows or has reason to believe to be,
likely to spread the infection of any disease dangerous to life, shall be punished with imprisonment of
either description for a term which may extend to six months or with fine or with both”. Section 270 of
PPC is about “the malignant act likely to spread infection of disease dangerous to life. Whoever
malignantly does any act which is, and which he knows or has reason to believe to be, likely to spread
the infection of any disease dangerous to life, shall be punished with imprisonment of either description
for a term which may extend to two years or with fine or with both”. In the next section i.e. 271 of PPC,
it is provided that, “whoever knowingly disobeys any rule made and promulgated by the Federal or any
Provincial Government for putting any vessel into a state of quarantine or for regulating the intercourse
of vessels in a state of quarantine with the shore or with other vessels, or for regulating the intercourse
between places where an infectious disease prevails and other places, shall be punished with
imprisonment of either description for a term which may extend to six months or with fine or with both”.
Although these sections provide punishment for those who violate the law by spreading infectious
diseases, yet the punishments provided in these sections are not strict enough to create any strong
deterrence. These sections are not repealed and still part of the PPC, but they are seldom used
practically. Dealing with the control of the outbreak of COVID-19 under the criminal laws, in Punjab,
can positively help in effectively controlling the contact of the affected person with the population. In
the most populated province of Pakistan, the adoption of new laws and effective enforcement
mechanism has played a positive role in curtailing the gatherings those may lead to a widespread
outbreak of the virus in the society.

Journal of Business and Social Review in Emerging Economies Vol. 6, No 4, December 2020
1523
5. Discussion & Analysis
The legislative measures taken by the Government of Punjab has been effective in controlling the spread
of the virus by authorizing the local authorities to stop all sort of public gatherings. Moreover, these laws
further empower the authorities to take all necessary actions in relation to the protection of healthcare.
However, these legislative measures have attracted criticism form economic and human rights
perspectives. The PIDA 2020 empowers the local authorities to control all economic and mobilization
restrictions that may affect the fundamental rights of the citizens. There are some strong arguments
against the lockdowns and economic shutdown in a developing country like Pakistan where economic
indicators are already down. But the policy choice for Government is the same as it is around the world
for most of the Governments i.e. simple trade-off between saving lives and saving the economy.
During the pandemic, the government authorities are facing the issue to balance strict control measures
and protection of economic activities as well as human rights. The choice has always been the protection
of life by imposing strict social distancing laws and shut down the economic activities although the
severity and magnitude of these shutdowns vary from country to country. In Pakistan, the government
imposed the strict lockdown during March 2020, but later switched to the smart lockdown and resumed
the economic activities. The application of PIDA 2020 has been effective in controlling the spread of the
virus. A recent study on the Scandinavian countries suggests that most of the economic contraction is
caused by the virus itself and occurs regardless of the social distancing laws (Sheridan et al., 2020). This
study also suggests that the social distancing laws, which empower the Governments to impose
lockdowns and shut down economic activities, are often considered contrary to the economy and human
rights. However, these measures are necessary to save lives, a basic human right. In such circumstances
the newly promulgated PIDA 2020 is justifiable and it already has shown the positive results because the
number of infections in Punjab reduced dramatically after its implementation.
6. Conclusion
The study has tried to achieve the goals of awareness and analysis of local laws dealing with the control
of the infectious disease. The study explains and interprets the newly promulgated Punjab Infectious
Diseases (Prevention and Control) Act 2020. The legislation has been useful in introducing an effective
substantive law that enjoys an advanced enforcement mechanism. The law has been useful in controlling
the spread of the virus in Punjab by restricting public gathering. Former laws controlling the infectious
diseases did not give authorities space to deal with the novel challenges posed by the COVID-19. Since
the legislation is new, therefore, the study examines the salient features and important characteristics of
the PIDA 2020 to create awareness about the law, an essential part of establishing rule of law in society.
The study finds that the adoption of the PIDA 2020 has balanced the legislative, enforcement, and
policymaking of Punjab government with the protection of related human rights. A further study may
investigate the issue using the qualitative research methods by conducting the interviews of relevant
stakeholders such as enforcement agencies, district administration, market (traders) unions, and public
References
Ali, I., Shah, S. A., & Siddiqui, N. (2020). Pakistan confirms first two cases of coronavirus, govt says
“no need to panic”. DAWN. COM, February, 26.
Bilgin, S., Kurtkulagi, O., Kahveci, G. B., Duman, T. T., & Tel, B. M. A. (2020). Millennium pandemic:
a review of coronavirus disease (COVID-19). Experimental Biomedical Research, 3(2), 117-125.
COVID-19 live dashboard (Pakistan): national institute of health Islamabad. https://www.nih.org.pk/novel-
coranavirus-2019-ncov/. Accessed 5th April 2020.
Deng S‐Q, Peng H‐J. Characteristics of and public health responses to the Coronavirus disease 2019
outbreak in China. J Clin Med. 2020;9(2):575.
Gostin, Lawrence O., Eric A. Friedman, and Sarah A. Wetter. "Responding to COVID‐19: How to
Navigate a Public Health Emergency Legally and Ethically." Hastings Center Report 50, no. 2
(2020): 8-12.
Millán-Oñate, J., Rodriguez-Morales, A. J., Camacho-Moreno, G., Mendoza-Ramírez, H., Rodríguez-
Sabogal, I. A., & Álvarez-Moreno, C. (2020). A new emerging zoonotic virus of concern: the
2019 novel Coronavirus (SARS CoV-2). Infectio, 24(3), 187-192.
Journal of Business and Social Review in Emerging Economies Vol. 6, No 4, December 2020
1524
Pakistan Bureau of Statistics,
https://web.archive.org/web/20171015113737/http://www.pbscensus.gov.pk/
Punjab Epidemic Diseases Act 1958
Pakistan Penal Code 1860
Punjab Infectious Diseases (Prevention and Control) Ordinance 2020
She, J., Jiang, J., Ye, L., Hu, L., Bai, C., & Song, Y. (2020). 2019 novel coronavirus of pneumonia in
Wuhan, China: emerging attack and management strategies. Clinical and translational
medicine, 9(1), 1-7.
Sheridan, A., Andersen, A. L., Hansen, E. T., & Johannesen, N. (2020). Social distancing laws cause
only small losses of economic activity during the COVID-19 pandemic in
Scandinavia. Proceedings of the National Academy of Sciences, 117(34), 20468-20473.
Tang, H. March 2000. Winners and Losers of EU Integration, Policy Issues for Central and Eastern
Europe.
Waris, A., Khan, A. U., Ali, M., Ali, A., & Baset, A. (2020). COVID-19 outbreak: current scenario of
Pakistan. New Microbes and New Infections, 100681.
Zu, Z. Y., Jiang, M. D., Xu, P. P., Chen, W., Ni, Q. Q., Lu, G. M., & Zhang, L. J. (2020). Coronavirus
disease 2019 (COVID-19): a perspective from China. Radiology, 200490.
Zhou, Peng, Xing-Lou Yang, Xian-Guang Wang, Ben Hu, Lei Zhang, Wei Zhang, Hao-Rui Si et al. "A
pneumonia outbreak associated with a new coronavirus of probable bat origin." nature 579, no.
7798 (2020): 270-273.
Journal of Business and Social Review in Emerging Economies Vol. 6, No 4, December 2020
1525
Volume and Issues Obtainable at Center for Sustainability Research and Consultancy
Journal of Business and Social Review in Emerging Economies ISSN: 2519-089X (E): 2519-0326
Volume 6: No. 4, December 2020
Journal homepage: www.publishing.globalcsrc.org/jbsee
Socio-Economic and Political Impacts of Vocational Trainings on Tribal
Community of Pakistan
1Sami Ullah, 2Zilakat Khan Malik 1PhD Scholar, University of Peshawar, Peshawar, Pakistan, [email protected]
2Professor of Economics, University of Peshawar, Peshawar, Pakistan, [email protected]
ARTICLE DETAILS ABSTRACT History Revised format: November 2020 Available Online: December 2020
This study was conducted to evaluate the role of vocational training
imparted by the Federally Administered Tribal Area’s Development
Authority (FATA-DA) in the socio-economic and political
development of the tribal community in Pakistan. The survey was
initiated in the year 2018 in FATA where 400 males in the age group
(16-35 years) were selected for data collection through a
disproportionate simple random sampling procedure. Cross
Tabulation Analysis was conducted using SPSS. The result indicates
that vocational training imparted by FATA-DA contributed very less
to the socio-economic and political development of FATA’s youth.
Among 13 indicators, the impact on only 02 indicators was found
significant for the treatment group. This study concluded that
vocational training does have a contribution to the socio-economic
development of youth but in the case of FATA-DA sponsored
training, the result was not desirable. This might be due to certain
quality issues that must be taken into consideration during initiating a
vocational training program for the socio-economic and political
development of youth.
© 2020 Center for Sustainability Research and Consultancy Pakistan under
a Creative Commons Attribution-NonCommercial-ShareAlike 4.0
Keywords Vocational Training, Socio-
Economic, Tribal, FATA,
Youth
JEL Classification
M10, M12
Corresponding author’s email address: [email protected]
Recommended citation: Ullah, S. & Malik, Z. K. (2020). Socio-Economic and Political Impacts of
Vocational Trainings on Tribal Community of Pakistan. Journal of Business and Social Review in
Emerging Economies, 6(4), 1525-1541
1. Introduction
Investment in human capital is a highly focused phenomenon in the modern economy. Economists and
human capital theorists believe that vocational training is an essential means for the socio-economic
development of individuals and nations. Human capital development means to increase the earning
potential of the human being. It focuses on obtaining knowledge, skills, competencies, and personality
traits through education and training (Mincer, 1958; Becker, 1975). Vocational training is considered an
indispensable way for the development of human capital. Vocational training means the attainment of
knowledge and practical skills related to various occupations in different sectors of economic life.
Vocational training increases the chances of employment and earnings which breed considerable
economic and social benefits for human beings. It has an indirect effect on the decline in crime rate,
decrease in mental illness, improvement in health condition, better schooling of children, and social
cohesion. In this regard, it has been observed that skilling youth with vocational training has a

Journal of Business and Social Review in Emerging Economies Vol. 6, No 4, December 2020
1526
significant effect on the socialization of the youth community (Managing Vocational Training Systems:
A Handbook for Senior Administrators, 2001). Excessive academic literature presents that vocational
training has the potential of bringing positive changes in individual wellbeing (Maclean & Wilson,
2009).
From a social viewpoint, vocational training is a tool for fighting against individual poverty by
promoting equal opportunities in terms of labor, social context, and citizenship (Patankar, 2019).
Research conducted by the European Centre for the Development of Vocational Training (CEDEFOP)
has shown that technical and vocational training can foster confidence and self-esteem in individuals,
contributing to their engagement with families and society (Career Space Consortium, 2001). Technical
and vocational skills development can play a significant role in the transformation of rural communities
by making people empowered to make decisions and take action to improve their social, cultural,
economic, and political lives in a way that result in a broad positive impact on society as a whole
(Catherine & Jecob, 2014).
It enhances a wide range of so-called ‘life skills’ such as communication, motivation, teamwork,
responsibility, violence prevention, and training in reproductive health which shows that technical and
vocational training is increasingly accepted as a way of enhancing youth capability sets (Debrah, 2013).
In most countries of the world, technical and vocational training schemes have been started to make
underprivileged citizens believe that they have a bright future. Prominently, these schemes have
provided a means of reducing the psychological pressure of socio-political and economic trauma that is
bedeviling most of the underdeveloped countries. It has been observed that if the youth of a country
deprived of vocational and technical skills, there are the tendencies of becoming caught up in the web of
depression, hopelessness, juvenile delinquency, social aggression, and economic dependency. These
observations, as mentioned above, have been the greatest cause of prostitution, thuggery, and
hooliganism for most of the youth community who remained deprived of such vocational training
programs (Elebute & Mashood, 2016).
Federally Administered Tribal Areas (FATA) is the most lagging and underdeveloped community in
Pakistan. It is spread over an area of 27,220 square km, with a total population of 5001676 (Pakistan
Bureau of Statistics, 2017). 97.1% of people in FATA are living in rural areas. Two-third of the
population (73%) is living under the poverty line with multidimensional Poverty Index (MPI) 0.337 and
poverty incidence 73.7%. FATA consistently ranks lowest in the country in terms of human
development indicators like literacy, healthcare access, potable water access, employment rates, average
income, etc.
The political system remained weak in FATA for ages. After the independence of the sub-continent, the
Government of Pakistan also failed to devise a better policy for tribal Pashtuns and kept them deprived
of representation and political rights till 1997. Due to the lack of education in FATA, most of its
community is engaged in agriculture, livestock rearing, non-technical labor, and local businesses (Khan,
2017). The overall literacy rate is 33.3% which is far less than the national average (58%).
Unemployment in FATA is higher than the national average and other provinces of the country. The
highest rate of unemployment (10.8%) prevails in youth fall in the age bracket 15-24 years. This age
group remained the main resource pool for militant recruitment in the near past. The majority of women
(74.4%) are married by the age of 18 (BoS, 2015).
FATA-Development Authority was established in the year 2004 as a specialized body for prompt
development in FATA. FATA-DA started imparting technical education and vocational training to both
male and female youth to make them developed. From the year 2006 till 2018, FATA-DA imparted
vocational training to more than 50 thousand youth in 70 different vocational trades. This study was,
therefore, conducted as an evaluation study to investigate the socio-economic and political impacts of
the vocational training of FATA-DA on FATA’s youth. This study is a first-ever evaluation study on the
impacts of the said program. Results confirmed the limited impacts of the vocational training program of
FATA-DA on the socialization and political development of FATA’s youth. However, the impacts were
Journal of Business and Social Review in Emerging Economies Vol. 6, No 4, December 2020
1527
significant on two parameters, i.e. “poverty reduction and life-long learning”. In a study from Portugal,
it was reported that the impacts of vocational training on the social development of communities are not
certain as community transformations generally take a longer time (CEDFOP, 2011).
This study adds valuable stuff to the existing literature in the sense that the vocational training program
of FATA-DA has not been evaluated yet. Neither its economic contribution nor social contribution to
the target group has been studied so far.
Furthermore, limited literature exists on the contribution of vocational training to the social
advancement of the target community. Social development indicators taken in this study are less studied
in the past. A cross-tabulation analysis was conducted to compare the outcome for treatment and control
groups that may not be used in previous studies on the same topic. This study also concluded that if
quality issues exist in any vocational training program, the program will not deliver its objectives well
like in the case of FATA-DA vocational training.
2. Literature Review
2.1 Human Capital Theory
Schultz (1961) introduced the concept of human capital for the first time. He mentioned that human
capital development is an important factor for the nation’s growth. He further stated that human capital
is entrenched in individuals in the form of knowledge and skills. Human capital is closely linked with
training, practical skills attainment, knowledge, and abilities that facilitate the formation of personal,
economic, and social wellbeing (Garavan et al., 2001).
Vocational training and attainment of vocational skills are considered essential means of human capital
development. It has both direct and indirect economic and social effects on individuals and society.
Technical and vocational training is considered by experts a specific instrument for human capital
development that can play a significant role in promoting socio-economic progress (Wallenborn, 2010).
Vocational training result in economic gain with the impression of an increase in earnings that lead to a
decline in the incidence of crimes in youth, change in fertility behavior, hinder population growth,
reduce poverty and environmental pollution, etc. (Sweetland, 1996; McMahon, 1998). Vocational
training and skills development have both formal and informal effects on an individual’s personal
growth and development and income (Mincer, 1958).
Human capital development not only took into consideration the rate of monitory return but also
consider social values and quality of life created due to investment in education and training (Bensen,
1978). Vocational training develops specific human capital by creating job-specific skills that make the
workers more suitable and productive (Becker, 1975).
Vocational skill training increases productivity, innovation and growth, and bridge poverty reduction
among vulnerable communities. In a study, it was found that vocational skills development improves the
quality and diversity of output and improves the lives and health of marginalized rural communities by
increasing their earnings (Atchoarena & Gasperini, 2003).
2.2 New Growth Theory
According to the New Growth Theory, the economy can grow well by increasing the intellectual
abilities and skills of human beings rather than increasing physical capital (Cortright, 2001). New
Growth Theory advocates increasing return on investment rather than decreasing return as advocated by
traditional growth theories. It claims that human capital allows the economy to grow at a constant rate as
it has no diminishing marginal utility (Romer, 1994). This theory postulate that increased skills and
knowledge of producing more with limited resources will impact the standard of living of people
positively (Grossman & Helpman, 1994).
2.3 Socio-Economic Impacts of Vocational Training The measurement of social benefits of vocational training is much difficult than the economic benefits as

Journal of Business and Social Review in Emerging Economies Vol. 6, No 4, December 2020
1528
social benefits tend to be more diffuse. Both social and economic benefits are strongly interconnected.
For example, participation in vocational training can generate high employment which leads to a
reduction in income inequality, an increase in life satisfaction, and then a stable society. Less social
benefits have been reported so far, owing to the fact of lesser research in this area (Career Space
Consortium, 2001).
Furthermore, vocational and general education to a large extent substituted for each other in literature
which makes it difficult to measure the unique social benefits of vocational training.
The association between human capital development and social awareness is based on a close inter-
relationship that results in socio-economic and political development (Grubb & Lazerson, 2005).
Investment in vocational training and skills development is beneficial for individuals, society, and a
nation. The return on investment for an individual is a better career path and earnings and is global
competitiveness and economic development for nations and societies (Alam, 2008). Effective utilization
of vocational skills training inculcates essential skills and capabilities in youth that would help them
become self-confident. In a study on technical and vocational training, Akyeampong pointed out that
these trainings are not important only for their economic contribution but also for their positive role in
social, cultural, and political development (Akyempong, 2002).
Vocational skills development reduces the economic dependency of family members on each other. In a
study, it was concluded that adult learning caused improved earnings, decreased poverty, provided
health benefits and brought considerable returns for one’s children, etc. (Sabates, 2008). The association
between adult learning and community welfare contents from a social capital perspective which argues
that adult learning promotes an active lifestyle that helps preserve community resources (Merriam &
Kee, 2014). Unemployment among youth is a major economic and social problem with consequences of
skill shortages in the economy, underutilization of human capital, poverty among youth, a potential
increase in drug use, and criminal behavior (Dettmann & Günther, 2013; Meager, 2009). In a study on
data taken from the National Child Development Study (NCDS), it was revealed that adult learning
(Vocational and Leisure Courses) has a significant positive effect on the socialization of adults. The
effect was observed in social and health outcomes, i.e. reduction in the use of alcohol and smoking,
increase in physical exercise, and other related measures of life satisfaction (Feinstein & Hammond,
2004).
In another study by Feinstein, the effects of higher and vocational education were found less robust on
depression and obesity (Feinstein, 2002). Self-esteem, gaining self-competencies, social integration,
gaining a sense of hope and purpose are direct outcomes of education that result in better health
conditions and wellbeing (Hammond, 2002). Self-esteem and confidence associated with vocational
courses had also been reported by Dawe (2004). In another study, Hammond mentioned that failure to
succeed in learning could have long-lasting negative effects on learners (Hammond, 2004). National
Centre for Vocational Education Research (NCVER) surveyed the indigenous Australians’ community
and reported that 90% of the respondents had gained self-confidence and communicated better to people
as a result of undertaking vocational courses (Butler et al. forthcoming).
The demands of employment for vocational training and increased skills put pressure on the individual
to delay marriage and avoid parenthood at the earlier stages (Blackwell & Baynner, 2002). Durkheim
(1956) wrote that developing a “sense of belonging to a larger society” should be the fundamental aim of
formal (Institute based) and non-formal (Vocational) education regardless of the setting in which it
emerges. Vocational education and training have immeasurable gains to a community as a whole. For
instance, after controlling for one’s income, the amount of money and time devoted to charity and civic
engagements respectively is directly associated with employment and earning and indirectly with job
skills and training (Wolfe & Haveman, 1997).
Goel, (2010) stated that vocational skills and knowledge have a considerable effect on the social

Journal of Business and Social Review in Emerging Economies Vol. 6, No 4, December 2020
1529
development of any nation thus plays an essential role in the economic development of a country. It was
concluded in a study that more skilled workers volunteered twice as many hours as low skilled personnel
and donated 50% more to charities. This good feature of human capital development through vocational
training may lead to social cohesion and integrity (Hodgkinson & Weitzman, 1998). More skilled and
educated people contribute to the formation of a good society in many ways. They make conversant
choices during voting, add positively to political stability and democratization, care more for human
rights, and are more trusted by others (Wolfe & Haveman, 2002).
Van de Werfhorst (2016) concluded that vocational education graduates had a lower level of political
interest and engagement as compared to general education graduates. He further suggested that this type
of rigid differentiation of educational institutions may form a threat to democratic equality. Vocational
training raises job skills and earning potential of the individual, which results in a decline in the crime
rate. Crime becomes less attractive for the highly skilled and employed workforce. In a study conducted
in England, it was found that the ultimate benefit from vocational education and skills training are
growth in lifelong learning, increase in self-confidence, social cohesion, and active citizenship of
individuals. It also results in the extension of friendship and social networks (Schuller, Brassett-Gandy,
Green, Hammond & Preston, 2002). The effect of skills development on individual workers and
organizations ends in an increase in social awareness that eventually leads to social development (Beach,
2009).
Vocational education and technical skills training are the most important factors for economic growth
and social inclusion in a country (Nilsson, 2010). The findings of a study in Southern Punjab revealed
that foreign funds play a significant role in boosting vocational training which is then a cause to alleviate
individual poverty. It was also concluded that vocational training generates viable human capital for
socio-economic development (Hayyat & Chughtai, 2016). In a study in Nigeria, it was supposed that the
acquisition of technical and vocational skills improve the socio-economic condition of people and helps
to transform men into a self-reliant and economically stable person. It helps to reduce the incidence of
militancy, restlessness, kidnapping, and other social immoralities among youth (Isaac & Ph, 2014).
Typical short term vocational training programs have significant effects on individual performance
levels and self-confidence. However, no absolute evidence is available to determine its impacts on most
social behavior, delinquency, employment, and lifestyles (Knox & Chicago, 1981).
The existing literature has shown an indirect relationship between vocational education and socio-
economic wellbeing through intermediary variables, i.e. income and earnings, etc. Variation in this
relationship also depends on the socio-cultural context of rural/indigenous communities as well as on the
learning environment (Stanwick, Ong & Karmel, 2006). More importantly, social contact, friendship,
solidarity, family concepts, sense of belonging and supportive environment, etc. are factors affecting the
socialization of individuals during the training process.
2.4 Vocational Training Program of FATA-DA FATA-DA being a specialized agency for prompt development in infrastructure and human capital,
started interventions in FATA in the year 2006. Human capital development is the priority sector of
FATA-DA was focused, and a huge amount of development budget (Approx. Rs. 2.8 billion) was
allocated to vocational training. More than 52000 males and females in age 16-35 were trained in more
than 70 different market-oriented trades. 90% of training was of six months duration each. 10% were of
either three months or twelve months duration. The program focused on more than 70 different
vocational trades listed in Table 1 below.

Journal of Business and Social Review in Emerging Economies Vol. 6, No 4, December 2020
1530
Table 1 List of Trades
Auto Electrician
Auto Mechanics
Basic Electrician
Building Painter
Carpet Weaving
Office Automation & Management
Computer (Hardware)
Cutting, carving, polishing of precious and semi-
precious stones
Domestic Electrician
Dress making and tailoring techniques
Electrician
Fabric and Garments Productions
Gemology & Carving
Gemology & Faceting
General Electrician
Heavy Machinery Operator
Industrial Electrician
Laboratory Assistant
Land Surveying (With Auto CAD)
Marble and Granite mining, cutting, polishing
Light Engineering
Leather Goods
Masonry
Material Testing
Computer Networking Technician
Telecom Technician
Control Room Operator
Advanced Auto Mechanic (EFI/CNG)
Construction Safety
ACUDUCT Insulator
Tile Mason
Plaster Mason
Block Mason
Fall Ceiling
Scarf Folder
Football Stitching
Leather Upper Cutting Stitching
Mobile Phone Repairing
Plumbing
Quantity surveyor
Refrigeration/Air-conditioning Repairing Sheet
Metal Works
Steel Fixer
Surveyor Civil
Turner Machinist
TV/ Radio Repairing
Wood Technology
X-Ray Machine Operator
Call Centre Operator
Stitching Machine Operator Training
Fan Development & Parts Manufacturing
Conventional Machinery Operator Course
Electrical equipment and electric fan testing course
Fan Assembly Course
Auto CAD 2D, 3D
CAD/CAM course
Computerized Numerical Control (CNC)
Mechanic-II (Engine)
Mechanic-II (Chasis)
Optical Fiber Cable Jointing
Motor Winding Stitching Machine Operator
Training
Fan Development & Parts Manufacturing
Conventional Machinery Operator Course
Electrical equipment and electric fan testing course
Fan Assembly Course
Auto CAD 2D, 3D
CAD/CAM course
Machinery Course
Mechanic-II (Engine)
Mechanic-II (Chasis)
Lasting Computerized Numerical Control
Optical Fiber Cable Jointing
Source; FATA-DA, 2019
Students were recruited through open competition within agency quota and were invited through an
advertisement in daily news as well as through the official website of FATA-DA. Basic eligibility
criteria were candidates having FATA Domicile and fall in the age group of 16-35 years. Education
requirements varied from the middle to matric in different categories. According to a report of FATA-
DA Skill section, 95-96% of trainees completed their training. After 1-2 years of training completion, it
was observed that 36% of trainees were engaged in any category of job, while 24% were found
employed in the category of training (Relevant employment) (Ullah & Malik, 2020). An unpublished
study conducted by the M&E Section of FATA-DA also showed 25-27% relevant employment for male
youth of FATA after training completion.
3. Research Methodology
3.1 Study Area
The study was conducted in an extremely backward area of the country (FATA) where most of the
people (73%) living under the poverty line. It is a general perception that people of FATA are socially
underdeveloped that can easily be seen from their involvement in anti-state and anti-social activities.
People lack vocational skills hence restricted to subsistent farming for their livelihood.
3.2 Study Population & Sample Size The population for the treatment group was 23296 males who completed at least one course from
FATA-DA from 2006 till June 2016. The population for the control group was male group age 16-35

Journal of Business and Social Review in Emerging Economies Vol. 6, No 4, December 2020
1531
years from FATA who didn’t participate in the training program. The sample size of 200 each was taken
from both population groups through disproportionate stratified random sampling. This type of sampling
was done to avoid underrepresentation of one stratum; as both groups were of uneven nature. The
sample size was selected by using the following Slovin’s formula. The use of Slovin's formula allows
the researcher to sample the population with the desired degree of accuracy (Ellen, 2013).
Sample size (SS) =
Where N= Target population from which sample to be drawn
a = Margin of error at 95% confidence level i.e. 100%-95% = 5%
3.3 Questioner Development and Survey Administration A well-structured questioner was developed by incorporating information on personal and family
parameters and questions on social development indicators. The questioner was developed by taking
help from other questioners administered in similar studies conducted earlier. The survey was given to
respondents at least 02 years after the training completion. The questioners were administered directly
by face to face interaction to gather information from respondents.
4. Research Design A cross-sectional research design was used for this study. This type of research data is collected at a
single point in time. The quantitative research methodology was adopted. The respondents were asked
questions on social changes brought about by vocational training. Likert scale was used for data analysis
in order to ensure the entire data sample is analyzed fairly. In order to compare the outcome for
treatment and control groups, data were analyzed through cross-tabulation in SPSS.
5. Results and Discussion
5.1 Descriptive Statistics (Demographic Information of the Respondents) Table 2 below summarizes the demographic differences of the treatment and the control group. Most of
the respondents from both groups fall in the age group 16-20 years. Most of the respondents are
unmarried. Maximum numbers of the respondents have education up to FA/FSc level. Fathers of most of
the respondents in the treatment group are illiterate while in the control group, they were having primary
level education. Fathers of most of the respondents were self-employed having their own businesses.
Most of the respondents in both groups were belonging to families having monthly income above Pak
Rs. 20,000. It was also noted that most of the families were living inside FATA. Most of the respondents
from the treatment group showed their family size of 9-12 members each, while in the case of the
control group, it was 6-8 members each. In both cases, maximum numbers of families were reported to
have a household head other than the respondent himself. When asked about the previous job position, a
maximum number of the respondents were having no job before starting the training with FATA-DA.
Table 2 Demographic information of respondents
Respondent Information Treatment Group Control Group
Frequency (%) Frequency (%)
Age of Respondent
16-20 93 46.5 123 61.5
21-25 78 39.0 57 28.5
26-30 25 12.5 14 7.0
31-35 4 2.0 6 3.0
Total 200 100.0 200 100.0
Marital Status
Unmarried 160 80.0 152 76.0
Married 40 20.0 48 24.0
Total 200 100.0 200 100.0
Respondents Education
Primary 4 2.0 3 1.5
Matric 42 21.0 60 30.0
FA/FSc 106 53.0 80 40.0
BA/BSc 33 16.5 42 21.0
MA/MSc 15 7.5 15 7.5
Total 200 100.0 200 100.0
Father Education Nil 91 45.5 47 23.5
Primary 42 21.0 70 35.0
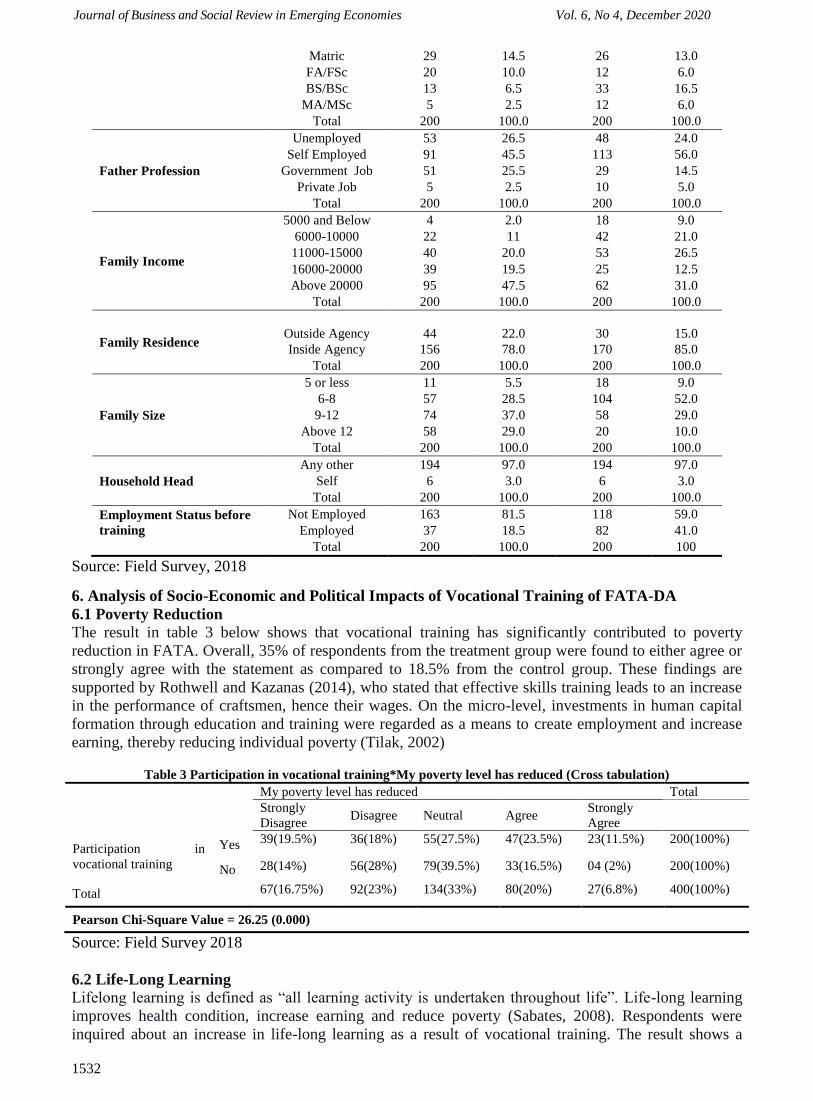
Journal of Business and Social Review in Emerging Economies Vol. 6, No 4, December 2020
1532
Matric 29 14.5 26 13.0
FA/FSc 20 10.0 12 6.0
BS/BSc 13 6.5 33 16.5
MA/MSc 5 2.5 12 6.0
Total 200 100.0 200 100.0
Father Profession
Unemployed 53 26.5 48 24.0
Self Employed 91 45.5 113 56.0
Government Job 51 25.5 29 14.5
Private Job 5 2.5 10 5.0
Total 200 100.0 200 100.0
Family Income
5000 and Below 4 2.0 18 9.0
6000-10000 22 11 42 21.0
11000-15000 40 20.0 53 26.5
16000-20000 39 19.5 25 12.5
Above 20000 95 47.5 62 31.0
Total 200 100.0 200 100.0
Family Residence
Outside Agency
44
22.0
30
15.0
Inside Agency 156 78.0 170 85.0
Total 200 100.0 200 100.0
Family Size
5 or less 11 5.5 18 9.0
6-8 57 28.5 104 52.0
9-12 74 37.0 58 29.0
Above 12 58 29.0 20 10.0
Total 200 100.0 200 100.0
Household Head
Any other 194 97.0 194 97.0
Self 6 3.0 6 3.0
Total 200 100.0 200 100.0
Employment Status before
training
Not Employed 163 81.5 118 59.0
Employed 37 18.5 82 41.0
Total 200 100.0 200 100
Source: Field Survey, 2018
6. Analysis of Socio-Economic and Political Impacts of Vocational Training of FATA-DA
6.1 Poverty Reduction
The result in table 3 below shows that vocational training has significantly contributed to poverty
reduction in FATA. Overall, 35% of respondents from the treatment group were found to either agree or
strongly agree with the statement as compared to 18.5% from the control group. These findings are
supported by Rothwell and Kazanas (2014), who stated that effective skills training leads to an increase
in the performance of craftsmen, hence their wages. On the micro-level, investments in human capital
formation through education and training were regarded as a means to create employment and increase
earning, thereby reducing individual poverty (Tilak, 2002)
Table 3 Participation in vocational training*My poverty level has reduced (Cross tabulation)
My poverty level has reduced Total
Strongly
Disagree Disagree Neutral Agree
Strongly
Agree
Participation in
vocational training
Yes 39(19.5%) 36(18%) 55(27.5%) 47(23.5%) 23(11.5%) 200(100%)
No 28(14%) 56(28%) 79(39.5%) 33(16.5%) 04 (2%) 200(100%)
Total 67(16.75%) 92(23%) 134(33%) 80(20%) 27(6.8%) 400(100%)
Pearson Chi-Square Value = 26.25 (0.000)
Source: Field Survey 2018
6.2 Life-Long Learning Lifelong learning is defined as “all learning activity is undertaken throughout life”. Life-long learning
improves health condition, increase earning and reduce poverty (Sabates, 2008). Respondents were
inquired about an increase in life-long learning as a result of vocational training. The result shows a

Journal of Business and Social Review in Emerging Economies Vol. 6, No 4, December 2020
1533
significant improvement in the life-learning of respondents. 62% of the respondents from the treatment
group were found to either agree or strongly agree with the statement as compared to 45% from the
control group. These findings are supported by Schuler et al. (2002) who in his study concluded that the
ultimate benefit from vocational education and skills training are growth in lifelong learning, increase in
self-confidence, social cohesion, and active citizenship of individuals. These findings also supported by
Wößmann (2008), who stated that TVET could improve the non-cognitive skills of low-skilled adults,
which further enhance their lifetime skill acquisition and learning.
Table 4 Participation in vocational training*My life-long learning has increased (Cross tabulation)
My life-long learning has increased Total
Strongly
Disagree Disagree Neutral Agree
Strongly
Agree
Participation in
vocational
training
Yes 13(6.5%) 21(10.5%) 42(21%) 85(42.5%) 39(19.5%) 200(100%)
No 10 (5%) 37(18.5%) 63(31.5%) 75(37.5%) 15 (7.5%) 200(100%)
Total 23(5.8%) 58(14.5%) 105(26.2%) 160(40%) 54(13.5%) 400(100%)
Pearson Chi-Square Value = 20.29 (0.000)
Source: Field Survey, 2018
6.3 Voluntary Communal Activities and Social Engagements The respondents were asked if they were actively participating in voluntary communal activities after
training completion. The result shows no significant effect of participation in vocational training in that
respect. 52.5% of respondents from the treatment group were found either strongly disagree or disagree
with the statement as compared to only 10.5% from the control group. 56.5% of respondents from the
control group were found either agree or strongly agree as compared to 32.5% from the treatment group.
These findings are inconsistent with the findings of Schuler et al. (2002) and (Wolfe & Haveman, 1997).
The relationship of vocational training with social change also depends on the socio-cultural context of
the indigenous communities as well as on the learning environment (Stanwick, Ong & Karmel, 2006). In
the case of vocational training of FATA-DA, the non-significant effect may also be due to not suitable
learning environment or due to socio-cultural issues.
Table 5 Participation in vocational training*Participation in voluntary communal and social activities
Participation in voluntary communal and social activities
Total Strongly
Disagree Disagree Neutral Agree
Strongly
Agree
Participation in
vocational training
Yes 28(14%) 77(38.5%) 30(15%) 52(26%) 13(6.5%) 200(100%)
No 08(4%) 13(6.5%) 79(39.5%) 67(33.5%) 46 (23%) 200(100%)
Total 36(9%) 90(22.5%) 109(27.2%) 119(30%) 59(14.8%) 400(100%)
Pearson Chi-Square Value = 90.471 (0.000)
Source: Field survey, 2018
6.4 Avoiding Risky Health Behaviors Respondents were investigated for the subject effect after completion of their training. The result
showed no significant effect of vocational training of FATA-DA on building a sense of avoiding risky
health behavior. 42% of the respondents from the treatment group were found either agree or strongly
agree with the statement as compared to 87% from the control group. These findings are in line with the
findings of Stanwick (2006), who concluded that higher level qualifications were closely associated with
better health outcomes and healthy life behavior, while lower-level vocational qualifications were not. In
another study by Feinstein, the effects of higher and vocational education were found less robust on
depression and obesity (Feinstein, 2002).
Table 6 Participation in vocational training*Caring more about risky health behaviors
Caring more about risky health behaviors Total
Strongly Disagree Neutral Agree Strongly

Journal of Business and Social Review in Emerging Economies Vol. 6, No 4, December 2020
1534
Disagree Agree
Participation in
vocational
training
Yes 13(6.5%) 13(6.5%) 90(45%) 58(29%) 26(13%) 200(100%)
No 04(2%) 09(4.5%) 13(6.5%) 89(44.5%) 85(42.5%) 200(100%)
Total 17(4.2%) 22(5.5%) 103(25.8%) 147(36.8%) 111(28%) 400(100%)
Pearson Chi-Square Value = 1.01 (0.000)
Source: Field survey, 2017
6.5 Perception of Male Youth towards Female Education FATA’s women had been deprived of their educational rights for ages. The male being a dominant
group in FATA does not allow their female counterpart to get an education. It is evident from the
existing female literacy rate in FATA, which is 3%, and drops out ratio, which is 70.6%. Positive change
in perception of male toward female education was the expected outcome of the vocational training
program. The result shows no significant effect of participation in vocational training. 62.5% of the
respondents from the treatment group were found either agree or strongly agree with the statement as
compared to 82% from the control group. On the other side, 23% of the respondents from the treatment
group were found either strongly disagree or disagree as compared to 10.5% from the control group.
According to Bennett (2018), general education is more effective than technical and vocational in
bringing social change and awareness among the masses. Furthermore, it can be stated that the learning
environment and short duration of the training would not have been enough for bringing positive change
in the perception of male youth towards female education.
Table 7 Participation in vocational training*Favor of higher education for female of FATA
Favor higher education for female of FATA
Total Strongly
Disagree Disagree Neutral Agree
Strongly
Agree
Participation in
vocational training
Yes 20(10%) 26(13%) 31(15.5%) 77(38.5%) 46(23%) 200(100%)
No 18(9%) 03(1.5%) 14(7%) 87(43.5%) 78(39%) 200(100%)
Total 38(9.5%) 29(7.2%) 45(11.2%) 164(41%) 124(31%) 400(100%)
Pearson Chi-Square Value = 33.63 (0.000)
Source: Field survey, 2018
6.6 Appreciating FATA’s Women for Doing a Job In the FATA context, in a male-dominated society, women are rarely allowed to work outside their
homes. The respondents were inquired for the same reason and found that participation in vocational
training of FATA has no significant effect on changing the mentality of males towards working women.
33.5% of the respondents from the treatment group were found either disagree or strongly disagree with
the statement as compared to 22% from the control group. These findings are supported by Bennett
(2018), who stated that vocational education is less effective in bringing social changes and awareness
among the masses. Furthermore, quality training and learning environments also matter.
Table 8 Participation in vocational training*Appreciate women of FATA for doing job
Appreciate women of FATA for doing job outside homes
Total Strongly
Disagree Disagree Neutral Agree
Strongly
Agree
Participation in
vocational
training
Yes 49(24.5%) 18(9%) 63(31.5%) 41(20.5%) 29(14.5%) 200(100%)
No 26(13%) 18(9%) 45(22.5%) 66(33%) 45(22.5%) 200(100%)
Total 75(18.8%) 36(9%) 108(27%) 107(27.8) 74(18.5%) 400(100%)
Pearson Chi-Square Value = 19.35 (0.000)
Source: Field survey, 2018
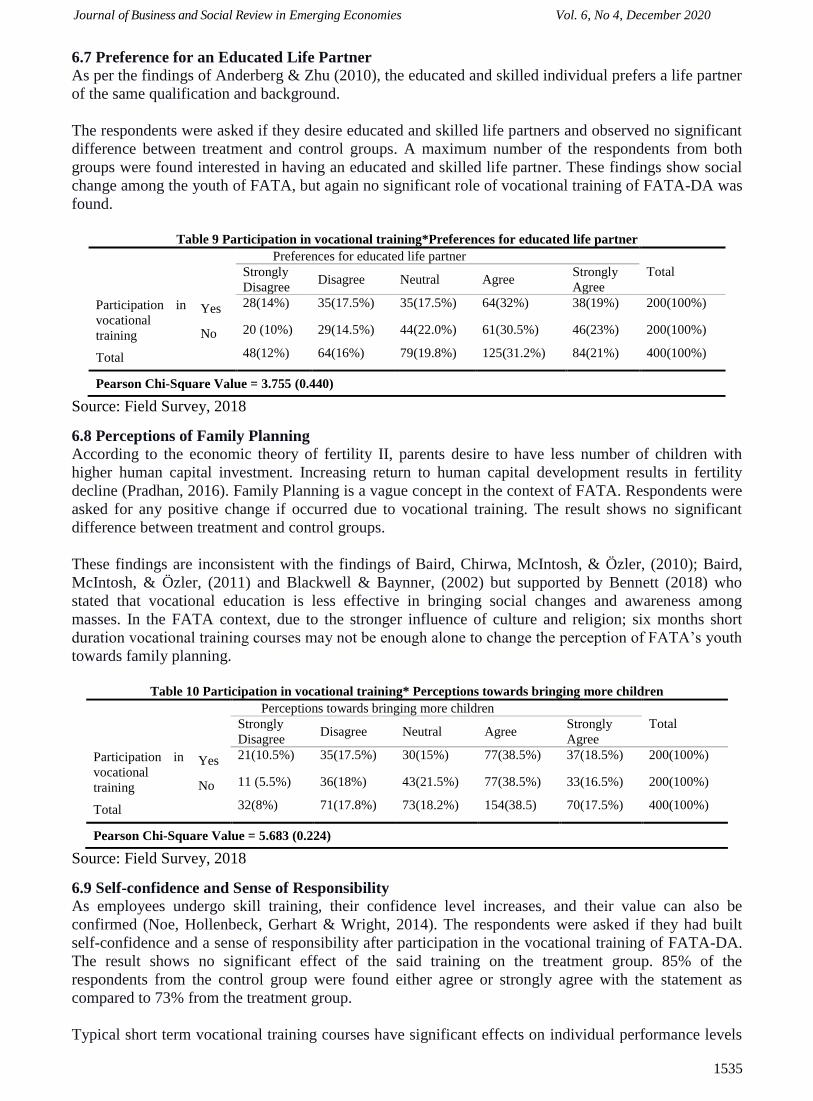
Journal of Business and Social Review in Emerging Economies Vol. 6, No 4, December 2020
1535
6.7 Preference for an Educated Life Partner As per the findings of Anderberg & Zhu (2010), the educated and skilled individual prefers a life partner
of the same qualification and background.
The respondents were asked if they desire educated and skilled life partners and observed no significant
difference between treatment and control groups. A maximum number of the respondents from both
groups were found interested in having an educated and skilled life partner. These findings show social
change among the youth of FATA, but again no significant role of vocational training of FATA-DA was
found.
Table 9 Participation in vocational training*Preferences for educated life partner
Preferences for educated life partner
Total Strongly
Disagree Disagree Neutral Agree
Strongly
Agree
Participation in
vocational
training
Yes 28(14%) 35(17.5%) 35(17.5%) 64(32%) 38(19%) 200(100%)
No 20 (10%) 29(14.5%) 44(22.0%) 61(30.5%) 46(23%) 200(100%)
Total 48(12%) 64(16%) 79(19.8%) 125(31.2%) 84(21%) 400(100%)
Pearson Chi-Square Value = 3.755 (0.440)
Source: Field Survey, 2018
6.8 Perceptions of Family Planning According to the economic theory of fertility II, parents desire to have less number of children with
higher human capital investment. Increasing return to human capital development results in fertility
decline (Pradhan, 2016). Family Planning is a vague concept in the context of FATA. Respondents were
asked for any positive change if occurred due to vocational training. The result shows no significant
difference between treatment and control groups.
These findings are inconsistent with the findings of Baird, Chirwa, McIntosh, & Özler, (2010); Baird,
McIntosh, & Özler, (2011) and Blackwell & Baynner, (2002) but supported by Bennett (2018) who
stated that vocational education is less effective in bringing social changes and awareness among
masses. In the FATA context, due to the stronger influence of culture and religion; six months short
duration vocational training courses may not be enough alone to change the perception of FATA’s youth
towards family planning.
Table 10 Participation in vocational training* Perceptions towards bringing more children
Perceptions towards bringing more children
Total Strongly
Disagree Disagree Neutral Agree
Strongly
Agree
Participation in
vocational
training
Yes 21(10.5%) 35(17.5%) 30(15%) 77(38.5%) 37(18.5%) 200(100%)
No 11 (5.5%) 36(18%) 43(21.5%) 77(38.5%) 33(16.5%) 200(100%)
Total 32(8%) 71(17.8%) 73(18.2%) 154(38.5) 70(17.5%) 400(100%)
Pearson Chi-Square Value = 5.683 (0.224)
Source: Field Survey, 2018
6.9 Self-confidence and Sense of Responsibility As employees undergo skill training, their confidence level increases, and their value can also be
confirmed (Noe, Hollenbeck, Gerhart & Wright, 2014). The respondents were asked if they had built
self-confidence and a sense of responsibility after participation in the vocational training of FATA-DA.
The result shows no significant effect of the said training on the treatment group. 85% of the
respondents from the control group were found either agree or strongly agree with the statement as
compared to 73% from the treatment group.
Typical short term vocational training courses have significant effects on individual performance levels

Journal of Business and Social Review in Emerging Economies Vol. 6, No 4, December 2020
1536
and self-confidence (Knox & Chicago, 1981). In the case of FATA’s youth, respondents from the
control group didn’t participate in vocational training, but they might have continued their general
education that may have resulted in building more confidence and a sense of responsibility as compared
to vocational training graduates.
Table 11 Participation in vocational training* Feeling self-confidence and sense of responsibility
Feeling self-confidence and sense of responsibility
Total Strongly
Disagree Disagree Neutral Agree
Strongly
Agree
Participation in
vocational training
Yes 9(4.5%) 07(3.5%) 38(19%) 101(50.5%) 45(22.5%) 200(100%)
No 05(2.5%) 04(2%) 21(10.5%) 91(45.5%) 79(39.5%) 200(100%)
Total 32(8%) 11(2.8%) 59(14.8%) 192(48.0) 124(31%) 400(100%)
Pearson Chi-Square Value = 16.70 (0.002)
Source: Field survey, 2018
6.10 Financial Support of the Needy People Alms and charitable giving is an indirect beneficial effect of vocational training (McMahon, 1998). The
respondents were inquired if they have developed such type of kind behavior after participation in the
vocational training of FATA-DA.
The result shows no significant effect. Less number of the respondents from the treatment group, i.e.
45.5% were found either agree or strongly agree with the statement as compared to respondents from the
control group (87%). These findings are in contrast to the findings of Wolfe & Haveman, (1997). 64%
of graduates of the training program were still unemployed (Ullah & Malik, 2019). An unpublished
report of the M&E Section of FATA-DA showed 73-75% unemployment among graduates of the
vocational training program of FATA-DA.
Table 11 Participation in vocational training* Financial support of needy people in the community
Financial support of needy people in the community
Total Strongly
Disagree Disagree Neutral Agree
Strongly
Agree
Participation in
vocational
training
Yes 13(6.5%) 19(9.5%) 79(39.5%) 67(39.4%) 22(11%) 200(100%)
No 03(1.5%) 01(0.5%) 22(11%) 103(51.5%) 71(35.5%) 200(100%)
Total 16(4%) 20(5.0%) 101(25.2%) 170(42.5) 93(23.2%) 400(100%)
Pearson Chi-Square Value = 88.059 (.000)
Source: Field Survey, 2018
6.11 Participation in Politics
People of FATA due to certain discriminatory policies of government remained deprived and unaware
of their political rights in the past. The respondents were asked about their political participation after
training completion.
The result shows no significant contribution in this area. 62.5% of respondents from the treatment group
were found either agree or strongly agree as compared to 79.5% from the control group. These findings
are supported by the study of Van de Werfhorst (2016), where he concluded that vocational education
graduates had a lower level of political interest and engagement as compared to general education
graduates.
Table 12 Participation in vocational training*Participation in political engagements
Participation in political engagements Total
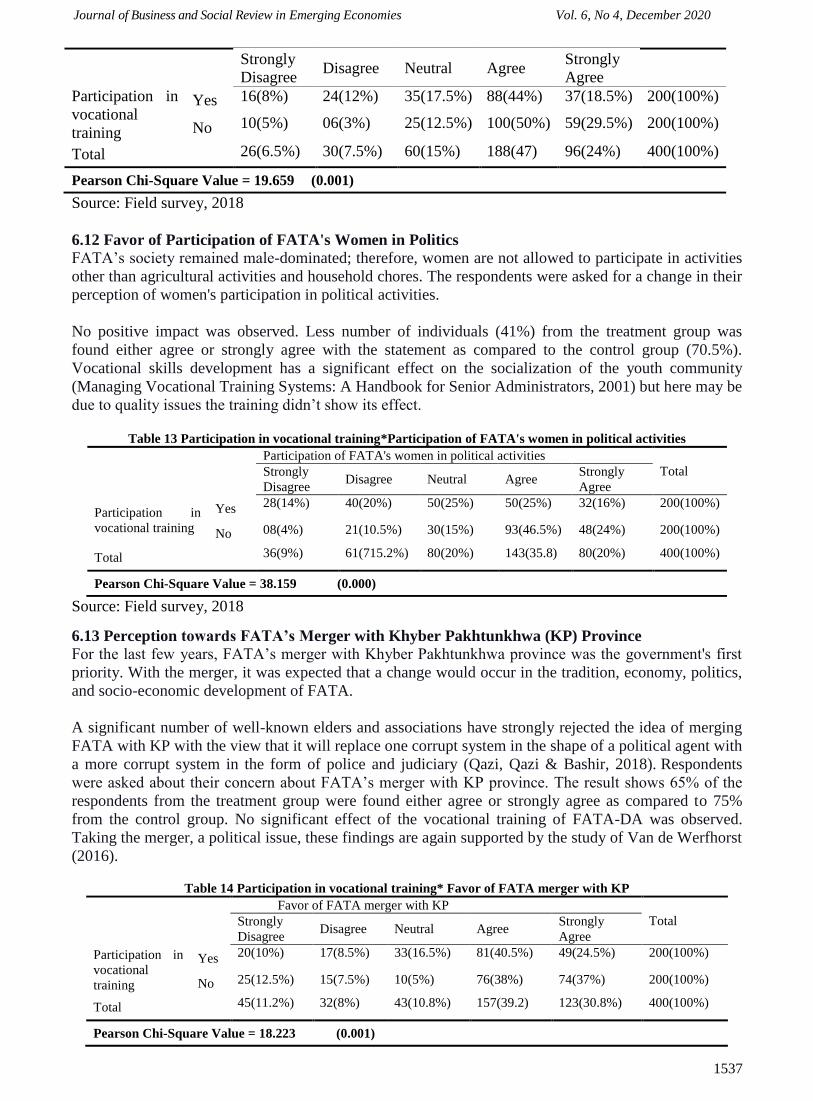
Journal of Business and Social Review in Emerging Economies Vol. 6, No 4, December 2020
1537
Strongly
Disagree Disagree Neutral Agree
Strongly
Agree
Participation in
vocational
training
Yes 16(8%) 24(12%) 35(17.5%) 88(44%) 37(18.5%) 200(100%)
No 10(5%) 06(3%) 25(12.5%) 100(50%) 59(29.5%) 200(100%)
Total 26(6.5%) 30(7.5%) 60(15%) 188(47) 96(24%) 400(100%)
Pearson Chi-Square Value = 19.659 (0.001)
Source: Field survey, 2018
6.12 Favor of Participation of FATA's Women in Politics FATA’s society remained male-dominated; therefore, women are not allowed to participate in activities
other than agricultural activities and household chores. The respondents were asked for a change in their
perception of women's participation in political activities.
No positive impact was observed. Less number of individuals (41%) from the treatment group was
found either agree or strongly agree with the statement as compared to the control group (70.5%).
Vocational skills development has a significant effect on the socialization of the youth community
(Managing Vocational Training Systems: A Handbook for Senior Administrators, 2001) but here may be
due to quality issues the training didn’t show its effect.
Table 13 Participation in vocational training*Participation of FATA's women in political activities
Participation of FATA's women in political activities
Total Strongly
Disagree Disagree Neutral Agree
Strongly
Agree
Participation in
vocational training
Yes 28(14%) 40(20%) 50(25%) 50(25%) 32(16%) 200(100%)
No 08(4%) 21(10.5%) 30(15%) 93(46.5%) 48(24%) 200(100%)
Total 36(9%) 61(715.2%) 80(20%) 143(35.8) 80(20%) 400(100%)
Pearson Chi-Square Value = 38.159 (0.000)
Source: Field survey, 2018
6.13 Perception towards FATA’s Merger with Khyber Pakhtunkhwa (KP) Province For the last few years, FATA’s merger with Khyber Pakhtunkhwa province was the government's first
priority. With the merger, it was expected that a change would occur in the tradition, economy, politics,
and socio-economic development of FATA.
A significant number of well-known elders and associations have strongly rejected the idea of merging
FATA with KP with the view that it will replace one corrupt system in the shape of a political agent with
a more corrupt system in the form of police and judiciary (Qazi, Qazi & Bashir, 2018). Respondents
were asked about their concern about FATA’s merger with KP province. The result shows 65% of the
respondents from the treatment group were found either agree or strongly agree as compared to 75%
from the control group. No significant effect of the vocational training of FATA-DA was observed.
Taking the merger, a political issue, these findings are again supported by the study of Van de Werfhorst
(2016).
Table 14 Participation in vocational training* Favor of FATA merger with KP
Favor of FATA merger with KP
Total Strongly
Disagree Disagree Neutral Agree
Strongly
Agree
Participation in
vocational
training
Yes 20(10%) 17(8.5%) 33(16.5%) 81(40.5%) 49(24.5%) 200(100%)
No 25(12.5%) 15(7.5%) 10(5%) 76(38%) 74(37%) 200(100%)
Total 45(11.2%) 32(8%) 43(10.8%) 157(39.2) 123(30.8%) 400(100%)
Pearson Chi-Square Value = 18.223 (0.001)
Journal of Business and Social Review in Emerging Economies Vol. 6, No 4, December 2020
1538
Source: Field survey, 2018
7. Conclusion This study concluded with the findings that vocational training of FATA-DA has limited impact on the
social development of FATA’s youth. Among 13 indicators of social change and development that were
focused on in this study, the positive impact was observed only on 02 indicators, i.e. reduction in
poverty level and an increase in lifelong learning.
Same responses were observed for both the treatment and control group on 02 indicators, i.e. preference
for an educated life partner and family planning. On 09 indicators of social change, i.e. participation in
voluntary communal activities, avoiding healthy risky behavior, perception towards the education of
female, appreciating women for doing jobs, self-confidence and sense of responsibility, financial support
of poor people, political participation, the favor of the participation of women in politics and perception
regarding FATA’s merger in KP province, the impact of vocational training of FATA-DA recorded were
recorded not significant.
Literature is deficient in studies focusing on the social impacts of vocational training. Most of the studies
have focused on the social impacts of general and higher education. Few studies showed, i.e. studies
conducted by Knox & Chicago (1981) and Van de Werfhorst (2016) etc. reported limited social impacts
of short-term vocational training.
As far as the FATA-DA vocational training is concerned; the researcher in another study on vocational
training of FATA-DA recorded that only 24% of training graduates got relevant employment after
training completion. As evident from the literature that the social impacts of vocational training up to a
maximum extent are indirect and depend on intermediary variables, i.e. income and employment, etc.
Less employment and minimum earning may have the leading causes of limited social impacts in this
case. It is recommended that quality parameters should be focused for maximum outcome. A course on
ethics, social and behavioral studies may also be included in the vocational training curriculum. It is also
recommended that the same study may be replicated again with bigger sample size.
8. Acknowledgement
The authors acknowledge the support of FATA-DA Officials in the provision of data and FATA’s youth
for their participation in the survey.
Funding Source
There are no funding sources for this research.
Competing Interest
The authors declare no competing interest.
Literature Cited
Akyempong, A.K. (2002), Vocationalization on secondary education in Ghana. Washington, DC:
World Bank.
Alam, G. (2008). The role of technical and vocational education in the national development of
Bangladesh. International Journal of Work-Integrated Learning, 9(1), 25.
Anderberg, D., & Zhu, Y. (2010). The effect of education on marital status and partner characteristics:
evidence from the UK.
Atchoarena, D., & Gasperini, L. (2003). Education for Rural Development towards New Policy
Responses. International Institute for Educational Planning (IIEP) UNESCO. 7-9 rue Eugene-
Delacroix, 75116 Paris, France.
Baird, S., Chirwa, E., McIntosh, C., & Özler, B. (2010). The short‐term impacts of a schooling
conditional cash transfer program on the sexual behaviour of young women. Health economics,
19(S1), 55-68.
Beach, J. M. (2009). A critique of human capital formation in the US and the economic returns to sub-

Journal of Business and Social Review in Emerging Economies Vol. 6, No 4, December 2020
1539
baccalaureate credentials. Educational Studies, 45(1), 24-38.
Ozler, B., McIntosh, C., & Baird, S. (2010). Cash or condition? Evidence from a randomized cash
transfer program. The World Bank.
Becker, G. S. (1975). Investment in human capital: effects on earnings. In Human Capital: A
Theoretical and Empirical Analysis, with Special Reference to Education, Second Edition (pp.
13-44). NBER.
Bennett, P. (2018). The heterogeneous effects of education on crime: Evidence from Danish
administrative twin data. Labour Economics, 52, 160-177.
Blackwell, L., & Baynner, J. (2002). Learning, Family Formation and Dissolution. Retrieved from
http://discovery.ucl.ac.uk/10014692/1/WBLResRep4.pdf.
BoS. (2015). FATA Development Indicators Household Survey (FDIHS) 2013-14. 120.
Career Space Consortium. (2001). Cedefop-European Centre for the Development of Vocational
Training (Eds.): Curriculum Development Guidelines. New ICT curricula for the 21st century:
designing tomorrow’s education.. Luxembourg: Office for Official Publications of the European
Communities.
h Cortright, J. C. (2001). New growth theory, new growth theory, technology and learning: Technology
and learning: A practitioner’s guide a practitioner’s guide. Reviews of economic development
literature and practice, (4).
Debrah, E. (2013). Alleviating poverty in Ghana: the case of livelihood empowerment against poverty
(LEAP). Africa Today, 59(4), 41-67.
Elebute, A., & Shagaya, O. M. (2016). Impact of vocational and technical education on livelihood
sustenance and economic development in Nigeria: the art workshop experience. International
Journal of Vocational and Technical Education Research, 2(2), 15-35.
Ellen, S. (2012). Slovin's formula sampling techniques.
Feinstein, L. (2002). Quantitative Estimates of the Social Benefits of Learning, 2: Health (Depression
and Obesity). Wider Benefits of Learning Research Report. Centre for Research on the Wider
Benefits of Learning, Institute of Education, 20 Bedford Way, London, WC1H 0AL, England,
United Kingdom (5 British pounds). Web site: http://www. learning benefits. net/..
Feinstein, L., & Hammond, C. (2004). The contribution of adult learning to health and social capital.
Oxford Review of Education, 30(2), 199-221.
Garavan, T. N., Morley, M., Gunnigle, P., & Collins, E. (2001). Human capital accumulation: the role of
human resource development. Journal of European industrial training.
Goel, V. P. (2013). Technical and vocational education and training system in India for sustainable
development. India Country Paper, 1-49.
Grossman, G. M., & Helpman, E. (1994). Endogenous innovation in the theory of growth. Journal of
Economic Perspectives, 8(1), 23-44.
Grubb, W. N., & Lazerson, M. (2005). Vocationalization in higher education: The triumph of the
education gospel. The Journal of Higher Education, 76(1), 1-25.
Hammond, C. (2002). What is it about education that makes us healthy? Exploring the education-health
connection. International Journal of Lifelong Education, 21(6), 551-571.
Hammond, C. (2004). Impacts of lifelong learning upon emotional resilience, psychological and mental
health: Fieldwork evidence. Oxford Review of Education, 30(4), 551-568.
Catherine, K., & Jacob, M. (2014). Vocational Skills Development for Youths in the Informal Sector of
the Economy in Africa. Journal of Business and Management, 15(6), 81-87.
Hayyat, A., & Chughtai, S. H. (2015). The impact of vocational training on Poverty Alleviation through
moderation role of foreign funds: Evidence from Southern Punjab. Management Studies and
Economic Systems, 54(2648), 1-15.
Hodgkinson, V. A., & Weitzman, M. S. (1990). Giving and volunteering in the United States.
Nwojiewho, D. I., & Chidinma, D. (2014). The Impacts of Vocational and Technical Education
Programmes on the Empowerment of Rural Dwellers in South-South, Nigeria. Journal of
Educational and Social Research, 4(3), 233.
Knox, G. W., University of Chicago, National Ctr for Assessment of Alternatives to Juvenile Justice
Processing, & United States of Amer. (1981). Vocational and Educational Upgrading for
Juvenile Delinquents: Community-based Programs and the Current" state of the Art". National

Journal of Business and Social Review in Emerging Economies Vol. 6, No 4, December 2020
1540
Center for the Assessment of Alternatives to Juvenile Justice Processing, University of Chicago,
School of Social Service Administration.
Maclean, R., & Wilson, D. (Eds.). (2009). International handbook of education for the changing world
of work: Bridging academic and vocational learning (Vol. 1). Springer Science & Business
Media.
Gasskov, V. (2000). Managing vocational training systems: A handbook for senior administrators.
International Labour Organization.
McMahon, W. (1998). Conceptual Framework for the Analysis of the Social Benefits of Lifelong
Learnings. Education Economics, 6(3), 309–946.
Meager, N. (2009). The role of training and skills development in active labour market policies.
International Journal of Training and Development, 13(1), 1-18.
Merriam, S. B., & Kee, Y. (2014). Promoting community wellbeing: The case for lifelong learning for
older adults. Adult Education Quarterly, 64(2), 128-144.
Mincer, J. (1958). Investment in human capital and personal income distribution. Journal of political
economy, 66(4), 281-302.
Nilsson, A. (2010). Vocational education and training–an engine for economic growth and a vehicle for
social inclusion?. International Journal of Training and Development, 14(4), 251-272.
Noe, R. A., Hollenbeck, J. R., Gerhart, B., & Wright, P. M. (2014). Human resource management (9rd
Ed.) (9th ed.). USA, McGraw-Hill.
Pakistan Bureau of Statistics. (2017). Provisional Summary Results of 6th Population and Housing
Census–2017.
Aisyianita, R. A. (2017). Pengembangan Pariwisata Berkelanjutan di DI Yogyakarta Melalui Pendekatan
Kewirausahaan Sosial (Sociopreneurship). Media Wisata, 15(2).
Pradhan, E. (2016). Link Between Education and Fertility in Low and Middle Income Countries.
Harvard TH Chan School of Public Health.
Riddell, W. C. (2006). The impact of education on economic and social outcomes: An overview of recent
advances in economics. Canadian Policy Research Networks.
Romer, P. (1994). New goods, old theory, and the welfare costs of trade restrictions. Journal of
development Economics, 43(1), 5-38.
Rothwell, W. J., & Kazanas, H. C. (2003). Planning and managing human resources: strategic planning
for human resources management. Human Resource Development.
Sabates, R. (2008). The impact of lifelong learning on poverty reduction. National Institute of Adult and
Continuing Education (NIACE).
Gough, A. M., Schuller, T., Preston, J., Hammond, C., Brassett-Grundy, A., & Green, A. (2002).
Learning, continuity and change in adult life.
Stanwick, J. (2006). Outcomes from Higher-Level Vocational Education and Training Qualifications.
National Centre for Vocational Education Research Ltd. PO Box 8288, Stational Arcade,
Adelaide, SA 5000, Australia.
Sweetland, S. R. (1996). Human capital theory: Foundations of a field of inquiry. Review of educational
research, 66(3), 341-359.
Tilak, J. B. (2002). Determinants of household expenditure on education in rural India (No. 88). New
Delhi: National Council of Applied Economic Research.
Ullah, S., & Malik, Z. K. (2020). Analysis of the Determinants of Participation, Strengths and
Weaknesses of Vocational Trainings of Federally Administered Tribal Area’s Development
Authority. International Journal of Economics and Financial Issues, 10(3), 149-157.
Van de Werfhorst, H. G. (2017). Vocational and academic education and political engagement: The
importance of the educational institutional structure. Comparative Education Review, 61(1), 000-
000.
Wallenborn, M. (2010). Vocational Education and Training and Human Capital Development: current
practice and future options. European Journal of Education, 45(2), 181-198.
Wolfe, B. L., & Haveman, R. H. (2002, June). Social and nonmarket benefits from education in an
advanced economy. In Conference series-federal reserve bank of Boston (Vol. 47, pp. 97-131).
Federal Reserve Bank of Boston; 1998.
Wolfe, B. L., & Haveman, R. H. (2002, June). Social and nonmarket benefits from education in an

Journal of Business and Social Review in Emerging Economies Vol. 6, No 4, December 2020
1541
advanced economy. In Conference series-federal reserve bank of Boston (Vol. 47, pp. 97-131).
Federal Reserve Bank of Boston; 1998.
Woessmann, L. (2008). Efficiency and equity of European education and training policies. International
Tax and Public Finance, 15(2), 199-230.

Journal of Business and Social Review in Emerging Economies Vol. 6, No 4, December 2020
1542
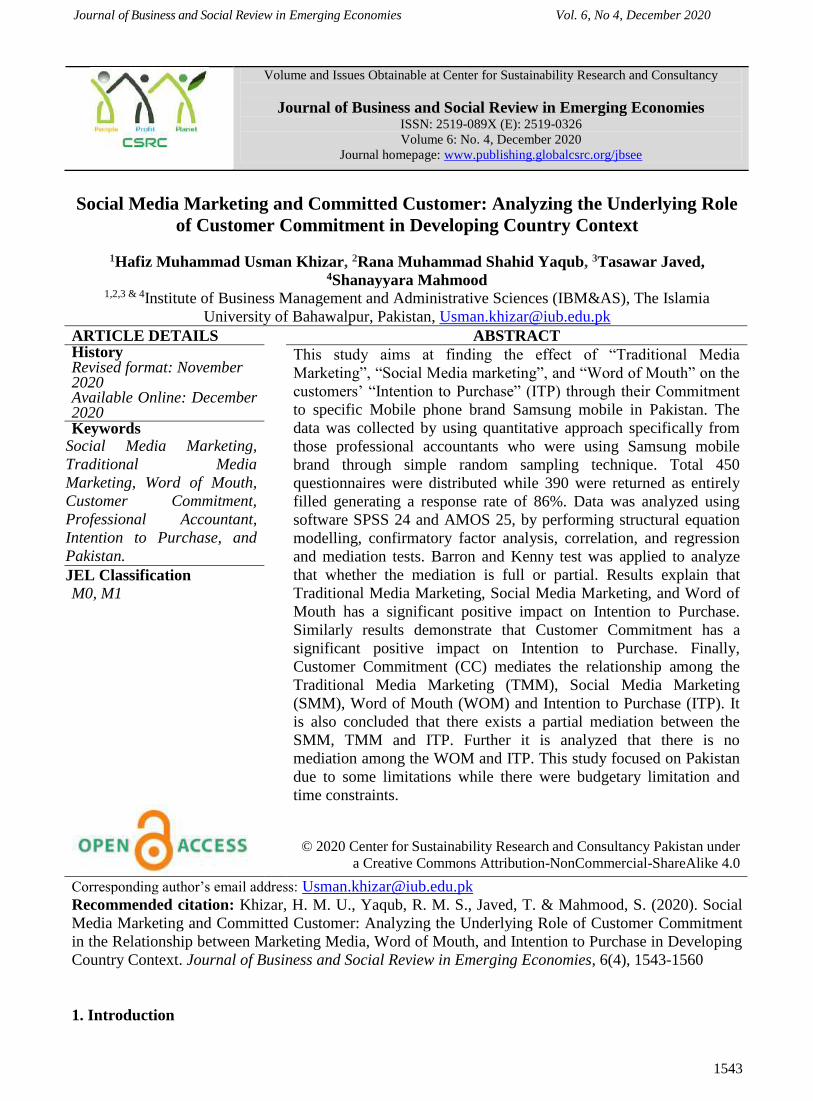
Journal of Business and Social Review in Emerging Economies Vol. 6, No 4, December 2020
1543
Volume and Issues Obtainable at Center for Sustainability Research and Consultancy
Journal of Business and Social Review in Emerging Economies ISSN: 2519-089X (E): 2519-0326
Volume 6: No. 4, December 2020
Journal homepage: www.publishing.globalcsrc.org/jbsee
Social Media Marketing and Committed Customer: Analyzing the Underlying Role
of Customer Commitment in Developing Country Context
1Hafiz Muhammad Usman Khizar, 2Rana Muhammad Shahid Yaqub, 3Tasawar Javed, 4Shanayyara Mahmood
1,2,3 & 4Institute of Business Management and Administrative Sciences (IBM&AS), The Islamia
University of Bahawalpur, Pakistan, [email protected]
ARTICLE DETAILS ABSTRACT History Revised format: November 2020 Available Online: December 2020
This study aims at finding the effect of “Traditional Media
Marketing”, “Social Media marketing”, and “Word of Mouth” on the
customers’ “Intention to Purchase” (ITP) through their Commitment
to specific Mobile phone brand Samsung mobile in Pakistan. The
data was collected by using quantitative approach specifically from
those professional accountants who were using Samsung mobile
brand through simple random sampling technique. Total 450
questionnaires were distributed while 390 were returned as entirely
filled generating a response rate of 86%. Data was analyzed using
software SPSS 24 and AMOS 25, by performing structural equation
modelling, confirmatory factor analysis, correlation, and regression
and mediation tests. Barron and Kenny test was applied to analyze
that whether the mediation is full or partial. Results explain that
Traditional Media Marketing, Social Media Marketing, and Word of
Mouth has a significant positive impact on Intention to Purchase.
Similarly results demonstrate that Customer Commitment has a
significant positive impact on Intention to Purchase. Finally,
Customer Commitment (CC) mediates the relationship among the
Traditional Media Marketing (TMM), Social Media Marketing
(SMM), Word of Mouth (WOM) and Intention to Purchase (ITP). It
is also concluded that there exists a partial mediation between the
SMM, TMM and ITP. Further it is analyzed that there is no
mediation among the WOM and ITP. This study focused on Pakistan
due to some limitations while there were budgetary limitation and
time constraints.
© 2020 Center for Sustainability Research and Consultancy Pakistan under
a Creative Commons Attribution-NonCommercial-ShareAlike 4.0
Keywords Social Media Marketing,
Traditional Media
Marketing, Word of Mouth,
Customer Commitment,
Professional Accountant,
Intention to Purchase, and
Pakistan.
JEL Classification
M0, M1
Corresponding author’s email address: [email protected]
Recommended citation: Khizar, H. M. U., Yaqub, R. M. S., Javed, T. & Mahmood, S. (2020). Social
Media Marketing and Committed Customer: Analyzing the Underlying Role of Customer Commitment
in the Relationship between Marketing Media, Word of Mouth, and Intention to Purchase in Developing
Country Context. Journal of Business and Social Review in Emerging Economies, 6(4), 1543-1560
1. Introduction

Journal of Business and Social Review in Emerging Economies Vol. 6, No 4, December 2020
1544
Technological revolution has risen at an extraordinary rate during the past few years, particularly in case
of online and traditional media (Duffett, 2015). The internet based technologies have redefined the skills
of interacting to consumers by providing an access to opportunities in marketplace regarding social
networking websites, wikis, blogs and product review sites (Ajina, 2019) . Previous studies proposed
that in 2012, 500 famous companies used social media and 73 percent of these firms had an official
company account in Twitter however 66 percent businesses had Facebook pages further in 2011, 28
percent of these firms had blogs (Barnes, Lescault, & Andonian, 2012).The usage of social media
(Facebook, YouTube, Instagram, Twitter, and LinkedIn) has increased among customers. As specified
by the Nielsen Company (2012), customers pass more time on social media instead any other set of sites
with an average of 121.18 min per day in 2012, which denotes an increase of 37% with respect to the
previous year. This trend has encouraged scholars to recognize how to use social media to effect
customer preferences, purchase decisions, and word of mouth (Arora & Sanni, 2019).
Social media refers to “a group of Internet-based applications that builds on the ideological and
technological foundations of Web 2.0 and that allows the creation and exchange of user generated
content” (Cheung, Pires, & Rosenberger, 2020). Social Media is becoming an important part of
marketing communications platform because it’s communicating features assist collaborative
participating, and knowledge-sharing activities (Moslehpour, Dadvari, Nugroho, & Do, 2020). Without
the virtual world the company would struggle to confirm its stability. Social Media arise as the most
powerful media for promotion across the world. Businesses are shifting a more pie of their promotion
budgets towards social media to better reach consumers (Saxena & Khanna, 2013). Social media is an
advancement and innovation in traditional media, a marketing instrument that alert the users about
brands and products, including newspapers, print ads, newsletters, television advertisements and
billboards. Further, Mulhern (2009) found that traditional media covers the market in short term and hit
the customer choices precisely. Abzari, Ghassemi, & Vosta (2014) proposed that social media differs
from traditional media through a change from the desktop to the web. Besides these two marketing
channels, there is a non-noticeable channel called Word of Mouth (WOM), that is a communication
procedure among customers regarding famous companies, their products, features, new ideas and
services (Zhou et al., 1997). These three marketing channels permits the marketers to share and
exchange the information with the consumers (Thackeray, Neiger, Hanson, & McKenzie, 2008).
Consequently customers show the intention to purchase that specific product and make purchases
according to their budget plans and within a specific span of time. Once a customer make purchase of
that specific brand, there is a possibility that he may become committed and loyal to that company due
to their psychological attachment referring this relation as customer commitment (Dimitriades, 2006).
The objective of this research work is to study the relationship between (SMM, WOM, and TMM) and
ITP in Pakistan with a particular focus on the direct and mediating impacts of CC on ITP. The three
variables (SMM, WOM, and TMM) are of particular significance due to their importance to Pakistani
marketing managers. The results of this research confirm the mediating role of CC in enhancing the
effects of TMM, SMM and WOM on ITP. The findings also show a positive relationship among each of
the variables (i.e., TMM, SMM and WOM) and ITP. SMM is not only about promotion or product but it
also is a network for well communication with consumers. The benefits obtain from social media
marketing is the fast consumer feedback. The repeated customer reaction obtains not only benefits the
brand but also gives a better understanding of the targeted audience. The contribution of this study to the
SMM literature is twofold. Previous study suggested that SMM in cooperation with WOM, TMM, and
its impact on ITP was not studied in Pakistan. This research will also contribute to the future literature in
a way that CC paly a meditating role in marketing channels. Social media (SM) is a new thought for the
advertisement and least studied in Pakistan.
The rest of the paper is arranged as follows; Section two discusses previous literature and develops the
hypotheses. Section three presents methodology. Section four describes the results. Section five
concludes the study.
2. Theoretical Framework and Hypotheses Development
2.1 Intention to Purchase (ITP)

Journal of Business and Social Review in Emerging Economies Vol. 6, No 4, December 2020
1545
The decision to purchase products and service in future is known as consumer intention to purchase. The
willingness of a consumer to buying a specific brands and specific products is identified as ITP
(Martins, Costa, Oliveira, Gonçalves, & Branco, 2019).Researcher explain that cost of retentive present
buyer is fewer than searching of new buyers (Spreng, Harrell, &Mackoy, 1995). ITP is more important
for the firm’s. Customer purchase Intention effected by the customer satisfaction (Rattanareuthai, 2006).
Customers purchase intention changed by social communities (Xu, Zhang, & Xue, 2013). Some authors
describe that service quality and consumer loyalty also effect the purchase intention (Hellier, Geursen,
Carr, & Rickard, 2003). Previous study explain that customer satisfaction and purchase intention have
significant relationship. Companies satisfied their buyers and focus on purchase intention (Yi &
Zenithal, 1990). Literature show that WOM also influenced purchase intention (Erkan & Evans, 2016).
Previous study recommended that there occurs positive relationship among the SMM and ITP.
2.2 Social Media Marketing (SMM) and ITP
Social media marketing is an electronic communication process. By the social media customers makes
social groups and share their messages, thoughts and videos (Lester, Serkedakis, & Tudor, 2016). Social
media as the “means for production, consumption and exchange of information” by online social
connections and platforms that have value for an organization's stakeholder (Jacobson, Gruzd, &
Hernández-García, 2020). Social media as the “group of applications that is based on internet that allow
the formation and exchange of user created content” (Kaplan & Haenlein, 2010). SMM provides
platform by which customer communicate, like as conversation forums, wikis, blogs, social networks
and multi-media sites, most of the famous Facebook, Twitter, Flicker, Myspace, Linked in and You
Tube (Bradley & Bartlett, 2011). Social media updates the party-political condition and day to day
activity via the Facebook and Twitter thus the costumer purchase intention has increased (Aad et al.,
2012) . Some researcher explain that Social Media updates the fitness info. People reply positive on
social media bulletin instead of newscast media (Lehmann, Ruiter, & Kok, 2013). Previous studies
shows that there is Social Media Marketing and Intention to Purchase are positively related. Social
Media Marketing changes the consumers’ behavior that impact the customer intention to purchase. If the
consumer behavior changed in a positive way then the consumer purchasing intention also enhanced (An
et al., 2012). SMM play a significant role in many businesses. The success and failure of companies is
based on customer feedback connected decision making of the business. For example, if a negative word
of mouth for a brand or service of the stock is forwarded on ‘Twitter or Facebook’ numerous consumers
will immediately follow and even distribute these comments. This could in time become a big issue
which negatively effects upcoming business (Ramanathan et al., 2017).Social media marketing has
improved the mode that organizations attract and hold potential customers. Due to easy availability of
internet, consumer feel free to generate and share information related to the products and services on
social media to make value (Tiruwa et al., 2016).
According to Ramanathan et al., (2017) customer purchasing behavior has dramatically changed due to
social media marketing . This has really changed in the purchasing behavior of seller and buyer where
the majority of SMM and e-commerce has providing contemporary purchasers with a greater platform of
buying options. SMM may become a valued addition for the brand advertisement if worked properly as
it has a worldwide influence and wide spread of usage at both national and international level (McClure
& Seock, 2020).
H1a: SMM has a significant effect on ITP.
2.3 Traditional Media Marketing (TMM) and ITP
In Traditional Media Marketing, consumers are attracted and informed about the products, services and
offers of the seller through the conventional media channels as Radio, TV ads, Prints media, Mail and
Newspaper. TMM is a marketing instrument that alert the consumers about products (Sillanpää, 2020).
Traditional media includes newspapers, print ads, newsletters, television advertisements and billboards.
TMM cover the market in short term and hit the customer choices (Mulhern, 2009). Arndt (1967)
described the connection among the business and their consumers. The transactional theory describes the
response of the customers that is changed by the TMM. TMM connect with the customers and keep
them for long term.

Journal of Business and Social Review in Emerging Economies Vol. 6, No 4, December 2020
1546
Yoo et al. (2000) explain the marketing channels have positive effect on brand loyalty, brand value,
brand equity and brand awareness. However previous research work on the relationship among the brand
and the marketing tools has emphasis on TMM. Trusov et al. (2009) explain the relationship among the
WOM and TMM. The author explains the impact of TMM tools on the growth of followers in a social
media. Previous research show that word of mouth (WOM) effects positively on followers’ growth rate
and they have long term relationship as compared to TMM. Stephen and Galak (2009) observed the
impact of SMM “such as weblogs” and TMM “such as television” on sales. According to Tümer,
Aghaei, Öney, & Eddine (2019) TMM have positive impact on marketing performance of businesses.
Although they thought that the impact of TMM is greater and stronger than SMM. Tümer, Aghaei,
Öney, & Eddine (2019) conclude that there was positive relation between the traditional media
marketing and customer intention to purchase.
H1b: TMM has a significant effect on ITP.
2.4 Word of Mouth (WOM) and ITP
Word of Mouth is a one to one method among the consumers that share information about the products
characteristic (Niininen, Buhalis, & March, 2007). WOM has two persons one is sender other person is
receiver, sender share the relevant information about the brands, companies, ideas and characteristic of
brands (Buhalis, & March, 2007). WOM is very honest type of marketing in which more than two
consumers converse their views related to the goods and services of any company (Iwane et al., 2004).
WOM has significant positive effect on customer purchase intention (Bansal & Voyer, 2000). WOM
effects positively on consumer mind, hence the sale of a business increased. WOM effect the purchasing
intention so strong and positive word of mouth increased the business sale and firm earn high profit
(Alrwashdeh, Emeagwali, & Aljuhmani, 2019). Research Explain that there exists a good relation
among the word of mouth and ITP (Reyes-Menendez, Saura, & Martinez-Navalon, 2019). A profitable
company have a good WOM stimulates the pushing power of customer (McGriff, 2012). WOM is a
type of promotion that retain the new consumers. Through the good WOM companies transfer their
information about the new products, new business, and new facilities and sustain their customer for long
duration so the WOM enhance the purchase intention (Jansen, Zhang, Sobel, & Chowdury, 2009).
“Theory of reasoned action” (TRA) support the Word of Mouth concept. TRA theory explained in the
previous study which indicate that WOM and ITP are highly correlated (Fishbein & Ajzen, 1977).
H1c: There is a positive relationship between Word of Mouth (WOM) and Intention to Purchase (ITP).
2.5 Direct and Mediating Effect of Customer Commitment (CC) on ITP
Customer Commitment is an innovative idea in which consumers have strong relationship with brands,
services. Customers attach emotionally with the , products, services and keep the long term relation
(Khan, Hollebeek, Fatma, Islam, & Riivits-Arkonsuo, 2020). CC is a continuous practice in which
consumer prefer and sustain the long-term company relationship (Hunt & Vasquez-Parraga, 1993).
Research identify that customers sacrificing their short term needs and maintain the long term
relationship (Morgan & Hunt, 1994). CC enhance the trust and consumer loyalty (Aad et al., 2010). CC
can’t be destroyed because consumers’ are faithful and become important element of the business
achievement. Committed buyers get many advantages from the business in the form of special care and
deductions.
Most researcher agree that establishing long term relationship with customers makes positive return to
companies (Reichheld,1993, 1996), thus the customer commitment become a key marketing success.
Geyskens et al. (1996) defined as customer commitment is long term relationship rather than terminate
relationship. Literature proposed two wide components of commitment: “affective commitment and
calculative or continuance commitment” (Kaur and Soch, 2012; Davis-Srameket al., 2009; Evanschitzky
et al., 2006; Fullerton, 2003). Regarding to Fullerton (2003), affective commitment shows customer
identify and feel the positive attachment with products and services. Commitment can be a cause of
maintainable competitive benefit to a firm because it offers positive word-of-mouth, cost reduction,
enhanced profits, and the prospect of sales at a premium price (Hur et al., 2010).

Journal of Business and Social Review in Emerging Economies Vol. 6, No 4, December 2020
1547
Poushneh & Vasquez-Parraga, (2019) argue that customer commitment is a strong predictor of different
metrics connected to customer retention, staying intention like switching and intention to purchase.
Therefor most researcher agree that establishing long term relationship with customers makes positive
return to companies and have positive relation with customer intention to purchase (Poushneh &
Vasquez-Parraga, 2019). The “commitment–trust theory” of relationship marketing supports the
Customer Commitment (Morgan and Hunt 1994). “The commitment-trust theory of states that two vital
components, duty and trust, must occur for success of a company”. Morgan and Hunt (1994) discuss that
commitment improves when a firm ‘‘joins to relationships by keeping high values of corporate values
and associating oneself with exchange partners having similar standards.
H2: There is a positive relationship between CC and ITP.
With this, previous research expalin that coustomer commitment (cc)mediates the relationship among
SMM and ITP. Accoring to (Khodabandeh & Lindh, 2020) social media marketing change the
customers buying behavior and customers commitment meditate the relationship between SMM and
ITP.
H3a: CC mediates the relationship among SMM and ITP.
Traditional Media Marketing is the use of conventional media channels as Radio, TV, Newspaper, Print
media and others to attract and inform the target market. Coustomer commitment have positive impact
on coustomer intention to purchase and medtaie the relationship among TMM and ITP (Tümer et al.,
2019)
H3b: CC mediates the relationship among TMM and ITP.
WOM is a one to one method among the consumers that share information about the products
characteristic (Niininen, Buhalis, & March, 2007). Some researcher explain that there is strong and
meditating effect among the CC , WOM and ITP (Mahadin & Akroush, 2019)
H3c: CC mediates the relationship among WOM and ITP.
Figure 1 shows the conceptual model in which TMM, SMM, WOM are independent Variables, ITP is
dependent Variable and Customer Commitment is mediating Variable.

Journal of Business and Social Review in Emerging Economies Vol. 6, No 4, December 2020
1548
Figure 1. Conceptual Model of Customers’ Intention to Purchase
3. Research Methodology
This study observes the impact of SMM, Word of Mouth and TM on ITP. In this research work CC
mediates the relationship among the (SMM, WOM, TMM), and ITP. Convenience sampling method was
used for data collection. Population was customers of Samsung Company in Pakistan and various audit
firms were study randomly to collect the data. Quantitative research was conducted among 450
respondents through Self-administered structured questionnaires in Pakistan. In total 390 valid
questionnaires having response rate of 86% were included in the data analysis. The survey was pre-
tested and reviewed. The questionnaire consisted of five portions covering the following matters: 1:
Social Media (Tsiros, Mittal, & Ross, 2004), 2: Tradition Media (Tsiros, Mittal, & Ross, 2004), 3:
Word of Mouth (Groeger & Buttle, 2014), 4: Purchase Intention (Jalilvand, Samiei, Dini, &Manzari,
2012) and 5: Customer Commitment (Bettencourt, 1997).
Furthermore, AMOS and SPSS software were used for analysis of data. Model fitness was tested by using
(CFA) Confirmatory Factor Analysis and (SEM), Structural Equation Modelling by the criteria proposed
by Hu & Bentler (1999). Barron and Kenny mediation test was applied to check the mediation among
the constructs.
4. Data Analysis and Results
4.1 Descriptive Statistics, Correlation and Regression Analysis
Table 1 depicts the chronbach’s alpha reliability values for all the variables as TM has .785, SM has
.725, WOM as .819 Customer Commitment has .759 and Customer Purchase Intention having reliability
value of .704 which is acceptable for the data analysis. Further Standard Deviation and Mean Values for
TM, SM, WOM, CC and ITP are (0.48821, 3.354), (0.42223, 3.744), (0.48821, 3.661), (0.4378, 3.452),
(0.4677, 3.55) respectively. Moreover , Correlation Analysis was used to analyze the relationship
between variables, as Traditional Media and Social Media has positive correlation with the value
(.153**) which explains if Traditional Media works in a positive way then the Social Media also capture
the customers. Similarly, Traditional Media and Word of Mouth also have positive correlation with the
value (.272**) which mean that if the Word of Mouth have positive impact on customers then the sales
increased. The overall correlation analysis explain that the relationship among the all variables have
positive effects with the values (.422**, .325**, .510**, .298**, .322**, .407**, .523**, .543**) which
means that Customer Purchase Intention has increased if the Marketing Media works in a positive way.
Regression analysis was applied to test the effect as Traditional Media impacts the Intention to purchase
of customer with the value of R = .325, R² = .105, β = .325 and P value =.000 expressive the
significance of the effect. Similarly, regression values for the impact of Social Media on Intention to
Purchase are R = .322, R² = .103, Beta Value = .322 and P value =.000 showing the significance of this
impact. Similarly, the effect of WOM on Customer Purchase Intention has significant effect as the P-
value < 0.05, R = .523, R² = .274 and the Beta Value =.523. Results also explain that the impact of CC
on ITP as the P-value < 0.05 R = .543, R² = .295 and the β =.553.
Table 1. Descriptive Statistics, Correlation and Regression Analysis
Reliability Mean SD TMM SMM WOM CC ITP
TMM .785 .3354 0.48821 1
SMM .725 3.744 0.42223 .153** 1
WOM .819 3.661 0.48821 .272** .510** 1
CC .759 3.452 0.4378 .422** .298** .407** 1
ITP .704 3.55 0.4677 .325** .322** .523** .543** 1
“Regression Analysis”
Direct Effect “R” “R2” “Beta Value” “P Value”
TMM ITP .325 .105 .325 .000
SMM ITP .322 .103 .322 .000
WOM ITP .523 .274 .523 .002

Journal of Business and Social Review in Emerging Economies Vol. 6, No 4, December 2020
1549
CC ITP .543 .295 .553 .000
4.2 Confirmatory Factor Analysis
4.2.1 Measurement Model A
Measurement Model A explains that are 3 latent variables in circle, constituting SMM, Customer
Commitment and Word of Mouth that are expressed by 19 observed variables in squares, further the
single headed arrow showed the tendency of proposed causal impact and co variance among two latent
variables demonstrated by double headed arrows.
Table 2. Standardized Regression Weights of Measurement Model A
Latent Variable Item Label Standardized Factor Loading
Social Media Marketing
(SMM)
SMM4 0.668
SMM5 0.451
SMM6 0.549
SMM7 0.642
SMM8 0.619
SMM9 0.795
SMM10 0.657
SMM11 0.611
SMM12 0.806
SMM13 0.622
SMM14 0.809
Customer Commitment
(CC)
CC39 0.437
CC38 0.578
CC37 0.442
CC36 0.730
CC35 0.801
Intention to Purchase (ITP) ITP42 0.715
ITP41 0.722
ITP40 0.527
Table 2.0 explains that latent variables caused the observed variables which are show by single headed
arrows towards the unobserved pointing away from the circle as shown by the values of elements of
Social Media Marketing constituting SMM4 (0.668), SMM5 (0.451), SMM6 (0.549), SMM7 (0.642),
SMM8 (0.619), SMM9 (0.795), SMM10 (0.657), SMM11 (0.611), SMM12 (0.806), SMM13 (0.622)
and SMM14 (0.809), similarly values of elements of Customer Commitment as CC39 (0.437), CC38
(0.578), CC37 (0.442), CC36 (0.730) and CC35 (0.801), and finally the values of element of Intention to
Purchase as ITP42 (0.715), ITP41 (0.722) and ITP40 (0.527).
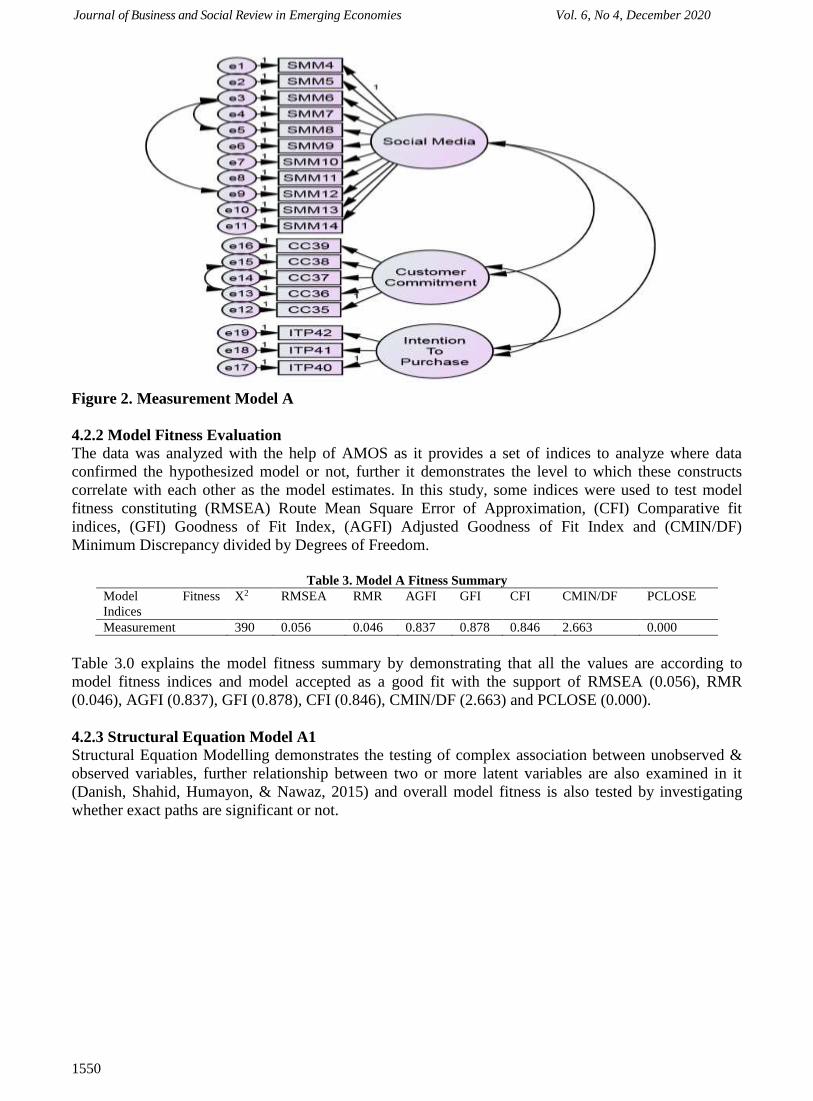
Journal of Business and Social Review in Emerging Economies Vol. 6, No 4, December 2020
1550
Figure 2. Measurement Model A
4.2.2 Model Fitness Evaluation
The data was analyzed with the help of AMOS as it provides a set of indices to analyze where data
confirmed the hypothesized model or not, further it demonstrates the level to which these constructs
correlate with each other as the model estimates. In this study, some indices were used to test model
fitness constituting (RMSEA) Route Mean Square Error of Approximation, (CFI) Comparative fit
indices, (GFI) Goodness of Fit Index, (AGFI) Adjusted Goodness of Fit Index and (CMIN/DF)
Minimum Discrepancy divided by Degrees of Freedom.
Table 3. Model A Fitness Summary
Model Fitness
Indices
X2 RMSEA RMR AGFI GFI CFI CMIN/DF PCLOSE
Measurement 390 0.056 0.046 0.837 0.878 0.846 2.663 0.000
Table 3.0 explains the model fitness summary by demonstrating that all the values are according to
model fitness indices and model accepted as a good fit with the support of RMSEA (0.056), RMR
(0.046), AGFI (0.837), GFI (0.878), CFI (0.846), CMIN/DF (2.663) and PCLOSE (0.000).
4.2.3 Structural Equation Model A1
Structural Equation Modelling demonstrates the testing of complex association between unobserved &
observed variables, further relationship between two or more latent variables are also examined in it
(Danish, Shahid, Humayon, & Nawaz, 2015) and overall model fitness is also tested by investigating
whether exact paths are significant or not.

Journal of Business and Social Review in Emerging Economies Vol. 6, No 4, December 2020
1551
Figure 3. Structural Equation Model A1
Table 4. Model A1 Fitness Summary
Model Fitness
Indices
PCLOSE RMSEA RMR AGFI GFI CFI CMIN/DF X2
Measurement 0.000 0.093 0.056 0.844 0.901 0.941 3.533 390
Table 4.0 explains the model fitness summary for Structural Equation Model as the values of PCLOSE
(0.000), RMSEA (0.09), RMR (0.05), AGFI (0.84), GFI (0.94), and CMIN/DF (3.53) are according to
the benchmarked indices showing model fitness.
Table 5. Standardized Regression Weights of Model A1
Estimates
Customer Commitment Social Media Marketing 0.432
Intention to Purchase ITP Customer Commitment 0.529
Intention to Purchase ITP Social Media Marketing 0.411
Table 5.0 shows the standardized regression weights of association of different variables such as
Customer Commitment to Social Media (0.432), Intention to Purchase and Customer Commitment
(0.529) and Intention to purchase to social media (0.411), these results demonstrate the significant
association among variables as regression weights of relationships exceeds 0.
4.2.4 Measurement Model B
Measurement Model B explains that are 3 latent variables in circle, constituting Word of Mouth, CC and
ITP that are expressed by 27 observed variables in squares.
Table 6. Standardized Regression Weights of Measurement Model B
Latent Variable Item Label Standardized Factor Loading
Word of Mouth WOM34 0.677
WOM33 0.441
WOM32 0.559
WOM31 0.664
WOM30 0.691
WOM29 0.789
WOM28 0.667
WOM27 0.621
WOM26 0.860
WOM25 0.623
WOM24 0.890
WOM23 0.447

Journal of Business and Social Review in Emerging Economies Vol. 6, No 4, December 2020
1552
WOM22 0.567
WOM21 0.452
WOM20 0.740
WOM19 0.810
WOM18 0.751
WOM17 0.721
WOM16 0.572
Customer Commitment (CC) CC39 0.587
CC38 0.424
CC37 0.703
CC36 0.810
CC35 0.751
Intention to Purchase (ITP) ITP42 0.724
ITP41 0.572
ITP40 0.711
Table 6.0 explains that latent variables caused the observed variables which are show by single headed
arrows towards the unobserved pointing away from the circle as shown by the values of elements of
Word of Mouth constituting WOM34 (0.677), WOM33 (0.441), WOM32 (0.559), WOM31 (0.664),
WOM30 (0.691), WOM29 (0.789), WOM28 (0.667), WOM27 (0.621), WOM26 (0.860)¸ WOM25
(0.623)¸ WOM24 (0.890), WOM23 (0.447), WOM22 (0.567), WOM21 (0.452), WOM20 (0.740),
WOM19 (0.810), WOM18 (0.751), WOM17 (0.721) and WOM16 (0.572). Similarly values of elements
of Customer Commitment as CC39 (0.587), CC38 (0.424), CC37 (0.703), CC36 (0.810) and CC35
(0.751), and finally the values of element of Intention to Purchase as ITP42 (0.724), ITP41 (0.572) and
ITP40 (0.711).
Figure 4. Measurement Model B
Table 7. Model B Fitness Summary
Model Fitness
Indices
PCLOSE RMSEA RMR AGFI GFI CFI CMIN/D
F
X2
Measurement 0.000 0.092 0.057 0.834 0.900 0.932 2.763 390
Table 7.0 explains the model fitness summary regarding confirmatory factor analysis by demonstrating

Journal of Business and Social Review in Emerging Economies Vol. 6, No 4, December 2020
1553
that all the values are according to model fitness indices and model accepted as a good fit with the
support of RMSEA (0.092), RMR (0.057), AGFI (0.834), GFI (0.900), CFI (0.932), CMIN/DF (2.763)
and PCLOSE (0.000).
a) Structural Equation Model B1
Figure 5. Structural Equation Model B1
Table 8. Model B1 Fitness Summary
Model Fitness
Indices
PCLOSE RMSEA RMR AGFI GFI CFI CMIN/DF X2
Measurement 0.000 0.065 0.063 0.856 0.890 0.801 2.620 390
Table 8.0 explains the model fitness summary regarding structural equation model by demonstrating that
all the values are according to model fitness indices and model accepted as a good fit with the support of
RMSEA (0.065), RMR (0.063), AGFI (0.856), GFI (0.890), CFI (0.801), CMIN/DF (2.620) and
PCLOSE (0.000).
Table 9. Standardized Regression Weights of Model B1
Estimates
Customer Commitment Word of Mouth 0.421
Intention to Purchase ITP Customer Commitment 0.530
Intention to Purchase ITP Word of Mouth 0.412
Table 9.0 shows the standardized regression weights of association of different variables such as
Customer Commitment to Word of Mouth (0.421), Intention to Purchase with Customer Commitment
(0.530) and Intention to Purchase to Word of Mouth (0.412), further these results demonstrate the
significant association among variables as regression weights of relationships exceeds 0.
4.2.5 Measurement Model C
Table 10. Standardized Regression Weights of Measurement Model C
‘Standardized Regression Weights’
“Latent Variable” “Item Label” “Standardized Factor Loading”
Traditional Media (TM) TMM1 0.790
TMM2 0.890
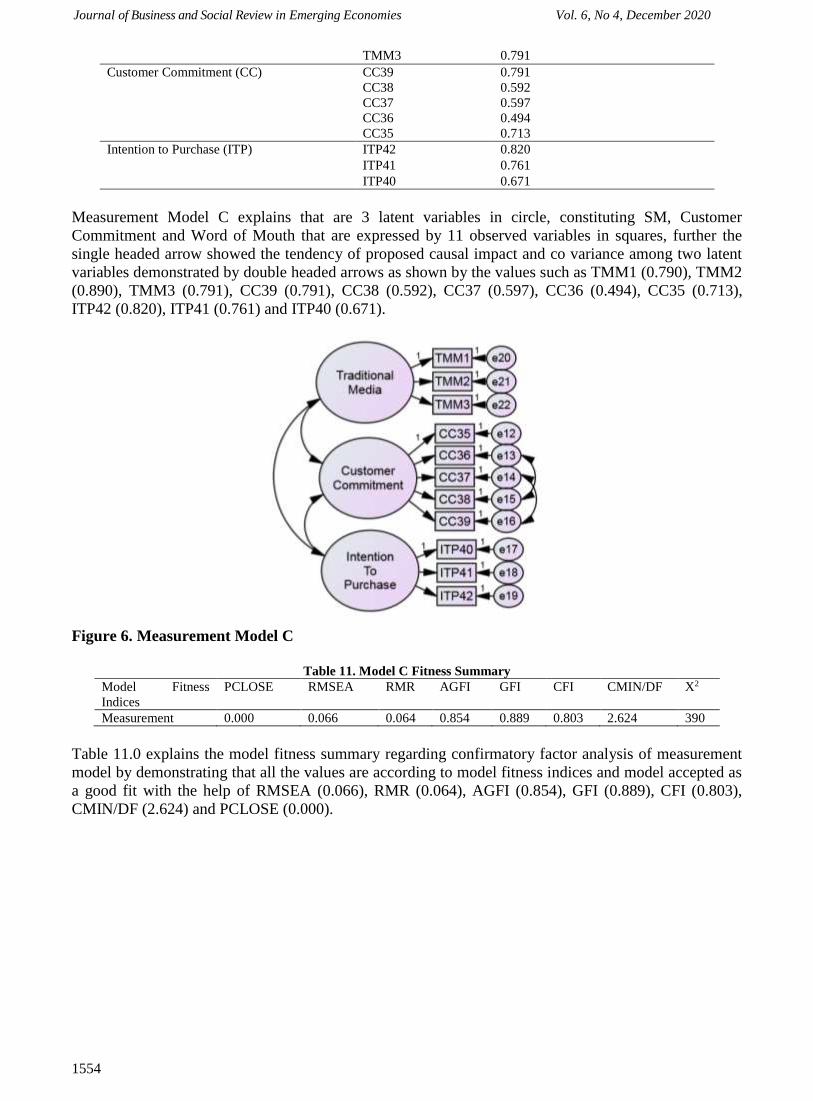
Journal of Business and Social Review in Emerging Economies Vol. 6, No 4, December 2020
1554
TMM3 0.791
Customer Commitment (CC) CC39 0.791
CC38 0.592
CC37 0.597
CC36 0.494
CC35 0.713
Intention to Purchase (ITP) ITP42 0.820
ITP41 0.761
ITP40 0.671
Measurement Model C explains that are 3 latent variables in circle, constituting SM, Customer
Commitment and Word of Mouth that are expressed by 11 observed variables in squares, further the
single headed arrow showed the tendency of proposed causal impact and co variance among two latent
variables demonstrated by double headed arrows as shown by the values such as TMM1 (0.790), TMM2
(0.890), TMM3 (0.791), CC39 (0.791), CC38 (0.592), CC37 (0.597), CC36 (0.494), CC35 (0.713),
ITP42 (0.820), ITP41 (0.761) and ITP40 (0.671).
Figure 6. Measurement Model C
Table 11. Model C Fitness Summary
Model Fitness
Indices
PCLOSE RMSEA RMR AGFI GFI CFI CMIN/DF X2
Measurement 0.000 0.066 0.064 0.854 0.889 0.803 2.624 390
Table 11.0 explains the model fitness summary regarding confirmatory factor analysis of measurement
model by demonstrating that all the values are according to model fitness indices and model accepted as
a good fit with the help of RMSEA (0.066), RMR (0.064), AGFI (0.854), GFI (0.889), CFI (0.803),
CMIN/DF (2.624) and PCLOSE (0.000).

Journal of Business and Social Review in Emerging Economies Vol. 6, No 4, December 2020
1555
Figure 7. Structural Equation Model C1
Table 12. Model Fitness Summary of Model C1
Model Fitness
Indices
PCLOSE RMSEA RMR AGFI GFI CFI CMIN/DF X2
Measurement 0.000 0.064 0.067 0.857 0.888 0.801 2.626 390
Table 12.0 explains the model fitness summary regarding confirmatory factor analysis of measurement
model C by demonstrating that all the values are according to model fitness indices and model accepted
as a good fit with the support of RMSEA (0.064), RMR (0.067), AGFI (0.857), GFI (0.888), CFI
(0.801), CMIN/DF (2.626) and PCLOSE (0.000).
Table 13. Standardized Regression Weights of Model C1
Estimates
Customer Commitment Traditional Media 0.423
Intention to Purchase Customer Commitment 0.533
Intention to Purchase Traditional Media 0.413
Table 13.0 shows the standardized regression weights of association of different variables such as
Customer Commitment to Traditional Media (0.423), Intention to Purchase with Customer Commitment
(0.533) and Intention to Purchase to Traditional Media (0.413), further these results demonstrate the
significant association among variables as regression weights of relationships exceeds 0.
4.3. Mediation Analysis by Barron and Kenny
Table 14. Mediation Analysis
Models Direct Effect Indirect Effect Mediation Effect
Model 1 SMM-----CC----ITP Significant
P=0.000
Significant P=0.000 Partial Mediation
Model II WOM----CC----ITP Significant
P=0.000
Insignificant P>0.05 No Mediation
Model
III
TM-----CC----ITP Significant
P=0.000
Significant P=0.000 Partial Mediation
Table 14.0 explain the Mediation Analysis of this study. In Model 1 results explain that the direct and
indirect effect both are significant as the (P >0.05) and the mediation results is partial mediation. Model
III observed that the direct and indirect effect both are significant as the (P >0.05) and the mediation
results is partial mediation. Model II results showed that the direct effect is significant as the (P >0.05)
and the indirect effect is insignificant as the (P <0.05) so there is no mediation.
H1a: SMM has a significant effect on ITP.

Journal of Business and Social Review in Emerging Economies Vol. 6, No 4, December 2020
1556
Regression analysis findings shows that SMM has significant impact on ITP, as β is .322 with
significant level of P<= 0.005. According to the findings, which are supporting the hypothesis that SMM
is significantly related to ITP. Thus, this hypothesis is accepted.
H1b: TMM has a significant effect on ITP.
Results also indicates the association between TMM and ITP is positive. The results explain that β =
.325 at .000 significance level. This relation among variables are considered to be significantly thus the
hypothesis is accepted.
H1c: There is positive relationship between WOM and ITP.
Results represents the connection between WOM and ITP. The results show that β =.523 at .000
significance level. The significant level has been proven by the sig. value as .000 having p value <
0.001. Thus, hypothesis is accepted.
H2: There is positive relationship between CC and ITP.
Same as the case with H2 the results shows that there is positive significant relationship with the CC and
ITP and the β = .553 at .000 significance level.
H3a: CC mediates the relationship among SMM and ITP.
The results are showing that CC has partially mediate the relationship with ITP and SMM .Results
explain that the direct and indirect effect both are significant as the (P >0.05) and the mediation results is
partial mediation. Thus, the above stated hypothesis is accepted.
H3b: CC mediates the relationship among TMM and ITP.
Same as the case with H3b where result values suggest that the CC has partially mediate with TMM and
ITP. Thus, the above stated hypothesis is accepted. . Results indicates that the direct and indirect effect
both are significant as the (P >0.05) and the mediation results is partial mediation.
H3c: CC mediates the relationship among WOM and ITP.
The results show that CC does not mediate the relationship among WOM and ITP. Results showed that
the direct effect is significant as the (P >0.05) and the indirect effect is insignificant as the (P <0.05) so
there is no mediation. Thus, the above stated hypothesis is rejected.
5. Discussions
With the sheer rise in Information Technology and computing, a new era of marketing and
advertisement has been started. The face of advertisement has been changed dramatically and its ability
to provide the information and communication to target customers has been increased manifolds.
Internet has become the biggest facilitator of communication through Social Media as well as Word of
Mouth Communication. The growth of Social Media Marketing globally as well as in Pakistan, paved
new ways for marketers and researchers to further investigate that how Traditional Media Marketing,
Social Media Marketing and Word of Mouth influence the behaviors of customers and eventually effect
Consumer Purchase Intentions. The purpose of this study was to explore the possible influence of TMM,
SMM and WOM on ITP through CC in the Samsung Company.
SMM have a strong positive influence on intention to purchase. The findings have revealed the
significant impact of TMM and WOM on ITP. Thus, our results are in line with prior studies which
found SMM a significant factor be affecting consumer intention to purchase (Alalwan, 2018). The prior
findings also indicate that TMM have significant impact on intention to purchase (Mustafa & Al-
Abdallah, 2020). On another hand, results show from this study that WOM have a significant effect on
consumer intention to purchase. Previous studies show that WOM have strong positive effect on ITP

Journal of Business and Social Review in Emerging Economies Vol. 6, No 4, December 2020
1557
(Nuseir, 2019).Additionally, results also indicate that CC have direct and mediating effect on intention
to purchase. The prior findings also indicate that CC have direct impact on ITP (Amoako, Kutu-Adu,
Caesar, & Neequaye, 2019). From the results, we can observe that the influence of CC partially mediates
the relationship between SMM and TMM on ITP. The Result also indicates that CC does not mediate
the relationship between WOM and ITP in the context Samsung brand in Pakistan.
6. Conclusion
In this study It is found that all the developed hypothesis (H1a, H1b, H1c, H2 and H3a,H3b) are
accepted with some changes as it can be observed that there occurs positive relationship between the
(SMM, TMM, WOM) and ITP. H3c hypothesis is rejected in this study. Similarly results prove that CC
has positive significant impact on ITP. Finally, CC mediates the relationship between the (SMM, TMM,
WOM) and ITP. It is concluded that there exists a partial mediation between the (SMM, TMM) and ITP.
Further it is analyzed that there is no mediation among the WOM and Customer Purchase Intention.
Further reliability values also suggested that data is clean and the questioners which is used to gather the
data is satisfactory, Confirmatory Factor Analysis also depicts that all the item values are within the
given ranges and model is fit according to those values and the indices for structural equation modelling
are also within the range of indices, proposing the fitness of model.
This research is an attempt to provide literature and good results regarding Impact of SMM, WOM and
TMM on Purchase Intentions through customer commitment among professional accountants working in
small audit firms of Pakistan who were using Samsung mobile as they are more conscious about their
products particularly mobile technologies. Marketing activities are considered as a key element for the
companies so from findings it can be conclude that when the customers are aware about the brands and
services through the (SMM, TMM, WOM) then customers have higher Intention to Purchase. Similarly,
when the customers remain Commit with the brands and services then the Customer Purchase Intention
also high.
7. Implications for Theory and Practice
To the researcher’s knowledge, the effects of Social Media Marketing and Traditional Marketing,
Customer Commitment and Word of Mouth Marketing on Customer Purchase Intentions have been
simultaneously studied for the first time in literature. In this study, the above mentioned three marketing
concepts have been differentiated and the effect of these different methods on Cutomer Purchase
Intentions is compared.
This study provides additional information about how Social Media Marketing, Traditional Media
Marketing and WOM enhances Customer Commitment and eventually how Customer Commitment
explains the Customer Behavior and effect the intention to Purchase. The results of this study suggest
that Samsung Company may develop Online Advertisement Strategies that create higher Customer
Satisfaction and meet the expectations of customers that will lead to favorable Purchase Intentions of
customers. This infers that companies can enhance sales through direct purchases from online sources by
giving more focus on Social Media Marketing and advertising. Moreover, more customers can be
attracted through Social Media Advertising on various channels.
Furthermore, Traditional Media Marketing should not be ignored by the companies, as Digital Media
and WOM is not being embraced by all the age groups and social classes. As the results show that
Traditional Media Marketing blended with Digital Marketing and WOM produces significant effect on
Customer Intention to Purchase. In addition, Mobile Technology companies like Samsung must give
importance and focus on providing the customers with after sale services through telecommunication for
complaint handling and other services, through Social Media channels that is Instagram, Facebook,
Twitter and others. It infers the significance of a diversified advertisement plan of Samsung through
Digital and Traditional Media to provide customers better services and to enhance customer
commitment and satisfaction.
Samsung should also use active social media campaign, free call centers from customer services, and
email for customer complaints and information. Positive Word of Mouth can be generated through

Journal of Business and Social Review in Emerging Economies Vol. 6, No 4, December 2020
1558
incentivizing and giving special discounts to the customers that share and spread the positive message,
ads and other contents of the company on various Social Media channels. Opinion leaders and
celebrities can also be used to promote the company through Social Media Campaigns and to attract
more customers by creating opinion leader influence. Lastly, the content of messages used in Social
Media Campaign must be carefully designed as it is crucial to give importance to customer expectations.
Market research should also be conducted by Samsung for better understanding of customers’
preferences and need, and this insight can be used for development of customized and high quality
products that could lead to Customer Satisfaction and Customer Commitment and thus generate positive
Purchase Intention.
8. Limitations and Future Research
As other studies, this study also have some limitations. The research design used in this study was cross
sectional and due to limited time and resources, data collected at a single location that is Pakistan, which
limits the generalizability of the findings. Future research may be conducted through longitudinal
design. Moreover, the study was focused only on a specific high-involvement product that is
Smartphone. Due to this the applicability of the results of this study is limited to high involvement
products only. Future research may be extended to other product categories. Furthermore, future
research may study the effect of other theoretical constructs or potential moderators (such as Price
discount on the SMM, TMM, and WOM). Only Pakistan” was surveyed in this research therefore it is
suggested that in future research other big and developed countries should be considered. In this
research our sample size was controlled but in future research sample size can be increased. This study
used quantitative data, whereas qualitative data should be used in future research. In this research
respondents were professional accountants working in small accounting firms of Pakistan but in future
study respondents belong to other sectors should be focused.
References
Aad, G., Abbott, B., Abdallah, J., Abdelalim, A., Abdesselam, A., Abdinov, O., . . . Abreu, H. (2012).
Electron performance measurements with the ATLAS detector using the 2010 LHC proton-
proton collision data. The European Physical Journal C, 72(3), 1909.
Abzari, M., Ghassemi, R. A., & Vosta, L. N. (2014). Analysing the effect of social media on brand
attitude and purchase intention: the case of Iran Khodro company. Procedia-Social and
Behavioral Sciences, 143, 822-826.
Ajina, A. S. (2019). The perceived value of social media marketing: an empirical study of online word-
of-mouth in Saudi Arabian context. Entrepreneurship and Sustainability Issues, 6(3), 1512-1527.
Alrwashdeh, M., Emeagwali, O., & Aljuhmani, H. (2019). The effect of electronic word of mouth
communication on purchase intention and brand image: An applicant smartphone brands in
North Cyprus. Management Science Letters, 9(4), 505-518.
Alalwan, A. A. (2018). Investigating the impact of social media advertising features on customer
purchase intention. International Journal of Information Management, 42, 65-77.
Amoako, G. K., Kutu-Adu, S. G., Caesar, L. D., & Neequaye, E. (2019). Relationship Marketing and
Repurchase Intention in Ghana’s Hospitality Industry: An Empirical Examination of Trust and
Commitment. Journal of Relationship Marketing, 18(2), 77-107.
An, F., Bai, J., Balantekin, A., Band, H., Beavis, D., Beriguete, W., . . . Brown, R. (2012). Observation
of electron-antineutrino disappearance at Daya Bay. Physical Review Letters, 108(17), 171803.
Arora, A. S., & Sanni, S. A. (2019). Ten years of ‘social media marketing’research in the Journal of
Promotion Management: Research synthesis, emerging themes, and new directions. Journal of
Promotion Management, 25(4), 476-499.
Arndt, J. (1967). Role of product-related conversations in the diffusion of a new product. Journal of
Marketing Research, 291-295.
Bansal, H. S., & Voyer, P. A. (2000). Word-of-mouth processes within a services purchase decision
context. Journal of service research, 3(2), 166-177.
Barnes, N., Lescault, A., & Andonian, J. (2012). Social media surge by the 2012 Fortune 500: Increase
use of blogs, Facebook, Twitter and more. Charlton College of Business Center for Marketing
Research: University of Massachusetts Dartmouth, North Dartmouth, MA, available at: www.
Journal of Business and Social Review in Emerging Economies Vol. 6, No 4, December 2020
1559
umassd. edu/cmr/socialmedia/2012fortune500/(accessed November 11, 2012).
Bradley, S. P., & Bartlett, N. (2011). Social Networks: The Portals of Web 2.0.
Cheung, M. L., Pires, G., & Rosenberger, P. J. (2020). The influence of perceived social media
marketing elements on consumer–brand engagement and brand knowledge. Asia Pacific Journal
of Marketing and Logistics.
Duffett, R. G. (2015). Facebook advertising’s influence on intention-to-purchase and purchase amongst
Millennials. Internet Research, 25(4), 498-526.
Erkan, I., & Evans, C. (2016). The influence of eWOM in social media on consumers’ purchase
intentions: An extended approach to information adoption. Computers in Human Behavior, 61,
47-55.
Fishbein, M., & Ajzen, I. (1977). Belief, attitude, intention, and behavior: An introduction to theory and
research.
Hellier, P. K., Geursen, G. M., Carr, R. A., & Rickard, J. A. (2003). Customer repurchase intention: A
general structural equation model. European journal of marketing, 37(11/12), 1762-1800.
Iwane, M. K., Edwards, K. M., Szilagyi, P. G., Walker, F. J., Griffin, M. R., Weinberg, G. A., . . . Balter,
S. (2004). Population-based surveillance for hospitalizations associated with respiratory syncytial
virus, influenza virus, and parainfluenza viruses among young children. Pediatrics, 113(6),
1758-1764.
Jansen, B. J., Zhang, M., Sobel, K., & Chowdury, A. (2009). Twitter power: Tweets as electronic word
of mouth. Journal of the American society for information science and technology, 60(11), 2169-
2188.
Jacobson, J., Gruzd, A., & Hernández-García, Á. (2020). Social media marketing: Who is watching the
watchers? Journal of Retailing and Consumer Services, 53.
Kaplan, A. M., & Haenlein, M. (2010). Users of the world, unite! The challenges and opportunities of
Social Media. Business horizons, 53(1), 59-68.
Khan, I., Hollebeek, L. D., Fatma, M., Islam, J. U., & Riivits-Arkonsuo, I. (2020). Customer experience
and commitment in retailing: Does customer age matter? Journal of Retailing and Consumer
Services, 57, 102219.
Khodabandeh, A., & Lindh, C. (2020). The importance of brands, commitment, and influencers on
purchase intent in the context of online relationships. Australasian Marketing Journal (AMJ).
Lehmann, B. A., Ruiter, R. A., & Kok, G. (2013). A qualitative study of the coverage of influenza
vaccination on Dutch news sites and social media websites. BMC public health, 13(1), 547.
Lester, D., Serkedakis, M., & Tudor, R. K. (2016). Student Perspective on the Significance of Social
Media On Sales Prospects: The Antithesis of Sales Professionals.
McClure, C., & Seock, Y.-K. (2020). The role of involvement: Investigating the effect of brand's social
media pages on consumer purchase intention. Journal of Retailing and Consumer Services, 53,
101975.
McGriff, J. A. (2012). A conceptual topic in marketing management: the emerging need for protecting
and managing brand equity: the case of online consumer brand boycotts. International
Management Review, 8(1), 49.
Mahadin, B. K., & Akroush, M. N. (2019). A study of factors affecting word of mouth (WOM) towards
Islamic banking (IB) in Jordan. International Journal of Emerging Markets.
Martins, J., Costa, C., Oliveira, T., Gonçalves, R., & Branco, F. (2019). How smartphone advertising
influences consumers' purchase intention. Journal of Business Research, 94, 378-387.
Morgan, R. M., & Hunt, S. D. (1994). The commitment-trust theory of relationship marketing. The
journal of marketing, 20-38.
Moslehpour, M., Dadvari, A., Nugroho, W., & Do, B.-R. (2020). The dynamic stimulus of social media
marketing on purchase intention of Indonesian airline products and services. Asia Pacific Journal
of Marketing and Logistics.
Mulhern, F. (2009). Integrated marketing communications: From media channels to digital connectivity.
Journal of marketing communications, 15(2-3), 85-101.
Mustafa, S., & Al-Abdallah, G. (2020). The evaluation of traditional communication channels and its
impact on purchase decision. Management Science Letters, 10(7), 1521-1532.
Niininen, O., Buhalis, D., & March, R. (2007). Customer empowerment in tourism through consumer
Journal of Business and Social Review in Emerging Economies Vol. 6, No 4, December 2020
1560
centric marketing (CCM). Qualitative Market Research: An International Journal, 10(3), 265-
281.
Nuseir, M. T. (2019). The impact of electronic word of mouth (e-WOM) on the online purchase
intention of consumers in the Islamic countries–a case of (UAE). Journal of Islamic Marketing.
Poushneh, A., & Vasquez-Parraga, A. Z. (2019). Emotional bonds with technology: the impact of
customer readiness on upgrade intention, brand loyalty, and affective commitment through
mediation impact of customer value. Journal of theoretical and applied electronic commerce
research, 14(2), 0-0.
Ramanathan, U., Ramanathan, U., Subramanian, N., Subramanian, N., Parrott, G., & Parrott, G. (2017).
Role of social media in retail network operations and marketing to enhance customer
satisfaction. International Journal of Operations & Production Management, 37(1), 105-123.
Reyes-Menendez, A., Saura, J. R., & Martinez-Navalon, J. G. (2019). The impact of e-WOM on hotels
management reputation: exploring tripadvisor review credibility with the ELM model. IEEE
Access, 7, 68868-68877.
Saxena, A., & Khanna, U. (2013). Advertising on social network sites: A structural equation modelling
approach. Vision, 17(1), 17-25.
Sillanpää, T. (2020). Building customer engagement in traditional media versus social media platforms:
Focus group study with high and low involvement products.
Thackeray, R., Neiger, B. L., Hanson, C. L., & McKenzie, J. F. (2008). Enhancing promotional
strategies within social marketing programs: use of Web 2.0 social media. Health promotion
practice, 9(4), 338-343.
Tiruwa, A., Yadav, R., Suri, P. K., Shainesh, G., & Sivakumaran, B. (2016). An exploration of online
brand community (OBC) engagement and customer’s intention to purchase. Journal of Indian
Business Research, 8(4).
Tümer, M., Aghaei, I., Öney, E., & Eddine, Y. N. (2019). The impact of traditional and social media
marketing on customers’ brand trust and purchase intentions in the Turkish airline market.
Journal of Research in Emerging Markets, 1(4), 55-68.
Xu, Y. C., Zhang, C., & Xue, L. (2013). WITHDRAWN: Measuring product susceptibility in online
product review social network. Decision Support Systems.
Zhou, A., Paranjape, J., Brown, T. L., Nie, H., Naik, S., Dong, B., . . . Colmenares, C. (1997). Interferon
action and apoptosis are defective in mice devoid of 2′, 5′‐oligoadenylate‐dependent RNase L.
The EMBO journal, 16(21), 6355-6363.

Journal of Business and Social Review in Emerging Economies Vol. 6, No 4, December 2020
1561
Volume and Issues Obtainable at Center for Sustainability Research and Consultancy
Journal of Business and Social Review in Emerging Economies ISSN: 2519-089X (E): 2519-0326
Volume 6: No. 4, December 2020
Journal homepage: www.publishing.globalcsrc.org/jbsee
Strategic Dimensions of CPEC: Role of Regional and International Powers
1Muhammad Ijaz Latif, 2Muhammad Tayyab Zia 1Chairman Department of International Relations, The Islamia University of Bahawalpur, Pakistan,
2PhD Scholar, University of the Punjab Lahore, Associate Lecturer, The Islamia University of
Bahawalpur, Pakistan
ARTICLE DETAILS ABSTRACT History Revised format: November 2020 Available Online: December 2020
Indian Ocean, along with its chokepoints and Sea Lanes of
Communications, is considered to be the significant strategic
maritime arena. The area has remained under the influence of the US.
India, being a largest littoral state of the said ocean, has a strong say
here. Sino- Pakistan strategic collaboration and convergence over the
construction of Gwadar and CPEC would not only serve the
commercial interests of both of the states, rather it would also
strengthen their strategic and defense position in the region. On the
Beijing’s part, China would, to a considerable extent, neutralize its
“Malacca Dilemma”. And on Islamabad’s part, it would serve to be a
deterrent to any aggressive design of her arch rival India. It is
because on the one hand it would enhance the strategic depth of
Pakistan, and on the other hand integrity of Pakistan would be
indispensible for China. And any attempt to destabilize Pakistan
could provoke China, so Pakistan’s integrity would be sine qua non
for China.
© 2020 Center for Sustainability Research and Consultancy Pakistan under
a Creative Commons Attribution-NonCommercial-ShareAlike 4.0
Keywords CPEC, US, Pakistan, China,
Indian Ocean, CARs, Russia,
Iran, India
JEL Classification
M10, M14
Corresponding author’s email address: [email protected]
Recommended citation: Latif, M. I. & Zia, M. T. (2020). Strategic Dimensions of CPEC: Role of
Regional and International Powers. Journal of Business and Social Review in Emerging Economies,
6(4), 1561-1569
1. Introduction
Alfred Mahan in 1890 stated that “whoever controls the Indian Ocean will dominate Asia, the destiny of
the world will be decided on its waters” (Abbasi, 2015). Contemporary maritime power politics and geo-
strategic struggle of various rising international and regional powers is verifying the saying of the said
scholar. Indian Ocean has been evolved to be the center stage of thrust for power of numerous players.
Strategic importance of Indian Ocean and significance of its Sea Lanes of Communications has made the
area, the focus point of US, India China and Pakistan.
Indian Ocean has been remained under the impact of hegemonic hankerings of the US since few
decades, yet the economic and political rise of China has set the question mark on previous standing of
the US. India, being a major littoral state of the Indian Ocean, too has the candidature of the ocean
which perplexes its immediate neighbor Pakistan. Any rift between New Delhi and Beijing can
consequently bring the region at the brink of a maritime standoff not only between the said states, rather
various other actors too could involve. It is because the area has the some most sensitive chokepoints i.e.
Strait of Hormuz, Bab el Mandeb and Malacca strait, all of which play decisive role in world trade.
Journal of Business and Social Review in Emerging Economies Vol. 6, No 4, December 2020
1562
Strait of Hormuz joints Persian Gulf to the Arabian Sea and is located between Oman and Iran. Being
one of the most crucial chokepoints, almost seventeen million barrel oil on daily basis is being
transported through the Strait , as well as eighty five percent of crude oil is exported through the strait to
Asia (Ahmad, 2015).
Washington has devised both bilateral and multilateral approaches to maintain the status quo in the said
area with the objective of diminish the probability of emergence of any state or an alliance that can pose
a threat to US interests there. But changing strategic patterns in the maritime power structure have made
the Indian Ocean an upcoming arena of competition for international and regional actors. In order to deal
with this emerging environment, Washington is developing its strategic relations with New Delhi to
counter any situation, growing Chinese role, which could be a matter of concern for both of the states
(Smith, 2016: 4, 5).
Construction of Gwadar port and CPEC too are anticipated to alter the status quo and power patterns of
South Asia and Indian Ocean. It is because on the Islamabad’s part, Pakistan would step forward
towards its second strike naval capability and On Beijing’s part China would have a direct access to
Indian Ocean. These developments have the potential to pose a severe challenge to the long cherished
interests of US and India to exert a strong position in the region.
1.1 Strategic Significance of CPEC
Having a unique geo- strategic location, Pakistan is located at the juncture of energy deficient and
energy proficient countries. CPEC is considered to be a pilot project of One Belt One Road initiative of
China. Industrialized zones, energy infrastructure, communication infrastructure, and Gwadar port are
the core areas of CPEC. Although commercial significance and economic dimension of CPEC is
palpable yet few factors limit its economic side. It is assumed that CPEC would be a transit trade route
for Central Asian Republics (CARs) and Afghanistan which since previous few years depend upon Iran
significantly. It is speculated that utilization of Gwadar and CPEC by upper discussed landlocked states
for their trade would be unlikely in near future for certain reasons. To persuade Kabul and CARs to opt
for CPEC and Gwadar as alternative route for their international trade, Islamabad will have to ensure
economic and political stability along with efforts for sustained peace and stability in Afghanistan. But
as for as feeble maritime standing of Pakistan and aspirations of China to have a more proactive role in
maritime politics are concerned, CPEC and Gwadar would have positive impacts in strategic and
security terms.Moreover, CPEC would play a key role in strengthening the land based defense of
Pakistan and security situation in Baluchistan. It is because CPEC is considered to be a security concern
for India (Pande, 2015: 22).
Assuming the geographical position of the Gwadar port, it could be a listening post in order to monitor,
and if, essential, to intervene in highly significant maritime oil trade region of the world, Strait of
Hormuz. Some strategists are of the view that Gwadar port and CPEC would contribute in enhancing the
bargaining position of Islamabad in regional and global arena while negotiating with other players.
Furthermore, if both key regional players, Islamabad and New Delhi, have a naval confrontation,
Gwadar would be a better geo- strategic alternative as compared to vulnerable and heavily burdened
ports of Karachi. It is because on the one hand Karachi is geographically close to India and naval
barricade of Karachi is assumed to be a crucial tactical option for India with reference to its ‘cold start
doctrine’ It is because according to the claims of New Delhi, its strategic doctrine has been converted
from pro- active to offensive and reactive to defensive. The said doctrine was releasedwith the title of
The Indian Army Doctrine in 2004. The anticipated offensive move is intended to have a swift
penetration in Pakistan’s territory coupled with the air strikes and naval barricade of Karachi. Indian
military advancement in territory of Pakistan is having the ambition to hit the military installations of
Pakistan and barricade of Karachi is said to cease the energy and arms supplies of Pakistan
(Chandramohan, 2015: 97).
Gwadar and CPEC would be the primary line of defense for Pakistan in that worst case scenario.
This line of defense has a two- pronged aspect.
Journal of Business and Social Review in Emerging Economies Vol. 6, No 4, December 2020
1563
(i) Logistical network of CPEC would serve to be a better option for military forces of
Pakistan to move swiftly according to the given situation.
(ii) a. If Eastern route, and Western route also to certain extent, of CPEC is threatened by
hegemonic designs of India, it would automatically threaten the Chinese strategic and
commercial interests that could prompt China to intervene in order to secure its
installations.
b. As for as Gwadar is concerned, a well-equipped naval base here would make the barricade
of Karachi by India meaningless (Boyce, 2017: 22).
On the other hand Pakistan worryingly relied on ports of Karachi both for commercial and naval
operations, not having an equal alternative to Karachi. So the barricade of Karachi only could severely
hamper the naval security of Pakistan. With the development of deep sea port of Gwadar, Islamabad
would have a resilient alternative to Karachi in any case of naval adventure of its adversary, New Delhi
(Hussain, Javiad, Sabri, Ilyas, Batool, 2014: 602).
Sino-Pakistanbilateral naval collaboration is expected to be further augmented with the construction of
Gwadar port and CPEC. Both of the states would be in a better environment for joint military and naval
exercises. Restructuring of regional and international power equations have compelled Islamabad and
Beijing to be more close to each other. A China-US Forum’s report states that Washington is courting
New Delhi with the declared and overt objective of a lead role in the Indian Ocean region. New Delhi’s
close ties with states that Beijing is apprehensiveof, compel both Pakistan and China to deepen their
bilateral ties. (Butt and Butt, 2015:30).
While considering Tehran, Iran would build an oil refinery accompanied by previously planned Iran-
Pakistan Gas Pipeline and in this perspective, CPEC is anticipated to have a trilateral aspect. First,
Tehran would export her gas and oil related products to Beijing and Islamabad, second, for her energy
requirements, China would have a more reliable source and third, Pakistan, on the one hand, would
serve to be a nucleus for Sino-Iran bilateral trade, and on the other hand, convergence of interests of two
major actors, Beijing and Tehran, with Islamabad, Pakistan’s position in the region would be more
strengthened in the region. All, Beijing, Tehran and Islamabad, have ambiguous ties with New Delhi,
except Indo- Iran ties, which are to a certain extent objectively oriented, But as for as increased Indo-US
role in region is concerned, it seems more likely that Iran would make attempts to limit their role.
Diminishing the strength of Baloch nationalists, assumed to be Indian backed, too is the converged
objective of the said trilateral virtual alliance. Construction of Gwadar and CPEC would further deepen
the objective of these states regarding peace and stability in Baluchistan, as peaceful Baluchistan is the
pre-requisite for the success of the project (Wolf, 2018:170).
It is perhaps earlier to assume that Gwadar would be utilized for combined naval operations too by
Beijing and Islamabad, but energy, security and trade are evident to be focused by both of the partners.
Pakistan’s orientations in this regard, in order to operationalize the Gwadar port for non-commercialized
dimension too, is more pro-active. Although Chinese stance, in this perspective, is not very vibrant, yet
partialtakeover of Gwadar by Chinese authority in not deemed only to secure her energy trade route,
rather increased role in Indian Ocean too is the interest of China (Jamshed, 2015).
It is due to the ‘Malacca dilemma’ that the Asian giant is facing because of her massive dependence
upon Malacca Strait, a bottleneck between Indonesia and Malaysia. This narrower and congested area
can easily be blocked and consequently having the lesser energy supply for China. Moreover, Malacca
Strait is considered under the dominance of the US, which is not threatening the energy supply of China
at the current moment but monitoring of these supplies by the US is more likely and probability of
blockade of the said strait in any event of confrontation between two powers, Beijing and Washington, is
not precluded (Snedden, 2016:19).
Therefore, for China, Gwadar is more than mere an alternative to Malacca Strait, rather Beijing views it
to be the staging ground of various maritime operations. It is considered to be the first opportunity for
Beijing to operate at a port in Indian Ocean at such a larger scale for her submarines and ships coupled
Journal of Business and Social Review in Emerging Economies Vol. 6, No 4, December 2020
1564
with refueling and refurbishment of Chinese vessels, enhancing influence in Indian Ocean. The
discussed development would anticipated to assist Islamabad and Beijing to counterbalance specifically
New Delhi, and Washington in general, in South Asian regional affairs and Indian Ocean. Although
China has assisted various other sea ports too in the Indian Ocean littoral states i.e. Bangladesh, Sri
Lanka etc, yet these projects don’t undermine the strategic significance of CPEC and Gwadar. It is
because on the one hand Islamabad is having a rift with New Delhi, unlikely to Colombo and Dhaka,
and on the other hand Gwadar would be opted to be a transit trade that would bypass Malacca Strait,
which is implausible in the case of ports of Bangladesh and Sri Lanka. As having the potential to
restructure the power equation in Indian Ocean and South Asia, specifically in hub of global trade oil,
Strait of Hormuz, CPEC would make Islamabad capable to marginalize the naval dominance of New
Delhi in the region. For Islamabad, CPEC would be a deterrent to New Delhi for latter’s alleged
intervention in Pakistan generally and Baluchistan specifically, because of the fact that if Chinese
workforce is assassinated or attacked by insurgents, assumed to be partially Indian backed, that could
consequently create a more rift in bilateral Sino- India relations. New Delhi would have to experience a
severe response from Beijing, ultimately benefitting Pakistan (Wagner, 2016:2).
1.2 CPEC and Indian Concerns
New Delhi percepts CPEC to be a threat to its hegemonic designs in Arabian Sea, Strait of Hormuz,
Persian Gulf and in the region. It is because as being a major trade partner of India, China shares
common economic advantages with the former state. Indian strategists are of the view that it could be a
long- term security concern if Beijing operates through Gwadar as that development would enable China
to have a strategic edge in Indian Ocean and Strait of Hormuz. For that very reason, India has overtly
asserted concerns regarding the CPEC (Jahangir &Anis, 2016:13). Prime Minister of India Narendra
Modi has called CPEC as “unacceptable”. Sujatha Singh, Foreign Minister of India expressed that New
Delhi has raised the issue of CPEC and Gwadar (Ranjan, 2015: 14).
Minister of Foreign Affairs of India (2014- 2919), Sushma Swaraj expressed that the Government of
India has noticed the reports regarding joint efforts of Islamabad and Beijing in order to build
infrastructure in POK which includes the development of CPEC as well. She further said that India has
sent its apprehensions to China regarding their bilateral, Islamabad and China, actions in POK and
appealed to terminate these arrangements (Sekhon, 2016: 184).
In past, New Delhi believed that potential rise of economy of India would compel Islamabad to be
agreed to collaborate on East- West alignment. It was because of Indian attempts to persuade Pakistan to
grant her transit rights for trade with Central Asian Republics. Whereas, CPEC would make Pakistan
capable to jeopardize these Indian attempts and embark North- South alignments of cooperation and
attract Central Asian Republics towards the logistic advantage of CPEC and deep sea port of Gwadar.
Consequently, irrespective of potential economic rise of New Delhi in the decades ahead, Central Asian
Republics would find themselves to have a more plausible trade route and more reliable trade partner,
Beijing (Zargar, 2017: 5).
As a matter of fact, a significant part of CPEC passes through the Azad Jammu and Kashmir.
Completion of CPEC would reinforce the legitimacy of Islamabad’s stance regarding the Kashmir
conflict, which enhances the anxieties of New Delhi. Moreover, that could lead towards the termination
of historic aspirations of India to bring Pakistan under the hegemony of the former, which could only be
possible if Islamabad would be under the economic umbrella of New Delhi. But that would become
meaningless after the construction of Gwadar port and completion of CPEC, subsequently hindering the
hegemonic aspirations of India (Khan, 2018: 93). Furthermore Beijing has strived to convince Islamabad
to convert Iran- Pakistan- India gas pipe line (IPI) to Iran- Pakistan- China, which worried New Delhi
because CPEC would catalyze the process of conversion of energy trade routes to China and making it
for India a zero-sum-game (Khayyam, 2014: 4).
Kazakhstan, Kyrgyzstan, China and Pakistan have agreed upon a quadrilateral trade and transit
agreement too is under consideration. With the diplomatic assistance of China, some of the upper

Journal of Business and Social Review in Emerging Economies Vol. 6, No 4, December 2020
1565
discussed states have showed their consent to utilize Gwadar port for their trade in the long run. This
Sino-Pak bilateral quest to persuade Central Asian Republics towards CPEC and Gwadar would not only
strengthen their economies, rather it would hamper the role of New Delhi in these states. Some of the
Indian strategists have suggested a two- pronged military solution, annexing Gilgit Baltistan, as for as
CPEC is concerned. On the one hand that would serve to be a direct Indian access to Central Asia via
Afghanistan and on the other hand the strategic move would cut the contagious land based Sino-Pakistan
border, consequently leaving CPEC with no meaning (Zargar, 2017:4).
Moreover, strengthened economy of Pakistan in the wake of CPEC would lead towards increase in
military budget of Pakistan. Pakistan withsophisticated military potential would have no interest in
bilateral economic cooperation with India, which is aprerequisite tomarginalize the rift between both of
the key regional actors. Moreover, Islamabad would more confidently internationalize the voice of
Kashmir, in order to prompt international community, if she would have a strong military potential. That
would hamper the regional aspirations of New Delhi, as she negates any regional, international or any
multilateral solution of the Kashmir conflict (Wagner, 2016: 2).
As for as Indian perspective is concerned, challenge to the interests of the New Delhi in the Indian
Ocean Region has compelled India to increase her strategic collaboration with the US. In the aftermath
of construction of Gwadar port, acquisition of sea based second strike capability would be more
plausible for Pakistan due to the anticipated sophistication of Pakistan Navy. The said development
would be more detrimental for India when it would be coupled with the likely competence of CPEC and
Gwadar to provide the logistic support to Chinese Navy. Consequently and unsurprisingly, India has
given access for the US to her military bases with the objective of reciprocity of import of sophisticated
technology from the US (Rashid, 2018: 16).
1.3 CPEC and US Concerns
Due to the geo- political significance of South Asia, US is having a long history of its involvement in the
region. As future emergence of two major powers, Beijing and New Delhi and potentially among them
Beijing, is anticipated in the region, Washington has to ensure her military presence in South Asia
(Lashari, 2016:176).
Although US has not expressed her apprehensions regarding CPEC, yet US strategic objective, halt the
probability of emergence of any international power in global arena, it could be analyzed that US would
not remained indifferent regarding CPEC. It could be reinforced by the focus of various writings and
statements of US officials on geo- strategic importance of Baluchistan. Some of them have suggested the
independence of Baluchistan to fulfill the Washington’s strategic interests in South Asia. Director of
Asia Program, Selig Harrison, offered US to seek an independent Baluchistan. He not only presented the
indication of independence of Baluchistan, rather step by step comprehensive course of actions too was
purposed. He is of the view that, on the one hand, independent Baluchistan would marginalize the
regional repercussions that Washington is facing and on the other hand decrease the regional anarchy.
That would be utilized to be a “safe playground” for covert and overt operations of the USin order to
achieve her strategic interests in the region. AUS military strategist, Lt. Col. Ralph Peter too presented
the same motive of revising the land borders of Iran, Afghanistan and Pakistan. In his article “Blood
borders” he stated that the current border demarcations of these said states are not natural and their
revision would be in the long-term strategic interest of the US (Hilali, 2014).
Selig Harrison, taking a step forward, wrote that to dissuade China of what she is doing in Pakistan,
Opting Gwadar to be an alternative trade route, US has to “play hardball” by backing separatists in
Baluchistan. Assistance of the US to separatist movements would avert China from constructing the
naval base in Gwadar. Statements and writings of these responsible US officials reveal that Washington
would not only have no objection on intelligence activities of Mosad and RAW in Baluchistan rather
US’ own intelligence monitoring in this regard is even cannot be precluded. An Indian defense analyst,
Amarjit Singh too is of the view that only a weakened Islamabad is in the strategic interest of New Delhi
as only then India would be able to concentrate solely on the rise of Chines influence in South Asia.
SeligHarrison further argued that independent Baluchistan under the influence of the US would limit the

Journal of Business and Social Review in Emerging Economies Vol. 6, No 4, December 2020
1566
Iranian influence in Persian Gulf. Discussed ambitious regional designs of New Delhi and their
convergence on them has made their apprehensions evident regarding bilateral collaboration of
Islamabad and Beijing on construction of Gwadar port and CPEC (Hilali, 2014).
Historically, Indian Ocean’s exits and entrances along with its chokepoints and South Asia have
remained under the hegemonic influence of the US. Due to her maritime vulnerabilities, specifically in
Strait of Malacca, China too was not in a position to be an potential equal of the US. It is because
massive dependence of Beijing on Strait of Malacca and the said area too is under the influence of the
US. Any possible Chinese threat to the interests of the US would only result into increased trouble for
China for her trade which traverses the said strait. CPEC and Gwadar could be a two pronged concern
for the US. On the one hand China would have a direct access to Indian Ocean and on the other hand
Chinese dependence on Strait of Malacca would be reduced to a significant extent. Resultantly, a more
proactive Chinese role in Indian Ocean maritime politics is anticipated. Consequently, New Delhi and
Washington in 2015 signed a Joint Strategic Vision, the era of bilateral Sino- Pakistan collaboration on
CPEC and Gwadar port. Principal Deputy Assistant Secretary of State for South and Central Asian
Affairs, Richard E. Hoaglan argued that strategic vision with New Delhi is a distinctive step that would
exert a clear indication to that country which is having the ambitions to sabotage the global norms. This
development illustrates South Asian and maritime concerns of the New Delhi and Washington about
CPEC (Jia, 2017: 105).
Although Washington has not overtly opposed CPEC, yet her full scale indifference in future seems less
likely. It is because, due to the rift between Russia and the US, Washington is anticipated to marginalize
her role and let Beijing to play the role of a balancer. But in the long run, when power equation of the
region would be altered, Washington’s intentions to interpret CPEC to be a zero sum game and attempt
to jeopardize it cannot be precluded, as CPEC could also be a matter of concern for the US designs in
Middle East, Persian Gulf and resource rich area of Central Asia (Butt & Butt, 2015: 39).
Although Islamabad and Beijing have negated those reports which have argued about the naval potential
of Gwadar as well as US concerns. SussaneKoelbl, a German Journalist, constructed compatibility
between Indo- US alliance and role of Gwadar in future maritime power structure in Indian Ocean.
Arguing further, she stated that New Delhi and Washington, both, assume construction of Gwadar port
to be a challenge to their interests. Bilateral construction of Gwadar port, by Beijing and Islamabad, is
anticipated with the objective of stationing warships of China. Various Indian officials have stated that
CPEC and construction of Gwadar would make Beijing capable of setting a sophisticatedly equipped
naval stage on the West of India (Jamshed, 2015).
Washington too has developed her own vision of New Silk Road with the intention of increasing her role
in Central and East Asia. The US Defense Secretary, James Mattis, reclaimed theIndian assertions that
CPEC traverses in the disputed area of Kashmir and GilgitBaltistan. The statement reveals the overt tilt
of Washington towards New Delhi, as a senior US official has apprehensions regarding the mega project
of CPEC. Intensified international propaganda too can be examined in the same context of Indo- US
anxieties over more velocity of One Belt One Road as compared to the US given New silk Road (Khan,
2019: 185).
Moreover, US intends to take Pakistan as its area of influence. Be it containment of Communism and
cold war, or be it war against terrorism. Although Islamabad has developed deep ties with China, yet she
has remained under the influence of the US. But in the aftermath of CPEC and construction of Gwadar,
on the one hand China too would have a strong say along with the US and on the other hand, because of
it, Pakistan too would be at better position to negotiate with the US (Mustafa & Zafar, 2011:5065).
1.4 Role of Various Players
1.4.1 Iran
Tehran is one of the key stakeholders regarding Gwadar port and CPEC because on the one hand
Gwadar is considered to be a potential challenge to Chahbahar and on the other hand India has
developed a meaningful understanding with Iran. As a response to bilateral collaboration of Pakistan and
Journal of Business and Social Review in Emerging Economies Vol. 6, No 4, December 2020
1567
China on CPEC and Gwadar port, Iran and India have worked closely on sophistication of Chahbahar.
New Delhi has supposedly budgeted US$ 500 million for the development of a free trade area coupled
with US$20 billion to sophisticate the port of Chahbahar (Boyce, 2017: 23).
But Gwadar has a natural advantage on Chahbahar as on the one hand Gwadar is a deep sea port as
compared to Chahbahar and on the other hand Iran remains under the international sanctions that limit
the effectiveness of Chahbahar. Moreover, Iran has showed its interests to be the part of CPEC and
Gwadar port (Zargar, 2017: 3).
1.4.2 Russia
As Iran and Russia have close bilateral relations. With the growing ties of Islamabad, Beijing, Tehran
and Moscow, it would be more likely that Russia would seek the opportunity of trade and other
commercial operations by utilizing CPEC and Gwadar port. Islamabad has offered Moscow to opt for
CPEC and Gwadar port for trade. Foreign Minister of Russia too showed indications about Russian
interests in the project (Boyce, 2017: 23).
1.4.3 Afghanistan
Afghanistan is bridge between two significant regions, South and Central Asia. Access to Central Asian
Republics is one of the key components of CPEC and for that very reason Kabul’s role is of much
importance for Islamabad and Beijing as well. It is because a trilateral discussion was arranged among
Afghanistan, China and Pakistan in 2018 in which debate on role of Afghanistan regarding CPEC and
Gwadar was arranged (Khan, 2019: 184).
Islamabad has announced that a 265 KM Motorway would be constructed from Kabul to Peshawar in
order to connect Afghanistan with CPEC. That linkage would assist the integration of Afghanistan to
other regions of the world via Indian Ocean, Gwadar port and CPEC. Another road linkage which would
connect Afghanistan to CPEC is via Chaman and this is too under consideration, which would connect
Afghanistan to the Western route of CPEC. That link road would save 600 KM as compared to the route
which is utilized now (Butt & Butt, 2017: 33).
1.4.4 Central Asia
As having the land locked geography, Central Asian Republics desperately depend upon other countries
specifically Iran and Russia for trade operations. These states would have a more feasible route in shape
of CPEC and Gwadar port due to two factors. On the one hand Gwadar is a deep sea port than
Chahbahar and on the other hand Iran too has shown its interests in CPEC and Gwadar. Turkmenistan
Afghanistan Pakistan India gas pipe- line and its extension towards China would catalyze the addition of
these land locked states in CPEC (Zia- ur-Rehman, 2017: 274).
2. Conclusion
CPEC and construction of Gwadar port are anticipated to shift the geo- political and geo- strategic
alignments not only in South Asian region but beyond South Asia too. Countries of various other regions
are also reconsidering their multilateral and bilateral relations with other regional and global players.
Potential of Gwadar and CPEC to bridge various regions, not only of Asian origin but other regions as
well, at a single center- stage, Pakistan, would lead Islamabad and Beijing towards further closer ties and
mutual exertion of power in regional as well as in global arena. Those regional and global players which
assume CPEC and Gwadar to be a potential concern, if not challenge, have been perplexed and will,
more likely, strive to marginalize the anticipated prospective of the project. In order to neutralize any
attempt like that, Pakistan and China would need to have further strengthen their security measures
specifically in Baluchistan and GilgitBaltistan. Being a global power, role of Washington would remain
significant and relevant in the region. Construing CPEC to be a challenge by the US and forwarding
New Delhi against Pakistan and China would only perpetuate the longstanding regional strategic rift and
security structure of the region.
References

Journal of Business and Social Review in Emerging Economies Vol. 6, No 4, December 2020
1568
Abbasi, K. A. (2015). ‘Strategic Significance of Indian Ocean’. (Proceedings of International
Conference on CPEC, GC University, Lahore).
Ahmad, Z. (2015). ‘China-Pakistan Economic Corridor: A Vital Component of Emerging Strategic
Significance of Indian Ocean’. (Proceedings of International Conference on CPEC, GC
University, Lahore).
Boyce, T. (2017). ‘The China-Pakistan Economic Corridor: Trade, Security and Regional Implications’.
Sandia Report. (SAND2017-0207). pp. 19-32.
https://www.osti.gov/scitech/servlets/purl/1344537. Accessed on 10.09.2020.
Butt, K.M., and Butt, A. A. (2015). Impact of CPEC on Regional and Extra-Regional Actors. Journal of
Political Science. (33). pp. 23-44.
Chandramohan, B. (2013). Indo-Pakistan Relations in Contemporary Times. Foreign Policy Research
Centre. (2). pp. 93-103.
Hilali, A. Z. (2014). ‘Contemporary Geopolitics of Indian Ocean and Great Power Competition over
Gwadar’. (Paper presented at the international conference on-Major Powers’ Interests in Indian
Ocean: Challenges and Options for Pakistan. Serena Hotel, Islamabad).
Hussain, S, S., Javaid, U., Sabri, P. S., Ilyas, M., Batool, I. (2014). ‘Compulsions of Sino-Pakistani
Strategic Engagement in Lieu of Security Constraints Endangered by the Anarchist International
Political System’. South Asian Studies, Vol. 29 (2). pp. 593-606.
Jamshed, U. (2015). ‘Economic Cooperation between Pakistan and China: Gwadar Deep Sea Port’.
(Proceedings of International conference on CPEC, GC University, Lahore).
Jia, C. (2017). ‘New Trends of US Policy Towards South Asia: Challenges to CPEC’. Islamabad Policy
Research Institute. Vol. 7 (1). pp. 95-121.
Khan, M. (2018). China-Pakistan Economic Corridor: A Game Changer. Islamabad: The Institute of
Strategic Studies. pp. 86-107.
Khan, H. U. (2019). ‘Regional Security Threats to CPEC: A Strategic Overview’. Journal of Research
Society of Pakistan. Vol. 56 (1). pp. 181-189.
Khayyam, U. (2014). ‘China Beyond its Borders: Strategic Interests in Pakistan’. South Asia Institute.
pp. 1-4.
Lashari, M. A. (2016). ‘Pak-China Defence and Strategic Relations: Emerging Global and Regional
Dynamics’. Journal of Security and Strategic Analyses. Vol. 2 (1). pp. 165-182.
Mustaf, S., and Zafar, A. (2011). ‘China-Pakistan Economic Corridor and Challenges for Pakistan and
China’. International Journal of Social Science and Economic Research. Vol. 2 (11). pp. 5059-
5065.
Ollapally, D. M. (2014). ‘China and India: Economic Ties and Strategic Rivalry’.
https://www.risingpowersinitiative.org/wp-content/uploads/Orbis_Ollapally_ChinaIndia.pdf. pp.
342-357. Accessed on 10.09.2020.
Pande, S. (2015). ‘Sino-Pak Strategic Relationship: Implications for India’. Centre for Land Warfare
Studies. pp.18-24.
Ranjan, A. (2015). ‘The China-Pakistan Economic Corridor’. Institute of Chinese Studies. (10). pp. 1-
25.
Rashid, F. (2018). ‘China-Pakistan Economic Corridor (CPEC) and The Emerging Maritime Security
Environment’. Institute of Strategic Studies Islamabad. Vol. (37). pp. 1-25.
Sekhon, A. S. (2016). ‘China’s Interests in Pakistan Occupied Kashmir (POK)’. International Research
Journal of Human Resources and Social Sciences. Vol. 3(9). pp. 178-185.
Sharif, R. (2015). ‘Maritime Challenges of China’s Trade Routes-Chinese Rationale for Undertaking
CPEC’, (Proceedings of International conference on CPEC, GC University, Lahore).
Smith, J. M. (2016). ‘China- India Relations in the Modi-Xi Era’.
https://www.uscc.gov/sites/default/files/SMITH_Remarks%20031016.pdf. Accessed on
22.10.2020.
Snedden, C. (2016). ‘Shifting Geo-Politics in The Greater South Asia Region’. https://apcss.org/wp-
content/uploads/2016/04/Snedden-SouthAsia-2016-revised-format.pdf. Accessed on 10.09.2020.
Wagner, C. (2016). ‘The Effects of China-Pakistan Economic Corridor on India-Pakistan Relations’.

Journal of Business and Social Review in Emerging Economies Vol. 6, No 4, December 2020
1569
https://www.swp-berlin.org/fileadmin/contents/products/comments/2016C25_wgn.pdf. Accessed
on 09.09.2020.
Wolf, S. (2018). ‘China’s Role in Pakistan: International and Domestic Implications’. Foreign Policy
Research Centre.vol. (2). pp. 155-178.
Zargar, H. (2017). ‘China Pakistan Economic Corridor: Realigning Realities’,
https://www.researchgate.net/publication/315684771_China_Pakistan_Economic_Corridor_Re-
Aligning_Realities. Accessed on 18.08.2020.
Zia-ur-Rehman, M. (2017). ‘Strategic National Perspective & CPEC Understanding The Changing
International Paradigms’. Margalla Papers. (2017): pp. 271-283.

Journal of Business and Social Review in Emerging Economies Vol. 6, No 4, December 2020
1570
Journal of Business and Social Review in Emerging Economies Vol. 6, No 4, December 2020
1571
Volume and Issues Obtainable at Center for Sustainability Research and Consultancy
Journal of Business and Social Review in Emerging Economies ISSN: 2519-089X (E): 2519-0326
Volume 6: No. 4, December 2020
Journal homepage: www.publishing.globalcsrc.org/jbsee
A Comparative Study of Perjury in Legal System of Pakistan and Islamic Law
1Rashida Zahoor, 2Muhammad Fahad Anwar, 3Muhammad Asif Safdar, 4Jibran Jamshed 1&2Assistant Professor, Department of Law, University of Sahiwal, Pakistan,
[email protected], [email protected] 3Assistant Professor, Principal of Gillani Law College, Bahauddin Zakariya University Multan, Pakistan,
[email protected] 4Assistant Professor, Department of Law, Islamia University of Bahawalpur, Pakistan,
ARTICLE DETAILS ABSTRACT History Revised format: November 2020 Available Online: December 2020
Perjury is one of the crimes that harm criminal justice; Action against
criminal justice means behavior that affects people's right to access
the justice system or society's right to prosecute and punish criminals.
The witness is considered a reason to prove disputes in both legal and
criminal complaints, and due to the importance and value of the
evidence, perjury has its specific implications. In our criminal justice
system, testimony is a way of legal knowledge and reasoning to
diagnose crimes committed by the accused. The testimony is not used
in criminal matters, and ignoring his way is not against the accused.
Consequently, truth is essential, and testimony cannot be used if it is
not true. This paper expresses various forms and numerous aspects of
perjury along with its definition, discusses perjury as part of the
behavioral and psychological approach of sociology, and finally
analyzes the laws of Perjury in Pakistan along with the relevant
sections of the Pakistan Penal Code, 1860 (PPC), Qanoon and
Shahadat Ordinance, 1984 (QSO) and The Oaths Act, 1873 and other
Islamic provisions of laws relating to perjury.
© 2020 Center for Sustainability Research and Consultancy Pakistan under
a Creative Commons Attribution-NonCommercial-ShareAlike 4.0
Keywords Perjury, Pakistani laws on
Perjury, PPC, QSO, Islamic
Laws of Swear.
JEL Classification
M10, M12
Corresponding author’s email address: [email protected]
Recommended citation: Zahoor, R., Anwar, M. F., Safdar, M. A. & Jamshed, J. (2020). A Comparative
Study of Perjury in Legal System of Pakistan and Islamic Law. Journal of Business and Social Review
in Emerging Economies, 6(4), 1571-1579
1. Introduction
The only purpose of taking evidence in court has always been to allow judges to practice justice after
adequately assessing the pros and cons of the litigation in question while keeping the rating scale among
the parties concerned. It would be difficult for the court of law to do so unless and as long as the
evidence previously presented is truthful, uncontaminated, and free of prejudice. The basic rules for the
test of evidence were followed in Pre-Islamic Society of Arabia, early Roman Society, India, Persia, etc.
In all legal systems, the oath is one reason for the trial, and a means to resolve hostility in claims for
religious and belief reasons. It means that people swear by God and by their religions and beliefs to
show that they are correct and accurate in what they deposed. Suppose a person finds out that swearing
is false, and I shall achieve several effects in the judgment issued by the judge. Swearing is the last

Journal of Business and Social Review in Emerging Economies Vol. 6, No 4, December 2020
1572
resort to prove the case and examine the claims and disputes in civil and criminal cases. Due to the
authority of trying to ascertain the cause, perjury will have some effect. In the legal system, this reason
generally serves only to settle the dispute. The curse word is used if the complaint cannot be proven in
any other way. After introducing the swear word, the plaintiff's reason is not accepted; however, the
lawyer's refusal to award the award is useful in the lawsuit and is released based on the above admission.
Taking the oath is based on conscience and believes in the oath. By reducing the likelihood of false
statements, the legislature predicted the concentration on the dirty word. In Islamic law, the oath is a
concept of dignity; even if the lawyer is not one of the followers of monotheistic religions after swearing
God, the prosecutor can also take the oath to the sanctities accepted by the above. Based on measures
such as the meaning of the subject matter of the complaint, the parties' personality to the dispute, the
oath could be focused according to the perspective and discretion of the court in terms of conditions,
time, space, and situation state. "I swear to inform the reality, the total truth and to compress the truth" -
a sentence that is narrated many times in a week in television programs and films. It is therefore known
that its meaning is often not marked. However, as soon as he is sworn in court or other officials who
continue, he will provide all of the above information regarding reality or violation.
Wrong testimony or false testimony is a curse for any country's criminal justice system. Several innocent
people suffered behind bars for ages just because a person had lied to the court. It is encouraging that
Pakistan's Supreme Court Judge viewed the extinction of perjury as one of the foundations to reform the
criminal justice system. Supreme Court of Pakistan had firmly stated his objective to build a dam against
false testimonies and false witnesses. Supreme Court said that those on trial would be sentenced to
prison and forbidden to testify again.
Providing false evidence of an oath in a competent jurisdiction is legally known as a violation. It is a
grave crime because it delays the method of justice at the center of a system. Perjury as the crime of
being under oath could be a serious crime as it upsets the essential objectives of the judicial system "the
discovery of reality". Even the well-known and influential have been exposed to effects of violations
that embody law enforcement, prison, and legal documents—the tendency to lie sticks to practically
every society and civilization.
Furthermore, an individual could also be a habitual traitor and pathological liar. The use of lies is not
only subject to cessation but will also be the result of interference. The opposite side of the violation is
that under "oath" a lie is formed.
Giving false testimony is a criminal offense in the law of Pakistan. In PPC making false statements at
every stage in court proceedings accounts for seven years in jail, while the penalty for making wrong
statements in capital cases can be up to life imprisonment. According to the law, the same lender can be
sentenced to death because of his fall statement; an innocent person is executed.
1.1 Definition
Judicial affirmation of falsehood upon oath and affirmation equivalent to the oath is called perjury. For
perjury, there must be a renunciation of what is correct or an assertion of what is false. The declarations
criticized must be relevant to the matter which has been initially tried.
The deliberate declaration on a matter of fact, faith, knowledge, or opinion given by a witness as a
portion of the evidence, whether or not the evidence is given to the judge in open court or by an affidavit
or otherwise, by way of oath or in any manner permitted by law to be substituted for an oath. Such
declaration must be known as false by such witness and be intended to mislead the court or person
conducting a case.
1.2 Essential Elements of Perjury
A witness who is under oath has committed perjury if he makes a statement that the witness knew it was
not correct in court or other proceedings. The witness's statement in court has to be "material" on the
Journal of Business and Social Review in Emerging Economies Vol. 6, No 4, December 2020
1573
matter. It means that statement and material before the court must connect to the litigation, investigation
or inquiry of the proceeding. Following are the essential elements of perjury:-
Perjury only takes place under oath The witness, who makes a declaration, must swear by a judge, a notary or other official to tell the
truth before someone who is authorized to take the oath under the relevant law. Also, the
proceedings must be 'in front of a competent authority' authorized by the state's law. For
instance, an authority that has started an inquiry outside its powers will not be considered
competent proceeding (Reid Jr, 1999). In such a case, the accused will not be liable for perjury
as for perjury, authority or court must be empowered to record evidence (Mst. Maryam Hayyat
Case, PLD 2013 Karachi 194, 2013).
Perjury involves statement Keeping quiet or denying a witness to give a statement will not be considered perjury, but it may
lead to other punitive charges. If testimony is accepted in the proceedings and the witness
authenticates it as incorrect scripture under oath will be considered perjury.
With an intention to mislead A witness submitting before the competent authority must know that the declaration it makes is
false and he must make it to deceive the court.
Only incorrect statements are perjury Incorrect statements of a witness resulting from misperception, memory loss, or errors are neither
false and nor will be considered perjury. Contradiction in evidence may be considered perjury
if one witness made self-contradictory statements and prosecutors may prove perjury because
self-contradictory statements were false.
Contradictory Statements may lead to perjury A witness's statement must be observed and read as a whole by the court/authority. If, when
questioned at one point during evidence, a witness claimed that he did not recall an incident.
However, he undoubtedly recollected aspects of the event when questioned future than he may
have committed perjury. However, if evidence of a witness is inconsistent, the proceeding
before the authority or the court is not perjury.
Statement in court or another trial Inappropriate comments made outside of official hearings do not constitute perjury. For example, a
deponent is lying to his prosecutor, who takes outlines to draw up an affidavit that the
deponent has not committed any perjury. However, if the deponent signs the affidavit later
with the false statement that it includes, then perjury is considered. Affidavits, written
declarations, written responses to courts or public bodies and proceedings statements are
subject to perjury in the prevailing state laws.
"Substantial" testimonials can be perjury The wrong statement must manipulate the proceeding. This implies, in a matter of the proceeding,
it must have a connection to the matter. It involves an incorrect statement that is likely to
mislead or hinder the investigation or case. This implies that a lie under oath about an issue
irrelevant to the proceeding is not regarded as perjury. For example, it would not amount to
perjury to incorrectly state in a proceeding that "I never update my Facebook page at work"
and it had nothing to do with social networking at work.
A substantial statement that is unnecessary may be a perjury Where false evidence does not affect a case's outcome, witness lying may be accused of perjury.
For example, an ex-police officer is on trial for participating in a gambling operation, and some
witnesses have affirmed his involvement. That ex-police officer denied any involvement,
however. His denial would be a strong statement, although it did not affect the court's finding
of guilt because the court had evidence from the other witnesses to rely on.
1.3 Main Reasons for Giving False Evidence
Commonly main reasons for giving wrong evidence are as under:-

Journal of Business and Social Review in Emerging Economies Vol. 6, No 4, December 2020
1574
i. The desire to cause damage to the party in civil or criminal proceedings, either because of the
adverse party's inducement or pressure or because of the witness' dispute with the adverse party
or
ii. To assist the suspect in criminal proceedings or civil litigation, either under coercion, threat or
inducement,
iii. To avoid suffering rage of a party to which witness must submit evidence.
In many cases, witnesses evade appearing before courts to give a statement and show
unawareness of disputed matter to avoid aggravation usually faced by witnesses while appearing in
the courts. Witnesses also considered it a waste of time and unnecessary embarrassment. It was also
noted in many criminal cases that, on the one hand, some witnesses give false evidence at police
request to make the prosecution case successful. Despite being inclined to give real evidence, other
witnesses are abstained from fear of retribution, either by the police or the accused party.
1.4 Lying and Environmental Approach: An Behavioral Analysis
"Lying" is a behavior that seems prevalent in different cultures, ages, etc. Lying also seems to be linked
with some of the social problems. It frequently interrupts social connections, causes problems in places
of work, and corrupts politics. For example, in lying behavior, people are considered liars, whereby
lying is considered to exist in the individual. Because of this, the individual is liable for their lying
behavior. Thus, thinking of environmental factors leading to the development and persistence of lying is
avoided as the problem of lying is presumed to exist in individuals (Fryling, 2016).
Not surprisingly, lying can grow very early in the life of every child. In childhood, most behavior is
secure through instant incidents. Children learn to take food, which is reinforced by contact with food
and by taking puppets from their age fellows or friends when nobody watches, all these behaviors are
immediately reinforced. Much of the young child's behavior can be considered impulsive in this sense.
Indeed, both past and future are verbal constructs (Hayes, n.d.). However, as children grow a
sophisticated verbal range. For example, they start responding to several derived stimulus issues.
While building on childhood practices, adult situations are reasonably separate in their complexity that
deserves special attention. In line with our analysis, lying may occur in adulthood as it was not
sufficiently conditioned as an aversive stimulus condition. Usually, some adults may lie because they
have never been taught lying was "bad." Lying, as defined by an aversive stimulus, is not a form of
stimulus to avoid. If the lying context's remaining features are not avoided, the positive and negative
strengthens both direct and derived. This condition makes lying cases somewhat probable (Fryling,
2016).
1.5 Pathological Liars
Pathological lying has been outlined as "falsification entirely disproportionate to any discernible finish
visible, is also in-depth and sophisticated, and should manifest over several years or perhaps a lifetime".
Tell compulsive lies while not a transparent motive
Told of times and obsessively
Told for no apparent reason or gain
Continuous
Told to create the teller seem heroic or the victim
Not deterred by guilt or risk of obtaining acknowledged
Examples of pathological lying:
Making a false history, like expression they have achieved or experienced one thing they haven't
Claiming to own a grievous unhealthiness that they do not have
Telling lies to impress others, like expression they are associated with a superstar
1.6 Pakistani Laws Dealing with Perjury:
1.6.1 Perjury under PPC
Section 191 of PPC deals with Perjury in Pakistan (PPC, 1860). This section contains the following
elements: -

Journal of Business and Social Review in Emerging Economies Vol. 6, No 4, December 2020
1575
1.6.2 Giving the Wrong Evidence
PPC defines "giving of false evidence" This definition cannot be said to include any
common principle of universal application as such. An individual should always
express the truth is a moral belief, but not a legal principle.
1.6.3 Statement on Oath When an individual is "legally bound by an oath" a person authorized to administer it must give
sufficient legal oath. The person to whom such oaths can be administered must be competent. The oath
must have been made before giving a statement.
1.6.4 Court not Appropriately Established An individual who makes false statements on oath before a court or authority that is not correctly
constituted cannot sentence for perjury.
1.6.5 Wrong Verification Perjury is a false statement made through wrong verification, and it constitutes an offense punishable
under S. 193 PPC.
1.6.6 Declaration If an individual makes a false statement that any law binds him, he would be guilty of perjury. For
example, if a court officer makes a false statement of how a "warrant of sale" was issued, he will be
guilty of an offense under S. 191 of PPC.
1.6.7 Giving False Statement To constitute an offence of perjury, the case's decision in which it is given need not provide false
evidence on a material question of law or fact. For perjury, it is sufficient that the false evidence is
deliberately given if the person making that statement deliberately makes it known that it is false and
intends to mislead the court to presume it is true. But if the false statement is not directly related to a fact
in the case, but only to incidental matters, it should be taken into account in the sentence.
1.6.8 The Statement is not Read over to the Person If a witness's false statement was not read as required by S.360 of the CrPC, the defect was deemed
curable and would not be fatal to the proceedings (IDO Case, PLD 1951 Quetta 14, 1951).
1.6.9 Information of Falsehood is Required An individual cannot be convicted of perjury unless he knows that his statement is false or thinks it is
false or does not believe it is true. An individual does not commit an offense under PPC S.193 by merely
mentioning something untrue in a complaint or written statement or omitting something from the
complaint or written statement. Excluding the name of one of the decree-holders in a decree, the
application is not an offense under S. 193.
1.6.10 Proof There must be absolute certainty about the statement's falseness and the absence of faith by the accused
in his own words to support a conviction under S 193 of the PPC. The burden is on the prosecution to
show that the witness' statement in his testimony, or any document produced in court, was false as
defined in S. PPC 191. It cannot be presumed that the statement made before the police during the
investigation by the witness spoke the truth and, based on that assumption, it cannot be held that he gave
false evidence in the testimony of the witness before the court and thus committed an offence under S.
PPC, 193.
1.6.11 Perjury in Qanoon-e-shahadat Ordinance, 1984
Competency of witnesses under Article 3 of the 1984 Qanoon-e-Shahadat Order;

Journal of Business and Social Review in Emerging Economies Vol. 6, No 4, December 2020
1576
Article 3 provides that each person is competent to give evidence in court (QSO, 1984). The only
restriction to regulate the witness' ability is court satisfaction that the person before the court can provide
evidence. However, the article itself qualifies this general principle by providing exceptions. One of
Article 3's exceptions is perjury. His exception says perjury is an offence; it means deliberately giving
false evidence in court. Any person sentenced for perjury is excluded from giving evidence in court.
Such a person is not a truthful witness. However, if the person repents in the court's opinion, the
evidence can be accepted.
1.6.12 The 'Tazkiya-al-Shahood' It is a method of inquiry to be implemented by the court to govern a witness's trustworthiness on the
standard of Islamic injunctions that require piousness, credibility and truthfulness of the witness. It is
only acceptable in Hadood laws and not in Tazir (Shahid Orakzai Case, PLD 2017 FSC 63, 2017).
1.6.12.1 Ways of checking Tazkiya:
According to Fatawa-e Alamgiry, there are two ways of checking Tazkiya;
1. Capability of the witness can be examined openly
2. Capability of the witness can be checked through investigation secretly
1.6.12.2 Persons can also aid in checking Tazkiya:
Following persons can also aid in checking Tazkiya;
1. Persons trustworthy;
2. Persons familiar with the witness's life and the character whose capability is being tested.
Even if need in respect of Tazkiya-al-Shuhood will be accomplished at the top of the testimony and
interrogation of a witness, the suspect should be supplied with another chance of cross-examining even
at that stage the witness in respect of his standing as claimed to be a just/Adil witness. It is solely
through the method of interrogatory of a witness in respect of a matter asked of him to fulfill the wants
of Tazkiya-al-Shuhood that associate suspect will, on the one hand, impeach the integrity and quality of
a witness and by an equivalent process modify the judicature to fulfill late requirements of inquiry to
succeed in a conclusion that the witness could be a just/Adil witness which his proof need not be
discarded however must be relied upon to choose the case (Wajid Umar Case, 1992 PCr.LJ 1536, 1992).
1.6.13 Impeaching a Witness When evidence is given under oath during the hearing, the adverse party can usually challenge the
authenticity of evidence through cross-examination. The opposition's tools express flexibility to analyze
witnesses' authentic ability to look at certain witnesses' occurrences or memory. The opponent may also
challenge the witness's necessary quality by allowing witnesses to tell reality apart from those facts.
Such a way in proceedings can be called "impeaching witness", and it is rapid attack on the witnesses'
character (Naeem Case, 2019 PCrLJ Karachi 305, 2019).
1.6.14 Impeaching a Witness through Previous Inconsistent Statements A person's own statements confronting the witness on the opposite side, which are at odds with the
person's evidence, could be common to impeach. However, the opposing party cannot introduce the
statement without allowing the witness to clarify (Mehdi Khan Case, 2015 PCrLJ Lahore 26, 2015).
1.6.15 Implementation of Oath Laws in Pakistan
The Pakistani courts barely apply laws punishing perjury for punishing liars. That is why they do not
perform the theory of deterrent practically. In August 2018, during the case regarding judicial reforms,
the Sindh High Court (SHC) Registrar replied that "the SHC and its subordinate courts have not
prosecuted even a single person over the past almost three years for perjury under Sections 193-196 of
PPC" (Sehgal, 2019).
The public thinks there are many excellent ways to get away with lies in court, even if the liars are
identified during proceedings even though they have no fear of punishment. Witnesses lying in court
against Aasia Bibi are accountable for her long-term imprisonment. Supreme Court acquitted Aasia Bibi,
but no action was taken against witnesses for perjury (Wikipedia, n.d.).
Journal of Business and Social Review in Emerging Economies Vol. 6, No 4, December 2020
1577
Perjury is an exclusively criminal offense as it weakens the court's very purpose, country laws, and
judiciary at large. Pakistan's honest citizens currently feel hopeless to reach court in disputes because
they are not sure that justice will prevail. Gulzar Ahmad's new Supreme Court Chief Justice (CJP) style
may differ from his predecessors to bring the rule of law back into the system. Justice Gulzar Ahmad
took up the abolition of perjury as one of the foundations of criminal justice reform and his involvement
in restoring Pakistan's judiciary. He assured that the law punishing perjury would be implemented with
full spirit.
Justice and truth are closely linked and inter-reliant. According to Islamic teachings established
truthfulness is a Muslim's central characteristic. Once, Hazrat Muhammad PBUH offered morning
prayer, and after he has finished his prayer, he stood up, saying three times: False witness was made
equivalent to attributing a partner to Allah. Then he recited: avoid the abomination of idols and avoid
speaking falsehood as pure people of Allah's faith, associating nothing with Him.
The discussion of Articles 62 and 63 of the Constitution of the Islamic Republic of Pakistan, 1973, and
the demands we heard to delete them from this fundamental law of our country sign that being
trustworthy is no longer considered a central value.
A judiciary that allows deliberate falsehood is doomed to fail, and a society that accepts destroying it.
The truth is that the foundation of the Criminal Justice System. In application No. 231 of 2019 before
the Supreme Court of Pakistan, Chief Justice of Pakistan stated that "Justice is that the essence and
foundation of civil society can compromise the truth is a compromise for society's future as a simple,
genuine and civilized society" (Khizar Hayyat Case, PLJ 2019 Supreme Court (Criminal) 265, 2019).
Under Pakistani law false witnesses can be imprisoned up to life, it was said by said former Pakistani
chief justice Asif Saeed Khosa during a case of false testimony in Mazhar Hussain's famous murder
case. In this case, a police officer, namely Mazhar Hussain, was murdered in Faisalabad, Pakistan. A
witness Muhammad Arshad appeared in the witness box. He said, "he was shot in the arm, and he
injured out the bit, and I may be punished in the hereafter if I have lied in court." During the hearing,
Pakistan's chief justice said that the witness should refrain from talking so much and told him that his
medical report says a pellet or bullet did not hit him. CJP also added that "you said that you felt the
pellet on your leg too, were you wearing iron pants? A person was sentenced to death because you lied
in court. The law says that people who give false testimonies should be imprisoned for life." The court
rejected his statement and sent his case to the Anti-Terrorism Court (SAMAA | Zulqarnain Iqbal, 2019).
1.7 Islamic Laws about Perjury
In Islam, very great pressure has been laid on the significance of proper evidence. In the Holy Quran in
"Sura-e-Yusaf," it has been provided that when Zulekha falsely accused Hazrat Yusaf of arrogant
conduct and no clear evidence was available, except the inconsistent statements of both parties. It was
suggested that the shirt of Hazrat Yusaf might be inspected and if it was found to be torn from the front
than Zulekha's allegation is correct, but in case the shirt was found torn from the back, Hazrat Yusaf is
innocent, and after inspection, Zulekha was found guilty of the false allegation.
1.8 Verses of the Holy Quran
The following verses of the Holy Quran are dealing with the matter of giving testimony:
"And do not mix the truth with falsehood or conceal the truth while you know [it]."(Quran 2:42)
"And let not the witnesses refuse when they are called upon." (Quran 2:282)
"And do not conceal testimony, for whoever conceals it his heart is indeed sinful." (Quran 2:283)
"O you who have believed, be persistently standing firm for Allah, witnesses in justice, and do not let
the hatred of a people prevent you from being just. Be just that is nearer to righteousness. Moreover, fear
Allah; indeed, Allah is acquainted with what you do." (Quran 5:8)
"O you who have believed, be persistently standing firm in justice, witnesses for Allah, even if it be
against yourselves or parents and relatives." (Quran 4:135)
"So follow not [personal] inclination, lest you not be just. And if you distort [your testimony] or refuse
[to give it], then indeed Allah is ever, with what you do, acquainted." (Quran 4:135)
Journal of Business and Social Review in Emerging Economies Vol. 6, No 4, December 2020
1578
"And establish the testimony for [the acceptance of] Allah." (Quran 65:2)
"And we will not withhold the testimony of Allah. Indeed, we would then be of the sinful." (Quran
5:106)
"And avoid false statement." (Quran 22:30)
"And they who do not bear witness to what is false." (Quran 25:72)
From the above verses of the Holy Quran, testifying to its proper meaning and weight is a compulsory
duty, and those who stand firm in their testimonies are among the people of morality and faith. If there
are no other witnesses that would allow justice to be done, and there is fear that somebody's right may be
lost, testifying becomes the few witnesses' responsibilities. Islam commands testimony and prohibits
hiding it as hiding evidence is condemned in Islam and disliked by Allah. Giving false testimony has
many sins that promote falsehood against the truth and promote injustice and violence against justice. It
also erases justice and equity and jeopardizes public security.
1.9 Traditions of the Holy Prophet (PBUH)
According to the Holy Prophet (PBUH), false testimony is one of the extreme evils, and the following
hadith verifies the importance of giving true testimony:
" Hazrat Anas (RA) said the Holy Prophet (PBUH) was once asked about great sins.
i. Joining others to worship Allah;
ii. To undutiful to one's parents;
iii. Kill someone (which Allah has forbidden to kill)
iv. Giving false evidence."
Hazrat Abdullah (RA) narrated that the Holy Prophet (PBUH) said that if somebody makes a false oath
to unjustly get a Muslim's property, Allah will be angry when he meets Him (Bukhari, n.d.).
1.10 Enforcement of Hadd Ordinance, 1979
Under section 2 of the Offence of Qazf (Enforcement of Hadd) Ordinance, 1979 offence of Qazf had
been provided.
The Holy Quran dealing the offence of Qazf commands that:
"And those who accuse chaste women and then do not produce four witnesses - lash them with eighty
lashes and do not accept from them testimony ever after. And those are defiantly disobedient." (Quran
24:4)
"And those who accuse their wives [of adultery] and have no witnesses except themselves - then the
witness of one of them [shall be] four testimonies [swearing] by Allah that indeed, he is of the truthful."
(Quran 24:6)
"And the fifth [oath will be] that the curse of Allah be upon him if he should be among the liars." (Quran
24:7)
"But it will prevent punishment from her if she gives four testimonies [swearing] by Allah that indeed,
he is of the liars." (Quran 24:8)
"And the fifth [oath will be] that the wrath of Allah be upon her if he was of the truthful." (Quran 24:9)
The above verses highlight Islam's position on the compulsory standard of evidence to achieve. The
Holy Quran places great importance on the need to meet the necessary standard of evidence. A person
who lifts Zina's allegation but does not comply with the evidentiary standards provided must be
punished.
2. Conclusion
Individuals who commit perjury are complicit in justice's failure and crooked the legal process of
exposing the truth. Bearing false evidence attracts severe, legal penalties in a well-functioning justice
system. In an unethical, cruel system, however, giving false evidence is treated as daily detail. Lower
courts are rife with alls offering a price for false evidence. Indeed, an accused's life may be in an
individual's hands who lives by misleading the court. It is not because there is no perjury law.
The reason perjury is so prevalent in the criminal justice system is that it is so rarely enforced that it may
not exist. It emerged in August 2018 that over the past three years, not a single individual is prosecuted
for perjury in the SHC and its subordinate courts. False testimony is not always bought, but may
sometimes result from witness pressure. Therefore, witness protection must be much more substantial.

Journal of Business and Social Review in Emerging Economies Vol. 6, No 4, December 2020
1579
Enhanced forensic services would also reduce witness trust. Perjury cannot be isolated. It is just one
feature of the consistent, appalling criminal justice system.
In Pakistan whoever gives false evidence or interferes with oral or documentary evidence is liable for
imprisonment up to seven-year, and it may also be extended up to the imprisonment of life.
References
Bukhari, S. (n.d.). Sahih Bukhari. https://d1.islamhouse.com/data/en/ih_books/single/en_Sahih_Al-
Bukhari.pdf
Fryling, M. J. (2016). A developmental-behavioral analysis of lying. International Journal of Psychology
and Psychological Therapy, 16(1), 13–22.
Hayes, S. C. (n.d.). Hayes, SC & Hayes, LJ (1992). American Psychologist, 47, 1383-1395.
Wajid Umar Case, 1992 PCr.LJ 1536, (1992).
Mehdi Khan Case, 2015 PCrLJ Lahore 26, (2015).
Naeem Case, 2019 PCrLJ Karachi 305, (2019).
IDO Case, PLD 1951 Quetta 14, (1951).
Mst. Maryam Hayyat Case, PLD 2013 Karachi 194, (2013).
Shahid Orakzai Case, PLD 2017 FSC 63, (2017).
Khizar Hayyat Case, PLJ 2019 Supreme Court (Criminal) 265, (2019).
PPC. (1860). Pakistan Penal Code.
http://www.pakistani.org/pakistan/legislation/1860/actXLVof1860.html
QSO. (1984). Qanun-e-Shahdat Order. https://punjabpolice.gov.pk/system/files/qanun-e-shahadat-order-
1984.pdf
Reid Jr, C. J. (1999). The Fundamental Freedom: Judge John T. Noonan, Jr.’s Historiography of
Religious Liberty. Marq. L. Rev., 83, 367.
SAMAA | Zulqarnain Iqbal. (2019). Fake witnesses can be imprisoned for life under Pakistani law: top
judge. http://library1.nida.ac.th/termpaper6/sd/2554/19755.pdf
Sehgal, I. (2019). Fighting perjury in Pakistan. Dailytimes.
http://library1.nida.ac.th/termpaper6/sd/2554/19755.pdf
Wikipedia. (n.d.). Asia Bibi blasphemy case. https://en.wikipedia.org/wiki/Asia_Bibi_blasphemy_case

Journal of Business and Social Review in Emerging Economies Vol. 6, No 4, December 2020
1580

Journal of Business and Social Review in Emerging Economies Vol. 6, No 4, December 2020
1581
Volume and Issues Obtainable at Center for Sustainability Research and Consultancy
Journal of Business and Social Review in Emerging Economies ISSN: 2519-089X (E): 2519-0326
Volume 6: No. 4, December 2020
Journal homepage: www.publishing.globalcsrc.org/jbsee
Implicit Change Leadership, Affective Commitment to Change, and the Mediating
Role of Organizational Trust
1Sarfraz Ahmed Dakhan, 2Sheraz Rajput, 3Tariq Aziz, 4Khalil Ahmed Channa 1,2,3,4Department of Business Administration, Sukkur IBA University, Sukkur, Pakistan,
ARTICLE DETAILS ABSTRACT History Revised format: November 2020 Available Online: December 2020
This paper aims to know the implicit change leadership schemas, the
commitment of the employees towards change, and their relationship
with the trust culture of academic institutions. Quantitative approach
with surveys of 300 employees of academic institutions has been
used in this study. SPSS software has been used to examine the
relationship between variables and constructs. Findings reveal that
organizational trust has a mediating effect on implicit change
leadership and affective commitment to change. Moreover, a positive
relationship was found between trust culture and change leadership
and change leadership with a commitment to change. Furthermore,
the results suggest that change leaders must take into account the
trusting culture perspective of the organization to motivate the
employees to make them accept change.
© 2020 Center for Sustainability Research and Consultancy Pakistan under
a Creative Commons Attribution-NonCommercial-ShareAlike 4.0
Keywords Implicit change leadership,
Organizational trust,
Affective commitment to
change
JEL Classification
M10, M14
Corresponding author’s email address: [email protected]
Recommended citation: Dakhan, S. A., Rajput, S., Aziz, T. & Channa, K. A. (2020). Implicit Change
Leadership, Affective Commitment to Change, and the Mediating Role of Organizational Trust. Journal
of Business and Social Review in Emerging Economies, 6(4), 1581-1593
1. Introduction
Today’s era is the most competing if we compare it with the past. With the latest innovations and
technologies, and the increased global competition, organizations have to move towards the latest trends,
be innovative to sustain, and to adapt the change (Regiana M.hechanova. Raquel Cementina-Olpoc,
2012).
The fast pace changing environment has also pushed academic institutions towards being more receptive
to change, and to be flexible enough to cope with the diverse global business models, policies, cultures,
and operational structures. This study will be based on analyzing academic institutions. The thing which
needs focus here is that this change is not easy to adapt, it requires efforts, management support,
employees’ acceptance and most importantly, change leaders and leadership plays a very important role
here. Organizations have always found this challenging to deal with change. It is very hard for
employees to accept it because it is a matter of moving out of their comfort zones and try to fit into
something very new (Lorenzoni, Nicholson, and Whitmarsh, 2007). However, with the help of good
leadership culture of change can be developed because leaders are the ones who change the values,
behaviours, attitude of the employees with their abilities (Ganta, and Manukonda, 2014).

Journal of Business and Social Review in Emerging Economies Vol. 6, No 4, December 2020
1582
Without a change leader, the prevailing culture of an organization and commitment of the follower
engaged in the change process, it is often not possible to execute, maintain and control the change, no
matter what actions are required (Metre, 2009). These leaders aim to be change agent, because they
identify the change, create a vision and implement a proper strategy (Drucker, 1999; Gilley, 2005;
Howkins, 2001). Moreover, the employee’s emotional responses to change can be key indicators of how
the change will be accepted in an organization.
A study by Griffith cooper has argued that change agents may curb the resistance by creating a sense of
collaboration between them for a more united action to construct change through their personality
characteristics (Griffith-Cooper and King, 2007). Furthermore, these change agents are supposed to be
effective communicators, so that there should be high interaction with the employees and more
engagement in the change process. They should also have self-motivation, a clear vision, problem-
solving skills, ability to provide accurate information, to communicate and negotiate well, and to rapidly
take action where necessary (Luscher and Lewis, 2008).
Apart from the leadership, those employees who are emotionally attached with the organization, and feel
that their organizations' problems are their own, they show more commitment, are likely to show a
positive attitude to organizational change.
Emphasize has been put on in this paper on affective commitment to change since it positively
influences the success of change (Cunningham, 2006; Michaelis et al. 2010) and can be likely to be
influenced by implicit leadership theory "ILT" (Hechanova, Caringal-Go and Magsaysay (2018). This
theory exhibits that subordinates have do have some dispositions for their leaders, the more their
schemas match the actual traits of the leaders, the more that leader is perceived as effective
(Epitropaki and Martin, 2005). According to this theory, leaders have five dimensions to be an ideal
change leader, which this study will examine in the context of academic institutions. These are
strategic or technical competence, character, social, execution, and resilience competence at last.
(Magsaysay and Hechanova, 2017).
Accepting the change is also influenced by trust culture in the organization where employees have faith
in each other’s intentions, abilities, behaviours, decisions towards the organizational interest rather than
the individual interest and have good trustworthy relationships among them. However, leaders also play
a pivotal role when it comes to forming a positive culture in the organization where the trustworthy
relationship is made among the employees (Ionescu, 2014). A good leader guides the employee through
his interpersonal skills about how to maintain a positive work environment which helps employees to
embrace change more rapidly. Further research has also demonstrated the more the trust in leaders’
employees have, the more they feel that they are obliged to accept the change (Reinke, 2003)
In this study, we will explore whether there exists to be a positive relationship between implicit change
leadership and affective commitment to change. Secondly, we will see how implicit change leadership
has an influence on trust culture. We will see the mediating effect of trust culture between change
leadership and commitment to change. Lastly, we will see the difference between the actual traits of
change leaders and the perceived schemas of the subordinates based on implicit leadership theory (ILT)
in academic institutions.
2. Literature Review
2.1 Implicit Change Leadership
Leadership is an important part of an organization to embrace change and face the challenges of rapid
growth in technologies and the economic environment (Cabeza Erikson, Edwards, and Van Brabant,
2008). Leadership is considered to be a special ability through which perceptions, values, attitude and
beliefs of subordinates can be changed (Ganta, and Manukonda). Change leaders have been emphasized
in creating a vision for the future, where employees are motivated and encouraged to accept change.

Journal of Business and Social Review in Emerging Economies Vol. 6, No 4, December 2020
1583
(Bass, 1985; Den Hartog, Van Muijen & Koopman, 1997; Yammarino & Bass,1990). Change leadership
has thus been an important factor in the change management process.
2.2 Why is it Important?
Research suggests that change is unavoidable and that it is increasing day by day. It’s a critical factor
which leads to organizational victory (Drucker, 1999; Ford & Gioia, 2000; Fried-man, 2005; Johansson,
2004; Kuhn, 1970). It can also be seen as the variable which serves ways to gain an edge in the market.
(Florida, 2005; Friedman, 2005; Howkins, 2001). Findings reveal that organizations can get a
competitive advantage when they adapt transformational and continuous change (Cohen, 1999).
Researchers refer to the continuous change which is frequently recurring, emergent, and which never
ends (Quinn, 2004; Weick & Sutcliffe, 2001).
Transformational change on the other side refers to the fundamental shift from the current model (Kuhn,
1970). In either case, the researcher agrees that change in the organization is increasing. Change
programs where improve organizational performance often disrupts the employee’s routines because
they have to perform completely new tasks for which they have little knowledge, learn different skills,
and adjust with the new people and environment which is why this is the basic source of unwillingness
in employees to adapt the change (Chreim, 2006). Any programs in relation to change therefore could
result in stress if employees find it difficult to face (Andrews et al., 2008).
For a change, leaders are the building blocks of readiness in the employees in an organization, where
adapting change is not readily accepted. Leadership is now as per new paradigm seen from follower’s
perspective. ILT has assumption every individual has mental predispositions about an ideal leader.
(Eden and Leviatan, 1975). Follower uses their cognitive schemas to decide upon the effectiveness and
ineffectiveness of leaders (Offermann et al., 1994; Phillips and Lord, 1981). ILT defines that employees
perform a matching process between their leader and ILT and if there exits deficiency that reduces the
impression of the leader. Reversely, more the congruence between ILT of employee and actual leader,
the leader is going to be considered as effective (Epitropaki and Martin, 2005; Schyns et al., 2011).
Leadership schemas in one culture may vary from other culture based on varying expectations and
settings in cultures. (Popper and Druyan, 2001). The study with reference to ILT across Asia has shown
a different list than the list of other countries. Research by (Ling et al. (2000) exhibited Chinese
employees had four patterns to define their leaders: interpersonal competence, goal efficiency, versatility
and personal mortality. There has been much research conducted on ILT in the context of different
cultures. In a research conducted by (Offermann et al. (1994) started with 160 characteristics thought of
as leader characteristics, eventually they revealed eight dimensions defining ideal leaders: strength,
tyranny, devotion, attractiveness, charisma, intelligence a counter-prototype trait and sensitivity.
2.3 What Variables have been Studied through ICL
A recent study conducted by (Magsaysay and Hechanova, (2017) found out that an ideal leader has five
competencies: character, technical and strategic, resilience, execution, and social competencies.
Leadership expectation gap occurs when there exists a substantial difference between ILT and actual
leader. As per the research conducted by Saltz (2004), stated that follower is to be satisfied with the
leader once Leader exhibits the behaviour consistent with follower schema.
2.4 Relationship between Affective Commitment (AC) to Change
2.4.1 ICL
2.4.1.1 AC to Change
AC to change in this study means the (intentions to bolster for the change having perceived all the
benefits resulting from the change). For any change initiative of an organization to succeed it must be
supported and accepted by its employees (Armenakis and Harris, 2009; Fedor et al., 2006; Smollan,
2006). Commitment to change has an influence on the behaviour and intentions to support change
(Herscovitch and Meyer, 2002; Fedor et al., 2006).

Journal of Business and Social Review in Emerging Economies Vol. 6, No 4, December 2020
1584
2.4.1.2 Why is it Important
A research conducted by Herscovitch and Meyer (2002) showed special interest in investigating the idea
of commitment to change which is considered to be the mindset that makes employees pursue the course
of actions direly needed for effective implementation of change and formulated the three dimensions of
commitment to change (normative, continuance and affective) given the original framework of
organizational commitment (Herscovitch and Meyer, 2002). Emphasis on the affective commitment to
change since it positively impacts the success of change (Cunningham, 2006; Michaelis et al. 2010) and
it is to be positively impacted by ILT (Hechanova, Caringal-Go and Magsaysay (2018).
Moreover, researchers have found a positive relationship between effective leadership and commitment
to change. Visionary leaders make employees understand the fair intentions from management side
(Harvey et al., 2003). Employees feel committed towards the change and more readily accept the change
initiative once they believe that the organization is going to get benefit out of it, and since they deem
that the intentions of organizations are worthwhile (Byrne et al., 2005). Furthermore, they also believe
that organization is respecting them and is protecting their interests (Korsgaard et al., 2002). By doing so
followers tend to perceive the positive outcome of the change and show more commitment towards the
change initiative.
Consequently, employees show more commitment during a change when they feel their leaders have
respect for them and that they value their dignity during a change process. Open communication of
leaders to employees to build trust give employees a sense of good intentions for them (Byrne et al.,
2005). These supportive behaviours organizations increase the commitment of the employees to be more
receptive to change. (House and Mitchell, 1974).
Affective commitment to change is further supported by social exchange theory in which employees see
commitment as a two-way process when they perceive the organization to give them training,
opportunities to grow, security in the job and return they believe they should give organization, the
loyalty and commitment it needs from its employees (Robinson et al., 1994). Therefore, our first
hypothesis to be tested is
Hypotheses 1: There exists a positive relationship between ILC and AC
2.5 Relationship between ICL and Trust Culture
Research conducted by (e.g. Dietz and Den Hartog, 2006; Lewicki et al., 2006; Rousseau et al., 1998;
Schoorman et al., 2007) showed that trust consists of multiple dimensions and it has multiple facets
even: the affective, trust propensity, behavioural element and cognitive elements, perceived
characteristics of the trustee, and the position that trustee and trustor hold in the organization. If
perceived promises are not fulfilled in the organization, then the employees of that organization seek to
behave negatively (Robinson, 1996; Robinson and Rousseau, 1994). (Neves and Caetano (2009)
revealed that how the trust in their leader’s competencies led to an affective commitment by reducing
turnover and increasing overall organizational performance.
In an organizational change to accept and be willing to take risks of the change, there are four believes
related to trust, the belief that other parties will prove themselves confidential and trustworthy, be honest
with what they say and open in their communications, belief that leaders they trust do have such
capabilities to process change, and that they are truly sincere with about others best interests (Algahtani,
2014). According to one study trust in management is often characterized as social bond with other
parties, a type of social bond in which people exchange their thoughts, receive positive treatments from
each other, and create a sense of understanding with each other which improves commitment in the
employees (Tyler and Degoey 1996).
Grint says that those who possess strong leadership skills can prove himself a good role model because
his achievements get the trust of the people (Grint, 2007). Leaders are the ones who are responsible for
the proper execution of the goals. Effective leaders set optimistic and specific goals and they make

Journal of Business and Social Review in Emerging Economies Vol. 6, No 4, December 2020
1585
effective strategies to achieve those goals. Atkinson in his study said that if there are no good leaders,
motivation in employees can’t be enhanced and no clear direction can be given to the organization to
adopt the change (Atkinson, 2015). Hoverer, a recent take on leadership is to view it from the follower
side that comes up with the understanding that leadership is socially constructed, and effective
leadership is basically what perceiver thinks. (Meindl, 1995; Van Quaquabeke et al, 2011). Therefore,
our second hypothesis to be tested is
Hypotheses 2: There is a positive relationship between ICL and Trust culture
2.6 The Mediating Role of Organizational Trust Culture
Trust has been identified as the factor which shows the willingness to depend on others based on the
previous experience about someone being a trustworthy person (Sitkin and Roth, 1993; Mishra, 1996;
Mayer et al., 2007). As per this understanding of the trust, it can be defined as an attitude exhibited by
employees for the organization and how it leads its employees (Korsgaard et al., 2002). Scholars have
defined trust to be an essential part of implementing change (Armenakis et al., 1993). If the subordinates
have trust in the abilities of the leader, their performance can show a boost up and their commitment
increases (Lee et al, 2010).
People follow a person whom they trust that he will show them the right path but not a leader who just
posturizes the things but not put his words into actions (Stacey, Paul and Alice, 2011). Trust helps
builds commitment in the employees which reduces the resistance to accept change and helps modify the
preexisting beliefs and values which are potential barriers to accept change.
If employees want to embrace change, they need to trust their leaders and management, believe that they
are trustworthy (Huy, 2002). Leaders who believe in keeping their promise are to be trusted since they
are considered to be honest (Bass, 1985).
In addition, an exceptional leader being good at active management that is to deal with irregularities are
mostly perceived as competent, which is a vital dimension of the trust (Mishra, 1997). Moreover, trust in
the leaders plays an intervening role between various outcomes and leadership (Podsakoff et al., 1990).
Some researchers argue that trust mediates the relationship between leadership and the internal
psychological behaviours such as organizational citizenship, satisfaction and motivation (Pillai et al.,
1999).
The literature regarding trust has shown its vitality about how valuable it can be to for the acceptance of
the change. For instance, a study by (Reinke 2003) has stated the more there is the trust of employees in
their leaders the more readiness employees will show to accept the change. Similarly, another study by
(Condrey, 1995) has shown a direct relationship between organizational trust and evaluation of new
human resource management system and their supervisor role in the change process as the fundamental
one. Therefore, our third hypothesis is:
Hypotheses 3: Trust culture will mediate the positive relationship between ICL and
AC.

Journal of Business and Social Review in Emerging Economies Vol. 6, No 4, December 2020
1586
Figure 1: Conceptual Framework
3. Methodology
This study was based on convenient sampling. Participants used in this study was lecturers, Assistant
professors, Associate Professors, and Professors which were 300 in total. Percentage of male
participants were 75.4 and female participants were 24.6. Education of participants ranged from
undergraduate to PhD level. The study was based on university teachers, and the sample has been
collected from different universities of Sindh province of Pakistan
3.1 Measures
3.1.1 Implicit Change Leadership: ICL tests whether there is a difference between the characteristics
of an actual and ideal leader. Measures used in this study were based on 5 competencies of a change
leader in which 30 items has been tested. All the items were recorded on a five-point Likert scale with 1
showing “Strongly Disagree” and 5 show “Strongly Agree ".
3.1.2 Strategic and Technical Competencies: six items have been tested which includes if a leader is
Open-minded, Proactive, creative, Analytical, possess intelligence, and have long-term thinking.
3.1.3 Character: Three items have been tested which includes if a leader is Credible, Arrogant, and
exemplary.
3.1.4 Execution Competencies: Nine items have been tested to see if a leader is Decisive, Lazy,
Inspiring, Persuasive, Passive, Micro manages, effective coach or mentor, is organized, and lacks
execution.
3.1.5 Social Competencies: Eight items have been tested to see if a leader is a participative,
approachable, empathetic, not bossy, supportive, people-oriented, and not distrustful, and effective
communicator.
3.1.6 Resilience: Four items have been tested to see if a leader is Optimistic, Adaptable, not sensitive,
composed under pressure.
3.1.7 Affective Commitment to Change: Eights dimensions were tested on a five-point Likert scale
with 1 showing " Strongly Disagree " and 5 show " Strongly Agree ". Items were “I would be very
happy to spend the rest of my career with this institute". "I enjoy discussing my organization with people
outside it”. “I feel as if this institute’s problems are my own". “I think that I could easily become as
attached to another institute as I am to this one". "
Implicit
Change e
Leadership
Trust Culture
Affective
Commitment

Journal of Business and Social Review in Emerging Economies Vol. 6, No 4, December 2020
1587
I do not feel like ‘part of the family’ at my institute". " I do not feel ‘emotionally attached’ to this
institute"." This institute has a much deal of personal meaning for me." I have no strong sense of
belonging to my institute".
3.1.8 Organizational Trust: Six items have been tested on a five-point Likert scale with 1 showing
"strongly disagree” and 5 show "Strongly Agree". Item was “Our institute members are generally
trustworthy". “Our institute members have reciprocal faith in other members' intentions and behaviours".
"Our institute members have reciprocal faith in others' ability". “Our institute members have reciprocal
faith in others' behaviours to work toward organizational goals". “Our institute members have reciprocal
faith in others' decision toward organizational interests than individual interests". “Our institute
members have relationships based on reciprocal faith".
4. Data Analysis and Results
Compatibility scores for implicit change leadership (ICL) were calculated by getting the difference
between actual and ideal. Correlation and mean scores were calculated for each scale. Preceding to the
testing of hypothesis, we computed analysis for presuppositions for the bivariate statistic. Durbin
Watson test is conducted which is 1.639. Gender, age and education frequency are analyzed from
assumptions. At last, regression analysis was used to see the relationship between implicit change
leadership (ICL) and affective commitment to change (AC) with mediating role of organizational trust
culture (OTC) Cronbach’s alpha is computed from assumptions which show data reliability of 0.739.
4.1 Measurement Model Assessment
Before testing the hypothesis, we have tested the reliability, discriminant validity and convergent
validity of the hypothesis. Further details are present in table 2. It represents that all the Loadings (AC1
0.849) are higher than its level of significance of 0.5 (Barclay et al., 1995; chin, 1998). Average variance
of every construct (AC 0525, CH 0.58, EC 0.504, SC 0.522, S&T0.544, R 0.533, and TC0.502) is
exceeding through its nominal threshold of 0.5 (Bagozzi & Yi, 1988). Results of composite reliability
(AC 0.765, TC 0.833 and ICL 0.80086) is also higher than its minimum value recommended (0.70)
(Hair et al., 2013). These results are assuring convergent validity and its achievement. So, table 2
suggests the study has significantly attained both the measures validities convergent reliability and scale
validity.
Table 2: Assessment of Measurement Model
Constructs Items Loadings CR AVE
Affective-Commitment AC1 0.849 0.765 0.525
AC2 0.694
AC3 0.61
ICLCHAR1 0.594
ICLCHAR2 0.898
Character ICLEC1 0.722 0.726 0.58
ICLEC2 0.653
ICLEC3 0.681
ICLEC4 0.759
ICLEC9 0.73
Execution-Competence ICLR1 0.838 0.835 0.504
ICLR2 0.72
ICLR3 0.615
Social-Competence ICLSOCIAL2 0.691 0.845 0.522
ICLSOCIAL3 0.708
ICLSOCIAL5 0.684
ICLSOCIAL7 0.798
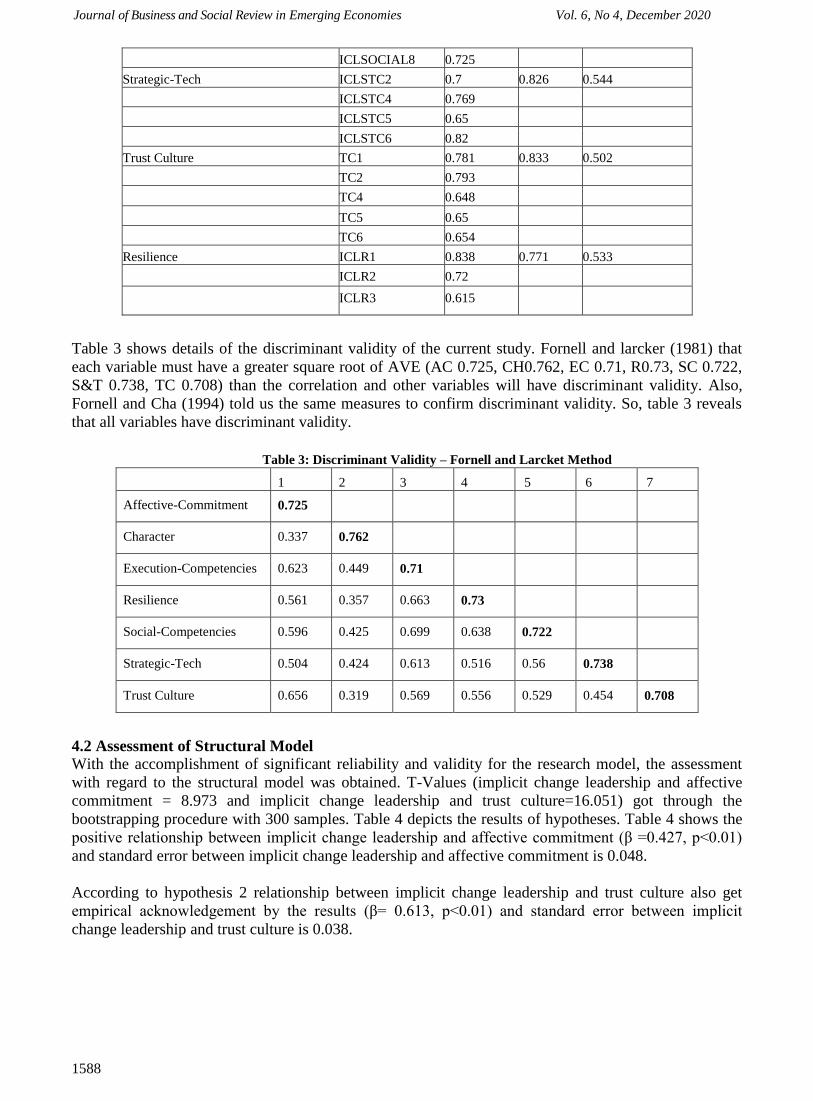
Journal of Business and Social Review in Emerging Economies Vol. 6, No 4, December 2020
1588
ICLSOCIAL8 0.725
Strategic-Tech ICLSTC2 0.7 0.826 0.544
ICLSTC4 0.769
ICLSTC5 0.65
ICLSTC6 0.82
Trust Culture TC1 0.781 0.833 0.502
TC2 0.793
TC4 0.648
TC5 0.65
TC6 0.654
Resilience ICLR1 0.838 0.771 0.533
ICLR2 0.72
ICLR3 0.615
Table 3 shows details of the discriminant validity of the current study. Fornell and larcker (1981) that
each variable must have a greater square root of AVE (AC 0.725, CH0.762, EC 0.71, R0.73, SC 0.722,
S&T 0.738, TC 0.708) than the correlation and other variables will have discriminant validity. Also,
Fornell and Cha (1994) told us the same measures to confirm discriminant validity. So, table 3 reveals
that all variables have discriminant validity.
Table 3: Discriminant Validity – Fornell and Larcket Method
1 2 3 4 5 6 7
Affective-Commitment 0.725
Character 0.337 0.762
Execution-Competencies 0.623 0.449 0.71
Resilience 0.561 0.357 0.663 0.73
Social-Competencies 0.596 0.425 0.699 0.638 0.722
Strategic-Tech 0.504 0.424 0.613 0.516 0.56 0.738
Trust Culture 0.656 0.319 0.569 0.556 0.529 0.454 0.708
4.2 Assessment of Structural Model
With the accomplishment of significant reliability and validity for the research model, the assessment
with regard to the structural model was obtained. T-Values (implicit change leadership and affective
commitment = 8.973 and implicit change leadership and trust culture=16.051) got through the
bootstrapping procedure with 300 samples. Table 4 depicts the results of hypotheses. Table 4 shows the
positive relationship between implicit change leadership and affective commitment (β =0.427, p<0.01)
and standard error between implicit change leadership and affective commitment is 0.048.
According to hypothesis 2 relationship between implicit change leadership and trust culture also get
empirical acknowledgement by the results (β= 0.613, p<0.01) and standard error between implicit
change leadership and trust culture is 0.038.
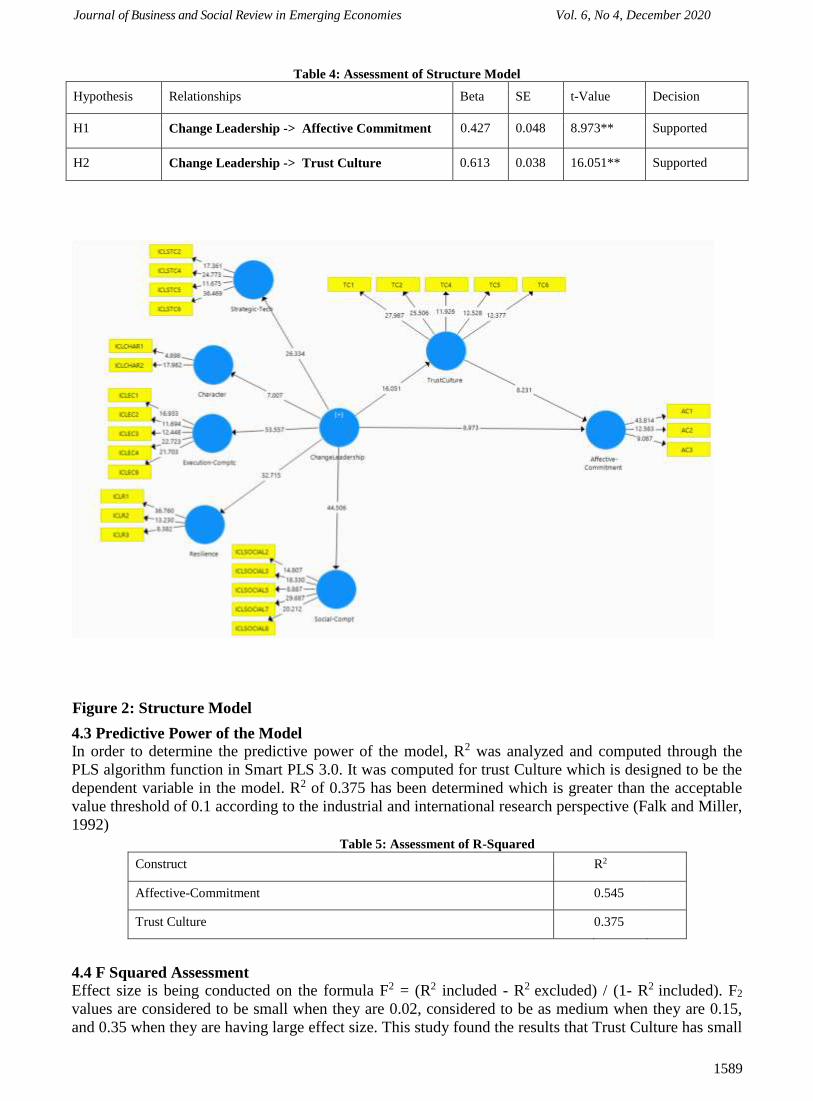
Journal of Business and Social Review in Emerging Economies Vol. 6, No 4, December 2020
1589
Table 4: Assessment of Structure Model
Hypothesis Relationships Beta SE t-Value Decision
H1 Change Leadership -> Affective Commitment 0.427 0.048 8.973** Supported
H2 Change Leadership -> Trust Culture 0.613 0.038 16.051** Supported
Figure 2: Structure Model
4.3 Predictive Power of the Model
In order to determine the predictive power of the model, R2 was analyzed and computed through the
PLS algorithm function in Smart PLS 3.0. It was computed for trust Culture which is designed to be the
dependent variable in the model. R2 of 0.375 has been determined which is greater than the acceptable
value threshold of 0.1 according to the industrial and international research perspective (Falk and Miller,
1992)
Table 5: Assessment of R-Squared
Construct R2
Affective-Commitment 0.545
Trust Culture 0.375
4.4 F Squared Assessment
Effect size is being conducted on the formula F2 = (R2 included - R2 excluded) / (1- R2 included). F2
values are considered to be small when they are 0.02, considered to be as medium when they are 0.15,
and 0.35 when they are having large effect size. This study found the results that Trust Culture has small

Journal of Business and Social Review in Emerging Economies Vol. 6, No 4, December 2020
1590
effect size f2=0.214 than affective commitment to change. The effect size of the character is also found
to be small with f=0.45. However, the effect size of Resilience, Social, Strategic and technical was found
to be large. Following table summarizes the results which are discussed.
Table 6: Assessment of F-Squared
Dependent
Variables
Affective-
Commitment Character
Execution Resilience Social
Strategic-
Tech
Trust
Culture
Change Leadership 0.251 0.45 3.46 1.685
3.09 8 1.556
0.60 1
Trust Culture 0.214 n/a n/a n/a n/a n/a n/a
4.5 Q-Squared Assessment
To determine the predictive relevance of the dependent variable, the blindfold approach for cross-
validated redundancy of Q2 was computed. The below table presents the blindfold approach results,
through which Q2 values for the constructs are found to be greater than zero which suggest that the
model do have predictive relevance
Table 7: Assessment of Q-Square
SSO SSE Q2=(1-SSE/SSO)
Affective-Commitment 900 662.799 0.264
Trust Culture
1,500.00 1,238.40 0.174
4.6 Mediation Analysis
Regarding hypothesis 3, the mediation effect of trust culture on change leadership and affective
commitment to change, the recommendation from preacher and Hayes (2004; 2008) has been
considered. The Bootstrapping method has been carried out to examine the indirect effects of mediation.
Findings have been found positive in which β= 0.242, p<0.01) and with a t-value of 7.715. Moreover, as
per Preacher and Hayes research indicated there exists the indirect effect of 0.183 with 97.5 per cent
Boot must not straddle a zero and hence suggests a mediating effect.
Table 8: Indirect Effect
Hypo: Relationship Beta SE t-value 2.50% 97.50%
H3 Change Leadership ->
Affective-Commitment
0.242 0.031 7.715 0.183 0.305
5. Discussion
Results support our hypothesis that implicit change leadership do have a positive direct relationship with
affective commitment to change and that change leadership schemas positively affects commitment to
change.
Moreover, our second hypothesis has also been supported showing that implicit change leadership
schemas also have a positive relationship with organizational trust culture. Our third hypothesis which
was to show the mediating effect of trust culture on change leadership and affective commitment to
change has also been supported by using the bootstrapping method, and with the t-value of 7.715 and p-
value of less than 0.01 and with the beta of 0.242 the mediation effect does exist. These results add to
the literature and show how important it is for leaders to develop a positive mindset and image in the

Journal of Business and Social Review in Emerging Economies Vol. 6, No 4, December 2020
1591
eyes of employees and subordinates to readily accept change and to show more loyalty and commitment
in terms of organizational trust and change.
Results also indicated that the constructs have also passed reliability test with all the constructs of
implicit change leadership having more loading than the normal significant level. Of 0.05. So, it has
been shown that the study has convergent reliability which shows that the constructs are in fact
related. Furthermore, a discriminant validity test was also conducted, and all the variables proved
discriminant validity as shown in table 3 which suggests that those items which are not related are
actually not overlapping and are unrelated.
Structural equation modelling and the bootstrapping method was used to prove the hypothesis and infer
the decision in which all the decisions were supported. The mediating effect of trust culture was shown
and the relationship between implicit change leadership and trust culture was supported with a standard
error of 0.038.
The proportion of variance for the dependent variable was found R2 was found more than the acceptable
threshold level for the dependent variable. Affective commitment with R2 0.545 shows 54.5% of the
variance accounted by the model, which shows a moderate fit with the model, whereas trust culture with
R2 0.375 shows 37.5 % variance accounted by the model.
The model has greater than 0 Q2 values which show that the model does have predictive validity with
affective commitment having slightly more predictive relevance than the trust culture. This measure
shows the importance of creating an organizational trust among employees with having change leaders
possessing strong influence and desirable attitude to get the subordinates to accept the change by
showing the positive relationships between trust culture and change leadership.
6. Implications and Conclusion
6.1 Implications
It has been revealed in the research that how important it is for the leaders to develop a positive attitude
in the minds of employees and build a culture in which employees trust in the practices of organization
and feel committed to it.
It is, therefore, necessary for change leaders to develop such skills and polish their competencies so that
in the time when they truly want their organizational members to be adept to change they should not
face any difficult convincing them, instead they must not be concerned about the resistance they might
face from their employees regarding any change that may occur in an organization and rather should
have a firm trusting culture.
7. Conclusion
This study confirmed that organizational trust plays a key role in accepting change. It shows that change
leaders personality traits do have an influence on the commitment of employees in academic institutions
and that trust and commitment collectively build leadership schemas which in turn make the employees
feel more loyal to their organizations and readily accept the change.
The study was limited to academic institutions of Sindh region; however, culture influences may differ
in other provinces. Leadership traits may differ based on the specific cultural aspects of that region. So,
future studies can consider the cultural perspective of academic institutions of other provinces as well.
Furthermore, future studies can also take the effects of different variables as a mediating effect on
change leadership and commitment to change.
References
Meindl, J. (1995), “The romance of leadership as a follower-centric theory: a social constructionist
approach”, The Leadership Quarterly, Vol. 6 No. 3, pp. 329-341

Journal of Business and Social Review in Emerging Economies Vol. 6, No 4, December 2020
1592
Van Quaquabeke, N., van Knippenberg, D. and Brodbeck, F. (2011), “More than meets the eye: the role
of subordinates’ self-perceptions in leader categorization processes”, Leadership Quarterly, Vol.
22 No. 2, pp. 367382.
Jowett F. Magsaysay, Ma. Regina M. Hechanova, (2017) "Building an implicit change leadership
theory", Leadership & Organization Development Journal, Vol. 38 Issue: 6, pp.834-848.
Epitropaki, O. and Martin, R. (2005), “From ideal to real: a longitudinal study of the role of implicit
leadership theories on leader-member exchanges and employee outcomes”, Journal of Applied
Psychology, Vol. 90 No. 4, pp. 659-676.
Schyns, B., Kiefer, T., Kerschreiter, R. and Tymon, A. (2011), “Teaching implicit leadership theories to
develop leaders and leadership: how and why it can make a difference”, Academy of
Management Learning & Education, Vol. 10 No. 3, pp.
397-408.
Popper, M. and Druyan, N. (2001), “Cultural prototypes? Or leaders’ behaviors? A study on workers’
perceptions of leadership in an electronics industry”, Journal of Managerial Psychology, Vol. 16
No. 7, pp. 549-558.
Offermann, L.R., Kennedy, J.K. and Wirtz, P.W. (1994), “Implicit leadership theories: content,
structure, and generalizability”, Leadership Quarterly, Vol. 5 No. 1, pp. 43-58.
Saltz, J.L. (2004), “Beyond simple similarity: the relationship of leader-follower personality fit with
follower satisfaction with the leader and follower commitment to the organization”,
Ma. Regina M. Hechanova, Jaimee Felice Caringal-Go, Jowett F. Magsaysay, (2018) "Implicit change
leadership, change management, and affective commitment to change: Comparing academic
institutions vs business enterprises", Leadership & Organization Development Journal, Vol. 39
Issue: 7, pp.914-925.
Armenakis, A. (1993), “Creating readiness for organizational change”, Human Relations, Vol. 46 No. 6,
pp. 681-703.
Fedor, D.B. , Caldwell, S. and Herold, D.M. (2006), “The effects of organizational changes on employee
commitment: a multilevel investigation”, Personnel Psychology, Vol. 59 No. 1, pp. 1-29.
Herscovitch, L. and Meyer, J.P. (2002), “Commitment to organizational change: extension of a three-
component model”, Journal of Applied Psychology, Vol. 87 No. 3, pp. 474-487
Cunningham, G. (2006), “The relationships among commitment to change, coping with change, and
turnover intentions”, European Journal of Work and Organizational Psychology.
Michaelis, B., Stegmaier, R. and Sonntag, K. (2010), “Shedding light on followers’ innovation
implementation behavior: the role of transformational leadership, commitment to change, and
climate for initiative”, Journal of Managerial Psychology, Vol. 25 No. 4, pp. 408-429.
Adil, M.S. (2014), “Impact of leader’s change-promoting behavior on readiness for change: a mediating
role of organizational culture”, j o u r n a l o f m a n a g e m e n t s c i e n c e s, Vol. 1 No. 2, pp.
113-150.
Dietz, G. and Den Hartog, D. (2006), “Measuring trust inside organizations”, Personnel Review, Vol. 35
No. 5, pp. 557-588.
Lewicki, R.J., McAllister, D.J. and Bies, R.J. (1998), “Trust and distrust: new relationships and
realities”, Academy of Management Review,
Rousseau, D.M., Sitkin, S.B., Burt, R.S. and Camerer, C. (1998), “Not so different after all: across-
discipline view of trust”, The Academy of Management Review, Vol. 23 No. 3, pp.
393-404.
Schoorman, F.D., Mayer, R.C. and Davis, J.H. (2007), “An integrative model of organizational trust:
past, present, and future”, Academy of Management Review, Vol. 32 No. 2, pp. 344-354.
Robinson, S.L. and Rousseau, D.M. (1994), “Violating the psychological contract, not the exception but
the norm”, Journal of Organizational Behavior, Vol. 15 No. 3, pp. 245-259.
Neves, P. and Caetano, A. (2009), “Commitment to change: contributions to trust in the supervisor and
work outcomes”, Group and Organization Management, Vol. 34 No. 6, pp. 623-644.
Mayer, R.C., Davis, J.H. and Schoorman, F.D. (1995), “An integrative model of organizational trust”,
The Academy of Management Review, Vol. 20 No. 3, pp. 709-734.
McAllister, D.J. (1995), “Affect-and cognition-based trust as foundations for interpersonal cooperation
in organizations”, Academy of Management Journal, Vol. 38 No. 1, pp. 24-59.

Journal of Business and Social Review in Emerging Economies Vol. 6, No 4, December 2020
1593
Rousseau, D.M., Sitkin, S.B., Burt, R.S. and Camerer, C. (1998), “Introduction to special topic forum:
not so different after all: a cross-discipline view of trust”, The Academy of Management Review,
Vol. 23 No. 3, pp. 393-404.
Whitener, E.M., Brodt, S.E., Korsgaard, M.A. and Werner, J.M. (1998), “Managers as initiators of trust:
an exchange relationship framework for understanding managerial trustworthy behavior”, The
Academy of Management Review, Vol. 23 No. 3, pp. 513-530. [Crossref],
Hao, Moo & Yazdanifard, Assc. Prof. Dr. Rashad. (2015). How Effective Leadership can Facilitate
Change in Organizations through Improvement and Innovation. Global Journal of Management
and Business Research (A). 15. 1-6.
Abdulla Ahmed Al-Ali, Sanjay Kumar Singh, Moza Al-Nahyan, Amrik Singh Sohal, (2017) "Change
management through leadership: the mediating role of organizational culture", International
Journal of Organizational Analysis, Vol. 25 Issue: 4, pp.723-739.
Ann-Louise Holten, Sten Olof Brenner, (2015) "Leadership style and the process of organizational
change", Leadership & Organization Development Journal, Vol. 36 Issue: 1, pp.2-16,
Gilley, Ann & Gilley, Jerry & Mcmillan, Heather. (2009). Organizational change: Motivation,
communication, and leadership effectiveness. Performance Improvement Quarterly. 21. 75 - 94.
10.1002/piq.20039.
Wen Juan Cai, Mark Loon, Peter Hoi Kin Wong, (2018) "Leadership, trust in management and
acceptance of change in Hong Kong’s Civil Service Bureau", Journal of Organizational Change
Management, Vol. 31 Issue: 5, pp.1054-1070,
Dr Björn Michaelis , Ralf Stegmaier & Karlheinz Sonntag (2009) Affective Commitment to Change and
Innovation Implementation Behavior: The Role of Charismatic Leadership and Employees’ Trust
in Top Management, Journal of Change Management, 9:4, 399-417.

Journal of Business and Social Review in Emerging Economies Vol. 6, No 4, December 2020
1594
Journal of Business and Social Review in Emerging Economies Vol. 6, No 4, December 2020
1595
Volume and Issues Obtainable at Center for Sustainability Research and Consultancy
Journal of Business and Social Review in Emerging Economies ISSN: 2519-089X (E): 2519-0326
Volume 6: No. 4, December 2020
Journal homepage: www.publishing.globalcsrc.org/jbsee
Awareness on Islamic Banking: An Investigation on Women Entrepreneurs in
Quetta
1Saba Raja, 2Jameel Ahmed, 3Kaneez Fatima 1Research Student, Institute of Management Sciences, University of Balochistan, Quetta, Pakistan,
[email protected] 2&3Assistant Professor, Institute of Management Sciences, University of Balochistan, Quetta, Pakistan,
[email protected], [email protected]
ARTICLE DETAILS ABSTRACT History Revised format: November 2020 Available Online: December 2020
This study creates the profile of women entrepreneurs in Quetta city
and examines their awareness level regarding Islamic banking and its
products. The study is descriptive in nature and survey questionnaire
was used for data collection. The data from 106 women entrepreneurs
were collected who are engaged in multiple business activities in
Quetta city. From the results it has been found that majority of the
women entrepreneurs (i.e., 60%) knew about the term, Islamic
banking but the sample size trimmed down as the research questions
moved to awareness about Islamic principles, Shariah board, Islamic
banking products, Islamic modes of finance and comparison of
Islamic banking with conventional banking. It was found that only 10
(out of 106) women entrepreneurs are highly aware about Islamic
banking, Islamic principles, Shariah board, Islamic banking products,
and Islamic modes of finance. This study suggests that Islamic banks,
scholars, and academicians should collaborate to enhance the
awareness by arranging awareness campaigns, workshops, seminars,
and training sessions on Islamic banking and its products among
women entrepreneurs.
© 2020 Center for Sustainability Research and Consultancy Pakistan under
a Creative Commons Attribution-NonCommercial-ShareAlike 4.0
Keywords Women entrepreneurs,
Awareness, Islamic Banking,
Islamic Banking Products,
Quetta.
JEL Classification
M0, M1
Corresponding author’s email address: [email protected]
Recommended citation: Raja, S., Ahmed, J. & Fatima, K. (2020). Awareness on Islamic Banking: An
Investigation on Women Entrepreneurs in Quetta. Journal of Business and Social Review in Emerging
Economies, 6(4), 1595-1609
1. Introduction
Islamic finance implies the financial structure in which all financial activities must comply with Shariah
(Reiff, 2018). The concept of Islamic finance came into being with the inception of Islam, but formally
Islamic banking system was established in the 20th century. It provides an interest-free banking system
and operates according to Shariah (Gait & Worthington, 2007). Islamic banking is rapidly growing in
the international market. Currently, more than 300 Islamic banks are operating in over 50 countries
around the world (Lim, 2019) and more than 200 conventional banks are offering Islamic banking
services from their Islamic windows (Markets, 2019).
In Pakistan, the Islamic banking system was initiated with the establishment of Meezan bank in 2002.
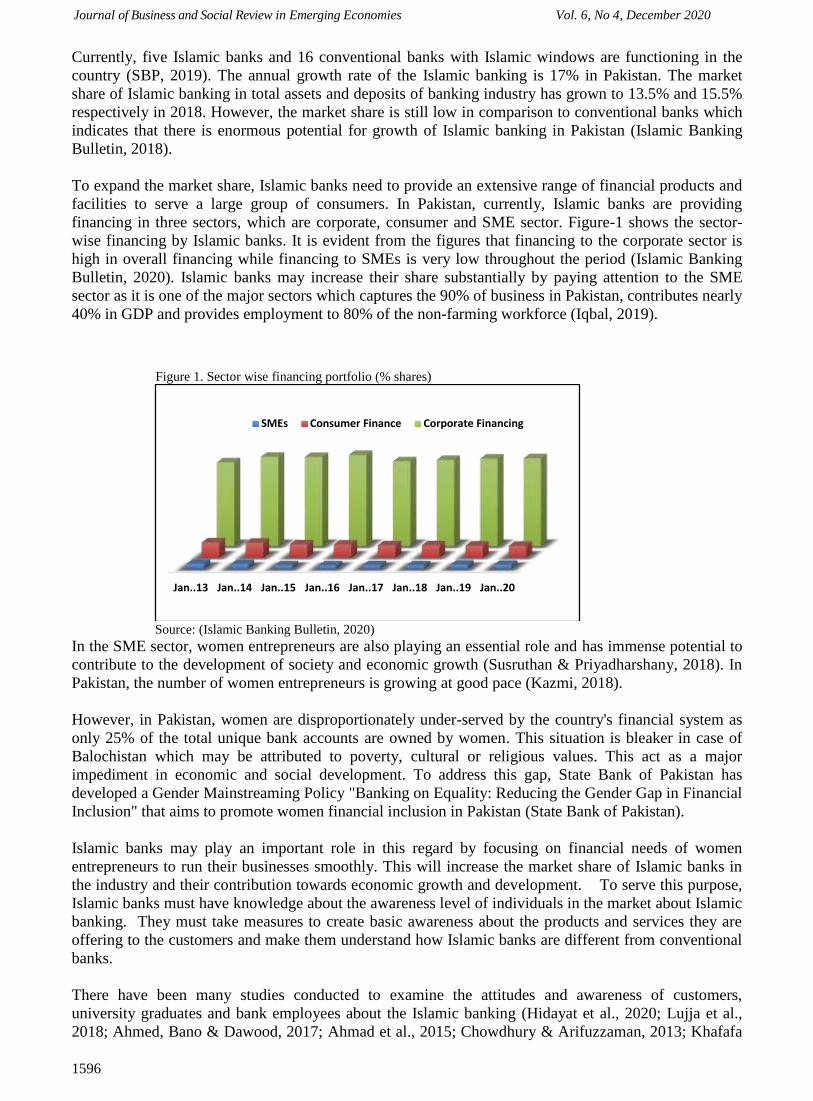
Journal of Business and Social Review in Emerging Economies Vol. 6, No 4, December 2020
1596
Currently, five Islamic banks and 16 conventional banks with Islamic windows are functioning in the
country (SBP, 2019). The annual growth rate of the Islamic banking is 17% in Pakistan. The market
share of Islamic banking in total assets and deposits of banking industry has grown to 13.5% and 15.5%
respectively in 2018. However, the market share is still low in comparison to conventional banks which
indicates that there is enormous potential for growth of Islamic banking in Pakistan (Islamic Banking
Bulletin, 2018).
To expand the market share, Islamic banks need to provide an extensive range of financial products and
facilities to serve a large group of consumers. In Pakistan, currently, Islamic banks are providing
financing in three sectors, which are corporate, consumer and SME sector. Figure-1 shows the sector-
wise financing by Islamic banks. It is evident from the figures that financing to the corporate sector is
high in overall financing while financing to SMEs is very low throughout the period (Islamic Banking
Bulletin, 2020). Islamic banks may increase their share substantially by paying attention to the SME
sector as it is one of the major sectors which captures the 90% of business in Pakistan, contributes nearly
40% in GDP and provides employment to 80% of the non-farming workforce (Iqbal, 2019).
Figure 1. Sector wise financing portfolio (% shares)
Source: (Islamic Banking Bulletin, 2020)
In the SME sector, women entrepreneurs are also playing an essential role and has immense potential to
contribute to the development of society and economic growth (Susruthan & Priyadharshany, 2018). In
Pakistan, the number of women entrepreneurs is growing at good pace (Kazmi, 2018).
However, in Pakistan, women are disproportionately under-served by the country's financial system as
only 25% of the total unique bank accounts are owned by women. This situation is bleaker in case of
Balochistan which may be attributed to poverty, cultural or religious values. This act as a major
impediment in economic and social development. To address this gap, State Bank of Pakistan has
developed a Gender Mainstreaming Policy "Banking on Equality: Reducing the Gender Gap in Financial
Inclusion" that aims to promote women financial inclusion in Pakistan (State Bank of Pakistan).
Islamic banks may play an important role in this regard by focusing on financial needs of women
entrepreneurs to run their businesses smoothly. This will increase the market share of Islamic banks in
the industry and their contribution towards economic growth and development. To serve this purpose,
Islamic banks must have knowledge about the awareness level of individuals in the market about Islamic
banking. They must take measures to create basic awareness about the products and services they are
offering to the customers and make them understand how Islamic banks are different from conventional
banks.
There have been many studies conducted to examine the attitudes and awareness of customers,
university graduates and bank employees about the Islamic banking (Hidayat et al., 2020; Lujja et al.,
2018; Ahmed, Bano & Dawood, 2017; Ahmad et al., 2015; Chowdhury & Arifuzzaman, 2013; Khafafa
Jan..13 Jan..14 Jan..15 Jan..16 Jan..17 Jan..18 Jan..19 Jan..20
SMEs Consumer Finance Corporate Financing

Journal of Business and Social Review in Emerging Economies Vol. 6, No 4, December 2020
1597
& Shafii, 2013; Göksu & Becic, 2012; Khattak & Rehman, 2010; Metawa & Almossawi, 1998; Haron et
al., 1994). There have also been few studies conducted on business firms, corporations, and SMEs’
attitudes towards the Islamic financial system (Gait & Worthington, 2008). However, no study in
literature has investigated the awareness level of women entrepreneurs about Islamic banking. Thus, this
study aims to investigate the awareness level of women entrepreneurs about Islamic banking and its
products in Quetta, Pakistan. The study will contribute to literature in several ways; First, it focuses the
women entrepreneurs of Quetta where, no profile of the women entrepreneurs was available with
SMEDA or any other Govt Organization. Hence, we create their profile. Secondly, it determines the
degree of awareness of women entrepreneurs on Islamic banking, and its products and the difference
between Islamic and conventional banking.
The rest of the paper is organized as follows; Section 2 reviews the literature briefly, section 3 lays out
the methodology, section 4 presents the analysis of results, section 5 concludes.
2. Literature Review
Islamic banking system is characterized as banking system which is in line with Islamic values and
governed by the Shariah principles (Cheteni, 2014). Fundamentally, Islamic banking system is
introduced to fulfill the requirement of Muslims to use banking products/services in such a way that
doesn’t comprise the Islamic values (Khan et al., 2007). Islamic banking is rapidly growing in last few
decades and expended to all places in world-wide and it has gained extensive recognition among
Muslims and Non-Muslims (Ahmad et al., 2015).
2.1 Awareness about Islamic Banking
Awareness refers to the knowledge or information about the particular object (Yaur, 1973). Awareness
towards Islamic banking and its products refers to the knowledge and understanding about the existence
of Islamic bank, as well as information about its operations, product/services and all functions of Islamic
banking (Buchari et al., 2015a). In literature, number of studies (for example Hidayat et al., 2020;
Ahmed, Bano & Dawood, 2017; Ahmad et al., 2015; Chowdhury & Arifuzzaman, 2013; Göksu &
Becic, 2012; Haron et al., 1994) have been conducted on the awareness level of customers, employees,
entrepreneurs, students of graduate studies, university employees, and Muslims and Non-Muslims
communities. These studies have been conducted in various countries around the world including
Bahrain, Jordan, Bangladesh, Brunei, Libya, South Africa and in several cities of Pakistan.
The previous studies show that majority of customers were aware with the term, ‘Islamic banking’
(Saini et al., 2011). However, they were less aware with the products and services provides by Islamic
banks (Metawa & Almossawi, 1998). The customers were using it for daily transactions therefore they
were aware only with some general products including current/saving accounts, Automated Tailored
Machine (ATM), and the rest were unfamiliar with other products offered by Islamic banking (Imran et
al., 2014; Raza & Azeem, 2014). Similarly, the majority of the respondents were not aware with several
financial products such as Mudarabaha, Musharkaha, Murhabaha and Ijarah (Khan et al., 2007). Naser
et al. (1999) found that majority of the customers have switched to Islamic banking due to religious
motivation. The religious motivation is one of the important factors while choosing Islamic banking,
whereas the other factors including confidentiality of customers' information, transaction efficiency,
services charges, and financial counseling played a significant role in choosing Islamic banking (Khattak
& Rehman, 2010). On the contrary there were few customers who had skeptical views regarding the
Shariah compliance of Islamic banking (Imran et al., 2014). The few studies suggested that marketing
strategies should be improved to boost the customer's awareness regarding Islamic banking products as
the majority of the respondents were unaware with Islamic banking products and financial products
(Bashir, 2013; Khafafa & Shafii, 2013).
Similarly, few studies have been conducted on awareness of financial institution’s employees. These
studies have been conducted in Bahrain, Russia, and Pakistan. The study in Bahrain shows that more
than half of the participants were aware of Islamic banking, and have positive perspective for Islamic
banking products (Buchari et al., 2015b). On the other hand, the study in Russia found that there is a
Journal of Business and Social Review in Emerging Economies Vol. 6, No 4, December 2020
1598
relatively low level of awareness among employees of financial institutions. The respondents were not
aware that Riba, Maysir and Gharar strictly prohibited in Islam. Likewise, the respondents were not
aware of financial products, even they were not familiar with the terminologies used in modes of finance
(Hidayat et al., 2020). Furthermore, in comparison to the employees of Islamic banks and Conventional
banks having Islamic windows, the employees of Islamic banks are more aware with the operations,
products and services of Islamic banks than their conventional counterparts (Arshad et al., 2011; Zainol,
2008). It has also been found that the gender and age pay a significant role in terms of awareness of
employees (Buchari et al., 2015b; Saleem et al., 2018).
Furthermore, few studies have also been conducted on university graduates regarding their awareness
about Islamic banking. These studies found that majority of respondents have a lack of understanding
about Islamic banking and they were unfamiliar with the products offered by Islamic banks (Ali, 2016).
Due to lack of understanding, the respondents had skeptical views regarding Shariah compliance
activities of Islamic banking (Chowdhury & Arifuzzaman, 2013).
The review of literature shows that the studies are conducted on awareness level of customers,
employees, entrepreneurs, students of graduate studies, university employees, and Muslims and Non-
Muslims communities. They found varying degree of awareness on Islamic banking. However, no study
has investigated the awareness level of women entrepreneurs on Islamic banking. This study attempts to
fill the gap by measuring the awareness level of women entrepreneurs in Quetta city. This is interesting
to investigate because women in general and Quetta being a capital city of Balochistan, in particular are
underserved by the financial system in Pakistan.
3. Research Methodology
This study is descriptive in nature as it described the extent to which women entrepreneurs are aware of
Islamic banking and its products in Quetta city. This approach is deemed appropriate to observe and
measure any phenomena (Combes, 2019). Additionally, the researcher compiled the business profile of
Quetta's women entrepreneurs, as no such information was available regarding women entrepreneurs
and their businesses in Quetta.
The researchers used survey method to examine the women entrepreneurs' awareness level about Islamic
banking and its products. Survey method is an appropriate method when the researchers aim to describe
or explain the characteristics of a group (Ponto, 2015). A structured questionnaire was designed to
survey women entrepreneurs; the questionnaire consisted of the demographic, business profile, and
awareness about Islamic banking.
For data collection, the researchers acquired the list of 201 women entrepreneurs from various sources
including Small and Medium Development Authority (SMEDA), Innovative Development Organization
(IDO), Incubation Center of Sardar Bahadur Khan Women University (SBKWU), National Incubation
Center (NIC) Quetta, and Women Chamber of Commerce and Industries (WCCI) Quetta. The snowball
sampling was also used to get further contacts of women entrepreneurs.
The researcher approached the complete list of 201 women entrepreneurs. It has been found that out of
the 201 contacts, 51 contacts numbers were invalid or wrong, 21 of them didn't attend the call, and 23
didn't respond to the questionnaire. Therefore, the data was collected from 106 women entrepreneurs by
personal visits, using telephonic calls, and through online questionnaires.
The data was analyzed through descriptive analysis using SPSS. The descriptive analysis technique
describes the basic features and provides the summarized information of measured data (Kenton, 2019).
4. Analysis and Findings The analysis of the study is divided into three sections. Firstly, the demographic profile is presented
which demonstrate the respondents' background. In the second section, the business profile is developed,
which identified the business sectors of women entrepreneurs in Quetta. In the last section, awareness

Journal of Business and Social Review in Emerging Economies Vol. 6, No 4, December 2020
1599
about Islamic banking is analyzed to measure women entrepreneurs' awareness level about Islamic
banking and its products.
In this study, the researchers analyzed different aspects of the demographic profile of women
entrepreneurs. Table 1 demonstrate various age groups of the women entrepreneurs. It is evident from
the following Table that majority of women entrepreneurs fall under the age of 45 years. More than 50
percent of women entrepreneurs are in the age group of 25-35. This means that women in this age group
are more inclined toward starting their own businesses rather than seeking jobs. It is because Govt. of
Pakistan is encouraging higher education institutions to educate the university graduates regarding
entrepreneurship by not only offering courses related to entrepreneurship but also organizing training
sessions and Business Idea Competitions. For this purpose, Higher Education Commission (HEC)
directed all universities to operationalize business incubation centers to support the young entrepreneurs
(Reuters, 2019).
Table 1. Age profile of Women entrepreneurs
describes the division of 106 women entrepenrus based on different ethnic groups. It is explicit from
Table 2 that 60 percent of the women entrepreneurs are from Panjabi and Urdu speaking communities.
The percentage of women entrepeneurs from local tribes (i.e., Baloch, Pashtun and Brahvi) is
comparatively low. This could be due to cultural barriers because culture is one of the main hurdles for
women entrepreneurship in Pakistan (CIPE, 2013). In tribal setup of Balochistan, women are exposed to
strict cultural norms. Due to these cultural norms, they are not allowed to make their decisions and
choose their professional careers. (Sabir, 2010).
Table 2. Ethnic Group of Women
5. Business Profile
Business profile is a
report that provides an
overview of the business entity,
which includes business name,
nature of business,
business activities,
business owner etc. (ARCA,
2019). In the study, the
researchers developed the
business profile of 106 women entrepreneurs because no detailed information existed regarding women
entrepreneurs' businesses in Quetta city. This is not surprising because women entrepreneurship is one
of the areas which has not received much attention in traditional societies of Pakistan. According to
World Bank, Pakistan has the lowest rate of women entrepreneurship (i.e., only 1 percent) among other
countries across the globe.
The type of businesses operated by women entrepreneurs in Quetta city can be divided into 11 different
business sectors as shown in Table 3. It has been found that Clothing, Beauty Salon and Food-related
businesses account for approximately 75 percent of overall businesses operated by women entrepreneurs
Age Frequency Percentage
≤ 25 Years 24 22.6
26-35 Years 40 37.7
36-45 Years 30 28.3
46-55 Years 11 10.4
≥ 56 Years 1 0.9
Total 106 100.0
Ethnic Group Frequency Percentage
Balochi 12 11.3
Pashtun 15 14.2
Brahvi 04 3.8
Persian 11 10.4
Panjabi 35 33.0
Urdu 25 23.6
Others 04 3.7
Total 106 100.0
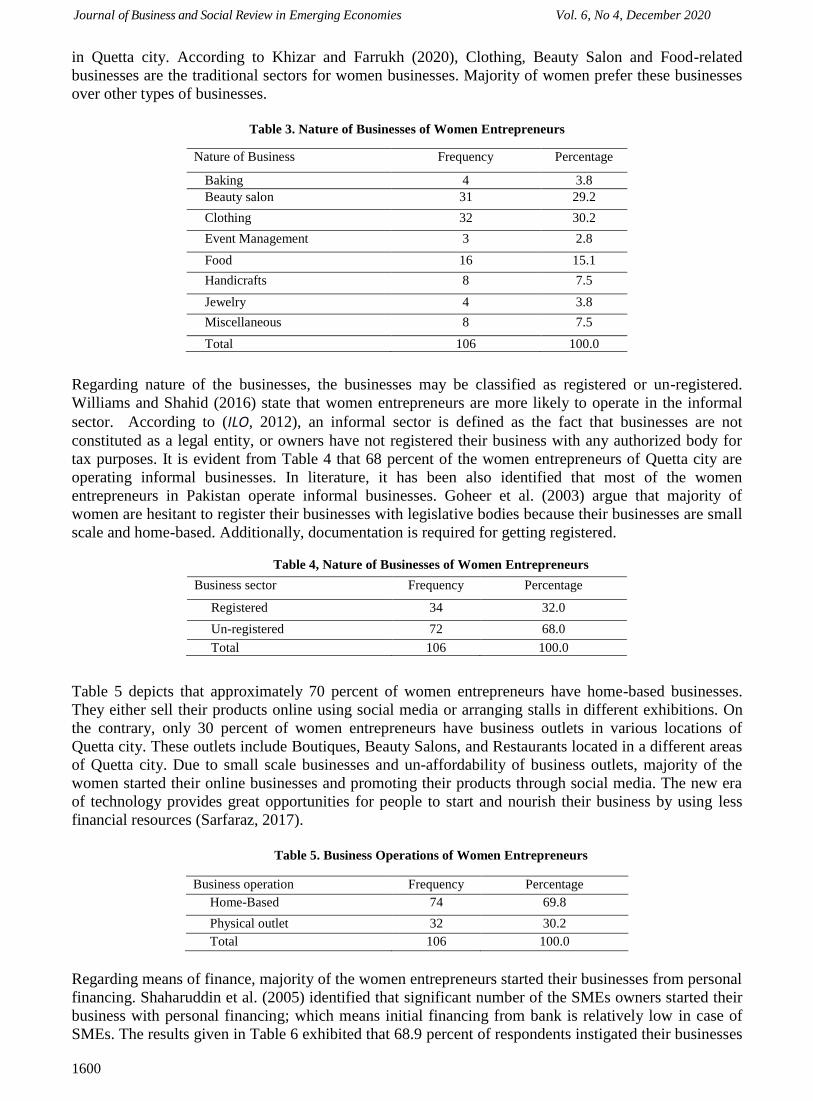
Journal of Business and Social Review in Emerging Economies Vol. 6, No 4, December 2020
1600
in Quetta city. According to Khizar and Farrukh (2020), Clothing, Beauty Salon and Food-related
businesses are the traditional sectors for women businesses. Majority of women prefer these businesses
over other types of businesses.
Table 3. Nature of Businesses of Women Entrepreneurs
Regarding nature of the businesses, the businesses may be classified as registered or un-registered.
Williams and Shahid (2016) state that women entrepreneurs are more likely to operate in the informal
sector. According to (ILO, 2012), an informal sector is defined as the fact that businesses are not
constituted as a legal entity, or owners have not registered their business with any authorized body for
tax purposes. It is evident from Table 4 that 68 percent of the women entrepreneurs of Quetta city are
operating informal businesses. In literature, it has been also identified that most of the women
entrepreneurs in Pakistan operate informal businesses. Goheer et al. (2003) argue that majority of
women are hesitant to register their businesses with legislative bodies because their businesses are small
scale and home-based. Additionally, documentation is required for getting registered.
Table 4, Nature of Businesses of Women Entrepreneurs
Table 5 depicts that approximately 70 percent of women entrepreneurs have home-based businesses.
They either sell their products online using social media or arranging stalls in different exhibitions. On
the contrary, only 30 percent of women entrepreneurs have business outlets in various locations of
Quetta city. These outlets include Boutiques, Beauty Salons, and Restaurants located in a different areas
of Quetta city. Due to small scale businesses and un-affordability of business outlets, majority of the
women started their online businesses and promoting their products through social media. The new era
of technology provides great opportunities for people to start and nourish their business by using less
financial resources (Sarfaraz, 2017).
Table 5. Business Operations of Women Entrepreneurs
Regarding means of finance, majority of the women entrepreneurs started their businesses from personal
financing. Shaharuddin et al. (2005) identified that significant number of the SMEs owners started their
business with personal financing; which means initial financing from bank is relatively low in case of
SMEs. The results given in Table 6 exhibited that 68.9 percent of respondents instigated their businesses
Nature of Business Frequency Percentage
Baking 4 3.8
Beauty salon 31 29.2
Clothing 32 30.2
Event Management 3 2.8
Food 16 15.1
Handicrafts 8 7.5
Jewelry 4 3.8
Miscellaneous 8 7.5
Total 106 100.0
Business sector Frequency Percentage
Registered 34 32.0
Un-registered 72 68.0
Total 106 100.0
Business operation Frequency Percentage
Home-Based 74 69.8
Physical outlet 32 30.2
Total 106 100.0

Journal of Business and Social Review in Emerging Economies Vol. 6, No 4, December 2020
1601
by personal financing, 29.2 percent through family/friends financing. However, only a small fraction of
1.9 percent of women entrepreneurs commenced their business by obtaining financing from the banks.
Due to interest factor and bank criteria for financing, most of the women prefers to start their business
with their personal, and family financing (Syed, 2010).
Table 6. Initial Capital for Businesses of Women Entrepreneurs
6. Analysis of Awareness about Islamic Banking and its Products
In this study, numerous questions were probed from women entrepreneurs about Islamic banking to
assess their awareness regarding Islamic banking and its product. The questionnaire was categorized into
six sections based on awareness about Islamic banking, Islamic principles, Shariah board, Islamic
banking products, modes of finance, and comparison of Islamic banking with their conventional
counterparts.
The first about and main question about awareness of Islamic banking was asked from 106 women
entrepreneurs. The result as shown in Figure 2 depicts that only 64 women entrepreneurs were aware
about Islamic banking, whereas 42 women entrepreneurs were not aware about it. In Pakistan, the
Islamic banking system is introduced since nearly two decades, yet the awareness level among women
entrepreneurs is relatively low. Such low awareness level among women entrepreneurs could be due to
insufficient marketing strategies as up till now Islamic banks are incapable to launch awareness
campaigns for the women in Pakistan (Ayub, 2013). Based on awareness of women entrepreneurs
about Islamic banking, the sample size decreased to 64 respondents. The researchers queried the
remaining questions from only those women entrepreneurs who were aware about Islamic banking.
Figure 2. Awareness about Islamic Banking
Although majority of the women entrepreneurs (i.e., 60 percent) knew about Islamic banking but the
number of women entrepreneurs further trimmed down as we moved to our second question i.e., Islamic
banking operations are based on Islamic principles. From 64 women entrepreneurs, only 44 of them
were aware that Islamic banking is based on Islamic principles as shown in Figure 3. The results found
to be in line with a study conducted on general society that majority of the respondents were aware with
the existence of Islamic banking. However, limited respondents knew about the way Islamic banks
operate (Shaikh et al., 2017). Based on the responses of women entrepreneurs, the sample size further
0
10
20
30
40
50
60
70
Are you aware about islamic banking?No
of
wo
men
en
trep
ren
eurs
Yes No
Initial Capital for Business Frequency Percentage
Personal 73 68.9
Family/Friends Financing 31 29.2
Loan from Bank 02 1.90
Total 106 100.0

Journal of Business and Social Review in Emerging Economies Vol. 6, No 4, December 2020
1602
reduced to 44 respondents. The researchers asked the remaining questions from only those women
entrepreneurs who were not only aware about Islamic banking existence but also knew that it is based on
Islamic principles.
Figure 3. Awareness about Islamic Banking is based on Islamic principles
The queries regarding various aspect of Islamic principles, which the researchers asked from the women
entrepreneurs, were mainly focused on Riba (interest), profit-loss sharing principles, uncertainty
(gharar) and investment in halal businesses. Being a Muslim and resident of Islamic Republic of
Pakistan, the majority of women entrepreneurs were aware about the concept of Riba and its prohibition
in Islam (see Figure 4). This may be because Riba and its prohibition is not only stated in Quran, Hadith
and in fiqh books but it has also been discussed in length by Islamic scholars (Ali, 2007). However, only
34 of women entrepreneurs knew about Riba-free banking activities.
Figure 4. Awareness about Riba about Interest-free banking
Regarding profit-loss sharing principle, the researchers found that almost half of the women
entrepreneurs knew that Islamic banking and its returns are based on profit-loss sharing principle. While
15 of them were informed about the risk-sharing model as shown in Figure 5. The results demonstrated
that awareness regarding Islamic banking operations was relatively low. Such low level of awareness
could be due to marketing strategies, as Islamic banks are unable to properly target the unaware segment
of general society in order to create their awareness regarding Islamic baking and its operations which
would ultimately increase market share of Islamic banks (Rustam et al., 2011).
0
10
20
30
40
50
Do you know that Islamic banking is based on Shariah principles?No
of
wo
men
en
trep
ren
eurs
Yes No
05
1015202530354045
Are you familiar with theconcept of Interest (Riba)?
Do you know that Islamstrictly prohibit all forms of
interest (Riba)?
Do you know that Islamicbanking provide Interest-free/Riba-free banking?
No
of
wo
men
en
trep
ren
eurs
Yes No

Journal of Business and Social Review in Emerging Economies Vol. 6, No 4, December 2020
1603
Figure 5. Awareness about profit -loss and Risk-sharing principle
Concerning the awareness about prohibition of uncertainty (gharar) and investment by the Islamic banks
in Halal businesses, only 14 women entrepreneurs were aware about the fact that Islamic banks avoid
uncertainty (gharar) in all forms of transactions (see Figure 6). Almost half of them knew that Islamic
banks invest only in Halal businesses.
Figure 6. Awareness about prohibition of uncertainty and investment in Halal Business
Based on the responses of 44 women entrepreneurs regarding various aspects of Islamic principles (such
as Riba & its prohibition, profit-loss sharing principle, risking sharing, uncertainty (gharar) and
investment in Halal businesses), the results (as shown in Figure 4 – 6) found to be mixed as discussed
previously. Although majority of them were well informed about concept of Riba and its prohibition in
Islam. But it has been found that there were only 21 women entrepreneurs who positively answered all
the questions related to different aspects of Islamic principles. The rest of them were not familiar with
different aspects of Islamic principles. Insufficient knowledge about Islamic principles pertaining to
Islamic finance and its various aspects could be one of the reasons behind such unawareness as
highlighted by (Hidayat, 2020).
Due to lack of understanding about Islamic principles and its different aspects, the sample size reduced
to 21 so the remaining questions were asked from those women entrepreneurs who not only were aware
about existence of Islamic banking but also were well informed about Islamic principles and its various
aspects. The researchers queried the 21 women entrepreneurs about Shariah board and its functions. It
has been found that all of the women entrepreneurs were aware about Shariah board of Islamic banks
and its roles in evaluation of Islamic banking activities and product & services as depicted in Figure 7.
0
5
10
15
20
25
30
35
Do you know that Islamicbanking is based on profit-
loss sharing?
Do you know that Islamicbanking products are based
on risk-sharing model?
Do you know that in Islamicbanking, returns are basedon gift and profit-sharingbasis instead of interest?
No
of
wo
men
en
trep
ren
eurs
Yes No
0
5
10
15
20
25
30
35
Islamic banking prohibits uncertainty in allform of transactions.
Do you know that Islamic banks invest onlyin Halal business?
No
of
wo
men
en
trep
ren
eurs
Yes No
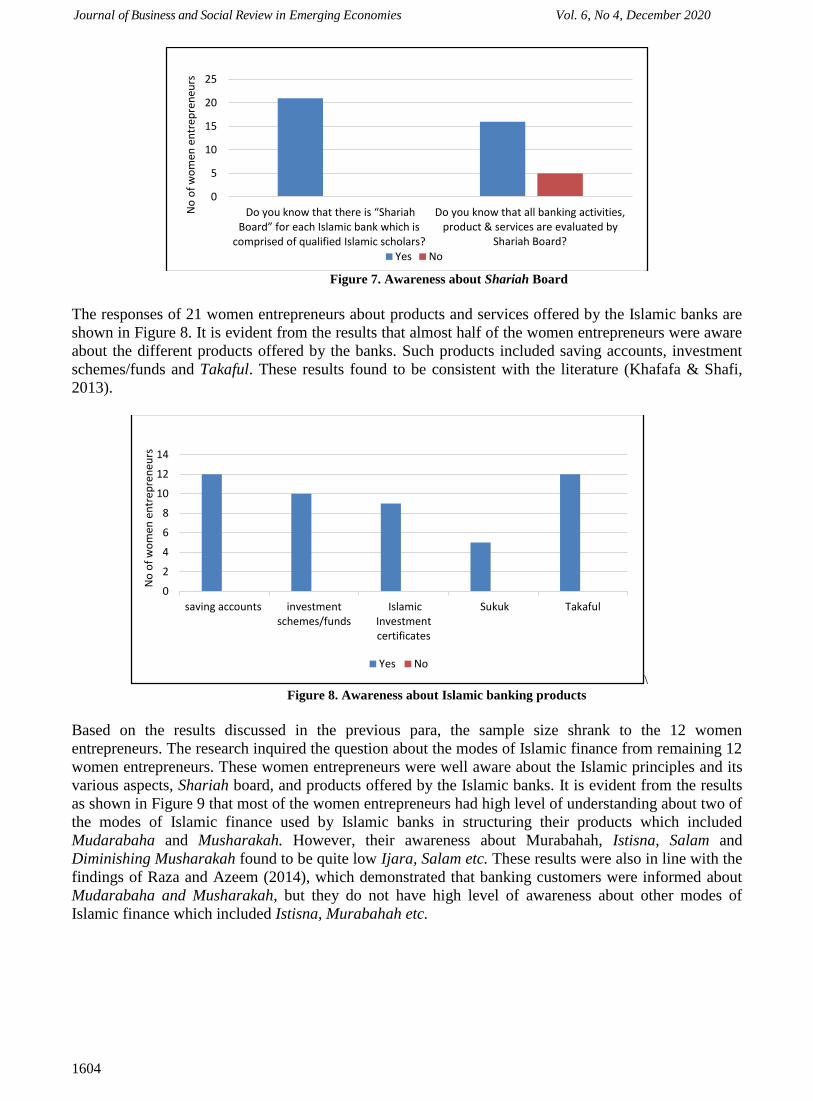
Journal of Business and Social Review in Emerging Economies Vol. 6, No 4, December 2020
1604
Figure 7. Awareness about Shariah Board
The responses of 21 women entrepreneurs about products and services offered by the Islamic banks are
shown in Figure 8. It is evident from the results that almost half of the women entrepreneurs were aware
about the different products offered by the banks. Such products included saving accounts, investment
schemes/funds and Takaful. These results found to be consistent with the literature (Khafafa & Shafi,
2013).
\
Figure 8. Awareness about Islamic banking products
Based on the results discussed in the previous para, the sample size shrank to the 12 women
entrepreneurs. The research inquired the question about the modes of Islamic finance from remaining 12
women entrepreneurs. These women entrepreneurs were well aware about the Islamic principles and its
various aspects, Shariah board, and products offered by the Islamic banks. It is evident from the results
as shown in Figure 9 that most of the women entrepreneurs had high level of understanding about two of
the modes of Islamic finance used by Islamic banks in structuring their products which included
Mudarabaha and Musharakah. However, their awareness about Murabahah, Istisna, Salam and
Diminishing Musharakah found to be quite low Ijara, Salam etc. These results were also in line with the
findings of Raza and Azeem (2014), which demonstrated that banking customers were informed about
Mudarabaha and Musharakah, but they do not have high level of awareness about other modes of
Islamic finance which included Istisna, Murabahah etc.
0
5
10
15
20
25
Do you know that there is “Shariah Board” for each Islamic bank which is
comprised of qualified Islamic scholars?
Do you know that all banking activities,product & services are evaluated by
Shariah Board?
No
of
wo
men
en
trep
ren
eurs
Yes No
0
2
4
6
8
10
12
14
saving accounts investmentschemes/funds
IslamicInvestmentcertificates
Sukuk Takaful
No
of
wo
men
en
trep
ren
eurs
Yes No

Journal of Business and Social Review in Emerging Economies Vol. 6, No 4, December 2020
1605
Figure 9. Awareness about Islamic modes of finance
Finally, the researchers asked the most aware 10 women entrepreneurs about the comparison of Islamic
banks with conventional ones. It is evident from Figure 10 that all 10 women entrepreneurs deemed
Islamic banks different from their conventional counterparts.
The study analyzed that there are 10 women entrepreneurs who are highly aware about Islamic banking,
Islamic principles, Shariah board, Islamic banking products, and Islamic modes of finance.
Figure 10. Awareness about Islamic modes of finance
7. Conclusion
The paper investigated the awareness level of women entrepreneurs regarding Islamic banking and its
products in Quetta city. Additionally, the researcher compiled business profile of Quetta-based women
entrepreneurs. The researchers identified the 11 multiple sectors where women entrepreneurs are
operating their businesses and found that majority of women entrepreneurs are engaged in informal
businesses.
Moreover, to examine the awareness level, the researcher conducted a survey and found that the overall
awareness about Islamic banking among women entrepreneurs is relatively low. The study analyzed
that around 60% women entrepreneurs knew Islamic banking however the response regarding the further
quires were diminished as the researcher moved to the next sections. Regarding various aspect of
Islamic principles, the study identified that majority of women entrepreneurs were aware about the
concept of Riba and its prohibition in Islam. However, the study found mixed responses for other
aspects of Islamic principles including profit-loss sharing, uncertainty (gharar), and investment in halal
business. The findings revealed that only a few numbers of women entrepreneurs were familiar with
different aspects of Islamic principles and about Shariah board's role in Islamic banking. The results
revealed that around 11% women entrepreneurs were aware of different products offered by Islamic
0
2
4
6
8
10
12
MudarabahaMusharakah Murabahah Istisna Salam Ijarah DiminishingMusharakah
No
of
wo
men
en
trep
ren
eurs
Yes NO
0
2
4
6
8
10
12
In practice Islamic banking is different from conventional Banking.No
of
wo
men
en
trep
ren
eurs
Yes No
Journal of Business and Social Review in Emerging Economies Vol. 6, No 4, December 2020
1606
banks. Similarly, around 09% of women entrepreneurs were aware with various financial products such
as Mudarabaha, Musharkaha, Ijarah, Salam, Istisna, and Diminishing Musharakah. The study found
that only 10 women entrepreneurs (i.e., 09%) are highly aware about Islamic banking, Islamic
principles, Shariah board, Islamic banking products, and Islamic modes of financing.
The study analyzed that due to lack of knowledge and insufficient marketing strategies of Islamic banks,
majority of women entrepreneurs were unaware with different aspects of Islamic banking. The study
suggested that Islamic banks should start new marketing strategies by targeting the neglected sectors.
Therefore, with the collaboration of the State Bank of Pakistan, the Islamic banking industry should
initiate awareness campaigns, arrange workshops, seminars, and training sessions to increase awareness
regarding Islamic banking among women entrepreneurs and general public.
Reference
Ahmad, M., Palil, R., Bakar, A. B. A., & Dolah, N. H. (2015). Literature Review On The Knowledge Of
Islamic Banking Products Among Muslim Entrepreneurs. International Journal of Business,
Economics and Law, 6(2), 4.
Ahmed, J., Bano, S., & Dawood, L. (2017). Understanding Islamic Banking: The Perception and
Thoughtfulness of Customers about Islamic Banking in the Context of Balochistan. Journal of
Islamic Banking and Finance, 34(3).
Ali, F. (2016). Awareness about Islamic Banking System. KASBIT Business Journal (KBJ), 9, 94–130.
ARCA. (2019). Business Profile. Accounting and Corporate Regulatory Authority.
https://www.acra.gov.sg/how-to-guides/buying-information/business-profile
Arshad, M., Aslam, S., Razi, A., & Ali, S. A. (2011). A COMPARATIVE ANALYSIS OF BANKERS’
PERCEPTION ON ISLAMIC BANKING IN PAKISTAN. 12.
Ayub, R. (2013). Perception Of Working Women Towards Islamic Banking In Pakistan. RADS Journal
of Social Sciencess & Business Management, 1(1), 7–12.
Bashir, M. S. (2013). Analysis of Customer Satisfaction with the Islamic Banking Sector: Case of Brunei
Darussalam. 2(10), 38–50.
Buchari, I., Rafiki, A., & Qassab, M. A. H. A. (2015a). Awareness and Attitudes of Employees towards
Islamic Banking Products in Bahrain. Procedia Economics and Finance, 30, 68–78.
https://doi.org/10.1016/S2212-5671(15)01256-3
Buchari, I., Rafiki, A., & Qassab, M. A. H. A. (2015b). Awareness and Attitudes of Employees towards
Islamic Banking Products in Bahrain. Procedia Economics and Finance, 30, 68–78.
https://doi.org/10.1016/S2212-5671(15)01256-3
Chaouch, N. (2017). An Exploratory Study of Tunisian Customers’ Awareness and Perception of
Islamic Banks. International Journal of Islamic Economics and Finance Studies, 26.
Cheteni, P. (2014). Awareness of Islamic Banking Products and Services among Consumers in South
Africa. Mediterranean Journal of Social Sciences. https://doi.org/10.5901/mjss.2014.v5n9p96
Chowdhury, M. N. H., & Arifuzzaman, S. M. (2013). Examining Awareness Regarding Islamic Banking
among Business Graduates in Bangladesh. Journal of Islamic Economics , Banking and Finance,
9(1), 77–88. https://doi.org/10.12816/0001594
Combes, S. mc. (2019, May 15). Descriptive Research Design | Definition, Methods and Examples.
Scribbr. https://www.scribbr.com/methodology/descriptive-research/
CIPE (2013). Barriers to Women’s Entrepreneurship in Pakistan. Center for International Private
Enterprise. https://www.cipe.org/blog/2013/03/11/barriers-to-womens-entrepreneurship-in-
pakistan/
Dourish, P., & Bellotti, V. (1992). Awareness and coordination in shared workspaces. Proceedings of
the 1992 ACM Conference on Computer-Supported Cooperative Work - CSCW ’92, 107–114.
https://doi.org/10.1145/143457.143468
Fouladi, H. (2017, August 31). Cultural and Tribal Barriers in Balochistan. WRN.
https://www.womensregionalnetwork.org/single-post/2017/10/25/cultural-and-tribal-barriers-in-
balochistan
Gafoor, K. A. (2012). Considerations in the Measurement of Awareness. Emerging Trends in Education,
6.
Journal of Business and Social Review in Emerging Economies Vol. 6, No 4, December 2020
1607
Gait, A. H., & Worthington, A. C. (2007). An Empirical Survey of Individual Consumer, Business Firm
and Financial Institution Attitudes towards Islamic Methods. 23.
Gait, A., & Worthington, A. (2008). An empirical survey of individual consumer, business firm and
financial institution attitudes towards Islamic methods of finance. International Journal of Social
Economics, 35(11), 783–808.
https://doi.org/10.1108/03068290810905423
Gerrard, P., & Barton Cunningham, J. (1997). Islamic banking: A study in Singapore. International
Journal of Bank Marketing, 15(6), 204–216. https://doi.org/10.1108/02652329710184433
Goheer, N. A. (2003). Women entrepreneurs in Pakistan: How to improve their bargaining power.
InFocus Program on Boosting Employment through Small Enterprise Development, International
Labour Office.
Göksu, A., & Becic, A. (2012). Awareness of Islamic Banking in Bosnia and Herzegovina. International
Research Journal of Finance and Economics, 100, 26–39.
Hanif, M., & Iqbal, A. M. (2010). Islamic Financing and Business Framework: A Survey (No. 4). 15(4),
16.
Haron, S., Ahmad, N., & Planisek, S. L. (1994). Bank Patronage Factors of Muslim and Non‐Muslim
Customers. International Journal of Bank Marketing, 12(1), 32–40.
https://doi.org/10.1108/02652329410049599
Hidayat, S. E., Rafiki, A., & Svyatoslav, S. (2020). Awareness of financial institutions’ employees
towards Islamic finance principles in Russia. PSU Research Review, 4(1), 45–60.
https://doi.org/10.1108/PRR-08-2019-0026
ILO. (2012). Statistical update on employment in the informal economy. International Labour
Organization. http://www.ilo.org/global/statistics-and-databases/WCMS_182504/lang -
en/index.htm
Imran, M., Samad, S. A., & Masood, R. (2014). Awareness Level of Islamic Banking in Pakistan’s Two
Largest Cities. 1, 20.
Islam, J. U., & Rahman, Z. (2017). Awareness and willingness towards Islamic banking among
Muslims: An Indian perspective. International Journal of Islamic and Middle Eastern Finance
and Management, 10(1), 92–101. https://doi.org/10.1108/IMEFM-01-2016-0017
Islamic Banking Bulletin. (2018). Islamic Banking Department, State Bak of Pakistan.
Islamic Banking Bulletin. (2020). Islamic Banking Department, State Bank of Pakistan.
http://www.sbp.org.pk/ibd/bulletin/2020/Mar.
Iqbal, Z. (2019, October 9). SME growth in Pakistan: What is missing? Daily Times.
https://dailytimes.com.pk/481200/sme-growth-in-pakistan-what-is-missing/
Kazmi, K. H. (2018, October 28). Significance of women entrepreneurship in Pakistan. Pakistan & Gulf
Economist. http://www.pakistaneconomist.com/2018/10/29/ significance-of-women-
entrepreneurship-in-pakistan/
Kenton, W. (2019). Descriptive Statistics. Investopedia.
https://www.investopedia.com/terms/d/descriptive_statistics.asp
Khafafa, A. J., & Shafii, Z. (2013). Customer Satisfaction and Islamic Banking Awareness in the Islamic
Banking Window System in Libya. Middle-East Journal of Scientific Research 13 (Research in
Contemporary Islamic Finance and Wealth Management), 7.
Khan, M. S. N., Hassan, M. K., & Shahid, A. I. (2007). Banking Behavior of Islamic Bank Customers in
Bangladesh. Journal of Islamic Economics, Banking and Finance, 3(2), 36.
Khattak, N. A., & Rehman, K. U. (2010). Customer satisfaction and awareness of Islamic banking
system in Pakistan. African Journal of Business Management, 4(5), 662–671.
Khizar, A., & Farrukh, S. (2020). Female Economic Participation in Pakistan. Case-Study. Karandaaz.
https://karandaaz.com.pk/wp-content/uploads/2020/04/Case-Study.
Lim, S. (2019). Understanding Islamic Banking. Investopedia.
https://www.investopedia.com/terms/i/islamicbanking.asp
Lujja, S., Mohammed, M. O., & Hassan, R. (2018). Islamic banking: An exploratory study of public
perception in Uganda. Journal of Islamic Accounting and Business Research, 9(3), 336–352.
https://doi.org/10.1108/JIABR-01-2015-0001
Markets. (2019). Global Islamic Finance Markets Report 2019: Islamic Banking is the Largest Sector,

Journal of Business and Social Review in Emerging Economies Vol. 6, No 4, December 2020
1608
Contributing to 71%, or USD 1.72 Trillion. GlobeNewswire News Room.
http://www.globenewswire.com/news-release/2019/03/20/1758003/0/en/Global-Islamic-Finance-
Markets-Report-2019-Islamic-Banking-is-the-Largest-Sector-Contributing-to-71-or-USD-1-72-
Trillion.html
Metawa, S. A., & Almossawi, M. (1998). Banking behavior of Islamic bank customers: Perspectives and
implications. International Journal of Bank Marketing, 16(7), 299–313.
https://doi.org/10.1108/02652329810246028
Naser, K., Jamal, A., & Al‐Khatib, K. (1999). Islamic banking: A study of customer satisfaction and
preferences in Jordan. International Journal of Bank Marketing, 17(3), 135–151.
https://doi.org/10.1108/02652329910269275
Noonari, S., & Memon, Ms. I. (2015). Knowledge and Perception of Students Regarding
IslamicBanking: A Case Study of Hyderabad Sindh Pakistan.
https://doi.org/10.13140/RG.2.1.3030.4485
Ponto, J. (2015). Understanding and Evaluating Survey Research. Journal of the Advanced Practitioner
in Oncology, 6(2), 168–171.
Rammal, H. G., & Zurbruegg, R. (2007). Awareness of Islamic banking products among Muslims: The
case of Australia. Journal of Financial Services Marketing, 12(1), 65–74.
https://doi.org/10.1057/palgrave.fsm.4760060
Raza, H., & Azeem, M. (2014). 234629802.pdf. Research Journal of Finance and Accounting, 5(3),
Article 3. https://core.ac.uk/download/pdf/234629802.pdf
Reiff, G. (2018). Islamic Banking – History, Overview & Future Table of Content.
https://www.academia.edu/33493111/Islamic_Banking_History_Overview_and_Future_Table_o
f_Content
Reuters. (2019). Youth, women spur social business growth in Pakistan: Global poll. DAWN.COM.
https://www.dawn.com/news/1512360
Rustam, S., Bibi, S., Zaman, K., & Rustam, A. (2011). Perceptions of Corporate Customers Towards
Islamic Banking Products and Services in Pakistan. The Romanian Economic Journal, 41, 107–
123.
Saini, Y., Bick, G., & Abdulla, L. (2011). Consumer awareness and usage of islamic banking products in
South Africa. South African Journal of Economic and Management Sciences, 14(3), 298–313.
https://doi.org/10.4102/sajems.v14i3.193
Saleem, M., Ashraf, A., Kashif, M., & Umair, M. (2018). Attitude and Perception of Employees towards
Islamic Banking. IOSR Journal of Business and Management (IOSR-JBM), 18.
Sabir, Dr. A. R. (2010). MULTICULTURALISM: A CASE STUDY OF BALOCHISTAN | Balochi
Linguist. BALOCHISTAN REVIEW, 23(2).
https://balochilinguist.wordpress.com/2013/04/21/multiculturalism-a-case-study-of-balochistan/
Sarfaraz, E. (2017). Pakistan’s young entrepreneurs tap social media to grow business. World Asia.
https://gulfnews.com/world/asia/pakistan/pakistans-young-entrepreneurs-tap-social-media-to-
grow-business-1.2022254
SBP. (2019). State Bank of Pakistan. http://www.sbp.org.pk/ibd/faqs.asp
Shaikh, D. M. A., Shah, Dr. A. B., & Bhaghal, G. U. (2017). AWARENESS OF ISLAMIC BANKING
IN THE SOCIETY: A CASE STUDY OF HYDERABAD. The Government: Research Journal
of Political Science, 5(Supplementary Edition), 133–142.
Shaharuddin, Dr. A., Hamid, S. A., Safian, Y. H. M., & Muhamad Muda, P. D. D. (2005). A Study on
Small and Medium-Sized Enterprises Perception Towards Islamic Banking Products.
http://ddms.usim.edu.my:80/jspui/handle/123456789/5332
Susruthan, N. K., & Priyadharshany, D. Aj. (2018). Role of Women Entrepreneurship. International
Journal of Pure and Applied Mathematics, 120(05), 12.
Syed, J. (2010). Women and small business entrepreneurship in Pakistan. In International Research
Handbook on Successful Women Entrepreneurs (pp. 117–131). Cheltenham & New York:
Edward Elgar.
Tonido. (2009). Brand Awareness and Perception. Tonido.
https://www.tonido.com/blog/index.php/2009/04/30/brand-awareness-and-
perception/#.XdUNLdVKiM8

Journal of Business and Social Review in Emerging Economies Vol. 6, No 4, December 2020
1609
William, C. C., & Round, J. (2009). Evaluating informal Entrepreneur’s Motives: Some Lessons from
Moscow. International Journal of Entrepreneurial Behaviour and Research, 15(1), 94–107.
Williams, C. C., & Shahid, M. S. (2016). Informal entrepreneurship and institutional theory: Explaining
the varying degrees of (in)formalization of entrepreneurs in Pakistan. Entrepreneurship &
Regional Development, 28(1–2), 1–25. https://doi.org/10.1080/08985626.2014.963889
Yaur, M. k. (1973). THE CONCEPT OF AWARENESS. Journal of Thought, 8(4), 259–269.
Zainol, Z. (2008). A Comparative Analysis of Bankers’ Perceptions on Islamic Banking. International
Journal of Business and Management, 3, 12.

Journal of Business and Social Review in Emerging Economies Vol. 6, No 4, December 2020
1610

Journal of Business and Social Review in Emerging Economies Vol. 6, No 4, December 2020
1611
Volume and Issues Obtainable at Center for Sustainability Research and Consultancy
Journal of Business and Social Review in Emerging Economies ISSN: 2519-089X (E): 2519-0326
Volume 6: No. 4, December 2020
Journal homepage: www.publishing.globalcsrc.org/jbsee
Sectarianism in Pakistan: A Statistical Analysis of Problems of Shia Hazara
Community of Quetta
1Gulshan Majeed,
1Assistant Professor, Department of Political Science, University of the Punjab, Lahore, Pakistan,
ARTICLE DETAILS ABSTRACT History Revised format: November 2020 Available Online: December 2020
Pakistan was created on the name of religion and it was perceived by
the leaders that religion would prove a binding factor among various
ethnic and religious identities of Pakistan but it could not happen
because religion was not implemented in its true sense. The
phenomenon of sectarianism emerged as a significant issue
specifically during the decade of 1980s in the era of General Zia
because of Islamization process. Quetta, the city of Balochistan has
largest Shia Hazara community and this community has become
victim of Suicide attacks, bomb blasts and terrorist acts. This
community feels itself highly insecure in Quetta. Researcher has
conducted research on this sensitive issue of sectarian violence against
Shia Hazara community of Quetta by using primary and secondary
sources to collect data. This study will highlight actual grievances of
this community and provide guidance to the policy makers to
understand the real concerns of this community. © 2020 Center for Sustainability Research and Consultancy Pakistan under a
Creative Commons Attribution-NonCommercial-ShareAlike 4.0
Keywords sectarianism, integration,
Shia Hazara Community,
Militant, Violence
JEL Classification
M10, M11
Corresponding author’s email address: [email protected]
Recommended citation: Majeed, G. (2020). Sectarianism in Pakistan: A Statistical Analysis of
Problems of Shia Hazara Community of Quetta. Journal of Business and Social Review in Emerging
Economies, 6(4), 1611-1620
1. Introduction
Sunni-Shia conflicting situation is not new in Pakistan particularly in the province of Punjab. Sunni-Shia
conflicts were of different nature under Britishers than the Muslim rulers in Sub-Continent. British Raj
became successful to uproot sunni-shia confrontation during its whole period of governance from 1857 to
1947. They implemented variou policies to contain Sunni-Shia conflicting situation. After 1947 Shia in
Pakistan tried to continue the attitude of indifference towards their faith as they used to do under
Britishers. (Ahmad, 2011). Sectarian conflicts became more prominent during the decade of 1980. A
number of internal and external reasons were there. Some external forces for example the Iranian
Revolution also contributed in the emergence of sectarian violent conflicting situation in Pakistan. The
growth of Shi’ite militancy in Iran proved a source for Shia community of Pakistan to assert them more
forcefully and this assertion gave air to the existing differences between Shia and Sunni community of
Pakistan. Ruling elite remained unable to establish socio-political institutions on the basis of true
democratic and moral values. (Jullundhri, 1998). In the capital city of Balochistan different sects used to
live peacefully but the peace of province was disturbed because of war in Afghanistan and Iranian
Revolution.` Quetta the capital of Balochistan has largest Shia population between 500,000 and 600,000.
They spread over in the west and east of the city. Since 1947, the Shia Hazaras community has remained
an underprivileged. Mostly their income depends on remittance payments from Australia, Europe, Iran,

Journal of Business and Social Review in Emerging Economies Vol. 6, No 4, December 2020
1612
and Gulf. This is one belief in Pakistan that Shia Hazara community receives Iranian support and General
Zia's government permitted state actors to support anti-Hazara segments for this reason. (NHRC Report.
2018). Hazara Democratic Party is an organized voice of Shia Hazara community of Balochistan. This
party is a significant source to find statistics on anti-Hazara violence in the capital city of Balochistan. The
socio-economic condition of Pakistan also produces militant behavior among different sects. The country
has been facing the menace of poverty since its birth and has a high population growth rate. One can
observe socio-political fabric of the country ripped by corruption, poverty, illiteracy, and terrorism and
most crucial by sectarian conflicts. The people of Pakistan seem highly worried about the future of
Pakistan. In Pakistani society the phenomenon of radicalism has been working on sectarian lines.
(Mahmood, 1995)
2. Literature Review
To review literature is very important to conduct research in an organized way. Researcher can have an
opportunity through available literature review regarding topic to evolve a mechanism to conduct research
in an impartial way. There can be more conceptual clarity and more valuable conclusions can be drawn
which can be more helpful to solve problems of the society and state. For this present study researcher has
tried to go through various available resources to develop conceptual clarity.
Khalid Ahmad in his book titled "Sectarian War: Pakistan Sunni-Shia Violence and Its Links to the
Middle –East” has explained that thousands of lives have been lost in Pakistan because of sectarian
conflicts. He states that during British Raj very tolerable level of Sunni-Shia tension was witnessed and
this situation remained in Pakistan till the decade of 1970s. Sunni-Shia conflicts became explicit during
1980s due to role of certain internal and external factors. Pakistan became front line state during Soviet
invasion in Afghanistan Islamization process which provided by General Zia within the boundary of
Pakistan also was supported by the government of Saudi Arabia.
Musa Khan Jalazai in his book titled "Sectarianism and Politico-Religious Terrorism in Pakistan” has
explained in detail administrative structure before partition and highlights the structure of Pakistan
administrative system 1973 to 1985. Author discusses ideological confrontation in religious perspective
and organized sectarianism in Pakistan. He has explained in detail the differences among Sunni and Shia
sects and their different tactics to respond each other and create terror in the society.
Anatol Lieven in his book titled " Pakistan a Hard Country “ has explained in detail Pakistan's internal
problems and threat to Pakistan from Pakistani Taliban. Author has discussed about different activities
of Pakistani Taliban and their support base in Pakistani society. Pakistani Taliban enjoy support by the
local population. Security forces find it very difficult to sort out their hide outs because they have been
living like common people among general public. They initiate their disruptive activities and seek hide
among local population.
Musa Khan Jalazai in his book titled "Suicide Terrorism Taliban, Cross-Border Terrorism and Violence
in Pakistan and Afghanistan" has explained that terrorists target people indiscriminately and they initiate
terrorist acts to achieve their specific objectives. The major objective of terrorists is to create fear in the
mind of people and get government’s attention. He did highlight the concerns of US and Afghanistan. It
is the main concern of Afghanistan that Pakistan should prevent terrorists to cross over into Afghanistan.
Escalation of militant extremism in Pakistan has created a significant fault line in the politics of
Pakistan. Author explained that sectarian forces have potential to shake the foundation of state.
Extremist elements have been posing great internal security threat.
Zahid Hussain in his book titled "The Relentless Rise of Islamic Militants in Pakistan –And How It
Threatened the World The Scorpion's Tail" has explained how and in what way Americans have been
initiating various activities to fight against the militant groups of Pakistan and Afghanistan. He has
highlighted in detail the concerns of America in this region. Author explained in detail about drone
attacks Campaign to tackle extremist elements of Pakistan. Author has explained various issues related

Journal of Business and Social Review in Emerging Economies Vol. 6, No 4, December 2020
1613
to drone attacks and reaction of local population because according to local population some innocent
people have also becoming victim of these attacks and developing sense of hatred towards security
agencies. Author did highlight that militants have secured safe heavens in different parts of Pakistan
including the province of KPK, Baluchistan and Punjab.
Rashid Ahmad (Jullundhri) in his book titled “Islam and Current Issues” has explained in detail about
the impact of Islamic fundamentalism in Pakistan. In Pakistan various social organization, Ulama,
fundamentalists and nationalists want to bring change in socio-political set up. These groups share
national feelings that Pakistani people should have a healthy political system which can secure their
material and spiritual needs. Consequently people have to face hard times. They received bad treatment
at the hands of ruling class. The author has explained the case of East Pakistan crisis.
Tor H. Aase in his article in the book titled “Muslim Diversity: Local Islam in Global Context” has
explained in an organized way the existing differences between Sunni and Shia of Gilgit. Before 1988
Gilgit used to be perceived a peaceful place where Shia, Sunni and Ismailis have been living peacefully
without confronting with each other. In 1988 conflict emerged between Shias and Sunnis over the start
of Ramadan. A single incident did happen which escalated into violent conflicting situation beween
Sunnis and Shias of Gilgit particularly and generally in whole. Shias start their fast one day before
Sunnis and same was done by the Shias of Gilgit. On the second day of Ramadan Shias of Gilgit woke
up and anti shia slogans written on the walls of towns. The writings claimed that Shias were non
Muslims or Kuffar. Shias became highly emotional over these writings and shooting broke out. Sunnis
from the south of Gilgit started to move to rescue their fellow believers. Sunnis were moving to wage
jehad on Shias in Gilgit and Shias were also gathering to fight against the Sunnis. Conflict became so
violent that government has to ask.
Huma Yousaf in her report Titled “Sectarian violence; Pakistan Greatest Security Threat” Author has
explained that Pakistan has faced a sharp resurgence in sectarian violence. This sectarian violence can be
inter-faith and inter-sect. In inter-faith violence non Muslim communities like Hindus, Christians, Sikhs
and parse’s are made target. In sectarian conflicts the Deobandi practice the most orthodox version of
Islam and are most extremist group against Shias. They have established madras’s in country and
developed relations with Taliban. She has highlighted the emergence of sectarian conflicts in more
forceful way during Zia regime. The role of external actors’ cannot be ignored in this regard. Musharraf
during his regime imposed ban on different sectarian and militant organization but after 9/11 the policies
of government gave air to the resurgence of sectarian violence. She has suggested various policies to
curb the menace of sectarian violence. The government has to impose strict ban on sectarian outfits and
provide security to those judges who involve in trial of sectarian criminals and restricting funding to
sectarian groups. Farman Ullah in his article titled “ Sectarianism in Pakistan: Causes & Remedies
(Pakistan No 43&44 Spring &Autumn 2009) has explained in a comprehensive way about the concept
of sectarianism and its strong hold in Pakistani society. According to author Religion in Pakistan is used
by the religious, political and military force as a card to grab power. First phase of the sectarianism
started in Pakistan from 1947 and remained till 1977. During this era, sectarianism escalated because of
many reasons. Zia’s Islamization further added intensity in this whole process.
Asma Khan Mahsood in this article titled “History of Sectarianism in Pakistan: Implications for Lasting
Peace (Journal of Political Science & Public Affairs Vol.5, Issue 4. 2017) has explained about the
historical background of sectarianism, social, political and economic implications of sectarianism on the
Pakistani society. Islam is the religion of peace and tolerance. Pakistan was established on the name of
Islam so is called as the country of peace and love. Before 1980, issue of the sectarianism was not a
major problem but due to the Islamic policies of Zia and religious intolerance made this issue more
prominent. Author has explained various social, economic and political implications of sectarianism.
Muhammad Usman Amin Siddiqi &Misbah Mukhtar in the article titled “Perception Of Violence And
Victimization Among Hazaras in Pakistan (Journal of Political Science XXXIII,2015) has explained
about violence against the Hazara community of Quetta and impact of violence on the Hazara people. It
is also considered that states like India and Iran who do not want stable Pakistan are behind the killings
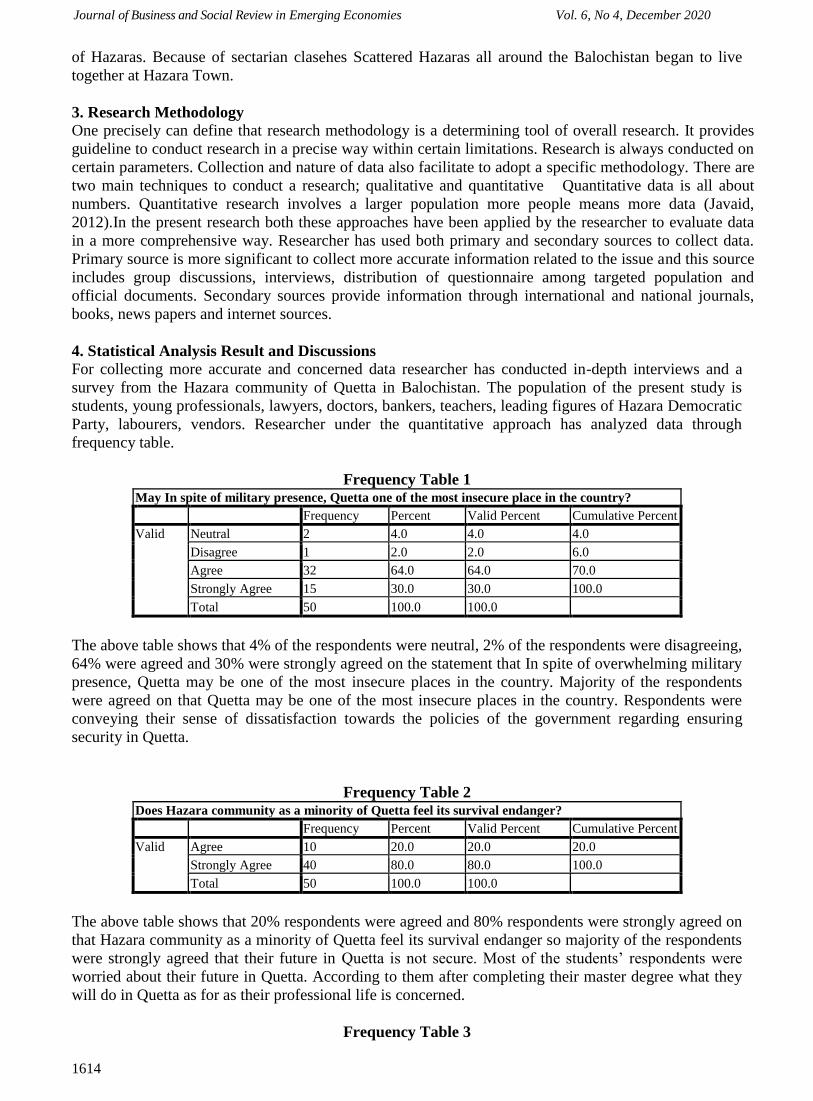
Journal of Business and Social Review in Emerging Economies Vol. 6, No 4, December 2020
1614
of Hazaras. Because of sectarian clasehes Scattered Hazaras all around the Balochistan began to live
together at Hazara Town.
3. Research Methodology One precisely can define that research methodology is a determining tool of overall research. It provides
guideline to conduct research in a precise way within certain limitations. Research is always conducted on
certain parameters. Collection and nature of data also facilitate to adopt a specific methodology. There are
two main techniques to conduct a research; qualitative and quantitative Quantitative data is all about
numbers. Quantitative research involves a larger population more people means more data (Javaid,
2012).In the present research both these approaches have been applied by the researcher to evaluate data
in a more comprehensive way. Researcher has used both primary and secondary sources to collect data.
Primary source is more significant to collect more accurate information related to the issue and this source
includes group discussions, interviews, distribution of questionnaire among targeted population and
official documents. Secondary sources provide information through international and national journals,
books, news papers and internet sources.
4. Statistical Analysis Result and Discussions For collecting more accurate and concerned data researcher has conducted in-depth interviews and a
survey from the Hazara community of Quetta in Balochistan. The population of the present study is
students, young professionals, lawyers, doctors, bankers, teachers, leading figures of Hazara Democratic
Party, labourers, vendors. Researcher under the quantitative approach has analyzed data through
frequency table.
Frequency Table 1 May In spite of military presence, Quetta one of the most insecure place in the country?
Frequency Percent Valid Percent Cumulative Percent
Valid Neutral 2 4.0 4.0 4.0
Disagree 1 2.0 2.0 6.0
Agree 32 64.0 64.0 70.0
Strongly Agree 15 30.0 30.0 100.0
Total 50 100.0 100.0
The above table shows that 4% of the respondents were neutral, 2% of the respondents were disagreeing,
64% were agreed and 30% were strongly agreed on the statement that In spite of overwhelming military
presence, Quetta may be one of the most insecure places in the country. Majority of the respondents
were agreed on that Quetta may be one of the most insecure places in the country. Respondents were
conveying their sense of dissatisfaction towards the policies of the government regarding ensuring
security in Quetta.
Frequency Table 2 Does Hazara community as a minority of Quetta feel its survival endanger?
Frequency Percent Valid Percent Cumulative Percent
Valid Agree 10 20.0 20.0 20.0
Strongly Agree 40 80.0 80.0 100.0
Total 50 100.0 100.0
The above table shows that 20% respondents were agreed and 80% respondents were strongly agreed on
that Hazara community as a minority of Quetta feel its survival endanger so majority of the respondents
were strongly agreed that their future in Quetta is not secure. Most of the students’ respondents were
worried about their future in Quetta. According to them after completing their master degree what they
will do in Quetta as for as their professional life is concerned.
Frequency Table 3

Journal of Business and Social Review in Emerging Economies Vol. 6, No 4, December 2020
1615
Do Hazara have their due share in administrative set up of Quetta ?
Frequency Percent Valid Percent Cumulative Percent
Valid neutral 9 18.0 18.0 18.0
S.D 2 4.0 4.0 22.0
Disagree 8 16.0 16.0 38.0
Agree 23 46.0 46.0 84.0
Strongly Agree 8 16.0 16.0 100.0
Total 50 100.0 100.0
The above table shows that 18% respondents were neutral, 4% were strongly disagree,16% were
disagree, 46% were agreed and 16% were strongly agreed on the statement that Hazara have their due
share in administrative set up of Quetta. Majority of the respondents were agreed that Hazara have their
due share in administrative set up of Quetta. According to various categories of the respondents they
have satisfaction regarding their participation in various administrative departments of Quetta.
Frequency Table 4 Is core identity of hazara endanger in Quetta?
Frequency Percent Valid Percent Cumulative Percent
Valid neutral 1 2.0 2.0 2.0
Disagree 1 2.0 2.0 4.0
Agree 16 32.0 32.0 36.0
Strongly Agree 32 64.0 64.0 100.0
Total 50 100.0 100.0
The above table shows that 2% respondents were neutral, 2% respondents were disagree, 32%
respondents were agreed and 62% respondents were strongly agreed on the statement that core identity
of Hazara is endanger in Quetta. Most of the student respondents showed their concern regarding
presence of threat for their core identity. According to them their different features of face become a
source to identify them as they are from Hazara community and easily they can be made a target by
other sectarian identities. Students said they have to wear veil to hide their identity.
Frequency Table 5
Is Hazra Democratic Party an organized voice of Hazara community of Quetta?
Frequency Percent Valid Percent Cumulative Percent
Valid Neutral 3 6.0 6.0 6.0
S.D 1 2.0 2.0 8.0
Disagree 5 10.0 10.0 18.0
Agree 34 68.0 68.0 86.0
Strongly Agree 7 14.0 14.0 100.0
Total 50 100.0 100.0
The above table shows that in response of the statement that Hazara Democratice party is an organized
voice of Hazara community of Quetta 6% respondents were neutral, 2% respondents were strongly
disagreed, 10% respondents were disagreed, 68% respondents were agreed and 14% respondents were
strongly agreed that Hazara Democratic party is an organized voice of Hazaras. According to various
categories of respondents this party has been playing a vital role for the protection of rights of Hazara
community. This party is a strong voice for conveying the demands of Hazara community towards the
ruling authority.
Frequency Table 6 Are The concerns of Hazara community not properly addressed by the government?
Frequency Percent Valid Percent Cumulative Percent
Valid S.D 3 6.0 6.0 6.0
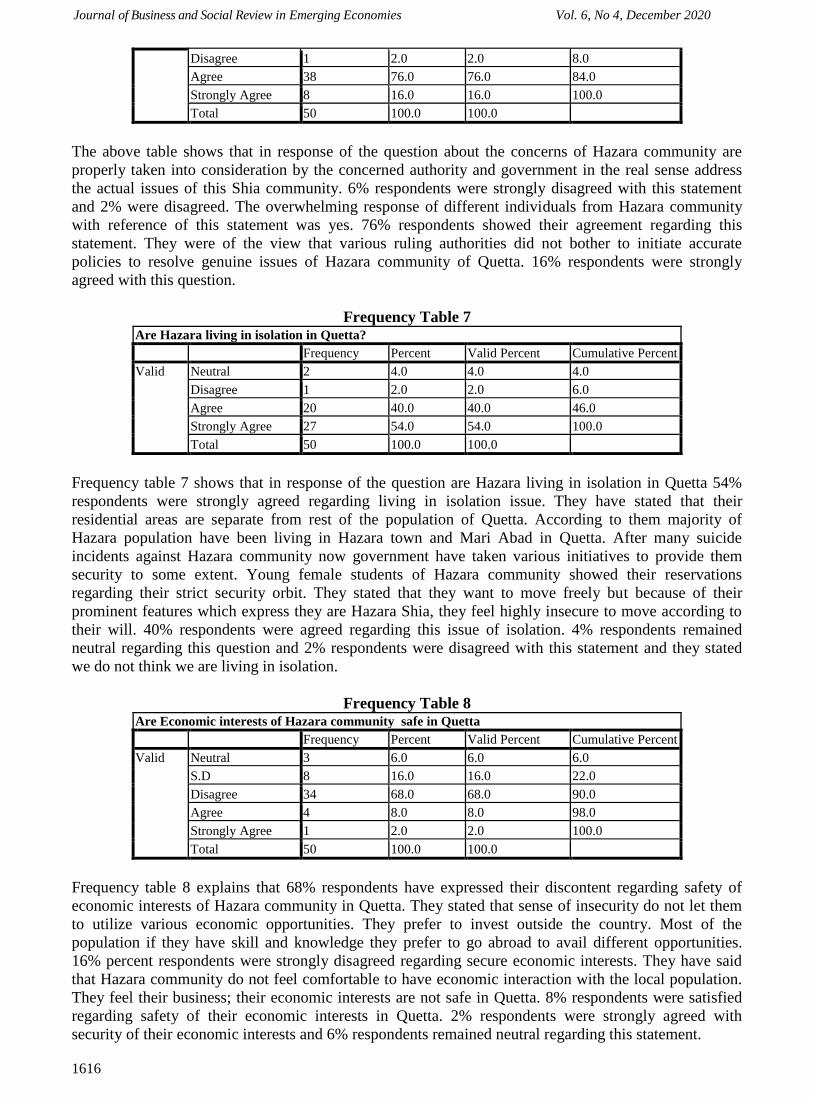
Journal of Business and Social Review in Emerging Economies Vol. 6, No 4, December 2020
1616
Disagree 1 2.0 2.0 8.0
Agree 38 76.0 76.0 84.0
Strongly Agree 8 16.0 16.0 100.0
Total 50 100.0 100.0
The above table shows that in response of the question about the concerns of Hazara community are
properly taken into consideration by the concerned authority and government in the real sense address
the actual issues of this Shia community. 6% respondents were strongly disagreed with this statement
and 2% were disagreed. The overwhelming response of different individuals from Hazara community
with reference of this statement was yes. 76% respondents showed their agreement regarding this
statement. They were of the view that various ruling authorities did not bother to initiate accurate
policies to resolve genuine issues of Hazara community of Quetta. 16% respondents were strongly
agreed with this question.
Frequency Table 7 Are Hazara living in isolation in Quetta?
Frequency Percent Valid Percent Cumulative Percent
Valid Neutral 2 4.0 4.0 4.0
Disagree 1 2.0 2.0 6.0
Agree 20 40.0 40.0 46.0
Strongly Agree 27 54.0 54.0 100.0
Total 50 100.0 100.0
Frequency table 7 shows that in response of the question are Hazara living in isolation in Quetta 54%
respondents were strongly agreed regarding living in isolation issue. They have stated that their
residential areas are separate from rest of the population of Quetta. According to them majority of
Hazara population have been living in Hazara town and Mari Abad in Quetta. After many suicide
incidents against Hazara community now government have taken various initiatives to provide them
security to some extent. Young female students of Hazara community showed their reservations
regarding their strict security orbit. They stated that they want to move freely but because of their
prominent features which express they are Hazara Shia, they feel highly insecure to move according to
their will. 40% respondents were agreed regarding this issue of isolation. 4% respondents remained
neutral regarding this question and 2% respondents were disagreed with this statement and they stated
we do not think we are living in isolation.
Frequency Table 8 Are Economic interests of Hazara community safe in Quetta
Frequency Percent Valid Percent Cumulative Percent
Valid Neutral 3 6.0 6.0 6.0
S.D 8 16.0 16.0 22.0
Disagree 34 68.0 68.0 90.0
Agree 4 8.0 8.0 98.0
Strongly Agree 1 2.0 2.0 100.0
Total 50 100.0 100.0
Frequency table 8 explains that 68% respondents have expressed their discontent regarding safety of
economic interests of Hazara community in Quetta. They stated that sense of insecurity do not let them
to utilize various economic opportunities. They prefer to invest outside the country. Most of the
population if they have skill and knowledge they prefer to go abroad to avail different opportunities.
16% percent respondents were strongly disagreed regarding secure economic interests. They have said
that Hazara community do not feel comfortable to have economic interaction with the local population.
They feel their business; their economic interests are not safe in Quetta. 8% respondents were satisfied
regarding safety of their economic interests in Quetta. 2% respondents were strongly agreed with
security of their economic interests and 6% respondents remained neutral regarding this statement.

Journal of Business and Social Review in Emerging Economies Vol. 6, No 4, December 2020
1617
Frequency Table 9 Is Religious militancy affecting negatively to Hazara community of Quetta?
Frequency Percent Valid Percent Cumulative Percent
Valid Neutral 1 2.0 2.0 2.0
Agree 18 36.0 36.0 38.0
Strongly Agree 31 62.0 62.0 100.0
Total 50 100.0 100.0
The above table shows that in response of the question is religious militancy affecting negatively to
Hazara community of Quetta? 62 % respondents were strongly agreed regarding this question.
According to them religious militancy has created serious distrust between local population and Hazara
community. Hazara because of their distinctive features cannot hide their specific identity and because
of this identification they become easy prey in the hands of opponent sect. they have a dominant threat
of insecurity and remain unable to participate positively in the development of province. Though they
are well educated and become successful to become part of different administrative posts. 36%
respondents were agreed that religious militancy has been proving a major obstacle in the way of their
development. While 2% respondents remained neutral regarding this statement.
Frequency Table 10 Can Media play an effective role to create peace and harmony among various religious
communities of Quetta?
Frequency Percent Valid Percent Cumulative Percent
Valid Neutral 10 20.0 20.0 20.0
S.D 6 12.0 12.0 32.0
Disagree 6 12.0 12.0 44.0
Agree 25 50.0 50.0 94.0
Strongly Agree 3 6.0 6.0 100.0
Total 50 100.0 100.0
The above table shows that in response of the question about the role of media in creating peace and
harmony among various communities of Quetta 50% respondent were agreed regarding the role of
media. They stated that media should create a soft image of various religious communities of Quetta.
Media should highlight in the true sense various concepts of Islamic teachings for example tolerance,
peace, equality, brotherhood and human dignity. Media should create strong awareness about the
concept of tolerance among various religious communities. So they can learn to tolerate each other
belief system. 6% respondents were strongly agreed with significant role of media to create harmony.
12% were disagreed and 12% were disagreed with the role of media. They say government should
initiate effective policies to create awareness through educating people so they would be able to make
differentiation between right and wrong. While 20% respondents remained neutral regarding the role of
Media.
Frequency Table 11 Is future of Hazara community pessimistic in Quetta?
Frequency Percent Valid Percent Cumulative Percent
Valid neutral 1 2.0 2.0 2.0
Disagree 9 18.0 18.0 20.0
Agree 25 50.0 50.0 70.0
Strongly Agree 15 30.0 30.0 100.0
Total 50 100.0 100.0
Frequency table 11 shows that in response of the question regarding the future of Hazara community in
Quetta 50% respondents were agreed that they do not see any optimism regarding their presence in
Quetta. Religious militancy always poses a serious threat to their lives. The element of satisfaction is

Journal of Business and Social Review in Emerging Economies Vol. 6, No 4, December 2020
1618
disappearing from their lives. 30% respondents were strongly agreed with the statement. There is hard
need on the part of the federal as well as provincial governments to formulate a long run policy to
address the menace of sectarianism. 18% respondents were of the view that they feel a positive
development in near future regarding the existence of Hazara community in Quetta and 2% respondents
remained neutral regarding this question.
Frequency Table 12 Are people of Hazara community migrating from Quetta for the sake of their survival and
economic well being?
Frequency Percent Valid Percent Cumulative Percent
Valid neutral 3 6.0 6.0 6.0
Disagree 1 2.0 2.0 8.0
Agree 30 60.0 60.0 68.0
Strongly Agree 16 32.0 32.0 100.0
Total 50 100.0 100.0
Frequency table 12 shows that in response of the question are people of Hazara community of Quetta
migrating for their survival and economic well being 60% respondents were agreed regarding this
question. They stated those who can afford to go abroad for availing better opportunities regarding
economic activities and for the welfare of their families they prefer to go and settled on permanent basis.
32% respondents were strongly agreed with this statement that to leave Quetta for a better future is very
common trend among individuals of Hazara community. 2% respondents were disagreed that it is not
necessary to migrate for better future and survival. If government ensure peace among different
communities of Quetta then Quetta can be a best place to live and 6% respondents remained neutral
regarding this question.
Frequency Table 13 Are you satisfied by the efforts of Government of Pakistan to stop sectarian violence
Frequency Percent Valid Percent Cumulative Percent
Valid neutral 3 6.0 6.0 6.0
Disagree 30 60.0 60.0 66.0
Agree 11 22.0 22.0 88.0
Strongly Agree 6 12.0 12.0 100.0
Total 50 100.0 100.0
The above table shows that in response of the question do the people of Hazara community feel
satisfaction over the efforts of government of Pakistan 60% respondents were disagreed regarding this
question. According to them various governments did not realize the sensitivity of the issue. Sectarian
violence takes place under the sense of hatred. When different sects do not tolerate each other and start
to kill on the basis of minor differences. Survival in such societies becomes difficult. Different
governments formulated short term policies to tackle the menace of sectarian violence. The government
first evolves a policy to manage sectarian conflicts and then long run policies should be evolved to
resolve the issue. 22% respondents were agreed regarding government initiatives to address the sectarian
issues but say that concerned sects should be taken into confidence by the government at the time of
formulation of policies. 12% respondents were strongly agreed regarding the arrangements of various
governments to tackle the issue. While 6% respondents remained neutral.
Frequency Table 14 Is Role of political parties satisfactory to minimize sectarian violence in Quetta?
Frequency Percent Valid Percent Cumulative Percent
Valid neutral 7 14.0 14.0 14.0
S.D 8 16.0 16.0 30.0
Disagree 26 52.0 52.0 82.0
Agree 8 16.0 16.0 98.0
Journal of Business and Social Review in Emerging Economies Vol. 6, No 4, December 2020
1619
Strongly Agree 1 2.0 2.0 100.0
Total 50 100.0 100.0
Frequency table 14 shows that in response of question about the role of political parties to minimize
sectarian violence in Quetta 52% respondents were disagreed regarding satisfaction about the role of
political parties to address the issue of sectarianism. They stated political parties in Pakistan work for the
personal interests of leadership and do not bother about issue regarding national integration. Political
parties have interaction with people only during the days of elections. After elections it is a kind of
dream of people to see their leaders in their respective constituency. 16% respondents were strongly
disagreed about the positive role of political parties to minimize sectarianism. 16% respondents were
agreed that they are to some extent satisfied with the role of political parties to curb the menace of
sectarian violence. 2% respondents were strongly agreed regarding the effective role of political parties.
While 14% respondents remained neutral in this regard.
Frequency Table 15 Is a viable strategy the need of the time to stop sectarian violence?
Frequency Percent Valid Percent Cumulative Percent
Valid neutral 2 4.0 4.0 4.0
S.D 3 6.0 6.0 10.0
Disagree 1 2.0 2.0 12.0
Agree 17 34.0 34.0 46.0
Strongly Agree 27 54.0 54.0 100.0
Total 50 100.0 100.0
The above table shows in response of the question about a viable strategy is required to stop sectarian
violence 54% respondents were strongly agreed regarding the need of a viable mechanism to contain
sectarian violence. They stated that various governments should initiate a policy which can provide a
conducive environment to all religious communities to live according to their own specific belief system
and freely can celebrate their rituals. 34% respondents were agreed with a durable strategy to stop
sectarian violence. 6% respondents were strongly disagreed and 2% respondents were disagreed
regarding the need of the strategy to contain sectarian violence. While 4% respondents remained neutral
regarding this question.
5. Conclusion
Above available information are very important to show ground reality about the existing fear among the
Shia Hazara community of Quetta regarding their survival in Pakistan. They want to play their
constructive role in the development of the country by availing different opportunities. But when they
will remain confining in specific areas because of certain security reasons then it becomes difficult for
them to move freely and flourish their potential. Shia Hazara community is facing various
psychological issues due to prevailing insecurity. This is the need of the time that government has to
take initiatives to curb those elements of society which are responsible to initiate sectarian attacks
against the Shia Hazara community of Quetta. Goverment has to provide them justice so that Hazara
community can feel itself an important part of political system of Pakistan and can remain positive in the
progress of country.
References:
Ahmad, K. (2011). Sectarian War Pakistan's Sunni-Shia Violence and its Links to the Middle East. Karachi,
Oxford University Press.
Ahmad (Jullundhri), Rashid. (1998) Islam and Current Issues, Lahore, Institute of Islamic Culture.
Mahmood, Sohail ,(1995). Islamic Fundamentalism in Pakistan, Egypt and Iran, Lahore, Vanguard.
NCHR Report. (2018).Understanding the agonies of ethnic Hazaras. (2018) National Commission for Human
Rights. Retrieved from https://nchr.gov.pk/wp-content/uploads/2019/01/HAZARA-REPORT.pdf
Jalazai, M..K (1993). Sectarianism and Politico-Religious Terrorism in Pakistan, Lahore, Tarteeb
Publishers.
Journal of Business and Social Review in Emerging Economies Vol. 6, No 4, December 2020
1620
Lieven, A. (2012). Pakistan a Hard Country, New Delhi: Penguin Books
Jalazi, M.K. (2006). Suicide Terrorism Taliban, Cross Border Terrorism and Violence in Pakistan and
Afghanistan, Lahore, Institute of Advance and Strategic Studies.
Hussain, Z. (2010) The Scorpion Tail The Relentless Rise Of Islamic Militants in Pakistan –and How It
Threatens the World, New York, Free Press
Manger, Leif. Ed (1999) Muslim Diversity: Local Islam in Global Context, Routledge
Huma Yousaf. (2012). Sectarian violence; Pakistan Greatest Security Threat? Norway, Norwegian
Peace Building Resource Center. NOREF.
Ullah, Farman. (2009) in the article titled “Sectarianism in Pakistan: Causes & Remedies” Pakistan, No. 43&44
(Spring & Autumn) Pakistan Study Centre, University of Peshawar, ISSN:1990-6579
Mahsood, Asma Khan, (2017). in the article titled “History of Sectarianism in Pakistan: Implications for Lasting
Peace in Journal of Political Science & Public Affairs Vol.5, Issue 4.
Siddiqi ,Muhammad Usman Amin & Mukhtar, Misbah (2015). in the article titled “Perception Of Violence
And Victimization Among Hazaras in Pakistan in Journal of Political Science XXXIII.
Javaid Umbreen, (2012).Academic Research Writing and Publishing. Lahore. Classic Punblication.
Journal of Business and Social Review in Emerging Economies Vol. 6, No 4, December 2020
1621
Volume and Issues Obtainable at Center for Sustainability Research and Consultancy
Journal of Business and Social Review in Emerging Economies ISSN: 2519-089X (E): 2519-0326
Volume 6: No. 4, December 2020
Journal homepage: www.publishing.globalcsrc.org/jbsee
Mechanism between Organizational Support Factors and Motivation to Transfer:
Mediating Role of Self-Efficacy
1Zeshan Ahmer, 2Muhammad Aamir, 3Majid Ali, 4Muhammad Usman
1Assistant Professor, Institute of Business Administration, University of the Punjab, Lahore, Pakistan,
[email protected] 2Assistant Professor, Hailey College of Commerce, University of the Punjab, Lahore, Pakistan,
[email protected] 3Assistant Professor, Hailey College of Commerce, University of the Punjab, Lahore, Pakistan,
[email protected] 4Assistant Professor, Hailey College of Commerce, University of the Punjab, Lahore, Pakistan,
ARTICLE DETAILS ABSTRACT History Revised format: November 2020 Available Online: December 2020
Transfer of training has turned out to be a major issue for the banking
industry and the desire of successful transferability of training content
can be actualized by motivating the trainees to transfer their learned
skills. Therefore, this study highlighted the less studied variables from
organizational factors (i.e. organizational and supervisor support) and
trainee’s characteristics (i.e. self-efficacy) to develop a model for
motivation to transfer. For the purpose, data were collected from 388
banking employees and the hypotheses were investigated by means of
structural equation modeling using AMOS. The study found both
organizational and supervisor support as contributing factors towards
motivation to transfer through self-efficacy. The study has
implications for the banking sector to cope with this emerging issue.
© 2020 Center for Sustainability Research and Consultancy Pakistan
under a Creative Commons Attribution-NonCommercial-ShareAlike
4.0
Keywords self-efficacy, motivation to
transfer, perceived supervisor
support, perceived
organizational support.
JEL Classification
M0, M1
Corresponding author’s email address: [email protected]
Recommended citation: Ahmer, Z., Aamir, M., Ali, M. & Usman, N. (2020). Mechanism Between
Organizational Support Factors and Motivation to Transfer: Mediating Role of Self-Efficacy. Journal of
Business and Social Review in Emerging Economies, 6(4), 1621-1630
1. Introduction
In today’s knowledge-based economy, organizations are striving to gain a competitive advantage over
their rivals (Islam & Ahmed, 2018; Islam et al., 2021; Islam et al., 2020). Studies in the domain of
management have suggested establishing a learning culture, designing organizational structure, caring
employee’s career growth, focusing on HR practices as well as developing employees (Bates &
Khasawneh, 2005; Islam & Ahmed, 2018; Islam, 2019) to gain competitive advantage. However, Tian et
al., (2016) emphasized focusing on ‘transfer of training’ as it is an essential but neglected aspect of
employee’s development. It is evident that organizations spend a huge amount on the training of their
employees but remained unable to get the desired results, because the majority of the trainees are not
intended to transfer the acquired skilled (Salas & Kosarzycki, 2003; Silverman, 2012). Training
provided by US Postal Service and Burger King can be considered as the best examples where
Journal of Business and Social Review in Emerging Economies Vol. 6, No 4, December 2020
1622
organizations have to suffer millions of dollars (Bunch, 2007; Feiden, 2003). Further, Salas et al., (2003)
argued that “… learning through training programs usually disseminated within a year” in the service
sector.
Service sectors contribute 80 percent (in the case of developed countries) and 60 percent (in case of
developing countries) in the country’s gross domestic products. Amongst many services sectors, the
significance of the banking sector cannot be overlooked. In Pakistan, State Bank of Pakistan (SBP) is the
regulatory authority for all the conventional and Islamic banks. According to the latest press release,
banks in Pakistan lack in providing training programs to its employees, and if so, most of the trainees
remained unable to transfer their learned skills at the workplace (Azam, 2016). Given that, the prime
focus of this study is on Motivation to Transfer (MTT) as motivated employees can better transform
their newly learned knowledge and skills at their workplace (Islam, 2019).
Motivation to transfer training refers to “the learner’s intended efforts to utilize skills and knowledge
learned in training setting to a real-world work situation (Burke & Hutchins, 2007, p. 167).” According
to Facteau et al., (1995), the presence of motivation is essential for learners because efficacious learners
are more likely to perform better to accomplish organizational goals. Despite the fact that MTT is more
inspirational construct compared to transfer of training (Burke & Hutchins, 2007), it was considered
rarely by preceding researchers. Literature has highlighted organizational factors and trainee’s
characteristics as main aspects that contribute in motivation to transfer (Chauhan, Ghosh, Rai, & Shukla,
2016). Studies on the association between trainee’s characteristics with motivation to transfer are well
documented, whereas how organizational factors contribute in motivating trainees to transfer their
learned knowledge still need to shed light (Islam, 2019; Islam & Tariq, 2018). However, this study
considered both the aspects to understand the mechanism between the same. More specifically,
according to Van den Bossche, Segers and Jansen (2010), researchers need to study the association of
perceived organizational support (POS) and perceived supervisor support (PSS) with motivation to
transfer (MTT) as previous studies are of mixed results. In addition, the association of self-efficacy
(from trainee’s characteristics) with MTT is well documented (Yamkovenko & Holton, 2010). However,
studies are not well documented about the mediating role of self-efficacy towards MTT.
Organizational Support Theory (OST) provides a base for this study. OST states that employees’ with
the perception of care and support by their organization, reciprocate with greater or similar values
(Rhoades & Eisenberger, 2002). The receptive work environment in the form of support provided by
organization and supervisors may not only develop a sense of being acknowledged and remunerated for
remarkable performance, but also enhances self-reliance of individuals (Bandura, 1995), which not only
effect on their self-efficacy but also motivate them to apply their learned skills at the workplace.
Therefore, this study investigates the effects of perceived organizational support and perceived
supervisor support on MTT through self-efficacy.
2. Hypotheses development
The concept MTT is important for human resource development. Cheng and Hampson (2008)
mentioned that there is a need to explore hidden variables related with the transfer of training because
learning in training does not transfer automatically, motivation of trainee for transfer is an unavoidable
factor. Literature indicates that work environment and personal emotions are most relevant factors that
motivate trainee for transfer of training (Zumrah & Boyle, 2015). Work-environment related factors
include peer support (Martin, 2010), supervisory support (Saks & Belcourt, 2006), preferred support
(Pham, Segers, & Gijselaers, 2013) and top management support (Kupritz & Hillsman, 2011). Whereas,
personal factors include motivation to transfer (Devos et al., 2007), employees’ personality
(Yamkovenko & Holton, 2010) and self-efficacy (Velada et al., 2007). The interaction of some work
environment factors and personal characteristics such as perceived supervisor support (PSS), POS, self-
efficacy, and MTT have been over-sighted by previous studies. The current study indents to investigate
such relationships to fill existing void.
Generally, MTT is influenced through organizational support and personal intention of the employee to

Journal of Business and Social Review in Emerging Economies Vol. 6, No 4, December 2020
1623
transfer training at workplaces. The positive attitude of the organization enhances the motivation of
employee to transfer back skills which he/she learned during a training session. Training skills cannot be
transferred through mechanical ways but it is motivated through organizational and personal emotions of
employees (Bosset & Bourgeois, 2015). The previous literature directs that POS and self-efficacy are
quite an influential factor that effects MTT but they have been examined in isolation and structural
linkage of these variables is missing in the literature (Chiaburu & Lindsay, 2008; Chiaburu & Marinova,
2005). The literature unveiled that POS positively influences employees’ attitudes and behavior
(Ahmed, Ismail, Amin, & Islam, 2014; Islam, Khan, Khawaja, & Ahmad, 2017; Islam & Tariq, 2018;
Rozkwitalska & Basinska, 2015). Meta-analysis on POS disclosed that it has a direct effect on
individual-level outcomes (Ahmed & Nawaz, 2015; Riggle, Edmondson, & Hansen, 2009; Rhoades &
Eisenberger, 2002) but prior studies have ignored the impact of POS on subjective aspect of employees’
welfare. As Caesens and Stinglhamber (2014) describe that POS improve the subjective behavior of
employees through physiological and emotional ways. Self-efficacy is one of the important aspects of
the subjective welfare of employees. Therefore, the present study has used self-efficacy as a mediator to
explain the relationship between POS and MTT in accordance with many of previous studies conducted
in the service sector. Caesens and Stinglhamber (2014) used self-efficacy as a mediator while studying
the relationship between POS and work engagement. Islam and Ahmed (2018) also used this variable as
a mediator while investigating the association between POS and transfer of training.
POS is one of the organizational factors that influences MTT. Theoretically, POS help employees in a
subjective way by satisfying their socio-emotional needs like commitment, affiliation and self-efficacy.
Consequently, POS promotes employees’ commitment towards job and extra-role performance in the
organization (Bosset & Bourgeois, 2015). Recently, the importance of MTT has increased because it is a
vital factor to ensure training transfer. MTT is divided into two dimensions, such as autonomous
motivation and controlled motivation. Autonomous motivation is defined as the internal desire of an
individual to transfer training whereas, controlled motivation is regulated through organizational
rewards and incentives (Gegenfurtner et al., 2009). Previous studies have proposed two factors, namely,
self-efficacy and motivation to learn and they are believed to have a significant influence on MTT
(Kontoghiorghes, 2002; Machin & Fogarty, 2004; Paulsen & Kauffeld, 2017). The above discussion
indicates that the influence of POS on MTT seems to be essential for the transfer of training, however,
its impacts may be examined. Therefore, it is hypothesized that:
H1: POS has positive impact on MTT.
H2: POS has positive impact on self-efficacy.
H3: Self-efficacy mediates the positive association between POS and MTT.
The relevance of POS with MTT may not be refuted but environmental factors such as supervisory
support, co-worker support, managerial support, and learning culture are equally important to motive
employees for transfer of training (Islam, Khan, Ahmad, & Ahmed, 2013; Martin, 2010; Pham et al.,
2013). Previous studies (e.g. Ghosh, Chauhan, & Rai, 2015; Lancaster, Milia, & Cameron, 2013)
revealed divergent results to explain the relationship between PSS and MTT. A group of studies found a
strong and position association between PSS and MTT (Cromwell & Kolb, 2004; Gumuseli & Ergin,
2002). As Chiaburu and Lindsay (2008) reported a positive influence of PSS on MTT on the individual
as well as on group level. Whereas another group of studies found a moderate association between these
variables, reported mixed results and suggested that future studies should clarify the relationship
between PSS and MTT through further investigation (Burke & Hutchins, 2007). Some of the studies
have proposed that PSS normally influences MTT indirectly, therefore, the relationship of both variables
should be investigated through any mediator (Bhatti, Battour,Sundram, & Othman, 2013; Nijman,
Nijhof, Wognum, & Veldkamp, 2006). There is a dearth of literature that predicts the negative and non-
significant association between PSS and MTT, however, few researchers proclaim that no association
exists between these variables (Chiaburu & Marinova, 2005). According to Baldwin and Ford (1988),
work environment factors may be classified into three categories: general-environmental factors,
general, and specific training factors. Richey (1992) added that these factors are interrelated with each
other, therefore, general-environmental factors impact general-training related factors that consequently
Journal of Business and Social Review in Emerging Economies Vol. 6, No 4, December 2020
1624
impact specific factors related to training. Furthermore, Nijman et al. (2006) suggested three separate
components of work environment that influence training transfer: a) general work environment; b)
specific work environments that is an intention to transfer training; c) supervisor supportive behavior to
enhance transfer. They consider it as a separate and significant component of the work environment. The
review of literature witnesses the independent relationship between PSS and MTT and relationship
between self-efficacy and MTT, however, a little effort is made to investigate the relationship between
PSS and MTT through mediating role of self-efficacy (Simosi, 2012). Self-efficacy is the part of the
cognitive process that motivates individuals to enhance their emotional and motivational performance
because individuals with high self-efficacy put more effort to achieve high performance. Self-efficacy
positively influences transfer intentions and transfer promoting activities.
Though, it is perceived that employees with high self-efficacy are more likely to get innovative skills
through training and are not only enthusiastic to newly learned skills on the job but also encourage their
colleagues to apply their training at the workplace. Several studies narrate that trainee who is confident
about his abilities would be more inclined to apply and transfer training e.g., (Al-Eisa, Furayyan, &
Alhemoud, 2009; Islam & Ahmed, 2018). The above discussion concludes that transfer literature
examines these variables separately with motivation towards transfer training. Thus, the present study
aimed to investigate PSS and MTT through the mediating role of self-efficacy. Therefore, it was
hypothesized that:
H1: PSS has positive impact on MTT.
H2: PSS has positive impact on self-efficacy.
H3: Self-efficacy mediates the positive association between PSS and MTT.
3. Methods
3.1 Participants and Procedures
The study considered employees of the banking sector. Despite the fact that employees of private and
public organizations have varied level of MTT, still this study consider both the sectors in the light of
the fact that in Pakistan this has turned into a challenge for both the sectors (Azam, 2016). Item response
theory was used to select the sample of 480 (i.e. 24x20) and respondents were approached on
convenience basis. Of these, 388 were used in the final analysis. First, permission was obtained from
respective heads, and then respondents were assured about the anonymity of their responses. The data of
this study was collected from January 2017 till December 2017.
On the basis of demographical characteristics, the majority of the respondents were male (71.7%), less
than 30 years of age (59.1%), married (46.8%), holding 18-years of education (50.0%) with the current
work experience of less than 5-years (59.5%).
3.2 Measures
This study adapted scales from the previous studies and respondents were asked to respond on a five-
point Likert scale ranging between “1-strongly disagree to 5-strongly agree”.
PSS was measured using a four-item scale of Tsai and Tai (2003) with the sample item, “My supervisor
encourages me to attend training program.” POS was measured using a shortened six-item scale of
Rhoades and Eisenberger (2002). This scale was noted as reliable, a sample item includes, “My
organization really cares about my well-being.” A ten-item scale of Schwarzer and Jerusalem, (1995)
with the sample item, “I am confident that I could deal efficiently with unexpected events” was used for
self-efficacy. Finally, MTT was measured through Machin and Forgarty’s (2004) four-item scale with
the sample item, “I intend to use the knowledge and skills acquired from training program when I get
back on the job.”
4. Results
4.1 Primary analyses
Initially, the primary analyses were conducted (including missing values, outliers, normality and
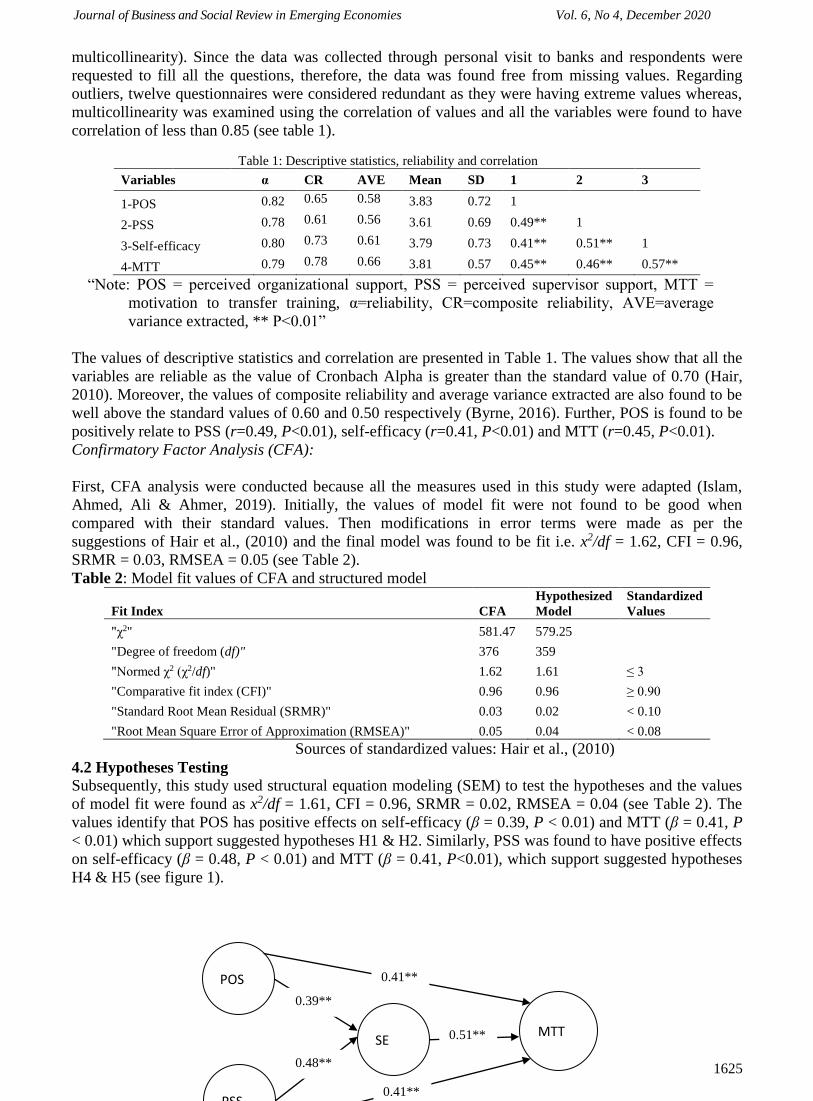
Journal of Business and Social Review in Emerging Economies Vol. 6, No 4, December 2020
1625
multicollinearity). Since the data was collected through personal visit to banks and respondents were
requested to fill all the questions, therefore, the data was found free from missing values. Regarding
outliers, twelve questionnaires were considered redundant as they were having extreme values whereas,
multicollinearity was examined using the correlation of values and all the variables were found to have
correlation of less than 0.85 (see table 1).
Table 1: Descriptive statistics, reliability and correlation
Variables α CR AVE Mean SD 1 2 3
1-POS 0.82 0.65 0.58 3.83 0.72 1
2-PSS 0.78 0.61 0.56 3.61 0.69 0.49** 1
3-Self-efficacy 0.80 0.73 0.61 3.79 0.73 0.41** 0.51** 1
4-MTT 0.79 0.78 0.66 3.81 0.57 0.45** 0.46** 0.57**
“Note: POS = perceived organizational support, PSS = perceived supervisor support, MTT =
motivation to transfer training, α=reliability, CR=composite reliability, AVE=average
variance extracted, ** P<0.01”
The values of descriptive statistics and correlation are presented in Table 1. The values show that all the
variables are reliable as the value of Cronbach Alpha is greater than the standard value of 0.70 (Hair,
2010). Moreover, the values of composite reliability and average variance extracted are also found to be
well above the standard values of 0.60 and 0.50 respectively (Byrne, 2016). Further, POS is found to be
positively relate to PSS (r=0.49, P<0.01), self-efficacy (r=0.41, P<0.01) and MTT (r=0.45, P<0.01).
Confirmatory Factor Analysis (CFA):
First, CFA analysis were conducted because all the measures used in this study were adapted (Islam,
Ahmed, Ali & Ahmer, 2019). Initially, the values of model fit were not found to be good when
compared with their standard values. Then modifications in error terms were made as per the
suggestions of Hair et al., (2010) and the final model was found to be fit i.e. x2/df = 1.62, CFI = 0.96,
SRMR = 0.03, RMSEA = 0.05 (see Table 2).
Table 2: Model fit values of CFA and structured model
Fit Index CFA
Hypothesized
Model
Standardized
Values
"χ2" 581.47 579.25
"Degree of freedom (df)" 376 359
"Normed χ2 (χ2/df)" 1.62 1.61 ≤ 3
"Comparative fit index (CFI)" 0.96 0.96 ≥ 0.90
"Standard Root Mean Residual (SRMR)" 0.03 0.02 < 0.10
"Root Mean Square Error of Approximation (RMSEA)" 0.05 0.04 < 0.08
Sources of standardized values: Hair et al., (2010)
4.2 Hypotheses Testing
Subsequently, this study used structural equation modeling (SEM) to test the hypotheses and the values
of model fit were found as x2/df = 1.61, CFI = 0.96, SRMR = 0.02, RMSEA = 0.04 (see Table 2). The
values identify that POS has positive effects on self-efficacy (β = 0.39, P < 0.01) and MTT (β = 0.41, P
< 0.01) which support suggested hypotheses H1 & H2. Similarly, PSS was found to have positive effects
on self-efficacy (β = 0.48, P < 0.01) and MTT (β = 0.41, P<0.01), which support suggested hypotheses
H4 & H5 (see figure 1).
POS
SE MTT
PSS
0.41**
0.51**
0.39**
0.48**
0.41**

Journal of Business and Social Review in Emerging Economies Vol. 6, No 4, December 2020
1626
Figure 1: Structural Model
Further, path analysis was conducted to test the mediating effect of self-efficacy. Where direct paths
between POS-MTT and PSS-MTT were compared with the indirect paths (i.e. path POS-SE × Path SE-
MTT) to examine its significance. The values depict that the indirect path between POS-MTT through
self-efficacy (β = 0.20, P < 0.01) was found to be lesser than direct path (β = 0.41, P < 0.01), but still
significant. This identifies partial mediating effect of self-efficacy between POS-MTT relationship and
support hypothesis H3. Similarly, the indirect path between PSS-MTT through self-efficacy (β = 0.22, P
< 0.01) was found to be lesser than direct path (β = 0.41, P < 0.01), but significant and allowed to accept
suggested hypothesis H6.
5. Discussion and Implications This study aimed at fulfilling literary gaps regarding the mediating role of self-efficacy between the
associations of PSS and POS with MTT. The results found POS as an important predictor of self-
efficacy and MTT. These results are in line with Eisenberger et al’s. (1986) organizational support
theory as when employees feel of being cared by their organization, they not only found to be confident
(i.e. self-efficacy) in achieving given tasks but also feel motivated to apply and transfer their learned
skills through various programs (i.e. training programs here). Thus, employees perception of support
from their organization contributed to building their confidence (Islam & Ahmed, 2018), which further
motivate them for transfer.
In addition, the study also found PSS to be positively contributing towards the development of
employee’s confidence and in turn, they were found to be motivated regarding the transfer of training.
According to Gist and Mitchell (1992), being efficacious or not is dependent upon the level of support
which employees perceive. Drawing from this notion and results of this study, it has confirmed that
support from supervisor boosts employees’ confidence on themselves, in turn, they get motivated to
apply the same on others (by transferring their learned skills). In a similar study, Taylor. (2000) also
noted that trainees having supportive supervisors are more likely to transfer their skilled at the
workplace.
These results contribute to present literature in several ways. First, it extends the findings and scope of
OST as previous studies have not examined the same on a frequent basis. Second, this study adds to the
limited literature on transfer of training by identifying the mechanism between organizational and
motivational training. Undoubtedly, training is important at all levels of an organization, but if it is not
transferred by the trainees, it will remain unfruitful for the organization. Therefore, organizations are
suggested to focus on motivating trainees to transfer their learned skills. This study suggests banking
sector management to foster a cooperative environment where employees feel that they would be cared
by them and they can communicate to their supervisors easily. Such an environment may be achieved by
fostering learning environment (Islam & Tariq, 2018). Learning environment gives enough confidence
to the employees to share their ideas with each other especially with their immediate supervisors.
Though the study has implications, it is not free from limitations. First, the data for this study was
collected from the banking sector considering the need of Pakistani banking sector. Therefore, to further
generalize the results other sectors can be considered. Second, literature has suggested that cultures
effect the employee’s perception, it is therefore recommended to examine the same in other countries as
well. Finally, as Pakistan is a male dominant country, most of the participants of this study were male,
which may raise a question on gender biased results. Therefore, future researchers should consider both
male and female respondents.
References:
Journal of Business and Social Review in Emerging Economies Vol. 6, No 4, December 2020
1627
Ahmed, I., Khairuzzaman Wan Ismail, W., Mohamad Amin, S., & Islam, T. (2014). Role of perceived
organizational support in teachers’ responsiveness and students’ outcomes: Evidence from a
public sector University of Pakistan. International Journal of Educational Management, 28(2),
246-256.
Ahmed, I., & Nawaz, M. M. (2015). Antecedents and outcomes of perceived organizational support: a
literature survey approach. Journal of Management Development, 34(7), 867-880.
Al-Eisa, A. S., Furayyan, M. A., & Alhemoud, A. M. (2009). An empirical examination of the effects of
self-efficacy, supervisor support and motivation to learn on transfer intention. Management
decision, 47(8), 1221-1244.
Awais Bhatti, M., Mohamed Battour, M., Pandiyan Kaliani Sundram, V., & Aini Othman, A. (2013).
Transfer of training: does it truly happen? An examination of support, instrumentality, retention
and learner readiness on the transfer motivation and transfer of training. European Journal of
Training and Development, 37(3), 273-297.
Azam. (2016). SBP Press Release.
Baldwin, T. T., & Ford, J. K. (1988). Transfer of training: A review and directions for future research.
Personnel psychology, 41(1), 63-105.
Bandura, A. (1995). Self-efficacy in changing societies: Cambridge university press.
Bates, R., & Khasawneh, S. (2005). Organizational learning culture, learning transfer climate and
perceived innovation in Jordanian organizations. International journal of training and
development, 9(2), 96-109.
Bosset, I., & Bourgeois, E. (2015). Motivation to transfer: linking perceived organizational support to
training to personal goals. In Motivationsforschung im Weiterbildungskontext (pp. 169-199):
Springer.
Bunch, K. J. (2007). Training failure as a consequence of organizational culture. Human resource
development review, 6(2), 142-163.
Burke, L. A., & Hutchins, H. M. (2007). Training transfer: An integrative literature review. Human
resource development review, 6(3), 263-296.
Byrne, B. M. (2016). Structural equation modeling with AMOS: Basic concepts, applications, and
programming: Routledge.
Caesens, G., & Stinglhamber, F. (2014). The relationship between perceived organizational support and
work engagement: The role of self-efficacy and its outcomes. Revue Européenne de Psychologie
Appliquée/European Review of Applied Psychology, 64(5), 259-267.
Chauhan, R., Ghosh, P., Rai, A., & Shukla, D. (2016). The impact of support at the workplace on
transfer of training: a study of an Indian manufacturing unit. International journal of training
and development, 20(3), 200-213.
Cheng, E. W., & Hampson, I. (2008). Transfer of training: A review and new insights. International
Journal of Management Reviews, 10(4), 327-341.
Chiaburu, D. S., & Lindsay, D. R. (2008). Can do or will do? The importance of self-efficacy and
instrumentality for training transfer. Human Resource Development International, 11(2), 199-
206.
Chiaburu, D. S., & Marinova, S. V. (2005). What predicts skill transfer? An exploratory study of goal
orientation, training self‐efficacy and organizational supports. International journal of training
and development, 9(2), 110-123.
Cromwell, S. E., & Kolb, J. A. (2004). An examination of work‐environment support factors affecting
transfer of supervisory skills training to the workplace. Human resource development quarterly,
15(4), 449-471.
Devos, C., Dumay, X., Bonami, M., Bates, R., & Holton III, E. (2007). The Learning Transfer System
Inventory (LTSI) translated into French: internal structure and predictive validity. International
journal of training and development, 11(3), 181-199.
Eisenberger, R., Huntington, R., Hutchison, S., & Sowa, D. (1986). Perceived organizational support.
Journal of applied psychology, 71(3), 500.
Facteau, J. D., Dobbins, G. H., Russell, J. E., Ladd, R. T., & Kudisch, J. D. (1995). The influence of
general perceptions of the training environment on pretraining motivation and perceived training
transfer. Journal of management, 21(1), 1-25.

Journal of Business and Social Review in Emerging Economies Vol. 6, No 4, December 2020
1628
Feiden, D. (2003). Bizarre postal bonding. New York Daily News.
Gegenfurtner, A., Festner, D., Gallenberger, W., Lehtinen, E., & Gruber, H. (2009). Predicting
autonomous and controlled motivation to transfer training. International journal of training and
development, 13(2), 124-138.
Ghosh, P., Chauhan, R., & Rai, A. (2015). Supervisor support in transfer of training: Looking back at
past research. Industrial and Commercial Training, 47(4), 201-207.
Gist, M. E., & Mitchell, T. R. (1992). Self-efficacy: A theoretical analysis of its determinants and
malleability. Academy of Management review, 17(2), 183-211.
Gumuseli, A. I., & Ergin, B. (2002). The manager’s role in enhancing the transfer of training: A Turkish
case study. International journal of training and development, 6(2), 80-97.
Hair, J. F., Black, W.C., Babin, B.J. and Anderson, R.E. . (2010). Multivariate Data Analysis (7th ed.):
Prentice Hall, Upper Saddle River, NJ.
Islam, T. (2019). Motivation to transfer training in learning organization. Journal of management
development, 38(4), 273-287.
Islam, T., & Ahmed, I. (2018). Mechanism between perceived organizational support and transfer of
training: Explanatory role of self-efficacy and job satisfaction. Management Research Review,
41(3), 296-313.
Islam, T., Ahmed, I., Ali, G., & Ahmer, Z. (2019). Emerging trends of coffee cafes in Pakistan: Factors
affecting revisit intention. British food Journal,121(9), 2132-2147.
Islam, T., Khan, M. M., Khawaja, F. N., & Ahmad, Z. (2017). Nurses’ reciprocation of perceived
organizational support: the moderating role of psychological contract breach. International
Journal of Human Rights in Healthcare, 10(2), 123-131.
Islam, T., & Tariq, J. (2018). Learning organizational environment and extra-role behaviors: The
mediating role of employee engagement. Journal of Management Development, 37(3), 258-270.
Islam, T., ur Rehman Khan, S., Norulkamar Ungku Bt. Ahmad, U., & Ahmed, I. (2013). Organizational
learning culture and leader-member exchange quality: The way to enhance organizational
commitment and reduce turnover intentions. The Learning Organization, 20(4/5), 322-337.
Islam, T., Khan, M.M., Ahmed, I. and Mahmood, K. (2020). Promoting in-role and extra-role green
behavior through ethical leadership: mediating role of green HRM and moderating role of
individual green values. International Journal of Manpower, (In
press). https://doi.org/10.1108/IJM-01-2020-0036
Islam, T., Ahmad, S., Kaleem, A. and Mahmood, K. (2021). Abusive supervision and knowledge
sharing: moderating roles of Islamic work ethic and learning goal orientation. Management
Decision, 59 (2), 205-222.
Kontoghiorghes, C. (2002). Predicting motivation to learn and motivation to transfer learning back to the
job in a service organization: A new systemic model for training effectiveness. Performance
Improvement Quarterly, 15(3), 114-129.
Kupritz, V. W., & Hillsman, T. (2011). The impact of the physical environment on supervisory
communication skills transfer. The Journal of Business Communication (1973), 48(2), 148-185.
Lancaster, S., Di Milia, L., & Cameron, R. (2013). Supervisor behaviours that facilitate training transfer.
Journal of Workplace Learning, 25(1), 6-22.
Machin, M. A., & Fogarty, G. J. (2004). Assessing the antecedents of transfer intentions in a training
context. International journal of training and development, 8(3), 222-236.
Martin, H. J. (2010). Workplace climate and peer support as determinants of training transfer. Human
resource development quarterly, 21(1), 87-104.
Nijman, D.-J. J., Nijhof, W. J., Wognum, A., & Veldkamp, B. P. (2006). Exploring differential effects of
supervisor support on transfer of training. Journal of European industrial training, 30(7), 529-
549.
Paulsen, H. F. K., & Kauffeld, S. (2017). Linking positive affect and motivation to transfer within
training: a multilevel study. International journal of training and development, 21(1), 35-52.
Pham, N. T., Segers, M. S., & Gijselaers, W. H. (2013). Effects of work environment on transfer of
training: empirical evidence from M aster of B usiness A dministration programs in V ietnam.
International journal of training and development, 17(1), 1-19.

Journal of Business and Social Review in Emerging Economies Vol. 6, No 4, December 2020
1629
Rhoades, L., & Eisenberger, R. (2002). Perceived organizational support: a review of the literature.
Journal of applied psychology, 87(4), 698.
Richey, R. (1992). Designing Instruction for the Adult Learner: Systematic Training Theory and
Practice: ERIC.
Riggle, R. J., Edmondson, D. R., & Hansen, J. D. (2009). A meta-analysis of the relationship between
perceived organizational support and job outcomes: 20 years of research. Journal of business
research, 62(10), 1027-1030.
Rozkwitalska, M., & Basinska, B. A. (2015). Job satisfaction in the multicultural environment of
multinational corporations: Using the positive approach to empower organizational success.
Baltic Journal of Management, 10(3), 366-387.
Saks, A. M., & Belcourt, M. (2006). An investigation of training activities and transfer of training in
organizations. Human Resource Management: Published in Cooperation with the School of
Business Administration, The University of Michigan and in alliance with the Society of Human
Resources Management, 45(4), 629-648.
Salas, E., & Kosarzycki, M. P. (2003). Why don't organizations pay attention to (and use) findings from
the science of training? Human resource development quarterly, 14(4), 487-491.
Schwarzer, R., & Jerusalem, M. (1995). Optimistic self-beliefs as a resource factor in coping with stress.
In Extreme stress and communities: Impact and intervention (pp. 159-177): Springer.
Silverman, R. E. (2012). So much training, so little to show for it. Wall Street Journal, 1-3.
Simosi, M. (2012). The moderating role of self‐efficacy in the organizational culture–training transfer
relationship. International journal of training and development, 16(2), 92-106.
Taylor, M. C. (2000). Transfer of learning in workplace literacy programs. Adult Basic Education, 10(1),
3-9.
Tsai, W.-C., & Tai, W.-T. (2003). Perceived importance as a mediator of the relationship between
training assignment and training motivation. Personnel review, 32(2), 151-163.
Van den Bossche, P., Segers, M., & Jansen, N. (2010). Transfer of training: the role of feedback in
supportive social networks. International journal of training and development, 14(2), 81-94.
Velada, R., Caetano, A., Michel, J. W., Lyons, B. D., & Kavanagh, M. J. (2007). The effects of training
design, individual characteristics and work environment on transfer of training. International
journal of training and development, 11(4), 282-294.
Wei Tian, A., Cordery, J., & Gamble, J. (2016). Returning the favor: positive employee responses to
supervisor and peer support for training transfer. International journal of training and
development, 20(1), 1-16.
Yamkovenko, B., & Holton, E. (2010). Toward a theoretical model of dispositional influences on
transfer of learning: A test of a structural model. Human resource development quarterly, 21(4),
381-410.
Zumrah, A. R., & Boyle, S. (2015). The effects of perceived organizational support and job satisfaction
on transfer of training. Personnel review, 44(2), 236-254.

Journal of Business and Social Review in Emerging Economies Vol. 6, No 4, December 2020
1630

Journal of Business and Social Review in Emerging Economies Vol. 6, No 4, December 2020
1631
Volume and Issues Obtainable at Center for Sustainability Research and Consultancy
Journal of Business and Social Review in Emerging Economies ISSN: 2519-089X (E): 2519-0326
Volume 6: No. 4, December 2020
Journal homepage: www.publishing.globalcsrc.org/jbsee
A Descriptive Analysis of Compensation Offerings and its Impact on Turnover
Intentions of Educational Managers of Punjab
1Majid Ali, 2Muhammad Ramzan, 3Rizwan Qaiser Danish
1Assistant Professor, Hailey College of Commerce, University of the Punjab, Lahore, Pakistan,
[email protected] 2Assistant Professor, Hailey College of Commerce, University of the Punjab, Lahore, Pakistan,
[email protected] 3Associate Professor, Institute of Business Administration, University of the Punjab, Lahore, Pakistan,
ARTICLE DETAILS ABSTRACT History Revised format: November 2020 Available Online: December 2020
This research is aimed at investigating compensation offerings at
various levels and its impact on the turnover intentions of employees
in educational sector of Punjab. It specifically addressed the issue how
different compensation offerings (for example pay, bonus, medical
facility, housing etc) effects on intention to quit from the organisation.
The research has focused on gauging the impact of the compensation
package on the educational managers’ intention to quit, i. e. turnover,
and to know to what extent degree of impact of each constituent of the
compensation package has on their intention to leave the organization.
This study has provided implications for policy makers in different
organisations related to education particularly in Pakistani context.
© 2020 Center for Sustainability Research and Consultancy Pakistan
under a Creative Commons Attribution-NonCommercial-ShareAlike
4.0
Keywords compensation, education,
offerings, intention to leave.
JEL Classification
M10, M11
Corresponding author’s email address: [email protected]
Recommended citation: Ali, M., Ramzan, M. & Danish, R. Q. (2020). A Descriptive Analysis of
Compensation Offerings and its Impact on Turnover Intentions of Educational Managers of Punjab.
Journal of Business and Social Review in Emerging Economies, 6(4), 1631-1651
1. Introduction
Educational sector of Pakistan is typically characterised with high turnover and teaching and non-
teaching staff switch their jobs rapidly. In this way, hiring and retaining talented employees incur a huge
cost. In a study by Steers, the research undertaken to understand the offerings of compensation by a
company and its various elements and demonstrates that there exists a bond among the rewards a
company compromises and persons individuals which are engrossed to the compensation into working
for the organization, and incumbents which wanted to remain the part of business (Steers, 1991). The
flourishing economy of Pakistan with a greatest extended economic expansion, specifically with the
foundation of CPEC, a younger and mid-career workforce that are not old work force is increasing on
regular basis and it is also evident how short joblessness is putting burden on educational industry wages
while more and more PhDs and MPhils are saturating the market. Organizations and institutions in this
important sector are reacting with heaps of new customized and choice based employee reward packages
and benefit contributions not characteristically available from other type of firms. As a result, employees
are very keen in retorting with thoughts around in which way continuum of new liaison of employee and
employer must graft in the new-fangled economic conditions.
Journal of Business and Social Review in Emerging Economies Vol. 6, No 4, December 2020
1632
2. Significance of the Study
From a standpoint of theory, this study is an effort to provide suggestion of the financial and non -
financial elements of compensation that are considered of utmost prominence to educational managers.
The recent bulk of scholar’s work on this area of educational management, endeavors to help further in
understanding of rewards, both related financial and nonfinancial, along with their intentions to leave
their jobs. This investigation also anticipates contributing to the scant studies by presenting indication of
the mark to which management benefit bundles, as a whole, have an encouragement on intentions to halt
with the group of universal managers. Finally, two “open ended questions” have been focused on
establishing “what is the most important factor influencing a general manager’s decision to stay with the
company”, and “what is the most important factor influencing their decision to leave”. As per pragmatic
approach, this research is to chart new boundaries to escort managers yearning to advance their retaining
and diminish their turnover as an emblem of the useful or tolerant compensation strategies. These types
of different financial and non-financial compensation plans will provide and reduce turnover.
In recent times the more focus is being paid on the employees how well they are performing in their
organizations. How well an organization gears its policies and programs regarding reward system and
achieves its strategic intent in terms of its mission and vision is of paramount concern. Managers are
becoming increasingly aware in both private and public organizations that using an apt compensation
plan a critical source of competitive advantage often comes from a suitable system of attracting and
managing the organizations human resources. Hence following are the research questions and objectives
of the study.
3. Research Objectives
1. To investigate the existing management reward or compensation practices of the educational
managers
2. To find the relationship between compensation practices and turnover intentions in teaching and non-
teaching managerial staff.
3. To identify the differences in various managerial level in compensation and turnover intentions.
4. Research Questions
The following basic research questions of this study have been described below:
1. Are the employes turnover intention decrease by the compensation plan for educational managers?
2. Among compensation essentials which in turn, as identified by different educational managers, effect
turnover intentions?
5. Literature Review
5.1 Compensation
Lawler (1981) explained that total or whole compensation composed of all the benefits in cash or
financial forms plus other fringe benefits which are received b employees from a company during a time
is called compensation. Dibble (1999) expands the definition of earnings, “it is money even when we do
not use the word” and further elaborates by stating that “a benefit like employee development, even
though not necessarily viewed by the employee as compensation, is a substitute for money and a major
cost for employers”. In today’s era, the rewards offered to employees has extended both in terms of
category and quantity. Normally, a meeting is conducted after a fixed term usually one year and
compensation plan is offered to managers along with annual bonus or increments based on performance
considering goals for revenues and expenses of the company (Muller, 1999). In broad, compensation is
categorized among two types among which one is monetary and second is non-monetary, however as the
time has passed new idea of cafeteria compensation has been devised in which employees are offered a
long range of benefits from which he can take whatever he wants within his limitations. Moreover,
employees that have knowledge skills and abilities at their peak, they are in a better position to negotiate
with the employer like a sports man. The following lists will give an overview of some of the categories
and types of bonuses:
“Base Pay”
• “Salary and wages- for being at work”

Journal of Business and Social Review in Emerging Economies Vol. 6, No 4, December 2020
1633
“Increases for Demonstrating New Skills”
• “Competency pay”
• “Skill based pay”
• “Job progression”
“Increases for Results”
• “Incentive”
• “Commission”
• “Gainsharing”
• “Merit increase”
“Pay For Working More Hours”
• “Overtime”
• “Premium pay”
“Increases not Dependent on Anything Else”
• “Cost of living adjustment- COLA”
• “General Increase”
“Increase Based on the Organizations Financial Success”
• “Profit sharing”
• “Bonus”
“Other Forms of Increases”
• “Promotional increase”
• “Market adjustment’’
“Short term incentives
• Retention bonus
• Signing bonus
• Referral bonus
• Guaranteed annual bonus
• Gainsharing
• Cash incentive programs
• Vacation awards
Long term incentives
• Stock options
• Employee stock ownership
• IPO equity
• Restrictive stock
• Manager bonus plan
• Ownership stake
• 401K plan
• Retirement plan
• Deferred compensation- 3 years or longer”
5.2 Turnover
Turnover has been defined by Mobley (1982) as “the cessation of membership in an organization by an
individual who received monetary compensation from the organization”. According to Wasmuth and
Davis (1983), there are various schemes for categorizing employee turnover. Specifically, for this study
the contrast of deliberate versus unintentional will be used since the research will focus on the
employee’s intention to turnover. Voluntary turnover is the choice of employee how he wants to quit
from his own will and by choice, whereas quite opposite to it is involuntary turnover which is based on
the option of organization due to any reason including retirement and death (Mobley, 1982).
5.3 Intention to Turnover
In theory, a good predictor of future behavior must be a person’s behavioral intentions according to
multiple research studies offered by Mobley (1982). In the previous study including intention to quit
seven variables were studied as a predictor for turnover by Mobley, he concluded that when all variables
were combined, “only intention to quit was significantly related to turnover”. Additionally, determined

Journal of Business and Social Review in Emerging Economies Vol. 6, No 4, December 2020
1634
through the other study, that intentions to leave served as a “summary variable” encompassing many
other variables that were associated to turnover. The assessment by Mobley was, “intentions are the best
predictors of turnover”. Intent to quit was used as a substitute for actual turnover by McFillen, Riegel
and Enz because the capability to quit the job depend upon whether the employee can quit.
According to Woods (1999), the relationship changed through the process of reengineering, downsizing
and reorganization when businesses decided to break the “psychological contracts” they had long
held with employees, which gave employees a sense of security, in the late 1980’s and 90’s.
Today we are “employed at will” Because employees are “temporary”, in the sense that mostly
employees do not holds a job for whole life; Despite the certainties of the new economy still
there are avoidable reasons for turnover and ways to decrease it.
Many reasons of turnover may be:
Pay
“Treatment by superiors”
“Amount of work hours”
“Job pressure”
“Scheduling of hours - frustration
with the chain”
“Training program - slow
promotions”
“Fringe benefit package-
performance expectations- poor job
performance”
“Attractive opportunity in another
line of work”
“Working manager concept- need for
a new challenge- type of work
required”
“Physical demands of job”
“Inability to live up to chain store
managers image”
“Inability to handle job”
“Desire to get out of education
business”
“Desire to find work in another
geographic area”

Journal of Business and Social Review in Emerging Economies Vol. 6, No 4, December 2020
1635
According to Lazear (1999) Turnover is less likely among high wage, high performing workers.
Roseman states (1981), that for “more money” peoples quit the companies and “there is no question that
pay rates can influence turnover however, managers generally overestimate the significance of pay”. It is
sure that pay is significant, but “there are many other issues, other than pay, that effect intention to
turnover. In any company, employees can compare their pay with individuals or groups internal and
external to the organization. Both internal and external inequity can have dire consequences for the
firm”, though the outcomes of external equity such as turnover are the most threatening according to
Lawler (1981).
In the recent years another issue is planned turnover which has gained more attention. According to
Lawler “not all turnover is detrimental to an organizations ability to be effective (Lawler, 1987). From
losing poor performers and the inflow of “new blood” organization can benefit. When the replacement
costs are negligible then it could be cost effective to agree to take a higher rate of turnover for keeping
salaries repressed, and it may be the situation with unqualified labor. In additionally, when a project has
a limited lifetime and the need for the employees linked with the project will come to an end” then use
of planned turnover is effective.
6. Method Data was collected through self-administered questionnaire including open ended questions from sample
and population which was appropriate for this study. Unit of analysis was individual and there was
minimal interference of researcher. As there were four different levels of employees, so multilevel data
was analyzed to see if there is any difference among different levels.
The questionnaire with major focus on demographic variables and compensation types or offerings was
distributed among the academic staff with some managerial responsibilities. Their turnover intentions
were measured by one global question as whether they want to leave their job or not. We consider every
person having 2 or more people under him or her to manage with. Overall 600 questionnaires were
distributed among which 560 were returned filled. Among these 16 were discarded due to missing data
or left-over page thus making useable response 91%.
The respondents were questioned on five point Likert scale with anchors “Not at all influential”,
“Slightly Influential” “Moderately Influential” “Very Influential” and “Extremely Influential” and we
analyzed it on major demographic variables, analysis of variance and correlation. The results are
described in the next section.
7. Result and Analysis
Data has been analyzed through SPSS software for in depth analysis. Frequencies, mean, standard
deviation, correlation, regression, and ANOVA were run for descriptive analysis and multilevel
differences.
7.1 Descriptive Statistics
7.1.1 Basic Salary
Table 1. Salary of Respondents
Frequency Percent Valid Percent Cumulative Percent
Not at all influential 39 7.1 7.1 7.1
Slightly influential 59 10.8 10.8 17.9
Moderately influential 136 24.9 24.9 42.9
Very influential 181 33.2 33.2 76.0
Extremely influential 131 24.0 24.0 100.0
Total 546 100.0 100.0
Table 1 explains that out of total 546 respondents the basic salary of 39 respondents was “Not at all
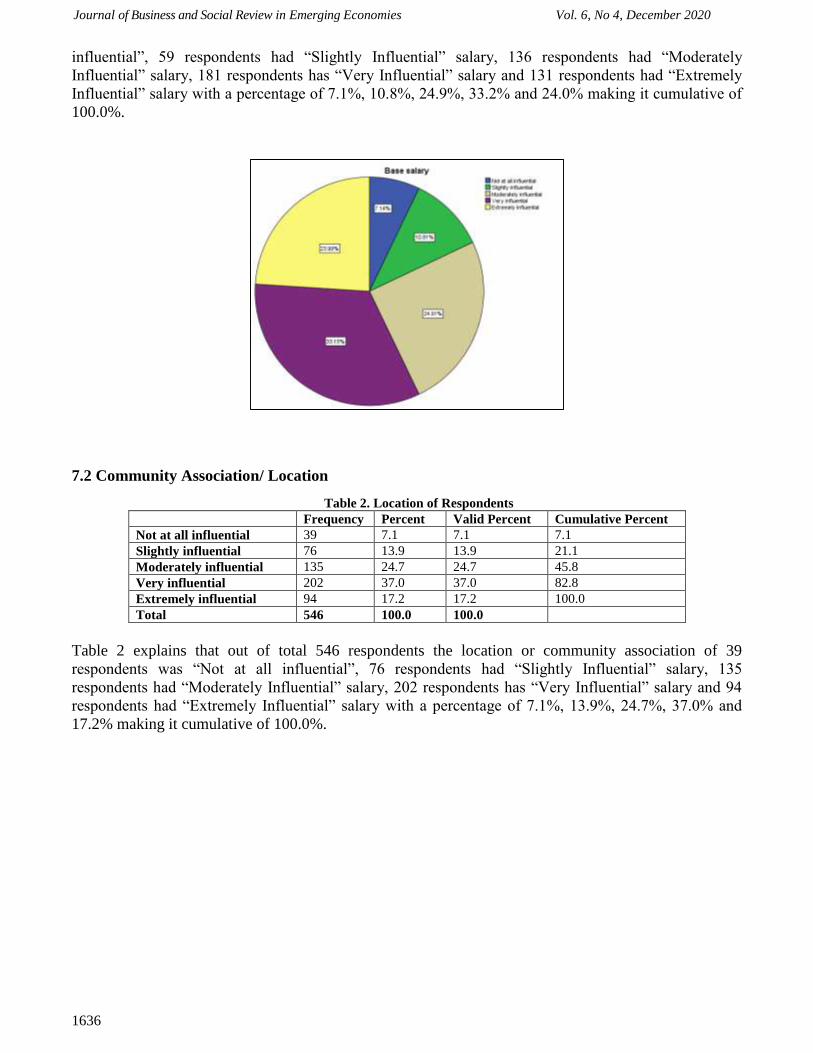
Journal of Business and Social Review in Emerging Economies Vol. 6, No 4, December 2020
1636
influential”, 59 respondents had “Slightly Influential” salary, 136 respondents had “Moderately
Influential” salary, 181 respondents has “Very Influential” salary and 131 respondents had “Extremely
Influential” salary with a percentage of 7.1%, 10.8%, 24.9%, 33.2% and 24.0% making it cumulative of
100.0%.
7.2 Community Association/ Location
Table 2. Location of Respondents
Frequency Percent Valid Percent Cumulative Percent
Not at all influential 39 7.1 7.1 7.1
Slightly influential 76 13.9 13.9 21.1
Moderately influential 135 24.7 24.7 45.8
Very influential 202 37.0 37.0 82.8
Extremely influential 94 17.2 17.2 100.0
Total 546 100.0 100.0
Table 2 explains that out of total 546 respondents the location or community association of 39
respondents was “Not at all influential”, 76 respondents had “Slightly Influential” salary, 135
respondents had “Moderately Influential” salary, 202 respondents has “Very Influential” salary and 94
respondents had “Extremely Influential” salary with a percentage of 7.1%, 13.9%, 24.7%, 37.0% and
17.2% making it cumulative of 100.0%.

Journal of Business and Social Review in Emerging Economies Vol. 6, No 4, December 2020
1637
7.3 Deferred compensation/ end of contract cash out
Table 3. Deferred Compensation of Respondents
Frequency Percent Valid Percent Cumulative Percent
Not at all influential 58 10.6 10.6 10.6
Slightly influential 148 27.1 27.1 37.7
Moderately influential 137 25.1 25.1 62.8
Very influential 147 26.9 26.9 89.7
Extremely influential 56 10.3 10.3 100.0
Total 546 100.0 100.0
Table 3 explains that out of total 546 respondents the deferred compensation of 58 respondents was “Not
at all influential”, 148 respondents had “Slightly Influential” salary, 137 respondents had “Moderately
Influential” salary, 147 respondents has “Very Influential” salary and 56 respondents had “Extremely
Influential” salary with a percentage of 10.6%, 27.1%, 25.1%, 26.29 and 10.3% making it cumulative of
100.0%.
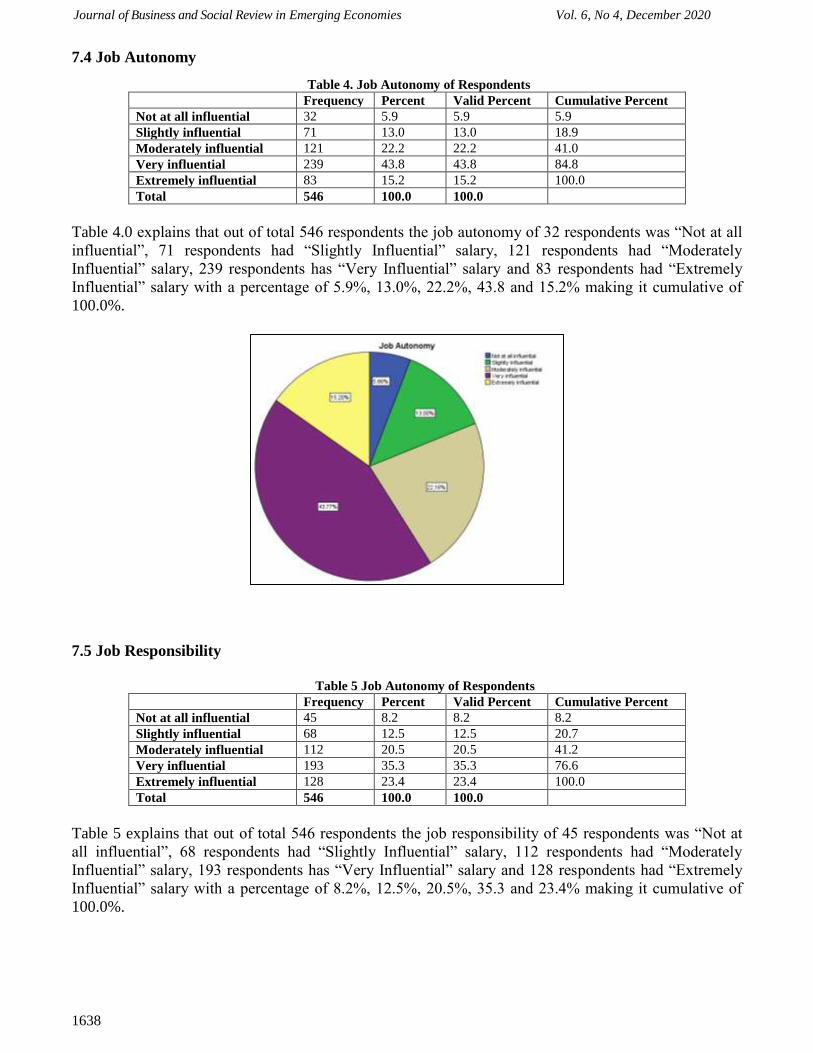
Journal of Business and Social Review in Emerging Economies Vol. 6, No 4, December 2020
1638
7.4 Job Autonomy
Table 4. Job Autonomy of Respondents
Frequency Percent Valid Percent Cumulative Percent
Not at all influential 32 5.9 5.9 5.9
Slightly influential 71 13.0 13.0 18.9
Moderately influential 121 22.2 22.2 41.0
Very influential 239 43.8 43.8 84.8
Extremely influential 83 15.2 15.2 100.0
Total 546 100.0 100.0
Table 4.0 explains that out of total 546 respondents the job autonomy of 32 respondents was “Not at all
influential”, 71 respondents had “Slightly Influential” salary, 121 respondents had “Moderately
Influential” salary, 239 respondents has “Very Influential” salary and 83 respondents had “Extremely
Influential” salary with a percentage of 5.9%, 13.0%, 22.2%, 43.8 and 15.2% making it cumulative of
100.0%.
7.5 Job Responsibility
Table 5 Job Autonomy of Respondents
Frequency Percent Valid Percent Cumulative Percent
Not at all influential 45 8.2 8.2 8.2
Slightly influential 68 12.5 12.5 20.7
Moderately influential 112 20.5 20.5 41.2
Very influential 193 35.3 35.3 76.6
Extremely influential 128 23.4 23.4 100.0
Total 546 100.0 100.0
Table 5 explains that out of total 546 respondents the job responsibility of 45 respondents was “Not at
all influential”, 68 respondents had “Slightly Influential” salary, 112 respondents had “Moderately
Influential” salary, 193 respondents has “Very Influential” salary and 128 respondents had “Extremely
Influential” salary with a percentage of 8.2%, 12.5%, 20.5%, 35.3 and 23.4% making it cumulative of
100.0%.
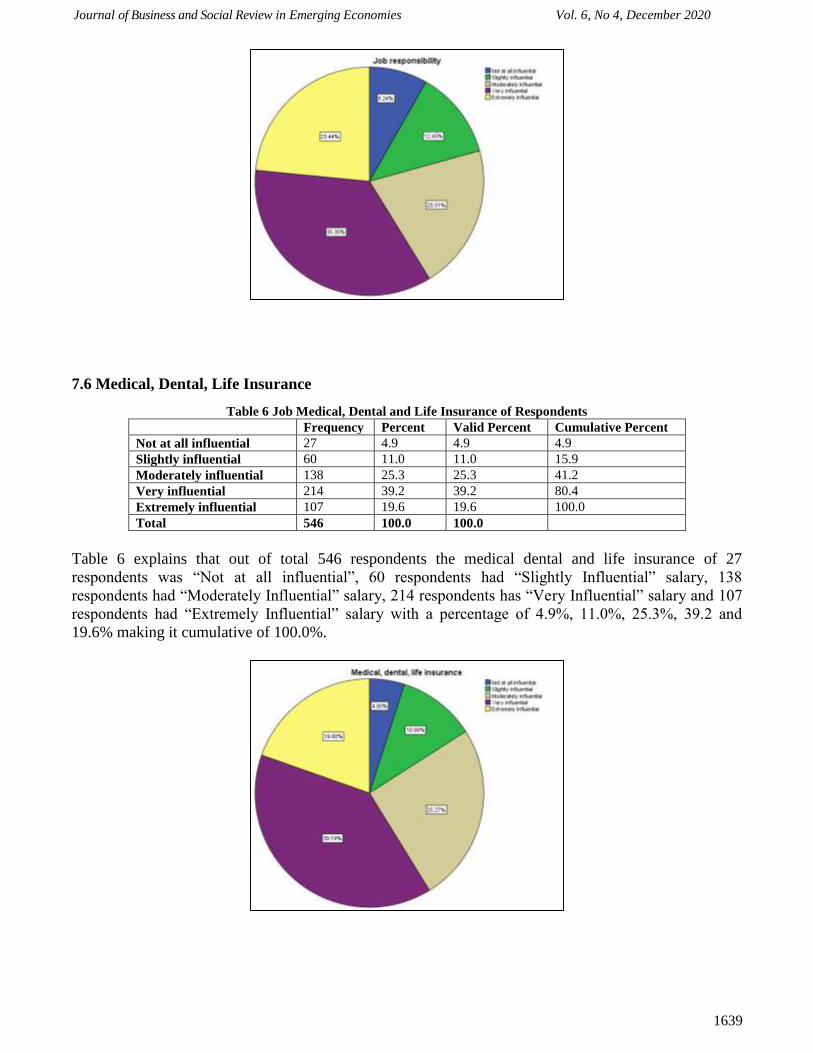
Journal of Business and Social Review in Emerging Economies Vol. 6, No 4, December 2020
1639
7.6 Medical, Dental, Life Insurance
Table 6 Job Medical, Dental and Life Insurance of Respondents
Frequency Percent Valid Percent Cumulative Percent
Not at all influential 27 4.9 4.9 4.9
Slightly influential 60 11.0 11.0 15.9
Moderately influential 138 25.3 25.3 41.2
Very influential 214 39.2 39.2 80.4
Extremely influential 107 19.6 19.6 100.0
Total 546 100.0 100.0
Table 6 explains that out of total 546 respondents the medical dental and life insurance of 27
respondents was “Not at all influential”, 60 respondents had “Slightly Influential” salary, 138
respondents had “Moderately Influential” salary, 214 respondents has “Very Influential” salary and 107
respondents had “Extremely Influential” salary with a percentage of 4.9%, 11.0%, 25.3%, 39.2 and
19.6% making it cumulative of 100.0%.

Journal of Business and Social Review in Emerging Economies Vol. 6, No 4, December 2020
1640
7.7 Ownership Stake/ Equity Interest
Table 7 Ownership of Respondents
Frequency Percent Valid Percent Cumulative Percent
Not at all influential 38 7.0 7.0 7.0
Slightly influential 56 10.3 10.3 17.2
Moderately influential 172 31.5 31.5 48.7
Very influential 196 35.9 35.9 84.6
Extremely influential 84 15.4 15.4 100.0
Total 546 100.0 100.0
Table 7 explains that out of total 546 respondents the ownership of 38 respondents was “Not at all
influential”, 56 respondents had “Slightly Influential” salary, 172 respondents had “Moderately
Influential” salary, 196 respondents has “Very Influential” salary and 84 respondents had “Extremely
Influential” salary with a percentage of 7.0%, 10.3%, 31.5%, 35.9% and 15.4% making it cumulative of
100.0%.
7.8 Performance Bonus
Table 8 Performance Bonus of Respondents
Frequency Percent Valid Percent Cumulative Percent
Not at all influential 30 5.5 5.5 5.5
Slightly influential 88 16.1 16.1 21.6
Moderately influential 140 25.6 25.6 47.3
Very influential 204 37.4 37.4 84.6
Extremely influential 84 15.4 15.4 100.0
Total 546 100.0 100.0
Table 8 explains that out of total 546 respondents the performance bonus of 30 respondents was “Not at
all influential”, 88 respondents had “Slightly Influential” salary, 140 respondents had “Moderately
Influential” salary, 204 respondents has “Very Influential” salary and 84 respondents had “Extremely
Influential” salary with a percentage of 5.5%, 16.1%, 25.6%, 37.4% and 15.4% making it cumulative of
100.0%.

Journal of Business and Social Review in Emerging Economies Vol. 6, No 4, December 2020
1641
7.9 Quality of Working Conditions
Table 9 Quality of working conditions of Respondents
Frequency Percent Valid Percent Cumulative Percent
Not at all influential 21 3.8 3.8 3.8
Slightly influential 37 6.8 6.8 10.6
Moderately influential 112 20.5 20.5 31.1
Very influential 247 45.2 45.2 76.4
Extremely influential 129 23.6 23.6 100.0
Total 546 100.0 100.0
Table 9 explains that out of total 546 respondents the quality of working conditions of 21 respondents
was “Not at all influential”, 37 respondents had “Slightly Influential” salary, 112 respondents had
“Moderately Influential” salary, 247 respondents has “Very Influential” salary and 129 respondents had
“Extremely Influential” salary with a percentage of 3.8%, 6.8%, 20.5%, 45.2% and 23.6% making it
cumulative of 100.0%.

Journal of Business and Social Review in Emerging Economies Vol. 6, No 4, December 2020
1642
7.10 Retirement Plan
Table 10 Retirement plan of Respondents
Frequency Percent Valid Percent Cumulative Percent
Not at all influential 16 2.9 2.9 2.9
Slightly influential 40 7.3 7.3 10.3
Moderately influential 91 16.7 16.7 26.9
Very influential 226 41.4 41.4 68.3
Extremely influential 173 31.7 31.7 100.0
Total 546 100.0 100.0
Table 10 explains that out of total 546 respondents the retirement plan of 16 respondents was “Not at all
influential”, 40 respondents had “Slightly Influential” salary, 91 respondents had “Moderately
Influential” salary, 226 respondents has “Very Influential” salary and 173 respondents had “Extremely
Influential” salary with a percentage of 2.9%, 7.3%, 16.7%, 41.4% and 31.7% making it cumulative of
100.0%.
7.11 Status as Employer or Owner
Table 11 Status of Respondents
Frequency Percent Valid Percent Cumulative Percent
Not at all influential 16 2.9 2.9 2.9
Slightly influential 44 8.1 8.1 11.0
Moderately influential 106 19.4 19.4 30.4
Very influential 231 42.3 42.3 72.7
Extremely influential 149 27.3 27.3 100.0
Total 546 100.0 100.0
Table 11.0 explains that out of total 546 respondents the status as owners of 16 respondents was “Not at
all influential”, 40 respondents had “Slightly Influential” salary, 91 respondents had “Moderately
Influential” salary, 226 respondents has “Very Influential” salary and 173 respondents had “Extremely
Influential” salary with a percentage of 2.9%, 7.3%, 16.7%, 41.4% and 31.7% making it cumulative of
100.0%.

Journal of Business and Social Review in Emerging Economies Vol. 6, No 4, December 2020
1643
7.12 Stock Options Table 12 Stock option of Respondents
Frequency Percent Valid Percent Cumulative Percent
Not at all influential 17 3.1 3.1 3.1
Slightly influential 51 9.3 9.3 12.5
Moderately influential 110 20.1 20.1 32.6
Very influential 236 43.2 43.2 75.8
Extremely influential 132 24.2 24.2 100.0
Total 546 100.0 100.0
Table 12 explains that out of total 546 respondents the stock options of 17 respondents was “Not at all
influential”, 51 respondents had “Slightly Influential” salary, 110 respondents had “Moderately
Influential” salary, 236 respondents has “Very Influential” salary and 132 respondents had “Extremely
Influential” salary with a percentage of 3.1%, 9.3%, 20.1%, 43.2% and 24.2% making it cumulative of
100.0%.
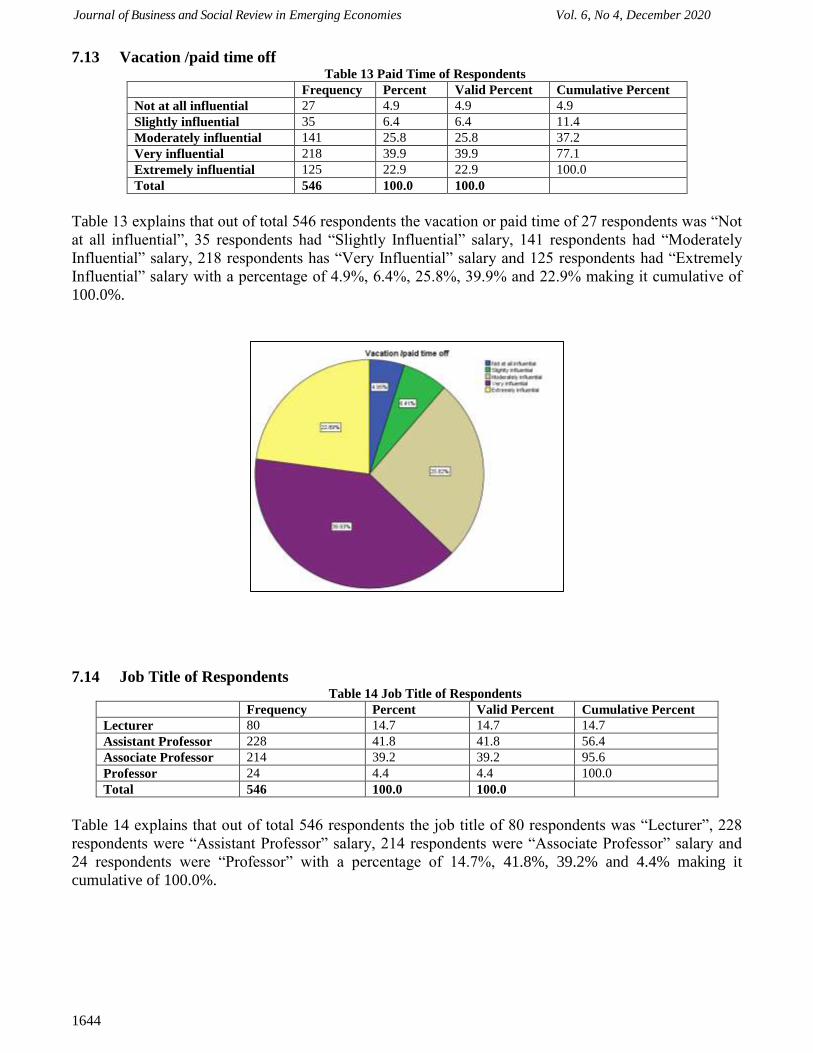
Journal of Business and Social Review in Emerging Economies Vol. 6, No 4, December 2020
1644
7.13 Vacation /paid time off Table 13 Paid Time of Respondents
Frequency Percent Valid Percent Cumulative Percent
Not at all influential 27 4.9 4.9 4.9
Slightly influential 35 6.4 6.4 11.4
Moderately influential 141 25.8 25.8 37.2
Very influential 218 39.9 39.9 77.1
Extremely influential 125 22.9 22.9 100.0
Total 546 100.0 100.0
Table 13 explains that out of total 546 respondents the vacation or paid time of 27 respondents was “Not
at all influential”, 35 respondents had “Slightly Influential” salary, 141 respondents had “Moderately
Influential” salary, 218 respondents has “Very Influential” salary and 125 respondents had “Extremely
Influential” salary with a percentage of 4.9%, 6.4%, 25.8%, 39.9% and 22.9% making it cumulative of
100.0%.
7.14 Job Title of Respondents Table 14 Job Title of Respondents
Frequency Percent Valid Percent Cumulative Percent
Lecturer 80 14.7 14.7 14.7
Assistant Professor 228 41.8 41.8 56.4
Associate Professor 214 39.2 39.2 95.6
Professor 24 4.4 4.4 100.0
Total 546 100.0 100.0
Table 14 explains that out of total 546 respondents the job title of 80 respondents was “Lecturer”, 228
respondents were “Assistant Professor” salary, 214 respondents were “Associate Professor” salary and
24 respondents were “Professor” with a percentage of 14.7%, 41.8%, 39.2% and 4.4% making it
cumulative of 100.0%.

Journal of Business and Social Review in Emerging Economies Vol. 6, No 4, December 2020
1645
7.15 Marital Status
Table 15 Marital Status of Respondents
Frequency Percent Valid Percent Cumulative Percent
Single 313 57.3 57.3 57.3
Married 233 42.7 42.7 100.0
Total 546 100.0 100.0
Table 15.0 explains the marital status of respondents that out of total 546 respondents, 313 were
“Single” and 233 respondents were “Married” with a percentage of 57.3%, and 42.7% making it
cumulative of 100.0%.
7.16 Total Experience
Table 16 Experience of Respondents
Frequency Percent Valid Percent Cumulative Percent
1-5 Years 361 66.1 66.1 66.1
6-10 Years 125 22.9 22.9 89.0
11-15 Years 42 7.7 7.7 96.7
16-20 Years 12 2.2 2.2 98.9
21-25 Years 6 1.1 1.1 100.0
Total 546 100.0 100.0
Table 16 explains the total experience of respondents that out of total 546 respondents, 361 had
experience of 1-5 years, 125 respondents have experience of 6-10 years, 42 respondents had experience
of 11-15 years, 12 respondents had experience of 16-20 years and 6 respondents had experiences of 21-
25 years respectively with percentage of 66.1%, 22.9%, 7.7%, 2.2% and 1.1% making it cumulative of
100.0%.
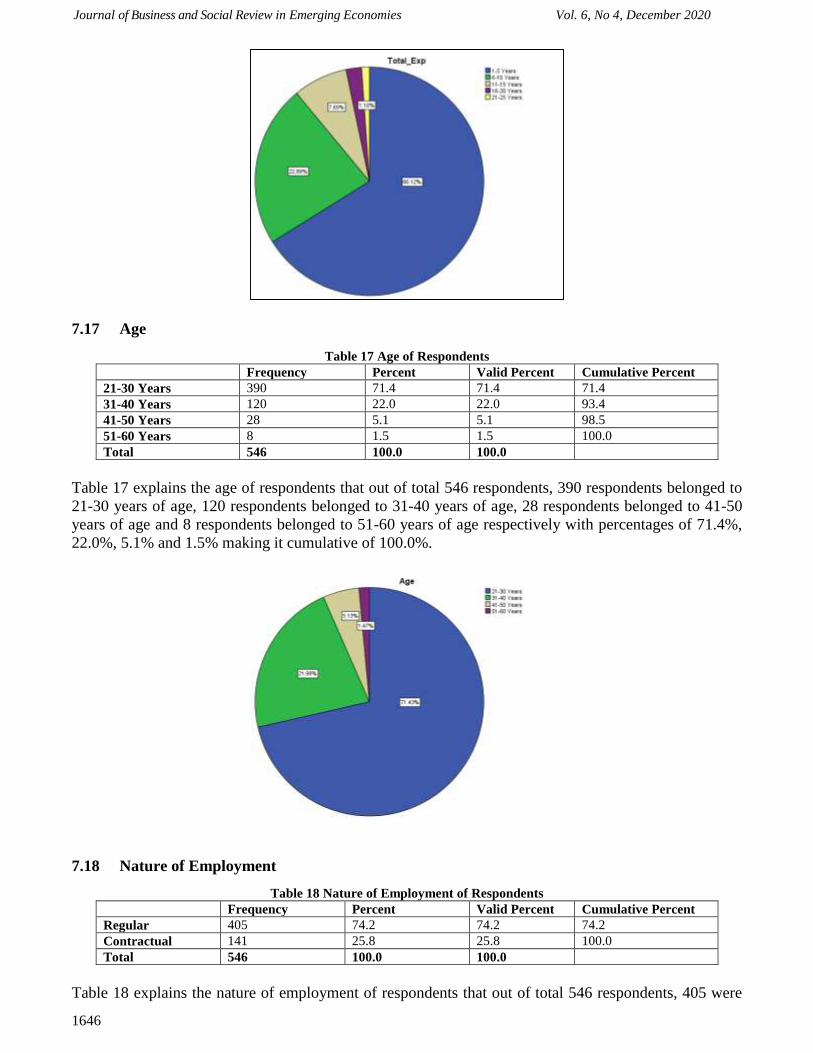
Journal of Business and Social Review in Emerging Economies Vol. 6, No 4, December 2020
1646
7.17 Age
Table 17 Age of Respondents
Frequency Percent Valid Percent Cumulative Percent
21-30 Years 390 71.4 71.4 71.4
31-40 Years 120 22.0 22.0 93.4
41-50 Years 28 5.1 5.1 98.5
51-60 Years 8 1.5 1.5 100.0
Total 546 100.0 100.0
Table 17 explains the age of respondents that out of total 546 respondents, 390 respondents belonged to
21-30 years of age, 120 respondents belonged to 31-40 years of age, 28 respondents belonged to 41-50
years of age and 8 respondents belonged to 51-60 years of age respectively with percentages of 71.4%,
22.0%, 5.1% and 1.5% making it cumulative of 100.0%.
7.18 Nature of Employment
Table 18 Nature of Employment of Respondents
Frequency Percent Valid Percent Cumulative Percent
Regular 405 74.2 74.2 74.2
Contractual 141 25.8 25.8 100.0
Total 546 100.0 100.0
Table 18 explains the nature of employment of respondents that out of total 546 respondents, 405 were

Journal of Business and Social Review in Emerging Economies Vol. 6, No 4, December 2020
1647
“Regular” and 141 respondents were “Contractual” with a percentage of 74.2%, and 25.8% making it
cumulative of 100.0%.
7.19 Education of Respondents Table 19 Education of Respondents
Frequency Percent Valid Percent Cumulative Percent
Masters/MPhil 245 44.9 44.9 44.9
Doctorate 263 48.2 48.2 93.0
Others 38 7.0 7.0 100.0
Total 546 100.0 100.0
Table 19 explains the education of respondents that out of total 546 respondents, 245 were
“Master/MPhil qualified”, 263 were Doctorate and 38 respondents had other qualification with a
percentage of 44.9%, and 48.2% and 7.0% making it cumulative of 100.0%.
7.20 Salary of Respondents Table 20 Education of Respondents
Frequency Percent Valid Percent Cumulative Percent
20000-40000 90 16.5 16.5 16.5
41000-60000 135 24.7 24.7 41.2
61000-90000 120 22.0 22.0 63.2
91000-110000 150 27.5 27.5 90.7
110000-130000 51 9.3 9.3 100.0
Total 546 100.0 100.0
Table 20 explains the experience of respondents that out of total 546 respondents, 90 had salary of
20,000 to 40,000, 135 had salary of 41,000-60,000, 120 had salary of 61,000-90,000, 150 had salary of
91,000-110,000 amd51 had salary of 110,000-130,000 with a percentage of 16.5%, 24.7%, 22.0%,
27.5% and 9.3% making it cumulative of 100.0%.
7.21 Job Status of Respondents Table 21 Job Status of Respondents
Frequency Percent Valid Percent Cumulative Percent
Top Management 15 2.7 2.7 2.7
Middle Management 162 29.7 29.7 32.4
Lower Management 154 28.2 28.2 60.6
Non-Managerial 215 39.4 39.4 100.0
Total 546 100.0 100.0

Journal of Business and Social Review in Emerging Economies Vol. 6, No 4, December 2020
1648
Table 21 explains the job status of respondents that out of total 546 respondents, 12 belongs to top
management, 162 belongs to middle management, 154 belongs to lower management and 215 belongs to
non-managerial job with a percentage of 2.7%, 29.7%, 28.2 % and 39.4 % making it cumulative of
100.0%.
Following table describes descriptive statistics including mean standard deviation, skewness and
kurtosis. We can see that the retirement plan has the highest mean value, 3.92 while deferred
compensation has the lowest mean value 2.99. All the standard deviations are approximately one.
Skewness and kurtosis is within the threshold range.
7.22 Descriptive Analysis
N Min Max Mean Std.
Deviation
Skewness Kurtosis
Statistics Std.
Error
Statistics Std.
Error
Base salary 546 1 5 3.56 1.172 -.568 .105 -.451 .209
Community association/
location
546 1 5 3.43 1.140 -.493 .105 -.512 .209
Deferred compensation/ 546 1 5 2.99 1.174 .004 .105 -.946 .209
Job Autonomy 546 1 5 3.49 1.081 -.634 .105 -.238 .209
Job responsibility 546 1 5 3.53 1.210 -.592 .105 -.559 .209
Medical, dental, life insurance 546 1 5 3.58 1.075 -.587 .105 -.207 .209
Ownership stake/ equity
interest
546 1 5 3.42 1.085 -.507 .105 -.219 .209
Performance bonus 546 1 5 3.41 1.097 -.414 .105 -.552 .209
Quality of working conditions 546 1 5 3.78 1.006 -.862 .105 .522 .209
Retirement plan 546 1 5 3.92 1.017 -.922 .105 .444 .209
Status as employer or owner 546 1 5 3.83 1.013 -.802 .105 .242 .209
Stock options 546 1 5 3.76 1.020 -.743 .105 .106 .209
Vacation /paid time off 546 1 5 3.69 1.047 -.738 .105 .234 .209
Job Title 546 1 4 2.33 .777 -.092 .105 -.562 .209
Marital Status 546 1 2 1.43 .495 .297 .105 -1.919 .209
Total Experience 546 1 5 1.49 .818 1.903 .105 3.739 .209
Age 546 1 4 1.37 .651 1.869 .105 3.304 .209
Nature of Employment 546 1 2 1.26 .438 1.108 .105 -.776 .209
Education 546 1 3 1.62 .613 .444 .105 -.655 .209
Salary 546 1 5 2.88 1.243 -.005 .105 -1.094 .209
Job Status 546 1 4 3.04 .894 -.314 .105 -1.182 .209
The following table is about Analysis of variance that describes mean differences among variables and

Journal of Business and Social Review in Emerging Economies Vol. 6, No 4, December 2020
1649
their relative significance. We can observe that there is no significant difference except for job
autonomy and retirement plan.
7.23 ANOVA Sum of
Squares DF
Mean
Square
F
Sig
Base salary Between Groups 1.560 3 .520 .377 .769
Within Groups 746.945 542 1.378
Total 748.505 545
Community association Between Groups 5.205 3 1.735 1.338 .261
Within Groups 702.787 542 1.297
Total 707.993 545
Deferred compensation Between Groups 3.120 3 1.040 .754 .521
Within Groups 747.835 542 1.380
Total 750.954 545
Job Autonomy Between Groups 10.077 3 3.359 2.906 .034
Within Groups 626.407 542 1.156
Total 636.484 545
Job responsibility Between Groups 6.763 3 2.254 1.544 .202
Within Groups 791.143 542 1.460
Total 797.907 545
Medical, life insurance Between Groups 4.562 3 1.521 1.319 .267
Within Groups 624.859 542 1.153
Total 629.421 545
Ownership stake Between Groups 6.183 3 2.061 1.758 .154
Within Groups 635.239 542 1.172
Total 641.421 545
Performance bonus Between Groups 1.757 3 .586 .485 .693
Within Groups 654.345 542 1.207
Total 656.103 545
Quality of working conditions Between Groups 7.169 3 2.390 2.379 .069
Within Groups 544.458 542 1.005
Total 551.626 545
Retirement plan Between Groups 10.726 3 3.575 3.502 .015
Within Groups 553.399 542 1.021
Total 564.125 545
Status as employer or owner Between Groups 6.699 3 2.233 2.191 .088
Within Groups 552.460 542 1.019
Total 559.159 545
Stock options Between Groups 7.313 3 2.438 2.358 .071
Within Groups 560.257 542 1.034
Total 567.570 545
Vacation /paid time off Between Groups 5.306 3 1.769 1.617 .184
Within Groups 592.616 542 1.093
Total 597.921 545
The following table describes the bivariate relationship among various variables. Most of the
relationships are strong and significantly correlated, except base salary with performance bonus,
community association with performance bonus. Likewise performance bonus with status as employer
or owner is also insignificant.
7.24 Correlation among Variables Variables (1) (2) (3) (4) (5) (6) (7) (8) (9) (10) (11) (12) (13
)
Base salary (1) 1
Community
association (2)
.740** 1
Deferred - -.057 1
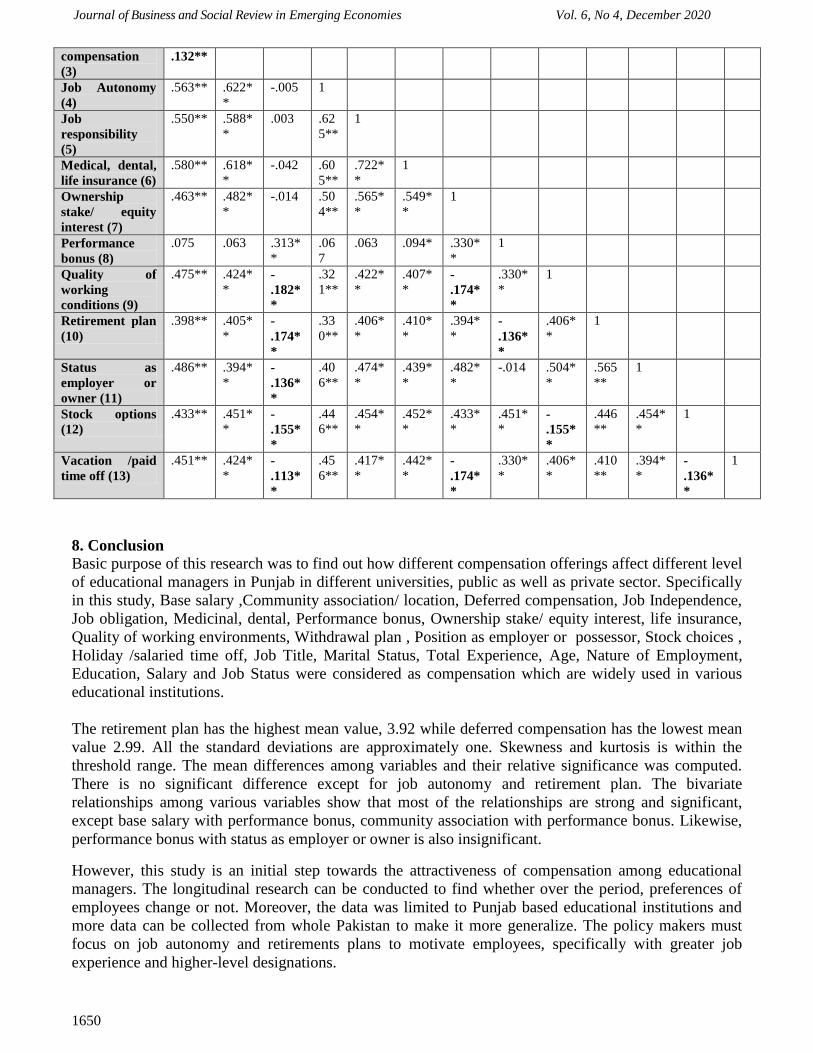
Journal of Business and Social Review in Emerging Economies Vol. 6, No 4, December 2020
1650
compensation
(3)
.132**
Job Autonomy
(4)
.563** .622*
*
-.005 1
Job
responsibility
(5)
.550** .588*
*
.003 .62
5**
1
Medical, dental,
life insurance (6)
.580** .618*
*
-.042 .60
5**
.722*
*
1
Ownership
stake/ equity
interest (7)
.463** .482*
*
-.014 .50
4**
.565*
*
.549*
*
1
Performance
bonus (8)
.075 .063 .313*
*
.06
7
.063 .094* .330*
*
1
Quality of
working
conditions (9)
.475** .424*
* -
.182*
*
.32
1**
.422*
*
.407*
* -
.174*
*
.330*
*
1
Retirement plan
(10)
.398** .405*
* -
.174*
*
.33
0**
.406*
*
.410*
*
.394*
* -
.136*
*
.406*
*
1
Status as
employer or
owner (11)
.486** .394*
* -
.136*
*
.40
6**
.474*
*
.439*
*
.482*
*
-.014 .504*
*
.565
**
1
Stock options
(12)
.433** .451*
* -
.155*
*
.44
6**
.454*
*
.452*
*
.433*
*
.451*
* -
.155*
*
.446
**
.454*
*
1
Vacation /paid
time off (13)
.451** .424*
* -
.113*
*
.45
6**
.417*
*
.442*
* -
.174*
*
.330*
*
.406*
*
.410
**
.394*
* -
.136*
*
1
8. Conclusion
Basic purpose of this research was to find out how different compensation offerings affect different level
of educational managers in Punjab in different universities, public as well as private sector. Specifically
in this study, Base salary ,Community association/ location, Deferred compensation, Job Independence,
Job obligation, Medicinal, dental, Performance bonus, Ownership stake/ equity interest, life insurance,
Quality of working environments, Withdrawal plan , Position as employer or possessor, Stock choices ,
Holiday /salaried time off, Job Title, Marital Status, Total Experience, Age, Nature of Employment,
Education, Salary and Job Status were considered as compensation which are widely used in various
educational institutions.
The retirement plan has the highest mean value, 3.92 while deferred compensation has the lowest mean
value 2.99. All the standard deviations are approximately one. Skewness and kurtosis is within the
threshold range. The mean differences among variables and their relative significance was computed.
There is no significant difference except for job autonomy and retirement plan. The bivariate
relationships among various variables show that most of the relationships are strong and significant,
except base salary with performance bonus, community association with performance bonus. Likewise,
performance bonus with status as employer or owner is also insignificant.
However, this study is an initial step towards the attractiveness of compensation among educational
managers. The longitudinal research can be conducted to find whether over the period, preferences of
employees change or not. Moreover, the data was limited to Punjab based educational institutions and
more data can be collected from whole Pakistan to make it more generalize. The policy makers must
focus on job autonomy and retirements plans to motivate employees, specifically with greater job
experience and higher-level designations.

Journal of Business and Social Review in Emerging Economies Vol. 6, No 4, December 2020
1651
9. Limitations and Future Guidelines
This study is not free of limitations like other studies. The nature of the study is cross sectional while the
choice of employees may change over a period. So, longitudinal study may produce different results. As
the sample drawn was related to a developing country, sample from developed countries may differ in
the choice of compensation offerings due to different economic conditions and cultural choices. Its
generalizability may also be increased. It is recommended that future research should emphasis on the
role of age, gender and culture in the compensation offerings. Executive compensation should be
considered separately from general offerings. Moreover, pay for performance can be used as moderating
or contingent effect to see the patterns more clearly.
References
Dibble, Suzanne, (1999), Keeping Your Valuable Employees, New York, Wiley.
Ermel, Lauren & Bohl, Don, (1997), Responding to a Tight Labor Market: Using Incentives to Attract
and Retain Workers, Compensation and Benefits review, America Management Association
International, 29 (6).
Lawler, Edward E., (1981), Determining Total Compensation: Strategic Issues, Pay and Organization
Development, Reading, MA. Addison-Wesley.
Lawler, Edward E., (1987), The Design of Effective Reward Systems, Englewood Cliffs, NJ, Prentice
Hall.
Lazear, Edward, (1999) Personnel Economics: Past Lessons and Future Directions, Journal of Labor
Economics, 17 (2).
Mcfillen, James, Riegel, Carl & Enz, Cathy, (1986, Nov.), Why restaurant managers Qui (and how to
keep them), The Cornell Hotel and Restaurant Administration Quarterly.
Mobley, William H., (1982), Employee Turnover: Causes, Consequences, and Control Reading, MA.,
Addison–Wesley.
Muller, Christopher, C., (1999), The Business of Restaurants: 2001 and Beyond, Hospitality
Management, 18 (4).
Roseman, Edward, (1981), Managing Employee Turnover: A Positive Approach, New York,
AMACOM.
Steers, Richard, M., & Porter, Lyman, (1991) Motivation and Work Behavior, New York, McGraw Hill.
Wasmuth, William J. & Davis, Stanley W., (1983, May), Managing Employee Turnover: Why
Employees Leave, The Cornell Hotel and Restaurant Administration Quarterly.
Woods, Robert H., (1999), Predicting is Difficult, Especially About the Future: Human Resources in the
New Millenium, Hospitality Management, 18 (4).

Journal of Business and Social Review in Emerging Economies Vol. 6, No 4, December 2020
1652

Journal of Business and Social Review in Emerging Economies Vol. 6, No 4, December 2020
1653
Volume and Issues Obtainable at Center for Sustainability Research and Consultancy
Journal of Business and Social Review in Emerging Economies ISSN: 2519-089X (E): 2519-0326
Volume 6: No. 4, December 2020
Journal homepage: www.publishing.globalcsrc.org/jbsee
The Development of a Questionnaire to Measure the Institutional Performance in
Higher Education Institutions
1Gulshan Fatima Alvi, 2Nazma Bibi, 3Mahwish Safder,
1Assistant Professor Lahore Leads University, Lahore, Pakistan, [email protected] 2Assistant Professor Govt Degree College (W) Kot Khawaja Saeed, Lahore, Pakistan,
[email protected] 3Assistant Professor Lahore Leads University, Lahore, Pakistan, [email protected]
ARTICLE DETAILS ABSTRACT History Revised format: November 2020 Available Online: December 2020
The objective of the study was to develop a questionnaire named IPQ
(Institutional Performance Questionnaire) that measures the
institutional performance of higher educational institutions. The scale
comprised 11 subscales: Mission Statement and Goal (5 items),
Planning and Evaluation (3 items), Organization & Governance, (3
items), Integrity (3 items), Faculty (3 items), Students (2 items),
Institutional Resources (3 items), Academic Programs and Curricula
(3 items), Public Disclosure and Transparency (2 items), Assessment
& Quality Assurance (8 items), and Student Support Services (3
items). In total, 25 faculty members of the universities were selected
by multistage stratified sampling, response to the questionnaire. The
questionnaire was pilot tested and the Cronbach's alpha for the entire
questionnaire was .951; for each subscale, alpha ranged from .623 to
0.823. Exploratory factor analysis was utilized to establish the
construct validity of institutional performance in higher education
institutions Findings of the study confirmed the validity and reliability
of the IPQ (Institutional Performance Questionnaire).
© 2020 Center for Sustainability Research and Consultancy Pakistan under a
Creative Commons Attribution-NonCommercial-ShareAlike 4.0
Keywords Development, Institutional
Performance Questionnaire,
Standards, , Higher
Education Institutions
JEL Classification
M0, M1
Corresponding author’s email address: [email protected]
Recommended citation: Alvi, G. F., Bibi, N. & Safder, M. (2020). The Development of a
Questionnaire to Measure the Institutional Performance in Higher Education Institutions. Journal of
Business and Social Review in Emerging Economies, 6(4), 1653-1663
1. Introduction
Universities impact the advancement of nations through their commitment to improved innovation,
information move, advancing national solidarity, and supporting change and expanding productivity
(Mugizi, 2018).Within the context of the national development, higher education institutions (HEIs) are
the most important milestones of the knowledge-based economy (Secundo, Margherita, Elia, &
Passionate, 2010). HEIs are the underpinning organizations of the rational capacity building. Moreover,
these institutions always seek for policy reforms that target at the progression of the entire education
system (Chapman, 2009).
Hedin (2009) asserts that higher education institutions have been endeavoring to purposeful incredible

Journal of Business and Social Review in Emerging Economies Vol. 6, No 4, December 2020
1654
performance towards attaining international measures of education. HEIs are considered as the main
instruments for the national development.
In contemporary times, higher education institutions have a key role for the sustenance of any society,
likewise the quality of education, modern trends of curriculum, competent faculty members and
manpower resources are viewed as most imperative components for the development of higher
education institutions (Rena, 2010). Quality of education transforms the traditional society into a modern
society and efficient institutions are the major determinants for meeting the demands of the advance
technologies in modern society. Measurement of institutional performance is a tool for the evaluation of
institutions so that they may become efficient. With the passage of the time, researchers concentrated on
the measurement of the institutional performance, so the initiative may take to achieve the required
objectives of the efficient institutions.
In Pakistan,HEC (Higher Education Commission) is that body which is considered as a liable for
consolidation and development of public and private sector universities. HEC was inaugurated in 2003
for the sake of quality assurance of educational institutions and also placed some standards for full-
fledged Monitoring and performance evaluation of higher education institutions. Higher Education
Commission consigns its aims and objectives according to the international expansion and practice.
With the help of England Association of Schools and Colleges in 2005, and the middle states
commission in 2006, the crucial arrangements were taken and eleven standards of accreditation were
established by this commission to improve the performance of HEIs.
According to Batool, Qureshi, and Raouf (2010), the standards established by HEC, have substantial
place in the global ranking of the higher education institutions. These standards aim to prospect the
development and evaluate the effectiveness of higher educational institutions. Therefore, there is a need
to develop a more comprehensive questionnaire that may base on performance evaluation standards of
higher education institutions recommended by HEC (Higher Education Commission).
2. Literature Review
Institutional Performance (IP) indicates the hierarchical ability of an institution to achieve its objectives
like gainfulness, solid monetary outcomes, a sizeable piece of the pie, quality items, consumer loyalty,
and long term endurance (Sawalha, 2013). Institutional performance of higher education institutions
subsists on a mission. All the tactics and measures are considered to get the successful achievement of
the mission statement and objectives to the extent that establishes its productivity, usefulness with
quality and excellence (Lambinicio, 2016).
Institutional performance can be measured through the availability of human and financial resources in
order to attain the objectives. Especially, in profit-making organizations (Greenberg, 2011; Abubakar,
2017; Hilman, Kamyabi & Devi, 2012).
During the examination of prior research, Carton (2004) focused on the institutional performance
measurement and developed a questionnaire. The domain of institutional financial performance was
empirically established and this measure also provided more relevant information about profitability,
growth, cash flow, leverage and the efficiency of the institution. Validity and reliability of the
constructs and measures were finally tested, and the questionnaire was also statistically evaluated. The
nature of that research was exploratory.
Antony and Bhattacharyya (2010) empirically developed a model for the measurement of
institutional performance and institutional excellence. This model significantly
contributes to distinguish the excellence level from the performance level. Managers
of small and medium enterprises can use this model to evaluate the performance and
excellence in segments.

Journal of Business and Social Review in Emerging Economies Vol. 6, No 4, December 2020
1655
PGF Consultants Inc. was ordered by the Forum of Federations to direct a developmental (mid-term) of
Institutional Performance Evaluation, as required by its Grant Agreement with the Government of
Canada 2005-2011. The reason for the evaluation was to survey the Forum's utilization of the funds and
its prescribed results, efficiency, and effectiveness of the finance strategies (Meekison, 2008).
Chun and Rainey (2005) developed theoretically and methodologically more significant, four procedures
of institutional performances those are, administrative usefulness, client service alignment, output, and
work excellence. These measures are related to objective vagueness of U.S. federal government
agencies' performance.
Researchers prepared two larger reports on the agency’s performance with the help of these measures
that had the valid value of Cronbach’s alpha series of .73 to .74 Brewer and Selden (2000) developed a
model to evaluate institutional performance and proposed theoretical dimensions for it. They also
classified the constructs to help in predicting the institutional performance that are managerial
philosophy, human wealth and ability of leadership and control of individual-level factors (individual
performance, task motivation, structure of work/task, public service motivation, task motivation). The
model has good reliability with the Cronbach’s alpha (.70 to .94).
Crucke and Decramer (2016) developed as a self-assessment tool to evaluate the social enterprise. They
selected five performance domains named: financial performance, atmosphere performance, and public
performance, human performance that are supporting in decision-making. Different members of the
enterprise can use this tool easily. This tool is being tried to fill the gap through a most suitable
instrument for the inner and exterior assessment of non-financial output of different groups in public
enterprises. The results specified strong scale reliability 0.70 to 0.93.
The researchers measured the performance in the light of academic results. Different trends of
development also used for performance evaluation. Strong theoretical rationale of performance was also
measured as important construct for management related researches (Richard, Devinney, Yip, &
Johnson, 2009; Liao & Wu, 2009; Kirby, 2005).
Considering the above researches, sufficient information about the performance measurement scales and
questionnaire have been described.
All these measurements are the fundamentals for future development in different institution, but in
Pakistan HEC (Higher Education Commission) is systematically executing the reforms for the
improvement of performance in higher education institutions. Performance evaluations Standards are the
primary step for the task accomplishment.
The objective of this study is to develop a questionnaire for the measurement of institutional
performance in higher education institutions, so that the anticipated certification to the quality provisions
in higher education may be achieved. Moreover, these are the essentials for the international visibility
and regional development of the country.
3. Objectives
1. To develop a questionnaire to measure the institutional performance in higher Education
Institutions
2. To develop the institutional performance evaluation system in higher
education institutions under the eleven standards of accreditation recommended
by HEC (Higher Education Commission).
4. Conceptual Framework

Journal of Business and Social Review in Emerging Economies Vol. 6, No 4, December 2020
1656
This study encompassed various features that were perceived in the conceptual framework of the study.
The institutional performance in higher education institutions was estimated with the support of eleven
standards of
accreditation by NEASC (England Association of Schools and Colleges, 2005) for the higher education
institutions namely, Mission Statement and Goal, Planning and Evaluation, Organization and
Governance, Integrity Faculty, Students, Institutional Resources, Academic Programs and Curricula,
Public Disclosure & Transparency, Assessment & Quality Assurance, and Student Support Services.
5. Methodology
The scholars developed the IPQ (Institutional Performance Questionnaire) on the basis of these
standards provided by Higher Education Commission.
Standard 1: Mission Statement and Goals Standard
2: Planning and Evaluation Standard 3: Organization
and Governance Standard 4: Integrity
Standard 5: Faculty
Standard 6: Students
Standard 7: Institutional Resources
Standard 8: Academic Programs and Curricula
Standard 9: Public Disclosure and Transparency
Figure 1.1 Conceptual frameworks for developing a questionnaire to measure the institutional
performance in higher education institutions.
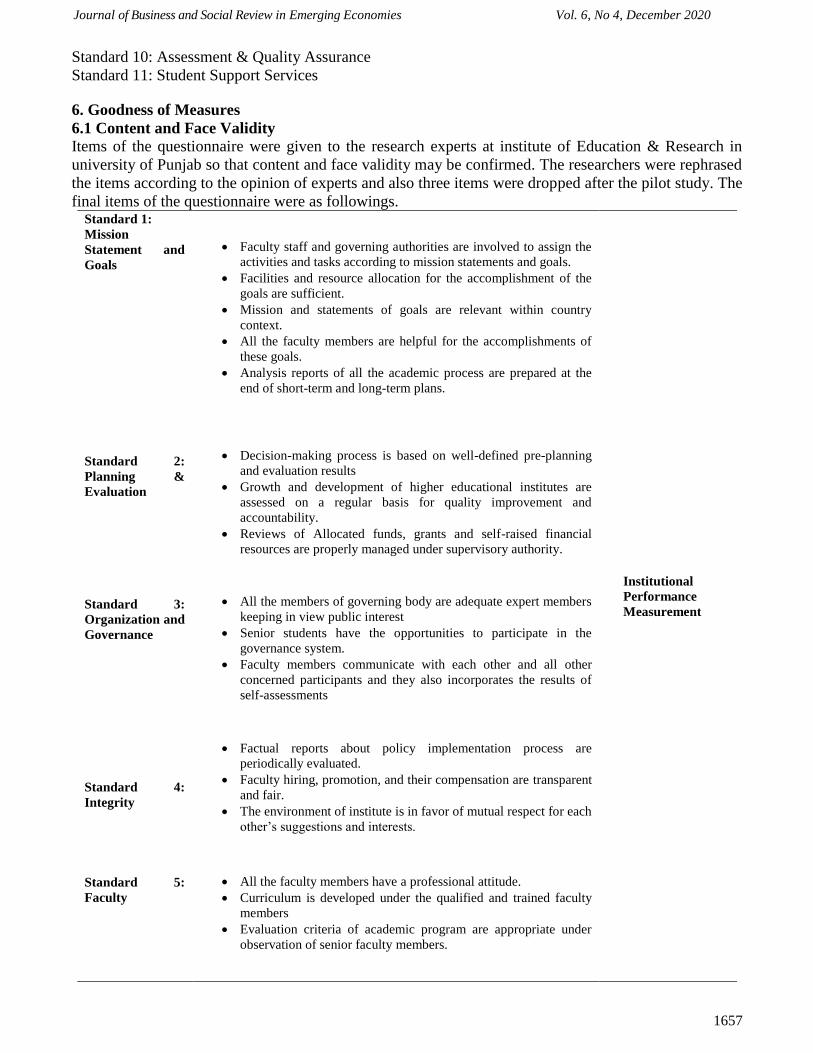
Journal of Business and Social Review in Emerging Economies Vol. 6, No 4, December 2020
1657
Standard 10: Assessment & Quality Assurance
Standard 11: Student Support Services
6. Goodness of Measures
6.1 Content and Face Validity
Items of the questionnaire were given to the research experts at institute of Education & Research in
university of Punjab so that content and face validity may be confirmed. The researchers were rephrased
the items according to the opinion of experts and also three items were dropped after the pilot study. The
final items of the questionnaire were as followings. Standard 1:
Mission
Statement and
Goals
Faculty staff and governing authorities are involved to assign the
activities and tasks according to mission statements and goals.
Facilities and resource allocation for the accomplishment of the
goals are sufficient.
Mission and statements of goals are relevant within country
context.
All the faculty members are helpful for the accomplishments of
these goals.
Analysis reports of all the academic process are prepared at the
end of short-term and long-term plans.
Institutional
Performance
Measurement
Standard 2:
Planning &
Evaluation
Decision-making process is based on well-defined pre-planning
and evaluation results
Growth and development of higher educational institutes are
assessed on a regular basis for quality improvement and
accountability.
Reviews of Allocated funds, grants and self-raised financial
resources are properly managed under supervisory authority.
Standard 3:
Organization and
Governance
All the members of governing body are adequate expert members
keeping in view public interest
Senior students have the opportunities to participate in the
governance system.
Faculty members communicate with each other and all other
concerned participants and they also incorporates the results of
self-assessments
Standard 4:
Integrity
Factual reports about policy implementation process are
periodically evaluated.
Faculty hiring, promotion, and their compensation are transparent
and fair.
The environment of institute is in favor of mutual respect for each
other’s suggestions and interests.
Standard 5:
Faculty
All the faculty members have a professional attitude.
Curriculum is developed under the qualified and trained faculty
members
Evaluation criteria of academic program are appropriate under
observation of senior faculty members.

Journal of Business and Social Review in Emerging Economies Vol. 6, No 4, December 2020
1658
Standard 6:
Students
Admission policies are annually reviewed and changed according
to the demand of the current era.
Support program is developed for low achiever students to
achieve the expected learning outcomes of present educational
policy of higher education.
Standard 7:
Institutional
Resources
Resources are appropriately allocated according to the
requirements of faculty and students relevant the execution of
institutional goals.
Strategies are well developed to measure the level of utilization
of institutional resources.
Physical infrastructure and facilities are the part of the
Comprehensive master plan and life-cycle management plan
including in the policy of higher education.
Institutional
Performance
Measurement
Standard 8:
Academic
Programs and
Curricula
Faculty members are restricted to follow the course outline and
they also plan the lesson before delivering the lectures.
Curricula and syllabus content are correlated with institutional
goals.
The academic program quality standards are compatible with
international purposes of student’s survival in the society.
Standard 9:
Public Disclosure
and
Transparency
Inquiries are transparently arranged about institutional program.
Reports are published on monthly or quarterly basis to inform all
the stakeholders.
Standard 10:
Assessment &
Quality
Assurance
Institutional performance is assessed in terms of correlated goals
and missions.
This assessment review is used for further improvement in
academic program.
Administration and faculty members coordinate and facilitate to
each other in terms of required goals and objectives of higher
education policy
Quality Enhancement Cell is working properly to accelerate the
best faculty, administrative members and students.
Quality Enhancement Cell is working for capacity building and
training sessions of faculty members.
Quality Enhancement Cell is preparing PQAR (program quality
assurance report) for continuous improvement.
Administrative, technical and financial support is providing by
higher authorities for quality assurance.
Quality and assessment survey performs are distributed to faculty
members, students and other stakeholders in the institution.

Journal of Business and Social Review in Emerging Economies Vol. 6, No 4, December 2020
1659
Standard 11:
Student Support
Services
Guidance and counseling services of students are adequately
processing.
Athletics’ programs are arranging regularly for consolidating the
energies of students towards a beneficial competition.
Students’ complaints and grievances’ reports are using for further
benefits in favor of those students
Research instrument, Institutional Performance Questionnaire was pilot tested. Firstly two universities,
Government College University, Lahore (public university) and University of Central Punjab, Lahore
(private university) were randomly selected for this purpose. After the selection of the universities,
Institutional Performance Questionnaire was distributed to the Deans of the Faculties and Heads of the
Quality Enhancement Cells from both universities, and then also disseminated to the Heads of the
Departments of the universities.
7. Pilot test for Assessing Institutional Performance Questionnaire
Table 1.2 Item statistics and item total correlation for assessing institutional Performance Questionnaire
Item
Number
Mean
(Difficulty
Level)
Item-total Correlation
(Discrimination Index)
Item
Number
Mean
(Difficulty
Level)
Item-total
Correlation
(Discrimination
Index)
IPQ 1 3.630 .621 IPQ 20 3.620 .341
IPQ 2 3.580 .487 IPQ 21 3.760 .514
IPQ 3 3.780 .812 IPQ 22 3.700 .495
IPQ 4 3.740 .247 IPQ 23 3.780 .418
IPQ 5 3.660 .405 IPQ 24 3.860 .477
IPQ 6 3.880 .430 IPQ 25 3.860 .677
IPQ 7 4.150 .258 IPQ 26 3.780 .647
IPQ 8 3.820 .543 IPQ 27 3.620 .720
IPQ 9 3.580 .802 IPQ 28 3.780 .643
IPQ 10 3.100 .520 IPQ 29 3.740 .669
IPQ 11 3.280 .570 IPQ 30 3.660 .624
IPQ 12 3.620 .718 IPQ 31 3.540 .637
IPQ 13 3.630 .602 IPQ 32 3.740 .349
IPQ 14 3.660 .751 IPQ 33 3.540 .533
IPQ 15 3.700 .690 IPQ 34 3.540 .520
IPQ 16 4.040 .509 IPQ 35 3.780 .643
IPQ 17 3.660 .741 IPQ 36 3.860 .667
IPQ 18 3.620 .436 IPQ 37 3.840 .381
IPQ 19 3.380 .672 IPQ 38 3.870 .532
Table 1.3 Scales Statistics
Mean Std. Deviation Cronbach’s Alpha Reliability Coefficient
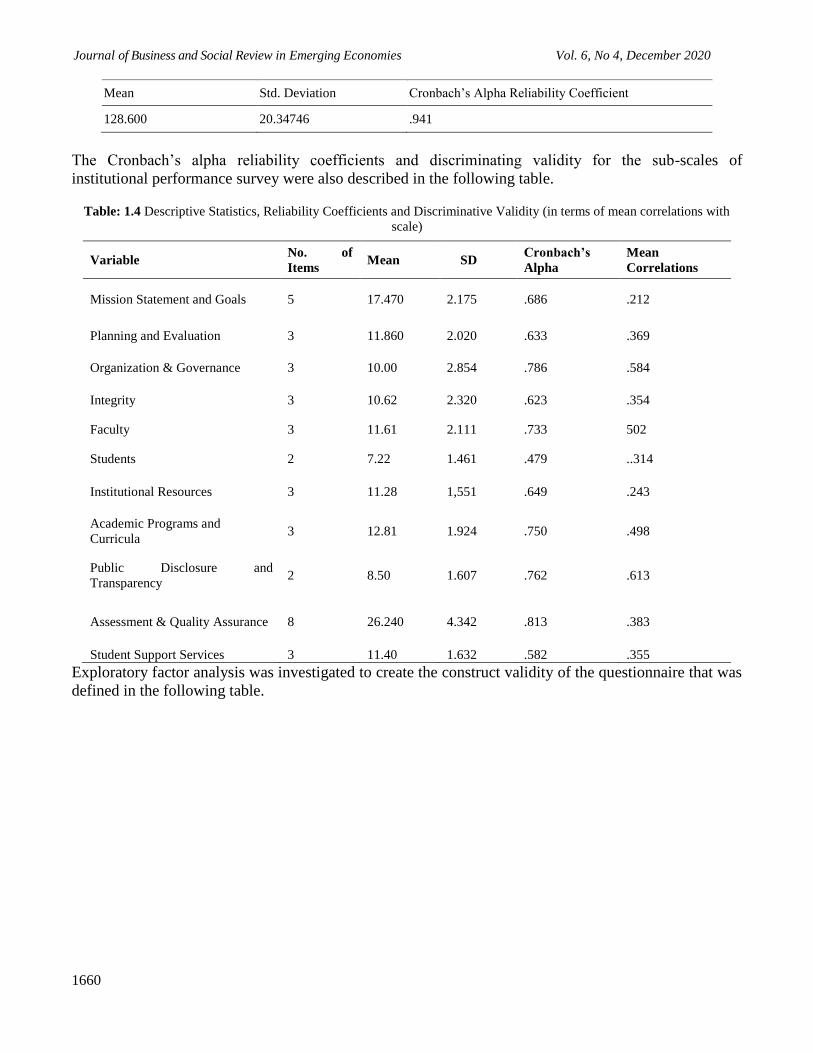
Journal of Business and Social Review in Emerging Economies Vol. 6, No 4, December 2020
1660
Mean Std. Deviation Cronbach’s Alpha Reliability Coefficient
128.600 20.34746 .941
The Cronbach’s alpha reliability coefficients and discriminating validity for the sub-scales of
institutional performance survey were also described in the following table.
Table: 1.4 Descriptive Statistics, Reliability Coefficients and Discriminative Validity (in terms of mean correlations with
scale)
Exploratory factor analysis was investigated to create the construct validity of the questionnaire that was
defined in the following table.
Variable No. of
Items Mean SD
Cronbach’s
Alpha
Mean
Correlations
Mission Statement and Goals 5 17.470 2.175 .686 .212
Planning and Evaluation 3 11.860 2.020 .633 .369
Organization & Governance 3 10.00 2.854 .786 .584
Integrity 3 10.62 2.320 .623 .354
Faculty 3 11.61 2.111 .733 502
Students 2 7.22 1.461 .479 ..314
Institutional Resources 3 11.28 1,551 .649 .243
Academic Programs and
Curricula 3 12.81 1.924 .750 .498
Public Disclosure and
Transparency 2 8.50 1.607 .762 .613
Assessment & Quality Assurance 8 26.240 4.342 .813 .383
Student Support Services 3 11.40 1.632 .582 .355
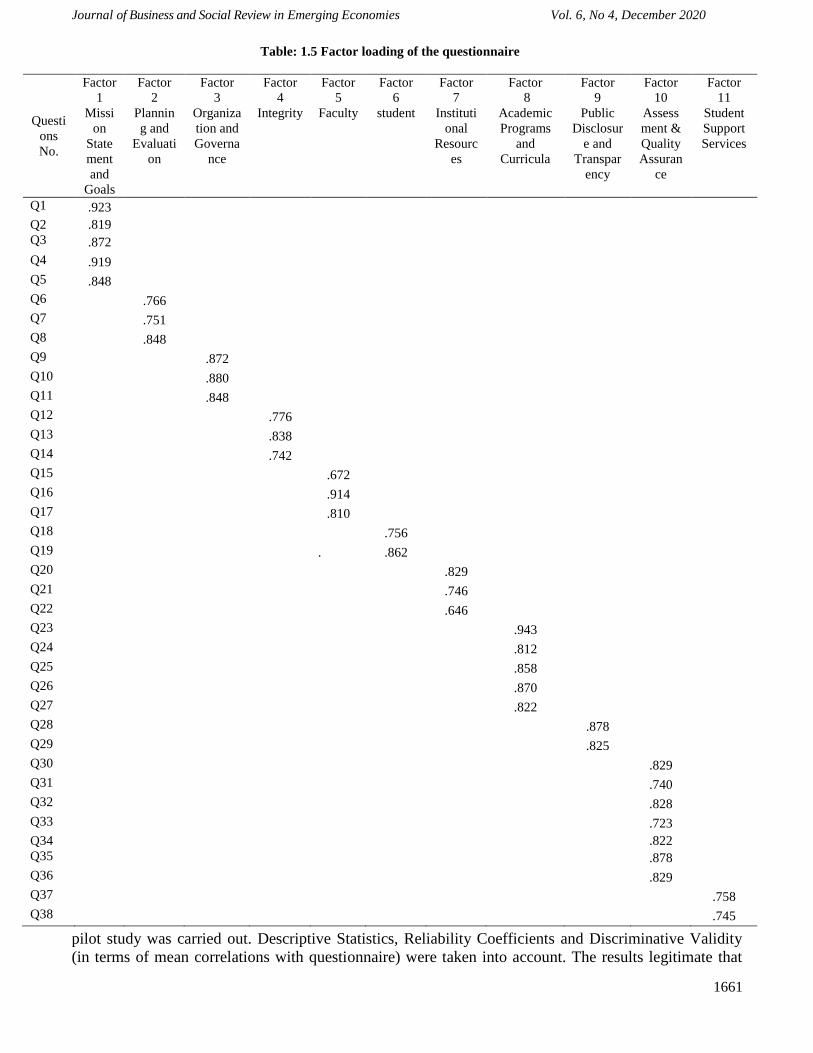
Journal of Business and Social Review in Emerging Economies Vol. 6, No 4, December 2020
1661
Conclusions
The results of this study concluded that Institutional Performance Questionnaire has high
reliability and evaluates a good construct for the measurement of institutional performance in higher
education institutions single construct of performance measures in academia. The Institutional
Performance Questionnaire was validated with the visions of the Deans of the Faculties and Heads of the
Quality Enhancement Cells and Heads of the Departments from the universities that were selected as the
sample of the study.
It was also concluded through the pilot study that the instrument is fit for the performance
measurement of higher education institutions.
Consequently this research study documented an empirically reliable and valid instrument to
measure the institutional performance in higher education institutions. Moreover factor loading of all the
items were exceeding of 0.7.Therfore, Institutional Performance Questionnaire has recognized to be a
good parameter for measuring institutional performance in higher educational institutions
Discussion
The researchers conceptualized the framework of questionnaire development that was based on
the eleven standards of accreditation. These standards have been accepted with the assistance of England
Association of Schools and Colleges, 2005 and the Higher Education Commission of the Middle States,
2006. These performance evaluation standards concentrated on the imminent growth and efficiency of
higher education institutions. The Institutional Performance Questionnaire has 11 subscales. Firstly, the
pilot study was carried out. Descriptive Statistics, Reliability Coefficients and Discriminative Validity
(in terms of mean correlations with questionnaire) were taken into account. The results legitimate that
Table: 1.5 Factor loading of the questionnaire
Questi
ons
No.
Factor
1
Missi
on
State
ment
and
Goals
Factor
2
Plannin
g and
Evaluati
on
Factor
3
Organiza
tion and
Governa
nce
Factor
4
Integrity
Factor
5
Faculty
Factor
6
student
Factor
7
Instituti
onal
Resourc
es
Factor
8
Academic
Programs
and
Curricula
Factor
9
Public
Disclosur
e and
Transpar
ency
Factor
10
Assess
ment &
Quality
Assuran
ce
Factor
11
Student
Support
Services
Q1 .923
Q2 .819
Q3 .872
Q4 .919
Q5 .848
Q6 .766
Q7 .751
Q8 .848
Q9 .872
Q10 .880
Q11 .848
Q12 .776
Q13 .838
Q14 .742
Q15 .672
Q16 .914
Q17 .810
Q18 .756
Q19 . .862
Q20 .829
Q21 .746
Q22 .646
Q23 .943
Q24 .812
Q25 .858
Q26 .870
Q27 .822
Q28 .878
Q29 .825
Q30 .829
Q31 .740
Q32 .828
Q33 .723
Q34 .822
Q35 .878
Q36 .829
Q37 .758
Q38 .745

Journal of Business and Social Review in Emerging Economies Vol. 6, No 4, December 2020
1662
Institutional Performance Questionnaire and its subscales have good criterion-related validity and also
construct validity.
The study revealed the scale Cronbach’s Alpha Reliability Coefficient value was .951 and the subscales
alpha ranged from .623 to 0.823. Exploratory factor analysis was applied to ensure the construct validity
of instrument.
As others measured described in different studies (Brewer & Selden 2000; Carton 2004; Chun & Rainey
2005; Meekison, 2008; Crucke & Decramer, 2016) all the measures had been systematically conducted
with good construct and criterion validity. The researchers conceptualized different constructs like
Organizational Culture, Human Capital and Capacity, Leadership and Supervision and Individual-Level
Factors (Structure of Task/Work, Task Motivation, Public Service Motivation, and Individual
Performance), managerial effectiveness, customer service orientation, productivity, and work quality.
The alpha value of all measures ranged from 0.70 to .0.93.
The Institutional Performance Questionnaire was significantly developed for the higher education
institutions according to the international standard of accreditation in higher education institutions that
portrayed also the strength of the HEC (higher education commission). Main focus of this questionnaire
was to evaluate the performance of higher education institutions because HEIs are the spinal column and
prosperity of a nation. This study provides a conceptual framework also that how the performance of
higher education institutions can be improved. The researchers endeavored to cover all the performance
indicators and provisions that made a considerable contribution by analyzing mission, planning and
evaluation, assessment and quality assurance etc. Statistical results of the study authenticated that this
questionnaire can be used for the performance evaluation of the universities because the well awareness
of change leads towards betterments and provide best educational opportunities.
8. Practical Implications
This study provides a strategy for questionnaire design to measure the institutional performance in
higher education institutions. This questionnaire is based on the eleven standards of accreditation that
brings out the starting point for educational management towards rational initiatives. It may also helpful
to fill the gaps between development and implementations of policy reforms in higher education
institutions. This research also represents a resourceful contribution to the expansion of international
performance evaluation standards especially for developing countries.
References
Antony, J. and Bhattacharyya, S. (2010), "Measuring organizational performance and organizational
excellence of SMEs – Part 2: an empirical study on SMEs in India", Measuring Business
Excellence, Vol. 14 No. 3, pp. 42-52. https://doi.org/10.1108/13683041011074209
Batool, Z., Qureshi, R., & Raouf, A. (2010). Performance evaluation standards for the HEIs.
Islamabad: Higher Education Commission.
Brewer, G. and Selden, S. (2000). Why Elephants Gallop: Assessing and Predicting Organizational
Performance in Federal Agencies. Journal of Public Administration Research and Theory, 10(4),
pp.685-712
Carton, R. (2004). Measuring Organizational Performance: An exploratory study. Ph.D. University of
Georgia.
Chapman, D.W. (2009), Teacher Motivation: Incentives and working conditions, policy brief no. 9,
Secondary teachers in Southeast Asia Project, World Bank, Washington, DC.
Chun, Y. & Rainey, H. (2005). Goal Ambiguity and Organizational Performance in U.S. Federal
Agencies. Journal of Public Administration Research and Theory, 15(4), pp.529- 557.
Crucke, S. & Decramer, A. (2016). The Development of a Measurement Instrument for the
Organizational Performance of Social Enterprises. Sustainability, 8(2), p.161.
Greenberg, J. (2011). Behavior in organizations (10th ed.). Upper Saddle River, NJ: Prentice Hall
Hedin,S. ( 2009).Higher education institutions as drivers of regional development in the Nordic
Journal of Business and Social Review in Emerging Economies Vol. 6, No 4, December 2020
1663
countries. Nordegio Working Paper, Stockholm, Sweden.
Hilman, H. (2009). Relationship of competitive strategy, strategic flexibility and sourcing strategy on
organizational performance (Unpublished PhD thesis). Universiti Putra Malaysia, Malaysia.
Kamyabi, Y., & Devi, S. (2012). The impact of advisory services on Iranian SME performance: An
empirical investigation of the role of professional accountants. South African Journal of Business
Management, 43, 61-72.
Kirby, J. (2005, July-August). Toward a theory of high performance. Harvard Business Review, 83(7),
30-39.
Lambinicio, J. (2016). Organizational performance of higher education institutions in Pangasinan,
Third Asia Pacific Conference on Advanced Research, Melbourne.
Liao, S. H., & Wu, C. C. (2009). The relationship among knowledge management, organizational
learning, and organizational performance. International Journal of Business and Management,
4(4), 64-76.
Meekison, P. (2008). Organizational Performance Evaluation. Ottawa, Ontario: PGF Consultants
Inc.
Rena, Ravinder. (2010). Emerging trends of higher education in developing countries.
Scientific Annals of the Alexandru Ioan Cuza University of Iasi: Economic Sciences Series.
vol. 2010SE, 301-316.
Richard, P. J., Devinney, T. M., Yip, G. S., & Johnson, G. (2009). Measuring organizational
performance: Towards methodological best practice. Journal of Management, 35, 718-804.

Journal of Business and Social Review in Emerging Economies Vol. 6, No 4, December 2020
1664
Volume and Issues Obtainable at Center for Sustainability Research and Consultancy
Journal of Business and Social Review in Emerging Economies ISSN: 2519-089X (E): 2519-0326
Volume 6: No. 4, December 2020
Journal homepage: www.publishing.globalcsrc.org/jbsee
Journal of Business and Social Review in Emerging Economies Vol. 6, No 4, December 2020
1665
University Readiness and University Adjustment: Lived Experience of First-
generation University Students
1Waqas Ahmad, 2Sadaf Mahmood, 3Muhammad Shabbir, 4Nazia Malik 1PhD Scholar in Sociology, Department of Sociology, GC University Faisalabad, Pakistan,
[email protected] 2Assistant Professor, Department of Sociology, GC University Faisalabad, Pakistan,
[email protected] 3Assistant Professor, Department of Sociology, GC University Faisalabad, Pakistan,
[email protected] 4Assistant Professor, Department of Sociology, GC University Faisalabad, Pakistan,
ARTICLE DETAILS ABSTRACT History Revised format: November 2020 Available Online: December 2020
The study purpose is to explore the relationship between university
readiness and university adjustment of first-generation students.
Students enter university with dreams and motivation after entering
university the first challenge is to adjust in the university
environment. University readiness directly linked and influenced the
university adjustment of the students. Thus, the major objectives of
the research are: to know the university readiness of first-generation
university students and to access how first-generation university
students in step to the university life. For the purpose of data
collection, a self-administered well-structured questionnaire was
developed and used. The COVID-19 pandemic restricted the
movement of the individuals and the academic institutions remained
close that’s why the method of online survey was adopted to collect
data in the second half of year 2020. In total, 405 first-generation
university students’ responses were collected. Results show that first-
generation students were less prepared to enter the university. The
researcher found a significant relationship between university
readiness and university adjustment. It was also found that majority
of the first-generation university students were less prepared to enter
the university and feel themselves miss adjustment with university
environment.
© 2020 Center for Sustainability Research and Consultancy Pakistan under
a Creative Commons Attribution-NonCommercial-ShareAlike 4.0
Keywords First-generation students,
University readiness,
University adjustment,
Environment
JEL Classification
M10, M14
Corresponding author’s email address: [email protected]
Recommended citation: Ahmad, W., Mahmood, S., Shabbir, M. & Malik, N. (2020). University
Readiness and University Adjustment: Lived Experience of First-generation University Students.
Journal of Business and Social Review in Emerging Economies, 6(4), 1665-1672
1. Introduction
A higher degree is a dire need for economic security in the era of global economy. World is rapidly
shifting towards knowledge-based occupations where earning opportunities enhanced through
educational attainment (Roderick et al., 2009). Worldwide enrollments in higher education increased 0.8
Journal of Business and Social Review in Emerging Economies Vol. 6, No 4, December 2020
1666
to 4.6 from late 1970s to 2015 (Organization for Economic Cooperation and Development, 2017). After
joining university or higher education the first important thing is to adjust and retain in the university
environment. Adjustment is a psychological procedure of coping with, adapting to and managing the
challenges, problems and demands of daily life (Chong et al, 2014; Nasir & Maliha, 2011).
Students’ adjustment with university environment is an imperative factor in forecasting outcomes and
their future accomplishments. Students enter first time in university face problems to adjust in the
university environment. They are passing through the adjustment phase in their first year of joining
university. After the first semester it is the vital period in deciding retention in university (Clinciu,
2012). University readiness defined as the ability to college or high school student to succeed in the hunt
graduate or higher degree. For university readiness they need to understand the process of joining
university and associated things with university education like how to deal and manage with financial
issues, how to see living/ residence matters, and adjust with university environment (Conley, 2020).
Students join universities for social, personal and intellectual growth. They expect it will enhance their
personal and professional skills, social status, and employment opportunities; and parallel to this it will
make them independent. They imagine a life free of parental control, full of joy and interest with novel
activities. Although after joining the university many of their positive expectations and feelings
converted into negative. In the first years of their study many challenges are in the way of their
adjustment. The reality of students’ university experience is stressful, harsher, than their forecasting
(Bruce et al,. 1986).
There is no any clear definition of University readiness because the concept varies due to emphasis on
contrary combination and criteria thence (Conley, 2020). According to Baker et al., (2005) university
readiness is the combination of three components: first is the university/College awareness
(guardian/parent and students’ information about the process and planning aspects of university
attendance), second is eligibility (completion of coursework needed for admission in university), and the
third one is Preparation (Students’ aptitude to execute their awareness into accomplishment). Definition
of university/college readiness may include aspirations of students’, emotional and social development,
social capital, navigation, study skills, and home support are important apparatuses of college readiness
(Mishkind 2014; Cortez et al., 2014).
2. Challenges of first-generation students in university readiness and adjustment
First-generation students faced lot of inequalities and hurdles because of their parental experience in
terms of lack of motivation lack of guidance, subject selection and support. Choy (2001) describe that
there is a huge gap between the continuing-generation and first-generation in relation to facing
challenges. Lee et al., (2004) explains that the FGS faced many challenges and disadvantages during
their university education. Many studies concluded that first-generation students are less prepared
academically (Martinez et al., 2009). Some other studies found that first-generation students attend
university part-time due to financial issues (Cushman, 2007; Thomas 2009). First-generation students
feel themselves inferior from other and maintain less interaction with regular generation students (Kuh
et al., 2008).
Another important factor is parental support which provide students confidence to complete their
studies. First-generation found less guidance and support from their parents because their parents have
less knowledge, and exposure. They got less emotional, financial and educational support from their
parents. FGS also face language barriers, difficulty to adjust university social environment and low
academic self-esteem (Stephens et al., 2014). Student who are first in their family attend university
having problems in adjustment both socially and academically. They struggle to construct their identity
as Stephens et al. (2014) describes that first-generation students struggle more to find their way to adjust
in university environment. Other studies as ASHE (2013) concluded that first-generation students have
limited access towards information’s, less interaction with faculty, and sense of belongingness with
Journal of Business and Social Review in Emerging Economies Vol. 6, No 4, December 2020
1667
university social and cultural environment. The student joins university and is the first in his/her family
making him/her separate from his family and showing more engagement in university culture (Boden,
2011).
The study examine what first-generation students face in adjustment when attaining higher education for
the first time, an occurrence which, without any prior preparation by them or by their institution
(university), may elevate their level of anxiety and may impede in their learning capabilities
(Checkoway, 2018). In Pakistan students face a similar dilemma, being first generation students
pursuing higher education degrees, is a daunting task. The major objectives of the research are to know
the university readiness of first-generation university students and to access how first-generation
university students adjusted to university life.
3. Research Methodology
Aim of the current study is to explore the relationship between student’s university readiness and
university adjustment. The study intended to identify problem FGS faced to adjust in social environment
of university and throughout the university period. The research methodology considered most suitable
for this research is quantitative. Quantitative study seeks to collect and interpret empirical data to reach
the desired objectives.
First-generation students (both male & female) studying in different public and private sector
universities of Pakistan are population interviewed through a Google docs survey form for the current
study. Data were collected from 405 respondent belongs to different universities of Pakistan from them
232 respondents were male and 173 respondents were female. Data were collected by using online
research tool survey monkey, after making data collection form it was shared on different plat forms
included social media, emails, WhatsApp groups and, other available platform. The association between
university readiness and university adjustment is checked.
4. Results and Discussions
The part of the article is discussing the results of the present study. The first subsection discussion about
the background information of the respondents, while the descriptive overview of university readiness,
university adjustment is presented and in the end the relationship between these two variables is
checked.
Table 1: Background Characteristics of the respondents (N = 405)
Sr. Demographic determinants Indicators Frequency Percentage
1 Gender Male 232 57.3
Female 173 42.7
2 Age 18-22 287 70.9
23-27 86 21.2
28-32 22 5.4
Above 32 10 2.5
3 Residence Rural 187 46.2
Semi-Urban 66 16.3
Urban 152 37.5
4 Degree Program BS 250 61.7
Master 111 27.4
MS. M.Phil. 31 7.7
PhD 13 3.2
5 Semester 1st 52 12.8
2nd 12 3.0
3rd 167 41.2
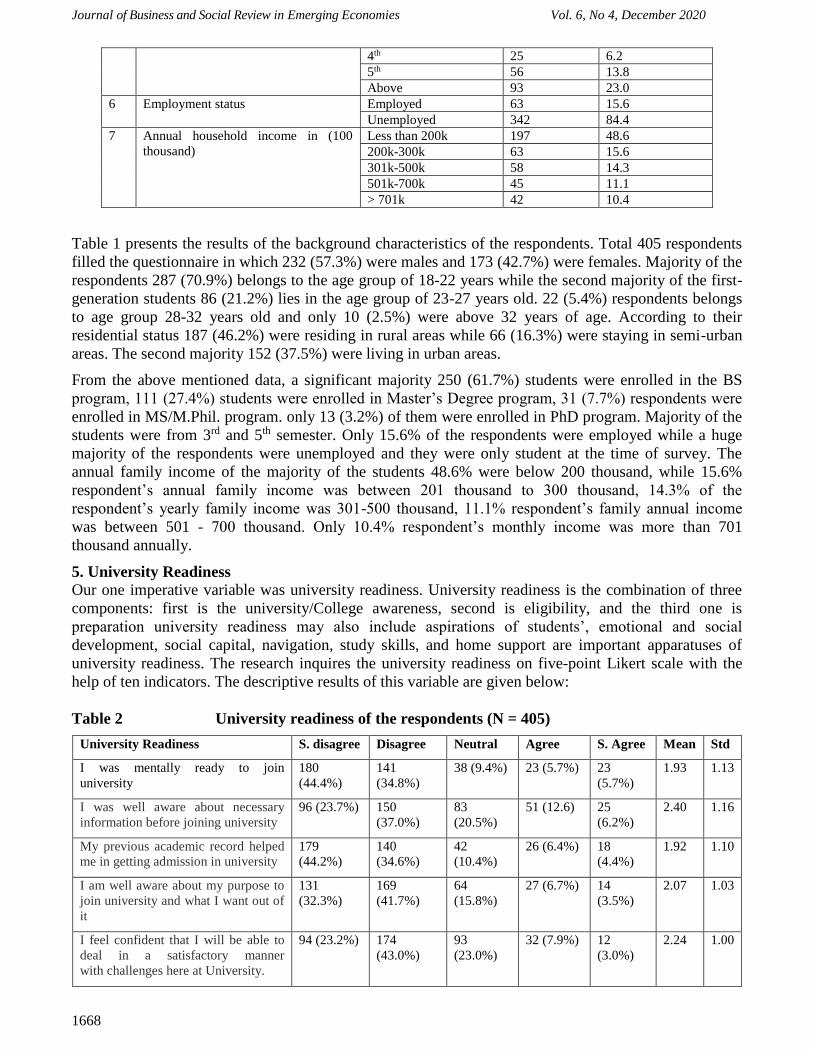
Journal of Business and Social Review in Emerging Economies Vol. 6, No 4, December 2020
1668
4th 25 6.2
5th 56 13.8
Above 93 23.0
6 Employment status Employed 63 15.6
Unemployed 342 84.4
7 Annual household income in (100
thousand)
Less than 200k 197 48.6
200k-300k 63 15.6
301k-500k 58 14.3
501k-700k 45 11.1
> 701k 42 10.4
Table 1 presents the results of the background characteristics of the respondents. Total 405 respondents
filled the questionnaire in which 232 (57.3%) were males and 173 (42.7%) were females. Majority of the
respondents 287 (70.9%) belongs to the age group of 18-22 years while the second majority of the first-
generation students 86 (21.2%) lies in the age group of 23-27 years old. 22 (5.4%) respondents belongs
to age group 28-32 years old and only 10 (2.5%) were above 32 years of age. According to their
residential status 187 (46.2%) were residing in rural areas while 66 (16.3%) were staying in semi-urban
areas. The second majority 152 (37.5%) were living in urban areas.
From the above mentioned data, a significant majority 250 (61.7%) students were enrolled in the BS
program, 111 (27.4%) students were enrolled in Master’s Degree program, 31 (7.7%) respondents were
enrolled in MS/M.Phil. program. only 13 (3.2%) of them were enrolled in PhD program. Majority of the
students were from 3rd and 5th semester. Only 15.6% of the respondents were employed while a huge
majority of the respondents were unemployed and they were only student at the time of survey. The
annual family income of the majority of the students 48.6% were below 200 thousand, while 15.6%
respondent’s annual family income was between 201 thousand to 300 thousand, 14.3% of the
respondent’s yearly family income was 301-500 thousand, 11.1% respondent’s family annual income
was between 501 - 700 thousand. Only 10.4% respondent’s monthly income was more than 701
thousand annually.
5. University Readiness
Our one imperative variable was university readiness. University readiness is the combination of three
components: first is the university/College awareness, second is eligibility, and the third one is
preparation university readiness may also include aspirations of students’, emotional and social
development, social capital, navigation, study skills, and home support are important apparatuses of
university readiness. The research inquires the university readiness on five-point Likert scale with the
help of ten indicators. The descriptive results of this variable are given below:
Table 2 University readiness of the respondents (N = 405)
University Readiness S. disagree Disagree Neutral Agree S. Agree Mean Std
I was mentally ready to join
university
180
(44.4%)
141
(34.8%)
38 (9.4%) 23 (5.7%) 23
(5.7%)
1.93 1.13
I was well aware about necessary
information before joining university
96 (23.7%) 150
(37.0%)
83
(20.5%)
51 (12.6) 25
(6.2%)
2.40 1.16
My previous academic record helped
me in getting admission in university
179
(44.2%)
140
(34.6%)
42
(10.4%)
26 (6.4%) 18
(4.4%)
1.92 1.10
I am well aware about my purpose to
join university and what I want out of
it
131
(32.3%)
169
(41.7%)
64
(15.8%)
27 (6.7%) 14
(3.5%)
2.07 1.03
I feel confident that I will be able to
deal in a satisfactory manner
with challenges here at University.
94 (23.2%) 174
(43.0%)
93
(23.0%)
32 (7.9%) 12
(3.0%)
2.24 1.00

Journal of Business and Social Review in Emerging Economies Vol. 6, No 4, December 2020
1669
I am well aware about my academic
goals
106
(26.2%)
189
(46.7%)
76
(18.8%)
26 (6.8%) 8 (2.0%) 2.11 0.90
I prepared my-self to face all the
challenges before joining university
95
(23.45%)
115
(28.39%)
99
(24.46%)
51
(12.59%)
45
(11.11%)
2.59 0.84
My expectations were too high about
university education.
145
(35.8%)
137
(33.8%)
69
(17.0%)
34 (8.4%) 20
(4.9%)
2.13 1.14
I feel myself enough skilled to fit in
university environment
82 (20.2%) 181
(44.7%)
93
(23.0%)
35 (8.6%) 14
(3.5%)
2.30 1.00
I don’t have much motivation for
study lately
43 (10.6%) 108
(26.7%)
116
(28.6%)
105
(25.9%)
33
(8.1%)
2.94 1.13
Table 2 reveals the university readiness of first-generation students. Total 10 questions were asked to
check the university readiness. Frequency and percentages carried out for description and then mean and
standard deviation calculated to check the central tendency and variance. Low standard deviation
designates data points are very close to the means and high deviation reveals that data points are
scattered. The measurement of table data describes that majority of the university students were not
mentally ready to join university (M = 1.93, SD = 1.13), while majority of them don’t have enough
awareness and necessary information before joining the university (M = 2.40, SD = 1.16). The average
response of previous academic record helped me in getting admission in university 1.92 (SD = 1.10).
Majority of the respondents were disagreed with the statement that they were well aware about their
purpose to join university (M = 2.07, SD = 1.03). Similarly, more than half were not confident with their
skills to deal with challenges in a satisfactory manner in the university with the average value of 2.24
(SD = 1.00). The response remained in disagreement regarding their awareness about their academic
goals with M = 2.11, SD = 0.90. The mean value of 2.59 with the standard deviation of (0.84) shows
that the first generation students were not fully prepared to face challenges of university life before
joining university. Majority of the students were not expecting very high from the university (M = 2.13,
SD = 1.14). Almost 65% of the respondents clearly stated that they were not enough skilled to adjust in
university environment (M = 2.30, SD = 1.00). While, the response for the question that “I don’t have
much motivation for study lately” remained unclear in its response as 27.6% of the respondents were
disagreed, 28.6% remained neutral, and almost 26% agreed (M = 2.94, SD = 1.13). Many studies found
that as Arnold et al. (2012) describe that most of the first-generation students were mentally unprepared
for the joining university and having less knowledge about the procedures of applying for admission and
university selection as well. As Crozier, Reay & Clayton, 2008) described that first-generation students
had low academic grades and limited knowledge about subject selection and finding opportunities
related to their subject lemmatized their academic performance and opportunities to succeed. Gamez et
al. (2013) described that first-generation students having less university readiness resultantly faced
issues in university selection, subject selection, adjust in university environment as compare to regular
students. Johnson, S.E et al., (2011) found that students feel trouble to find their place in the university
environment.
6. Adjustment with the curriculum and the extra-curricular activities
The research inquires the adjustment of the first-generation students with the curriculum and extra-
curricular activities on five-point Likert scale with the help of eight indicators. The descriptive results
with frequency, percentage, mean and standard deviation of this variable are given below:
Table 3: Adjustment of respondents with curriculum and extra-curricular activities Adjustment with curriculum extra
curriculum activities
S. disagree Disagree Neutral Agree S. Agree Mean Std.
University education is difficult for
me
38 (9.4%) 78
(19.3%)
90
(22.2%)
119
(29.4%)
80
(19.8%)
3.31 1.24

Journal of Business and Social Review in Emerging Economies Vol. 6, No 4, December 2020
1670
I found myself in trouble while doing
my academic work
48 (11.9%) 123
(30.4%)
117
(28.9%)
89
(22.0%)
28 (6.9%) 2.84 1.10
I always found myself involved in
the social activities in university
59 (14.6%) 112
(27.7%)
112
(27.7%)
87
(21.5%)
35 (8.6%) 2.82 1.18
I enjoy completing academic
assignments
95 (23.5%) 150
(37.0%)
100
(24.7%)
39
(9.6%)
21 (5.2%) 2.36 1.09
Course/Syllabus easy to understand
for me
79 (19.5%) 163
(40.2%)
104
(25.7%)
46
(11.4%)
13 (3.2%) 2.39 1.02
I am satisfied with my participation
in social activities at university
83 (20.5%) 125
(30.9%)
108
(26.7%)
75
(18.5%)
14 (3.5%) 2.54 1.11
I am satisfied with the course
contents of my degree
115
(28.4%)
161
(39.8%)
80
(19.8%)
26
(6.4%)
23 (5.7%) 2.21 1.10
I am satisfied with the academic
system and other service (Mess,
Hostel, Scholarship, Career
counseling etc.) at university.
59 (14.6%) 141
(34.8%)
108
(26.7%)
57
(14.1%)
40 (9.9%) 2.41 1.02
Table 3 is about the adjustment with curriculum and extra curriculum activities. Total 08 questions were
asked to check the adjustment with curriculum and extra curriculum activities. Frequency and
percentages carried out for description and then mean and standard deviation calculated to check the
central tendency and variance. Low standard deviation designates data points are very close to the means
and high deviation reveals that data points are scattered. Majority (Mean= 3.31, SD= 1.24) of the first-
generation students agreed that university education is difficult for them, while (Mean= 2.84, SD= 1.10)
found themselves in trouble while doing their academic tasks. The involvement in social activities at
university level found high among first first-generation students with mean value 2.82 and SD= 1.18.
While fewer less than half (Mean= 2.36, SD=1.09) didn’t enjoy completing academic assignments.
While course/slybus understanding is another basic and most important thing to feel adjust in university.
Research data found that less than half (Mean= 2.39, SD= 1.02) agreed that course/slybus is easy to
understand for them. A slightly more than half (Mean= 2.54, SD= 11) were satisfied with their
participation in social activities at university level, while only (Mean= 2.21, SD= 1.10) found satisfied
with the course content of their degree program. Satisfaction with academic and other services also
recorded low (Mean= 2.41, SD= 1.02) among students.
7. Conclusion
Results show that first-generation students were less prepared and not ready to enter in the university.
Data shows that there is a significant relationship between university readiness and university
adjustment. It was also found that majority of the first-generation university students were less prepared
to enter the university and they feel them less adjusted with university curriculum and extra-curricular
activities. . First-generation students were not satisfied with the services provided by university and the
course contents as well. It was difficult for them to evaluate this situation of maladjustment.
8. Recommendations
In the light of the present study, it is recommended that student’s facilitation center should be
established at central and department or at least faculty level to guide and facilitate the students’ in
admission and after admission throughout the degree completion. The psychologists or psychiatrists
should appoint in the university so that the students can visit and discuss their issues that are actually not
serious ones but the students failed to cope with the situation. These specialists can help them in
adjustment and minimize the effects of these challenges on their academic achievements. As it is the
first research in Pakistan on first-generation university students. There is a need to conduct more
researches on first-generation students to understand the problems and challenges of first-generation
students that will not only help to collect statistics regarding first-generation students and their
challenges as well as will help in policy making.
Journal of Business and Social Review in Emerging Economies Vol. 6, No 4, December 2020
1671
References
Arnold, K., Castleman, B. L., & Wartman, K. L. (2012). Stemming the tide of summer melt: An
experimental study of the effects of post-high school summer intervention on low-income
students’ college enrollment. Journal of Research on Educational Effectiveness, 5(1), 1 17.
Baker, D. B., Clay, J. N., & Gratama, C. A. (2005). The essence of college readiness: Implications for
students, parents, schools, and researchers, Research, and Consulting, LLC. Retrieved from
https://spu.edu/orgs/research/College%20Readiness_Report_v1.pdf.
Bers, T., & Schuetz, P. (2014); A missing piece of the college completion conundrum. Community
College Review, 42(3), 167-183.
Boden, K. (2011). Perceived academic preparedness of first-generation Latino college students. Journal
of Hispanic Higher Education, 10(2), 96-106.
Bruce E. Compas, Barry M. Wagner, Lesley A. Slavin, and Kathryn Vannatta (1986). A Prospective
Study of Life Events, Social Support, and Psychological Symptomatology during the Transition
From High School to College. American Journal of Community Psychology, Vol. 14, No. 3,
1986.
Castleman, B. L., Arnold, K., & Wartman, K. L. (2012). Stemming the tide of summer melt: An
experimental study of the effects of post-high school summer intervention on low-income
students’ college enrollment. Journal of Research on Educational Effectiveness, 5(1), 1 17.
Checkoway, Barry (2018). Inside the Gates: First-Generation Students Finding Their Way. Higher
Education Studies, v8 n3 p72-84 2018. ISSN: ISSN-1925-4741.
Choy, Susan (2011). Students Whose Parents Did Not Go to College: Postsecondary Access,
Persistence, and Attainment. Findings from the Condition of Education, (2001).
Clinciu, 2012 Clinciu, A.I. (2012). Adaptation and stress for the first year university students. Procedia –
Social and Behavioral Sciences, 78, 718-722. Elsevier.
Conley, D. T. (2020). Redefining College Readiness: Educational policy improvement center.
Cortez, L. J., Martinez, M. A., & Sa´enz, V. B. (2014). Por los ojos de madres: Latina mothers’
understandings of college readiness. International Journal of Qualitative Studies in Education,
27(1), 877–900.
Crozier, G. Reay, D. Clayton,J. Colliander,L. (2008) Different Strokes for Different Folks: Diverse
Students in Diverse Institutions - Experiences of Higher Education. Research Papers in
Education, 23:2, 167-177.
Cushman, K. (2007). Facing the culture shock of college. Educational Leadership, 64, 44-47.
Gamez-Vargas, J., & Oliva, M. (2013). Adult guidance for college: Rethinking educational practice to
foster socially-just college success for all. Journal Of College Admission, (221), 6068.
Hodges-Payne, T. (2006). Perceptions of first-generation college students: Factors that influence
graduate school enrollment and perceived barriers to attendance (Doctoral Dissertation).
Available from ProQuest Dissertations and Theses database.
Huerta, J., Watt, K. M., & Reyes, P. (2013). An examination of AVID graduates' college preparation and
postsecondary progress: community college versus 4-year university students. Journal of
Hispanic Higher Education, 12(1), 86-101.
Johnson, S. E., Richeson, J. A., & Finkel, E. J. (2011). Middle class and marginal? Socioeconomic
status, stigma, and self-regulation at an elite university. Journal of Personality and Social
Psychology, 100(5), 838-852. doi:10.1037/a0021956.
Kuh, G. D. (2008). High-impact educational practices: What they are, who has access to them, and why
they matter. Washington, DC: Association of American Colleges and Universities. Retrieved
from https:// keycenter.unca.edu/sites/default/files/aacu_high_ impact_2008_final.pdf.
Lee, J. L., Sax, L. J., Kim, K. A., & Hagedorn, L. S. (2004). Understanding students’ parental education
beyond first-generation status. Community College Review, 32(1), 1-21.
Maria Chong Abdullah, and habibah Elias, and Rahil Mahyuddin, And Jegak Uli (2014). Adjustment
Amongst First Year Students in Malaysian University. European Journal Of Social Sciences.

Journal of Business and Social Review in Emerging Economies Vol. 6, No 4, December 2020
1672
Martinez, J. A., Sher, K. J., Krull, J. L., & Wood, P. K. (2009). Blue-collar scholars. Mediators and
moderators of university attrition in first-generation college students. Journal of College Student
Development, 50, 87-103.
Mishkind, A. (2014). Overview: State definitions of college and career readiness. College and Career
Readiness and Success Center. Retrieved from http://eric.ed.gov/?id=ED555670.
Nasir, Maliha (2011). Correlation of emotional intelligence with demographic characteristics, academic
achievement and cultural adjustment of the students of IIUI. International Islamic University
Islamabad. http://173.208.131.244:9060/xmlui/handle/123456789/5518.
Roderick, M., Nagaoka, J., & Coca, V. (2009). College Readiness for All: The Challenge for Urban
High Schools. The Future of Children, 19(1), 185-210. Retrieved January 25, 2021, from
http://www.jstor.org/stable/27795040.
Stephens, N. M., Hamedani, M. G., & Destin, M. (2014). Closing the social-class achievement gap A
difference-education intervention improves first-generation students' academic performance and
all students' college transition. Psychological Science, 25, 943-953.
Stephens, N. M., Hamedani, M. G., & Destin, M. (2014). Closing the social-class achievement gap A
difference-education intervention improves first-generation students' academic performance and
all students' college transition. Psychological Science, 25, 943-953.
Thomas, I. (2009). The role of demographic, pre-college, and involvement factors on postsecondary
academic performance of first-generation college students: Findings from a national study.
Unpublished doctoral dissertation, University of Maryland, College Park.

Journal of Business and Social Review in Emerging Economies Vol. 6, No 4, December 2020
1673
Volume and Issues Obtainable at Center for Sustainability Research and Consultancy
Journal of Business and Social Review in Emerging Economies ISSN: 2519-089X (E): 2519-0326
Volume 6: No. 4, December 2020
Journal homepage: www.publishing.globalcsrc.org/jbsee
Effect of Practices Executed by Monitoring Education Assistants on Elementary
School Teachers’ Mental Health
1Sumaira Munawar, 2Khadija Sittar, 3Misbah Malik
1Assistant professor, Lahore Leads University, Lahore, Pakistan, [email protected]
2Institute of Education and Research, University of the Punjab, Lahore, Pakistan,
[email protected] 3Lecturer, Institute of Education and Research, University of the Punjab, Lahore, Pakistan,
ARTICLE DETAILS ABSTRACT
History
Revised format: August 2020
Available Online: September
2020
Teachers’ mental health not only increases their efficiency,
professional growth and development but also their effects their
personality. Punjab education department established Monitoring
education authorities to improve quality of education by monitoring
quality indicators. Monitoring practices of Education Assistants may
affect the mental health of teachers on their workplaces which
culminate in low performance. The objective of this study was to
determine effect of monitoring education authorities’ practices on
school teachers’ mental health. 300 elementary school teachers were
selected for data collection through cluster sampling technique in
District Sheikhpura. Data collection was done through survey
questionnaire with 17 statements. Findings revealed that a significant
correlation between teachers’ performance and motivational
techniques used by their heads. A pilot study was conducted to
validate cronbach's alpha 0.86 which statistically significant.
Furthermore, following practices of Monitoring education authorities
are effecting mental health index .On the bases of these findings that
it is recommended that the government might give training to MEAs
for improving their behaviours during their visits in schools.
© 2020 The authors, under a Creative Commons
Attribution-NonCommercial 4.0
Keywords
Monitoring Education
Assistants, Elementary
School Teachers, Mental
Health
JEL Classification
M1, M12
Corresponding author’s email address: [email protected]
Recommended citation: Munawar, S., Sittar, K. & Malik, M. (2020). Effect of Practices Executed by
Monitoring Education Assistants on Elementary School Teachers’ Mental Health. Journal of Business
and Social Review in Emerging Economies, 6(4), 1673-1679
1. Introduction
The socio-economic development of any country is based on the most important indicator called
education. For a nations’ socio-economic development it is a vital investment and given importance in

Journal of Business and Social Review in Emerging Economies Vol. 6, No 4, December 2020
1674
all over the world. According to Government of Pakistan (2009) the role of education as a reform and
development of a country is emphasized in all the education policies of Pakistan. In Pakistan there is no
proper attention on quality of education. Total 2 percent of GDP is investing by the federal and
provincial government which is very less to promote education in the country. World Bank (2004)
described that in our country both quality and quantity of education is poor. This backwardness has
many reasons. Some of them are poverty, lack of infrastructure, lack of funds and teachers’ absenteeism.
It is difficult in organizations of education to introduce the system of complex management in order to
develop the means of modification for creation and formation of modern system(Sergeevich &
Sevastjanovna, 2020 ).
According to Muriuning (2015) “monitoring is a continuous process of collecting information, providing
check and balance and presenting factual position of assigned work.” The relevant information is
gathered through monitoring process. “It is a type of evaluation that collects concrete information
utilized for program reformation (Noh, 2006)”. Mental health, in layman terms, is a “level of
psychological well-being, or an absence of a mental disorder”. According to various personnel and
professional demands the level of mental heath being effected in teachers. The social, physical and
mental health of teachers not only develop teachers’ personality but it also adds to the teaches’
efficiency. (Lucas & Kate, 2019).
According to McCutcheon (2007) we have to remove these reasons in order to achieve national
education goals. It is reviewed in the education policy of Pakistan recently that there are two main
reasons (lack of commitment and implementation) because of them previous educational policies did not
achieve the targets. Through motivation commitment gap might be filled and through better monitoring
system implementation gap may be filled. Government of Pakistan (2009) recommended that in
education sector monitoring system should be strengthen. The successful key to implementation of any
educational program adequate, inclusive, rigorous, supervision and continuous monitoring are the most
important elements. In order to assess implementation progress readily, there is need to some kind of
mechanism for newly program introduced in any educational settings. This type of mechanism is called
monitoring mechanism (Donkoh & Dwamena, 2014).
Khawaja (2001) stated that activities of monitoring and supervision by monitoring education assistant
within an educational system. “Monitoring is a type of evaluation that collects concrete information
utilized for program reformation” (Noh, 2006). According to Shah (2009) “monitoring is a continuous
process of collecting information, providing check and balance and presenting factual position of
assigned work.” The relevant information is gathered through monitoring. According to Shami (2009)
monitoring involves results of communication at appropriate management level and for future evaluation
of storage of information. For effective implementation of any program, monitoring is an effective part
of management.
According to Tatnack (2000) “monitoring is an aspect of both accountability and development.” There
are two types of monitoring functions i.e. passive and active. Without proper monitoring any
organization cannot be achieved their desired goals. Therefore, in all developed countries there is an
effective and organized system of monitoring in the world. Shah (2004) defined that in order to ensure
quality education effective monitoring is an important part of management system. The following steps
involved in monitoring; objectives formulation, instrumentation, and aims of education. Through these
steps it is ensured whether these objectives are achieved vigilantly or not. Many countries have their
own monitoring system in all over the world. The monitoring education in Pakistan lies with the
education department itself. The responsibility of monitoring school programs are the responsibility of
heads who are the immediate boss of the institution. On the other hand EDOs, DEOs, DDEOs, and
AEOs are responsible for planning, organizing, staffing, directing, leading, controlling, monitoring and
evaluating the institutions.
Under the Punjab Education Sector Reforms Program (PESRP) in 2000, Government of the Punjab
(2001) has reforms in education sectors. PESRP has three pillars responsible for quality education. In
2001 under the act of devolution power, provincial government introduced an external monitoring
system called Program Monitoring and Implementation which was initiated to enhance quality of

Journal of Business and Social Review in Emerging Economies Vol. 6, No 4, December 2020
1675
education, access to education, allocation of resources to support devolution and improve governance in
Punjab at provincial and district level. The programs and projects of government of the Punjab are
monitoring by the Monitoring and Implementation Unit (PMIU). In all thirty five districts there are
appointed thirty five District Monitoring Officers (DMOs) for this purpose. “These DMOs had been
appointed directly by the Chief Minister Secretariat after recommendation of services and general
administration department of the provincial government and they were appointed from District
Management Group.” A sub department of monitoring cell PMIU called monitoring cell was established
to monitoring educational programs.
In order to collect data from schools retired Junior Commissioned Officers of army (JCOs) were
appointed. The designation given to these newly appointed field workers are called Monitoring and
Evaluation Assistants (MEAs). The monthly reports are sent to District Monitoring Officers made by
them. Then further copies of these reports forwarded to the DCO and Chief Minister of Punjab.
According to the report given by DMOs it is the duty of DCO to give instructions to concerned
education officer to take action on these reports. At district level under the DCO both departments are
working. The data is gathered by monitoring system through public education system and third party
validated the data. With the help of these stake holders (EDOEs, DEOs, DMOs and heads) through
PESRP has to improve the Punjab province education system. Under the PESRP at primary and
secondary level enrollment rate has been increased GOP, 2007).
Many factors like devolution of power, external and internal motivation, commitment and efforts of
government and media campaigns are responsible for this gain. In order to take corrective actions,
monitoring system provide facts and figures provided by these factors. There is need to find
effectiveness of both systems working parallel to the both monitoring system. Mental health of teachers
are affected by this strict monitoring system. Therefore, researcher intended to investigate the effect of
monitoring evaluation on mental health of teachers.
2. Research Questions
Following research questions were formed in this study.
1. Is there any significant difference between male and female teachers about “Effect of Practices
Executed by Monitoring Education Assistants on Elementary School Teachers’ Mental Health”?
2. Is there any significant difference between rural and urban teachers about “Effect of Practices
Executed by Monitoring Education Assistants on Elementary School Teachers’ Mental Health?”
3. Is there any significant difference between B. Ed. And M. Ed. teachers about “Effect of Practices
Executed by Monitoring Education Assistants on Elementary School Teachers’ Mental Health?”
4. Is there any significant difference between PST and EST teachers about “Effect of Practices
Executed by Monitoring Education Assistants on Elementary School Teachers’ Mental Health?”
5. Is there any significant difference between teachers about “Effect of Practices Executed by
Monitoring Education Assistants on Elementary School Teachers’ Mental Health in terms of
their qualification?”
6. Is there any significant difference between teachers about “Effect of Practices Executed by
Monitoring Education Assistants on Elementary School Teachers’ Mental Health in terms of
their age?”
3. Research Methodology
Present study was quantitative in nature .The survey method was used to collect data. Population of the
study was all the Government Elementary School teachers working in schools of District Sheikhpura.
Sample of the study was 300 elementary school teachers.
4. Instrumentation

Journal of Business and Social Review in Emerging Economies Vol. 6, No 4, December 2020
1676
Questioner was used for data collection. The researcher used a self-compiled questionnaire for data
collection. The questionnaire consisted of five point Likert scales. Responses of the items rated on five
point likert type scale from ‘strongly agree 5’ to ‘strongly Disagree1.
5. Data Analysis
Data were analysed by using inferential statistics (independent samples t-test).
The mean scores regarding the perceptions of male and female teachers about “Effect of Practices
Executed by Monitoring Education Assistants on Elementary School Teachers’ Mental Health” was
shown in table 1.No significant mean difference between male and female teachers’ was found at p≤0.05
level of significance. Whereas, male and female teachers have mean difference regarding mental health
at p≤0.05 significance level.
The mean scores regarding the perceptions of rural and urban teachers about “Effect of Practices
Executed by Monitoring Education Assistants on Elementary School Teachers’ Mental Health” was
shown in table 2. A significant mean difference between male and female teachers’ was found at p≤0.05
level of significance. Whereas, rural and urban teachers have mean difference regarding mental health at
p≤0.05 level of significance.

Journal of Business and Social Review in Emerging Economies Vol. 6, No 4, December 2020
1677
The mean scores regarding the perceptions of B.Ed and M.Ed. teachers about “Effect of Practices
Executed by Monitoring Education Assistants on Elementary School Teachers’ Mental Health” was
shown in table 3. A significant mean difference between B.Ed and M.Ed. teachers’ was found at p≤0.05
level of significance. Whereas, B. Ed. and M.Ed. teachers have no mean difference regarding mental
health at p≤0.05 significance level.
The mean scores regarding the perceptions of PST and EST teachers about “Effect of Practices Executed
by Monitoring Education Assistants on Elementary School Teachers’ Mental Health” was shown in
table 4. No significant mean difference between PST and EST teachers’ was found at p≤0.05 level of
significance. Whereas, PST and EST teachers have no mean difference regarding mental health at
p≤0.05 level of significance.

Journal of Business and Social Review in Emerging Economies Vol. 6, No 4, December 2020
1678
Age wise mean scores regarding the perceptions of male and female teachers about “Effect of Practices
Executed by Monitoring Education Assistants on Elementary School Teachers’ Mental Health” was
shown in table 5. “No significant mean difference between male and female teachers’ was found at
p≤0.05 level of significance”. Whereas, male and female teachers have no mean difference regarding
mental health at p≤0.05 level of significance.
Qualification wise mean scores regarding the perceptions of male and female teachers about “Effect of
Practices Executed by Monitoring Education Assistants on Elementary School Teachers’ Mental Health”
was shown in table 6. “No significant mean difference between male and female teachers’ was found at
p≤0.05 level of significance”. Whereas, male and female teachers have no mean difference regarding
mental health at p≤0.05 level of significance.
6. Conclusions
On the basis of data analyses, the following conclusions are drawn.
1. MEAs checked the balance/record of School Council (SC), Farogh-e-Taleem funds.
2. “MEAs also reviewed the number of meetings held during the past three months by the school
board and the visit by the District Officer and the Deputy District Education Officer.”
3. The necessary equipment would be tested by MEAs like, cleanliness of building, parks, and
school playgrounds and classroom environment.
4. This monitoring system for the improvement of primary education system is valuable.

Journal of Business and Social Review in Emerging Economies Vol. 6, No 4, December 2020
1679
5. Daily three to four hour MEAs should visit by MEAs regularly in schools.
6. School monitoring training did not received by MEAs.
7. Before visit to any school deputy district education officer did not inform by MEAs before the
visit to any school.
8. Head-teachers provide co-operation to MEAs during their visit to school.
9. Number of students present and absent in the class should be checked by the MEAs at the time of
monitoring and also check Farogh-e-Taleem fund received per student.
10. MEAs examined the students ' level of cleanliness and a number of free sets of textbooks.
7. Recommendations
Following were the recommendations on the basis of the above findings.
1. Monitoring education authorities receive no school trainings. Therefore, MEAs should provide
training before the 15 days of their appointments and an orientation session should be conducted.
2. Before visiting to any school MEAs should informed by District Education Officer / Deputy
District Education Officer, therefore, the visit schedule should be provided to the District
Education Officer/ Deputy District Education Officer by MEAs.
References
Donkoh,E.K., & Dwamena, E.O.(2014). Effects of educational supervision on professional
development : perception Of public basic school teachers at Winneba,Ghana. British
Journal of Education,1(6),63-82.
Government of Pakistan (2009).National Education Policy. Islamabad: Ministry of Education.
Government of Punjab (2007).Punjab in Figures 2007. Lahore: Planning and Development Department.
Lucas,S., & Kate,H. (2019).Secondary school teachers' experiences of supporting mental health. Journal
of Mental Health Trainning Education and Practice,14(5),372-383.
McCutcheon, S. (2007).Punjabi Reforms. Retrieved from www.UNDP.org/pk dated 04/03/2010.
Muriungi, M.T. (2015). The role of participatory monitoring and evaluation programs among
government corporations: a case of Ewaso Ngi’ro North Development Authority. International
Academic Journal of Social Sciences and Education,1(4), 53-76.
Noh, H. J. (2006). Policy Evaluation (2nd ed.). Bupmunsa: Seoul, Korea.
Shah, D. (2009).Monitoring the Quality of Secondary Education in Context of Decentralization in
Pakistan.Lahore.Bulletin of Education and Research, 31(1), 1-25. IER, University of the Punjab.
Shami, P.A. (2009). Educational Leadership and Institutional Management. Islamabad: AEPM, MOE.
World Bank. (2004). Making Service Work for Poor People. World Development Report, Washington
and Oxford: World Bank and Oxford University Press.