Job insecurity and the difficulty of regaining employment: An empirical study of unemployment...
29
JOB INSECURITY AND THE DIFFICULTY OF REGAINING EMPLOYMENT: AN EMPIRICAL STUDY OF UNEMPLOYMENT EXPECTATIONS Francis Green, Alan Felstead and Brendan Burchell y I. INTRODUCTION Job insecurity has been a big issue for the 1990s. Research has been accumulating over the past decade which suggests that the implications of job insecurity are more far-reaching than was suggested in earlier research on flexibility (Boyer, 1988). That job insecurity is a major source of psychological ill-health is now well established (see Burchell, 1994, 1999 for reviews). The effects appear to be long-term (Heaney, Israel and House, 1994), and to extend beyond individuals to those with whom they live (Hughes and Galinsky, 1994; Larson, Wilson and Beley, 1994; Lampard, 1994) and to their relations with employers (Hudson et al., 1997; Hallier, 1997; Brockner, 1992; Ernst and Young, 1995). Though less well estab- lished, there are also some direct economic implications. These include a posited impact on wage restraint (e.g. Hogan and Ragan, 1995; Aaronson and Sullivan, 1998) and hence on unemployment (though this is disputed by Bertola, 1990), a putative impact on consumer expenditure, in particular on housing spending with consequent implications for the housing market (Hutton, 1995), a possibly adverse impact on the acquisition of human capital (Alogoskoufis et al., 1995), and increasing segmentation at the lower rungs of the labour market thus exacerbating tendencies to economic inequality (Payne and Payne, 1993). In addition, an important element of insecurity – the cost of job loss – is also a linchpin of a major class of efficiency-wage models of effort regulation (e.g. Bowles, 1985). There is now a growing literature establishing significant changes in elements of job security in the U.S. labour market. While the overall length of tenure of jobs remained broadly stable from 1973 onwards, there was a switch away from long tenure among men’s jobs, and towards longer-lasting jobs for women (Farber, 1996). Farber (1997) reports increases in the OXFORD BULLETIN OF ECONOMICS AND STATISTICS, 62, SPECIAL ISSUE (2000) 0305-9049 855 # Blackwell Publishers Ltd, 2000. Published by Blackwell Publishers, 108 Cowley Road, Oxford OX4 1JF, UK and 350 Main Street, Malden, MA 02148, USA. y We should like to thank Andrew Clark, Peter Sloane and an anonymous referee for helpful comments on an earlier version of this paper, and Ken Prandy for assistance with the use of occupation recoding tables. The paper draws on the Skills Survey, which was funded by the Economic and Social Research Council as part of a project entitled ‘Learning, Skills and Economic Rewards’, within the Learning Society research programme.
Transcript of Job insecurity and the difficulty of regaining employment: An empirical study of unemployment...

JOB INSECURITY AND THE DIFFICULTY OFREGAINING EMPLOYMENT: AN EMPIRICAL STUDY
OF UNEMPLOYMENT EXPECTATIONS
Francis Green, Alan Felstead and Brendan Burchelly
I. INTRODUCTION
Job insecurity has been a big issue for the 1990s. Research has beenaccumulating over the past decade which suggests that the implications ofjob insecurity are more far-reaching than was suggested in earlier researchon ¯exibility (Boyer, 1988). That job insecurity is a major source ofpsychological ill-health is now well established (see Burchell, 1994, 1999for reviews). The effects appear to be long-term (Heaney, Israel and House,1994), and to extend beyond individuals to those with whom they live(Hughes and Galinsky, 1994; Larson, Wilson and Beley, 1994; Lampard,1994) and to their relations with employers (Hudson et al., 1997; Hallier,1997; Brockner, 1992; Ernst and Young, 1995). Though less well estab-lished, there are also some direct economic implications. These include aposited impact on wage restraint (e.g. Hogan and Ragan, 1995; Aaronsonand Sullivan, 1998) and hence on unemployment (though this is disputed byBertola, 1990), a putative impact on consumer expenditure, in particular onhousing spending with consequent implications for the housing market(Hutton, 1995), a possibly adverse impact on the acquisition of humancapital (Alogoskou®s et al., 1995), and increasing segmentation at the lowerrungs of the labour market thus exacerbating tendencies to economicinequality (Payne and Payne, 1993). In addition, an important element ofinsecurity ± the cost of job loss ± is also a linchpin of a major class ofef®ciency-wage models of effort regulation (e.g. Bowles, 1985).
There is now a growing literature establishing signi®cant changes inelements of job security in the U.S. labour market. While the overall lengthof tenure of jobs remained broadly stable from 1973 onwards, there was aswitch away from long tenure among men's jobs, and towards longer-lastingjobs for women (Farber, 1996). Farber (1997) reports increases in the
OXFORD BULLETIN OF ECONOMICS AND STATISTICS, 62, SPECIAL ISSUE (2000)0305-9049
855# Blackwell Publishers Ltd, 2000. Published by Blackwell Publishers, 108 Cowley Road, Oxford
OX4 1JF, UK and 350 Main Street, Malden, MA 02148, USA.
yWe should like to thank Andrew Clark, Peter Sloane and an anonymous referee for helpfulcomments on an earlier version of this paper, and Ken Prandy for assistance with the use ofoccupation recoding tables. The paper draws on the Skills Survey, which was funded by theEconomic and Social Research Council as part of a project entitled `Learning, Skills andEconomic Rewards', within the Learning Society research programme.

aggregate rate of job loss in the 1990s despite economic expansion, arisingmainly for the stated reason `position or shift abolished'. Job loss hasincreased especially for more highly educated and older workers (Farber,1993), though less educated workers remain the more susceptible. Aaronsonand Sullivan (1998) con®rm that there has been an increase in expectationsof job loss and in displacement rates for workers with ®ve or more years ofjob tenure. Several studies show large and persistent costs of job loss (e.g.Jacobsen et al., 1993; Huff Stevens, 1997; Ruhm, 1996; Farber, 1997),though Farber (1993) argues that these costs were no higher in 1990±91than in 1982±3. Some objective indicators of job stability are also changingfor segments of the British workforce. For example, while job tenure isdeclining for older workers and for less skilled men, a signi®cant minorityof men are still in jobs likely to last 20 years or more (Gregg andWadsworth, 1995, 1997; Burgess and Rees, 1996, 1997). For certain groupsof women, most notably women with dependent children, tenure has beenincreasing. The pace of these changes is slow and does not match claimsabout an end to `jobs for life' in the British labour market. Recent researchhas tended to associate increases in non-standard forms of employmentcontract, declines in unionism and more widespread use of subcontracting,with greater insecurity (see, for example, Heery and Salmon, 1998). Thosewho lose their jobs are increasingly likely to re-enter the labour market witha non-standard form of employment contract (Payne and Payne, 1993).Gregg et al. (1997) estimate that the wage loss suffered by those displacedfrom jobs averages around 10 percent, while Gregory and Jukes (1997)show that for the average man the wage loss after a spell of long-termunemployment is 20 percent. We know little about any trend in this wageloss, though Gregg and Wadsworth (1996) report the relative decline ofentry-level wages in comparison to average wages.
There is, however, little work which serves to con®rm or refute theputative associations between job characteristics and the job insecurityperceived by workers. This lacuna is perhaps unsurprizing since, whileobjective indicators of job characteristics are readily available, direct sub-jective measures of insecurity are thinner on the ground.1 The recentexpansion of research on the implications of assumed changes in perceivedjob insecurity has been accompanied by a parallel burst of political concernand media attention.2 Much of this research and political comment took asa starting point that perceived job insecurity had been increasing ± anapparent paradox in the light of lower unemployment rates. Even though theobjective indicators of ¯exibility or insecurity were contested in the politicalarena,3 many commentators accepted the assumption of changing percep-tions even in the absence of quantitative measures of change.
1For exceptions, see Burchell (1994) and Bender and Sloane (1998).2See The Guardian, 25/3/96, for one example among many.3In 1995, the President of the Board of Trade famously referred to job insecurity as only `a state
of mind'.
856 BULLETIN
# Blackwell Publishers 2000

One serious attempt has, however, been made to assess recent trends inperceived insecurity in Britain. The OECD reports an increase in insecurityfrom 1985 to 1995 in Britain, on the basis of surveys by a commercialsurvey company (International Survey Research Ltd), and also an increasebetween 1991 and 1996 using the British Household Panel Study (BHPS)(OECD, 1997; see also Guest et al., 1996: 36). Below we take issue withthis ®nding, drawing attention to substantive weaknesses in the relevant dataupon which the ®nding is based.
There are broadly two approaches to designing questions to analyzeemployees' perceptions of job insecurity. In the ®rst, respondents aredirectly questioned on their perceptions and/or their satisfaction with their`job security', with those words explicitly framed in the question. In thesecond, respondents are questioned as to how they perceive the risk of jobloss and unemployment in a speci®ed future period. The latter approach,which is adopted in this paper, involves a narrower conception, since bothresearchers and probably most respondents view job security as encompass-ing the conditions of a job in addition to the continuation of the employmentcontract. The narrower conception, in terms of unemployment risk, has theadvantage of potentially capturing more closely the in¯uence of the labourmarket on employees' behaviour. Here we extend the analysis of jobinsecurity by also exploring perceptions of employees' job chances werethey to ®nd themselves on the external job market.
We examine data from two surveys ± the Social Change and EconomicLife Initiative (SCELI) carried out in 1986 and the Skills Survey (SS)carried out in 1997 ± with two main aims: to identify aggregate anddisaggregate trends in the components of insecurity, and to analyze thedeterminants of insecurity in 1997. As part of this analysis, we investigatehow closely subjective measures of insecurity are related to objectivemeasures such as job tenure and the temporary/permanent status of jobs.We use these results to throw light on insecurity trends.
We ®nd that the recent political concern over insecurity has beenpremised on a false assumption of substantially rising insecurity. Rather, theperceived risk of job loss has in aggregate changed rather little between1986 to 1997. The perceived dif®culty of regaining an equally good job islower in 1997 than it was in 1986. The overall ®ndings need, however, twostrong quali®ers. First, there has been a re-distribution of insecurity. Inparticular professional workers, who were generally quite secure in 1986,have become much more insecure, while sales workers and manual workershave become less insecure in their jobs. Second, the level and changes inunemployment itself are important factors affecting insecurity. In thisrespect at least, workers' fear of job loss should have been substantiallylower in 1997 than in 1986 (when in aggregate the unemployment rate wassome ®ve percentage points higher). That this was not so, does suggest ashift in workers' perceptions of unemployment risk. Our estimates predictthat, should unemployment return to the levels of the mid 1980s, the
JOB INSECURITY AND THE DIFFICULTY OF REGAINING EMPLOYMENT 857
# Blackwell Publishers 2000

aggregate levels of insecurity would be substantially greater than the levelsof either 1986 or 1997.
The remainder of the paper is organised as follows. The next sectionexamines existing evidence by the OECD on perceived job insecurity inBritain. Section III explains our data, the measures of insecurity and themethodology to be used. Section IV presents key ®ndings with respect tothe changes in and the determinants of insecurity, and Section V concludes.
II. THE OECD'S ANALYSIS
In a recent study from the OECD, it is reported that perceived job insecurityrose considerably in the UK in the decade on from the mid 1980s. Althoughthis trend appears consistent with the expansion of research and with mediacoverage of the problems of job insecurity, a close inspection of the datasets on which the OECD base their claim reveals serious weaknesses in bothcases. One data set which they use is the British Household Panel Survey,where they analyse changes in the seven-point item on satisfaction with jobsecurity. They show that there was a marked increase in those who were not`totally satis®ed' with their job security, from 61.7 percent in 1991 tobetween 75.8 percent and 78.2 percent in the subsequent three years.
However, a closer examination of the data shows that there are other hugechanges between 1991 and 1992. For instance, there is also a mirroredchange at the other end of the scale, with fewer respondents being `totallydissatis®ed' with their job security. An inspection of the six other scalesmeasuring satisfaction with different aspects of jobs (e.g. pay, hours,management) in all cases reveals exactly the same trends away from bothendpoints of the scale (1 and 7) between 1991 and 1992. Discussions withthose involved in the ®eldwork revealed a simple explanation for thiscurious pattern. While the wording of the job satisfaction items in thequestionnaire had remained constant, the showcard was changed. In 1991only the extremes and the midpoint of the seven-point scale were labelled(i.e. `totally satis®ed', `neither satis®ed nor dissatis®ed', `totally dissatis-®ed'), while the other points were just numbers on the scale. This causedbunching around the three labelled points. In subsequent waves, all sevenpoints on the response scale were labelled on the show card, thus reducingthe bunching.4 The OECD's method of analysis ± simply looking at thepercentages who scored on the extremes of the scale ± was highly sensitiveto this change. A summary measure that takes all scores into account, themean, shows only very slight, non-monotonic and non-signi®cant changesover the period 1991±1995.
The other data set which the OECD uses to describe change over timewas collected by International Survey Research (ISR) Ltd. At ®rst glancethis seems to be a valuable large-sample data set, measuring job insecurity
4We are grateful to Nick Buck at the University of Essex for pointing this out to us.
858 BULLETIN
# Blackwell Publishers 2000
using the same measures, in several European countries at several points intime. The OECD shows that all European countries had experienced a dropin satisfaction with job insecurity over the period 1985±1995, but that theUK was the most extreme case, with a massive drop of 22 percentage pointsin those responding favourably to a question about employment security.
However, close scrutiny of ISR's data suggests that it might be of too poora quality for use in such a way. ISR is a commercial organisation, offeringpersonnel and consultancy services. Companies can buy into their annualsurveys and have ISR take a census of their total workforce. For their moneycompanies receive a description of their own workforce, benchmarkedagainst the total data set of tens of thousands of cases, supplied by thedozens of other companies who also bought into the survey within theprevious three years.5 While the data might thus be useful for somepurposes, it makes no attempt to provide a representative or stable samplefor comparison either between countries or over time.
III. DATA AND METHODOLOGY
(i) Data Sets
We base our own conclusions on data collected by two different surveys ±the Social Change and Economic Life Initiative (SCELI) carried out in1986 and the Skills Survey (SS)6 carried out in 1997. One part of SCELIwas a survey of individuals aged 20 to 60 (including 4,041 who were inemployment), while the SS surveyed 2,467 employed individuals in thesame age range.
One design objective of the Skills Survey was to frame a range ofquestions concerning skills and three speci®c questions concerning jobsecurity in a manner identical to that adopted in SCELI. While it was thuspossible to ensure that no spurious trends would emerge as a result ofdifferences in the framing of questions, there remains the issue as towhether the two samples are reasonably comparable. The SS was designedto extract a representative sample for Britain. Full details are provided inAshton et al. (1999). While SCELI's sample was larger, it was concentratedon only six large (mainly urban) areas around Britain, and though theseareas included places of high and low unemployment and other varyingcharacteristics it was not designed to be representative of Britain as a whole.Despite this, previous studies have used SCELI results to compare withsubsequent surveys (e.g. Gallie, 1986), on grounds that the SCELI sampledid nevertheless come close to being representative of Britain as a whole in
5We are grateful to David Ladipo, of the University of Cambridge for uncovering these details,and for the cooperation of ISR.
6This survey was devised by David Ashton, Bryn Davies, Alan Felstead and Francis Green,carried out by Social and Community Planning Research (SCPR) and funded under the Economicand Social Science Research Council's Learning Society Initiative (ESRC Grant No.L123300100151).
JOB INSECURITY AND THE DIFFICULTY OF REGAINING EMPLOYMENT 859
# Blackwell Publishers 2000

terms of key socio-economic characteristics. This judgement is con®rmedby comparisons with other, nationally representative surveys (Green et al.,1999).7
(ii) Measures of Insecurity
The three questions on insecurity were posed with identical wording,prompts, show cards and response sets for the two surveys. One questionasked respondents: `Do you think that there is any chance at all of yourlosing your job and becoming unemployed in the next twelve months?'Those reporting in the af®rmative were asked: `how would you rate thelikelihood of this happening?' and allowed to respond against a 5-pointLikert scale. Combining responses to these two questions, a single six-pointordinal scale of job insecurity was derived, ranging from those who thinkthat there is no chance at all of losing their job and becoming unemployedin the next twelve months through to those who think that such a scenario is`very likely'. We refer to this as the Job Insecurity (JI) Scale. In order tosimplify tabular representation of some of the trends, we also convert the JIScale into a JI Index, by allocating scores of zero to ®ve of increasingperceived risk of job loss.
Another key aspect of insecurity is the cost of job loss. This cost dependson the wages of the current job, on bene®ts while unemployed, on expectedduration of unemployment and on the expected wage of the next job (see,e.g. Bowles, 1985). While previous empirical studies have proxied the costof job loss through measures of wages, bene®ts and unemployment dura-tion, here the focus is on the expected wage and implicitly on expectedunemployment duration. Both surveys asked: `If you were looking for worktoday, how easy or dif®cult do you think it would be for you to ®nd a job asgood as your current one?' From the responses a four-point Dif®culty ofRe-employment (DR) Scale was derived, and a corresponding DR Indexspeci®ed by allocating scores of one to four in increasing order of dif®culty.The DR Scale and Index thus captures some but not all of the majorconstituent elements of the potential cost of job loss facing workers.
(iii) Empirical Procedure
The analysis consists in part of a simple comparison of the JI and DR scalesand indices of insecurity across the two data sets. We also address thedeterminants of insecurity as measured on the JI Scale and the DR scale, inthe following conventional framework.
Let Y�1 be a latent variable measuring perceived risk of job loss andunemployment, and specify:
7As a further check, we con®rmed that the pattern of change discussed below was not sensitiveto the exclusion of SS respondents from the Greater London area.
860 BULLETIN
# Blackwell Publishers 2000

Y�1 � á0 � á0X1 � á2X2 � á3X3 � á4X4 � á5X5 � u (1)
where X1 is a vector of variables capturing the external environment, X2
covers relevant job characteristics, X3 company policies towards employees,X4 respondents' human capital and X5 other relevant personal character-istics. If u is assumed normally distributed, then with the usual assumptionsthat different categories in the scale are observed according as Y�1 falls insix given ranges, the ordinal probit model can be estimated. It will beconvenient to discuss prior predictions for the coef®cient signs along withthe results below. A similar approach is used to analyze the Dif®culty ofRe-employment. We specify Y�2 , as the latent perceived Dif®culty of Re-employment, corresponding to the DR Scale, to depend on an overlappingbut not identical set of explanatory variables, and again estimate coef®cientsusing the ordinal probit model.
IV. FINDINGS
(i) Changes in Job Insecurity and in the Dif®culty of Re-employment
Table 1 depicts responses on the Job Insecurity Scale in 1986 and 1997.Columns 1 and 2 show a fall from 80 percent to 77 percent in the proportionof respondents who were con®dent that their job was not under threat. Ifone took just this as a measure of job insecurity one might conclude thatinsecurity had risen. However, the scale was also squeezed at the other end.A decreasing proportion of respondents rated this as `quite likely' or `verylikely' (8.6 percent for 1986 compared to 7.1 percent for 1997). The samepattern is repeated for men and women considered separately. While
TABLE 1The Job Insecurity Scale, by Sex, 1986 vs 1997
Likelihoodof Job
All Employed Employed Men Employed Women
Loss 1986 1997 1986 1997 1986 1997
No chance 80.0 77.1 77.1 73.7 84.0 81.4Veryunlikely
1.3 1.3 2.0 1.9 0.3 0.6
Quiteunlikely
3.5 5.2 4.9 6.8 1.7 3.3
Evens 6.6 9.2 7.3 10.9 5.7 7.2Quite likely 4.0 3.5 3.9 2.8 4.0 4.2Very likely 4.6 3.6 4.8 3.9 4.3 3.3
Source :Social Change and Economic Life Initiative, 1986 and Skills Survey, 1997.
JOB INSECURITY AND THE DIFFICULTY OF REGAINING EMPLOYMENT 861
# Blackwell Publishers 2000

signi®cantly fewer women than men feared the loss of their job, the scalewas squeezed at both ends for both men and women.
Table 2 depicts the pattern in the DR Scale for the same two years. Here,the unambiguous change, repeated separately for men and women, is for adecrease (signi®cant at the 5% level) in the Dif®culty of Re-employment.For example, whereas in 1986 some 40 percent thought they would ®nd itvery dif®cult to get a job as good as their current one, in 1997 only 28percent thought this.
This fall in the Dif®culty of Re-employment, accompanied by relativestasis in perceptions of job insecurity, cannot be described as a trend, sincewe have only two observation dates at different points in the economiccycle. While unemployment had just peaked at around 11 percent at thetime of SCELI, it had been falling for half a decade to round 6 percent atthe time of the SS. Below we return to address the potential impact ofunemployment on insecurity. Meanwhile it is of interest to record thechanges in insecurity experienced by particular socio-economic groups.
Table 3 utilises the JI Index and the DR Index to summarise patterns ofchange amongst groups de®ned by various characteristics. Row 1 shows asmall rise in the JI Index from 0.67 to 0.71, comparing 1997 with 1986.However, the rise is not statistically signi®cant (t � 1:09). The lack of anysubstantial change is a re¯ection of the squeezing at both ends of the JIScale shown in Table 1. Columns (3) and (4) show a substantive andsigni®cant fall in the DR Index (t � ÿ9:53), corresponding to the shiftingDR Scale depicted in Table 2.
Different groups experienced a wide range of Job Insecurity changes. In1986, professional workers were among the most secure, but by 1997 theyranked highest in job insecurity. Sales occupations, by contrast, recorded asigni®cant fall in job insecurity. Taken together, the non-manual occupa-tions experienced a signi®cant rise in insecurity from 0.54 to 0.67, while themanual occupations experienced a fall in insecurity from 0.93 to 0.81 that
TABLE 2The Dif®culty of Re-employment Scale, by Sex, 1986 vs 1997
How Easy toGet AnotherJob As Good As
All Employed Employed Men Employed Women
Current One: 1986 1997 1986 1997 1986 1997
Very easy 4.7 6.9 4.9 5.5 4.5 8.5Quite easy 16.4 24.2 14.9 21.8 18.4 27.2Quite dif®cult 39.1 40.6 37.2 39.7 41.8 41.8Very dif®cult 39.8 28.3 43.0 33.0 35.3 22.6
Source :Social Change and Economic Life Initiative, 1986 and Skills Survey, 1997.
862 BULLETIN
# Blackwell Publishers 2000
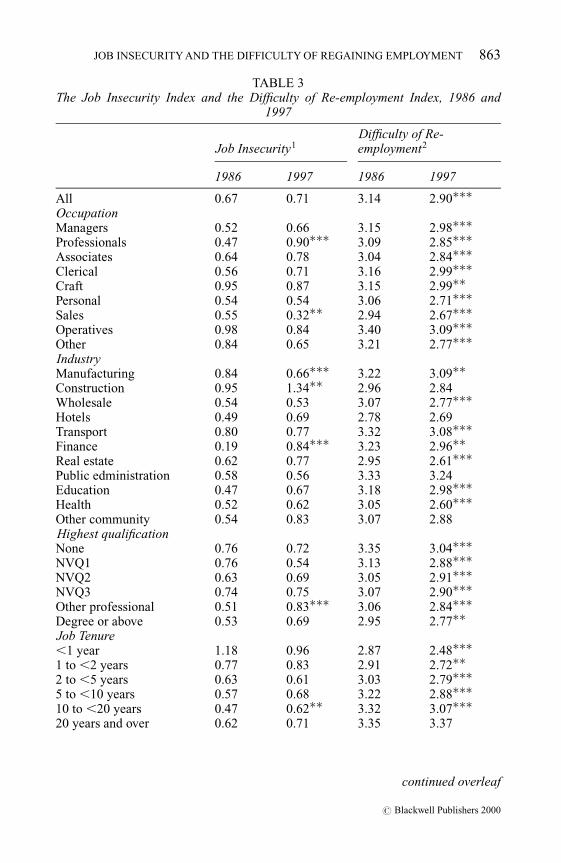
TABLE 3The Job Insecurity Index and the Dif®culty of Re-employment Index, 1986 and
1997
Job Insecurity1Dif®culty of Re-employment2
1986 1997 1986 1997
All 0.67 0.71 3.14 2.90���OccupationManagers 0.52 0.66 3.15 2.98���Professionals 0.47 0.90��� 3.09 2.85���Associates 0.64 0.78 3.04 2.84���Clerical 0.56 0.71 3.16 2.99���Craft 0.95 0.87 3.15 2.99��Personal 0.54 0.54 3.06 2.71���Sales 0.55 0.32�� 2.94 2.67���Operatives 0.98 0.84 3.40 3.09���Other 0.84 0.65 3.21 2.77���IndustryManufacturing 0.84 0.66��� 3.22 3.09��Construction 0.95 1.34�� 2.96 2.84Wholesale 0.54 0.53 3.07 2.77���Hotels 0.49 0.69 2.78 2.69Transport 0.80 0.77 3.32 3.08���Finance 0.19 0.84��� 3.23 2.96��Real estate 0.62 0.77 2.95 2.61���Public edministration 0.58 0.56 3.33 3.24Education 0.47 0.67 3.18 2.98���Health 0.52 0.62 3.05 2.60���Other community 0.54 0.83 3.07 2.88Highest quali®cationNone 0.76 0.72 3.35 3.04���NVQ1 0.76 0.54 3.13 2.88���NVQ2 0.63 0.69 3.05 2.91���NVQ3 0.74 0.75 3.07 2.90���Other professional 0.51 0.83��� 3.06 2.84���Degree or above 0.53 0.69 2.95 2.77��Job Tenure,1 year 1.18 0.96 2.87 2.48���1 to ,2 years 0.77 0.83 2.91 2.72��2 to ,5 years 0.63 0.61 3.03 2.79���5 to ,10 years 0.57 0.68 3.22 2.88���10 to ,20 years 0.47 0.62�� 3.32 3.07���20 years and over 0.62 0.71 3.35 3.37
continued overleaf
JOB INSECURITY AND THE DIFFICULTY OF REGAINING EMPLOYMENT 863
# Blackwell Publishers 2000

was not quite signi®cant (p � 0:13).8 It is the more highly educated who onaverage have suffered increases in job insecurity. Across industries manu-facturing workers, in 1986 among the most insecure, enjoyed much lessinsecurity in 1997, while ®nancial sector workers switched from being mostsecure to being among the least secure. However, all sectors and occupa-tions bene®ted from signi®cant reductions in the perceived dif®culty ofgaining re-employment in an equivalent job.
Much existing research on job insecurity has centred on changes in jobtenure, on the assumption that those with longer tenure perceive a lower riskof unemployment. However, Table 3 suggests that the relationship betweentenure and the JI Index is `U-shaped'. The precise shape is likely to havebeen in¯uenced by the economic cycle. Compared with 1986 the point
TABLE 3(continued)
Job Insecurity1Dif®culty of Re-employment2
1986 1997 1986 1997
Under 35 0.74 0.67 2.97 2.70���Over 35 0.62 0.74�� 3.26 3.03���Permanenty 0.48 0.58 3.16 2.92Temporaryy 2.72 2.28 3.03 2.81Women with dependent
children0.64 0.60 3.00 2.70���
Full time 0.66 0.69 3.17 2.93���Part time 0.70 0.79 3.03 2.80���Self-employed 0.45 0.74�� 3.08 2.88��Employees 0.69 0.71 3.15 2.91���
Notes :y The de®nitions of `temporary' and `permanent' differ between the two data sets, so comparisons
between 1986 and 1997 are not valid. The SCELI asked respondents how they thought theiremployer considered their job, whereas SS asked respondents whether they thought their job waspermanent or not.
1. The Job Insecurity Index, measuring the likelihood of job loss, is derived from the Job InsecurityScale (see Table 1). It is calculated by awarding a score of 0 to those respondents reporting `nochance at all' of job loss, 1 to those reporting it as `very unlikely', 2 to those reporting it as `quiteunlikely', and so on. This gives a minimum score of 0 and a maximum of 5 for each individual.The table reports the mean scores for each group.
2. The Dif®culty of Re-employment Index is derived from the Dif®culty of Re-employment Scale(see Table 2) by allocating a score of 1 to those who report it `very easy' to get another job as goodas the current one, rising to 4 for where it is `very dif®cult'. The table reports the mean scores foreach group.Asterisks indicate tests of the hypotheses within each group that the indices differ between 1986and 1997; � indicates p , 0:10; �� indicates p , 0:05; ��� indicates p , 0:01.
8Further detailed analysis (not shown) revealed that squeezing of the JI Scale arose from areduction in the proportion of manual workers who felt very insecure, along with a reduction inthe proportions of non-manuals who felt completely secure.
864 BULLETIN
# Blackwell Publishers 2000

estimates of JI are lower in 1997 for short-tenured workers and higher forlong-tenured workers. This may be because short-tenured workers are morelikely to have been recent voluntary quitters in the comparative boom of1997. By contrast, the DR Index in both years shows that longer tenuredworkers perceive they would have more dif®culty ®nding re-employment.In 1997 those workers with very long tenure (over 20 years) have about anaverage fear of job loss, but would ®nd most dif®culty gaining re-employ-ment at an equivalent level.
Other research on insecurity focuses on ¯exibility and on non-standardforms of work. Table 3 shows that part-timers are a little more insecure thanfull-timers, but the difference is insigni®cant; moreover, part-timers experi-enced a lower DR Index. The self-employed, who in 1986 were less insecurethan employees, were in 1997 little different on average from employees.The biggest differences are found, unsurprisingly, according to the type ofemployment contract. Temporary jobs carried much greater Job Insecuritythan permanent jobs in both 1986 and 1997.9
Although the summary statistics in Tables 1 to 3 do not reveal anaggregate trend towards greater insecurity, it might be conjectured that thereis, nevertheless, a structural shift in the link between perceived insecurityand what are normally taken as the objective indicators of insecurity. If it isassumed that unemployment itself is the overiding factor causing insecurity,then the fact that job insecurity did not fall is striking, given that aggregateunemployment in 1997 was not much more than half what it was in 1986.10
In order to assess whether such a structural shift may have occurred, atwo-part strategy was followed. First, we control as far as possible for theimpact of changes in other variables (excluding unemployment) affectinginsecurity. We pooled data from the SS and SCELI, and estimated ordinalprobit models based on (1), using the range of independent variables thatwere common to the two sets. The results are summarized in Table 4. The®rst panel reports coef®cients on a dummy variable for SS respondent, withall observations from both surveys included in the same ordinal probitestimation. In the case of the JI Index, the SS dummy is positive butinsigni®cant, indicating that even after controlling for changes in many keyvariables normally associated with ¯exibility and insecurity ± includingpart-time status, unionism, self-employment, age, marital status, dependentchildren, gender, occupation and industry ± there remains no downwardchange in insecurity.11 In the case of the DR Index, the coef®cient issigni®cantly negative, indicating a reduction in the Dif®culty of Re-employ-ment, which is consistent with the lower aggregate unemployment rate.
The second panel of Table 4 repeats the investigation allowing the controlvariables to have different coef®cients in the two years. Separate estimations
9In Burchell et al. (1997), we also focus on `Employment Security', indexed by the product ofJI and DR; this index also showed no more insecurity in 1997 than in 1986.
10The probability of job loss for each employed person, however, has fallen by less.11We discuss the impact of the control variables below.
JOB INSECURITY AND THE DIFFICULTY OF REGAINING EMPLOYMENT 865
# Blackwell Publishers 2000

from each year are obtained. The null hypothesis that all coef®cients are thesame in both years is decisively rejected in a likelihood ratio test, and hencefrom the statistical angle these estimates are to be preferred. Then, taking asthe base case a hypothetical average respondent from the total pooledsample, the predicted difference in the indicator variables Y�1 and Y�2between the two years is reported in panel two. As in panel one, there is asigni®cant downward shift in the DR Index. However, the conditionalchange in the JI Index between 1986 and 1997 is now not only positive butsigni®cant. Thus, for our given hypothetical individual job insecurity wouldhave risen between 1986 and 1997. The absence of a fall in job insecurityremains thus unexplained.
Unfortunately, two important variables could not be used in this part ofthe investigation. The variable indicating the temporary status of jobcontracts was derived from rather different questions: in the SS the questionwas modelled on a similar question in the Labour Force Survey focussingdirectly on the employees' perceptions, while the SCELI questions askedrespondents whether they thought their employer considered their job to bepermanent. The other key variable was the state of the external labourmarket. In the nature of SCELI (there being only six areas) the variation inthe local unemployment rate was limited to group variation between areas.The lack of these two variables in the pooled ordinal probit analysis meansthat it was not possible to estimate directly whether there was any change in
TABLE 4Changes in Perceived Insecurity, Controlling for Changes in Common Variables
JI Scale DR Scale
Pooled Ordinal Probit: 0.043 ÿ0.283Estimated Coef®cient and t-statistic on SS
Dummy Variable(1.06) (ÿ8.91)
n 5642 5831pseudo R2 0.03 0.07log likelihood ÿ4580.99 ÿ6494.80
Estimated change, SS minus 1.62 1.00SCELI, allowing all coef®cients to change, and
t-statisticy(2.93) (2.27)
Likelihood ratio test for null hypothesis that allcoef®cients do not change (critical ÷2 � 20:1)
102.07 138.04
Note :y Calculated for a hypothetical individual with characteristics average over both years.
In each case, the Scales formed the dependent variable in an ordinal probit estimation. Coef®cientsgive estimated marginal effects on the latent variable measuring, respectively, job insecurity anddif®culty of re-employment. Control variables were: 8 occupation dummies, 10 industry dummies,gender, part-time, age squared, marital status, dependent children, 4 highest quali®cation dummies,4 establishment size dummies, job tenure and its square, unionisation recognition and membership,and self-employment.
866 BULLETIN
# Blackwell Publishers 2000

insecurity after controlling for changes in unemployment and temporarywork.
However, with the Skills Survey it was possible to match in unemploy-ment rates (and changes thereof) with Travel-to-Work-Areas. The secondpart of the investigation strategy was therefore to examine the detaileddeterminants of the JI and DR Scales using the SS data, including these keyvariables and other selected variables from the rich set derivable from otherquestions. Thus, in addition to examining hypotheses about the determina-tion of insecurity in a cross-section, it becomes possible to estimate theimpact of local unemployment and of temporary working, and to use theestimates to assess indirectly whether there has been any structural shift.
(ii) Determinants of Job Insecurity
Estimates of the ordinal probit model of job insecurity (1) are presented inTable 5.12 It is instructive to consider the determinants of job insecurity inthe framework of ®ve sets of variables (represented by X1 to X5). First, X1
represents the impact of the external labour market environment on percep-tions of unemployment risk. While it is not possible, in a cross-section, touncover directly the impact of the economic cycle, it is possible to estimatethe impact of unemployment in each respondent's Travel-To-Work-Area.Column (1) shows a positive and signi®cant impact of local unemploymenton respondents' perceptions of unemployment risk, suggesting that theyinfer fragility of their own job from high unemployment in the localeconomy (presumably quite rationally). We also examined whether theannual change in the unemployment rate altered perceptions of job insecur-ity; the coef®cient estimate is, however, quite insigni®cant.
It could be argued that non-standard employment or the external labourmarket might have somewhat different impacts on workers in high-paid andlow-paid occupations. We therefore split the sample into high-paid and low-paid occupations. A likelihood ratio test rejected the null hypothesis that allcoef®cients were the same in the two groups (÷2 � 65:8). Columns (2) and(3) show that the positive impact of the local unemployment rate is onlysigni®cant in the case of the lower-paid occupations.
Second, X2 covered the impact of job characteristics, including in parti-cular those associated in the literature with perceived insecurity. Asexpected, being on a temporary job contract substantially raises the risk ofunemployment in all occupations. Being in a part-time job was also asso-ciated with higher job insecurity ± though the impact failed to reachstatistical signi®cance in the high wage occupations. These two ®ndingscon®rm the general tenor of the assumptions made linking non-standardwork with insecurity.
12The model is estimated only on employees, since a number of variables were not asked of theself-employed.
JOB INSECURITY AND THE DIFFICULTY OF REGAINING EMPLOYMENT 867
# Blackwell Publishers 2000

TABLE 5Determinants of Job Insecurity. Ordinal Probit Estimates
(1) (2) (3)
AllHigh WageOccupationsy
Low WageOccupations{
External Unemployment rate 3.75(1.85)��
1.90(2.99)
4.42(2.41)�
X1 Annual change in unemployment rate 3.58(8.23)
ÿ8.84(13.3)
8.55(10.70)
JobCharacteristics
Temporary 1.17(0.10)���
1.10(0.18)���
1.25(0.13)���
X2 Part-time 0.27(0.10)���
0.23(0.17)
0.33(0.12)���
Union recognised 0.03(0.09)
0.15(0.15)
0.02(0.11)
Union recognised and union member 0.06(0.10)
0.11(0.14)
0.03(0.12)
Estab size: 1 ÿ0.37(0.29)
ÿ0.10(0.43)
ÿ0.50(0.42)
25±99 ÿ0.02(0.08)
ÿ0.09(0.13)
0.02(0.10)
100±499 ÿ0.10(0.09)
0.05(0.14)
ÿ0.15(0.12)
500 or more ÿ0.01(0.10)
ÿ0.07(0.15)
0.05(0.14)
Industry dummies Included Included IncludedOccupation dummies Included Included Included
868
BU
LL
ET
IN
#B
lackw
ellP
ublish
ers2000

Company HRPolicies
Appraisal in last year ÿ0.13(0.07)�
ÿ0.25(0.11)��
ÿ0.08(0.09)
X3 Management consults employees ÿ0.09(0.07)
ÿ0.05(0.13)
ÿ0.10(0.09)
Human capital andother personalcharacteristics
Job tenure (months) ÿ0.00235(0.00087)���
ÿ0.00142(0.00141)
ÿ0.00292(0.00116)��
Job Tenure Squared� by 100
0.00060(0.00021)���
0.00055(0.00034)
0.000627(0.000292)��
X4 and X5 Highest quali®cation§:None ÿ0.12
(0.11)ÿ0.15(0.26)
ÿ0.11(0.14)
NVQ1 ÿ0.05(0.13)
0.15(0.27)
ÿ0.07(0.16)
NVQ2 0.095(0.093)
0.11(0.17)
0.11(0.11)
OtherProfessional
0.10(0.11)
0.01(0.16)
0.27(0.18)
Degree or above 0.01(0.12)
0.06(0.43)
ÿ0.24(0.25)
Age 0.00389(0.0241)
0.022(0.044)
ÿ0.014(0.029)
Age squared 0.0000(0.0003)
ÿ0.0003(0.0005)
0.00026(0.0003)
Female ÿ0.14(0.08)
ÿ0.13(0.13)
ÿ0.16(0.11)
Married ÿ0.02(0.07)
0.00(0.11)
ÿ0.02(0.09)
continued overleaf
JOB
INS
EC
UR
ITY
AN
DT
HE
DIF
FIC
UL
TY
OF
RE
GA
ININ
GE
MP
LO
YM
EN
T869
#B
lackw
ellP
ublish
ers2000

TABLE 5(continued)
(1) (2) (3)
AllHigh WageOccupationsy
Low WageOccupations{
Female with dependent children ÿ0.16(0.08)
ÿ0.15(0.17)
ÿ0.18(0.13)
Sample size 2122 740 1382Log likelihood ÿ1713.71 ÿ679.79 ÿ1001.02Log-L (slopes � 0) ÿ1842.52 ÿ729.14 ÿ1095.1715
Notes :The dependent variable is the Job Insecurity Scale: for the de®nition, see Table 1 and text.y Managers & Administrators, Professionals and Associate Professionals and Technical Occupations.{ Clerical & secretarial; Craft & related; Personal & protective services; Sales; Plant & machine operatives; Other.§ Equivalent Levels; reference category � NVQ Level III.Standard errors in brackets; signi®cance levels at 1% (�), 5% (��) or 10% (���).
870
BU
LL
ET
IN
#B
lackw
ellP
ublish
ers2000
The impact of unions on insecurity is theoretically ambivalent. On onehand, unionism may add protection against unfair dismissal and also raisethe cost to ®rms of making workers redundant. On the other hand, to theextent that unions raise wages and are also concentrated among olderindustries, unionised workers might expect a greater risk of unemployment.In addition, union membership could be endogenous, in that feelings ofinsecurity might induce joining a union (Bender and Sloane, 1999). In theevent unionism ± measured both as being in a recognised workplace and inaddition being a union member ± had a very small, insigni®cant, effect onjob insecurity. Ironically, while unions have emphasised the problem of jobinsecurity in their attempts to in¯uence policy making (TUC 1995, 1996),they have no observable direct impact on the insecurity of their members.
Third, we control for whether a range of company human resourcepractices had any impact on employees' perceived insecurity. It can beargued that a policy to ensure information ¯ows ef®ciently from manage-ment to workers will enable a more informed judgement about anyredundancy possibility. First, respondents were asked whether they hadbeen formally appraised in the previous year. The estimates show that theimpact of appraisal is to reduce fears of unemployment, though notsigni®cantly so for low-paid occupations. Second, respondents were askedwhether management arranged meetings where employees could expressviews about the organisation. Such consultation is weakly associated withlower insecurity among low-paid occupations, though the impact wasinsigni®cant. Other policies, including suggestion schemes, and meetingsto inform employees about the organization, had very small impacts andare not included in Table 5. Overall, the impact of company humanresource policies on employees' fears of unemployment appears to berather small.
Fourth, the impact of human capital variables on perceived job insecuritywas considered. Job tenure is typically taken as a proxy for ®rm-speci®chuman capital. For this reason, and because of the value to ®rms ofsustaining internal labour markets, long tenure has been taken as anindicator of greater security. However, as with the raw data, tenure and jobinsecurity follow a U-shaped association. A possible explanation (which wecannot test with the current data) is that workers with very long job tenuremight perceive greater job insecurity than those with somewhat less tenure,if they judge their skills to be obsolescent. Alternatively tenure could beendogenous: with a heterogeneous workforce, those most at risk from jobloss might be less inclined than others to be mobile, and hence have lowerquit rates. For low-paid occupations the lowest insecurity is experienced ataround 19 years. The marginal impact of job tenure on Y�1 is negative andsigni®cant (p-value of 0.011) when evaluated at the median (5.6 years).Hence it would be valid to associate ceteris paribus falls in median jobtenure for this group with rises in job insecurity. For high-paid occupationsthe trough occurs at 11 years, though in this case the effect of tenure just
JOB INSECURITY AND THE DIFFICULTY OF REGAINING EMPLOYMENT 871
# Blackwell Publishers 2000

fails to reach signi®cance. The effect of marginal changes in tenureevaluated at the median (7.8 years) is small and insigni®cant.
Finally, variables representing other personal characteristics were in-cluded as controls. Of interest is the impact of gender, since the long-termgrowth of employment of women might suggest greater job security forwomen. Gregg et al. (1997) also point to the impact of maternity regulationsin providing security against dismissal on grounds of motherhood. The jointimpact of `Female' and `Female With Dependent Child' is positive(÷2 � 8:25, p-value � 0:02), indicating that, compared with men, womenwith dependent children feel more secure in their jobs.13
(iii) Determinants of the Dif®culty of Re-employment
In the case of the DR Scale, the impact of the external environment (i.e.local labour market conditions) is strongly con®rmed, as shown in Table 6.Employees in areas with high and/or increasing unemployment judged thatregaining equivalent employment would be more dif®cult than those inlower unemployment areas. A plausible interpretation is that those in highunemployment areas would perceive a greater likelihood of having to passthrough a spell of unemployment during job search. Alternatively, for thosewho have become unemployed, there would be perceived to be a smallerchoice of jobs in a high unemployment area.
In respect of job characteristics, our expectation was that ceteris paribusbetter jobs would be judged to be more dif®cult to replace with equallygood jobs following redundancy. Con®rmation of this expectation derivesfrom ®ndings that unionised jobs are judged more dif®cult to replace, whileunskilled jobs that take less than one month to learn are the more easilyreplaced. In column (2) we added two measures of job rewards: the log ofhourly pay and whether the employer contributes to an occupational pensionscheme. Both variables have positive coef®cients and together are statisti-cally signi®cant (p � 0:07). Columns (1) and (2) also show that employeesin large establishments (greater than 500 workers) judge their chances ofregaining equivalent employment to be signi®cantly easier than those insmaller establishments. These various ®ndings held also in respect of high-paid and low-paid occupations taken separately (columns (3) and (4)).However, temporary jobs ± which are presumably less desirable per se thanpermanent jobs ± were nevertheless judged the more dif®cult to regain. Apossible explanation for this ®nding is that temporary workers may be morelikely than permanent workers to have to try to regain employment via aspell of unemployment.
We expected that, controlling for job characteristics, an individual'stransferable human capital should make it easier to ®nd an equivalent job.
13However, the association is strongest for low-paid occupations; for high-paid occupations thep-value is 0.21.
872 BULLETIN
# Blackwell Publishers 2000

TABLE 6Determinants of The Dif®culty of Re-Employment. Ordinal Probit Estimates
(1) (2) (3) (4)
All AllHigh WageOccupationsy
Low WageOccupations{
External Unemployment rate 4.10(1.48)���
4.01(1.56)���
5.85(2.53)��
3.63(1.86)��
X1 Annual change inunemployment rate
16.34(6.58)��
ÿ14.15(2.04)��
33.05(11.29)���
8.77(8.21)
JobCharacteristics
Temporary 0.18(0.01)�
0.23(0.10)��
0.19(0.17)
0.15(0.12)
X2 Part-time 0.04(0.08)
0.09(0.08)
0.37(0.16)��
ÿ0.03(0.09)
Union recognised 0.11(0.07)
0.08(0.07)
ÿ0.02(0.13)
0.18(0.09)��
Union recognised and unionmember
0.26(0.07)
0.25(0.08)���
0.30(0.12)��
0.21(0.09)��
Estab size: 1 0.08(0.21)
0.15(0.64)
0.05(0.36)
ÿ0.00(0.27)
25±99 ÿ0.02(0.06)
ÿ0.02(0.07)
ÿ0.03(0.11)
ÿ0.05(0.08)
100±499 ÿ0.11(0.07)
ÿ0.10(0.07)
ÿ0.12(0.12)
ÿ0.11(0.09)
500 or more ÿ0.23(0.08)���
ÿ0.21(0.09)��
ÿ0.27(0.13)��
ÿ0.21(0.11)�
continued overleaf
JOB
INS
EC
UR
ITY
AN
DT
HE
DIF
FIC
UL
TY
OF
RE
GA
ININ
GE
MP
LO
YM
EN
T873
#B
lackw
ellP
ublish
ers2000

TABLE 6(continued)
(1) (2) (3) (4)
All AllHigh WageOccupationsy
Low WageOccupations{
Computer usage ÿ0.20(0.07)���
ÿ0.22(0.07)���
ÿ0.21(0.10)��
ÿ0.15(0.11)
Easily learned} ÿ0.20(0.07)���
ÿ0.23(0.07)���
ÿ0.12(0.17)
ÿ0.19(0.07)��
Log hourly pay ± 0.111(0.071)
± ±
Pension scheme (employerpays in)
± 0.10(0.06)
± ±
Industry dummies Included Included Included IncludedOccupation dummies Included Included Included Included
HumanCapital and otherpersonalcharacteristics
Job tenure (months) 0.00353(0.00071)���
ÿ0.00293(0.00076)���
0.00407(0.00120)���
0.00303(0.00093)���
Job tenure squared � by 100 ÿ0.000576(0.000182)���
0.000503(0.000189)�
ÿ0.000793(0.000297)���
ÿ0.000297(0.000250)
X4 and X5 Highest Quali®cationa:None 0.16
(0.09)�0.19
(0.09)��0.22
(0.21)0.10
(0.10)NVQ1 0.02
(0.10)0.02
(0.11)0.07
(0.23)ÿ0.01(0.12)
NVQ2 0.02(0.07)
0.03(0.08)
0.18(0.14)
ÿ0.07(0.09)
874
BU
LL
ET
IN
#B
lackw
ellP
ublish
ers2000

Other professional ÿ0.14(0.09)
ÿ0.16(0.10)
0.06(0.36)
ÿ0.30(0.14)��
Degree or above ÿ0.18(0.09)�
ÿ0.22(0.10)��
ÿ0.01(0.14)
ÿ0.45(0.18)��
General skills§ ÿ0.12(0.06)��
ÿ0.13(0.06)��
ÿ0.22(0.10)��
ÿ0.06(0.08)
Registered disability 0.63(0.25)��
0.57(0.27)��
ÿ0.19(0.39)
ÿ0.97(0.33)���
Age ÿ0.0444(0.0195)��
ÿ0.0513(0.0207)��
ÿ0.0265(0.0383)
ÿ0.0487(0.0231)��
Age squared 0.000798(0.000246)���
0.000895(0.00026)���
0.00053(0.00047)
0.00087(0.00029)���
Female ÿ0.21(0.07)���
ÿ0.19(0.07)���
0.03(0.10)
ÿ0.32(0.09)���
Married ÿ0.02(0.05)
ÿ0.03(0.06)
ÿ0.05(0.09)
ÿ0.02(0.07)
Female with dependentchildren
ÿ0.03(0.08)
ÿ0.03(0.08)
ÿ0.34(0.14)��
0.09(0.09)
Sample size 2140 1968 740 1400Log likelihood ÿ2425.27 ÿ2233.95 ÿ829.26 ÿ1568.57Log-L (slopes � 0) ÿ2651.83 ÿ2435.70 1912.58 ÿ1736.93
Notes:The dependent variable is the Dif®culty of Re-employment Scale: for the de®nition, see Table 2 and text.y Managers and Administrators, Professionals and Associate Professionals and Technical Occupations.{ Clerical and secretarial; Craft and related; Personal and protective services; Sales; Plant and machine operatives; Other.a Current job skills would be `very useful' for another employer in same or another industry.§ Takes less than a month to learn to do job well.Standard errors in brackets; signi®cance levels at 1% (�), 5% (��) or 10% (���).§ Equivalent Levels; reference category � NVQ Level III.
JOB
INS
EC
UR
ITY
AN
DT
HE
DIF
FIC
UL
TY
OF
RE
GA
ININ
GE
MP
LO
YM
EN
T875
#B
lackw
ellP
ublish
ers2000

This expectation is strongly con®rmed in three ways. First, those with atleast degree-level quali®cations, judged it easier to gain re-employment.Second, we asked respondents to assess how useful (on a four-point scale)the skills they used on their current job would be if they were to work foranother employer. `General Skills' was de®ned to take the value 1 if theirskills were thought `very useful' for another employer whether in the sameor in another industry. This variable had a negative impact on the DR Scale,especially among the high-paid occupations. Third, we asked respondentsabout how if at all they used computers at work. The variable `ComputerUsage', which takes the value 1 if they used computers for complex oradvanced purposes, is an indicator of a particular general skill which iswidely assumed and has been shown to be especially valuable on the labourmarket (e.g. Krueger, 1993). As expected, this variable also is negativelyrelated to the DR Scale.
In so far as job tenure measures ®rm-speci®c human capital, such capitalwould not be considered of value in regaining employment. In addition,higher job tenure is likely to be an indicator of greater commitment to anorganisation and, in internal labour markets, higher rewards linked toseniority. In line with these expectations, employees with greater job tenurejudged signi®cantly greater dif®culty in regaining equivalent employment ±though the marginal increase tapered off to zero at 26 years. Finally, amongthe low-paid occupations, being female was associated with greater ease ofre-employment consistent with the assumption of a more buoyant generallabour market for women; and being a registered disabled person also raisedthe DR Scale measure, presumably because this was feared to narrow downthe range of job opportunities.
(iv) Predicted Changes in Insecurity
We are now in a position to complete the second part of our researchstrategy on the issue as to whether there has been a distinct shift inperceptions of insecurity in Britain. While the above analysis reviewed theextent to which the coef®cient signs were in line with expectations, a keyquestion is whether the sorts of changes that might be plausible to envisagein the external labour market and in temporary working could causesubstantive changes in insecurity. We try to answer this question by takingthe coef®cients on unemployment and on temporary working in Tables 5and 6 to be a ®rst approximation to the impact of changes in these variablesover time. Arguably, this method could understate the impact of changes inaggregate unemployment, since a rise in unemployment everywhere reducesthe options of changing Travel-To-Work Area in search of employment.Table 7 presents predictions for three possible scenarios. For comparison,the ®rst column shows predicted frequency responses in the JI and DRscales for the existing sample, using coef®cient estimates from columns (1)of Tables 5 and 6 and the sample values for the RHS variables. Scenario (1)
876 BULLETIN
# Blackwell Publishers 2000
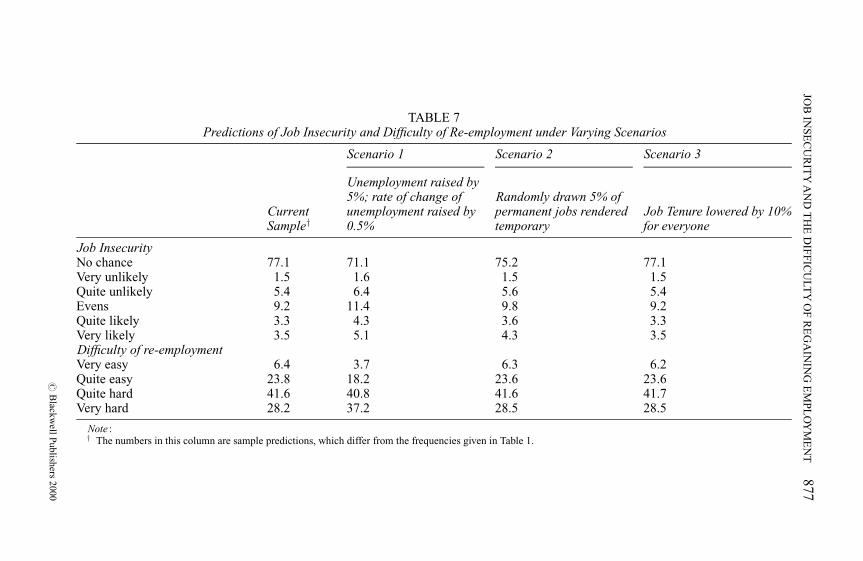
TABLE 7Predictions of Job Insecurity and Dif®culty of Re-employment under Varying Scenarios
Scenario 1 Scenario 2 Scenario 3
CurrentSampley
Unemployment raised by5%; rate of change ofunemployment raised by0.5%
Randomly drawn 5% ofpermanent jobs renderedtemporary
Job Tenure lowered by 10%for everyone
Job InsecurityNo chance 77.1 71.1 75.2 77.1Very unlikely 1.5 1.6 1.5 1.5Quite unlikely 5.4 6.4 5.6 5.4Evens 9.2 11.4 9.8 9.2Quite likely 3.3 4.3 3.6 3.3Very likely 3.5 5.1 4.3 3.5Dif®culty of re-employmentVery easy 6.4 3.7 6.3 6.2Quite easy 23.8 18.2 23.6 23.6Quite hard 41.6 40.8 41.6 41.7Very hard 28.2 37.2 28.5 28.5
Note :y The numbers in this column are sample predictions, which differ from the frequencies given in Table 1.
JOB
INS
EC
UR
ITY
AN
DT
HE
DIF
FIC
UL
TY
OF
RE
GA
ININ
GE
MP
LO
YM
EN
T877
#B
lackw
ellP
ublish
ers2000
gives predicted frequencies if the unemployment rate is everywhere raisedby 5 percentage points and the change in the unemployment rate by 0.5percentage points. It shows a substantial shift up the JI Scale. For example,some 29 percent would think there was some chance of becoming unem-ployed in the coming year: this compares with just 23 percent (predictedand actual) in the existing 1997 sample, and an actual frequency of just 20percent in the 1986 sample who expressed this risk assessment. Thissuggests that there has indeed been an upward shift in job insecurity, in thatif unemployment had not been much lower in 1997 than in 1986 jobinsecurity would have been substantially greater.
Scenario (1) also shows a substantial change in the perceived dif®culty ofre-employment. In this case, however, the rises in unemployment and itsrate of change would just move the DR Scale to approximately the levels of1986. This ®nding suggests that there has been no particular trend inperceptions of the dif®culty of getting jobs, and that the observed fall isconsistent with a purely cyclical effect.
Scenario (2) considers whether the predicted impact of unemploymentcould have been counterbalanced by a rise in temporary working. LFSestimates show temporary working rising from 5.4 percent in 1986 to 7.5percent in 1997. In order to give this variable a chance to impact on security,in Scenario (2) we imagine converting a randomly drawn 5 percent ofpermanent jobs into temporary ones. However, in comparison with the ®rstcolumn, the impact is quite small. So the failure of job insecurity to fallcannot be explained by the rise in temporary working. Since we have alsoeliminated other variables common to the two data sets, we conclude thatthere have been other factors, unobserved in the current data sets, whichhave shifted upwards the level of job insecurity in Britain.
Finally, for good measure we suggest in Scenario (3) that job tenure isunlikely to be central to the question of perceived job insecurity. Wearbitrarily assume a cut in job tenure by 10 percent for all sample membersand derive predicted frequencies. Comparison with column (1) indicatesthat the impact is very small.
V. CONCLUSIONS
What evidence we have ± based on work history data in SCELI ± points tosome signi®cant increases in subjective feelings of job insecurity in thedecade 1976±1986, before the time period of the present study. In theperiod 1966±1986 an advantage, in terms of security, of white collarworkers over blue collar workers was maintained, and even, if anything,increased slightly while both groups became much more insecure when thelate-1970s recession hit (Burchell, 1999). It has recently become almost theconventional wisdom that the period since the mid 1980s is also character-ized by increasing insecurity. Yet, hitherto, there is surprizingly littleempirical data on the extent, pattern and determinants of perceived insecur-
878 BULLETIN
# Blackwell Publishers 2000

ity. Our central aggregate ®ndings are that, while Job Insecurity hasremained largely unchanged or drifted slightly upwards, the Dif®culty ofRe-employment is substantively lower in 1997 than in 1986.
Why then has there been so much media coverage about insecurity inrecent years (OECD, 1997)? One possible resolution of this puzzle is the®nding that insecurity has increased among the professional classes, whileit has fallen among those who were traditionally less secure in the ®rstplace. This redistribution of insecurity could have been selectively per-ceived as an increase in aggregate insecurity, because the groups who haveexperienced insecurity increases are nearer to the centre of British politicaland media culture. While we have no independent evidence to support thisconjecture, it remains important to analyse job security at a more detailedlevel.
One quali®cation to our ®ndings is that we have here only examinedsome, albeit important, elements of work-related insecurity. One element ofthe cost of job loss, namely the amount of bene®ts receivable whileunemployed, is not included in our analysis, though changes in this mayhave contributed to changes in feelings of insecurity.
However, the most important reason to look beyond the simple aggregatechange is that, unsurprisingly, insecurity depends strongly on unemploy-ment itself. We have argued that, despite stasis in the Job Insecurity Index,there has been an upward shift in the link between job insecurity and othervariables. We have shown this in two complementary ways. First, control-ling for as many possible variables as were common to the 1986 and 1997data sets, a hypothetical individual with average characteristics is shown tohave an increase in job insecurity. Two excluded variables at this stage wereunemployment and temporary working, and if changes in unemploymenthave a major effect we should have expected a fall in insecurity. Second,taking detailed estimates for 1997 which include the effect of the externallabour market, we have shown that plausible changes in unemployment havesubstantially larger predicted effects than plausible changes in temporaryworking or indeed in other variables such as job tenure. Had there been noshift in job insecurity, the changes in unemployment since 1986 would haveinduced a noticeable fall in job insecurity. The implications of this ®ndingfor macroeconomic management of the economy are plain to see: a returnto high unemployment would have even more severe welfare consequencesthan in the 1980s.
Explanations for the upward shift in the job insecurity relationship liebeyond the scope of this paper. A good candidate would be the more evenexperience of the 1990 economic recession in Britain, which meant that allregions experienced high unemployment and that higher-status occupationsalso suffered relatively more than in earlier recessions. If more employeeshad an experience of unemployment or came into contact with unemployedpeople through social networks, and if memories of unemployment aresuf®ciently long, it could explain why in 1997 there was not a very much
JOB INSECURITY AND THE DIFFICULTY OF REGAINING EMPLOYMENT 879
# Blackwell Publishers 2000
lower level of Job Insecurity than found in our survey. However, there is nomeans of testing this conjecture with this data.
An assumption that is amply con®rmed by our study is the strong positiveassociation between a job being temporary and insecurity. It appears quitevalid, therefore, to study temporary working as part of the problem ofinsecurity, even though plausible changes in temporary working over thenext decade are unlikely to be large enough to alter aggregate insecurityvery much.
A further conclusion concerns the extent to which it is useful to examinetrends in job tenure, as giving important clues to insecurity. Underlying thenotion of the ending of `jobs for life' is the assumption, made explicit in anumber of studies, that longer tenure proxies for greater security. Our®ndings have shown that this is not wholly accurate. Tenure and jobinsecurity follow a U-shaped relationship. After a certain period ± as shortas ®ve years for 1997 ± there is a static or positive relationship betweentenure and job insecurity. Multivariate analyses also suggest a quadraticrelationship. The ®ndings imply that median tenure is not a reliable proxyfor job insecurity. Rather, it would be better to focus on the proportions withshort tenure (up to one or two years), since employees with short tenuresunambiguously have the greatest job insecurity. Nevertheless, our othercomponent of insecurity ± the dif®culty of re-employment ± is unsurpriz-ingly positively related to tenure. Thus, even if the proportions with shorttenure are used to capture an element of insecurity, it needs to be remem-bered that the cost of job loss for those with longer tenure is likely to begreater than for those with short tenure.
Given the importance of perceptions of unemployment risk in severalareas of economic enquiry, further research to investigate all the compo-nents of this risk, and the links between objective and subjective measures,would seem to be warranted.
Department of Economics, University of KentCentre for Labour Market Studies, University of LeicesterFaculty of Social and Political Sciences, University of Cambridge
Date of Receipt of Final Manuscript: July 1999
REFERENCES
Aaronson, D. and Sullivan, D. G. (1998). `The decline of job security in the 1990s:Displacement, anxiety, and their effect on wage growth', Federal Reserve Bankof Chicago. Economic Perspectives (First Quarter): 17±43.
Alogoskou®s, G., Bean, C., Bertola, G., Cohen, D., Dolado, J. and Saint-Paul,Gilles. (1995). Unemployment, Choices for Europe: Monitoring European Inte-gration 5. London: CEPR.
880 BULLETIN
# Blackwell Publishers 2000

Ashton, D., Davies, B., Felstead, A. and Green, F. (1999). Work Skills In Britain,SKOPE, Oxford University and Warwick University.
Bender, K. A. and Sloane, P. J. (1999). `Trade union membership, tenure and thelevel of job insecurity', Applied Economics, Vol. 31, pp. 123±35.
Bertola, G. (1990). `Job security, employment and wages', European EconomicReview, Vol. 34, pp. 851±86.
Bowles, S. (1985). `The production process in a competitive economy ± Walrasian,Neo-Hobbesian, and Marxian models', American Economic Review, Vol. 75, pp.16±36.
Boyer, R. (1988). The search for labour market ¯exibility. Clarendon Press, Oxford.Brockner, J. (1992). `Managing the effects of layoffs on survivors', California
Management Review, Vol. 34, pp. 9±28.Brockner, J., Grover, S., Dewitt, R. L. and Reed, T. F. (1992). `Layoffs, job security
and survivors � work effort: Evidence of an inverted-U relationship', Academyof Management Journal, Vol. 35, pp. 413±25.
Burgess, S. and Rees, H. (1997). `Transient jobs and lifetime jobs: dualism in theBritish labour market', Bulletin, Vol. 59, pp. 309±28.
Burgess, S. and Rees, H. (1996). `Job tenure in Britain 1975±92', EconomicJournal, Vol. 106, pp. 334±44.
Burchell, B. (1994). `The effects of labour market position, job insecurity andunemployment on psychological health', in Gallie, D., Marsh, C. and Vogler, C.(eds) Social Change and the Experience of Unemployment, Oxford UniversityPress, Oxford.
Burchell, B. (1996). `The unequal distribution of job insecurity', paper presented tothe 18th International Working Party on Labour Market Segmentation Confer-ence, University of Tampere, Finland, 9±14 July 1996.
Burchell, B. J. (1999). `The unequal distribution of job insecurity', 1967±1986.International Review of Applied Economics, Vol. xx, pp. xxx±xx.
Burchell, B. J., Felstead, A. and Green, F. (1997). `The Age of the WorriedWorker?', Annual Employment Research Unit Conference, Cardiff BusinessSchool, 11±12 September.
Central Statistical Of®ce (1993). Standard Industrial Classi®cation of EconomicActivities: Correlation Between SIC(92) and SIC(80), London: HMSO.
Farber, H. (1993). `The Incidence and Costs of Job Loss: 1982±91'. BrookingsPapers on Economic Activity: Microeconomics (1): 73±119.
Farber, H. (1995). Are lifetime jobs disappearing? Job duration in the UnitedStates: 1973±1993, National Bureau of Economic Research, Working Paper No.5014.
Farber, H. (1996). The Changing Face of Job Loss in the United States, NationalBureau of Economic Research, Working Paper No. 5596.
Gallie, D. (1994). `Methodological appendix: the Social Change and EconomicLife Initiative', in Rubery, J. and Wilkinson, F. (eds) Employer Strategy and theLabour Market, Oxford University Press, Oxford.
Gallie, D. and White, M. (1994). `Employer policies, employee contracts andlabour-market structures', in Rubery, J. and Wilkinson, F. (eds) EmployerStrategy and the Labour Market, Oxford University Press, Oxford.
Gallie, D. (1996). `Skill, gender and the quality of employment', Changing Formsof Employment: Organisations, Skills and Gender. R. Crompton, D. Gallie andK. Purcell. London, Routledge.
JOB INSECURITY AND THE DIFFICULTY OF REGAINING EMPLOYMENT 881
# Blackwell Publishers 2000

Green, F., Ashton, D., Burchell, B., Davies, B. and Felstead, A. (1999). `Are BritishWorkers Getting More Skilled?' in Borghans, L. and Grip, A. de (eds), TheOvereducation Worker? Edward Elgar, Cheltenham.
Gregg, P. and Wadsworth, J. (1997). `Can't Stand Up for Falling Down?': Insecurityin the UK Labour Market', paper presented to the 1997 Employment ResearchUnit Annual Conference, The Insecure Workforce, Cardiff Business School,September.
Gregg, P. and Wadsworth, J. (1995). `A short history of labour turnover, job tenure,and job security, 1975±93', Oxford Review of Economic Policy, Vol. 11, pp.73±90.
Gregory, M. and Jukes, R. (1997). The Effects of Unemployment on SubsequentEarnings: A Study of British Men 1984±94, LSE, Centre for Economic Perform-ance, The Labour Market Consequences of Technical and Structural Change,Discussion Paper 21.
Guest, D., Conway, N., Briner, R. and Dickman, M. (1996). `The state of thepsychological contract in employment', Institute of Personnel and DevelopmentIssues in People Management No. 16.
Hallier, J. (1997). `Security Abeyance and Enforced Worker Job Change', paperpresented to the 1997 Employment Research Unit Annual Conference, TheInsecure Workforce, Cardiff Business School, September.
Heery, E. and Salmon, J. Eds. (1998). The Insecure Workforce. Barmarick Publica-tions, Patrington.
Hogan and Ragan (1995). Economica, Vol. 62, pp. 495±505. Incomplete reference.Hudson, M., Reed, H. and Wilkinson, F. (1997). `De®ning Job Insecurity: Towards
an Inter-Disciplinary Approach', paper presented to the 1997 EmploymentResearch Unit Annual Conference, The Insecure Workforce, Cardiff BusinessSchool, September.
Huff Stevens, A. (1997). `Persistent Effects of Job Displacement: The Importanceof Multiple Job Lossess', Journal of Labor Economics, Vol. ??, pp. 165±88.
Hughes, D. and Galinsky, E. (1994). Work experiences and marital interactions ±Elaborating the complexity of work. Journal of organisational psychology, Vol.15, pp. 423±38.
Hutton, W. (1995). High Risk Strategy. The Guardian, May 22th 1995.Jacobsen, L., Lalonde, R. and Sullivan, D. (1993). `Earnings Losses of Displaced
Workers', American Economic Review, Vol. ??, pp. 685±709.Krueger, A. B. (1993). `How computers have changed the wage structure ±
evidence from microdata, 1984±1989', Quarterly Journal of Economics, Vol.CVIII, pp. 33±60.
Lampard, R. (1994). An examination of the relationship between marital dissolu-tion and unemployment, in D. Gallie, C. Marsh and C. Vogler (Eds) SocialChange and the experience of Unemployment. Oxford University Press, Oxford.
Larson, J. H., Wilson, S. M. and Beley, R. (1994). The impact of job insecurity onmarital and family relationships. Family Relationships, Vol. 43, pp. 138±43.
Marsh, C. and Vogler, C. (1994). `Economic convergence: a tale of six cities', inGallie, D., Marsh, C. and Vogler, C. (eds) Social Change and the Experience ofUnemployment, Oxford University Press, Oxford.
OECD (1997). OECD Employment Outlook 1997. Paris, OECD.Payne, J. and Payne, C. (1993). `Unemployment and peripherial work', Work,
Employment and Society, Vol. 7, pp. 513±34.
882 BULLETIN
# Blackwell Publishers 2000

Ruhm, C. J. (1991). `Are Workers Permanently Scarred by Job Displacements'.American Economic Review, Vol. ??, pp. 319±24.
Topel, R. (1990). `Speci®c capital and unemployment: measuring the costs andconsequences of job loss', Carneige-Rochester Conference Series on PublicPolicy, Vol. 33, pp. 181±214.
TUC (1995). Britain Divided ± Insecurity at Work. London, TUC.TUC (1996). All in the Mind? Job Insecurity in Britain Today. London, TUC.
JOB INSECURITY AND THE DIFFICULTY OF REGAINING EMPLOYMENT 883
# Blackwell Publishers 2000