Jim Patrick, Bill Branigan, Lee Hardy, Bob Berman, Jim ...
625
PLANNING COMMISSION REGULAR SESSION AGENDA Monday, July 26, 2021 - 7:00 PM City Hall, Council Chambers, 169 SW Coast Hwy, Newport, OR 97365 The meeting location is accessible to persons with disabilities. A request for an interpreter for the DEAF AND HARD OF HEARING, or for other accommodations for persons with disabilities, should be made at least 48 hours in advance of the meeting to Peggy Hawker, City Recorder at 541.574.0613, or [email protected]. The meeting will be live-streamed at https://newportoregon.gov , and broadcast on Charter Channel 190. Anyone wishing to provide written public comment should send the comment to [email protected]. The e-mail must be received at least four hours prior to the scheduled meeting. The agenda may be amended during the meeting to add or delete items, change the order of agenda items, or discuss any other business deemed necessary at the time of the m e e t i n g 1.CALL TO ORDER AND ROLL CALL Jim Patrick, Bill Branigan, Lee Hardy, Bob Berman, Jim Hanselman, Gary East, and Braulio Escobar. 2.APPROVAL OF MINUTES 2.A Approval of the Planning Commission Work Session Meeting Minutes of July 12, 2021. Draft PC Work Session Minutes 07-12-2021 1
-
Upload
khangminh22 -
Category
Documents
-
view
0 -
download
0
Transcript of Jim Patrick, Bill Branigan, Lee Hardy, Bob Berman, Jim ...

PLANNING COMMISSION REGULAR SESSION AGENDAMonday, July 26, 2021 - 7:00 PM
City Hall, Council Chambers, 169 SW Coast Hwy, Newport , OR 97365
The meeting location is accessible to persons with disabilities. A request for an interpreter forthe DEAF AND HARD OF HEARING, or for other accommodations for persons withdisabilities,should be made at least 48 hours in advance of the meeting to Peggy Hawker, City Recorder at541.574.0613, or [email protected].
The meeting will be live-streamed at https://newportoregon.gov, and broadcast on CharterChannel 190.
Anyone wishing to provide written public comment should send the comment [email protected]. The e-mail must be received at least four hours prior tothe scheduled meeting.
The agenda may be amended during the meeting to add or delete items, change the order ofagenda items, or discuss any other business deemed necessary at the time of them e e t i n g
1.CALL TO ORDER AND ROLL CALLJim Patrick, Bill Branigan, Lee Hardy, Bob Berman, Jim Hanselman, Gary East, and Braulio
Escobar.
2.APPROVAL OF MINUTES
2.A Approval of the Planning Commission Work Session Meeting Minutes of July12, 2021.Draft PC Work Session Minutes 07-12-2021
1
2.B Approval of the Planning Commission Regular Session Meeting Minutes ofJuly 12, 2021.Draft PC Reg Session Minutes 07-12-2021
3.CITIZENS/PUBLIC COMMENTA Public Comment Roster is available immediately inside the Council Chambers. Anyone who
would like to address the Planning Commission on any matter not on the agenda will begiven the opportunity after signing the Roster. Each speaker should limit comments tothree minutes. The normal disposition of these items will be at the next scheduledPlanning Commission meeting.
4.ACTION ITEMS
5.PUBLIC HEARINGS
5.A (Continuat ion) File No. 1-Z-21: Food Truck and Food Cart Amendments.
MemorandumAmendments to NMC Chapter 4.10, dated 7-22-21Amendments to NMC Chapter 14, dated 7-22-21Amendments to NMC Chapter 11.05 and 12.15 (as presented at the 7-12-21 publichearing)Map of the Bayfront and Nye Beach Parking DistrictsLetter from the Taphouse at Nye Creek, dated 7-9-21Newport News-Times article, dated 7-14-21Letter from Donald G, Lighthouse Associates, LLC, dated 7-14-21 (with attachments)Newport News-Times, Views on the News, dated 7-21-21Additional Testimony - Janet WebsterAdditional Testimony - LCSDAdditional Testimony - Lacee HortonAdditional Testimony - Mark HortonAdditional Testimony - Debbie Gehlken
6.NEW BUSINESS
7.UNFINISHED BUSINESS
8.DIRECTOR COMMENTS
2

9.ADJOURNMENT
3

1 Draft Planning Commission Work Session Minutes 7/12/2021.
Planning Commissioners Present: Bob Berman, Jim Hanselman, Lee Hardy, Braulio Escobar, Gary East, and
Bill Branigan.
Planning Commissioners Absent: Jim Patrick (excused).
PC Citizens Advisory Committee Members Absent: Greg Sutton and Dustin Capri (all excused).
City Staff Present: Community Development Director (CDD), Derrick Tokos; and Executive Assistant, Sherri
Marineau.
1. Call to Order. Vice Chair Branigan called the Planning Commission work session to order at 6:00 p.m.
2. New Business.
A. Newport Transportation System Plan Update - Transportation Standards (Tech Memo #10). Tokos
reviewed the Transportation System Plan (TSP) tech memo, and covered the street functional clarification of
roadways first. Berman asked if a portion of Harney Street was categorized for freight on the memo. Tokos
explained that this was in the context that the Harney Street connection was made. (Harney and 36th Streets
could only be a freight route if Harney Street was connected to the south. Without the connection, there wasn't
anything to justify freight on the route.
Tokos covered street x-sections next. Branigan asked if they were going to recommend that the streets they
designate as collectors adhere to the examples of street sections. He noted that most of the streets didn’t meet
these requirements. Tokos explained they would see a significant difference between major collector preferred
and major collector acceptable standards. Where there was already a street width without these components
where they would have to do the improvements. Branigan asked about major collector acceptable that didn’t
have sidewalks. Tokos explained these would be rectified through redevelopment of some sort of city project.
Berman asked if someone on an empty lot would be required to have sidewalks even though there weren’t
sidewalks by them. Tokos reported there would be updated development standards which included how they
went about determining what level of public improvement was required for infill development. As the code
was written, in cases where an entire block didn’t have sidewalks they would require a non remonstrance
agreement. In instances where a home was going in on a block where other sidewalks existed, they were
required to fill them in. Tokos reported that they would set up the framework on how decisions could be made
in terms of traffic calming, and give it a clear process.
Tokos reviewed mobility standards. He described a failed intersection as one where it took multiple light
intervals to get through the intersection. Hardy didn't think it was right to say that this was a failed intersection.
She thought it was an indication of too much traffic and the intersection wasn’t failing. Tokos noted they would
have an opportunity to discuss whether or not the city needed to adjust its thresholds for traffic through traffic
studies. What they would be doing was evaluating new development in a particular location and if there was a
need for some improvement to the intersection and street in conjunction with the development. Hardy asked if
they were considering bypasses. Tokos reported they weren't a part of the packet. This would be more of a
regional discussion. Hardy thought it needed to be on the table to consider. Tokos conveyed that it wasn’t a
part of the TSP work at that point. He explained the history of the what had been considered for bypasses for
Newport, with Moore Drive being the only logical freight route.
Tokos explained the guidelines for block spacing and noted that access management would be considered. They
Draft MINUTES
City of Newport Planning Commission
Work Session
Newport City Hall Council Chambers
July 12, 2021
6:00 p.m.
4

2 Draft Planning Commission Work Session Minutes 7/12/2021.
would also have some recommendations relative to EV charging stations based on the legislation from HB 2180
that required that new development of multifamily units of five or more, and all commercial developments, to
have electrical services in place to provide EV charging and that they provide conduit into the parking areas.
Tokos believed that they would have to do this for 20 percent of their parking. This would go into effect on
July 1, 2022. East asked if this allowed companies like Electrify America or Telsa to come in and put their own
systems in. Tokos explained this was infrastructure on the individual private properties to support EV charging.
Charging stations were becoming a reality and something they had to consider. The bill didn't require
developers to put the charging stations in, but that they have the power supply and the conduit into the parking
area so that it could be done without a major renovation to the building.
Tokos reviewed some of the renovation projects and the fiscally constrained project list. He reported the
projects had roughly $50 million available over a 20 year period. Tokos reviewed the Harney Street extension
findings and noted that they were able to get the costs down by $10 million but it was hard to get costs lower
because of terrain. The consultants thought there was enough merit to keep it on the list in case there were some
Federal funds that came in to fund it, but not list it on the fiscally constrained. Hanselman noted that the
consultants indicated there were 25,000 vehicles that went northbound on US 101 per day. He thought that the
possibility of a reduction of 5,000 vehicles for $60 million wasn’t very many when they were talking about
25,000 vehicles going north and likely the same amount going south. Berman pointed out that of the 5,000
vehicles a lot of them would be heavy use trucks. This would help with traffic improvement if they were
diverted. Escobar asked if the Harney Street would open up some of the land for development that was cost
prohibitive. Tokos thought it could and reminded that many of the 5,000 vehicles were local as well. (26:52)
Escobar thought that it seemed cost prohibitive at that point. Hanselman asked if any of this would pencil out
for affordable housing. Tokos thought this was unlikely and might not pencil out for developers because of
their costs for onsite work and offsite improvements. Tokos thought that if this project landed between $45-60
million the individual property owners would look to withdraw the 80 acres and try to do a house or two there.
Tokos reported they had tried to develop the properties in the past but they couldn’t make it work.
Tokos reviewed the Oceanview to Nye Street extension. He reported the TSP Committee's view was that there
may be value for this but it could fall off based on where they landed on the fiscally constrained numbers. Also,
the Committee’s preference was for the full street option. Tokos explained that once they saw the actual cost
of this they would compare it to other projects and see where it fell. Berman noted that the extension might
cause other issues such as how to get traffic on and off the extension, and how it might cause more traffic to
use Oceanview Drive.
Tokos reviewed the three US 101 couplet options. He reported that the TSP Committee thought the short couplet
was the best approach. Tokos then reviewed the US 20/US 101 options. The TSP Committee thought the
additional southbound turn lane was best. Hardy asked what they would do with the businesses that would be
required to move. Tokos explained if they were effecting the property so much that the building would have to
be removed they would have to purchase the property at fair market value. If they could do a right-of-way take
and the business was still functional, this became a different appraisal. Hardy thought there was a tradeoff
between the actual effective impact of modifying the street versus the expense and inconvenience to the
business owner by forcing them to close or modify their business. Tokos explained that anytime they pursued
condemnation they looking at the interest of the broader public and whomever you were impacting for business.
They would be obligated to pay fair market value. Hardy had concerns about making a business closed down
and them not being about to relocate in town. She thought this would be a loss of excess of fair market value.
Tokos thought they could talk about that when they got to that point. In the context of Urban Renewal they
could help pay for business relocation type factors. They could also look at modifications for the business as
well. Hardy thought it was tacky to force businesses to relocate this way.
Tokos reviewed the US 20 two-way concepts next and explained the thought process for bike and pedestrian
lanes. The TSP Committee thought they should stick with two-way traffic on the US 20 alignment and the
preference was to look to accommodate bicyclists on NE 1st Street because it was a more logical place for
them. Tokos thought they potentially might be looking at if they should rezone some of the C-3 heavy
commercial north of US 20 into a more of a multi-family.
5

3 Draft Planning Commission Work Session Minutes 7/12/2021.
Tokos reviewed the Moore Drive, Harney Street and US 20 intersection considerations. The TSP Committee
recommended going with a traffic signal with a left-turn pocket option.
Tokos reviewed the schedule moving forward. The consultants would be putting numbers to the different
options, especially the ones that were favorable. They would be looking to launch an online outreach starting
at the end of July and then an in person workshop during the second or third week of August. A final Project
Advisory Committee meeting would happen in September where they would look at the TSP closer to its
finished form. Then they would start to work this into the adoption process in November and December.
Escobar asked if the numbers for the projects would be better known for the outreach. Tokos confirmed they
would have more numbers for people to consider and weigh. Berman asked if the other projects would be
included. Tokos reported they would all be included with costs.
Berman pointed out that the maps showed the city limits outside of the Urban Growth Boundary whenever they
showed the coast line, and needed to be fixed. There was also graphics that were mislabeled or missing that
needed to be looked at.
B. Final Scope of Work for HB 2003 Compliant Housing Capacity Analysis and Housing Production
Strategy. Tokos reported the grant budget was $105,000 and the City would have to match up to 25 percent.
The State ended up getting more funding for this grant program then they asked for. Tokos thought Newport
would have the grant funded but the match amount was yet to be determined. He reported Newport was a high
priority for HB 2003 work. Tokos noted that the Task 5 piece was not required and was likely where they would
land. They would be looking to say that to help inform infrastructure investments they would take a hard look
at properties with moderate infrastructure needs and figure out, based on land values in these areas, the
infrastructure costs to get them fully serviced, the construction costs to build the units we need, and to see if
they would likely land in prices affordable for folks in our community. This will help Newport the State asked
us down the road why we didn’t meet certain benchmarks for the housing production strategy.
3. Unfinished Business.
A. Updated Planning Commission Work Program. Tokos pointed the major change on the work program was
to flip the review of the Tech Memos for the TSP. He also noted that there would be a public hearing for the
Wilder Development in August.
4. Adjourn. The meeting adjourned at 7:50 p.m.
Respectfully submitted,
______________________________
Sherri Marineau,
Executive Assistant
6

Page 1 Draft Planning Commission Meeting Minutes – 7/12/2021.
Draft MINUTES
City of Newport Planning Commission
Regular Session
Newport City Hall Council Chambers
July 12, 2021
Planning Commissioners Present: Bob Berman, Jim Hanselman, Lee Hardy, Braulio Escobar, Gary East,
and Bill Branigan.
Planning Commissioners Absent: Jim Patrick (excused).
City Staff Present: Community Development Director (CDD), Derrick Tokos; and Executive Assistant,
Sherri Marineau.
1. Call to Order & Roll Call. Vice Chair Branigan called the meeting to order in the City Hall
Council Chambers at 7:00 p.m. On roll call, Commissioners Hanselman, Branigan, Berman, Hardy,
Escobar, and East were present.
2. Approval of Minutes.
A. Approval of the Planning Commission Work Session Meeting Minutes of May 24, 2021.
MOTION was made by Commissioner Berman, seconded by Commissioner Escobar to approve the
Planning Commission Work Session Meeting Minutes of May 24, 2021 with minor corrections. The motion
carried unanimously in a voice vote.
B. Approval of the Planning Commission Regular Session Meeting Minutes of May 24, 2021.
MOTION was made by Commissioner Berman, seconded by Commissioner Escobar to approve the
Planning Commission Regular Session Meeting Minutes of May 24, 2021 as written. The motion carried
unanimously in a voice vote.
C. Approval of the Planning Commission Work Session Meeting Minutes of June 14, 2021.
MOTION was made by Commissioner Berman, seconded by Commissioner Escobar to approve the
Planning Commission Work Session Meeting Minutes of June 14, 2021 with minor corrections. The motion
carried unanimously in a voice vote.
3. Citizen/Public Comment. None were heard.
4. Public Hearings. At 7:05 p.m. Vice Chair Branigan opened the public hearing portion of the
meeting.
Vice Chair Branigan read the statement of rights and relevance. He asked the Commissioners for
declarations of conflicts of interest, ex parte contacts, bias, or site visits. None were heard. Branigan called
for objections to any member of the Planning Commission or the Commission as a whole hearing this
matter; and none were heard.
A. File 1-Z-21.
Tokos acknowledged the comments that came in after the staff report was posted that were received from
Bonnie Hendren, Janet Webster, Victor Mettle, Front Street Marine LLC, and the attorneys representing
the Lincoln County School District.
7

Page 2 Draft Planning Commission Meeting Minutes – 7/12/2021.
Tokos reviewed the staff report and made a request that the Commission discuss the policy options after
public testimony was taken. He also noted that they could choose to continue the hearing.
Berman asked for more precision when referring to residential areas in the draft. He asked if residential
areas was limited to the “R” type zones, and if this would be clarified. Tokos confirmed that he changed
the draft to read “residential zoned areas” and these were the R-1, R-2, R-3 and R-4 zones. Any reference
to residential areas would be changed to residential zoned areas. Berman noted Chapter 4.10.010 didn’t
have this change. Tokos would make sure all instances were changed in the draft.
Berman conveyed that he was not comfortable with a lottery if renewal applications exceed for the
authorized spot. He thought it wasn’t fair that someone could get established in a spot and then lose the
spot due to a random lottery. Tokos noted this applied to the five licenses at the Nye Beach turnaround
and the Bayfront by the Hatfield pump station. Business licenses for these were issued on an annual basis
and they didn’t proposing to change this. Tokos noted that the spots weren’t the vendor’s property and
they weren't entitled to those locations, except for the season they applied and obtained an endorsement
for them. Berman asked if vendors didn't renew in time could someone else come in and take the spot.
Tokos explained that the business license renewed but the fixed based endorsement didn’t. If someone
else put their name in for the space for the next year they would get the spot. Language could be added to
address this. Tokos reported that this hadn't been a significant issue that they had observed, and there
wasn't anyone who had locked up licenses for multiple years. Berman didn't think it was fair to have
someone who was already established not be able to be there through no fault of their own. Hanselman
agreed with Berman. He thought they could put in a renewal period for the business license holders. If
they didn't do this, someone else could get the spot that someone was already established at. Escobar
asked how they would feel about limiting a holders ability to hold or transfer a license. Berman thought
this should be the same as short-term rental licenses. They would get to continue to use it, and when they
stopped using it, it would go to someone else. Escobar suggested the licenses not be transferable.
Proponents: Susannah Montague addressed the Commission. She explained that she planned to open a
fixed stand to serve fish and chips. Montague reported that she had already been approved by Lincoln
County and she wanted to be open in Newport. She saw an influx of business in Newport and didn't think
food carts would create competition. Montague also noted that she wasn't interested in being in front of a
school, in Nye Beach or the Bayfront. Branigan asked where she planned to locate. Montague hoped to be
located in the Deco District.
Nathan Wallner, owner of the Tsunami Training Center addressed the Commission. He reported that they
had a lot they wanted to set up food carts on, and there were vendors who already wanted to set up at this
location. Wallner noted the location was close to the Szabos Steakhouse. There were a lot of surfers that
frequented this location and a new housing development being built close to it that they could serve.
Wallner thought that the food carts could add to the value of the city. Berman asked if they went through
the County process to get approved yet. Wallner reported they hadn’t. Berman asked if the lots were
residential. Wallner explained they were commercial lots.
Opponents: Mike Franklin, owner of the Chowder Bowl addressed the Commission. He explained that
over the last year restaurants had been dealing with COVID restrictions, higher costs, and it was hard to
hire enough employees. Franklin had nothing against food pods but didn't agree that carts should be
allowed without them having to pay for the infrastructure to operate. He noted the Nye Beach turnaround
area needed additional trash cans. Franklin didn't agree with taking out the half mile restriction and 15
minute rule. The lack of parking was a problem and food carts would affect the amount of parking spaces
there was. Enforcement was also already a problem, with overnight parking happening in the area.
Franklin felt that enforcement of a food truck would be up to a complaint driven response by business
owners and he didn't think that was fair as a business owner.
8

Page 3 Draft Planning Commission Meeting Minutes – 7/12/2021.
Franklin explained that the Nye Beach turnaround was often used for family picnics. He thought the hum
of generators, smoke, and blocking of the views would be horrible for Nye Beach. This area was better
suited to ice cream and jewelry vendors. Franklin didn’t think there was room for food carts there.
Franklin questions who would pay for the increase in trash disposal at the turnaround, and he thought that
food trucks should pay for this. He noted that if they were to put in pods, all of this would be handled and
money would be coming into the city. The impact on brick and mortar restaurants were dependent on
summer business. Franklin thought that a food truck outside his business would directly affect the
community and employees of his business. He listed the reasons why they city shouldn't change the code
and felt the current code still served the original intent.
Escobar noted that most of Franklin’s complaints were about trucks in Nye Beach. He asked if Franklin
had concerns about other areas in the city. Franklin thought this wouldn’t work if it wasn’t done properly,
there wasn’t infrastructure, and the city wasn’t handling things. He thought pods were a better way to
handle it.
Benedict Linsenmeyer, attorney representing the Lincoln County School District (LCSD) and Kim Cusick
with the LCSD addressed the Commission. Linsenmeyer reported that the LCSD was against allowing the
part of the proposed changes to allow food carts within 500 feet of secondary schools. They wanted to see
them be excluded from 500 feet regardless of they were on public or private property. Linsenmeyer
explained that the school food program currently used in Newport allowed free meals to children K-12,
but it was participation based program. This meant that if students went to food carts instead of school
lunches, it could lead to drops in participation and the School District may become ineligible for the food
program. This could further the inequality for the already disadvantaged children that relied on the one set
meal a day at school. Linsenmeyer thought this was reason enough to show that food carts were contrary
to the general welfare of the community. They believed that food carts and pods should be precluded from
being within 500 feet regardless of if they are on public or private property.
Escobar pointed out that the Cub Cave restaurant was across from the high school. He asked how the felt
about this business versus a food cart. Cusick reported that this location consistently took away from their
food program. She thought the building had been sold and they didn’t think the new owners would use it
in this manner. Escobar noted that he saw a lot of students around town getting food and asked if they had
a closed campus. Cusick reported that they didn't currently have a closed campus but they were
considering closing it to 9th and 10th graders next year. Escobar asked if they would be opened a food
cart or a brick and mortar restaurant on 3rd Street. Cusick confirmed they were against both. Linsenmeyer
added that food carts were different from a brick and mortar restaurant and attractive for everyone in
general. Because they already had a problem with children leaving campus for other food sources, they
don't want to make this more of a problem than it already was. The changes could very easily push them
over the edge of losing the food program.
Hanselman asked how many students qualified for free meals. Cusick reported 100 percent of the students
qualified under the community eligibility program, based on poverty rates. If participation dipped below a
certain level, they could lose their services or they would have to return to a free and reduced program.
Currently every student received free breakfasts and lunches. Berman asked what the current participation
counts were for the program. Cusick didn’t have the counts to report at that time. Berman asked what
percentage level they would have to fall under before the program went away. Cusick reported that if a
certain school fell below a certain percentage they would need to reduce staff and return to the free and
reduced meal pattern instead. She offered to provide the numbers to the Commission if needed. Branigan
asked for the details to be provided. Escobar asked them to also provide what the level of participation for
the high school was, and what the level of the threshold was.
Berman asked why the LCSD thought the food carts would be less healthy. Cusick explained that there
were very strict guidelines for meals through the Healthy Meal Act to insure that students were receiving
9

Page 4 Draft Planning Commission Meeting Minutes – 7/12/2021.
healthier meals. Berman asked if they had any comparative data on food carts as to whether or not they
meet that same criteria. Cusick could provide those materials.
Hanselman asked what the history was for the open campus and the possibility of that being curtailed.
Cusick reported that the Kindergarten through 8th grades had closed campuses. 9th grade and above were
currently open campuses but they were considering closing them due to the level of truancy.
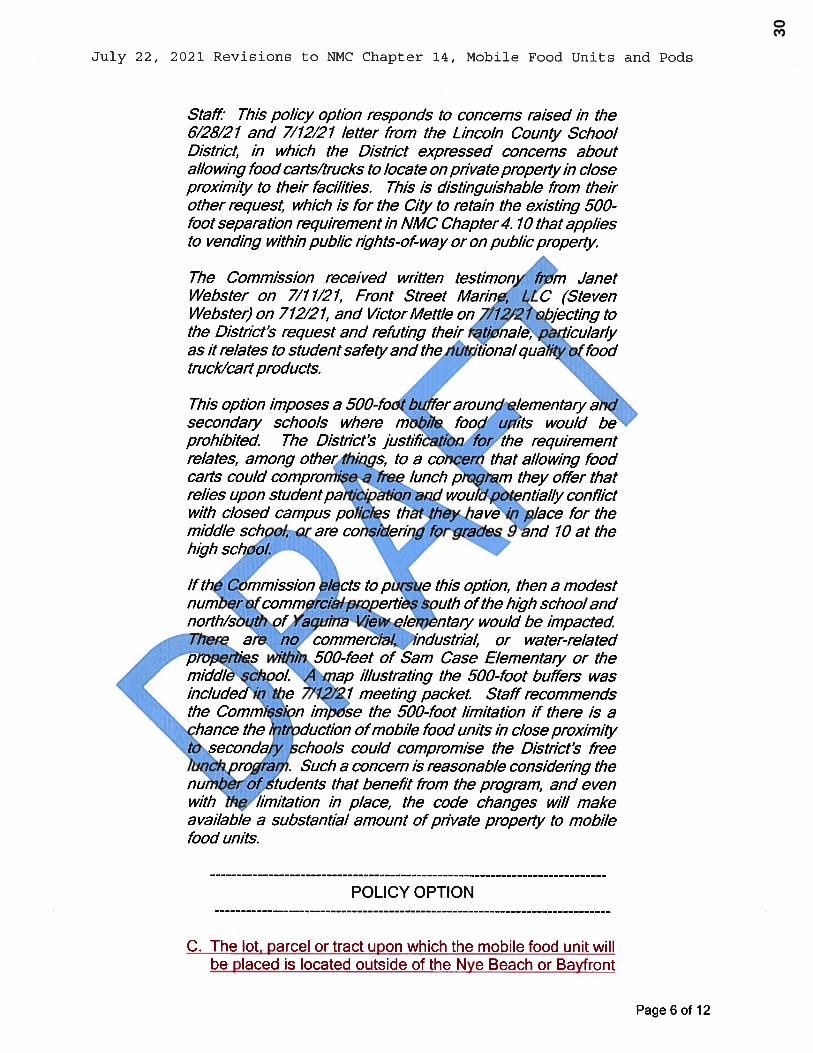
Greg Morrow, owner of the Tap House in Nye Beach addressed the Commission. He stated that he agreed
with what Mike Franklin said. Morrow noted that when the parking was full at the Nye Beach turnaround
his restaurant typically got the overflow. He described the garbage in the area as phenomenal and noted
how a past hotdog vendor who was located in the turnaround created a lot of garbage. Morrow was
concerned about parking enforcement for food carts and thought that if the changes were approved, the
city would see the holes in the guidelines. He was in favor of pods and thought there were some small
spots in Newport for these. Morrow pointed out that there were a lot of restaurants that were closed or
closing, and many were struggling at that time.
Janell Guplen, owner of Clearwater Restaurant and the Barge Inn addressed the Commission. She wanted
to see the hearing continued to get additional information, and to further the conversation and get it right
for the small businesses that wanted to get into the restaurant community and the city. Many of the small
restaurants have invested their time and energy into weathering COVID. Guplen reported she just recently
purchased the Cub Cave as well. She thought that having to face the chance to have a food cart across the
street from their businesses was hard. Guplen liked food pods and she felt there were other options for
food trucks to be on public lots instead of in front of restaurants.
Escobar asked if there was a food truck that parked in front of the fish plant on the Bayfront. Scott Gulpen
addressed the Commission and noted that there was a food truck that parked randomly on the Bayfront,
but not in front of their restaurant. They didn’t want trucks to be able to park within a certain feet from a
restaurant. Gulpen noted they were also planning on reopening the Cub Cave under the current permitted
use. Escobar asked if their concerns was about food trucks as opposed to a food pods. Guplen pointed out
that pods had to be regulated with bathrooms, sewer and parking. They opposed the change of the current
structure of the code.
Rebuttal: Montague pointed out that the current requirements to have a food cart in Lincoln County
required them to have a plan for trash and a bathroom.
Rebuttal: Franklin explained that the reason he was in favor of pods was because the food trucks on the
Bayfront only went to high traffic areas. If food trucks were going to act like a brick and mortar restaurant
and stay in one spot every day, they should have the same requirements as a brick and mortar restaurant
and be located on a pod site.
Rebuttal: Scott Gulpen reported that he had owned a food cart before and in order to have a plan for your
food truck, all you needed to do was designate a restroom, which could be a public bathroom, and provide
trash cans. He knew the food cart of the Bayfront relied on public bathrooms and private trashcans and
they didn’t provide either.
Branigan concluded the testimony portion of the hearing for the evening at 8:20 p.m.
Tokos reviewed the issues raised and asked for a Commission discussion on the policies to prepare
updates for the continued hearing.
The Commission discussed Chapter 4.10.35 policy options 1(A) and 1(B). Hardy stated that she didn't
like either option. She wanted restrictions in front of schools and felt that given the short lived
investments of food carts and the marginal income, she thought they were wasting their time. There was
general consensus to provide both options in the draft.
10

Page 5 Draft Planning Commission Meeting Minutes – 7/12/2021.
The Commission discussed Chapter 4.10.35 policy options 4(A) and 4(B), and the general consensus was
to provide option 4(B) only.
The Commission discussed Chapter 4.10.040 policy options A(1) and A(2). East didn't want to see this
changed for Nye Beach but for Bayfront. Berman thought instead of having the designated areas being the
same, they could ask the City Council to designate push cart areas and food truck areas. This way the
Council could decide the given areas each type could be located at. Hardy agreed with Berman. Escobar
wasn't in favor of food carts at the Nye Beach turnaround. He also felt it would be a disservice to have a
food truck at the pump station. Escobar was in favor of Berman's suggestion. Tokos would reframe the
language such that the Council by resolution would have to designate which locations are appropriate for
food trucks and fixed based vending on properties, and which locations should be reserved for carts.
Berman reminded that the Commission could also make a recommendation on the two current locations.
Tokos confirmed this could be done, but noted it wouldn’t be included in the language and would have to
be done by motion.
The Commission discussed Chapter 14.09.050 policy options A(1) and A(2). Tokos asked if the
Commission wanted to add language to restrict food pods only to the Bayfront or Nye Beach. The
Commission was in general consensus to have the additional language added.
The Commission discussed Chapter 14.09.050 policy options B(1), B(2) and B(3). The general
consensus was to keep all three policy options.
Berman requested there be a work session before a continued hearing to review draft policies and to ask
question before it was presented at the hearing for additional public testimony.
MOTION was made by Commissioner Escobar, seconded by Commissioner East to continue the hearing
for File 1-Z-21 to the July 26, 2021 Planning Commission regular session meeting. The motion carried
unanimously in a voice vote.
5. New Business. None were heard.
6. Unfinished Business. None were heard.
7. Action Items. None were heard.
8. Director Comments. None were heard.
9. Adjournment. Having no further business, the meeting adjourned at 8:40 p.m.
Respectfully submitted,
Sherri Marineau
Executive Assistant
11

City of Newport
Memorandum
Community DevelopmentDepartment
To: Planning Commission
From: Derrick I. Tokos, AICP, Community Development Director
Re: File No. 1 -Z-21, Amendments to the City of Newport Municipal Code Related tothe Operation of Food Trucks and Food Carts
On July 12, 2021, the Newport Planning Commission held a public hearing to consideramendments to Newport Municipal Code Section 4.10, Vending on Public Property; Section11.05, Building Codes; Section 12.15, System Development Charges; and Chapter 14, ZoningStandards, related to the operation of food trucks and food carts (collectively, “mobile foodunits”) in the City of Newport. After taking testimony, the Commission elected to continue thepublic hearing to July 26, 2021 and asked that staff revise the proposed amendments inresponse to feedback they received.
Attached are updated versions of NMC Chapters 4.10 and 14 with the changes theCommission requested. Explanations for each change are included in the staff analysis thatis incorporated into the documents. There are a number of policy options, and it is importantthat the Commission be clear about which options it is selecting when it ultimately makes arecommendation.
There is one change that staff is requesting the Commission accept that was not discussed atthe initial hearing. It relates to the procedure for approving a mobile food unit pod. Given thelevel of investment attributed to such projects, it would be appropriate to treat them like a morepermanent (i.e. non-transient) use. Land use decisions for such uses do not expire onceimplemented. It would be a Type I process since the approval standards are clear andobjective (ref: N MC 14.09.060(H)).
Correspondence received after the July 12, 2021 public hearing is enclosed. The Commissionwill have an opportunity to review and discuss the revisions at the 6:00pm work session priorto the 7:00 pm public hearing on July 26, 2021. That work session is an opportunity forCommission members to ask questions of staff and to request minor revisions, if needed. It isnot a forum where public testimony will be accepted nor will there be any deliberation.
The Planning Commission is charged with making a recommendation to the City Council as towhether or not the amendments are necessary and further the general welfare of thecommunity (NMC 14.36.010). The Council will make a final decision at a subsequent hearing.
AttachmentsAmendments to NMC Chapter 4.10, dated 7/22/21Amendments to NMC Chapter 14, dated 7/22/21Amendments to NMC Chapter 11.05 and 12.15 (as presented at the 7/12/21 public hearing)Map of the Bayfront and Nye Beach Parking DistrictsLetter from the Taphouse at Nye Creek, dated 7/9/2 1Newport News-Times article, dated 7/14/21Letter from Donald G, Lighthouse Associates, LLC, dated 7/14/21 (with attachments)Newport News-Times, Views on the News, dated 7/21/21
Page 1 of 1
Date: July22,2021
12

July 22, 2021 Revisions to NMC Chapter 4.10, Vending on PublicProperty
(Unless otherwise specified, new language is shown in double underline, and text to be removed isdepicted with strikethrough. Staff comments, in italics, are for context and are not a part of the revisions.)
CHAPTER 4.10 VENDING ON PUBLIC PROPERTY
4.10.005 Findings and Purpose
A. The primary purpose of the public streets and sidewalks isfor use by vehicular and pedestrian traffic.
B. Unrestricted vending on public streets, sidewalks andother public places would interfere withthe prirary use ofthose public areas. However, vendingonthe public streetsand sidewalks and upon certain’LbIic property that islimited to times and locations tt1 tninimize interfBrercewith public use promotes the put interest by contribuUnto an active and attractive pstrian envirpnment S
C. The purpose of this chapter is t sØ’ethe ability to usestreets, sidewalks jicj. other publiS1es for their primarypurposes while al’ Mmited vendlh in those areas toprotect the public and wei.
____
rty determined by thes where vendors may sell
ierchandise or services from
Mobile Stand. A stand that is moved from place to place andthat is engaged in vending from a single location in the publicright of way for no more than 15 minutes in residential zonedareas or up to 2 hours at a time elsewhere in the city.
Fixed standStand. A stand at which vending occurs for morethan 15 minutes in residential zoned areas or more than 2hours at a time in a single location elsewhere in the city. Even
4.10.010 Definition
The
BushCity Cora Si
un this chapter.
Stand. , bench, rack, pushcart, or wagonor other ven useaior the displaying, storing or transporting
articles oed for sale by a vendor, or otherwise used innectionIJh any activities of a vendor. Stand does not
inJe anym carried by a vendor and not placed on thegrotiior pavement for use or display.
Page 1 of 12
13

July 22, 2021 Revisions to NMC Chapter 4.10, Vending on PublicProperty
if a stand is easily movable, it is a fixed stand if it remains inplace for more than 15 minutes in a residential zoned area or2 hours elsewhere in the city in the course of a vendingactivity. For purposes of the definitions of “mixed mobilestand” and “fixed stand,” single location includes 100 feet inall directions.
Vending. The activity of selling or offering for sale any food,beverage, merchandise or service on public propiy, streetsor sidewalks from a stand, from the person or otiise.
Vendor. Any person engaged in the atj. vending,whether directly or indirectly.
Staff The City last amended this section with Ordinal?GB iVo2772, an ordinance that was adOpted in May of 2017ordinance included a sunset doaçe that requij-ed further CityCouncil action, a step that did not o#çur, meflipg the changeswere revoked as of January 1, 20 Qi’afhance No. 2112changed the from mYbiIi* fixed stands from15 minutes to 30 food trucks.The proposed further to two(2) hours. A two (2) OregonHealth to an
truck. Anauthorizes a user to lawfully
streets throughout therequirement isn’t
accomplished in thisthe 1. point for residential‘vely llmi vending in those areas tooperators such as ice cream sales. The
areas” has been clarified to readat the request of the Commission
4.10.015 iblic Property
It ibe unlawful to engage in any vending activity uponany street, sidewalk, or other public property of the cityexcept as specifically allowed by a vending endorsementon a business license or an exemption allowed bySubsections B. or C. of this section.
B. Vending on any city-owned or city-administered propertyother than rights of way or business vending areas isprohibited without a Special Event Permit issued pursuant
A.
Page 2 of 12
14

July 22,Property
2021 Revisions to NMC Chapter 4.10, Vending on Public
to NMC Chapter 9.80written agreement with the city. Anyvending by written agreement with the cityauthorized by aSpecial Event Permit is exempt from the prohibition onvending stated in Subsection A. of this section.
C. Vending on sidewalks by persons under 13 years of agewith the permission of the adjacent property owner isexempt from the provisions of this chapter, provided thatthe vending activity cannot block the sidewalkJhe soleremedy under this section shall be the reloUn of theactivity so that the sidewalk is not blocl
E. Proof of liability insurance covering personal injury andproperty damage, with coverage limits of at least$500,0002,000,000, naming the city as an additionalinsured.
othera
StaffS Private activities conducted onthan riqhts-of-way or businessSpecial Event Permit. ThatNo. 2170. This section of thepersons to the Special Event
4.10.020 Application
An application forendorsement shallinformation:
A. The áddresses andione numbers of each
in operating such business
)d, beverage, merchandiserered for sale as part of the
re any stand(s) will be located.
and photograph or drawing of any stand toe operation of the business. The requirement
ing or photograph may be waived for standson sidewalks adjacent to the place of business of
the license holder.
D.
Page 3 of 12
15

July 22, 2021 Revisions to NMC Chapter 4.10, Vending on PublicProperty
Staff Insurance requirement is updated to ali:gn with currentCitypractice. This was noted in the regulatory concept memodistributed at the 4/12/27 work session.
4.10.025 Vending Locations
A. Fixed stands are permitted only within:
1. Business vending area locations, or
2. The sidewalk area immediately adØçent to theapplicant’s place of business and the stndards ofSection 4 10 035 are met Stands authorized under thisagreement must be operated by fhe operator’of theadjacent business.
B. The vending endorsementjç fixed stand shall speãtfy’the location where the fixed may be located and isvalid only for that location. \;.
C. The Council may, ution, limi. number of fixedstands at each bus s S g areaftte applicationsApplications for a vehdhig en ment foNjd stands ina businessyending area exe e the maximiI’m number offixed ersem all be awarded by lot fromth licatie reeeiv y May 31 for the period
fling July shall b sued on a first come, firsts basis erenc ing given to vendor(s) thatpos d do ment to operate at the
— ‘ sine ing area evious fiscal year.
Th ange was requested by Commissionmemat t(12/2 1 public hearing. The rationale isthat a vorthaNvested time, energyandresources intoa fied sJd at a business vending area should not be at
risk of lM?pg the vending opportunity every time theirese is up for renewal.
D. Viig other than from fixed stands are not specific to alocation but are subject to the restrictions in Section4.10.035(A1.
E. Vending endorsements for stands at business vendingarea locations are limited to one stand. Vendingendorsements for areas adjacent to a permanent place ofbusiness may include more than one stand.
Page 4 of 12
16

July 22, 2021 Revisions to NMC Chapter 4.10, Vending on PublicProperty
4.10.030 Fees
A. An endorsement application surcharge of $10.00 or suchother amount as mv be established hv Council resolutionshall be A surcharge shall be added to the businesslicense application fee if a vendor’s endorsement isapplied for to recover the city’s administrative costs forprocessing vending endorsement applications. An entityexempt from payment of the business liceje fee isexempt from payment of the endorseme’plicationsurcharge.
B. An additional feeoperation shall be charged forbusiness vending areas andendorsement shall list theoperate. Endorsements mbut no refunds shall be giexercise all rights under the ei
C. An additionalexceed a totcharged to holdersadjacenL4 the bu:4 10 O2fTheth
..,,all berate standsby Section
;t the monthsEndorsements may be
io refund shall be given if theall rights under the
been amended to remove referencesamounts in favor of having the fees set by
a housekeeping change that the Cityhas beenof the MuniciaI Code are amended.
Page 5 of 12
17

July 22, 2021 Revisions to NMC Chapter 4.10, Vending on PublicProperty
4.10.035 Restrictions
A. No vendor shall:
POLICY OPTIONS
1(a) Vend within 500 feet of the grounds of anyelementary or secondary school during the periodcommencing one-half hour prior to the start of theschool day and ending one-half hour after dismissal atthe end of the school day;
or
1(b) Vend within 500 ff the grounds of anyelementary or secondahool during the periodcommencing one-half hou’ prior to the start of theschool day and., ending one-half hr after dismissal attheendoftheQIdaY
Staff The Planning fromJanet WcJsJer that th4tynfl W1’(ess the provisionbarrijjJ1jn road, f-way or on public propertythAVwithin,4?-feet h elementary or secondarys4ól when scl is in ‘ on (ret 3/26/21 and 4/12/21eg). HercAname .lates to its potent/al impacton 1ije p4!5P4We , d her husband own that isnot i,i4R5y theselpti’ons, since the Chapter 4. 10‘..*Wsioe limited to road rights-of-way and publicproperty.
The COfl7i7iss$bonsidered Ms. Webster’s commentswhen it’1 met in work session to consider the draftamendni”,ts and indicated that it couldpotentiafly supportlifting tJtp-ohibition as it relates to secondary schools (/ e‘jINO’f and hiqh school). Before acting upon any suchche, the Commission asked staff to meet with theDistkict. That meeting occurred on 6/23/21 and the SchoolDistrictprovided written testimony on 6/28/2 1. The Districtrequests that the City retain the existing standard,indicating, among other things, that allowing food cartscould compromise a free lunch program they offer thatrelies upon student pa#iciation and would potentiallyconflict with closed campus policies that they have in placefor the middle school or are considering for grades 9 and
Page 6 of 12
18

July 22, 2021 Revisions to NMC Chapter 4.10, Vending on PublicProperty
10 at the hi:qh school. This is documented/n letters dated6/28/21 and 7/12/21. The Commission received writtentestimony from Janet Webster on 7/11/21, Front StreetMarine, LLC (Steven Webster) on 712/21, and VictorMettle on 7/12/21 objecting to the District’s request andrefuting their rationale, particularly as it relates to studentsafety and the nutritional quality of food truck/cartproducts.
Following the 7/12/21 hearing, the Commissjn requestedthat the District provide additional infornA4’ian about thefree lunch program and asked that th44 options bekept on the table for further consicJer4on1.
The Commission can retain the existing limit.N$ê asshown with option 1(a) or it could amend the prohibitioffit relates to secondary schoQI4 as shown with opt/on 1(b)Staff recommends the Con?r141sion pursue option 1(a),which retains the existing 50d-ffz,t l/$t,on, if there is achance the introduction of mobi7jE,od units in closeproximity to sectJI4 chools cW’. compromise theDistrict’s free /ufflØjz?. S*/t..a concern isreasonable considg tñê1IJjer .tudents thatbenefit frQm the prog, anjJk$?W wiU7 the limitation in
avafialile a substantialaiJfofri7f4-way tWbd trucks, consistent with the
cii’s goal.
P PTION
2wfthin the Nye Beach or Bayfront parkingdist i , the cieographic boundaries of which aredefin in NMC Section 14.14.100, except within abusi vending area or as authorized by a SpecialEv ermit issued pursuant to NMC Chapter 9.80.
S This policy option has been added, at theCommission s request, in response to public testimonyreceived at the 7/12/2 1 publlc hearing. A request wasmade that food trucks/carts be limited to pods in NyeBeach and the Bayfront given the level of activity andcongestion in these areas. This would require that they beprohibited in public riqhts-of-way and on public property.The proposed language leaves in place the option ofvendors operating within the districts if they are located
Page 7 of 12
19

July 22, 2021 Revisions to NMC Chapter 4.10, vending on PublicProperty
within a desi:gnated vending area or as part of a SpecialEvent Permit. NMC 14. 14. 100 includes boundatydescriptions for the districts and is logical in that itcoincides with areas where timed parking is used tomanage demand. A map illustrating the district boundariesis included with the 7/26/21 agenda packet materials.
3. Vend between the hours of 9:00 P.M. and 6:00 AM.
first picking up, removingtrash or refuse remaining
idor or otherwise resulting
rn a stand, allow any items relating tothe vending business to be placed
other than in, on, or under the stand.
icense includes a stand, expand the standwhat is described in the application and
in the permit.
10.Violate any city ordinance regulating sound or noise.
11.Vend within any portion of any a vehicle travel laneportion of anywithin a street other than at times when
4. Leave any stand unattended.
5. Sell food or beverages for imm
eating or drinking establilitter receptacles ace-is notthe vendor.
;umption
StaffS This changethe 7/6/21 letter fromrequesting thesetting up in aeating or drinkingfriction betweenunfair
point iiResorts, Inc.,
carts/trucks from• ofan existing‘help prevent
viewed asthe 7/12/2 1
•this revision is
9. Vend anything other than that which the vendor islicensed to vend;
Page 8 of 12
20

July 22, 2021 Revisions to NMC Chapter 4.10, Vending on PublicProperty
the Street iS closed to allow vending. This prohibitiondoes not prohibit the use of mobile stands legallyparked and selling to persons not within the vehicle usetravel lane portion of a street. For the purpose of thissubsection, “legally parked” means the vehicle islocated within a striped parking stall or other areadesignated for vehicle parking.
Staft This subsection has been revised for clñty. At its5/24/21 work session, the Commission inqjI1d as towhether or not a vehicle can park across AiItiple stripedparking spaces The Police Chief in4,ted that he isunaware of a law that would pre vent m frori3 occurring,so language has been added to defín’ legally paiYçed inthe context of vending, as being perked within a *pedstall or other area designatec/rparking
‘N12.Operate a stand withoUt’.isplay;a copy of the’
business license with the ve1jOrsement on thestand or engae in other g activity withouthaving the busigs..iic,ense with ding endorsementimmediately a’
4.10.040 Vending Stands
II allowi ,her stand or any other itemoperation orthe vending business to lean
m any building or other structure without;ion.
POLICY OPTIONS
B. hail vend atst eight feet in
ntrance way to any buildingilk or intersection. Nors to block a sidewalk.
Is.
ivities, whether from a stand or otherwise, shallin such a way as to not block pedestrian use
1k. Pedestrian use is considered blocked if twoinnot pass each other walking in opposite
Page 9 of 12
21

July 22, 2021 Revisions to NMC Chapter 4.10, Vending on PublicProperty
A(1) Vending stands licensed for business vending areasshall not exceed five feet in length and five feet in height,excluding canopies and umbrellas.
or
A(2) Vending stands licensed for business vending areasshall not exceed f1ve-eicihteen (18) feet in length and f4veten (10) feet in height, excluding canopies angbrellas.
or
A(3) Vending stands licensed for busig areasshall not exceed five feet in lengtjfive fee’ eight,excluding canopies and umbreJinless an alt’ivevending stand size limitation4ablished for a bus1vending area(s) by City CoLresolutI\
Staff These policy options geteIW allowances forvending stands at “business venthn “ which are publicsites designated foi by Cou solution. Areascurrently designated 44Ttfp/aza e Nye BeachTurnaround (up to 3 lice)ás)aWbftstat te at Hatfieldand Bay B1y4 (‘up to 2 I14nsek4’iøn A7) retains theexisting lMiihich li/44fI$ze oRtands to a footprintthat catommWe foodVdingpushcarts or small tablesfor refsales Op7p A(2) e4nds the size allowance for a
foôê(uck/cart, in line with thethird bullet point of the
1 le1ff-lallmarkWpndResorts, Inc. Option A(3)ed J&Commission’s request following the 7/72/21
heari giv4j City Council the option of identifying, byresolutio sinwnding areas where stands larger than5-ft x 5-ft a prote.
Umbrell nd canopies shall be a minimum of seven feetove sidewalk Umbrellas or canopies may not
square feet in area.
C. Vending stands on sidewalks adjacent to the licensee splace of business are permitted only in the following areas:
1. On SW Coast Highway between SW Angle Street andSW Fall Street.
2. On SW Bay Boulevard between SW Bay Street and SEEads Street.
Page 10 of 12
22

July 22, 2021Property
Revisions to NMC Chapter 4.10, Vending on Public
3. On Hurbert Street between SW 7tui Street and SW 9th
Street.
4. In the area bounded by Olive Street on the south, NW6th Street on the north, NW High Street and NW CoastStreet on the east and the Pacific Ocean on the west,including both sides of each named Street. Forpurposes of this section, “Olive Street” roans bothOlive Street and the area that Olive SWt wouldoccupy if it continued straight to the PaGtfi cean westof SW Coast Street.
iy provision of this subchapter or of anylation relating to the vending business.
convictions or misdemeanor convictionsmoral turpitude. In deciding whether to deny
ication for a past conviction, the city mayr the length of time since the conviction,
r the applicant appears to have beensuccessfully rehabilitated, and the risk to the public.
6. Failure to obtain or maintain liability insurance coveringpersonal injury and property damage, with policy limitsof at least $500,000.002,000,000 and naming the cityas an additional insured.
by5. Any other locationresolution.
4.10.045 Denial and Revocation
A. A vendor’s endorsementof the following
1. Fraud or mifor the business
2. F
ement.
of
‘ess in such manner as toconstitute a danger or
,safety, or welfare.
Page 11 of 12
23

July 22, 2021 Revisions to NMC Chapter 4.10, Vending on PublicProperty
Staff The liability insurance amount has been increased toa/i9n with the change that was made to Section 4. 10.020.
4.10.050 Appeal
If an application is denied or a license is revoked, the licenseholder may appeal by filing a written appeal with the citymanager. The deadline for an appeal of a denial is 15 daysafter a denial is mailed, and the deadline for an appeal of arevocation is two days after the revocation is delivered. Arevocation sent by mail shall be deemec delivered twobusiness days after the date of mailing. The Council shall hearand decide the appeal at its next regular meeting eId at least10 days after the filing of the appeal. The decision of theCouncil shall be final. :
4.10.055 Violation
Violation of any provision of this catr::ia civil infraction,with a maximum penalty..of $500.00. aday during which aviolation shall contin[ij,i.a separate óse. Violations ofseparate provisions ai
Page 12 of 12
24

July 22, 2021 Revisions to NMC Chapter 14, Mobile Food Units and Pods
(Unless otherwise specified, new language is shown in double underline, and text to be removed isdepicted with strikethrough. Staff comments, in italics, are for context and are not a part of the revisions.)
CHAPTER 14.01 PURPOSE AND DEFINITIONS**
***
14.01.020 Definitions
***
Mobile Food Unit. Any vehicle that is self-1r that canbe pulled or pushed down a sidewalkèet, way orwaterway, on which food is Drepared cessed or ertedor which is used in selling and dis g food to the teconsumer. -
Mobile Food Unit Pod. Four or mob d units on thesame lot, parcel, or tract.
***
Temporary Structures. ailers, mobile homesfood units,prefabricatjjdings, or other structures that can readily bemoved not attached in a permanent manner to aperma’oundation and are used for residential or businesspur
sewer.A ,
tionary, a permitted by Section 14.08.050.
The definition of mobile food unit aligns with languagecontained in OAR Chapter 333, Division 150, which containsOregon Heallh Authority food sanitation rules. The City hasdiscretion as to what constitutes a “Pod” where additionalrequirements are triggered. These definitions replace thedefinition for “temporary vending carts,” which is deleted.Definition of temporary structures is being modified toeliminate outdated reference to mobile homes and addsreference to mobile food units. At its 5/24/2 1 work session,the Commission recommended that “Pods“be defined as fouror more mobile food units.
Page 1 of 12
25

July 22, 2021 Revisions to NMC Chapter 14, Mobile Food Units and Pods
CHAPTER 14.09 TEMPORARY STRUCTURES PERMITSUSES
14.09.010 Purpose
The purpose of this section is to provide some allowance forshort-term uses that are truly temporary in nature, where nopermanent improvements are made to the site, and the usecan be terminated and removed immediately. Temporaryactivities include special events as defined in 9.80.010 of theNewport Municipal Code, temporary living quarters,construction trailers, leasing offices, vending cartmobile foodunits, kiosks, storage buildings, and similar structures.
Staft Chapter title is being changed from structures to uses,which is more consistent with the purpose statement. Mobilefood units are introduced as a type of temporary use, which isappropriate given that they are vehicles.
14.09.020 Special Events Structures
Placement of special events structures is regulated underChapter 9.80 of the Newport Municipal C e.
14.09.030 Temporary Living Quarters
Notwithstanding any other restrictions and prohibitions in thiscode, a recreational vehicle may be used as a temporary livingquarters subject to the following conditions:
A. The request for temporary living quarters must be inconjuncflon with a valid, active building permit.
B. The time. limit shall be no longer than one (1) year fromissuanc” After the expiration of the time limit, therecreational vehicle used for the temporary living quartersmust no longer be used for on-site living purposes.
C. The recreational vehicle used as the temporary livingquarters must be self-contained for sanitary sewer.
D. Temporary living situations for non-residential projectsmay use a job shack or other such structure instead of arecreational vehicle as the living quarters and may have aportable toilet instead of a self-contained unit.
E. The location of the temporary living quarters on the siteshall satisfy the vision clearance requirements as set forthin Section 14.21 of the zoning code.
Page 2 of 12
26

July 22, 2021 Revisions to NMC Chapter 14, Mobile Food Units and Pods
F. Prior to the issuance of a temporary living quarters permit,the applicant shall sign an agreement that the applicantshall comply with the provisions of this subsection.
14.09.040 Temporary Structures for Other Than Special Events
Notwithstanding any other restrictions and prohibitions in thiscode, a temporary structure not associated with a specialevent may be erected subject to the following:
A. The permit, if approved, shall be issued for a period not toexceed two (2) years. Upon like application and approval,the permit may be renewed for up to an additional (1) year.
B. Temporary structures are limited to commercially andindustriallycommercial, industrial, water-related, or wa.dependent zoned properties.
C. No permanent changes will be made to the site in order toaccommodate the temporary structure.
D. Permission is granted by the property owner.
E. Sanitary facilities will be made available to the site.
F. The structure does not interfere with the provision ofparking for the permanent use on the site.
G. The structure satisfies the vision clearance requirementsof the zoning code.
H. Approval is obtained from the City Building Official if thestructure is to be erected for 180 days or longer.
1. For tern ry structures that are to be placed in one.location for 12 or more consecutive months, a bond orcsh deposit for the amount required to remove thermporary structure, if not removed in the required timeframe, shall be placed in an interest-bearing account in thename of the applicant and the City of Newport. Any bondor cash deposit must be in a form approved by the CityAttorney.
Staft Re vision is housekeeping in nature. City has previouslyinterpreted that commercial and industrial includes waterrelated and water-dependent zoned areas. This changemakes it explicit.
Page 3 of 12
27

July 22, 2021 Revisions to NMC Chapter 14, Mobile Food Units and Pods
14.09.050 Temporary Vending Carts
Notwithstanding 3fl other restrictions and prohibitions in thiscode, a temporary vending cart, not associated with a specialevent, may be located within the City of Newport subject to thefollowing:
E. At least one trash and one recycling receptacle will bemade available to the public.
Page 4 of 12
A-
B
..•.•-
s.... commercially-
tJvvI It
- H ;
. .. -..
vv.-t ,
- fltii
liii It—I II ;—t—; p1 L 1UiLJt—11 iii —
Municipal Code.
r’n Pu ropertyJTV nnnn thc
(: I;—II
‘N
Temporary vending carts may be ““‘
zoned property that is at least 4 mile from a permanenteating and drinking establishment.
Temporary vending carts cessoryimprovements (such as seating) arc “ 1vatelyc’”od properties, and cy
only ifenoc .....“ 4 0-cf th
The !ems for vendisare limited to food and b for immediateconsumption. Re s to have a ent item or serviceconsidered shall Lnitted in ing to the CityManager, who shal tei,. the ite service:
1 Caended pie temporary
lead tr caus ongestien or blocking ofwalk;
Inorttra period to complete the saleservice;
4. Nuse noise or offensive odors; and
5. Be ej carried by pedestrians.
a temporary vending cart, if approved, shall be
____
r a period not to exceed two (2) years. Uponex ion of a permit, a temporary vending cart mustimmediately cease pnmtipn, and must be permanently
F. The City of Newport receives a signed statement that thepermittee shall hold harmless the City of Newport, itsofficers and employees, and shall indemnify the City of
28

July 22, 2021 Revisions to NMC Chapter 14, Mobile Food Units and Pods
Newport, its officers and employees for any claims fordamage to property or injury to persons which may beoccasioned by any activities of the permittee. Permitteeshall furnish and maintain public liability, products liability,and property damage insurance as will protect permittee,property owners, and city from all claims for damage toproperty or bodily injury, including death, which may arisefrom operations of the permittee. Such insurance shallprovide coverage of not less than $1,000,000 peroccurrence. Such insurance shall be without prejudice tocoverage otherwise existing, and shall name as additionalinsured the City of Newport, their officers and employees,and shall further provide that the policy shall not terminateor be canceled prior to the completion of ttontractwithout 30 days written notice to the City Reeef theCity of Newport.
G. A bond or cash deposit for mount regujred to remothe temporary vending cart, rem Th the requiredtime frame, shall be placed in earing accountin the name of the pp licant and . ity of Newport. Anybend or cash deposit t be in a approved by theCity Attorney.
Staff’ This section is being rep ections 14. 09.050and 14.06.060 below.
14.09.050 Mobile Food Units .1
NotwithtS’ othLr[ ns and prohibitions in thismWood unit, nd’t’ociated with a special event,
the City of Newport subject to thefllpwi’
A. The lotcel ortràct upon which the mobile food unit willbe pIaces zoned for commercial, industrial, or water-elated and
POLICY OPTION
B. The lot, parcel or tract upon which the mobile food unit willbe placed is located at least 500 feet from the grounds ofany elementary or secondary school when said school(s)are in session. For the purpose of this subsection, “insession” is the period of time commencing one-half hourprior to the start of the school day and endinj one-half hourafter dismissal at the end of the school day; and
Page 5 of 12
29
July 22, 2021 Revisions to NMC Chapter 14, Mobile Food Units and Pods
Staff’ This poilcy option responds to concerns raised in the6/28/21 and 7/12/21 letter from the Lincoln County SchoolDistrict, in which the District expressed concerns aboutal/owing food carts/trucks to locate on private property in closeproximity to their facilities. This is distinguishable from theirother request, which is for the City to retain the existing 500-foot separation requirement in NMC Chapter 4. 10 that appliesto vending within public rights-of-way or on public property.
The Commission received written testimony from JanetWebster on 7/11/21, Front Street Marine, LLC (StevenWebster) on 712/21, and Victor Mettle on 7/12/21 objecting tothe District’s request and refuting their rationale, particularlyas it relates to student safety and the nutritional quality of foodtruck/cart products.
This option imposes a 500-foot buffer around elementary andsecondary schools where mobile food units would beprohibited. The District’s justification for the requirementrelates, among other things, to a concern that allowing foodcarts could compromise a free lunch program they offer thatrelles upon student participation and wouldpotentially conflictwith closed campus policies that they have in place for themiddle school, or are considering for grades 9 and 10 at thehíqh school.
If the Commission elects to pu,ue this option, then a modestnumber ofcommercialproperties south ofthe high school andnorth/south of Yaquina View elementary would be impacted.
are no commercial, industrial, or water-relatedp?Oies within 500-feet of Sam Case Elementary or themiddle school. A map illustrating the 500-foot buffers was
.bincluded in the 7/12/21 meeting packet. Staff recommendsthe Commission impose the 500-foot limitation if there is achance the introduction ofmobile food units in close proximity( secondary schools could compromise the District’s freefuhch program. Such a concern is reasonable considering thenumber of students that benefit from the program, and evenwith the limitation in place, the code changes will makeavailable a substantial amount of private property to mobilefood units.
POLICY OPTION
C. The lot, parcel or tract upon which the mobile food unit willbe placed is located outside of the Nye Beach or Bayfront
Page 6 of 12
30

July 22, 2021 Revisions to NMC Chapter 14, Mobile Food Units and Pods
parking districts, the geographic boundaries of which aredefined in NMC Section 1414.100, unless the use is aMobile Food Unit Pod; and
Staff This policy option has been added, at the Commission ‘srequest, in response to public testimony received at the7/12/2 1 public hearing from the owners of the Taphouse andChowder Bowl in Nye Beach, and Clearwater Restaurantalong the Bayfront. The rationale is that there is too muchcongestion in these areas and that mobile food units wouldpull business away from establlshed restaurants that arestruggling to bounce back from the pandemic. Mobile foodunit pods would be permitted in these districts. Those thattestified in support of this allowance argued that Pods aremore permanent, with a level ofin vestment that is comparableto permanent eating and drinking establishments. NMC14. 14. 100 includes boundary descr,tions for the districts ja’is logical in that it coincides with areas where timedparkinjsused to manage parking demand. A map illustrating thedistrict boundaries is included with the 7/26/21 agenda packetmaterials.
D(1) 6en consent is o ed from the propey ownerwhéYe the mobife:ood uni o be placed; and
or
D(2) Written sent is obtained from the propey ownerwhere, tie m food unit is to be placed and from theowner y a nt propey occupied by an eating anddrinking ablishment; and
or
D(3) ten consent is obtained from the property ownerwhere the mobile food unit is to be placed and from theowners of each adjacent lot or parcel; and
Staff’ The requirement that written consent be obtained fromproperty owner is a given,’ however, if the Commission isconcerned about the impact a mobile food unit may have onbrick and mortar eatihg or drinking establlshments than staffhas included optional language that would require siqn-offfrom owners of adjoining properties (Option D(2)). A third
Page 7 of 12
31

July 22, 2021 Revisions to NMC Chapter 14, Mobile Food Units and Pods
option, requiring si’n-off from the owners ofeach adjacent lotor parcel irrespective of whether or not they are developedwith an eating or drinking establishment, is included as wellbut would be more difficult to justify. Staff recommends theCommission pursue Option D(’l) or D(2).
E. The mobile food unit is olaced such that it or anyassociated structure does not occuov reauiredlandscaping or obstruct a sidewalk, drive isle, fire lane,clear vision area or accessible parking; and
F. 10-feet of clearance is maintained betch mobilefood unit and between such units andproposedbuildings; and
C. Mobile food unit service win are to be oriopedestrians (i.e. no drive indows) and if diretoward a public right-of-wa II maintajflhminimum fi.(5) foot seoaration from the ri f-w
H. Electrical conner”) are the around andcovered with a ‘tjijfl ramguivalent where
en arate from andbile fcit is locat1 at least 10-feet
frther moS food ‘s and buildings and is fullyfrom w;and
ted witj wf is permaneuiW affixed to the vehicle in
anc h NMC 10.10.070. and one portable a-frarn tImplies with the parameters outlined in
and
any, are fully attached to the mobile food unit
Llefood unit is limited to a single piece of outdoorcoo ing equipment situated no less than 10-feet from theunit and any building; and
M. A minimum of one (1)trash receptacle per mobile food unitis located on the lot, parcel, or tract with at least 10-feet ofseparation between the receptacle(s) and combustible fueltanks; and
crossing drive
I. Any pneratc
-a Signaaesoci
c
nobile food unit is limited to
NMC
Awn I n Is1nd lo entirely on the subiect lot, parcel, or tract; and
Page 8 of 12
32

July 22, 2021 Revisions to NMC Chapter 14, Mobile Food Units and Pods
N. Mobile food units parked for more than two (2) hours orthat provides customer seating shall be situated within500-feet of an accessible restroom with handwashingfacilities; and
0. The permit for a mobile food unit other than a mobile foodunit pod, if approved, shall be issued for a period not toexceed two (2) years. Upon like application and approval,the permit may be renewed for additional (2) year intervals.
Staft The provisions above apply to the placement of mobilefood units on private property (as opposed to the pro visions ofChapter 4. 70 that apply to public rights-of-way). They drawfrom the code concepts discussed at the 4/12/21 work sessionand sample codes reviewed at that 3,2221 work session.Some of the concepts also borrow from codes adoptedbv theCity’s of Beaverton and Corvallis. This is structured as aministerial action with review and appro val by the CommunityDevelopment Department without notice, which is consistentwith how other temporary uses are handled. As a ministerialaction, the standards must be clear and objective.
A number of the provisions a/so integrate with Oregon HealthAuthority requirements outlined in OAR Chapter 333,Divisions 150 and 162 (enclosed) and requirements of theOregon Building and Fire Codes. Generators are permissiblebut must be screened and they would be subject to decibellimitat ns of the City’s noise ordinance.
14.09.060 Mobile Pods
In ‘ n omplyinci with the provisions of NMC14.09. m food unit pod may be located within theCity of Nert su to the following:
The mo food units include a sheltered commonustomr.., eating area that conforms with the following
a ers:
1. s a maximum of 50 percent of the structure enclosedwith walls or sides. Membrane structures may be fullyenclosed; and
2. Are not more than 15-feet in height. i
B. Each mobile food unit is connected to city sanitary sewerservice, water, and a permanent power source located onthe lot, parcel, or tract; and
Page 9 of 12
33

July 22, 2021 Revisions to NMC Chapter 14, Mobile Food Units and Pods
C. Existing uses on the lot, parcel or tract upon which themobile food unit pod is to be located possess off-streetparking that satisfies the requirements of NMC Chapter14.14; and
D. One off-street parking space is provided for each mobilefood unit plus one space for every 150 square feet ofseating; and
E. The lot, parcel, or tract shall be landscape cordancewith NMC Chapter 14.19: and
F. Areas occupied by customers are imWated mobilefood units operate during hoursrkness, wit uresthat are downward directed aelded to preven eon abutting properties; and
C. Use of generators is prohibite d
H. Review and approval shall be sua Type I decisionmaking procedure as set forth in NMapter 14.52.
Staff’ Mobile food unit pods are defined as four or more unitson a lot, parcel, or tract. This can be adjusted. The conceptis that at this density they need to move closer towardsstandards that would apply to brick and mortar eating anddr/nAYii.establishments. This is where the requirement thatseating 1e provided comes into play. Given Newport’s
cliniate. JfeqUiret77ent that the seating be sheltered is: .
ésonab/é. The /finitation that a non-membrane sheller beno n7ore than 50% enclosed helps facilitate continuity of thePod by ensuring vi’sibility between mobile food units andseating areas and it avoids triqgering assembly occupancy
.. .and related provisions of the Oregon Structural SpeciallyCode that could significantly drive up the cost of a project.Connection to publlc water and sewer will tr,gger SDCs, a costthat is s/mi/ar/v borne by brick and mortar establlshments.Use of a permanent power source alleviates the need forgenerators. which could be a noise issue when several arerunning in a concentrated area.
Off-street parking and landscaping requirements trigger for apod,’ whereas, they are not a consideration for sites with oneor two mobile food units. Brick and mortar eating and drinkingestabllshments must satisfy these same requirements.
Page 10 of 12
34

July 22, 2021 Revisions to NMC Chapter 14, Mobile Food Units and Pods
After the Commission’s 7/12/21 hearing, but pr/or to the7/26/21 hearing, staffamended Subsection 14.09.050(0) andadded Subsection (H). Given the level of in vestmentassociated with a Pod development, it wouldbe difficult for theCity to justify the approval being Nm/ted to two (2) years withan option for renewal e very two (2) years.
14.09.060070 Permits Not Transferable Unless Approved
Permits authorized by this section are not transferable toanother person or location unless approved by the CommunityDevelopment Director.
14.09.0-74080 Approval Authority
Unless otherwise provided, placement of temporarystructures is subject to review and approval by the CommunityDevelopment Director as a ministerial action.
14.09.080090 Application Submittal Requirements
In addition to a land use application form with the informationrequired in Section 14.52.080, applicatio or temporarystructures uses shall include the following:
A. Asiteplan,drawntosca ,showing:
1. The proposed location of the—temporary structures,mobile food units, seating areas, and amenities, as
P applicable.
2. Existing buildings.
3. Existing parking.
4. Access(es) to the parking areas.
5. Any additional structures, seating areas, and amenitiesassociated with the temporary structureuse.
6. The location and size of trash receptacles.
7. Utilities.
8. Existing signs and signs associated with the temporarystru ctu reuse.
Page 11 of 12
35

July 22, 2021 Revisions to NMC Chapter 14, Mobile Food Units and Pods
9. Temporary structure bBuilding elevations or photos ofproposed temporary structures or mobile food units.
1O.The location of drive up windows (The location of anaccessible restroom with handwashing facilities, ifapplicable).
B. A signed agreement stating that the applicant is aware ofthe limitations and conditions attached to the granting ofthe permit and agrees to abide by such limitations andconditions.
C. A description of the types of items sold or servicesrendered, if applicable.
D. A valid copy of all necessary permits required by State orlocal health authorities, and other required licenses orpermits, such as business license or sign permit obtainedby the applicant and maintained on site.
Staff The submittal requirements have been updated toaccount for mobile food s an app//cation type.
14.09.090100 Fire Marshal lnsp on
Prior to the issuance of any permit, the Fire Marshal shallinspect and approve any temporary structure to assureconfØrance with provisiorof the Fire Code.
14.09.1-00110 C ructimption
Construction trailers located on the site upon whichconstruction is to that are used during the course of theconstruction projece exempt from the process outlined inthis section and may be permitted at the time of building permitapproval provided said structures comply with the buildingcode and the vision clearance requirements of the zoningco
Page 12 of 12
36

July 7, 2021 Revisions to NMC Chapters 11.05 and 12.15, Relating toBuilding Codes and System Development Charges
(Unless otherwise specified, new language is shown in double underline, and text to be removed isdepicted with strikethrough. Staff comments, in itafics, are for context and are not a part of the revisions.)
CHAPTER 11.05 BUILDING CODES
***
11.05.180 Exemptions
Temporary Vending CartsMobile Food Units that are permitted in accordance with theNewport Zoning Code and Ordinance section 2 2 29.030 Municipal Code Chapter14.09 and are not permanently attached to a foundation, they are considered vehicles(not a building or structure), and the Oregon Structural Specialty Code does not apply.
Staff’ These revisions are need to address changes to terminology and to accuratelycross-reference the section of the code that will regulate mobile food units.
CHAPTER 12 15 SYSTEM DEVELOPMENT CHIRES
12.15.060 Exemptions
***
A. The following actions exempii payment of SDCs:
1. Additions to multi-family and other dwelling units that are assessed SDCs on anEquivalent Dwelling Unit basis, provided the addition does not result in a newdwelling unit.
An tion, addition, replacement, change in use or permit or connection thatdoes not increase the parcel’s or structure’s use of a public Improvementsystem is exempt from payment for the SDC payment applicable to that type ofimprovement Some redevelopment may be subject to some types of SDCsand not to others.
3. Temporary and seasonal uses, including special events, vending carts mobilefood units (other than pods), and patio or deck seating associated with eatingor drinking establishments.
Staff’ With this change, persons establi’shing a mobile food unitpod (L e. four ormoremobile food units on a property) will be required to pay system development chargescommensurate to the developments impact on publlc seivices. Revisions to NMCChapter 74.09 require that pods be connected to city wastewater seivices and thatthey offershelteredseating to guests. These are more permanent site improvementswith impacts thatmaybe moreyear-round than seasonaL Three orfewermobile foodunits on a property will not be requi’red to pay SDC’s.
Page 1 of 1
37

NE. °RT Cityof NewportCommunity Development Department169 SWCeeetHighwey Phone1.541.574 0629
______________
Newport, OR 97365 Feo;1541.6740644
k&,dl,o,,tçOs,cesTheCtyoINeS,ta,s,,ptjtyft,toop,wrdnen Olmis
Image Taken July 201844nch 4band Digital Orthophotos
Bayfront and Nye Beach Parking Districts with Zoning(district boundaries shown in cross hatch) N
A1L____JL......J FeetI wnn I flIlfl
38
I
AT NYECREEK
515 NW COAST STREET
NEWPORT, OR 97365
(541)272-5545
July 9, 2021
To The City of Newport and all whom it may concern:
Nye Beach in the summer is a busy area for tourism, yet the infrastructure of the roads and parking makeit cramped leaving the businesses in the area with only so much space for their potential customers tonavigate and park. If the city were to allow Food Carts in the Nye Beach turnaround it would add morestress to an area that is already so limited on space. Last time a food cart was in the turnaround was acouple years ago and in the short time the cart was there, the amount of paper garbage that was blowingaround in the wind was amazing. The trash bins were unable to carry the load from all the to-go containersthat are produced from a food cart. All the excess trash causes the seagulls to be very densely populated inthat area feeding on anything that is left behind creating messes of their own. This would contribute tomaking our Nye Beach area littered and dirty, which isn’t what any of us want.
Food carts in our small city are not a good idea either, they can come and go without any investment in ourarea. The carts don’t have to pay the overhead costs like the restaurants. Yet they can pick the best, mostlucrative times to show up (weekends, holidays, summer) and pull business from the restaurants that arehere all 12 months of the year. Our locally owned restaurants only have a small window of time to makesure they make enough to keep the doors open when the tourists aren’t around in winter.
We do not want any food carts to be allowed in Newport. As a compromise if the city were to allow foodcarts in, it should only be as a food cart pod. The food pod would need to have carts sign a year lease tomake sure they are part of our community, not just here to take from our businesses without aninvestment in the city. They would need to provide adequate parking for their patrons, garbage, sanitationand cleanup to make sure our city stays clean and a place people want to visit. With a lease and overheadlike restaurants the carts would then be a more permanent business paying their part just like all therestaurants in Newport do.
After speaking to other restaurant owners in the area we are not the only ones who feel this way and haveconcerns about allowing food carts in Newport.
Thank you for your time and consideration,
Greg MorrowSusan ArmstrongOwners
39

Hit-and-run charge after
/N ib
NE”wS’ 6i92o472;;aK’S
Local News Coastal Views. ts.com .
Newport, Oregon Wednesday, Juty 14,2021 Number 55 $1 • 139 years.HE6ThSTREET&HWY1O1
NEWPORT WOMAN ON JEOPARDY PRIMALTONES: AVENUE LIKE NO OTHER 541-574-6847SEE...COMMUNI1Y PAGE Bi SEE.. .BUSINESS PAGE B8 ‘THENEWPORTCAFE.COM
Up-dose look at PacWaveBY MATHEW BROCK
01 the News-Times
SEAL ROCK — Fromcurious Lincoln County residents to OregonState University engineering students, dozensof people from LincolnCounty and beyond wereshuttled to DriftwoodBeach State RecreationArea on Saturday to getan up-close look at theongoing construction ofthe PacTt’ave South project’s beachside landingsite.
Half the constructionequipment at the sitewas shut doors Saturdayfor an open house, withvisitors being brought infrom the Seal Rock FireStation and given toursfrom PacWave staff,engineers and contractors who explained justwhat goes into an underground and subsea construction project of thisscale.
When complete, Driftwood will house thePacWave South facility’sbeachside landing point,which will connect theseven miles of underseacable that extend fromthe projects offshore
testing facility to its onshore utility monitoring
PACwAvE art Page AlO
Newportcouldopen upto foodtrucksPlan 12 LR
COIfl 11? 1SS1O)?
con tin nesp a but’heai’uig
BY KENNETH LIPPOr the Nevr-Times
NEWPORT — TheNewport Planning Conntission held a first psiblie hearing on proposedchanges to city coderegarding food trucks,which are currently allbut forbidden in the city.
The Newport CityCouncil made amending the city code to allow greater operationof food trucks one of itslegislative goals, sendingthe matter to the planning commission, whichfirst took up the issueon March 22. Duringa public hearing at itsregular meeting Mondaynight, the contnsissionreviewed revised codelanguage developed bycity staff.
The current code requires food trucks, referred to as mobile foodunits, on consmercialproperty ts be at leasthalf mile of brick-andntortar eateries. Thereare very few comnniercialproperties in Newportthat fit that bill, Community DevelopmentDirector Derrick Tokossaid during the meetingMonday.
It’s possible to get anendorsement that allosvs operating in a rightof way — parking on the
TRUCKS on Page A8
Construction workers at Driftwood
Beach State Recreation Site stand
by as they prepareto operate a mas
sive auger attachedto an underground
drill. (Photo byMathew Brock)
A drone photo (pictured right) shows
the DriftwoodBeach construction
Site from the air.
(Courtesy photo)
New Seal Rock fire board gets to workAnton electedboard president
Toledo council discussesraising street lighting fee
BY MATHEW BROCKOf the News-Times
TOLEDO — The Toledo City Council is considering raising the city’s Street Light Utility fee this yearto help cover the $140,000 in costs required annuallyto maintain the local lighting system.
The current fee was technically lowered from $7.50to $2.50 a month in 2019, with the $5 difference being redirected to the city’s Sewer Fund, which receiveda boost this year when the council chose to raise thecity’s sewer and water rates by 2 percent in May.
The council met last Wednesday, June 7, at city hall,where it discussed a new framework to determine therate and svill hold off on a decision until city staff can
LIGHTING on Page A7
BY MiCHAELHEIN BACH
Of the News-Times
SEAL ROCK — Thethree newly elected members of the Seal Rock Rural Fire Protection Dirtrict Board of Directorswasted little time ushering in a culture of teatssition during their first
SEAL ROCK on Page A9
Al Anton, right, recites the oath of office during a July 8meeting of the Seal Rock Rural Fire Protection DistrictBoard of Directors as sitting board member Tina Fritzlooks on at the district’s Grebe Street station. Shortlyafter being sworn icr, along with newly elected directors Mike Burt and Paul Rimola, Anton was elected thenew board president. (Photo by Michael Heinbach)
40

A8 News-Times Newport, OR Wednesday, July 14, 2021
svith student safety er access to nutritieus feud.She said the primary audience weuld he employeesat the acheoia and localbusincaaea, and that mostfeed truck operatnra takecare to preside a clean,inviting atmosphere, aswell as high-quality fare.
Susie Montague, whohas previously appearedbefere riP’ council to
urge changes to the code,speke Monday in support
ef tile proposed changes.Mentague haa obtained
the required liceese fromLincoln Counts’ to operatea fish and chips atand, tobe supplied by the fishinghost she owns with herhusband, the F/V Jo El.
Montague aaid she’dobserved Newport grewbusier during recentyears, and this seasenhas brought numerousreports ef difficulty getting a table anywhere onweekends. She said shewuuld seek a faxed Incation on private propertyand had nu interest inlocating near a schoni,on tise Bayfront or at NycBeach.
Nathais Wailner, ewnerof Tsunami Training Center in Agate Beach, said heivanted to rent one ef his
lots next dour to the gumfor use by a fend truck.
Tile uperatien wuuid be
located arruss Northeast
52nd Street from Szabo’aSteakhouse, tVallner said,but there svouid he plentyef business to go amend,considering the cruwds atthe wayside across High-
way Sot during teuriatseason.
In testimony againstchanges, Mike Franklin,owner uf Newpurt Chowder Bowl, said he believedthere was a place fur fundtrucks in Newport, butthat they should he restricted to fixed pods uiththe same required infrastructure, trash removaland licensing as brick-and-mortar eateries.
Franklin said mobilefond trucks could bring
uneven conspetition at the
worst possible time, with
restaurants just out from
under the strict rapac
ity limits of the pandemic
and desperate fur staff.Mobile fond trucks couldtake up precious parkingspaces and contribute toalready overflowing trashduring the busy seuaon.They also have the advantage of being able tooperate only during peaktimes, whereas restau
TRUCKSCeotinoed from page I
side of the road — butstops are limited to 55minutes in one spot. That
language was designedfor operations like ire
cream trucks, Tokos said.Vendors also cannot operate on rights of svay within 500 feet of schools.
The city can alan grantspecial event permits forvending on city property
other than streets, such asit does during the farmersnsarket.
The revised rode wnuidallosv up to three mobilefood units on a privatecnnunereiai or industrialproperty — at four units,the operation beconsm a“pod,” which is subject tomore rigorous requirensents, such us connection to water/sewer service and sheltered seating— with no restrictionsen prosimity to existingrestaurants. Operationswould be permitted fortxvn years through a special use permit, whichcould be renewed.
:.4on city rights of way,the amended rode wouldallow operation for upto twe hours in one spotwith a special business
license endorsement, except in residential areas,where operation wouldatiB be restricted to 15minutes.
Tokos said the commission had a couple of pnlicy options regarding private property. If a ntobilefoud unit is planned rightnext deer to a brick-andnsortar establishment,they could require the approval of that neighboring business owner. Theycould also prolsibit operation on public rights ofway that front an existingrestaurant.
rants base employees ;s’hnrely on regular hours andrustonsero who expertthem to be open.
“This change in rodeciii impact each and everybusiness in this community,” Franklin said. GregMorroc; owner of the Taphouse at Nye Creek, saidhe agreed with everythingFranklin said, and he farther expounded on thetrash issue at Nve Beach.
June11 Goplen, ownerof Clearwater Restaurantand the Barge Inn Tavernon the Bayfrunt, urgedthe rontnsission to extendits consideration of therevised cede to bring inntnre input.
Comnsiwionera electedto continue the hearingto the July 2fi meeting,svhirh will ailosv it to consider specific figures fronsthe school district regarding how close the highschool h tu losing freemeals.
Tokos ciii also makerevisions to proposedrode language for thenext meeting at the dirertiots of commissioners.He’ll add a policy eptionthat creates two differentkinds of spaces for faxed
vendors on public property (which currently onlyapplies to two locations,the Nve Beach tumaround and near HatfieldMarine Science Center inSouth Beach).
The coosmuission directed him to includelanguage that prohibitsoperation ems rights of wasin front of existing restaurants and eliminate thepolicy option of out doingso. Consnsisoioners werealso in favor of requiringvenders to get approvalfrons their neighbor ifthey planned to operatenext door to a restaurant.
They retained for conaideratiou all optionsregardimsg proximity toschools, and added wasan option to restrict foodtnmrks in Nyc Beach andthe Bsvfront to operationc’ithin pnds.
The commission will reviesv the res’ised languageand hear more public testimony during its regular nseeting at 7 p.m. on
July 26. The commissionmakes rerommendationsto the rits council, whichcould adopt any finalchanges to the municipalrode.
Language might alse beincluded that prohilsitsoperation on rights of svaycithin 500 feet of anyschool, and that prohibition could be extended toprivate property, a prosision for which the LincoinCounty Schooi Districthas advocated.
A June 28 letter te Tokos from the office of Superintendent Karen Graysaid the district “vehemuently opposed” ailossingfood trucks to park nearsecondary schools.
According to the letter,the district is consideringgoing to a “closed campus” for ninth and tothgraders at Nesvport HighSchool, and it believesnearby fond trucks svouldcomplicate those efforts.Allowing food truckscould also svorsen traffic, the letter claims, andit could jeopardize thedistrict’s federal and statemeal funding, should toomany students opt forfood trucks instead of thecafeteria. The letter alsoraises the concern thatvendom’ food may notbe as nutritious as theschool’s.
During Monday’s meeting, an attoruey for theschool district made itnear that they opposedany food truck operation within 500 feet ofany school, svhether inthe right of cay or onprivate property. He saidNesvport High Schoolaiready had iosv schoolmeal participation, andfood trucks could veryss’ell push them over theedge.
In svritteu testimony,Janet Webster, who ownsproperty near NesrportHigh where she wantsto create a pod, said shedoes not believe foodtrucks would interfere
IGENERAL PRACTICELAW
Do you have a child who is ready for kindergarten? [ -(tureieg sac ertefare 5€etember st 25271
AdeptzvsReal Estate LawBusiness LawCivil Trial
Experienced & KnowledgeableServing Lincoln County Since
217 S. Main St paulosieriund.c
Toledo, OR 97391l-
/\ ABC Learning Center ‘“‘
Award 7 is reisdy to meet,your amaim)wseolng family’s educational class
School! , needs! alas,!
r mIS d h—
cheek oat oar website to register forthe 2a2t 2a22 schoolmail M-F 7a r ‘5.
ww.ab
.,,1,75
I a “,
SEEKING CASH DONATIONS TO HELP CARE FOR TtIbmH4 —
Bright HqrizQpsI 4 i11) cRidingCctiter“5 Call A or websire foe details
on maiuoe a donatian.www,BRloH’rHoglz ‘“ ‘.0% .541-961-4156
SEE UNTEERS ,:J
________________________________________
Food Shareof Lincoln County Cosiact
535 N.E. 1st Street .. VnlsnteerQ- Newport, OR 97365 Opociii’cvs7
WWW.FOOOSHARELC.ORG. 541-265-8578
41

Derrick Tokos
From: Lighthouse Associates <[email protected]>Sent: Wednesday, July 14, 2021 6:39 PMTo: Derrick Tokos; Public comment; Sherri MarineauCc: [email protected]; [email protected]: File No. 1-Z-21. Mobile Food Units and Proposed Changes to Codes and PoliciesAttachments: foodtruckfreedom.pdf
[WARNING] This message comes from an external organization. Be careful of embedded links.
Mr. Derrick I. Tokos, AICPCommunity Development DirectorCity of Newport169 SW Coast HighwayNewport, OR 97365d .tokos@ newportoregon.gov
Planning CommissionCity of Newport169 SW Coast HighwayNewport, OR 97365publiccommentnewportoregon.govs. marineaunewportoregon.gov
RE: File No. 1-Z-21. Mobile Food Units and Proposed Changes to Codes and Policies
Dear Mr. Tokos and Commissioners Patrick, Branigan, Hardy, Berman, Hanselman, East, and Escobar.
As a resident of Newport, Oregon and a business owner and resident manager of commercial property in the “DecoDistrict” I am writing to offer my input with regard to the proposed changes regarding food trucks and food carts (andother potential mobile vendors).
I was invited on short notice and attended the July 12th evening meeting/public hearing regarding this issue, and regretthat I was not prepared to offer input at that time.
My first exposure to food trucks was in Roswell, New Mexico while I was a junior high school student five decades ago. Iknow most people think of food trucks as a more recent phenomenon, but I clearly remember the line of food trucksparked in the “bus loading zone” during the middle of the school day offering food and snacks. The school districtwelcomed them and profited from the rent charged them. The health and welfare of the students did not appearnegatively impacted. I am certainly not suggesting that for our schools here in the Lincoln County School District, but I dobelieve that the 500’ limit is unjustified. I lived on Third right across from the High School with a daughter attendingschool there. She came home every day during lunch, usually with several friend to have lunch. Those same friends alsooften went to Starbucks, The Human Bean and other establishments. As a parent, I sincerely do not believe that accessto mobile food units would impact the school any more than the current options and heartily disagree with thepresentation and arguments made by the representatives of the LCSD. They offered no real statistics on what the actualimpact might be.
1
42

Prior to coming to Newport, I spent two years working for a non-profit food pantry and community service organization
in Orange County, California. Food trucks are an integral part of most communities there and are positive and productive
contributors to those communities. They are licensed and inspected and must have their permit stickers posted
indicating the same. Many are operated on street corners using public street parking spaces with access via public
sidewalks and I never once saw any problem with traffic obstruction or impeding sidewalk usage. Some even operated
in core downtown areas of Orange and Santa Ana enhancing the other businesses in those areas and helping build
buying foot traffic.
Also, the arguments presented by the brick and mortar eating establishments would equally apply to any new eating
establishment opening in Newport and claiming unfair competition is an unfounded argument. It has long been held
that competition is an American value and is usually encouraged. My answer to that argument is ‘step up” and earn
customers the old fashioned way with good food and good service. Statistically, around the country mobile food units
are not detrimental to traditional eating establishments, although I believe that some restrictions would, like fences,
make for good neighbors. My own belief is that 200’ from an existing eating or drinking establishment would be a
suitable boundary unless a waiver is granted by an existing business.
I am attaching a PDF file compiled by an organization in conjunction with universities for the purpose of “How to Build
Better Food Truck Laws in Your City”. The publication references several other studies and policies that have worked and
some that haven’t in other cities around the country. I encourage your perusal of that material as you contemplate
those issues in our beloved City.
Respectfully,
Donald GLighthouse Associates LLC(541) 992-7175
Attachments: Food Truck Freedom, How to Build Better Food Truck Laws in Your City”
Other suggested references:https://ced.sog.unc.edu/food-trucks-local-regulation-and-communitv-economic-development/
http://www.ij.org/images/pdf folder/economic liberty/vending/foodtruckfreedom.pdf
2
43

—--
)S
.,
-II
EI
c)I
.1
.1
SSS
5—
I
-j44

OOO
4 by Robert Frommer and Bert GallInstitute for Justice
J November 2012
I
JHo°
BfltrCt
Laws
45

FOREWORD
This report is a project of the Institute for Justice’s National Street Vending Initiative,which the Institute created in 2010 to promote freedom and opportunity for food-truckoperators and other street vendors. The initiative also seeks to combat anti-competitive andprotectionist laws that stifle the economic liberty of mobile-food operators and street vendors.
Through this initiative, the Institute has successfully fought protectionist restrictions incourt, and it encourages cities to instead enact narrowly tailored laws that address legitimatepublic health and safety concerns while not stifling entrepreneurial drive and opportunity.(For current news about the initiative, go to http://www.ij.org/vending.) In 2011, as part of itseducational efforts, the Institute published Streets of Dreams: How Cities Can Create EconomicOpportunity by Knocking Down Protectionist Barriers to Street Vending, which for the firsttime documented anti-competitive laws and regulations that restrict street vendors in the 50
largest cities in America.In response to that report and the growing popularity of food trucks, officials and food
truck operators have asked for examples of good laws that allow the food-truck industry toflourish while also protecting public health and safety. The Institute for Justice, drawing on itsresearch of food-truck laws nationwide, as well as its experience litigating vending cases andits discussions with food-truck operators, associations and government officials, created thisdocument: Food Truck Freedom: How to Build Better Food-Truck Laws in Your City.
46

TABLE OF COflTEflT
Executive Sununary 5
Introduction 7
Case Study: Los Angeles 10
Los Angeles from the Trenches 12
How Cities Should Address Public Health and Safety Issues 14
Food-Safety 14
Food Safety Enforcement 15
Parking 16
Ii Original Research on Food Trucks and Sidewalk Congestion 19
Refuse 21
Liability Insurance 22
Hours of Operation 23
Employee Sanitation 24
Commissary Requirements 25
Permitting and Licensing 26
Conclusion 29
47

EXECUTIUF SUmmARY
America is experiencing a food-truck revolution. These mobile kitchens are a way for new and innovativechefs who are long on ideas but short on capital to try out new concepts and dishes. Thanks to their low startup costs, food trucks give new entrepreneurs the opportunity to get into business for themselves at a fraction ofwhat it would cost to open a restaurant. These new businesses offer consumers more dining options, create jobs,and improve the overall quality of life in their communities.
In order to foster the conditions that will let food trucks thrive in their cities, officials should rememberthe two principles of good food-truck policy: 1) no protectionism; and 2) clear, narrowly tailored, and outcome-based laws. The following recommendations—based on the legislative best practices of Los Angeles and othercities that have experience regulating food trucks—exemplify those principles.
FOOD SAFETY: The Institute for Justicerecommends that cities follow their stateand county health codes. To the extent thecounty or state food code does not deal witha specific issue, the Institute recommendsthat officials follow the requirements ofChapter 10 of the California Retail FoodCode, which governs food trucks.
FOOD-SAFETY EnFORCEmEnT: The Instituterecommends that cities follow the approachof Los Angeles County, which inspectstrucks both when they are first permittedand periodically when they are in the field.Inspectors should hold food trucks andrestaurants to the same standards.
PARHIflO:Proximity Restrictions and RestrictedZones: Cities should not pass or retainlaws that tell food trucks they may notoperate either within a certain distance ofa brick-and-mortar competitor or in selectparts of the city. Protecting a few selectbusinesses from competition is not a propergovernment role; instead, cities shouldregulate only to protect the public againstactual health and safety concerns.
Distance to Intersections: The Institute recommends thatcities follow the example of El Paso, Texas, which statesallows food trucks to operate on the public way so long asthey are not parked within 20 feet of an intersection.
Use of Metered Parking Spaces: The Institute recommendsthat cities follow the example of Los Angeles by allowing foodtrucks to operate from metered locations.
Duration Restrictions (How Frequently Food Trucks MustMove): The Institute recommends that cities follow theexamples of Philadelphia and New York City, which do notforce food trucks to move after a certain period of time.
Potential Sidewalk Congestion: The Institute for Justicerecommends that cities follow the example of Los Angeles,which specifies only that food trucks not operate in a manner“which will interfere with or obstruct the free passage ofpedestrians or vehicles along any such street, sidewalk orparkway.”
REFUSE: The Institute recommends that cities follow LosAngeles’ approach, which requires trucks to “pick up, removeand dispose of all trash or refuse which consists of materialsoriginally dispensed from the catering truck” and to provide“a litter receptacle which is clearly marked with a signrequesting its use by patrons.” Cities should further specifythe precise distance from the truck for which operators areresponsible.
5
48

LIABILITY IIISURAflCE: The Institute recommends that citiesfollow the example of Los Angeles, which does not requiretrucks to purchase liability insurance beyond the amountrequired of all vehicles under state law,
HOURS OF OPERATIOfl: The Institute recommends that citiesfollow Los Angeles’ approach and not restrict when foodtrucks may operate.
EP1OYEE SAOITRTIOO:Handwashing: The Institute for Justice recommends that citiesfollow the example of Los Angeles County and the CaliforniaRetail Food Code, which requires trucks to have handwashingstations if they prepare food, but does not require them ontrucks selling only prepackaged foods like frozen desserts.
Bathroom Access: The Institute recommends that citiesemulate Las Vegas, Charlotte and Portland, Ore., by notrequiring that food trucks enter into bathroom-accessagreements with brick-and-mortar businesses.
COISSARY REQUIREmEnTS: The Institute recommendsthat cities follow the example of Portland, Ore., which exemptsfood trucks that carry all the equipment they need to satisfyhealth and safety concerns from having to associate with acommissary. For trucks that do require commissaries, theInstitute recommends that cities follow Los Angeles County’sapproach of allowing trucks to share commissary space.Cities, however, should not follow Los Angeles County’spractice of forbidding shared commercial kitchens, and shouldemulate the models put forward by cities like Austin, Texas,and San Francisco.
LICEfiSIflO:Application Process: Cities should follow the licensingapproach of Los Angeles County, which has a simple andstraightforward application process. In terms of guidance,cities should emulate Boston and Milwaukee, which have bothpublished step-by-step instructions to guide entrepreneursthrough the licensing process.
Cost: The Institute recommends that citiesshould impose a flat annual fee in the rangeof S200-300, as both Cleveland and KansasCity, Mo. have done. To the extent thata city issues licenses on a calendar yearbasis, its fee should be prorated so a truckfirst getting on the road halfway throughthe year would pay only half the full-yearamount.
Who the License Covers: The Instituterecommends that cities follow the exampleof Los Angeles County by licensing theoverall vending business rather than theindividual vendor.
Limits on the Number of Permits Issued: TheInstitute for justice recommends that citiesfollow the example of Los Angeles and notlimit the number of food-truck permits.
The specific laws and regulatory materials upon which these recommendationsare based are discussed thoroughly in thepages that follow. Cities should implementthese recommendations, which will bothprotect public health and safety and allowfood-truck entrepreneurs to create andrun businesses that will create jobs, increase customer choice, and boost the localeconomy.
Afi OfiLIAE compnoium COATAIAIflG THE FULLLAflOURGE OF THE LAWS CITED Ifl THIS REPORTCAfl BE FOUflD AT HTTP://WWW.IJ.ORG/UEflDIflG.
6
49

• Food trucks create jobs, buy productsand services from local businesses, andcontribute sales taxes and permit fees tocities.
• Food trucks attract foot traffic tocommercial districts—which meansincreased sales and a more vibrant retail-business environment overall.
• Food trucks serve as eyes on thestreet” and make the street a safer andmore enjoyable place to visit. Theirpresence can help prevent crime andrevitalize underused public spaces.
• Food trucks give entrepreneurs with bigdreams, but only a little capital, a way tostart their own food-service businesses.In many instances, trucks serve as astepping stone toward opening a brick-and-mortar space. Food trucks also giveexisting restaurants a new way to reachtheir customers.
Given the rapid growth of the food-truckindustry, it is little surprise that city officialsacross the country have started to look for answers about how to regulate this new culinarytrend. The purpose of this report is to providethose answers.
In Part I of this report, the Institute for justice outlinestwo important general principles for regulating food trucks,and then discusses how those principles have led to a thrivingfood-truck economy in the city of Los Angeles, which has thebest overall legal framework for food trucks in the country. InPart II, the report discusses how Los Angeles and other citieshave addressed specific regulatory issues based on an Institutesurvey of the food-truck laws in the 50 largest cities in theUnited States. Using these examples, as well as discussionswith government officials, food-truck owners and other stake-holders, the report then offers recommendations as to whatcities’ laws are models that other cities should follow.
TWO IPORTAflT PRIACIPI.ES FOR THE REOULATIOfl OF FOOD TRUCHS
In this report, the Institute discusses a variety of specificvending issues. While the details of each city’s laws concerning these issues may vary, the Institute for justice has foundthat the best laws typically follow the same pattern of 1) notprotecting incumbent businesses from competition, and 2)
providing clear, narrowly tailored and outcome-based rulesthat address actual health and safety issues.
Principle *1: No ProtectionismCities should not pass laws meant to protect established
businesses from competition from food trucks. Some of theanti-competitive laws the Institute for Justice first identified
Jon Fas,,,an, Truck,up Dlicioou Ti E’,v.’’.’, Nuveu,bnr 22, 2010, itt pJ/eawuu econom,st.con,1nude111493279
2 See, e 9. Sarah Meohan, Organsieru hope to prow Baltimore, D.C. food truck cumpetctiuts 8u,nsmur Busraass Juuo’,ur,Jone 25, 20t2, http)/awrvahitinomais corn/bait rnore/newC2O)Z!O0!25jorganizers’hope’to-grow’balkmnre.httui
I flT ROD U CD OflThe food truck revolution is sweeping the nation. In 2010, The Economist magazine predicted that “some
of the best food Americans eat may come from a food truck.”t That prediction has become true. Gourmet trucksacross the country are at the forefront of modern dining, serving affordable and delicious fare that rarely can befound at the neighborhood sandwich shop. In addition, food-truck “rallies” have become popular social eventsaround the country, with events frequently drawing thousands of hungry customers.2 These mobile kitchens arealso powerful engines of economic growth. Together, food trucks directly employ thousands of people nationwide, and the trucks, equipment, and food they purchase generate millions in economic activity.
In its 2011 research report on street vending entitled Streets of Dreams, the Institute for Justice explainedhow street vendors, including food-truck owners, are creating jobs, satisfying customers and generally makingtheir communities safer and more interesting places to live.3 Below are just some of the benefits that food trucksare providing as their numbers grow in cities across the country:
3 Erin Nu,rnau Robert Frommec Rett Gall B Lisa Kneppet, S,oacrs or De,opaas; Hi’w C,oes Ceo Cnr.orn Ecouor,,,c Orrornu’or Ksrocr;so O,,,o,. Po.,rcct,”,,,oi Barroos to Stunt herriNG 1201 1, httpilvôeos.ri orglstreets-of-deeams-2.
7
50

in Streets of Dreams prevent trucks from operating in certaincommercial areas, require trucks to move after an arbitrarilyshort time, and even stop trucks from operating within acertain distance of their brick-and-mortar competitors. Theseprotectionist laws do not help protect public health or safety.Instead, they stifle entrepreneurship, destroy jobs and hurtconsumers both by raising prices and giving them fewerchoices.4
Many of these laws are the result of lobbying by afew politically connected and powerful brick-and-mortarrestaurants, which argue that since food trucks don’t have thesame costs in terms of rent and property taxes, they amountto ‘unfair competition.” Of course, this argument ignores thefact that restaurants have many advantages over food trucks.No food truck, for instance, can offer its patrons heatingor air conditioning. Trucks generally can’t offer customersanywhere to sit. And since space on a food truck is limited,once a truck is out of forks, knives and other supplies, it’s Justout; there’s no stockroom in the back to turn to.
With all these inherent advantages, restaurants don’tneed the additional advantage of government interventionto “protect” them from food trucks, Furthermore, enactingrules to protect some businesses from competition isn’t justwrong, it’s unconstitutional. Both the U.S. Supreme Courtand numerous federal courts have held that it is illegitimatefor state and local governments to pass laws that burden oneset of businesses in order to benefit another, more politicallypowerful, group.5
4 G,o,, H..,ooo, & A,,rr.’w, Poooo, OBo,,, E’.,.,,.,,.,,or 462-634th ed. 20t3i eeplaioing welfare effects of gooernmeetbarriers to tote/i
5 See, e.g., Metro. Lde los. Co Waro47O U.S BSUEIOO5I; Cra,gs,,les c Silos, 3f2F.3d220(Otlr Cir.2002i; Merr,fieldL00150’ 547 F34 970 Stir Cit. 2USUi, Co,s,vell v. Hareifloo. 6SF Sopp 24 I Ui, (S.D. Cal. 1995
Principle 2: Clear, Narrowly Tailored andOutcome-Based Laws
Cities should focus their efforts onenacting clear, narrowly tailored andoutcome-based rules that address legitimateand demonstrable health and safetyconcerns. First, any laws that a city enactsshould be drafted in a clear and easy-to-understand way. Clear laws are easier forfood-truck operators to follow, since theyneed not guess at what the law requiresor prohibits. They make it easier for newentrants to get permitted and on the road.And, lastly, clear laws are easier for a city toadminister and create less risk that officialswill apply vaguely worded restrictions in anunfair and anti-competitive manner.
Second, cities should enact narrowlytailored laws in order not to throw out theproverbial baby with the bathwater. In
IJ’s 2011 vending pubhcation, Streets of Dreams.
8
51

other words, putting rules in place that gono further than what is needed to solvethe particular problem at hand. Overlybroad and restrictive regulations don’tbetter protect the public, but they canmake running a business more difficult, ifnot impossible. One example comes upwith regard to congestion. In New YorkCity, the areas around theaters can oftenbecome quite crowded, particularly astheaters let out. New York’s narrow solutionis to prevent food trucks from operatingat these specific locations during showtime. By contrast, turning all of midtownManhattan into a no-vending zone” wouldbe regulatory overkill and would appear tobe born more out of protectionism than anylegitimate concern for public health andsafety.
Officials should also enact outcome-based regulations, rather than regulationsthat specify particular methods or processes.
Regulations that focus on results are simpler to follow andgive food trucks an opportunity to figure out the best way tosolve the problem. One example is how cities regulate trash.Although most cities require food trucks to pick up theirrefuse, a few cities painstakingly detail the kind of trash cansa truck should use and where they must be placed. This top-down approach stops trucks from coming up with creativesolutions, and its one-size-fits-all nature means that sometrucks will have to carry trash cans that are far larger andmore unwieldy than what they actually need. Instead, citiesshould lay out their regulatory goal and then give the trucksflexibility in how they make that goal happen.
Ultimately, the prescription for food-truck successis simple: provide trucks with clear, narrowly tailored andoutcome-based rules that address the public’s legitimatehealth and safety concerns, And then step back and watchthis new, dynamic industry, with its jobs, satisfied customersand revitalized public spaces, flourish. To see how these twoprinciples have been applied in the real world, look no furtherthan how the birthplace of the modern gourmet food-truckmovement—the city of Los Angeles—regulates food trucks.
9
52

CASE STUDY: LOS AflGEIES
Of all the cities in the United States, few are moreclosely identified with the food-truck revolution than the Cityof Angels. For decades, “loncheros” served tacos, burritosand tamales to construction crews and the occasional officeworker.6 Then in late 2008, two entrepreneurs named RoyChoi and Mark Manguera came up with the idea for a Korean/Mexican fusion taco truck.7 Naming their creation “Kogi,” thetwo struggled at first, frequently setting up outside nightclubsin Hollywood.8 But soon Kogi went viral after Manguera andChoi started using Twitter to let people know where the truckwould be at any given time.9 Since then, Kogi has been a wildsuccess and now has four color-coded trucks on the road.t°
Other entrepreneurs quickly realized the potentialthat gourmet food trucks had to offer. Within a few years,numerous entrepreneurs began to roll out their own kitchenson wheels. Now Angelenos have access to trucks sellingeverything from Vietnamese Banh Mi sandwiches to Hawaiianshave ice and home-style macaroni and cheese. The publicreception for the trucks has been overwhelming, and theadvent of food trucks has in no way diminished L.A.’s vibrantrestaurant culture. Instead, Zagat.com reports that restaurantcustomers believe that the area’s restaurant scene hasimproved.1
But a more-vibrant food scene is not the only gift thetrucks have given Los Angeles. The growth in Los Angeles’food-truck industry has created hundreds, if not thousands,of new jobs, both on the trucks themselves and also at thebusinesses that design the trucks, build them, and supplythem with the equipment and ingredients that they need.Furthermore, having the food trucks out and about drawshungry customers outside as well, and as urban theoristJane Jacobs pointed out,”a well-used street is apt to bea safe street.”2 Lastly, food trucks are entrepreneurshipincubators. Food trucks, with their lower capital costs, are away for chefs to try out new cuisines and new ideas. Thoseowners who succeed often take their winning ideas onestep further by expanding their businesses and sometimesopening brick-and-mortar spaces. As a result of his food-truck success, for instance, Kogi’s Roy Choi expanded hisempire into brick-and-mortar locations, including his newrestaurant named Chego.13
6 JesUs Hern,osillo. LOCHERAS: A L.;u at son Sranoeauy Fouo Truer n, Los Asu,ier, Sept 20)0, http.iiann, Iabo,ucta.edeipablicationslrepoftslLacheras.pdi
7 Jessica Gel?, Kngi Korea,, 880. a taca truck brnughtto you by Twilte L.A Gr.,r, FeL. 11,2005, http2iwoou.lotiotes coedIeotoresla’fo-koqil l’2005lob11,0,4771256 stnr
8 Me,,ill Shindle,, Riding Shotgun ‘athKngi Zr.icr.cns.r,A)t,. 6, 2009, httpU/sru.aagatcooubuzzidddg-sbotgun-witb’kogi
9 Jess,ca Gel?, Kegi Korean B8LI,a taco truck brought to yea by Ta,joa, LA. Tens. Feb. lt,2005, httpptwwwla8,ees.coodleeto,es,la-lo-kogit t-SlSAiebt l.0,477t256.storj
10 Kogi BBfl’To’Go, hetp:flkogibbq.coml.
11 Zagal.conr, Zagal Celebrates 25 Years irs Los Angeles; 2,027 Restaurants Scaregad By 21. 168 Local Diners, Sept. Ii,2011, hnp’sssuss.zagal conr!node;3655295.
The food trucks success in the city ofLos Angeles, along with the great benefitsthose trucks provide, show that L.A’sregulatory framework is one that other citieswould do well to emulate. What makes LosAngeles a success comes from its adherenceto the two principles discussed above.
First, Los Angeles’ regulations arenot designed to stifle food trucks for thepurpose of protecting brick-and-mortarrestaurants from competition. As discussedabove, incumbent businesses often asklocal governments to put roadblocks inthe way of their new competitors. But LosAngeles’ code contains few if any anti-competitive restrictions. Unlike Chicago,San Antonio and New Orleans, for instance,Los Angeles does not say that food truckscannot operate within a certain distance oftheir brick-and-mortar counterparts. Thisdifference is partially due to an earlier rulingby a California court that such proximityrestrictions are unconstitutional.14 Likewise,Los Angeles does not require that foodtrucks must be hailed before they stop andserve customers. And it does not artificiallyrestrict when food trucks may operate.
Furthermore, California law has helpedprotect the public against attempts atprotectionist legislation. In July 2006, thecity of Los Angeles passed an ordinance thatordered food trucks to move every 30 or 60minutes depending on whether they were ina residential or commercial area.15 The citybegan to stringently enforce the durationrestriction in 2009, but it was soon rebuffed.On June 10, 2009, Judge Barry Kohn of theCalifornia Superior Court invalidated theordinance because it expressly conflictedwith the state vehicle code, which permitscities to regulate vehicle vendors only “forthe public safety.”18 A similar durationrestriction in the Los Angeles County codehad earlier met the same fate.17
ISSue Jnr:, Jn;ou,, Tue Den,,, srio Lu or 5,54, A’rr,;ur, Citus 34(1002).
13 Chegol, http/!eatchega.com!
14 People a Ala Carlo Catering. 159 CaL Rptr 479 Cal App. Dept Saper. Ct 15751
5 LA City Code 9 80.73lbl21lFl.
16 Cal. Vehicle Code 9 22455lbi; Press Release, UCLA School 01 Law, UCLA School of Law ChnicalPrograre ruins casechallaegieg validity of Las Angeles city ordinance implemented against fond tracks, June 10,2009, httpfissssw law.ocla.edoinews’madiarPagns.’News.esps?NewslO=737
Ii Penple u. Garcia, No 8E8V5884 at 5-6 (Cal Sup Ct Aug 27, 20081 Irelemog to Los AnGeles County Code b 762.0701
10
53

Second, the laws that the city of LosAngeles does have in place are generallynarrowly tailored to deal with actual healthand safety issues, straightforward, andfocus on results rather than on methods andprocesses. Together, the state, county andcity have established rules to govern, amongother things, what facilities and equipment atruck must carry on board, how it preparesfood and where it may operate. In LosAngeles, the law does not micromanagetrucks; instead, it merely requires thatthey obey the traffic rules applicable to allvehicles,18 follow basic safety precautions9and pick up after themselves.20 That said,some provisions of Los Angeles’ laws areoverly burdensome. The city’s requirementthat trucks not park within 100 feet of anintersection,21 for instance, seems excessive,particularly since other communities allowfor much more reasonable distances.22
USIflO OS AflOELES AS A STARTIAG POIAT
Although they are not perfect, and have been the subjectof fights both in council chambers and the courts, Los Angeles’food-truck regulations are generally a success. Los Angeleshas avoided protectionist laws in favor of clear, narrowlytailored and outcome-based health and safety rules, and itsapproach should serve as a starting point for cities that aredrafting their own food truck laws. On the next two pages,the Southern California Mobile Food Vendors’ Associationemphasizes the benefits of the approach. Then starting onpage 14, the Institute for Justice will discuss various food-truck topics and explain where L.A. has done well, where ithas gone awry, and where other cities might have a superiorapproach. The Institute will then go on to provide specificrecommendations that cities can adopt to address the mainpublic health and safety issues concerning food trucks.
8 LA. City Code 8 88.l3lb)l21)B)
lOLA. City Code 9 80.13lhE2}iC) ireqoidog that tr,,ck operators only serve customers from the side of the truckahothog tl,e sidewalk).
281 A. City Code 8 80.13)b)l21)E).
21 LA. City Code 8 88.69)d).
22 See, e.g., El Paso City Code 92 46.O2OlCl ireqvoog that trucks not operate wdh,n 20 foot of an ,otnrsnctiool.
fl I,
11
54

F.Los Angeles from the Trenches
Mobile Vending in Los Angeles
Historically, mobile vending in Los Angeles was primarilya business for recent immigrants. Many of the taco trucksof the 19705 and 19805 were founded and run by Mexicanimmigrants. These trucks faced discriminatory enforcementof the laws and, in some cases, outright attempts by cityofficials to shut down mobile vending in many communities.Those pioneers fought back by pairing with civil-rightslawyers to push back on the most egregious of these laws,including one that prohibited food vending within 100 feet of arestaurant’s front door.23 The current state of regulations is atestament to those advocates.
Another key to California’s vending landscape camein 1984, when the California Legislature passed a landmarkprovision telling cities that they may only regulate mobilevending “for the public safety.”24 One year later, theLegislature went one step further by preventing cities frominstituting outright bans on mobile vending for any reason.25This law has helped food trucks fight back against anti-competitive restrictions at the city and county levels.
by Matt GelIer, CEO, andieffrey Dermer and Kevin Behrendt, Counsel, Southern California Mobile Food Vendors’ Association
Southern California is the most mature mobile-vending market in the United States. The traditional tacotrucks, or “loncheros,” have been a familiar sight in California for generations. As a result of this unique history,Southern California and Los Angeles are more comfortable with mobile vending than perhaps other parts of theUnited States. Furthermore, this experience has left Los Angeles with the most well-developed and mature setof regulations in the country.
But none of this came easily. Over the years, public-interest advocates have fought tirelessly in thecourts, in the state legislature, and in local government halls for a more reasonable regulatory environmentfor mobile vending. Other states and cities would do well to avoid these battles and instead simply “cut to thechase” by repealing any protectionist laws on their books and passing narrow regulations that deal with actualhealth and safety issues. By emulating the best parts of Los Angeles’ regulatory landscape as described in thisreport, officials throughout the country can make sure thattrucks comply with the law and that consumers and residentsare satisfied.
Below, we briefly describe how Los Angeles’ uniqueregulatory landscape has evolved and the economic and socialbenefits that it has helped produce.
The Southe? ii California Mobile Food endors 4s-sociat ion was founded infanwiru 2010 in responseto the confusing regulatory Jrainewoi k that con-
fronted gourmet food- truck operators Sutce thenthe Association has worked with over 30 cities torepeal anti-coinpetittve vending laws fought backattempts at the Calitornw state legislature to weaken state protections for food trucks and hi mightsuit against municipalities that, at the behest ofbrick— and - mortar bus biesses, enacted ordinancesmeant to ensure that no mobile vending occurredon their streets.
The late 2000s saw the rise ofthe modern gourmet food truck. In thepast, food trucks had primarily servedconstruction workers on job sites. Thisbusiness model worked well during theboom times, but the real-estate collapseof 2007-08 meant that there were fewconstruction sites to service. Faced witha massive excess capacity of cateringvehicles, many entrepreneurs bought trucksand repurposed them. This was helped, inpart, by the fact that Los Angeles is hometo a family-business culture and a large
23 People IrA! CaA Cater,ng Co 359 Cal. llptr 415 lral App Dept Super Cl
24CaI Veh,cleCedeD2245S!bf
25 More spachcally, rho 1985 mendmenhtosect,oo 22455 removed rite final OflntafIce oisuftsectien lit,. whohpteuoesly read An ordtea,,ce or resolat,on adopted pors,iant to th,s subd,ois,on map poohlbitvendng fromvehicle upon a sty et
p.
12
55

number of different ethnic groups, many ofwhom brought new food concepts to thisemerging industry.
But the growth in this new industryruffled some feathers, including corporatequick-serve restaurants and thecommercial developers who rent to them.Unfortunately, but not surprisingly, theseforces made a concerted effort to pass newprotectionist laws in the city of Los Angelesand elsewhere. Although Los Angelesitself refrained from enacting any newanti-competitive restrictions, some othermunicipalities in the area passed restrictivevending laws and began to enforce anti-competitive laws that were already on thebooks.
It was against this backdrop that thefood trucks in Southern California joinedforces to create the Southern CaliforniaMobile Food Vendors Association. Only twoyears old, the Association has grown from30 initial members to over 150 members.Through education, lobbying and litigation,the Association has sent a clear messageto regulators that consumer choice andentrepreneurship should come first.
Thankfully, forward-looking officials in Los Angeles haveheard this message, embraced it, and now see the benefitsthat come from giving food trucks the freedom to operate.This hands-off approach has spawned an entirely new food-truck industry, with many companies now building andcustomizing food trucks, supplying graphic wraps for newentrepreneurs and selling technology to help consumers bothlocate their favorite trucks and order from them. The numberof trucks has grown, leading to hundreds of new jobs. And theincreased competition has pushed everyone, both food trucksand brick-and-mortar restaurants, to cook and serve food thatis better tasting and a better value.
Competition is what makes America great, and LosAngeles’ regulatory model wisely embraces that competitivespirit and rejects the idea that the government should protectcertain businesses at the expense of consumers. The city’sapproach to regulating food trucks has worked for LosAngeles, and it can work for your city as well.
F
F .
56

In the following pages, the Institute for Justice discusseshow cities should address some major topics surrounding foodtrucks, including these health and safety issues:
Food Safety
Food-Safety Enforcement
Parking
Refuse
• Liability Insurance
• Hours of Operation
• Employee Sanitation
Commissary Requirements
Licensing
For each issue, the Institute will describe the applicablelaw in Los Angeles and explain its advantages and drawbacks,It will then examine how other cities address the issue andexplain why those other approaches are better or worse thanwhat L.A. does. Finally, the Institute will recommend what lawcities should adopt and give reasons for that recommendation.Throughout, the report will provide citations to the pertinentlaws.
HOW LOS AflOELES REGuLATES FOOD SAFETY:The city of Los Angeles does not regulatethe design of food trucks, how they storeand cook food or what procedures theymust follow in cleaning their equipmentand utensils. Instead, this function isperformed by the Los Angeles CountyHealth Department, which administers therules set forth in the California Retail FoodCode.26 That code prescribes how all foodbusinesses, restaurants and food trucksincluded, must be designed and run.
While the Food Code has general rulesthat are applicable to all food sellers,’7 it alsocontains food-truck specific rules. The code,for instance, specifies the requisite amountof aisle space within the cooking portionof the truck28 and mandates that utensilsbe secured so they are not thrown aboutwhile the truck is moving,’9 The code alsoimposes different requirements on trucksbased on what the vehicle will be usedfor. If food will be prepared and cooked onboard a food truck, for instance, the coderequires that the vehicle be equipped withboth warewashing and handwashing sinks30and that any deep fryers be sealed using apositive air pressure lid.5’ Trucks that do notprepare and cook food need not meet theserequirements.
HOW OTHER CITIES REGULATE FOOD SAFETY:As in Los Angeles, in most cities theregulations concerning food safety aboardfood trucks come from state or countyretail-food codes. In Phoenix, for instance,the Maricopa County EnvironmentalHealth Code governs how food trucks areregulated.12 That code requires that trucksfollow the general provisions that are
26 Cal Heahh and Safety Code 0813100 et seq
21 Cal Hellh and Safety Code hi i42341a1 meeting that [alll n,olr,le food lacdilirs and mobile support ones shallmeet tire applicable requirements in Chapters tot, inclusive, and Chapter 13, unless specifically exenipted fromany of these provisionsl
28 Cal. Health and Safety Cede 8114321
29 Cal. Health and Safety Cede ft l4323lbuifl
30 Cal. Heahh aud Safety Code I l43ll
3t Cal. Hnahh and Safety Code Of 143231hil2’
HOW CITIES SHOULD ADDRESS PUBLIC HEALTH AflO FOOD SAFETYSAFETY ISSUES Sd:
An online compendium containing the full language of the lawscited in this report can be found at http://www.ij.org/vending.
14
57

applicable to brick-and-mortar restaurants,but it also imposes some additional, food-truck specific regulations. Likewise, theregulations that govern food safety forfood trucks in Indianapolis are governedby the retail food establishment sanitationrequirements of the Indiana AdministrativeCode, which govern both mobile and fixed-location food providers.33
Often the design and constructionrequirements for a food truck turn onwhat the truck will be used for. New YorkCity, for instance, has two different setsof regulations for food trucks based onwhether the food truck will be selling foodthat requires any cooking or processingin the vehicle (excluding the boiling of hotdogs). The two categories are subject todifferent requirements, which are a mix ofstate and local sanitary and health codes.34Likewise, the food-truck application forPortland, Ore., details four classes of vehiclesand the specific requirements that apply toeach class.35
IflSTITUTE FOR JUSTICE RECOmmEflDATIOfl:The Institute for Justice notes that mostmunicipalities follow the food -safety rulesestablished in county or state food codes,which are typically based on industry bestpractices. To the extent the county or statefood code does not deal with a specific issue,the Institute recommends that officialsfollow the requirements of Chapter 10 of theCalifornia Retail Food Code, which governsfood trucks.36
Furthermore, cities drafting theirown regulations should, as the CaliforniaRetail Food Code does, customize thoserequirements based on what the truck willserve. Safety or cooking equipment that isnecessary for a truck where food is preparedmay well be unnecessary for a truck that
sells only prepackaged food or ice cream. Regardless of whatlaw a city follows, though, it should lay out what precise stepsoperators must take. Having officials rely on informal customsand standards that are unknowable to those on the outsideunnecessarily increases both uncertainty and costs to wouldbe entrepreneurs.
BOTTOM LINE:Cities without food-safety regulations for mobile vehicles shouldadopt Chapter 10 of the California Retail Food Code and tailorthose regulations to the potential risk that the truck’s food posesto public health and safety.
FOOD-SAFETY EflFORCEEflT
HOW FOOD SAFETY IS EflFORCED IA OS AAOELES: Los AngelesCounty is the government body responsible for administeringthe state retail-food code and inspecting food trucks.37 Itsrules call on county officials to perform unannounced fieldinspections of trucks. In early 2011, the county startedassigning letter grades to food trucks based on the results oftheir inspections, which mirrored what the county already didfor brick-and-mortar restaurants.33 Food trucks must displaythe grade they received on their vehicle,39 Food truck ownershave largely welcomed this change, which gives them theopportunity to show that they are just as clean and sanitary astheir brick-and-mortar counterparts.4°
HOW OTHER CITIES EI1FORCE FOOD SAFETY: Cities are split asto who inspects mobile food vendors. Approximately half ofAmerica’s largest 50 cities inspect trucks themselves, whilestate or county health departments conduct inspections forthe other 25 cities. The frequency of inspections similarlyvaries: While San Antonio conducts “routine, unannouncedinspections” of food trucks,4t Albuquerque, N.M., inspectstrucks at least twice a year based on the “past compliancerecord of a food establishment and the risk presented toconsumers by the menu items provided by the specificfood establishment. “° Inspections in most cities are
33 ind,ana State Oepattunent of Health, Retail Fond Eseabi,shment Sanitation Requirements, httpJwm.in.gnvl,sdhi 33 LA. County Code 5804 752des)4l0_iac.1-24pdf
40 See Lisa Jennings, LA toed trucks to post letter grade ,espectunn results, No,’iti’s Res,soassr Nrv;s Oct 20, 20t0.34 See Nes Punk Cit3 Deltartunert ef Health and Mental Hygiene Msbiie Vending Permit Inspection Requirements, hop I/nm con,laeticleda’foud-treckspnst-Irner-grade-inspectionresolts.
http’s,swi nycgnc:httepduh!doweioads/pdt/pennitlmfv_.cao.taucLinspectien.pdf.4t San Antonio C,ty Cede 5t3R2lkl,
35 See Mobile Feed Unit Plan Resiew Packet, http.I/web.multco.uslseesidelautSltleu/lneal4ildecsments’mtupian-,eoiew pdt 42 Albugneegue Cop Code 96-I-H
36 Cal Health and Safety Code 8514294 cc seq
lILA Count’3 Code 558114405. 804752
1 538 ReegUong 1,0 II. A dnoe to grade fend trucks in L.A Ceunty. LA Ti,aes, Sept 14. 20t8, hnp/Iutticleu lat,mes
cnes20torsep/14/IlncaUla-meIuud-tn,,cks-2ItIg09t4
58

unannounced,43 and most are conducted by the same officialswho inspect brick-and-mortar restaurants.44
IflSTITUTE FOR JUSTICE RECOmmEnDATIOn: Of the existing lawsconcerning food-safety enforcement, the Institute for Justicerecommends that cities generally follow the approach of LosAngeles County.45 In a forthcoming report, the Institute forJustice compares the inspection grades of restaurants andfood trucks in Los Angeles and finds that the city’s food trucksare just as clean and sanitary on average as its restaurants.Furthermore, cities should consider following Albuquerque’sapproach of taking a truck’s inspection history and the food itserves into account when deciding how frequently to inspectit. The Southern California Mobile Food Vendors Association,in a similar vein, has suggested that trucks that get two “A”grades in a row should receive a “Certification of Excellence”that reduces their inspection rate to only once per year. Thisapproach makes sense, since inspectors generally shouldspend less time on trucks that pass inspection with flyingcolors and instead focus on food trucks or restaurants thathave a history of problems. Finally, inspectors should holdfood trucks and brick-and-mortar restaurants to the samefood-safety standards.
BOTTOM LINE:Cities should follow Los Angeles approach by inspecting foodtrucks both whenfirst permitting them and periodically thereafter. Trucks serving non- hazardousfood or that have passed multiple inspections should, as in Albuquerque, N.M., be subject toless frequent inspections, which will give inspectors more time toinspect trucks and restaurants with a history of issues.
PRRHIflG
HOW LOS RAGELES DEALS WITH PARHIflO:Proximity Restrictions and Restricted Zones: The city of LosAngeles does not prohibit food trucks from operating within acertain distance of brick-and-mortar restaurants. Likewise,the city does not restrict food trucks from operating in popular
43 See, e.g., City of Kansas Cftg, Food protecson frequently asked qoestions. http’//ww4 kcmo.oeglhealsh.nsllweb/foodlaqse8.
44 See, e.g., Las Vegas Cey Code 802.020.
45 LA. Coo,rty Code 80804405,8.04.752.
46 LA. City Code 0 80.73lh1{2liAii4)lil.
47 LA. City Code 042 ISIs).
48 LA Cay Cede 080.1315021091.
commercial areas; instead, it merely statesthat food trucks cannot operate within 200feet of certain parks45 or near the PacificOcean.47
Distance to Intersections: Food trucks in LosAngeles must follow all traffic rules and anystopping, standing or parking prohibitions asprovided by the State Vehicle Code.48 Theymust also follow the traffic regulations inthe Los Angeles Municipal Code that apply toall vehicles.48 In addition to those state andmunicipal traffic laws, food trucks may notpark within 100 feet of an intersection.50 The100-foot prohibition is far larger than whatis needed to accommodate any congestionor visibility issues. For many smaller blocks,the restriction makes it difficult, if notimpossible, for trucks to legally park andserve their fare. Indeed, it appears thatLos Angeles recognizes the difficulty withthis approach; according to the SouthernCalifornia Mobile Food Vendors Association,the city of Los Angeles does not activelyenforce its 100-foot restriction.
Use of Metered Parking Spaces: The city ofLos Angeles permits food trucks to vendfrom metered public parking spots for themaximum amount of time listed on themeter.51
Duration Restrictions (How Frequently FoodTrucks Must Move): The city of Los Angelespreviously restricted how frequently foodtrucks had to move. Under its old law, foodtrucks could only stay in one spot for 30minutes in a residential area, or 60 minutesin a commercial one.52 They then had tomove one-half mile away and not returnfor 30 or 60 minutes, respectively.53 A LosAngeles Superior Court judge invalidatedthis duration restriction in 2009 and it is nolonger enforced.54
501 A City Code 80.73lbll2i1All3l.
51 See LA. Cd’y Code 0 88.73{b112)IBI
52 LA. City Code 80.73lbll2l1Fl.
53 Id.
50 Press Release UCLA School of Lass Clinical Program W,ns Case Challeog,oq ‘Ial,ddv of Los Angeles CrtyOrdina,rcr lnrplrroerrted AgairstTaco Tmcbs, lJu,re 10, 20091, http!femvw.law.scla.rdu!newsmediaiPages/News.aspx°NecrslD131.
49 Id.
16
59

Potential Sidewalk Congestion: The city ofLos Angeles does not mandate that foodtrucks park and vend only at sidewalks ofa certain minimum width; instead, it statesthat food trucks should not operate in a waythat blocks the public right of way.55
HOW OTHER CITIES DEAL WITH PARHIflO:Proximity Restrictions and Restricted Zones:In Streets of Dreams, the Institute looked athow many of the largest cities in the UnitedStates imposed restrictions on where foodtrucks could operate. In all, 20 of the 50largest U.S. cities told food trucks to stay acertain distance away from their brick—and-mortar competitors, while 34 cordoned offparts of the city, often prime commercialareas, from vending.55 Proximityrestrictions exist solely to prevent onebusiness from being able to compete withanother, which simply is not a legitimategovernment interest. Indeed, virtuallyevery court to consider one of these lawshas held them to be unconstitutional andstruck them down.57
Although not as transparentlyprotectionist as laws establishing proximityrestrictions, laws that create restrictedzones are often protectionist in effect dueto their breadth. Typically, congestionissues are fairly localized at particularintersections or on particular streets.But rather than take a narrow approach,restricted zones prohibit all vending in largeswaths of a city. Regulations that exceedtheir required scope look like less of anhonest attempt to solve a real problem andmore of an attempt to keep food trucksfrom competing.
Distance to Intersections: The 100-footrestriction that Los Angeles requires foodtrucks to follow is much larger than similarlaws in other major cities. Many cities do
55 See LA. Cdv Cede 56.08(c)
56 Sooras or D,eas,s 16,20 Jely 2011)
51 See, e.g., People e. Ala Carte Cateoog, 169 CaI.Rpte. 419)979); L)uchein at Liedsay 42A.O.2d 190,345 N.Y.S.2d 531973),alfd Oochein Undoag 34 N Y.2d 690(974); Thoederhh’d Catenng Ce. e City of Chicago, Case No. 835292) Oct.15,19601.
50 Las Vegas City Cede S 6.55.O7OiAii2i.
59 See, e.g., El Paso Coy Code) 12.4b,020iC, 29 teeli; Minneapohs Coy Code 188.490(2) (30 feet), Sao Aotoeio CayCode S 13-b3iaii5i iSO feeti
17 60 Pittshorgh City Code) 719.O5Aldi
not specify any minimum distance a truck must be froman intersection, instead merely requiring that a truck notvend “in a congested area where the operation will impedepedestrian or vehicle traffic.”5° And of those cities that doprovide for a minimum, the required distance ranges from 20to 50 feet.50
Use of Metered Parking Spaces: Most cities in the UnitedStates allow food trucks to pay for and operate from meteredparking spaces for the amount of time listed on the meter.One notable exception to this is Pittsburgh, which says thatfood trucks “shall not park any vehicles for the purpose ofvending, or place any materials in on-street metered parkingspaces.”6° And in New York City, a controversy has eruptedover whether food trucks may vend from metered spots. Thecity’s transportation regulations state that “[nb peddler,vendor, hawker or huckster shall park a vehicle at a meteredparking space for purposes of displaying, selling, storing oroffering merchandise for sale from the vehicle. “ A foodtruck sued, arguing that its food was not “merchandise”for purposes of the law. A New York trial court ruled for thecity in May 2011,62 and that ruling was upheld the followingyear.63
Duration Restrictions: As discussed in Streets of Dreams, 19of the 50 largest U.S. cities mandate how frequently a vendormust move, regardless of whether he or she is vendingfrom a metered space or what the time limit for the space,if any, might be.64 Those laws require vendors to moveonce every 15 minutes to two hours;65 in some instances,vendors who have moved are not allowed to return to theiroriginal location for a specified amount of time.66 Theselaws are counterproductive, and should be scrapped.Forcing vendors to move regularly makes it difficult, if notimpossible, to run a profitable business. Short time limitsalso pose a safety hazard, since it pressures cooking trucksinto moving before their equipment has completely cooled.And by requiring trucks to constantly be on the road, lawslike these make congestion worse, not better.
Potential Sidewalk Congestion: Most cities deal with potentialsidewalk congestion issues as Los Angeles does, by simplyrequiring that food trucks not operate in a manner that blocksor inhibits use of the sidewalk by pedestrians. Fresno, Calif.,for instance, states that “[njo mobile vendor shall block or
61 Ny,’, Yy,5 Coy Depaetmeet of Traespottason Regelations 04-08)6)18).
62 GIan,, CoVes, Food Trocks Shooed Frees Midtown. N.Y 1e,,se,Jeee 28,20(1. hep:i/eveytimes coee2Oltlf29Idioingifsod-twcks-shooedfnom-oidtoosn htesl?_wZ
63 Monroy so C,y,, of Ness Yorh. May 8,2012, httpJycase)aw.hed(aw.ceosley-sopteme-ceott-apge8ate-dioi-s,00it 000535 html
04 Smoos os Dmw,e 23 lJoly 2011)
65 See Col,,mb,,s Coy Code 52151.16(15 n,,n,,sesf; Los Vegas City Code 6.55.070)Al121 30 misetesf; Chicago CoyCode 07-39-I Sf61 itoso ho,,,si
66 See, e.g., Soc,a,eeste City Code 5560.110 )statieg that oeedie sehicle nsa’y not ,et,,,n so original locat,n,, ,,ot,lt),e nest day)
60

obstruct the free movement of pedestrians or vehicles on anysidewalk.”67 Las Vegas, Nev., similarly says that no mobilefood vendor shall “[viend in a congested area where theoperation will impede pedestrian or vehicle traffic.”68 AndPhiladelphia states that food trucks should not increase trafficcongestion or delay, or constitute a hazard to traffic.”69
IASTITUTE FOR JUSTICE RECOmmEnDATIOn:Proximity Restrictions and Restricted Zones: The Institutefor Justice recommends that cities follow the example ofLos Angeles by not prohibiting food trucks from operatingwithin a certain distance of brick-and-mortar restaurants.The first lawsuit the Institute for justice brought as part of itsNational Street Vending Initiative was against El Paso, Texas,which enacted a law that kept food trucks from operatingwithin 1,000 feet of any fixed business that served food.7° Inresponse to the lawsuit, El Paso quickly backed down anddropped its anti-competitive restriction.
The Institute for justice also recommends that citiesfollow the example of Los Angeles by not establishing broadzones where food trucks may not operate. As discussedat the beginning of this report, cities should strive to enactnarrow laws that address the particular problem at hand butgo no further. New York City, for instance, does not have anyblanket prohibitions on where food trucks may go; instead, itproscribes vending only at certain specific times and locationsbased on demonstrable congestion concerns. The Institute forjustice recommends that other cities do the same.
Distance to Intersections: Of the laws dealing with traffic,parking, and congestion issues, the Institute for Justicerecommends that cities follow the example of El Paso, Texas,which states that food trucks “shall be allowed to stop, standor park on any public street or right-of-way, provided thisarea is not within twenty feet of an intersection, such vehicledoes not obstruct a pedestrian crosswalk and the area isnot prohibited to the stopping, standing or parking of suchvehicles.”71 This rule is clear, definite, and easy for food trucksto follow. The Institute for Justice does not recommend thatcities follow Los Angeles’ approach of prohibiting food trucksfrom parking within 100 feet of an intersection. Cities shouldnot regulate more heavily than necessary, and Los Angeles’100-foot restriction is excessive compared to what other citiesprescribe.
67 Fresno City Code 50-1107(h(.
68 Las Vegas COy Cede 655070{A(l21.
60 Philadetpha City Code 0 0-203(7115
70 El Paso Veoding, The lnstit,de ton Jost,ce, hepilew.ijerIel-paso-vendieg.
II El Paso City Code 0 l2.40.O2VCI
Use of Metered Parking Spaces: The Institutefor Justice recommends that cities followthe example of Los Angeles and virtuallyevery other major city by allowing foodtrucks to operate from metered locationsprovided that they pay the requisite feesand follow any time limitations associatedwith the location. Food trucks are miniaturecommerce centers, and letting them pay forand use parking spaces both enriches thecity and helps consumers find the trucksthat they want to patronize. Furthermore,there is no reason to single out food trucksfrom all other commercial vehicles andimpose special burdens on them that therest do not share.
Innovation: Food Truck Parking Passes
Some food trucks will want to use a metered parking spacefor longer than typically permitted. Foodtrucks that sellfried items, for instance, frequentlystruggle with shorter parkingperiods, as they oftenmust take 30 minutes or more to heat up their oilwhile setting up or to cool it down while preparingto move. One way that cities can accommodate thisdesire is to sell special permits to food trucks thatlet them park at metered locations for an extendedperiod of time. These permits may be issued on aperiodic basis, such as monthly or quarterly, or thecity can instead sell one-time passes. To use sucha pass, truck operators would scratch off the current date and place it in their windshield; once ondisplay, the pass would let the truck legally parkat one or multiple spots over the course of the day.The price of these permits or passes could be set ata premium above standard meter rates. This wouldgive more entrepreneurial food trucks more options while generating more revenuefor the city.
18
61

Duration Restrictions: After reviewinglaws that govern how long food trucksmay stay at one location, the Institute forJustice recommends that cities follow theexamples of Philadelphia and New YorkCity. Neither city forces food trucks to moveafter an arbitrary amount of time; instead,they require only that food trucks obeythe parking rules that apply to all vehicles.Although Los Angeles does not impose anyduration restrictions, that is only because acourt held them to be invalid; accordingly,the Institute does not recommend that citiesadopt the language in Los Angeles’ code.
Food trucks responding to an Institutesurvey pointed out that, for cooking trucks,it can often take up to a half hour to get setup and ready to cook and another half hourto close down the kitchen and get back onthe road. As a result, owners universallyexpressed frustration with durationrestrictions, which can make it practicallyimpossible to vend from a modern gourmetfood truck. Trucks also complained aboutthe harm to their business’s reputation whenthey have to turn away customers who havepatiently waited in line. As one Washington,D.C., entrepreneur put it, “Expecting busytrucks to move with 30 people on line is aburden.” For these reasons, the Institutefor Justice recommends that food trucks beallowed to stay at one location for at least aslong as any other vehicle.
Potential Sidewalk Congestion: The Institutefor Justice recommends that cities follow theexample of Los Angeles, which specifies onlythat food trucks not operate in a manner“which will interfere with or obstruct thefree passage of pedestrians or vehicles alongany such street, sidewalk or parkway.”72 Aset rule that requires a minimum sidewalkwidth in some instances can be regulatoryoverkill, such as in areas with little to no
72 See LA. City Code 56,08(c).
pedestrian traffic, and might be insufficient in particularlycrowded areas. Los Angeles’ approach is superior because itgives trucks more flexibility while continuing to protect thepublic right of way. As noted below, the fear that trucks leadto congested sidewalks has little to no evidentiary support.
BOTTOM LINE:Proximity Restrictions and Restricted Zones: Cities shouldfollowthe example of Los Angeles by not prohibiting food trucks fromoperating within a certain distance of brick-and-mortar restaurants or establishing large no-vending areas that are neither narrow nor based on real congestion concerns.
Distance to Intersections: Cities should adopt El Paso Code Section 12.46.020(c), which states that food trucks “shall be allowedto stop, stand or park on any public street or right-of--way, provided this area is not within twenty feet of an intersection, suchvehicle does not obstruct a pedestrian crosswalk and the area isnot prohibited to the stopping, standing or parking of such vehicles.”
Use of Metered Parking Spaces: Cities should follow the exampleof Los Angeles and almost all other cities by letting food trucksoperate from metered locations.
Duration Restrictions: Cities shouldfollow the examples ofPhiladelphia and New York City, neither of which artificially restrictshow long afood truck may stay at one spot.
Potential Sidewalk Congestion: Rather than prescribing the minimum width that a sidewalk must be for mobile vending, citiesshould follow Los Angeles’ approach and simply require that foodtrucks not operate in a manner “which will interfere with or obstruct the free passage of pedestrians or vehicles along any suchstreet, sidewalk or parkway.”
19
62

63

REF U SE
HOW LOS AflGELES REGULATES REFUSE:Los Angeles requires that food trucks‘shall pick up, remove and dispose of
all trash or refuse which consists ofmaterials originally dispensed from thecatering truck, including any packagesor containers, or parts of either, usedwith or for dispensing the victuals.”14So that customers can assist in thiseffort, the city also mandates that foodtrucks provide “a litter receptacle whichis clearly marked with a sign requestingits use by patrons.”76
HOW OTHER CITIES REGULATE REFUSE: Most cities surveyed bythe Institute for Justice require that food trucks clean up trash.In some cities like Seattle, for example, trucks must “maintainthe vending site, merchandise display, and adjoiningand abutting public place free of all refuse of any kindgenerated.”76 Other cities instead require only that vendorstake care of trash that they themselves create. Columbus,Ohio, for instance, makes vendors responsible for keeping thearea within twenty-five (25) feet of their operation free andclear of any litter caused by such operation.77
Like Los Angeles, some jurisdictions require that trucksput out trash receptacles. In Boston, for instance, food trucksmust provide “a waste container for public use that theoperator shall empty at his own expense.”78 And Buffalo, N.Y.,which recently liberalized its vending rules, likewise requiresthat food trucks be “equipped with trash receptacles of asufficient capacity that shall be changed as necessary.”9
73 Due to coosteuction, the sidewalk en the western sole of the Street was sgnlcantly shutter than the eastern side1201 teen compared to 303 teetl To accu,,et for this, times for the eastene side of the steetit haee been rnutt,pliedby .6633 Adj,sted tin,es are shove,,.
74 LA, C,ty Cede 80 331 hI{211E1
75 LA. City Cede 80.73301121181.
76 See Seattle City Cede 4 15.17.t5214i
77 See Columbus City Code 6523 t3lc)lt t)
78 Bustuo City Cede t7-tO.tlailSt
21 79 B,,ftalo Cey Cude 0 3t6-5llll.
64

IflSTITUTE FOR JUSTICE RECOmmEnDATIOn: Of the laws thatdeal with refuse issues, the Institute for justice recommendsthat cities follow Los Angeles’ approach, albeit with additionallanguage that precisely lays out how far from the truckoperators must search for any trash they created.8° Thefollowing is an amalgam of language from Los Angeles andColumbus that cities may use in crafting their laws:
After dispensing victuals, at any location, acatering truck operator, prior to leaving thelocation, shall pick up, remove and dispose ofall trash or refuse within twenty-five feet ofthe catering truck which consists of materialsoriginally dispensed from the catering truck,including any packages or containers, or parts ofeither, used with or for dispensing the victuals.
It is reasonable for cities to make food trucks removeany trash they generate from the immediate area surroundingthe truck, as is the requirement that trucks give customerssome way to discard their refuse. Cities should be careful,however, not to go overboard with these regulations bymandating exactly what type of receptacles trucks must useor how large they have to be.8
BOTTOM LINE:Cities shouldfollow the example ofLos Angeles and require trucksto be responsible for the trash the9 create, but they should alsogive trucks a specific distance they are responsible for, as Columbus, Ohio, does.
LIABILITY IflSURAflCE
IflSURRflCE REQUIREEflTS FOR FOOD TRUCKS Ifi LOS AflOELES:Like all motor vehicles, food trucks in California must carryliability insurance in order to operate on the public rightof way.82 Food trucks operating in Los Angeles need notpurchase any additional liability insurance beyond thatamount.
80 LA. City Code 880 73lbi12)i0i-{Ei.
81 An earlier ,eeisio,, of Bnffalos food-truck law, passed in January2012. required thattrocks carry and put outtwo, 65-ga0nn garbage cons. After compla,nts from tood-tnock operators, who saw the law as unneces
sary and unduly burdensome, rho spottsor of 11,0 hill changed rho Iarrguagn to whar is reflected abnso. AaronOusecker. Eewoodfood truck rules unveilec Ton Burwu Nnzs, an 05 Jan I 2, 2012)
02 See Cal, Vehicle Code 81850.2 (detailing ,ninitnum irability requiremeots that sehicle operators must carry).
83 Boston Crtg Code 8 tl-l0.5(b({li.
84 Las Vegas City Code 6.55.080.
IflSURAflCE REQUIREEflTS FOR FOOD TRUCHSIfl OTHER CITIES: Most of the city lawssurveyed by the Institute for justice, likeLos Angeles, do not impose separate liabilityinsurance requirements on food trucks.Instead, those vehicles may get to work solong as they carry the state-mandated levelof insurance to operate on the road. Somecities, however, also require that truckscarry a general liability insurance policy thatlists the city as an additional insured. InBoston, for instance, a food-truck applicantmust provide a certificate of insuranceproviding general liability insurance listingthe City as additionally insured.”03 And inLas Vegas, food trucks must maintain autoand general liability insurance of at leastS30 0,000.04
IflSTITUTE FOR JUSTICE RECOmmEnDATIOn:After reviewing liability insurancerequirements for food trucks, the Institutefor justice recommends that cities followthe general approach of Los Angeles bynot requiring that food trucks maintaininsurance policies naming the city as anadditional insured. Cities are no more liablefor injuries caused by food trucks thanthey are for injuries caused by brick-and-mortar businesses. Additionally, havingto name the city as an additional insuredcauses additional headaches for food trucks,as the practice is out of the ordinary andsomething many insurance companies arereluctant to do. Unless a city requires thatall food service companies doing businesswithin its boundaries carry a specific levelof liability insurance, it should follow LosAngeles’ approach and not foist additionalrequirements on food trucks that theirbrick-and-mortar counterparts do notshare.
22
65

BOTTOM LINE:Unless a city requires all businesses in itsjurisdiction to carry a specific amount of liabilityinsurance, it should follow the approach of LosAngeles and not impose this requirement on foodtrucks. Cities should not require trucks to carryliability insurance that names the city as anadditional insured.
HOURS OF OPERATIOfl
HOURS OF OPERATIOO Ifl LOS AflOELES: The cityof Los Angeles does not place any artificiallimitations on when vendors may operate,which allows food trucks to specialize.Some trucks like PerKup Coffee and Tea Co.may choose to serve breakfast fare, whileother trucks may decide to cater to late-night customers, just as others serve barpatrons on Friday and Saturday nights. Thiskind of flexibility means that consumers willbe able to get food on their way into work oron their way home after a late night. In theend, letting trucks choose when to operateleads to more successful trucks and moresatisfied customers.
HOURS OF OPERATIOfl Ifl OTHER CITIES: Ofthe SO cities surveyed by the Institute forJustice for this report, approximately halfprohibited food trucks from operatingduring at least part of the day. Someof these restrictions are quite minimal:In Austin, Texas, for instance, mobilefood vendors are only required to ceaseoperations between the hours of 3 am. and6 am.85 And New York City has no blanketrestriction on hours of operation, instead
restricting vending during certain hours only at specifiedlocations.86
Other cities’ restrictions, however, are quite onerous. InPhoenix, food trucks may not operate in the public way after7 p.m. or whenever it gets dark, whichever is later.81 And inSacramento, Cali., the city manager requires vendors to limittheir hours of operation to between 8 am. and 6 p.m.88 Theserestrictions do nothing to further public health and safety, butmake it that much harder for trucks to succeed.
IflSTITUTE FOR JUSTICE RECOmmEnDATIOn: The Institute forjustice recommends that cities follow Los Angeles’ approachand not restrict when food trucks may operate. Trucksshould be free to vend at any time, or at the very least to besubject to the same rules as brick-and-mortar restaurants.To the extent that vending from a specific location at certaintimes poses actual public health and safety concerns, citiesshould address the specific problem and go no further. Oneexample of such a narrow approach is Santa Monica, Calif.There, officials were concerned about the large crowds ofpeople coming out of late-night bars on a stretch of MainStreet. The worry was that the size of the trucks mightcreate visibility problems for passing automobiles and lead toaccidents involving inebriated bar patrons who venture outinto the street. Rather than banning all food trucks in SantaMonica from operating at night, the city took a more focusedapproach by merely saying that on Friday and Saturday nights,trucks could not sell from 1 am. to 3 a.m. on the half-milestretch of Main Street where the bars are located.89 Foodtrucks were able to continue operating on nearby side streetswhere the city’s traffic safety concerns were less.
BOTTOM LINE:Cities should follow Los Angeles’ example and not place restrictions on when food trucks may operate. If a demonstrable healthand safety issue exists at a specific location, cities should take thenarrowest approach that resolves the issue.
85 See Austin City Code H 25-28l2iC54i
86 See Ne,a York C,ty Departnrenr ot Health arrd Mental Hygiene Letter to Mob,Ie Food Vendors 85/06d28t t, aea,labIearhttp/fs.nyc.gouhtmtidolY’dowoioads,’pdl/penmiVrrrN.restnutrd-st.nnrts pdi
87 Phoenie City Code 3t-24.tiCi
88 Secranrento Cit’1 Code 5.88.ttO.
ttgJason bias. Santa Moo,ca Baestare-,’Jigirt Food FLacks on Mo,,, Sn,eec Tt Leoncr N,u. No 88. 2Otti, httpif‘aosw.tonfsaotarnenica coro,ssm sit the iookootoosss!Nen,s-2OblNoue,eher-2ht Itt_tO_it_Santa MonicaBans Late N,qht Food Trucks or, Stain Strertbrtrol
23
66
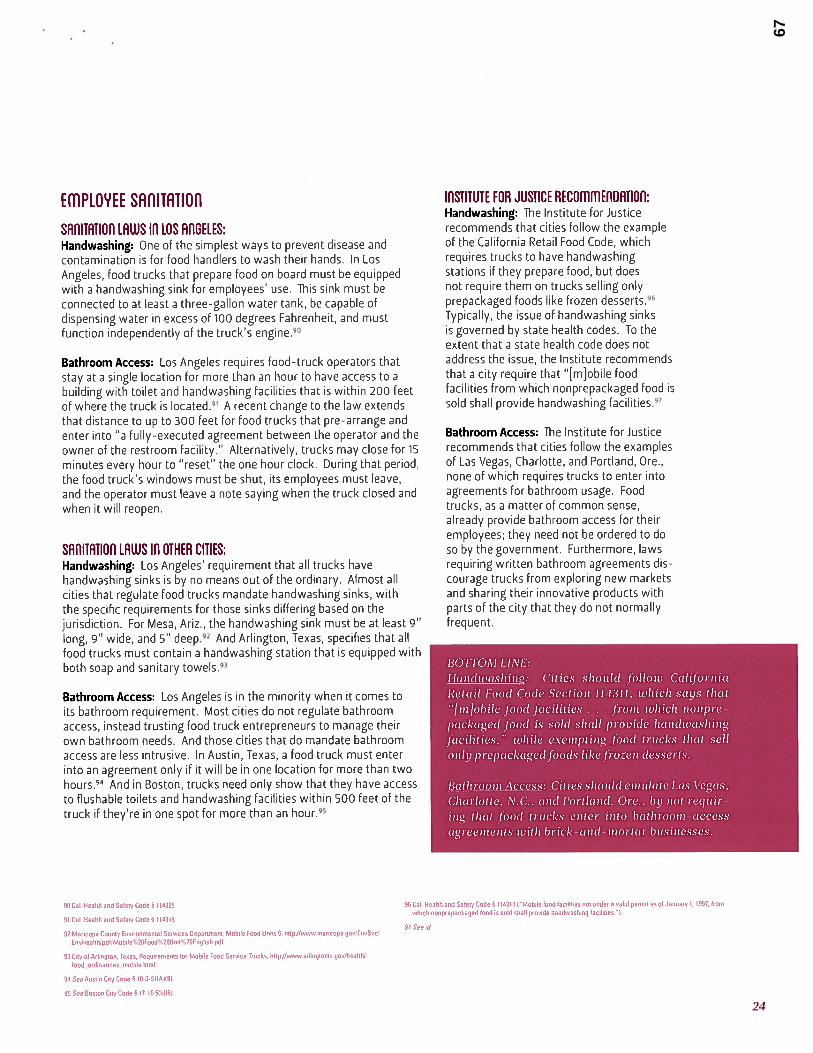
EPLOYfF SAflITRTIOO
SAAITATIOfl LAWS IA LOS AAOELES:Handwashing: One of the simplest ways to prevent disease andcontamination is for food handlers to wash their hands. In LosAngeles, food trucks that prepare food on board must be equippedwith a handwashing sink for employees’ use. This sink must beconnected to at least a three-gallon water tank, be capable ofdispensing water in excess of 100 degrees Fahrenheit, and mustfunction independently of the truck’s engine.90
Bathroom Access: Los Angeles requires food-truck operators thatstay at a single location for more than an hour to have access to abuilding with toilet and handwashing facilities that is within 200 feetof where the truck is located,91 A recent change to the law extendsthat distance to up to 300 feet for food trucks that pre-arrange andenter into a fully-executed agreement between the operator and theowner of the restroom facility.” Alternatively, trucks may close for 15
minutes every hour to “reset” the one hour clock. During that period,the food truck’s windows must be shut, its employees must leave,and the operator must leave a note saying when the truck closed andwhen it will reopen.
SAIIITATIOA LAWS Ill OTHER CITIES:Handwashing: Los Angeles’ requirement that all trucks havehandwashing sinks is by no means out of the ordinary. Almost allcities that regulate food trucks mandate handwashing sinks, withthe specific requirements for those sinks differing based on thejurisdiction. For Mesa, Ariz., the handwashing sink must be at least 9’long, 9” wide, and 5’ deep.92 And Arlington, Texas, specifies that allfood trucks must contain a handwashing station that is equipped withboth soap and sanitary towels,
Bathroom Access: Los Angeles is in the minority when it comes toits bathroom requirement. Most cities do not regulate bathroomaccess, instead trusting food truck entrepreneurs to manage theirown bathroom needs. And those cities that do mandate bathroomaccess are less intrusive. In Austin, Texas, a food truck must enterinto an agreement only if it will be in one location for more than twohours.94 And in Boston, trucks need only show that they have accessto flushable toilets and handwashing facilities within 500 feet of thetruck if they’re in one spot for more than an hour.95
90 Cal. Health and Satety Code 14325
91 Cal. Health and Salety Code 9114315
92 Maricopa Coonly Eovrrono,eotai Seesrces Oepattneeoe, Mnh,le Food Units 6. htnpIfwy’w marcopa qou/EouSuc/E,,vHoah5’pdFMebileC2OFood%2OUicn%2OEoqlish.pdl
93 Cr5y 01 Arhngtoe, Teuas, Requirements to, Mob,le Food Se,oice T,,,cks, hOp1!ntwarIrnqtoota.goW1tealtlloud ordinances mobile.html.
94 See Austin Ce3 Code I I0-39tlAil8l.
955cc Boston CdV Code Ill-IS 5ib16i.
IASTITUTE FOR JUSTICE RECOmmEnDATIOn:Handwashing: The Institute for Justicerecommends that cities follow the exampleof the California Retail Food Code, whichrequires trucks to have handwashingstations if they prepare food, but doesnot require them on trucks selling onlyprepackaged foods like frozen desserts.96Typically, the issue of handwashing sinksis governed by state health codes. To theextent that a state health code does notaddress the issue, the Institute recommendsthat a city require that “[m]obile foodfacilities from which nonprepackaged food issold shall provide handwashing facilities.97
Bathroom Access: The Institute for Justicerecommends that cities follow the examplesof Las Vegas, Charlotte, and Portland, Ore.,none of which requires trucks to enter intoagreements for bathroom usage. Foodtrucks, as a matter of common sense,already provide bathroom access for theiremployees; they need not be ordered to doso by the government. Furthermore, lawsrequiring written bathroom agreements discourage trucks from exploring new marketsand sharing their innovative products withparts of the city that they do not normallyfrequent.
BOYFOM LINE:Handwashing: Cities should follow CaliforniaRetail Food Code Section 114311, which says that“fmjobile food facilities . . from which nonprepackaged food is sold shall provide handwashingfacilities,” while exempting food trucks that sellonly prepackagedfoods like frozen desserts.
BathroomAccess: Cities should emulate Las Vegas,Charlotte, N.C., and Portland, Ore., by not requiring that food trucks enter into bathroom-accessagreements with brick-and-mortar businesses.
96 Cal. Health and Salnty Code 9114311 i’Mubrie lend luc,Idius not coder a ealid permit as 01 January I, 1997, ho,owhich nouprepackaged lood is sold shall prooide handwashing Iacitities.).
97 See id
24
67

commissn REQUIREEflTS
COmmISSARY REQUIREfl1EflTS In LOS AflGELES:Most mobile-food vending operations inLos Angeles are based out of a commissary,which is a facility at which they can parkand clean their truck, store their inventoryand do the paperwork that is associatedwith running any business. The CaliforniaRetail Food Code and Los Angeles Countyrequire that most food trucks be stored andserviced at an approved commissary.98 Theonly exceptions to this requirement are fortrucks that operate from a fixed position atcommunity events, or trucks that engageonly in limited food preparation (in whichcase they may instead be serviced by amobile support unit). With the exceptionsnoted above, food trucks must be cleanedevery operating day and must report tothe commissary at the end of each day’soperations 100
Although Los Angeles food trucksmay clean their vehicles and do theirpaperwork at a shared commissary, theymay not actually do any food preparationthere. The reason is a Los Angeles CountyHealth Department rule that says that onlythe permit holder for a commercial kitchenmay use it to prepare food. Matt Geller,CEO of the Southern California Mobile FoodVendors Association, views that position ascounterproductive and ‘a threat to publichealth because it does not give mobilevendors the option to operate legally ina rented kitchen, This can lead to mobilevendors prepping from home or unlicensedkitchen facilities.” He recommends thatLos Angeles County create regulations thatallow for use of an approved commissary orshared kitchen space.
98 Cai. Health and Safety Code 81 i4295
99 See Cal. Health and Safety Code I l429Slb,ieI.
100 Cal. Health and Safety Codn 881 142954sf, I 14297la4
lOt Or Admin H 351 02-1,1349
02 Id; see also Dragon Health Authority Mob,ie Food Dart Operation Garde, http//pubi,c.heaith.aregoe.gov/HeafdryEnoironnreaodFoodSafet’y/Ooc,,meotsireug,,,de.pdt
03 Flon,da Adn,i,ssrratiue Code 4 61c-4Ol03.
commissn REQUIREEflTS Ill OTHER CITIES: Most othercities require that food trucks generally associate with acommissary, but some cities’ models give trucks moreflexibility than Los Angeles does. Under Portland, Oregon’slaw, for example, a truck need not associate with acommissary if it sells only prepackaged food, in which caseit need only be affiliated with a warehouse.° Alternatively,trucks in Portland “may not be required to have a base ofoperation if the unit contains all the equipment and utensilsnecessary to assure” that the vehicle is clean and can safelystore and prepare food,102 The state of Florida has similarlyproposed regulations that would exempt self-sufficient mobilefood vehicles from having to associate with a commissary.103
Most other cities also let food trucks and otherculinary entrepreneurs use shared kitchen spaces to prepareand cook food. One such city is San Francisco, where LaCocina, a nonprofit “kitchen incubator,” offers low-incomeentrepreneurs shared commercial kitchen space andworkshops with such titles as “How to Start a Food Business inSan Francisco. “4 And in Austin, Texas, another city that letsfood truck operators use shared commercial kitchen spaces, acompany named Capital Kitchens gives Austin food truckers achoice They can use the facility as just a commissary wherethey can clean their truck and store their food, or they canalso register the facility as their base of operations, whichallows them to prepare and cook food there as well.105
IflSTITUTE FOR JUSTICE RECOmmEnDATIOn: The Institute forJustice recommends that cities follow Portland’s example byexempting food trucks from being “required to have a base ofoperation if the unit contains all the equipment and utensilsnecessary to assure” that the truck can satisfy health andsafety concerns. Some food trucks are self-contained mobilekitchens that protect against vermin and can refrigerateand freeze food 24 hours a day. Likewise, a truck sellingonly prepackaged items, like cupcakes, poses no real threatto public safety. Because signing up and working througha commissary can often be arduous, requiring trucks likethese to associate with a commissary is both costly andunnecessary. For trucks that are not self-sufficient, theInstitute recommends that cities follow the example of Los
05 Capdal Kircl,e,,s, Mobile food vender http51capitat-kjtchees.conVn,ob1,e-loud-vnndo, ht,nl
I’ll La Cnc,,,a i,ttp ;,‘,•-,,lacOCinaSfO0’25
68

Angeles County, where trucks can operate out of their owncommissary or a shared commissary.
Cities should also let food trucks band together andopen their own shared kitchen spaces. Los Angeles County’sprohibition against shared kitchens is counterproductive andputs a high roadblock in the way of fledgling entrepreneurs.Instead, the Institute recommends that cities follow theexamples of San Francisco and Austin, Texas, which bothlet food trucks prepare and cook food in shared commercialkitchen spaces.
BOTTOM LINE:Cities should follow Portland, Oregon’s example by saying foodtrucks should not be “required to have a base of operation if theunit contains all the equipment and utensils necessary to assure”to satisfy health and safety concerns.
For trucks that are not self-sufficient, cities should followthe example of Los Angeles County, where trucks can operate outof their own commissary or a shared commissary. Lastly, cities should let food trucks join together and open their own sharedkitchen spaces, as both San Francisco and Austin, Texas, do.
PERITTIflO AflO LICEflSIflG
HOW LOS AflGELES PERITS RflD LICEflSES FOOD TRUCHS:The Application Process: Before a truck gets on the road,it needs to get both a health permit from the county of LosAngeles and a separate business license from the city of LosAngeles. The health permit requires operators to providedetailed plans for the layout of the vehicle.106 It also requiresoperators to fill out written operational guidelines that lay outthe truck’s proposed menu, how it will be prepared, and howthe truck will wash its equipment and utensils.107 Lastly, atleast one person on board the truck must be certified in foodsafety.108
Although Los Angeles’ application process is relativelyless complex than the process in other jurisdictions, it is stilloften hard for would-be food-truck operators to navigateit. This is because, although food trucks in Los Angeles areregulated at the city,109 county,°° and state levels, noneof those jurisdictions clearly explains how to get a vending
06 County of Los Angeles Depa,t,oent of Publ,c Health, Plan Check Guidelines to, Mobile Fend Facilities and Msb,leSupport Unit httpfieu.wu pnhlichealtln Iacnunty.gou/ehfdocsiuip/Pl.ANCHECI(GUIDELINES_l.pdl
07 County of Los Aegelos Depantment of Pubic Heabl,, W,ittee Opeeatienal Procedures. htttybi.poblichealthlacoanly.gov!nlVdecsIutyCalCode WOn 0pLProc2.pdf
08 County of Los Angeles Department of Public Health. Mobile Food Facility Inloro,at,00 Packet Operational Guidei,ees,http/eupufmlichealth.lacountv.govielVdocs;up/RulesaadRegulations_4.pdf
IOU See generallteLA. City Code 8073161
110 See geoeraffpLA. County Code Chapter 804.
ill Cal Health and Safety Code H 11429401004
permit and get out on the road. Althoughthe Southern California Mobile Food VendorsAssociation’2 has helped fill some of thevoid, Los Angeles should clarify what thesefledgling entrepreneurs need to get started.
Cost: The annual fee for a Los AngelesCounty health permit for a food truck rangesfrom $602 to $787, depending on whattypes of items the truck sells.113 The city ofLos Angeles does not charge for a businesslicense.4
Who the Permit Covers: Los Angeles Countyrequires only that the operator of a truckhave a permit. The employees who help outon the truck need not apply and receive theirown vending permit.
Limits on the Number of Permits Issued:Neither the city of Los Angeles nor LosAngeles County limit or in any other wayrestrict the number of food trucks that mayapply for and receive a license or permit.
HOW OTHER CITIES LICEflSE RflD PERflITFOOD TRUCHS:Application Process: Many cities’ actualpermitting procedures are more complexthan Los Angeles’. In Milwaukee, forinstance, opening a food truck meansgetting a peddler’s license that requires thehealth department to inspect the vehicle.But a would-be operator must also applyfor a separate food-dealer license andoccupancy permit for the business.05 Andthat, in turn, requires the operator to applyfor and receive a Wisconsin state seller’spermit.°6 Altogether, an applicant inMilwaukee must get permission from at leastthree separate government agencies, eachrequiring multiple steps, before getting onthe road.
112 hnp-!/socalmfva.cnrn!
113 LA. Cnonty Code H 004720
114 Soutl,n,n Calilo,eia Mobile Food Vendoes Assncietion, FAQ, hopi/socalmtsa.comlfaoj
ItS City of Milwaukee, Food Peddler License Inlormatmon, http-/IcOy.mnifwaokee goulletageLrhrary/GroupslccLice,ses/FoodPoddlerApplication.pdf.
116 Id.
26
69

Boston’s 12w is similarly complicated.The city has a single application form formobile vendors; once an applicant submitsthe Form, the Public Works commissionersubmits it to various city departments fortheir review and approval.”7 But before anapplicant submits their application, he orshe must first obtain a health permit fromthe city Inspectional Services Department, abusiness certificate, a state-issued peddler’slicense and a GPS contract.1t Altogether,a would-be vendor in Boston must goto three different city departments, thecommonwealth of Massachusetts and aprivate GPS company before receiving herlicense. Actually being able to sell from thetruck on either public or private propertyrequires entrepreneurs to take severaladditional steps.1t°
Although Milwaukee’s and Boston’spermitting procedures are much morecomplicated than Los Angeles’, both citiesprovide helpful guidance to applicants. Inmodernizing its food-truck rules, Milwaukeecreated a web document that helps would-be food-truck entrepreneurs understandwhat they need to do to get licensed.20Boston provides similar information on itswebs ite 121
Cost: The licensing fees that food truckspay vary greatly by jurisdiction. In KansasCity, Mo., food trucks have to pay $292annually for a permit. In Boston, the permitfee varies based on a complex valuation ofthe public way used by the truck.122 And inCleveland, the annual fee for a food truck is$26344123
Who the Permit Covers: Lastly, most citiesrequire only that a food truck apply forand receive a single vending permit, withthe truck’s employees working underthat permit. But Washington, D.C., issues
vending permits to individuals, not businesses, and requiresthat someone with a valid permit be on board the truckwhenever it is in operation.’24 If the food truck’s owner cannotbe on board himself, then an employee on the truck musthave his own separate vending permit. This requirementimposes a significant burden on food-truck owners, who facea huge burden if they want someone else to occasionally runthe truck. And Washington, D.C.’s rule limits the opportunitiesfor job creation that mobile food vending can offer.
Limits on the Number of Permits Issued: Most cities in theUnited States do not impose a limit on how many food trucksmay apply for and receive a permit. One exception is NewOrleans, which states that “the number of [food-truck]permits issued . . . shall at no time exceed 100 for the entirecity.”20 New York City limits the number of permits availableto food vendors, including food trucks, to 3,100.126 Althoughit sounds like a large number, this number of permits isinsufficient and has led to the growth of an illegal blackmarket in vending permits. The price on the black marketto use someone’s food vending permit for two years hasreached as high as $20,000 according to a Wall Street Journalinvestigative article.127
IflSTITUTE FOR JUSTICE RECOmmEnDATIOn:Application Process: The Institute recommends followingLos Angeles County’s approach to permitting, which is lesscomplex than the process in other jurisdictions. Most truckoperators in other parts of the country report having to dealwith two or more different agencies to get their permits,and having it take weeks, if not months, to complete theprocess. This complexity compounds the confusion that oftensurrounds the permitting process. As a food-truck operatorin Philadelphia, which is known to have a complicatedpermitting process, said, “The government operates in silos,no agency is coordinated, no one person can give a succinctoverview of the entire process, it seems like no one trulyunderstands it comprehensively.” Requiring multiple permitsfrom many different government agencies makes it both morecomplicated and more expensive to get a truck on the road.
In terms of clarity, however, the Institute applaudsMilwaukee and Boston for clearly explaining how to apply for apermit, and the Institute recommends that other cities publishsimilar step-by-step instruction guides. Operators across the
17 Boston C,ty CodeS 7-105
ItO City of Boston, Food T,ock Pe,rot Apphcation 2012, ht1p/www cgyoflsoston gou/tmaqes_Documems/2612%20Food%2bT,,,ck’2OPerto420Aoplication-4-12Icn,3-2564l pdf
lb City of Boston. Mohile Food Trt,ck: Choosing a Lncat,on For You, Food T,uck, hnp3icnyofhoston goofhos,nessimot.ilni’.ocahsns.asp
120 See Poshcans, Fopco,o T,ocks and Restau,ants a,, 5Vf,ools A Gu,de to, Operatots of Mob,Ie Food Establishnents trot, the City of MiIs’ua,,koo Houhh Department. hnp’c,tymilwaukee.qus,I,nageLibarv/GroupsuhealthAuehorsICEHjPDFsIc,shcaets.bookIet_for_web_2OiO.pdf
121 See Cityol Boston. f,lobilo Food Truck. Permit Overview, http-ffwww.cityolbostongoufbosinessinrob,le/applicatinn.asp27
122 Boston City Code 017-10 ‘O’bi
123 Cleveland City ode0 23105,71
1240 C. Department of Consumer and Regulatory AOai,s. Mnh,le Food Teocfu Lcensiog lnfonnat,on. http2ld.c.goo/Dc,DCRA’forobnsiness.’apptyuOoroanbusioossl,oensojhewrtoesta,n.ann,obiIeofondeltockvhos,ness. statingthat food-truck l,conses “are issued to indiuid,,als not businesses and the truck must be operated by theindividual who is soned the ticense”l.
125 Nest Orleans City Codo ft 10-191161.
126 New York City Code S l7-OO7fbO2liai to ibii3i1ai
07 Sumathi ifeddy, Prices for Food-Cart Perm,tsSkp’ockot.Weuu Store’ J”5’ Match 9.2011. hnp3!oetine wsyruu,iurtirtuicRttmotdyauR2laRlOalh05070lCteehyyluoffhleuR html
70

country repeatedly complain that the most frustrating aspectof the permitting process is not the specific requirementsinvolved, but the lack of clear, consistent instructions on howto complete them. According to food-truck entrepreneurswith whom the Institute spoke, officials often don’t seemto know all the rules, are unhelpful or give conflictinginform at ion.
Cost: The Institute, after reviewing the cost of applying forvending permits across the country, recommends that citiesshould impose a flat annual fee in the range of $200-300,as both Cleveland and Kansas City have done. Businessesshould not be viewed as a cash cow, and the Institute forJustice recommends that fees be no higher than necessary tocover the cost of inspecting and regulating the food trucks.Furthermore, those fees should be relatively stable and knownto would-be truck operators before they enter the business.For this reason, the Institute for Justice recommends thatcities not adopt Boston’s convoluted fee structure.
Who the License Covers: The Institute for Justice recommendsthat cities follow the example of Los Angeles County by lettingoperators decide whether to have a license or permit issued tothem personally or to their vending business. Cleveland, forinstance, issues food-truck licenses to “vendors,” which canbe either an individual or the associated business.128 Brick-and-mortar restaurants need not get a separate license foreach shift manager; similarly, taking this simple step will lettrucks avoid the time and expense of acquiring a vendingpermit for each manager who oversees truck operations.
Limits on the Number of Permits Issued: The Institute forJustice recommends that cities follow the example of LosAngeles and not limit the number of food-truck permits.Placing an arbitrary limit on how many licenses may beissued does not address any actual health and safety issues.Instead, it acts as a barrier to new food trucks while enrichingthose few who are lucky enough to have snared a permit.Furthermore, a limit hurts consumers by limiting their choices.Lastly, a cap is unnecessary, as consumer demand will guidehow many food trucks will voluntarily choose to operate in agiven city.
28 Cleveland C,ty Code 241.0313,
BOTTOM LINE:Application Process: Cities should follow the licensing approach of Los Angeles County, whichisnot plagued by ennecessary complexity. In termsof guidance, cities should emulate Boston and Milwaukee, which both have published step-by-stepinstructions to guide entrepreneurs through the licensing process.
Cisi: Cities should follow the approach of bothCleveland, and Kansas City, Mo., by imposing aflatannualfee in the range of $200-300.
Who the License Covers: Cities should follow theapproach of Los Angeles by issuing vending licenses to an individual’s vending businesses ratherthan the individual himself or herself.
Limits on the Number of Permits Issued: Citiesshould follow the approach of Los Angeles and notcap the number offood-truck permits, which hurtsconsumers and leads to an illicit black market forpermits, as it has in New York City.
Innovation: Reciprocal LicensingArrangements
One major hurdle for food-truck entrepreneurs ishaving to get a separate license for each town inwhich they want to operate their trucks. This re-quirement makes little sense, particularly giventhat inspectors in many states verify food trucks’safety using a common set of criteria that are de—veloped at the state level. Cities should considerentering into reciprocal licensing arrangementswith nearby communities. A compact or jointagreement between different cities would meanthat a truck would need to get licensed only once;it then could operate in any city that was a party tothat joint agreement. This approach would cut avast amount of red tape and make the trucks morecommercially viable while still ensuring that thetrucks met each city’s legitimate health and safetyconcerns.
28
71

conclusion
A vibrant food-truck industry benefits everyone. It provides consumers with a wide variety of innovative,inexpensive cuisine that they might otherwise not get to enjoy. It gives would-be entrepreneurs who are long onideas but short on financial capital a way to pursue their dream. And it can activate underused spaces, bring newlife to communities and make them safer, more enjoyable places to live.
Public-minded officials who want to make their cities better would do well to encourage food-truckentrepreneurship. Thankfully, this commitment doesn’t require paying for an expensive new program or hiringdozens of vending “experts.” Instead, cities can look to other cities that have experience regulating food trucks,such as Los Angeles, and then adopt their best legislative practices by implementing the recommendations inthis report. By avoiding protectionist restrictions and enacting clear, narrowly tailored and outcome-based lawsto address legitimate health and safety issues, cities will enable their residents to enjoy all of the economic andcultural benefits of America’s growing food truck revolution.
72

j
‘• k
30
73

OTHER PUBLICATIOflS OF THE IflSTITUTE FOR JUSTICE’SflATIOflAL STREET UEODIflG IflITIATIUE
Street of Dreams: How Cities Can Create Economic Opportunity by Knocking Down ProtectionistBarriers to Street Vending (July 2011)http://www.ij.org/streets-of-dreams- 2
Seven Myths and Realities about Food Trucks: Why the Facts Support Food—Truck Freedom(November 2012)
http://wwwijorg/vendng
IJ UEflDIflG UIDEOS
Chicago Food Trucks Atlanta Vending El Paso Vendingwww, ij.org/ChcagoFoodTruckVideo www.ij.org/freedomflix/category/51/177 www. ij.org/[reedomfOx/categorj/43/177
74

ROBERT FROfflER
Robert Frommer is an attorney with the Institute for Justice, where he litigates indefense of political speech, economic liberty and private property.
Frommer is lead counsel on the Institute for Justice’s lawsuit against the city ofChicago’s anti-competitive food-truck law. He is also lead counsel on a lawsuitchallenging Atlanta’s vending monopoly and is a co-author of Streets of Dreams.Frommer’s views have been published in a number of print and on-line newspapers and journals, including The Wall Street Journal, The Washington Post and thePittsburgh Post-Gazette.
Before joining IJ, Frommer was an attorney with the Washington, D.C., office of Gibson, Dunn & CrutcherLLP. He is a former law clerk to Judge Morris Sheppard Arnold of the U.S. Court of Appeals for the EighthCircuit. Frommer received his law degree magna cum laude from the University of Michigan Law School in2004.
BERT GALL
Bert Gall is a senior attorney at the Institute for Justice, where he litigates economicliberty, free speech, school choice and property rights cases nationwide.
Gall directs IJ’s National Street Vending Initiative, a nationwide effort to vindicatethe right of street vendors to earn an honest living by fighting unconstitutionalvending restrictions in courts of law and the court of public opinion. In addition toserving as co-counsel in IJ’s current challenge to Chicago’s protectionist food-trucklaw, he also served as co-counsel in IJ’s successful challenge to El Paso’s protectionist restrictions on mobile vendors, which resulted in El Paso repealing those restrictions.
Gall received his law degree from Duke University in 1999 and his undergraduate degree from Rice University. Before coming to the Institute, he worked at Helms Mulliss & Wicker in Charlotte, N.C., and clerked forJudge Karen Williams of the U.S. Court of Appeals for the Fourth Circuit.
In 2009, GaIl was recognized by The NatIonal Law Journal as one of its “Rising Stars: Washington’s 40 under 40,” which honored the top 40 lawyers under the age of 40 in the Washington, D.C., area.
A CH flOW LED om E flTS
The authors would like to thank the many food-truck associations whose members and officers provided valuable infor
mation and feedback, including Malt Geller, CEO of the Southern California Mobile rood Vendor’s Association (50CaIMFVA);
Jeffrey Dermer and Kevin Behrendt, counsel for 5oCaIMFVA and partners in law firm Dermer & Behrendt; Executive Director
Che Ruddell-Tabisola and Doug Povich of the Food Truck Assocwtion of Metropolitan Washington; Rachel Billow, President
of the New Orleans Food Truck Coalition; and Rebecca Kelly, President of the Tallahassee Food Truck Association. The au
thors would also like to thank Jon Markman, Akil Alleyne, Jordan Fischetti, Brad King, Eddie Lowe, Katie McLay, Nick Sibilla,
Bryson 5mith and Andrew Ward for their help in compiling and analyzing the data underlying this report.
Designed by Robyn Patterson.
75

.1
1’76

www.rnerkley.senate.gov
U.S. Rep. Kurt SchraderD-Ore., 5th DistrictOregon: 503-588-9100Washington D.C.: 202-225-5711snrw.schrader.house.gov
State Sen. Dick AndersonR-5th districtSalem: 503-986-1705sen.dickanderssngtoregonlegislature.govwww.oregonlegislature.gov/anderson
VIEWPOINT
A tow truck driver was sent to a job on Newport’s Nye Beach back in September 1945, and his day wentdrastically downhill from there, as can be seen in this photo taken by Roger Hart. (Photo courtesy of theLincoln County Historical Society, LCHS #1635, oreyoncoasthistory.org and www.facebook.com/newportlincolncountyhistoricalsociety)
Where’s thenew power?
VIEWS ON THE NEWS — READER FEEDBACK
Last month I wrotewh) logisticall) electriccars aren’t for everyone,and especially for thosetraveling long distances,Please stop telling me Iam destroying the planetif I don’t have one. Here’ssome reasons why they’renot for me.
First, if I need gas, I pullin, fill up in 10 minutes,and am on my sva Nowaiting in line and finallygetting to. the rechargestation for another., 40minutes to charge,
Secondl electricity forelectric cars will not bea stable commodity. Remember the Californiaroiling blackouts duringthe fires? People withelectric cars couldn’t evacuate because their carswouldn’t charge. Even toda California is havinga hard time keeping thepower on. Last month wesaw most of the Portlandarea with no electricitybecause of overuse of airconditioners.
Third, the price is between $55,000 and$125,000 for a new Tesla— very high monthly payments,
Fourth, would I be ableto trade my used electrical car in? Would anyonebuy a used one knowing abattery could go bad, costing a fortune to replace?If people aren’t buyingused ones, then dealerswon’t be taking them in,It costs nearly $16,000 toreplace a Tesla Model 3battery pack.
And fifth, if electricalcars don’t use gasoline,they will not pay the gastax, which pays for roadsand bridges. What then?They’ll start trackingyour travel to tax you. Nothanks, it’s none of thegovernment’s businesswhere I go or how muchI travel.
Put your thinkingcaps back on. Again, BillGates, liberal who knowstechnologr: “Current renewables are dead-endtechnologies. They areunreliable, Battery storage is inadequate. Windand solar depend onthe weather. The cost ofdc-carbonization usingtoday’s technoloD’ is beyond astronomical.” John
Each week, readers are svhich ester to folks on the north A.lbany “The Barn More food trucksasked — via the News- go. . at h’lckoiy Station,” is a please. We should be en
, Times Facebook page — Ttacy Crews brilliant example of ibod couragl’ng the talents of. — to offer their input on truck success, all our amazing chefs.an issue currently in the Fm fbr food trucks, — KC Warren — Jennifer Koppnews. To join that con- competition is a positive.
: versation, log on at wwvc Only issue I see is traf- Lincoln ciry needs This would really addKern’ recently said even if
facebook.com/newport- fic congestion, packing. them, not enough restau- some choices and conic‘ newstitnes. Maybe create food courts, rants to cos’er the tosrist nience to finding a meal.we go to zero C02 emis-
— Meridee Wiley season. Locals can’t even Just cannot have plassions, it wouldn’t do athing if the rest of the The topic: Newport is get in for dinner on the tic utensils, containers,world doesn’t follow, considering amending its I love food trucks for a weekends. Food trucks straws or paper products
Electrical grids in our city code to allow greater quick, eclectic meal, in a are a different experience that will add to the littercountry will not handle operation of food trucks, wide array of great food from a sit-down, elegant problems that plague our
which currently are all options. The theory that restaurant, beaches.the masses having electri- but forbidden in the city, foods trucks create unfair — Tina Torres — Ron Beckcal cars. If we rea11’intendSome people would like competition to brick-and-to adopt electric vehiclesto see more food trucks, mortar restaurants is lu- I don’t see how hai’- Food trucks srould befor all, we have to face car while others believe they dicrous, Every eater)’ has ing food trucks could be a si’elronie addition forlain realities. The average
‘ would represent unfair the option to choose how a problem. More job op- thislocal, especially in thehouse is equipped with competition with Østing they serve their custom- portunities, they’re delish summertime when tour-100 to 200-amp service, brick-aqi”and they would’ need an era. We need diversity and and provide more food ists take over es-erything.food_trucks offer an op- optionsatonespot. The fact that we don’tadditional 76-amp service : ‘ thai’ between a sit-down — Kaylee Kappus allow them already is in-for a Tesla Smaller sys-’
tems are available, but they Questions: Do you ever restaurant and a fast-food sane.patronize food trucks, chain. Cities need to do I svould love for us to — Alesha Davisrequire up to mne hours tO and would you like to see more to create food courts have food trucks. I think arecharge a car. On a small more of them in Newport, for food truck4 where they seay around the issues is for No si’ay Our poor busistreet (approximately 25 or whatever city you live haveapei-inanentplace to them to be ass food truck nesses are dying alreadyhomes), the electrical in
frastructure would in? Do you think allowing operate, instead of being pod which is successful in They can do something atmore food trucks to oper- forced to dance around man)’ Oregon cities, the fairs. Our city is totallyable to carry more than ate is unfair to brick-and- towns, looking for a spot — Cheryl Brown anti business unless theythree houses with a Tesla. mortar businesses that to sell flvm. Good for the line their pockets. We doIfeven halfthe homes have
smaller electric vehicles, have made big invest- conan unity and good for The brick-and-mortar not need food trucks oththe system would be wildly ments in their permanent the economy. establishments are having er than at events here.overloaded, In addition i
buildings and infrastruc- — Kathy Elfers trouble for lots of other — Patrick Henrytore? If so, how would reasons, nothing related Maguirethe grid and infrastructureyou balance the scales? First I think they should to food carts. Why not doovetload, where is the new have to meet all food safe- it for the community and Yes, please. We needpon’er? There is a time/place for tyandpreparations guide- visitors? People haven’t variety family friendlyAs I stated in my last
letter, where are all theboth of them, Ifyou only lines set by the state. I tru- even been able to get into selections. If you thinkget a 30-minute break, ly don’t see them as being lots ofthem latelyanyhow: about it, most peoplecharging stations located the truck is the only way in competition with the Isaw people svho couldn’t svould stay and enjoy theon the highways, as it“to go. Besides, the market brick-and-mortar restau- even get a hot cup of cof- beaches if there ss’ere atake thousands and thou-
: will decide who survives, rants in Neisport because fee in I’lve Beach it was so food truck in ss’alkingsands of them? All high-— Al Rabassa it is a different experience packed up in the morning, distance of our parks. Itway systems will need to
and service, never mind trying to get would actually help drawbe very high amp s’stems. Need more, not enough — Cindy Jones j’ou and your visiting fam- people to stop in ourso charging times will not restaurants. Too many ily or friends fed. town. Foodie people flockbe in hours. Lithium-ionvisitors. Food trucks offer Nev,port needs all the — Judy Sandoval to a good food truck.batteries perform better additional options, help it can get. So man)- Murphy — Adrienne Woodsin warm ss’eather, so in
— Ann Dowdy restaurants have closedcolder winter months it. and have not been ix- I believe we need to Unfair competition? Iwill require more charg- I think there should be placed. I am tired of the open Newport up to food think the food tracks areing. Where is that grid, rules, like can’t be within samethreefastfoodchoic- trucks. It helps new busi- the underdog here. Not toand where is the power? J so much distance of any es in this town and would nesses to get started and mention the brick-and-So, before we continue restaurants and don’t be svelcome the chance to try brings in more variety mortar joints aren’t theto spend tax dollars on anyis’here you might in- nesv foods. Neiiport has been frozen only ones investing montax credits for rich peo- terrupt traffic or slow it — Diane Relaford for too long. ey to operate. Running apie to buy electric cars, down. Otherwise it ‘s great — Sharon Jensen food truck isn’t free, it’smaybe sic should start for people that are on a Yes, I much prefer food a lot of blood, svi’eat, andbuilding nuclear power lunch break, trucks, especially when Yes, sve need a few food mostly tears at present.plants across the country
— Kristin Savage more than one can gather trucks in our area Today Any business that helps aso we can power all thetogether. So nice that a trying to get mi take-out famil,t- survii-e right nowcharging stations, Even
. Personally I love the couple or family can all lunch in Ns’e Beach was a is good business. What weif we built nuclear power idea offood trucks, I think getthefoodoftheirchoice nightmare. I cosldn’t find don’t need is more taxes.plants, and it would take with our current tourist and still eat together at a dang spot anysi’here — Cyril Brunelmany to provide enough level, we can support both, community tables, They nearby so I parked sever-electricity, we still have— Dawn Osburn has’e “food truck sites” in a] blocks asia): I normally During the summer itthe problems of building.
Salem and it’s really cool, wouldn’t mind the svalk, would be great. Restaua completely new power Choices can only be Also great to everyone get but on lunch breaks, we rants are not able to keepgrid for both home charging stations and acres and positive for businesses and their meal and go sit on a don’t have the extra time with many visitors, and
‘ for consumers, As with beach, to deal with the tour- the wait is 45 minutes toacres of highss’ait very everything latels this sub- — Kimberly Regina ist traffic at our favorite an hour or more to eat. Sohigh-amp charging sta- ject will have to be kicked places. The few drive- ies, in the food trucks. Iftions, plus a huge disposalissue for dead batteries, around, probably for a I personally think that thrus are alss’ays packed, you’re worried about your
long time, before deci- first chance to operate a too. There’s room for food restaurant losing busiAgain, logistically it sions can be oiade. Mean- food truck should be of- trucks — we all eat. ness to the food trucks,won’t work. svhile, a food truck court fered to, and owned and — Gretchen Lord-Jelie ins.ybe it’s the food and at-called The Pines, is under operated by restaurants znosphcre that iou shouldBob Folkers is a resi construction in the Thft that have a brick and TV’s are getting them reu’ish,dent ofSiletz. sector ofLincoln City mortar in town, here in Lincoln Citu I’m — Oma Challburg
— Cathi Pierce — Deanna Quan excited because think ofall the times you can’t get Editor’s note: due to
Food trucks are a great Yes on food trucks. Es- into a restaurant during space constraints, weidea They are svorking pecially us’hen the weather tourist season, don’t guarantee all ‘Viewssi’ell for V aldport and Va- is nice and the pandemic — JA Sparks on the News” commentschats and serve a different lingers, ivhat could be received via our Face-clientele. I would certainly better than ordering a It will not affect brick- book page will be printedrather see family-owned nice meal and eating it and-mortar businesses, in this space, and somefood trucks than chain fast outside with friends? Vt’e need food trscks. comments may be editedfood restaurants, both of The food truck pod in — Shelly King for length.
i;ii ‘AiT1i ‘.k1iNiws TIMFs
—I -
77

1
Sherri Marineau
From: Janet Webster Sent: Sunday, July 25, 2021 11:11 AMTo: Public commentCc: Derrick TokosSubject: July 25 Planning Commission Work Session & Continued Public Hearing
[WARNING] This message comes from an external organization. Be careful of embedded links. ________________________________ July 25, 2021 Dear Planning Commission and Mr. Tokos, I have reviewed the proposed ordinance amendments along with Mr. Tokos’s comments. I have two issues for consideration. All pertain to Section 14. 1. I oppose Policy Option B that prohibits food trucks within 500 feet of an elementary or secondary school. Before making a decision on this prohibition, I suggest that the Planning Commission get clarity on the eligibility requirements for the free and reduced lunch program. I think eligibility depends on the number of students signed up to receive free and reduced meals, not on the number of meals served. Several members of the public have offered examples of the utility of access to food trucks in supplying students with nutritious food that they enjoy. 2. A suggested amendment excludes food trucks from private property if within the Bayfront and Nye Beach Parking Districts. I suggest that Policy Option D1 is workable. This would allow a business to place a food cart on its property as Local Ocean Seafoods is currently doing. Given the past year, restaurants that have the space have expanded outdoor dining. Placement of a food truck or cart could improve the service. I imagine that this would probably be a seasonal effort. Sincerely, Janet Webster Newport, OR 97365
78

Macpherson, Gintner & DiazLAWYERS
423 North Coast HighwayP.O. Box 1270
Newport, Oregon 97365(541) 265-8881
FAX (541) 265-3571email: [email protected]
thJuly 24m, 2021
Mr. Derrick Tokos, DirectorCity of NewportCommunity Development Department169 SW Coast HighwayNewport, OR 97365
Re: Draft Code Amendments Relating to Food Carts
Dear Mr. Tokos:
This office represents Lincoln County School District ("School Dista-ict"). As discussedin the last meeting, the School District is opposed to the proposed changes to the NewportMunicipal Code ("NMC"), Specifically, the School District opposes any changes which wouldallow food tmcks, carts, or pods within 500 feet of secondary schools, regardless of if they are onpublic or private property, during and immediately before and after school hours. This letterserves two purposes: to inform you of our concerns and to save grounds for appeal if thePlanning Commission chooses to proceed with the current prospective language. The last lettersubmitted by the LCSD is hereby incorporated by reference.
I. WTRODUCTION
At the Planning Commission meeting on July 12th, 2021, some Commissioners asked foradditional infonnation before deciding how to proceed on this proposed change. ThoseCommissioners requested, specifically, more information on the participation-based lunchprogram, proof that school lunches are healthier than the food served by food carts, the currentstmggles the high school is having with tmancy, and the long-term effects this ordinance wouldhave on our city. It is the School District's hope that, with this information in hand, the PlanningCommission can do what is right for the entire community and not allow food trucks to operatedirectly across from the high school.
Before discussing the specifics, it is useful to understand the scope of this issue. Based onthe letters received by and the testimony presented to the Planning Commission, there iscurrently only one property owner in Newport who is encouraging the elimination of the 500-foot requirement, Janet Webster. At that meeting, we heard from two people who want to start upfood carts, and neither of them stated an interest to operate near the schools. There have been noother parties interested in reducing the 500-foot requirement that we are aware of.
79

Mrs. Webster's interest in using her property, located directly across from the high school, tomake money is understandable. To be clear, the School District is in no way attempting to insultor demonize Mrs. Webster. We understand her desire to profit off her currently unused land. Wealso understand that, as we did not submit our letter to the Planning Commission until after shehad submitted hers, she may be unaware of why this decision would harm the community. TheSchool Disteict simply believes that the dangers to the children, as well as the disadvantages tothe entire community outweigh her monetary interests in operating food carts beyond the timeshe is ciurently allowed. The community interests Mrs. Webster presents are discussed in a latersection of this letter and are unconvincing. After reading this letter and understanding thedangers presented to students, the Planning Commission will see that limited economic benefitscannot outweigh the health and welfare of our children and community at large.
This letter will argue a few points. First, it will define the scope of the issue by pointing outthat food carts can, under the new scheme, already sell breakfast and dinner every day of the yearwithin 500 feet of schools, reiterating that removing the word "secondary" from the NMC wouldonly allow them to open for lunch. It will then discuss the state of the proposed law and howmonitoring what food tmcks sell near the high school would be impossible. Second, it willprovide more information on the current USDA free school lunch program. Third, it willdemonsb-ate that food served by food ti^icks is dramatically less healthy than the USDAstandards Newport High School adheres to. Finally, this letter will discuss the specific dangersthat allowing for a food pod directly across the street from the high school will cause or add to,including mental health issues, tmancy, and safety concerns.
II. UNDERSTANDING THE ISSUES
1. Food Carts Can Alread 0 erate Near Schools Eve Da of the Year'Let's address the proponent of the change first. If the ordinance is changed in every respect
except allowing food carts next to schools, what does that mean for Mrs. Webster or the otherproperty owners within 500 feet of the high school? It means that they can still operate a foodpod on their property every day of the year.
The 500-foot requirement is only for certain times on school days. Essentially, it preventsfood carts from being open during lunch. The 500-foot requirement has aged gracefully as therisks associated with having food carts next to schools have only increased over time. Food cartscan still operate within 500 feet of schools on weekends, half an hour after school, more thanhalf an hour before school, on most holidays, and for the entire summer vacation. When we lookat the Disbict Wide School Calendar, we see that there are 186 non-school days per year wherecarts will have free reign. (Ex. 1.) Of the 178 school days, food carts are only unable to operatearound school hours. The School District is not attempting to deprive landowners of their abilityto profit off their land. Rather, we are asking the question, "Is allowing food carts to open forlunch directly across fi-om the high school, for the benefit of so few, worth the potential harm?"
Keep in mind that the expanding of the food cart ordinance will generally allow forunprecedented food cart growth throughout the entire city. There are no operators or staff whowill be harmed by the 500-foot restiiction - they will have the whole city to choose where to setup shop and can migrate to the high school for dinner. This is not an all or nothing situation. Theother NMC changes drastically reduce the importance of being able to operate directly next tothe secondary school. A food cart owner may argue that operating somewhere like the NyeBeach turnaround would be important because of the tourist traffic there, but that argument does
80

not apply to the high school. In fact, it seems the only reason for operating next to the highschool is to target a captive audience of students and staff. Mrs. Webster acknowledges this asher intention in her July 11 letter. However, because there are far more students thm teachers,608 students compared to 70 staff members, any food carts operating next to the high schoolwould be primarily targeting high school children. Knowing this, these food carts will likelystock what sells best to children and what they cannot get in school, unhealthy food and drinks.This economic probability has serious consequences, which are addressed in detail in latersections.
Finally, let's discuss the benefits of not changing the ordinance. Students would benefitbecause they are able to continue to receive free, healthy meals all year round. The current mealsite program allows for the School District to serve meals all year round to those children whoneed them most. Even in the summer months, students receive free meals, as documented in theschedule included as Exhibit 3. That could cease being the case if the lunch program is ended.For the meals served on school days, students benefit by being able to focus better, by attendingclasses more frequently, and by being safe from the dangers associated with this change (obesity,traffic, strangers, etc. ) The teachers and staff will benefit because they will not have funding cutdue to the end oftheUSDA program. More importantly, being healthier leads to children havinghappier, more fulfilling lives. It is difficult to imagine what the phrase "general welfare" couldmean if it does not include promoting happy, healthy lives for members of our community.
2. The State of the Law and Practical ConcernsFirst and foremost, the Commission should understand the mission of the School District and
all the good it entails. The School District's mission is to provide safe, healthy, enrichingenvironments where our children can learn and grow. However, it takes a village (or in this case,a town) to raise a child. The School District shares the view of the American DieteticAssociation, which is now called the Academy of Nutrition and Dietetics, in arguing "schoolsand the community have a shared responsibility to provide all shidents with access to high-quality foods and school-based nutrition services as an integral part of the total educationprogram. " (Ex. 6. ) Frankly, the School District needs the help of the entire community. Thatincludes neighbors, the Planning Commission, and the City Council. We are thankful for thePlanning Commission providing us with the opportunity to further comment on this proposedchange and hope that all community members understand they are needed to create a city thatcares about its future.
We should also strive to understand the state of the law. For this, we must assume that therest of the ordinance will pass as it is now. If the ordinance does not pass, there can be no foodtmcks so there will be none within 500 feet of a school, and this letter would be moot.
Additionally, the map demonstrating the area impacted by the 500-foot requirement issomewhat misleading. Attached is Exhibit 2, which shows the map provided by the PlamiingCommission at the July 12 meeting and a map of the entire city of Newport, both with theimpacted area shaded in. After examining the maps, it is easy to realize that this change impactsjust a minor fraction of our town.
When addressing the law, we must also address the enforcement mechanisms available. Onemight argue that we should simply monitor and restrict what food carts next to schools sell, butthis is not possible. At the last meeting, one of the largest anti-cart arguments was that there is noway to enforce regulations relating to garbage or other violations. This argument captures theessence of a larger issue - the police budget in Newport is limited and must be prioritized
81

beginning with the most important matters. This means that, if the Coinmission or Council wereto try and implement standards for what foods could be served near the high school, they wouldlikely be unenforceable in practice. Further, the American Heart Association argues that "At aminimum, healthy mobile vending around schools should meet nutrition standards that are in linewith the Instihite of Medicine's standards for competitive foods. " (Ex. 4. ). This is all well andgood in the major cities the American Heart Association analyzed, like Los Angeles and Seattle,but it provides an impossible barrier for a town like ours which lacks the resources to rely onenforcement mechanisms.
To the School District, it is clear that, as the American Heart Association states, "Mobilevendors who sell food in close proximity to schools or on the actual campus have the potential togreatly affect the nutritional intake of elementary and secondary school children. " (Ex. 4. ) TheAmerican Heart Association, in their document "Mobile Vending Near Schools PolicyStatement" state the same problems which our high school would stmggle with. Problems likesafety, school lunch programs, equity issues, and issues with school resources are all specificallyaddressed. (Ex. 4. ) The problems our schools would be facing are not new or novel. Major citiesand small towns alike face the same problems; the only difference is that major cities either usetheir resources to enforce nutrition standards or tend to push food carts further from schoolsduring school hours. Because the first option is impossible, Newport should choose the second.
III. USDA LUNCH PROGRAM
Currently, all schools in Newport offer free breakfasts and lunches to all students. Thisprogram is made possible by the participation of the students in the entire school district, not justone specific school. This program, and the ability of the School District to provide free,nutritious meals to students could be harmed by the proposed changes to the NMC.
A. USDA Nutrition Standards
Newport High School is required, by the US Department of Agriculture, to meet certainnutritional standards. These standards are broken down in Exhibit 9. Exhibit 9 describes themeals in terms of their ingredients, calories, micronutrients, and macronutrients. These aredifficult to directly weigh against a prospective food pod for numerous reasons. However, theUSDA has certified that the school meals referenced in this document are healthier than the foodserved by food carts. "A USDA report to Congress concluded that competitive foods (such asfood ti^icks) have lower nutritional quality than school meals and that these foods may contributeto overconsumption of food energy, dietary fat, saturated fat, added sugars, and sodium andunder consumption of calcium, fiber, finits and vegetables, and whole grains. " (Ex. 6.)
B. Fundin andPartici ation
To answer the Commission's questions regarding participation, a staff member at the LincolnCounty School distiict drafted a letter. This letter, included as Exhibit 8, proves that a decrease inparticipation would not only hurt the high school, but would hurt the entire school system. Dueto the interconnected nature of the USDA program, and the problems with participation andtruancy described below, any decrease in participation would negatively impact the program. Iurge all Commissioners to read Exhibit 8 thoroughly.
82

IV. EVALUATING FOOD CART NUTRITION
In general, there is a consensus that food carts are unhealthy. There is also a consensusthat school food is healthy, thanks largely to the efforts ofMichelle Obama's Healthy, Hunger-Free Kids Act. The specific standards imposed by this program are described in Exhibit 11.While the UDSA has already certified that school meals are healthier than food tmcks, it is alsouseful to consider the intuitive nature of this idea. Food carts are, in general, much less healthythan USDA monitored school lunches. It just makes sense. Food carts aim to provide quick,delicious meals. Unfortunately, the taste and convenience come at the cost of nutritional value.We encourage the Commissioners to use their personal dining experience when considering thenutritional value provided by food carts.
We understand that one blanket statement from the USDA may not be enough to convinceeveryone on the Planning Commission. One of the best sources for providing detailedinformation regarding food trucks and the health issues associated with them is the paper"Preventing Childhood Obesity: Health in the Balance. " This 434-page document, included asExhibit 7, describes, in detail, the groups needed to prevent obesity in children, how obesity isimpacted by poor nutrition, and how a lack of school food leads to a lack of knowledge whichcan cause obesity and all the problems associated with it. It was created and supported by thefollowing organizations: the Centers for Disease Control Prevention (CDC), Institute ofMedicine (IOM), Department of Health and Human Services' Office of Disease Prevention andHealth Promotion (ODPHP), National Institute of Diabetes and Digestive and Kidney Diseases(NIDDK), National Heart, Lung, and Blood Institute (NHLBI), National Institute of Child Healthand Human Development (NICHD), Division of Nutrition Research Coordination of the NationalInstitutes of Health, and The Robert Wood Johnson Foundation (RWJF). The reason for creatingthis report was the "Call to Action to Prevent and Decrease Overweight and Obesity" issued bythe US Surgeon General. The primary goal of this plan is prevention of obesity in children.
This report does not exclusively focus on food carts. Instead, it takes a multidisciplineapproach to evaluating the behavioral, cultural, environmental, and social factors which causeobesity. Certainly, food carts fall under that umbrella. It is important to remember that health isnot a single faceted problem, you cannot prevent obesity by just telling kids to eat better. "Thecommittee... developed its recommendations to encompass the roles and responsibilities ofnumerous stakeholders and many sectors of society. " (Ex 7. ) Rather, it is a combination of manyfactors and environments, which is why the School District needs the support of the city. Thisagain mirrors the position of the American Heart Association's assertion that all communitystakeholders share the responsibility of ensuring local children grow up healthy.
While it is impractical to break down the entire document in this letter, I have provided it sothat Planning Commissioners will have all the data they need to make the right decision. Thereare a few sections in this study I would like to address specifically, which demonstrate that "thevalue we attach to our children is fundamentally connected to society's responsibility to providefor their growth. " (Ex. 7). In Section 6 "Local Communities" the study reiterates the view of theAcademy of Nutrition and Dietetics in saying that both private and public resources, such as thelocal government, are responsible for fighting the obesity epidemic ravaging America's youth.The sections "Social and Emotional Health" and "Physical Health" repeat the concerns containedin this letter while specifically calling obesity an epidemic on short- and long-tenn time frames.There are short term effects to poor nutiition, such as lack of focus and decreased cognitive
83

ability, but the long-term effects are widespread and much more dangerous. The study, whenread in the context of food carts against regulated USDA lunches, makes it clear that the SchoolDistrict's position is the correct one.
Based on the attached studies and intuitive logic, we can conclude that food carts are onefactor which tend to increase obesity. How does childhood obesity impact the general welfare ofNewport? Children who suffer from obesity "are more likely to be chronically ill, to have anegative impact on their earning potential, and to even die prematurely. " (Ex. 7) Further, "Themetabolic and psychologic dangers of childhood obesity track into adult life and eventuallyenhance the risks of disease, disability, and death. " (Ex. 7) This problem is country wide as dietand physical inactivity are predicted to become the number one cause of death in America.Rather than allow for just one more factor contributing to lifelong obesity, the Commissionshould take the advice of the American Heart Association, the Academy of Nutrition andDietetics, and essentially every other government and medical association's position on this topicby preventing food tmcks from targeting our children.
V. THE GENERAL WELFARE AND RESPONDING TO ARGUMENTS
In providing the Plamiing Commission with more information, we would be remiss if we didnot address the specific points raised by Mrs. Webster, especially those that relate to the generalwelfare. In her July 1 1th letter, Mrs. Webster seems to contend that the general welfare would beincreased in a few ways: by allowing for more food carts in general, by offering a place to eat forthose who "do not relish driving or walking on Hwy 101", and by providing nutritious food. Asthe point regarding nutritious food has already been discussed in detail, there is no need toreiterate it here. However, the first and second points deserve some attention, especially becausethese points will be tme regardless of if the 500-foot limit is removed.
There will be more food carts, even on the east side of Highway 101, regardless of thechange to the 500-foot buffer zone. Simply because there is a piece of land which, pre-ordinancechange, is interested in offering itself to a pod does not mean that there are no other propertyowners who are outside the 500-foot zone who would do the same. The absence of evidence isnot the evidence of absence, especially at this stage of the process. If there is a demand for foodcarts in areas east of Highway 101, that demand will be filled through the free market incompliance with the NMC. Unless food carts can directly target children, Mrs. Webster'sproperty is irrelevant to the natire of supply and demand economics which motivate food cartoperators. If the NMC is changed, food cart operators will evaluate the best place to do business.With that in mind, is the Planning Commission willing to risk the dangers to our children andcommunity at large for such a minimal benefit?
In her letter, Mrs. Webster states that the primary audience for this food cart pod on herproperty would be the staff of the high school. Perhaps Mrs. Webster truly intends for staff to bethe primary patrons of this pod, but that belief is incongruent with the facts. The high school has70 staff members, and 608 children. For every 1 staff member, there are 8.6 children. When welook at the numbers, we see who the real audience of this food cart pod would be. If the pod ismore than 500 feet away from the high school, the staff would still have easy access, relative tothe other dining options in the area. Placing it right across the street does not provide realbenefits to anyone except Mrs. Webster. Again, we are in no way trying to insult or demonizeMrs. Webster. We simply do not believe the balancing test weighs in her favor.
84

Let's move on to another point raised in the same July 11 letter. She contends that "Aclosed campus is the prerogative of the School District and its responsibility. The existence of afood truck would not interfere with this policy. " The School District is currently considering aclosed campus for 9th and 10th graders, but this change would not be so until the 2022-2023school year at the earliest. Food carts so close to school would present one more reason for thesestudents to become truant and skip school. Oddly, in the very next sentence, she states that foodcarts "provide an inviting atmosphere for their clients. " We agree with her on that point. PerhapsMrs. Webster did not know that the school is already struggling to deal with truancy and does nothave the resources available to combat the increase which a nearby pod would provide. Ourquestion is, why would the city offer students another incentive to skip school?
VI. TRUANCY AND MENTAL HEALTH
1. Truanc isAlread a Serious Problem
Currently, there are serious problems with truancy at Newport High School. While tmancy isspecifically defined in the Oregon Administrative Rules, this letter defines it in a broader sense.Truancy is not simply a student missing "more than eight unexcused one-halfday absences, orthe equivalent thereof, in any four-week period in which school is in session" as the OARs state.Our problems go beyond this definition. Our problems include students who are showing up lateto class or skipping classes entirely, as well as the long-term effects that missing class has onstudent achievement.
When a child is truant, it prevents them from being able to learn. This is tine in the short- andlong-term. Educating children is a primary goal of the School District, so this is very troubling.Obviously if a child skips a class, they will not learn as much as the children who attended. Whatchildren learn is built on the foundations set by previous classes and grade levels. If a student
-doesn't learn to add, they cannot learn how to multiply. Because of this, having a student miss anextended amount of school time is seriously detrimental to not just what they are learning now,but what they will not be able to learn later. This is just one more example of how this decisionwill have implications for years to come.
One may think that if truancy is already a problem, changing the ordinance would only be adrop in the bucket. This thinking is backwards and dangerous. It ignores the harm currentlyfacing children and presents an excuse for those with power to ignore their responsibility. Atruant child will never come to a Planning Commission meeting to explain their story. Rather, itis up to the School District to educate both the children and the local government about thereality of the situation. Instead of adding to the harm, we should all be focused on reducing itfrom every angle possible. The School District is taking new measures to combat truancy,especially truancy related to food options, by investing roughly $150,000.00 into their cafeteria.A few photos demonstrating what the cafeteria used to look like and the current constructionprogress are included in Exhibit 10. By making it a more inviting place to eat and hang out, theSchool District hopes to curb the already rampant truancy in the high school. The project is stillongoing, but improvements can be seen in Exhibit 9.
We know that having a place to eat close to school causes tmancy. In the school year of2018-2019, when the Cub Cave was open, the tmancy rate was significantly higher than the nextyear. Obviously, there are other factors at play, such as CO VID-19 which explain why truancydropped, but again, the idea of having access to an attractive place just across the street causing
85

children to be tmantjust makes sense. Having a fun place kids can go to means that kids will gothere, regardless of what it means for their academic success.
The problems regarding truancy that come from the Cub Cave being so close to school areclear. Students would be lured into skipping classes by other truant students or communitymembers who were spending time there. Despite, or perhaps because of, the Cub Cave's invitingnature, this was a natural result. However, the problem is not just students skipping classes.There were several times where school staff had to call the police when they were concernedabout drugs. From across the street, the staff could do nothing but rely on the intervention of cityworkers like police to help. This strained both the school system and local law enforcement.
As we heard at the last Planning Commission meeting on July 12th, the owners of the CubCave stated they plan to reopen it as a restaurant. There is nothing the School District can do tostop this. So, the problems associated with truancy and other unsupervised bad behavior arelikely to occur. The result of having to deal with the Cub Cave and four new food carts is clear.Food carts are uniquely attractive mobile events. Each one specializes in a certain kind of fooddue to their limited space. They are separate businesses that provide different attractions. Mrs.Webster stated her interest in opening a food cart pod, which is defined in the ordinance as atleast four food carts. By allowing this pod next to the high school, the city would be multiplyingthe problems we already face. Essentially, we would have to deal with five Cub Caves (theoriginal and the four carts) instead of just one.
The problem oftmancy is country wide, and tmancy leads to an increased chance of astudent dropping out. In America, a student drops out of high school every 26 seconds. Highschool dropouts are three times more likely to be unemployed and thus draw from governmentbenefits. Over 80% of incarcerated people in our country are high school dropouts. Finally, thosewho drop out are more likely to be uninsured, to struggle with mental health problems, and tohave a lower life expectancy. As discussed, the School District is doing all it can to preventtruancy and dropouts, but we can't do it on our own. We need the help of the PlanningCommission and the City Council.
Tmancy is not just the problem of the School District. It is a problem for the students wholearn less, perform worse, and harm their long-term mental abilities and economic potential. It isa problem for parents, who are planning on having their children graduate from high school,rather than drop out. It is a problem for the city, which makes less tax revenue on those who earnless, and which has limited police resources. And yes, it is a problem for the School District,which is doing its best to combat tmancy, even without four new attractive nuisances across thestreet. The Commission should consider the long-term economic impacts oftmancy on the entirecity and weigh those, along with everything else, against the limited interests of one propertyowner.
2. Mental Health and E uit Issues
The USDA food program benefits the physical and mental health of our students by reducingstigmas surrounding poverty. When lunches are free, there is little that separates the poor kidsfrom the affluent ones. They eat the same meals in the same space which leads to viewing eachother as equals. We aren't saying that school lunch programs create a perfectly equalenvironment, but that they are one of the factors at play in encouraging the healthy mentaldevelopment of children. If a student not only loses their only secured meals of the day but mustwatch from across the street as their richer peers have fun eating, this could severely negativelyimpact their mental health.
86

High school is not the same as it was 20 years ago. The current generation of children usetechnology, often to the detriment of their mental health, to document their days and comparethemselves to one another. This would be just one more hurdle for a generation of children whoalready suffer from mental health issues more than any previous generation. "Popular as theindie food trucks are, the interests of small business should not trump the interest oflow-incomestudents, who should be able to enjoy a healthy firee lunch with a side of dignity. " (Ex. 5.) A poorstudent who is suffering from anxiety and depression does not need an additional stressor whichmay prevent them from not only eating, but from feeling like an equal with their peers.
VII. SAFETY CONCERNS
Concerns about safety fall into two main categories; traffic and strangers. The proposed foodpod location is directly across from where the School District is spending $150, 000. 00 to expandthe cafeteria. Students would have to cross 3rd street. There is no direct cross walk between thehigh school and the proposed location of the pod, and there is no way for teachers to supervisethe children who leave campus. While this street is not ideal as it stands, it should be noted thatthe high school already closes off NE Eads Street from 7th to 3rd during the school day. So, a lotof the traffic which would typically use Eads is redirected onto 3rd, making the street moredangerous for children who would be sneaking out of school to visit the pod. There are questionsof liability here. Who is liable if a driver hits a child that is running across the middle of thestreet? Is the school liable for failing to supervise a truant child? Is the food pod liable forcreating an attractive nuisance? I'd encourage you to not think about liability, and insteadconsider responsibility. The Planning Commission should work to prevent children being hit bycars by preventing this change. This is a serious risk that cannot be underplayed. Traffic andother safety concerns are likely a big part of why the 500-foot limitation was passed in the firstplace.
One of the other dangers, having children deal with strangers, is a difficult one to approach.We are not saying that people who operate or frequent food carts are in any way less reputablethan any other member of the community. What we are saying is that having groups ofunsupervised children frequently congregate off school grounds can be dangerous. Parentsshould feel that, when they send their kids to school, they are sending them to a safe location.We know, from being next to the Cub Cave, that strangers will be spending time at the foodcarts, and that this can lead to bad behavior and dmg use in our students. It will be no secret thathigh schoolers spend a lot ofunsupervised time at these food carts. What sort of person wouldtake advantage of that information, and to what ends? The School District is strongly opposed toa wait and see approach when it comes to the safety of our children.
VIII. CONCLUSION
It seems clear that the solely economic benefits this change would produce for a limitednumber of individuals is not worth the harm it presents to the community through the localchildren. The School District is doing its best to provide a safe and healthy learning environmentfor all students, and the proposed decision would actively impede that purpose. And for what?Mrs. Webster, or any other property owner, can already have a food pod on their property everyday of the year. It simply cannot be a lunch time distraction for students which could cause
87

truancy, safety problems, and the end of a school food program which is often the only thingkeeping the poorest children in Newport fed.
The problems facing our children are numerous and complicated. Obesity, malnutrition,mental health issues, physical health issues, inequality, safety, and truancy all impact the short-and long-tenn welfare of our children and community. The School Disfadct is simply asking thatthe general welfare be prioritized over limited economic interests. The Lincoln County SchoolDistrict urges the Planning Commission to deny removing the word "secondary" from theproposed language and to enact an ordinance which would prohibit any food carts from operatingnear schools, regardless of if they are on public or private land.
10 88

Macpherson, Gintner & DiazLAWYERS
423 North Coast HighwayP.O. Box 1270
Newport, Oregon 97365(541)265-8881
FAX (541) 265-3571email:[email protected]
Exhibit 1 - School Calendar - demonstrates that food carts can be open for 186 days per yearregardless of the 500-foot language.
Exhibit 2 - Ma s - demonstrate the very limited area impacted by keeping the secondarylanguage. These maps present a more accurate picture than the map included in the meetingmaterials from the Planning Commission meeting on July 12 , 2021
Exhibit 3 - Summer Meal Sites Schedule - demonstrates the locations where the School
Distinct is currently able to provide free lunches outside of schools, which could be banned bychanging the ordinance.
Exhibit4 - American Heart Association Statement on Food Carts Near Schools -demonstrates the health risks associated with mobile vendors near schools.
Exhibit 5 - News Article - demonstrates the psychological and health problems with food cartsdirectly outside of schools.
Exhibit 6 - Position of the American Dietetic Association - demonstrates that the health ofchildren needs to be the responsibility of the entire community, not just schools.
Exhibit 7 - Food and Nutrition Board Committee on Prevention of Obesi in ChUdren andYouth - study which demonsta-ates the importance of multiple groups working together toprevent obesity and the severe dangers obesity poses to children throughout their entire lives.
89

Exhibit 8 - Letter on Partici ation in the USDA Free Lunch Pro ram - demonstrates howimportant participation is to the program for the high school and entire school system.
Exhibit 9 - USDA School Meal Nutritional Value - demonstrates that the USDA requirednutritional standards used at Newport High School are very healthy.
Exhibit 10 - $150 000 Renovation on School Cafeteria - demonstrates the effort Newport HighSchool is putting into combating truancy and improving shident's dining space.
Exhibit 11 - USDA Food Standards for Breakfast and Lunch Pro ram - demonstrates thespecific standards imposed by the USDA on Newport High School.
90

Exhibit 1
91

I
MON
MON
132027
MON
MON
MON
MON
MON
MON
28MON
4'111825
2UZ1-Z<i UIS I KIU 1-WIUb SUMUUL UALbNUAK
LINCOLN COUNTY SCHOOL DISTRICT
TUE WED
162330
MON
1623
3
1017
31'TUE WED
THU4 5
11; 1218 19
', ':., I
THU
NON
6
132027
7 8i 9'14 1S| 1621 23 2328 29 30
TUE WED THU
FRI AUGUSTG 2 Administrators Report
13 Student Registration Days (Check school for dates and details)20 24-27 New Teacher Insenice Week
// 30-3 All Teachers Report
FRI SEPTEMBER
6 Labor Day Holiday (No School)10 7 First Day of School and various orientations TBD.17 7-9 Kindergarten Orientation (Check Schools for detailsl)24 8 First Day of School! All Students: Grades 1-12
FRI OCTOBER
8 LCSD Professional Development (No School)4
111825
1
8
152229
6
13
3
10
2431
7
TUE
TUE
TUE
TUE
TUE
5
121926
2
9
1623301
7|14
4
111825
1
8
1522
1
81
WED3
1017'
WED1
8.1151
WED51
121
-l9J-2i'i
WED
9,
16123
WED2
1
14"21
2STHU
4
THU2
g
16
THU6
132027
THU3
101724
THU3
FRI
FRI
FRI
FRI
FRI
15
29
5
1219
3
1017
7
1421
4
111825
4
202122
1124-26
20.31
3
172728
1421
7
Evening ConferencesConferences Day/Evening (No School")No School"
NOVEMBER
Veteran's Day Holiday Observed (No School)Thanksgiving Break (No School)
DECEMBERWinter Break (No School)
JANUARYAll students back to School
Martin Luther King Day (No School)End of 1st Semester
Records Day (No School)
FEBRUARY
LCSD Professional Development (No School)President's Day Holiday (No School)
MARCH
LCSD Professional Development (No School)91
1ffl
29
10!
1?124311
TUE WED THU
TUE
5
121926
3
101724311
2027'
7
14"21
28iWED THU
11
18
FRI1
8
15"22
29FRI
13|
25 27
TUE WED THU FRI
7
-J^.-
2i 39 10
16 1723' 2430Y
21 2228 29
Professional Development (No School)Records Day (No School)Wednesday Eariy Release (See your school for times)!No School (Shaded days)Conference Day (No School)
Evening Conference Trade Day (No School)
Days induded in Instructional Ume calculation, pursuant to
21-25 Spring Break (No School)
APRIL20 Evening Conferences
21 Conferences Day/Evening (No School")22 No School"
MAY20 LCSD Professional Development (No School)30 Memonal Day Holiday (No School)
JUNE
9 Seniors last day10-11 High School Graduation
14 All students last day - End of 2nd Semester
15 Teachers last day/Records Day
LCNSD
2
22
21
20
13
20
20
18
21
22
Total Days this Calendar 190
Total Days 2023-21 190
INSTRC STDNTDAYS CONTACT0 0
18
18
13
19
19
18
21
10
178
176
Board Approved 3.9.21
18
18
18
13
19
18
17
19
20
10
170
168
92

Exhibit 2
93

City of NewportZoning Map
Legend
I-; City Limits* Urban Growth BoundaryZone Ditlrtct
C-1 Retail and Service
C-2 Tourist
C-3 Heavy1-1 Light1-2 Medium
1-3 HeavyP-1 Public Structures
P-2 Public Paiks
P-3 Public Open Space
R.1 Low Density Single-Family
R-2 Medium Density Singte-FamityR-3 Medium Density Mulli-Familyft-4 High Density MulU-FamilyWIWhler DependentW-ZVteter Related
2,500 5, 000
City of NewportSlss^a?'^
;Nnwport, OS173W
\\Feet
10,0(10
y>^
L
94

Attachment" "I- - 1
City of NewportCommunity Development Departnwntin»«»Co»«tHtth«n» niailKl. t41. 8K. fMHfllpwl. aHt'IWS »M:1.M1.8><.W<4
li»*t»i^iftdl»Mt*M»ipN»iM»r. n»lt. »«uNat»»ibtrt. wnw*r.»1 wiw. Pr Cty N NwrN >iai»w» i» n»im«n Nt u cNwlhln w <- i..^».Iin««---0»«»ln«mC--,B...hfie.
Potential 500-ft Buffer from School Ground(Impacted Areas Shown in White Cross-Hatch) N
lm«9»1»k*nJulyaor**wh, 4-t«nd Olglfl Orthiihoto*Quinlum SpXtal, Inc. Canmr, OR 500 1,000
Feel2.000 52
95

Exhibit 3
96

2021 Lincoln County Summer Meal Sites & Curbside Locations
I Newport Locations
Frank Wade Park June 21st thru Sept 3rd
Newport Parks & Rec 225 SE Avery Street June 21st thru Sept 3rd.
Oceansprayfamily Center 1039 NW Nye Street June 16th thru Sept 3rd.Salmon Run Apts 7035 NE Echo Court June 16th thru Sept 3rd.Yaquina View Elementary 351 SE Harney Street June 16th thru Sept 3rdNewport High School 22 NE Eads St. Curbside June 17th thru June 30th
NewporU-figh School 22 NE Eads St. Curbside Aug 16th thru Aug 20thToledo Locations
Olalla Center 321 SE 3rd Street
Toledo High School 1800 NE Sturdevant Rd. Curbside June 17th thru June 30thToledo High School 1800 NE Sturdevant Rd. Curbside Aug 16th thru Aug 20thToledo Elementary 600 SE Sturdevant Rd. Curbside June IGth thru Sept 3rdEddyville Charter School Curbside Aug 9 thru Aug 20Siletz Valley Charter School Curbside June 21nd thru July 2ndSiletz Valley Charter School Curbside Aug 9th thru Aug 20thLincoln City LocationsTaft 7-12 3870 Spyglass Ridge Dr. Curbside June 17th thru June 30th
Taft 7-12 3870 Spyglass Ridge Dr. Curbside Aug 16th thru Aug 20thTaft Elementary 4040 High School Dr. Curbside June 17th thru Sept 3rd.Waldport LocationCrestview Heights Elementary Curbside June 17th thru Sept. 3rdWaldport High School Curbside June 17th thru June 30th
Meals will only be served during the listed hours above
M-F Lunch & Afternoon Snack
M-F Lunch & Afternoon Snack
M-F
M-FM-FM-F
M-F
M-FM-FM-FM-FM-FM-FM-F
M-FM-FM-F
M-FM-F
Breakfast & Lunch
Breakfast & Lunch
Breakfast & Lunch
Breakfast & Lunch
Breakfast & Lunch
Breakfast & Lunch
Breakfast & Lunch
Breakfast & Lunch
Breakfast & Lunch
Breakfast & Lunch
Breakfast & Lunch
Breakfast & Lunch
Breakfast & Lunch
Breakfast & Lunch
Breakfast & Lunch
Breakfast & Lunch
Breakfast & Lunch
Menu Used
Hot & Cold
Hot & Cold
Hot & ColdHot & ColdHot & Cold
Hot & Cold
ColdHot & ColdHot & ColdHot & ColdHot & ColdHot & ColdHot & Cold
Hot & Cold
Hot & ColdHot & Cold
Breakfast
N/A
N/A
10:00-10:30
8:45-9:158:45-9:158:00-8:30
10:30-11:008:45-9:158:45-9:158:45-9:158:45-9:158:45-9:158:45-9:15
8:45-9:158:45-9:158:45-9:15
8:45-9:158:45-9:15
Lunch
11:30-12:00 M.W.Th&F 10:30-11:00 Tue
11:30.12:00 M.W.Th&F 10:30-11:00 Tue
12:00-12:3011:30-12:0012:00-12:3012:00-12:3012:00-12:30
12:30-1:0012:00-12:3012:00-12:3012:00-12:3012:00-12:3012:00-12:3012:00-12:30
12:00-12:3012:00-12:3012:00-12:30
12:00-12:3012:00-12:30
Snack
3:00-3:30
3:00-3:30
N/AN/A
N/AN/A
N/AN/AN/AN/AN/AN/AN/A
N/AN/AN/A
N/AN/A
This Institution is an Equal 0 ity Provider
ALL MEALS ARE NO COST TO CHILDREN AGES 1 TO 18
97

Exhibit 4
98

American . AmericanHeart
Association
Mobile Vending Near Schools Policy StatementJune 2012
StrokeAssociation®
Position and RationaleThe American Heart Association (AHA) advocates for nutrition policy efforts that make healthy foodsmore affordable and accessible to all consumers and bring food pricing and subsidies in line with federaldietary guidelines and AHA nutrition recommendations. The recent trend of mobile food vending allowsfor the possibility of greater access to healthy foods, such as fi^uts and vegetables, in low-incomecommunities. However, it can also increase access to less healthy foods which is of particular concernaround schools where the targeted consumers are children.
Mobile vending around schools should provide only healthy foods and be in line with the Institute ofMedicine's nutrition standards for competitive foods in schools. As an emerging issue, there is limitedevidence showing the health impact of mobile vending around schools. The American Heart Associationsupports additional research and pilot approaches with evaluation to determine the impact on children'shealth, diet, purchasing behavior, and calories consumed.
BackgroundChildren attending public schools offering the National School Lunch Program (NSLP) and SchoolBreakfast Program receive more than one third of their daily energy from foods consumed at school.Foods sold in competition with school meals are widely available on and around campuses across theUnited States. 2 School-based obesity and chronic disease prevention strategies that target the food sold inschools have shown modest impacts on childhood obesity rates.'
A growing body of evidence suggests the school food environment extends beyond school walls intoneighborhoods that surround campuses, particularly for students who walk and bike to school. While alarge number of studies have examined the effect that nearby fast-food outlets and convenience stores canhave on the school food environment, ... " little is known about the effect that mobile food vendorshave on the school food environment. Mobile vendors who sell food in close proximity to schools or onthe actual campus have the potential to greatly affect the nutritional intake of elementary and secondaryschoolchildren.
National surveys ' show that most schools do not allow students to leave campus during lunchtime:only 25-27% of high schools, 4-15% of middle schools, and 6-8% of elementary schools support an open-campus system. Some vendors overcome this by locating directly on the school campus. Althoughstudents should be encouraged to eat healthy foods if they leave school for lunch, policies aimed atinfluencing school food environments may have a greater impact by targeting food consumed outside ofthe regular school day, particularly just before and after school. A number of studies have demonstratedthat mobile food vendors tend to convene near schools just before and after school hours. 13'14
Unfortunately, it is difficult to estimate the number of mobile vendors who sell food in the United States.According to the 2007 U. S. Economic Census, 1,930 firms operated mobile food services that engagedin preparing and serving meals for immediate consumption from vehicles and carts across the country.The states in which the largest proportions of these fmns operated were California (13. 4%), New York(11.4%), Florida (6. 9%), and Pennsylvania (6. 9%). 16 The U. S. Census data has two major flaws: fast, theCensus counts the number of businesses involved in mobile food vending without determining thenumber of individual vehicles or carts owned by each firm; second, the count listed above does notcapture businesses that own and operate vehicles and carts that sell unprepared foods, including fmits andvegetables, candy, or soda. Additionally, since the mobile vending market is rapidly growing, the U.S. 99

Census data from 2007 is likely outdated. One market research fmn estimates fhat the mobile foodvending industry grew at an annual rate of 7.7% between 2006 and 2011. 17
Mobile vendors sell food in both rural and urban areas across fhe Umted States. 18 A number of cities havereported that the mobile food industry has the ability to provide entrepreneurial and workforcedevelopment opportunities for low-income and immigrant workers in their communities. 19'20'21 In manycommunities, mobile food vendors frequently serve Hispanic and African American neighborhoods thathave few large food outlets and grocery stores. These mobile vendors can travel deep into areas wherezoning laws and other prohibitive factors discourage the establishment of permanent retailers. Althoughmobile vendors can offer economic possibilities and community benefits, they frequently face oppositionand resentment from competing local businesses and "brick-and-mortar" restaurants. Other opponents ofmobile food vendors cite concerns with trash, parking, and sidewalk congestion.
Mobile food vending near schools can have negative consequences for students and for school districts:. Safety issues: Based on preliminary surveys on issues related to school vending, the concern
about safety is foremost and can be divided into three categories -o Traffic-related safety as children run across public roadways to access vendorso Interaction with strangerso Food safety (unhealthy food preparation not up to school food standards and difficult to
enforce).. School Lunch Program and School Breakfast Program Vulnerability: as schools strive to meet
USDA's Healthier US Schools Initiative nutritional standards, the School Lunch and Breakfastprograms could be undermined by the influence of outside unhealthy food sources. 6'8Additionally, allowing sales by outside vendors may result in a loss of revenue for school mealprograms.
. Equity issues: food and beverage purchased from food tmcks may cost more than students fromlow income families can afford, especially those who are on subsidized meal programs.
. School resource issues: school officials have a duty to supervise the students on campus,resources and staff would be needed to attend to students purchasing food from outside vendors.
Local-Level Policy OptionsAlthough state retail food codes generally require all vendors to follow food safety and hygiene standardsto prevent food-bome illnesses and contamination, 26 local governments typically play a large role inoverseeing mobile food vendors' day-to-day operations. Most cities implement municipal codes thatrequire mobile vendors to obtain a number of permits or licenses to legally sell food within city limits.For example, the city of Boston, Massachusetts requires that mobile food vendors obtain permits from theBoston Fire Department, the health department, and the state of Massachusetts. 19 Most cities also usemunicipal codes to ban mobile vendors from operating in specific zones or locations, including areas inclose proximity to restaurants and other mobile vendors. Further research is needed to determine if theregulations in place assure adequate food preparation and safety.
Existin Policies that have been Im lentedDue to the concerns outlined above, many localities have established policies to limit mobile foodvendors' ability to sell to children near schools (See Appendbc.) These local ordinances have taken one ormore of the following approaches:
. Prohibit all mobile vending near schools: policies ban mobile vendors selling food within aspecified distance of schools on all days or during days and hours when children are likely topresent.
Examples: Phoenix, AZ, Los Angeles, CA; Seattle, WA; where municipal codes prohibitmobile food vendors from locating within a certain distance of public and privateschools. 28-29'30
100

. Limit mobile vending by location: policies restrict mobile vending by zoning code or on a block-by-block basis on at all times or during days and hours when children are likely to present.
Examples: Evanston, IL and Oakland, CA, where municipal codes prohibit mobile foodvendors from operating within specific zones and blocks of the cities. 31'32
Policies that prohibit or restrict mobile vending face challenges and barriers to implementation, including:. The need for sufficient infrastructure to enforce regulations. A study completed in Los Angeles,
California showed that although mobile food vendors are prohibited from selling within 500 feetof schools, vendors still succeed in selling snacks after school to children outside of elementaryschools.
. Potential opposition from mobile vendors, who earn a living by selling to children. Mobilevending has been viewed as a valuable economic point-of-entry for immigrant and refugeecommunities. 29
Policies to Promote Health Mobile VendinA number of localities have established policies to encourage mobile food vendors to sell healthy foods.These local ordinances have taken one or more of the following approaches:
. Regulate the types and numbers of mobile vendor licenses: policies promote increased licensingof healthy mobile vendors in localities that restrict the total number of mobile vendor licenses.
Example: New York, NY, where the city enacted "The Green Cart Initiative" legislationto bring healthy, fresh, affordable produce to city food deserts. '34 This program created1,000 additional city permits to operate fresh produce carts in designated neighborhoodswhere community members consumed low rates of finits and vegetables.
. Restrict certain types of goods sold by mobile vendors: policies incentivize vendors to sellnutritious foods.
Example: Kansas City, MO, where mobile food vendors who sell in public parks receivea 50% discount on their annual permit fees if the food they sell meets specific nutritionalstandards.35
Local policies that promote healthy mobile vending have the potential to increase access to highlynutritious foods in underserved neighborhoods. Some evidence suggests that mobile food vendors canincrease fresh produce consumption:
. One year after the implementation of New York City's Green Cart Initiative, low-incomecommunity members in underserved areas reported that they relied on Green Carts as a frequentshopping option. 33
. A recent small scale study^6 examined the impact of allowing mobile frvat vendors to increaseaccess to fresh fruit and vegetables for schoolchildren. This study found that it is feasible forsanctioned vendors to sell nutritious food items after school and suggested that the presence ofhealthy food vendors may decrease sales at vendors selling less healthful items.
Policies that aim to incentivize healthy mobile food vending face challenges and barriers toimplementation, including:
. The need for sufficient infrastmcture to establish nutritional standards, to inspect for nutritionalstandards, to issue permits, and to enforce regulations.
. Potential opposition from mobile vendors who do not sell healthy foods.
. Potential opposition from proprietors of stores that sell healthy foods and who may lose businessto healthy mobile food vendors.
. Potential need to allow vendors to accept Electronic Benefit Transfer cards (EBT) so that low-income families can use SNAP and WIC benefits to purchasing from mobile vendors. Thispractice would also increase vendors' profitability in high poverty districts. 33
101

State-Level Policy Options
Mobile food vending regulations related to the school food environment have only been enacted at thelocal level. In Febmary 2012, an assemblyman in California proposed a bill36 to restrict mobile foodvendors from locating near all schools in the state. While the bill did not pass during the 2012 session, itdid spark significant discussion among public health officials and advocates, lawmakers, and mobile foodvendors. We expect this discussion to continue in California and, in all likelihood, in other states acrossthe country. States will need to learn from the experiences of local communities as they considerregulating mobile food vendors across varying communities.
Conclusion
Policy creation and implementation at any local level requires significant political will. In order to enact asuccessful mobile food vending policy that promotes healthy eating for children, policymakers shouldengage in conversations to gain support from parents, mobile vendors, local business owners, healthdepartment officials, law enforcement agencies, and school officials.
The American Heart Association supports additional research and policy approaches to detennine theefficacy of healthy mobile vending policies on schoolchildren. The AHA. prioritizes robust evaluation aspart of local legislation or regulation that is passed. At minimum, healthy mobile vending around schoolsshould meet nutaition standards that are in line with the Institute of Medicine's standards for competitivefoods.
102

Appendix A: Sample of Local MobUe Food Vendor Restrictions Near Schools
Ci
Phoenbt
Fresno
Los Angeles
ManhattanBeach
Merced
Oakland
Riverside
Sacramento
San DiegoSanFranciscoSan Jose
Stockton
WestHoll ood
State Code
AZ Ci Code §10-166 B 3
CA Munici al Code §9-1107CA Municipal Code §80.73(b)(2)(A)()5)
CA Munici al Code §3.68
CA Municipal Code §5.54.090(B)CA Munici al Code §5.49.050(C)(2
CA Munici al Code §9.04.210
CA Munici Code §5. 88.010
CA Munici Code §54.0122(g)
CA Public Works Code 5.8. 184.85 3)(DCA Municipal Code §6.54.240(2)
CA Municipal Code §5. 72. 060(A)(1)
CA Munici al Code §5. 92. 050(2)(ii)
Evanston IL Munici al Code §8-26-3(H)ElPaso TX Municipal Code §12.46. 020
San Antonio TX Munici alCode §13-63(a (9)DesMoines WA Municipal Code §5.57. 150(l)(a)
Pu allu WA Munici 1 Code §5.65(1 (a
Seattle WA Munici al Code §6.54.240(A)(2)
Mobile Food Vendor RestrictionsProhibited within 300' of property line of schools, 6:00AM-5:00 PM30Prohibited within 1000' of schools intended to educatechildren 18 or oun er37Prohibited within 500' of schools
Prohibited within 300' of property line of schools, 7:00AM - 5:00 PM, exception for allowance for principalexce tionProhibited from stopping or parking adjacent to anyschool, 8:00 AM - 4:00 PM on school da s39Prohibited within 400'of rim and middle schools32
Prohibited within 1000' of property line of schools, 7:00AM - 4:00 PM40Prohibited within 350' of any school building, school
und, olavsround, recreation park, or nablic parkProhibited within 500' of property line of schools, 7:00AM - 4:00 PM42Prohibited within 1500' of property line of schools, 7:00AM - 5:00 PM, Monda - Frida 43Prohibited within 500' of schools44Prohibited within 300' of any school grounds, park,playground, or City-o erated recreation centerProhibited within 1 block of schools, 8:00 AM - 5:00PM46Prohibited within 500' of schools when school is insession, prohibited on specific streets near high schoolstadium durin events3Prohibited within 2 blocks of schools
Prohibited within 300' of schools betweenl hour beforeschool starts throu 1 hour after school ends48Prohibited within 400' of schools, regular school hoursProhibited within 400' of schools during the hours ofregular school session and school-related events,exceution for allowance b schoolProhibited within 1,000' of any school containing aKindergarten through 12th-grade class, within 50' of anypublic park15
103

References:
Briefel R, Wilson A, Gleason P. Consumption ofLow-Nutrient, Energy-Dense Foods and Beverages at School, Home, andOther Locations among School Lunch Participants and Nonparticipants. Journal of the American Dietetic Association.2009;109(2):S79-S90.2 Gordon A, Fox MK. School Nutrition Assessment Study-III Summary of Findings. Alexandria, VA: United States Department ofAgriculture, Food and Nutrition Service, Office of Research, Nutrition, and Analysis; 2007. Available at:http://www. fas.usda. gov/ora/MENU/Published/CNP/FILES/SNDAIU-SummaryofFmdmgs. pdf. Accessed June 4, 2012.
Gittelsohn J, Kumar MB. Preventing childhood obesity and diabetes: is it time to move out of the school? Pediatric Diabetes.2007, 8:55-69.
Mozaffarian D. Afshin A. Benowitz NL. Bittner V. Daniels SR. Franch HA. Jacobs DR. Kraus WE. Kris-Etherton PM.Krummel DA. Popkin BM. Whitsel LP. Zakai NA. Population approaches to improve diet, physical activity, and smoking habits.Circulation. 2012. 126:1514-1563.
Tester JM, Yen IH, Pallis LC, Laraia BA. Healthy food availability and participation in WIC (Special Supplemental NutritionProgram for Women, Infants, and Children) in food stores around lower- and higher-income elementary schools. Public HealthNutrition. 2010;14(06):960-964.6 Davis B, Carpenter C. Proximity ofFast-Food Restaurants to Schools and Adolescent Obesity. American Journal of PublicHealth. 2009;99(3):505-510.Howard PH, Fitzpati^ck M, Fulfrost B. Proximity of food retailers to schools and rates of overweight ninth grade students: an
ecological study in California. BMC Public Health. 2011;11(1):68.8 Neuinark-Sztainer D, French SA, Hannan PJ, Story M, Fulkerson JA. School lunch and snacking patterns among high schoolstudents: Associations with school food environment and policies. International Journal of Behavioral Nutrition and PhysicalActivity. 2005;2(14). Available at: http://www. ijbnpa. org/contenVpdf71479-5868-2-14. pdf. Accessed June 5, 2012.
Simon PA, Kwan D, Angelescu A, Shih M, Fielding JE. Proximity of fast food restaurants to schools: Do neighborhood incomeand type of school matter? Preventive Medicine. 2008;47(3):284-288.10 Zenk SN, Powell LM. US secondary schools and food outlets. Health &. Place. 2008;14(2):336-346
Gordon A, Crepinsek MK, Nogales R, Condon E. School Nutrition Dietary Assessment Study-III: Volume I: SchoolFoodservice, School Food Environment, and Meals Offered and Served. Office of Research, Nutrition and Analysis, USDA,Food and Nutrition Service; 2007:466. Available at: http://www.fas.usda.gov/ora/MENU/Published/CNP/FILES/SNDAIU-Voll. pdf. Accessed June 5, 2012.
O'Toole TP, Anderson S, Miller C, Guthrie J. Nutrition Services and Foods and Beverages Available at School: Results Fromthe School Health Policies and Programs Study 2006. Journal of School Health. 2007;77(8):500-521.
Tester JM, Yen IH, Laraia BA. Mobile food vending and the after-school food environment. American Journal of PreventiveMedicine. 2010;38(1):70-73.
Goetz K, Wolstein J. Street Vendors in Los Angeles: Promoting Healthy Eating in L.A. Communities. Applied Policy ProjectUCLA School of Public Affairs Department of Public Policy; 2007:1-81. Available at: http://www.spa.ucla.edu/ps/research/G-StreetVendorsFinal. pdf. Accessed June 7, 2012."U.S. Census Bureau. Industry Statistics Sampler: NAICS 72233 - Mobile food services - Definition. 2004. Available at:http://www. census. gov/econ/industry/def7d72233. htm. Accessed June 11, 2012."U.S. Census Bureau. Industay Statistics Sampler: NAICS 72233 - Mobile food services - Geographic Distribution. 2011.Available at: http://www.census.gov/econ/industry/geo/g72233.htm. Accessed June 12, 2012.
Samadi N. Rolling along: While the food truck craze will wane, demand for specialty foods will support growth: IBISWorldIndustry Report 72233 Street Vendors in the US Sample. IBISWorld; 2011:4. Available at:http://www.ibisworld.com/industry/default.aspx?indid=1683. Accessed June 11, 2012.
National Policy and Legal Analysis Network to Prevent Childhood Obesity (NPLAN), a project of Public Health Law mdPolicy (PHLP). Healthy Mobile Vending Policies A Win-Winfor Vendors and Childhood Obesity Prevention Advocates.; 2009:1-4. Available at:
http://changelabsolutions. org/sites/changelabsolutions. org/files/nplan/MobileVendmg_FactSht_FINAL_091008. pdf. AccessedJune 5, 2012.19Boston, Massachusetts. Municipal Code §1 7-10.; 2011. Available at:http://www.cityofboston.gov/Images_Documents/Ordmance%20Promoting%20Economic%20Development%20and%20the%20Food%20Tmck%20Industry%20m%20Boston_tcm3-25610. pdf. Accessed June 11, 2012.20 Seattle.gov. Seattle Street-Food Initiative, Director's Report. City of Seattle, Department of Planning and Development;2011:1-8. Available at: http://www.seattle.gov/counciVclark/attachments/2011street_food_duTeport.pdf. Accessed June 11,2011.
Kapell H, Katon P, Koski A, Li J, Price C, Thalhammer K. Food Cartology Rethinking Urban Spaces as People Places. UrbanVitality Group; 2008:1-52. Available at: http://www.portlandonline.com/shared/cfin/image.cfin?id=200738. Accessed June 11,2012.
Odoms-Young A, Zenk S, Mason M. Measuring food availability and access in Afiican-American communities: implicationsfor intervendon and policy. American Journal of Preventive Medicine. 2009, 36(4 Supplemental) :S145-S 150.
National Policy and Legal Analysis Network to Prevent Childhood Obesity (NPLAN), a project of Public Health Law andPolicy (PHLP). Model Healthy Food Zone Ordinance Creating a Healthy Food Zone Around Schools by Regulating the
6104

Location of Fast Food Restaurants (and Mobile Food Vendors).; 2009:1-14. Available at:http://changeIabsolutions.org/sites/changelabsolutions.org/files/nplan/HealthyFoodZone_Ordinance_FINAL_091008.pdf,Accessed June 5, 2012.24Berk KH, Leib AD. Food Truck Regulations Drive Controversy. Business Law Today The ABA Business Law Section 's OnlineResource. http://apps.americanbar.or^uslaw/blt/content/2012/05/keepingcurrent.shtml. Published May 25, 2012. Accessed June5, 2012.25Morris L. Food Tmcks Are a Win-Win. HuffingtonPost. com. http://www. huffmgtonpost. com/leland-moms/food-tmck-regulations-dc_b_1266866.html. Published February 10, 2012. Accessed June 11, 2012.26Tester JM, Stevens S, Yen IH, Laraia BA. Is it time for nuto-itious food on wheels?: an analysis of public health policy and legalissues relevant to mobile food vending. American Journal of Public Health. 2010;100(11):2038-2046.27Rifkin S. Comparative Practices and Stakeholder Feedback for Mobile Food Vending Policies in Oakland. City of OaklandPlanning Department; 2011:1-5. Available at:http://www. mills. edu/academics/graduate/ppoL'student_research/student_research_l l/Rifldn201 l_ES. pdf. Accessed June 11,2012."Los Angeles, California. Municipal Code §80. 73 (b) (2) (A) 05).; 2009. Available at:http://www. amlegal. com/nxt/gateway. dll?f==templates&fa=default. htm&vid=amlegal:lamc_ca. Accessed June 7, 2012."Seattle, Washington. Municipal Code §15. 02. 042(6)(g). ; 2011. Available at: http://clerk. ci. seattle. wa.us/~scripts/nph-brs. exe?d=ORDF&sl=123659. ordn. &Sect6=HITOFF&l=20&p=l&u=/~public/cbory. htm&r=l&f=G. Accessed June 5, 2012."Phoenix, Arizona. Municipal Code art XIV, §10- 166(B)(3). ;20l 1. Available at: http://www. citymb. mfo/agenda/2012/Ag-Mm20120221/20120221-02. pdf. Accessed June 5, 2012.31Evanston, Illinois. Municipal Code §8-26-3 (H).; 2010. Available at:http://library. municode. com/mdex. aspx?clientId=14913&stateId=13&stateName=Illinois. Accessed June 5, 2012."Oakland, California. Municipal Code §5.49. 050(C)(2). ; 2004. Available at:http://library. mumcode. com/index. aspx?clientld=16308. Accessed June 5, 2012.33Citizens' Committee for Children of New York, Inc. Green Cart Implementation: Year One. ; 2010:1-23.34New York City, New York. Administrative Code §17-306 - §17-325. 1.; 2008. Available at: htq)://public. leginfo. state. ny.us/.Accessed June 6, 2012.
Kansas City, Missouri. Parks and Recreation Vending Policy 4. 7. 08.; 2006. Available at:http://www. kcmo. org/idc/groups/parksandrec/documents/parksrecreation/012710. pdf. Accessed June 5, 2012.
Tester JM, Yen IH, Laraia BA. Using Mobile Fmit Vendors to Increase Access to Fresh Fmit and Vegetables forSchoolchildren. Preventing Chronic Disease. 2012 ;9:110222."Fresno, California. Municipal Code §9-1107(g). Available at: http://library.municode.com/index.aspx?clientld=14478.Accessed June 7, 2012.
38Manhattan Beach, California. Municipal Code §3. 68. ; 2012. Available at: http://www. citymb. info/agenda/2012/Ag-Min20120221/20120221-02. pdf. Accessed June 5, 2012.39Merced, California. Municipal Code §5. 54. 090 (B). Available at: http://library. mumcode. com/index. aspx?clientld=16096.Accessed June 7, 2012.
""Riverside, California. Municipal Code §9. 04. 210. Available at: http://www. riversideca. gov/municode/pd£/09/9-04. pdf.Accessed June 7, 2012.
41Sacramento, California. Municipal Code §5. 88. 010. Available at: http://www. qcode. us/codes/sacramento/. Accessed June 7,2012.42 San Diego, California. Municipal Code §54.0122(g).; 2009. Available at:http://docs.sandiego.gov/municode/MuniCodeChapter05/Ch05Art04Division01.pdf. Accessed June 6, 2012.43 San Francisco, California. Public Works Code §5. 8. 184. 85(3)(D). Available at:http://www. amlegal. com/library/ca/sfrancisco. shtml. Accessed June 7, 2012.44 San Jose, California. Municipal Code §6. 54. 240(A)(2):, 2009. Available at:http://sanjose.amlegal.com/nxt/gateway.dlVCalifomia/sanjose_ca/sanjosemunicipalcode?f=templates$fii=default.htm$3.0$vid=amlegal:sanjose_ca. Accessed June 6, 2012.
Stockton, California. Municipal Code, Charter, and Civil Service Rules §5. 72. 060(A)(1). Available at:http://qcode. us/codes/stockton/view. php?topic=5-5_72-5_72_060&frames=on. Accessed June 5, 2012.
West Hollywood, California. Municipal Code §5. 92. 050(2) fii). Available at: http://qcode.us/codes/westhollywood/. AccessedJune 4, 2012.47E1 Paso, Texas. Municipal Code §12. 46. 020.; 2011. Available at:http://library.municode.com/mdex.aspx?clientId=16180&stateId=43&stateName=Texas. Accessed June 6, 2012.48San Antonio, Texas. Municipal Code §13-63(a)(9):, 2008. Available at:http://library. municode. com/mdex. aspx?clientld=l 1508. Accessed June 6, 2012.9Des Moines, Washington. Municipal Code §5. 57. 150(l)(a). Available at: http://www.codepublishing.com/wa/desmomes/.
Accessed June 7, 2012.50Puyallup, Washington. Municipal Code §5. 65(1) (a).; 2004. Available at:http://www. cityo^)uyallup. org/files/library/91e98a4b9a86ed77. pdf. Accessed June 6, 2012.
105

Exhibit 5
106

II--
/
by Dana Woldow on March 21, 2012
It has been well-documented that hungry students can't learn, but there is to
more to getting kids to eat a school lunch than just improving the food. Makingkids feel comfortable enough to get into the lunch line is a challenge even indistricts with scratch-cooked meals using locally sourced ingredients. Schoolfood reformer Chef Ann Cooper (http://www. chefann. com/), who overhauledschool meals in Berkeley, says, "High school students are some of the hardestto get to eat in the cafeterias. For too long, eating school food has beenassociated with being poor, and that stigma is hard to shed."
Janet Poppendieck, Professor of Sociology at Hunter College in New York,knows all about that stigma. In one of the best-known scholarly studies of the
National School Lunch Program, Free for All: Fixing School Food in America(http://www.janetpoppendieck.com/free_for_all. html), she wrote:
The biggest problem is the stigma that comes from being different, from being marked as poor, from being unable to payin a culture that places excessive value on being able to pay and a school food subculture that increasingly viewschildren as 'customers.'
Several years ago, San Francisco Unified School District began taking steps to combat the stigma. A swipe card systemwas installed in the cafeterias, so no one can tell just by looking who is paying for their meal and who is getting freelunch. A la carte choices previously available only to those with money to purchase them were eliminated, and a widerchoice of complete meals is now offered to all students.
Fundraising food sales that competed with the school lunch program were eliminated by SFUSD's Wellness Policy. Eventhe City got on board with the idea that competition with the meal program drained away money which was badly neededto offer higher quality food. In 2007, a San Francisco city ordinance was passed keeping mobile food vendors 1, 500 feet(about three blocks) from public middle and high schools.
But now, "The City that Knows How" may be poised to reverse course. Proposed legislation(http://sfgsa.org/modules/showdocument.aspx?documentid=8394) before the Board of Supervisors would shorten thedistance mobile vendors must keep back from schools to just one block. The current law is doing its inteiRlartgl^ »
107

keeping "roach coaches" and other vendors away from SFUSD students, and helping to protect the school mealprogram. More middle and high school kids are eating school lunch now than five years ago. Bringing vendors closer toschool will surely undo that progress.
For many reasons, San Francisco's school meal program needs more protection than other communities. SFUSD mealscontain whole grains, fresh fruit and vegetables, and lean meat (no "pink slime"(https://beyondchron. org/news/index. php?itemid=9976) served here!); middle and high schools have salad bars, mealscontain Og trans fat, no artificial colors or flavors, and nothing is fried - ever. Since 2010, all meals have met(https://beyondchron. org/news/index. php?itemid=8504) the Gold Standard under the USDA's Healthier US Schoolsinitiative.
SFUSD has eliminated a la carte, an additional revenue stream in other school districts, and serves only full meals, so
that every choice is available to every student. Most other districts continue to allow the de facto economic segregationthat happens when low-income students getting free lunch are offered one or two choices, while those with money havea whole buffet of a la carte offerings to choose from. When free lunch is viewed as "poor people's food," many studentswill choose to go hungry rather than bear the stigma of self-identifying as poor in front of their peers.
Some school districts turn away students with no money who get in the cafeteria line without being eligible for free lunch,while others give those kids a "meal of shame" of a cheese sandwich or cold cereal; SFUSD provides every child in linewith a full meal, even if they cannot pay for it.
All of this adds to the cost of operating the meal program, which is already underfunded by the federal government.Nowhere is that underfunding more apparent than in San Francisco, where the high cost of living drives some of thehighest labor costs in the country.
Currently, the school district contributes over $3 million from its general fund to augment the insufficient governmentfunding. It's worth it to provide a better experience for students, with less stigma around eating school meals, andhealthier choices. The school district's primary mission is education, so it's vital that students eat a midday meal,
because hungry students can't learn.
The proposal to shorten the distance mobile food vendors must stay from schools to one block (about 500 feet) aims tosupport the new gourmet food trucks which have sprung up recently, by allowing them more places to park in acongested city. However, the change would allow all mobile vendors, including the soda and chips dispensing roachcoaches, to park a block from schools and sell to students all of the food that state laws have banned from campus.
Just because kids could walk to a comer store and buy junk food doesn't mean that cities should undo existing
legislation, and provide even more opportunities for kids to make poor food choices. Popular as the indie food trucks are,the interests of small business should not trump the interests of low income students, who should be able to enjoy a
healthy free lunch with a side of dignity.
The current 1,500 foot limit, and SFUSD's efforts to combat the stigma, are working. Almost 3,000 more middle and highschool students ate school lunch last year than before the 2007 ordinance was enacted, despite the fact that CaliforniaDepartment of Education records show (http://dq. cde. ca. gov/dataquest/Enrollment/GradeEnr. aspx?cChoice=DistEnrGrd&cYear=2010-11&cSelect=3868478-SAN) SFUSD middle and high school enrollment has declined
by almost 2,400 students in that same time period.
Translate »
108
But don't take my word for it that bringing mobile food vendors closer to schools is a bad idea. I spoke with a number ofthe nation's leading authorities on school lunch programs to get their opinion on the proposed San Francisco ordinancechange.
Chef Ann Cooper, who fixed Berkeley's school food and now heads student nutrition in Boulder CO public schools, toldme, "I believe that to repeal the food truck ban in SF would be to reverse the hard work and healthy food guidelines thatthe district nutrition services has implemented. Any vending food trucks, whether their food is healthy or not, potentiallycompetes with the food served in the cafeteria, and could be a deterrent to sustainable healthy school food programs."
Marion Nestle, Professor in the Department of Nutrition, Food Studies, and Public Health, and Professor of Sociology atNew York University, is the author of the seminal food policy book Food Politics (http://www. foodpolitics. com/about/); shealso writes a monthly column on nutrition for the SF Chronicle. Her view: "If the current system isn't broke, why fix it?Food vendors can go plenty of other places. They need to leave schools in peace to get their school meals programsworking, healthy, and functional."
Amy Kalafa, an award winning filmmaker, nutritionist and mom based in Connecticut, is one of the Two Angry Moms fromthe film about (http://www. snagfilms. com/films/title/two_angry_moms) school food of the same name; she is also theauthor of LUNCH WARS: How to Start a School Food Revolution and Win the Battle for Our Children's Health
(http://www. blogher. com/bookclub/now-reading-lunch-wars). She said, "the current ordinance was hard-won and reallydoesn't impede business, it just doesn't encourage kids to eschew the school meal. If only the people supporting the foodtrucks, who are putting so much effort into this campaign, were as interested in improving the quality of school meals! Ithink the extra 1000 feet is great exercise for the students who are motivated to go the distance."
Mrs. Q, is the nom de plume of a special education teacher from Chicago who ate school lunch with her students everyday for a year, blogged about it, and then wrote a book about her experience called Fed Up with Lunch(http://abcnews. go. com/Nightline/book-excerpt-fed-lunch-mrs/story?id=14667895). Asked about shortening the keep-back distance to one block, she opined, "definitely a big thumbs down."
Janet Poppendieck, author of Free for All, told me:"/, too, love the indie food trucks, but I do not think they should bepermitted to undermine the National School Lunch Program that we are all working so hard to improve. What troubles meabout parking food trucks near schools is that these endearing vehicles inadvertently stigmatize the school lunch.
"In short, they give students with money an opportunity to flash their cash - or debit cards - thus demonstrating theiraffluence to their peers. If going out to the food truck becomes the 'cool' thing to do, the students left behind in thelunchroom are likely to be perceived as 'uncool. ' The old free lunch stigma that San Francisco has worked so hard toeliminate by removing a la carte meals from the cafeteria will rear its ugly head again."
Dana Woldow has been a school food advocate since 2002 and shares what she has learned at PEACHSF. org(http://peachsf.org). She supported the passage of San Francisco's existing ordinance keeping food trucks 1500 feetfrom public middle and high schools during the day. Follow her on Twitter @nestwife (http://twitter. com/nestwife).
(https://beyondchron. org/author/)More Posts (https://beyondchron.org/author/)
Translate
109

Exhibit 6
110

Journal of theAcademyofNutritionand Dietetics
Log in Q,
FROM THE ASSOCIATION ADA REPORT Ul
Position of the American Dietetic Association: Local Support forNutrition Integrity in Schools
https://doi. org/10. 1016/j. jada. 2005. 11
^feP lumX Metrics
Abstract
It is the position of the American Dietetic Association that the schools and the community have a
shared responsibility to provide all students with access to high-quality foods and school-based
nutrition services as an integral part of the total education program. Educational goals, including the
nutrition goals of the National School Lunch Program and the School Breakfast Program, should be
supported and extended through school district wellness policies that create overall school
environments that promote access to healthful school meals and physical activity and provide
learning experiences that enable students to develop lifelong healthful eating habits. The National
School Lunch and School Breakfast Programs are an important source of nutrients for school-agechildren, and especially for those of low-income status. The American Dietetic Association was
actively involved in the 2004 reauthorization of these programs, ensuring access through continued
funding, promoting nutrition education and physical activity to combat overweight and prevent
chronic disease, and promoting local wellness policies. The standards established for school meal
programs result in school meals that provide nutrients that meet dietary guidelines, but standards do
not apply to foods and beverages served and sold outside of the school meal. Labeled as
competitive foods by the US Department of Agriculture, there is a growing concern that standards
should be applied to food in the entire school environment. Legislation has mandated that all school
districts that participate in the US Depariiment of Agriculture's Child Nutrition Program develop and. """'""lent a local wetlness policy by the school year 2006-2007. Resources are available to assist
< >111

in the development ofwellness policies, and dietetics professionals can assist schools in develooingpolicies that meet nutrition integrity standards.
Position Statement
It is the position of the American Dietetic Association that the schools and the community have a
shared responsibility to provide all students with access to high-quality foods and school-based
nutrition services as an integral part of the total education program. Educational goals, including the
nutrition goals of the National School Lunch Program and the School Breakfast Program, should be
supported and extended through school district wellness policies that create overall school
environments that promote access to healthful school meals and physical activity and provide
learning experiences that enable students to develop lifelong healthful eating habits.
The American Dietetic Association (ADA) promotes access to food and nutrition programs for all
children and adolescents, regardless of age; sex; socioeconomic status; racial, ethnic, or linguistic
diversity; or health status (1). School meal programs are regarded as a safety net for ensuring that
children and adolescents at risk for poor nutritional intakes have access to a safe, adequate, and
nutritious food supply that promotes optimal physical, cognitive, and social growth and
development. The ADA also recognizes that school nutrition services is one of eight essential
components of the Coordinated School Health Program and as such can be used as a model for
collaborating with other staff from the component areas in the school setting to improve the school
health environment (2, 3).
Over 28 million children receive National School Lunch Program (NSLP) lunches daily, and
approximately 8. 9 million receive breakfasts in the School Breakfast Program (4). In a national study
of school health policies and programs (5), nearly all (99%) schools offered lunch to students and
87. 6% participated in the US Department of Agriculture's (USDA's) reimbursable NSLP. At that time,
about 67. 8% of the schools offered breakfast to students and 63. 8% participated in the
reimbursable School Breakfast Program.
School districts or independent schools that choose to participate in the school meal programsreceive cash subsidies from the USDA for each meal served under the NSLP, School Breakfast
Program, and/or Afterschool Snack educational or enrichment program. In addition, schools are
also entitled to receive commodity foods for each lunch served (4). A larger proportion of these
are served to children from low-income families, with 59. 1% of the total lunches Qnrl 82. ^0/- nf
al breakfasts served to free and reduced price eligible students (4). A nationally112

representative study of the NSLP and the School Breakfast Program, the School Nutrition Dietary
Assessment study, completed in school year 1991-1992, confirmed that school meals met a variety
of important nutrition goals, but the study also found that school lunches were not consistent with
Dietary Guidelines for Americans recommendations for total fat and saturated fat intake (6, 7, 8).
Subsequently, the USDA took action to improve the nutritional quality of school meals after passage
of the Healthy Meals for Healthy Americans Act by requiring school meals to adhere to the DietaryGuidelines for Americans, which includes limits on total fat and saturated fat and calls for diets
moderate in sodium (9). The nutrition standards established for school lunch and breakfast
programs are based on the 1995 Dietary Guidelines (10) pending promulgation of new regulations
in 2006 as required by Public Law 261-165 passed in June 30, 2004 (11). Current federal laws (12)also establish a standard for school lunches to provide one third and school breakfasts one fouri:h of
the 1989 Recommended Dietary Allowances (13) of protein, vitamin A, vitamin C, iron, calcium, and
food energy to be eligible for the NSLP and School Breakfast Program reimbursements (13).
The Dietary Guidelines for Americans 2005 have key recommendations for Americans ages 2 years
and older and includes recommendations for nutrition and physical activity specific for children and
adolescents (14). Incorporation of these recommendations will include an updating of the school
meal patterns.
In response to the increase in overweight and obesity, schools have been identified as one of the
sectors in society that could address this trend by creating health-promoting programs that help
children and adolescents adopt and maintain healthful eating and physical activity behaviors (2, 15,
16, 17, 18, 19, 20, 21). The prevalence of overweight among children 6 to 11 years of age doubled
and among those 12 to 17 years of age tripled between the late 1970s and 2000 (22). When viewed
as a public health issue with multiple factors, the need for addressing the problem by multiple
stakeholders is evident (20).
The ADA has been a key participant in collaborative efforts at the national level to address school
nutrition and the school environment (18, 23, 24), including issues of access, program integrity, and
healthy children. The ADA, as a steering committee member of the National Alliance of Nutrition
and Activity (23), was actively involved in the 2004 reauthorization of school nutrition programs,
ensuring that children and adolescents have increased access to these programs through continued
funding, promoting nutrition education and physical activity designed to combat overweight and
prevent chronic disease, and promoting local wellness policies to address the total school
iment.
< >113

Rationale for Position
The Child Nutrition and WIC [Special Supplemental Nutrition Program for Women, Infants, and
Children] Reauthorization Act of 2004 (25) requires local education agencies that participate in theUSDA's Child Nutrition Programs to develop local wellness policies beginning in school year 2006-
2007. The ADA, collaborating with the government, professional organizations, and the private
sector (15), advocated for this provision. Local wellness policies are required to include goals for
nutrition education, physical activity, nutrition guidelines for all foods available on school campusesduring the school day, school-based activities, and the development of a plan for measuringimplementation. The provision requires the involvement of parents, students, school food
authorities, school boards, school administrators, and the public in developing the local wellnesspolicy (25).
This wellness policy requirement for school districts provides an immediate and continuing
opportunity for dietetics professionals at the federal, state, and local levels, along with industry,media, researchers, parents, and families, to become involved in assisting school districts in
addressing healthful eating and physical activity through health-promoting changes in school
environments (20)
Nutrition Integrity in Schools
Nutrition integrity is defined by the School Nutrition Association as "A level of performance that
assures all foods and beverages available in schools are consistent with the Dietary Guidelines for
Americans, and, when combined with nutrition education, physical activity, and a healthful school
environment, contributes to enhanced learning and development of lifelong, healthful eating habits"
(26). Nutrition integrity can be used as a basis to guide the process of creating healthful eating andphysical activity in school environments.
The School Nutrition Association uses the nutrition integrity standard as a foundation for self-
assessment and a benchmarking tool for child nutrition program personnel. In addition, the School
Nutrition Association recognized the potential use of nutrition integrity to address the growingavailability of foods and beverages offered outside of the school meal programs (26). The effect of
increased sales of foods other than school meals was identified in a report to Congress by theUSDA that stated, "While studies indicate that the school meal programs do contribute to better
n and healthier eating behaviors for children who participate, competitive foods .. "^"-mi""
;- Titian integrity of the programs and discourage participation" (27).114

Food Choices at School and the Eating Environment
The shift in providing children with greater access to competitive foods has the potential to erode
the positive influences of school meals (27, 28). Studies consistently show that for many children,
meals and snacks consumed at school make a major contribution to many children's total daily
consumption of food and nutrients (6, 29).
Although children may understand that good nutrition and good health are related, this
understanding may not be reflected in their food choices and meal patterns while at school (19).
Food choices at school are influenced by the total eating environment in the schools, including
types of foods available throughout the school, nutrition information in the cafeteria and around the
school, nutrition education provided in the classroom, and nutrition promotions that reach families
(20, 24).
Children's eating habits are shaped by a variety of influences, and schools are a critical part of the
social environment that shapes these behaviors (2, 20, 30). Other environmental issues that need to
be considered in addition to competitive foods are the nutritional quality, variety, and acceptability of
program meals, meal scheduling, and nutrition education (31). A commitment to physical activity
and promotion of healthful eating are also factors contributing to an overall healthful school nutrition
environment. There are also issues of foods served outside of the school meal programs, at
classroom parties and other school events. The use of food as a reward for appropriate behavior in
the classroom is being addressed in some schools as part of school food policies (27, 32). Children
receive a mixed message when the value of healthful food choices is taught in the classroom and
students then encounter school vending machines and other venues with a wide assortment of
snack foods and beverages that are not based on meeting nutrition standards (27).
Nutrition Concerns Regarding School Meals and Competitive Foods
Although school meals have improved in nutritional quality since the initiation of the School Meal
Initiative in the mid-1990s and the implementation of meal pattern requirements (7, 27), nutrition
standards do not apply to the increasing sales of a la carte foods sold in the cafeteria and to foods
sold in snack bars, school stores, or vending machines, foods and beverages labeled as
competitive foods by the USDA (6, 27, 33, 34). These foods range from a second serving as part of
the school meal to foods that are sold in addition to or in place of reimbursable school meals.
Recent studies have documented these increases and changes in foods and beverages offered
outside of the school meal programs (35, 36, 37, 38, 39, 40, 41, 42, 43, 44).
< > 115

A USDA report to Congress concluded that competitive foods have lower nutritional quality thanschools meals and that these foods may contribute to overconsumption of food energy, dietary fat,saturated fat, added sugars, and sodium and underconsumption of calcium, fiber, fruits and
vegetables, and whole grains (27). According to USDA regulations 7 CFR §210. 11 (a) and 7 CFR
§220. 12(a), competitive foods are any foods sold in competition with school meal programs to
children in foodservice areas during the meal service periods (45, 46). This includes all other foods
offered for individual sale except for meals sen/ed through the USDA's school meal programs. The
USDA further defined foods of minimal nutritional value as a food that provides less than 5% of the
Recommended Dietary Allowances for each of the eight specified nutrients per 100 calories or perserving. This includes foods such as carbonated beverages, water ices, chewing gum, and certain
candies. Under current program regulations, the sale of foods of minimal nutritional value is
prohibited in the foodservice areas during the school meal periods. Regulations do not prohibit theirsale outside the foodservice area at any time during the school day.
The School Health Policies and Programs Study (5) reported that 43% of elementary, 73. 9% of
middle/junior high, and 98. 2% of senior high schools had a vending machine or a school store,
canteen, or snack bar where students could purchase food or beverages in 2000 (5). In more recent
Government Accountability Office surveys (44), using a nationally representative sample of schools,
almost all schools sold competitive foods to students, and over the last 5 years, the availability hasincreased in both middle schools and in a la carte lines. The Government Accountability Office
estimated that nearly nine of 10 schools offered competitive foods in 2003-2004, but middle and
high schools were more likely to sell these foods than elementary schools (44)
Vending Sales and "Pouring Rights" Issues
Schools and districts have come to rely on income from competitive food sales, including vendingmachines, primarily from carbonated beverages but also bottled water, to support discretionary
spending not related to school foodservice (5, 20, 33, 47, 48), and the practice of districts having
exclusive agreements with beverage or other companies for vending sales has increased in the last
few years (30, 40, 47, 49). Exclusive beverage contracts, granting a company exclusive rights to sellbeverages to students in schools (44), require schools to provide beverages through the contracted
company in other venues. In 2003-2004, nearly half of all schools had an exclusive beverage
contract, many covering 5 years or more, with some covering at least 10 years (44, 49). Many of the
"pouring rights" contracts have provisions to increase the percentage of profits schools receive
when sales volume increases, and this is a substantial incentive for schools to promote soft drink
nption by adding vending machines, increasing the times they are available, an-" "'"-l<et:n"
iducts to students (27, 44, 49). Districts may also receive significant signing inc< ^ 5 a ^ 116
other perks (44, 49, 50). In a Texas survey of school vending, beverage company and school
officials acknowledged that the true purpose of these contracts is to develop brand loyalty instudents at an early age with exclusive vending contracts allowing unlimited advertising access totheir students (49).
These practices of promoting consumption of carbonated and other beverages are of particular
concern because adolescents have been reported to decrease consumption of milk that has not
been replaced by other dairy-rich sources of calcium but rather by soft drinks and noncitrus juicesand drinks (36, 51, 52). The displacement of milk as a beverage that contributes essential nutrients
to children undergoing rapid growth may put girls at a higher risk for developing osteoporosis (35,53). Researchers also have explored the connection between consumption of sugar-sweetened
drinks and childhood obesity. Research has shown that each 1-oz decline in milk consumptionresulted in a 4. 2-oz increase in soft drink consumption and a net gain of 31 calories and a loss of 34
mg of calcium (54).
Because of the negative effect of soft drink consumption on meeting nutrient recommendations and
the possible health consequences, nutrition education messages targeted to children and/or parentsshould encourage limited consumption of soft drinks, including carbonated beverages (30, 35). Inaddition, policies that limit children's access to soft drinks and carbonated beverages at school
should be promoted (27, 30). Restrictions to competitive foods are advocated to promote healthful
eating and preventing overweight and obesity (5, 17, 20, 24, 30, 55).
Schools often sell competitive foods in or near the cafeteria during lunchtime, and students are
allowed to purchase these foods as their lunch or to supplement their lunch (44, 56). Revenues to
schools from competitive food sales in the school year 2003-2004 were substantial, and were used
to support foodservice operations and student activities (44). The Government Accountability Officestudy found that more than 30% of high schools generated the most revenue from competitive food
sales and raised more than $125, 000 per school in 2003-2004. A Texas survey in 2003 estimated
the total annual revenue statewide from vending contracts to be over $54 million. The amount peryear from vending contracts ranges from $2. 7 million per year in districts with over 100, 000 students
to $25, 000 per year in districts with fewer than 5, 000 students (49).
Across all competitive food sales, school foodservices generated more revenue than other school
groups, largely through a la carte sales, and they generally used this revenue to support overall
foodservice operations (44). A la carte sales in the school cafeteria are seen as a competitive tool
ool foodservice personnel to counteract sales by principals, school groups, stud<=>n+ s+orps
:», ler nonschool foodservice purchase points (47). Those school districts that hav / vr117

of free and reduced priced eligible students to paying students have a challenge to financiallymaintain their programs. However, although some a la carte sales in school foodservice may behealthful choices, others may have a negative effect on diet quality based on foods selected bystudents (56).
A study on availability of a la carte programs for young adolescents showed that students from
schools without an a la carte program reported intakes that met or came near to meeting dietaryrecommendations, whereas students exposed to a la carte programs reported lower intakes of fruits
and vegetables and a higher percentage of calories from total and saturated fat (39). Another studyshowed that adolescents selecting a la carte items in addition to or instead of school meals
increased intake of energy but decreased intake of certain nutrients (42).
Studies of school eating environments confirmed that there are competitive foods issues that need
to be addressed in school districts, individual schools, and/or states as a public policy issue (38, 40,43, 56). The practice of offering alternative foods and beverages as school meals to children at a
critical stage of growth and development undermines the purpose of the "Healthy School Meals for
Americans Act" (9), which requires school meals to meet the Dietary Guidelines for Americans (10).If a school's setting is intended to be a learning environment for children, the issue of healthful food
choices needs to be a priority.
Improving Quality, Variety, and Acceptability of School Meals
The School Health Policies and Programs 2000 study (5) reported that schools offer a variety of
foods to students as part of school meals, approximately 84% offered five or more foods containingwhole grains each week, 68% offered a choice between two or more fruits or types of 100% fruit
juice each day for lunch, 66% offered a choice between two or more entrees or main courses each
day for lunch, 62% offered spaghetti or other pasta, and 43% offered cheese pizza with no "ieat
topping (5).
Almost half (47%) of elementary schools, 63% of middle/junior high schools, and 76% of highschools offered pizza, hamburgers, or sandwiches a la carte; 42% of elementary schools, 57% of
middle/junior high schools, and almost 80% of high schools offered lettuce, vegetables, or bean
salads a la carte; 30% of elementary schools, 46% of middle/junior high schools, and 69% of highschools offered vegetables a la carte; and 30% of elementary schools, 46% of middle/junior highschools, and 74% of high schools offered Trench fries a la carte (5).
aspects of the school meal environment are subject to local control (31). The Uor>A
TIIC Research Service summarized potential improvements to the school meal < im118

and suggested approaches for improvement to increase NSLP quality and/or acceptance. Attractive
school meals with choices of menu items are more likely to be eaten. Encouraging consumption of
fruits, salad, and other vegetables served with meals are of particular importance because these
foods are underconsumed by children and are also the components of USDA school meals most
likely to be discarded uneaten by children as plate waste (31, 56). The "offer vs serve" provision has
enabled some schools to increase food consumption by incorporating more choices as part of the
school meal offerings (56). hlowever, in other schools, offer vs serve may be compounding the
problem of low fruit and vegetable consumption by students. Offer vs serve is required by federal
school lunch and breakfast regulations (57) in senior high schools participating in school meal
programs, and local school districts may choose to adopt the provision for lower grades (56). Offervs serve has become the standard in high schools and middle/junior high schools, and the majorityof elementary school also participate in the offer vs serve provision (56). The offer vs serve
provision in schools that use the food-based menu planning systems must take a full portion of at
least three of the five NSLP meal pattern items offered and three of the four food items for the
School Breakfast Program (56). Under the offer vs serve provision, students may refuse up to two ofthe five food items on the food-based school lunch menu and one of the four required food items on
the school breakfast menu. However, the meal must remain priced as a unit even with two or one
less food items.
Thus, students selecting a school breakfast under the food-based menu planning system could
select juice offered as a vegetable/fruit component and decline the milk. During lunch under the
food-based menu planning system, when many schools offer alternative beverages to milk, students
may refuse the milk that was part of the meal and purchase an alternate beverage and/or decline
the fruit and/or vegetables. Schools that use nutrient-based systems must select two menu items of
the foods offered in the NSLP. If the selected breakfast or lunch contains fewer food items than
allowed under the offer vs serve provision and menu planning system, the food items selected are
categorized as a la carte sales and cannot be claimed as a reimbursable school meal.
Meal Scheduling, Time to Eat, and Recess Scheduling
Another complicating issue in the competitive foods issue is the pressure to reduce the length ofmeal periods to allow more time for classroom subjects during the day (27). In many schools there
is simply not enough time allocated for all students to go to the school foodservice area during a
regularly scheduled lunch period. An adequate time to eat lunch around midday was identified as
one of the 10 factors associated with developing healthful eating habits in school children (58). InI studies, the average time for kindergarten to 12th-grade students to consume '.. ""'' WE-"
/ between 7 and 10 minutes, but other elements important to the dining experie < cli119

socializing, service, and clean-up activities added to the time used for lunch. Based on the
information from these time studies, it was determined that a reasonable lunch schedule allows
students at least 20 minutes to eat after they have been served their meals and arrive at the table
with their food (59). However, in some cases this allocation may not be feasible and would be a
challenge to address. Based on recommendations from a task force report on student nutrition and
physical activity, one state legislature mandated that all students in elementary schools have 20
minutes to eat lunch once served (60).
Several studies report that meals scheduled before recess encourage students to rush meals (31).
Over 40% of elementary schools reported scheduling recess immediately after lunch (5). A study
was conducted to determine the impact that scheduling recess before and after the lunch period
had on nutrient consumption and plate waste for students in grades 3, 4, and 5 (61). When recess
was scheduled before lunch, school children consumed significantly more food and had less plate
waste than children who had recess after lunch. Also, when recess was scheduled before lunch,
children consumed more calories and total nutrients, including calcium, vitamin A, and iron, than
when recess was after lunch (61).
Other Nutrition Integrity Issues that Affect the School Environment
Other nutrition integrity aspects of the school environment include the use of food as a behavioral
award for children, foods provided at school parties, food used for fundraisers, and food choices in
after-school feedings and other school events (2, 3, 14, 18, 19, 20, 23, 32, 39, 51, 62).
Opportunities for physical education and physical exercise are also part of the school environment
that support and promote learning experiences that enable students to develop lifelong, healthful
habits and need to be assessed and promoted (2, 3, 18, 19, 20, 23, 24, 62). Developmentally,
elementary children need a protected environment, whereas older students need to learn to make
choices. Comprehensive, sequential nutrition education using the classroom and the lunchroom can
reinforce healthful eating behaviors (3, 18, 19, 20, 32).
In the current school environment, children are offered food as a reward for good behavior. Often
these foods have little or no nutritional value but are easy, inexpensive, and can bring about short-
term behavior change (18, 19, 20, 24, 32, 38, 39, 51, 62). The disadvantages of these rewards are
many, including undermining nutrition education lessons; encouraging overconsumption of foods
high in added sugar and fat; and teaching using food as a reward, not as an intrinsic motivator (32).
These issues need to be addressed in promoting a healthful school environment.
ifits of and Access to the School Breakfast Program< >
120

Most US students have access to the NSLP, but the number of school breakfasts served per day inschools under the School Breakfast Program is only 31% of the number of lunches served in the
NSLP (4). Not all schools offer the School Breakfast Program, even though the program is
permanently authorized and is available free or at a reduced price for income-eligible students. The
School Breakfast Program is considered an underutilized program in some schools, which is
considered an access problem.
In a report evaluating the impact of school nutrition programs using a nationally representative data
set, researchers concluded that the availability of the School Breakfast Program had beneficial
effects for children (63). Children who had the School Breakfast Program available consumed a
better overall diet, consumed a lower percentage of calories from fat, were less likely to have a low
intake of magnesium, and were less likely to have low serum levels of vitamin C and folate (63).Many of the benefits were concentrated at the middle and upper parts of the income distribution,
and the researchers concluded that these results were based on the substitution aspect of the
School Breakfast Program. School breakfasts were of higher nutritional quality than those
consumed elsewhere. The data for this study included nutritional information based on actual serum
levels rather than dietary recall information and an explicit and transparent identification strategy touncover the causal impacts of the programs (63).
Congress authorized the USDA/Food and Nutrition Service to implement and evaluate a 3-yearuniversal breakfast study of elementary schools in six school districts representing a range ofdemographic and economic characteristics (64). In this study, universal breakfasts were offered to
all elementary students without regard to household income. The specific question the pilot studyaddressed was, "Would an increase in the School Breakfast Program by students in elementaryschools offering universal free breakfasts result in improved dietary intakes and/or measures of
academic performance?"
The availability of universal free school breakfast caused a substantial increase in school breakfast
participation (64). School breakfast participation almost doubled in the first year, and this level was
maintained in the second and third year. In control schools, school breakfast participation onlyincreased slightly. The impact of the school breakfast program varied by treatment school, but
breakfast participation was greater in treatment schools with classroom breakfast. The average foodand nutrient intakes of treatment and control school students at breakfast over the course of the
day, as determined by food recalls during the first year of the study, were essentially the same. The
rate of breakfast skipping in treatment and control breakfast elementary school students was similar
v (4%). The availability of universal school breakfast shifted the source of break' - orr
or elsewhere) to school in treatment schools (64).121

Based on these study results, the availability of free universal breakfast increased participation but
had little impact on other outcome measures, including academic achievement test scores,
attendance, tardiness, health and discipline, and daily food and nutrient intakes (64). The USDA
noted that these test results do not negate the importance of eating breakfast and that these
findings suggested simply offering free school breakfast to all elementary school students would
not, on average, be expected to improve academic or behavior outcomes beyond what occurs in the
schools already offering the school breakfast program (64).
The USDA/Food and Nutrition Service reports that a larger proportion of school meals are served to
children from low-income families (4). However, there is an issue of access to the school breakfast
program based on the ratio of free and reduced price eligible students who eat school lunch
compared with those who eat school breakfast. The Food Research Action Center publishes an
annual School Breakfast Scorecard based on the previous school year's participation data (65). In
the 2004 report, the percentage of schools offering school lunch and also operating school
breakfast was 79. 4% (2003-2004) (65). That left 21. 6% schools with no school breakfast program.
In seven states, almost all (97%) schools with the lunch program also had the breakfast program;
and in six states, there were fewer than 60% of schools that had both lunch and breakfast
programs. However, having a school breakfast program does not ensure that children will eat
breakfast at school. Nationally the ratio of the number of children who ate free or reduced-price
breakfasts to those who also ate school lunches was 43:100. In 12 states, the ratio was greater than
50:100; and in seven states, the ratio was less than 33:100 (65). Based on numbers of low-income
students who eat lunch, the Food Research Action Center estimates that there were 9.4 million low-
income children who could have been participating in school breakfast daily during 2003-2004 but
who did not.
In the Food Research Action Center report, when state agencies were asked to list the most
effective strategies for increasing school breakfast participation, 64. 3% of those responding listed
universal free breakfast and 50% listed breakfast in the classroom (65). This has been particularly
effective in school districts that have a high percentage of free and reduced price eligible students.
The Food Research Action Center concluded that offering some form of universal free breakfast is
the one way that states, school districts, and schools can expand school breakfast to ensure that
every child starts the day with breakfast (65). Schools that offer breakfast in the classroom have
seen significant increases in breakfast participation, and in a universal free program, almost all
children participate. Schools that offer nonuniversal free breakfast in the classroom or other
tive breakfast service have discovered that paid and reduced price eligible chilc ill;
)ate at a higher level in an alternative breakfast program than in a traditional pre \ in 122

which breakfast is served in the cafeteria before school. The numbers of paid and reduced pricestudents participating will be lower, but not the number of free students participating when
compared with a universal free breakfast. This is especially important because many children, and
particularly adolescents, reported skipping breakfast. In a study offourth-grade children from urban,
suburban, and rural schools (66), 20% reported skipping breakfast and/or lunch at least three times
per week.
In a study of middle school adolescents in grades six to eight, students reported skipping breakfastan average of 28% of the time and did not eat anything until lunch (67). A recent review and
summary of the literature on breakfast consumption and nutritional adequacy, body weight, and
academic performance in children and adolescents concluded that breakfast consumption is
associated with the health and well-being of children and adolescents (68). The investigators
therefore promoted the consumption of a healthful breakfast, at home or at school on a daily basis.For children who tend to skip breakfast because of a lack of time in the morning, reviewers
advocated that students eat breakfast either at school or on their way to school and that health
practitioners who work with children should encourage parents to investigate the availability of
school feeding programs and encourage breakfast consumption in groups who may be more likelyto skip breakfast (68). Because the school breakfast program is an entitlement program, as is the
school lunch program, schools with 40% of free and reduced price eligible students who eat school
lunch are eligible for severe need funding, which will offset program costs (69).
Efforts to Change School Environments Are Increasing
Concerned with these issues, several action groups have developed resources and organizedefforts in which interested public and private organizations and individuals can participate inpromoting healthful school environments that promote students' learning (15, 16, 18, 19, 23, 30,
62). The activities of the National Alliance of Nutrition and Activity is one example of how several
organizations collaborated to promote positive changes in school nutrition environments by
supporting legislative actions that not only addressed access to programs and nutrition education
but also resulted in the Congressional requirement for local wellness policies (23). Figure 1,
resources for changing school nutrition environment, provides a summary of selected materials and
references including Web sites developed by government agencies and organizations.
^Figure thumbnail gr1
Resources for changing school nutrition environment. < > 123

View Large Image | Download (PPT)
State Legislation and Other State Efforts
Momentum is increasing for addressing school-based nutrition issues legislatively. At the beginning
of 2005, several states, notably Arkansas, California, North Carolina, Michigan, and Texas, had
introduced and passed school-based state legislative interventions or policies at the state level to
address the growing concern for the obesity epidemic (79). According to the Government
Accountability Office (44), 28 states had taken legislative initiatives to restrict competitive foods
beyond USDA regulations as of April 2005. Since that time, other states not identified in that report
have passed relevant legislation indicating the dynamic nature of these activities.
By September 2005, over 200 bills addressing some form of school-based nutrition legislation had
been introduced nationwide (80). Ongoing legislation initiatives are tracked and reported at a
Centers for Disease Control and Prevention searchable Web site database (81). In addition, a
growing number of state agencies and school nutrition associations are also addressing state
legislative mandates and the local wellness policies.
Local Wellness Policies
As a result of the requirement that school districts develop and implement a local wellness policy by
the beginning of the 2006-2007 school year, the USDA has formed an interagency working group
with representatives from the USDA/Food and Nutrition Service, US Department of Education-Safe
and Drug Free Schools, Centers for Disease Control and Prevention's Division of School and
Adolescent hlealth, and the National Food Service Management Institute to review and compile
Web-based resources for schools and communities. The USDA's local wellness policy Web site (82)
was placed on the Team Nutrition Web site.
Other organizations, the National Alliance of Nutrition and Activity and the School Nutrition
Association, also developed Web-based wellness documents. The National Alliance of Nutrition and
Activity, representing over 300 organizations, developed Model School Wellness Policies (83), and
the School Nutrition Association developed Local School Wellness Policy Guidelines (84). The
Action for Healthy Kids has an interactive wellness policy tool Web site (85) that is searchable by
state and provides suggested language for the required components of a school district's wellness
policy. It also includes other desired elements such as the use of food as rewards that could be
sed by wetlness policies. This is a valuable resource that also provides model I; ge
ss policy components. 124

Developing Local Wellness Policies
There are numerous resources available as well as strategies for individuals and/or groups to use in
developing local wellness policies and promoting healthful school environments that will supportaccess to healthful school meals and improve student nutrition and physical activity. Because of the
influence of federal and state legislation, each school district may have a different set of
requirements that must be met in addition to the federal requirements. There are evolving resources
available for use by states and local communities. Figure 2, Local Wellness Policy Resources,
provides a sample of readily available Web resources that may be particularly useful in developinglocal wellness policies.
^Figure thumbnail gr2
Figure 2 Local wellness policy resources.
View Large Image | Download (PPT)
When considering the development of a local wellness policy, access to school meals and
scheduling of adequate time for lunch could be included as part of a policy. Ensuring that schools
have breakfast programs and exploring alternate ways to serve breakfasts that would reach more
students at the beginning of the school day should also be considered. This position paper has
provided many references and suggested actions to promote a healthful school environment that
could be used by those involved in helping school districts to develop a local wellness policy
The Role Of Dietetics Professionals
School districts are required to develop and implement local wellness policies in the school year
beginning after June 30, 2006. ADA members and dietetics professionals are uniquely qualified to
engage in helping schools in their communities to develop local policies based on nutrition integritystandards that will reflect the needs of the community. Directly involved in these efforts are
members of the School Nutrition Services dietetics practice group, with over 900 ADA members.
These members include federal and state governments, school districts and school cafeterias,
consultants, dietetics and/or nutrition educators, and industry representatives. Dietetics
sionals can provide support to those who work at various levels of the School N ' "" i
ms or allied areas, or who have an interest in the nutrition integrity of school me ^ gr. ^125

and the school nutrition environment. Dietetics professionals with school-aged children can be
particularly influential in efforts to affect environmental changes in the schools attended by theirchildren.
ADA members and dietetics professionals are encouraged to be proactive and to use their skills andf
knowledge to promote nutrition integrity in schools and to assist local school boards, principals,
teachers, foodservice personnel, parent and teacher organizations, other health care professionals,
and community members in the development of local wellness policies and programs. 70, 71, 72, 73,74, 75, 76, 77, 78, 86
ADA Position adopted by the hlouse of Delegates on October 4, 1999, and reaffirmed
on May 24, 2004. This position will be in effect until December 31, 2009. ADA
authorizes republication of the position, in its entirety, provided full and proper credit
is given. Requests to use portions of the position must be directed to ADA
Headquarters at 800/877-1600, ext 4835 or ppapers@eatright. org
Author: VMar} B. Pilant, PhD, RD (Office of School Food Services and Nutrition,
South Carolina Department of Education, Columbia, SC).
Reviewers: Lois Chait, MBA, MA, RD (Three Village Central School District, Stony
Brook, NY); Sharon Denny, MS, RD (ADA Knowledge Center, Chicago, IL); Dietetic
Technicians in Practice dietetic practice group (Susan Colavito, DTR , Warren
Hospital, Phillipsburg, NJ); School Nutrition Services dietetic practice group (Ruth W.
Gordon, MEd, RD); Hunger and Environmental dietetic practice group (Beth K.
Thorson, MS, RD, Leander Independent School District, TX); Carol Longley, RD,
MSW (Rock Island Schools, Rock Island, IL); Management in Food and Nutrition
Systems dietetic practice group (Sarabeth Kayton, MS, RD, Chicago, IL); Esther
Myers, PhD, RD, FADA (ADA Scientific Affairs, Chicago, IL); Victoria A. Warren-
Mears, PhD, RD (Oregon Health and Science University, Portland, OR); Jennifer A.
Weber, MPH, RD (ADA Government Affairs, Washington, DC); Yibo Wood, PhD (US
nepartment of Agriculture, Alexandria, VA).
< > 126

Association Positions Committee Workgroup: Ida Laquatra, PhD, RD (chair); M
Patricia Fuhrman, MS, RD, FADA; Tami Cline, MS, RD, FADA.
References
1. American Dietetic Association
Position of the American Dietetic Association.
J Am DietAssoc. 2003; 103: 887-893
View in Article /\
Google Scholar
2. Wechsler H. . McKenna M. L. . Lee S. M. . Dietz W. H.
The role of schools in preventing childhood obesity.
J NatlAssoc State Boards Educ. 2004; 5: 4-12
View in Article /\
Google Scholar
3. American Dietetic Association
Position of the American Dietetic Association, Society for Nutrition Education, andAmerican School Food Service Association-Nutrition services.
J Am DietAssoc. 2003; 103: 505-514
View in Article /\
Google Scholar
4. US Department of Agriculture School Meals. Available at: http://www. fns. usda. gov/cnd/.Accessed March 25, 2005.
View in Article /\
Google Scholar
< >127

5. Wechsler H. . Brener N D. . Kuester S. . Miller C.
Food service and foods and beverages available at school.
J Sch Health. 2001; 71: 313-324
View in Article /\
Google Scholar
6. Gleason P. . Suitor C.
Children's Diets in the Mid-1990s. Dietary Intake and Its Relationship with School Meal
Participation. US Department of Agriculture, Food and Nutrition Service, Office of Analysis,Nutrition, and Evaluation, Alexandria, VA2001
View in Article /\
Google Scholar
7. Fox M. K. . Crepinsek M. K. . Connor P. . Battaglia M.
School Nutrition Dietary Assessment Study-11 Summary of Findings. US Department of
Agriculture, Food and Nutrition Service, Alexandria, VA2001
View in Article /\
Google Scholar
8. Un B-H, Guthrie J, Frazao L. American children's diets not making the grade. Food Review.2001:24:8-17. Available at:
http://www. ers. usda. gov/publications/FoodReview/May2001/FRV24l2b. pdf. Accessed August30, 2005.
View in Article /\
Google Scholar
9. Healthy Meals for Healthy Americans 106. Available at: http://www4. law. cornell. edu/usc-
cgi/get_external. cgi?type=pubL&target=103-448. Accessed September 19, 2005.
View in Article /\
)ogle Scholar
< >128

10. US Department of Agriculture, US Department of Health and Human Services. DietaryGuidelines for Americans. 4th ed. Available at:
http://www.nal. usda.gov/fnic/dga/dga95/cover.html. Accessed August 30, 2005.
View in Article /\
Google Scholar
11. August 30, 2005. Child Nutrition and WIC Reauthorization Act of 2004. Pub L No. 103.
Available at: http://www. fns. usda. gov/cnd/Governance/Legislation/PL_108-265. pdf. Accessed
April 5, 2005.
View in Article /\
Google Scholar
12. Healthy Meals for Healthy Americans Act. 42 USC 13 §1758 (2005). Available at:
http://www.law.cornell. edu/uscode/html/uscode42/usc_sec_42_00001758-000-.html Accessed
April 5, 2005.
View in Article /\
Google Scholar
13. Food and Nutrition Board, National Research Council
Recommended Dietary Allowances. 10th ed. National Academy Press, Washington, DC1989
View in Article /\
Google Scholar
14 Academy Press; 1989. US Department of Health and Human Services, US Department of
Agriculture. Dietary Guidelines for American 2005. Available at:
http://www. health. gov/dietaryguidelines/dga2005/document. Accessed April 5, 2005.
View in Article /\
Google Scholar
< > 129

15. Black JD. Opening Remarks, Local Wellness Policy Stakeholders meeting. Available at:
http://www. eatright. org/Public/Files/Opening_remarks_at_Jan_12_2005_stakeholders_meeting.doc. Accessed March 25, 2005.
View in Article /\
Google Scholar
16 US Department of Health and Human Services. The Surgeon General's Call to Action to
Prevent and Decrease Overweight and Obesity. Rockville, MD: US Department of Health and
Human Services, Public Health Service, Office of Surgeon General; 2001. Available at:
http://www. surgeongeneral. gov/topics/obesity/. Accessed August 30, 2005.
View in Article /\
Google Scholar
17. Nestle M. . Jacobson M. F.
Halting the obesity epidemic.
Public Health Rep. 2000; 115: 12-24
View in Article /\
Google Scholar
18. Action for Healthy Kids Web site. Available at: http://www. actionforhealthykids. org/ AccessedAugust 3, 2005.
View in Article /\
Google Scholar
19 US Department of Agriculture. Changing the Scene: Improving the School Nutrition
Environment. Available at: http://www. fns. usda. gov/tn/Resources/changing. html. Accessed April5, 2005.
View in Article /\
Google Scholar
< >130

20 Food and Nutrition Board, Institute of Medicine, Committee on Prevention of Obesity of Children
and Youth
Schools.
in: Koplan J. P. Liverman C. T. Kraak V. l. Preventing Childhood Obesity: Health in the Balance.
National Academy Press, Washington, DC2005: 237-284
View in Article /\
Google Scholar
21. Center for Health and Health Care in Schools. Childhood overweight: What the research tells
us. School of Public Health and Health Services. Available at:
http://www.healthinschools.org/sh/obesityfs.asp. Accessed August 30, 2005.
View in Article /\
Google Scholar
22. Ogden C. L. . Flegal K. M. . Carroll M. D. . Johnson C. L.
Prevalence and trends in overweight among US children and adolescents, 1999-2000.
JAMA. 2002; 288: 1728-1732
View in Article ^
Google Scholar
23. Center for Science in the Public Interest. National Alliance for Nutrition and Activity. Available at:
http://www.cspinet.org/nutritionpolicy/nana.html. Accessed April 5, 2005
View in Article /\
Google Scholar
24. US Department of Health and Human Services. Healthy People 2010. Understanding and
Improving Health. 2nd ed. Washington, DC: US Government Printing Office; 2000. Available at:
http://www.health.gov/healthypeople/DocumenVtableofcontents.htm#volume1. Accessed March
25, 2005.
iw in Article /\
)ogle Scholar < > 131
25. Child Nutrition and WIC Reauthorization Act of 2004. Pub L No. 204 (2004). Available at:http://www. fns. usda. gov/tn/Healthy/108-265. pdf. Accessed April 5, 2005.
View in Article /\
Google Scholar
26. School Nutrition Association. Nutrition Integrity in School Food and Nutrition Programs 2003.Available at: http://www. asfsa. org/lndex. aspx?id=1075. Accessed April 5, 2005.
View in Article /\
Google Scholar
27 US Department of Agriculture. Foods sold in competition with USDA school meal programs: Areport to Congress. Available at:
http://www. fns. usda. gov/cnd/lunch/CompetitiveFoods/report_congress. htm. Accessed April 5,2005.
View in Article /\
Google Scholar
28. Harnack L. . Snyder P. . Story M. . Holliday R. . Lytle L.Availability of a la carte food items in junior and senior high schools.
J Am DietAssoc. 2000; 100: 701-703
View in Article ^
Google Scholar
29. Gleason P. . Suitor C
Eating at school.
AmJAgEcon. 2003; 85: 1047-1061
View in Article /\
Google Scholar
: =: nerican Academy of Pediatrics < >132

Policy statement.
Pediatrics. 2004; 113: 152-154
View in Article /\
Google Scholar
31 Ralston K, Buzby J, Guthrie J. A Healthy School Meal Environment. United States Department
of Agriculture. Economic Research Service. Food Assistance and Nutrition Research Report
Number 34-5. Available at: http://www. ers. usda. gov/publications/fanrr34/fanrr34-5/fanrr34-5. pdf.Accessed August 30, 2005. Oregon Nutrition Standards in the
View in Article /\
Google Scholar
32. Oregon Nutrition Standards in the School Environment. Available at:
http://www. ode. state. or. us/semces/nutrition/nslp/foodchoices/nutrition_standards. pdf AccessedAugust 30, 2005.
View in Article /\
Google Scholar
33. US General Accounting Office
Public Education. US General Accounting Office, Washington, DC2000
View in Article /\
Google Scholar
34 Gleason P. . Suitor C.
Changes in Children's Diets. US Department of Agriculture, Washington, DC2001
View in Article /\
Google Scholar
^ Rowman S.A.
.verage choices of young females. < > 133

J Am DietAssoc. 2002; 102: 1234-1239
View in Article /\
Google Scholar
36. Cavadini C. . Seiga-Riz A. M. . Popkin B. M.
US adolescent food intake trends from 1965 to 1996.
Arch Dis Child. 2000; 83: 18-24
View in Article /\
Google Scholar
37 French S.A. . Un B. -H. . Guthrie J. F.
National trends in soft drink consumption among children and adolescents age 6-17years.
J Am DietAssoc. 2003; 103: 1326-1331
View in Article /\
Google Scholar
38. French S.A. . Story M. . Fulkerson J.A. . Gerlach A. F.
Food environment in secondary schools.
Am J Public Health. 2003; 93: 1161-1167
View in Article /\
Google Scholar
39. Kubik M.Y. . Lytle L.A. . Hannan P.J. . Perry C. L. . Story M.
The association of the school food environment with dietary behaviors of youngadolescents.
Am J Public Health. 2003; 93: 1168-1173
View in Article /\
Google Scholar
lantV.B. . Skinner J D. < >134

Availability of competitive foods and beverages during lunch in middle schools.
Top Clin Nutr. 2004; 19: 20-27
View in Article ^\
Google Scholar
41 Rampersaud G. C. . Bailey L.B. . Kauwell G. P.A.
National survey beverage consumption data for children and adolescents indicated the
need to encourage a shift toward more nutritive beverages.
J Am DietAssoc. 2003; 103: 97-100
View in Article /\
Google Scholar
42. Templeton S. B. . Marlette M. A. . Panemangalore M.
Competitive foods increase the intake of energy and decrease the intake of certain
nutrients by adolescents consuming school lunch.
J Am DietAssoc. 2005; 105: 215-220
View in Article /\
Google Scholar
43. Wildey M. B. . Pampalone S.Z. . Pelletier R. L. . Zive M. M. . Elder J. P. . Sallis J.F
Fat and sugar levels are high in snacks purchased from student stores in middle
schools.
J Am DietAssoc. 2000; 100: 319-322
View in Article /\
Google Scholar
44. US Government Accountability Office. School meal programs: Competitive foods are widely
available and generate substantial revenues. Report to Congressional Requesters GAO-05-
563. Available at: http://www. gao. gov/new. items/d05563. pdf. Accessed September 9, 2005.
iw in Article /\
)ogle Scholar < >135

45. National School Lunch Program. 210. 11 (2005). Available at:
http://www. fns. usda. gov/cnd/Governance/regulations/05-7_CFR_Part_210. pdf. Accessed April5, 2005.
View in Article /\
Google Scholar
46. School Breakfast Program. 7 CFR220. 12 (2005). Available at:
http://www. fns. usda. gov/cnd/Governance/regulations/05-7_CFR_Part_220. pdf. Accessed April5, 2005
View in Article /\
Google Scholar
47. American School Food Service Association
Little Big Fact Book. American School Food Service Association, Alexandria, VA2003
View in Article /\
Google Scholar
48. Probart C. . McDonnell E. . Weirich E. . Hartman T. . Bailey-Davis L. . Prabhakher VCompetitive foods available in Pennsylvania public high schools.
J Am DietAssoc. 2005; 105: 1243-1249
View in Article /\
Google Scholar
49. Square Meals: Nourishing Children's Bodies and Minds. School Vending Contract Survey.Available at:
http://www. squaremeals. org/fn/render/channel/items/0, 1249, 2348_2515 0 0, 00. html. Accessed
September 12, 2005.
View in Article /\
Google Scholar
< > 136

50. Moyers B. Society and community: Transcript: Buying access [transcript]. Public BroadcastingService. October 18, 2002. Available at:
http://www. pbs. org/now/transcript/transcript_schools. html. Accessed April 5, 2005.
View in Article /\
Google Scholar
51. Lytle L.A. . Seifert S. . Greenstein J. . McGovern P.
How do children's eating patterns and food choices change over time? Results from a
cohort study.
Am J Health Promotion. 2000; 14: 222-228
View in Article /\
Google Scholar
52. Lin B-H, Ralston K. Competitive foods: Soft drinks vs milk. US Department of Agriculture,
Economic Research Service, Food Assistance and Nutrition Research Report Number 34-7.
July 2003. Available at: http://www. ers. usda. gov/publications/fanrr34/fanrr34-7/fanrr34-7. pdf.Accessed August 30, 2005.
View in Article /\
Google Scholar
53. Ballew C. . Kuester S. . Gillespie C.
Beverage choices affect adequacy of children's nutrient intakes.
Arch Pediatr Adolesc Med. 2000; 154: 1148-1152
View in Article /\
Google Scholar
54 YenS. -LinB. -H.
Beverage consumption among U.S. children and adolescents.
EurRevAgric Econ. 2002; 29: 85-103
aw in Article /\.
)ogle Scholar < >137

55. Kramer-Atwood J. L. . Dwyer J. . Hoelscher D. M. . Nicklas T. A. . Johnson R. K. .
Schulz G. K.
Fostering healthy food consumption in schools.
J Am Diet Assoc. 2002; 102: 1228-1233
View in Article /\
Google Scholar
56. Buzby JC, Guthrie JF. Plate waste study in school nutrition programs: A final report. US
Department of Agriculture, Economic Research Service, Food Assistance and Nutrition
Research Report Number E-FAN-02-009. March 2002. Available at:
http://www.ers. usda.gov/publications/efan02009. Accessed August 30, 2005.
View in Article /\
Google Scholar
57. US Department of Agriculture. Menu Planner for Healthy School Meals. 2001. Available at:
http://schoolmeals. nal. usda. gov/Recipes/menuplan/menuplan. html. Accessed January 12,2004.
View in Article /\
Google Scholar
58. US Department of Agriculture, Food and Nutrition Service Web site. Prescription for change:
Ten keys to promote healthy eating in schools. Available at:
http://www. fns. usda. gov/tn/Healthy/healthyeatingchallenge. html. Accessed October 28, 2005.
View in Article /\
Google Scholar
59. Conklin MT, Lambert LG, Anderson JB. How long does it take students to eat lunch? A
summary of three studies. J Child Nutr Manage. Available at:
http://docs.schoolnutrition.org/newsroom/jcnm/02spring/conklin/. Accessed March 25, 2005.
iw in Article /\
< > 138

Google Scholar
60. Student Health and Fitness Act 59-10- 350. Available at: http://www. scstatehouse. net/cgi-bin/web_bh10.exe?bill1=3499&session=116. Accessed October 28, 2005.
View in Article /\
Google Scholar
61. Bergman EA, Buergel NS, Englund TF, Femrite A. The relationships of meal and recess
schedules to plate waste in elementary schools. J Child Nutr Manage. Available at:
http://docs. schoolnutrition. org/newsroom/jcnm/04fall/bergman/bergman2. asp. Accessed August30, 2005.
View in Article /\
Google Scholar
62. National Association of State Boards of Education
Fit, Healthy, and Ready to Learn: A School Health Policy Guide. Part 1 Physical Activity,Healthy Eating, and Tobacco-use Prevention. National Association of State Boards of
Education, Alexandria, VA2000
View in Article /\
Google Scholar
63. Bhattacharya J, Currie J, Haider SJ. Evaluating the impact of school nutrition programs: Final
report. Economic Research Service. E-FAN-04-008. July 2004. Available at:
http://www. ers. usda. gov/publications/efan04008/. Accessed August 30, 2005.
View in Article /\
Google Scholar
64. US Department of Agriculture, Food and Nutrition Service. Evaluation of the Universal School
Breakfast Program Pilot Project. Executive Summary. Available at:
p://www. fns. usda.gov/oane/MENU/Published/CNP/FILES/SBPPExecSum. pdf. A-ser1
:- igust 30, 2005. ^ ^139

View in Article /\
Google Scholar
65. Food Research Action Center School Breakfast Scorecard: 2004, Status Report on the School
Breakfast Program. Available at: http://www. frac. org/html/news/. Accessed March 25, 2005.
View in Article /\
Google Scholar
66. Gross S. M. . BronnerY. . Welch C. . Dewberry-Moore N . Paige D. M.
Breakfast and lunch skipping patterns among fourth-grade children from selected public
schools in urban, suburban, and rural Maryland.
J Am DietAssoc. 2004; 104: 420-423
View in Article /\
Google Scholar
67. PilantV. B.
Calcium Intake and Breakfast Patterns of Middle School Children.
in: In: Dissertation: Factors Influencing Calcium Intake and Foodservice Satisfaction in South
Carolina Middle School Children. University of Tennessee, Knoxvitle, TN2004: 83-109
View in Article /\
Google Scholar
68. Rampersaud G. C. . Pereira M. A. . Girand B. L. . Adams J. »Metzl J. D.
Breakfast habits, nutritional status, body weight, and academic performance in children
and adolescents.
J Am DietAssoc. 2005; 105: 743-760
View in Article /\
Google Scholar
lild Nutrition and WIC Reauthorization Act of 2004. Pub L No. 201 (2004). Avail?hlQ Qt:
:r~ p://www. fns. usda. gov/cnd/Governance/Legislation/PL_108-265. pdf. Accessed y ^ ,2140

View in Article /\
Googte Scholar
70. US Department of Agriculture. Team Nutrition. Available at:
http://www.fns.usda.gov/tn/about. html. Accessed August 30, 2005.
View in Article /\
Google Scholar
71. US Department of Agriculture. Team Nutrition: Resource Library. Available at:
http://teamnutrition.usda.gov/library.html. Accessed August 30, 2005
View in Article /\
Google Scholar
72. US Department of Agriculture. HealthierUS School Challenge: Criteria and Instructions for
Elementary Schools. Available at:
http://www. fns. usda. gov/tn/HealthierUS/criteriaJnstructions. pdf. Accessed August 30, 2005.
View in Article /\
Google Scholar
73. US Department of Agriculture. Team Nutrition. School Success Stories. Available at:
http://teamnutrition. usda. gov/success. html. Accessed August 30, 2005
View in Article /\
Google Scholar
74 US Department of Agriculture, US Department of Health and Human Services. Making ItHappen: School Nutrition Success Stories. Available at:
http://www. fns. usda. gov/tn/Resources/makingithappen. html. Accessed August 30, 2005.
View in Article /\
)ogle Scholar
< > 141
75. National Center for Chronic Disease and Health Promotion. Healthy Schools! Coordinated
School Health Program. Division of Adolescent and School Health. Available at:
http://www. cdc. gov/HealthyYouth/CSHP/. Accessed August 30, 2005.
View in Article /\
Google Scholar
76. US Department of hlealth and Human Services, Centers for Disease Control and Prevention.
Healthy Youth! School Health Index. Division of School and Adolescent Health. Available at:
http://apps. nccd. cdc. gov/SHI/PaperFormat/Modules. aspx. Accessed August 30, 2005.
View in Article /\
Google Scholar
77. Center for Science in the Public Interest. School Foods Tool Kit: A Guide to Improving SchoolFoods and Beverages. Washington, DC: Center for Science in the Public Interest; 2004.
Available at: http://www. cspinet. org/schoolfoodkiVschool_foods_kit_part1. pdf/. Accessed April5, 2005.
View in Article /\
Google Scholar
78. Vallianatos M. Healthy school food policies: A checklist. A working paper of the Center for Food
and Justice, Urban and Environmental Policy Institute. Available at:
http://departments. oxy. edu/uepi/cfj/resources/healthy_school_food_policies_05. pdf. AccessedNovember 7, 2005.
View in Article /\
Google Scholar
79 Bogden J.
State Innovations.
J NatlAssoc State Boards Educ. 2004; 5: 49-51
. _ 3w in Article /\
.
)ogle Scholar < > 142

80. American Public Health Association. Schools taking center stage in battle against childhood
obesity. The Nation's Health. September 5, 2005. Available at:
http://www. asfsa. org/Article. aspx?SMDOCID=bhsgml _ 2005 _ 09 _ 05 23425 891442171-
0354-KEYWORD. Missing&SMContentSet=0. Accessed September 12, 2005.
View in Article /\
Google Scholar
81 Centers for Disease Control and Prevention, National Center for Chronic Disease Prevention
and Health Promotion. Nutrition and Physical Activity: State Legislative Information. Available
at: http://apps. nccd. cdc. gov/DNPALeg/. Accessed April 5, 2005.
View in Article /\
Google Scholar
82. US Department of Agriculture, Food and Nutrition Service. Local Wellness Policy. Available at:
http://teamnutrition. usda. gov/Healthy/wellnesspolicy. html/. Accessed August 30, 2005
View in Article /\
Google Scholar
83. National Alliance of Nutrition and Activity. Model School Wellness Policies. Available at:
http://www. schoolwellnesspolicies. org/. Accessed August 30, 2005
View in Article /\
Google Scholar
84 School Nutrition Association. Local School Wellness Policies. Available at:
http://www. asfsa. org/lndex. aspx?id=1075 . Accessed August 30, 2005.
View in Article /\
Google Scholar
< >143

85. Action for Healthy Kids. Wellness Policy Web page. Available at:
http://www. actionforhealthykids. org/resourcesPwp. php. Accessed August 30, 2005. '
View in Article /\
Google Scholar
86. Illinois Nutrition Education and Training Program. Website Resources: Wellness Policies.
Available at: http://www. kidseatwell. org/flyers/WellnessPolicyResources. pdf. Accessed August30, 2005.
View in Article /\
Google Scholar
Article Info
Identification
DOI:https://doi. org/10. 1016/j. jada. 2005. 11. 006
Copyright
© 2006 American Dietetic Association. Published by Elsevier Inc. All rights reserved.
ScienceDirect
Access this article on ScienceDirect
Figures
^Figure thumbnail gr1 ^Figure thumbnail gr2
3 1 Resources for ch... Figure 2 Local wellness po...< >
144

Related Articles
ARTICLES &ISSUES
JAND Articles In
Press
Current Issue
List of Issues
Supplements
Open AccessArticles
COLLECTIONS
President's Page
USDA Center for
Nutrition Policyand Promotion
Corner
Scope &Standards for
RDNs & NDTRs
Focus Area
Standards for
CDR SpecialistCredentials
Focus Area
Standards for
RDNs
Academy History
Autism
Cancer and Diet
Childhood
Overweight andObesity
Cultural
Competency andDiversity
Diabetes
Dietetics
Education
Dietetics Practice
Based Research
Network
Eating Disorders
Evidence AnalysisLibrary
Fatty Acids
Food Supply
GastrointestinalNutrition
Gastrointestinal
Health
Global Research
and Practice
Malnutrition
Pediatric
Malnutrition
Adult/Senior
Malnutrition
Special PopulationMalnutrition
Menu Labelingand Nutrient
Analysis
Military Nutrition
Nutritional
Genomics
Nutrition Care
Process and
Terminology
Nutrition
Informatics
Position and
Practice Papers
Pregnancy
Question of the
Month
Research
Methodology
School Nutrition
Sports Nutrition
Women's hlealth
MULTIMEDIA
Editor's Podcasts
Author Podcasts
Educational Slides
CPE
Academy JournalCPE Articles
CPE Quiz Login
FOR AUTHORS
Information for
Authors
Submits
Manuscript
Copyright andAuthor Agreement
EmbargoPolicy/Articles inPress
About OpenAccess
Getting YourManuscriptPublished
Getting YourPaper Noticed
Permissions
Researcher
Academy
JOURNAL INFO
About the Journal
Editorial Board
New Content
Alerts
Activate OnlineAccess
Abstracting andIndexing
Reprints
Subscribe
Contact
Information
ADVERTISINGAND MEDIA
Info for
Advertisers
Press Releases
Subscribe
FOLLOW US
YouTube
145

We use cookies to help provide and enhance our service and tailor content. To update your cookie settings,
please visit the Cookie Settings for this site.
Copyright © 2021 Elsevier Inc. except certain content provided by third parties. The content on this site is intendedfor healthcare professionals.
Privacy Policy Terms and Conditions Accessibility hlelp & Contact
<S. RELXTK
< >146

Exhibit 7
147

Preventing Childhood ObesityHealth in the Balance
Committee on Prevention of Obesity in Children and Youth
Food and Nutrition BoardBoard on Health Promotion and Disease Prevention
Jeffrey P. Koplan, Catharyn T. Liverman, Vivica I. Kraak, Editors
148

THE NATIONAL ACADEMIES PRESS 500 Fifth Street, N.W. Washington, DC 20001
NOTICE: The project that is the subject of this report was approved by the Governing Boardof the National Research Council, whose members are drawn from the councils of the Na-tional Academy of Sciences, the National Academy of Engineering, and the Institute of Medi-cine. The members of the committee responsible for the report were chosen for their specialcompetences and with regard for appropriate balance.
The study was supported by Contract No. 200-2000-00629, T.O. #14 between the NationalAcademy of Sciences and the Centers for Disease Control and Prevention; by Contract No.N01-OD-4-2139, T.O. #126 with the National Institutes of Health; and by Grant No. 047513with The Robert Wood Johnson Foundation. The contracts were supported by funds from theU.S. Department of Health and Human Services’ Office of Disease Prevention and HealthPromotion; Centers for Disease Control and Prevention; National Institute of Diabetes andDigestive and Kidney Diseases; National Heart, Lung, and Blood Institute; National Instituteof Child Health and Human Development; and the Division of Nutrition Research Coordina-tion of the National Institutes of Health. Any opinions, findings, conclusions, or recommenda-tions expressed in this publication are those of the authors and do not necessarily reflect theviews of the organizations or agencies that provided support for the project.
Library of Congress Cataloging-in-Publication Data
Institute of Medicine (U.S.). Committee on Prevention of Obesity in Children and Youth. Preventing childhood obesity : health in the balance / Committee on Prevention of Obesityin Children and Youth, Food and Nutrition Board, Board on Health Promotion and DiseasePrevention ; Jeffrey P. Koplan, Catharyn T. Liverman, Vivica I. Kraak, editors. p. ; cm. Includes bibliographical references and index. ISBN 0-309-09196-9 (hardcover) — ISBN 0-309-09315-5 1. Obesity in children—United States—Prevention. 2. Child health services—UnitedStates. 3. Nutrition policy—United States. 4. Health promotion—United States. [DNLM: 1. Obesity—prevention & control—Adolescent. 2. Obesity—prevention &control—Child. 3. Health Policy—Adolescent. 4. Health Policy—Child. 5. Health Promo-tion—methods. 6. Social Environment. WD 210 I604p 2005] I. Koplan, Jeffrey. II.Liverman, Catharyn T. III. Kraak, Vivica I. IV. Institute of Medicine (U.S.). Board onHealth Promotion and Disease Prevention. V. Title. RJ399.C6I575 2005 618.92’398—dc22 2004026241
Additional copies of this report are available from the National Academies Press, 500 FifthStreet, N.W., Box 285, Washington, DC 20055. Call (800) 624-6242 or (202) 334-3313 (inthe Washington metropolitan area), Internet, http://www.nap.edu.
For more information about the Institute of Medicine, visit the IOM home page at:www.iom.edu.
Copyright 2005 by the National Academy of Sciences. All rights reserved.
Illustration by Becky Heavner.
Printed in the United States of America.
The serpent has been a symbol of long life, healing, and knowledge among almost all culturesand religions since the beginning of recorded history. The serpent adopted as a logotype by theInstitute of Medicine is a relief carving from ancient Greece, now held by the StaatlicheMuseen in Berlin.
149

“Knowing is not enough; we must apply. Willing is not enough; we must do.”
—Goethe
Adviser to the Nation to Improve Health
150

The National Academy of Sciences is a private, nonprofit, self-perpetuating societyof distinguished scholars engaged in scientific and engineering research, dedicatedto the furtherance of science and technology and to their use for the general welfare.Upon the authority of the charter granted to it by the Congress in 1863, the Acad-emy has a mandate that requires it to advise the federal government on scientific andtechnical matters. Dr. Bruce M. Alberts is president of the National Academy ofSciences.
The National Academy of Engineering was established in 1964, under the charter ofthe National Academy of Sciences, as a parallel organization of outstanding engi-neers. It is autonomous in its administration and in the selection of its members,sharing with the National Academy of Sciences the responsibility for advising thefederal government. The National Academy of Engineering also sponsors engineer-ing programs aimed at meeting national needs, encourages education and research,and recognizes the superior achievements of engineers. Dr. Wm. A. Wulf is presi-dent of the National Academy of Engineering.
The Institute of Medicine was established in 1970 by the National Academy ofSciences to secure the services of eminent members of appropriate professions in theexamination of policy matters pertaining to the health of the public. The Instituteacts under the responsibility given to the National Academy of Sciences by itscongressional charter to be an adviser to the federal government and, upon its owninitiative, to identify issues of medical care, research, and education. Dr. Harvey V.Fineberg is president of the Institute of Medicine.
The National Research Council was organized by the National Academy of Sciencesin 1916 to associate the broad community of science and technology with theAcademy’s purposes of furthering knowledge and advising the federal government.Functioning in accordance with general policies determined by the Academy, theCouncil has become the principal operating agency of both the National Academyof Sciences and the National Academy of Engineering in providing services to thegovernment, the public, and the scientific and engineering communities. The Coun-cil is administered jointly by both Academies and the Institute of Medicine. Dr.Bruce M. Alberts and Dr. Wm. A. Wulf are chair and vice chair, respectively, of theNational Research Council.
www.national-academies.org
151

v
COMMITTEE ON PREVENTION OF OBESITYIN CHILDREN AND YOUTH
JEFFREY P. KOPLAN (Chair), Woodruff Health Sciences Center, EmoryUniversity, Atlanta, GA
DENNIS M. BIER, Children’s Nutrition Research Center, Baylor Collegeof Medicine, Houston, TX
LEANN L. BIRCH, Department of Human Development and FamilyStudies, Pennsylvania State University, University Park
ROSS C. BROWNSON, Department of Community Health, St. LouisUniversity School of Public Health, MO
JOHN CAWLEY, Department of Policy Analysis and Management,Cornell University, Ithaca, NY
GEORGE R. FLORES, The California Endowment, San Francisco, CASIMONE A. FRENCH, Division of Epidemiology, University of
Minnesota, MinneapolisSUSAN L. HANDY, Department of Environmental Science and Policy,
University of California, DavisROBERT C. HORNIK, Annenberg School for Communication,
University of Pennsylvania, PhiladelphiaDOUGLAS B. KAMEROW, Health, Social and Economics Research, RTI
International, Washington, DCSHIRIKI K. KUMANYIKA, Center for Clinical Epidemiology and
Biostatistics, University of Pennsylvania School of Medicine,Philadelphia
BARBARA J. MOORE, Shape Up America!, Washington, DCARIE L. NETTLES, School of Education, University of Michigan, Ann
ArborRUSSELL R. PATE, Department of Exercise Science, University of South
Carolina, ColumbiaJOHN C. PETERS, Food and Beverage Technology, Procter & Gamble
Company, Cincinnati, OHTHOMAS N. ROBINSON, Division of General Pediatrics and Stanford
Prevention Research Center, Stanford University School of Medicine,Palo Alto, CA
CHARLES ROYER, Evans School of Public Affairs, University ofWashington, Seattle
SHIRLEY R. WATKINS, SR Watkins & Associates, Silver Spring, MDROBERT C. WHITAKER, Mathematica Policy Research, Inc.,
Princeton, NJ
152

Staff
CATHARYN T. LIVERMAN, Study DirectorLINDA D. MEYERS, Director, Food and Nutrition BoardROSE MARIE MARTINEZ, Director, Board on Health Promotion and
Disease PreventionVIVICA I. KRAAK, Senior Program OfficerJANICE RICE OKITA, Senior Program OfficerCARRIE SZLYK, Program Officer (through September 2003)TAZIMA A. DAVIS, Research AssociateJ. BERNADETTE MOORE, Science and Technology Policy Intern
(through June 2003)ELISABETH RIMAUD, Financial AssociateSHANNON L. RUDDY, Senior Program Assistant
vi
153
FOOD AND NUTRITION BOARD
CATHERINE E. WOTEKI (Chair), Department of Food Science andHuman Nutrition, Iowa State University, Ames
ROBERT M. RUSSELL (Vice-Chair), U.S. Department of AgricultureJean Mayer Human Nutrition Research Center on Aging, TuftsUniversity, Boston, MA
LARRY R. BEUCHAT, Center for Food Safety, University of Georgia,Griffin
SUSAN FERENC, SAF* Risk, LC, Madison, WINANCY F. KREBS, Department of Pediatrics, University of Colorado
Health Sciences Center, DenverSHIRIKI K. KUMANYIKA, Center for Clinical Epidemiology and
Biostatistics, University of Pennsylvania School of Medicine,Philadelphia
REYNALDO MARTORELL, Rollins School of Public Health, EmoryUniversity, Atlanta, GA
LYNN PARKER, Child Nutrition Programs and Nutrition Policy, FoodResearch and Action Center, Washington, DC
NICHOLAS J. SCHORK, Department of Psychiatry, PolymorphismResearch Laboratory, University of California, San Diego
JOHN W. SUTTIE, Department of Biochemistry, University ofWisconsin, Madison
STEPHEN L. TAYLOR, Department of Food Science and Technologyand Food Processing Center, University of Nebraska-Lincoln
BARRY L. ZOUMAS, Department of Agricultural Economics and RuralSociology, Pennsylvania State University, University Park
IOM Council Liaison
DONNA E. SHALALA, University of Miami, Coral Gables, FL
Staff
LINDA D. MEYERS, DirectorGERALDINE KENNEDO, Administrative AssistantELISABETH RIMAUD, Financial Associate
vii
154

BOARD ON HEALTH PROMOTION AND DISEASE PREVENTION
JAMES W. CURRAN (Chair), Rollins School of Public Health, EmoryUniversity, Atlanta, GA
RONALD BAYER, Joseph L. Mailman School of Public Health,Columbia University, New York, NY
DAN G. BLAZER, Duke University Medical Center, Durham, NCHELEN B. DARLING, National Business Group on Health, Washington,
DCSTEPHEN B. FAWCETT, KU Work Group on Health Promotion and
Community Development, University of Kansas, LawrenceJONATHAN FIELDING, Department of Health Services, Los Angeles
County, CALAWRENCE O. GOSTIN, School of Law, Georgetown University and
Department of Public Health, Johns Hopkins University, Washington,DC
ELLEN R. GRITZ, Department of Behavioral Science, University ofTexas, Houston
GEORGE J. ISHAM, HealthPartners, Minneapolis, MNMARK S. KAMLET, Department of Economics and Public Policy,
Carnegie Mellon University, Pittsburgh, PAJOYCE SEIKO KOBAYASHI, Department of Psychiatry, University of
Colorado Health Sciences Center and Acute Crisis Services DenverHealth Medical Center
ELENA O. NIGHTINGALE, Member Emerita, Institute of Medicine,Washington, DC
ROXANNE PARROTT, Department of Communication Arts &Sciences, Pennsylvania State University, University Park
THOMAS A. PEARSON, Department of Community and PreventiveMedicine, University of Rochester, NY
IRVING ROOTMAN, Faculty of Human and Social Development,University of Victoria, British Columbia, Canada
DAVID J. TOLLERUD, School of Public Health and InformationSciences, University of Louisville, KY
KATHLEEN E. TOOMEY, Division of Public Health, GeorgiaDepartment of Human Resources, Atlanta
WILLIAM A. VEGA, University Behavioral HealthCare, Robert WoodJohnson Medical School, New Brunswick, NJ
PATRICIA WAHL, School of Public Health and Community Medicine,University of Washington, Seattle
LAUREN A. ZEISE, Reproductive and Cancer Hazard Assessment,Office of Environmental Health Hazard Assessment, Oakland, CA
viii
155

IOM Council Liaison
JEFFREY P. KOPLAN, Woodruff Health Sciences Center, EmoryUniversity, Atlanta, GA
Staff
ROSE MARIE MARTINEZ, DirectorRITA A. GASKINS, Administrative Assistant
ix
156

157

Reviewers
xi
This report has been reviewed in draft form by individuals chosen fortheir diverse perspectives and technical expertise, in accordance withprocedures approved by the National Research Council’s Report
Review Committee. The purpose of this independent review is to providecandid and critical comments that will assist the institution in making itspublished report as sound as possible and to ensure that the report meetsinstitutional standards for objectivity, evidence, and responsiveness to thestudy charge. The review comments and draft manuscript remain confiden-tial to protect the integrity of the deliberative process. We wish to thank thefollowing individuals for their review of this report:
LINDA ADAIR, Carolina Population Center, University of NorthCarolina at Chapel Hill
TOM BARANOWSKI, Children’s Nutrition Research Center, BaylorCollege of Medicine
EDWARD N. BRANDT, College of Public Health, University ofOklahoma
CUTBERTO GARZA, Division of Nutritional Sciences, CornellUniversity
MICHAEL S. JELLINEK, Newton Wellesley Hospital, Newton LowerFalls, MA
DAVID L. KATZ, Yale Prevention Research Center, Yale UniversityCARINE LENDERS, Department of Pediatrics, Boston Medical Center
158

AVIVA MUST, Department of Family Medicine and Community Health,Tufts University
VIVIAN PILANT, Office of School Food Services and Nutrition, SouthCarolina Department of Education
ALONZO PLOUGH, Department of Public Health-Seattle & KingCounty, School of Public Health and Community Medicine,University of Washington
ROSSI RAY-TAYLOR, Minority Student Achievement Network, AnnArbor, MI
JAMES F. SALLIS, San Diego State University, Active Living ResearchProgram
MARILYN D. SCHORIN, Yum! Brands, Inc.DONNA E. SHALALA, University of MiamiMICHAEL D. SLATER, Department of Journalism and Technical
Communication, Colorado State UniversitySYLVIE STACHENKO, Centre for Chronic Disease Prevention and
Control, Ottawa, OntarioROLAND STURM, RAND CorporationBOYD SWINBURN, Centre for Physical Activity and Nutrition
Research, Deakin University, MelbourneMARGARITA S. TREUTH, Bloomberg School of Public Health, Johns
Hopkins UniversityLINDA VAN HORN, Feinberg School of Medicine, Northwestern
UniversityBARRY L. ZOUMAS, Department of Agricultural Economics and Rural
Sociology, Pennsylvania State University
Although the reviewers listed above have provided many constructivecomments and suggestions, they were not asked to endorse the conclusionsor recommendations nor did they see the final draft of the report before itsrelease. The review of this report was overseen by ENRIQUETA C. BOND,Burroughs Wellcome Fund, and GORDON H. DEFRIESE, Department ofSocial Medicine, University of North Carolina at Chapel Hill. Appointedby the National Research Council, they were responsible for making certainthat an independent examination of this report was carried out in accor-dance with institutional procedures and that all review comments werecarefully considered. Responsibility for the final content of this report restsentirely with the authoring committee and the institution.
xii REVIEWERS
159

Preface
xiii
In 2001, the U.S. Surgeon General issued the Call to Action to Preventand Decrease Overweight and Obesity to stimulate the development ofspecific agendas and actions targeting this public health problem. In
recognition of the need for greater attention directed to prevent childhoodobesity, Congress, through the fiscal year 2002 Labor, Health and HumanServices, Education Appropriations Act Conference Report, directed theCenters for Disease Control and Prevention (CDC) to request that theInstitute of Medicine (IOM) develop an action plan targeted to the preven-tion of obesity in children and youth in the United States. In addition toCDC, this study was supported by the Department of Health and HumanServices’ Office of Disease Prevention and Health Promotion (ODPHP);National Institute of Diabetes and Digestive and Kidney Diseases (NIDDK);the National Heart, Lung, and Blood Institute (NHLBI); the National Insti-tute of Child Health and Human Development (NICHD); the Division ofNutrition Research Coordination of the National Institutes of Health; andThe Robert Wood Johnson Foundation (RWJF).
The charge to the IOM committee was to develop a prevention-focusedaction plan to decrease the prevalence of obesity in children and youth inthe United States. The primary emphasis of the study’s task was on exam-ining the behavioral and cultural factors, social constructs, and other broadenvironmental factors involved in childhood obesity and identifying prom-ising approaches for prevention efforts. To address this charge, the IOMappointed a 19-member multidisciplinary committee with expertise in childhealth and development, obesity, nutrition, physical activity, economics,
160

xiv PREFACE
education, public policy, and public health. Six meetings were held duringthe 24-month study and a variety of sources informed the committee’swork. The committee obtained information through a literature review(Appendix C) and a commissioned paper discussing insights, strategies,and lessons learned from other public health issues and social changecampaigns that might be relevant to the prevention of obesity in childrenand youth (Appendix D). The meetings included two workshops that werekey elements of the committee’s information-gathering process (AppendixE). Held in June 2003, the first workshop focused on strategies for devel-oping school-based policies to promote nutrition and physical activity inchildren and youth. The second workshop was organized in December2003 and addressed marketing and media influences on preventing child-hood obesity and issues related to family dynamics. Each workshopincluded public forum sessions, and the committee benefited from thebreadth of issues raised by nonprofit organizations, professional associa-tions, and individuals.
Since the inception of this study, the committee recognized that it faceda broad task and a complex problem that has become an epidemic not onlyin the United States but also internationally. The committee appreciated theopportunity to develop an action plan on the prevention of obesity inchildren and youth and developed its recommendations to encompass theroles and responsibilities of numerous stakeholders and many sectors ofsociety.
Children are highly cherished in our society. The value we attach to ourchildren is fundamentally connected to society’s responsibility to providefor their growth, development, and well-being. Extensive discussions willneed to continue beyond this report so that shared understandings arereached and support is garnered for sustained societal and lifestyle changesthat will reverse the obesity trends among our children and youth.
Jeffrey P. Koplan, ChairCommittee on Prevention of Obesity inChildren and Youth
161

Acknowledgments
xv
It was a privilege to chair this Institute of Medicine (IOM) committeewhose members not only brought their breadth and depth of expertiseto this important topic but were actively engaged in the committee’s
work. This report represents the result of six meetings, two open sessions,numerous emails and phone conferences, and the extensive analysis andthoughtful writing contributed by the committee members who volunteeredtheir time to work on this study. I thank each of the committee members fortheir dedication and perseverance in working through the diversity of issuesin a truly interdisciplinary collaboration.
The committee greatly benefited from the opportunity for discussionwith the individuals who made presentations and attended the committee’sworkshops and meetings, including: Neal Baer, Kelly Brownell, HaroldGoldstein, Paula Hudson Collins, Mary Engle, Susan McHale, Alex Molnar,Eric Rosenthal, Mark Vallianatos, Jennifer Wilkins, and Judith Young, aswell as all those who spoke during the open forums (Appendix E).
This study was sponsored by the U.S. Department of Health and Hu-man Services’ Centers for Disease Control and Prevention; Office of Dis-ease Prevention and Health Promotion; National Heart, Lung, and BloodInstitute; National Institute of Diabetes and Digestive and Kidney Diseases;National Institute of Child Health and Human Development; the Divisionof Nutrition Research Coordination of the National Institutes of Health;and The Robert Wood Johnson Foundation. The committee thanks TerryBazzarre, William Dietz, Karen Donato, Gilman Grave, Van Hubbard,
162

xvi ACKNOWLEDGMENTS
Woodie Kessel, Kathryn McMurry, Pamela Starke-Reed, Susan Yanovski,and their colleagues for their support and guidance on the committee’s task.
This study was conducted in collaboration with the IOM Board onHealth Promotion and Disease Prevention (HPDP), and we wish to thankboth Rose Martinez, director of the HPDP Board, for her thoughtful inter-actions and discussions with the committee, and Carrie Szlyk, who was ofgreat assistance in the early phases of this study.
We appreciate the extensive analysis of lessons learned from otherpublic health efforts and their relevance to preventing childhood obesitywritten by Michael Eriksen (Appendix D). Many thanks to Sally AnnLederman and Lynn Parker for their technical review of sections of thereport. Kathi Hanna’s work as a consultant, financial oversight by ElisabethRimaud, and the editing work of Steven Marcus, Laura Penny, and TomBurroughs are also greatly appreciated. The work of Rebecca Klima-Hudsonand Stephanie Deutsch is also most appreciated. The report has been en-hanced by the artwork of Becky Heavner, and we thank her for thesecreative efforts.
Last, but not least, I would like to thank the Food and Nutrition Boardstudy staff, Linda Meyers, Cathy Liverman, Vivica Kraak, Janice Okita,Tazima Davis, and Shannon Ruddy, for their extraordinary competence,diligence, wisdom, and intellectual openness. Their in-depth knowledge ofthe subject matter, keen sense of policy and practice, and willingness toconstantly work and revise to make this document as useful, thoughtful,and accurate as possible was invaluable in its creation.
Preventing Childhood Obesity: Health in the Balance presents a set ofrecommendations that, when implemented together, will catalyze synergis-tic actions among families, communities, schools, and the public and pri-vate sectors to effectively prevent the large majority of children and youthin the United States from becoming obese. Although the committee mem-bers have diverse backgrounds, over the course of this study we havegained a deeper appreciation for the difficulty and complexity of the stepsnecessary to prevent obesity in our nation’s youth. We provide this guid-ance with the hope that it will benefit the health of our nation and futuregenerations.
Jeffrey P. Koplan, ChairCommittee on Prevention of Obesity inChildren and Youth
163

Contents
xvii
EXECUTIVE SUMMARY 1
1 INTRODUCTION 21An Epidemic of Childhood Obesity, 21Implications for Children and Society at Large, 22Contexts for Action, 25Public Health Precedents, 44Summary, 47References, 48
2 EXTENT AND CONSEQUENCES OF CHILDHOOD OBESITY 54Prevalence and Time Trends, 54Considering the Costs for Children and for Society, 65Summary, 72References, 73
3 DEVELOPING AN ACTION PLAN 79Definitions and Terminology, 79Framework for Action, 83Obesity Prevention Goals, 86Energy Balance, 90Review of the Evidence, 107
164

xviii CONTENTS
Summary, 115References, 115
4 A NATIONAL PUBLIC HEALTH PRIORITY 125Leadership, Coordination, and Priority Setting, 129State and Local Priorities, 131Research and Evaluation, 134Surveillance and Monitoring, 137Nutrition and Physical Activity Programs, 141Nutrition Assistance Programs, 142Agricultural Policies, 144Other Policy Considerations, 146Recommendation, 147References, 148
5 INDUSTRY, ADVERTISING, MEDIA, ANDPUBLIC EDUCATION 153Industry, 153Nutrition Labeling, 166Advertising, Marketing, and Media, 171Media and Public Education, 177References, 185
6 LOCAL COMMUNITIES 193Mobilizing Communities, 194Health Care, 221References, 227
7 SCHOOLS 237Food and Beverages in Schools, 238Physical Activity, 253Classroom Curricula, 261Advertising in Schools, 265School Health Services, 269After-School Programs and Schools as Community Centers, 272Evaluation of School Programs and Policies, 274Recommendation, 276References, 278
8 HOME 285Promoting Healthful Eating Behaviors, 287Promoting Physical Activity, 296Decreasing Inactivity, 301
165

CONTENTS xix
Parents as Role Models, 305Raising Awareness of Weight as a Health Issue, 306Recommendation, 308References, 309
9 CONFRONTING THE CHILDHOODOBESITY EPIDEMIC 319Next Steps for Action and Research, 322
APPENDIXES
A Acronyms 327B Glossary 331C Literature Review 339D Lessons Learned from Public Health Efforts
and Their Relevance to Preventing Childhood Obesity 343E Workshop Programs 377F Biographical Sketches 383
INDEX 395
166

167

1
Executive Summary
Despite steady progress over most of the past century toward ensur-ing the health of our country’s children, we begin the 21st centurywith a startling setback—an epidemic of childhood obesity. This
epidemic is occurring in boys and girls in all 50 states, in younger childrenas well as adolescents, across all socioeconomic strata, and among all ethnicgroups—though specific subgroups, including African Americans, Hispan-ics, and American Indians, are disproportionately affected. At a time whenwe have learned that excess weight has significant and troublesome healthconsequences, we nevertheless see our population, in general, and our chil-dren, in particular, gaining weight to a dangerous degree and at an alarm-ing rate.
The increasing prevalence of childhood obesity1 throughout the UnitedStates has led policy makers to rank it as a critical public health threat.Over the past three decades, its rate has more than doubled for preschoolchildren aged 2 to 5 years and adolescents aged 12 to 19 years, and it hasmore than tripled for children aged 6 to 11 years. At present, approxi-mately nine million children over 6 years of age are considered obese. These
1Reflecting classification based on the readily available measures of height and weight, thisreport uses the term “obesity” to refer to children and youth who have a body mass index(BMI) equal to or greater than the 95th percentile of the age- and gender-specific BMI chartsof the Centers for Disease Control and Prevention (CDC). In most children, such BMI valuesare known to indicate elevated body fat and to reflect the presence or risk of related diseases.
168

2 PREVENTING CHILDHOOD OBESITY
trends mirror a similar profound increase over the same approximate pe-riod in U.S. adults as well as a concurrent rise internationally, in developedand developing countries alike.
Childhood obesity involves immediate and long-term risks to physicalhealth. For children born in the United States in 2000, the lifetime risk ofbeing diagnosed with diabetes at some point in their lives is estimated at 30percent for boys and 40 percent for girls if obesity rates level off. Youngpeople are also at risk of developing serious psychosocial burdens related tobeing obese in a society that stigmatizes this condition.
There are also considerable economic costs. The national health careexpenditures related to obesity and overweight in adults alone have beenestimated to range from approximately $98 billion to $129 billion afteradjusting for inflation and converting estimates to 2004 dollars. Under-standing the causes of childhood obesity, determining what to do aboutthem, and taking appropriate action require attention to what influenceseating behaviors and physical activity levels because obesity preventioninvolves a focus on energy balance (calories consumed versus calories ex-pended). Although seemingly straightforward, these behaviors result fromcomplex interactions across a number of relevant social, environmental,and policy contexts.
U.S. children live in a society that has changed dramatically in thethree decades over which the obesity epidemic has developed. Many ofthese changes—such as both parents working outside the home, longerwork hours by both parents, changes in the school food environment, andmore meals eaten outside the home, together with changes in the physicaldesign of communities often affect what children eat, where they eat, howmuch they eat, and the amount of energy they expend in school and leisuretime activities. Other changes, such as the growing diversity of the popula-tion, influence cultural views and marketing patterns. Use of computersand video games, along with television viewing, often occupy a large per-centage of children’s leisure time and potentially influence levels of physi-cal activity for children as well as for adults. Many of the social andcultural characteristics that the U.S. population has accepted as a normalway of life may collectively contribute to the growing levels of childhoodobesity. An understanding of these contexts, particularly regarding theirpotential to be modified and how they may facilitate or impede develop-ment of a comprehensive obesity prevention strategy, is essential for reduc-ing childhood obesity.
DEVELOPING AN ACTION PLAN FOR OBESITY PREVENTION
The Institute of Medicine Committee on Prevention of Obesity in Chil-dren and Youth was charged with developing a prevention-focused action
169

EXECUTIVE SUMMARY 3
plan to decrease the prevalence of obesity in children and youth in theUnited States. The primary emphasis of the committee’s task was on exam-ining the behavioral and cultural factors, social constructs, and other broadenvironmental factors involved in childhood obesity and identifying prom-ising approaches for prevention efforts. The plan consists of explicit goalsfor preventing obesity in children and youth and a set of recommendations,all geared toward achieving those goals, for different segments of society(Box ES-1).
Obesity prevention requires an evidence-based public health approachto assure that recommended strategies and actions will have their intendedeffects. Such evidence is traditionally drawn from experimental (random-ized) trials and high-quality observational studies. However, there is limitedexperimental evidence in this area, and for many environmental, policy,and societal variables, carefully designed evaluations of ongoing programsand policies are likely to answer many key questions. For this reason, thecommittee chose a process that incorporated all forms of available evi-dence—across different categories of information and types of study de-sign—to enhance the biological, psychosocial, and environmental plausibil-ity of its inferences and to ensure consistency and congruency ofinformation.
Because the obesity epidemic is a serious public health problem callingfor immediate reductions in obesity prevalence and in its health and socialconsequences, the committee believed strongly that actions should be basedon the best available evidence—as opposed to waiting for the best possibleevidence. However, there is an obligation to accumulate appropriate evi-dence not only to justify a course of action but to assess whether it hasmade a difference. Therefore, evaluation should be a critical component ofany implemented intervention or change.
Childhood obesity prevention involves maintaining energy balance at ahealthy weight while protecting overall health, growth and development,and nutritional status. The balance is between the energy an individualconsumes as food and beverages and the energy expended to support nor-mal growth and development, metabolism, thermogenesis, and physicalactivity. Although “energy intake = energy expenditure” looks like a fairlybasic equation, in reality it is extraordinarily complex when considering themultitude of genetic, biological, psychological, sociocultural, and environ-mental factors that affect both sides of the equation and the interrelation-ships between these factors. For example, children are strongly influencedby the food- and physical activity-related decisions made by their families,schools, and communities. Furthermore, it is important to consider thekinds of foods and beverages that children are consuming over time, giventhat specific types and quantities of nutrients are required to support opti-mal growth and development.
170

4 PREVENTING CHILDHOOD OBESITY
BOX ES-1Goals of Obesity Prevention in Children and Youth
The goal of obesity prevention in children and youth is to create—throughdirected social change—an environmental-behavioral synergy that pro-motes:
• For the population of children and youth♦ Reduction in the incidence of childhood and adolescent obesity♦ Reduction in the prevalence of childhood and adolescent obesity♦ Reduction of mean population BMI levels♦ Improvement in the proportion of children meeting Dietary Guidelines for
Americans♦ Improvement in the proportion of children meeting physical activity guide-
lines♦ Achieving physical, psychological, and cognitive growth and develop-
mental goals
• For individual children and youth♦ A healthy weight trajectory, as defined by the CDC BMI charts♦ A healthful diet (quality and quantity)♦ Appropriate amounts and types of physical activity♦ Achieving physical, psychosocial, and cognitive growth and developmental
goals
Because it may take a number of years to achieve and sustain these goals,intermediate goals are needed to assess progress toward reduction of obe-sity through policy and system changes. Examples include:
• Increased number of children who safely walk and bike to school• Improved access to and affordability of fruits and vegetables for low-income
populations• Increased availability and use of community recreational facilities• Increased play and physical activity opportunities• Increased number of new industry products and advertising messages that
promote energy balance at a healthy weight• Increased availability and affordability of healthful foods and beverages at
supermarkets, grocery stores, and farmers markets located within walkingdistance of the communities they serve
• Changes in institutional and environmental policies that promote energybalance
Thus, changes at many levels and in numerous environments will re-quire the involvement of multiple stakeholders from diverse segments ofsociety. In the home environment, for example, incremental changes suchas improving the nutritional quality of family dinners or increasing the timeand frequency that children spend outside playing can make a difference.
171

EXECUTIVE SUMMARY 5
Changes that lead to healthy communities, such as organizational and policychanges in local schools, school districts, neighborhoods, and cities, areequally important. At the state and national levels, large-scale modifica-tions are needed in the ways in which society promotes healthful eatinghabits and physically active lifestyles. Accomplishing these changes will bedifficult, but there is precedent for success in other public health endeavorsof comparable or greater complexity and scope. This must be a nationaleffort, with special attention to communities that experience health dispari-ties and that have social and physical environments unsupportive of health-ful nutrition and physical activity.
A NATIONAL PUBLIC HEALTH PRIORITY
Just as broad-based approaches have been used to address other publichealth concerns—including automobile safety and tobacco use—obesityprevention should be public health in action at its broadest and most inclu-sive level. Prevention of obesity in children and youth should be a nationalpublic health priority.
Across the country, obesity prevention efforts have already begun, andalthough the ultimate solutions are still far off, there is great potential atpresent for pursuing innovative approaches and creating linkages that per-mit the cross-fertilization of ideas. Current efforts range from new schoolboard policies and state legislation regarding school physical educationrequirements and nutrition standards for beverages and foods sold inschools to community initiatives to expand bike paths and improve recre-ational facilities. Parallel and synergistic efforts to prevent adult obesity,which will contribute to improvements in health for the entire U.S. popula-tion, are also beginning. Grassroots efforts made by citizens and organiza-tions will likely drive many of the obesity prevention efforts at the locallevel and can be instrumental in driving policies and legislation at the stateand national levels.
The additional impetus that is needed is the political will to makechildhood obesity prevention a national public health priority. Obesityprevention efforts nationwide will require federal, state, and local govern-ments to commit adequate and sustained resources for surveillance, re-search, public health programs, evaluation, and dissemination. The federalgovernment has had a longstanding commitment to programs that addressnutritional deficiencies (beginning in the 1930s) and encourage physicalfitness, but only recently has obesity been targeted. The federal governmentshould demonstrate effective leadership by making a sustained commitmentto support policies and programs that are commensurate to the scale of theproblem. Furthermore, leadership in this endeavor will require coordina-tion of federal efforts with state and community efforts, complemented by
172

6 PREVENTING CHILDHOOD OBESITY
engagement of the private sector in developing constructive, socially re-sponsible, and potentially profitable approaches to the promotion of ahealthy weight.
State and local governments have especially important roles to play inobesity prevention, as they can focus on the specific needs of their state,cities, and neighborhoods. Many of the issues involved in preventing child-hood obesity—including actions on street and neighborhood design, plansfor parks and community recreational facilities, and locations of newschools and retail food facilities—require decisions by county, city, or townofficials.
Rigorous evaluation of obesity prevention interventions is essential.Only through careful evaluation can prevention interventions be refined;those that are unsuccessful can be discontinued or refocused, and those thatare successful can be identified, replicated, and disseminated.
Recommendation 1: National PriorityGovernment at all levels should provide coordinated leadership for theprevention of obesity in children and youth. The President should re-quest that the Secretary of the Department of Health and Human Ser-vices (DHHS) convene a high-level task force to ensure coordinatedbudgets, policies, and program requirements and to establish effectiveinterdepartmental collaboration and priorities for action. An increasedlevel and sustained commitment of federal and state funds and re-sources are needed.
To implement this recommendation, the federal government should:
• Strengthen research and program efforts addressing obesityprevention, with a focus on experimental behavioral research andcommunity-based intervention research and on the rigorous evalua-tion of the effectiveness, cost-effectiveness, sustainability, and scal-ing up of effective prevention interventions
• Support extensive program and research efforts to preventchildhood obesity in high-risk populations with health disparities,with a focus both on behavioral and environmental approaches
• Support nutrition and physical activity grant programs, par-ticularly in states with the highest prevalence of childhood obesity
• Strengthen support for relevant surveillance and monitoringefforts, particularly the National Health and Nutrition ExaminationSurvey (NHANES)
• Undertake an independent assessment of federal nutrition as-sistance programs and agricultural policies to ensure that they pro-
173

EXECUTIVE SUMMARY 7
mote healthful dietary intake and physical activity levels for all chil-dren and youth
• Develop and evaluate pilot projects within the nutrition assis-tance programs that would promote healthful dietary intake andphysical activity and scale up those found to be successful
To implement this recommendation, state and local governmentsshould:
• Provide coordinated leadership and support for childhood obe-sity prevention efforts, particularly those focused on high-risk popu-lations, by increasing resources and strengthening policies that pro-mote opportunities for physical activity and healthful eating incommunities, neighborhoods, and schools
• Support public health agencies and community coalitions intheir collaborative efforts to promote and evaluate obesity preven-tion interventions
HEALTHY MARKETPLACE AND MEDIA ENVIRONMENTS
Children, youth, and their families are surrounded by a commercialenvironment that strongly influences their purchasing and consumptionbehaviors. Consumers may initially be unsure about what to eat for goodhealth. They often make immediate trade-offs in taste, cost, and conve-nience for longer term health. The food, beverage, restaurant, entertain-ment, leisure, and recreation industries share in the responsibilities forchildhood obesity prevention and can be instrumental in supporting thisgoal. Federal agencies can strengthen industry efforts through general sup-port, technical assistance, research expertise, and regulatory guidance.
Some leaders in the food industry are already making changes to ex-pand healthier options for young consumers, offer products with reducedenergy content, and reduce portion sizes. These changes must be adoptedon a much larger scale, however, and marketed in ways that make accep-tance by consumers (who may now have acquired entrenched preferencesfor many less healthful products) more likely. Coordinated efforts amongthe private sector, government, and other groups are also needed to create,support, and sustain consumer demand for healthful food and beverageproducts, appropriately portioned restaurant and take-out meals, and accu-rate and consistent nutritional information through food labels, healthclaims, and other educational sources. Similarly, the leisure, entertainment,and recreation industries have opportunities to innovate in favor of stimu-
174

8 PREVENTING CHILDHOOD OBESITY
lating physical activity—as opposed to sedentary or passive-leisure pur-suits—and portraying active living as a desirable social norm for adults andchildren.
Children’s health-related behaviors are influenced by exposure to me-dia messages involving foods, beverages, and physical activity. Researchhas shown that television advertising can especially affect children’s foodknowledge, choices, and consumption of particular food products, as wellas their food-purchase decisions made directly and indirectly (through par-ents). Because young children under 8 years of age are often unable todistinguish between information and the persuasive intent of advertising,the committee recommends the development of guidelines for advertisingand marketing of foods, beverages, and sedentary entertainment to chil-dren.
Media messages can also be inherently positive. There is great potentialfor the media and entertainment industries to encourage a balanced diet,healthful eating habits, and regular physical activity, thereby influencingsocial norms about obesity in children and youth and helping to spur theactions needed to prevent it. Public education messages in multiple types ofmedia are needed to generate support for policy changes and provide mes-sages to the general public, parents, children, and adolescents.
Recommendation 2: IndustryIndustry should make obesity prevention in children and youth a prior-ity by developing and promoting products, opportunities, and informa-tion that will encourage healthful eating behaviors and regular physicalactivity.
To implement this recommendation:
• Food and beverage industries should develop product and pack-aging innovations that consider energy density, nutrient density, andstandard serving sizes to help consumers make healthful choices.
• Leisure, entertainment, and recreation industries should de-velop products and opportunities that promote regular physical ac-tivity and reduce sedentary behaviors.
• Full-service and fast food restaurants should expand healthierfood options and provide calorie content and general nutrition in-formation at point of purchase.
Recommendation 3: Nutrition LabelingNutrition labeling should be clear and useful so that parents and youthcan make informed product comparisons and decisions to achieve andmaintain energy balance at a healthy weight.
175

EXECUTIVE SUMMARY 9
To implement this recommendation:
• The Food and Drug Administration should revise the Nutri-tion Facts panel to prominently display the total calorie content foritems typically consumed at one eating occasion in addition to thestandardized calorie serving and the percent Daily Value.
• The Food and Drug Administration should examine ways toallow greater flexibility in the use of evidence-based nutrient andhealth claims regarding the link between the nutritional propertiesor biological effects of foods and a reduced risk of obesity andrelated chronic diseases.
• Consumer research should be conducted to maximize use ofthe nutrition label and other food-guidance systems.
Recommendation 4: Advertising and MarketingIndustry should develop and strictly adhere to marketing and advertis-ing guidelines that minimize the risk of obesity in children and youth.
To implement this recommendation:
• The Secretary of the DHHS should convene a national confer-ence to develop guidelines for the advertising and marketing of foods,beverages, and sedentary entertainment directed at children andyouth with attention to product placement, promotion, and content.
• Industry should implement the advertising and marketingguidelines.
• The Federal Trade Commission should have the authority andresources to monitor compliance with the food and beverage andsedentary entertainment advertising practices.
Recommendation 5: Multimedia and Public Relations CampaignThe DHHS should develop and evaluate a long-term national multi-media and public relations campaign focused on obesity prevention inchildren and youth.
To implement this recommendation:
• The campaign should be developed in coordination with otherfederal departments and agencies and with input from independentexperts to focus on building support for policy changes; providinginformation to parents; and providing information to children andyouth. Rigorous evaluation should be a critical component.
176

10 PREVENTING CHILDHOOD OBESITY
• Reinforcing messages should be provided in diverse media andeffectively coordinated with other events and dissemination activi-ties.
• The media should incorporate obesity issues into its content,including the promotion of positive role models.
HEALTHY COMMUNITIES
Encouraging children and youth to be physically active involves provid-ing them with places where they can safely walk, bike, run, skate, playgames, or engage in other activities that expend energy. But practices thatguide the development of streets and neighborhoods often place the needsof motorized vehicles over the needs of pedestrians and bicyclists. Localgovernments should find ways to increase opportunities for physical activ-ity in their communities by examining zoning ordinances and priorities forcapital investment.
Community actions need to engage child- and youth-centered organiza-tions, social and civic organizations, faith-based groups, and many othercommunity partners. Community coalitions can coordinate their effortsand leverage and network resources. Specific attention must be given tochildren and youth who are at high risk for becoming obese; this includeschildren in populations with higher obesity prevalence rates andlongstanding health disparities such as African Americans, Hispanic Ameri-cans, and American Indians, or families of low socioeconomic status. Chil-dren with at least one obese parent are also at high risk.
Health-care professionals, including physicians, nurses, and other clini-cians, have a vital role to play in preventing childhood obesity. As advisorsboth to children and their parents, they have the access and influence todiscuss the child’s weight status with the parents (and child as age appropri-ate) and make credible recommendations on dietary intake and physicalactivity throughout children’s lives. They also have the authority to encour-age action by advocating for prevention efforts.
Recommendation 6: Community ProgramsLocal governments, public health agencies, schools, and communityorganizations should collaboratively develop and promote programsthat encourage healthful eating behaviors and regular physical activity,particularly for populations at high risk of childhood obesity. Commu-nity coalitions should be formed to facilitate and promote cross-cuttingprograms and community-wide efforts.
177

EXECUTIVE SUMMARY 11
To implement this recommendation:
• Private and public efforts to eliminate health disparities shouldinclude obesity prevention as one of their primary areas of focus andshould support community-based collaborative programs to addresssocial, economic, and environmental barriers that contribute to theincreased obesity prevalence among certain populations.
• Community child- and youth-centered organizations shouldpromote healthful eating behaviors and regular physical activitythrough new and existing programs that will be sustained over thelong term.
• Community evaluation tools should incorporate measures ofthe availability of opportunities for physical activity and healthfuleating.
• Communities should improve access to supermarkets, farmers’markets, and community gardens to expand healthful food options,particularly in low-income and underserved areas.
Recommendation 7: Built EnvironmentLocal governments, private developers, and community groups shouldexpand opportunities for physical activity including recreational facili-ties, parks, playgrounds, sidewalks, bike paths, routes for walking orbicycling to school, and safe streets and neighborhoods, especially forpopulations at high risk of childhood obesity.
To implement this recommendation:
Local governments, working with private developers and commu-nity groups, should:
• Revise comprehensive plans, zoning and subdivisionordinances, and other planning practices to increase availabilityand accessibility of opportunities for physical activity in new devel-opments
• Prioritize capital improvement projects to increase opportuni-ties for physical activity in existing areas
• Improve the street, sidewalk, and street-crossing safety ofroutes to school, develop programs to encourage walking and bicy-cling to school, and build schools within walking and bicycling dis-tance of the neighborhoods they serve
178

12 PREVENTING CHILDHOOD OBESITY
Community groups should:• Work with local governments to change their planning and
capital improvement practices to give higher priority to opportuni-ties for physical activity
The DHHS and the Department of Transportation should:• Fund community-based research to examine the impact of
changes to the built environment on the levels of physical activity inthe relevant communities and populations.
Recommendation 8: Health CarePediatricians, family physicians, nurses, and other clinicians shouldengage in the prevention of childhood obesity. Health-care professionalorganizations, insurers, and accrediting groups should support indi-vidual and population-based obesity prevention efforts.
To implement this recommendation:
• Health-care professionals should routinely track BMI, offerrelevant evidence-based counseling and guidance, serve as role mod-els, and provide leadership in their communities for obesity preven-tion efforts.
• Professional organizations should disseminate evidence-basedclinical guidance and establish programs on obesity prevention.
• Training programs and certifying entities should require obe-sity prevention knowledge and skills in their curricula and examina-tions.
• Insurers and accrediting organizations should provide incen-tives for maintaining healthy body weight and include screening andobesity preventive services in routine clinical practice and qualityassessment measures.
HEALTHY SCHOOL ENVIRONMENT
Schools are one of the primary locations for reaching the nation’schildren and youth. In 2000, 53.2 million students were enrolled in publicand private elementary and secondary schools in the United States. In addi-tion, schools often serve as the sites for preschool, child-care, and after-school programs. Both inside and outside of the classroom, schools presentopportunities for the concepts of energy balance to be taught and put intopractice as students learn about good nutrition, physical activity, and theirrelationships to health; engage in physical education; and make food and
179

EXECUTIVE SUMMARY 13
physical activity choices during school meal times and through school-related activities.
All foods and beverages sold or served to students in school should behealthful and meet an accepted nutritional content standard. However,many of the “competitive foods” now sold in school cafeterias, vendingmachines, school stores, and school fundraisers are high in calories and lowin nutritional value. At present, federal standards for the sale of competitivefoods in schools are only minimal.
In addition, many schools around the nation have reduced their com-mitment to provide students with regular and adequate physical activity,often as a result of budget cuts or pressures to increase academic courseofferings, even though it is generally recommended that children accumu-late a minimum of 60 minutes of moderate to vigorous physical activityeach day. Given that children spend over half of their day in school, it is notunreasonable to expect that they participate in at least 30 minutes of mod-erate to vigorous physical activity during the school day.
Schools offer many other opportunities for learning and practicinghealthful eating and physical activity behaviors. Coordinated changes in thecurriculum, the in-school advertising environment, school health services,and after-school programs all offer the potential to advance obesity preven-tion. Furthermore, it is important for parents to be aware of their child’sweight status. Schools can assist in providing BMI, weight, and heightinformation to parents and to children (as age appropriate) while being sureto sensitively collect and report on that information.
Recommendation 9: SchoolsSchools should provide a consistent environment that is conducive tohealthful eating behaviors and regular physical activity.
To implement this recommendation:
The U.S. Department of Agriculture, state and local authorities, andschools should:
• Develop and implement nutritional standards for all competi-tive foods and beverages sold or served in schools
• Ensure that all school meals meet the Dietary Guidelines forAmericans
• Develop, implement, and evaluate pilot programs to extendschool meal funding in schools with a large percentage of children athigh risk of obesity
180

14 PREVENTING CHILDHOOD OBESITY
State and local education authorities and schools should:
• Ensure that all children and youth participate in a minimum of30 minutes of moderate to vigorous physical activity during theschool day
• Expand opportunities for physical activity through physicaleducation classes; intramural and interscholastic sports programsand other physical activity clubs, programs, and lessons; after-schooluse of school facilities; use of schools as community centers; andwalking- and biking-to-school programs
• Enhance health curricula to devote adequate attention to nutri-tion, physical activity, reducing sedentary behaviors, and energy bal-ance, and to include a behavioral skills focus
• Develop, implement, and enforce school policies to createschools that are advertising-free to the greatest possible extent
• Involve school health services in obesity prevention efforts• Conduct annual assessments of each student’s weight, height,
and gender- and age-specific BMI percentile and make this informa-tion available to parents
• Perform periodic assessments of each school’s policies and prac-tices related to nutrition, physical activity, and obesity prevention
Federal and state departments of education and health and profes-sional organizations should:
• Develop, implement, and evaluate pilot programs to exploreinnovative approaches to both staffing and teaching about wellness,healthful choices, nutrition, physical activity, and reducing seden-tary behaviors. Innovative approaches to recruiting and training ap-propriate teachers are also needed
HEALTHY HOME ENVIRONMENT
Parents (defined broadly to include primary caregivers) have a pro-found influence on their children by fostering certain values and attitudes,by rewarding or reinforcing specific behaviors, and by serving as role mod-els. A child’s health and well-being are thus enhanced by a home environ-ment with engaged and skillful parenting that models, values, and encour-ages healthful eating habits and a physically active lifestyle. Economic andtime constraints, as well as the stresses and challenges of daily living, maymake healthful eating and increased physical activity a difficult reality on aday-to-day basis for many families.
181

EXECUTIVE SUMMARY 15
Parents play a fundamental role as household policy makers. Theymake daily decisions on recreational opportunities, food availability athome, and children’s allowances; they determine the setting for foods eatenin the home; and they implement countless other rules and policies thatinfluence the extent to which various members of the family engage inhealthful eating and physical activity. Older children and youth, mean-while, have responsibilities to be aware of their own eating habits andactivity patterns and to engage in health-promoting behaviors.
Recommendation 10: HomeParents should promote healthful eating behaviors and regular physicalactivity for their children.
To implement this recommendation parents can:
• Choose exclusive breastfeeding as the method for feeding in-fants for the first four to six months of life
• Provide healthful food and beverage choices for children bycarefully considering nutrient quality and energy density
• Assist and educate children in making healthful decisions re-garding types of foods and beverages to consume, how often, and inwhat portion size
• Encourage and support regular physical activity• Limit children’s television viewing and other recreational screen
time to less than two hours per day• Discuss weight status with their child’s health-care provider
and monitor age- and gender-specific BMI percentile• Serve as positive role models for their children regarding eating
and physical-activity behaviors
CONFRONTING THE CHILDHOOD OBESITY EPIDEMIC
The committee acknowledges, as have many other similar efforts, thatobesity prevention is a complex issue, that a thorough understanding of thecauses and determinants of the obesity epidemic is lacking, and that progresswill require changes not only in individual and family behaviors but also inthe marketplace and the social and built environments (Box ES-2). As thenation focuses on obesity as a health problem and begins to address thesocietal and cultural issues that contribute to excess weight, poor foodchoices, and inactivity, many different stakeholders will need to make diffi-cult trade-offs and choices. However, as institutions, organizations, andindividuals across the nation begin to make changes, societal norms are
182

16 PREVENTING CHILDHOOD OBESITY
likely to change as well; in the long term, we can become a nation whereproper nutrition and physical activity that support energy balance at ahealthy weight will become the standard.
Recognizing the multifactorial nature of the problem, the committeedeliberated on how best to prioritize the next steps for the nation in pre-venting obesity in children and youth. The traditional method of prioritiz-ing recommendations of this nature would be to base these decisionson the strength of the scientific evidence demonstrating that specific inter-ventions have a direct impact on reducing obesity prevalence and to orderthe evidence-based approaches based on the balance between potentialbenefits and associated costs including potential risks. However, a robustevidence base is not yet available. Instead, we are in the midst of compilingthat much-needed evidence at the same time that there is an urgent need torespond to this epidemic of childhood obesity. Therefore, the committeeused the best scientific evidence available—including studies with obesity asthe outcome measure and studies on improving dietary behaviors, increas-ing physical activity levels, and reducing sedentary behaviors, as well asyears of experience and study on what has worked in addressing similarpublic health challenges—to develop the recommendations presented inthis report.
As evidence was limited, yet the health concerns are immediate andwarrant preventive action, it is an explicit part of the committee’s recom-mendations that all the actions and initiatives include evaluation efforts tohelp build the evidence base that continues to be needed to more effectivelyfight this epidemic.
From the ten recommendations presented above, the committee hasidentified a set of immediate steps based on the short-term feasibility of theactions and the need to begin a well-rounded set of changes that recognizethe diverse roles of multiple stakeholders (Table ES-1). In discussions andinteractions that have already begun and will follow with this report, each
BOX ES-2Summary of Findings and Conclusions
• Childhood obesity is a serious nationwide health problem requiring urgent at-tention and a population-based prevention approach so that all children maygrow up physically and emotionally healthy.
• Preventing obesity involves healthful eating behaviors and regular physicalactivity—with the goal of achieving and maintaining energy balance at a healthyweight.
• Individual efforts and societal changes are needed. Multiple sectors and stake-holders must be involved.
183

EXECUTIVE SUMMARY 17
community and stakeholder group will determine their own set of prioritiesand next steps. Furthermore, action is urged for all areas of the report’srecommendations, as the list in Table ES-1 is only meant as a starting point.
The committee was also asked to set forth research priorities. There isstill much to be learned about the causes, correlates, prevention, and treat-ment of obesity in children and youth. Because the focus of this study is onprevention, the committee concentrated its efforts throughout the report onidentifying areas of research that are priorities for progress toward prevent-ing childhood obesity. The three research priorities discussed throughoutthe report are:
• Evaluation of obesity prevention interventions—The committee en-courages the evaluation of interventions that focus on preventing an in-crease in obesity prevalence, improving dietary behaviors, increasing physi-cal activity levels, and reducing sedentary behaviors. Specific policy,environmental, social, clinical, and behavioral intervention approachesshould be examined for their feasibility, efficacy, effectiveness, andsustainability. Evaluations may be in the form of randomized controlledtrials and quasi-experimental trials. Cost-effectiveness research should bean important component of evaluation efforts.
• Behavioral research—The committee encourages experimental re-search examining the fundamental factors involved in changing dietarybehaviors, physical activity levels, and sedentary behaviors. This researchshould inform new intervention strategies that are implemented and testedat individual, family, school, community, and population levels. This wouldinclude studies that focus on factors promoting motivation to change be-havior, strategies to reinforce and sustain improved behavior, identificationand removal of barriers to change, and specific ethnic and cultural influ-ences on behavioral change.
• Community-based population-level research—The committee en-courages experimental and observational research examining the most im-portant established and novel factors that drive changes in populationhealth, how they are embedded in the socioeconomic and built environ-ments, how they impact obesity prevention, and how they affect society atlarge with regard to improving nutritional health, increasing physical activ-ity, decreasing sedentary behaviors, and reducing obesity prevalence.
The recommendations that constitute this report’s action plan to pre-vent childhood obesity commence what is anticipated to be an energeticand sustained effort. Some of the recommendations can be implementedimmediately and will cost little, while others will take a larger economicinvestment and require a longer time for implementation and to see thebenefits of the investment. Some will prove useful, either quickly or over the
184

18 PREVENTING CHILDHOOD OBESITY
longer term, while others will prove unsuccessful. Knowing that it is impos-sible to produce an optimal solution a priori, we more appropriately adoptsurveillance, trial, measurement, error, success, alteration, and dissemina-tion as our course, to be embarked on immediately. Given that the health oftoday’s children and future generations is at stake, we must proceed with alldue urgency and vigor.
185

EXECUTIVE SUMMARY 19
TABLE ES-1 Immediate Steps
Federal government • Establish an interdepartmental task force andcoordinate federal actions
• Develop nutrition standards for foods and beveragessold in schools
• Fund state-based nutrition and physical-activity grantswith strong evaluation components
• Develop guidelines regarding advertising and marketingto children and youth by convening a nationalconference
• Expand funding for prevention intervention research,experimental behavioral research, and community-based population research; strengthen support forsurveillance, monitoring, and evaluation efforts
Industry and media • Develop healthier food and beverage product andpackaging innovations
• Expand consumer nutrition information• Provide clear and consistent media messages
State and local • Expand and promote opportunities for physical activitygovernments in the community through changes to ordinances,
capital improvement programs, and other planningpractices
• Work with communities to support partnerships andnetworks that expand the availability of and access tohealthful foods
Health-care professionals • Routinely track BMI in children and youth and offerappropriate counseling and guidance to children andtheir families
Community and nonprofit • Provide opportunities for healthful eating and physicalorganizations activity in existing and new community programs,
particularly for high-risk populations
State and local education • Improve the nutritional quality of foods and beveragesauthorities and schools served and sold in schools and as part of school-related
activities• Increase opportunities for frequent, more intensive and
engaging physical activity during and after school• Implement school-based interventions to reduce
children’s screen time• Develop, implement, and evaluate innovative pilot
programs for both staffing and teaching aboutwellness, healthful eating, and physical activity
Parents and families • Engage in and promote more healthful dietary intakesand active lifestyles (e.g., increased physical activity,reduced television and other screen time, morehealthful dietary behaviors)
186

187

21
Introduction
AN EPIDEMIC OF CHILDHOOD OBESITY
Children’s health in the United States has improved dramaticallyover the past century. Vaccines targeting previously common child-hood infections—such as measles, polio, diphtheria, tetanus, ru-
bella, and Haemophilus influenza—have nearly eliminated these scourges.Through the widespread availability of potable water, improved sanitation,and antibiotics, diarrheal diseases and infectious diseases such as tuberculo-sis and pneumonia have diminished in frequency and as primary causes ofinfant and child deaths in the United States (CDC, 1999). Pervasive foodscarcity and essential vitamin and mineral deficiencies have largely disap-peared in the U.S. population (IOM, 1991; Kessler, 1995). The net result isthat infant mortality has been lowered by over 90 percent, contributing tothe substantial increase in life expectancy—more than 30 years—since 1900(CDC, 1999). Innovations such as seatbelts, child car seats, and bike hel-mets, meanwhile, have contributed to improved children’s safety, and fluo-ridation of municipal drinking water has enhanced child and adolescentdentition (CDC, 1999).
Given this steady trajectory toward a healthier childhood and healthierchildren, we begin the 21st century with a startling setback—an epidemic1
1
1The term “epidemic” is used in reference to childhood obesity as there have been anunexpected and excess number of cases on a steady increase in recent decades.
188
22 PREVENTING CHILDHOOD OBESITY
of childhood obesity. This epidemic is occurring in boys and girls in all 50states, in younger children as well as in adolescents, across all socioeco-nomic strata, and among all ethnic groups—though specific subgroups,including African Americans, Hispanics, and American Indians, are dispro-portionately affected (Ogden et al., 2002; Caballero et al., 2003). At a timewhen we have learned that excess weight has significant and troublesomehealth consequences, we nevertheless see our population, in general, andour children, in particular, gaining weight to a dangerous degree and at analarming rate.
The increasing prevalence of childhood obesity throughout the UnitedStates has led policy makers to rank it as a critical public health threat forthe 21st century (Koplan and Dietz, 1999; Mokdad et al., 1999, 2000;DHHS, 2001). Over the past three decades since the 1970s, the prevalenceof childhood obesity (defined in this report as a gender- and age-specificbody mass index [BMI] at or above the 95th percentile on the 2000 CDCBMI charts) has more than doubled for preschool children aged 2 to 5 yearsand adolescents aged 12 to 19 years, and it has more than tripled forchildren aged 6 to 11 years (see Chapter 2; Ogden et al., 2002). Approxi-mately nine million American children over 6 years of age are alreadyconsidered obese. These trends mirror a similar profound increase in U.S.adult obesity and co-morbidities over a comparable time frame, as well as aconcurrent rise in the prevalence of childhood and adult obesity and relatedchronic diseases internationally, in developed and developing countries alike(WHO, 2002, 2003; Lobstein et al., 2004).
IMPLICATIONS FOR CHILDREN AND SOCIETY AT LARGE
Many of us consider our weight and height as personal statistics, pri-marily our own, and occasionally our physician’s concern. Our weight issomething we approximate on forms and applications requiring this infor-mation. Body size has been a cosmetic issue rather than a health issuethroughout most of human history, but scientific study has changed thisview. One’s aesthetic preference for a lean versus a plump body type may berelated to personal taste, cultural and social norms, and association of bodytype with wealth or well-being. However, the implications of a wholesaleincrease in BMIs are increasingly becoming a public health problem. Thus,we need to acknowledge the sensitive personal dimension of height andweight, while also viewing weight as a public health issue, especially as theweight levels of children, as a population, are proceeding on a harmfulupward trajectory.
The as yet unabated epidemic of childhood obesity has significant rami-fications for children’s physical health, both in the immediate and longterm, given that obesity is linked to several chronic disease risks. In a
189

INTRODUCTION 23
population-based sample, approximately 60 percent of obese children aged5 to 10 years had at least one physiological cardiovascular disease (CVD)risk factor—such as elevated total cholesterol, triglycerides, insulin, or bloodpressure—and 25 percent had two or more CVD risk factors (Freedman etal., 1999).
The increasing incidence of type 2 diabetes in young children (previ-ously known as adult onset diabetes) is particularly startling. For individu-als born in the United States in 2000, the lifetime risk of being diagnosedwith diabetes at some point in their lives is estimated at 30 percent for boysand 40 percent for girls if obesity rates level off (Narayan et al., 2003).2 Theestimated lifetime risk for developing diabetes is even higher among ethnicminority groups at birth and at all ages (Narayan et al., 2003). Type 2diabetes is rapidly becoming a disease of children and adolescents. In casereports limited to the 1990s, type 2 diabetes accounted for 8 to 45 percentof all new childhood cases of diabetes—in contrast with fewer than 4percent before the 1990s (Fagot-Campagna et al., 2000). Young people arealso at risk of developing serious psychosocial burdens related to beingobese in a society that stigmatizes this condition, often fostering shame,self-blame, and low self-esteem that may impair academic and social func-tioning and carry into adulthood (Schwartz and Puhl, 2003).
The growing obesity epidemic in children, and in adults, affects notonly the individual’s physical and mental health but carries substantialdirect and indirect costs for the nation’s economy as discrimination, eco-nomic disenfranchisement, lost productivity, disability, morbidity, and pre-mature death take their tolls (Seidell, 1998). States and communities areobliged to divert resources to prevention and treatment, and the nationalhealth-care system is burdened with the co-morbidities of obesity such astype 2 diabetes, hypertension, CVD, osteoarthritis, and cancer (Ebbeling etal., 2002).
The obesity epidemic may reduce overall adult life expectancy (Fontaineet al., 2003) because it increases lifetime risk for type 2 diabetes and otherserious chronic disease conditions (Narayan et al., 2003), thereby poten-tially reversing the positive trend achieved with the reduction of infectiousdiseases over the past century. The great advances of genetics and otherbiomedical discoveries could be more than offset by the burden of illness,disability, and death caused by too many people eating too much andmoving too little over their lifetimes.
2These projections are based on data on the lifetime risk of diagnosed diabetes and do notaccount for undiagnosed cases. The data do not allow for differentiation between type 1 andtype 2 diabetes. However, the major form of diabetes in the U.S. population is type 2, whichaccounts for an estimated 95 percent of diabetes cases (Narayan et al., 2003).
190
24 PREVENTING CHILDHOOD OBESITY
Aside from the statistics, we can see the evidence of childhood obesityin our community schoolyards, in shopping malls, and in doctors’ offices.There are confirmatory journalistic reports of the epidemiologic trends inweight—from resizing of clothing to larger coffins to more spacious easychairs to the increased need for seatbelt extenders. These would be ofpassing interest and minimal importance were it not for the considerablehealth implications of this weight gain for both adults and children. Forexample, compared with adults of normal weight, adults with a BMI of 40or more have a seven-fold increased risk for diagnosed diabetes (Mokdad etal., 2003). Indeed, the obesity epidemic places at risk the long-term welfareand readiness of the U.S. military services by reducing the pool of individu-als eligible for recruitment and decreasing the retention of new recruits.Nearly 80 percent of recruits who exceed the military accession weight-for-height standards at entry leave the military before they complete their firstterm of enlistment (IOM, 2003).
What might our population look like in the year 2025 if we continue onthis course? In a land of excess calories ingested and insufficient energyexpended, the inevitable scenario is a continued increase in average bodysize and an altered concept of what is “normal.” Americans with a BMIbelow 30 will be considered small and obesity will no longer be newswor-thy but accepted as the social norm.
While the existence and importance of the increase in the population-wide obesity problem are no longer debated, we are still mustering thedetermination to forge effective solutions. We must remind ourselves thatsocial changes to transform public perceptions and behaviors regardingseatbelt use, smoking cessation, breastfeeding, and recycling would havesounded unreasonable just a few decades ago (Economos et al., 2001), yetwe have acted vigorously and with impressive results. How to proceedsimilarly in meeting the formidable childhood obesity challenge is the focusof this Institute of Medicine (IOM) report.
The 19-member IOM committee was charged with developing a pre-vention-focused action plan to decrease the prevalence of obesity in chil-dren and youth in the United States. The primary emphasis of thecommittee’s task was on examining the behavioral and cultural factors,social constructs, and other broad environmental factors involved in child-hood obesity and identifying promising approaches for prevention efforts.This report presents the committee’s recommendations for many differentsegments of society from federal, state, and local governments (Chapter 4),to industry and media (Chapter 5), local communities (Chapter 6), schools(Chapter 7), and parents and families (Chapter 8).
191

INTRODUCTION 25
CONTEXTS FOR ACTION
Investigating the causes of childhood obesity, determining what to doabout them, and taking appropriate action must address the variables thatinfluence both eating and physical activity. Seemingly straightforward, thesevariables result from complex interactions across a number of relevantsocial, economic, cultural, environmental, and policy contexts.
U.S. children live in a society that has changed dramatically in the threedecades over which the obesity epidemic has developed. Many of thesechanges, such as both parents working outside the home, often affect deci-sions about what children eat, where they eat, how much they eat, and theamount of energy they expend in school and leisure time activities (Ebbelinget al., 2002; Hill et al., 2003).
Other changes, such as the increasing diversity of the population, influ-ence cultural views and marketing patterns. Lifestyle modifications, in partthe result of media usage and content together with changes in the physicaldesign of communities, affect adults’ and children’s levels of physical activ-ity. Many of the social and cultural characteristics that the U.S. populationhas accepted as a normal way of life may collectively contribute to thegrowing levels of childhood obesity. The broad societal trends that impactweight outcomes are complex and clearly multifactorial. With such societalchanges, it is difficult to tease out the quantitative and qualitative role ofindividual contributing factors. While distinct causal relationships may bedifficult to prove, the dramatic rise in childhood obesity prevalence must beviewed within the context of these broad societal changes.
An understanding of these contexts, particularly regarding their poten-tial to be modified and how they may facilitate or impede development of acomprehensive obesity prevention strategy, is therefore essential. This nextsection provides a useful background to understand the multidimensionalnature of the childhood obesity epidemic.
Lifestyle and Demographic Trends
The interrelated areas of family life, ethnic diversity, eating patterns,physical activity, and media use—discussed below—are all aspects of soci-etal change that must be considered. Singly and in concert, the trends inthese areas will strongly influence prospects for preventive and correctivemeasures.
Family Life
The changing context of American families includes several distincttrends such as the shifting role of women in society, delayed marriage,
192

26 PREVENTING CHILDHOOD OBESITY
childbearing outside of marriage, higher divorce rates, single parenthood,and work patterns of parents (NRC, 2003). Among the many importanttransformations that have occurred are expanded job opportunities forwomen, which have led to more women entering the workforce. Economicnecessities have also prompted this trend. Moreover, married mothers areincreasingly more likely than they were in the past to remain in the laborforce throughout their childbearing years.
Women’s participation in the labor force increased from 36 percent in1960 to 58 percent in 2000 (Luckett Clark and Weismantle, 2003). Since1975, the labor force participation rate of mothers with children under age18 has grown from 47 to 72 percent, with the largest increase amongmothers with children under 3 years of age (U.S. Department of Labor,2004). Over the same period, men’s labor force participation rates declinedslightly from 78 percent to 74 percent (Population Reference Bureau,2004b). In 2002, only 7 percent of all U.S. households consisted of marriedcouples with children in which only the husband worked.
These trends, together with lower fertility rates, a decrease in averagehousehold size, and the shift in household demographics from primarilymarried couples with children to single person households and householdswithout children, have caused the number of meal preparers in U.S. house-holds who cook for three or more people to decline (Population ReferenceBureau, 2003; Sloan, 2003).
It has been suggested that smaller households experience fewer econo-mies of scale in home preparation of meals than do larger families. Prepar-ing food at home involves a set amount of time for every meal that changesminimally with the number of persons served. Eating meals out involves thesame marginal costs per person. Moreover, changes in salary and the lowerprices of prepared foods may have reduced the value of time previouslyused to prepare at-home meals. Thus, incentives have been shifted awayfrom home production toward eating more meals away from home (Sturm,2004). Time-use trends for meal preparation at home reveal a gradualdecline from 1965 to 1985 (44 minutes per day versus 39 minutes per day)and a steeper decline from 1985 to 1999 (39 minutes per day versus 32minutes per day) (Robinson and Godbey, 1999; Sturm, 2004).
Ethnic Diversity
The racial and ethnic composition of children in the United States isbecoming more diverse. In 2000, 64 percent of U.S. children were whitenon-Hispanic, 15 percent were black non-Hispanic, 4 percent were Asian/Pacific Islander, and 1 percent were American Indian/Alaska Native. Theproportion of children of Hispanic origin has increased more rapidly thanthe other racial and ethnic groups from 9 percent of the child population in
193
INTRODUCTION 27
1980 to 16 percent in 2000 (Federal Interagency Forum on Child andFamily Statistics, 2003).
Differences among ethnic groups (e.g., African American, AmericanIndian, Hispanic, and Asian/Pacific Islanders) include variations in house-hold composition and size—particularly larger household size in Hispanicand Asian populations (Frey, 2003)—and in other aspects of family lifesuch as media use and exposure, consumer behavior, eating, and physicalactivity patterns (Tharp, 2001; Nesbitt et al., 2004).
Ethnic minorities are projected to comprise 40.2 percent of the U.S.population by 2020 (U.S. Census Bureau, 2001), and the food preferencesof ethnic families are expected to have a significant impact on consumers’food preferences and eating patterns (Sloan, 2003). The higher-than-aver-age prevalence of obesity in several ethnic minority populations may indi-cate differences in susceptibility to unfavorable lifestyle trends and theconsequent need for specially designed preventive and corrective strategies(Kumanyika, 2002; Nesbitt et al., 2004).
Eating Patterns
As economic demands and the rapid pace of daily life increasinglyconstrain people’s time, food trends have been marked by convenience,shelf stability, portability, and greater accessibility of foods throughout theentire day (Food Marketing Institute, 1996, 2003; French et al., 2001;Sloan, 2003). Food has become more available wherever people spend time.Because of technological advances, it is often possible to acquire a variety ofhighly palatable foods, in larger portion sizes, and at relatively low cost.Research has revealed a progressive increase, from 1977 to 1998, in theportion sizes of many types of foods and beverages available to Americans(Nielsen and Popkin, 2003; Smiciklas-Wright et al., 2003); and the concur-rent rise in obesity prevalence has been noted (Nestle, 2003; Rolls, 2003).
Foods eaten outside the home are becoming more important in deter-mining the nutritional quality of Americans’ diets, especially for children(Lin et al., 1999b; French et al., 2001). Consumption of away-from-homefoods comprised 20 percent of children’s total calorie intake in 1977-1978and rose to 32 percent in 1994-1996 (Lin et al., 1999b). In 1970, householdincome spent on away-from-home foods accounted for 25 percent of totalfood spending; by 1999, it had reached nearly one-half (47 percent) of totalfood expenditures (Clauson, 1999; Kennedy et al., 1999).
The trend toward eating more meals in restaurants and fast food estab-lishments may be influenced not only by simple convenience but also inresponse to needs such as stress management, relief of fatigue, lack of time,and entertainment. According to a 1998 survey conducted by the NationalRestaurant Association, two-thirds of Americans indicated that patronizing
194

28 PREVENTING CHILDHOOD OBESITY
a restaurant with family or friends allowed them to socialize and was abetter use of their leisure time than cooking at home and cleaning upafterward (Panitz, 1999).
For food consumed at home, never has so much been so readily avail-able to so many—that is, to virtually everyone in the household—at lowcost and in ready-to-eat or ready-to-heat form (French et al., 2001; Sloan,2003). Increased time demands on parents, especially working mothers,have shifted priorities from parental meal preparation toward greater con-venience (French et al., 2001), and the effects of time pressures are seen inworking mothers’ reduced participation in meal planning, shopping, andfood preparation (Crepinsek and Burstein, 2004). Industry has endeavoredto meet this demand through such innovations as improved packaging andlonger shelf stability, along with complementary technologies, such as mi-crowaves, that have shortened meal preparation times.
Another aspect of this trend toward convenience is an increased preva-lence, across all age groups of children and youth, of frequent snacking andof deriving a large proportion of one’s total daily calories from energy-dense snacks (Jahns et al., 2001). At the same time, there has been adocumented decline in breakfast consumption among both boys and girls,generally among adolescents (Siega-Riz et al., 1998) and in urban elemen-tary school-age children as compared to their rural and suburban counter-parts (Gross et al., 2004); further, children of working mothers are morelikely to skip meals (Crepinsek and Burstein, 2004).
There are also indications that children and adolescents are not meetingthe minimum recommended servings of five fruits and vegetables dailyrecommended by the Food Guide Pyramid (Cavadini et al., 2000; AmericanDietetic Association, 2004). This trend is partially explained by the limitedvariety of fruits and vegetables consumed by Americans. In 2000, fivevegetables—iceberg lettuce, frozen potatoes, fresh potatoes, potato chips,and canned tomatoes—accounted for 48 percent of total vegetable servingsand six fruits (out of more than 60 fruit products)—orange juice, bananas,apple juice, apples, fresh grapes, and watermelon—accounted for 50 per-cent of all fruit servings (Putnam et al., 2002).
These trends have contributed to an increased availability and con-sumption of energy-dense foods and beverages. As summarized in Table1-1 and Figures 1-1 through 1-3, trends in the dietary intake of the generalU.S. population parallel trends in the dietary intake of children and youth.A more in-depth discussion of caloric intake, energy balance, energy den-sity, Dietary Guidelines for Americans, and the Food Guide Pyramid isincluded in Chapters 3, 5, and 7.
195

INTRODUCTION 29
Physical Activity
Physical activity is often classified into different types including recre-ational or leisure time, utilitarian, household, and occupational. The directsurveillance of physical activity trends in U.S. adults began only in the1980s and was limited to characterizing leisure-time physical activity. In2001, CDC began collecting data on the overall frequency and duration oftime spent in household, transportation, and leisure-time activity of bothmoderate and vigorous intensity in a usual week through the state-basedBehavioral Risk Factor Surveillance System (BRFSS) (CDC, 2003c).
National surveys conducted over the past several decades suggest anincrease in population-wide physical activity levels among American men,women, and older adolescents; however, a large proportion of these popu-lations still do not meet the federal guidelines for recommended levels oftotal daily physical activity.3 The data for children’s and youth’s leisuretime and physical activity levels reveal a different picture than the adultphysical activity trend data that are summarized in Table 1-2.
Trend data collected by the Americans’ Use of Time Study, throughtime-use diaries, indicated that adults’ free time increased by 14 percentbetween 1965 and 1985 from 35 hours to an average total of nearly 40hours per week (Robinson and Godbey, 1999). Data from other popula-tion-based surveys, including the National Health Interview Survey, Na-tional Health and Nutrition Examination Survey (NHANES), BRFSS, andthe Family Interaction, Social Capital and Trends in Time Use Data (1998-1999), together with trend data on sports and recreational participation,suggest minor to significant increases in reported leisure-time physical ac-tivity among adults (Pratt et al., 1999; French et al., 2001; Sturm, 2004).
Data from the 1990-1998 BRFSS4 revealed only a slight increase inself-reported physical activity levels among adults (from 24.3 percent in1990 to 25.4 percent in 1998), and a decrease in respondents reporting nophysical activity at all (from 30.7 percent in 1990 to 28.7 percent in 1998)(CDC, 2001).
Women, older adults, and ethnic minority populations have been iden-tified as having the greatest prevalence of leisure-time physical inactivity(CDC, 2004b). In general, the prevalence of self-reported, no leisure-timephysical activity was highest in 1989, and declined to its lowest level in 15years among all groups in 35 states and the District of Columbia based on
3The Surgeon General’s report on physical activity and health suggests that significanthealth benefits can be obtained by Americans who include a moderate amount of physicalactivity (e.g., 30 minutes of brisk walking) on most if not all days of the week (DHHS, 1996).
4The BRFSS is a population-based, randomly selected, self-reported telephone survey con-ducted among the noninstitutionalized U.S. adult population aged 18 years and older through-out the 50 states (CDC, 2003c).
196

30T
AB
LE
1-1
Tre
nds
in F
ood
Ava
ilabi
lity
and
Die
tary
Int
ake
of t
he U
.S.
Popu
lati
on a
nd o
f U
.S.
Chi
ldre
n an
d Y
outh
a
Die
tary
Int
ake
Tre
ndU
.S.
Popu
lati
onU
.S.
Chi
ldre
n an
d Y
outh
Port
ion
size
s of
foo
dsPo
rtio
n si
zes
of m
ost
food
s co
nsum
ed b
y ad
ults
Port
ion
size
s fo
r ch
ildr
en a
ged
2 ye
ars
and
olde
rbo
th a
t ho
me
and
away
fro
m h
ome
(exc
ept
incr
ease
d fo
r m
ost
food
s co
nsum
ed b
oth
at h
ome
and
pizz
a) i
ncre
ased
bet
wee
n 19
77 a
nd 1
996
away
fro
m h
ome
betw
een
1977
and
199
6 (N
iels
en(N
iels
en a
nd P
opki
n, 2
003)
.an
d Po
pkin
, 20
03).
Tot
al e
nerg
y in
take
der
ived
Tot
al e
nerg
y in
take
inc
reas
ed f
rom
18%
to
34%
Tot
al e
nerg
y in
take
inc
reas
ed f
rom
20%
to
32%
for
from
aw
ay-f
rom
-hom
efo
r ad
ults
bet
wee
n 19
77-1
978
and
1995
chil
dren
bet
wee
n 19
77-1
978
and
1994
-199
6so
urce
s(L
in e
t al
., 1
999a
).(L
in e
t al
., 1
999b
).
Tot
al e
nerg
y in
take
Bet
wee
n 19
71 a
nd 2
000,
ave
rage
ene
rgy
inta
keN
o si
gnif
ican
t in
crea
sed
tren
ds i
n en
ergy
int
ake
wer
ein
crea
sed
from
2,4
50 t
o 2,
618
calo
ries
for
men
obse
rved
in
chil
dren
age
d 6-
11 y
ears
bet
wee
n 19
77-
and
1,54
2 to
1,8
77 k
cal
for
wom
en (
CD
C,
1978
and
199
4-19
96,
1998
(E
nns
et a
l.,
2002
).20
04a)
.T
otal
cal
orie
s co
nsum
ed b
y ad
oles
cent
boy
s ag
edB
etw
een
1989
and
1991
and
199
4-19
96,
tota
l12
to
19 y
ears
inc
reas
ed b
y 24
3 be
twee
n 19
77-
ener
gy i
ncre
ased
8.6
% a
nd 9
.5%
, ac
cord
ing
to19
78 a
nd 1
994-
1996
fro
m 2
,523
to
2,76
6fo
od s
uppl
y an
d C
SFII
dat
a, r
e spe
c tiv
e ly
c alo
rie s
(E
nns
e t a
l.,
2003
). T
otal
cal
orie
s (
Cha
nmug
am e
t al
., 2
003)
.c o
nsum
ed b
y ad
ole s
c ent
gir
ls a
ged
12 t
o 19
yea
rsin
c re a
sed
by 1
23 b
e tw
e en
1977
-197
8 an
d 19
94-1
996
Be t
we e
n 19
83 a
nd 2
000,
cal
orie
s pe
r c a
pita
from
1,7
87 t
o 1,
910
c alo
rie s
(E
nns
e t a
l.,
2003
).in
c re a
sed
by 2
0% (
USD
A,
2003
) (F
igur
e 1-
1).
Tot
al f
at c
onsu
mpt
ion
Be t
we e
n 19
71 a
nd 2
000,
the
pe r
c ent
age
ofB
e tw
e en
1965
and
199
6, t
he p
ropo
rtio
n of
ene
rgy
calo
rie s
fro
m t
otal
fat
de c
reas
e d f
or m
en (
from
from
tot
al f
at c
onsu
med
by
c hil
dre n
de c
reas
e d f
rom
36.9
%to
32.
8%)
and
wom
en (
from
36.
1% t
o39
% t
o 32
%,
and
satu
rate
d fa
t fr
om 1
5% t
o 12
%32
.8%
) (C
DC
, 20
04a)
. H
owev
e r,
the
inta
ke o
f(C
avad
ini
e t a
l.,
2000
).gr
ams
of t
otal
fat
inc
reas
e d a
mon
g w
omen
and
dec r
e ase
d am
ong
men
(C
DC
, 20
04a)
Chi
ldre
n ag
ed 6
to
11 y
ears
in
1994
-199
6, 1
998
(Fig
ure
1-2)
.c o
nsum
ed 2
5% o
f c a
lori
e s f
rom
dis
c re t
iona
ry f
at(U
SDA
, 20
00;
Enn
s e t
al.
, 20
02).
197

31Fo
r ad
oles
cent
s ag
ed 1
2 to
19
year
s, g
irls
con
sum
ed25
% a
nd b
oys
cons
umed
26%
of
thei
r ca
lori
es f
rom
adde
d fa
t (U
SDA
, 20
00;
Enn
s et
al.
, 20
03).
Add
ed d
ieta
ry s
wee
tene
rsB
etw
een
1977
and
200
0, a
n 83
cal
orie
/day
Chi
ldre
n ag
ed 6
to
11 y
ears
in
1994
to
1996
and
199
8in
crea
se i
n ca
lori
c sw
eete
ners
was
obs
erve
dco
nsum
ed 2
1-23
tea
spoo
ns o
f ad
ded
suga
rs i
n a
in t
he U
.S.
for
all
indi
vidu
als
2 ye
ars
and
olde
r,1,
800-
2,00
0 ca
lori
e di
et w
hich
exc
eede
d th
e Fo
odre
pres
enti
ng a
22%
inc
reas
e in
the
pro
port
ion
Gui
de P
yram
id r
ecom
men
dati
on o
f 6-
12 t
easp
oons
of e
nerg
y de
rive
d fr
om c
alor
ic s
wee
tene
rsfo
r a
1,60
0-2,
200
calo
rie
diet
(U
SDA
, 19
96;
Enn
s et
(Pop
kin
and
Nie
lsen
, 20
03).
al.,
200
2).
Bet
wee
n 19
82 a
nd 1
997,
per
cap
ita
cons
umpt
ion
of s
wee
tene
rs i
ncre
ased
28%
(34
pou
nds)
(Put
nam
and
Ger
rior
, 19
99).
Dai
ry a
nd m
ilk
cons
umpt
ion
Bet
wee
n 19
70 a
nd 1
997,
the
con
sum
ptio
n of
Mil
k co
nsum
ptio
n de
crea
sed
by 3
7% i
n ad
oles
cent
mil
k pe
r ca
pita
dec
reas
ed f
rom
31
gall
ons
tobo
ys a
nd 3
0% i
n ad
oles
cent
gir
ls b
etw
een
1977
-24
gal
lons
, w
hile
che
ese
cons
umpt
ion
incr
ease
d19
78 a
nd 1
994
(Cav
adin
i et
al.
, 20
00).
146%
fro
m 1
1 po
unds
/per
son
in 1
970
to 2
8po
unds
/per
son
in 1
997
(Fre
nch
et a
l.,
2001
).In
197
7-19
78,
chil
dren
age
d 6
to 1
1 ye
ars
cons
umed
four
tim
e s a
s m
uch
mil
k as
any
oth
e r b
e ve r
age ,
and
Am
e ric
ans
c ons
umed
2.5
tim
e s a
s m
uch
c he e
sead
ole s
c ent
s ag
ed 1
2 to
19
year
s dr
ank
1.5
tim
e s a
san
d dr
ank
23%
le s
s m
ilk
per
c api
ta i
n 19
97m
uch
mil
k as
any
oth
e r b
e ve r
age .
In
1994
-199
6 an
dth
an i
n 19
70 (
Putn
am a
nd G
e rri
or,
1999
).19
98,
c hil
dre n
age
d 6
to 1
1 c o
nsum
ed 1
.5 t
ime s
as
muc
h m
ilk
as s
oft
drin
ks,
and
by 1
994-
1996
adol
e sc e
nts
c ons
umed
tw
ice
as m
uch
soft
dri
nks
asm
ilk
(Fre
nch
e t a
l.,
2001
).
c on
tin
ued
198

32
Ado
lesc
ent
inta
ke o
f w
hole
mil
k de
crea
sed
whi
lech
eese
inc
reas
ed.
In
1994
-199
6, f
or a
dole
scen
tsag
ed 1
2 to
19
year
s, o
nly
12%
of
girl
s an
d 30
% o
fbo
ys c
onsu
med
the
num
ber
of d
airy
ser
ving
sre
com
men
ded
by t
he F
ood
Gui
de P
yram
id (
USD
A,
2000
; E
nns
et a
l.,
2002
, 20
03).
Frui
t an
d ve
geta
ble
In 1
997,
Am
eric
ans
cons
umed
24%
mor
e fr
uit
In 1
977-
1978
chi
ldre
n ag
ed 6
to
11 y
ears
con
sum
edco
nsum
ptio
nan
d ve
geta
bles
per
cap
ita
than
the
y di
d in
mor
e to
tal
vege
tabl
es t
han
chil
dren
in
1994
-199
6,19
70 (
Fren
ch e
t al
., 2
001)
.19
98 (
Enn
s et
al.
, 20
02).
In
199
4-19
96,
1998
, on
ly24
% o
f gi
rls
and
23%
of
boys
con
sum
ed t
henu
mbe
r of
Foo
d G
uide
Pyr
amid
rec
omm
ende
d fr
uit
serv
ings
(U
SDA
, 20
00;
Enn
s et
al.
, 20
02).
In 1
994-
1996
ado
lesc
e nts
age
d 12
to
19 y
ears
, on
ly18
% o
f gi
rls
and
14%
of
boys
con
sum
ed t
henu
mbe
r of
Foo
d G
uide
Pyr
amid
re c
omm
ende
d fr
uit
serv
ings
(U
SDA
, 20
00;
Enn
s e t
al.
, 20
03).
Mea
t, p
oult
ry,
and
fish
Tot
al m
eat
c ons
umpt
ion
per
c api
ta i
ncre
ase d
In 1
994-
1996
and
199
8 th
e pe
rce n
tage
s of
chi
ldre
nc o
nsum
ptio
nby
19
lbs
from
197
0 to
200
0.
In 2
000,
aged
6 t
o 11
yea
rs a
nd a
dole
sce n
ts a
ged
12 t
o 19
yea
rsin
divi
dual
Am
e ric
ans
c ons
umed
16
poun
ds l
e ss
c ons
umin
g m
eat,
pou
ltry
, fi
sh,
and
e ggs
we r
e lo
we r
red
mea
t th
an i
n 19
70,
32 l
bs m
ore
poul
try,
than
in
1977
-197
8 (U
SDA
, 20
00;
Enn
s e t
al.
, 20
02,
and
3 lb
s m
ore
fish
and
she
llfi
sh20
03).
(Put
nam
et
al.,
200
2).
TA
BL
E 1
-1C
onti
nued
Die
tary
Int
ake
Tre
ndU
.S.
Popu
lati
onU
.S.
Chi
ldre
n an
d Y
outh
199

33B
ever
age
cons
umpt
ion
Ann
ual
soft
dri
nk c
onsu
mpt
ion
incr
ease
d fr
omSo
ft d
rink
con
sum
ptio
n ne
arly
tri
pled
am
ong
34.7
to
44.4
gal
lons
per
cap
ita
betw
een
adol
esce
nt b
oys
from
7 t
o 22
oun
ces
per
day
1987
-199
1 an
d 19
97 (
Fren
ch e
t al
., 2
001)
.be
twee
n 19
77-1
978
and
1994
(G
uthr
ie a
nd M
orto
n,20
00;
Fren
ch e
t al
., 2
003)
.Po
rtio
n si
zes
of s
oft
drin
ks i
ncre
ased
by
49ca
lori
es (
from
13.
1 to
19.
9 fl
oz)
bet
wee
n 19
77B
y 14
yea
rs o
f ag
e, 3
2% o
f ad
oles
cent
gir
ls a
ndan
d 19
96 (
Nie
lsen
and
Pop
kin,
200
3).
52%
of
adol
esce
nt b
oys
cons
ume
thre
e or
mor
e8-
ounc
e se
rvin
gs o
f so
da d
aily
(G
leas
on a
nd S
uito
r,20
01).
Chi
ldre
n as
you
ng a
s 7
mon
ths
old
are
cons
umin
gso
da (
Fox
et a
l.,
2004
).
NO
TE
: C
SFII
= C
onti
nuin
g Su
rvey
of
Food
Int
akes
by
Indi
vidu
als.
a Foo
d av
aila
bilit
y (p
er c
apit
a in
take
) is
bas
ed o
n fo
od s
uppl
y da
ta; d
ieta
ry in
take
tre
nds
are
base
d on
mea
sure
d or
sel
f-re
port
ed f
ood
cons
umpt
ion
data
.
200

34 PREVENTING CHILDHOOD OBESITY
0
100
200
300
400
500
600G
ram
s pe
r ca
pita
per
day
1970
1972
1974
1976
1978
1980
1982
1984
1986
1988
1990
1992
1994
1996
1998
2000
Carbohydrates
Total Fat
Protein
FIGURE 1-2 Percentage of calories from macronutrient intake for carbohydrates,protein, and total fat among adult men and women, 1970-2000.SOURCE: CDC, 2004a.
FIGURE 1-1 U.S. macronutrient food supply trends for carbohydrates, protein,and total fat, 1970-2000.SOURCES: Putnam et al., 2002; USDA, 2003.
0
10
20
30
40
50
60
1971-1974 1976-1980 1988-1994 1999-2000
Survey years
Per
cent
age
of c
alor
ies
Carbohydrates
Total Fat
Protein
201

INTRODUCTION 35
BRFSS data, although it is unclear why this occurred (CDC, 2004b). In2001, BRFSS respondents were asked to report the overall frequency andduration of time spent in household, transportation, and leisure-time activ-ity of both moderate and vigorous intensity (CDC, 2003c). Although 45.4percent of adults reported having engaged in physical activities consistentwith the recommendation of a minimum of 30 minutes of moderate inten-sity activity on most days of the week in 2001, more than one-half of U.S.adults (54.6 percent) were not sufficiently active to meet these recommen-dations (CDC, 2003c).
The physical activity trend data for children and youth are even morelimited than for adults. Most available information is on the physical activ-ity levels of high school youth, with limited data available on levels inyounger children. Based on the Youth Risk Behavior Survey (YRBS), dailyenrollment in physical education classes declined among high school stu-dents from 42 percent in 1991 to 25 percent in 1995 (DHHS, 1996) andincreased slightly to 28.4 percent in 2003 (CDC, 2004c). Cross-sectionaldata collected through the YRBS for 15,214 high school students indicatedthat one-third (33.4 percent) of 9th to 12th graders nationwide are notengaging in recommended levels of moderate or vigorous physical activity
1500
1700
1900
2100
2300
2500
2700
2900
1970 1974 1978 1982 1986 1990 1994 1998
Cal
orie
s pe
r pe
rson
per
day
Available Calories
Energy Intake (Men)
Energy Intake (Women)
FIGURE 1-3 Available calories from the U.S. food supply, adjusted for losses,a
and average energy intake for adult men and women,b 1970-2000.SOURCES: Putnam et al., 2002; CDC, 2004a.
aBased on USDA food supply data, calories from the U.S. food supply adjustedfor spoilage, cooking losses, plate waste, and other losses increased by 20 percentbetween 1983 and 2000 (Putnam et al., 2002; USDA, 2003).
bDietary intake trends and percentage of calories from macronutrient intake arebased on a CDC analysis of four NHANES, by survey year, for adult men andwomen aged 20 to 74 years from 1971 to 2000 for energy intake (kilocalories),protein, carbohydrates, total fat, and saturated fat (CDC, 2004a).
202

36 PREVENTING CHILDHOOD OBESITY
TABLE 1-2 Trends in Leisure Time and Physical Activity of U.S. Adults,Children, and Youth
Trend Adults Children and Youth
Available leisure Adults’ free time increased by From 1981 to 1997, childrentime 14% between 1965 and 1985 aged 3 to 12 years experienced
to an average of nearly 40 a decline in their free time byhours per week based on seven hours per week (Sturm,Americans’ Use of Time Study 2005a).(Robinson and Godbey, 1999).
Leisure-time There have been increases in An estimated 61.5% of childrenphysical activity reported leisure-time physical aged 9 to 13 years do not
activity among U.S. adults participate in any organizedbased on NHES, NHANES, physical activity during theirBRFSS, and trend data on nonschool hours and 22.6%sports and recreational do not engage in any free-participation (Pratt et al., time physical activity based1999; French et al., 2001). on the 2002 YMCLS (CDC,
2003a).There was a slight increase inself-reported physical activity From 1981 to 1997, childrenlevels among adults, based aged 3 to 12 years experiencedon the 1990-1998 BRFSS, an increase in time spent infrom 24.3% in 1990 to organized sports and outdoor25.4% in 1998 (CDC, 2001). activities (Sturm, 2005a).
There was a slight decrease inadults reporting no physicalactivity at all (from 30.7%in 1990 to 28.7% in 1998)(CDC, 2001).
Moderate to Based on the 2001 BRFSS, High school students in gradesvigorous physical 45.4% of adults reported 9 to 12 are not engaging inactivity having engaged in physical recommended levels of
activities consistent with the moderate or vigorous physicalrecommendation of a activity based on the YRBSminimum of 30 minutes of (CDC, 2003b, 2004c; seemoderate-intensity activity Chapter 7).on most days of the week in2001. However, 54.6% ofU.S. adults were notsufficiently active to meetthese recommendations(CDC, 2003c).
203

INTRODUCTION 37
and an estimated 10 percent report that they are inactive (CDC, 2003b,2004c; see Chapter 7).
In 2002, the CDC collected baseline data through the Youth MediaCampaign Longitudinal Survey (YMCLS), a nationally representative sur-vey of children aged 9 to 13 years and their parents, which revealed that61.5 percent of youth in this age group do not participate in any organizedphysical activity during their nonschool hours and 22.6 percent do notengage in any free-time physical activity (CDC, 2003a).
Shifts in transportation patterns can affect energy balance. Many tech-nological innovations have occurred over the past several decades such asthe increased availability of labor-saving devices in the home, a decline inphysically active occupations, and the dominance of automobiles for com-muting to work and personal travel (Cutler et al., 2003). National datatracking trends on the physical activity levels and leisure or discretionary
Physical education Not applicable Daily enrollment in physicalclasses education classes declined
among high school studentsfrom 42% in 1991 to 25% in1995 (DHHS, 1996) and 28.4%in 2003 (CDC, 2004c).
Travel to and Not applicable From 1977 to 2001, there wasfrom school a marked decline in children’s
walking to school as apercentage of total school tripsmade by children aged 5 to 15years from 20.2% to 12.5%(Sturm, 2005b).
An estimated 25% of childrenaged 5 to 15 years who livedwithin a mile of school walkedor bicycled at least once duringthe previous month based onthe 1999 HealthStyles Survey(CDC, 2002).
NOTE: BRFSS = Behavioral Risk Factor Surveillance System. NHES = National HealthExamination Survey. NHANES = National Health and Nutrition Examination Surveys.YMCLS = Youth Media Campaign Longitudinal Survey. YRBS = Youth Risk Behavior Survey.
TABLE 1-2 Continued
Trend Adults Children and Youth
204

38 PREVENTING CHILDHOOD OBESITY
time of younger children and pre-adolescents are limited. However, ananalysis of the available data for children aged 3 to 12 years from 1981 to1997 (Hofferth and Sandberg, 2001) suggests a decline in their free time bysix hours per week—attributed to an increase in time away from home instructured settings—and an increase in time spent in organized sports andoutdoor activities over this time frame (Sturm, 2005a). However, it is notpossible to determine the overall impact of these changes on children’sphysical activity levels.
One factor that has influenced overall transportation patterns in theUnited States is the change in the built environment. Through a number ofmediating factors, the built environment can either promote or hinder physi-cal activity, although the role and influence of the built environment onphysical activity levels is a relatively new area of investigation. The ways inwhich land is developed and neighborhoods are designed may contribute tothe level of physical activity residents achieve as a natural part of their dailylives (Frank, 2000).
There have been many changes in the built environment over the pastcentury or more. For a variety of reasons, Americans moved away fromcentral cities to lower density suburbs, many of the most recent of whichnecessitate driving for transportation.
In these areas, streets were often built without sidewalks, residentialareas were segregated from other land uses, and shopping areas were de-signed for access by car. These characteristics discourage walking and bik-ing as a means of transportation, historically an important source of physi-cal activity.
Indeed, the amount of time that adults spend walking and biking fortransportation has declined in the past two decades, largely because peopleare driving more (Sturm, 2004). In addition, the more time that Americansspend traveling, the less time they have available for other forms of physicalactivity. In 2000, Americans spent nearly 26 minutes commuting to theirjobs, an increase from 22 minutes in 1990, and the average commuting timewas 30 minutes or more in 25 of the 245 cities with at least 100,000population (Population Reference Bureau, 2004a).
Children’s motorized vehicle travel to and from school has increased,though this represents a small proportion of their overall travel. The 2001National Household Travel Survey (NHTS) indicated that less than 15percent of children aged 5 to 15 years walked to or from school and 1percent bicycled (Bureau of Transportation Statistics, 2003). Even childrenliving relatively close to school do not walk to this destination. The 1999HealthStyles Survey found that among participating households, 25 percentof children aged 5 to 15 years who lived within a mile of school eitherwalked or bicycled at least once during the previous month (CDC, 2002).
From 1977 to 2001, there was a marked decline in children’s walking
205

INTRODUCTION 39
to school as a percentage of total school trips made by 5- to 15-year-oldsfrom 20.2 percent to 12.5 percent (Sturm, 2005b). Based on data collectedthrough the National Personal Transportation Surveys for 1977 and 1990,and the NHTS for 2001, there is little evidence of changes in walking triplength although distance traveled by bicycle has decreased (Sturm, 2005b).Although reduced physical activity has been identified as an unintendedconsequence of dependence on motorized travel, it is unclear how changesin children’s transportation patterns have reduced their overall physicalactivity levels (Sturm, 2005b).
Media
The presence of electronic media in children’s lives, and their time spentwith such media, has grown considerably and has increased the time spentin sedentary pursuits, often with reduced outside play time. In 1999, theaverage American child lived in a home with three televisions, three radios,three tape players, two video cassette recorders (VCRs), one video gameplayer, two compact disc players, and one computer (Roberts et al., 1999)(Figure 1-4). In 2003, nearly all children (99 percent) aged zero to six yearslived in a home with a television set and the average number of VCRs ordigital video discs (DVDs) in these young children’s homes was 2.3 (Rideoutet al., 2003). Television dominates the type of specific media used by chil-dren and youth and is the only form of electronic media for which trenddata are available. In 1950, approximately 10 percent of U.S. householdshad a television (Putnam, 1995) in comparison with 98 percent in 1999(Nielsen Media Research, 2000). The percent of American homes withmore than one television set rose from 35 percent in 1970 (Lyle andHoffman, 1972) to 88 percent in 1999 (Roberts et al., 1999). Moreover,there has been a ten-fold increase over the same period in the percent ofAmerican homes with three or more television sets (Rideout et al., 2003). In2003, one-half (50 percent) of children aged zero to six years had three ormore televisions, one-third (36 percent) had a television in their bedrooms,and nine out of ten children in this age range had watched television orDVDs (Rideout et al., 2003).
During a typical day, 36 percent of children watch television for onehour or less, 31 percent of children watch television for one to three hours,16 percent watch television for three to five hours, and 17 percent watchtelevision for more than 5 hours (Roberts et al., 1999) (Figure 1-5).
Two separate national data sources have tracked children’s and adoles-cents’ discretionary time spent watching television. Results indicate that theextent of television viewing differs by age, but also suggest an observeddecline in television watching by children under 12 years by approximatelyfour hours per week between 1981 and 1997 (Hofferth and Sandberg,
206

40 PREVENTING CHILDHOOD OBESITY
2001). Based on the Monitoring the Future Survey from 1990 to 2001,there was a steady decrease in heavy television watching (three hours ormore) among adolescents yet an observed increase in television viewing forone hour or less (Child Trends, 2002). Although children are using othertypes of electronic media including video games and computers (Roberts etal., 1999; Rideout et al., 2003), television viewing represents a significantamount of discretionary time among children and youth, which is a seden-tary and modifiable activity (see Chapter 8).
Consumer Attitudes and Public Awareness
Trends in media coverage suggest a striking increase in public interestin obesity. The International Food Information Council (IFIC) has beenfollowing U.S. and international media coverage of the obesity issue since
� �����
� �����
� �����
�����
�����
� �����
� �����
� ��
�
� ��
� �
� ��
� �
All Children Girls Boys White Minority2–7year olds
8–18year olds
FIGURE 1-4 Daily media use among children by age. Media use includes televi-sion, video games, radios, cassette tape players, VCRs, compact disc players, andcomputers.SOURCE: Rideout et al., 1999. This information was reprinted with permissionfrom the Henry J. Kaiser Family Foundation.
207

INTRODUCTION 41
1999 and has tracked a steady upward trend in the volume and breadth ofissues covered (IFIC, 2004) (Figure 1-6).
This media focus, independent of the longstanding popularity of weightcontrol as a consumer issue (Serdula et al., 1999), includes obesity-relatedtopics ranging from popular diets and quick weight loss strategies to litiga-tion against fast food restaurants to reports of new programs, policies, andresearch findings.
The media coverage on obesity is viewed by the public, parents, andother stakeholder groups in a variety of ways, depending on their personalbeliefs regarding issues such as personal responsibility, the role of govern-ment and other institutions in promoting personal freedoms, media influ-ences, free speech and the rights of advertisers, and the ways in whichparents should raise their children, as well as on consequent responses tovarious population level approaches being proposed to address obesity.
While some people place a high value on the individual’s right to choosewhat, when, where, and how to eat and be active, others are looking foradvice, information, and enhanced opportunities, and may even favor gov-ernment interventions that facilitate healthier choices (Kersh and Morone,2002).
1 Hour or Less19%
0 Hours17%
1 to 3 Hours31%
3 to 5 Hours16%
More than 5 Hours17%
FIGURE 1-5 Daily television viewing by children and youth in hours.SOURCE: Rideout et al., 1999. This information was reprinted with permissionfrom the Henry J. Kaiser Family Foundation.
208

42 PREVENTING CHILDHOOD OBESITY
Recent opinion polls indicate that a large number of adults and parentsare very concerned or somewhat concerned about childhood obesity (FieldResearch Corporation, 2003; Widmeyer Polling & Research, 2003). Forexample, a recent telephone survey of 1,068 randomly selected Californiaresidents suggested that for one out of three respondents, obesity-relatedbehaviors, especially unhealthy eating habits or the lack of physical activity,represent the greatest risk to California children (Field Research Corpora-tion, 2003). Although obesity is considered a health problem comparable tosmoking, some research suggests that it remains low on the list of Ameri-cans’ perceptions of serious health problems, which remain dominated bycancer, HIV/AIDS, and heart disease (Oliver and Lee, 2002; Lake SnellPerry & Associates, 2003; San Jose Mercury News/Kaiser Family Founda-tion, 2004). More recent national research shows that Americans are per-ceiving childhood obesity to be a serious problem, similar to tobacco use,underage drinking, and violence, but not as serious as drug abuse (Evans etal., 2004).
Families may vary in the value they place on different health outcomesrelated to obesity, and the merits they attribute to certain benefits or draw-backs of changing behaviors to address it (Whitaker, 2004). Research sug-gests that some parents do not perceive weight, per se, to be a health issuefor their children (Baughcum et al., 2000; Jain et al., 2001; Borra et al.,2003), independent of their child’s physical and social functioning. They
FIGURE 1-6 Trends in obesity-related media coverage, 1999-2004.SOURCE: IFIC, 2004. Reprinted, with permission. Copyright 2004 by the Interna-tional Food Information Council.
0
2000
4000
6000
8000
10000
12000
14000
16000 International
U.S.
1999 2000 2001 2002 2003 2004
Num
ber
of o
besi
ty-r
elat
ed m
edia
eve
nts
209

INTRODUCTION 43
think of their child as healthy if he or she has no serious medical conditions,and they embrace the hope that the overweight child will outgrow theproblem. They may also hesitate to raise weight-related issues due to theirconcerns that this may lower the child’s self-esteem and potentially encour-age him or her to develop an eating disorder. School-age children, however,do not generally view obesity as a health problem as long as it does notsignificantly affect appearance and performance (Borra et al., 2003). Beingobese, whether as a child or an adult, is highly stigmatized and viewed as amoral failing, among some educators (Price et al., 1987), health profession-als (Teachman and Brownell, 2001), and even very young children (Cramerand Steinwert, 1998; Latner and Stunkard, 2003).
Further, individuals and consumers vary in the priority they place onhealthy eating and an active lifestyle, and they hold a spectrum of views onhealth regarding weight management, weight control, and wellness(Buchanan, 2000; Strategy One, 2003). Consumer research reveals thatAmericans express not having enough time to fit everything into their daythat they would like to, with the consequence that their health may beneglected (Strategy One, 2003).
In a recent national poll of 1,000 U.S. adult respondents, half of therespondents viewed obesity as a public health problem that society needs tosolve while the other half considered it a personal responsibility or choicethat should be dealt with privately (Lake Snell Perry & Associates, 2003).
However, Americans do appear more uniformly willing to supportproactive actions to reduce obesity in children and youth, especially in theschool setting (Lake Snell Perry & Associates, 2003; Robert Wood JohnsonFoundation, 2003; Widmeyer Polling & Research, 2003). Childhood obe-sity presumably engenders more support for societal-level approaches be-cause children, who are thought to have less latitude in food and activitychoices than adults, are unlikely to be blamed by society for becomingobese. Understanding consumer perceptions and knowledge of publicawareness about obesity will be essential in order to design an effectivemultimedia and public relations campaign supporting obesity prevention(see Chapter 5).
Emerging Programs and Policies
As it has done with many other child health concerns, from whoopingcough, polio, and measles to use of toddlers’ seats in automobiles, theUnited States is now addressing the growing problem of childhood obesity.State legislatures, federal agencies, school boards, teachers, youth programs,parents, and others are mobilizing to address the array of interrelated issuesassociated with the development, and potential prevention, of childhoodobesity. Because adult overweight and obesity rates are even higher than
210

44 PREVENTING CHILDHOOD OBESITY
those of children, many efforts focus on improving eating habits and en-couraging physical activity for people of all ages.
The range of these efforts is quite broad, and many innovative ap-proaches are under way. As discussed throughout the report, many of theseefforts are occurring at the grassroots level—neighborhood-specific or com-munity-wide programs and activities encouraging healthy eating and pro-moting regular physical activity. A number of U.S. school districts, forinstance, have established new standards for the types of food and bever-ages that will be available in their school systems (Prevention Institute,2003). Many communities are examining the local availability of opportu-nities for physical activity and are working to expand bike paths and im-prove the walkability of neighborhoods. Further, community child- andyouth-centered organizations (such as the Girl Scouts and the Boys andGirls Clubs of America) are adding or expanding programs focused onincreasing physical activity. A national cross-sector initiative, ShapingAmerica’s Youth, supported by the private sector (industry), nonprofit or-ganizations, and the Department of Health and Human Services, is workingto compile a registry of the relevant ongoing research and interventionprograms across the country as well as funding sources. Evaluating theseefforts and disseminating those that are most effective will be the challengeand goal for future endeavors.
In many other countries where childhood obesity is a growing problem,including the United Kingdom, Sweden, Germany, France, Canada, andAustralia, a broad array of national and community-level efforts and policyoptions are being pursued. Among these are the banning of vending ma-chines in schools, developing restrictions for television advertising to chil-dren, and using taxes derived from energy-dense foods to support physicalactivity programs.
PUBLIC HEALTH PRECEDENTS
Public health problems of comparably broad scope and complexityhave been successfully addressed in the past (Economos et al., 2001), andthis experience gives us not only the confidence that childhood obesity toocan be moderated, even prevented, but supplies us with some of the neededtools. This solid public health history of achievements is exemplified in Box1-1 (CDC, 1999; Appendix D).
Many of these problems were not apparent at first, and grew to becomean accepted part of life before they were recognized and subsequently ad-dressed. For example, in 1900, with only approximately 8,000 cars on theroads, it was surely inconceivable that motor vehicle deaths could reach apeak of 56,278 per year in 1972 (U.S. Department of Transportation,1995; Waller, 2002). Multifocal interventions on vehicular safety and high-
211

INTRODUCTION 45
way improvements have enabled us to make great progress in reducingmotor vehicle deaths from this peak (Bolen et al., 1997; NSC, 1997). As thenumber of miles driven in the United States rose from 206 billion in 1930 to2,467 billion in 1996, the death rate per 100 million miles declined dra-matically from 15.97 in 1930 to 1.76 in 1996 (NSC, 1997; IOM, 1999).Even with this progress, however, we continue to record over 42,000 deathsa year from motor vehicle collisions (U.S. Department of Transportation,2004).
Early in the 20th century, when cigarettes were hand-rolled, few wouldhave predicted that cigarette smoking would become the major preventablecause of death in the United States a century later. Tobacco reform effortscan be traced back to the late 19th and early 20th century and were strength-ened in the 1940s and 1950s as epidemiological studies began to convincethe medical community and public about the health hazards of tobacco (Feeet al., 2002). In 1964, nearly 70 million people in the U.S. consumedtobacco on a regular basis; and according to the 1955 Current PopulationSurvey, two-thirds of men (68 percent) and one-third of women (32.4percent) 18 years and older were regular smokers of cigarettes. As revealedby these data, cigarette smoking was the social norm, its link with heart andlung diseases was not widely accepted, and the desire or ability to quitsmoking in that era was very low (DHHS, 1964). The reduction in nationalprevalence of cigarette smoking from 41.9 percent in 1965 to 23 percent in2001 (Kochanek and Smith, 2004) reflects changes in the social norms andthe positive influence of public health and policy interventions (PublicHealth Service, 1994; Economos et al., 2001).
BOX 1-1Ten Great Public Health Achievements
United States, 1900-1999
• Vaccination• Motor vehicle safety• Safer workplaces• Control of infectious disease• Decline in deaths from coronary heart disease and stroke• Safer and healthier foods• Healthier mothers and babies• Family planning• Fluoridation of drinking water• Recognition of tobacco use as a health hazard
SOURCE: CDC, 1999.
212

46 PREVENTING CHILDHOOD OBESITY
TABLE 1-3 Recommended Public Health Interventions Common toMultiple Health Behaviors and Conditions
Type of Intervention Health Behavior or Condition
Community-wide campaigns Physical activity**Motor vehicle occupant injuries*Oral health (water fluoridation)**
School-based interventions Physical activity**Oral health (sealants)**Vaccine preventable diseases (requirementfor school admission)*
Skin cancer*
Mass media strategies Tobacco initiation and cessation**Motor vehicle occupant injuries**
Laws and regulations Reducing exposure to secondhand smoke**Motor vehicle occupant injuries**
Provider reminder systems Vaccine preventable diseases**Tobacco cessation*
Reducing costs to patients Tobacco cessation*Vaccine preventable diseases**
Home visits Vaccine preventable diseases*Violence prevention**
* Sufficient Evidence.** Strong Evidence.
SOURCE: Task Force on Community Preventive Services, 2004.
Recently, intensive effort has been devoted to reviewing the evidenceof the effectiveness of community preventive services. The Guide to Com-munity Preventive Services (Task Force on Community Preventive Ser-vices, 2004) has completed an analysis of the evidence in nine major areas(two health behaviors, six specific health conditions, and one addressingthe social environment). Additional reports, including those central topreventing childhood obesity (e.g., school-based programs, communityfruit and vegetable consumption, consumer literacy, and food and nutri-tion policy) are forthcoming. In the nine health areas examined to date, theTask Force found that certain categories of interventions appear to havestrong evidence of effectiveness for multiple health behaviors and prob-lems (Table 1-3). Further, based on the experience to date from the Guide
213

INTRODUCTION 47
to Community Preventive Services, it appears that comprehensive pro-grams that involve communities, schools, mass media, health providers,and laws and regulations are most likely to be effective for a number ofhealth problems (see also Appendix D).
There is a general pattern to the interventions that have successfullyaddressed many of these public health problems (CDC, 1999). In nearly allcases, policy changes were followed by the emergence of new governmentleadership structures to effectively enforce the policies and oversee thedevelopment and implementation of pertinent programs. Such directionwas aided by improved surveillance methods, control measures, technolo-gies, and treatments, together with expanding systems of service deliveryand provider education. By organizing the experiences, principles, andstrategies underlying these multiple achievements into conceptual frame-works, we may likewise develop successful approaches to childhood obe-sity prevention.
SUMMARY
After working throughout the 20th century to improve children’s physi-cal health by reducing the incidence of disease and widening margins ofsafety, we now find ourselves bringing children into environments withsome decidedly less-than-healthful features—fewer opportunities to bephysically active and socially interactive, more opportunities to be seden-tary and passively entertained, and frequent temptations to consume in theabsence of hunger or need and to engage in other risky behaviors.
A complex of interacting cultural, social, economic, familial, and psy-chological issues have set the stage for these growing obesity risks forchildren. Although the need to take action to curb the epidemic is widelyacknowledged, the debate about what to do and how to do it is just begin-ning in earnest. Important insights can potentially be obtained from anexamination of past successes in overcoming, or at least alleviating, someother problems that also seemed insurmountable at first. Such insights arepresented as part of the committee’s charge to use theoretical and empiricalfindings to assess the potential utility of specific approaches within a com-prehensive childhood obesity prevention strategy.
This report provides a broad-based examination of the problem ofobesity in children and youth, and it presents an action plan—with recom-mendations on the roles and responsibilities of numerous stakeholders andmany sectors of society—for addressing this problem. The committee hopesthat the report will produce shared understandings and stimulate sustainedsocietal and lifestyle changes so that the current obesity trends among ourchildren and youth may be reversed.
214

48 PREVENTING CHILDHOOD OBESITY
REFERENCES
American Dietetic Association. 2004. Position of the American Dietetic Association: Dietaryguidance for healthy children ages 2 to 11 years. J Am Diet Assoc 104(4):660-677.
Baughcum AE, Chamberlin LA, Deeks CM, Powers SW, Whitaker RC. 2000. Maternal per-ceptions of overweight preschool children. Pediatrics 106(6):1380-1386.
Bolen JR, Sleet DA, Chorba T, Brewer R, Dellinger A, Wallace LJD, Johnson VR. 1997.Overview of efforts to prevent motor-vehicle-related injury. In: Prevention of MotorVehicle-Related Injuries: A Compendium of Articles from the Morbidity and MortalityWeekly Report, 1985-1996. Atlanta, GA: National Center for Injury Prevention andControl.
Borra ST, Kelly L, Shirreffs MB, Neville K, Geiger CJ. 2003. Developing health messages:Qualitative studies with children, parents, and teachers help identify communicationsopportunities for healthful lifestyles and the prevention of obesity. J Am Diet Assoc103(6):721-728.
Buchanan DR. 2000. An Ethic for Health Promotion. New York: Oxford University Press.Bureau of Transportation Statistics. 2003. National Household Travel Survey. [Online]. Avail-
able: http://www.bts.gov/programs/national_household_travel_survey/ [accessed July 27,2004].
Caballero B, Himes JH, Lohman T, Davis SM, Stevens J, Evans M, Going S, Pablo J. 2003.Body composition and overweight prevalence in 1704 schoolchildren from 7 AmericanIndian communities. Am J Clin Nutr 78:308-312.
Cavadini C, Siega-Riz AM, Popkin BM. 2000. US adolescent food intake trends from 1965 to1996. Arch Dis Child 83(1):18-24.
CDC (Centers for Disease Control and Prevention). 1999. Ten great public health achieve-ments—United States, 1990-1999. MMWR 48(12):241-243.
CDC. 2001. Physical activity trends—United States, 1990-1998. MMWR 50(9):166-169.CDC. 2002. Barriers to children walking and bicycling to school—United States, 1999.
MMWR 51(32):701-704.CDC. 2003a. Physical activity levels among children aged 9-13 years—United States, 2002.
MMWR 52(33):785-788.CDC. National Center for Health Statistics. 2003b. Health, United States, 2003 with
Chartbook on Trends in the Health of Americans. [Online]. Available: http://www.cdc.gov/nchs/data/hus/tables/2003/03hus059.pdf [accessed May 25, 2004].
CDC. 2003c. Prevalence of physical activity, including lifestyle activites among adults—UnitedStates, 2000-2001. MMWR 52(32):764-769.
CDC. 2004a. Trends in intake of energy and macronutrients—United States, 1971-2000.MMWR 53(4):80-82.
CDC. 2004b. Prevalence of no leisure-time physical activity—35 states and the District ofColumbia, 1988-2002. MMWR 53(4):82-86.
CDC. 2004c. Youth Risk Behavior Surveillance—United States, 2003. MMWR 53(SS-2):21-24.
Chanmugam P, Guthrie J, Cecilio S, Morton J, Basiotis P, Anand R. 2003. Did fat intake inthe United States really decline between 1989-1991 and 1994-1996? J Am Diet Assoc103(7):867-872.
Child Trends. 2002. Watching Television. [Online]. Available: http://www.childtrendsdatabank.org/pdf/55_PDF.pdf [accessed September 3, 2004].
Clauson A. 1999. Share of food spending for eating out reaches 47 percent. Food Rev22(3):15-17.
Cramer P, Steinwert T. 1998. Thin is good, fat is bad: How early does it begin? J Appl DevPsych 19:429-451.
215

Crepinsek MK, Burstein NR. 2004. Maternal Employment and Children’s Nutrition. VolumeII, Other Nutrition-Related Outcomes. E-FAN-04-006-1. Washington, DC: EconomicResearch Service, USDA.
Cutler D, Glaeser E, Shapiro J. 2003. Why Have Americans Become More Fat? NBER Work-ing Paper No. W9446. Cambridge, MA: National Bureau of Economic Research.
DHHS (U.S. Department of Health and Human Services). 1964. Surgeon General Report:Smoking and Health. Washington, DC: Report of the Advisory Committee to the Sur-geon General of the Public Health Service.
DHHS. 1996. Physical Activity and Health: A Report of the Surgeon General. Atlanta, GA:USDHHS, CDC, NCCDPHP.
DHHS. 2001. The Surgeon General’s Call to Action to Prevent and Decrease Overweight andObesity. Rockville, MD: Public Health Service, Office of the Surgeon General.
Ebbeling CB, Pawlak DB, Ludwig DS. 2002. Childhood obesity: Public-health crisis, commonsense cure. Lancet 360(9331):473-482.
Economos CD, Brownson RC, DeAngelis MA, Novelli P, Foerster SB, Foreman CT, GregsonJ, Kumanyika SK, Pate RR. 2001. What lessons have been learned from other attemptsto guide social change? Nutr Rev 59(3 Pt 2):S40-S56.
Enns CW, Mickle SJ, Goldman JD. 2002. Trends in food and nutrient intakes by children inthe United States. Fam Econ Nutr Rev 14(2):56-68.
Enns CW, Mickle SJ, Goldman JD. 2003. Trends in food and nutrient intakes by adolescentsin the United States. Fam Econ Nutr Rev 15(2):15-27.
Evans WD, Finkelstein EA, Kamerow DB, Renaud JM. June 2-4, 2004. Public Perceptions ofChildhood Obesity. Presentation at the Time/ABC News Obesity Summit, Williamsburg,VA.
Fagot-Campagna A, Pettitt DJ, Engelgau MM, Burrows NR, Geiss LS, Valdez R, Beckles GL,Saaddine J, Gregg EW, Williamson DF, Narayan KM. 2000. Type 2 diabetes amongNorth American children and adolescents: An epidemiologic review and a public healthperspective. J Pediatr 136(5):664-672.
Federal Interagency Forum on Child and Family Statistics. 2003. America’s Children: KeyNational Indicators of Child Well-Being, 2003. Washington, DC: U.S. Government Print-ing Office.
Fee E, Brown TM, Lazarus J, Theerman P. 2002. The smoke nuisance. Am J Public Health92(6):931.
Field Research Corporation. 2003. A Survey of Californians about the Problem of ChildhoodObesity. Conducted for the California Endowment. October-November 2003. [Online].Available: http://www.calendow.org/obesityattitudes/index.htm [accessed April 9, 2004].
Fontaine KR, Redden DT, Wang C, Westfall AO, Allison DB. 2003. Years of life lost due toobesity. J Am Med Assoc 289(2):187-193.
Food Marketing Institute. 1996. Trends in the United States: Consumer Attitudes & theSupermarket, 1996. Washington, DC: Food Marketing Institute.
Food Marketing Institute. 2003. Trends in the United States: Consumer Attitudes & theSupermarket 2003. Washington, DC: Food Marketing Institute.
Fox MK, Pac S, Devaney B, Jankowski L. 2004. Feeding Infants and Toddlers Study: Whatfoods are infants and toddlers eating? J Am Diet Assoc 104(1 Suppl 1):S22-S30.
Frank LD. 2000. Land use and transportation interaction: Implications on public health andquality of life. J Plan Educ Res 20:6-22.
Freedman DS, Dietz WH, Srinivasan SR, Berenson GS. 1999. The relation of overweight tocardiovascular risk factors among children and adolescents: The Bogalusa Heart Study.Pediatrics 103(6 Pt 1):1175-1182.
French SA, Story M, Jeffery RW. 2001. Environmental influences on eating and physicalactivity. Annu Rev Public Health 22:309-335.
216

50 PREVENTING CHILDHOOD OBESITY
French SA, Lin BH, Guthrie JF. 2003. National trends in soft drink consumption amongchildren and adolescents age 6 to 17 years: Prevalence, amounts, and sources, 1977/1978 to 1994/1998. J Am Diet Assoc 103(10):1326-1331.
Frey WH. 2003. Married with children. Am Demogr 25(2):17-19.Gleason P, Suitor C. 2001. Children’s Diets in the Mid-1990’s: Dietary Intake and Its Rela-
tionship with School Meal Participation. Alexandria, VA: U.S. Department of Agricul-ture. Report No. CN-01-CD1.
Gross SM, Bronner Y, Welch C, Dewberry-Moore N, Paige DM. 2004. Breakfast and lunchmeal skipping patterns among fourth-grade children from selected public schools inurban, suburban, and rural Maryland. J Am Diet Assoc 104(3):420-423.
Guthrie JF, Morton JF. 2000. Food sources of added sweeteners in the diets of Americans. JAm Diet Assoc 100(1):43-51.
Hill JO, Wyatt HR, Reed GW, Peters JC. 2003. Obesity and the environment: Where do wego from here? Science 299(5608):853-855.
Hofferth SL, Sandberg JF. 2001. Changes in American children’s time, 1981-1997. In: OwensT, Hofferth S, eds. Children at the Millennium: Where Have We Come From, Where AreWe Going? Advances in Life Course Research. New York: Elsevier Science.
IFIC (International Food Information Council). 2004. Trends in Obesity-Related Media Cov-erage. Washington, DC. [Online]. Available: http://www.ific.org/research/obesitytrends.cfm [accessed July 26, 2004].
IOM (Institute of Medicine). 1991. Improving America’s Diet and Health. Washington, DC:National Academy Press.
IOM. 1999. Reducing the Burden of Injury: Advancing Prevention and Treatment. Washing-ton, DC: National Academy Press.
IOM. 2003. Weight Management: State of the Science and Opportunities for Military Pro-grams. Washington, DC: The National Academies Press.
Jahns L, Siega-Riz AM, Popkin BM. 2001. The increasing prevalence of snacking among USchildren from 1977 to 1996. J Pediatr 138(4):493-498.
Jain A, Sherman SN, Chamberlin DL, Carter Y, Powers SW, Whitaker RC. 2001. Why don’tlow-income mothers worry about their preschoolers being overweight? Pediatrics 107(5):1138-1146.
Kennedy E, Blaylock J, Kuhn B. 1999. Introduction. On the road to better nutrition. In:Frazao E, ed. America’s Eating Habits: Changes and Consequences. Washington, DC:USDA.
Kersh R, Morone J. 2002. How the personal becomes political: Prohibitions, public health,and obesity. Stud Am Polit Dev 16:162-175.
Kessler DA. 1995. The evolution of national nutrition policy. Annu Rev Nutr 15:xiii-xxvi.Kochanek KD, Smith BL. 2004. Deaths: Preliminary data for 2002. Natl Vital Stat Rep
52(13):1-47.Koplan JP, Dietz WH. 1999. Caloric imbalance and public health policy. J Am Med Assoc
282(16):1579-1581.Kumanyika S. 2002. The minority factor in the obesity epidemic. Ethn Dis 12(3):316-319.Lake Snell Perry & Associates. 2003. Obesity as a Public Health Issue: A Look at Solutions.
[Online]. Available: http://www.phsi.harvard.edu/health_reform/harvard_forum_release.pdf [accessed January 28, 2004].
Latner JD, Stunkard AJ. 2003. Getting worse: The stigmatization of obese children. Obes Res11(3):452-456.
Lin BH, Guthrie J, Frazao E. 1999a. Nutrient contribution of food away from home. In:Frazao E, ed. America’s Eating Habits: Changes and Consequences. Washington, DC:USDA.
217

INTRODUCTION 51
Lin BH, Guthrie J, Frazao E. 1999b. Quality of children’s diets at and away from home:1994-96. Food Rev 2-10.
Lobstein T, Baur L, Uauy R, IASO International Obesity TaskForce. 2004. Obesity in chil-dren and young people: A crisis in public health. Obes Rev 5(Suppl 1):4-85.
Luckett Clark S, Weismantle M. 2003. Employment Status: 2000. Census 2000 Brief. U.S.Department of Commerce. [Online]. Available: http://www.census.gov/prod/2003pubs/c2kbr-18.pdf [accessed July 23, 2004].
Lyle J, Hoffman HR. 1972. Children’s use of television and other media. In: Rubenstein EA,Comstock GA, Murray JP, eds. Television and Social Behavior. Vol. 4. Washington,DC: U.S. Government Printing Office. Pp. 257-273.
Mokdad AH, Serdula MK, Dietz WH, Bowman BA, Marks JS, Koplan JP. 1999. The spreadof the obesity epidemic in the United States, 1991-1998. J Am Med Assoc 282(16):1519-1522.
Mokdad AH, Serdula MK, Dietz WH, Bowman BA, Marks JS, Koplan JP. 2000. The con-tinuing epidemic of obesity in the United States. J Am Med Assoc 284(13):1650-1651.
Mokdad AH, Ford ES, Bowman BA, Dietz WH, Vinicor F, Bales VS, Marks JS. 2003. Preva-lence of obesity, diabetes, and obesity-related health risk factors, 2001. J Am Med Assoc289(1):76-79.
Narayan KM, Boyle JP, Thompson TJ, Sorensen SW, Williamson DF. 2003. Lifetime risk fordiabetes mellitus in the United States. J Am Med Assoc 290(14):1884-1890.
Nesbitt SD, Ashaye MO, Stettler N, Sorof JM, Goran MI, Parekh R, Falkner BE. 2004.Overweight as a risk factor in children: A focus on ethnicity. Ethn Dis 14(1):94-110.
Nestle M. 2003. Increasing portion sizes in American diets: More calories, more obesity. JAm Diet Assoc 103(1):39-40.
Nielsen Media Research. 2000. 2000 Report on Television: The First 50 Years. New York:AC Nielsen Company.
Nielsen SJ, Popkin BM. 2003. Patterns and trends in food portion sizes, 1977-1998. J AmMed Assoc 289(4):450-453.
NRC (National Research Council), IOM. 2003. Working Families and Growing Kids: Caringfor Children and Adolescents. Washington, DC: The National Academies Press.
NSC (National Safety Council). 1997. Accident Facts. Ithaca, IL: NSC.Ogden CL, Flegal KM, Carroll MD, Johnson CL. 2002. Prevalence and trends in overweight
among US children and adolescents, 1999-2000. J Am Med Assoc 288(14):1728-1732.Oliver JE, Lee T. 2002. Public Opinion and the Politics of America’s Obesity Epidemic. KSG
Working Paper No. RWP02-017. [Online]. Available: http://ksgnotes1.harvard.edu/Re-search/wpaper.nsf/rwp/RWP02-017?OpenDocument [accessed August 9, 2004].
Panitz B. 1999. Year of the restaurant: Unwrapping what the industry has to offer. Restau-rants USA, February, Pp. 26-30. [Online]. Available: http://www.restaurant.org/rusa/magArticle.cfm?ArticleID=338 [accessed December 16, 2003].
Popkin BM, Nielsen SJ. 2003. The sweetening of the world’s diet. Obes Res 11(11):1325-1332.
Population Reference Bureau. 2003. Traditional Families Account for 7 Percent of U.S. House-holds. [Online]. Available: http://www.ameristat.org/pdf/TraditionalFamiliesAccountfor7Percent.pdf [accessed April 15, 2004].
Population Reference Bureau. 2004a. Going to Work: America’s Commuting Patterns in2000. [Online]. Available: http://www.prb.org/AmeristatTemplate.cfm?Section=2000Census1 [accessed April 15, 2004].
Population Reference Bureau. 2004b. Record Number of Women in the U.S. Labor Force.[Online]. Available: http://www.prb.org/AmeristatTemplate.cfm?Section=Labor__Employment &template=/ContentManagement/ContentDisplay.cfm&ContentID=7880[accessed April 15, 2004].
218

52 PREVENTING CHILDHOOD OBESITY
Pratt M, Macera CA, Blanton C. 1999. Levels of physical activity and inactivity in childrenand adults in the United States: Current evidence and research issues. Med Sci SportsExerc 31(11 Suppl):S526-S533.
Prevention Institute. 2003. Environmental and Policy Approaches to Promoting Healthy Eat-ing and Activity Behaviors. Oakland, CA: Prevention Institute.
Price JH, Desmond SM, Stelzer CM. 1987. Elementary school principals’ perceptions ofchildhood obesity. J Sch Health 57(9):367-370.
Public Health Service. 1994. For a Healthy Nation: Returns on Investment in Public Health.Atlanta, GA: DHHS.
Putnam J, Gerrior S. 1999. Trends in the U.S. food supply. In: Frazao E, ed. America’s EatingHabits: Changes and Consequences. Washington, DC: USDA. Pp. 133-160.
Putnam J, Allshouse J, Kantor LS. 2002. U.S. per capita food supply trends: More calories,refined carbohydrates, and fats. Food Rev 25(3):2-15.
Putnam RD. 1995. Tuning in, tuning out: The strange disappearance of social capital inAmerica. Political Science 28:664-683.
Rideout VJ, Foehr UG, Roberts DF, Brodie M. 1999. Kids & Media @ the New Millennium:Executive Summary. Menlo Park, CA: Henry J. Kaiser Family Foundation. [Online]Available: http://www.kff.org/content/1999/1535/KidsExecSum%20FINAL.pdf [ac-cessed November 20, 2003].
Rideout VJ, Vandewater EA, Wartella EA. 2003. Zero to Six: Electronic Media in the Livesof Infants, Toddlers and Preschoolers. Menlo Park, CA: Henry J. Kaiser Family Founda-tion.
Robert Wood Johnson Foundation. 2003. Healthy Schools for Healthy Kids. Princeton, NJ:Robert Wood Johnson Foundation.
Roberts D, Foehr U, Rideout V, Brodie M. 1999. Kids and Media @ the New Millennium.Menlo Park, CA: Henry J. Kaiser Family Foundation.
Robinson JP, Godbey G. 1999. Time for Life. The Surprising Ways That Americans UseTheir Time. 2nd edition. University Park, PA: The Pennsylvania State University Press.
Rolls BJ. 2003. The supersizing of America. Portion size and the obesity epidemic. NutrToday 38(2):42-53.
San Jose Mercury News/Kaiser Family Foundation. 2004. Survey on Childhood Obesity.Menlo Park, CA: Henry J. Kaiser Family Foundation.
Schwartz MB, Puhl R. 2003. Childhood obesity: A societal problem to solve. Obes Rev4(1):57-71.
Seidell JC. 1998. Societal and personal costs of obesity. Exp Clin Endocrinol Diabetes106(Suppl 2):7-9.
Serdula MK, Mokdad AH, Williamson DF, Galuska DA, Mendlein JM, Heath GW. 1999.Prevalence of attempting weight loss and strategies for controlling weight. J Am MedAssoc 282(14):1353-1358.
Siega-Riz AM, Popkin BM, Carson T. 1998. Trends in breakfast consumption for children inthe United States from 1965-1991. Am J Clin Nutr 67(4):748S-756S.
Sloan EA. 2003. What, when, and where Americans eat. Food Techn 57(8):48-66.Smiciklas-Wright H, Mitchell D, Mickle S, Goldman J, Cook A. 2003. Foods commonly
eaten in the United States, 1989-1991 and 1994-1996: Are portion sizes changing? J AmDiet Assoc 103(1):41-47.
Strategy One. 2003. Addressing the Obesity Debate: A Consumer Point of View. Washing-ton, DC: International Food Information Council.
Sturm R. 2004. The economics of physical activity: Societal trends and rationales for inter-ventions. Am J Prev Med 27(3S):126-135.
219

INTRODUCTION 53
Sturm R. 2005a. Childhood obesity—What can we learn from existing data on societal trends.Part 1. Preventing Chronic Disease [Online]. Available: http://www.cdc. gov/pcd/issues/2005/jan/04_0038.htm.
Sturm R. 2005b (in press). Childhood obesity—What can we learn from existing data onsocietal trends. Part 2. Preventing Chronic Disease [Online]. Available: http://www.cdc.gov/pcd/issues/2005/apr/04_0039.htm.
Task Force on Community Preventive Services. 2004. Guide to Community Preventive Ser-vices. Task Force Recommendations. [Online] Available: http://www.thecommunityguide.org/overview/recs-to-date.pdf [accessed May 25, 2004].
Teachman BA, Brownell KD. 2001. Implicit anti-fat bias among health professionals: Is any-one immune? Int J Obes Relat Metab Disord 25(10):1525-1531.
Tharp MC. 2001. Marketing and Consumer Identity in Multicultural America. ThousandOaks, CA: Sage Publications.
U.S. Census Bureau. 2001. U.S. Interim Projections by Age, Sex, Race, and Hispanic Origin.[Online]. Available: http://www.census.gov/ipc/www/usinterimproj/ [accessed June 11,2004].
USDA (U.S. Department of Agriculture). Center for Nutrition Policy and Promotion. 1996.The Food Guide Pyramid. Washington, D.C.: U.S. Government Printing Office.
USDA. 2000. Pyramid Servings Intakes by U.S. Children and Adults: 1994-96, 1998. Agricul-tural Research Service, Community Nutrition Research Group. Table Set No. 1.
USDA. 2003. Profiling food consumption in America. In: Agriculture Fact Book 2001-2002.Washington, DC: USDA. U.S. Government Printing Office.
U.S. Department of Labor. 2004. Women in the Labor Force: A Databook. Bureau of LaborStatistics. Report 973. [Online]. Available: http://www.bls.gov/cps/wlf-databook.pdf [ac-cessed April 15, 2004].
U.S. Department of Transportation. 1995. Highway Statistics Summary to 1995. Washing-ton, DC: Federal Highway Administration. Office of Highway Information Manage-ment. [Online]. Available: http://www.fhwa.dot.gov/ohim/summary95/ [accessed June18, 2004].
U.S. Department of Transportation. 2004. Fatality Analysis Reporting System (FARS) Web-Based Encyclopedia. Washington, DC: National Center for Statistics and Analysis. Na-tional Highway Traffic Safety Administration. [Online]. Available: http://www-fars.nhtsa.dot.gov/ [accessed September 28, 2004].
Waller PF. 2002. Challenges in motor vehicle safety. Annu Rev Public Health 23:93-113.Whitaker RC. 2004. Informational Report on Evidence-Based Literature for Development of
a Childhood Obesity Interactive Tool. Princeton, NJ: Mathematica Policy Research.WHO (World Health Organization). 2002. World Health Report: Reducing Risks, Promot-
ing Healthy Life. Geneva: WHO.WHO. 2003. Diet, Nutrition and the Prevention of Chronic Diseases. Technical Report
Series No. 916. Geneva: WHO.Widmeyer Polling & Research. 2003. Summary of Study Findings: Americans’ Attitudes on
Fighting Obesity. American Public Health Association Obesity Poll. Washington, DC.
220

54
Extent andConsequences of
Childhood Obesity
2
Overall trend data clearly indicate that obesity prevalence in U.S.children and youth has risen to distressing proportions, but manyquestions remain about the nature, extent, and consequences of
this problem. How much do we really know about how this epidemic isunfolding? Which population groups are most affected? What does theavailable evidence tell us about how to address this problem? Finally, whatare the potential consequences of inaction with respect to social, develop-mental, and health outcomes and the associated health-care system costs?This chapter’s discussion of these questions informs the recommendationsthroughout the remainder of this report.
PREVALENCE AND TIME TRENDS
Because direct measures of body fat are neither feasible nor availablefor nationwide assessments of the prevalence of obesity, the National Healthand Nutrition Examination Surveys (NHANES),1 conducted by the Na-tional Center for Health Statistics, have been using body mass index (BMI)as a surrogate measure for body fatness. The prevalence of childhood and
1NHANES is a series of cross-sectional, nationally representative examination surveys thatbecame a continuous survey in 1999. Previous surveys include NHANES III (conducted from1988 to 1994), NHANES II (conducted from 1976 to 1980), NHANES I (conducted from 1971to 1974), the National Health Examination Survey (NHES) cycle 3 (conducted from 1966 to1970), and the NHES cycle 2 (conducted from 1963 to 1965).
221

EXTENT AND CONSEQUENCES OF CHILDHOOD OBESITY 55
adolescent obesity is equated to the proportion of those who are in theupper end of the BMI distribution—specifically, at or above the age- andgender-specific 95th percentile of the Centers for Disease Control andPrevention’s (CDC’s) BMI charts for children and youth aged 2 through 19years2 (Kuczmarski et al., 2000) (see Chapter 3 for a more extensive discus-sion about the use of terms for childhood overweight and childhood obe-sity).
If BMI is normally distributed and survey-specific percentile distribu-tions are presented, then by definition, 5 percent of children in each surveywill be above the 95th percentile BMI of the survey sample. Thus, reportsbased on the survey-specific BMI percentiles would always designate 5percent of children as obese and would fail to detect any true increasingprevalence of obesity across surveys. The CDC therefore developed a re-vised growth reference in 2000 that established the age- and gender-specific95th percentile of BMI. The growth reference data were based on BMIdistributions from national surveys between 1963 and 1980 for childrenaged 6 to 19 years, and between 1971 and 1994 for children aged 2 through5 years (Kuczmarski et al., 2002; Ogden et al., 2002b). There are no BMI-for-age references or accepted definitions for children younger than 2 yearsof age. However, the Special Supplemental Nutrition Program for Women,Infants and Children (WIC) has defined the term overweight for childrenunder 2 years who are at or above the 95th percentile of weight-for-lengthand uses this standard for determining WIC program eligibility (Ogden etal., 2002a).
Overall Burden
The term “epidemic” suggests a condition that is occurring more fre-quently and extensively among individuals in a community or populationthan is expected. This characterization clearly appears to apply to child-hood obesity. In 2000, obesity was two to three times more common inchildren and youth than in a reference period in the early 1970s. Theincrease in obesity prevalence has been particularly striking since the late1970s. The obesity epidemic affects both boys and girls and has occurred inall age, race, and ethnic groups throughout the United States (Ogden et al.,2002a).
The 1999-2000 NHANES found that approximately 10 percent of 2-to 5-year-old children were at or above the 95th percentile of BMI, repre-
2The NHANES series use the term “overweight” rather than “obese” to describe all chil-dren who are at or above the age- and gender-specific 95th percentile of BMI. However, thisreport uses the term “obese” to refer to those children (see Chapter 3).
222

56 PREVENTING CHILDHOOD OBESITY
senting twice the expected percentage; and that more than 15 percent of 6-to 19-year-olds met this criterion, representing about three times the ex-pected percentage (Ogden et al., 2002a). No significant increases in obesityprevalence were reported between the 1999-2000 and the 2001-2002NHANES (Hedley et al., 2004).
A significant, unabated increase in the prevalence of childhood obesityacross all age groups is clearly seen in an analysis of serial national surveysfrom the early 1970s through the year 2000 (Figure 2-1). In the nearly 30years between the 1971-1974 NHANES and the 1999-2000 NHANES, theprevalence of childhood obesity more than doubled for youth aged 12 to 19years (from 6.1 percent to 15.5 percent) and more than tripled for childrenaged 6 to 11 years (4 percent to 15.3 percent). Even for preschool children,aged 2 to 5 years, the prevalence also more than doubled (5 percent to 10.4percent) between these two national surveys (Ogden et al., 2002a). Data forchildren younger than 2 years of age, based on weight-for-length dataavailable from NHANES II (6-23 months) onward also suggest an upwardtrend (Ogden et al., 2002a).
The same trends, stratified by gender, are shown in Figure 2-2 forinfants and preschool children and in Figure 2-3 for school-aged childrenand adolescents. Among children older than 2 years of age, the increasedprevalence of obesity over time has occurred to a similar degree in both
Ages 6–11 years
Ages 6–23 months
Ages 12–19 years
Ages 2–5 years
20
15
10
5
0
Per
cent
1963
-67
1966
-70
1971
-74
1976
-80
1988
-94
1999
-200
0
FIGURE 2-1 Age-specific trends in child and adolescent obesity.NOTE: Obesity is defined as a BMI at or above the age- and gender-specific 95thpercentile cutoff points from the 2000 CDC BMI charts. Weight-for-length is usedto track children aged 6 to 23 months (under 2 years of age).SOURCES: Ogden et al., 2002a; CDC, 2003.
223

EXTENT AND CONSEQUENCES OF CHILDHOOD OBESITY 57
Females 6–23 months
Males 6–23 months
Males 2–5 years
Females 2–5 years
20
15
10
5
0
Per
cent
1963
-67
1966
-70
1971
-74
1976
-80
1988
-94
1999
-200
0
FIGURE 2-3 Trends in child and adolescent obesity, girls and boys aged 6 through19 years.NOTE: Obesity is defined as a BMI at or above the age- and gender-specific 95thpercentile cutoff points from the 2000 CDC BMI charts.SOURCES: Ogden et al., 2002a; CDC, 2003.
FIGURE 2-2 Trends in infant and child obesity, boys and girls aged 6 monthsthrough 5 years.NOTE: Obesity is defined as a BMI at or above the age- and gender-specific 95thpercentile cutoff points from the 2000 CDC BMI charts. Weight-for-length is usedto track children aged 6 to 23 months (under 2 years of age).SOURCE: Ogden et al., 2002a.
Females 12–19
Males 6–11
Males 12–19
Females 6–11
20
15
10
5
0
Per
cent
1963
-67
1966
-70
1971
-74
1976
-80
1988
-94
1999
-200
0
224

58 PREVENTING CHILDHOOD OBESITY
boys and girls. However, in those children under 2 years of age,3 theincreased prevalence is more marked in girls than in boys.
High-Risk Population Subgroups
Although no demographic group in the United States has been un-touched by the childhood obesity epidemic, there is evidence that somesubgroups of the U.S. population have been affected more than others. Asdiscussed below, certain ethnic minority populations, children in low-socio-economic-status families, and children in the country’s southern regiontend to have higher rates of obesity than the rest of the population. Eitherthe factors driving the obesity epidemic are more pronounced in these high-risk populations and communities, or their children and adolescents may bemore sensitive to, or less able to avoid, the causal factors when present.Additional efforts will be needed to identify the nature of the risk forobesity in these high-risk population subgroups.
High-Risk Ethnic Groups
Cross-sectional population-based estimates of obesity prevalence at 6to 19 years of age are available for U.S. children and adolescents overall,and specifically for non-Hispanic blacks, non-Hispanic whites, and Mexi-can Americans (Figure 2-4).4
Although obesity is prevalent among children and youth throughoutthe entire population, Hispanic, non-Hispanic black, and Native-Americanchildren and adolescents are disproportionately affected when compared tothe general population (Ogden et al., 2002a). With both sexes combined,up to 24 percent of non-Hispanic black and Mexican-American adolescentsare above the 95th percentile. Among boys, the highest prevalence of obe-sity is observed in Mexican Americans and among girls, the highest preva-lence is observed in non-Hispanic blacks (Ogden et al., 2002a). American-
3There are no BMI-for-age references or accepted definitions for children younger than 2years of age. Weight-for-length greater than the 95th percentile is used by the CDC and theWIC program to define overweight in children under 2 years of age (see Chapter 3).
4Standard terms used in the NHANES series include non-Hispanic whites, non-Hispanicblacks, and Mexican Americans. The ethnic and racial categories discussed throughout thischapter use those that specific researchers used for different data sets. This report generallyuses the terms African Americans to refer to non-Hispanic blacks; Hispanics to refer toMexican Americans and populations from other Latin-American countries of Hispanic de-scent; American Indians to refer to Native Americans; and whites to refer to non-Hispanicwhites. The report also uses the term Asian/Pacific Islanders (which includes Native Hawai-ians).
225

59
Girl
s, a
ged
12-1
9 ye
ars
051015202530
1976
-198
019
88-1
994
1999
-200
0S
urve
y ye
ars
Whi
teB
lack
Mex
ican
-Am
eric
an
Whi
teB
lack
Mex
ican
-Am
eric
an
Whi
teB
lack
Mex
ican
-Am
eric
an
Whi
teB
lack
Mex
ican
-Am
eric
an
Girl
s, a
ged
6-11
yea
rs0510152025
1976
-198
019
88-1
994
1999
-200
0S
urve
y ye
ars
Boy
s, a
ged
6-11
yea
rs051015202530
1976
-198
019
88-1
994
1999
-200
0S
urve
y ye
ars
Percent of population at or above the gender- and age-specific 95th BMI percentile
Percent of population at or above the gender- and age-specific 95th BMI percentile
Percent of population at or above the gender- and age-specific 95th BMI percentile
Percent of population at or above the gender- and age-specific 95th BMI percentile
Boy
s, a
ged
12-1
9 ye
ars
051015202530
1976
-198
019
88-1
994
1999
-200
0S
urve
y ye
ars
FIG
UR
E 2
-4T
rend
s in
obe
sity
pre
vale
nce
for
non-
His
pani
c w
hite
, no
n-H
ispa
nic
Bla
ck,
and
Mex
ican
-Am
eric
an b
oys
and
girl
s.N
OT
E:
Obe
sity
is
defi
ned
as a
BM
I at
or
abov
e th
e ag
e- a
nd g
ende
r-sp
ecif
ic 9
5th
perc
enti
le c
utof
f po
ints
fro
m t
he 2
000
CD
C B
MI
char
ts.
The
fol
low
ing
data
poin
ts h
ave
a re
lati
ve s
tand
ard
erro
r of
20
to 3
0 pe
rcen
t: 1
999-
2000
boy
s, a
ged
6 to
11
year
s (w
hite
);19
99-2
000
girl
s, a
ged
6 to
11
year
s (w
hite
); 1
988-
1994
gir
ls,
aged
6 t
o 11
yea
rs (
whi
te);
198
8-19
94 g
irls
, ag
ed 1
2 to
19
year
s(M
exic
an A
mer
ican
).
226

60 PREVENTING CHILDHOOD OBESITY
Indian children and youth, although not reported separately in theNHANES data, are also particularly affected by obesity (Caballero et al.,2003). For example, the prevalence of obesity in 7-year-old American-Indian children has been estimated recently at nearly 30 percent, represent-ing twice the current estimated prevalence among all U.S. children of thatage (Caballero et al., 2003).
Moreover, ethnicity-specific plots of the cross-sectional NHES andNHANES data for children aged 6 to 19 years suggest accelerated rates ofincrease in obesity prevalence for non-Hispanic black and Mexican-Ameri-can children of both sexes (Figure 2-4), creating a disparity in obesityprevalence between non-Hispanic white and black children (particularlyamong girls) (CDC, 2003).
Additional evidence that some ethnic disparities for obesity are increas-ing over time is drawn from the National Longitudinal Survey of Youth(NLSY). Between 1986 and 1998, the prevalence of obesity increased 120percent among African Americans and Hispanics while it increased 50percent among non-Hispanic whites (Strauss and Pollack, 2001).
Socioeconomic Difference
Evidence also suggests significant variation in BMI as a function ofboth socioeconomic status and ethnicity based on NHANES III in girls aged6 to 9 years (Winkelby et al., 1999). An increase in obesity prevalenceamong African Americans appears greatest for those at the lowest income(Strauss and Pollack, 2001). But uncertainties remain. These disparities arenot the same across ethnic groups and they do not emerge at comparabletimes during childhood. Also, there is almost no consensus, despite manytheories, about the mechanisms by which they occur. For instance, analysisof the data from the 1988-1994 NHANES shows that the prevalence ofobesity in white adolescents is higher among those in low-income familiesbut there is no clear relationship between family income and obesity inother age or ethnic subgroups (Troiano and Flegal, 1998; Ogden et al.,2003).
Nonetheless, two analyses of nationally representative longitudinaldata—the NLSY (Strauss and Knight, 1999; Strauss and Pollack, 2001)and the National Longitudinal Study of Adolescent Health (Goodman,1999; Goodman et al., 2003)—have suggested that family socioeconomicstatus is inversely related to obesity prevalence in children and that theeffects of socioeconomic status and race or ethnicity were independent ofother variables.
One explanation is insurance status, which is related to socioeconomicstatus; the uninsured may face barriers to accessing health care (Haas et al.,2003). Insurance coverage has been associated with the prevalence of obe-
227

EXTENT AND CONSEQUENCES OF CHILDHOOD OBESITY 61
sity in youth. An analysis of the 1996 Medical Expenditure Panel SurveyHousehold Component found that a combination of lacking health insur-ance and having public insurance (Medicaid, Medicare, or other publichospital coverage) were directly associated with obesity among adolescents(Haas et al., 2003).
Regional Differences
Regional differences in the prevalence of U.S. childhood obesity werealready apparent in 1998 based on NLSY data (10.8 percent in westernstates and 17.1 percent in southern states) (Strauss and Pollack, 2001).However, most data available for regional differences are for adults. In1998, adult obesity prevalence based on the CDC Behavioral Risk FactorSurveillance System (BRFSS) exceeded 20 percent in several states—Ala-bama (20.7 percent), Alaska (20.7 percent), Louisiana (21.3 percent), SouthCarolina (20.2 percent) and West Virginia (22.9 percent)—predominantlyin the Southeast (Mokdad et al., 1999). By 2002, BRFSS data revealed thatseven states had adult obesity prevalence rates greater than 25 percent:Alabama, Louisiana, Michigan, Mississippi, South Carolina, Texas, andWest Virginia (CDC, 2002). Systematic data reflecting regional differencesin obesity prevalence for children and youth are currently not available.
Shifts in the Population BMI Distribution
Researchers can monitor changes in the nature of the obesity epidemicby comparing the BMI distribution curves derived from population-basedsurveys and noting shifts in any particular distribution over time. A shifttoward higher BMIs over the entire distribution would indicate that virtu-ally everyone is becoming heavier, with lean individuals gradually movinginto the overweight range, overweight individuals moving into the obeserange, and the number of obese individuals becoming more severely obese.However, a graphical analysis comparing NHANES III (1988-1994) withearlier data found that the distributional patterns of BMIs differed amongage groups (Flegal and Troiano, 2000).
For adults, there was a general shift upward in the BMI distribution,with the greatest shift occurring at the upper end of the distribution, re-flected by the heaviest subgroups becoming heavier. For younger childrenaged 6 to 11 years, and to a lesser extent in adolescents, the distributions ofBMI values were characterized by little or no difference in the lower part ofthe distribution, though there was also a greater shift at the upper end, asshown schematically in Figures 2.5a and 2.5b (Flegal and Troiano, 2000).The results of this study indicate that the heaviest children and youth wereheavier in NHANES III than in earlier surveys; the authors caution, how-
228

62 PREVENTING CHILDHOOD OBESITY
Body mass index
Per
cent
of p
opul
atio
n
Body mass index
Per
cent
of p
opul
atio
n
FIGURE 2-5 Schematic representations of BMI distribution models.NOTE: Figure 2-5a shows a schematic representation of increased skewness (lackof symmetry) at the upper end of the BMI distribution with little change at thelower end, as has been observed in U.S. children and adolescents. Figure 2-5bshows a schematic representation of both a rightward shift in the distribution andincreased skewness at the upper end of the distribution, as has been observed inU.S. adults.SOURCE: Reprinted, with permission, from Flegal and Troiano, 2000. Copyright2000 by the International Journal of Obesity and Related Metabolic Disorders.
ever, that the unweighted sample sizes for 6- to 17-year-olds, particularlyfor adolescents, are small (Flegal and Troiano, 2000). Strauss and Pollack(2001) came to a similar conclusion based on their analyses of NLSY data.
Changes in BMI distributions have impacts on the population’s health.In adults, the major health-related co-morbidities that occur with obesitydo not have a linear relationship with BMI. For example, although relation-ships between BMI and hypertension, diabetes, dyslipidemia, and even deathoccur across a wide range of BMIs, these relationships strengthen consider-ably at the highest levels of BMI (Solomon and Manson, 1997; Must et al.,1999).
Similarly, children at the highest levels of BMI are generally at thegreatest risk of adverse health outcomes. Elevated blood pressure and insu-lin were both observed to be twice as common in children with BMIs abovethe 97th percentile as in children within the 95th to 97th percentile (Freed-man et al., 1999). But the prevalence of these health outcomes is lowbetween the 25th and 75th BMI percentiles, increasing modestly, if at all,across that span. Thus, with the childhood obesity epidemic characterizedby a disproportionate number of children at the extreme ranges of BMI,there are likely to be higher obesity-related morbidity rates in children thanif the epidemic mostly resulted from an upward shift in BMI across theirentire population.
a b
229

EXTENT AND CONSEQUENCES OF CHILDHOOD OBESITY 63
Relationship Between the Childhood and Adult Obesity Epidemics
The obesity epidemic that began in the early 1970s and escalated after1980 for children and youth has progressed similarly in adults over thesame time period. As depicted in Figures 2-6 and 2-7, between the 1971-1974 NHANES and the 1999-2000 NHANES the prevalence of obesity—defined as a BMI at or above 30 kg/m2—more than doubled (from 14.5
1960-62
1963-65
1966-70
1971-74
1976-80
1988-94
1999-2000
Obesity, 12–19 years
Obesity, 6–11 years
Obesity, 20–74 years
Overweight, 20–74 years
70
60
50
40
30
20
10
0
Per
cent
Year
FIGURE 2-6 Overweight and obesity by age in the United States, 1960-2000.NOTE: Percents for adults are age-adjusted. Obesity for children is defined as aBMI at or above the age- and gender-specific 95th percentile BMI cutpoints fromthe 2000 CDC BMI charts. Obesity for adults is defined as a BMI greater than orequal to 30. Obesity is a subset of the percent of overweight.SOURCE: CDC, 2003.
230

64 PREVENTING CHILDHOOD OBESITY
64%Overweightor Obese
67%Overweightor Obese 62%
Overweightor Obese
30%
34%
28%
39%
34%
28%
����� ����� ��� �� ���
���� ����������
FIGURE 2-7 Prevalence of overweight and obesity among adults 20 years of ageand older, NHANES 1999-2000.SOURCE: CDC, 2003. Reprinted with permission from Salinsky and Scott, 2003.Copyright by the National Health Policy Forum.
percent to 30.5 percent) among 60 million U.S. adults. Between 1999-2000and 2001-2002 there were no significant changes in the prevalence of obe-sity in adults (30.5 percent versus 30.6 percent) (Hedley et al., 2004). Thesetrends, underscored by similar findings at the state level (Mokdad et al.,2001), have paralleled childhood and youth obesity prevalence, suggestingthat the epidemics may be linked.
The observation that children and adults are both experiencing epidem-ics of obesity over the same time frame has important implications forunderstanding causes and formulating prevention interventions. Many ofthe same sociocultural factors that have contributed to the adult obesityepidemic have likely contributed to the childhood obesity epidemic.
The average parents today are twice as likely to be obese as 30 years
231

EXTENT AND CONSEQUENCES OF CHILDHOOD OBESITY 65
ago, even though their genetic susceptibility and that of their child has notchanged over this period. Parental obesity more than doubles the risk ofadult obesity among both obese and nonobese children under 10 years ofage (Whitaker et al., 1997). For example, an obese preschool child withnormal weight parents has approximately a 25 percent chance of beingobese as an adult. However, this same preschool child with an obeseparent has more than a 60 percent chance of being an obese adult(Whitaker et al., 1997). An additional implication of the adult and child-hood obesity co-epidemics relates to intergenerational transmission. Thereare a number of potential mechanisms by which maternal obesity in preg-nancy may promote offspring obesity (Whitaker and Dietz, 1998; Levin,2000; Oken and Gillman, 2003), and further research is needed to exam-ine these mechanisms.
Children can inherit obesity susceptibility genes from an obese parentor parents, or can be exposed, after birth, to diet and activity patterns thatpromote obesity. Moreover, recent research suggests that an altered intrau-terine environment may be a third mechanism (see Chapter 8). For ex-ample, obese mothers are more likely to experience diabetes in pregnancy,and some evidence suggests that the offspring of mothers who have diabetesin pregnancy may have an increased risk of developing obesity later in life(Silverman et al., 1998).
In a study of low-income families enrolled in the WIC program, chil-dren born to mothers who were obese at the time of conception were twiceas likely to be obese at 4 years of age (Whitaker, 2004b). Although muchremains to be learned about the mechanisms of intergenerational obesity,these data suggest that it may be important to consider the promotion ofhealthy body weights among pregnant mothers as part of childhood obe-sity prevention efforts, and obesity research efforts should examine pre-vention interventions for pregnant mothers who are obese as well as fortheir children.
CONSIDERING THE COSTS FOR CHILDREN AND FOR SOCIETY
The primary concern about childhood obesity is its potential impact onwell-being, not only in childhood but into adulthood, with the term “well-being” reflecting the committee’s view that social and emotional health is asimportant as physical health. As discussed in Chapter 1, families may differin the value they place on the different health outcomes of obesity, and themerits they attribute to certain benefits or drawbacks of changing behaviorsto address it (Whitaker, 2004a). Research suggests that some parents donot perceive weight to be a health issue for their children (Baughcum et al.,2000; Jain et al., 2001; Borra et al., 2003), independent of their child’sphysical and social functioning. Thus, individuals may differ in the value
232

66 PREVENTING CHILDHOOD OBESITY
they place on various aspects of their well-being (Buchanan, 2000). De-pending on these values, childhood obesity may represent a greater concernto some than to others. Failing to reverse the trend in childhood obesitymeans that many obese children, over their lifetimes, could experiencesignificant impairments in multiple domains of functioning. They are morelikely to be chronically ill, to have a negative impact on their earningpotential, and to even die prematurely.
Social and Emotional Health
While childhood obesity may not result in recognized clinical symp-toms until later in life, the social and emotional correlates often have imme-diate effects on children’s lives. Research on the short- and long-term im-pacts of obesity on children’s emotional and social functioning has beenextensively reviewed (French et al., 1995; Dietz, 1998b; Must and Strauss,1999; Puhl and Brownell, 2001; Styne, 2001; Must and Anderson, 2003;Schwartz and Puhl, 2003), and the collective body of research clearly indi-cates that obese children and youth are stigmatized, and subject to negativestereotyping and discrimination by their peers (Schwartz and Puhl, 2003;Strauss and Pollack, 2003).
This sort of treatment, which is hypothesized to produce adverse emo-tional consequences such as low self-esteem, negative body image, anddepressive symptoms for obese children, is not limited to peers; it may alsocome from adults, including parents, teachers, and health-care providers(Strauss et al., 1985). Even though obesity in children has become morecommon, such negative treatment has not diminished (Latner and Stunkard,2003), as revealed by obese children who continue to be socially marginalizedby their peers (Strauss and Pollack, 2003).
The results of studies on the emotional well-being of obese children aredifficult to succinctly summarize, given the differences between studies.Variations include the outcome measures used, the characteristics of thestudy subjects (particularly age, gender, racial/ethnic status, and degree ofobesity), and whether the samples were clinical or community-based. Fur-thermore, because many of the study designs are cross-sectional, it is oftenimpossible to distinguish between time course, and impossible to determinewhether the associations are causal. Nonetheless, a few general statementscan be made.
In one longitudinal study, associations between obesity and low self-esteem appear to emerge by early adolescence and were strongest in His-panic and white adolescent girls but not in African-American girls (Strauss,2000). The emotional consequences are somewhat stronger in girls than inboys, increase with age, and may be greater in those obese children whoseek treatment (Schwartz and Puhl, 2003). Having concerns about being
233

EXTENT AND CONSEQUENCES OF CHILDHOOD OBESITY 67
obese, regardless of actual body weight, appears to be a primary factorassociated with depressive symptoms among preadolescent girls (Ericksonet al., 2000).
The social and emotional impacts of obesity can also be long term. In alongitudinal U.S. cohort with a seven-year follow-up, women 16 to 24years of age at baseline who had been overweight completed fewer years ofschool, earned less money, and were less likely to be married (Gortmaker etal., 1993). The impact of adolescent obesity on the subsequent lower earn-ings of women was also demonstrated in a British cohort study (Sargentand Blanchflower, 1994).
Physical Health
Several thorough reviews (Dietz, 1998a,b; Must and Strauss, 1999;Deckelbaum and Williams, 2001; Styne, 2001; Must and Anderson, 2003)have found childhood obesity to be associated with a wide array of disor-ders that affect multiple organ systems. These disorders include hyperten-sion, dyslipidemia, glucose intolerance/insulin resistance, hepatic steatosis,cholelithiasis, sleep apnea, menstrual abnormalities, impaired balance, andorthopedic problems. Some of these conditions produce clinical symptomsin obese children, while others do not; however, the metabolic and physi-ologic changes associated with childhood obesity, along with the obesityitself, tend to track into adult life and eventually enhance the risks ofdisease, disability, and death.
In 2000, it was estimated that 400,000 deaths were attributed to poordiet and physical inactivity in the United States (Mokdad et al., 2004), anincrease of one-third from 300,000 annual deaths attributed to diet andsedentary activities in 1990 (McGinnis and Foege, 1993). Although theserisk factors represent the second leading cause of deaths among Americans,diet and physical inactivity are predicted to exceed tobacco as the leadingcause of deaths in the future (Mokdad et al., 2004).
Of the multiple health correlates of the childhood obesity epidemic,perhaps the one that has received greatest attention is the increased preva-lence of type 2 diabetes in children.5 By one population-based estimatefrom southwestern Ohio, a ten-fold increase in the prevalence of type 2diabetes in children between 1982 and 1994 accounted for one-third of allnew cases of diabetes (including type 1 and type 2) in children by 1994(Pinhas-Hamiel et al., 1996). For individuals born in the United States in2000, the lifetime risk of being diagnosed with diabetes at some point intheir lives is estimated at 30 percent for boys and 40 percent for girls if
5Type 2 diabetes was previously referred to as adult-onset diabetes and type 1 diabetes waspreviously called juvenile-onset diabetes.
234

68 PREVENTING CHILDHOOD OBESITY
obesity rates level off (Narayan et al., 2003). Nearly all children with type2 diabetes are obese, and a disproportionate number are Native American,African American, Hispanic, or Asian/Pacific Islander (Fagot-Campagna etal., 2000; Goran et al., 2003; Davis et al., 2004).
Several risk factors—including increased body fat (especially abdomi-nal fat), insulin resistance, ethnicity, and the onset of puberty—have beenidentified as contributors to the development of type 2 diabetes, and theyappear to have an additive influence (Goran et al., 2003). Accurate esti-mates of the prevalence of diabetes in U.S. children are difficult to deter-mine. It has been estimated that the prevalence of diabetes is 0.41 percent inU.S. youth aged 12-19 years (approximately 100,000 U.S. adolescents) andthe prevalence of impaired fasting glucose is 1.76 percent (approximately500,000 U.S. adolescents) (Fagot-Campagna et al., 2001). Better estimatesfor children are not possible because the prevalence of type 2 diabetes inthis population is still relatively low. NHANES is the only current nationaldata collection effort that could potentially make such an estimate. How-ever, the sample sizes from NHANES are not large enough to make a stablepoint estimate of the prevalence.
The childhood obesity epidemic may result in increased risk of type 2diabetes. One study found that for each adolescent diagnosed with type 2diabetes, there are 5 others with impaired fasting glucose, an indicator ofinsulin resistance below the diagnostic threshold for type 2 diabetes (Fagot-Campagna et al., 2001). Furthermore, the degree of insulin resistance inchildren increases with the severity of body fatness, as it does in adults(ADA, 2000). Thus, the combination of more obese children and the in-creased severity of obesity suggests that larger numbers of children willreach the diagnostic threshold for type 2 diabetes. Finally, it is estimatedthat approximately three-fourths of obese adolescents will be overweight asyoung adults (Guo et al., 2002) and will likely face the persistent risk ofdeveloping type 2 diabetes.
The increased prevalence of obesity among adults of all ages also hasbeen associated with a similar increase in the prevalence of diabetes(Mokdad et al., 2001). In fact, the increase in diabetes prevalence has beengreatest in young adults aged 30 to 39 years, with prevalence almost dou-bling between 1990 and 2001 (Mokdad et al., 2000, 2003). Moreover, thedevelopment of all of the major complications of diabetes, including retin-opathy, nephropathy, and neuropathy, are related to duration of disease.Those who develop diabetes earlier in life generally will develop costlycomplications earlier with the potential for premature mortality. For ex-ample, among 79 individuals in a Canadian referral clinic who were diag-nosed with type 2 diabetes before the age of 17 and who were followed upfrom ages 18 to 33 years, two had died suddenly while on dialysis and threemore were currently receiving dialysis (Dean and Flett, 2002).
235

EXTENT AND CONSEQUENCES OF CHILDHOOD OBESITY 69
A potentially even more important complication of childhood obesitymay be the metabolic syndrome, diagnosed when a person has at least threeof five metabolic abnormalities: glucose intolerance, abdominal obesity,hypertriglyceridemia, low high-density lipoprotein (HDL) cholesterol, andhigh blood pressure (NHLBI, 2002). The metabolic syndrome is nowpresent in approximately one-quarter of all U.S. adults (Ford et al., 2002;Park et al., 2003) and in nearly 30 percent of U.S. children and youth whoare obese (Cook et al., 2003).
Among adults, the metabolic syndrome is associated not only with type2 diabetes (Haffner et al., 1992; Cook et al., 2003) but also with cardiovas-cular disease (Isomaa et al., 2001; Cook et al., 2003) and a higher mortalityrate (Lakka et al., 2002; Cook et al., 2003). Even among those obese youthwho do not yet have clinical diabetes, components of the metabolic syn-drome appear to contribute to the development of atherosclerosis (Mahoneyet al., 1996; Berenson et al., 1998; McGill et al., 2002). Ultimately, it maybe the association of childhood obesity with the metabolic syndrome, ratherthan exclusively with diabetes, that may comprise the greatest physicalhealth threat of childhood obesity.
It is possible that if the childhood obesity epidemic continues at itscurrent rate, conditions related to type 2 diabetes—such as blindness, am-putation, coronary artery disease, stroke, and kidney failure—will becomeordinary in middle-aged people. Additionally, risk factors for cancer inobese adults, such as hormone alterations, may be present in obese childrenand contribute to a higher incidence of certain types of cancer later in life(Gascon et al., 2004). Thus, these conditions may affect a greater propor-tion of the population than current morbidity. This is a serious prospectgiven that obesity accounts for a level of morbidity comparable to that ofsmoking and poverty (Sturm and Wells, 2001).
Integrated View of the Consequences of Childhood Obesity
In reviews of the correlates of childhood obesity, discussions of thephysical impacts and of the social and emotional impacts are often sepa-rate. But this distinction may be artificial. First, although the brain plays acentral role in the regulation of energy balance and obesity (Schwartz et al.,2000), it is also the central organ for integrating social stimuli, regulatingemotion, and executing social interaction. Not surprisingly, cues that affectboth eating and activity behaviors are often social in nature, ranging fromsadness to anxiety to boredom.
Social and emotional factors must therefore be recognized not only aspotential consequences of obesity but also as potential causes. For example,depressed mood in children and adolescents may precede the developmentof obesity and not just follow it (Pine et al., 2001; Goodman and Whitaker,
236

70 PREVENTING CHILDHOOD OBESITY
6The $98 billion is based on an estimate of $93 billion in year 2002 dollars (Finkelstein etal., 2003) and the $129 billion is based on an estimate of $117 billion in year 2000 dollars(DHHS, 2001a) calculated from the 2004 Consumer Price Index (U.S. Bureau of Labor Statis-tics, 2004).
2002; Richardson et al., 2003). In a nationally representative sample of 8-to 11-year-olds, clinically meaningful behavioral problems have been shownto be associated with the development of obesity over a 2-year periodamong children not obese at baseline (Lumeng et al., 2003). Affective fac-tors, such as depressive symptoms, are also the likely mediators of theobserved association between adult obesity and traumatic childhood expe-riences (e.g., physical abuse, sexual abuse) (Williamson et al., 2002).
There is accruing evidence that even the metabolic syndrome itself maybe a consequence of how the brain processes environmental stimuli that aresocial in nature. For instance, the brain’s response to stress may alter thehypothalamic-pituitary-adrenal (or gonadal) axis in a way that promotescentral fat deposition and insulin resistance in adults (Bjorntorp, 2001).Because children also experience stress, the part of the brain that regulatesemotion may not only influence whether a child overeats, but also themetabolic consequences of that excess energy.
The fact that the physiologic response to stress is conditioned in child-hood (Gunnar and Donzella, 2002) emphasizes the potential importance ofoptimizing the social and emotional health of children as a strategy forpreventing obesity over a lifetime. Failure to recognize this connectionbetween social or emotional health and physical health could result inprevention strategies that are poorly conceptualized, and underscores theneed to consider the broadest possible definition of health to include thephysical, mental, and emotional aspects (Table 2-1), because the founda-tions of all three develop during childhood and are interconnected.
Health-Care Costs
A RAND study has calculated that the costs imposed on society bypeople with sedentary lifestyles (i.e., the “external” costs generated) may begreater than those imposed by smokers (Keeler et al., 1989). More recentcomputations of national health-care expenditures related to obesity andoverweight in adults showed large lifetime external costs related to theseconditions. After adjusting for inflation and converting estimates to 2004dollars, the national direct and indirect health-care costs related to over-weight and obesity range from $98 billion (Finkelstein et al., 2003) to $129billion (DHHS, 2001a).6 It has been suggested that overweight and obesitymay account for nearly one-third (27 to 31 percent) of total direct costsrelated to 15 co-morbid diseases (Lewin Group, 2000) and account for 9
237

EXTENT AND CONSEQUENCES OF CHILDHOOD OBESITY 71
TABLE 2-1 Physical, Social, and Emotional HealthConsequences of Obesity in Children and Youth
Physical Health• Glucose intolerance and insulin resistance• Type 2 diabetes• Hypertension• Dyslipidemia• Hepatic steatosis• Cholelithiasis• Sleep apnea• Menstrual abnormalities• Impaired balance• Orthopedic problems
Emotional Health• Low self-esteem• Negative body image• Depression
Social Health• Stigma• Negative stereotyping• Discrimination• Teasing and bullying• Social marginalization
percent of total U.S. medical spending (Finkelstein et al., 2003). Less than adecade ago, by contrast, the estimated direct health-care costs attributableto obesity ranged from 1 to 6 percent of total health-care expenditures,depending on the definition of obesity and the methods of calculation used(Seidell, 1995; Wolf and Colditz, 1998). Annual medical expenditures inthe United States related to obesity are estimated at $75 billion (in 2003dollars) with approximately half of the expenditures financed by Medicaidand Medicare (Finkelstein et al., 2004). California, the most populousstate, spent the most in public funds on health care for obese people in thatyear, a total of $7.7 billion (Finkelstein et al., 2004).
The direct health-care costs of physical inactivity, which contribute tothe obesity epidemic, have been estimated to exceed $77 billion annually(Pratt et al., 2000). In addition, there are indirect costs of physical inactiv-ity, such as those associated with dependence on motorized travel. Forexample, the national cost of traffic congestion in 2002 was estimated at3.5 billion hours of delay, costing the nation $69.5 billion—an increase of$4.5 billion from the previous year (Schrank and Lomax, 2003).
Additionally, the estimated national health-care expenditures for Ameri-cans with diabetes exceeded $132 billion in 2002, and it has been suggested
238

72 PREVENTING CHILDHOOD OBESITY
that people with diabetes have health-care costs that are on average 2.4times higher than those of people without diabetes (ADA, 2003). Obesity-linked type 2 diabetes, by far the most common form of the disease, islargely preventable. The cost of obesity has recently been compared toother health-care costs, and research suggests that it outranks both smokingand drinking in adverse health effects and health-care costs, adding anaverage of $395 per patient per year to health-care costs (Sturm, 2002).
The direct economic burden of obesity in youth aged 6 to 17 years hasbeen estimated, based on the 1979-1999 National Hospital Discharge Sur-vey (Wang and Dietz, 2002). Obesity-associated hospital costs were deter-mined from hospital discharges that listed obesity as either the primary orsecondary diagnosis. Results indicate that the percentage of discharges withobesity-related diseases increased dramatically from 1979-1981 to 1997-1999. Discharges for diabetes doubled, gallbladder disease tripled, andsleep apnea increased five-fold during this time frame. In 2001 dollars,obesity-associated annual hospital costs for children and youth were esti-mated to have more than tripled from $35 million (1979-1981) to $127million (1997-1999) (Wang and Dietz, 2002).
In 2000, the United States spent approximately 14 percent of its grossnational product on health care—representing the largest share for anydeveloped country over the past decade—and its per capita health-careexpenditures were greater than those of any other nation (OECD HealthData, 2003). But although it is estimated that preventive measures couldimpact 70 percent of the causes of early deaths in the United States(McGinnis et al., 2002), most of the $1.4 trillion that the United Statesspends per year on health is used for direct medical care service. The na-tional investment in preventing disease and promoting health is estimatedto be only 5 percent of the total annual health-care costs (DHHS, 2001b;Kelley et al., 2004). This imbalance underscores the need for the health-caresystems in the United States to establish a greater preventive orientation(Mokdad et al., 2004), particularly for childhood obesity, a largely prevent-able condition that has been shown to be a major determinant of health-care costs.
SUMMARY
Representative population surveys have found significant increases inthe prevalence of obesity in U.S. children and youth. In 2000, childhoodobesity was two to three times more common than in the early 1970s.Certain subpopulations of children, including those in several ethnic minor-ity populations, in low-socioeconomic-status families, and in the southernregion of the United States, tend to be most affected. Furthermore, there are
239

EXTENT AND CONSEQUENCES OF CHILDHOOD OBESITY 73
particular concerns that the heaviest children are becoming heavier (i.e., askewing of the population BMI distribution).
Obesity can have adverse impacts on a child’s physical, social, andemotional well-being. It increases the incidence of type 2 diabetes and otherchronic medical and psychosocial conditions. Furthermore, the metabolicand physiologic changes associated with childhood obesity, along withobesity itself, tend to track into adult life and eventually increase theindividual’s risk of disease, disability, and death.
Poor diet and physical inactivity contributed to an estimated 400,000deaths that occurred in the U.S. population in 2000 (Mokdad et al., 2004);predictions indicate that diet and physical inactivity will ultimately over-take tobacco as the leading cause of death in the future. Obesity-associatedannual hospital costs for children and youth were estimated to have morethan tripled over a two-decade period, rising from $35 million (1979-1981)to $127 million (1997-1999).7 Meanwhile, after adjusting for inflation andconverting estimates to 2004 dollars, the national direct and indirect health-care expenditures related to adult obesity and overweight range from $98billion to $129 billion. These figures clearly implicate obesity as a majordeterminant of health-care costs.
REFERENCES
ADA (American Diabetes Association). 2000. Type 2 diabetes in children and adolescents.Pediatrics 105(3):671-680.
ADA. 2003. Economic costs of diabetes in the U.S. in 2002. Diabetes Care 26(3):917-932.Baughcum AE, Chamberlin LA, Deeks CM, Powers SW, Whitaker RC. 2000. Maternal per-
ceptions of overweight preschool children. Pediatrics 106(6):1380-1386.Berenson GS, Srinivasan SR, Bao W, Newman WP 3rd, Tracy RE, Wattigney WA. 1998.
Association between multiple cardiovascular risk factors and atherosclerosis in childrenand young adults: The Bogalusa Heart Study. N Engl J Med 338(23):1650-1656.
Bjorntorp P. 2001. Do stress reactions cause abdominal obesity and comorbidities? Obes Rev2(2):73-86.
Borra ST, Kelly L, Shirreffs MB, Neville K, Geiger CJ. 2003. Developing health messages:Qualitative studies with children, parents, and teachers help identify communicationsopportunities for healthful lifestyles and the prevention of obesity. J Am Diet Assoc103(6):721-728.
Buchanan DR. 2000. An Ethic for Health Promotion. New York: Oxford University Press.Caballero B, Himes JH, Lohman T, Davis SM, Stevens J, Evans M, Going S, Pablo J. 2003.
Body composition and overweight prevalence in 1704 schoolchildren from 7 AmericanIndian communities. Am J Clin Nutr 78:308-312.
7This estimate is based on 2001 dollars.
240

74 PREVENTING CHILDHOOD OBESITY
CDC (Centers for Disease Control and Prevention). 2002. Behavioral Risk Factor Surveil-lance System Survey Data: Risk Factors and Calculated Variables–2002. Atlanta, GA:U.S. Department of Health and Human Services, CDC. [Online]. Available: http://apps.nccd.cdc.gov/brfss/list.asp?cat=RF&yr=2002&qkey=4409&state=All [accessedJune 11 2004].
CDC. 2003. Health, United States, 2003 with Chartbook on Trends in the Health of Ameri-cans. [Online]. Available: http://www.cdc.gov/nchs/data/hus/hus03.pdf [accessed May17, 2004].
Cook S, Weitzman M, Auinger P, Nguyen M, Dietz WH. 2003. Prevalence of a metabolicsyndrome phenotype in adolescents: Findings from the Third National Health and Nu-trition Examination Survey, 1988-1994. Arch Pediatr Adolesc Med 157(8):821-827.
Davis J, Busch J, Hammatt Z, Novotny R, Harrigan R, Grandinetti A, Easa D. 2004. Therelationship between ethnicity and obesity in Asian and Pacific Islander populations: Aliterature review. Eth Dis 14(1):111-118.
Dean HJ, Flett B. 2002. Natural history of type 2 diabetes diagnosed in childhood: Long-termfollow-up in young adult years. Diabetes 51:A24-A25.
Deckelbaum RJ, Williams CL. 2001. Childhood obesity: The health issue. Obes Res9(S4):239S-243S.
DHHS (U.S. Department of Health and Human Services). 2001a. The Surgeon General’s Callto Action to Prevent and Decrease Overweight and Obesity. Rockville, MD: PublicHealth Service, Office of the Surgeon General.
DHHS. 2001b. Steps to a Healthier U.S. Washington, DC: Office of Public Health Promo-tion. [Online]. Available: http://www.healthierus.gov/steps/steps_brochure.pdf [accessedJune 18, 2004].
Dietz WH. 1998a. Childhood weight affects adult morbidity and mortality. J Nutr128(2S):411S-414S.
Dietz WH. 1998b. Health consequences of obesity in youth: Childhood predictors of adultdisease. Pediatrics 101(3):518-525.
Erickson SJ, Robinson TN, Haydel KF, Killen JD. 2000. Are overweight children unhappy?Body mass index, depressive symptoms, and overweight concerns in elementary schoolchildren. Arch Pediatr Adolesc Med 154(9):931-935.
Fagot-Campagna A, Saaddine JB, Engelgau MM. 2000. Is testing children for type 2 diabetesa lost battle? Diabetes Care 23(9):1442-1443.
Fagot-Campagna A, Saaddine JB, Flegal KM, Beckles GL. 2001. Diabetes, impaired fastingglucose, and elevated HbA1c in U.S. adolescents: The Third National Health and Nutri-tion Examination Survey. Diabetes Care 24(5):834-837.
Finkelstein EA, Fiebelkorn IC, Wang G. 2003. National medical spending attributable tooverweight and obesity: How much, and who’s paying? Health Aff (Millwood) 22:W3-219-226.
Finkelstein EA, Fiebelkorn IC, Wang G. 2004. State-level estimates of annual medical expen-ditures attributable to obesity. Obes Res 12(1):18-24.
Flegal KM, Troiano RP. 2000. Changes in the distribution of body mass index of adults andchildren in the US population. Int J Obes Relat Metab Disord 24(7):807-818.
Ford ES, Giles WH, Dietz WH. 2002. Prevalence of the metabolic syndrome among USadults: Findings from the Third National Health and Nutrition Examination Survey. JAm Med Assoc 287(3):356-359.
Freedman DS, Dietz WH, Srinivasan SR, Berenson GS. 1999. The relation of overweight tocardiovascular risk factors among children and adolescents: The Bogalusa Heart Study.Pediatrics 103(6):1175-1182.
French SA, Story M, Perry CL. 1995. Self-esteem and obesity in children and adolescents: Aliterature review. Obes Res 3(5):479-490.
241

EXTENT AND CONSEQUENCES OF CHILDHOOD OBESITY 75
Gascon F, Valle M, Martos R, Zafra M, Morales R, Castano MA. 2004. Childhood obesityand hormonal abnormalities associated with cancer risk. Eur J Cancer Prev 13(3):193-197.
Goodman E. 1999. The role of socioeconomic status gradients in explaining differences in USadolescents health. Am J Public Health 89(10):1522-1528.
Goodman E, Whitaker RC. 2002. A prospective study of the role of depression in the devel-opment and persistence of adolescent obesity. Pediatrics 109(3):497-504.
Goodman E, Slap GB, Huang B. 2003. The public health impact of socioeconomic status onadolescent depression and obesity. Am J Public Health 93(11):1844-1850.
Goran MI, Ball GD, Cruz ML. 2003. Obesity and risk of type 2 diabetes and cardiovasculardisease in children and adolescents. J Clin Endocrinol Metab 88(4):1417-1427.
Gortmaker SL, Must A, Perrin JM, Sobol AM, Dietz WH. 1993. Social and economic conse-quences of overweight in adolescence and young adulthood. N Engl J Med 329(14):1008-1012.
Gunnar MR, Donzella B. 2002. Social regulation of the cortisol levels in early human devel-opment. Psychoneuroendocrinology 27(1-2):199-220.
Guo SS, Wu W, Chumlea WC, Roche AF. 2002. Predicting overweight and obesity in adult-hood from body mass index values in childhood and adolescence. Am J Clin Nutr76(3):653-658.
Haas JS, Lee LB, Kaplan CP, Sonneborn D, Phillips KA, Liang S-Y. 2003. The association ofrace, socioeconomic status, and health insurance status with the prevalence of over-weight among children and adolescents. Am J Public Health 93(12):2105-2110.
Haffner SM, Valdez RA, Hazuda HP, Mitchell BD, Morales PA, Stern MP. 1992. Prospectiveanalysis of the insulin-resistance syndrome (syndrome X). Diabetes 41(6):715-722.
Hedley AA, Ogden CL, Johnson CL, Carroll MD, Curtin LR, Flegal KM. 2004. Prevalence ofoverweight and obesity among US children, adolescents, and adults, 1999-2002. J AmMed Assoc 291(23):2847-2850.
Isomaa B, Almgren P, Tuomi T, Forsen B, Lahti K, Nissen M, Taskinen MR, Groop L. 2001.Cardiovascular morbidity and mortality associated with the metabolic syndrome. Diabe-tes Care 24(4):683-689.
Jain A, Sherman SN, Chamberlin DL, Carter Y, Powers SW, Whitaker RC. 2001. Why don’tlow-income mothers worry about their preschoolers being overweight? Pediatrics107(5):1138-1146.
Keeler EB, Manning WG, Newhouse JP, Sloss EM, Wasserman J. 1989. The economic costsof a sedentary life-style. Am J Public Health 79(8):975-981.
Kelley E, Moy E, Kosiak B, McNeill D, Zhan C, Stryer D, Clancy C. 2004. Prevention healthcare quality in America: Findings from the First National Healthcare Quality and Dis-parities Reports. Preventing Chronic Disease 1(3). [Online]. Available: http://www.cdc.gov/pcd/issues/2004/jul/cover.htm [accessed June 18, 2004].
Kuczmarski RJ, Ogden CL, Grummer-Strawn LM, Flegal KM, Guo SS, Wei R, Mei Z, CurtinLR, Roche AF, Johnson CL. 2000. CDC growth charts: United States. Adv Data8(314):1-27.
Kuczmarski RJ, Ogden CL, Guo SS, Grummer-Strawn LM, Flegal KM, Mei Z, Wei R, CurtinLR, Roche AF, Johnson CL. 2002. Data from the National Health Survey. 2000 CDCGrowth Charts for the United States: Methods and Development. Hyattsville, MD:National Center for Health Statistics.
Lakka HM, Laaksonen DE, Lakka TA, Niskanen LK, Kumpusalo E, Tuomilehto J, SalonenJT. 2002. The metabolic syndrome and total and cardiovascular disease mortality inmiddle-aged men. J Am Med Assoc 288(21):2709-2716.
Latner JD, Stunkard AJ. 2003. Getting worse: The stigmatization of obese children. Obes Res11(3):452-456.
242

76 PREVENTING CHILDHOOD OBESITY
Levin BE. 2000. The obesity epidemic: Metabolic imprinting on genetically susceptible neuralcircuits. Obes Res 8(4):342-347.
Lewin Group. 2000. The Costs of Obesity. Paper presented at Obesity: The Public HealthCrisis Conference, Washington, DC, American Obesity Association, September 13, 2000.
Lumeng JC, Gannon K, Cabral HJ, Frank DA, Zuckerman B. 2003. Association betweenclinically meaningful behavior problems and overweight in children. Pediatrics112(5):1138-1145.
Mahoney LT, Burns TL, Stanford W, Thompson BH, Witt JD, Rost CA, Lauer RM. 1996.Coronary risk factors measured in childhood and young adult life are associated withcoronary artery calcification in young adults: The Muscatine Study. J Am Coll Cardiol27(2):277-284.
Manning WG, Keeler EB, Newhouse JP, Sloss EM, Wasserman J. 1989. The taxes of sin. Dosmokers and drinkers pay their way? J Am Med Assoc 261(11):1604-1609.
McGill HC Jr, McMahan CA, Herderick EE, Zieske AW, Malcom GT, Tracy RE, Strong JP.2002. Obesity accelerates the progression of coronary atherosclerosis in young men.Circulation 105(23):2712-2718.
McGinnis JM, Foege WH. 1993. Actual causes of death in the United States. J Am Med Assoc270(18):2207-2212.
McGinnis JM, Williams-Russo P, Knickman JR. 2002. The case for more active policy atten-tion to health promotion: To succeed, we need leadership that informs and motivates,economic incentives that encourage change, and science that moves the frontiers. HealthAff (Millwood) 21(2):78-93.
Mokdad AH, Serdula MK, Dietz WH, Bowman BA, Marks JS, Koplan JP. 1999. The spreadof the obesity epidemic in the United States, 1991-1998. J Am Med Assoc 282(16):1519-1522.
Mokdad AH, Ford ES, Bowman BA, Nelson DE, Engelgau MM, Vinicor F, Marks JS. 2000.Diabetes trends in the U.S.: 1990-1998. Diabetes Care 23(9):1278-1283.
Mokdad AH, Bowman BA, Ford ES, Vinicor F, Marks JS, Koplan JP. 2001. The continuingepidemics of obesity and diabetes in the United States. J Am Med Assoc 286(10):1195-1200.
Mokdad AH, Ford ES, Bowman BA, Dietz WH, Vinicor F, Bales VS, Marks JS. 2003. Preva-lence of obesity, diabetes, and obesity-related health risk factors, 2001. J Am Med Assoc289(1):76-79.
Mokdad AH, Marks JS, Stroup DF, Gerberding JL. 2004. Actual causes of death in theUnited States, 2000. J Am Med Assoc 291(10):1238-1245.
Must A, Anderson SE. 2003. Effects of obesity on morbidity in children and adolescents.Nutr Clin Care 6(1):4-12.
Must A, Strauss RS. 1999. Risks and consequences of childhood and adolescent obesity. Int JObes Relat Metab Disord 23(2S):S2-S11.
Must A, Spadano J, Coakley EH, Field AE, Colditz G, Dietz WH. 1999. The disease burdenassociated with overweight and obesity. J Am Med Assoc 282(16):1523-1529.
Narayan KM, Boyle JP, Thompson TJ, Sorensen SW, Williamson DF. 2003. Lifetime risk fordiabetes mellitus in the United States. J Am Med Assoc 290(14):1884-1890.
NHLBI (National Heart, Lung, and Blood Institute). 2002. Third Report of the Expert Panelon Detection, Evaluation, and Treatment of High Blood Cholesterol in Adults (AdultTreatment Panel III). Publication No. 02-5215. Rockville, MD: NIH.
OECD Health Data. 2003. A Comparative Analysis of 30 Countries. [Online]. Available:http://www.fedpubs.com/subject/health/oecdhealth.htm [accessed June 6, 2004].
Ogden CL, Flegal KM, Carroll MD, Johnson CL. 2002a. Prevalence and trends in overweightamong US children and adolescents, 1999-2000. J Am Med Assoc 288(14):1728-1732.
243

EXTENT AND CONSEQUENCES OF CHILDHOOD OBESITY 77
Ogden CL, Kuczmarski RJ, Flegal KM, Mei Z, Guo S, Wei R, Grummer-Strawn LM, CurtinLR, Roche AF, Johnson CL. 2002b. Centers for Disease Control and Prevention 2000growth charts for the United States: Improvements to the 1977 National Center forHealth Statistics version. Pediatrics 109(1):45-60.
Ogden CL, Carroll MD, Flegal KM. 2003. Epidemiologic trends in overweight and obesity.Endocrinol Metab Clin North Am 32(4):741-760, vii.
Oken E, Gillman MW. 2003. Fetal origins of obesity. Obes Res 11(4):496-506.Park YW, Zhu S, Palaniappan L, Heshka S, Carnethon MR, Heymsfield SB. 2003. The
metabolic syndrome: Prevalence and associated risk factor findings in the US populationfrom the Third National Health and Nutrition Examination Survey, 1988-1994. ArchIntern Med 163(4):427-436.
Pine DS, Goldstein RB, Wolk S, Weissman MM. 2001. The association between childhooddepression and adulthood body mass index. Pediatrics 107(5):1049-1056.
Pinhas-Hamiel O, Dolan LM, Daniels SR, Standiford D, Khoury PR, Zeitler P. 1996. In-creased incidence of non-insulin-dependent diabetes mellitus among adolescents. J Pediatr128(5):608-615.
Pratt M, Macera CA, Wang G. 2000. Higher direct medical costs associated with physicalinactivity. Physician Sportsmed 28(10):63-70.
Puhl R, Brownell KD. 2001. Bias, discrimination, and obesity. Obes Res 9(12):788-805.Richardson LP, Davis R, Poulton R, McCauley E, Moffitt TE, Caspi A, Connell F. 2003. A
longitudinal evaluation of adolescent depression and adult obesity. Arch Pediatr AdolescMed 157(8):739-745.
Salinsky E, Scott W. 2003. Obesity in America: A Growing Threat. NHPF Background Paper.Washington, DC: The George Washington University.
Sargent JD, Blanchflower DG. 1994. Obesity and stature in adolescence and earnings inyoung adulthood: Analysis of a British birth cohort. Arch Pediatr Adolesc Med148(7):681-687.
Schrank D, Lomax T. 2003. The 2003 Urban Mobility Report. Texas Transportation Insti-tute. College Statation, TX: Texas A&M University System.
Schwartz MB, Puhl R. 2003. Childhood obesity: A societal problem to solve. Obes Rev4(1):57-71.
Schwartz MW, Woods SC, Porte D Jr, Seeley RJ, Baskin DG. 2000. Central nervous systemcontrol of food intake. Nature 404(6778):661-671.
Seidell JC. 1995. The impact of obesity on health status: Some implications for health carecosts. Int J Obes Relat Metab Disord 19(6S):S13-S16.
Silverman BL, Cho NH, Rizzo TA, Metzger BE. 1998. Long-term effects of the intrauterineenvironment: The Northwestern University Diabetes in Pregnancy Center. Diabetes Care21(S2):B142-B149.
Solomon CG, Manson JE. 1997. Obesity and mortality: A review of the epidemiologic data.Am J Clin Nutr 66(4S):1044S-1050S.
Strauss CC, Smith K, Frame C, Forehand R. 1985. Personal and interpersonal characteristicsassociated with childhood obesity. J Pediatr Psychol 10(3):337-343.
Strauss RS. 2000. Childhood obesity and self-esteem. Pediatrics 105(1):E15.Strauss RS, Knight J. 1999. Influence of the home environment on the development of obesity
in children. Pediatrics 103(6):E85.Strauss RS, Pollack HA. 2001. Epidemic increase in childhood overweight, 1986-1998. J Am
Med Assoc 286(22):2845-2848.Strauss RS, Pollack HA. 2003. Social marginalization of overweight children. Arch Pediatr
Adolesc Med 157(8):746-752.
244

78 PREVENTING CHILDHOOD OBESITY
Sturm R. 2002. The effects of obesity, smoking, and drinking on medical problems and costs:Obesity outranks both smoking and drinking in its deleterious effects on health andhealth costs. Health Aff (Millwood) 21(2):245-253.
Sturm R, Wells KB. 2001. Does obesity contribute as much to morbidity as poverty orsmoking? Public Health 115(3):229-235.
Styne DM. 2001. Childhood and adolescent obesity. Prevalence and significance. Pediatr ClinNorth Am 48(4):823-854.
Troiano RP, Flegal KM. 1998. Overweight children and adolescents: Description, epidemiol-ogy, and demographics. Pediatrics 101(3):497-504.
U.S. Bureau of Labor Statistics. 2004. Consumer Price Indexes. [Online]. Available: http://www.bls.gov/cpi/home.htm [accessed September 3, 2004].
Wang G, Dietz WH. 2002. Economic burden of obesity in youths aged 6 to 17 years: 1979-1999. Pediatrics 109(5):E81-E86.
Whitaker RC. 2004a. Informational Report on Evidence-Based Literature for Developmentof a Childhood Obesity Interactive Tool. Princeton, NJ: Mathematica Policy Research.
Whitaker RC. 2004b. Predicting preschooler obesity at birth: The role of maternal obesity inearly pregnancy. Pediatrics 114(1):e29-e36.
Whitaker RC, Dietz WH. 1998. Role of the prenatal environment in the development ofobesity. J Pediatr 132(5):768-776.
Whitaker RC, Wright JA, Pepe MS, Seidel KD, Dietz WH. 1997. Predicting obesity in youngadulthood from childhood and parental obesity. N Engl J Med 337(13):869-873.
Williamson DF, Thompson TJ, Anda RF, Dietz WH, Felitti V. 2002. Body weight and obesityin adults and self-reported abuse in childhood. Int J Obes Relat Metab Disord26(8):1075-1082.
Winkleby MA, Robinson TN, Sundquist J, Kraemer HC. 1999. Ethnic variation in cardio-vascular disease risk factors among children and young adults: Findings from the ThirdNational Health and Nutrition Examination Survey, 1988-1994. J Am Med Assoc281(11):1006-1013.
Wolf AM, Colditz GA. 1998. Current estimates of the economic cost of obesity in the UnitedStates. Obes Res 6(2):97-106.
245

79
Developing anAction Plan
3
The committee was charged with developing an action plan focusedon preventing obesity in children and youth in the United States.The aim of the plan was to identify the most promising approaches
for prevention, including policies and interventions for immediate actionand in the longer term. The critical elements of the action plan’s develop-ment, described in this and subsequent chapters, were as follows:
• Clarifying definitions related to key concepts• Developing a framework to guide the type and scope of data
gathered• Articulating obesity prevention goals for children and youth• Identifying criteria for conducting an in-depth review of the avail-
able evidence• Translating the findings from the best available evidence into spe-
cific recommendations that comprise an integrated action plan.
DEFINITIONS AND TERMINOLOGY
Childhood and Adolescent Obesity
Body mass index (BMI) is an indirect measure of obesity based on thereadily determined measures of height and weight. This report uses the term“obese” to refer to children and youth with BMIs equal to or greater thanthe 95th percentile of the age- and gender-specific BMI charts developed by
246

80 PREVENTING CHILDHOOD OBESITY
the Centers for Disease Control and Prevention (CDC) (Kuczmarski et al.,2000). In most children, values at this level are known to indicate excessbody fat, which itself is difficult to measure accurately in either clinical orpopulation-based settings.
What constitutes “excess” is an amount of body fat (often expressed asa percentage of body mass) that is sufficient to cause adverse health conse-quences. The exact percentage of body fat at which adverse consequencesoccur can vary widely across individuals and the consequences themselves—ranging from low self-esteem or mild glucose intolerance to major depres-sion or nephropathy—show considerable variation as well.
BMI—calculated as weight in kilograms divided by the square of heightmeasured in meters (kg/m2)—is the recommended indicator of obesity-re-lated risks in both children and adults. For adults, overweight is defined asa BMI between 25 and 29.9 kg/m2 and obesity is defined as a BMI equal toor greater than 30 kg/m2 (NHLBI, 1998). The BMI cut-off points werebased on epidemiological data that show increasing mortality above a BMIof 25 kg/m2, with greater increases above 30 kg/m2 (NHLBI, 1998).
Because children’s development varies with age, and because boys andgirls develop at different rates, the use of BMI to assess body weight inchildren requires growth and gender considerations. Thus, BMI values forchildren and youth are specific to both age and gender (Barlow and Dietz,1998; Dietz and Robinson, 1998).
The committee recognizes that it has been customary to use the term“overweight” instead of “obese” to refer to children with BMIs above theage- and gender-specific 95th percentiles (Himes and Dietz, 1994; Barlowand Dietz, 1998; DHHS, 2001a; Kuczmarski et al., 2002; AAP, 2003).Obese has often been considered to be a pejorative term, despite having aspecific medical meaning. There have also been concerns about misclassi-fication, as BMI is only a surrogate measure of body fatness in children asin adults. Furthermore, children may experience functional impairment(physical or emotional) at different levels of body fatness.
However, the term “obese” more effectively conveys the seriousness,urgency, and medical nature of this concern than does the term “over-weight,” thereby reinforcing the importance of taking immediate action.Further, BMI in children correlates reasonably well to direct measures ofbody fatness (Mei et al., 2002), and high BMIs in children have beenassociated with many co-morbidities such as elevated blood pressure, insu-lin resistance, and increased lipids (Freedman et al., 2001). These are thesame co-morbidities that often worsen in adult life and contribute to pre-mature death from obesity.
The committee recognizes, however, that the term obese is probablynot well suited for children younger than 2 years of age because the rela-tionships among BMI, body fat, and morbidity are less clear at these ages.
247

DEVELOPING AN ACTION PLAN 81
Additionally, a high BMI in children younger than 2 years of age is lesslikely to persist than a high BMI in older children (Guo et al., 1994). BMIreference values are not established for children less than 2 years of age.Weight-for-length greater than the 95th percentile is used by CDC and theSpecial Supplemental Nutrition Program for Women, Infants, and Childrento define overweight for children in this age group.
It is important that government agencies, researchers, health-care pro-viders, insurers, and others agree on the same definition of childhood obe-sity. Although varying definitions have arisen from many uses of the term inpublic health, clinical medicine, insurance coverage, government programsand other settings, to the extent possible, there should be concurrence ondefinitions and terminology.
In this report, the term “obese” refers to children and youth betweenthe ages of 2 and 18 years who have BMIs equal to or greater than the 95thpercentile of the age- and gender-specific BMI charts developed by CDC.1
Prevention
To “prevent” means simply to take prior anticipatory action to hinderthe occurrence of a course or event. Prevention efforts related to healthtraditionally have focused on preventing disease, particularly infectiousdisease. Conceptual frameworks have been developed that categorize health-related prevention efforts based on the segment of the population to whichthey are directed: the entire population (universal or population-based pre-vention); those who are at high risk of developing a disease (selective orhigh-risk prevention); or those who have a disease (targeted or indicatedprevention) (Gordon, 1983; Rose, 1992; IOM, 1994; WHO, 2000).
Another traditional approach categorizes prevention according to dis-ease progression: primary prevention involves avoiding the occurrence of adisease in a population; secondary prevention is aimed at early detection ofthe disease to limit its occurrence; and tertiary prevention is focused onlimiting the consequences of the disease (DHHS, 2000).
A more recent framework conceptualizes a spectrum of preventionbased on where—from the individual to the broader environment—theprevention actions are directed. Approaches include strengthening indi-vidual knowledge and skills, providing community education, educating
1This definition is consistent with current CDC recommendations with the exception of theterminology. International references such as the International Obesity Task Force or ColeBMI values allow for cross-cultural comparisons. These references use different populationsand slightly differing techniques for developing cut-off points (Flegal et al., 2001).
248

82 PREVENTING CHILDHOOD OBESITY
providers, fostering coalitions and networks, changing institutional prac-tices, and influencing policy (Cohen and Swift, 1999).
The prevention frameworks discussed lend themselves relatively easilyto infectious diseases in which there are clear endpoints and progressions.But the frameworks can be more complex to apply to health outcomes (e.g.,childhood obesity) in which the progression is a continuum and the condi-tion is both a risk factor for other chronic diseases and a health outcome initself. The committee concluded that the well-established concept of pri-mary prevention was most amenable to its assigned task of developing abroad-based action plan that addresses the social, cultural, and environ-mental factors associated with childhood obesity.
A primary prevention approach emphasizes efforts that can help themajority of children who are at a healthy weight to maintain that status andnot become obese. Within this approach, the committee developed themajority of its recommendations as “population-based” actions—directedto the entire population instead of high-risk individuals. However, thecommittee acknowledges that obesity prevention will need to combine popu-lation-based efforts with targeted approaches for high-risk individuals andsubgroups. Consequently, the report also contains specific actions aimed athigh-risk populations affected by obesity, such as children and adolescentsin particular ethnic groups with higher than average obesity-prevalencerates and communities in which there are recognizable social and economicdisparities. Subpopulations of children warranting special considerationalso include children with disabilities or special health-care needs. Thecomplex medical, psychological, physical, and psychosocial difficulties thatthese children encounter may well put them at elevated risk for low physicalactivity levels and unhealthful dietary behaviors.
The committee acknowledges that although population-based preven-tion approaches may be theoretically or conceptually the most useful ap-proaches for addressing a society-wide problem, the practical challenge is indetermining how best to implement these interventions to achieve broadoutreach and maximal coverage. These issues will be discussed further inthe sections on local communities and evaluation of interventions (see Chap-ters 4 and 6).
The committee was not charged with, nor did it develop, recommenda-tions directed specifically at obesity treatment or reducing excess weight inchildren and youth. However, it is likely that many of the suggested actionswill also benefit children and youth who are already obese, even if theinterventions are insufficient to produce enough short-term weight loss forachieving normal weight status. For example, obese children can benefitfrom healthful choices in the school cafeteria.
Prevention of obesity, particularly among those at high risk, may seemvery similar to treatment in that screening is involved and individualized
249

DEVELOPING AN ACTION PLAN 83
intervention is often delivered in clinical settings. However, there are sev-eral important differences between prevention and treatment approaches(Kumanyika and Obarzanek, 2003). The targeted outcomes are different:prevention of weight gain is a satisfactory outcome for prevention ap-proaches, whereas weight loss is the desired outcome for treatment. Moti-vations to maintain a healthful rate of weight gain for growing childrenmay differ in nature and intensity from motivations to lose weight. Al-though treatment approaches may include relatively extreme behavioralchanges over the short term, preventive strategies usually necessitate long-term continuation.
The committee’s approach to obesity prevention is similar to the rangeof prevention efforts that have been used to address many other publichealth problems. Some efforts directly change the physical environment butrequire no purposeful action on the part of the target population (e.g.,fluoridation of community drinking water and food fortification); othersdirectly require behavior change in targeted high-risk populations (e.g.,immunization of children); and some require environmental change to fa-cilitate behavioral change (e.g., zoning and land-use regulations to encour-age physical activity). The majority of efforts require multiple approaches;for example, efforts to reduce underage drinking and tobacco control haveinvolved legislation, media campaigns, counseling, and many other mecha-nisms (NRC and IOM, 2003; Mensah et al., 2004).
Appendix B provides a glossary of terms used throughout this report.
FRAMEWORK FOR ACTION
Using an ecological perspective, the committee developed a frameworkto depict the behavioral settings and leverage points that influence bothsides of the energy balance2 equation—energy intake and energy expendi-ture. An ecological systems theory model postulates that changes in indi-vidual characteristics are affected not only by personal factors (e.g., age,gender, genetic profile) but also by interactions with the larger social, cul-tural, and environmental contexts in which they live (e.g., family, school,community) (Figure 3-1) (Davison and Birch, 2001; Lobstein et al., 2004).
Building on this ecological model and drawing upon concepts fromseveral relevant frameworks (Swinburn et al., 1999; Booth et al., 2001;Kumanyika et al., 2002; Swinburn and Egger, 2004), the committee devel-oped a framework that shows layers of ecologic factors as influences onenergy imbalance, which is shown as the typical graphic in which energy
2Energy balance, as discussed in detail below, refers to a state in which energy intake isequivalent to energy expenditure, resulting in no net weight gain or weight loss.
250

84 PREVENTING CHILDHOOD OBESITY
Child or Adolescent
Culture and Society
Industry, GovernmentCommunity
School and Peers
Family and Home
FIGURE 3-1 Simplified ecological systems theory model.
intake exceeds energy expenditure (Figure 3-2). Both aspects of energyimbalance (i.e., food and beverage intake and physical activity) interactwith and are affected by multiple factors within each of the four ecologicallayers. The two innermost layers describe factors operating within the indi-vidual (including genetic factors, ethnic identity and culturally determinedattitudes and beliefs, psychosocial factors, and current health status) andthose operating within the physical and social locations and situations thatdefine daily behavioral settings (Booth et al., 2001). The key behavioralsettings for children and youth are the home, school, and community. Asnoted in the framework developed by the Partnership to Promote HealthyEating and Active Living, behavioral settings are affected either directly orindirectly by a variety of other factors that potentially constitute primaryand secondary leverage points for effecting changes (Booth et al., 2001).These leverage points include the major sectors that affect the food system,opportunities for physical activity or sedentary behavior, and informationand education regarding dietary behaviors and physical activity. The outer-most layer on the framework in Figure 3-2 reflects the critical concept of anoverlay of social norms and values, that is, the social fabric that cuts acrossall the layers and processes below. Social norms and values both determineand respond to collective social and institutional processes within the con-
251

DEVELOPING AN ACTION PLAN 85
Social Norms and Values
Primary and Secondary Leverage Points• Food and Agriculture • Education • Media • Government • Public Health • Health Care
• Land Use and Transportation • Leisure • Recreation
Behavioral Settings• Home • School • Community
Energy Intake
Energy Expenditure
Energy Imbalance
Obese Children and Youth
Genetic, Psychosocial, and Other Personal Factors
Food and Beverage
Intake
PhysicalActivity
FIGURE 3-2 Framework for understanding obesity in children and youth.NOTE: In this diagram energy intake is depicted as excessive when compared toenergy expenditure, leading to a positive energy balance (or energy imbalance)resulting in obesity.
text of the larger U.S. culture. This framework, which emphasizes the needfor obesity prevention efforts to leverage the interests and actions of anumber of stakeholders working within and across multiple settings andsectors, guided the review of evidence and the development of recommen-dations in this report.
252

86 PREVENTING CHILDHOOD OBESITY
OBESITY PREVENTION GOALS
Clear specification of obesity prevention goals is essential in shaping anaction plan and evaluating its success. Pertinent issues for setting obesityprevention goals for populations include concepts of optimum populationBMI and healthy weight levels, potential effects on food intake and patternsof physical activity and inactivity (the primary modifiable determinants ofobesity), as well as attitudes and social norms related to food and eating,physical activity and inactivity, body size, and dietary restrictions (WHO,2000; Kumanyika et al., 2002). For children and youth, these consider-ations must be framed not only within the context of healthy physical,psychological, and cognitive development but in recognition that the in-creased prevalence of childhood obesity has broadened the emphasis ofdietary guidance to address the overconsumption of energy-dense foodsand beverages and physical activity patterns (ADA, 2003, 2004).
For individual children and youth, obesity prevention goals focus onmaintaining energy balance (calories consumed versus calories expended).As discussed in greater detail later in the chapter, this involves engaging inhealthful dietary behaviors and regular physical activity. Healthful dietarybehaviors include choosing a balanced diet, eating moderate portion sizes,and heeding the body’s own satiety cues that indicate physiological fullness.It is currently recommended that children and adolescents accumulate aminimum of 60 minutes of moderate to vigorous physical activity each day(see section on physical activity).
Children’s food and beverage intake and their physical activity andsedentary behavior patterns can be influenced by a variety of environmentalfactors, including the availability and affordability of healthful foods, ad-vertising messages, and opportunities to participate in physical activitywithin communities (Richter et al., 2000). Although individuals and fami-lies are embedded within broader social, economic, and political environ-ments that influence their behaviors and may either promote or constrainthe maintenance of health (IOM, 2001), such environments may also serveas contexts for change. These are the settings in which relationships areformed (e.g., home environment and support networks), and they representa collection of formal and informal community institutions that monitorthe behavior and safety of residents (Leventhal and Brooks-Gunn, 2001).
As will be noted throughout this report, changing the social, physical,and economic environments that contribute to the incidence and prevalenceof childhood obesity—especially in populations in which the problem islongstanding and highly prevalent—may take many years to achieve. There-fore, the committee acknowledges that numerous intermediate goals, in-volving step-by-step improvements in diet patterns and physical activitylevels of children and youth, are necessary for assessing progress. The ulti-
253

DEVELOPING AN ACTION PLAN 87
mate aim of obesity prevention in children and youth, however, is to create,through directed social change, an environmental-behavioral synergy thatpromotes positive outcomes both at the population and individual levels.Box 3-1 summarizes these long-term and intermediate goals, which will bediscussed in greater detail throughout the report.
BOX 3-1Goals of Obesity Prevention in Children and Youth
The goal of obesity prevention in children and youth is to create—throughdirected social change—an environmental-behavioral synergy that pro-motes:
• For the population of children and youth♦ Reduction in the incidence of childhood and adolescent obesity♦ Reduction in the prevalence of childhood and adolescent obesity♦ Reduction of mean population BMI levels♦ Improvement in the proportion of children meeting the Dietary Guidelines
for Americans♦ Improvement in the proportion of children meeting physical activity guide-
lines♦ Achieving physical, psychological, and cognitive growth and develop-
mental goals
• For individual children and youth♦ A healthy weight trajectory, as defined by the CDC BMI charts♦ A healthful diet (quality and quantity)♦ Appropriate amounts and types of physical activity♦ Achieving physical, psychosocial, and cognitive growth and developmental
goals
Because it may take a number of years to achieve and sustain these goals,intermediate goals are needed to assess progress toward reduction of obe-sity through policy and system changes. Examples include:
• Increased number of children who safely walk and bike to school• Improved access to and affordability of fruits and vegetables for low-income
populations• Increased availability and use of community recreational facilities• Increased play and physical activity opportunities• Increased number of new industry products and advertising messages that
promote energy balance at a healthy weight• Increased availability and affordability of healthful foods and beverages at
supermarkets, grocery stores, and farmers markets located within walkingdistance of the communities they serve
• Changes in institutional and environmental policies that promote energybalance
254

88 PREVENTING CHILDHOOD OBESITY
Optimum BMI and Healthy Weight
The concept of optimum BMI can be applied to populations. For coun-tries such as the United States, where undernutrition is not as common as indeveloping countries,3 a BMI-distribution median of around 21 kg/m2 maybe optimal (WHO, 2000). Population weight goals for obesity preventionin adults can also be stated in terms of decreasing the proportion thatexceed the threshold of 30 kg/m2, although this goal includes both prevent-ing new cases of obesity and reducing weight among those already over thethreshold.
The same principles are appropriate for assessing the population ofchildren in the United States in pursuit of the committee’s primary objec-tive: to stop, and eventually reverse, current trends toward higher BMIlevels. Also, as discussed in Chapter 2, there are particular concerns aboutthe population of obese children becoming heavier. Achieving this objectivewould have the effects of reducing the mean BMI as well as decreasing theproportion of children and youth in the population that exceeds the thresh-old definition of obesity.
Available research does not currently allow the committee to define anoptimum BMI for children and youth. It suggests, however, that futureresearch toward this aim should be focused on defining the associationsbetween BMI and objective measures of concurrent and future growth andbetween BMI and physiological and psychological morbidity, mortality,and health (Robinson, 1993; Robinson and Killen, 2001).
Analogous to the current practice for adults, the committee recom-mends the use of BMI for assessing individual and population changes inchildren and youth over time and in response to interventions. Populationweight goals for childhood obesity prevention should be stated in terms ofchanges in the mean BMI and in the shape of the entire BMI distribution.Alternatively, goals can be stated in terms of decreasing the proportion ofchildren or youth who exceed particular thresholds—e.g., 75th, 85th, 90th,95th, or 97th percentiles of BMI for age and gender on the CDC BMIcharts. In the absence of an appropriate evidence base, however, thresholdgoals are necessarily somewhat arbitrary and sacrifice substantial informa-tion about the rest of the distribution as well as substantial statistical powerto detect differences between groups and over time (Robinson and Killen,2001).
3Hunger and food insecurity persist in the United States. In 2002, 35 million individualsincluding 13.1 million children lived in food insecure households (an estimated 11 percent ofall U.S. households); 3.5 percent (3.8 million) of U.S. households were food insecure withhunger (Nord et al., 2003). Additionally, rates of micronutrient deficiencies remain unaccept-ably high in certain subgroups of the U.S. population (Wright et al., 1998; Ballew et al., 2001;Ganji et al., 2003; Hampl et al., 2004).
255

DEVELOPING AN ACTION PLAN 89
The current CDC guidelines for healthy weight in children and youthare in the range of the 5th to 85th percentiles of the age- and gender-specificBMI charts. Therefore, a child whose weight tracks in that range—that is,he or she does not cross to lower than the 5th or higher than the 85thpercentiles—would be considered to be in the healthy weight range accord-ing to these definitions.
The CDC BMI charts are mathematically smoothed curves of the pooledgrowth parameters of children and adolescents sampled in cross-sectionalnational health surveys conducted from 1963 to 1994. An analogy wouldbe to consider the curves as compiled from a series of “snapshots” of largenational samples made at different times over three decades. But becausethe sample sizes at each age level get much smaller at the extremes of thedistributions, the growth curves may be more prone to errors at the upperand lower ends.
Because of the increases in body weight that occurred in the 1980s and1990s—after the second National Health and Nutrition Examination Sur-vey (NHANES II) conducted in 1976-1980—a decision was made not toinclude the NHANES III (1988-1994) body-weight data in the revised 2000BMI charts for children aged 6 years or older. The NHANES III data wouldhave shifted the affected curves (weight-for-age and BMI-for-age) upward,which was considered to be biologically and medically undesirable. How-ever, the fact that the CDC BMI charts were developed from data for aprior time period in which children were leaner, on average, leads to anoccasionally confusing situation—for example, where more than 5 percentof the population is above the 95th percentile—but this is readily clarifiedin the context of the charts’ historical source.
The CDC BMI charts are derived from cross-sectional samples of chil-dren (data for different age groups are based on different children). That is,they do not directly represent the longitudinal growth trajectory for thesame set of children who have been measured as they age.4 Therefore, it isnot known whether an individual child’s height, weight, or BMI should beexpected to follow along the same percentile curve over time in order tomaintain health or whether there are health implications of variationsthroughout childhood (e.g., crossing percentiles by going from the 20thpercentile at age 1 to the 60th percentile at age 5 to the 40th percentile atage 12). Mei and colleagues (2004) found that shifts in growth rates were
4The latter approach has been used to develop longitudinal growth charts that are used inseveral other countries (Tanner and Davies, 1985; Cameron, 2002). These types of charts aregenerally developed from smaller, and potentially less representative, samples.
256

90 PREVENTING CHILDHOOD OBESITY
common during birth to 6 months and less common in children aged 2 to 5years. More research is needed to determine whether there is an increasedprevalence of “crossing” percentiles in different populations or during dif-ferent age intervals and whether there are associations between crossingpercentiles and health-related outcomes.
The problem is how to proceed despite this lack of certainty. Thecommittee concluded that because the CDC BMI charts are based on largenational samples of the U.S. population of children and youth, they are thebest available tools for assessing growth in clinical and public health set-tings. Although there are many unknowns about how to apply this infor-mation to individual children, and clinicians face difficulties in makinggeneralizations regarding normal growth trajectories, experience suggeststhat children who demonstrate rapid changes—that is, frequently crossingup or down percentiles—may require special health-care attention. Health-and medical-care professionals should be consulted regarding growth-related questions for individual children as they can assess a child’s owngrowth trajectory in context (see Chapter 6).
ENERGY BALANCE
Obesity prevention involves maintaining energy balance at a healthyweight while protecting overall health, growth and development, and nutri-tional status. Energy balance refers to the state in which energy intake isequivalent to energy expenditure, resulting in no net weight gain or weightloss. In adults, who have stopped growing, this relationship between energyintake and output must be equal and reach a zero net energy balance toprevent body storage of extra calories5 from food as fat and result inweight gain, which represents a positive energy balance. Strictly speaking,growing children, even those at a healthy body weight, must be in a slightlypositive energy balance to satisfy the additional energy needs of tissuedeposition for normal growth. However, for the purpose of simplicity inthis report, the committee uses the term “energy balance” in children toindicate an equality between energy intake and energy expenditure thatsupports normal growth without promoting excess weight gain.
In children, energy expenditure constitutes the calories used for basalmetabolism, processing of food, maintenance and repair of the body, anddaily physical activity—in addition to the calories required for normalgrowth and development. Inappropriate weight gain (excess fat storage)results when energy expenditure is consistently exceeded by energy intakeover time.
5In this report the term “calories” is used synonymously with “kilocalories.”
257

DEVELOPING AN ACTION PLAN 91
Energy intake is the calories ingested in the form of food and beverages.Children require a dietary pattern consisting of a variety of foods thatprovide all the necessary nutrients to support normal growth and develop-ment, as well as regular physical activity. Thus, a balanced diet refers to theconsumption of appropriate amounts of a wide variety of nutrient-densefoods that provide adequate amounts and proportions of macronutrients(protein, fat, and carbohydrates) as well as sufficient essential micronutri-ents (vitamins, minerals) and dietary fiber, in addition to providing ad-equate energy to meet the needs of maintenance, growth, and development.
Although “energy intake = energy expenditure” looks like a fairly basicequation, in reality it is extraordinarily complex when considering the mul-titude of genetic, biological, psychological, sociocultural, and environmen-tal factors that affect both sides of the energy balance equation and theinterrelationships among these factors (Figure 3-2). For example, theamount, type, and intensity of physical activity influence body compositionand physical fitness, which in turn influence the energy cost of physicalactivity (Hill et al., 2004).
There are several concepts regarding energy balance and weight gain inchildren and youth that the committee determined were important to clarify:
• Genetics is a factor in excess weight but it is not the explanation forthe recent epidemic of obesity (Koplan and Dietz, 1999). Although inher-ited tendencies toward weight gain may be a partial explanation for excessweight in children, as discussed below, there have been no measurablechanges in the genetic composition of the population during the recentdecades that could explain the significant increases in obesity.
• Growth spurts do occur at several points throughout childhoodand adolescence, but it cannot be assumed that a child will lose his or herexcess weight at those times. Many experienced clinicians assess an indi-vidual child’s relative weight status by examining the consistency of thatchild’s weight or BMI percentiles over time. Thus, for example, after theage of about 4 years, normally growing children who are in the 20th or50th or 65th percentile for weight would be expected to remain aroundthese same percentiles for weight, during the remainder of their childhood.However, what can be considered normal variation to that pattern is notyet known, and is an important research question.
• Physiological reasons for a child’s excess weight should be carefullyexplored by health-care professionals. However, the identifiable medicalconditions that cause childhood obesity are rare and are not the principalunderlying causes of the current obesity epidemic in the population.
• The perceptions of what healthy children should “look like” differamong generations, cultures, and individuals. However, it is important thatobesity not become the norm in society for children and youth as it poses
258

92 PREVENTING CHILDHOOD OBESITY
serious health risks during childhood that can continue throughout adultlife.
In the simplest terms, energy balance represents calories consumedversus calories expended, although as noted above, many individual vari-ables can affect that balance. The discretionary variables under anindividual’s control on a daily basis are dietary energy intake and theenergy expended during physical activity.6 Daily energy intake is deter-mined by the calorie content of the specific food and beverages consumed.Energy expenditure above resting metabolism is largely dependent on thenature and intensity of the activity and is often measured in calories perminute of activity (e.g., walking at a moderate or brisk pace of 3 to 4.5miles per hour on a level surface expends between 3.5 and 7 calories perminute as measured in adults [CDC, 2004]). Knowing this, it is possible todetermine the amount of physical activity that would be required to “burnoff” the energy contained in a given food (Box 3-2). The relatively highamount of physical activity required to balance the calories in many pre-ferred foods highlights the challenges of maintaining energy balance underconditions of a sedentary lifestyle and when surrounded by abundant foodin large portions at relatively low cost. Much remains to be learned regard-ing the interactive effects of diet and physical activity—for example, the
6Resting metabolism also contributes to daily energy expenditure but it is not subject tomodification by the individual in the short term. Resting metabolic rate changes as a functionof body mass and composition which generally takes weeks or months to change under anapplied regimen.
BOX 3-2Balancing Food Intake and Physical Activity
• One small chocolate chip cookie (50 calories) is equivalent to walking brisk-ly for 10 minutes.
• The difference between a large chocolate chip cookie and a small chocolatechip cookie is estimated to be about 200 calories or about 40 minutes of rakingleaves.
• One hour of walking at a moderate pace (20 minutes/mile) uses about thesame amount of energy that is in one jelly-filled doughnut (300 calories).
• A fast food meal containing a double patty cheeseburger, extra-large fries,and a 24 ounce soft drink is equal to running 21/2 hours at a 10 minute/mile pace(1500 calories).
SOURCE: DHHS, 2001b.
259
DEVELOPING AN ACTION PLAN 93
extent to which increased physical activity or decreased dietary intake mightimprove the body’s own ability to regulate energy balance.
Furthermore, greater understanding is needed regarding the relativecontribution of energy intake and energy expenditure to the energy imbal-ance that is driving the obesity epidemic. The increasing prevalence ofobesity among children and youth in the United States could be the result ofan upward shift in energy intake, a downward shift in energy expenditure,or the occurrence of both trends concurrently (Hill and Peters, 1998;Harnack et al., 2000; Hill et al., 2003). Some researchers have suggestedthat most of the effect is attributable to excessive energy intake (Sturm,2005), while others have focused on the decline in regular physical activityand the increase in sedentary behaviors (Cutler et al., 2003).
It has been hypothesized that obesity can result from very small ex-cesses in energy intake relative to expenditure and that the average weightgain in U.S. adults could be prevented if chronic energy expenditure ex-ceeded intake by only 100 calories per day (Hill and Peters, 1998; Hill etal., 2003). However, estimates in a population of Hispanic children haveshown greater potential energy gaps, ranging from approximately 200 to500 calories per day (Butte and Ellis, 2003). This is an area requiringfurther research.
The following sections provide a brief overview of the context forenergy balance and the complexities that researchers and policy makersface in these areas.
Genetic Variation and Biological Considerations
Obesity has long been recognized to occur in families, and havingoverweight or obese parents increases a child’s risk of being obese. Afterage 3, parental obesity is a stronger predictor of a child’s future obesity asan adult than is the child’s current weight (Whitaker et al., 1997).
Nonetheless, the familial clustering of obese individuals does not alonepredict an individual’s weight characteristics, which reflect the combinedeffects of genetic variations, the common or shared environmental varia-tions within family (which may include both intrauterine and infant feedingfactors), and the environmental variations external to the family (Bouchardet al., 2003).
Quantifying with any precision the specific contributions of each ofthese factors to the development of obesity has been difficult, despite avariety of studies in nuclear families, in families with identical twins rearedtogether or reared apart, and in families with adopted children. Bouchardand colleagues (2003) reviewed approximately 50 such studies and con-cluded that heritability accounts for about 25 to 40 percent of anindividual’s expressed variation in weight and body fat mass. Specific ma-
260

94 PREVENTING CHILDHOOD OBESITY
ternal or paternal effects could not be identified. Using a new approach totwin studies, Segal and Allison (2002) concluded that common environ-mental effects might account for approximately 25 percent of the BMIvariance in twins. It is important to note the difficulty in assigning propor-tionality to what is a gene-person-environment interaction.
Similarly, despite its intensity, the search for the specific genes respon-sible for an individual’s obese status has also been difficult. More than 400genes, markers, and chromosomal regions have been linked to obesity phe-notypes, 208 quantitative trait loci for human obesity have been identified,and 41 Mendelian disorders manifesting obesity have been genomicallymapped (Snyder et al., 2004). However, only six single-gene defects result-ing in obesity have been found, and in fewer than 150 individuals (Snyder etal., 2004). Thus, even though these monogenetic disorders have providedsignificant insight into the pathophysiology of obesity (Cummings andSchwartz, 2003; O’Rahilly et al., 2003), with few exceptions, human obe-sity appears to be a complex genetic trait. Nonetheless, genome-wide scansin widely varying populations have identified several genomic regions con-taining common quantitative trait loci for obesity phenotypes, suggestingthat there may be shared genetic factors predisposing individuals of differ-ent ethnic origins to excessive storage of body fat (Bouchard et al., 2003).What is clear, however, is that the genetic characteristics of human popula-tions have not changed in the last three decades, while the prevalence ofobesity has approximately doubled. Thus, the recent population rise inbody weight reflects the interaction of genotypes that predispose individu-als to obesity with detrimental behavioral and environmental factors.
In animals, the evidence is strong for such gene-environment interac-tions affecting body weight and energy balance (Barsh et al., 2000), withthe responsible genes orchestrating a complex system of biological feed-back. In this system, central nervous system signals integrate messagesabout energy intake sent from the gastrointestinal tract with informationabout the current status of fuel reserves received from the energy-storingadipose tissue. The result is the direction of ingested food either into storageas fat or dissipation as energy, depending on the body’s status and needs atthe time (Rosenbaum and Leibel, 1998; Havel, 2000, 2004; Druce andBloom, 2003; Gale et al., 2004). What now seems clear is that this systemevolved to defend the body from excessive energy deficit, a defense mecha-nism that has far less relevance today, when many humans are exposed tosituations of food excess (Schwartz et al., 2003; Havel, 2004). Further-more, although the system has now been characterized extensively in ro-dents and in adult humans, little is known about its development during thefetal period, infancy, or childhood (Box 3-3).
261

DEVELOPING AN ACTION PLAN 95
Psychosocial and Behavioral Considerations
Dietary Intake
Everyone needs to eat food and consume beverages for daily suste-nance. But beyond the physical necessities are the complex social, cultural,and emotional nuances that involve food and permeate many facets of dailylife. Children and adults alike consume food and beverages in part becausethey are hungry but also because eating and drinking are pleasurable andare an integral part of family life, celebrations, recreational events, andother social occasions. Food is also important in the psychosocial well-being, emotional expression, and coping responses of many people. It is,therefore, unrealistic to base recommended eating patterns solely on thechemical composition of foods without taking cultural, social, economic,and emotional drivers of food consumption into account. Furthermore,while few would dispute the negative aspects of individual substances suchas tobacco, alcohol, or illegal drugs, there have been strong debates over
BOX 3-3Food Intake Regulatory Systems
In 1994, it was discovered that a peptide hormone—leptin—is manufacturedand secreted by fat cells, travels through the circulatory system, crosses the blood-brain barrier, and acts on the brain’s hypothalamus to influence appetite (Zhang etal., 1994). This finding has led to the concept of a “fat-brain axis” (Elmquist andFlier, 2004), a pathway by which events in the periphery of the body are communi-cated to the brain. As a result, the brain may “monitor” the body’s energy or adi-pose stores and, when indicated, start a chain of events that either initiates orterminates feeding.
There is now evidence that leptin affects both neuronal activity (Pinto et al.,2004) and synaptic plasticity (Bouret et al., 2004) in the arcuate nucleus of thehypothalamus, which is home to two distinct populations of neurons with opposingactions—one group that stimulates food intake and another that suppresses it(Elmquist and Flier, 2004). Furthermore, Bouret and colleagues (2004) suggestthat leptin plays a neurotrophic role during the development of the hypothalamusthat is restricted to a “neonatal critical period”—that is, the plasticity present earlyin life is apparently lost by adulthood. Although it is widely appreciated that goodnutrition and a healthful lifestyle during the pregnancy period are important forproducing healthy babies, these findings raise the possibility that the baby’s food-intake and body fat regulatory systems may be permanently shaped during thisperiod.
Future research undoubtedly will be directed to determining whether this com-munication system is indeed fundamental to the mechanisms of food-intake andbody fat regulation in humans, and whether its timing is so narrowly focused.
262

96 PREVENTING CHILDHOOD OBESITY
“good foods” versus “bad foods, even taking a purely nutritional perspec-tive. Energy intake and dietary quality are determined by the total amountsand combination of foods consumed. A given food or beverage may havemultiple nutritional quality dimensions and will have a differential impacton the overall eating pattern depending on what other foods are eaten.Nevertheless, the frequency of consuming certain types of foods is an indi-cator of the likelihood that the overall quantity and quality of foods will beappropriate, particularly in growing children for whom the nutrient densityof diets (i.e., adequacy of vitamins and minerals per unit of energy intake) isimportant.
Based on current scientific evidence, the Dietary Guidelines for Ameri-cans provide nutritional advice to the American public on how to attain abalanced diet (defined in this report as an overall dietary pattern thatprovides all the essential nutrients in the appropriate amounts to meetnutritional needs and support life processes such as growth in childrenwithout promoting excess weight gain7 ) (Boxes 3-4 and 3-5; also see Chap-ter 5 and Appendix B).
Based on the Dietary Guidelines for Americans, the Healthy Eating
7The U.S. Dietary Guidelines for Americans are currently under revision and the sixthedition will be released in 2005. The Food Guide Pyramid is an educational tool that depictsqualitative dietary guidance based on the principles of balance, proportionality, and modera-tion.
BOX 3-42000 Dietary Guidelines for Americans
• Aim for Fitness♦ Aim for a healthy weight♦ Be physically active each day
• Build a Healthy Base♦ Let the Pyramid guide your food choices♦ Choose a variety of grains daily, especially whole grains♦ Choose a variety of fruits and vegetables daily♦ Keep food safe to eat
• Choose Sensibly♦ Choose a diet that is low in saturated fat and cholesterol and moderate in
total fat♦ Choose beverages and foods to moderate your intake of sugars♦ Choose and prepare foods with less salt♦ If you drink alcoholic beverages, do so in moderation
SOURCE: USDA and DHHS, 2000.
263

DEVELOPING AN ACTION PLAN 97
BOX 3-5Benefits Associated with a Healthful Diet
• A low-fat, low-saturated-fat, and low-cholesterol diet is associated withreduced risk of coronary heart disease.
• Fruits and vegetables supply fiber which binds to lipids such as cholester-ol and decreases their concentration in the blood, thereby decreasing the risk ofcoronary heart disease. Increased consumption is also associated with lower ca-loric intake, lower percentage of calories from fat, and a lower BMI. Fruits andvegetables provide vitamins A, C, and E that are essential for normal metabolismand may act as antioxidants, thus reducing the risk of developing certain cancers(including stomach, esophageal, lung, and colorectal cancers).
• Diets that are moderate in salt help prevent high blood pressure.• Diets that are moderate in sugar help prevent tooth decay.• Calcium maintains healthy bones and teeth and plays a vital role in nerve
conduction, muscle contraction, and blood coagulation. Adequate calcium intakeduring childhood and adolescence is key to peak bone-mass development and theprevention of osteoporosis later in life.
SOURCES: IOM, 1997, 2002, 2004; USDA and DHHS, 2000.
Index (HEI) is a tool developed by the U.S. Department of Agriculture toassess diet quality in order to provide a comprehensive assessment of diet inthe U.S. population. A low HEI score suggests a poor diet and is alsoassociated with overweight and obesity (Guo et al., 2004). Thus, the use ofthe HEI and the Dietary Guidelines for Americans as a way to improvehealth should be emphasized. However, the overall effectiveness of theDietary Guidelines for Americans in disease prevention requires furtherresearch (Guo et al., 2004).
There are some indications of a small but significant increase in theaverage number of calories consumed daily by children over the last 15 to20 years. The Continuing Survey of Food Intakes by Individuals, whichexamined changes between two time periods—1989-1991 and 1994-1996—in nationally representative samples of school-aged children, found an in-crease from 88 to 94 percent of the recommended energy allowance(Gleason and Suitor, 2001). Because no changes were seen in the energyintake from breakfast or lunch, the authors suggest that the increase wasdue to increased food consumption at dinner or in the form of snacks.Subsequent analyses of trends in energy intakes of children and youth haveproduced mixed findings (Enns et al., 2002; Nielsen et al., 2002; Sturm,2005), and much remains to be learned about the dietary factors thatcontribute to the obesity epidemic in these groups.
Many challenges remain in conducting research on children’s dietary
264
98 PREVENTING CHILDHOOD OBESITY
intake. They include difficulties in children accurately recalling and quanti-fying foods consumed, the accuracy of third-party reports (usually parentsor caregivers), and varying estimations of portion size. Use of the 24-hourrecall method is common, but the need to collect information for multipledays to determine typical intake of foods or nutrients makes it a time- andlabor-consuming process (Goran, 1998). Furthermore, the energy require-ments for children vary, depending on the timing of growth and develop-mental spurts, and may be highly individualized.
Physical Activity
Physical activity, which has been defined as “any bodily movementproduced by skeletal muscles that results in energy expenditure” (Caspersenet al., 1985), is in many respects synonymous with childhood. One of thejoys and benefits of childhood is that being physically active is often anatural and fun part of playing and interacting with family and friends anddoes not generally involve a conscious decision to exercise. This play time isalso developmentally important for children’s cognitive, motor-skill, andsocial development (NRC and IOM, 2000). Physical activity—not only infree play time, but in school, organized sports, and other activities—is anintegral part of many children’s daily routines. However, as children grow,they generally become less physically active in adolescence and adulthood(Caspersen et al., 2000; Sallis, 2000). Additionally, children’s patterns ofphysical activity often differ from those of older adolescents and adults.Children often engage in intermittent activity mixed with brief periods ofrest rather than in prolonged exercise (Goran et al., 1999).
Current recommendations are for children and adolescents to accumu-late a minimum of 60 minutes of moderate to vigorous physical activityeach day (Biddle et al., 1998; USDA and DHHS, 2000; Cavill et al., 2001;IOM, 2002; NASPE, 2004). The National Association for Sport and Physi-cal Education recommends that children aged 5 through 12 years be in-volved in age-appropriate physical activity (including moderate to vigorousphysical activity, most of it intermittent) that adds up to at least 60 min-utes—and as much as several hours—per day on most days of the week(NASPE, 2004). Furthermore, long periods (two hours or more) of inactiv-ity during the day time are discouraged in this age group. One of thestrongest correlates of physical activity in children is time spent outside(Klesges et al., 1990; Baranowski et al., 1993; Sallis et al., 1993).
The health and quality-of-life benefits associated with regular moderatephysical activity extend beyond the prevention of obesity (CDC, 1997)(Box 3-6). One of the major research challenges in this area is how toaccurately measure physical activity, particularly in young children. Toolsand techniques vary in terms of their intrusiveness into normal daily rou-
265

DEVELOPING AN ACTION PLAN 99
BOX 3-6Benefits Associated with Physical Activity
for Children and Adolescents
Cardiovascular System• Improves plasma lipid/lipoprotein profile, including reduction of low-density
lipoproteins (LDLs) and increase of high-density lipoproteins (HDLs) in childrenand youth with at-risk levels. Elevated plasma LDL and lowered HDL are risk fac-tors for the development of coronary heart disease (CHD) and evidence indicatesthat atherosclerosis begins in childhood.
• Prevents or delays the development of hypertension and decreases bloodpressure.
Musculoskeletal System• Develops higher peak bone masses (which have been linked with reduced
risk of osteoporosis in adulthood), increases bone-mineral density and bone size(which confers bone strength), and decreases the likelihood of fractures.
• Increases muscular strength and aerobic endurance• Maintains joint structure and function• Increases fat-free mass, reduces body-fat percentage
Mental Health, Psychological and Emotional Well-Being• Reduces stress and symptoms of depression and anxiety• Improves self-esteem and body image
Chronic Disease Prevention• Helps prevent chronic diseases such as hypertension, type 2 diabetes, obe-
sity, and cardiovascular diseases.• Improves overall health and improves adult health status
SOURCES: DHHS, 1996; Sothern et al., 1999; Boreham and Riddock, 2001; Ma-ziekas et al., 2003.
tines (perhaps affecting activity level) and in the cost and time needed tocollect and monitor the results. Questionnaires of parents and children areoften confounded by recall problems and varying assessments of the type,intensity, and duration of the activity (Saris, 1986; Goran, 1998; Sirard andPate, 2001). Measures of motion (e.g., pedometers and accelerometers)have come into wide use as research tools in recent years, but additionalwork is needed to ensure the validity of these methods in diverse groups ofchildren and youth and in diverse settings. Additionally, research is neededto establish better methods of measurement of energy expenditure in chil-dren going through their normal daily activities in their home and schoolenvironments.
266

100 PREVENTING CHILDHOOD OBESITY
Sociocultural and Other Environmental Considerations
The specific types and levels of environmental factors to be consideredas influences on food intake and physical activity are numerous. Tables 3-1and 3-2 provide an illustrative listing of factors operating within differentecological layers (Swinburn et al., 1999). What is available with respect tofood intake and physical activity opportunities (physical environment) isinfluenced by policies and financial inputs (political and economic environ-ments) and is also targeted to the sociocultural milieu. Availability affectsthe range of possible individual choices, but personal choice is also medi-ated through a range of sociocultural variables that differ by age, gender,ethnicity, region, neighborhood characteristics, and socioeconomic status.
This matrix of environmental levels and types can also be developed tofacilitate consideration of influences on obesity-related variables such as theavailability of education and counseling and broader health promotionabout weight gain prevention (physical environment), cost of preventiveservices (economic), and coverage of preventive services by third-party pay-ers (policy environment). As discussed in the following sections, in thesociocultural domain, attitudes about body size and obesity are also criticalcontextual considerations when designing obesity prevention interventions.
Considerations Regarding Stigmatization
One of the concerns that arises in discussions regarding the preventionof childhood obesity is how to effectively focus on the behaviors that con-tribute to obesity without stigmatizing obese children and youth. As notedin Chapter 2, there is a body of research indicating that obese children andyouth are stigmatized and experience negative stereotyping and discrimina-tion by their peers, with adverse social and emotional consequences(Schwartz and Puhl, 2003).
Given that the stigmatization of obese children appears to have in-creased over a 40-year period from 1961 to 2001, there is a need to focuson the sensitivities regarding this issue and to explicitly reduce negativeattitudes and behaviors such as teasing and discrimination directed towardobese children and youth (Latner and Stunkard, 2003; Schwartz and Puhl,2003). This focus needs to be a consideration in the design of the range ofinterventions discussed throughout this report.
There is also the need to consider the adverse effects of normalizationwhen discussing stigmatization. In many ways, American society has be-come more accepting of larger sizes in the products and portions we con-sume. Furthermore, our society often accommodates obesity as the socialnorm, for example, by resizing clothing, expanding the width of seating inpublic areas, and retrofitting ambulances to accommodate larger girth
267

101T
AB
LE
3-1
Exa
mpl
es o
f E
nvir
onm
enta
l In
flue
nces
on
Food
Int
ake,
by
Typ
e of
Env
iron
men
t
Typ
e of
Env
iron
men
t: F
ood-
Rel
ated
Inf
luen
ces
Size
or
Lev
elof
the
Env
iron
men
tPh
ysic
alE
cono
mic
Polic
y/Po
litic
alSo
cioc
ultu
ral
Mic
roen
viro
nmen
ts•
Loc
atio
n an
d ty
pe•
Loc
ally
im
pose
d•
Fam
ily
rule
s re
late
d•
“Eth
os”
or c
lim
ate
rela
ted
(e.g
., b
ehav
iora
lof
foo
d st
ores
taxe
sto
foo
d pu
rcha
sing
to f
ood
and
eati
ng i
n th
ese
ttin
gs s
uch
as•
Ven
ding
mac
hine
•V
endo
r pr
icin
gan
d co
nsum
ptio
nho
me,
sch
ool,
and
hom
es,
scho
ols,
plac
emen
t an
dpo
lici
es•
Food
pol
icie
s of
loc
alne
ighb
orho
odan
d co
mm
unit
ies)
prod
ucts
•Fi
nanc
ial
supp
ort
scho
ols
or s
choo
l•
Rol
e m
odel
s fo
r ea
ting
•Po
int-
of-p
urch
ase
for
heal
thdi
stri
cts
beha
vior
s at
hom
e, i
nin
form
atio
npr
omot
ion
prog
ram
ssc
hool
, an
d in
com
mun
ity
•L
ocal
foo
d•
Spon
sors
hip
ofse
ttin
gs (
e.g.
, ch
urch
es)
prod
ucti
onhe
alth
ful
food
poli
cies
and
pra
ctic
es
Mac
roen
viro
nmen
ts•
Food
pro
duct
ion/
•C
osts
of
food
•N
atio
nal
food
and
•M
ass
med
ia i
nflu
ence
s on
(e.g
., s
ocie
tal
sec t
ors
impo
rtin
gpr
oduc
tion
,nu
trit
ion
poli
c ie s
,fo
od s
e le c
tion
s an
d e a
ting
such
as
food
and
•Fo
od m
anuf
actu
ring
man
ufac
turi
ng,
and
regu
lati
ons,
and
beha
vior
sag
ric u
ltur
e , e
duca
tion
,•
Food
mar
keti
ngdi
stri
buti
onla
ws,
inc
ludi
ng•
Gen
e ral
con
sum
e r t
rend
sm
edic
al,
gove
rnm
ent,
•Fe
dera
l nu
trit
ion
•T
axe s
, pr
icin
g po
lic i
e s,
food
lab
e lin
gin
foo
d an
d e a
ting
publ
ic h
e alt
h, o
rla
beli
ng g
uide
line
ssu
bsid
ies
•Fo
od i
ndus
try
heal
th c
are )
•W
age
stru
c tur
e an
dst
anda
rds
and
othe
r fa
c tor
s th
atpr
acti
c es
infl
uenc
e pe
rson
al•
Reg
ulat
ions
and
and
hous
e hol
d in
c om
egu
ide l
ine s
on
adve
rtis
ing
to c
hild
ren
SOU
RC
E:
Ada
pted
fro
m S
win
burn
et
al.,
1999
.
268

102T
AB
LE
3-2
Exa
mpl
es o
f E
nvir
onm
enta
l In
flue
nces
on
Phys
ical
Act
ivit
y, b
y T
ype
of E
nvir
onm
ent
Typ
e of
Env
iron
men
t
Size
or
Lev
elof
the
Env
iron
men
tPh
ysic
alE
cono
mic
Polic
y/Po
litic
alSo
cioc
ultu
ral
Mic
roen
viro
nmen
ts•
Side
wal
ks a
nd•
Cos
t of
gym
•Fa
mil
y ru
les
abou
t•
“Eth
os”
or c
lim
ate
rela
ted
to(e
.g.,
beh
avio
ral
foot
path
sm
embe
rshi
pste
levi
sion
wat
chin
gph
ysic
al a
ctiv
ity
and
sett
ings
suc
h as
•C
ycle
pat
hs•
Bud
get
allo
cati
ons
for
•Fa
mil
y ru
les
abou
tin
acti
vity
in
the
hom
e,ho
mes
, sc
hool
s, a
nd•
Publ
icre
crea
tion
cen
ters
or
hous
ehol
d ch
ores
scho
ol,
and
neig
hbor
hood
com
mun
itie
s)tr
ansp
orta
tion
wal
king
and
cyc
ling
•R
estr
icti
ons
on•
Rol
e m
odel
s fo
r ph
ysic
al•
Stre
et l
ight
spa
ths
auto
mob
ile
traf
fic
acti
vity
and
ina
ctiv
ity
in t
he•
Rec
reat
iona
l•
Fund
ing
for
impr
oved
•R
estr
icti
ons
onho
me,
at
scho
ol,
and
in t
hefa
cili
ties
and
clu
bspu
blic
tra
nspo
rtbi
cycl
e or
ped
estr
ian
neig
hbor
hood
•Sp
onso
rshi
p of
traf
fic
phys
ical
act
ivit
y-re
late
d•
Zon
ing
for
heal
th p
rom
otio
npr
otec
tion
of
open
•In
flue
nces
on
hous
ehol
dsp
aces
inco
me
and
tim
e•
Bui
ldin
g co
des
e xpe
ndit
ure s
Mac
roe n
viro
nmen
ts•
Aut
omob
ile
indu
stry
•Pu
blic
tra
nspo
rt•
Stat
e -le
vel
poli
c ie s
•M
ass
med
ia i
nflu
e nc e
s on
(e.g
. so
c ie t
al s
e cto
rsfu
ndin
g an
d su
bsid
ies
on p
hysi
c al
e duc
atio
nph
ysic
al a
c tiv
ity
and
such
as
food
and
in s
c hoo
lsin
acti
vity
agri
c ult
ure ,
edu
cati
on,
•G
ene r
al c
onsu
me r
tre
nds
inm
edic
al,
gove
rnm
ent,
patt
e rns
of
phys
ical
ac t
ivit
ypu
blic
he a
lth
oran
d in
acti
vity
heal
th c
are )
SOU
RC
E:
Ada
pted
fro
m S
win
burn
et
al.,
1999
.
269

DEVELOPING AN ACTION PLAN 103
(Newman, 2004). Just as there are social and emotional consequences ofstigmatization, there are also social and health consequences for obesitybecoming the accepted social norm. This tension between stigmatizationand normalization can be addressed, as it has been for other public healthconcerns, by focusing on the behaviors that can be changed to promotehealth rather than on the individual and his or her appearance.
It is important to note that the lessons learned from tobacco preventionand control efforts are not entirely applicable to obesity prevention. Bansagainst smoking in public buildings, on airplanes, and at other locationshave encouraged some people to quit smoking due to the added inconve-nience and public disapproval of this behavior. However, foods and bever-ages are necessary for sustenance and the issue is not “whether or not” toeat but rather what to eat, how much, and how often.
Areas of further research on this issue include how to encourage chil-dren to accept peers of all sizes and shapes and how to assist and supportparents, teachers, children, and youth in addressing and coping with socialstigma.
Body Image
A community’s norms, values, and expectations also affect the way thatchildren in the normal or overweight (but not obese) range view theirbodies. There is also concern that obesity prevention efforts will lead toinappropriate weight concern, dieting preoccupation, or unhealthful weightcontrol practices among children and youth. Attitudes toward body sizediffer across cultures and especially affect females. Standards of attractive-ness in males are less weight-dependent. Consistent with the stigma associ-ated with being obese, the dominant attitudes in the United States andmany similar societies favor a thin or lean body type in females, although asdiscussed below there is cultural variation in the degree of fatness or thin-ness that is acceptable as well as in preferred body shapes (Brown andBentley-Condit, 1998). Attitudes about acceptable body size and shape alsochange over time and may apply differently to people of different ages.
The potential importance of this issue is underscored by reports ofweight concerns in young children and in adolescents, in numerous ethnicgroups, and in both low and high socioeconomic strata (see Chapter 2).Studies of children as young as the first grade have reported that a substan-tial proportion of children (about 50 percent of girls and 30 to 40 percentof boys), when given a choice of silhouettes will choose a thinner body sizethan their own as the “ideal” body size (Thompson et al., 1997). Robinsonand colleagues (2001) studied a multiethnic and socioeconomically diversesample of third graders (mean age was 8.5 years) in 13 northern California
270

104 PREVENTING CHILDHOOD OBESITY
elementary schools, and reported that concerns about being obese anddissatisfaction with body size were highly prevalent, increased with increas-ing BMI, and present—although to varying degrees—in all socioeconomicstrata and ethnic groups. Furthermore, a study of 4,700 adolescents inMinnesota public schools (grades 7 through 12; mean age was 15 years)found high body satisfaction (versus low or moderate) in only 20 percent ofgirls and 34 percent of boys (Neumark-Sztainer et al., 2002).
Several studies have examined potential correlates of body image dis-satisfaction and weight concerns or dieting practices, particularly gender,ethnicity, and socioeconomic status. Most of the studies that have exam-ined ethnic differences consistently find less weight concern, less body sizedissatisfaction, and a heavier ideal body size in African-American girlscompared with white girls, but not necessarily boys, and sometimes demon-strate significant differences within African Americans across different so-cioeconomic levels (e.g., concern was greater at higher levels) (Thompson etal., 1997; Brown et al., 1998; Halpern et al., 1999; Adams et al., 2000;Neumark-Sztainer et al., 2002). These findings in children and adolescentsare generally parallel to the numerous studies in adults indicating a rela-tively lower level of weight concern and higher level of body satisfaction inblack women compared to white women; even considering the higher weightlevels of the black women (Flynn and Fitzgibbon, 1998).
In contrast to the data for African Americans, available studies suggestthat weight concerns in Hispanic and Asian girls are comparable to orexceed those in non-Hispanic white girls (Robinson et al., 2001; Neumark-Sztainer et al., 2002). The finding in Hispanic girls is consistent with data inadults (Serdula et al., 1999). Data for Native Americans in the Minnesotastudy (which were adjusted for grade level, socioeconomic status, and BMI)indicated a similar level of body satisfaction to that in white girls, but asignificantly lower level of concern about controlling their weight(Neumark-Sztainer et al., 2002).
Socioeconomic Status
Socioeconomic status has generally been inversely associated with obe-sity prevalence (see Chapter 2) and children with obese mothers and lowfamily income were found to have significantly elevated risks of becomingobese, independent of other demographic and socioeconomic factors(Strauss and Knight, 1999). When compared with food-insufficient house-holds of higher income, low-income food-insufficient households had moreobese children; however, food insufficiency by itself was not associatedwith self-reported measures of childhood obesity (Casey et al., 2001). Otherstudies have not been able to show a clear relationship between childhood
271

DEVELOPING AN ACTION PLAN 105
obesity and food insufficiency or food insecurity8 after adjusting for otherconfounding variables (Alaimo et al., 2001b; Kaiser et al., 2002; Mathesonet al., 2002). However, food insecurity is associated with adverse healthoutcomes in infants and toddlers below 36 months of age (Cook et al.,2004) and with negative academic and psychosocial outcomes includingdepression in older children (Alaimo et al., 2001a, 2002).
Many of the variables in Tables 3-1 and 3-2 may be potential mediatorsof the relationship between socioeconomic inequities and childhood obe-sity. Both food and physical activity options are more likely to be periodi-cally inadequate, unpredictable, or of lower quality for those with lowpersonal incomes or those living in low-income neighborhoods (Travers,1996; Morland et al., 2002a,b; Addy et al., 2004; Fitzgibbon and Stolley,2004; Molnar et al., 2004). Poverty and living in low-income neighbor-hoods limit access to healthful foods. Some types of leisure-time physicalactivity are theoretically available at low or no cost, but these options maybe less available to children in low-income neighborhoods because of neigh-borhood safety concerns, lack of adult supervision, or limited communityrecreational or other resources. Addressing childhood obesity in these con-texts will require attention to root causes, and attempts to mitigate theunderlying social and environmental adversity will be needed (Travers,1997).
Racial and Ethnic Disparities
The substantially higher prevalence of obesity in adults, children, andyouth in some African-American, Hispanic, American-Indian, and PacificIslander populations (see Chapter 2) generates considerations across theentire ecologic framework (see Figure 3-2). A relatively high obesity preva-lence in some Hispanic and American-Indian groups was noted prior to theobesity epidemic (Kumanyika, 1993); the pattern of excess weight gain andaccelerated rates of obesity prevalence in African-American children andyouth is a more recent development. It is now understood that issues of raceare much more complex than the traditional U.S. Census Bureau racial andethnic groupings often used in epidemiological research (Cooper, 2003;Cooper et al., 2003). However, the different historical and geographical
8Food insufficiency is defined as inadequacy in the amount of food intake because oflimited money or resources. Food insecurity is the limited or uncertain availability of nutri-tionally adequate and safe foods, or the inability to acquire such foods in a socially acceptableway. Although these definitions are similar, food insecurity describes a broader condition thatnot only encompasses food insufficiency but also the psychological and other dimensions ofthe food system (Cook et al., 2004).
272

106 PREVENTING CHILDHOOD OBESITY
trajectories of these social and politically defined groups are associated withsome differences in gene frequencies that may be linked with obesity devel-opment. Regardless, as discussed earlier in this chapter, the predominantfactors responsible for the expression of obesity as a general populationphenomenon are the linked behavioral and environmental factors outlinedin the framework in Figure 3-2.
Many factors that potentially mediate racial and ethnic differences andpredispose minority children and youth to high obesity risks can be postu-lated across physical, economic, sociocultural, and policy/political envi-ronments (Tables 3-1 and 3-2). Socioeconomic inequities are dispropor-tionately common in minority populations and some of the excess risk maybe mediated through economic and physical environmental factors relatedto low income or living in low-income communities. Other factors mayaffect individuals and communities on the basis of sociocultural factorsthat are not dependent upon socioeconomic status. Eating and physicalactivity patterns in some minority communities are less favorable to weightcontrol than those in the general population, and these differences areobserved within socioeconomic strata (Kumanyika and Krebs-Smith,2001). For example, targeted marketing of high-calorie, low-nutrient-densefoods on black-oriented television has been reported (Tirodkar and Jain,2003). Less access to supermarkets or to good quality food in supermar-kets has been associated with black neighborhoods (Morland et al., 2002a)(see Chapter 6).
Sociocultural variables that need to be considered when approachingobesity prevention to reduce racial and ethnic disparities include traditionalcuisines and any aspect of the attitudes, beliefs, and values (referred to inTables 3-1 and Table 3-2 as the ethos or climate) that may facilitate orinhibit the promotion of healthful eating, physical activity, and weightcontrol patterns in children and youth in these communities (Kumanyikaand Morssink, 1997; Kumanyika, 2002, 2004). This ethos may includecultural values of responsiveness to or harmonization with the existingenvironmental context, as opposed to assumptions that the context can (orshould) necessarily be changed. Included in the sociocultural environmentare the high prevalence of obesity (e.g., the normative presence of theproblem) as well as high levels of obesity-related health problems. In addi-tion, to the extent that a history of discrimination or marginalization basedon race or ethnicity becomes intertwined with other sociocultural factors, acertain level of skepticism or distrust relative to mainstream informationand initiatives, including health information, may influence the receptivityto obesity prevention messages—particularly when these messages seem toconflict with pre-existing attitudes and beliefs.
273

DEVELOPING AN ACTION PLAN 107
REVIEW OF THE EVIDENCE
The committee identified a primary prevention, population-based ap-proach to be the most viable long-term strategy for reducing obesity and itschronic disease burdens. Examples of the effectiveness of primary preven-tion interventions include smoking cessation to reduce lung cancer inci-dence, condom use to lower HIV transmission, and fruit and vegetableconsumption to prevent cancer and cardiovascular diseases (CVDs) (Krokeet al., 2003; WHO, 2003).
There is no single acceptable standard, however, for assessing the entirerange of prevention interventions and programs (Kellam and Langevin,2003). Each phase of prevention research involves specific criteria for evi-dence and a variety of possible research designs. This is often a processwhereby the preceding phase of research informs the subsequent generationof research—from efficacy to effectiveness, sustainability, going-to-scale,and, finally, sustaining system-wide9 (Figure 3-3). Numerous evidence-based prevention strategies are currently being used, though their focus—whether on individuals, institutions, or societal structures—can vary(Kellam and Langevin, 2003).
An Evidence-Based Medicine Approach
Evidence-based medicine is a valuable concept for informing clinicalmedicine that provides universally accepted standards for testing the scien-tific method and developing clinical practice guidelines (Harris et al., 2001;Heller and Page, 2002). This approach uses an accepted hierarchy of evi-dence—in accordance with its type, quality, and strength—to support rec-ommendations (Table 3-3) (Harris et al., 2001; Kroke et al., 2003), and itestablishes a cause-and-effect relationship guided by the principles of pre-dictability, replicability, generalizability, and falsifiability. Predictabilitydepends on a properly implemented intervention producing expected out-comes, a clear understanding of the intervention’s elements, and a cause-and-effect interaction among those elements (Tang et al., 2003).Replicability and generalizability rely on an intervention’s potential for
9Efficacy research addresses whether an intervention produces a beneficial impact underoptimal conditions of implementation and scientific rigor. Effectiveness research tests anintervention under normal conditions such as those in which the intervention may be em-ployed. Sustainability research assesses whether the training and support structures developedfor effectiveness trials can work to continue the implementation of the intervention by otherimplementers and with other cohorts of the population. Going-to-scale research designs andtests methods of training, support, and assessment that can be implemented across an entiresystem. Sustaining system-wide research determines how to maintain high-quality standardsfor an entire program over the long term (Kellam and Langevin, 2003).
274

108 PREVENTING CHILDHOOD OBESITY
SustainingSystem-wide
Going-to-Scale
Sustainability
Effectiveness
Efficacy
FIGURE 3-3 Five phases of prevention research.SOURCE: Reprinted with permission, from Kellam and Langevin, 2003. Copyright2003 by Prevention Science.
universal application that is independent of time, place, or context (Tang etal., 2003). Falsifiability refers to the possibility that an evaluation coulddetermine, if relevant, that the intervention is ineffective (Tang et al., 2003).
An evidence-based medicine approach has been adopted by federal andscientific institutions to guide obesity treatment in adults (NHLBI, 1998).However, efforts to apply its principles to identifying effective interventionsfor other areas of disease prevention and health promotion have met withvarying degrees of success (Osaka Declaration, 2001; McQueen, 2002;WHO, 2003; Victora et al., 2004). Indeed, it has been suggested that clini-cal decisions may have a relatively small impact on health outcomes com-pared to changes in the social environment, and that broadening evidence-based medicine beyond clinical policy decision-making—to public healthdecision-making—often has the potential to produce a larger beneficialimpact on the health of populations (Heller and Page, 2002).
An Evidence-Based Public Health Approach
As the public health and health promotion disciplines have evolved,evidence-based public health has become the goal with a knowledge basethat includes disease frequency and distribution; correlates, determinantsand consequences of disease; and the safety, efficacy, effectiveness, andcost-effectiveness of a range of interventions (Victora et al., 2004). Butgiven the complex environment in which multiple social, economic, cul-tural, and political elements interact to produce change in population-wideproblems such as obesity, causality may not always be established for the
275

DEVELOPING AN ACTION PLAN 109
relationships among the various interventions (McQueen, 2002; Tang etal., 2003).
Several factors complicate the task. The first is complexity in the causalsequences, including mediating factors, multiple causes acting simulta-neously (some independently, others interactively), and the potential forunintended consequences from well-intended interventions. The second fac-tor is that scientific uncertainty is associated with many or most of thecausal links, which can vary across different social contexts and be con-strained by current methods and ethical limitations (NRC, 1994). A thirdfactor is that individuals and groups differ in the benefits and costs theyattach to each of the causes, potential solutions, intended outcomes, andunintended consequences (Slovic, 1987, 2000). It has been suggested thatthere can be no purely scientific answer to the question of what should bedone because the answer depends on social values (NRC, 1978). A fourthfactor is that individuals and groups vary in how much uncertainty they arewilling to tolerate before acting to address a problem (NRC, 1989).
The conclusion that results from these well-established principles isthat while scientists can strive to clarify causal relations and reduce uncer-tainty, they are incapable of recommending specific actions (or inaction)
TABLE 3-3 Hierarchy of Research Design Used for Evidence-BasedClinical Medicine
Level ofEvidence Type of Study
I Evidence obtained from at least one properly designed randomizedcontrolled trial (RCT) that provides a consistent pattern of findingsin the population for which a recommendation is made.
II-1 Evidence obtained from well-designed controlled trials withoutrandomization.
II-2 Evidence obtained from well-designed cohort or case-controlledanalytical studies, preferably from more than one center orresearch group.
II-3 Evidence obtained from multiple time-series or correlational studieswith or without then intervention.
III Evidence obtained from opinions of respected authorities, based onclinical experience, descriptive studies and case reports, or reportsof expert committees.
SOURCES: Harris et al., 2001; Kroke et al., 2003.
276

110 PREVENTING CHILDHOOD OBESITY
TABLE 3-4 Comparison of Individual and Community Approaches forCVD Prevention
Clinical Practice Community and Population-BasedApproaches for Individuals Approaches for Health Promotion
The evidence standards are The evidence standards are RCTsRCTs and outcome and process evaluations
that use both quantitative andqualitative methods
The focus is on individual patients The focus is on the community
Less than a therapeutic dose is Preventive dose rarely appliesunacceptable
Easier to treat an individual Difficult to scale up health promotionprograms that reach the entire population
Outcomes of interventions are Outcomes are to change social norms,individual change environments, and the behavior of entire
populations
Interventions can focus on most Interventions rarely take on socialfactors relevant to outcomes determinants external to the community
SOURCE: Adapted from Osaka Declaration, 2001.
without making implicit value judgments (NRC, 1978, 1996). The solutionto this dilemma ideally lies in the development and application of newapproaches for integrating scientific considerations with social and norma-tive considerations in a transparent, fair, and competent manner (Renn etal., 1995; NRC, 1996; Klinke and Renn, 2002).
Although randomized controlled trials (RCTs) are the gold standardfor testing interventions in clinical and public health research, it is notalways feasible, appropriate, or ethical to use that methodology in conduct-ing population-based research; furthermore, RCTs may not always illumi-nate the complexity of some population-based prevention strategies(Robinson et al., 1998; Briss et al., 2000).
Therefore, the evidence base regarding public health prevention effortsoften involves the integration of a range of research methodologies. Severalhealth promotion and disease prevention initiatives have implemented com-prehensive population health programs using a broader integrated approachto the evidence. For example, Table 3-4 illustrates the different approachesrequired for guiding the design of individual and community-based ap-proaches to CVD prevention (Osaka Declaration, 2001).
277

DEVELOPING AN ACTION PLAN 111
Developing Recommendations Based on an IntegratedApproach to the Evidence
The committee faced a significant challenge in deciding what types ofevidence to use in formulating recommendations for obesity prevention inchildren and youth. A review of randomized controlled interventions forobesity prevention and treatment among children and adolescents identi-fied only 35 such studies (Campbell et al., 2002). Due to the limited numberof RCTs in obesity prevention efforts and methodological issues, includingsmall sample sizes and high attrition rates of study participants, there is apaucity of RCT data from which to generalize results to broader popula-tions (NHS Centre for Reviews and Dissemination, 2002).
The committee, therefore, developed guidelines for an integrated use ofthe available evidence to inform population-based obesity prevention inter-ventions and on which to base its recommendations. This was deemednecessary to enhance the biological, psychosocial, and environmental plau-sibility of its inferences and identify consistency and congruency of infor-mation due to the paucity of causal research. Such an integrated-evidenceapproach has been used successfully to apply science-based principles toother public health efforts (Appendix D), such as in establishing a frame-work for evaluating the safety of dietary-supplement ingredients (IOM andNRC, 2004).
As childhood obesity is a serious public health problem calling forimmediate reductions in obesity prevalence and in its health and socialconsequences, the committee strongly believed that actions should be basedon the best available evidence—as opposed to waiting for the best possibleevidence.
The different types of evidence that the committee used in developingthe report’s recommendations are illustrated in Table 3-5, and the follow-ing principles guided the committee’s process:
• Evidence is needed to inform and guide policy and programmaticdecisions, justify a course of action, and evaluate the effectiveness of inter-ventions that support obesity prevention.
• Although the strength of the evidence is a basis for policy develop-ment, other considerations—including the fiscal and sociopolitical climatewithin which governments, institutions, and communities operate—mustalso be taken into account (Tang et al., 2003).
• Absence of experimental evidence does not indicate a lack of causa-tion or the ineffectiveness of an obesity prevention intervention. Given themethodological challenges, as well as the complexities in linkages betweendifferent elements and in their environments, certain interventions mayprove effective even though their mechanisms for success are not known.
278

112T
AB
LE
3-5
Prop
osed
Com
pone
nts
of E
vide
nce-
Bas
ed O
besi
ty P
reve
ntio
n
Poli
cy o
rR
elev
ant
Evi
denc
eO
bjec
tive
Prog
ram
Rel
evan
cean
d In
form
atio
nT
ypes
of
Out
puts
Est
imat
e th
e H
ealt
h B
urde
n•
Show
urg
ency
of
taki
ng•
Mon
itor
ing
and
surv
eill
ance
•Pr
eval
ence
est
imat
es i
nclu
ding
Why
sho
uld
we
doac
tion
on
obes
ity
data
(e.
g.,
prev
alen
ce,
proj
ecte
d tr
ends
som
ethi
ng a
bout
obe
sity
?•
Com
pare
cos
ts,
heal
thtr
ends
)•
Est
imat
es o
f th
e co
sts
of o
besi
tybu
rden
, an
d ga
ins
from
•O
bser
vati
onal
stu
dies
(e.
g.,
(dir
ect,
ind
irec
t, i
ntan
gibl
e)pr
even
tion
wit
h ot
her
risk
rela
tive
ris
ks,
occu
rren
ce•
Com
para
tive
hea
lth
burd
ens
infa
ctor
s an
d di
seas
esra
tes
in d
iffe
rent
term
s of
yea
rs o
f li
fe o
r D
AL
Ys
•A
ddre
ss p
rior
itiz
atio
n of
popu
lati
ons)
lost
obes
ity
rela
tive
to
othe
r is
sues
•E
cono
mic
ana
lyse
s (e
.g.,
•E
stim
ated
pos
sibl
e re
duct
ions
in
•Id
enti
fy p
opul
atio
ns o
fco
sts
of o
besi
ty,
disa
bili
ty-
burd
en w
ith
inte
rven
tion
ssp
ecia
l in
tere
stad
just
ed l
ife
year
s•
Ben
chm
arks
for
goa
l se
ttin
g[D
AL
Ys]
los
t)•
Info
rmed
opi
nion
(e.
g.,
for
mod
elin
g as
sum
ptio
ns)
Iden
tify
the
Det
erm
inan
ts•
Iden
tify
tar
gets
for
•O
bser
vati
onal
stu
dies
•E
vide
nce
revi
ews
of s
peci
fic
Wha
t ar
e th
e c a
usat
ive
inte
rve n
ing
•E
xpe r
imen
tal
stud
ies
mod
ifia
ble
dete
rmin
ants
of
and
prot
e cti
ve f
acto
rs t
hat
•R
e lat
e ob
e sit
y is
sue s
to
•In
dire
c t e
vide
nce
obe s
ity
and
its
path
way
sc o
uld
pote
ntia
lly
beot
her
e xis
ting
age
ndas
•M
onit
orin
g an
d su
rve i
llan
c ein
c lud
ing
leve
ls o
f c e
rtai
nty
and
targ
e te d
by
inte
rve n
tion
s?•
Ide n
tify
con
grue
nt a
ndda
tali
kely
siz
e of
im
pac t
c onf
lic t
ing
poli
c ie s
and
•In
form
ed o
pini
on (
e .g.
, on
•Id
enti
fie d
im
port
ant
stak
ehol
der
acti
viti
e sc u
rre n
t po
lic i
e s a
nd a
c tiv
itie
sgr
oups
and
are
as o
f c o
ngru
enc e
•Id
e nti
fy t
he k
e y g
ove r
nmen
t,th
at i
nflu
e nc e
obe
sity
)an
d c o
nfli
c tno
ngov
e rnm
enta
lor
gani
z ati
on,
and
priv
ate
sec t
or s
take
hold
e rs
that
are
c ent
ral
to o
besi
ty p
reve
ntio
n
279

113
Des
crib
e th
e Fr
amew
ork
•L
inks
to
and
com
pati
bili
ty•
Para
llel
evi
denc
e fr
om o
ther
•C
ompr
ehen
sive
obe
sity
for
Act
ion
wit
h ex
isti
ng p
lans
, po
lici
es,
publ
ic h
ealt
h in
itia
tive
spr
even
tion
in
a st
anda
lone
How
and
whe
re s
houl
dan
d pr
ogra
ms
•Pr
e-ex
isti
ng f
ram
ewor
ks f
orfr
amew
ork
or a
s pa
rt o
f a
we
inte
rven
e?•
Spec
ific
atio
n of
the
acti
on (
e.g.
, O
ttaw
a C
hart
er)
broa
der
plan
of
acti
on f
orco
mpr
ehen
sive
and
mul
ti-
•In
form
ed o
pini
on (
e.g.
,nu
trit
ion
and
phys
ical
act
ivit
y,di
men
sion
al n
atur
e of
the
abou
t ot
her
succ
essf
ulan
d/or
non
com
mun
icab
leac
tion
nee
ded
fram
ewor
ks o
r m
odif
iabl
edi
seas
es•
Pers
uasi
on o
f st
akeh
olde
rsan
d fe
asib
le s
trat
egie
s)•
Iden
tifi
ed s
etti
ngs,
sec
tors
, an
dof
the
fea
sibi
lity
and
•In
form
atio
n on
cur
rent
supp
ort
acti
ons,
and
sho
rt-
and
nece
ssit
y of
a c
ompr
ehen
sive
rele
vant
ini
tiat
ives
long
-ter
m p
opul
atio
n go
als
appr
oach
•Pr
ogra
m l
ogic
and
the
ory
•E
vide
nce
of p
rece
denc
e
Eva
luat
e Po
tent
ial
•C
onse
nsus
on
pote
ntia
l•
Exp
erim
enta
l st
udie
s•
Spec
ific
des
crip
tion
s of
Inte
rven
tion
sco
ncre
te a
ctio
ns•
Obs
erva
tion
al s
tudi
esin
terv
enti
ons
and
supp
ort
acti
ons
Wha
t ar
e th
e sp
ecif
ic a
nd•
Mov
e ob
esit
y in
itia
tive
s•
Eff
ecti
vene
ss a
naly
ses
•E
ffec
tive
ness
, co
st-e
ffec
tive
ness
,po
tent
ial
inte
rven
tion
s an
dth
roug
h th
e ag
enda
-set
ting
•E
cono
mic
ana
lyse
sor
cos
t-ut
ilit
y es
tim
ates
for
the
thei
r li
kely
eff
ecti
vene
ss?
proc
ess
•Pr
ogra
m l
ogic
and
the
ory
inte
rven
tion
s•
Iden
tify
res
ourc
e•
Proc
ess
eval
uati
on (
e.g.
, of
impl
icat
ions
e xis
ting
com
mun
ity
orde
mon
stra
tion
int
e rve
ntio
ns)
Sele
c t a
Por
tfol
io o
f Po
lic i
e s,
•G
ain
stak
ehol
der
inpu
t in
to•
Info
rmed
opi
nion
on
spe c
ific
•Sp
e cif
ic p
ortf
olio
of
poli
c ie s
,Pr
ogra
ms,
and
Ac t
ions
judg
men
ts o
n po
lic y
and
inte
rve n
tion
s an
d ac
tion
spr
ogra
ms,
and
oth
e r a
c tio
ns t
oW
hat
is a
com
pre h
e nsi
veim
plem
enta
tion
im
plic
atio
nsre
gard
ing
the i
r fe
asib
ilit
y an
dpr
e ve n
t ob
e sit
ypo
rtfo
lio
of i
niti
ativ
e s t
hat
•G
ain
stak
ehol
der
supp
ort
for
sust
aina
bili
ty;
pote
ntia
l ot
her
is s
uffi
c ie n
t to
pre
vent
prio
rity
int
e rve
ntio
nspo
siti
ve o
r ne
gati
ve p
ote n
tial
inc r
e ase
s in
obe
sity
?im
pac t
s; e
ffe c
ts o
n e q
uity
; an
dac
c ept
abil
ity
to s
take
hold
e rs
SOU
RC
E:
Ada
pted
fro
m S
win
burn
et
al.,
2005
.
280

114 PREVENTING CHILDHOOD OBESITY
This has been exemplified by programs that reduce television viewing timeand decrease BMI in children (Robinson, 1999).
• Given the significant shortage at present of experimental evidenceto guide programs and policies, and the fact that many societal variables ofinterest have not been well addressed in controlled experimental studies asmoderating or mediating factors, obesity prevention will require an evi-dence-based public health approach that continues to draw on RCTs, quasi-experiments, and observational studies as important sources of information(Victora et al., 2004).
• Given that obesity is a serious health risk, preventive actions shouldbe taken even if there is as-yet-incomplete scientific evidence on the inter-ventions to address specific causes and correlates of obesity. However,there is an obligation to accumulate appropriate evidence not only to justifya course of action but to assess whether it has made a difference.
• Finally, for interventions that have minimal potential risk and re-quire few resources, formative and process evaluations may be sufficient toprovide a “preponderance” of evidence (Robinson et al., 1998).
As described in Appendix C, the committee conducted a thoroughbibliographic search of the relevant scientific databases and benefited fromthe expertise of academic, industry, government, and nonprofit sector ex-perts during its deliberations. In examining the literature, the committeefocused on studies that examined weight and body composition outcomes,but it also broadened its scope to include studies that looked at changes inphysical activity (or sedentary behavior) levels and in dietary intake pat-terns.
In examining the evidence on obesity-related prevention interventions,the committee considered the methodologies used by individual studies.Evaluating such studies involves characterizing the appropriateness of theirdesigns for measuring target outcomes (e.g., increasing physical activity) aswell as assessing the quality and generalizability of the study execution. Thecommittee also considered the strength of the overall body of availableevidence. Other factors considered by the committee included the feasibilityof implementing the recommended actions, the opportunities for makingchanges, and the past success of parallel public health and social changeefforts. Where trends of social, dietary, and other factors and health out-comes ran in parallel, the committee believes these trends merit furtherstudy and concern while acknowledging the possible occurrence of con-founding.
It is also important to note that the committee focused on areas forimprovement rather than on specific products, mechanisms for distribu-tion, or industries. For example, the report emphasizes the nutritional evalu-ation of the contents of vending machines in schools rather than the re-
281

DEVELOPING AN ACTION PLAN 115
moval of vending machines (Chapter 7); considers the nutrient quality andenergy density of foods and beverages rather than focusing on specific typesof products (e.g., soft drinks, chips, candy); and highlights the improve-ments needed and actions that can promote energy balance rather thanaddressing any one industry (e.g., fast food restaurants).
SUMMARY
This report uses the term “obese” to refer to children and youth be-tween the ages of 2 and 18 years who have BMIs equal to or greater thanthe 95th percentile of the age- and gender-specific BMI charts developed byCDC. For individuals, obesity prevention involves maintaining energy bal-ance at a healthy weight while protecting overall health, growth and devel-opment, and nutritional status. Energy balance (calories consumed versuscalories expended) is an extraordinarily complex concept when consideringthe multitude of genetic, biological, psychological, sociocultural, and envi-ronmental factors that affect both sides of the energy balance equation andthe interrelationships among these factors.
Clear specification of obesity prevention goals is essential in shaping anaction plan and evaluating its success. Relevant issues for setting obesityprevention goals for populations include concepts of optimum populationBMI and healthy weight levels, potential effects on food intake and patternsof physical activity and inactivity, as well as attitudes and social normsrelated to food and eating, physical activity, inactivity, body size, and di-etary restrictions. This chapter discusses a variety of influences on children’sdiets and physical activity patterns including genetic variation and biologi-cal considerations, and sociocultural and other environmental factors.
Using an ecological systems theory model and a primary preventionevidence-based public health approach, this report focuses on how changesin the individual child’s behaviors are affected not only by individual fac-tors but also through interactions with the larger social, cultural, and envi-ronmental contexts in which he or she lives (e.g., family, school, commu-nity, social and physical environments).
REFERENCES
AAP (American Academy of Pediatrics), Committee on Nutrition. 2003. Prevention of pediat-ric overweight and obesity. Pediatrics 112(2):424-430.
ADA (American Dietetic Association). 2003. Position of the American Dietetic Association:Child and adolescent food and nutrition programs. J Am Diet Assoc 103(7):887-893.
ADA. 2004. Position of the American Dietetic Association: Dietary guidance for healthychildren ages 2 to 11 years. J Am Diet Assoc 104(4):660-677.
282

116 PREVENTING CHILDHOOD OBESITY
Adams K, Sargent RG, Thompson SH, Richter D, Corwin SJ, Rogan TJ. 2000. A study ofbody weight concerns and weight control practices of 4th and 7th grade adolescents.Ethn Health 5(1):79-94.
Addy CL, Wilson DK, Kirtland KA, Ainsworth BE, Sharpe P, Kimsey D. 2004. Associationsof perceived social and physical environmental supports with physical activity and walk-ing behavior. Am J Public Health 94(3):440-443.
Alaimo K, Olson CM, Frongillo EA Jr. 2001a. Food insufficiency and American school-agedchildren’s cognitive, academic, and psychosocial development. Pediatrics 108(1):44-53.
Alaimo K, Olson CM, Frongillo EA Jr. 2001b. Low family income and food insufficiency inrelation to overweight in US children: Is there a paradox? Arch Pediatr Adolesc Med155(10):1161-1167.
Alaimo K, Olson CM, Frongillo EA. 2002. Family food insufficiency, but not low familyincome, is positively associated with dysthymia and suicide symptoms in adolescents. JNutr 132(4):719-725.
Ballew C, Bowman BA, Sowell AL, Gillespie C. 2001. Serum retinol distributions in residentsof the United States: Third National Health and Nutrition Examination Survey, 1988-1994. Am J Clin Nutr 73(3):586-593.
Baranowski T, Thompson WO, DuRant RH, Baranowski J, Puhl J. 1993. Observations onphysical activity in physical locations: Age, gender, ethnicity, and month effects. Res QExerc Sport 64(2):127-133.
Barlow SE, Dietz WH. 1998. Obesity evaluation and treatment: Expert committee recommen-dations. The Maternal and Child Health Bureau, Health Resources and Services Admin-istration and the Department of Health and Human Services. Pediatrics 102(3):E29.
Barsh GS, Farooqi IS, O’Rahilly S. 2000. Genetics of body-weight regulation. Nature404(6778):644-651.
Biddle S, Sallis JF, Cavill NA. 1998. Young and Active? Young People and Health EnhancingPhysical Activity. Evidence and Implication. London: Health Education Authority.
Booth SL, Sallis JF, Ritenbaugh C, Hill JO, Birch LL, Frank LD, Glanz K, Himmelgreen DA,Mudd M, Popkin BM, Rickard KA, St Jeor S, Hays NP. 2001. Environmental andsocietal factors affect food choice and physical activity: Rationale, influences, and lever-age points. Nutr Rev 59(3 Pt 2):S21-S39.
Boreham C, Riddock C. 2001. The physical activity, fitness and health of children. J SportsSci 19(12):915-929.
Bouchard C, Pérusse L, Rice T, Rao DC. 2003. Genetics of human obesity. In: Bray GA,Bouchard C, eds. Handbook of Obesity. Etiology and Pathophysiology. 2nd ed. NewYork: Marcel Dekker.
Bouret SG, Draper SJ, Simerly RB. 2004. Trophic action of leptin on hypothalamic neuronsthat regulate feeding. Science 304(5667):108-110.
Briss PA, Zaza S, Pappaioanou M, Fielding J, Wright-De Aguero L, Truman BI, Hopkins DP,Mullen PD, Thompson RS, Woolf SH, Carande-Kulis VG, Anderson L, Hinman AR,McQueen DV, Teutsch SM, Harris JR, Task Force on Community Preventive Services.2000. Developing an evidence-based guide to community preventive services: Methods.Am J Prev Med 18(1S):35-43.
Brown KM, McMahon RP, Biro FM, Crawford P, Schreiber GB, Similo SL, Waclawiw M,Striegel-Moore R. 1998. Changes in self-esteem in black and white girls between theages of 9 and 14 years. The NHLBI Growth and Health Study. J Adolesc Health 23(1):7-19.
Brown PJ, Bentley-Condit VK. 1998. Culture, evolution, and obesity. In: Bray GA, BouchardC, James WPT, eds. Handbook of Obesity. New York: Marcel Dekker. Pp. 143-156.
Butte NF, Ellis KJ. 2003. Comment on “Obesity and the environment: Where do we go fromhere?” Science 301(5633):598b.
283

DEVELOPING AN ACTION PLAN 117
Cameron N. 2002. British growth charts for height and weight with recommendations con-cerning their use in auxological assessment. Ann Hum Biol 29(1):1-10.
Campbell K, Waters E, O’Meara S, Kelly S, Summerbell C. 2002. Interventions for Prevent-ing Obesity in Children. Oxford, U.K.: Cochrane Library.
Casey PH, Szeto K, Lensing S, Bogle M, Weber J. 2001. Children in food-insufficient, low-income families: Prevalence, health, and nutrition status. Arch Pediatr Adolesc Med155(4):508-514.
Caspersen CJ, Powell KE, Christenson GM. 1985. Physical activity, exercise, and physicalfitness: Definitions and distinctions for health-related research. Public Health Rep100(2):126-131.
Caspersen CJ, Pereira MA, Curran KM. 2000. Changes in physical activity patterns in theUnited States, by sex and cross-sectional age. Med Sci Sports Exerc 32(9):1601-1609.
Cavill N, Biddle S, Sallis JF. 2001. Health enhancing physical activity for young people:Statement of the United Kingdom Expert Consensus Conference. Pediatr Exer Sci 13:12-25.
CDC (Centers for Disease Control and Prevention). 1997. Guidelines for school and commu-nity programs to promote lifelong physical activity among young people. MMWRRecomm Rep 46(RR-6):1-36.
CDC. 2004. Measuring Physical Activity. [Online]. Available: http://www.cdc.gov/nccdphp/dnpa/physical/measuring/index.htm [accessed August 18, 2004].
Cohen L, Swift S. 1999. The spectrum of prevention: Developing a comprehensive approachto injury prevention. Inj Prev 5(3):203-207.
Cook JT, Frank DA, Berkowitz C, Black MM, Casey PH, Cutts DB, Meyers AF, Zaldivar N,Skalicky A, Levenson S, Heeren T, Nord M. 2004. Food insecurity is associated withadverse health outcomes among human infants and toddlers. J Nutr 134(6):1432-1438.
Cooper RS. 2003. Race, genes, and health: New wine in old bottles? Int J Epidemiol 32:23-25.
Cooper RS, Kaufman JS, Ward R. 2003. Race and genomics. N Engl J Med 348(12):1166-1170.
Cummings DE, Schwartz MW. 2003. Genetics and pathophysiology of human obesity. AnnuRev Med 54(1):453-471.
Cutler D, Glaeser E, Shapiro J. 2003. Why Have Americans Become More Fat? NBER Work-ing Paper No. W9446. Cambridge, MA: National Bureau of Economic Research.
Davison KK, Birch LL. 2001. Childhood overweight: A contextual model and recommenda-tions for future research. Obes Rev 2(3):159-171.
DHHS (U.S. Department of Health and Human Services). 1996. Physical Activity and Health:A Report of the Surgeon General. Atlanta, GA: CDC.
DHHS. 2000. Healthy People 2010: Understanding and Improving Health. 2nd edition.Washington, DC: U.S. Government Printing Office. [Online]. Available: http://www.healthypeople.gov/document/tableofcontents.htm [accessed April 9, 2004].
DHHS. 2001a. The Surgeon General’s Call to Action to Prevent and Decrease Overweightand Obesity. Rockville, MD: Public Health Service, Office of the Surgeon General.
DHHS. 2001b. Overweight and Obesity: What You Can Do. Being Physically Active CanHelp You Attain or Maintain a Healthy Weight. [Online]. Available: http://www.surgeongeneral.gov/topics/obesity/calltoaction/fact_whatcanyoudo.htm [accessed August9, 2004].
Dietz WH, Robinson TN. 1998. Use of the body mass index (BMI) as a measure of over-weight in children and adolescents. J Pediatr 132(2):191-193.
Druce M, Bloom SR. 2003. Central regulators of food intake. Curr Opin Clin Nutr MetabCare 6(4):361-367.
284

118 PREVENTING CHILDHOOD OBESITY
Elmquist JK, Flier JS. 2004. Neuroscience. The fat-brain axis enters a new dimension. Science304(5667):63-64.
Enns CW, Mickle SJ, Goldman JD. 2002. Trends in food and nutrient intakes by children inthe United States. Fam Econ Nutr Rev 14(2):56-68.
Fitzgibbon ML, Stolley MR. 2004. Environmental changes may be needed for prevention ofoverweight in minority children. Pediatr Ann 33(1):45-49.
Flegal KM, Ogden CL, Wei R, Kuczmarski RL, Johnson CL. 2001. Prevalence of overweightin US children: Comparison of US growth charts from the Centers for Disease Controland Prevention with other reference values for body mass index. Am J Clin Nutr73(6):1086-1093.
Flynn KJ, Fitzgibbon M. 1998. Body images and obesity risk among black females: A reviewof the literature. Ann Behav Med 20(1):13-24.
Freedman DS, Khan LK, Dietz WH, Srinivasan SR, Berenson GS. 2001. Relationship ofchildhood obesity to coronary heart disease risk factors in adulthood: The BogalusaHeart Study. Pediatrics 108(3):712-718.
Gale SM, Castracane VD, Mantzoros CS. 2004. Energy homeostasis, obesity and eatingdisorders: Recent advances in endocrinology. J Nutr 134(2):295-298.
Ganji V, Hampl JS, Betts NM. 2003. Race-, gender- and age-specific differences in dietarymicronutrient intakes of US children. Int J Food Sci Nutr 54(6):485-490.
Gleason P, Suitor C. 2001. Children’s Diets in the Mid-1990’s: Dietary Intake and Its Rela-tionship with School Meal Participation. Report No. CN-01-CD1. Alexandria, VA:USDA.
Goran MI. 1998. Measurement issues related to studies of childhood obesity: Assessment ofbody composition, body fat distribution, physical activity, and food intake. Pediatrics101(3 Pt 2):505-518.
Goran MI, Reynolds KD, Lindquist CH. 1999. Role of physical activity in the prevention ofobesity in children. Int J Obesity 23(S3):S18-S33.
Gordon R. 1983. An operational classification of disease prevention. Public Health Reports98:107-109.
Guo SS, Roche AF, Chumlea WC, Gardner JD, Siervogel RM. 1994. The predictive value ofchildhood body mass index values for overweight at age 35 y. Am J Clin Nutr 59(4):810-819.
Guo X, Warden BA, Paeratakul S, Bray GA. 2004. Healthy Eating Index and obesity. Eur JClin Nutr May 19 [Online]. Available: http://dx.doi.org/10.1038/sj.ejcn.1601989 [ac-cessed September 8, 2004].
Halpern CT, Udry JR, Campbell B, Suchindran C. 1999. Effects of body fat on weightconcerns, dating, and sexual activity: A longitudinal analysis of black and white adoles-cent girls. Dev Psychol 35(3):721-736.
Hampl JS, Taylor CA, Johnston CS. 2004. Vitamin C deficiency and depletion in the UnitedStates: The Third National Health and Nutrition Examination Survey, 1988 to 1994.Am J Public Health 94(5):870-875.
Harnack L, Snyder P, Story M, Holliday R, Lytle L, Neumark-Sztainer D. 2000. Availabilityof a la carte food items in junior and senior high schools: A needs assessment. J Am DietAssoc 100(6):701-703.
Harris RP, Helfand M, Woolf SH, Lohr KN, Mulrow CD, Teutsch SM, Atkins D, MethodsWork Group, Third US Preventive Services Task Force. 2001. Current methods of theU.S. Preventive Services Task Force: A review of the process. Am J Prev Med 20(3S):21-35.
Havel PJ. 2000. Role of adipose tissue in body-weight regulation: Mechanisms regulatingleptin production and energy balance. Proc Nutr Soc 59(3):359-371.
Havel PJ. 2004. Update on adipocyte hormones: Regulation of energy balance and carbohy-drate/lipid metabolism. Diabetes 53(S1):S143-S151.
285

DEVELOPING AN ACTION PLAN 119
Heller RF, Page J. 2002. A population perspective to evidence based medicine: “Evidence forpopulation health.” J Epidemiol Community Health 56(1):45-47.
Hill JO, Peters JC. 1998. Environmental contributions to the obesity epidemic. Science280(5368):1371-1374.
Hill JO, Wyatt HR, Reed GW, Peters JC. 2003. Obesity and the environment: Where do wego from here? Science 299(5608):853-855.
Hill JO, Saris WHM, Levine JA. 2004. Energy expenditure in physical activity. In: Bray GA,Bouchard C, eds. Handbook of Obesity: Etiology and Pathophysiology. 2nd ed. NewYork: Marcel Dekker.
Himes JH, Dietz WH. 1994. Guidelines for overweight in adolescent preventive services:Recommendations from an expert committee. The Expert Committee on Clinical Guide-lines for Overweight in Adolescent Preventive Services. Am J Clin Nutr 59(2):307-316.
IOM (Institute of Medicine). 1994. Reducing Risks for Mental Disorders. Washington, DC:National Academy Press.
IOM. 1997. Dietary Reference Intakes for Calcium, Phosphorus, Magnesium, Vitamin D,and Fluoride. Washington, DC: National Academy Press.
IOM. 2001. Health and Behavior: The Interplay of Biological, Behavioral, and Societal Influ-ences. Washington, DC: National Academy Press.
IOM. 2002. Dietary Reference Intakes for Energy, Carbohydrate, Fiber, Fat, Fatty Acids,Cholesterol, Protein, and Amino Acids. Washington, DC: The National Academies Press.
IOM. 2004. Dietary Reference Intakes for Water, Potassium, Sodium, Chloride, and Sulfate.Washington, DC: The National Academies Press.
IOM, NRC (National Research Council). 2004. Dietary Supplements: A Framework forEvaluating Safety. Washington, DC: The National Academies Press.
Kaiser LL, Melgar-Quinonez HR, Lamp CL, Johns MC, Sutherlin JM, Harwood JO. 2002.Food security and nutritional outcomes of preschool-age Mexican-American children. JAm Diet Assoc 102(7):924-929.
Kellam SG, Langevin DJ. 2003. A framework for understanding “evidence” in preventionresearch and programs. Prevention Science 4(3):137-153.
Klesges RC, Eck LH, Hanson CL, Haddock CK, Klesges LM. 1990. Effects of obesity, socialinteractions, and physical environment on physical activity in preschoolers. HealthPsychol 9(4):435-449.
Klinke A, Renn O. 2002. A new approach to risk evaluation and management: Risk-based,precaution-based, and discourse-based strategies. Risk Anal 22(6):1071-1093.
Koplan JP, Dietz WH. 1999. Caloric imbalance and public health policy. J Am Med Assoc282(16):1579-1582.
Kroke A, Boeing H, Rossnagel K, Willich SN. 2003. History of the concept of ‘levels ofevidence’ and their current status in relation to primary prevention through lifestyleintervention. Public Health Nutr 7(2):279-284.
Kuczmarski RJ, Ogden CL, Grummer-Strawn LM, Flegal KM, Guo SS, Wei R, Mei Z, CurtinLR, Roche AF, Johnson CL. 2000. CDC growth charts: United States. Adv Data (314):1-27.
Kuczmarski RJ, Ogden CL, Guo SS, Grummer-Strawn LM, Flegal KM, Mei Z, Wei R, CurtinLR, Roche AF, Johnson CL. 2002. Data From the National Health Survey. 2000 CDCGrowth Charts for the United States: Methods and Development. Hyattsville, MD:National Center for Health Statistics.
Kumanyika SK. 1993. Ethnicity and obesity development in children. Ann NY Acad Sci699:81-92.
Kumanyika SK. 2002. Obesity treatment in minorities. In: Wadden TA, Stunkard AJ, eds.Handbook of Obesity Treatment. 3rd ed. New York: Guilford Publications. Pp. 416-446.
286

120 PREVENTING CHILDHOOD OBESITY
Kumanyika SK. 2004. Cultural differences as influences on approaches to obesity treatment.In: Bray GA, Bouchard C, eds. Handbook of Obesity: Clinical Applications. 2nd ed.New York: Marcel Dekker.
Kumanyika SK, Krebs-Smith SM. 2001. Preventive nutrition issues in ethnic and socioeco-nomic groups in the United States. In: Bendich A, Deckelbaum RJ, eds. Primary andSecondary Preventive Nutrition. Totowa, NJ: Humana Press. Pp. 325-356.
Kumanyika SK, Morssink CB. 1997. Cultural appropriateness of weight management pro-grams. In: Dalton S, ed. Overweight and Weight Management. Gaithersburg, MD: As-pen. Pp. 69-106.
Kumanyika SK, Obarzanek E. 2003. Pathways to obesity prevention: Report of a NationalInstitutes of Health Workshop. Obes Res 11(10):1263-1274.
Kumanyika S, Jeffery RW, Morabia A, Ritenbaugh C, Antipatis VJ, Public Health Approachesto the Prevention of Obesity (PHAPO) Working Group of the International ObesityTask Force (IOTF). 2002. Obesity prevention: The case for action. Int J Obes RelatMetab Disord 26(3):425-436.
Latner JD, Stunkard AJ. 2003. Getting worse: The stigmatization of obese children. Obes Res11(3):452-456.
Leventhal T, Brooks-Gunn J. 2001. Changing neighborhoods and child well-being: Under-standing how children may be affected in the coming century. In: Owens T, Hofferth S,eds. Children at the Millennium: Where Have We Come From, Where Are We Going?Advances in Life Course Research. New York: Elsevier Science.
Lobstein T, Baur L, Uauy R, IASO International Obesity TaskForce. 2004. Obesity in chil-dren and young people: A crisis in public health. Obes Rev 5(Suppl 1):4-85.
Matheson DM, Varady J, Varady A, Killen JD. 2002. Household food security and nutri-tional status of Hispanic children in the fifth grade. Am J Clin Nutr 76(1):210-217.
Maziekas MT, LeMura LM, Stoddard NM, Kaercher S, Martucci T. 2003. Follow up exer-cise studies in pediatric obesity: Implications for long term effectiveness. Br J Sports Med37(5):425-429.
McQueen DV. 2002. Strengthening the evidence base for health promotion. Health Promo-tion International 16(3):261-268.
Mei Z, Grummer-Strawn LM, Pietrobelli A, Goulding A, Goran MI, Dietz WH. 2002. Valid-ity of body mass index compared with other body-composition screening indexes for theassessment of body fatness in children and adolescents. Am J Clin Nutr 75(6):978-985.
Mei Z, Grummer-Strawn LM, Thompson D, Dietz WH. 2004. Shifts in percentiles of growthduring early childhood: Analysis of longitudinal data from the California Child Healthand Development Study. Pediatrics 113(6):e617-e627.
Mensah GA, Goodman RA, Zaza S, Moulton AD, Kocher PL, Dietz WH, Pechacek TF,Marks JS. 2004. (April). Law as a tool for preventing chronic diseases: Expanding thespectrum of effective public health strategies [Part 1 and 2]. Preventing Chronic Disease[Online]. Available: http://www.cdc.gov/pcd/issues/2004/apr/04_0009.htm [accessedApril 20, 2004].
Molnar BE, Gortmaker SL, Bull FC, Buka SL. 2004. Unsafe to play? Neighborhood disorderand lack of safety predict reduced physical activity among urban children and adoles-cents. Am J Health Promot 18(5):378-386.
Morland K, Wing S, Diez Roux A, Poole C. 2002a. Neighborhood characteristics associatedwith the location of food stores and food service places. Am J Prev Med 22(1):23-29.
Morland K, Wing S, Diez Roux A. 2002b. The contextual effect of the local food environ-ment on residents’ diets: The atherosclerosis risk in communities study. Am J PublicHealth 92(11):1761-1767.
287

DEVELOPING AN ACTION PLAN 121
NASPE (National Association for Sport and Physical Education). 2004. Physical Activity forChildren: A Statement of Guidelines for Children Ages 5-12. 2nd edition. Reston, VA:NASPE.
Neumark-Sztainer D, Croll J, Story M, Hannan PJ, French SA, Perry C. 2002. Ethnic/racialdifferences in weight-related concerns and behaviors among adolescent girls and boys:Findings from Project EAT. J Psychosom Res 53(5):963-974.
Newman C. 2004. Why are we so fat? National Geographic (August):46-61.NHLBI (National Heart, Lung, and Blood Institute). 1998. Clinical Guidelines on the Identi-
fication, Evaluation, and Treatment of Overweight and Obesity in Adults: The EvidenceReport. NIH Publication No. 98-4083. Rockville, MD: NIH. [Online]. Available: http://www.nhlbi.nih.gov/guidelines/obesity/ob_gdlns.pdf [accessed November 21, 2003].
NHS Centre for Reviews and Dissemination. 2002. The prevention and treatment of child-hood obesity. Eff Health Care 7(6):1-12.
Nielsen SJ, Siega-Riz AM, Popkin BM. 2002. Trends in energy intake in U.S. between 1977and 1996: Similar shifts seen across age groups. Obes Res 10(5):370-378.
Nord M, Andrews M, Carlson S. 2003. Household Food Security in the United States, 2002.Alexandria, VA: USDA Economic Research Service. Food Assistance and Nutrition Re-search Report 35.
NRC (National Research Council). 1978. Knowledge and Policy: The Uncertain Connection.Washington, DC: National Academy Press.
NRC. 1989. Improving Risk Communication. Washington, DC: National Academy Press.NRC. 1994. Science and Judgment in Risk Assessment. Washington, DC: National Academy
Press.NRC. 1996. Understanding Risk: Informing Decisions in a Democratic Society. Washington,
DC: National Academy Press.NRC, IOM. 2000. From Neurons to Neighborhoods: The Science of Early Childhood Devel-
opment. Washington, DC: National Academy Press.NRC, IOM. 2003. Reducing Underage Drinking: A Collective Responsibility. Washington,
DC: The National Academies Press.O’Rahilly S, Farooqi IS, Yeo GS, Challis BG. 2003. Minireview: Human obesity—Lessons
from monogenic disorders. Endocrinology 144(9):3757-3764.Osaka Declaration. 2001 (May). Health, Economics and Political Action: Stemming the Glo-
bal Tide of Cardiovascular Disease. Declaration of the Fourth International Heart HealthConference, Osaka, Japan.
Pinto S, Roseberry AG, Liu H, Diano S, Shanabrough M, Cai X, Friedman JM, Horvath TL.2004. Rapid rewiring of arcuate nucleus feeding circuits by leptin. Science304(5667):110-115.
Renn O, Webler T, Wiedemann P, eds. 1995. Fairness and Competence in Citizen Participa-tion: Evaluating Models for Environmental Discourse. Boston, MA: Kluwer AcademicPublishers.
Richter KP, Harris KJ, Paine-Andrews A, Fawcett SB, Schmid TL, Lankenau BH, Johnston J.2000. Measuring the health environment for physical activity and nutrition among youth:A review of the literature and applications for community initiatives. Prev Med 31(2Part 2):S98-S111.
Robinson TN. 1993. Defining obesity in children and adolescents: Clinical approaches. CritRev Food Sci Nutr 33(4-5):313-320.
Robinson TN. 1999. Reducing children’s television viewing to prevent obesity: A randomizedcontrolled trial. J Am Med Assoc 282(16):1561-1567.
288

122 PREVENTING CHILDHOOD OBESITY
Robinson TN, Killen JD. 2001. Obesity prevention for children and adolescents. In: Thomp-son JK, Smolak L, eds. Body Image, Eating Disorders, and Obesity in Youth: Assess-ment, Prevention, and Treatment. Washington, DC: American Psychological Associa-tion. Pp. 261-292.
Robinson TN, Patrick K, Eng TR, Gustafson D. 1998. An evidence-based approach to inter-active health communication: A challenge to medicine in the information age. SciencePanel on Interactive Communication and Health. J Am Med Assoc 280(14):1264-1269.
Robinson TN, Chang JY, Haydel KF, Killen JD. 2001. Overweight concerns and body dissat-isfaction among third-grade children: The impacts of ethnicity and socioeconomic sta-tus. J Pediatr 138(2):181-187.
Rose G. 1992. The Strategy of Preventive Medicine. New York: Oxford University Press.Rosenbaum M, Leibel RL. 1998. The physiology of body weight regulation: Relevance to the
etiology of obesity in children. Pediatrics 101(3 Part 2):525-539.Sallis JF. 2000. Age-related decline in physical activity: A synthesis of human and animal
studies. Med Sci Sports Exerc 32(9):1598-1600.Sallis JF, Nader PR, Broyles SL, Berry CC, Elder JP, McKenzie TL, Nelson JA. 1993. Corre-
lates of physical activity at home in Mexican-American and Anglo-American preschoolchildren. Health Psychol 12(5):390-398.
Saris WH. 1986. Habitual physical activity in children: Methodology and findings in healthand disease. Med Sci Sports Exerc 18(3):253-263.
Schwartz MB, Puhl R. 2003. Childhood obesity: A societal problem to solve. Obes Rev4(1):57-71.
Schwartz MW, Woods SC, Seeley RJ, Barsh GS, Baskin DG, Leibel RL. 2003. Is the energyhomeostasis system inherently biased toward weight gain? Diabetes 52(2):232-238.
Segal NL, Allison DB. 2002. Twins and virtual twins: Bases of relative body weight revisited.Int J Obes Relat Metab Disord 26(4):437-441.
Serdula MK, Mokdad AH, Williamson DF, Galuska DA, Mendlein JM, Heath GW. 1999.Prevalence of attempting weight loss and strategies for controlling weight. J Am MedAssoc 282(14):1353-1358.
Sirard JR, Pate RR. 2001. Physical activity assessment in children and adolescents. SportsMed 31(6):439-454.
Slovic P. 1987. Perception of risk. Science 236(4799):280-285.Slovic P. 2000. Perceived risk, trust, and democracy. In: Connolly T, Arkes H, Hammond K,
eds. Judgment and Decision Making: An Interdisciplinary Reader. New York: Cam-bridge University Press. Pp. 500-516.
Snyder EE, Walts B, Perusse L, Chagnon YC, Weisnagel SJ, Rankinen T, Bouchard C. 2004.The human obesity gene map: The 2003 update. Obes Res 12(3):369-439.
Sothern MS, Loftin M, Suskind RM, Udall JN, Blecker U. 1999. The health benefits ofphysical activity in children and adolescents and implications for chronic disease preven-tion. Eur J Pediatr 158(4):271-274.
Strauss RS, Knight J. 1999. Influence of the home environment on the development of obesityin children. Pediatrics 103(6):E85.
Sturm R. 2005 (in press). Childhood obesity – What can we learn from existing data onsocietal trends. Part 2. Preventing Chronic Disease [Online]. Available: http://www.cdc.gov/pcd/issues/2005/apr/04_0039.htm [access after March 15, 2005].
Swinburn BA, Egger GJ. 2004. Influence of obesity-producing environments. In: Bray GA,Bouchard C, eds. Handbook of Obesity. Clinical Applications. 2nd ed. New York:Marcel Dekker.
Swinburn BA, Egger G, Raza F. 1999. Dissecting obesogenic environments: The developmentand application of a framework for identifying and prioritizing environmental interven-tions for obesity. Prev Med 29(6 Pt 1):563-570.
289

DEVELOPING AN ACTION PLAN 123
Swinburn B, Gill T, Kumanyika S. 2005 (in press). Obesity prevention: A proposed frame-work for translating evidence into action. Obes Rev 6(1).
Tang KC, Ehsani JP, McQueen DV. 2003. Evidence-based health promotion: Recollections,reflections, and reconsiderations. J Epidemiol Community Health 57(11):841-843.
Tanner JM, Davies PS. 1985. Clinical longitudinal standards for height and height velocityfor North American children. J Pediatr 107(3):317-329.
Thompson SH, Corwin SJ, Sargent RG. 1997. Ideal body size beliefs and weight concerns offourth-grade children. Int J Eat Disord 21(3):279-284.
Tirodkar MA, Jain A. 2003. Food messages on African American television shows. Am JPublic Health 93(3):439-441.
Travers KD. 1996. The social organization of nutritional inequities. Soc Sci Med 43(4):543-553.
Travers KD. 1997. Reducing inequities through participatory research and community em-powerment. Health Educ Behav 24(3):344-356.
USDA (U.S. Department of Agriculture), DHHS (U.S. Department of Health and HumanServices). 2000. Nutrition and Your Health: Dietary Guidelines for Americans. Homeand Garden Bulletin No. 232, 5th ed. Washington, DC: Government Printing Office.
Victora CG, Habicht JP, Bryce J. 2004. Evidence-based public health: Moving beyond ran-domized trials. Am J Public Health 94(3):400-405.
Whitaker RC, Wright JA, Pepe MS, Seidel KD, Dietz WH. 1997. Predicting obesity in youngadulthood from childhood and parental obesity. N Engl J Med 337(13):869-873.
WHO (World Health Organization). 2000. Obesity: Preventing and Managing the GlobalEpidemic. WHO Technical Report Series 894. Geneva: WHO.
WHO. 2003. Diet, Nutrition and the Prevention of Chronic Diseases. WHO Technical Re-port Series 916. Geneva: WHO.
Wright JD, Bialostosky K, Gunter EW, Carroll MD, Najjar MF, Bowman BA, Johnson CL.1998. Blood folate and vitamin B12: United States, 1988-1994. Vital Health Stat11(243):1-78.
Zhang Y, Proenca R, Maffei M, Barone M, Leopold L, Friedman JM. 1994. Positionalcloning of the mouse obese gene and its human homologue. Nature 372(6505):425-432.
290

291

125
A National PublicHealth Priority
4
Although the general public has become increasingly aware of thepersonal health consequences of obesity, what may not yet be gen-erally apparent is the public health nature of the obesity epidemic
and the consequent need for population-based approaches to address it.Obesity prevention should be public health in action at its broadest and
most inclusive level, as is true for the ongoing efforts to prevent youth fromsmoking. For example, local communities are passing ordinances that banor limit cigarette vending machines, schools and community youth organi-zations are discouraging or banning smoking, states are passing excise taxesto raise tobacco prices, the federal government is providing national leader-ship and the resources for research and programs, and the private sector isrestricting smoking in workplaces (Box 4-1) (Economos et al., 2001; IOM,2003). In addition, a broad, complementary, and continuing campaignaimed at reducing adult smoking continues to be conducted. The 2004Surgeon General’s report on tobacco use emphasized that “a comprehen-sive approach—one that optimizes synergy from a mix of educational,clinical, regulatory, economic, and social strategies—has emerged as theguiding principle for effective efforts to reduce tobacco use” (DHHS, 2004).
A similarly broad-based approach is needed for childhood obesity pre-vention. Across the country these efforts are beginning. As discussedthroughout this report, current efforts range from new school board poli-cies and state legislation regarding school physical education requirementsand nutrition standards for beverages and foods sold in schools to commu-nity initiatives to expand bike paths and improve recreational facilities.
292

126 PREVENTING CHILDHOOD OBESITY
BOX 4-1Comprehensive Efforts to Address Public Health Concerns
Highway Safety:• Federal government: Safety regulations for new vehicles; highway design and
safety regulations; establishment of the National Highway Traffic Safety Ad-ministration; state and community grant programs; research funding
• State and local governments: Highway safety offices; primary enforcement ofsafety belt laws; alcohol-impaired-driving laws; requirements for licensing anddriver education; motor vehicle inspections
• Public support and advocacy: Citizen advocacy groups (e.g., MothersAgainst Drunk Driving)
• Research• Media campaigns• Education: Driver education; parent education regarding safety seats
Tobacco:• Federal government: Airline smoking ban; warnings on tobacco packages;
research funding; Surgeon Generals’ reports; establishment of the Office onSmoking and Health
• State and local governments: Excise taxes, laws that establish smoke-freeworkplaces and public locations
• Public support and advocacy: Grassroots efforts to prevent exposure to sec-ond hand smoke; community coalitions (e.g., ASSIST)
• Research• Media campaigns• Education: School-based programs
NOTE: This box denotes only selected examples of the multiple approaches usedto address each public health problem.SOURCES: IOM, 1999, 2003; Economos et al., 2001.
Parallel and synergistic efforts to prevent adult obesity, which will contrib-ute to improvements in health for the U.S. population at all ages, are alsobeginning. Grassroots efforts made by citizens and organizations will likelydrive many of the obesity prevention efforts at the local level and can beinstrumental in driving policies and legislation at the state and nationallevels (Economos et al., 2001).
A policy analysis by Kersh and Morone (2002) shows that three of theseven common triggers for strong public action in response to a publichealth problem are beginning to be activated with respect to the U.S. obe-sity epidemic: social disapproval that shifts the social norm, evidence-basedmedical research, and self-help movements for overweight and obese indi-viduals. Other triggers that have worked successfully for public healthproblems such as tobacco, alcohol, and illicit-drug use (a widespread coor-dinated movement or campaign; fear of problem-related behaviors or re-
293

A NATIONAL PUBLIC HEALTH PRIORITY 127
lated culture, such as the drug culture; coordinated interest group advo-cacy; and targeting of groups or industries contributing to the problem) arenot yet fully in place for obesity prevention or may not be relevant to thisissue (Kersh and Morone, 2002; Haddad, 2003).
The additional impetus that is needed is the political will to makechildhood obesity prevention a national public health priority. Effectiveprevention efforts on a nationwide basis will require federal, state, andlocal governments to commit sufficient resources for surveillance, research,programs, evaluation, and dissemination.
As the nation focuses on obesity as a health problem and begins toaddress the societal and cultural issues that contribute to excess weight,poor food choices, and inactivity, many different stakeholders will need tomake difficult trade-offs and choices. Industries and businesses must re-examine many of their products and marketing strategies. Governments atthe local, state, and national levels must consider this issue in setting priori-ties for programs and resources. Schools need to ensure that consistentmessages regarding energy balance are a basic part of the school environ-ment. Community organizations and numerous other stakeholders mustexamine the ways in which local opportunities for a healthful diet andphysical activity are made accessible, available, affordable, and acceptableto children, youth, and their parents. Families need to make their homesmore conducive to a healthful diet and daily physical activity. Many ofthese changes will be challenging because they present Americans withdifficult trade-offs. However, as institutions, organizations, and individualsacross the nation begin to make changes, societal norms are likely to changeas well; in the long term, we may become a nation where proper nutritionand physical activity that support energy balance at a healthy weight willbecome the standard.
Within the United States and globally, attention is being focused onobesity prevention efforts. A number of interest groups, coalitions, nationalgovernments, and intergovernmental organizations have examined the ris-ing obesity and chronic disease problems in a variety of contexts, recog-nized its complicated nature, and proposed actions to reduce its prevalenceboth nationally and globally (e.g., WHO, 2000, 2003; DHHS, 2001; HealthCouncil of the Netherlands, 2003; National Board of Health, 2003; NewSouth Wales Department of Health, 2003; Canadian Institute for HealthInformation, 2004; Lobstein et al., 2004; Raine, 2004; United KingdomParliament, 2004; Willett and Domolky, 2004). Many of the strategies andaction plans that have been developed from these efforts do not differgreatly from the recommendations in this report. The committee has gainedinsights from these efforts, and in this report draws together the evidenceon obesity prevention, nutrition, and physical activity with the lessonslearned from other public health issues (Box 4-2) to develop an action planfor childhood obesity prevention that is as informed, responsive, and realis-
294

128 PREVENTING CHILDHOOD OBESITY
BOX 4-2Lessons Learned from Other Public Health Issues and
Potential Applicability to Obesity Prevention(see Appendix D)
• Advertising—Although obesity prevention does not involve restricted productsto minors as is pertinent for tobacco and alcohol product advertising, there aresimilar concerns regarding young children’s inability to detect persuasiveintent.
• Consumer information—Providing information to consumers has many paral-lels including the need for label information on tobacco, food, and drug prod-ucts.
• Public education campaigns to convey public health messages such as thoseregarding youth smoking, and seat belt and child car seat use provide exam-ples for obesity prevention media campaigns.
• Grassroots efforts and coalition building—Community organizations (in-cluding youth and civic organizations) are active in health promotion efforts andcoalitions resulting from grassroots efforts have been successful in legislativeand social changes (e.g., drunk driving laws).
• School environment—Changes to promoting a healthier overall school envi-ronment have parallels in smoking bans in schools. Further, classroom educa-tion and particularly health education efforts focus on a number of health pro-motion topics including safety, HIV prevention, and violence prevention.
• Health-care system—As with numerous other health promotion issues, thehealth-care system provides opportunities for parent and child education aswell as for prevention interventions such as administering vaccines.
• Changes in the physical environment—Modifications of highways, roads,and intersections to enhance pedestrian and traveler safety provide parallelexamples for the funding, regulatory, and prioritization efforts required to en-hance opportunities for physical activity.
• Government support and funding—The long-term commitment from bothfederal and state governments for research, surveillance, and program effortson a number of public health issues (e.g., highway improvements, researchcenters, surveys) provides parallels for sustained efforts on obesity prevention.
• Industry involvement—Numerous health-promoting products such as sun-screens are developed and marketed by industry.
• Comprehensive approach—As indicated in Box 4-1, comprehensive ap-proaches have been used in enhancing highway safety and in preventing to-bacco use by youth. A similar comprehensive effort is suggested for obesityprevention.
• Taxation and pricing—Obesity prevention efforts do not involve access to arestricted product for youth (as do tobacco and alcohol prevention efforts). Ex-cise taxes and pricing strategies have played an important role in tobacco con-trol efforts. However, it is more difficult to identify specific food and beverageproducts on which to impose taxes or tax breaks.
• Litigation changed the tobacco control environment including the public’s viewof the issue. It is unclear whether the same issues that led to litigation fortobacco are relevant to obesity prevention.
• Access and opportunity—For restricted products, laws and regulations torestrict access to tobacco and alcohol have decreased availability. The ubiqui-tous nature of foods and beverages makes that a less feasible option for obe-sity prevention.
295

A NATIONAL PUBLIC HEALTH PRIORITY 129
tic as possible. The committee acknowledges, as have many other similarefforts, that obesity prevention is a complex issue, that a thorough under-standing of the causes and determinants of the obesity epidemic is lacking,and that progress will require changes not only in individual and familybehaviors but also in the marketplace and the social and built environ-ments. No simple solutions are anticipated; therefore, multiple stakeholdersneed to make a long-term commitment to improve opportunities for health-ful nutrition and physical activity.
Although this chapter focuses on actions that need to be taken by thefederal, state, and local governments, it is essential to mobilize and involvethe numerous private organizations that fund obesity prevention programsand initiatives. It is in the best interest of the nation’s children for allrelevant stakeholders to make obesity prevention efforts a priority.
The committee recognizes the importance of combined social delibera-tion, problem analysis, and social mobilization around the issue of child-hood obesity prevention at different levels and in various settings. Thisreport and others that follow can set forth recommendations and broadlyoutline suggested actions; however, many of the next steps for progress onthis issue will involve discussions and interactions of the implementers andinnovators—the people, agencies, and organizations concerned about thisissue and ready to work together to develop, implement, and evaluateapproaches to prevent childhood obesity that fit the needs of their state,county, community, school, or neighborhood.
LEADERSHIP, COORDINATION, AND PRIORITY SETTING
A National Priority
The federal government has a long-standing commitment to programsthat address nutritional deficiencies (beginning in the 1930s) and encouragephysical fitness, but only recently has obesity been targeted. Physical activ-ity and overweight/obesity are now designated as priority areas and leadinghealth indicators in the nation’s health objectives, Healthy People 2010,developed by the Department of Health and Human Services (DHHS) incollaboration with state and territorial health officials and numerous na-tional membership organizations. The goal set by Healthy People 2010 is toreduce the proportion of children and adolescents who are obese to 5percent by 2010 (DHHS, 2000).
Obesity prevention is a cross-cutting issue that does not naturally fallunder the purview of any one federal department. It encompasses healthconcerns central to the mission of DHHS; nutrition, nutrition education,and food-related issues for which the U.S. Department of Agriculture(USDA) has responsibilities; and school curriculum and school environ-
296

130 PREVENTING CHILDHOOD OBESITY
ment concerns that the Department of Education addresses. In addition, theagendas of numerous other federal departments include transportation,housing, and many other issues that are key to increasing physical activitylevels and improving dietary quality and patterns.
Given the importance of obesity prevention for the health of Americanchildren, and given the overarching nature of this issue, prevention effortsneed to be coordinated at the highest federal levels. The committee recom-mends that the President request that the Secretary of DHHS convene ahigh-level task force that includes the Secretaries or senior officials fromDHHS, Agriculture, Education, Transportation, Housing and Urban De-velopment, Interior, Defense, and other relevant federal agencies. The goalof the task force would be to ensure coordinated budgets, policies, researchefforts, and program requirements and establish effective interdepartmentalcollaboration and priorities for action. It would be important for the taskforce to meet on a regular basis with local and state officials, representa-tives from nongovernmental organizations including foundations and ad-vocacy groups, industry representatives, civic and youth-related organiza-tions, and other relevant stakeholders.
It is expected that high-level focused attention on this issue will result infostering interdisciplinary and interdepartmental research collaborationsthat span agriculture, health, behavioral sciences, economics, urban plan-ning, and other relevant disciplines. Given the public health nature of thechildhood obesity epidemic, it is the committee’s judgment that the Secre-tary of Health and Human Services should chair this coordinating taskforce.
To maintain the momentum over the long term, the committee urgesthat the coordinating task force consider periodic reassessments of its orga-nization and its goals. In the initial work of the task force, participation ofthe Secretaries of the departments or senior officials will be needed to givehigh-level visibility, authority, and credence to the coordinating efforts.However, it is unrealistic to expect such high-level participation to continueindefinitely. After 2 to 3 years, an assessment may be needed to determinethe best way to continue the collaboration and keep the research partner-ships energized. In any case, sustained coordination will be primary toaddressing this health issue, and it is up to the federal departments to ensurethat it is a long-term priority.
As part of its focus on obesity prevention in children and youth, thefederal government should document its efforts and progress through anannual report to the nation. This report, which would include updates onthe new and recently evaluated efforts in each of the cabinet departments aswell as on cross-cutting efforts, could be coordinated through the Centersfor Disease Control and Prevention (CDC). Content would include up-to-date epidemiologic data on childhood obesity trends, the amount and
297

A NATIONAL PUBLIC HEALTH PRIORITY 131
sources of government funds that are targeted to childhood obesity preven-tion, information on programs and research, and the results of programevaluations. It would also be informative to have an overview of federal,state, and local policy measures that have been taken to address the issue, aswell as profiles of model programs that show promise.
Meanwhile, it will be important to continue the current intra- andinterdepartmental collaboration efforts, including the National Institutes ofHealth (NIH) Task Force on Obesity Prevention (which coordinates effortsbetween the NIH institutes on this issue), and the 2005 Dietary GuidelinesAdvisory Committee (which is conducting a review of the current scientificand medical knowledge on childhood obesity in order to provide a techni-cal report of recommendations to the Secretaries of DHHS and USDA thatwill inform the 2005 edition of the Dietary Guidelines for Americans; seeChapter 3). This review will ensure consistency of dietary recommenda-tions across DHHS and USDA agencies regarding national dietary recom-mendations for the American public.
Just as it has done with automobile and highway safety initiatives (Box4-1), efforts to curb youth smoking, and current efforts to defend againstpotential bioterrorist threats, the federal government should set forth obe-sity prevention as a national health priority—one that is acted upon throughextensive and sustained funding and a long-term commitment of resources(IOM, 2003).
Congressional support will be crucial in ensuring that funding is madeavailable for pilot programs and for research, public education, and pro-gram efforts. Furthermore, congressional leadership is needed on issuessuch as nutritional standards for foods and beverages sold in schools and inother areas that need legislative authorization.
The federal government should take a leadership role in the preventionof obesity in children and youth by making this issue a top priority for theU.S. Departments of Health and Human Services, Agriculture, and Educa-tion. This priority should be reflected in the departments’ public state-ments, programs, research priorities, and budgets. These departments alongwith other relevant federal entities (e.g., the Departments of Transporta-tion, Housing and Urban Development, Interior, and Defense) should to-gether pursue an integrated approach that promotes healthful eating andregular physical activity to achieve energy balance.
STATE AND LOCAL PRIORITIES
State and local governments have important roles to play in obesityprevention because they can focus on the specific needs of their communi-ties’ populations (see Chapter 6). Many of the issues involved in preventingchildhood obesity require decisions by county, city, or town officials. Ac-
298

132 PREVENTING CHILDHOOD OBESITY
tions on street and neighborhood design, planning for parks and commu-nity recreational facilities, and locations of new schools and retail foodfacilities are usually up to the local zoning boards, planning commissions,and similar entities. Efforts can be tailored to local residents and institu-tions, and can be more quickly adapted and revised to meet changingdemands and integrate new approaches.
State governments and agencies, including state departments of health,education, and transportation, are also key to ensuring that obesity preven-tion policies are developed and programs are implemented. Further, stategovernments are responsible for programs that provide food assistance,address the consequences of obesity (e.g., diabetes and heart disease), andinfluence health spending and policy (such as Medicaid, Title V [Maternaland Child Health], and direct funding for community development/housingand transportation). In some states, major policy decisions for school sys-tems are made at the community or county level, but in others it is the statedepartment of education that makes most of these decisions.
As numerous and diverse programs and initiatives are being planned orunder way in states and communities, organizations that bring togetherstate and local leaders—such as the National Governors Association, theU.S. Conference of Mayors, the National Association of County and CityHealth Officials, the Association of State and Territorial Health Officials,and the American Public Health Association—can each raise awareness ofobesity issues, facilitate the sharing of lessons learned, and help coordinateobesity prevention efforts.
One avenue for expanding state-based obesity prevention efforts isthrough CDC’s grants program that focuses on local capacity building andimplementation of programs to prevent obesity and other chronic diseases(CDC, 2004a). As discussed in Chapter 6, expansion of this grant programcould be instrumental in establishing community demonstration projects.Twenty states received funding through these grants in fiscal year (FY)2003. By expanding the total funding for the state grant programs, neededresources could be allocated to support additional states, particularly thosewith the highest prevalence of childhood and youth obesity. For example,the committee notes the critical role that the federal government has playedin highway safety by providing states with grant funding (the Section 402State and Community Highway Safety Grant program); these funds havebeen used for the development and evaluation of new innovative programsto increase the use of seat belts and child safety seats (IOM, 1999).
Another recent initiative to provide funds for city- and community-based health efforts is the DHHS Steps to a Healthier U.S. Initiative (seeChapter 5). In 2003, DHHS provided 12 grants to promote community andtribal initiatives focused on reducing the burden of diabetes, overweight,obesity, and asthma and emphasizing efforts to address physical inactivity,
299

A NATIONAL PUBLIC HEALTH PRIORITY 133
poor nutrition, and tobacco use. Evaluation and further funding of thisprogram is encouraged.
State and local governments should make childhood obesity preventiona priority by devoting resources to this issue and providing leadership inlaunching and evaluating prevention efforts.
State and Local Public Health Agencies
Government public health agencies are critical components of thenation’s response to childhood obesity at national, state, and local levels,not only because the public health workforce has the needed expertise, butalso because it has access to a large number of children, youth, and families;the ability to galvanize community efforts; and the resources to implementprevention programs. As the only institutions with the mission and legalmandate to protect the health of the public-at-large, federal, state, and localgovernment public health agencies are the most publicly accountable enti-ties within the health system. Public health has a long record of remarkableachievement despite modest resources, and the recent infusion of federalsupport to bolster preparedness for biological terrorism has strengthenedthe infrastructure to respond to disease emergencies (IOM, 2003).
The state and local public health agencies in particular comprise thefront line of the public health system. Although they are in an ideal positionto assess the childhood obesity epidemic and the local conditions that arefueling it, these agencies need to be restructured for collaborative ap-proaches that address behavioral, social, and environmental factors andthat involve diverse community stakeholders and engage even the mostdisenfranchised communities. Such partners can include schools, child-carecenters, nutrition services, parks and recreation departments, civic and eth-nic organizations, faith-based groups, businesses, and community planningand transportation boards (see Chapter 6).
As noted above, the committee urges increased funding for CDC’sprogram of state-based obesity prevention grants to provide the resourcesneeded by state and local departments of health and others for improvedsurveillance efforts to identify specific community, state, and regional is-sues; training of public health professionals on obesity prevention; plan-ning, implementing, and evaluating obesity prevention efforts includingsupport for community coalitions and other collaborative efforts with com-munity stakeholders, schools, and other key partners; and development ofbetter tools for public communication.
Health departments have the added dimension of serving as regulatoror educator of standards for practice. Immunization programs, tobaccocontrol efforts, and food service or restaurant inspection are all examples ofpublic health (or environmental health) agencies overseeing and informing
300

134 PREVENTING CHILDHOOD OBESITY
private-sector entities in order to protect health. With sufficient resourcesand staff training, public health and environmental health agencies may beable to develop complementary obesity-related programs to educate foodservice workers on nutritional values and portion size, for example, and tomonitor and sanction institutional compliance with nutrition and physicalactivity standards for children.
State and local public health agencies should make childhood obesityprevention a priority and work collaboratively with families, communities,schools, health- and medical-care providers, and industry to ensure thatoutcome. Further, state and local governments should increase funding fortheir health agencies so that they can more fully implement and evaluateobesity prevention efforts. State and local public health agencies shouldwork with other state and local agencies, such as planning and publicworks departments, in establishing an interagency and multisectoral coor-dinating task force to facilitate collaborative planning, implementation,and assessment; coordinate and leverage governmental and nongovernmen-tal resources; assure the capacity, workforce skills, standards, and resourcesnecessary to achieve obesity prevention goals; support community coali-tions (see Chapter 6); and work with community partners.
RESEARCH AND EVALUATION
Much remains to be learned about the causes and correlates of child-hood obesity, as well as the optimum measures for preventing it. Experi-mental behavioral research and community-based research are key to learn-ing more about changes in dietary and physical activity behaviors inindividuals and populations (see Chapter 9). Moreover, as discussed else-where in this report, the funding and evaluation of a wide variety of obesityprevention intervention approaches are critical, given that there is a dearthof knowledge on this subject. Interventions focused on high-risk popula-tions are particularly important. Such programs should be culturally rel-evant and designed to address the barriers to healthy lifestyles in thesepopulations’ physical and social environments.
An interdisciplinary research effort is greatly needed. Topics as diverseas the impacts of the built environment on health and behavior, gene-environment interactions, and the social underpinnings of healthful lifestylesrequire a research approach that embraces and encourages interdisciplinaryresearch in agricultural and food sciences, nutritional sciences, economics,public health, marketing, behavioral and social sciences, policy sciences,urban planning, physiology, and health care. Innovative intervention de-signs, collaborative research efforts, and rigorous evaluation are key. Afrequently overlooked component of the research cycle—the rapid transla-tion and diffusion of effective programs and policies to community set-
301

A NATIONAL PUBLIC HEALTH PRIORITY 135
tings—is especially vital for making needed headway in obesity preventionefforts. Such transfer necessarily involves innovative intervention designand rigorous evaluation (see Chapter 3).
Because nutrition, physical activity, and obesity research encompassbroad areas of investigation, federally funded research efforts are nowdispersed amongst a number of U.S. agencies, including NIH, CDC, andUSDA. In FY 2003, NIH spent $379 million on obesity-related research(NIH, 2004b). The NIH Obesity Research Task Force recently developed astrategic plan, focused primarily on the biobehavioral causes of obesity, forcoordinating the NIH efforts (NIH, 2004a). CDC funds a range of state-based nutrition and physical activity grants, in addition to its own extensiveepidemiologic efforts, to study the correlates of the obesity epidemic. USDAconducts extensive nutrition research and funds six human nutrition re-search centers across the country, one of them specifically devoted tochildren’s nutrition (including childhood obesity).
The interdisciplinary nature of obesity-related research, however, of-fers exciting opportunities for strengthening and expanding intra- and in-terdepartmental research efforts. USDA, for example, could link land grantinstitutions and other higher education entities with federal nutrition assis-tance programs and could field multidisciplinary teams to evaluate pro-gram changes (NRC, 2004).
The federal investment in research on the prevention of childhoodobesity must be strengthened. Further, foundations and other health-re-lated organizations that fund research should consider designating child-hood obesity prevention as a key area for funding. Interdisciplinary effortsshould emphasize behavioral and community-based research, particularlyin addressing childhood obesity prevention in high-risk populations.
A top research priority is the evaluation of obesity prevention interven-tions (see Chapter 9). Despite broad acknowledgement of the importance ofthe obesity crisis and the urgent need for effective prevention approaches,systematic reviews of the literature find few high-quality studies of theefficacy and/or effectiveness of various interventions to prevent weight gainand obesity in children (Campbell et al., 2002). As discussed throughoutthe report, there are many studies on correlates of obesity, physical activity,sedentary behavior, and various dietary intake patterns, many of whichconclude that their findings will be useful in designing effective preventionprograms. However, much of this research does not bear directly on under-standing how best to manipulate these correlates to achieve changes inchildren’s physical activity, sedentary behavior, diet, or weight. As a result,there are gaps in knowledge regarding how to successfully apply currentunderstandings of causes and correlates into feasible and efficacious inter-ventions and, subsequently, effective public health programs. Thus there isa need for more experimental research—studying purposeful manipulations
302

136 PREVENTING CHILDHOOD OBESITY
of biological, behavioral, environmental, and policy factors—in tightly con-trolled laboratory studies, in randomized clinical trials, in quasi-experimen-tal trials, and in natural experiments of environmental and policy changes.What distinguishes this research from nonexperimental research is the abil-ity to reasonably make causal inferences and to translate the results intopolicies or programs for either further testing or clinical or public healthpractice.
One opportunity for obtaining needed information is to incorporateevaluation into the planning and implementation of programs and initia-tives already being put forward (Box 4-3). As noted throughout this report,numerous relevant policies and programs are currently being planned orimplemented at all levels of society. However, often the evaluation compo-nent is not considered an integral part of the implementation plan or timeor funding constraints limit or negate evaluation efforts. When evaluationsof these policies and programs are absent or inadequate, neither the policynor the program sponsor and others will ever know whether or not theprograms were successful. Until a sufficient evidence base is built, therefore,attention must be given to ensuring that careful evaluation research isconducted as part of all new policy and program initiatives. Through theseevaluation efforts, interventions can be refined; those that are unsuccessfulcan be discontinued or refocused, and those that are successful can beidentified, replicated, and disseminated.
Furthermore, cost-benefit and cost-effectiveness analyses must becomea central component of prevention research because these assessments canguide appropriate policy making on the best use of limited resources (Kellamand Langevin, 2003). CDC is currently working on Project MOVE (Mea-surement of the Value of Exercise) which is calculating cost-effectiveness of
BOX 4-3Evaluation Framework
Steps for designing and evaluating programs in public health:
• Engage stakeholders—include those involved in program operations, thoseserved or affected by the programs, and primary users of the evaluation
• Describe the program• Focus the evaluation design• Gather credible evidence• Justify conclusions• Ensure use and share lessons learned
SOURCE: CDC, 1999.
303

A NATIONAL PUBLIC HEALTH PRIORITY 137
previously conducted physical activity interventions based on publisheddata. One of the literature’s few cost-effectiveness studies on this topicexamined Planet Health, a middle-school-based obesity prevention inter-vention with nutrition and physical activity components; the researcherscalculated that the intervention (cost of $33,677 or $14 per student peryear) would prevent 1.9 percent of the female students from becomingoverweight as adults, thereby saving an estimated 4.1 quality-adjusted lifeyears. The estimated savings in medical care costs ($15,887) and loss ofproductivity costs ($25,104) would result in a net savings to society of$7,313 (Wang et al., 2003). Assessments of the cost-effectiveness of otherinterventions are needed. Increased funding is needed to ensure rigorousevaluation of the net benefit and cost-effectiveness of childhood obesityprevention interventions that are being implemented at local, state, andnational levels.
SURVEILLANCE AND MONITORING
National, state, and regional surveillance systems monitor the child-hood obesity problem and contribute information on its prevalence (Table4-1). For example, CDC’s Youth Risk Behavior Surveillance System(YRBSS) surveys examine a variety of obesity-related factors, includingphysical activity and nutrition, in 12- to 19-year-olds. The School HealthPolicies and Programs Study (SHPPS), a national survey of states, schooldistricts, schools, and classrooms, which has been conducted twice (1994and 2000), examines policies for school health services, food services, andphysical education (CDC, 2004b).
The National Health and Nutrition Examination Survey (NHANES)monitors the population—through home interviews and health examina-tions of representative samples of U.S. households with participants asyoung as 2 months of age—to gather a wealth of information relevant toobesity prevention efforts (see Chapter 2). The current NHANES measuresmany factors that relate to energy balance: dietary intake, physical activity,body mass index, body composition, cardiovascular fitness, and biochemi-cal indicators such as blood pressure and serum glucose. Furthermore,collaborations between DHHS and USDA have facilitated the recent inte-gration of the Continuing Survey of Food Intakes by Individuals (CSFII)and NHANES, so that dietary intake and health data can be more accu-rately correlated. Efforts are ongoing to incorporate the diet and healthknowledge segment (previously in CSFII) into NHANES as well, providingfurther insights into knowledge and attitudes about diet and nutrition.
The health examination segment of NHANES includes fitness tests andquestions regarding physical activity for 12- to 49-year-old participants.The current NHANES assessments of body composition include the use of
304

138
TA
BL
E 4
-1Se
lect
ed S
urve
illan
ce S
yste
ms
Prim
ary
Surv
eilla
nce
Syst
emSp
onso
rFr
eque
ncy
Des
crip
tion
CSF
IIC
onti
nuin
g Su
rvey
of
Food
USD
A19
89-1
991;
199
4-19
96;
Nat
iona
lly
repr
esen
tati
ve s
urve
y of
die
tary
int
ake.
Inta
kes
by I
ndiv
idua
ls19
98;
now
par
t of
NH
AN
ES
Res
pond
ents
wer
e as
ked
to p
rovi
de 2
to
3 da
ys o
ffo
od i
ntak
e da
ta.
CSF
II i
s no
w i
ncor
pora
ted
into
NH
AN
ES.
NH
AN
ES
CD
CPr
evio
usly
con
duct
ed p
erio
dica
lly,
Ong
oing
nat
iona
lly
repr
esen
tati
ve s
urve
y as
sess
ing
Nat
iona
l H
ealt
h an
d N
utri
tion
now
con
tinu
ous
surv
eyth
e he
alth
and
nut
riti
onal
sta
tus
of a
dult
s an
dE
xam
inat
ion
Surv
eych
ildr
en i
n th
e U
nite
d St
ates
thr
ough
int
ervi
ews
and
dire
ct p
hysi
cal
exam
inat
ions
. C
urre
ntly
, in
part
ners
hip
wit
h U
SDA
, N
HA
NE
S in
corp
orat
esth
e C
SFII
.
NH
TS
BT
S an
d20
01Su
rvey
of
long
-dis
tanc
e an
d lo
cal
trav
el b
y th
eN
atio
nal
Hou
seho
ldFH
WA
Am
e ric
an p
ubli
c . T
he s
urve
y in
form
atio
n in
c lud
e sT
rave
l Su
rvey
mod
e of
tra
nspo
rtat
ion,
dur
atio
n, d
ista
nce
and
purp
ose
of t
rip.
Pri
or r
e lat
e d s
urve
ys i
nclu
de t
heN
atio
nwid
e Pe
rson
al T
rans
port
atio
n Su
rvey
cond
ucte
d in
196
9, 1
977,
198
3, 1
990,
and
1995
and
the
Am
e ric
an T
rave
l Su
rvey
con
duc t
e din
197
7 an
d 19
95.
Nat
iona
l L
ongi
tudi
nal
NIC
HD
1994
, 19
96,
and
2001
-200
2N
atio
nall
y re
pre s
e nta
tive
stu
dy t
hat
e xpl
ore s
Stud
y of
Ado
lesc
e nt
Hea
lth
heal
th-r
e lat
e d b
e hav
iors
by
foll
owin
g a
sam
ple
ofad
ole s
c ent
s w
ho w
e re
in g
rade
s 7
thro
ugh
12 i
n19
94-1
995
into
you
ng a
dult
hood
.
305

139N
LSY
BL
SA
nnua
l in
terv
iew
sN
atio
nall
y re
pres
enta
tive
stu
dy o
f yo
uths
who
Nat
iona
l L
ongi
tudi
nal
Surv
eyw
ere
12 t
o 16
yea
rs o
ld i
n 19
96.
Init
ial
inte
rvie
ws
of Y
outh
wer
e w
ith
the
yout
h an
d on
e pa
rent
. Su
bseq
uent
annu
al i
nter
view
s w
ith
the
yout
h. T
opic
s ra
nge
from
edu
cati
on a
nd e
mpl
oym
ent
to h
ealt
h is
sues
and
tim
e us
e.
PedN
SSC
DC
Com
pile
d fr
om o
ngoi
ng r
epor
tsPr
ogra
m-b
ased
sur
veil
lanc
e sy
stem
tha
t ex
amin
esPe
diat
ric
Nut
riti
onnu
trit
iona
l st
atus
of
chil
dren
in
low
-inc
ome
Surv
eill
ance
Sys
tem
hous
ehol
ds.
The
sys
tem
use
s da
ta c
olle
cted
fro
mhe
alth
, nu
trit
ion,
and
foo
d as
sist
ance
pro
gram
sfo
r in
fant
s an
d ch
ildr
en,
such
as
WIC
.
SHPP
SC
DC
1994
and
200
0; t
o be
con
duct
edPe
riod
ic c
olle
ctio
n of
inf
orm
atio
n on
sch
ool
Scho
ol H
ealt
h Po
lici
es a
ndin
200
6he
alth
-rel
ated
pol
icie
s an
d pr
ogra
ms
at t
he s
tate
,Pr
ogra
ms
Stud
ydi
stri
ct,
scho
ol,
and
clas
sroo
m l
evel
s.
YR
BSS
CD
C19
91-p
rese
nt;
ever
y 2
year
sM
onit
ors
heal
th r
isk
beha
vior
in
adol
esce
nts
You
th R
isk
Beh
avio
rth
roug
h na
tion
al,
stat
e, a
nd l
ocal
sch
ool-
base
dSu
rvei
llan
ce S
yste
msu
rvey
s of
rep
rese
ntat
ive
sam
ples
of
9th
thro
ugh
12th
gra
de s
tude
nts.
NO
TE
: B
LS
= B
urea
u of
Lab
or S
tati
stic
s; B
TS
= B
urea
u of
Tra
nspo
rtat
ion
Stat
isti
cs;
CD
C =
Cen
ters
for
Dis
ease
Con
trol
and
Pre
vent
ion;
CSF
II =
Con
tinu
ing
Surv
ey o
f Fo
od I
ntak
es b
y In
divi
dual
s; F
HW
A =
Fed
eral
Hig
hway
Adm
inis
trat
ion;
NIC
HD
= N
atio
nal
Inst
itut
e of
Chi
ld H
ealt
h an
dH
uman
Dev
elop
men
t; U
SDA
= U
.S.
Dep
artm
ent
of A
gric
ultu
re.
306

140 PREVENTING CHILDHOOD OBESITY
multifrequency bioelectrical impedance analysis data on participants aged 8to 49 years and dual energy x-ray absorptiometry measures on participantsolder than 8 years of age. This information allows greater accuracy indetermining body-weight status and in examining correlates of nutritionand physical activity. NHANES data are used to track trends in obesityprevalence. But it is critical that additional information be collected andanalyzed to provide insights into obesity prevention efforts.
Many of the current surveillance efforts collect data on only one agerange (most often adolescents) and usually lack the resources to focus onhigh-risk populations at the state and regional levels. More detailed infor-mation is needed on weight status; physical activity; nutrition; social, envi-ronmental, and behavioral risk factors for obesity; and economic and medi-cal consequences of obesity (such as type 2 diabetes in children and youth).Information on children’s physical activity levels is particularly scant be-cause most national surveys focus on adolescents. Additional information isneeded at the state and regional level to provide more in-depth informationon specific geographic areas or high-risk populations. Further efforts shouldalso be made to monitor community-level variables in order to assess theimpact of environmental-level changes and policies. Examples include thenumber of school districts requiring daily physical education in schools, thenumber of grocery stores selling fresh fruits and vegetables within low-income neighborhoods, or the percentage of children living within a mile ofschool who commute by walking or biking. Innovative approaches shouldbe explored and evaluated that would monitor the impact of changes at thelocal level and feed that information back to national sources so that suc-cessful programs could be refined and expanded.
Relevant surveillance and monitoring efforts should be supported andstrengthened by increased federal funding; this applies particularly toNHANES, as it is a valuable information resource for obesity preventionprograms. Special efforts should be made to identify those populationsmost at risk of childhood obesity, and to monitor the social, environmental,and behavioral factors contributing to that elevated risk.
Further efforts to collect longitudinal data would be useful, as longitu-dinal studies can examine potential risk factors associated with the develop-ment of obesity and normal weight, which is not possible from cross-sectional studies. Discussions are ongoing about initiating a new nationallongitudinal study on U.S. children that would follow a large cohort overtime to examine health and well-being issues. As this national study is beingconsidered, the committee urges that weight status, as well as nutrition- andphysical activity-related measures, be included in such an effort’s basic setof questions. A precedent is the Avon Longitudinal Study of Pregnancy andChildhood (ALSPAC), based in England and involving other Europeancollaboration centers. ALSPAC is examining nutrition and other anteced-
307

A NATIONAL PUBLIC HEALTH PRIORITY 141
ents as well as growth outcomes. Any national longitudinal cohort study ofchildren that is established should examine antecedents and outcomes, in-cluding physical activity levels, dietary patterns, eating behaviors, andweight status, related to the development of obesity during childhood.
NUTRITION AND PHYSICAL ACTIVITY PROGRAMS
A number of public- and private-sector programs educate consumers ofall ages about proper nutrition and regular physical activity. For example,the USDA’s Expanded Food and Nutrition Education Program (EFNEP)uses the resources of county Cooperative Extension System services andother local agencies to reach low-income families and youth, and both theSpecial Supplemental Nutrition Program for Women, Infants, and Children(WIC) and the Food Stamp Program (FSP) have nutrition education compo-nents. Team Nutrition has been developed by USDA to improve schoolnutrition and nutrition education, and it has components for students,parents, teachers, and food service personnel. The Five-A-Day media cam-paigns, the result of an extensive public-private partnership, promote theconsumption of fruits and vegetables. These programs still face challenges,however. A recent assessment of several USDA nutrition education effortsrevealed limited resources, competing program requirements, and a lack ofsystematic data collection on the types of nutrition education offered (GAO,2004). Actions are therefore needed that clearly identify program goals,tailor nutrition education to meet the needs of participants, and collect dataon program results (GAO, 2004).
Increasingly, more public- and private-sector programs are focusing onphysical activity, or they are working to promote both good nutrition andphysical activity. The President’s Council on Physical Fitness and Sports isdeveloping a Fit ‘n Active Kids program. The Partnership for a WalkableAmerica is an extensive public-private collaboration to promote walkingand improve conditions for walking. The America on the Move initiativesponsored by the Partnership to Promote Healthy Eating and Active Living(an organization of nonprofit and private-sector partners) targets preven-tion of adult weight gain as a first step toward combating obesity; theinitiative specifically advocates increasing physical activity by 100 caloriesper day and decreasing caloric intake by 100 calories per day (America onthe Move, 2004). CDC’s VERB campaign (see Chapter 5) focuses on mediamessages on physical activity for 9- to 13-year-olds and involves collabora-tions with schools, youth organizations, and other organizations.
The existing infrastructure and capabilities of these and other relevantfederal programs and public-private collaborations can provide an avenueto raise awareness of the health consequences of childhood obesity and toconvey, through well-evaluated interventions, information on energy bal-
308

142 PREVENTING CHILDHOOD OBESITY
ance and the benefits to children of healthful food choices and regularphysical activity. Some of these programs were developed to accomplishgoals other than obesity prevention, and evaluation of how to best use themto respond to the current information needs for obesity prevention may beneeded. Children, youth, and their families need to have the information tomake positive lifestyle decisions just as they need access to nutritious foodsand recreational facilities in order to implement these choices (see Chapter8). Providing obesity-related information to parents and families is oftenquite a challenge, because there is no one source or avenue throughout theUnited States for parent education. Several options are available at present,including federal and state nutrition education programs, parenting maga-zines and other media, health-care visits, and school-based programs. How-ever, other innovative approaches need to be explored.
Program implementation efforts should particularly address childhoodobesity prevention in high-risk populations. Some of the ongoing federalfood and nutrition efforts—including EFNEP, FSP, WIC, the NationalSchool Lunch Program (NSLP), the School Breakfast Program (SBP), theSummer Food Service Program, and the Child and Adult Care Food Pro-gram (CACFP)—address the needs of low-income, high-risk populationsthat have significant health disparities. But these programs could do more,even within their existing infrastructure, through a sustained commitmentto funding for obesity prevention research and intervention development,implementation, and evaluation.
Federal support is needed for programs that emphasize improved nutri-tion and physical activity in children, youth, and their families, with par-ticular attention paid to populations at high risk of obesity. These pro-grams should be required to have strong evaluation components, and theevaluation results should consequently be reflected in program refinementsthat strengthen their evidence-based approaches. Programs should also ex-plore and evaluate new approaches to educating children and their familiesabout concepts related to energy balance.
NUTRITION ASSISTANCE PROGRAMS
One in five Americans utilizes one or more of the 15 federal nutritionassistance programs (USDA, 2003a). Many of these programs provide foodto children either directly, through the school breakfast and lunch pro-grams, or indirectly, through vouchers that may be used by the family tosupplement household food resources (Table 4-2).
In FY 2001, approximately 4 million children were served each monthby the FSP, 28 million were served daily by the NSLP, and 8.1 million wereserved daily by the SBP. Although the FSP includes a nutrition educationcomponent in selected states, the program is designed as a food equity
309

A NATIONAL PUBLIC HEALTH PRIORITY 143
program to alleviate hunger and food insecurity; thus it does not haveguidelines on the specific types of food that recipients may purchase withtheir benefits. There has been growing interest, however, in examining therelationships among food insecurity, federal nutrition assistance programparticipation, and the risk of obesity among children and youth. Becauseresource-constrained families are more likely to participate in nutritionprograms, any association of program participation with obesity must beevaluated within the context of poverty and food insecurity (Frongillo,2003).
As noted in Chapter 3, food insecurity in children has not been associ-ated with obesity, except in white girls aged 8 to 16 years (Alaimo et al.,2001; Casey et al., 2001; Frongillo, 2003). In fact, existing empirical datasuggests that there is a lower risk of overweight and obesity in school-agedfood-insecure girls who participated in the FSP, NSLP, and the SBP (Joneset al., 2003).
The WIC program provides nutrition information, supplemental foods,and referrals to health care for low-income women, infants, and children upto age 5 who are at nutritional risk. Approximately half of all infants and25 percent of all 1- to 4-year-old children in the United States participate inthe WIC program (Oliveira et al., 2002). A study of low-income preschool
TABLE 4-2 Selected Federal Food and Nutrition Assistance Programs
FY 2002
Food Stamp Program Average monthly participation (millions) 19.1Average benefit per person (dollars/month) 79.68Total expenditures ($ billions) 20.7
WIC Average monthly participation (millions) 7.5Total expenditures ($ billions) 4.3
National School Average daily participation (millions) 28.0Lunch Program Total expenditures ($ billions) 6.9
School Breakfast Program Average daily participation (millions) 8.1Total expenditures ($ billions) 1.6
Child and Adult Meals served in:Care Food Program • Child care centers (millions) 984
• Family child care homes (millions) 708• Adult day care centers (millions) 45Total annual expenditures ($ billions) 1.9
SOURCE: USDA, 2003a.
310

144 PREVENTING CHILDHOOD OBESITY
children in 18 states and Washington, DC (most were WIC recipients)found that one in ten was overweight in 1995, a relative increase of 20percent from 1983 (Mei et al., 1998). Two studies examining potentialassociations between the WIC food package and overweight status in chil-dren found that WIC foods did not contribute to overweight (CDC, 1996)and that the weight status of children in the WIC program was comparableto that of other low-income children (Burstein et al., 2000). The Institute ofMedicine is currently conducting a study to review the nutritional needs ofthe populations served by the WIC Program, assess their supplementalnutritional needs, and propose recommendations for the contents of theWIC food packages.
Given that a great deal is known about good nutrition and the dietarycomposition of balanced diets, it would be advantageous to the health ofchildren participating in federal nutrition assistance programs if nutrient-rich foods were made available and if there was access to ethnically andculturally appropriate foods. The committee is particularly interested inurging USDA to expand pilot programs that focus on increasing the avail-ability of fresh fruits and vegetables and other nutritious foods or provideincentives for the purchase of these items. Ideas for such programs haveincluded double or specifically designated fruit and vegetable vouchers;coupons or other discount promotions; and the ability to use electronicbenefit transfer cards at farmers’ markets or community-supported agricul-tural markets (GAO, 2002). Additionally, a systematic study should exam-ine potential strategies for improving the community food environment toensure that FSP recipients have access to supermarkets, farmers’ markets,and other venues that provide fresh, high-quality, and affordable produceand other healthful foods (see Chapter 6).
In addition to their current objectives to improve food access and di-etary quality, the federal nutrition assistance programs (e.g., WIC, FSP)should include obesity prevention as an explicit goal for the populationsserved. Congress should request independent assessments of these programsto ensure that each provides adequate access to healthful dietary choices(including fruits, vegetables, and whole grains) for the populations served.USDA should also continue to explore pilot programs within the nutritionassistance programs that encourage diet and physical activity behaviorsthat promote energy balance at a healthy weight in children and youth.
AGRICULTURAL POLICIES
As the traditional paradigm of “farm to table” shifts to one of “table tofarm,” driven by consumer demand and an awareness of the connectionsbetween diet and health, decision makers in the United States should take anew look at the impact of agricultural and food policies (NRC, 2004). The
311

A NATIONAL PUBLIC HEALTH PRIORITY 145
committee acknowledges that the nation’s food supply is part of a globalfood system, and that many food-related issues lie outside of any onenation’s purview. However, the committee also realizes that the globalimplications of domestic solutions to the childhood obesity epidemic shouldbe thoughtfully considered so that new problems are not created that mayproduce adverse consequences (Appendix D).
There are a number of mechanisms by which U.S. federal agriculturalpolicies may potentially affect the types of foods available to and marketedto children. For example, schools participating in the NSLP may choose toreceive entitlement commodities purchased by USDA specifically for theprogram or receive bonus commodities from USDA to bolster the agricul-tural markets for particular products (to address temporary surpluses or tohelp stabilize farm prices) (USDA, 2002, 2004b). In the 2001-2002 schoolyear, USDA’s Agricultural Marketing Service and Farm Service Agencytogether spent more than $765 million on school lunch entitlement pur-chases and approximately $58 million in providing bonus commodities(USDA, 2004b). These included beef, fish, poultry, eggs, fruits, vegetables,flours, grains, dairy products, and peanut products. As discussed in Chap-ter 7, there are several federal, state, and local programs at present, such asthe Department of Defense’s Fresh Produce Program, that provide the dis-tribution mechanisms for delivering fresh produce from farms to schools.
A second set of policies to examine involves the check-off programs,used for agriculture products such as beef, pork, and dairy, in which pro-ducers are required to donate money—a fixed amount for each unit sold—to a fund established by federal legislation but run by a national private-sector board (Dairy Management, 2004; National Pork Board, 2004;USDA, 2004a). For example, the National Pork Board reports that porkproducers and importers pay 40 cents on each $100 when pigs or porkproducts are sold; these funds generated $47.8 million in 2003 (NationalPork Board, 2004) for use in advertising, marketing, education, research,and other programs that promoted the commodity.
Concerns have been raised about the many factors that influence fooddemand and food consumption behaviors of Americans—the types andprices of available foods, technological advances, time pressures, and gov-ernment policies on agriculture, taxes, and exports/imports—which areoutside of consumer control (NRC, 2004).
A review of agricultural policies could identify unintended effects ofU.S. agricultural subsidies on human health. For example, Americans’ percapita consumption of caloric sweeteners—primarily sucrose derived fromcane, beets, and corn (notably high fructose corn syrup)—increased by 43pounds, or 39 percent, between 1950-1959 and 2000 (USDA, 2003b). In2000, the average American consumed 152 pounds of caloric sweeteners,which was equivalent to 52 teaspoons of added sugars per person per day
312

146 PREVENTING CHILDHOOD OBESITY
(USDA, 2003b), more than 40 percent of which came from high fructosecorn syrup (Bray et al., 2004). The possible relationships among agricul-tural policies (such as corn subsidies and the production and use of highfructose corn syrup in the U.S. food supply), the obesity epidemic (Bray etal., 2004), and the marked increase in type 2 diabetes (Gross et al., 2004;Schulze et al., 2004) warrant further investigation.
An independent assessment should be conducted of U.S. agriculturalpolicies, including agricultural subsidies and commodity programs, thatmay affect the types and quantities of foods available to children throughthe federal food assistance programs. Further, other efforts (such as check-off programs) that have involved federal legislation should be examined toensure that they work to promote a healthful dietary intake among chil-dren. Policies and programs should be revised as necessary to promote aU.S. food system that supports energy balance at a healthy weight.
OTHER POLICY CONSIDERATIONS
The imposition of taxes on certain foods or beverages, particularlyhigh-calorie food items or those with low nutrient density, has been dis-cussed with regard to the obesity epidemic. Several states including Arkan-sas, Tennessee, Virginia, and Washington, currently impose excise taxes onsoft drinks. Although the tax rates have been found to be too small to affectsales, in certain jurisdictions the revenues generated are substantial butgenerally have not been used to fund obesity prevention activities (Jacobsonand Brownell, 2000). It is not known whether imposing a sales tax ondesignated foods such as soft drinks would have a significant effect onbeverage sales (Jacobson and Brownell, 2000). Moreover, there is the diffi-culty of determining which foods would be taxable—for example, how todefine soft drink and snack foods (Jacobson and Brownell, 2000). Taxationand pricing strategies have been found to contribute to tobacco preventionand control efforts (Levy et al., 2004). Pricing policies for food are muchmore complex than tobacco and there is limited evidence about the priceelasticity of high-energy-dense foods (Yach et al., 2003). It is notable thatother countries, such as Norway, have effectively used agricultural policiessuch as consumer and producer subsidies to encourage the consumption ofhealthful foods (Milio, 1998).
The committee has carefully considered the issues regarding taxes onspecific foods, particularly soft drinks and energy-dense snack foods, but atthis time, it is the committee’s judgment that there is not sufficient evidenceto make a strong recommendation either for or against taxing these foods.More research is needed to determine objective methods for defining andcharacterizing foods based on nutritional considerations such as the qualityand quantity of nutrients or the energy density. Additionally, because low-
313

A NATIONAL PUBLIC HEALTH PRIORITY 147
income families spend a greater proportion of their household income onfood than do higher-income families (Nord et al., 2003), taxes on foodsmay have the effect of being regressive and may lead to unintended conse-quences such as increasing food insecurity. In any case, taxation may notaddress the main issue, that many people will not consume greater amountsof healthful foods, even if their relative prices are lower, simply becausethey prefer energy-dense foods.
Because some states are already taxing specific types of food or bever-age products, studying these examples may prove useful. The committeesuggests that research into the effects of taxation and pricing strategies beconsidered a priority to help shed light on the potential outcomes of morebroadly applying taxation as a public health strategy for promoting im-proved dietary behaviors, more physical activity, and reduced sedentarybehaviors.
RECOMMENDATION
Childhood obesity is a serious nationwide health problem requiringurgent attention and a population-based prevention approach. Innovativeideas, commitments of time and resources by diverse sectors and stakehold-ers, and sustained efforts involving individual, institutional, and societalchanges are needed to ensure that all children grow up physically andemotionally healthy.
Also needed is national leadership that elevates childhood obesity pre-vention to a top national health priority and dedicates the funding andresources required to make this goal a long-term commitment. Only throughpolicies, legislation, programs, and research will meaningful changes bemade. Steady monitoring and evaluation of those changes will inform andrefine future efforts. Prevention of obesity in children and youth should bea national public health priority.
Recommendation 1: National PriorityGovernment at all levels should provide coordinated leadership for theprevention of obesity in children and youth. The President should re-quest that the Secretary of the DHHS convene a high-level task force toensure coordinated budgets, policies, and program requirements and toestablish effective interdepartmental collaboration and priorities foraction. An increased level and sustained commitment of federal andstate funds and resources are needed.
To implement this recommendation, the federal government should:
314

148 PREVENTING CHILDHOOD OBESITY
• Strengthen research and program efforts addressing obesityprevention, with a focus on experimental behavioral research andcommunity-based intervention research and on the rigorous evalua-tion of the effectiveness, cost-effectiveness, sustainability, and scal-ing up of effective prevention interventions
• Support extensive program and research efforts to preventchildhood obesity in high-risk populations with health disparities,with a focus both on behavioral and environmental approaches
• Support nutrition and physical activity grant programs, par-ticularly in states with the highest prevalence of childhood obesity
• Strengthen support for relevant surveillance and monitoringefforts, particularly NHANES
• Undertake an independent assessment of federal nutrition as-sistance programs and agricultural policies to ensure that they pro-mote healthful dietary intake and physical activity levels for all chil-dren and youth
• Develop and evaluate pilot projects within the nutrition assis-tance programs that would promote healthful dietary intake andphysical activity and scale up those found to be successful
To implement this recommendation, state and local governmentsshould:
• Provide coordinated leadership and support for childhood obe-sity prevention efforts, particularly those focused on high-risk popu-lations, by increasing resources and strengthening policies that pro-mote opportunities for physical activity and healthful eating incommunities, neighborhoods, and schools
• Support public health agencies and community coalitions intheir collaborative efforts to promote and evaluate obesity preven-tion interventions
REFERENCES
Alaimo K, Olson CM, Frongillo EA Jr. 2001. Low family income and food insufficiency inrelation to overweight in US children: Is there a paradox? Arch Pediatric Adolesc Med155(10):1161-1167.
America on the Move. 2004. America on the Move. [Online]. Available: http://www.americaonthemove.org [accessed May 15, 2004].
Bray GA, Nielsen SJ, Popkin BM. 2004. Consumption of high-fructose corn syrup in bever-ages may play a role in the epidemic of obesity. Am J Clin Nutr 79(4):537-543.
Burstein NR, Fox MK, Hiller JB, Kornfeld R, Lam K, Price C, Rodda DT. 2000. Profile ofWIC Children. Cambridge, MA. Prepared by Abt Associates for USDA, FNS, Office ofAnalysis, Nutrition, and Evaluation.
315

A NATIONAL PUBLIC HEALTH PRIORITY 149
Campbell K, Waters E, O’Meara S, Kelly S, Summerbell C. 2002. Interventions for Prevent-ing Obesity in Children. Oxford, U.K.: Cochrane Library.
Canadian Institute for Health Information. 2004. Obesity. In: Improving the Health of Cana-dians. Ottawa, Ontario: CIHI. Pp. 105-142.
Casey PH, Szeto K, Lensing S, Bogle M, Weber J. 2001. Children in food-insufficient, low-income families: Prevalence, health, and nutrition status. Arch Pediatr Adolesc Med155(4):508-514.
CDC (U.S. Centers for Disease Control and Prevention). 1996. Nutritional status of childrenparticipating in the Special Supplemental Nutrition Program for Women, Infants, andChildren—United States, 1998-1991. MMWR 45(3):65-69.
CDC. 1999. Framework for program evaluation in public health. MMWR Recomm Rep48(RR11):1-40.
CDC. 2004a. CDC’s State-Based Nutrition and Physical Activity Program to Prevent Obesityand Other Chronic Diseases. [Online]. Available: http://www.cdc.gov/nccdphp/dnpa/obesity/state_programs/index.htm [accessed April 21, 2004].
CDC. 2004b. School Health Policies and Programs Study. [Online]. Available: http://www.cdc.gov/nccdphp/dash/shpps/index.htm [accessed May 26, 2004].
Dairy Management, Inc. 2004. About the Dairy Checkoff. [Online]. Available: http://www.dairycheckoff.com/ [accessed March 15, 2004].
DHHS (U.S. Department of Health and Human Services). 2000. Healthy People 2010: Objec-tives for Improving Health. Washington, DC: DHHS.
DHHS. 2001. The Surgeon General’s Call to Action to Prevent and Decrease Overweight andObesity. Rockville, MD: Public Health Service, Office of the Surgeon General.
DHHS. 2004. The Health Consequences of Smoking: A Report from the Surgeon General.Washington, DC: DHHS. [Online]. Available: http://www.cdc.gov/tobacco/sgr/sgr_2004/index.htm [accessed June 8, 2004].
Economos CD, Brownson RC, DeAngelis MA, Foerster SB, Foreman CT, Gregson J,Kumanyika SK, Pate RR. 2001. What lessons have been learned from other attempts toguide social change? Nutr Rev 59(3 Pt 2):S40-S56.
Frongillo EA. 2003. Understanding obesity and program participation in the context of pov-erty and food insecurity. J Nutr 133(7):2117-2118.
GAO (U.S. General Accounting Office). 2002. Fruits and Vegetables: Enhanced Federal Ef-forts to Increase Consumption Could Yield Health Benefits for Americans. GAO-02-657. Washington, DC: GAO.
GAO. 2004. Nutrition Education: USDA Provides Services Through Multiple Programs, butStronger Linkages Among Efforts are Needed. GAO-04-528. Washington, DC: GAO.
Gross LS, Li L, Ford ES, Liu S. 2004. Increased consumption of refined carbohydrates and theepidemic of type 2 diabetes in the United States: An ecologic assessment. Am J Clin Nutr79(5):774-779.
Haddad L. 2003. What Can Food Policy Do to Redirect the Diet Transition? FCND Discus-sion Paper No. 165. Washington, DC: International Food Policy Research Institute.
Health Council of The Netherlands. 2003. Overweight and Obesity. Publication 2003/07.The Hague, Netherlands: Health Council of The Netherlands.
IOM (Institute of Medicine). 1999. Reducing the Burden of Injury: Advancing Preventionand Treatment. Washington, DC: National Academy Press.
IOM. 2003. The Future of the Public’s Health in the 21st Century. Washington, DC: TheNational Academies Press.
Jacobson MF, Brownell KD. 2000. Small taxes on soft drinks and snack foods to promotehealth. Am J Public Health 90(6):854-857.
316

150 PREVENTING CHILDHOOD OBESITY
Jones SJ, Jahns L, Laraia BA, Haughton B. 2003. Lower risk of overweight in school-agedfood insecure girls who participate in food assistance: Results from the panel study ofincome dynamics child development supplement. Arch Pediatr Adolesc Med 157(8):780-784.
Kellam SG, Langevin DJ. 2003. A framework for understanding “evidence” in preventionresearch and programs. Prev Sci 4 (3):137-153.
Kersh R, Morone J. 2002. How the personal becomes political: Prohibitions, public health,and obesity. Stud Am Polit Dev 16:162-175.
Levy DT, Chaloupka F, Gitchell J. 2004. The effects of tobacco control policies on smokingrates: A tobacco control scorecard. J Public Health Manag Pract 10(4):338-353.
Lobstein T, Baur L, Uauy R, IASO International Obesity Task Force. 2004. Obesity in chil-dren and young people: A crisis in public health. Obes Rev 5(Suppl 1):4-85.
Mei Z, Scanlon KS, Grummer-Strawn LM, Freedman DS, Yip R, Trowbridge FL. 1998.Increasing prevalence of overweight among U.S. low-income preschool children: TheCenters for Disease Control and Prevention Pediatric Nutrition Surveillance, 1983 to1995. Pediatrics 101:E12.
Milio N. 1998. Norwegian nutition policy: Progress, problems and prospects. In: Milio N,Helsing E, eds. European Food and Nutrition Policies in Action. WHO Regional Publi-cations, European Series, No. 73. Copenhagen, Denmark: Regional Office for Europe.
National Board of Health. 2003. National Action Plan Against Obesity. Recommendationsand Perspectives. Short Version. Copenhagen, Denmark: National Board of Health,Center for Health Promotion and Prevention.
National Pork Board. 2004. About Pork Checkoff. [Online]. Available: http://www.porkboard.org/about/ [accessed March 15, 2004].
New South Wales Department of Health. 2003. Prevention of Obesity in Children and YoungPeople. NSW Government Action Plan 2003-2007. North Sydney, NSW, Australia:NSW Department of Health.
NIH (National Institutes of Health). 2004a. Strategic Plan for NIH Obesity Research.[Online]. Available: http://obesityresearch.nih.gov/About/ObesityEntireDocument.pdf[accessed August 24, 2004].
NIH. 2004b. Estimates of Funding for Various Diseases, Conditions, Research Areas.[Online]. Available: http://www.nih.gov/news/fundingresearchareas.htm [accessed June22, 2004].
Nord M, Andrews M, Carlson S. 2003. Household Food Security in the United States, 2002.Food Assistance and Nutrition Research Report 35. Alexandria, VA: Economic Re-search Service.
NRC (National Research Council). 2004. Exploring a Vision: Integrating Knowledge forFood and Health. Washington, DC: The National Academies Press.
Oliveira V, Racine E, Olmsted J, Ghelfi LM. 2002. The WIC Program: Background, Trends,and Issues. Food Assistance and Nutrition Research Report, Number 27. Washington,DC: USDA, Economic Research Service.
Raine KD. 2004. Overweight and Obesity in Canada: A Population Health Perspective.Ottawa, Ontario: Canadian Institute for Health Information.
Schulze MB, Manson JE, Ludwig DS, Colditz GA, Stampfer MJ, Willett WC, Hu FB. 2004.Sugar-sweetened beverages, weight gain, and incidence of type 2 diabetes in young andmiddle-aged women. J Am Med Assoc 292(8):927-934.
United Kingdom Parliament. 2004. Health–Third Report. House of Commons: Select Com-mittee on Health. [Online]. Available: http://www.parliament.the-stationery-office.co.uk/pa/cm200304/cmselect/cmhealth/23/2302.htm [accessed June 10, 2004].
317

A NATIONAL PUBLIC HEALTH PRIORITY 151
USDA (U.S. Department of Agriculture). 2002. Availability of Fresh Produce in NutritionAssistance Programs. Nutrition Assistance Program Report Series, No. CN-02-FV. Alex-andria, VA: USDA Food and Nutrition Service, Office of Analysis, Nutrition, and Evalu-ation.
USDA. 2003a. The Food Assistance Landscape. Food Assistance and Nutrition ResearchReport Number 28-3. Washington, DC: Economic Research Service.
USDA. 2003b. Profiling food consumption in America. In: Agriculture Fact Book 2001-2002.Washington, DC: USDA. U.S. Government Printing Office.
USDA. 2004a. Beef Promotion and Research Order. Agricultural Marketing Service. Live-stock and Seed Program. [Online]. Available: http://www.ams.usda.gov/lsg/mpb/beef/beefchk.htm [accessed March 15, 2004].
USDA. 2004b. National School Lunch Program. Agricultural Marketing Service. [Online].Available: http://www.ams.usda.gov/nslpfact.htm [accessed March 15, 2004].
Wang LY, Yang Q, Lowry R, Wechsler H. 2003. Economic analysis of a school-based obesityprevention program. Obes Res 11(11):1313-1324.
WHO (World Health Organization). 2000. Obesity: Preventing and Managing the GlobalEpidemic. Report of a WHO Consultation: WHO Technical Report Series 894. Geneva:WHO.
WHO. 2003. Diet, Nutrition and the Prevention of Chronic Diseases. Technical ReportSeries No. 916. Geneva: WHO.
Willett WC, Domolky S. 2004. Strategic Plan for the Prevention and Control of Overweightand Obesity in New England. Providence, RI: New England Coalition for Health Pro-motion and Disease Prevention. [Online]. Available: http://www.neconinfo.org/Strategic_Plan_02-11-03.pdf [accessed June 6, 2004].
Yach D, Hawkes C, Epping-Jordan JE, Galbraith S. 2003. The World Health Organization’sframework convention on tobacco control: Implications for global epidemics of food-related deaths and disease. J Public Health Policy 24(3/4):274-290.
318

319

153
Industry, Advertising,Media, and
Public Education
5
To lead a healthier and more active lifestyle, many young consumersand their parents will need to alter their food and beverage prefer-ences and engage in fewer sedentary pursuits in order to achieve
energy balance. Market forces may be very influential in changing bothconsumer and industry behaviors. The food, beverage, restaurant, enter-tainment, leisure, and recreation industries must share responsibility forchildhood obesity prevention and can be instrumental in supporting thisgoal. Federal agencies such as the U.S. Department of Health and HumanServices (DHHS), the U.S. Department of Agriculture (USDA), and theFederal Trade Commission (FTC) all have the potential to strengthen in-dustry efforts through general support, technical assistance, research exper-tise, and regulatory guidance. In addition, government is an importantsource of positive reinforcement. It can recognize industry stakeholderswho are willing to take the financial risks of developing new products andservices consistent with the goals of healthful eating behaviors and regularphysical activity, thereby setting examples for other private-sector entitiesto follow.
INDUSTRY
American children and youth represent dynamic and lucrative markets.For example, food and beverage sales to young consumers exceeded $27billion in 2002 (U.S. Market for Kids’ Foods and Beverages, 2003). Simi-
320

154 PREVENTING CHILDHOOD OBESITY
larly, young people are major consumers of the products and services of theentertainment, leisure, and recreation industries.
Providing young consumers and their families with the knowledge andskills to make informed and prudent choices in these marketplaces could bea key obesity prevention strategy. Industry continuously develops new prod-ucts and services in response to changing consumer demand, and its pri-mary emphases—sales trends, marketing opportunities, product appeal,and expanding market share for specific product categories and productbrands (Datamonitor, 2002; U.S. Market for Kids’ Foods and Beverages,2003)—could be profitably shifted toward healthier and more activelifestyles.
Although the private sector has not historically viewed its responsibilityas changing consumers’ preferences toward healthier choices, changes areunder way that acknowledge the essential role that industry may play inrelated policy dialogues, public/private partnerships, and research (Crockettet al., 2002).
The increased media coverage of childhood obesity in recent years, andthe consequent growth in public attention and potential for litigation havesensitized the food and beverage industries to examine the underlying causesof the problem and learn from the tobacco industry experiences (Daynard,2003; Appendix D). Moreover, it provides an opportunity for many typesof industries (e.g., food, beverage, entertainment, recreation) to explorenew marketing opportunities (Datamonitor, 2002). To the extent that con-sumers want to purchase and consume a healthful diet, engage in physicalactivity, and maintain energy balance, private industry not only has a profitincentive but a public relations incentive to help them meet that goal anddemonstrate that industry can be responsive to public concerns.
The committee recognizes that children, youth, and their adult careproviders are immersed in a modern milieu, including a commercial envi-ronment that could be shaped to encourage behaviors relevant to prevent-ing obesity (Peters et al., 2002). Consumers may initially be unsure aboutwhat to eat for good health. They often make immediate trade-offs in taste,cost, and convenience for longer term health (Wansink, 2004). But numer-ous opportunities for influencing consumers’ purchase decisions presentthemselves as the food and beverage industries develop, package, label,promote, distribute, and price products and as retail food stores, full-servicerestaurants, and fast food establishments make similar sets of decisions.Each of these points offers opportunities for influencing consumers’ pur-chase decisions.
Developing healthier food and beverage products or serving smallerportion sizes may be viewed by some private-sector businesses as risksrather than as opportunities; making changes in the absence of broad-basedconsumer demand, whatever the market, conceivably can be seen as a risk
321

A NATIONAL PUBLIC HEALTH PRIORITY 155
to the private sector. But in this case there is ample precedent. A variety offood-industry stakeholders have recently made positive changes by expand-ing healthier meal options for young consumers (Hurley and Liebman,2004; Richwine, 2004), offering improved food products with reducedsugar content for children (PR Newswire, 2004), and reducing portion sizesat full-service and fast food restaurants (Hurley and Liebman, 2004). Thesechanges can and should occur on a much larger scale. For that to happen,coordinated efforts among industry, government, and other sectors areneeded to stimulate, support, and sustain consumer demand for healthfulfoods and beverages, appropriately portioned meals, and accurate and con-sistent nutritional information made readily available to the public.
Similarly, the leisure, entertainment, and recreation industries are facedwith the challenge of maintaining profitability while portraying active liv-ing1 as a desirable social norm for adults and children. These industries,which influence how leisure time is used, can create a wide range of newproducts and opportunities to increase energy expenditure through theincorporation of physical activity messages into sedentary pursuits (e.g.,television commercials, video games and Internet websites that remind orprompt consumers to increase physical activity for a specified amount oftime to balance screen time). This chapter presents a series of recommenda-tions appropriate to the commercial environment in general and to variousindustries in particular.
Food and Beverage Industry
Product Development
The food and beverage industries’ decisions are guided by key factors—including taste, palatability, cost, convenience, value, variety, availability,ethnic preferences, and safety—that drive consumer demand (FMI, 2003a,b;Wansink, 2004). The industry’s decisions are also constrained by otherconditions. For example, product and meal size are significant drivers ofconsumers’ perceived value of the foods and beverages they purchase,whether for consumption at home or elsewhere (FMI, 2003a,b; Stewart etal., 2004; Wansink, 2004).
Similarly, modern retail food stores offer tens of thousands of food andbeverage items from which to choose. While more than 14,000 new foodand beverage products enter the U.S. marketplace annually, less than 6
1Active living is a way of life that integrates two types of physical activity—recreational orleisure activity (e.g., jogging, skateboarding, or playing basketball), and utilitarian or occupa-tional activity (e.g., walking or bicycling to school or running errands)—into one’s dailyroutine.
322
156 PREVENTING CHILDHOOD OBESITY
percent are innovative enough to be successful (Heasman and Mellentin,2001). The majority of these new products fail for a variety of reasonsincluding lack of consumer demand, cost, marketing strategies, or lack ofpositive reinforcement or support from other groups (such as the publichealth sector and health-care professionals) (Heasman and Mellentin, 2001).
But failure in the past, particularly with regard to healthier food andbeverage offerings, does not necessarily mean failure in the future. Thefinancial success of diet carbonated beverages and the greater availability ofreduced-calorie food and beverage products—buttressed in part by the re-duced fat or saturated fat processed food products created by industry inresponse to the Healthy People 2000 objectives (NCHS, 2001)—are ex-amples of how industry could be continually seeking new ways to meetconsumer demand, earn a decent profit, and have its products positivelyaffect public health.
Thus significant profit incentives now exist for industry to developreduced-calorie and low-energy-dense foods, thereby helping consumersachieve their dietary and energy balance goals. Movement in that directionhas already begun; food and beverage industries are currently seeking op-portunities in product development and product reformulation, with anemphasis on eating for health (Datamonitor, 2002; FMI, 2003a). Newproducts are also developed, packaged, and marketed to ethnically diversechildren and youth with attention to cultural taste preferences and attrac-tive packaging (Williams et al., 1993). The committee recommends that asnew products are developed or existing products are modified by the pri-vate sector, it should be imperative that energy balance, energy density,nutrient density, and standard serving sizes are primary considerations inthe process. This can be assisted by government stakeholders providinggeneral support, technical assistance, research expertise, and regulatoryguidance.
Energy Density of Foods
As discussed in Chapter 3, the energy density of a given food is theamount of energy it stores per unit volume or mass. At 9 kilocalories2
stored per gram, fat has the highest energy density. Alcohol stores 7 kilo-calories per gram, carbohydrates and protein both store 4, fiber stores 1.5-2.5, and water stores 0.0—i.e., it does not provide energy. Energy density isa determinant of the effects of foods and macronutrients on satiety (Rolls et
2 In this report the term “kilocalories” is used synonymously with “calories.”
323

A NATIONAL PUBLIC HEALTH PRIORITY 157
al., 2004a), and it may have a significant influence on regulating foodintake and body weight as well (Drewnowski, 2003; Prentice and Jebb,2003).
High-energy-dense foods, such as potato chips and sweets, tend to bepalatable but may not be satiating for consumers, calorie for calorie, therebyencouraging greater food consumption (Drewnowski, 1998; Prentice andJebb, 2003). Humans may have a weak innate ability to recognize foodswith a high energy density to down-regulate the amount of food consumedin order to maintain energy balance, thereby fostering a “passive overcon-sumption” of these types of foods (Prentice and Jebb, 2003). By contrast,low-energy-dense foods, such as fruits and vegetables, contain more fiberand water and less fat than high-energy-dense foods. As a result, theypromote satiety and reduce energy intake but may be considered less palat-able by some individuals (Drewnowski, 1998; Rolls et al., 2004b). Con-sumers typically ingest fewer calories when meals are low in energy densitythan high in energy density (Kral et al., 2002; Rolls et al., 2004b). There isa need for further research on the implications of dietary energy density onthe short-term and long-term physiological regulation of satiety, and therole of energy density in total energy intake and achieving a healthy bodyweight.
An analysis of the 1999-2000 National Health and Nutrition Examina-tion Survey (NHANES) and NHANES III data revealed that three foodgroups—sweets and desserts, soft drinks, and alcoholic beverages—com-prised nearly 25 percent of all calories consumed by Americans between1988 and 2000. Salty snacks and fruit-flavored beverages accounted foranother 5 percent, bringing the total calories contributed by high-energy-dense/low-nutrient-dense foods to be at least 30 percent of Americans’ totalcalorie intake during that period (Block, 2004). Nutrient composition dataavailable from fast food company websites suggest that average menus aretwice the energy density of recommended healthful diets (Prentice and Jebb,2003).
Developing low-energy-dense but palatable food products, which willhelp consumers achieve and maintain energy balance by reducing the prob-ability of excessive energy consumption, has been a significant challenge forthe food industry (Drewnowski, 1998). While acknowledging this chal-lenge, the committee emphasizes the need to identify specific incentives thatwill help the industry develop such new products. In the meantime, manu-facturers can modify existing products—for example, by replacing fat withprotein, fruit or vegetable purée, fiber, water, or even air—to reduce energydensity but maintain palatability without substantially reducing the prod-uct size or volume.
324

158 PREVENTING CHILDHOOD OBESITY
Product Packaging and Portion Sizes
Packaging is the “interface” between food-industry products and theconsumer—that is, it is the public’s first point of contact—and food pack-ages implicitly suggest portion sizes or food combinations (e.g., which foodsare eaten together such as peanut butter and jelly). But a product packagecan be modified in three general ways—by size, visual appeal, and the typeand amount of information it provides (such as the nutritional contentaccording to the Nutrition Facts panel on food labels)—in order to assistconsumers in making knowledgeable purchasing decisions and determiningportion sizes for themselves.
Because energy requirements vary both by age and body size (IOM,2002), parents need to be aware of the appropriate amount of food thatwill help meet but not exceed their child’s own energy needs. In order to doso at present, however, they must overcome an established and unhealthytrend; research has revealed a progressive increase in portion sizes of manytypes of foods and beverages made available to Americans from 1977 to1998 (Nielsen and Popkin, 2003; Smiciklas-Wright et al., 2003), the sameperiod during which a rise in obesity prevalence has been observed (Nestle,2003b; Rolls, 2003).
Some research on the effects of food portion size has shown that chil-dren 3 years old and younger seem to be relatively unresponsive to the sizeof the portions of food that they are served (Rolls et al., 2000; see alsoChapter 8). By contrast, the food intake of older children and adults isstrongly influenced by portion size, with larger portions often promotingexcess energy intake (McConahy et al., 2002; Rolls et al., 2002; OrletFisher et al., 2003). Children 3 to 5 years of age consumed more of anentrée and 15 percent more total energy at lunch when presented withportion sizes that were double an age-appropriate standard size (OrletFisher et al., 2003). Portions that are currently served and consumed athome, and particularly away from home, may be several times the USDA-recommended serving size or recommended caloric level3 (Orlet Fisher etal., 2003). In addition to food portion size, the frequency of eating and thetypes of foods consumed are important predictors of energy intake as chil-dren transition from being toddlers to preschoolers. One study that evalu-ated the relationship of food intake behaviors to total energy intake among
3A serving size is a standardized unit of measure used to describe the total amount of foodsrecommended daily from each of the food groups from the Food Guide Pyramid (FGP) or aspecific amount of food that contains the quantity of nutrients listed on the Nutrition Factspanel. A portion size is the amount of food an individual is served at home or away fromhome and chooses to consume for a meal or snack. Portions can be larger or smaller thanserving sizes listed on the food label or the FGP (USDA, 1999).
325

A NATIONAL PUBLIC HEALTH PRIORITY 159
children aged 2 to 5 years who participated in the Continuing Survey ofFood Intakes by Individuals (CSFII) 1994-1996, 1998 found that eatingbehaviors and body weight were positively related to energy intake(McConahy et al., 2004).
Research also suggests that individuals tend to overconsume high-energy-dense foods beyond physiological satiety (Kral et al., 2004), espe-cially when they are unaware that the portion sizes served to them havebeen substantially increased (Rolls et al., 2004a). Satiety signals are nottriggered as effectively with high-energy-dense foods (Drewnowski, 1998),and large portions of them consumed on a regular basis are particularlyproblematic for achieving energy balance and weight management in olderchildren and adults.
A variety of physiological processes are involved in the regulation ofdietary intake, satiety, energy metabolism, and weight. These include theneural pathways that regulate hunger and influence food intake, gastrointes-tinal mechanisms involved in providing signals to the brain about ingestedfood, and adipocyte-derived factors that provide information about energystores, as well as the genetic and environmental factors that affect thesephysiological processes (see Chapters 3 and 8). There are a variety of exter-nal cues that may also influence dietary intake such as portion size andpackage size. For example, there is some evidence to support the hypothesisthat larger food package sizes encourage greater consumption than smallerfood package sizes (Wansink, 1996), and external cues such as packagingand container size may contribute to the volume of food consumed(Wansink and Park, 2000).
Thus, although the committee recognizes the difficulties faced by thefood industry in developing new packaging options for consumers, industryshould explore, through research and test-marketing, the best approachesfor modifying product packages—multipackages with smaller individualservings or standard serving sizes, or resealable packages—so that productspalatable to consumers may remain profitable while promoting consump-tion of smaller portions. Moreover, the food industry should investigateother approaches for promoting consumption of smaller portion sizes andstandard serving sizes.
Leisure, Entertainment, and Recreation Industries
Americans now enjoy more leisure time than they did a few decadesago. As discussed in Chapter 1, trend data collected by the Americans’ Useof Time Study through time use diaries indicated that adults’ free timeincreased by 14 percent between 1965 and 1985 to an average total ofnearly 40 hours per week (Robinson and Godbey, 1999). Data from otherpopulation-based surveys, including the National Health Interview Survey,
326

160 PREVENTING CHILDHOOD OBESITY
NHANES, Behavior Risk Factor Surveillance System (BRFSS), and the Fam-ily Interaction, Social Capital and Trends in Time Use Data (1998-1999),together with trend data on sports and recreational participation, suggest asignificant increase in reported leisure-time physical activity in adults (Prattet al., 1999; French et al., 2001a; Sturm, 2004).
Cross-sectional data from the National Human Activity Pattern Sur-vey, based on the responses of 7,515 adults between 1992 and 1994,assessed time use and daily energy expenditure patterns of adults. Resultssuggested that sedentary and low-intensity activities dominated whileleisure-time, high-intensity activities accounted for less than 3 percent ofenergy expenditure (Dong et al., 2004).
Americans are presented with trade-offs in how they allocate their timeand money. Understanding how Americans in general, and children andyouth in particular, use their leisure time will help to determine ways ofpromoting more physical activity into their lives. An analysis of time alloca-tion and expenditure patterns for U.S. adults over the past several decadessuggests that they are spending more time in leisure and travel or transpor-tation and less time in productive home activities (e.g., meal preparationand cleanup) and occupational activities (Sturm, 2004). Leisure-timeindustries have exceeded gross domestic product growth for both activeindustries (e.g., bicycles, sporting goods, membership sports clubs) andsedentary industries (television, spectator sports). However, there has beena steeper growth in sedentary industries from 1987 to 2001—especially thegrowth of cable television and spectator sports (Sturm, 2004).
Trend data for children (spanning from 1981 to 1997) have shown thatthey now have less discretionary or free time—defined as time not spenteating, sleeping, attending to personal care, or at school—than they used tobecause more of their time is spent away from home in school, after-schoolprograms, or daycare. There is also a noted increase in the amount of timechildren spend in organized sports (Hofferth and Sandberg, 2001; Sturm,2005a), but active transportation (e.g., bicycling or walking) is not a signifi-cant source of physical activity for children and youth (Sturm, 2005b).
Modern technologies such as labor-saving home appliances have re-duced the energy expended for home meal preparation and the amount oftime needed to achieve the same task (Sturm, 2004). Other technologicalinnovations such as home entertainment devices (including cable television,computers, video games) and automobiles have contributed to sedentarybehaviors among Americans, causing them to expend less energy. Thisphenomenon of increased time spent in passive sedentary pursuits relativeto active leisure activities has been associated with the rise in obesity (Frenchet al., 2001a; Philipson and Posner, 2003). However, although the averageAmerican adult spends more than 20 hours per week watching television,videos, or digital video discs (DVDs), it is notable that the largest increase
327

A NATIONAL PUBLIC HEALTH PRIORITY 161
in television watching occurred prior to 1980, which preceded the obesityepidemic (Sturm, 2004). The leisure, entertainment, and recreation indus-tries can help counter the physical inactivity trend by promoting activeleisure-time pursuits, while at the same time developing new products andmarkets. The introduction of products that involve more physical activityby some industry leaders suggests that some already believe they can createa significant market for these types of products.
Some companies have used popular athletic figures, who are potentialrole models for active and healthful lifestyles, to promote sedentarylifestyles. Instead, the industries could leverage their existing relationshipswith celebrities to convey messages that encourage physical activity andhealthful living and reduce sedentary behaviors.
Some potentially positive efforts are now under way. One athletic ap-parel manufacturer provides funding to build, upgrade, or refurbish sportscourts and other athletic facilities throughout the United States; awardsgrants to nonprofit organizations and governmental partners; supportsphysical education classes in elementary schools; and is a partner in Shap-ing America’s Youth, a national cross-sectoral initiative for promotingphysical activity and healthful lifestyles during childhood (Nike, 2004).Activity-based games offer opportunities for the leisure industry to marketa product that promotes physical activity in children and youth. The evalu-ation of private-sector programs is crucial in order to assess if they areeffective in increasing physical activity, especially among high-risk popula-tions, and determine if they may have unanticipated and adverse conse-quences.
Full-Service and Fast Food Restaurant Industry
Increased consumption of food outside of the home has been one of themost marked changes in the American diet over the past several decades. In1970, household income allotted to away-from-home foods accounted for25 percent of total food spending; by 1999, it had reached nearly one-half(47 percent) of total food spending (Lin et al., 1999c). Total consumerspending on food dispensed for immediate consumption outside the homeamounted to $415 billion in 2002 (Stewart et al., 2004). Similarly, a greaterproportion of consumers’ nutrients is now derived from foods purchasedoutside the home.
Consumption of away-from-home foods comprised 20 percent ofchildren’s total calorie intake in 1977, rising to 32 percent in 1994-1996(Lin et al., 1999b). For adults, such foods provided more than one-third (34percent) of total calories in 1995 (Lin et al., 1999a).
The frequency of dining out rose by more than two-thirds over the pasttwo decades, from 16 percent in 1977-1978 to 27 percent in 1995 (Lin et
328

162 PREVENTING CHILDHOOD OBESITY
al., 1999a). Restaurant industry sales for commercial and noncommercialservices were projected to exceed $426 billion in 2003 (National Restau-rant Association, 2003) and are forecasted to reach $440 billion in 2004(National Restaurant Association, 2004). Moreover, consumer spending atrestaurants is projected to continue growing over the next decade (Stewartet al., 2004). Full-service and fast food restaurants alike have been enjoyingthis boom—in 2003, full-service restaurant sales reached $153.2 billionand fast food restaurant sales reached nearly $121 billion (National Res-taurant Association, 2003)—and it appears likely to continue. Assumingmodest growth in household income and demographic changes, consumerper-capita spending between 2000 and 2020 is expected to rise by 18percent at full-service restaurants and by 6 percent at fast food outlets(Stewart et al., 2004).
Given the growing public concern about the rise in obesity, particularlychildhood obesity, full service and fast food restaurants throughout thecountry have begun offering healthier food options. At present, however,most restaurants do not provide consumers with the calorie and selectednutrient content either of offered meals or individual food and beverageitems4; this information would be useful for making more prudent menudecisions. While the culinary qualities of fast food meals tend to differ fromthose of full-service restaurants (Lin et al., 1999a), both of them are typi-cally energy dense and served in large portions.
Fast food consumption is associated with a diet that is high in totalenergy and energy density but low in micronutrient density. For example,an analysis of the CSFII 1994-1996 data for adult men and women revealedthat a typical fast food meal provided more than one-third of their dailyenergy, total fat, and saturated fat intake; and that energy density increasedwhile micronutrient density concurrently decreased with frequency of fastfood consumption (Bowman and Vinyard, 2004).
Published data are limited that compare the nutrient content of full-service restaurant meals for children. However, one review of the entreesoffered to children at 20 table-service restaurants found fried chicken onevery one of the children’s menus, a hamburger or cheeseburger on 85percent of the menus, and french fries on all but one of the menus (Hurleyand Liebman, 2004). At nearly one-half of the restaurant chains, frenchfries were the only side dish on the children’s menus, and while childrencould generally choose a beverage from among soft drinks, juice, or milk,
4Under the Nutrition Labeling and Education Act of 1990, food products exempted fromcalorie and nutrient labeling include foods served for immediate consumption, ready-to-eatfood not for immediate consumption (i.e., take-out foods), and foods produced by smallbusinesses with annual sales below $500,000 (IOM, 2004).
329

A NATIONAL PUBLIC HEALTH PRIORITY 163
10 of the restaurants offered free refills only for soft drinks (Hurley andLiebman, 2004).
Children and youth aged 11 to 18 years visit fast food outlets anaverage of twice per week (Paeratakul et al., 2003), and this frequency isassociated with increased intake of soft drinks, pizza, french fries, total fat,and total calories, as well as with reduced intake of vegetables, fruit, andmilk (French et al., 2001b). In a study of 6,212 children and adolescentsbetween the ages of 4 and 19 years of age participating in the CSFII, thosewho ate fast food consumed more total energy, more energy per gram offood (greater energy density), more total fat and carbohydrates, more addedsugars, more sweetened beverages, less milk, and fewer fruits and non-starchy vegetables than those who did not consume fast food (Bowman etal., 2004). Adolescents aged 13 to 17 years were found to consume morefast food regardless of whether they were lean or obese. Moreover, obeseadolescents were less likely to compensate for the extra energy consumedby adjusting their energy throughout the day than were their lean counter-parts (Ebbeling et al., 2004).
Expanding Healthier Meals and Food Choices
Given these trends and data, full-service and fast food restaurantsshould continue to expand their healthier meal options and food choices—particularly for children and youth—through the inclusion of fruits, veg-etables, low-fat milk, and calorie-free beverages among their offerings. It isalso important for restaurants to expand options for healthier children’smeals, encourage parents to help their children make smarter eating choices,and remind parents of their rights as customers to substitute side dishes andcustomize meals to their satisfaction. Research is needed to monitor con-sumers’ and children’s responses to these expanded options.
Restaurants should also initiate a voluntary, point-of-sale, nutrition-information campaign for consumers. Meanwhile, in accordance with therecommendations of the Food and Drug Administration (FDA) ObesityWorking Group’s recommendations (FDA, 2004), consumers at restau-rants should be encouraged to request information about the nutritionalcontent of complete meals, foods, and beverages offered and consequentlybe provided with accurate, standardized, and understandable details at thepoint of sale. This nutritional information should include total calories, fat,cholesterol, and fiber, together with instruction on meaningfully interpret-ing these values within the context of typical consumers’ total energy anddietary needs.
Nutrition labeling of restaurant meals and individual foods should takevarying sizes or options into account and should be located near the price ofthe selections; this will ensure that the consumer is made aware of the
330

164 PREVENTING CHILDHOOD OBESITY
information and that increased demand for healthful items and appropriateportions is made more likely. Moreover, the restaurant industry shouldexplore price incentives that encourage consumers to order smaller mealportions. Research initiatives are needed to identify the most effective typesof information formats on menus for encouraging the selection of healthfuloptions (Stubenitsky et al., 1999).
As these suggested actions are costly endeavors, consideration must begiven to the practicality of implementing these actions in cost-effectiveways, especially in expensive restaurants where there is great variability inmeals requested by patrons, and small or individual restaurants with lim-ited food volume sales. It is also unclear who will be expected to pay for thenutrient analyses as well as the menu labeling itself. One option would be toencourage local public health departments to contract with dietitians inconducting nutrition education for the public and analyzing the nutrientcontent of menus. This would represent a new role for local government,but it could be developed by adapting current food safety and sanitationinspection services. It could also generate fees, so that the activity would beself-supporting and sustainable in the long-term; and it could be a conve-nient way to give public recognition to restaurants in compliance.
Providing Nutrition Education at Restaurants
In addition to voluntary point-of-service menu labeling, the committeerecognizes that parents currently have limited nutrition information to relyon in order to select portion sizes and foods that are appropriate for theirchild. Thus, the committee encourages the restaurant industry to providenutrition education that is consistent with the Dietary Guidelines for Ameri-cans and the FGP in order to inform parents and older youth about appro-priate energy intake for meals intended for children and adolescents ofdifferent ages.
The Dietary Guidelines for Americans is a federal summary, issuedjointly by DHHS and USDA every 5 years, that provides sound guidance tothe public about food choices based on the current scientific evidence. Thefirst edition was released in 1980 and provided seven guidelines. The fifthedition was released in 2000 and provided 10 guidelines clustered into threecategories: aim for a healthy weight, build a healthy base, and choosesensibly (Ballard-Barbash, 2001).
The FGP was released in 1992 by USDA to teach consumers how to putthe Dietary Guidelines for Americans into action. The FGP serves as theofficial food guide for the United States (USDA, 1992; Achterberg et al.,1994). The FGP illustrates the concepts of variety, proportionality, andmoderation emphasized in the Dietary Guidelines for Americans(Achterberg et al., 1994; Dixon et al., 2001). In 1999, USDA developed an
331

A NATIONAL PUBLIC HEALTH PRIORITY 165
FGP for Young Children, based on the actual eating patterns of childrenaged 2 to 6 years, which aims to simplify educational messages and focuson young children’s food preferences and nutritional requirements (USDA,2003b; ADA, 2004).
These FGPs offer recommended daily serving sizes for each of the foodgroups, including bread, cereal, rice, and pasta; fruits; vegetables; milk,yogurt, and cheese; meat, beans, eggs, and nuts; and fats, oils, and sweets.Considerations used in determining serving sizes are the amount of a foodthat provides key nutrients, ease of use, and commonly recognized house-hold measures of food and equivalents (USDA, 1999, 2000).
Unfortunately, despite the availability of the FGP and its adapted ver-sion specifically for younger children, most American children do not meetthe recommended servings for fruit, dairy, and grain groups; and they donot meet the Dietary Guidelines’ recommendations for total and saturatedfat (ADA, 2004) (see Chapter 3).
The committee acknowledges that parents may have a difficult timeunderstanding how portion sizes should be distributed for their childrenacross an entire day, particularly when they are making selections at full-service and fast food restaurants. Another confounding factor is thatyounger children tend to eat smaller portions, compared to standardizedserving sizes, more frequently throughout the day (McConahy et al., 2004).The current educational tools do not provide guidance pertinent to theseconsiderations. The committee therefore encourages enhancing or adaptingthe existing FGP model,5 or developing a new food-guidance system andrelevant educational materials, that will convey how portions should bedistributed throughout the day for children of different age groups. (Forexample, if a child is in a particular age group, he or she should eat a certainproportion of energy at each meal—for example, 20 percent at breakfast,30 percent at lunch, 30 percent at dinner, and 20 percent for snacks, andthe appropriate temporal distribution of snacks should account for theduration of fasting overnight and for variations in daytime energy demandsdue to age and activity.)
Because such an enhancement could be used by parents to determine asingle restaurant meal’s percentage of their child’s daily required total en-ergy intake, encouraging restaurants to adopt this educational tool maypromote children’s consumption of smaller food portions. Additionally, thefull-service and fast food restaurant industries should provide general nutri-
5An example of an adapted FGP is the Radiant Pyramid, a daily food guide based on theconcept of nutrient density. The most nutrient-dense food choices, at the bottom of thepyramid, should be consumed in appropriate serving sizes frequently, whereas the most en-ergy-dense food choices at the (much smaller) top of the pyramid should be consumed onlyoccasionally (Porter Novelli, 2003).
332

166 PREVENTING CHILDHOOD OBESITY
tion information that will facilitate consumers’ informed decisions aboutfood and meal selections and appropriate portion sizes (consistent with theenergy balance principles of the Dietary Guidelines for Americans andillustrated by the FGP). Finally, consumer research is needed to identify themost effective types of information formats on menus for encouraging theselection of healthful options.
Recommendation 2: IndustryIndustry should make obesity prevention in children and youth a prior-ity by developing and promoting products, opportunities, and informa-tion that will encourage healthful eating behaviors and regular physicalactivity.
To implement this recommendation:
• Food and beverage industries should develop product and pack-aging innovations that consider energy density, nutrient density, andstandard serving sizes to help consumers make healthful choices.
• Leisure, entertainment, and recreation industries should de-velop products and opportunities that promote regular physical ac-tivity and reduce sedentary behaviors.
• Full-service and fast food restaurants should expand healthierfood options and provide calorie content and general nutrition in-formation at point of purchase.
NUTRITION LABELING
The purpose of nutrition labeling is to provide consumers with usefulinformation that will allow them to compare products and make informedfood choices, thereby enhancing the likelihood of maintaining dietary prac-tices and reducing the risk of chronic disease (IOM, 2004). In particular,the implementation of the regulations resulting from the 1990 NutritionLabeling and Education Act (NLEA) was to be communicated in such away that the public could “readily observe and comprehend such informa-tion and understand its relative significance in the context of a total dailydiet” (FDA, 1993). The Nutrition Facts panel and nutrient and healthclaims that resulted from the NLEA are complementary approaches forproviding guidance to consumers. They are discussed in turn below.
Nutrition Facts Panel
In 1993, the percent Daily Value (% DV) was added to the NutritionFacts panel—a set of consistently formatted information items that are
333

A NATIONAL PUBLIC HEALTH PRIORITY 167
displayed on food product labels—to assist consumers in rapidly and effi-ciently understanding how various foods could fit into the context of ahealthful diet. The Nutrition Facts panel’s contents, regulated by the FDA,are specific to the food product or food-product category; they specify thenumber of servings per container and the key nutrients in a serving, accord-ing to the % DV for a 2,000-calorie-per-day diet (USDA, 2000; IOM,2004). Serving sizes on the label are standardized so that consumers cancompare nutritional information between products, even for packaged foods(such as frozen pizza) that contain ingredients from multiple food groups(USDA, 2000).
Data on consumers’ actual use of the Nutrition Facts panel are limitedsince it was mandated by FDA in 1990. However, consumer research con-ducted by the FDA and the Food Marketing Institute (FMI) has found thatone-half of U.S. adult consumers use food labels when purchasing a fooditem for the first time (FMI, 1993, 2001; Derby, 2002). The most commonreason for using the label is to assess whether a product is high or low in aparticular nutrient, especially fat, and the second most common use is todetermine total calories (IOM, 2004).
Moreover, consumers often use the Nutrition Facts panel and the %DV to confirm a nutrient or health claim on the front of a product and tomake product-specific judgments (Geiger et al., 1991; FDA, 1995). Con-sumer research indicates that the % DV in particular has been effective inhelping consumers make judgments about different food products that arehigh or low in a particular nutrient and to put different food products in thecontext of a daily diet (IOM, 2004). Research shows that without the %DV, consumers could not accurately interpret metric values and distinguishbetween products (IOM, 2004).
Consumers generally report using the nutrition label more often toavoid rather than to purchase a specific food item (FMI, 1997). Researchsuggests that although food labels may influence some consumers undercertain circumstances, particularly women, older consumers, and well-educated consumers (Kristal et al., 2001), many do not use the NutritionFacts panel at all. This is attributed in part to lack of interest, lack ofknowledge for using it appropriately, and difficulty of use (IOM, 2004).But even when consumers do have and understand the information, it maynot change their behavior if their food purchases are primarily motivatedby factors such as palatability, price, and convenience (Wansink, 2004).
The committee supports the FDA’s current actions in exploring howbest to revise the Nutrition Facts panel to prominently display products’standardized calorie serving and % DV (FDA, 2004). The committee en-dorses this as a step to assist consumers in making informed decisions toachieve energy balance. Energy requirements of children and adolescentsdiffer by age, gender, and activity level. These differences are reflected in
334

168 PREVENTING CHILDHOOD OBESITY
the Estimated Energy Requirements established in the Institute of Medicine’s(IOM) report on Dietary Reference Intake values for macronutrients (IOM,2002). However, the committee did not see a practical way in which theNutrition Facts panel could incorporate all the % DV figures that wouldcorrespond to the energy needs of children at different ages (IOM, 2002;USDA, 2003a). Therefore, a recommendation to develop a specific % DVfor children and youth based on age, gender, and three activity levels iscurrently not feasible.
FDA should establish mandatory guidelines for the display of totalcalorie content on the Nutrition Facts panel regarding products such asvending-machine items, single-serving snack foods, and ready-to-eat foodspurchased at convenience stores—typically consumed in their entirety onone eating occasion. Although many prepackaged, ready-to-eat foods areprovided in package sizes that may typically be consumed all at once, thenutrition label offers information only on one serving, as defined by theFDA standard serving size.
Thus, although the number of servings per package is also given, thepurchaser must calculate the nutritional content of a multiple-serving por-tion that may be consumed at one sitting. For example, soft drinks are oftensold in 20-ounce containers and are labeled as containing 2.5 servings.Because many consumers undoubtedly consume the entire 20 ounces andnot precisely 8 ounces (one serving), which represents only 40 percent ofthe entire product, it would be easier for them to know the total nutritionalvalue if this information was provided directly on the label.
Finally, the Nutrition Facts panel may be modified in other ways toenhance readability and consumer understanding (Kristal et al., 2001).Consideration should be given to the selection, organization, and display ofnutrients to maximize the positive message and educational benefit con-veyed by the label in order to assist consumers in making wise choiceswithin a healthful diet while also serving to remind them to limit caloriesand other nutrients (e.g., cholesterol, fat) and thereby reduce their risk ofchronic diseases related to obesity (IOM, 2004). In summary, the FDA,relevant industries, and other groups should conduct consumer research onthe use of the nutrition label, on restaurant menu labeling, and on how toenhance or adapt the FGP or develop a new food-guidance system.
Nutrient Claims and Health Claims
A nutrient claim is a food-package statement consistent with FDAguidelines that characterizes the level of a nutrient in a food. Depending onthe claim, the level is usually categorized as “free,” “high,” or “low.” Witha few exceptions, a nutrient-content claim may be made by manufacturersonly if a DV has been identified for that nutrient and the FDA has estab-lished, by regulation, the criteria that a food must meet in order to list the
335

A NATIONAL PUBLIC HEALTH PRIORITY 169
claim (IOM, 2004). An estimated 33.7 percent of products sold in 2000-2001 had nutrient content claims related to energy, total fat, saturated fat,cholesterol, dietary fiber, sodium, or sugars (Legault et al., 2004).
A health claim6 on a product package states that a scientifically dem-onstrated relationship exists between a food substance, legally defined as aspecific food or food component, and a disease or health-related condition(IOM, 2004). Health claims (as well as nutrient claims) must be authorizedby the FDA prior to their use in food labeling; the agency carefully assesseswording so that the claimed health-related relationship does not implycausation (IOM, 2004).
The FDA has approved 14 different health claims that may be used onfood packages that emphasize both risks and benefits such as the relation-ship between heart disease and saturated fat; cancer and fruits and veg-etables; and coronary heart disease risk and fruits, vegetables, grains, andsoluble fiber (IOM, 2004). Approximately 4.4 percent of products sold in2000-2001 had a health claim on their food package. The product groupswith the highest percentage of health claims were hot cereal, refrigeratedand frozen beverages, seafood, snacks (granola bars and trail mixes), eggsand egg substitutes, and meat and meat substitutes (Legault et al., 2004).These products provided a claim about the relationship between a diet lowin saturated fat and cholesterol and a reduced risk of heart disease; high insoluble fiber and reduced risk of heart disease; and high in soy protein andreduced risk of heart disease (Legault et al., 2004).
Health claims advertising and labeling is product-specific so that theinformation imparted not only suggests a relationship between the foodcharacteristics and health but also features a product that contains thesecharacteristics (Mathios and Ippolito, 1999). Health claims, in conjunctionwith the Nutrition Facts panel, can help consumers make product-specificdecisions and more informed food and beverage choices in the marketplace(Ippolito and Pappalardo, 2002).
The question has been raised as to whether the policy changes thatoccurred in the mid-1980s, which allowed food manufacturers to explicitlylink diet to disease risks in advertising and labeling, assisted or confusedconsumers in making more healthful food choices to improve their diet(Mathios and Ippolito, 1999). An analysis that examined market share datain the ready-to-eat cereal market, consumer knowledge data, individualnutrient intake data, and per capita consumption data found that U.S.consumers’ diets improved from 1985 to 1990 during the same time periodthat producers were permitted to use health claims in advertising and label-
6A “qualified” health claim uses appropriate qualifying language to describe the level ofscientific evidence that the claim is truthful. The FDA offers guidance, including a method forsystematically evaluating the evidence, on the review process for developing qualified healthclaims (IOM, 2004).
336

170 PREVENTING CHILDHOOD OBESITY
ing (Mathios and Ippolito, 1999), although it is not possible to determinethe role that health claims played in these positive outcomes. Evidence fromthe ready-to-eat cereal market indicates that allowing producers to usehealth claims resulted in more healthful product innovations and motivatedcompetition based on healthful products (Mathios and Ippolito, 1999).
Thus, health claims may serve to stimulate industry to develop newproducts, or modify existing ones, that encourage positive changes in con-sumers’ eating habits. Food and beverage companies would benefit frombeing able to use simple and easily understood health claims in order tostimulate increased consumer selection of healthier food products, includ-ing their own.
New health claims may be added to products through a process wherebya food manufacturer notifies the FDA of its intent to use a health claimbased on scientifically accurate and authoritative findings. No health claimscurrently exist for products that explicitly address preventing obesity. How-ever, it will be essential to develop a standard nutrient claim or health claimdefinition for energy density and nutrient density. For example, by develop-ing a health claim for food products that have an energy density below 1calorie per gram, such foods might be considered supportive of maintaininga healthy body weight. However, this type of health claim could not applyto beverages.7 A disclosure statement may be needed to accompany a healthclaim if consumer research reveals that a health claim on a food label wouldimply that a food is healthful in all respects (e.g., it has a low energy densitybut may not be nutrient dense) if this is not the case.
The regulatory environment in the early 1980s discouraged food andbeverage manufacturers and advertisers from using health claims, but thispolicy was eased in 1993 when the FDA’s health claim rules were revised(Ippolito and Pappalardo, 2002). The FTC has recently encouraged theFDA to consider giving manufacturers greater flexibility in making truthful,nonmisleading nutrient claims for foods,8 allowing comparative claims9
7As discussed in Chapter 3 and Appendix B, beverages (such as soft drinks and fruitdrinks), due to their high water content, are generally not energy dense. However, the energydensity of soft drinks is disproportionately high for its nutrient content when compared toother nutrient-dense beverages such as low-fat milk. Therefore, comparisons of beveragesshould involve considerations of nutrient density.
8A nutrient content claim is an FDA-regulated statement on food packages that character-izes the level of a nutrient in a food such as “free,” “high,” “low,” “more,” and “reduced”.The NLEA (1990) allows the use of nutrient-content claims that describe the amount of anutrient according to the FDA’s authorizing regulations (IOM, 2004).
9Comparative claims are a subset of nutrient content claims. Under NLEA rules, compara-tive claims are required to meet a number of specific restrictions and disclose the comparisonproduct, the percentage that a nutrient is reduced, and the actual amount of the nutrient forboth the product and the comparison food (Ippolito and Pappalardo, 2002).
337

A NATIONAL PUBLIC HEALTH PRIORITY 171
between different types and portion sizes of food, and permitting healthclaims that specifically relate reduced calorie consumption to decreasing therisk of obesity-related diseases (FTC, 2003).
The committee encourages the FDA to examine ways to give the foodand beverage industries greater flexibility in making nutrient content andhealth claims that help consumers including children achieve and maintainenergy balance. The committee also recommends that consumer research beundertaken to determine the best formats for health claims that relatelowered calorie consumption with reductions in the risk of obesity andobesity-related disease. Finally, the committee suggests that the govern-ment, academia, and private sector work together to conduct the necessaryresearch on which to base such health claims.
Recommendation 3: Nutrition LabelingNutrition labeling should be clear and useful so that parents and youthcan make informed product comparisons and decisions to achieve andmaintain energy balance at a healthy weight.
To implement this recommendation:
• The FDA should revise the Nutrition Facts panel to promi-nently display the total calorie content for items typically consumedat one eating occasion in addition to the standardized calorie servingand the percent Daily Value.
• The FDA should examine ways to allow greater flexibility inthe use of evidence-based nutrient and health claims regarding thelink between the nutritional properties or biological effects of foodsand a reduced risk of obesity and related chronic diseases.
• Consumer research should be conducted to maximize use ofthe nutrition label and other food-guidance systems.
ADVERTISING, MARKETING, AND MEDIA
Children of all ages are spending a larger proportion of their leisuretime using a combination of various forms of media, including broadcasttelevision, cable networks, DVDs, video games, computers, the Internet,and cell phones (Roberts et al., 1999; Rideout et al., 2003). This trend hasprompted concerns about the effects of these activities on their health (Kai-ser Family Foundation, 2004). Children’s exposure to advertising and mar-keting, particularly to the food, beverage, and sedentary-lifestyle messagesdelivered through the numerous media channels, may have a strong influ-ence on their tendency toward increased obesity and chronic disease risk(Kaiser Family Foundation, 2004).
338

172 PREVENTING CHILDHOOD OBESITY
Advertising and promotion have long been intrinsic to the marketing ofthe American food supply (Gallo, 1999). Food and beverage companies andthe restaurant industry together represent the second-largest advertisinggroup in the American economy, after the automotive industry (Gallo,1999), and young people are a major target. The annual sales of foods andbeverages to young consumers exceeded $27 billion in 2002 (U.S. Marketfor Kids Foods and Beverages, 2003), and millions of dollars are spentannually by the food and beverage industry for specific product brands(Story and French, 2004). Food and beverage advertisers collectively spend$10 billion to $12 billion annually to reach children and youth (Nestle,2003a; Brownell, 2004). Estimates are available for different categories ofyouth-focused marketing in the United States—more than $1 billion isspent on media advertising to children, primarily on television; more than$4.5 billion is spent on youth-targeted promotions such as premiums, cou-pons, sweepstakes, and contests; $2 billion is spent on youth-targeted pub-lic relations; and $3 billion is spent on packaging designed for children(McNeal, 1999).
Similarly, young people are major consumers of the products and ser-vices of the entertainment, leisure, and recreation industries. An accuratefigure for children’s and adolescents’ comprehensive media and entertain-ment use is not readily available, though market research suggests there isgreat potential for the growth of this market; children are being raised in atechnology-oriented culture that exposes them to modern media conve-niences as noted above (Rideout et al., 2003; U.S. Kids Lifestyles MarketResearch, 2003). For example, it was projected that $4.2 billion would bespent on children’s videos in 2001 (Children’s Video Market, 1997) and ona typical day, children aged 4 to 6 years used computers (27 percent) andvideo games (16 percent) (Rideout et al., 2003).
The quantity and nature of advertisements to which children are ex-posed to daily, reinforced through multiple media channels, appear to con-tribute to food, beverage, and sedentary-pursuit choices that can adverselyaffect energy balance. It is estimated that the average child currently viewsmore than 40,000 commercials on television each year, a sharp increasefrom 20,000 commercials in the 1970s (Kunkel, 2001). Studies of children’sadvertising content during that roughly 20-year period found that morethan 80 percent of all advertising to children fell into four product catego-ries: toys, cereal, candy, and fast food restaurants (Kunkel, 2001). More-over, an accumulated body of research reveals that more than 50 percent oftelevision advertisements directed at children promote foods and beveragessuch as candy, fast food, snack foods, soft drinks, and sweetened breakfastcereals that are high in calories and fat, low in fiber, and low in nutrientdensity (Kotz and Story, 1994; Gamble and Cotunga, 1999; Horgen et al.,2001; Hastings et al., 2003).
339

A NATIONAL PUBLIC HEALTH PRIORITY 173
Dietary and other choices influenced by exposure to these advertise-ments may likely contribute to energy imbalance and weight gain, resultingin obesity (Kaiser Family Foundation, 2004). Based on children’s commer-cial recall and product preferences, it is evident that advertising achieves itsintended effects (Kunkel, 2001; CSPI, 2003; Hastings et al., 2003; Wilcoxet al., 2004), and an extensive systematic literature review concludes thatfood advertisements promote food purchase requests by children to par-ents, have an impact on children’s product and brand preferences, andaffect consumption behavior (Hastings et al., 2003). Indeed, the 2003 RoperYouth Report10 suggests that an increased number of children aged 8 to 17years are playing central roles in household purchasing decisions related tofood, media, and entertainment (Roper ASW, 2003).
Industry has come to view children and adolescents as an importantmarket force, given their spending power, purchase influence, and potentialas future adult consumers (McNeal, 1998). Market research from the early1990s suggests that children’s purchase influence rises with age from $15billion per year for 3- to 5-year-olds to $90 billion per year for 15- to 17-year-olds (Stipp, 1993). Marketers use a variety of techniques, styles, andchannels to reach children and youth, including sales promotions, celebrityor cartoon-character endorsements, product placements, and the co-mar-keting of brands (Horgen et al., 2001; CSPI, 2003; Hastings et al., 2003;Wilcox et al., 2004).
Research suggests that long-term exposure to such advertisements mayhave adverse impacts due to a cumulative effect on children’s eating andexercise habits (Horgen et al., 2001; CSPI, 2003; Hastings et al., 2003;Wilcox et al., 2004). Children learn behaviors and have their value systemsshaped by the media (Villani, 2001). Just as portrayals in television and filmshape viewers’ perceptions of certain health-related behaviors, such as smok-ing cigarettes or drinking alcohol, the messages about consuming certainfoods and beverages and engaging in sedentary activities may affect them aswell (Hastings et al., 2003; Kaiser Family Foundation, 2004).
A recent report issued by the American Psychological Association (APA)Task Force on Advertising and Children concluded that young children(under the age of 8) are uniquely vulnerable to commercial promotionbecause they lack the cognitive skills to comprehend its persuasive intent;that is, they do not understand the difference between information and
10The 2003 Roper Youth Report, based on a nationwide cross-sectional cohort of 544children aged 8 to 17 years, was conducted by Roper ASW, a market-research firm. Face-to-face interviews were conducted in children’s homes in 2003 (Roper ASW, 2003).
340

174 PREVENTING CHILDHOOD OBESITY
advertising (Wilcox et al., 2004). This finding is consistent with the policystatement of the American Academy of Pediatrics that “advertising directedtoward children is inherently deceptive and exploits children under eightyears of age” (AAP, 1995). A child is unable to critically evaluate thesemessages’ content, intention, and credibility in order to assess their truth-fulness, accuracy, and potential bias (Wilcox et al., 2004).
In general, children are exposed to up to one hour of advertising forevery five hours of television watched (Horgen et al., 2001). This propor-tion complies with the Federal Communication Commission’s enforcementof the Children’s Television Act of 1990, which limits advertising to nomore than 12 minutes per hour during the week, and fewer than 10.5minutes per hour on the weekend, for television programs reaching childrenunder 12 years old (FCC, 2002). However, this exposure to advertisingmay represent a conservative estimate given the growth in unregulatedadvertising reaching children through cable television and the Internet (DaleKunkel, University of Arizona, personal communication, August 17, 2004).
After reviewing the evidence, the committee has concluded that theeffects of advertising aimed at children are unlikely to be limited to brandchoice. Wider impacts include the increased consumption of energy-densefoods and beverages and greater engagement in sedentary behaviors, bothof which contribute to energy imbalance and obesity. The committee con-curs with the APA Task Force’s finding (Wilcox et al., 2004) that advertis-ing targeted to children under the age of 8 is inherently unfair because ittakes advantage of younger children’s inability to attribute persuasive in-tent to advertising. There is presently insufficient causal evidence that linksadvertising directly with childhood obesity and that would support a banon all food advertising directed to children. Additional research and publicdialogue are needed regarding the potential benefits and consequences ofinstituting a food advertising ban for children. Recommending a ban maynot be feasible due to concerns about infringement of First Amendmentrights and the practicality of implementing such a ban (Engle, 2003).
There are historical insights that can be gained from the prior federalgovernment efforts related to advertising food products to children. In1978, the FTC proposed a rule that would ban or significantly restrictadvertising to children, based on a long-standing and widespread concernabout the possible adverse health effects from television advertising of foodand beverage products to children. The FTC staff sought comment on theissues, including three proposed alternative actions (Engle, 2003).
During this process, the FTC presented a review of the scientific evi-dence with the conclusion that television advertising directed at youngchildren is unfair and deceptive. The government rulemaking process foundthat the evidence of adverse effects of advertising on children was inconclu-sive, despite acknowledging some cause for concern; furthermore, it was
341

A NATIONAL PUBLIC HEALTH PRIORITY 175
found that it would be difficult to develop a workable rule that wouldaddress the concerns without infringing on First Amendment rights (Engle,2003). Congress barred any rule based on unfairness, and the FTC termi-nated the rulemaking in 1981 (Engle, 2003; Story and French, 2004).
Protecting parents from children’s requests for advertised products wasnot considered a sufficient basis for FTC action at that time. Furthermore,the process identified the complexities of designing implementable rulesthat restrict advertising directed at children (e.g., how to effectively placelimits on the time of day when advertisements could appear and how todefine the scope of advertisements directed at young children only) (Engle,2003). Thus the committee feels that the immediate step is to strengthenindustry self-regulation and corporate responsibility. Government agenciesshould also be empowered to be engaged with industry in these discussionsand to monitor compliance.
The committee favors an approach to address advertising and market-ing directed especially at young children under 8 years of age, but also forolder children and youth, that would first charge industry with voluntaryimplementation of guidelines developed through diverse stakeholder input,followed by more stringent regulation if industry is unable to mount aneffective self-regulating strategy. This approach is similar to that recom-mended for control of advertising of alcoholic beverages to youth (NRCand IOM, 2003).
It is not possible to determine whether industry self-regulation will leadto a favorable change in marketing and advertising of food and sedentaryentertainment11 products to children sooner than governmen- imposed regu-lation. However, it is desirable that industry is provided with an opportu-nity to implement voluntary changes to move toward marketing and adver-tising practices that do not increase the risk of obesity among children andyouth, followed by government regulation if voluntary actions are deter-mined to be unsuccessful.
DHHS should convene a national conference and invite the participa-tion of a diverse group of stakeholders to develop standards for marketingof foods and beverages (e.g., portion sizes, calories, fat, sugar, and sodium)and sedentary entertainment (movies, videos and DVDs, and other elec-tronic games). The group should include the food, beverage, and restaurantindustries; the Children’s Advertising Review Unit (CARU) of the BetterBusiness Bureaus; media and entertainment industries; leisure and recre-
11Sedentary entertainment refers to activities and products that require minimal physicalactivity and encourage physical inactivity such as watching television, video rentals, andspectator sports.
342

176 PREVENTING CHILDHOOD OBESITY
ation industries; public health organizations; and consumer advocacygroups. This national conference should also establish appropriate objec-tives and methods for evaluating the ongoing effectiveness of the new guide-lines.
In addition, further information should be collected about the impactof advertising on children’s eating and physical activity behaviors and abouthow media literacy training may help children and parents make moreinformed choices.
Implementation of the guidelines will be the responsibility of the foodand beverage industry and sedentary entertainment industry trade organi-zations, individual companies, advertising agencies, and the entertainmentindustry, with oversight from federal agencies. Appropriate advertisingcodes and monitoring mechanisms, including industry-sponsored and ex-ternal review boards (e.g., CARU, National Advertising Review Board),should be implemented to enforce the guidelines. Moreover, industry shouldtake actions to strengthen CARU guidelines and oversight in order to en-sure compliance. Through these actions, it is expected that reasonable pre-cautions will be put in place regarding the time, place, and manner ofproduct placement and promotion (i.e., children’s morning, afternoon, andweekend television programming and in-school educational programming)to limit children’s exposure to products that are not consistent with theprinciple of energy balance and that do not promote healthful diets andregular physical activity.
Further, Congress should empower the FTC with the authority andresources to monitor compliance with the guidelines, scrutinize marketingpractices of the relevant industries (including product promotion, place-ment, and content), and establish independent external review boards toinvestigate complaints and prohibit food and beverage and sedentary enter-tainment product advertisements that may be deceptive or have “particularappeal” to children that conflict with principles of healthful eating andphysical activity. Potential guideline elements to consider might be:
• Restrict or otherwise constrain the content of food and beverageand sedentary entertainment advertising on programs with a substantialchildren’s audience (i.e., children’s morning, afternoon, and weekend tele-vision programming and in-school educational programming such as Chan-nel One).
• Avoid implicit or explicit claims that high-energy-density and low-nutrient-density foods have nutritional value.
• Avoid linking such products to admired celebrities or sports fig-ures, or to cartoon characters. This would include cross-promotion of foodand sedentary entertainment products with branded children’s program-ming or networks.
343

A NATIONAL PUBLIC HEALTH PRIORITY 177
• Require inclusion of a disclaimer pointing to the need to limitconsumption of food or participation in sedentary entertainment.
• Require a message recommending complementary consumption ofhealthier food or participation in more physically active entertainment.
Congress should also authorize and appropriate sufficient funding tosupport a study of the cumulative direct and indirect effects of advertisingand marketing on the food and beverage and sedentary entertainment pur-chasing and health behaviors of children, adolescents, and parents; andinvestigate how approaches such as media literacy can provide childrenwith the desirable skills to respond to marketing messages.
Recommendation 4: Advertising and MarketingIndustry should develop and strictly adhere to marketing and advertis-ing guidelines that minimize the risk of obesity in children and youth.
To implement this recommendation:
• The Secretary of DHHS should convene a national conferenceto develop guidelines for the advertising and marketing of foods,beverages, and sedentary entertainment directed at children andyouth with attention to product placement, promotion, and content.
• Industry should implement the advertising and marketingguidelines.
• The FTC should have the authority and resources to monitorcompliance with the food and beverage and sedentary entertainmentadvertising practices.
MEDIA AND PUBLIC EDUCATION
Throughout this report there is discussion of the influence of media onchildhood obesity. This section discusses use of the media as a positivestrategy for addressing childhood obesity. The fundamental perspective ofthis report is that childhood obesity reflects numerous influences, and con-sequently that addressing the epidemic will require changes in the manyways in which American society interacts with its children. Deploying themedia should be seen as part of a broader effort to change social norms—for youth about their own behavior, for parents about their actions onbehalf of their children, and for society at large about the need to supportpolicies that protect its most vulnerable members.
There is perhaps some irony in using the mass media to address thechildhood obesity epidemic when the sedentary lifestyles associated withviewing television are noted to be contributing causes of that epidemic (see
344

178 PREVENTING CHILDHOOD OBESITY
Chapter 8). Nonetheless, the committee recognizes that the behaviors asso-ciated with the obesity epidemic are widespread, and few other mechanismsare available for stimulating the required changes. Use of the mass media isthe best way to reach large segments of the population. At the same time,the committee recognizes that there have been very few efforts to addressthe problem of childhood and youth obesity through the mass media, thusactions in this domain should be accompanied by careful and continuousmonitoring and evaluation to ensure that they are doing what they weremeant to do.
Finally, the committee recognizes that if a campaign is not designedwith sensitivity, there may be an unintentional consequence that couldincrease stigmatization of obese children. Stigmatization of smokers wasthought to be an effective tool for the tobacco control campaigns; however,obesity may be different. Therefore, the possibility that a campaign couldincrease negative attitudes and behaviors directed at obese children andyouth, such as teasing and discrimination, needs to be explicitly consideredin the design and development of the campaign. This should include ad-equate formative evaluation during development as well as surveillance,concurrent with and following campaign implementation, to detect andminimize any potential adverse effects.
Media-centered efforts must be closely linked with complementary ef-forts elsewhere in pursuit of the same objectives. For example, a mediacampaign to recommend that children walk to school might need to becomplemented by a public-relations campaign to ensure that there are saferoutes for walking, a campaign for reaching parents with a message thatthey should encourage their children to walk, and a campaign for motivat-ing children to be excited about and interested in walking to school. Thus,media-centered efforts include not only those directed at children and youththemselves, and those directed at parents, but also those directed at policymakers. Throughout this report the committee has emphasized the centralrole of policy change in obesity prevention, and media-based efforts canhave an important role in achieving these changes.
Policy changes occur more quickly if there is a strong social consensusbehind them (Economos et al., 2001; Kersh and Morone, 2002). For ex-ample, it is worth considering the policy changes that have been importantin the success of the anti-tobacco movement (Kersh and Morone, 2002;Daynard, 2003; Yach et al., 2003; see Appendix D). Restrictions on adver-tising, increases in taxation, and controls over smoking-permissible loca-tions were important components of the tobacco-use decline (Hopkins etal., 2001), but these changes could be readily implemented only because anew public-opinion climate around tobacco supported them and permittedlegislators and regulators to act (Kersh and Morone, 2002; Yach et al.,2003). This public opinion transformation likely resulted both from the
345

A NATIONAL PUBLIC HEALTH PRIORITY 179
natural diffusion of information about the health consequences of tobaccouse and the deliberate efforts by advocacy agencies to affect public opinion(Warner and Martin, 2003). Similarly, it will likely be easier to implementpolicies to prevent childhood obesity if the general public is informed aboutthe issues and strongly supportive of the need to address them.
Lessons Learned from Other Media Campaigns on Public Health Issues
A number of media campaigns covering a range of public health issueshave been targeted to adults or the general public. For example, mediaefforts were successfully used to encourage parents to put their infants tosleep on their backs to avoid Sudden Infant Death Syndrome (Moon et al.,2004) and to discourage the use of aspirin for children’s fevers to avoidReye’s syndrome (Soumerai et al., 1992). The outcomes of the “Back toSleep” and the Reye’s syndrome campaigns were encouraging, but theirobjective may be simpler than the sorts of actions recommended for energy-balance campaigns. A major national effort to encourage parents to moni-tor their children so as to reduce their risk of drug use has not yet shownevidence of behavior change, although it is still ongoing (Hornik et al.,2003).
A broader range of campaigns addressing parents’ own behaviors re-lated to energy balance has shown mixed results. Evaluations of a series ofmass-media-based interventions undertaken in the 1990s to promote adultphysical activity provide a mixed picture of success, with most reportingfairly good levels of recall of messages and changes in knowledge about thebenefits of exercise. Only sometimes, however, did results show evidence ofactual increases in self-reported physical activity, even over the short term(Owen et al., 1995; Vuori et al., 1998; Wimbush et al., 1998; Bauman etal., 2001, 2003; Hillsdon et al., 2001; Miles et al., 2001; Reger et al., 2002;Renger et al., 2002).
In addition to these predominantly mass-media-focused efforts, therewere other multicomponent campaigns for which mass media was but one(albeit important) channel that addressed not only physical activity butother outcomes as well (see Chapter 6). Initial success from the StanfordThree Community Study and the North Karelia Project demonstrated thepromise of this approach, and were followed by three large National Heart,Lung, and Blood Institute-funded community trials in the 1980s—theStanford Five-City Project, the Minnesota Heart Health Program, and thePawtucket Heart Health Program (Farquhar et al., 1990; Luepker et al.,1994; Carleton et al., 1995). The multiyear Minnesota Heart Health Pro-gram reported greater adult physical activity in its experimental communi-ties than in its control communities (Luepker et al., 1994); and the StanfordFive-City Project reported similar patterns (Young et al., 1996), as well as
346

180 PREVENTING CHILDHOOD OBESITY
lower resting heart rate (a measure of cardiorespiratory fitness), lowerblood pressure, and lower body mass index levels (Taylor et al., 1991;Farquhar et al., 1990) in the intervention communities. The Stanford andMinnesota projects included change in diet among their objectives, butthese studies did not report notable successes in affecting dietary fat ordietary cholesterol, although an effect on plasma cholesterol was reportedin the Stanford Five-City Project (Farquhar et al., 1990).
There were also a small number of evaluated mass-media interventionsfocused on diet. These included the “1% or Less” campaign in Wheeling,West Virginia, which showed that more adults in the state switched to low-fat milk than in a control community after a campaign in 1996 (Reger et al.,1999); and the Victoria, Australia’s “2 Fruit ‘n’ 5 Veg Every Day” cam-paign that ran from 1992 to 1995, which showed some increase in reportedconsumption of these targeted foods (Dixon et al., 1998).
The National Cancer Institute-sponsored “5 A Day for Better Health”program, for which mass-media promotion of fruit and vegetable consump-tion was a component, showed varying degrees of success. California datafor the initial “5 A Day for Better Health” program from 1989 to 1991, aswell as the subsequent national program, revealed small increases in con-sumption of daily servings of fruit and vegetables, though evaluators sug-gested that these may well have reflected ongoing secular trends (Foerster etal., 1995) or demographic shifts (Stables et al., 2002).
The findings on diet interventions, like those regarding physical activ-ity, clearly were mixed. The 5-A-Day evaluations represented efforts of adifferent magnitude than any of the described physical activity interven-tions, yet there were no clear associations between those efforts and dietarychanges. These results are of concern when considering large-scale dietaryinterventions. At the same time, it is evident that substantial changes in theU.S. adult diet have occurred during the last few decades, most strikingly inthe reduction of dietary cholesterol and resulting levels of plasma choles-terol (Frank et al., 1993). Although evaluations of deliberate campaignsmay not show consistent evidence of influence on dietary intake and out-comes, there are some influences producing large shifts in dietary knowl-edge and behavior. The idea that such shifts reflect general media coverageof dietary issues, creating in turn a substantial demand for low-cholesterol,low-fat products, and more recently, low-carbohydrate products, is worthserious consideration.
Approaches that seek to affect the shape of media coverage of diet and/or physical activity might merit high priority. One of the most difficultbarriers to successful public education programs is achieving high rates ofexposure to persuasive messages. Even if a carefully mounted intensiveeducation effort was effective for the audience it could reach, it may not befeasible to reach large audiences with those messages. Resources may not be
347

A NATIONAL PUBLIC HEALTH PRIORITY 181
available to pay for the outreach channels and prime time exposure fortarget groups needed on a continuing basis. In contrast, ordinary mass-media programs and news do reach large audiences with their messages.They can achieve high and continuing exposure to healthy messages.
Such heavy exposure may be effective for a variety of reasons: sheerrepetition so that messages (1) may be more likely to be heard and paidattention to, particularly if the repetition occurs across a variety of chan-nels; (2) may communicate social expectations for behavior, and (3) mayproduce a greater likelihood of community discussion of the message possi-bly producing personal reinforcement for behavior change.
Thus if the media cover an issue extensively, it may be possible toachieve changes in behavior not practicable with controlled educationalinterventions. However the problem for programs that take this route is thedifficulty of convincing media to cover an issue in a way consistent withsponsors’ goals. The solutions that people have used include buying orobtaining donated advertising time; engaging in media advocacy—a delib-erate attempt to create controversy or to leverage a news event to stimulatemedia coverage of an issue (Wallack and Dorfman, 1996); undertakingpublic relations efforts to encourage media coverage; and working withproducers and writers of entertainment programs or talk shows to encour-age incorporation of messages in those programs. Different programs haveused each of these strategies, with varying success (Wallack and Dorfman,1996; Hornik et al., 2003; Wray et al., 2004).
In March 2004, DHHS announced an obesity-focused campaign called“Small Steps” that is comprised of a series of public service announcementsrecommending that Americans take small and achievable steps toward in-creasing physical activity and reducing calorie consumption to improvetheir health and reverse the obesity epidemic (DHHS, 2004). The initiativeand advertisements provide suggestions such as choosing fruit for dessertand doing sit-ups in front of the television—easily accomplished actionsthat DHHS anticipates will appeal to Americans searching for achievableweight-management goals. The campaign, which is part of a larger DHHSeffort, the Steps to a Healthier U.S. Initiative, is addressed both to adultsand children and is implemented through awards to large urban communi-ties, rural communities, and tribal consortiums. Because this program waslaunched as this report was being written, results on effectiveness are notyet available.
Over the past 10 years, government and private groups have under-taken major media campaign efforts to influence a variety of other youthbehaviors, including tobacco use and drug use. Current evidence suggeststhat the anti-tobacco campaigns have been successful, while the anti-drugcampaigns have had less success. Tobacco use among youth has been de-clining since 1997, and there is evidence linking some of that decline to
348

182 PREVENTING CHILDHOOD OBESITY
state-level media campaigns (Siegel, 2002). In contrast, the National YouthAnti-Drug Media Campaign, sponsored by the White House Office of Na-tional Drug Control Policy, has not shown success thus far in influencingyouth marijuana consumption, despite having spent more than $1 billion inadvertising and other efforts (Hornik et al., 2003). The inconsistent resultsfrom these two areas do not lead to easy conclusions about whether mediacampaigns are promising for obesity-related behaviors. They do suggestthat the success of such campaigns will depend on the outcome sought andthe ways in which the campaigns are mounted and maintained.
Industry-sponsored efforts to encourage increased levels of physicalactivity are currently under way (Nike, 2004), though the committee doesnot have any information about their possible influence of these efforts onyouth behavior. The advantage of such industry-sponsored programs isthat they do not require explicit public investment; however, reasonablyenough, they will reflect their sponsors’ interests, which may not alwayscoincide with the agendas of those primarily concerned with youth obesity.In circumstances where they might play a useful complementary role in anational effort, industry-sponsored efforts should certainly be encouraged.However, national authorities must understand that such campaigns arelikely to be only one part of a broad effort, and should not be seen as analternative to mounting an urgent public-sector campaign focused on be-havioral objectives.
Within the past two years, the Centers for Disease Control and Preven-tion (CDC) has launched the VERB campaign, a multi-ethnic media cam-paign based on social marketing principles and behavioral change models(Huhman, et al., 2004) with the goal of increasing and maintaining physicalactivity in tweens—youth aged 9 to 13 years. Parents and other influentialsources on tweens (e.g., teachers and youth program leaders) are the sec-ondary audiences of the VERB campaign. The CDC has conducted exten-sive formative research to design this social marketing campaign (Wong etal., 2004), which currently involves multiple media venues that includetelevision, radio spots, print advertising, posters, the Internet, and out-of-home outlets such as movie theaters, billboards, and city buses (Wong etal., 2004).
A recently released summary of the VERB campaign’s first-year resultsof a prospective study suggests a high recall of messages and some evidencethat youth who had better campaign recall engaged in more physical activ-ity than those who did not (Potter et al., 2004). It should be noted, how-ever, that the extent to which the association between campaign recall andgreater physical activity can be attributed to the campaign’s influence can-not be determined from these results. One cannot rule out the alternativeexplanation that youth who are more naturally oriented toward being morephysically active are also more likely to recall the campaign messages.
349

A NATIONAL PUBLIC HEALTH PRIORITY 183
Given these preliminary, albeit positive results, and no other available evalu-ations of media campaigns, it is not possible at present to state that mediacampaigns can effectively increase physical activity in children aged 9 to 13years.
Next Steps
The committee recognizes that there is limited evaluated experience inmass-media-centered interventions that address obesity prevention. None-theless, there is substantial experience in other related areas, along with theinitial findings of positive evidence from some very recent obesity-focusedefforts. In addition, the committee recognizes that most of its recommenda-tions throughout the report require reaching the population at large, on acontinuing basis, to generate popular support for policy changes and pro-vide needed information to parents and youth about behaviors likely toreduce the risks of obesity. Only the mass media offer the possibility ofreaching that sizeable and wide-ranging audience.
Thus the committee recommends that DHHS, in coordination withother federal departments and agencies and with input from independentexperts, develop, implement, and rigorously evaluate a broad-based, long-term, national multimedia and public relations campaign focused on obe-sity prevention in children and youth. This campaign would vary in itsfocus as the nature of the problem changes, including components focusedon changing eating and physical activity behaviors among children, youth,and their parents as well as on raising support among the general public forpolicy actions. The outcome of this effort should be greater awareness ofchildhood obesity, increased public support for policy actions, and behav-ior change among parents and youth.
The three areas of focus for the recommended media campaign wouldinvolve:
• A continuing public relations or media advocacy effort designed tobuild a political constituency for addressing youth obesity, and for support-ing specific policy changes on national, state, or local levels. This willinclude print and broadcast media press briefings and outreach, mediasupport for other organizations focused on obesity issues, and efforts toencourage commercial media to incorporate obesity issues and positive rolemodeling in their programming.
• A systematic and continuing campaign to provide parents with thetypes of information described in Chapter 8, including the importance ofserving as role models and of establishing household policies and prioritiesregarding healthful eating and physical activity.
350

184 PREVENTING CHILDHOOD OBESITY
• A systematic and continuing campaign to reach youth who arethemselves making energy balance decisions that affect their risk of obesity.
The federal government’s recently launched VERB campaign is oneexample of a youth-focused campaign and presents an opportunity to ex-amine the long-term impact of a multimedia campaign focused on promot-ing physical activity in youth, one component of preventing obesity. Asnoted above, preliminary results are positive for an early phase of thecampaign. CDC has made substantial investment in this program and,given the positive first results, further investments should follow over alonger term.
Regarding the systematic campaign to reach youth, the committee spe-cifically endorses the continuation of VERB funding to ensure the possibil-ity of fully realizing the social marketing campaign’s potential and to evalu-ate its long-term impact. This proposal is costly. Thus, based on a rigorousevaluation over the long term, resources should be redirected if results arenot promising in meeting the three components of the campaign. In addi-tion, the committee notes that physical activity is but one side of the energyequation. Additional resources should be provided for a complementarycampaign focusing on energy-intake behaviors.
Funding for the national multimedia and public relations campaignshould include sufficient budgets to purchase media time for the campaign’sadvertising, rather than relying on donated time, as well as to support theprofessional implementation and careful evaluation of the campaign’s ef-fects. While DHHS’s Small Steps program intends to depend on contributedairtime under the auspices of the Advertising Council (DHHS, 2004), thecommittee suggests that it is not a promising route for frequently reachingthe public. A recent Kaiser Family Foundation study showed that the aver-age television station rarely plays such public service announcements dur-ing periods when most adults are in the viewing audience (Kaiser FamilyFoundation, 2002). Some campaigns have had success in obtaining donatedtime on stations where they had also purchased time (Randolph andViswanath, 2004), but that is merely a strategy for stretching resourcesmore effectively. In general, a campaign that depends on contributed time isquite unlikely to satisfy its objectives.
Input should be sought from independent experts and representativesof other federal, state, and local agencies, nonprofit organizations, and,where appropriate, industry representatives to construct a broad and evolv-ing strategy that includes all three of the areas of focus described above.These efforts, which need a long-term mandate from Congress, should beaimed at the general population and specific high-risk subgroups, and theirstaffs should be able to carefully assess targets of opportunity and re-balance their strategies as circumstances change.
351

A NATIONAL PUBLIC HEALTH PRIORITY 185
The committee realizes that many nonprofit organizations and othernongovernmental groups are involved in obesity prevention efforts. It en-courages these organizations to undertake their own extensive media cam-paigns (print, electronic, Web-based, and other media) for addressing theobesity problem.
Recommendation 5: Multimedia and Public Relations CampaignDHHS should develop and evaluate a long-term national multimediaand public relations campaign focused on obesity prevention in chil-dren and youth.
To implement this recommendation:
• The campaign should be developed in coordination with otherfederal departments and agencies and with input from independentexperts to focus on building support for policy changes, providinginformation to parents, and providing information to children andyouth. Rigorous evaluation should be a critical component.
• Reinforcing messages should be provided in diverse media andeffectively coordinated with other events and dissemination activi-ties.
• The media should incorporate obesity issues into its content,including the promotion of positive role models.
REFERENCES
AAP (American Academy of Pediatrics). Committee on Communications. 1995. Children,adolescents, and advertising. Pediatrics 95(2):295-297.
Achterberg C, McDonnell E, Bagby R. 1994. How to put the Food Guide Pyramid intopractice. J Am Diet Assoc 94(9):1030-1035.
ADA (American Dietetic Association). 2004. Position of the American Dietetic Association:Dietary guidance for healthy children ages 2 to 11 years. J Am Diet Assoc 104(4):660-677.
Ballard-Barbash R. 2001. Designing surveillance systems to address emerging issues in dietand health. J Nutr 131(2S-1):437S-439S.
Bauman AE, Bellew B, Owen N, Vita P. 2001. Impact of an Australian mass media campaigntargeting physical activity in 1998. Am J Prev Med 21(1):41-47.
Bauman A, McLean G, Hurdle D, Walker S, Boyd J, van Aalst I, Carr H. 2003. Evaluation ofthe national ‘Push Play’ campaign in New Zealand—Creating population awareness ofphysical activity. N Z Med J 116(1179):U535.
Block G. 2004. Foods contributing to energy intake in the US: Data from NHANES III andNHANES 1999–2000. J Food Comp Analysis 17(3-4):439-447.
Bowman SA, Vinyard BT. 2004. Fast food consumption of U.S. adults: Impact on energy andnutrient intakes and overweight status. J Am Coll Nutr 23(2):163-168.
352

186 PREVENTING CHILDHOOD OBESITY
Bowman SA, Gortmaker SL, Ebbeling CB, Pereira MA, Ludwig DS. 2004. Effects of fast foodconsumption on energy intake and diet quality among children in a national householdsurvey. Pediatrics 113(1):112-118.
Brownell K. 2004. Food Fight: The Inside Story of the Food Industry, America’s ObesityCrisis, and What We Can Do About It. New York: McGraw-Hill.
Carleton RA, Lasater TM, Assaf AR, Feldman HA, McKinlay S. 1995. The Pawtucket HeartHealth Program: Community changes in cardiovascular risk factors and projected dis-ease risk. Am J Public Health 85(6):777-785.
Children’s Video Market. 1997. [Online]. Available: http://www.academic.marketresearch.com/ [accessed June 4, 2004].
Crockett SJ, Kennedy E, Elam K. 2002. Food industry’s role in national nutrition policy:Working for the common good. J Am Diet Assoc 102(4):478-479.
CSPI (Center for Science in the Public Interest). 2003. Pestering Parents: How Food Compa-nies Market Obesity to Children. Washington, DC: CSPI. [Online]. Available: http://www.cspinet.org/new/200311101.html [accessed November 21, 2003].
Datamonitor. 2002. Childhood Obesity 2002: How Obesity Is Shaping the U.S. Food andBeverage Markets. Executive Summary. [Online]. Available: http://www.researchandmarkets.com/reports/c3990/ [accessed April 14, 2004].
Daynard RA. 2003. Lessons from tobacco control for the obesity movement. J Public HealthPolicy 24(3-4):291-295.
Derby B. 2002. Consumer Understanding of Nutrition Labels and Use of Daily Values.Presentation at the workshop on Use of Dietary Reference Intakes in Nutrition Labeling.Committee on Use of Dietary Reference Intakes in Nutrition Labeling, Institute of Medi-cine. Washington, DC, May 23.
DHHS. 2004. Citing “Dangerous Increase” in Deaths, HHS Launches New Strategies AgainstOverweight Epidemic. [Online]. Available: http://www.hhs.gov/news/press/2004pres/20040309.html [accessed March 29, 2004].
Dixon H, Borland R, Segan C, Stafford H, Sindall C. 1998. Public reaction to Victoria’s ‘2fruit ‘n’ 5 veg every day’ campaign and reported consumption of fruit and vegetables.Prev Med 27(4):572-582.
Dixon LB, Cronin FJ, Krebs-Smith SM. 2001. Let the pyramid guide your food choices:Capturing total diet concept. J Nutr 131(2S-1):461S-472S.
Dong L, Block G, Mandel S. 2004. Activities contributing to total energy expenditure in theUnited States: Results from the NHAPS study. Int J Behav Nutr Phys Act 1(1):4.
Drewnowski A. 1998. Energy density, palatability, and satiety: Implications for weight con-trol. Nutr Rev 56(12):347-353.
Drewnowski A. 2003. The role of energy density. Lipids 38(2):109-115.Ebbeling CB, Sinclair KB, Pereira MA, Garcia-Lago E, Feldman HA, Ludwig DS. 2004.
Compensation for energy intake from fast food among overweight and lean adolescents.J Am Med Assoc 291(23):2828-2833.
Economos CD, Brownson RC, DeAngelis MA, Novelli P, Foerster SB, Foreman CT, GregsonJ, Kumanyika SK, Pate RR. 2001. What lessons have been learned from other attemptsto guide social change? Nutr Rev 59(3 Pt 2):S40-S56.
Engle MK. 2003. FTC Regulation of Marketing to Children. Presentation at the workshop onThe Prevention of Childhood Obesity: Understanding the Influences of Marketing, Me-dia, and Family Dynamics. Committee on the Prevention of Obesity in Children andYouth, Institute of Medicine. Washington, DC, December 9.
Farquhar JW, Fortmann SP, Flora JA, Taylor CB, Haskell WL, Williams PT, Maccoby N,Wood PD. 1990. Effects of communitywide education on cardiovascular disease riskfactors: The Stanford Five-City Project. J Am Med Assoc 264:359-365.
353

A NATIONAL PUBLIC HEALTH PRIORITY 187
FCC (Federal Communications Commission). 2002. Children’s Educational Television.[Online]. Available: http://www.fcc.gov/cgb/consumer facts/childtv.html [accessed No-vember 21, 2003].
FDA (U.S. Food and Drug Administration). 1993. Food labeling: Mandatory status of nutri-tion labeling and nutrient content revisions: Format of nutrition label. Final rule. FedRegist 58(3):2079-2205.
FDA. 1995. Food labeling: Reference Daily Intakes. Part II; Final rule. Fed Regist60(249):67164–67175.
FDA. 2004. Calories Count. Report of the Working Group on Obesity. Center for FoodSafety and Applied Nutrition. [Online]. Available: http://www.cfsan.fda.gov/~dms/owg-toc.html#action [accessed April 19, 2004].
FMI (Food Marketing Institute). 1993. Shopping for Health: A Report on Diet, Nutrition andEthnic Foods. Washington, DC: FMI.
FMI. 1997. Shopping for Health: Balancing Convenience, Nutrition, and Taste. Washington,DC: FMI.
FMI. 2001. Shopping for Health: Reaching Out to the Whole Health Consumer. Washington,DC: FMI.
FMI. 2003a. Shopping for Health 2003: Whole Health for the Whole Family. Washington,DC: FMI.
FMI. 2003b. Trends in the United States: Consumer Attitudes & the Supermarket 2003.Washington, DC: FMI.
Foerster SB, Kizer KW, Disogra LK, Bal DG, Krieg BF, Bunch KL. 1995. California’s “5 aDay for Better Health!” campaign: An innovative population-based effort to effect large-scale dietary change. Am J Prev Med 11(2):124-131.
Frank E, Winkleby M, Fortmann SP, Farquhar JW. 1993. Cardiovascular disease risk factors:Improvements in knowledge and behavior in the 1980s. Am J Public Health 83(4):590-593.
French SA, Story M, Jeffery RW. 2001a. Environmental influences on eating and physicalactivity. Annu Rev Public Health 22:309-335.
French SA, Story M, Neumark-Sztainer D, Fulkerson JA, Hannan P. 2001b. Fast food restau-rant use among adolescents: Associations with nutrient intake, food choices and behav-ioral and psychosocial variables. Int J Obes 25(12):1823-1833.
FTC (Federal Trade Commission). 2003. Public Workshop: Exploring the Link BetweenWeight Management and Food Labels and Packaging. Docket No. 2003N-0038. Beforethe Department of Health and Human Services Food and Drug Administration. Com-ments of the Staff of the Bureau of Consumer Protection, the Bureau of Economics, andthe Office of Policy Planning of the Federal Trade Commission. December 12.
Gallo AE. 1999. Food advertising in the United States. In: Frazao E, ed. America’s EatingHabits: Changes and Consequences. Agriculture Information Bulletin Number 750.Washington, DC: USDA.
Gamble M, Cotunga N. 1999. A quarter century of television food advertising targeted atchildren. Am J Health Behav 23(4):261-267.
Geiger CJ, Wyse BW, Parent CR, Hansen RG. 1991. Review of nutrition labeling formats. JAm Diet Assoc 91(7):808-812, 815.
Hastings G, Stead M, McDermott L, Forsyth A, MacKintosh A, Rayner, M, Godfrey C,Caraher M, Angus K. 2003. Review of Research on the Effects of Food Promotion toChildren. Glasgow, UK. Center for Social Marketing, University of Strathclyde, Glasgow,UK. Available: http://www.food.gov.uk/multimedia/pdfs/foodpromotiontochildren1.pdf[accessed November 22, 2003].
Heasman M, Mellentin J. 2001. The Functional Foods Revolution: Healthy People, HealthyProfits? London, UK: Earthscan Publications.
354

188 PREVENTING CHILDHOOD OBESITY
Hillsdon M, Cavill N, Nanchahal K, Diamond A, White IR. 2001. National level promotionof physical activity: Results from England’s ACTIVE for LIFE campaign. J EpidemiolCommunity Health 55(10):755-761.
Hofferth SL, Sandberg JF. 2001. Changes in American children’s time, 1981-1997. In: OwensT, Hofferth S, eds. Children at the Millennium: Where Have We Come From, Where AreWe Going? Advances in Life Course Research. New York: Elsevier Science.
Hopkins DP, Husten CG, Fielding JE, Rosenquist JN, Westphal LL. 2001. Evidence reviewsand recommendations on interventions to reduce tobacco use and exposure to environ-mental tobacco smoke: A summary of selected guidelines. Am J Prev Med 20(2S):67-87.
Horgen KB, Choate M, Brownell KD. 2001. Television food advertising: Targeting childrenin a toxic environment. In: Singer DG, Singer JL, eds. Handbook of Children and theMedia. Thousand Oaks, CA: Sage Publications. Pp. 447-461.
Hornik R, Maklan D, Cadell D, Barmada C, Jacobsohn L, Henderson V, Romantan A,Niederdeppe J, Orwin R, Sridharan S, Baskin R, Chu A, Morin C, Taylor K, Steele D.2003. Evaluation of the National Youth Anti-Drug Media Campaign: 2003 Report ofFindings. Washington, DC: Westat.
Huhman M, Heitzler C, Wong F. 2004. The VERB™ campaign logic model: A tool forplanning and evaluation. Preventing Chronic Disease [Online]. Available: http://www.cdc.gov/pcd/issues/2004/jul/pdf/04_0033.pdf [accessed August 17, 2004].
Hurley J, Liebman B. 2004. Kids’ Cuisine: “What would you like with your fries?” NutritionAction Health Letter. Washington, DC: CSPI.
IOM (Institute of Medicine). 2002. Dietary Reference Intakes for Energy, Carbohydrate,Fiber, Fat, Fatty Acids, Cholesterol, Protein, and Amino Acids. Washington, DC: TheNational Academies Press.
IOM. 2004. Dietary Reference Intakes. Guiding Principles for Nutrition Labeling and Fortifi-cation. Washington, DC: The National Academies Press.
Ippolito PM, Pappalardo JK. 2002. Advertising Nutrition & Health. Evidence from FoodAdvertising 1977-1997. Washington, DC: Federal Trade Commission.
Kaiser Family Foundation. 2002. Shouting to be Heard: Public Service Advertising in a NewMedia Age. Menlo Park, CA: Henry J. Kaiser Family Foundation. [Online]. Available:http://www.kff.org/entmedia/20020221a-index.cfm [accessed June 24, 2004].
Kaiser Family Foundation. 2004. The Role of Media in Childhood Obesity. Menlo Park, CA:Henry J. Kaiser Family Foundation.
Kersh R, Morone J. 2002. How the personal becomes political: Prohibitions, public health,and obesity. Studies in American Political Development 16(2):162-175.
Kotz K, Story M. 1994. Food advertisements during children’s Saturday morning televisionprogramming: Are they consistent with dietary recommendations? J Am Diet Assoc94(11):1296-1300.
Kral TV, Roe LS, Rolls BJ. 2002. Does nutrition information about the energy density ofmeals affect food intake in normal-weight women? Appetite 39(2):137-145.
Kral TVE, Roe LS, Rolls BJ. 2004. Combined effects of energy density and portion size onenergy intake in women. Am J Clin Nutr 79(6):962-968.
Kristal AR, Hedderson MM, Patterson RE, Neuhouser M, Neuhauser ML. 2001. Predictorsof self-initiated, healthful dietary change. J Am Diet Assoc 101(7):762-766.
Kunkel D. 2001. Children and television advertising. In: Singer DG, Singer JL, eds. Hand-book of Children and the Media. Thousand Oaks, CA: Sage Publications. Pp. 375-394.
Legault L, Brandt MB, McCabe N, Adler C, Brown AM, Brecher S. 2004. 2000-2001 foodlabel and package survey: An update on prevalence of nutrition labeling and claims onprocessed, packaged foods. J Am Diet Assoc 104(6):952-958.
355

A NATIONAL PUBLIC HEALTH PRIORITY 189
Lin BH, Guthrie J, Frazao E. 1999a. Away-from-Home Foods Increasingly Important toQuality of American Diet. Washington, DC: Economic Research Service/U.S. Depart-ment of Agriculture. Agriculture Information Bulletin No. 749.
Lin BH, Guthrie J, Frazao E. 1999b. Quality of children’s diets at and away from home:1994-96. Food Rev 22(1):2-10.
Lin BH, Guthrie J, Frazao E. 1999c. Nutrient contribution of food away from home. InFrazao E, ed. America’s Eating Habits: Changes and Consequences. Washington, DC:Economic Research Service/U.S. Department of Agriculture. Agriculture InformationBulletin No. 750. Pp. 213-242.
Luepker RV, Murray DM, Jacobs DR Jr, Mittelmark MB, Bracht N, Carlaw R, Crow R,Elmer P, Finnegan J, Folsom AR, Grimm R, Hannan PJ, Jeffrey R, Lando H, McGovernP, Mullis R, Perry CL, Pechacek T, Pirie P, Sprafka JM, Weisbrod R, Blackburn H.1994. Community education for cardiovascular disease prevention: Risk factor changesin the Minnesota Heart Health Program. Am J Public Health 84(9):1383-1393.
Mathios AD, Ippolito P. 1999. Health claims in food advertising and labeling. In: Frazao E,ed. America’s Eating Habits: Changes and Consequences. Washington, DC: EconomicResearch Service/U.S. Department of Agriculture. Agriculture Information Bulletin No.750. Pp. 189-212.
McConahy KL, Smiciklas-Wright H, Birch LL, Mitchell DC, Picciano MF. 2002. Food por-tions are positively related to energy intake and body weight in early childhood. J Pediatr140(3):340-347.
McConahy KL, Smiciklas-Wright H, Mitchell DC, Picciano MF. 2004. Portion size of com-mon foods predicts energy intake among preschool-aged children. J Am Diet Assoc104(6):975-979.
McNeal JU. 1998. Tapping the three kids’ markets. Am Demog 20(4):37-41.McNeal J. 1999. The Kids Market: Myths and Realities. Ithaca, NY: Paramount Marketing
Publishing.Miles A, Rapoport L, Wardle J, Afuape T, Duman M. 2001. Using the mass-media to target
obesity: An analysis of the characteristics and reported behaviour change of participantsin the BBC’s ‘Fighting Fat, Fighting Fit’ campaign. Health Educ Res 16(3):357-372.
Moon RY, Oden RP, Grady KC. 2004. Back to Sleep: An educational intervention withwomen, infants, and children program clients. Pediatrics 113(3 Pt 1):542-547.
National Restaurant Association. 2003. Restaurant Industry Forecast. Executive Summary.[Online]. Available: http://www.restaurant.org/research/forecast.cfm [accessed April 19,2004].
National Restaurant Association. 2004. Restaurant Industry Forecast. Executive Summary.[Online]. Available: http://www.restaurant.org/pdfs/research/2004_forecast_execsummary.pdf [accessed April 26, 2004].
NCHS (National Center for Health Statistics). 2001. Healthy People 2000 Final Review.Hyattsville, MD: Public Health Service.
Nestle M. 2003a. Food Politics: How the Food Industry Influences Nutrition and Health.Berkeley, CA: University of California Press.
Nestle M. 2003b. Increasing portion sizes in American diets: More calories, more obesity. JAm Diet Assoc 103(1):39-40.
Nielsen SJ, Popkin BM. 2003. Patterns and trends in food portion sizes, 1977-1998. J AmMed Assoc 289(4):450-453.
Nike. 2004. NikeGo Programs: What Are You Going To Do About It? [Online]. Available:http://www.nike.com/nikebiz/nikego/programs.html [accessed June 7, 2004].
NRC (National Research Council), IOM. 2003. Reducing Underage Drinking: A CollectiveResponsibility. Washington, DC: The National Academies Press.
356

190 PREVENTING CHILDHOOD OBESITY
Orlet Fisher J, Rolls BJ, Birch LL. 2003. Children’s bite size and intake of an entree aregreater with large portions than with age-appropriate or self-selected portions. Am JClin Nutr 77(5):1164-1170.
Owen N, Bauman A, Booth M, Oldenburg B, Magnus P. 1995. Serial mass-media campaignsto promote physical activity: Reinforcing or redundant? Am J Public Health 85(2):244-248.
Paeratakul S, Ferdinand DP, Champagne CM, Ryan DH, Bray GA. 2003. Fast food consump-tion among US adults and children: Dietary and nutrient intake profile. J Am Diet Assoc103(10):1332-1338.
Peters JC, Wyatt HR, Donahoo WT, Hill JO. 2002. From instinct to intellect: The challengeof maintaining healthy weight in the modern world. Obes Rev 3(2):69-74.
Philipson TJ, Posner RA. 2003. The long-run growth in obesity as a function of technologicalchange. Perspect Biol Med 46(3S):S87-S107.
Porter Novelli, Inc. 2003. The Radiant Pyramid Concept. A Daily Food Choice Guide. Wash-ington, DC: Porter Novelli.
Potter LD, Duke JC, Nolin MJ, Judkins D, Huhman M. 2004. Evaluation of the CDC VERBCampaign: Findings from the Youth Media Campaign Longitudinal Survey, 2002-2003.Atlanta, GA: CDC.
PR Newswire. 2004. Kellogg introduces reduced-sugar versions of leaping kids’ brands, frostedflakes and fruit loops. News Release. April 21.
Pratt M, Macera CA, Blanton C. 1999. Levels of physical activity and inactivity in childrenand adults in the United States: Current evidence and research issues. Med Sci SportsExerc 31(11 Suppl):S526-S533.
Prentice AM, Jebb SA. 2003. Fast foods, energy density and obesity: A possible mechanisticlink. Obes Rev 4(4):187-194.
Randolph W, Viswanath K. 2004. Lessons learned from public health mass media campaigns:Marketing health in a crowded media world. Annu Rev Health 25:419-437.
Reger B, Wootan MG, Booth-Butterfield S. 1999. Using mass media to promote healthyeating: A community-based demonstration project. Prev Med 29(5):414-421.
Reger B, Cooper L, Booth-Butterfield S, Smith H, Bauman A, Wootan M, Middlestadt S,Marcus B, Greer F. 2002. Wheeling Walks: A community campaign using paid media toencourage walking among sedentary older adults. Prev Med 35(3):285-292.
Renger R, Steinfelt V, Lazarus S. 2002. Assessing the effectiveness of a community-basedmedia campaign targeting physical inactivity. Fam Community Health 25(3):18-30.
Richwine L. 2004. McDonald’s launches anti-obesity campaign. Reuters. News Release. April15.
Rideout VJ, Vandewater EA, Wartella EA. 2003. Zero to Six: Electronic Media in the Livesof Infants, Toddlers and Preschoolers. Kaiser Family Foundation.
Roberts D, Foehr U, Rideout V, Brodie M. 1999. Kids and Media @ the New Millennium.Menlo Park, CA: The Henry J. Kaiser Family Foundation.
Robinson JP, Godbey G. 1999. Time for Life. The Surprising Ways That Americans UseTheir Time. 2nd ed. University Park, PA: Pennsylvania State University Press.
Rolls BJ. 2003. The supersizing of America. Portion size and the obesity epidemic. NutritionToday 38(2):42-53.
Rolls BJ, Engell D, Birch LL. 2000. Serving portion size influences 5-year-old but not 3-year-old children’s food intakes. J Am Diet Assoc 100(2):232-234.
Rolls BJ, Morris EL, Roe LS. 2002. Portion size of food affects energy intake in normal-weight and overweight men and women. Am J Clin Nutr 76(6):1207-1213.
Rolls BJ, Roe LS, Kral TV, Meengs JS, Wall DE. 2004a. Increasing the portion size of apackaged snack increases energy intake in men and women. Appetite 42(1):63-69.
357

A NATIONAL PUBLIC HEALTH PRIORITY 191
Rolls BJ, Ello-Martin JA, Carlton Tohill B. 2004b. What can intervention studies tell us aboutthe relationship between fruit and vegetable consumption and weight management? JNutr 62(1):1-17.
Roper ASW. 2003 Roper Youth Report. New York, NY. [Online]. Available: http://www.roperasw.com/products/ryr.html [accessed May 3, 2004].
Siegel M. 2002. The effectiveness of state-level tobacco control interventions: A review ofprogram implementation and behavioral outcomes. Annu Rev Public Health 23(1):45-71.
Smiciklas-Wright H, Mitchell D, Mickle S, Goldman J, Cook A. 2003. Foods commonlyeaten in the United States, 1989-1991 and 1994-1996: Are portion sizes changing? J AmDiet Assoc 103(1):41-47.
Soumerai SB, Ross-Degnan D, Kahn JS. 1992. Effects of professional and media warningsabout the association between aspirin use in children and Reye’s syndrome. Milbank Q70(1):155-182.
Stables GJ, Subar AF, Patterson BH, Dodd K, Heimendinger J, Van Duyn MA, Nebeling L.2002. Changes in vegetable and fruit consumption and awareness among US adults:Results of the 1991 and 1997 5 a Day for Better Health Program surveys. J Am DietAssoc 102(6):809-817.
Stewart H, Blisard N, Bhuyan S, Nayga RM Jr. 2004. The Demand for Food Away fromHome. Full Service or Fast Food? Washington, DC: Economic Research Service/U.S.Department of Agriculture. Agricultural Economic Report No. 829. [Online]. Available:http://www.ers.usda.gov/publications/AER829/ [accessed June 3, 2004].
Stipp H. 1993. New ways to reach children. Am Demog 15(8):50-56.Story M, French S. 2004. Food advertising and marketing directed at children and adolescents
in the US. Int J Behav Nutr Phys Act 1(1):3-20. [Online]. Available: http://www.ijbnpa.org/content/1/1/3 [accessed August 9, 2004].
Stubenitsky K, Aaron JI, Catt SL, Mela DJ. 1999. The influence of recipe modification andnutritional information on restaurant food acceptance and macronutrient intakes. PublicHealth Nutr 3(2):201-209.
Sturm R. 2004. The economics of physical activity: Societal trends and rationales for inter-ventions. Am J Prev Med 27(3S):126-135.
Sturm R. 2005a (in press). Childhood Obesity—What Can We Learn from Existing Data onSocietal Trends. Part 1. Preventing Chronic Disease [Online]. Available: http://www.cdc.gov/pcd/issues/2005/jan/04_0038.htm [access after December 15, 2004].
Sturm R. 2005b (in press). Childhood Obesity—What Can We Learn from Existing Data onSocietal Trends. Part 2. Preventing Chronic Disease [Online]. Available: http://www.cdc.gov/pcd/issues/2005/apr/04_0039.htm [access after March 15, 2005].
Taylor CB, Fortmann SP, Flora J, Kayman S, Barrett DC, Jatulis D, Farquhar JW. 1991.Effect of long-term community health education on body mass index. The Stanford Five-City Project. Am J Epidemiol 134(3):235-249.
USDA (U.S. Department of Agriculture). 1992. The Food Guide Pyramid. A Guide to DailyFood Choice. Home and Garden Bulletin 252. Washington, DC: USDA Human Nutri-tion Information Service.
USDA. 1999. Food Portions and Servings: How Do They Differ? Washington, DC: USDACenter for Nutrition Policy and Promotion. Nutrition Insights 11.
USDA. 2000. Serving Sizes in the Food Guide Pyramid and the Nutrition Facts Panel: What’sDifferent and Why? Washington, DC: USDA Center for Nutrition Policy and Promo-tion. Nutrition Insights 22.
USDA. 2003a. Federal Register Notice on Technical Revisions to the Food Guide Pyramid.Table 2: Energy Levels for Proposed Food Intake Patterns. Center for Nutrition Policyand Promotion. [Online]. Available: http://www.cnpp.usda.gov/pyramid-update/FGP%20docs/TABLE%202.pdf [accessed August 25, 2004].
358

192 PREVENTING CHILDHOOD OBESITY
USDA. 2003b. The Food Guide Pyramid for Young Children. Center for Nutrition Policy andPromotion. [Online]. Available: http://www.usda.gov/cnpp/KidsPyra/LittlePyr.pdf [ac-cessed April 21, 2004].
U.S. Kids’ Lifestyles Market Research. 2003. Kids’ Lifestyles–US. [Online]. Available: http://www.the-infoshop.com/study/mt16815_kids_lifestyles.html [accessed June 4, 2004].
U.S. Market for Kids Foods and Beverages. 2003. 5th edition. Report summary. [Online].Available: http://www.marketresearch.com/researchindex/849192.html#pagetop [ac-cessed April 17, 2004].
Villani S. 2001. Impact of media on children and adolescents: A 10-year review of the re-search. J Am Acad Child Adolesc Psychiatry 40(4):392-401.
Vuori I, Paronen O, Oja P. 1998. How to develop local physical activity promotionprogrammes with national support: The Finnish experience. Patient Educ Couns33(S1):S111-S120.
Wallack L, Dorfman L. 1996. Media advocacy: A strategy for advancing policy and promot-ing health. Health Education Quarterly 23(3):293-317.
Wansink B. 1996. Can package size accelerate usage volume? Journal of Marketing 60(3):1-14.
Wansink B. 2004. The de-marketing of obesity. In: Wansink B, Smith AF, eds. MarketingNutrition: Soy, Functional Foods, Biotechnology and Obesity. Champaign, IL: Univer-sity of Illinois Press.
Wansink B, Park S. 2000. Accounting for taste: Prototypes that predict preference. J DatabaseMarketing 7(4):308-320.
Warner KE, Martin EG. 2003. The US tobacco control community’s view of the future oftobacco harm reduction. Tob Control 12(4):383-390.
Wilcox BL, Kunkel D, Cantor J, Dowrick P, Linn S, Palmer E. 2004. Report of the APA TaskForce on Advertising and Children. Washington, DC: American Psychological Associa-tion.
Williams JD, Achterberg C, Sylvester GP. 1993. Target marketing of food products to ethnicminority youth. Ann NY Acad Sci 699:107-114.
Wimbush E, MacGregor A, Fraser E. 1998. Impacts of a national mass media campaign onwalking in Scotland. Health Promot Int 13(1):45-53.
Wong F, Huhman M, Heitzler C, Asbury L, Bretthauer-Mueller R, McCarthy S, Londe P.2004. VERB™ —A social marketing campaign to increase physical activity among youth.Preventing Chronic Disease 1(3). [Online]. Available: http://www.cdc.gov/pcd/issues/2004/jul/04_0043.htm [accessed June 17, 2004].
Wray R, Hornik R, Gandy O, Stryker J, Ghez M, Mitchell-Clark K. 2004. Preventing domes-tic violence in the African American community: Assessing the impact of a dramaticradio serial. J Health Commun 9(1):31-52.
Yach D, Hawkes C, Epping-Jordan JE, Galbraith S. 2003. The World Health Organization’sframework convention on tobacco control: Implications for global epidemics of food-related deaths and disease. J Public Health Policy 24(3/4):274-290.
Young DR, Haskell WL, Taylor CB, Fortmann SP. 1996. Effect of community health educa-tion on physical activity knowledge, attitudes, and behavior. The Stanford Five-CityProject. Am J Epidemiol 144(3):264-274.
359

193
Local Communities
6
Prevention of obesity in children and youth is, ultimately, about com-munity—extending beyond individuals and families and often be-yond geographic boundaries to encompass groups of people who
share values and institutions (Pate et al., 2000). In recent years, manypublic health professionals and community leaders have recognized theneed for community involvement in preventing disease and promotinghealthful lifestyles. Consequently, they have attempted to capitalize on thenaturally occurring strengths, capacities, and social structures of local com-munities to institute health-promoting change.
Many factors in the community setting affect the health of children andyouth. Does the design of the neighborhood encourage physical activity?Do community facilities for entertainment and recreation exist, are theyaffordable, and do they encourage healthful behaviors? Can children pur-sue sports and other active-leisure activities without excessive concernsabout safety? Are there tempting-yet-healthful alternatives to staying-at-home sedentary pastimes such as watching television, playing video games,or browsing the Internet? Are sound food choices available in local storesand at reasonable prices?
Communities can consist of people living or working in particular localareas or residential districts; people with common ethnic, cultural, or reli-gious backgrounds or beliefs; or people who simply share particular inter-ests. But intrinsic to any definition of a community is that it seeks to protectfor its members what is shared and valued. In the case of obesity preventionin children and youth, what is “shared and valued” is the ability of children
360

194 PREVENTING CHILDHOOD OBESITY
to grow up with healthy and productive bodies and minds. But “to protect”is not necessarily a given. Achieving the vision of Healthy People 2010—“healthy people in healthy communities”—depends on the capacity of com-munities to foster social norms that support energy balance and a physicallyactive lifestyle (DHHS, 2000b).
This report as a whole examines a variety of types of communities andthe ways in which improvements can be made in order to foster and pro-mote healthful food and physical activity choices and behaviors. This chap-ter focuses on the local community, using the term “community” to refer tothe town, city, or other type of geographic entity where people share com-mon institutions and, usually, a local government. Of course, within eachlocal community there are many interdependent smaller networks of resi-dential neighborhoods, faith-based communities, work communities, andsocial communities.
The intent of this chapter’s recommendations is not only to make a casefor raising the priority of childhood obesity prevention in our communities,but also to identify common interests that can spark collaborative commu-nity initiatives for addressing that goal. Many communities and organiza-tions across the United States are actively working to address physicalactivity and nutrition-related issues; examples are highlighted throughoutthe chapter (Boxes 6-1 through 6-5).
MOBILIZING COMMUNITIES
By stepping outside the traditional view of obesity as a medical prob-lem, we may more fundamentally focus on the many institutions, organiza-tions, and groups in a community that have significant roles to play inmaking the local environment more conducive to healthful eating and physi-cal activity. Table 6-1 illustrates categories of many of the stakeholdergroups that could be involved in obesity prevention efforts. For communityefforts, key stakeholders include youth organizations, social and civic orga-nizations, faith-based groups, and child-care centers; businesses, restau-rants, and grocery stores; recreation and fitness centers; public health agen-cies; city planners and private developers; safety organizations; and schools.
Community-based obesity prevention efforts differ from those of schooland home settings (Pate et al., 2000), but potentially supplement and rein-force the messages received in those settings. Young people, particularlyadolescents, often spend a large part of their free time in community locales(e.g., recreational or entertainment centers, shopping areas, parks, fast foodrestaurants). These informal settings, which do not have the stresses ofgrades or other school situations, may offer environments that are moreconducive to trying new activities and foods. Additionally, community set-tings offer the potential for involving parents and other adult role models in
361

LOCAL COMMUNITIES 195
TABLE 6-1 Examples of Stakeholder Groups in the Prevention ofChildhood Obesity
Children, Youth, Parents, Families Health- and Medical-CareProfessional Societies
Child- and Youth-Centered Organizations Disciplinary organizations and societiesProgram, service, and advocacyorganizations (e.g., Boys and Girls Clubs, Health-Care Delivery Systems4H, Girl Scouts, Boy Scouts, YMCA, Hospitals, health clinics, school-basedYWCA, National Head Start Association, facilities, work-site health facilitiesChildren’s Defense Fund, NationalAssociation for Family Child Care) Health-Care Insurers, Health Plans, and
Quality Improvement and AccreditingCommunity-Based Organizations OrganizationsCommunity coalitions, civic organizations, Public and private health-care providersfaith-based organizations, ethnic and and insurance reimbursement institutionscultural organizations such as Medicaid and health maintenance
organizations; quality improvement andCommunity Development and Planning accrediting organizations (e.g., NationalArchitects, civil engineers, transportation Committee for Quality Assurance)and community planners, privatedevelopers, neighborhood associations Mass Media, Entertainment, Recreation,
and Leisure IndustriesEmployers and Work Sites Television, radio, movies, print, andEmployers and corporate policy makers, electronic media; journalists; commercialemployee advisory committees sponsors and advertisers; Internet
websites and advertisers; computerFood and Beverage Industries, Food and video-entertainment industryProducers, Advertisers, Marketers, and representativesRetailersCorporate and local food producers and Public Health Professionalsretailers (e.g., food and beverage industries,grocery stores, supermarkets, restaurants, Recreation and Sports Enterprisesfast food outlets, corner stores, farmers’ Local, collegiate, and professional sportsmarkets, community gardens) organizations; recreation facilities;
recreation and sport equipmentFoundations and Nonprofit Organizations manufacturers, advertisers, marketers,Government Agencies and Programs and retailersFederal, state, county, and local elected orappointed decision-makers (e.g., education Researchersboards and agencies, public health Biomedical, public health, and socialagencies, parks and recreation scientists; universities; private industrycommissions, planning and zoningcommissions, law enforcement agencies) Schools, Child-Care Programs
Educators and school administrators,Health-Care Providers food service personnel, after-schoolPediatricians, family physicians, nurses and program providers, coaches, schoolnurse practitioners, physician assistants, boards, school designers (siting anddietitians, occupational-health providers, construction), child-care providersdentists
362

196 PREVENTING CHILDHOOD OBESITY
promoting healthful behaviors (Pate et al., 2000). In enhancing local assetsfor promoting physical activity—that is, in designing and revamping com-munity facilities and neighborhoods—communities should consider issuesrelated to cultural and social acceptability, availability (proximity),affordability, and accessibility (ease of use).
Community Stakeholders and Coalitions
Community-Based Interventions: Framework and Evidence Base
“Ecological frameworks,” which have been applied across a variety ofsettings and public health issues to change people or change the environ-ment (Glanz, 1997), suggest that it is important to involve individuals,organizations, communities, and health policy makers in producing desiredeffects on health (Baker and Brownson, 1998). Given the interactive natureof virtually all elements of a community, most effective interventions act atmultiple levels. Moreover, tapping a wide range of local community lead-ers, organizations, businesses, and residents can result in local ownership ofthe issue and effectively leverage limited resources (Pate et al., 2000).
Community-wide campaigns and interventions. The most relevant evidencefor large-scale community-wide efforts comes from studies aimed at reduc-ing cardiovascular risk factors through dietary change and increased physi-cal activity. These interventions have often used multiple strategies, includ-ing media campaigns (see Chapter 5), community mobilizations, educationprograms for health professionals and the general public, modifications ofphysical environments, and health screenings and referrals; in some cases,home- and school-based interventions were also incorporated (Shea andBasch, 1990).
The Stanford Three Community Study, Stanford Five-City Project,Minnesota Heart Health Program (MHHP), Pawtucket Heart Health Pro-gram, and North Karelia Project (in Finland) have demonstrated the feasi-bility of community-based approaches in promoting physical activity andchanges in dietary intake (Farquhar et al., 1977, 1990; Maccoby et al.,1977; Luepker et al., 1994; Young et al., 1996; Puska et al., 2002). Theresults of these studies for adults have been somewhat inconsistent, al-though modest positive changes in diet and physical activity have generallybeen seen when a community that received the intervention was comparedwith one that had not. The strongest positive results were obtained by theextensive North Karelia project, which examined the effects of multipleinterventions on the high incidence of coronary artery disease (Pietinen et
363

LOCAL COMMUNITIES 197
al., 2001; Puska et al., 2002). This study, being long-term and multifocal,may be the best model for childhood obesity prevention efforts.
MHHP’s Class of 1989 Study provides some insights into the potentialimpact of community-based programs focused on children and youth(Kelder et al., 1993, 1995). This study examined changes in nutrition andaerobic activity among groups of students, starting when they were sixth-graders and extending through 12th grade. Interventions included a school-based curriculum and a number of other community-based approaches thatwere not designed specifically for children (including labeling of heart-healthful restaurant and grocery store items; media campaigns; and screen-ing for heart disease risk factors). Positive changes were seen in the youngpeople’s levels of physical activity and their nutritional knowledge anddecision-making.
Community campaigns aimed at preventing tobacco use by childrenand youth also provide evidence of the feasibility of using this approach foraddressing major public health problems. The Midwestern PreventionProject, the North Karelia Youth Project, and MHHP’s Class of 1989 Studyeach found reductions in youth smoking rates that were maintained overtime (IOM, 1994). It should be stressed that each of these studies had astrong school-based prevention intervention that complemented a commu-nity-wide program, and isolating the effects of the community-wide pro-gram was not possible.
Community programs for children and youth. Programs involving specificcommunity-based organizations have also been found to aid health promo-tion efforts. Studies with civic, faith-based, and social organizations haveestablished the feasibility of developing programs in a variety of settingsthat can be effective in improving nutritional knowledge and choices, in-creasing physical activity, and in some cases in reducing body weight or
BOX 6-1Girls on the Run
Girls on the Run is a nonprofit organization that works with local volunteers andcommunity-level councils to encourage preteen girls to develop self-respect andhealthful lifestyles through running (Girls on the Run, 2004). A 12-week, 24-lessoncurriculum has been developed for use in after-school programs and at recreationcenters and other locations. Evaluation of the program has found improvements inparticipants’ self-esteem, body-size satisfaction, and eating attitudes and behav-iors (DeBate, 2002).
364

198 PREVENTING CHILDHOOD OBESITY
maintaining healthy body weight (IOM, 2003). For example, Cullen andcolleagues (1997) found that Girl Scouts who participated with their troopin nutrition classes including tasting sessions and materials sent home ex-hibited increased levels of fruit and vegetable consumption. Furthermore,community programs often are focused on high-risk populations and offerthe opportunity to implement culturally appropriate interventions andevaluate their impact (Yancey et al., 2004).
Community coalitions. Building coalitions involves a range of public- andprivate-sector organizations that, together with individual citizens, focus ona shared goal and leverage the resources of each group through joint actions(Table 6-2). It has been pointed out, however, that while the strength of
TABLE 6-2 Unique Characteristics of Effective Community Coalitions
Characteristic Description
Holistic and comprehensive Allows the coalition to address issues that itdeems as priorities; well illustrated in theOttawa Charter for Health Promotion
Flexible and responsive Coalitions address emerging issues and modifytheir strategies to fit new community needs
Build a sense of community Members frequently report that they value andreceive professional and personal support fortheir participation in the social network of thecoalition
Build and enhance resident A structure is provided for renewed civicengagement in community life engagement; the coalition becomes a forum
where multiple sectors can engage with eachother
Provide a vehicle for As community coalitions solve local problems,community empowerment they develop social capital, allowing residents
to have an impact on multiple issues
Allow diversity to be valued As communities become increasingly diverse,and celebrated coalitions provide a vehicle for bringing
together diverse groups to solve commonproblems
Incubators for innovative Problem solving occurs not only at local levels,solutions to large problems but at regional and national levels; local leaders
can become national leaders
SOURCE: Adapted from Wolff, 2001.
365

LOCAL COMMUNITIES 199
coalitions is in mobilizing the community to work for change, they are notgenerally designed to develop or manage specific community services oractivities (Chavis, 2001).
Community collaborative efforts focused on health are of growing in-terest across the United States. Models are being refined on ways to linkcommunity organizations, community leaders and interested individuals,health-care professionals, local and state public health agencies, and univer-sities and research organizations (Lasker et al., 2001; Lasker and Weiss,2003). Community coalitions have played significant roles in efforts toprevent or stop tobacco use. The American Stop Smoking InterventionStudy (ASSIST), which was funded by the National Cancer Institute andfeatured the capacity building of community coalitions, targeted tobaccocontrol efforts at the state and local levels. States with ASSIST programshad greater decreases in adult smoking prevalence than non-ASSIST states(Stillman et al., 2003); factors identified as contributing to participationand satisfaction with the ASSIST coalitions included skilled members andeffective communication strategies (Kegler et al., 1998). Coalition buildingand community involvement also have been effective in community fluori-dation efforts (Brumley et al., 2001).
Health Disparities
Although this report focuses primarily on population-wide approachesthat have the potential to improve nutrition and increase physical activityamong all children and youth, the committee recognizes the additional needfor specific preventive efforts. Children and youth in certain ethnic groupsincluding African-American, Mexican-American, American-Indian, and Pa-cific Islander populations, as well as those whose parents are obese andthose who live in low-income households or neighborhoods, are dispropor-tionately affected by the obesity epidemic (Chapter 2). Many issues—in-cluding safety, social isolation, lack of healthy role models, limited access tofood supplies and services, income differentials, and the relative unavail-ability of physical activity opportunities—may be barriers to healthierlifestyles for these and other high-risk populations. Moreover, as discussedin Chapter 3, perceptions about body image and healthy weight can varybetween cultures and ethnic groups, and these groups can manifest differinglevels of comfort with having an elevated weight. Furthermore, there maybe a “communication gap” in making information about the health con-cerns of childhood obesity widely available.
As a result, culturally appropriate and targeted intervention strategiesare needed to reach high-risk populations. There are examples of thesetypes of strategies having positive results. For example, a 10-county studyof churches participating in the North Carolina Black Churches United for
366

200 PREVENTING CHILDHOOD OBESITY
Better Health project found that church-based interventions (includinggroup activities, changes in food served at church events, and disseminationof educational materials) resulted in increased fruit and vegetable consump-tion by adults participating in the intervention (Campbell et al., 1999). Pilotstudies from the Girls Health Enrichment Multi-site Study (GEMS), a re-search program designed to develop and test interventions for preventingoverweight and obesity in African-American girls, have included a varietyof community, after-school, and family-based components in a range ofsettings (Baranowski et al., 2003; Beech et al., 2003; Robinson et al., 2003;Story et al., 2003). For example, the Stanford GEMS pilot study in 61families tested a model that combined after-school dance classes for girlswith family-based efforts to reduce time spent watching television. Positivetrends were observed regarding body mass index (BMI), waist circumfer-ence, physical activity, and television viewing in the treatment group whencompared to the control group (Robinson et al., 2003). These studies dem-onstrate the feasibility of implementing relevant community programs; twoof these studies have been expanded to evaluate programs with larger studypopulations over a 2-year period (Kumanyika et al., 2003).
However, much remains to be learned about interventions that canreduce or alleviate the risk factors for childhood obesity in high-risk popu-lations. Prevention efforts must be considerate of culture, language, andinequities in social and physical environments (PolicyLink, 2002). Further-more, because these populations traditionally have been disenfranchised,special efforts must be made to gain their trust, both among individuals andat the community level. The 39-community Partnership for the Public’sHealth project in California and other community-centered public healthinitiatives have demonstrated that the most progress is made when anintervention engages community members themselves in the program’s as-sessment, planning, implementation, and evaluation (Partnership for thePublic’s Health, 2004).
Private and public efforts that work to eliminate health disparitiesshould include obesity prevention as one of their primary areas of focus.Some of the many ongoing efforts span the public and private sectors aswell as the local, regional, state, and national levels and focus on diabetesand other chronic diseases for which obesity is a risk factor. For example,the Centers for Disease Control and Prevention’s (CDC’s) REACH 2010initiative has broad-based collaboration within the U.S. Department ofHealth and Human Services (DHHS) and the private sector (CDC, 2004b)to fund and support demonstration projects and community coalitions fo-cused on eliminating health disparities. Each coalition includes community-based organizations and the local or state health department or a universityor research organization. Efforts to date have included community andtribal efforts to address diabetes and cardiovascular disease risk factors.
367

LOCAL COMMUNITIES 201
These efforts should aim to increase access to culturally and linguisti-cally appropriate nutritional and physical activity information and skillsand should support community-based collaborative programs that addressthe inequities in obesity rates between populations.
The communities themselves, meanwhile, need to involve all segmentsof the local population in developing both community-wide interventionsand those that focus on high-risk populations. Furthermore, local commu-nities—with the assistance of state and federal governments, nonprofit or-ganizations, and the private sector—need to grapple with the underlyingand long-standing socioeconomic barriers that result in limited opportuni-ties for physical activity (e.g., safe parks and playgrounds) and affordablehealthful foods (e.g., produce markets or large grocery stores). Opportuni-ties to foster such coalitions and to develop effective programs for high-riskpopulations will be widened if there is grassroots participation by the citi-zens most affected by the problem.
Next Steps for Community Stakeholders
Many community organizations are currently involved in efforts toimprove the well-being of their children and youth regarding a number ofhealth and safety concerns, such as tobacco and alcohol abuse, sexuallytransmitted diseases, pedestrian and bike safety, and prevention of motor
BOX 6-2Kids Off the Couch
Kids Off the Couch is a community collaborative pilot project in Modesto, Califor-nia, that works with parents and caregivers to prevent obesity in children up to 5years of age. The project’s goal is to influence behavioral changes in food selec-tion and physical activity among parents and primary caregivers. The programprovides parents and caregivers with:
• Information on the risks of childhood obesity• Tools to assist their children in achieving normal growth and healthy devel-
opment• Hands-on demonstrations on how to prepare healthful and tasty foods that
families will eat and enjoy• Instruction on how to engage their families in physical activity.
This project is a collaborative effort of numerous partners including the local schoolsystem, health services agency, hospitals, and health clubs; the American CancerSociety; Blue Cross of California; and the University of California Cooperative Ex-tension.
368

202 PREVENTING CHILDHOOD OBESITY
vehicle injuries. Increased media coverage and the voices of concerned indi-viduals and groups should now be prompting these community groups andothers, including the broad range of stakeholders they work with, to focuson childhood obesity prevention. In particular, there is a need to galvanizeaction and expand opportunities for healthful eating and physical activityat the community level.
Community youth organizations can have an impact not only by adapt-ing their own programs to include emphasis on healthful eating and physi-cal activity, but also by joining with other organizations to form coalitionsto promote community-wide efforts. Additionally, innovative approachesto community recreational programs are needed. Traditional organizedcompetitive sports programs are an important facet of the community andoffer physical activity opportunities for many children and adolescents.However, competitive sports programs are not of interest to all individualsand it is important to expand the range of options to include not only teamand individual sports but also other types of physical activity (e.g., dance,martial arts) (CDC, 1997b). It will also be important to help families over-come potential obstacles—including transportation, fees, or special equip-ment—to program participation (CDC, 1997b).
Community youth organizations (such as Boys and Girls Clubs, GirlsScouts, Boy Scouts, 4H, and YMCA) should expand existing programs andestablish new ones that widen children’s opportunities to be physicallyactive and maintain a balanced diet. These programs should complementand seek linkages with similar efforts by schools, local health departments,and other community organizations. Furthermore, evaluation of these pro-grams should be encouraged.
Employers and work sites are another important component of com-munity coalitions. The work site affects children’s health both indirectly,through its influence on employed parents’ health habits, and directly,through programs that may engage the entire family. Workplaces shouldoffer healthful food choices and encourage physical activity. In businesseswhere on-site child care is provided, attention should be paid to ensuringthat children have a balanced diet and adequate levels of physical activity.
Local organizations, businesses, local public health agencies, and otherstakeholders increasingly have been joining together to address health is-sues through community coalitions, wherein the sum is greater than theparts, and meaningful progress on an issue becomes more likely. Coalitionscan make obesity prevention a local priority and can design and implementprograms that best fit the local area. It is important for coalitions to beinclusive, promote broad involvement, and represent as many constituen-cies as possible (see Table 6-2). As coalitions become established, it is alsoimportant for them to periodically reassess their status to ensure they re-main inclusive and do not outlive their usefulness. Because of their nature,
369

LOCAL COMMUNITIES 203
coalitions exhibit wide variation in their structure and in the range oforganizations, agencies, and individuals involved. However, to be sustainedall require strong and ongoing leadership that is selected by coalition mem-bers.
Communities should establish and promote coalitions of key publicand private stakeholders (including community youth organizations, localgovernment, state and local public health agencies, civic and communitygroups, businesses, faith-based groups) to address the problem of child-hood obesity by increasing the opportunities for physical activity and abalanced diet. Partnering with academic centers will be important for com-munity-based research.
To have a long-term and significant impact on the public’s health,community health initiatives should include programs that work towardsinitiating changes at many levels including changes in individual behaviors,family environments, schools, workplaces, the built environment, and pub-lic policy (Kaiser Permanente, 2004). This ecologic approach (see Chapter3) is a critical part of a framework for community-level initiatives thatsupport a health-promoting environment. Communities should seek to un-dertake a comprehensive, interrelated set of interventions operating at eachecological level and in multiple sectors and settings. Factors that have beenfound to be involved in sustaining successful community change effortsinclude a large number of environmental changes focused on a small num-ber of categorical outcomes; intensity of behavior change strategy; durationof interventions; and use of appropriate channels of influence to reachappropriate targets (Fawcett et al., 2001).
Community-level approaches are among the most promising strategiesfor closing the disparities gap (PolicyLink, 2002; Prevention Institute, 2002).These strategies include improvements in the social and economic environ-ment (e.g., through the creation of health-promoting social norms, eco-nomic stability, and social capital development), the physical environment(e.g., access to affordable healthful food and physical activity resources),and community services (e.g., after-school programs) (Prevention Institute,2003). The goals of improving community health and addressing racial andethnic health disparities are closely aligned.
The committee acknowledges the limited amount of empirical researchthat directly examines the effects of changes in community programs orformation of coalitions on obesity prevalence. However, interventions suchas GEMS demonstrate the feasibility of these interventions, and the experi-ence gained in other public health areas provides additional support forrecommendations in these areas. As with other types of obesity preventioninterventions (noted throughout this report), there is a critical need toensure that community intervention programs are thoroughly evaluated.The impacts of coalitions have sometimes gone undetected because of inap-
370
204 PREVENTING CHILDHOOD OBESITY
propriate (or weak) evaluation plans. This is most likely to occur when (1)the evaluation timeline is too short, (2) the evaluation strategy focuses onunrealistic or distant health outcomes instead of intermediate indicatorsthat can be influenced by coalition activity, (3) measures are incapable ofdetecting valid indicators of change, or (4) alternative explanations foreffects are not taken into account (Kreuter and Lezin, 2002). In order toassess a community coalition’s level of change, and to allow communitieselsewhere to profit from its experience (good, bad, or in between), realisticevaluation plans must be set up and be incorporated into the initial plan-ning and implementation of coalitions and interventions. Ongoing evalua-tion that relies on learning and feedback is also an integral component ofthe community change process. Community health initiatives by their na-ture are confronted with unpredictable variables; feedback should be usedto adjust subsequent efforts.
The standard of practice in comprehensive community health improve-ment efforts is to fully engage community organizations and communityresidents, not just as subjects of research but as the drivers and owners ofevaluation—“community-based participatory research” (Minkler andWallerstein, 2003). Using this approach, community members are involvedin identifying and framing of the problem or goals; developing a logicmodel or framework for achieving success; identifying research questionsand appropriate research methods; documenting the intervention and itseffects; understanding the data; and using the data to make midcourseadjustments (Fawcett et al., 2004).
To provide the impetus for community programs and efforts, a coordi-nated network of community-based demonstration projects should be es-tablished. These projects would be run by community organizations linkedwith public health departments and in partnership with academic institu-tions to provide support, training, and evaluation. Seed funding for theprojects could come from an expansion of federal programs, particularlyCDC’s state-based Nutrition and Physical Activity Program to PreventObesity and Other Chronic Diseases (see Chapter 4) and the DHHS Stepsto a Healthier U.S. initiative.
Built Environment
Designing Communities and Neighborhoods toEncourage Physical Activity
Communities should provide places where children can play outside,particularly within their residential neighborhoods, and where they cansafely walk, bike, or travel by other self-propelled means to destinationssuch as the park, playground, or school. Hoefer and colleagues (2001)
371

LOCAL COMMUNITIES 205
found that local neighborhood and parks were the most frequent settingsfor physical activity among middle school students. Three studies of youngchildren found that the amount of time a child spent outside was the mostpowerful correlate of his or her physical activity level (Klesges et al., 1990;Baranowski et al., 1993; Sallis et al., 1993). However, pedestrian injuriesthat result from collisions with automobiles are a leading cause of injurydeath for children aged 5 years and older (Grossman, 2000), and trafficspeed is a key determinant of their injury risk (Jacobsen et al., 2000). Thechallenge is thus to create places where children are safe to walk, bike, andplay, so that the benefits of increased physical activity are not offset byincreases in injuries.
Because changes to the built environment can enhance opportunitiesfor children and youth to safely play outside and be more physically active,such changes are a critical component of any action plan to prevent child-hood obesity. Interest in the role of the built environment in determininglevels of physical activity has grown over the past decade, and renewedefforts are currently under way to reconnect the goals of urban planningand public health and to identify the factors that influence physical activityand travel behavior (Handy et al., 2002; Hoehner et al., 2003; Corburn,2004). A concurrent study by the Transportation Research Board is exam-ining issues regarding transportation, land use, and health in greater depththan this report, though for the population as a whole.
Encouraging children and youth to be physically active involves provid-ing them with opportunities to walk, bike, run, skate, play games, or en-gage in other activities that expend energy. However, in many neighbor-hoods children do not have safe places—because of vehicular traffic, orhigh crime rates, or both—in which to play outside. In other locales, chil-dren may lack adequate sidewalks or paths on which to bike, skate, orsimply walk to local destinations such as schools, parks, or grocery stores.This is a result of regulations and practices that guide the development oftransportation systems and design of neighborhoods. The needs of the carhave often been emphasized over the needs of pedestrians and bicyclists.
A recently published observational study examined the associationsbetween community physical activity-related settings (e.g., sports areas,public pools and beaches, parks and green space, and bike paths) and race,ethnicity, and socioeconomic status in 409 communities throughout theUnited States (Powell et al., 2004). The researchers found that higher me-dian household income and lower poverty rates were associated with in-creasing levels of available physical activity-related facilities and settings.Communities with higher proportions of ethnic minorities had fewer physi-cal activity-related settings. There are many communities and neighbor-hoods where access to facilities for physical activity is an issue that needs tobe addressed.
372

206 PREVENTING CHILDHOOD OBESITY
Correlational studies. Convenient access to recreational facilities emergesas a consistent correlate of physical activity, although most research hasbeen conducted with adults (Sallis et al., 1998; Humpel et al., 2002). A2002 review by Humpel and colleagues summarized the results of 16 cross-sectional studies, published between 1990 and 2001, on the link betweenphysical activity and the physical environment. Access to facilities such asbicycle paths or parks showed significant positive associations with physi-cal activity, while measures of a lack of facilities (or inadequate facilities)showed significant negative associations. Awareness of and satisfactionwith facilities also showed significant associations with physical activity, asdid measures of local aesthetics, such as attractive neighborhoods or enjoy-able scenery.
Although there are fewer studies on the relationships between youngpeople’s access to recreational facilities and their levels of physical activity,they are nevertheless consistent with the findings for adults. A comprehen-sive review by Sallis and colleagues (2000a) on the correlates of physicalactivity among children found a significant positive association with accessto recreational facilities and programs, and two out of three studies involv-ing adolescents found a significant positive association as well. However, astudy of the neighborhoods of low-income preschoolers in Cincinnati, Ohio,found that overweight was not associated with proximity to playgrounds(Burdette and Whitaker, 2004). These results suggest that access to recre-ational facilities may be more important for youth than for young childrenor that reported physical activity may not always translate into differencesin weight.
Available evidence (limited to the behavior of all residents or of adults
BOX 6-3Discovering Public Spaces as Neighborhood Assets in Seattle
Feet First, a Seattle-area nonprofit organization, is using its Active Living byDesign grant from the Robert Wood Johnson Foundation to help neighborhoodresidents take a closer look at their streets. As part of their project’s activities, FeetFirst staff organize neighborhoods through monthly walking audits. On these walks,the staff train groups of up to 40 neighbors to see their streets as an untappedresource with potential for physical activity. At the end of the one-mile, two-hourinspections, participants receive notes with photos and maps documenting assets,possible improvements, and needed policy changes. The organization assists cit-izens in working with city agencies and departments to address the neighborhoodconcerns.
Evaluation has been built into the design and implementation of the Feet Firstprogram and is now in progress. Results will be used to assess next steps andinform the planning of future programs.
373

LOCAL COMMUNITIES 207
only) shows that the design of streets and neighborhoods is correlated withwalking. A recent review of studies (Saelens et al., 2003) comparing “high-walkable” and “low-walkable” neighborhoods found that among personsaged 18 to 65 years, the frequency of walking trips was twice as high in thehigh-walkable locales. The high-walkable neighborhoods were character-ized as those that had higher residential density, street connectivity (fewcul-de-sacs), aesthetics, safety, and mixed land use (stores and serviceslocated within close proximity to residential areas).
Safety is often an important consideration in decisions by parents andchildren regarding outside activity. Safety concerns pertain to the speed andproximity of nearby traffic and to fears of crime; but other factors, such asunattended dogs and lack of street lighting, may also be pertinent. Researchhas shown that parents are more likely now than in the past to restrict theirchildren’s use of public spaces because of fear for their safety (Loukaitou-Sideris, 2003). Concerns about “traffic danger” and “stranger danger”have been reported as important influences on the decisions by parents todrive their children to school or not allow them to walk to the neighbor-hood park (Roberts, 1993; DiGuiseppi et al., 1998); furthermore, parentsreport that safety considerations are the most important factor in selectingplay spaces for their young children (Sallis et al., 1997).
Among adults, data from five states (Maryland, Montana, Ohio, Penn-sylvania, and Virginia) document a higher level of physical inactivity amongpersons who perceive their neighborhoods to be unsafe (CDC, 1999). Therealso appear to be large gaps in neighborhood safety across socioeconomicgroups. For example, a national study found that perception of neighbor-hood crime was almost twice as great among lower income populations asin higher income populations (Brownson et al., 2001). Thus, the crime rate,or the perception of crime, is likely to affect the likelihood of people walk-ing or bicycling in their neighborhoods.
Studies on the link between neighborhood crime and rates of physicalactivity among children and youth have shown inconsistent results. Gor-don-Larsen and colleagues (2000) studied a large adolescent cohort andfound that living in a high-crime neighborhood was associated with a de-creased likelihood that teenagers would participate in moderate-to-vigor-ous physical activity at high levels. However, a study by Zakarian andcolleagues (1994) looking at physical activity among minority adolescentsor children, who were predominantly of low socioeconomic status, foundno association with convenient facilities or neighborhood safety; anotherstudy found no association between these factors and overweight (Burdetteand Whitaker, 2004). On the other hand, Romero and colleagues (2001)studied fourth-grade students of diverse economic backgrounds and foundthat children from families of lower socioeconomic status perceived moreneighborhood hazards (including crime and traffic), but that this percep-
374

208 PREVENTING CHILDHOOD OBESITY
tion was significantly associated with more reported physical activity ratherthan less. This finding points to a problem documented by others (Doxey etal., 2003): children from families with lower socioeconomic status are moredependent on walking as a means of transportation than are children fromfamilies with higher socioeconomic status, but they also live in neighbor-hoods where walking is not as safe.
Intervention studies. Research that directly examines the impact of changesmade in the built environment on physical activity has been limited simplybecause increasing physical activity is often not the primary goal of theseinterventions and “pre-/post-” studies are difficult to conduct. Instead,changes to the built environment are often made because of safety concernsand the need to reduce the likelihood of traffic-related injuries. For ex-ample, the primary goal of traffic-calming programs—such as speed humps,traffic diverters, and “bulb-outs” (pavement structures that extend fromthe sidewalk at an intersection to force cars to take slower turns aroundcorners)—has been to reduce speeds and to lower the levels of traffic onresidential streets. Studies have been conducted of traffic levels and speeds,pedestrian-vehicle crashes, and pedestrian behavior both before and afterthe installation of traffic-calming devices (Huang and Cynecki, 2000, 2001;Retting et al., 2003). One recent study, for example, showed that speedhumps were associated with a lower probability of children being injuredwithin their neighborhood (Tester et al., 2004). However, no studies of theimpact of the installation of such devices on the physical activity of resi-dents in the area are available.
A small group of studies has used a pretest/posttest design to test theimpact of a specific change to the built environment in a relatively limitedarea (e.g., street-scale interventions). Painter (1996) examined the impact ofimproved lighting on the use of footpaths in London and found an interven-tion effect ranging from 34 percent to 101 percent increases in footpath use,depending on the location. Similarly, a 23 percent increase in bicycle usewas found with the addition of bike lanes (Macbeth, 1999). Researchersexamining the impact of the redesign of two residential streets in Hannover,Germany, into “Woonerven” (designed for shared use by cars and people)observed 11 percent to 100 percent more children on the street and 53percent to 206 percent more incidents of street play after the changes instreet design (Eubanks-Ahrens, 1987).
The research needs in this area are many. Most obviously, future stud-ies should determine the specific elements of the built environment thatinfluence physical activity in children and youth. DHHS and the Depart-ment of Transportation should fund community-based research to examinethe impact of changes to the built environment on the levels of physicalactivity in the relevant communities; in addition, population-wide demon-
375

LOCAL COMMUNITIES 209
stration projects should be funded and carefully evaluated, as should stud-ies of natural experiments.1 In addition, carefully designed interventionstudies together with studies using longitudinal designs are needed to im-prove our understanding of the relationships between changes to the builtenvironment and resulting physical activity behavior in youth; such studieswill require collaborations between researchers and the responsible publicofficials. Furthermore, better measures of physical activity collected throughtravel diary surveys (widely used in transportation planning) and ongoingsurveillance systems such as the Youth Risk Behavior Surveillance Systemare needed, as are better measures of the built environment itself.
The Guide to Community Preventive Services, a systematic review ofpopulation-based interventions, strongly recommends the “creation of andenhanced access to places for physical activity combined with informa-tional outreach activities” (p. 91) as an approach to promote physicalactivity, though the focus of this review was on adults (Kahn et al., 2002).But it is clear that improvements to many different elements of the builtenvironment—parks, hike/bike trails, sidewalks, traffic-calming devices,pedestrian crossings, bicycle-route networks, street connections, and mixedland-use developments—will contribute to the solution.
Next steps. It is incumbent upon local governments to find ways to increasethe opportunities for physical activity in local communities and neighbor-hoods. Achieving this goal may involve revising zoning and subdivisionordinances, where necessary, to ensure that new neighborhoods provideopportunities and facilities for physical activity. For example, a growingnumber of communities are revamping their local development codes toadhere to smart-growth principles (see Box 6-4) (Local Government Com-mission, 2003).
To enhance the quality and extent of opportunities for physical activitywithin existing neighborhoods, local governments will need to prioritizesuch projects in their capital improvement programs. Federal, state, andregional policies can also contribute to these efforts, primarily by providingthe funding necessary to effect physical changes to the built environment.The Federal Transportation Enhancements Program, for example, funded$1.9 billion in pedestrian and bicycle projects throughout the United Statesbetween 1992 and 2002 (Federal Highway Administration, 2004). As a
1In this context, the term “demonstration projects” refers to interventions specificallydesigned to examine the effects of a change in the built environment on physical activity,whereas “natural experiments” are changes that occur or are put in place for other reasons(e.g., an urban policy or practice) but that can be evaluated to determine their effect onphysical activity levels. The researcher or practitioner has a much higher level of control overa demonstration project compared with a natural experiment.
376

210 PREVENTING CHILDHOOD OBESITY
result, many Metropolitan Planning Organizations, agencies responsiblefor implementing federal transportation programs in metropolitan areas,now put significant emphasis on bicycle and pedestrian planning (Chaunceyand Wilkinson, 2003). Professional organizations such as the Institute ofTraffic Engineers and the American Planning Association should also workto assist the efforts of local governments by developing and disseminatingbest practices for expanding opportunities for physical activity.
Citizens themselves have a responsibility to advocate for changes inpolicy so that the built environment may ultimately offer increased oppor-tunities for physical activity among children and youth. The public maybring significant influence to bear over policy, particularly if a large andvocal constituency urges change and if prominent community groups, non-profit organizations, and business organizations lend their support. In manycommunities, neighborhood associations play a formal role in the planningprocess and have successfully advocated for new or improved parks, addi-tional side walks, traffic-calming programs, and other changes in the built
BOX 6-4Trends in City Planning
• Communities throughout the United States are turning to the concept of “smartgrowth” as a way of fostering walkable and close-knit neighborhoods, providinga variety of transportation choices, taking advantage of community assets, andencouraging mixed land uses (Smart Growth America, 2004). Organizationssuch as Smart Growth America and the Smart Growth Network represent coa-litions of nonprofit organizations and government agencies working towardthese goals.
• The Congress for the New Urbanism has brought together architects, develop-ers, planners, and others involved in the creation of cities and towns to promotethe principles of coherent regional planning, walkable neighborhoods, and at-tractive and accommodating civic spaces (CNU, 2004). This nonprofit organi-zation lists hundreds of recent development projects built according to theseprinciples, on which the neighborhood-design ordinances of a number of citiesare now based.
• Traditional approaches to street and street-network design are changing in re-sponse to concerns over the impact of increasing levels of traffic on communi-ties. The Institute of Transportation Engineers has published recommendedpractices for street design that encourage narrower streets in residential areasto reduce traffic speeds (ITE, 1999). A growing number of the nation’s commu-nities have revised their land development codes to encourage greater connec-tivity in the street network and require improved access for pedestrians andbicycles (Handy et al., 2003).
377

LOCAL COMMUNITIES 211
environment. In addition, legal approaches may be useful (Perdue et al.,2003; Mensah et al., 2004).
Local governments, in partnership with private developers and commu-nity groups, should ensure that every neighborhood has safe and well-designed recreational facilities and other places for physical activity forchildren and youth. Communities can require such environmental charac-teristics in new developments and use creative approaches to retrofit exist-ing neighborhoods. Furthermore, local governments should ensure thatstreets are designed to encourage safe walking, bicycling, and other physicalactivities within the neighborhood and the larger community. Child-safestreet design includes well-maintained sidewalks, safe places for crossing,adequate bike lanes, and features that slow traffic.
Walking and Bicycling to School
Compared with 30 years ago, few students in the United States arewalking or bicycling to school. In 1969, an average of 48 percent of allstudents walked or biked to that destination; among those living no morethan a mile away, nearly 90 percent did so (EPA, 2003). In comparison, the1999 HealthStyles Survey found that of the participating households, 19percent reported that their children walked to or from school at least oncea week in the preceding month and that 6 percent rode their bikes (CDC,2002a). Similar results were seen in a study by the Georgia Division ofPublic Health, which found that fewer than 19 percent of the state’s school-aged children who lived a mile or less from school commuted by foot mostdays of the week (CDC, 2002b).
The HealthStyles Survey households reported that barriers to theirchildren’s walking or bicycling to school included: long distances (noted by55 percent of respondents), traffic-related safety concerns (40 percent),adverse weather conditions (24 percent), crime danger (18 percent), schoolpolicy (7 percent), or other reasons (26 percent) (CDC, 2002a). Sixteenpercent acknowledged that there were no barriers to walking or bicycling toschool.
Two other studies also identified distance as a determinant. In onesmall study of six school sites, respondents said that it was more likely thattheir children would walk or bike to school if their home was a mile or lessaway (McMillan, 2002), while the other found that the probability ofwalking or bicycling declined with travel time (EPA, 2003). The situation atpresent is that the majority of children arrive and leave school in automo-biles, vans, trucks, and buses (Figure 6-1) (TRB, 2002). Research alsosuggests that parents, students, and school officials often select or encour-age motorized travel because of convenience, flexibility, budget, or expecta-tion rather than to maximize safety (TRB, 2002).
378

212 PREVENTING CHILDHOOD OBESITY
5 to 10 yrs old
11 to 13 yrs old
14 to 15 yrs old
16 to 18 yrs old
70
60
50
40
30
20
10
0
Per
cent
Bicycling Other Bus Walking School Bus Passenger Vehicle
(Adult Driver)
Passenger Vehicle
(Teen Driver)
FIGURE 6-1 Percentage of trips during normal school travel hours, NationwidePersonal Transportation Survey, 1995.SOURCE: Special Report 269: The Relative Risks of School Travel. TransportationResearch Board, National Research Council, Washington, D.C., 2002, Figure 3-1(a), p. 88. Reproduced with permission.
Because the majority of children and youth attend school five days perweek, throughout a large part of the year, trips to and from school offer apotential opportunity to substantially increase their daily physical activityand energy expenditure. Observational studies have in fact demonstratedthat children can get some of their most vigorous school-day physical activ-ity during the times they travel between home and school (Cooper et al.,2003; Tudor-Locke et al., 2003). Cooper and colleagues (2003) found, in astudy of 114 British children aged 9 to 11 years, that the boys who walkedto school were generally more active than those who were transported bycar (although similar results were not seen for girls).
While the committee acknowledges that there is no direct evidence thatwalking or bicycling to school will reduce the prevalence of obesity inchildren, clear evidence does exist that increases in physical activity canhave positive impacts on weight loss or on maintaining a healthy weight.Further, there are potential ancillary benefits, which include enhancing theneighborhood environment (e.g., so that families may walk or bike more
379
LOCAL COMMUNITIES 213
often during after-school hours), lowering busing costs, and fostering socialinteraction within the community.
Interventions to promote safe walking and bicycling to schools havealready become popular in some communities, thereby demonstrating abroader potential for feasibility and acceptability (Box 6-5). In Chicago, forexample, 90 percent of the nearly 422,000 public school children walk toschool and the city has encouraged a Walking School Bus program in whichone or more adults walk to school with and supervise a small group ofchildren from the neighborhood (Chicago Police Department, 2004). Since1997,2 National Walk Our Children to School Day and a similar interna-tional effort have attracted substantial interest.
Safe Routes to School programs have produced increases in the numberof students walking or bicycling between home and school. Demonstrationprojects in 10 British towns showed an increase in walking and bicyclingamong children and reductions in car use (Sustrans, 2001). An evaluationof the Safe Routes to School programs in seven schools in Marin County,California, found that from fall 2000 to spring 2002, there was a 64 per-cent increase in the number of children walking to school and a 114 percentincrease in the number of students bicycling (Staunton et al., 2003). An-other evaluation of the California program, which focused on schools inSouthern California, showed strong evidence of success in five schools,weak evidence in one school, and no evidence in three schools (success wasdefined as improvements in safety conditions as well as increases in thenumbers of children walking or bicycling to school) (Boarnet et al., 2003).These data suggest that Safe Routes to School programs show promise inpromoting physically active means for children traveling to and from school.
Locating schools in close proximity to the neighborhoods they serve isanother opportunity for increasing the likelihood that children and youthwill walk or bike between them (EPA, 2003). Annual school constructioncosts in the United States (including new school construction and schoolbuilding rehabilitation) were estimated to have grown from about $18billion in 1990 to $25 billion in 1997 (GAO, 2000) and continue to in-crease. Given the scale of this spending and the numerous projects involved,school construction projects provide a tremendous opportunity for locatingat least some new schools within walking or biking distance of the residen-tial areas from which they draw their students.
Local governments and school districts should ensure that children andyouth have safe walking and bicycling routes between their homes andschools and that they are encouraged to use them. Realizing this objective
2The first National Walk Our Children to School Day was sponsored by the Partnershipfor a Walkable America in 1997.
380

214 PREVENTING CHILDHOOD OBESITY
BOX 6-5Safe Routes to School
Safe Routes to Schools was initiated in Western Europe and the United King-dom. As its name implies, the program promotes walking and bicycling to school,and it does so through education and incentives that show how much fun it can be.The program also addresses the safety concerns of parents by encouraging great-er enforcement of traffic laws, educating the public, and exploring ways to createinherently safer streets.
In the United States, the California legislature established a Safe Routes toSchool program in 1999 and extended it for three more years in 2001. This pro-gram provides $25 million in state and federal transportation funds to projects thatimprove the safety of walking and bicycling to schools. Administered by the stateDepartment of Transportation, Safe Routes to School funded 268 projects in itsfirst 4 years (Caltrans, 2004).
Other programs are emerging across the United States to promote safe walk-ing and bicycling to school, and the nonprofit organization Transportation Alterna-tives provides a toolkit to help communities in starting their own Safe Routes toSchool-type programs (Transportation Alternatives, 2004).
The U.S. programs incorporate one or more of the following four key elements:
• An encouragement approach, which uses events and contests to entice stu-dents to try walking and bicycling
• An education approach, which teaches students important safety skills andlaunches driver-safety campaigns
• An engineering approach, which focuses on making physical improvements tothe infrastructure surrounding the school, reducing speeds and establishingsafer crosswalks and pathways
• An enforcement approach, which uses local law enforcement to ensure thatdrivers obey traffic laws.
will involve the efforts of many groups in local communities. Schools andschool districts, in collaboration with community partners, need to developand implement policies and programs that promote walking and bicycling(Chapter 7). Local governments need to allocate the resources to make thenecessary improvements to sidewalks, crosswalks, signals, signs, and othertraffic control devices. Collaborations between law enforcement officialsand schools are needed to deploy pedestrian safety measures at the begin-ning and end of each school day; crossing guards are an important part ofthis process. Additionally, decisions regarding the locations of new schoolsneed to carefully consider the benefits of being close enough to the neigh-borhoods they serve to facilitate students’ walking or bicycling from onesite to the other.
When interventions that promote walking or bicycling to school areimplemented, it is crucial that researchers evaluate their effects on total
381
LOCAL COMMUNITIES 215
daily physical activity and energy expenditure, and on changes in weightover time. Programs promoting safe routes to school, as well as otherefforts to increase students’ walking and bicycling, should include fundingfor evaluation, and the organizations that implement these programs shouldwork with researchers to develop rigorous evaluation designs. Because somuch remains to be learned about the various approaches to increasingwalking and bicycling to school, thorough evaluations of such initiativesare critical.
Community Food Environment
All members in a community need access3 to affordable and healthfulfood on a regular basis. Food security is commonly defined as “access by allpeople at all times to enough food for an active, healthy life and includes ata minimum: a) the ready availability of nutritionally adequate and safefoods, and b) the assured ability to acquire acceptable foods in sociallyacceptable ways (p. 1560)” (LSRO, 1990). Food security is one of thenecessary conditions to ensure the health of a population.
In 2002, 11.1 percent of U.S. households, representing more than 35million people, experienced food insecurity—that is, their access to nutri-tious food on a regular basis was limited or uncertain (Nord et al., 2003). Ingeneral, households with children report food insecurity at more than twicethe rate of households without children (16.5 percent versus 8.1 percent,respectively) (Nord et al., 2003). Children living in food-insecure house-holds are more likely to have compromised well-being than children livingin food-secure households (Alaimo et al., 2001); evidence has linked foodinsecurity to declines in children’s health, mental and psychological func-tioning, and academic achievement (ADA, 2004). As discussed in Chapter3, however, evidence linking childhood food insecurity to obesity is incon-clusive.
In 2002, a food-secure household in the United States spent 35 percentmore on food than the typical food-insecure household of the same size andcomposition (Nord et al., 2003), though food accounted for a greater pro-portion of the latter’s budget (Lang and Caraher, 1998). Thus, it stands toreason that food cost is a significant predictor of dietary choices and healthoutcomes, particularly in low-income ethnic minority urban communities(Perry, 2001; Morland et al., 2002a; Pothukuchi et al., 2002; Sloane et al.,2003) and rural communities (Holben et al., 2004). At the same time, while
3Food access is defined broadly in this context to represent improved availability of ad-equate amounts of healthful foods that households and communities have the financial re-sources to afford on a regular basis.
382

216 PREVENTING CHILDHOOD OBESITY
it is acknowledged that consumer food choices are shaped by taste, cost,and convenience, it has been suggested that high-fat, energy-dense foodsand diets are often less expensive on a cost-per-calorie basis and are morepalatable than high-fiber low-energy-dense foods such as the lean meats,fish, fresh fruits, and vegetables that comprise a healthful diet (Drewnowskiand Specter, 2004). However, based on the ACNielsen Homescan 1999data for household food purchases from all types of retail outlets, a priceanalysis of 154 types of fruits and vegetables found that more than one-halfof the produce items were estimated to cost less than 25 cents per serving.The study concludes that all consumers, including low-income households,can meet the recommendations of three servings of fruit and four servingsof vegetables for 64 cents per day (Reed et al., 2004). However, it isdifficult to predict or understand consumer behavior from these types ofanalyses, as discussed in Chapters 3 and 5.
The availability and affordability of energy-dense foods has increasedin recent years in low-income neighborhoods (Morland et al., 2002a,b;Sloane et al., 2003). This situation is associated with several trends: fewersupermarkets being located within a reasonable walking distance, super-market relocation to the suburbs (Cotterill and Franklin, 1995; Shaffer,2002; Bolen and Hecht, 2003), the lack of transportation to supermarketsoffering a variety of healthful choices at affordable prices (Urban and Envi-ronmental Policy Institute, 2002; Bolen and Hecht, 2003), and the localproliferation of gas stations and convenience stores that often have a lim-ited selection of healthful foods and at higher prices (Alwitt and Donley,1997; Perry, 2001; Morland et al., 2002a).
Community food-security assessment toolkits and other methods, suchas community mapping, have been used to assist communities throughoutthe United States in undertaking community assessments and inventories toidentify the type and range of locally available food resources, includingsupermarkets, corner grocery stores, full-service and fast food restaurants,food banks, food pantries, farmers’ markets, and community gardens (Perry,2001; Cohen, 2002; Pothukuchi et al., 2002; Sloane et al., 2003). Knowingthe inventory and its gaps, communities may then take appropriate action,and in fact they are addressing their food insecurity problems in a variety ofways.
For example, local governments are offering financial incentives suchas grants, loans, and tax benefits to stimulate the development of neighbor-hood groceries in underserved urban neighborhoods (Shaffer, 2002; Bolenand Hecht, 2003; Baltimore Healthy Stores Project, 2004; Clark, 2004).Some communities are initiating farmers’ markets or enhancing the existingFarmers’ Market Nutrition Programs offered to participants in SpecialSupplemental Nutrition Program for Women, Infants, and Children andthe Food Stamp Program (Connecticut Food Policy Council, 1998; Fisher,
383

LOCAL COMMUNITIES 217
1999; Kantor, 2001; Conrey et al., 2003). Others are promoting commu-nity gardens (Kantor, 2001; Twiss et al., 2003), school gardens (EdibleSchoolyard, 2004; see Chapter 7), and farm-to-school and farm-to-cafete-ria programs (Kantor, 2001; Bellows et al., 2003; Center for Food andJustice, 2004; Sanger and Zenz, 2004; see Chapter 7).
Recent research has demonstrated that children who grow some oftheir own food in school gardens have an increased preference for certainvegetables (Morris and Zidenberg-Cherr, 2002). Recent federal legislation(Public Law 108-265) includes provisions designed to strengthen partner-ships between local agriculture and schools to ensure that fresh local pro-duce can go from farms directly to schools.
These initiatives to enhance the community food environment and pro-mote household and community food security are promising to expandhealthful food choices, especially for neighborhoods that are now limited intheir ability to obtain healthful and affordable food on a regular basis.However, evaluations will be required to determine the programs’ effective-ness in meeting these goals.
Local governments should work with community groups, nonprofitorganizations, local farmers and food processors, and local businesses tosupport multisectoral partnerships and networks that expand the availabil-ity of healthful foods within walking distance, particularly in low-incomeand underserved neighborhoods. Such efforts will expand healthful foodchoices at local grocery stores, supermarkets, and fast food restaurants, andthey will encourage a broad range of community food-security initiativesthat improve access to highly nutritional foods.
Health Impact Assessments and Community Health Evaluations
Evaluation of community-wide efforts can be a challenge, given thetypically wide age range among members of the population; their ethnic,racial, and social diversities; the differences in settings of various commu-nity interventions; and the numerous barriers involved.
Nevertheless, it is important to assess the potential impact of proposedprograms and changes as well as to conduct evaluations of recent andongoing efforts. A prospective approach to community evaluation effortsinvolves a “health impact assessment” that gauges the potential effects of aproposed policy or intervention on the health of the population (WHO,1999). Much as environmental impact assessments examine the potentialeffects of a new construction project on such indicators as an area’s air andwater quality, health impact assessments are used to evaluate and thenmodify a proposed action—that is, to remove or minimize that action’snegative public health impacts, and to help enhance its positive effects(Taylor and Quigley, 2002). The health impact assessment may also be
384

218 PREVENTING CHILDHOOD OBESITY
particularly useful in bringing potential health impacts to the attention ofpolicy makers.
A major value of this approach is its focus on considering the input ofmultiple stakeholders, including those who would be directly affected bythe project under consideration. As changes are proposed to the built envi-ronment, communities should consider this tool for examining how pro-posed changes in the community would affect health issues such as access toand availability of healthful foods and opportunities for physical activity. Itwill be important to identify and examine natural experiments in whichinitiatives based on health-impact assessments could be compared to thoseundertaken without such an assessment.
For an overall assessment of a community’s health improvement effortsthat are already underway, community health “report cards” (also termedcommunity health assessments or health profiles) are an excellent tool, bothto assess and convey progress (CDC, 1997a). A variety of approaches havebeen used, all with the goal of providing a concise and consistent collectionof data that can be formatted for dissemination to the community. Forexample, state, county, and community health profiles have been developedusing CDC’s Healthy Days Measures among other community performanceindicators (CDC, 2004a). In addition, the Community Health Status Indi-cators Project (CHSI)—a collaborative effort of the Association of Stateand Territorial Health Officials, the National Association of County andCity Health Officials (NACCHO), and the Public Health Foundation—hasdeveloped report indicators and formats for county-specific informationthat allows comparisons with similar “peer” counties throughout the coun-try (NACCHO, 2004). A CHSI report contains information on behavioralrisks, preventive services use, access, and summary health measures. Toassist in obesity prevention efforts, community health report cards shoulduse measures that assess the community’s progress toward encouraginggood nutrition and physical activity. These measures could rate the builtand social environments, local school policies and practices (Chapter 7), thecommunity food environment, and the degree of involvement of local busi-nesses, organizations, and other groups in supporting and participating inobesity prevention efforts.
To streamline efforts and encourage communities to engage in thesetypes of evaluation efforts, common evaluation tools should be developedand shared, while also ensuring that evaluation tools have the flexibility tobe sensitive to the needs of local communities. This is an area where it willbe important to build on tools (those discussed above and others) that havealready been developed. Leadership for these efforts should involve CDC,NACCHO, the American Planning Association, and other relevant organi-zations, including foundations such as the Robert Wood Johnson Founda-tion, with interests in community-based obesity prevention efforts.
385

LOCAL COMMUNITIES 219
Communities should use evaluation tools (e.g., health impact assess-ments, audits, or report cards) to assess the availability and impact of localopportunities for physical activity (e.g., sidewalks, parks, recreational fa-cilities) and for healthful eating (e.g., grocery store access, farmers’ mar-kets).
Recommendations
Mobilizing communities to address childhood obesity will involvechanges in the social and built environment. Several large-scale community-based interventions—primarily focused on improving diet and physical ac-tivity levels to address cardiovascular outcomes—show the feasibility ofsuch efforts, although much remains to be learned about how to increasetheir effectiveness, particularly with regard to obesity prevention in youth.Efforts to address other public health issues such as tobacco prevention andcontrol provide models for community coalition efforts.
A relatively new field of research is merging urban planning, transpor-tation, and public health research tools to examine the impact of the builtenvironment on human health. Observational and correlational studies,primarily conducted in adult populations, have shown that features in thebuilt environment such as the walkability of neighborhoods or availabilityof recreational facilities are associated with level of physical activity. A fewsmall-scale intervention studies have examined the effects of changes to thebuilt environment; however, research is needed to explore what specificchanges to the built environment will be the most effective in preventingchildhood obesity. The committee recommends the implementation andevaluation of a range of community changes to facilitate improved nutri-tion and increased physical activity. These efforts are an integral part of acomprehensive approach to create healthier environments for children andyouth.
Recommendation 6: Community ProgramsLocal governments, public health agencies, schools, and communityorganizations should collaboratively develop and promote programsthat encourage healthful eating behaviors and regular physical activity,particularly for populations at high risk of childhood obesity. Commu-nity coalitions should be formed to facilitate and promote cross-cuttingprograms and community-wide efforts.
To implement this recommendation:
• Private and public efforts to eliminate health disparities shouldinclude obesity prevention as one of their primary areas of focus and
386

220 PREVENTING CHILDHOOD OBESITY
should support community-based collaborative programs to addresssocial, economic, and environmental barriers that contribute to theincreased obesity prevalence among certain populations.
• Community child- and youth-centered organizations shouldpromote healthful eating behaviors and regular physical activitythrough new and existing programs that will be sustained over thelong term.
• Community evaluation tools should incorporate measures ofthe availability of opportunities for physical activity and healthfuleating.
• Communities should improve access to supermarkets, farmers’markets, and community gardens to expand healthful food options,particularly in low-income and underserved areas.
Recommendation 7: Built EnvironmentLocal governments, private developers, and community groups shouldexpand opportunities for physical activity including recreational facili-ties, parks, playgrounds, sidewalks, bike paths, routes for walking orbicycling to school, and safe streets and neighborhoods, especially forpopulations at high risk of childhood obesity.
To implement this recommendation:
Local governments, working with private developers and commu-nity groups, should:
• Revise comprehensive plans, zoning and subdivisionordinances, and other planning practices to increase availabilityand accessibility of opportunities for physical activity in new devel-opments
• Prioritize capital improvement projects to increase opportuni-ties for physical activity in existing areas
• Improve the street, sidewalk, and street-crossing safety ofroutes to school, develop programs to encourage walking and bicy-cling to school, and build schools within walking and bicycling dis-tance of the neighborhoods they serve
Community groups should:• Work with local governments to change their planning and
capital improvement practices to give higher priority to opportuni-ties for physical activity
DHHS and the Department of Transportation should:• Fund community-based research to examine the impact of
387
LOCAL COMMUNITIES 221
changes to the built environment on the levels of physical activity inthe relevant communities and populations.
HEALTH CARE
Because health care is usually provided at the local level, it is bestaddressed in a community context. Health-care professionals have frequentopportunities to encourage children and youth to engage in healthfullifestyles. Unfortunately, treatment of obesity per se is rarely considered areimbursable interaction between patient and doctor, and our currenthealth-care system is not yet focused on preventive measures for childhoodobesity. But the health-care delivery system can still have a significantimpact on this issue. It is now up to health-care professionals and theirprofessional organizations, as well as health insurers and quality improve-ment and accrediting agencies, to make obesity prevention a part of routinepreventive health care.
Health-Care Professionals
Health-care professionals—physicians, nurses, and other clinicians—have an influential role to play in preventing childhood obesity. As health-care advisors both to children and their parents, they have the access andthe influence to make key suggestions and recommendations on dietaryintake and physical activity throughout children’s lives. They also have theauthority to elevate concern about childhood obesity and advocate forpreventive efforts.
The 2002 National Health Interview Survey found that 74.5 percent ofchildren (aged 18 years or younger) had seen a health-care professional atsome time during the past six months (Dey et al., 2004), thereby providingnumerous opportunities for doctors and other clinicians to measure andtrack height, weight, and BMI and to counsel the children—as well as theirparents or other caregivers—about proper nutrition and physical activity.Measuring height and weight and plotting these measures on growth chartsis already a standard part of children’s health care, and recent recommen-dations by the American Academy of Pediatrics have added BMI to this list(AAP, 2003). Although there is little direct evidence of the impact of height,weight, and BMI screening and tracking on preventing obesity in children,BMI measures for adults have been found to be both easy to measure and ahighly reliable method for identifying patients at risk of morbidity andmortality due to obesity (McTigue et al., 2003). The U.S. Preventive Ser-vices Task Force (USPSTF) recommends that clinicians use BMI to screenall adult patients for obesity (USPSTF, 2003). A survey of 940 pediatrichealth-care providers, however, found that more used clinical impression
388

222 PREVENTING CHILDHOOD OBESITY
and weight-for-age or weight-for-height measures than used BMI or BMIpercentiles (Barlow et al., 2002).
Because there are standardized BMI charts for children, and given thatBMI is a reasonably good surrogate for adiposity, it is sensible to includeBMI calculations in all health supervision visits for children. By routinelymeasuring height and weight and calculating BMI, clinicians communicatethat this is an important matter, just as important as routine immunizationsor screening tests in protecting children’s health (see Chapter 8). Further-more, BMI measures on an annual or similarly regular basis allow assess-ment of the individual child’s growth trajectory, which offers better in-sights, and on an earlier basis, than height or weight measurement alone(see Chapter 3).
After determining the child’s weight status, health-care professionalshave a responsibility to carefully communicate the results to parents and, inan age-appropriate manner, to the children themselves; provide the infor-mation that the families need to make informed decisions about physicalactivity and nutrition; and explain the risks associated with childhood over-weight and obesity. Behaviors that can be targeted include those mostclosely associated with improved nutrition and increased physical activity:increased breastfeeding, limited consumption of sweetened beverages, re-duced television viewing or other screen time, and a greater amount ofoutdoor play (Whitaker, 2003). Careful attention should be paid to mini-mizing the stigmatization of obesity (Schwartz and Puhl, 2003).
Studies of such counseling on obesity-related issues have shown posi-tive results. In one trial, African-American families were randomized toreceive primary-care-based counseling alone or counseling plus a behav-ioral intervention (including goal-setting and an electronic television-timemanager) as part of their regular clinic visits (Ford et al., 2002). Bothgroups reported similar within-group decreases (from baseline) in children’stelevision, videotape, and video game use. In the between-group compari-son, the behavioral intervention group reported medium to large (and sta-tistically significant) increases in organized physical activity and increasesin playing outside. There was also a slight decrease for the interventiongroup in the number of meals eaten in front of the television, though thedifferences were not statistically significant (Ford et al., 2002). A four-month primary-care-based assessment and counseling intervention involv-ing adolescents showed the feasibility of such efforts and found short-termimprovements in dietary and physical activity outcome measures (Patrick etal., 2001).
More generally, studies of counseling for adults may provide insightsinto the potential effectiveness of counseling for children and their parents.The USPSTF review of dietary intake counseling for adults in primary-caresettings found it to be effective in reducing dietary fat consumption and
389
LOCAL COMMUNITIES 223
increasing fruit and vegetable consumption (Pignone et al., 2003). The bestevidence was for patients with known risk factors for cardiovascular andother chronic diseases, but there was also fair evidence that brief counselingin primary care can produce some improvements in diet among unselectedpatients as well.
Similar reviews of studies that focused on physical activity counselingof adults in primary care found mixed results, although most of the studiesshowed a trend toward increased physical activity in the intervention groups(Sallis et al., 2000b; Eden et al., 2002). For example, a nonrandomizedcontrolled trial in healthy sedentary adults found short-term increases inmoderate physical activity, particularly walking, among those who hadreceived three to five minutes of physical activity counseling by their physi-cian (Calfas et al., 1996).
Although research on the effectiveness of counseling children and theircaregivers about obesity prevention is limited to date, and much remains tobe learned, the seriousness of the problem and the emergence of testedstrategies argue for routine counseling. The evidence that routine smoking-cessation counseling is effective, at least in changing adult behaviors, isanother precedent for this kind of guidance (DHHS, 2000a).
Additionally, as visible and influential members of their communities,health-care professionals can serve as role models for good nutrition, forbeing physically active, and for maintaining a healthy weight. Health-careprofessionals can also have influential voices in increasing communityawareness and advocating for actions to prevent childhood obesity. Bygiving speeches or conducting workshops at schools, testifying before legis-lative bodies, working in community organizations, or speaking out in anynumber of other ways, health-care professionals can press for changes tomake the community one that supports and facilitates healthful eating andphysical activity. A notable precedent is that physicians and other health-care professionals have played crucial roles in changing tobacco-relatedbehaviors; they have been advocates both at the local and national levels,and they have served as personal role models by quitting smoking or by notstarting in the first place.
Pediatricians, family physicians, nurses, and other clinicians shouldtake active roles in the prevention of obesity in children and youth. Asdiscussed above, this includes routinely measuring height and weight; track-ing BMI; and providing feedback, interpretation, counseling, and guidanceon obesity prevention to children, parents, and other caregivers. This as-sumes that clinicians will have learned the appropriate skills to deliver thesepreventive services, which has implications for training at all levels (seebelow). They should also serve as role models for healthful eating andregular physical activity and take leadership roles in advocating for child-hood obesity prevention in local schools and communities.
390

224 PREVENTING CHILDHOOD OBESITY
Similarly, health-care professional organizations and their membershave important roles to play in advocating across the range of communityinstitutions for obesity prevention activities and policies (AAP, 2003). Ar-eas of possible involvement include health insurance coverage policies,school nutrition and physical education, and community recreation andzoning policies. Professional organizations can also be influential in encour-aging their members to adopt a more healthful lifestyle and serve as rolemodels to their patients as well as to become more active in their offices andcommunities in working to prevent obesity. For example, the leadership ofthe American Academy of Family Physicians (AAFP) has recently chal-lenged all of its members to increase their personal physical activity levels inorder to serve as role models for their patients (as well as improve their ownhealth); additionally, AAFP has initiated a program called “Americans inMotion” to help patients, their families, and communities fight obesity(AAFP, 2004).
Furthermore, many professional organizations are providing informa-tion on topics relevant to obesity prevention. The American Academy ofPediatrics has issued position statements on children’s television viewingand on physical fitness and activity in schools (AAP, 2000, 2001). TheAmerican Medical Association recently published a 10-part monograph onassessment and treatment of adult obesity (Kushner, 2003); similar materi-als on children should also be prepared. Collaboration between groupscould broaden their effectiveness; if health-care professional organizationswork together to implement obesity prevention programs and initiativesand develop clinical guidance, they would help ensure that consistent mes-sages are reaching both health-care professionals and their patients.
Health- and medical-care professional organizations should make child-hood obesity prevention a high-priority goal for their organizations. Thisincludes creating and disseminating evidence-based clinical guidance andother materials on obesity prevention; establishing programs to encouragemembers to be role models for proper nutrition and physical activity; advo-cating for childhood obesity prevention initiatives; and coordinating theirefforts, wherever possible, with other health-care professional organiza-tions.
It is also critical to address current limitations in health-care trainingwith regard to obesity prevention, nutrition, and physical activity. Medicaland other health-care students have traditionally received little education innutrition and physical activity; further, instruction on counseling aboutthese topics generally has not been included either in medical school orprimary-care residency training curricula (Taren et al., 2001). Such omis-sions should be corrected in curricula at all levels, from preclinical sciencethrough the clinical training years and into postgraduate training programsand continuing medical education for practicing clinicians. In addition, if
391

LOCAL COMMUNITIES 225
certifying entities such as medical specialty boards included questions aboutthese areas in their formal examinations, this would provide an incentive tostudents and residents to master the associated material. Programs such asthe Nutrition Academic Award Program sponsored by the National Heart,Lung, and Blood Institute have begun to focus attention on improvingnutrition education efforts in medical schools (Pearson et al., 2001), andfurther efforts are needed regarding other relevant areas. A recent Instituteof Medicine report confirms the need for expanding behavioral and social-science content in medical schools’ curricula (IOM, 2004). Health-careprofessional schools, postgraduate training programs, continuing profes-sional education programs, professional organizations, and certifying enti-ties should require knowledge and skills related to obesity prevention (e.g.,child and adolescent BMI interpretation, nutritional and physical activitycounseling) in their curricula and examinations.
Health-Care Insurers, Health Plans, and Quality Improvementand Accrediting Organizations
Until recently, health-care concerns had largely focused on the treat-ment—as opposed to the prevention—of obesity, particularly the severeforms of adult obesity. But epidemiologic data showing increases in thenumbers of obese children and youth, along with a rise in the prevalence oftype 2 diabetes (formerly termed “adult onset diabetes”) and increasedhypertension in children (Muntner et al., 2004), have raised awareness thatchildhood obesity might be best addressed from a prevention perspective.Furthermore, the high economic costs of obesity (Chapter 2) provide incen-tives to health-care insurers and health plans to encourage healthful lifestylesand thereby reduce their costs.
The health-care insurance industry in particular has several paths bywhich it may address obesity prevention. For individuals and their families,health insurance companies and health plans can develop innovative strat-egies for encouraging policy holders and their children to maintain a healthyweight, increase their levels of physical activity, and improve the quality oftheir diet. Creative options may include incentives for participating in anddocumenting regular physical activity, or programs that provide discountsor other incentives for wellness-related products. For example, one insur-ance company includes discounts on health and wellness magazines as wellas lowered fees for health club memberships and weight-reduction pro-grams for adults (CIGNA, 2004). Furthermore, health-care insurers cantake an active role in community coalitions and other activities; one ex-ample is the Jump Up and Go Program in Massachusetts (Blue Cross BlueShield of Massachusetts, 2004). It will be particularly important for health-care insurers and health plans to consider incentives that are useful to high-
392

226 PREVENTING CHILDHOOD OBESITY
risk populations, who often live in areas where easy access to recreationalfacilities is lacking or where costs are prohibitive.
For the providers of health-care services, it is important that obesityprevention (including assessment of weight status as well as counseling onnutrition and physical activity) become a routine part of clinical care. More-over, measures related to successful delivery of clinical preventive services,such as rates of screening tests, should be important components of health-care quality-improvement programs that are promoted by health plans. TheNational Committee for Quality Assurance (NCQA) and other nationalquality-improvement and accrediting organizations should add obesity pre-vention efforts—such as routine measurement and tracking of BMI, coun-seling of children and their parents on diet and exercise—to the measuresthey develop and assess.
There may also be opportunities for incorporating obesity preventionmeasures and counseling into ongoing federal, state, and local programsthat provide disease prevention and health promotion services to children.For example, Medicaid’s Early and Periodic Screening, Diagnostic, andTreatment program offers preventive screenings for eligible children (gener-ally in underserved populations) and it includes a comprehensive health anddevelopmental history. More than 8.7 million children participated in thescreening program in 1998 (CMS, 2004), thus offering many potentialopportunities for obesity prevention in children.
As with other sectors, those involved in delivering and paying for healthcare need to become more proactive, preferably through a multifocal, coor-dinated set of initiatives, in working with families to promote physicalactivity and healthful diets among children. Medicare has recently removedbarriers to coverage for obesity-related services (DHHS, 2004). Althoughthis, of course, does not relate directly to children, it is an action that maywell be emulated by other insurers and for preventive services as well as fortreatment.
Health insurers, health plans, and quality-improvement and accreditingorganizations should designate childhood obesity prevention as a priorityhealth promotion issue. Furthermore, health plans and health-care insurersshould provide incentives to individuals and families to maintain healthybody weight and engage in routine physical activity. Health insurers, healthplans, and quality improvement and accrediting organizations (such asNCQA) should include screening and obesity prevention services (e.g., rou-tine assessment of BMI or other weight-status measures, counseling ofchildren and their parents on nutrition and physical activity) in routineclinical practice and in quality assessment measures relating to health care.
393

LOCAL COMMUNITIES 227
Recommendation
The health-care community offers a range of opportunities for interac-tions with children and youth regarding obesity prevention. Several con-trolled trials of counseling by health-care providers have resulted in patientimprovements in physical activity levels or diet, although these studies havegenerally been conducted with small numbers of patients and have focusedon counseling of adult patients. Further research is needed on effectivecounseling or other types of obesity prevention interventions that could beprovided in health-care settings. Improved professional education regard-ing obesity prevention is an important next step, as is the active involve-ment of health professional organizations, insurers, and accrediting organi-zations, in making childhood obesity prevention efforts a priority.
Recommendation 8: Health CarePediatricians, family physicians, nurses, and other clinicians shouldengage in the prevention of childhood obesity. Health-care professionalorganizations, insurers, and accrediting groups should support indi-vidual and population-based obesity prevention efforts.
To implement this recommendation:
• Health-care professionals should routinely track BMI, offerrelevant evidence-based counseling and guidance, serve as role mod-els, and provide leadership in their communities for obesity preven-tion efforts.
• Professional organizations should disseminate evidence-basedclinical guidance and establish programs on obesity prevention.
• Training programs and certifying entities should require obe-sity prevention knowledge and skills in their curricula and examina-tions.
• Insurers and accrediting organizations should provide incen-tives for maintaining healthy body weight and include screening andobesity preventive services in routine clinical practice and qualityassessment measures.
REFERENCES
AAFP (American Academy of Family Physicians). 2004. Americans in Motion. [Online]. Avail-able: http://www.aafp.org/x22874.xml [accessed May 14, 2004].
AAP (American Academy of Pediatrics), Committee on Sports Medicine and Fitness andCommittee on School Health. 2000. Physical fitness and activity in schools. Pediatrics105(5):1156-1157.
AAP. 2001. Children, adolescents, and television. Pediatrics 107(2):423-426.
394

228 PREVENTING CHILDHOOD OBESITY
AAP, Committee on Nutrition. 2003. Prevention of pediatric overweight and obesity. Pediat-rics 112(2):424-430.
ADA (American Dietetic Association). 2004. Position of the American Dietetic Association:Dietary guidance for healthy children ages 2 to 11 years. J Am Diet Assoc 104(4):660-677.
Alaimo K, Olson CM, Frongillo EA Jr, Briefel RR. 2001. Food insufficiency, family income,and health in US preschool and school-aged children. Am J Public Health 91(5):781-786.
Alwitt LF, Donley TD. 1997. Retail stores in poor urban neighborhoods. J Consumer Affairs31(1):139-164.
Baker EA, Brownson CA. 1998. Defining characteristics of community-based health promo-tion programs. J Public Health Manag Pract 4(2):1-9.
Baltimore Healthy Stores Project. 2004. Baltimore Healthy Stores Project. [Online]. Avail-able: http://www.healthystores.org/BHS.html [accessed June 8, 2004].
Baranowski T, Thompson WO, DuRant RH, Baranowski J, Puhl J. 1993. Observations onphysical activity in physical locations: Age, gender, ethnicity, and month effects. Res QExerc Sport 64(2):127-133.
Baranowski T, Baranowski JC, Cullen KW, Thompson DI, Nicklas T, Zakeri IE, Rochon J.2003. The Fun, Food, and Fitness Project (FFFP): The Baylor GEMS pilot study. EthnDis 13(1 Suppl 1):S30-S39.
Barlow SE, Dietz WH, Klish WJ, Trowbridge FL. 2002. Medical evaluation of overweightchildren and adolescents: Reports from pediatricians, pediatric nurse practitioners, andregistered dietitians. Pediatrics 110(1):222-228.
Beech BM, Klesges RC, Kumanyika SK, Murray DM, Klesges L, McClanahan B, Slawson D,Nunnally C, Rochon J, McLain-Allen B, Pree-Cary J. 2003. Child- and parent-targetedinterventions: The Memphis GEMS pilot study. Ethn Dis 13(1 Suppl 1):S40-S53.
Bellows BC, Dufour R, Bachmann J. 2003. Bringing Local Food to Local Institutions. AResource Guide for Farm-to-School and Farm-to-Institution Programs. [Online]. Avail-able: http://attra.ncat.org/attra-pub/PDF/farmtoschool.pdf [accessed June 8, 2004].
Blue Cross Blue Shield of Massachusetts. 2004. Jump Up and Go! [Online]. Available: http://www.bcbsma.com/common/en_US/myWellbeingIndex.jsp [accessed August 5, 2004].
Boarnet MG, Day K, Anderson C, McMillen T, Alfonzo M. 2003. Urban Form and PhysicalActivity: Insights from a Quasi-Experiment. [Online]. Available: http://www.activelivingresearch.org/downloads/boarnet_presentation.pdf [accessed June 3, 2004].
Bolen E, Hecht K. 2003. Neighborhood Groceries: New Access to Healthy Food in Low-Income Communities. California Food Policy Advocates. [Online]. Available: http://www.cfpa.net/Grocery.PDF [accessed January 8, 2004].
Brownson RC, Baker EA, Housemann RA, Brennan LK, Bacak SJ. 2001. Environmental andpolicy determinants of physical activity in the United States. Am J Public Health 91:1995-2003.
Brumley DE, Hawks RW, Gillcrist JA, Blackford JU, Wells WW. 2001. Successful implemen-tation of community water fluoridation via the community diagnosis process. J PublicHealth Dent 61(1):28-33.
Burdette HL, Whitaker RC. 2004. Neighborhood playgrounds, fast food restaurants, andcrime: Relationships to overweight in low-income preschool children. Prev Med 38(1):57-63.
Calfas KJ, Long BJ, Sallis JF, Wooten WJ, Pratt M, Patrick K. 1996. A controlled trial ofphysician counseling to promote the adoption of physical activity. Prev Med 25(3):225-233.
Caltrans. 2004. Safe Routes to School Program. [Online]. Available: http://www.dot.ca.gov/hq/LocalPrograms/saferoute2.htm [accessed April 22, 2004].
395

LOCAL COMMUNITIES 229
Campbell MK, Demark-Wahnefried W, Symons M, Kalsbeek WD, Dodds J, Cowan A, Jack-son B, Motsinger B, Hoben K, Lashley J, Demissie S, McClelland JW. 1999. Fruit andvegetable consumption and prevention of cancer: The Black Churches United for BetterHealth project. Am J Public Health 89(9):1390-1396.
CDC (Centers for Disease Control and Prevention). 1997a. Characteristics of communityreport cards, United States, 1996. MMWR 46(28):647-648.
CDC. 1997b. Guidelines for school and community programs to promote lifelong physicalactivity among young people. MMWR 46(RR-6):1-36.
CDC. 1999. Neighborhood safety and prevalence of physical inactivity-selected states.MMWR 48(7):143-146.
CDC. 2002a. Barriers to children walking and bicycling to school—United States, 1999.MMWR 51(32):701-704.
CDC. 2002b. School transportation modes—Georgia, 2000. MMWR 51(32):704-705.CDC. 2004a. State and Community Health Profiles. [Online]. Available: http://www.cdc.gov/
hrqol/community.htm [accessed July 6, 2004].CDC. 2004b. REACH: Racial and Ethnic Approaches to Community Health. [Online]. Avail-
able: http://www.cdc.gov/reach2010/ [accessed August 4, 2004].Center for Food and Justice. 2004. Farm to School Projects: Improving School Food While
Helping Local Farmers. Urban and Environmental Policy Institute. [Online]. Available:http://www.farmtoschool.org/ [accessed June 8, 2004].
Chauncey B, Wilkinson B. 2003. An Assessment of MPO Support for Bicycling and Walking.Washington DC: National Center for Bicycling and Walking.
Chavis DM. 2001. The paradoxes and promise of community coalitions. Am J CommunityPsychol 29(2):309-320.
Chicago Police Department. 2004. Protecting Our Children—Working Together for a SaferChicago. [Online]. Available: http://www.cityofchicago.org/cp/Alerts/SafetyTips/ChildSafety/WalkingSchoolbus.html [accessed May 21, 2004].
CIGNA. 2004. Member Discounts from Healthy Rewards. [Online]. Available: http://www.cigna.com/health/consumer/medical/discount.html [accessed April 22, 2004].
Clark V. 2004. Plan would add supermarkets in city: The $100 million statewide proposal isintended to promote healthy eating in low-income areas. Philadelphia Inquirer. Newsrelease. May 5.
CMS (Centers for Medicare & Medicaid Services). 2004. Annual EPSDT Participation Re-port, All States. [Online]. Available: http://www.cms.hhs.gov/medicaid/epsdt/ep1998n.pdf [accessed May 14, 2004].
CNU (Congress for the New Urbanism). 2004. About CNU. [Online]. Available: http://www.cnu.org/aboutcnu [accessed April 22, 2004].
Cohen B. 2002. Community Food Security Assessment Toolkit. Washington, DC: USDA,Economic Research Service. E-FAN-02-013. [Online]. Available: http://www.ers.usda.gov/publications/efan02013/efan02013.pdf [accessed June 8, 2004].
Connecticut Food Policy Council. 1998. Making Room at the Table: A Guide to CommunityFood Security in Connecticut. Hartford, CT: CFPC.
Conrey EJ, Frongillo EA, Dollahite JS, Griffin MR. 2003. Integrated program enhancementsincreased utilization of a farmers’ market nutrition program. J Nutr 133(6):1841-1844.
Cooper AR, Page AS, Foster LJ, Qahwaji D. 2003. Commuting to school: Are children whowalk more physically active? Am J Prev Med 25(4):273-276.
Corburn J. 2004. Confronting the challenges in reconnecting urban planning and publichealth. Am J Public Health 94(4):541-546.
Cotterill RW, Franklin AW. 1995. The Urban Grocery Store Gap. Storrs, CT: Food Market-ing Policy Center, University of Connecticut.
396

230 PREVENTING CHILDHOOD OBESITY
Cullen KW, Bartholomew LL, Parcel GS. 1997. Girl Scouting: An effective channel for nutri-tion education. J Nutr Educ 92(5):86-91.
DeBate RD. 2002. Girls on the Run International. Evaluation Report, Spring 2002. Char-lotte, NC: University of North Carolina.
Dey AN, Schiller JS, Tai DA. 2004. Summary health statistics for U.S. children: NationalHealth Interview Survey, 2002. Vital Health Statistics 10(221).
DHHS (U.S. Department of Health and Human Services), USPHS Guideline Panel. 2000a.Treating Tobacco Use and Dependence. Washington, DC: DHHS.
DHHS. 2000b. Healthy People 2010: Understanding and Improving Health. 2nd edition.Washington, DC: U.S. Government Printing Office. [Online]. Available: http://www.healthypeople.gov/document/tableofcontents.htm [accessed April 9, 2004].
DHHS. 2004. HHS Announces Revised Medicare Obesity Coverage Policy. [Online]. Avail-able: http://www.hhs.gov/news/press/2004pres/20040715.html [accessed August 4,2004].
DiGuiseppi C, Roberts I, Li L, Allen D. 1998. Determinants of car travel on daily journeys toschool: Cross sectional survey of primary school children. Br Med J 316(7142):1426-1428.
Doxey J, Tran T, Kimball K, Corliss J, Mercer M. 2003. Can’t Get There from Here: TheDeclining Independent Mobility of California’s Children and Youth. A Joint Project ofthe Surface Transportation Policy Project, Transportation and Land Use Coalition,Latino Issues Forum. [Online]. Available: http://www.transcoalition.org/reports/kids/kids_report.pdf [accessed April 18, 2004].
Drewnowski A, Specter SE. 2004. Poverty and obesity: The role of energy density and energycosts. Am J Clin Nutr 79(1):6-16.
Eden KB, Orleans CT, Mulrow CD, Pender NJ, Teutsch SM. 2002. Does counseling byclinicians improve physical activity? A summary of the evidence for the U.S. PreventiveServices Task Force. Ann Intern Med 137(3):208-215.
Edible Schoolyard. 2004. The Edible Schoolyard. [Online]. Available: http://www.edibleschoolyard.org [accessed June 4, 2004].
EPA (U.S. Environmental Protection Agency). 2003. Travel and Environmental Implicationsof School Siting. EPA 231-R-03-004. Washington, DC: EPA.
Eubanks-Ahrens B. 1987. A closer look at the users of Woonerven. In: Moudon AV, ed.Public Streets for Public Use. New York: Van Nostrand Reinhold.
Farquhar JW, Maccoby N, Wood PD, Alexander JK, Breitrose H, Brown BW Jr, Haskell WL,McAlister AL, Meyer AJ, Nash JD, Stern MP. 1977. Community education for cardio-vascular health. Lancet 1(8023):1192-1995.
Farquhar JW, Fortmann SP, Flora JA, Taylor CB, Haskell WL, Williams PT, Maccoby N,Wood PD. 1990. Effects of communitywide education on cardiovascular disease riskfactors. The Stanford Five-City Project. J Am Med Assoc 264(3):359-365.
Fawcett SB, Paine-Andrews A, Francisco VT, Schultz J, Richter KP, Berkley-Patton J, FisherJL, Lewis RK, Lopez CM, Russos S, Williams EL, Harris KJ, Evensen P. 2001. Evaluat-ing community initiatives for health and development. WHO Reg Publ Eur Ser 92:241-270.
Fawcett SB, et al. 2004. Understanding and Improving the Work of Community Health andDevelopment. Paper presented at the VIII Biannual Symposium on the Science of Behav-ior. As cited in: Kaiser Permanente. 2004. Kaiser Permanente’s Framework for Commu-nity Health Initiatives. [Online]. Available: http://www.kpihp.org/publications/briefs/chi_Framework.pdf.
Federal Highway Administration. 2004. Federal–Aid Highway Program Funding for Pedes-trian and Bicycle Facilities and Programs. [Online]. Available: http://www.fhwa.dot.gov/environment/bikeped/bikepedfund.htm [accessed July 15, 2004].
397

LOCAL COMMUNITIES 231
Fisher A. 1999. Hot Peppers and Parking Lot Peaches: Evaluating Farmers’ Markets in LowIncome Communities. Venice, CA: Community Food Security Coalition. [Online]. Avail-able: http://www.foodsecurity.org/executive.html [accessed April 22, 2004].
Ford BS, McDonald TE, Owens AS, Robinson TN. 2002. Primary care interventions toreduce television viewing in African-American children. Am J Prev Med 22(2):106-109.
GAO (U.S. General Accounting Office). 2000. School Facilities: Construction ExpendituresHave Grown Significantly in Recent Years. HEHS-00-41. Washington, DC: GAO.
Girls on the Run. 2004. Girls on the Run International. [Online]. Available: http://www.girlsontherun.org/ [accessed May 14, 2004].
Glanz K. 1997. Perspectives on using theory. In: Glanz K, Lewis FM, Rimer BK, eds. HealthBehavior and Health Education. 2nd ed. San Francisco, CA: Jossey-Bass Publishers. Pp.441-449.
Gordon-Larsen P, McMurray RG, Popkin BM. 2000. Determinants of adolescent physicalactivity and inactivity patterns. Pediatrics 105:E83.
Grossman DC. 2000. The history of injury control and the epidemiology of child and adoles-cent injuries. Future Child 10(1):23-52.
Handy S, Boarnet MG, Ewing R, Killingsworth RE. 2002. How the built environment affectsphysical activity: Views from urban planning. Am J Prev Med 23(2 Suppl):64-73.
Handy S, Paterson R, Butler K. 2003. Planning for Street Connectivity: Getting from Here toThere. Planning Advisory Service Report. Chicago, IL: American Planning Association.
Hoefer WR, McKenzie TL, Sallis JF, Marshall SJ, Conway JL. 2001. Parental provision oftransportation for adolescent physical activity. Am J Prev Med 21(1):48-51.
Hoehner CM, Brennan LK, Brownson RC, Handy SL, Killingsworth R. 2003. Opportunitiesfor integrating public health and urban planning approaches to promote active commu-nity environments. Am J Health Promot 18(1):14-20.
Holben DH, McClincy MC, Holcomb JP Jr, Dean KL, Walker CE. 2004. Food security statusof households in Appalachian Ohio with children in Head Start. J Am Diet Assoc104(2):238-241.
Huang HF, Cynecki MJ. 2000. Effects of traffic calming measures on pedestrian and motoristbehavior. Transp Res Rec 1705:26-31.
Huang HF, Cynecki MJ. 2001. The Effects of Traffic Calming Measures on Pedestrian andMotorist Behavior. McLean, VA: Federal Highway Administration.
Humpel N, Owen N, Leslie E. 2002. Environmental factors associated with adults’ participa-tion in physical activity: A review. Am J Prev Med 22(3):188-199.
IOM (Institute of Medicine). 1994. Growing Up Tobacco Free: Preventing Nicotine Addic-tion in Children and Youth. Washington, DC: National Academy Press.
IOM. 2003. Fulfilling the Potential of Cancer Prevention and Early Detection. Washington,DC: The National Academies Press.
IOM. 2004. Improving Medical Education: Enhancing the Behavioral and Social ScienceContent of Medical School Curricula. Washington, DC: The National Academies Press.
ITE (Institute of Transportation Engineers). 1999. Traditional Neighborhood DevelopmentStreet Design Guidelines: Recommended Practice. Washington, DC: ITE.
Jacobsen P, Anderson CL, Winn DG, Moffat J, Agran PF, Sarkar S. 2000. Child pedestrianinjuries on residential streets: Implications for traffic engineering. Inst Traffic Eng J Web70:71-75.
Kahn EB, Ramsey LT, Brownson RC, Heath GW, Howze EH, Powell KE, Stone EJ, RajabMW, Corso P. 2002. The effectiveness of interventions to increase physical activity. Asystematic review. Am J Prev Med 22(4 Suppl):73-107.
Kaiser Permanente. 2004. Kaiser Permanente’s Framework for Community Health Initiatives.[Online]. Available: http://www.kpihp.org/publications/briefs/chi_Framework.pdf.
398

232 PREVENTING CHILDHOOD OBESITY
Kantor LS. 2001. Community food security programs improve food access. Food Rev24(1):20-26.
Kegler MC, Steckler A, McLeroy K, Malek SH. 1998. Factors that contribute to effectivecommunity health promotion coalitions: A study of 10 Project ASSIST coalitions inNorth Carolina. American Stop Smoking Intervention Study for Cancer Prevention.Health Educ Behav 25(3):338-353.
Kelder SH, Perry CL, Klepp KI. 1993. Community-wide youth exercise promotion: Long-term outcomes of the Minnesota Heart Health Program and the Class of 1989 Study. JSch Health 63(5):218-223.
Kelder SH, Perry CL, Lytle LA, Klepp KI. 1995. Community-wide youth nutrition education:Long-term outcomes of the Minnesota Heart Health Program. Health Educ Res10(2):119-131.
Klesges RC, Eck LH, Hanson CL, Haddock CK, Klesges LM. 1990. Effects of obesity, socialinteractions, and physical environment on physical activity in preschoolers. HealthPsychol 9(4):435-449.
Kreuter M, Lezin N. 2002. Coalitions, consortia and partnerships. In: Last J, Breslow L,Green LW, eds. Encyclopedia of Public Health. London, UK: MacMillan Publishers.
Kumanyika SK, Obarzanek E, Robinson TN, Beech BM. 2003. Phase 1 of the Girls healthEnrichment Multi-site Studies (GEMS): Conclusion. Ethn Dis 13(1 Suppl 1):S88-S91.
Kushner RF. 2003. Assessment and Management of Adult Obesity: A Primer for Physicans.Chicago, IL: American Medical Association.
Lang T, Caraher M. 1998. Food poverty and shopping deserts: What are the implications forhealth promotion policy and practice? Health Educ J 58(3):202-211.
Lasker RD, Weiss ES. 2003. Broadening participation in community-problem solving: Amultidisciplinary model to support collaborative practice and research. J Urban Health80(1):14-47.
Lasker RD, Weiss ES, Miller R, Community-Campus Parternerships for Health. 2001. Pro-moting collaborations that improve health. Educ Health 14(2):163-172.
Local Government Commission. 2003. Overcoming Obstacles to Smart Growth ThroughCode Reform. Sacramento, CA: Local Government Commission.
Loukaitou-Sideris A. 2003. Transportation, Land Use, and Physical Activity: Safety and Secu-rity Considerations. Draft paper presented at a workshop of the Transportation Re-search Board and the Institute of Medicine Committee on Physical Activity, Health,Transportation, and Land Use. Washington, DC.
LSRO (Life Sciences Research Organization). 1990. Core indicators of nutritional state fordifficult to sample populations. J Nutr 120(Suppl 11):1559-1660.
Luepker RV, Murray DM, Jacobs DR Jr, Mittelmark MB, Bracht N, Carlaw R, Crow R,Elmer P, Finnegan J, Folsom AR, Grimm R, Hannan PJ, Jeffrey R, Lando H, McGovernP, Mullis R, Perry CL, Pechacek T, Pirie P, Sprafka JM, Weisbrod R, Blackburn H.1994. Community education for cardiovascular disease prevention: Risk factor changesin the Minnesota Heart Health Program. Am J Public Health 84(9):1383-1393.
Macbeth AG. 1999. Bicycle lanes in Toronto. ITE J 69:38-40, 42, 44, 46.Maccoby N, Farquhar JW, Wood PD, Alexander J. 1977. Reducing the risk of cardiovascular
disease: Effects of a community-based campaign on knowledge and behavior. J Commu-nity Health 3(2):100-114.
McMillan TE. 2002. The influence of urban form on a child’s trip to school. Presented at theAssociation of Collegiate Schools of Planning Annual Conference, Baltimore. Cited in:EPA. 2003. Travel and Environmental Implications of School Siting. EPA 231-R-03-004. Washington, DC: EPA.
399

LOCAL COMMUNITIES 233
McTigue KM, Harris R, Hemphill B, Lux L, Sutton S, Bunton AJ, Lohr KN. 2003. Screeningand interventions for obesity in adults: Summary of the evidence for the U.S. PreventiveServices Task Force. Ann Intern Med 139(11):933-949.
Mensah GA, Goodman RA, Zaza S, Moulton AD, Kocher PL, Dietz WH, Pechacek TF,Marks JS. 2004. Law as a tool for preventing chronic diseases: Expanding the spectrumof effective public health strategies [Part 2]. Preventing Chronic Disease [Online]. Avail-able: http://www.cdc.gov/pcd/issues/2004/apr/04_0009.htm [accessed April 20, 2004].
Minkler M, Wallerstein N. 2003. Community-Based Participatory Research for Health. SanFrancisco, CA: Jossey-Bass.
Morland K, Wing S, Diez Roux A, Poole C. 2002a. Neighborhood characteristics associatedwith the location of food stores and food service places. Am J Prev Med 22(1):23-29.
Morland K, Wing S, Diez Roux A. 2002b. The contextual effect of the local food environ-ment on residents’ diets: The atherosclerosis risk in communities study. Am J PublicHealth 92(11):1761-1767.
Morris J, Zidenberg-Cherr S. 2002. Garden-enhanced nutrition curriculum improves fourth-grade school children’s knowledge of nutrition and preferences for some vegetables. JAm Diet Assoc 102(1):91-93.
Muntner P, He J, Cutler JA, Wildman RP, Whelton PK. 2004. Trends in blood pressureamong children and adults. J Am Med Assoc 291(17):2107-2113.
NACCHO (National Association of County and City Health Officials). 2004. CommunityHealth Status Indicators Project. [Online]. Available: http://www.naccho.org/project2.cfm [accessed July 6, 2004].
Nord M, Andrews M, Carlson S. 2003. Household Food Security in the United States, 2002.Alexandria, VA: USDA, Economic Research Service. Food Assistance and NutritionResearch Report 35.
Painter K. 1996. The influence of street lighting improvements on crime, fear, and pedestrianstreet use, after dark. Landsc Urban Plan 35:193-201.
Partnership for the Public’s Health. 2004. The Power of Partnership: Improving the Health ofCalifornia’s Communities. 2003 Annual Report. [Online]. Available: http://www.partnershipph.org/col4/ar/ar03.pdf [accessed July 6, 2004].
Pate RR, Trost SG, Mullis R, Sallis JF, Wechsler H, Brown DR. 2000. Community interven-tions to promote proper nutrition and physical activity among youth. Prev Med 31:S138-S148.
Patrick K, Sallis JF, Prochaska JJ, Lydston DD, Calfas KJ, Zabinski MF, Wilfley DE, SaelensBE, Brown DR. 2001. A multicomponent program for nutrition and physical activitychange in primary care: PACE+ for adolescents. Arch Pediatr Adolesc Med 155(8):940-946.
Pearson TA, Stone EJ, Grundy SM, McBride PE, Van Horn L, Tobin BW, NAA CollaborativeGroup. 2001. Translation of nutritional sciences into medical education: The NutritionAcademic Award Program. Am J Clin Nutr 74(2):164-170.
Perdue WC, Stone LA, Gostin LO. 2003. The built environment and its relationship to thepublic’s health: The legal framework. Am J Public Health 93(9):1390-1394.
Perry D. 2001. The Need for More Supermarkets in Philadelphia. Philadelphia, PA: The FoodTrust.
Pietinen P, Lahti-Koski M, Vartiainen E, Puska P. 2001. Nutrition and cardiovascular diseasein Finland since the early 1970s: A success story. J Nutr Health Aging 5(3):150-154.
Pignone MP, Ammerman A, Fernandez L, Orleans CT, Pender N, Woolf S, Lohr KN, SuttonS. 2003. Counseling to promote a healthy diet in adults: A summary of the evidence forthe U.S. Preventive Services Task Force. Am J Prev Med 24(1):75-92.
400

234 PREVENTING CHILDHOOD OBESITY
PolicyLink. 2002. Reducing Health Disparities Through a Focus on Communities. Oakland,CA: PolicyLink. [Online]. Available: http://www.policylink.org/pdfs/HealthDisparities.pdf [accessed July 6, 2004].
Pothukuchi K, Joseph H, Burton H, Fisher A. 2002. What’s Cooking in Your Food System? AGuide to Community Food Assessment. Venice, CA: Community Food Security Coali-tion.
Powell LM, Slater S, Chaloupka FJ. 2004. The relationship between community physicalactivity settings and race, ethnicity and socioeconomic status. Evidence-Based Prev Med1(2):135-144.
Prevention Institute. 2002. Eliminating Health Disparities: The Role of Primary Prevention.[Online]. Available: http://www.preventioninstitute.org/pdf/Health_Disparities.pdf [ac-cessed August 23, 2004].
Prevention Institute. 2003. Environmental and Policy Approaches to Promoting Healthy Eat-ing and Activity Behaviors. Oakland, CA: Prevention Institute.
Puska P, Pietinen P, Uusitalo U. 2002. Influencing public nutrition for non-communicabledisease prevention: From community intervention to national programme—Experiencesfrom Finland. Public Health Nutr 5(1A):245-251.
Reed J, Frazao E, Itskowitz R. 2004. How Much Do Americans Pay for Fruits and Veg-etables? Agriculture Information Bulletin Number 790. Washington, DC: USDA, Eco-nomic Research Service. [Online]. Available: http://www.ers.usda.gov/publications/aib790/aib790.pdf [accessed August 4, 2004].
Retting RA, Ferguson SA, McCartt AT. 2003. A review of evidence-based traffic engineeringmeasures designed to reduce pedestrian-motor vehicle crashes. Am J Public Health93(9):1456-1463.
Roberts I. 1993. Why have child pedestrian death rates fallen? Br Med J 306(6894):1737-1739.
Robinson TN, Killen JD, Kraemer HC, Wilson DM, Matheson DM, Haskell WL, Pruitt LA,Powell TM, Owens AS, Thompson NS, Flint-Moore NM, Davis GJ, Emig KA, BrownRT, Rochon J, Green S, Varady A. 2003. Dance and reducing television viewing toprevent weight gain in African-American girls: The Stanford GEMS pilot study. EthnDis 13(1 Suppl 1):S65-S77.
Romero AJ, Robinson TN, Kraemer HC, Erickson SJ, Haydel KF, Mendoza F, Killen JD.2001. Are perceived neighborhood hazards a barrier to physical activity in children?Arch Pediatr Adolesc Med 155(10):1143-1148.
Saelens BE, Sallis JF, Black JB, Chen D. 2003. Neighborhood-based differences in physicalactivity: An environment scale evaluation. Am J Public Health 93(9):1552-1558.
Sallis JF, Nader PR, Broyles SL, Berry CC, Elder JP, McKenzie TL, Nelson JA. 1993. Corre-lates of physical activity at home in Mexican-American and Anglo-American preschoolchildren. Health Psychol 12(5):390-398.
Sallis JF, McKenzie TL, Elder JP, Broyles SL, Nader PR. 1997. Factors parents use in selectingplay spaces for young children. Arch Pediatr Adolesc Med 151(4):414-417.
Sallis JF, Bauman A, Pratt M. 1998. Environmental and policy interventions to promotephysical activity. Am J Prev Med 15(4):379-397.
Sallis JF, Prochaska JJ, Taylor WC. 2000a. A review of correlates of physical activity ofchildren and adolescents. Med Sci Sports Exerc 32(5):963-975.
Sallis JF, Patrick K, Frank E, Pratt M, Wechsler H, Galuska DA. 2000b. Interventions inhealth care settings to promote healthful eating and physical activity in children andadolescents. Prev Med 31(2):S112-S120.
401

LOCAL COMMUNITIES 235
Sanger K, Zenz L. 2004. Farm-to-Cafeteria Connections. Marketing Opportunities for SmallFarms in Washington State. Washington State Department of Agriculture, Small Farmand Direct Marketing Program. [Online]. Available: http://agr.wa.gov/Marketing/SmallFarm/102-FarmToCafeteriaConnections-Web.pdf [accessed June 8, 2004].
Schwartz MB, Puhl R. 2003. Childhood obesity: A societal problem to solve. Obes Rev4(1):57-71.
Shaffer A. 2002. The Persistence of L.A.’s Grocery Gap: The Need for a New Food Policyand Approach to Market Development. Los Angeles, CA: Center for Food and Justice,Urban and Environmental Policy Institute.
Shea S, Basch CE. 1990. A review of five major community-based cardiovascular diseaseprevention programs. Part II: Intervention strategies, evaluation methods, and results.Am J Health Promot 4(4):279-287.
Sloane DC, Diamant AL, Lewis LB, Yancey AK, Flynn G, Nascimento LM, McCarthy WJ,Guinyard JJ, Cousineau MR. 2003. Improving the nutritional resource environment forhealthy living through community-based participatory research. J Gen Intern Med18(7):568-575.
Smart Growth America. 2004. Smart Growth America. [Online]. Available: http://www.smartgrowthamerica.com/ [accessed April 22, 2004].
Staunton CE, Hubsmith D, Kallins W. 2003. Promoting safe walking and bicycling to school:The Marin County success story. Am J Public Health 93(9):1431-1434.
Stillman FA, Hartman AM, Graubard BI, Gilpin EA, Murray DM, Gibson JT. 2003. Evalua-tion of the American Stop Smoking Intervention Study (ASSIST): A report of outcomes.J Natl Cancer Inst 95(22):1681-1691.
Story M, Sherwood NE, Himes JH, Davis M, Jacobs DR Jr, Cartwright Y, Smyth M, RochonJ. 2003. An after-school obesity prevention program for African-American girls: TheMinnesota GEMS pilot study. Ethn Dis 13(1 Suppl 1):S54-S64.
Sustrans. 2001. Safe Route to Schools. Sustrans Information Sheet FS01. [Online]. Available:http://www.saferoutestoschools.org.uk/imagprod/downloads/fs01.pdf [accessed August4, 2004].
Taren DL, Thomson CA, Koff NA, Gordon PR, Marian MJ, Bassford TL, Fulginiti JV,Ritenbaugh CK. 2001. Effect of an integrated nutrition curriculum on medical educa-tion, student clinical performance, and student perception of medical-nutrition training.Am J Clin Nutr 73(6):1107-1112.
Taylor L, Quigley R. 2002. Health Impact Assessment: A Review of Reviews. London: HealthDevelopment Agency. [Online]. Available: http://www.hda-online.org.uk/evidence [ac-cessed May 26, 2004].
Tester JM, Rutherford GW, Wald Z, Rutherford MW. 2004. A matched case-control studyevaluating the effectiveness of speed humps in reducing child pedestrian injuries. Am JPublic Health 94(4):646-650.
Transportation Alternatives. 2004. Safe Routes to School. [Online]. Available: http://www.saferoutestoschools.org [accessed April 20, 2004].
TRB (Transportation Research Board). 2002. The Relative Risks of School Travel. A Na-tional Perspective and Guidance for Local Community Risk Assessment. Washington,DC: TRB.
Tudor-Locke C, Ainsworth BE, Adair LS, Popkin BM. 2003. Objective physical activity ofFilipino youth stratified for commuting mode to school. Med Sci Sports Exerc 35(3):465-471.
Twiss J, Dickinson J, Duma S, Kleinman T, Paulsen H, Rilveria L. 2003. Community gardens:Lessons learned from California healthy cities and communities. Am J Public Health93(9):1435-1438.
402

236 PREVENTING CHILDHOOD OBESITY
Urban and Environmental Policy Institute. 2002. Transportation and Food: The Importanceof Access. [Online]. Available: http://departments.oxy.edu/uepi/cfj/resources/Trans-portationAndFood.htm#_edn2 [accessed June 8, 2004].
USPSTF (U.S. Preventive Services Task Force). 2003. Screening for obesity in adults: Recom-mendations and rationale. Ann Intern Med 139(11):930-932.
Whitaker RC. 2003. Obesity prevention in pediatric primary care: Four behaviors to target.Arch Pediatr Adolesc Med 157(8):725-727.
WHO (World Health Organization). 1999. Health Impact Assessment: Main Concepts andSuggested Approach. Brussels, Belgium: European Centre for Health Policy.
Wolff T. 2001. Community coalition building—Contemporary practice and research: Intro-duction. Am J Community Psychol 29(2):165-172, 205-111.
Yancey AK, Kumanyika SK, Ponce NA, McCarthy WJ, Fielding JE, Leslie JP, Akbar J. 2004.Population-based interventions engaging communities of color in healthy eating andactive living: A review. Prev Chronic Dis 1(1):1-18. [Online]. Available: http://www.cdc.gov/pcd [accessed August 26, 2004].
Young DR, Haskell WL, Taylor CB, Fortmann SP. 1996. Effect of community health educa-tion on physical activity knowledge, attitudes, and behavior. The Stanford Five-CityProject. Am J Epidemiol 144(3):264-274.
Zakarian JM, Hovell MF, Hofstetter CR, Sallis JF, Keating KJ. 1994. Correlates of vigorousexercise in a predominantly low SES and minority high school population. Prev Med23(3):314-321.
403

237
Schools
7
Schools are one of the primary locations for reaching the nation’schildren and youth. In 2000, 53.2 million students were enrolled inpublic and private elementary and secondary schools in the United
States (U.S. Department of Education, 2002). Many of these schools arealso locations for preschool, child-care, and after-school programs in whichlarge numbers of children participate.
The school environment has the potential to affect national obesityprevention efforts both because of the population reach and the amount oftime that students spend at school each day. Children obtain about one-third1 of their total daily energy requirement from school lunch (USDA,2004a), and should expend about 50 percent of their daily energy expendi-ture while at school, depending on the length of their school day. Given thatschools offer numerous and diverse opportunities for young people to learnabout energy balance and to make decisions about food and physical activ-ity behaviors, it is critically important that the school environment be struc-tured to promote healthful eating and physical activity behaviors. Further-
1These estimates are for a school day and do not take into account weekends, holidays, orschool vacations. Students who eat breakfast at school could consume approximately 58percent of their total daily energy requirement at school. This estimate is based on the federalSchool Breakfast Program’s goal of providing one-fourth of the Recommended Dietary Al-lowances (RDAs) of certain nutrients through school breakfast and the National SchoolLunch Program’s goal of providing one-third of the RDAs through school lunches(7CFR210.10; 7CFR220.8; USDA, 2004a).
404

238 PREVENTING CHILDHOOD OBESITY
more, consistency of the messages and opportunities across the school envi-ronment is vital—from the cafeteria, to the playground, to the classroom,to the gymnasium.
Increasingly, schools and school districts across the country are imple-menting innovative programs focused on improving student nutrition andincreasing their physical activity levels. Parents, students, teachers, schooladministrators, and others play important roles in initiating these changes,and it is important to evaluate these efforts to determine whether theyshould be expanded, refined, or replaced and whether they should be fur-ther disseminated.
It is acknowledged that the school environment is complex, and schoolsface many economic and time constraints on their ability to address a broadarray of student needs. Further, many food- and physical activity-relatedpolicies and practices are linked at multiple levels. A change in one practicemay impact other areas of the school environment, either related directly tofood or physical activity or indirectly to other areas (such as academic,extracurricular, financial, or administrative). The recommended actions,described below, therefore, were developed with the goal of being imple-mented concurrently and not as stand-alone strategies. Moreover, theseactions should reinforce and support each other not only in the schools butin other settings, including the community and home environments (Chap-ters 6 and 8). Recommendations regarding schools also must acknowledgethe diverse ways in which public schools are governed and funded through-out the United States. Although public school governance is primarily local(school boards that oversee school districts), there is variability in the addi-tional role that states play (NRC, 1999).
The recommended actions in this chapter are intended to apply, asrelevant, to all the settings where children and youth spend a majority oftheir organized time outside the home. For most children and youth overthe age of 5 years, this will be a school setting (i.e., elementary school,middle school, or high school). For children below the age of 5 years, thismay be kindergarten, formal preschool, early childhood education pro-gram, child development center, child-care center, or family or other infor-mal child-care setting.
FOOD AND BEVERAGES IN SCHOOLS
The school food environment has undergone a rapid transition from afairly simple to a highly complex environment, particularly in high schools.Traditionally, school cafeterias offered only the U.S. Department of Agri-culture (USDA) federally subsidized school meal, which is required to meetdefined nutritional standards. Recently there have been increases, however,in the amount of “à la carte” foods and beverages—items offered individu-
405

SCHOOLS 239
ally and not as part of a school meal—sold in or near the school cafeteria intandem with the federally reimbursed school meal. Individual foods andbeverages are also sold or served in vending machines, at school stores, orat school fundraisers.
Foods and Beverages Sold in Schools
Federal School Meal Programs
The National School Lunch Program (NSLP) was established in 1946to “safeguard the health and well-being of the Nation’s children and toencourage the domestic consumption of nutritious agricultural commodi-ties and other food” (7CFR210.1). Each school day approximately 28million school-aged children participate in the NSLP and some 8 millionparticipate in the School Breakfast Program (SBP) (USDA, 2003).
Nutrition guidelines for the school meal programs have been revisedperiodically to maintain consistency with changes in nutritional recommen-dations. Current regulations for the programs require that the meals beconsistent with the Dietary Guidelines for Americans and adhere to theRDAs for energy, protein, calcium, iron, vitamin A, and vitamin C. Theseguidelines are described in Box 7-1.
Several food-based menu-planning approaches are used in the NSLP toensure that lunches and breakfasts are nutritionally balanced. The majorityof schools use the “traditional” food-based menu-planning system, which
BOX 7-1USDA Requirements for School Meal Programs
• Meet the applicable recommendations of the Dietary Guidelines for Americans,which recommend that no more than 30 percent of an individual’s calories comefrom fat, and that less than 10 percent from saturated fat.
• Provide one-third of the RDAs of protein, vitamin A, vitamin C, iron, and calci-um through school lunches and provide one-fourth of the RDA requirementsthrough school breakfasts.
• “Foods of minimal nutritional value” (FMNV) as defined by federal regulations,cannot be sold in food service areas during the school meal periods. The fourcategories of foods defined as FMNV are soda water, water ices, chewing gum,and certain candies (including hard candy, jellies and gums, marshmallow can-dies, fondant, licorice, and spun candy).
SOURCES: 7CFR210.10; 7CFR220.8; 7CFR Appendix B to Part 210.
406

240 PREVENTING CHILDHOOD OBESITY
requires school lunches to offer five food items selected from four foodtypes: fluid milk; meat or meat alternative; at least one serving of bread orgrain products; and two or more servings of fruit, vegetables, or both. Asecond approach is the “nutrient-based” menu-planning approach used byabout one-fourth of schools (USDA, 2004c). School food authorities pre-pare a nutrient analysis of meals for a one-week period to determine whetherthese meals meet the nutritional requirements outlined by the dietary guide-lines (USDA, 2004b). Schools that use this approach must serve milk andoffer at least one entrée and one side dish per meal. Requirements for fruitand vegetable servings are not specified under the current guidelines (USDA,2004b), and it should be noted that high-calorie, energy-dense items (e.g.,cookies, cake, and batter-fried foods) can be served to students as part oftheir school meals.
The target goals for the NSLP and SBP are that no more than 30percent of calories should come from fat and less than 10 percent of caloriesfrom saturated fat (USDA, 2004b). Because milk with high saturated fatcontent has been a particular concern regarding the students’ dietary in-take, schools were required to offer both whole and low-fat milk (currentlydefined as having 1 percent fat content or less) beginning in 1994 (USDA,2004b).
In response to research in the early 1990s indicating that school mealswere generally not meeting key nutritional goals, USDA launched the SchoolMeals Initiative for Healthy Children in 1995, which provides schools witheducational and technical resources for meal planning and preparation(USDA, 2001b). According to data from the second School Nutrition Di-etary Assessment Study (SNDAS-II), a nationally representative study of theNSLP and SBP conducted in the 1998-1999 school year, lunches in elemen-tary schools provided an average of 33 percent of calories from fat (targetgoal is 30 percent or less) and 12 percent of calories from saturated fat(target goal is less than 10 percent). The average lunch in secondary schoolsprovided about 35 percent of calories from fat and 12 percent of caloriesfrom saturated fat, also failing to meet the targets (USDA, 2001b). How-ever, compared with the first SNDAS survey in the 1991-1992 school year,there were significant increases in the percentages of schools that servedmeals consistent with the Dietary Guidelines regarding fat and saturated fatcontent. In the second survey, approximately two-thirds of NSLP menusoffered two fruit and vegetable choices, and more than 25 percent includedfive or more fruit and vegetable choices (USDA, 2001b).
All students are eligible to take advantage of the NSLP and SBP. The1998-1999 SNDAS-II survey found that approximately 60 percent of stu-dents at participating schools did so, either through full-price or reduced-cost purchase or by being eligible to receive free meals. Participation washighest in elementary schools (67 percent) and lowest in high schools (39
407

SCHOOLS 241
percent) (USDA, 2001b). Participation was highest among students ap-proved to receive free meals (80 percent) as compared with students receiv-ing reduced-price meals (69 percent) or students paying full price (48 per-cent).
Only a few studies have compared dietary quality of NSLP participantsand nonparticipants. Cullen and colleagues (2000) found that fifth-gradestudents who selected only the NSLP meal reported consuming up to twiceas many servings of fruit, juice, and vegetables than students who ate fromthe snack bar or brought their lunch from home. In a two-year follow-upstudy, diets of students as fourth-graders (when they had access to NSLPlunches only) were compared with their diets during the subsequent year,when as fifth-graders they had access to the snack bar in middle school(Cullen and Zakeri, 2004). During that second year the students consumedfewer fruits, fewer nonfried vegetables, less milk, and more sweetened bev-erages.
Competitive Foods
The term “competitive foods” is used to describe all foods and bever-ages served or sold in schools that are not part of the federal school mealprograms. This includes “à la carte” foods and beverages offered by theschool food service; items sold from vending machines located inside oroutside the school cafeteria; foods and beverages sold anywhere in theschool as part of fundraising efforts by student, faculty, or parent groups;items served in the classroom for snacks and rewards; and foods and bever-ages made available during after-school activities. As discussed below, com-petitive foods from these various sources are typically lower in nutritionalquality than those offered as part of the school meal programs.
Current federal nutritional guidelines for competitive foods are lim-ited. Foods of “minimal nutritional value”—narrowly defined primarily assoft drinks and certain types of candy (Box 7-1) (7 CFR Appendix B toPart 210)—are prohibited from sale in the school cafeteria while meals arebeing served. However, no other national standards currently exist toscreen competitive foods for nutritional quality within the school setting.Thus items of low nutrient density or high energy density, including cook-ies, candy bars, potato chips, and other salty or high-fat snack foods, areoften allowed for sale in direct competition with the school meals. Further-more, federal guidelines do not prohibit foods of minimal nutritional valuefrom being sold in vending machines near the cafeteria or at other schoollocations.
States and school districts, however, may implement their own more-restrictive policies regarding competitive foods, and many states have passedlegislation that limits the types of foods allowed for sale in the schools and
408

242 PREVENTING CHILDHOOD OBESITY
the hours during which they are available. A recent report by the GeneralAccounting Office (GAO) found that 21 states had policies that restrictcompetitive foods beyond USDA regulations (GAO, 2004). For example,California has mandated guidelines for foods and beverages offered inschools. This 2001 legislation includes a provision for funding pilot pro-grams that would, among other things, require fruits and vegetables to beoffered for sale in any school location where food or beverages are sold.Additionally, the board of the Los Angeles Unified School District in 2001voted to implement standards for beverages, which led to a ban on the saleof carbonated beverages on all school campuses (Los Angeles Unified SchoolDistrict, 2004). West Virginia prohibits schools from serving or sellingcandy bars, foods, or drinks consisting of 40 percent or more added sugaror other sweeteners; juice or juice products containing less than 20 percentreal juice; and foods with more than 8 grams of fat per 1-ounce serving. Inaddition, all soft drinks are prohibited in West Virginia elementary andmiddle schools (Stuhldreher et al., 1998; Wechsler et al., 2000). Localschools and school districts are also implementing their own restrictions oncompetitive foods (GAO, 2004). The issues surrounding competitive foodsare currently being discussed in many other states and school districts.
Specific policies and nutritional standards are still needed, however, inmost school districts. Data from the 2000 School Health Policies and Pro-grams Study (SHPPS) found that only about 40 percent of school districts,but almost no state governments, required schools to offer a choice of twoor more fruits or two or more vegetables at lunch time (Wechsler et al.,2001). With the exception of California, the 2000 SHPPS found that nostates require schools to offer fruits and vegetables in school stores, snackbars, or vending machines. At the district level, 3.7 percent of school dis-tricts require fruits and vegetables to be available in school stores and snackbars, and 1.7 percent require fruits and vegetables to be available in vend-ing machines (Wechsler et al., 2001). A recent statewide survey of Minne-sota secondary school principals found that only 32 percent of their schoolshad policies of any kind about nutrition and food and that 18 percent hadpolicies regarding items sold from school vending machines (French et al.,2002). Seventy-seven percent of these school principals reported havingvending machine contracts with soft drink companies.
Competitive foods represent a significant share of the foods that stu-dents purchase and consume at school, particularly in high schools(Wechsler et al., 2001). National survey data from the 2000 SHPPS showthat competitive foods are widely available in many elementary schools,most middle schools, and almost all secondary schools (Wechsler et al.,2001). In 2000, food and beverage items were sold to students from vend-ing machines, school stores, or snack bars in 98 percent of secondaryschools, 74 percent of middle schools, and 43 percent of elementary schools.
409

SCHOOLS 243
Data from a recent study of 20 high schools in Minnesota found a medianof 11 vending machines in each school—typically four soft drink machines,five machines dispensing other beverages (e.g., fruit juice, sports drinks, orwater), and two snack machines (French et al., 2003).
Available data show that competitive foods are often high in energydensity (often high fat or high sugar) and low in nutrient density (Story etal., 1996; Harnack et al., 2000; Wechsler et al., 2001; Zive et al., 2002;French et al., 2003). National data from the SHPPS survey show that 80percent of the à la carte areas in high schools sell high-fat cookies andbaked goods, and 24 percent sell chocolate candy (Wechsler et al., 2001).Although fruits and vegetables are generally available—they are sold in theà la carte areas of 68 percent of elementary schools, 74 percent of middleschools, and 90 percent of secondary schools—energy-dense foods tend tocomprise the majority of competitive foods offered for sale. For example, atthe 20 Minnesota high schools noted above, chips, cookies, pastry, candy,and ice cream accounted for 51.1 percent of all à la carte foods offered,while fruits and vegetables were at 4.5 percent, and salads 0.2 percent(French et al., 2003).
Because students’ food choices are influenced by the total food environ-ment, the simple availability of healthful foods such as fruits and vegetablesmay not be sufficient to prompt the choice of these targeted items whenother food items of high palatability (often high-fat or high-sugar items) areeasily accessible, especially those that are heavily marketed to children andyouth. Data from two recent studies conducted in middle schools provideempirical evidence for this hypothesis (Cullen et al., 2000; Kubik et al.,2003). Fruit and vegetable intake was lower among students at schoolswhere à la carte foods were available, in comparison with schools where àla carte foods were not available. Not surprisingly, when given the choicemany students select the higher fat and higher sugar items. However, datafrom a recent randomized trial involving 20 high schools indicate thatoffering a wider range of healthful foods can be an effective way to promotebetter food choices among high school students (French et al., 2004). Incombination with student-led schoolwide promotions, increases in the avail-ability of healthier à la carte foods led to significant increases in sales of thetargeted foods to students over a 2-year period. Taken together, such find-ings suggest that restricting the availability of high-calorie, energy-densefoods in schools while increasing the availability of healthful foods mightbe an effective strategy for promoting more healthful food choices amongstudents in schools.
The present reality, however, falls short of this situation. The rapidgrowth in the availability and marketing of à la carte foods and beverages,of soft drinks and other high-sugar beverages in school vending machines,and of other sources of competitive foods throughout the school environ-
410

244 PREVENTING CHILDHOOD OBESITY
ment has become an important issue. Bearing significantly as it does onstudent nutrition and obesity prevention efforts, this issue urgently needsattention from leaders at national, state, and local levels. New policies areneeded, both to ensure that the foods available at schools are consistentwith current nutritional guidelines and to support the goal of preventingexcess energy intake among students and helping students achieve energybalance at a healthy weight.
School-Based Dietary Intervention Studies
School-based interventions to improve food choices and dietary qualityamong students have been designed primarily as multifaceted interventionsthat include one or more of the following components:
• Changes in food service and the food environment (e.g., food avail-ability, preparation methods, price)
• Promotional activities (cafeteria-based or schoolwide)• Classroom curricula on nutrition education and behavioral skills• Parental involvement (e.g., informational newsletters or parent-
child home activities).
Most often these interventions have targeted total fat, saturated fat, orfruit and vegetable intake. In addition, they may have addressed otherweight-related behaviors such as physical activity or television viewing (re-viewed later in this chapter). This section focuses on the large-scale con-trolled intervention studies that have examined weight status or body massindex (BMI) changes as an outcome measure. A much larger literatureexists on school-based interventions to change the dietary behaviors ofstudents, including the 5-A-Day and Know Your Body studies (Walter etal., 1985; Hearn et al., 1998).
Evaluation of the literature on such interventions is complicated be-cause of their variety and the multicomponent nature of their designs,making comparisons of results difficult. In addition, differences exist acrossstudies in the number and types of food-related behaviors and age groupstargeted. Studies based in elementary, middle, and high schools differ notonly in the developmental stage of the students, but in the correspondingphysical and social environments, which contrast dramatically, for example,in the availability of à la carte foods, fast foods, snack bars, and vendingmachines. High school students are also more likely than elementary ormiddle school students to leave campus during the lunch period. Thesevariables may moderate the effects of interventions designed to influencefood choices in the school setting.
411

SCHOOLS 245
The Child and Adolescent Trial for Cardiovascular Health (CATCH),the largest and most comprehensive school-based intervention yet under-taken, targeted diet and physical activity behaviors as secondary outcomevariables (Box 7-2). This randomized trial involving 96 elementary schoolsdid not result in significant changes in body weight; however, significantchanges did occur in the school food environment and in reported dietaryintakes by students (Luepker et al., 1996). Compared to control schools,the fat content of meals at the intervention school meals was substantiallylowered, and intervention students’ reported dietary fat intake was signifi-cantly reduced relative to that of control students. Also, as noted below inthe discussion on physical activity, the percentage of physical educationclassroom time with moderate to vigorous physical activity increased in theintervention schools. The researchers speculated that the reasons for thelack of changes in physiologic risk factors may be related to the growth anddevelopment stage of the students or to the relatively low magnitude of thechanges in food intake and physical activity levels (Luepker et al., 1996).
Pathways, a large, multicomponent school-based intervention designedas an obesity prevention study, was conducted among third- to fifth-gradeAmerican-Indian children in reservation schools over a 3-year period (Ca-ballero et al., 1998). Pathways did not significantly affect body-weightchange, but significant intervention-related changes were observed for somedietary and physical activity behaviors, including lower fat intake and higherself-reported physical activity levels in the students in the interventionschools (Caballero et al., 2003). The goal of the food service intervention—to reduce the fat content of the school meals—was achieved. Both theCATCH and Pathways interventions show the feasibility of making posi-tive changes in the school food environment, but also the challenges still tobe faced in designing primary obesity prevention interventions in schools.As pointed out by the researchers in the Pathways study, restriction ofenergy intake is not an option in schools because there are students who arebelow the fifth BMI percentile, additionally, the school meals programshave to meet minimum mandatory levels for calorie content (Caballero etal., 2003).
Several other school-based intervention studies have shown significanteffects on body-weight outcomes; these studies tested multicomponent in-terventions not limited only to targeting dietary change. Planet Healthreported reductions in the prevalence of obesity among girls only(Gortmaker et al., 1999), and the Stanford Adolescent Heart Health Pro-gram observed reductions in BMI, triceps skinfold thickness, and subscapu-lar skinfold thickness among boys and girls (Killen et al., 1988).
Overall, school-based interventions, both multicomponent and singlecomponent, have produced healthful food choices among students. Envi-
412

246 PREVENTING CHILDHOOD OBESITY
BOX 7-2Selected School-Based Interventions
Child and Adolescent Trial for Cardiovascular Health (CATCH)—Designed asa health behavior intervention for the primary prevention of cardiovascular dis-ease, CATCH was evaluated in a randomized field trial in 96 elementary schools inCalifornia, Louisiana, Minnesota, and Texas (Luepker et al., 1996). CATCHschools received school food service modifications and food service personneltraining, physical education (PE) interventions and teacher training, and classroomcurricula that addressed eating behaviors, physical activity, and smoking (Luepkeret al., 1996). The primary individual outcome examined was change in serum cho-lesterol concentration; school-based outcomes were also examined.
Pathways—Designed to reduce obesity in American-Indian children in gradesthree through five, a randomized trial was conducted in 41 schools servingAmerican-Indian communities in Arizona, New Mexico, and South Dakota(Caballero et al., 1998; Davis et al., 1999). This multicomponent program in-volved incorporation of high-energy activities in PE classes and recess; foodservice training and nutritional educational materials; classroom curricula enhance-ments; and family efforts including family fun nights, take-home action- andsnack-packs, and family advisory councils. The primary outcome measure wasthe mean difference between intervention and control schools in percentage ofbody fat at the end of the fifth grade.
Planet Health—A curriculum-based health intervention, Planet Health lessonswere integrated into the math, language arts, social studies, science, and PE cur-ricula of grades six through eight. The lessons focus on teaching better dietary
ronmental interventions, which target reduced consumption of high-fatfoods and greater intake of fruits and vegetables through variations inavailability, pricing, and promotion in the school environment (Whitaker etal., 1993, 1994; Luepker et al., 1996; Caballero et al., 1998; Perry et al.,1998, 2004; Reynolds et al., 2000; French et al., 2001, 2004; French andStables, 2003) may have a particularly significant independent effect onfood choices (French et al., 2001; French and Stables, 2003). But theirimpacts are perhaps smaller in magnitude than when deployed as part of amulticomponent intervention program (Perry et al., 1998, 2004; French etal., 2001; French and Stables, 2003).
Because classroom education/behavioral skills curricula, for example,have typically been embedded in a multicomponent program, the effective-ness of this intervention component is difficult to evaluate as an isolatedstrategy. Furthermore, caution is needed in interpreting studies of self-reports of dietary intakes, which may be subject to reporting errors andbias.
413

SCHOOLS 247
Recent and Ongoing Pilot Program
Several pilot programs have been developed at the school, district,state, and federal levels to explore strategies to increase fruit and vegetableconsumption among students in school. The committee is not aware of anypublished outcome evaluation of these studies but the programs are de-scribed here to illustrate current approaches that may warrant continuedfunding and more systematic analysis. The most recent and perhaps largesteffort to increase the availability and consumption of fresh fruits and veg-etables was implemented by USDA during the 2002-2003 school year(Buzby et al., 2003). One hundred schools in four states (Indiana, Iowa,Michigan, and Ohio) and seven schools in New Mexico’s Zuni IndianTribal Organization participated in the pilot program, which distributedfruit and vegetables free to participating schools. Schools could choosewhen and how to distribute the produce to students. The program re-quested, however, that the fruits and vegetables be made available to stu-dents outside the regular school meal periods. Due to limited funding, no
habits, promoting physical activity, and reducing television viewing (Gortmaker etal., 1999). Evaluation of the intervention involved comparing obesity prevalenceand behavioral changes among students in five intervention and five controlschools in the Boston area.
Sports, Play and Active Recreation for Kids (SPARK)—A school-based inter-vention designed to improve the quantity and quality of physical education, theevaluation involved seven elementary schools in southern California in a 3-yearstudy (McKenzie et al., 1997). The SPARK program involves enhancements to thePE curriculum, implementation of a self-management curriculum, and teacher in-service training programs. Outcomes assessed included changes in student BMIand physical activity levels.
Stanford Adolescent Heart Health Program—Designed to reduce cardiovascu-lar disease risk factors in high school students, the intervention consisted of 20 50-minute classroom sessions on physical activity, nutrition, smoking, and stress(Killen et al., 1988). The evaluation of the intervention compared the results of10th-grade students in four high schools in northern California on behavioralchanges and physiological variables including BMI.
Stanford S.M.A.R.T. (Student Media Awareness to Reduce Television)—De-signed to motivate children to reduce their television watching and video gameusage, the intervention was evaluated in two elementary schools in California(Robinson, 1999). Students in the intervention third- and fourth-grade classroomsparticipated in an 18-lesson, six-month curriculum and families could use an elec-tronic television time manager. The primary outcome measure was BMI; otherphysiologic variables and behavioral changes were also assessed.
414

248 PREVENTING CHILDHOOD OBESITY
quantitative data were collected on the effects of the program on students’fruit and vegetable consumption or on any other dietary outcomes. How-ever, schools and school food-service staff reported that the program waspositively received (Buzby et al., 2003), and there are plans to expand theprogram. A similar program was developed and pilot-tested on a nationalbasis in the United Kingdom beginning in 2000. As far as the committee isaware, no quantitative evaluation data are available (United Kingdom De-partment of Health, 2002).
The Department of Defense’s Fresh Produce Program has been workingwith schools in several states to provide fresh produce for the school mealprograms. Schools have also begun to incorporate produce from schoolgardens (Morris and Zidenberg-Cherr, 2002; Stone, 2002), school saladbars (USDA, 2002), and farmers’ markets (Misako and Fisher, 2002) intothe school meal program in an effort to increase student participation andspecifically to increase their fruit and vegetable consumption (Box 7-3).Evaluation of these and other similar programs is important in determiningthe effects of these changes on student dietary behaviors.
Next Steps
As discussed above, several large-scale school-based intervention stud-ies demonstrate that changes in the school food environment can impactstudents’ dietary choices and improve the nutrient quality of their dietswhile at school.
Schools, school districts, and state educational agencies need to ensurethat all meals served or sold in schools are in compliance with the DietaryGuidelines for Americans. Additionally, schools should focus on improving
BOX 7-3Edible Schoolyard
The Edible Schoolyard is a nonprofit program conducted at the Martin Luther KingJunior Middle School in Berkeley, California, a public school for sixth- througheighth-graders. Students participate in all phases of the Seed to Table approach—planting vegetables, grains, and fruits; tending and harvesting the crops; preparingmeals with the produce they have grown; and recycling the vegetable scraps backto the garden. This cooking and gardening program involves classroom lessonsand hands-on experience in the garden and in the kitchen. The program’s goalsinclude an enhanced understanding of the cycle of food production; the focus ofevaluation efforts to date has been on ecoliteracy.
SOURCE: Edible Schoolyard, 2004.
415

SCHOOLS 249
food quality in the school meal programs. Increasing the availability ofwhole-grain foods, low-fat milk, and fresh local produce will not only bemore healthful for participating students, but has the potential to attractgreater participation.
Current nutritional standards are extremely limited for regulating com-petitive foods sold in schools, and many schools are selling high-calorie,energy-dense food and beverage items, often in competition with schoolmeal programs. To ensure that foods and beverages sold or served to stu-dents in school are healthful, USDA, with independent scientific advice,should establish nutritional standards for all food and beverage items servedor sold in schools. Such standards need to be applied to all meals and allfoods and beverages served or sold within the school environment.2 Amongthe many nutritional issues, consideration should be given to setting stan-dards for the fat and sugar content of school foods, because they are oftenhigh in calories and in energy density. State education agencies and localschool boards should adopt and implement these standards or developstricter standards for their local schools. Without such schoolwide stan-dards, different sources compete for student sales under unequal condi-tions. Such competitive practices often give unfair advantage to those sell-ing less healthful food and beverage items to students. Providing andenforcing uniform standards for meals, foods, and beverages on a school-wide basis also establishes a social norm for healthful eating behaviors. Thestandards ensure that the school environment is one in which healthfuleating is promoted and modeled, consistent with nutrition education mes-sages taught in the classroom.
It is important that evaluations be conducted to assess the impact ofchanges on competitive foods’ nutritional value and availability, on studentdietary quality, and on revenues generated by food and beverage sales.Evaluations of the school food environment may benefit from point-of-service purchase information available from automated systems in schoolcafeterias. Additionally, evaluations of the efficacy and effectiveness ofschool-based multicomponent interventions are needed to determinewhether these programs should be continued, replicated, expanded, or re-placed.
In efforts to make changes in school foods, the school food industryshould be an important partner in developing innovative approaches topreparing and serving healthful foods and beverages. Training of school
2Such changes in federal regulations may require changes in USDA’s authority, as USDA’scurrent authority extends only to foods sold in the cafeteria and other school food-serviceareas during school meal periods (GAO, 2004).
416

250 PREVENTING CHILDHOOD OBESITY
nutrition and food-service personnel should include a focus on obesityprevention efforts. Furthermore, as schools are built or renovated, schooldistricts should take into consideration plans for school kitchens that haveadequate preparation and serving space as well as plans for school cafete-rias that are of adequate size and layout so that students will not be rushed,uncomfortable, or scheduled to eat lunch too early or too late in the schoolday.
Funding and Sales of School Meals and Competitive Foods
School Meal Funding
School nutrition programs are financially self-supporting and must gen-erate sufficient revenues to pay for food-service staff, food purchases, andequipment. Schools that participate in the NSLP receive a fixed amount ofreimbursement for each school meal served. Federal reimbursement ratesare typically 9 to 10 times higher for free meals than for reduced-price orpaid meals (FNS/USDA, 2003). Although some states contribute a supple-mental amount and most schools also receive donated commodity foodsthrough USDA, federal reimbursements at their present levels are insuffi-cient to cover the remainder of the meals’ actual costs.
To generate funds needed to function, school food services often selladditional foods and beverages that are not part of the school meals pro-gram (GAO, 2003). As noted earlier, these items are called “competitivefoods” because they compete with the meal programs for students’ spend-ing on foods and beverages while in school. Thus, the federal fundingstructure places a school food service in the paradoxical situation of com-peting with itself as well as with other sources that sell food or beverages inschool—such as student groups or the school administration (through vend-ing machine contracts)—for student patronage.
In fact, the nationwide SNDAS-II school survey found that sales of à lacarte items were inversely related to sales of NSLP meals (USDA, 2001b).Not surprisingly, states that restricted competitive food sales, such as Geor-gia, Louisiana, Mississippi, and West Virginia, had school meal programparticipation rates that were higher than the national average (USDA,2001a).
Full funding for the school meal programs could relieve the pressure onschools’ food services to generate extra funding through the sales of com-petitive foods. Such a policy may enhance food services by focusing onproviding high-quality nutritious meals to encourage maximum participa-tion and may also help alleviate any perceptions among students that onlylow-income individuals eat the school meals.
417

SCHOOLS 251
Sales of Competitive Foods
Local schools and school education agencies should consider examin-ing policies and practices on the sale of competitive foods and beverages,including those sold in vending machines and as fundraisers. As discussedabove, these foods and beverages are often calorie-laden and low in nutri-ent density. If nutritional standards are developed and implemented forcompetitive foods and beverages, as recommended in this report, the stan-dards would apply to all food and beverage items sold in the schools,including those sold through vending machines and in fundraising. As seenin states and districts that have already implemented nutritional standards,the result of these standards and policies is that soft drinks and energy-dense foods are often precluded from being sold. The goal is, of course, a“win-win” situation where sales of healthful foods and beverages in vend-ing machines and other venues would be more healthful for students as wellas profitable to schools and school groups.
Current policies vary widely between schools and school districts abouthow funds are used from the different types of food and beverage sales.Vending machine revenues are often used by school administrators fordiscretionary budget purposes (Wechsler et al., 2000); examples includepurchases of computers, sports equipment, and funding of other schoolprograms and activities that are not funded in the school budget (Nestle,2000). One of the issues that has been raised is the exclusivity of someschools’ marketing contracts with specific soft drink companies that mayinclude financial and in-kind incentives for the volume of beverages sold(Nestle, 2000; Wechsler et al., 2000).
Food and beverage sales have been used at special events to generatefunds needed by student groups, school administrators, and booster clubsto support worthwhile activities such as field trips or the acquisition ofuniforms, equipment, or other supplies that are not covered by existingbudgets. Schools and school districts should consider adopting policies todiscourage the sale of foods and beverages and instead encourage othertypes of fundraising activities, such as walkathons or fun runs.
Pricing strategies may also be an effective means of promoting the salesof healthful foods, while discouraging sales of high-fat or energy-densefoods and beverages. In an initial pilot study, purchase of fresh fruit andvegetables from à la carte areas in two high schools increased two- to four-fold when prices were reduced by 50 percent (French et al., 1997). In asecond study over a 2-year period at 12 high schools and 12 worksites,purchases of more healthful vending machine snacks successively increasedwhen prices of lower fat foods were reduced by 10 percent, 25 percent, and50 percent compared to prices of the higher fat snacks that were alsoavailable (French et al., 2001). Importantly, no significant reduction in
418

252 PREVENTING CHILDHOOD OBESITY
vending machine profits were observed during the price reduction interven-tion. More generally, reducing the prices of targeted foods has consistentlyproduced increases in their purchase among adolescents in school settings,regardless of whether the target foods were vending machine snacks orfresh fruits and vegetables sold in food-service areas.
These pilot studies point to the need for further research and evaluationof pricing strategies. If competitive food sales to students continue, schoolfood services should consider the strategy of price increases on higher fat,low-nutrient-dense foods in tandem with lower prices on more healthfulfoods (Hannan et al., 2002). This strategy could achieve the dual goals ofpromoting healthful food choices among students and maintaining neededschool food-service revenues.
Next Steps
Innovative approaches are needed to encourage students to consumenutritious foods and beverages. Pilot programs offer the potential to imple-ment and carefully evaluate a variety of strategies related to pricing andfunding issues.
The committee proposes that USDA conduct pilot studies to examinethe benefits and costs of providing full funding for school breakfast, lunch,and snack programs in a targeted subset of schools that include a largepercentage of children at high risk for obesity. Outcomes to be examinedwould include the impact on student nutritional status and on obesityprevalence. It may also be valuable to examine whether the cost of provid-ing free meals is less expensive than the cost to monitor and track free andreduced-price eligibility for school meals.
Pilot programs could also be used to develop, implement, and evaluatealternative models to financially support school and student programs with-out relying significantly on food and beverage sales.
Experimental research is needed to examine the effects of school-basedinterventions and policy changes on students’ dietary intake and eatingbehaviors. For example, changes in food availability and access to bothhealthful and less healthful foods, pricing of foods and beverages soldthrough competitive food sources and pricing of the school meals, promo-tional programs to support healthful food choices, and corporate-spon-sored in-school food and beverage marketing activities need to be evaluatedto determine their effects on students’ diet and eating behaviors. Experi-mental and quasi-experimental studies are needed to evaluate the effects ofschool- and district-level policies regarding school food and beverage avail-ability and marketing on student dietary intake and on school revenues.Academic performance and classroom and social behavior are secondaryoutcomes of interest.
419

SCHOOLS 253
It is important to note that research should also focus on food service atchild-care centers, preschools, and other sites that serve meals to youngchildren. More needs to be known about improving nutrition for youngchildren.
PHYSICAL ACTIVITY
At a time when many children and youth need to increase their physicalactivity levels, schools offer the environment, the facilities, and the teachersnot only for meeting students’ current physical activity needs, but for help-ing them form the lifelong habits of incorporating physical activity intotheir daily lives. As discussed in Chapter 3, current recommendations arefor children to accumulate a minimum of 60 minutes of moderate to vigor-ous physical activity each day (Biddle et al., 1998; USDA and DHHS, 2000;Cavill et al., 2001; IOM, 2002; NASPE, 2004). Because children spend overhalf of their day in school, the committee felt it reasonable to recommendthat at least 30 minutes, or half of the recommended daily physical activitytime, be accrued during the school day. In addition to its contribution topreventing obesity, regular physical activity has numerous ancillary healthand well-being benefits (Chapter 3).
Researchers are examining the extent and nature of the relationshipbetween increased physical activity and enhanced academic performance,but the results to date are inconclusive. In a study involving 7,961 Austra-lian children, Dwyer and colleagues (2001) found that higher academicperformance was positively associated with physical fitness and physicalactivity. Other cross-sectional studies and a few limited longitudinal studieshave found similar results, although correlations are often weak (reviewedby Shephard, 1997). Explanations for a positive association include im-proved motor development, increased self-esteem, and improved behaviordue to physical activity; however, there are numerous confounders, includ-ing genetic factors, family environment, and changes in teacher and studentattitudes.
Physical Education Classes and Recess During School Hours
Daily physical education (PE) for all students is a goal supported byseveral national health- and education-related organizations, including theNational Association for Sport and Physical Education, the American Acad-emy of Pediatrics, and the U.S. Department of Health and Human Services(CDC, 1997; AAP, 2000; DHHS, 2000; NASPE, 2004). But although morethan three-fourths of the states and school districts responding to the SHPPSsurvey required that PE be taught, the nature and duration of the classesvaried widely in practice (Burgeson et al., 2001) and the percentages requir-
420

254 PREVENTING CHILDHOOD OBESITY
ing PE for all students were low. Only 8.0 percent of elementary schools,6.4 percent of middle/junior high schools and 5.8 percent of senior highschools provided daily PE3 for the entire school year for all of the studentsin each grade. Higher percentages of schools (though generally less thanone-third) provided PE three days a week or for part of the school year forall students (Burgeson et al., 2001), but for the grades after elementaryschool the percentages steadily decreased (Figure 7-1 and Figure 7-2).
There have also been concerns about the nature and duration of physi-cal activity levels during PE classes. The 2000 SHPPS survey found that ina typical PE class (lasting an average of 45 minutes), students at all levelsspent an average of 15.3 minutes participating in games, sports, or danceand 9.6 minutes doing skill drills (Burgeson et al., 2001). Of the 55.7percent of high school students who reported participating in PE class in the2003 YRBSS survey, 80.3 percent reported that they exercised or playedsports for more than 20 minutes in the average PE class (CDC, 2004b).Simons-Morton and colleagues (1993) found that in a typical 30-minuteelementary school PE class, the average child was vigorously active for onlytwo to three minutes (approximately 9 percent of the class time).
Traditionally PE teachers have been trained to conduct classes around
3Daily PE was defined as 150 minutes per week of PE class for elementary school studentsand 225 minutes for both middle/junior high and senior high school students (Burgeson et al.,2001).
FIGURE 7-1 Percentage of schools that require physical education, by grade.SHPPS 2000.SOURCE: Burgeson et al., 2001.
Per
cent
Grade Level
1 2 3 4 5 6 7 8 9 121110K
100
80
60
40
20
0
421

SCHOOLS 255
a motor skill instruction paradigm. There are opportunities for exploring avariety of teaching methods that both optimize physical activity and thatmake PE classes more fun. Including a range of physical activity interestsincluding dance and nontraditional activities such as Tai Chi and kickboxing is also important.
Recess is generally defined as unstructured time for physical activityduring the school day. The Centers for Disease Control and Prevention’s(CDC’s) Guidelines for School and Community Programs to Promote Life-long Physical Activity Among Young People recommend that schools pro-vide ample time for unstructured physical activity and that this time shouldcomplement, not substitute for, PE classes (CDC, 1997). Elementary schoolsdiffer greatly in their recess policies. While only a small minority of statesactually require elementary schools to provide students with regularly sched-uled recess, many more (22.4 percent) recommend this practice (Burgesonet al., 2001). Among elementary schools surveyed in the 2000 SHPPS, 71.4percent provided recess for all grades, and 96.9 percent offered regularlyscheduled recess during the school day for students in at least one grade.(Burgeson et al., 2001). Among these schools, students were scheduled tohave recess an average of 4.9 days per week for an average of 30.4 minutesper day.
Alternative approaches for incorporating physical activity into theschool day continue to be explored and include integrating brief episodes ofphysical activity into the classroom curriculum.
Male Students
Female Students
200 40 60 80 100
Grade 9
Grade 10
Grade 11
Grade 12
Percent
FIGURE 7-2 High school students not engaging in recommended amounts of phys-ical activity (neither moderate nor vigorous) by grade and sex, United States, 2001.SOURCE: CDC, 2003.
422

256 PREVENTING CHILDHOOD OBESITY
School-Based Interventions
There have been few studies examining the possible correlations be-tween PE enrollments and physical activity levels. Using the 1990 YRBSSdata, Pate and colleagues (1996) found that 59 percent of high-active stu-dents were enrolled in PE as compared to 29 percent of low-active students.As described below, several large-scale school-based intervention studieshave demonstrated increases in physical activity in PE classes, but only inisolated smaller scale studies have school interventions increased physicalfitness, reduced obesity, or increased physical activity outside of PE classes.
To date, interventions focused on elementary school children have beenthe most successful at increasing activity levels, with interventions such asGo For Health (Simons-Morton et al., 1997) and SPARK (Sallis et al.,1997) reporting significant increases in the amount of moderate to vigorousphysical activity performed during PE classes. In the SPARK intervention,students in the classes taught by physical education specialists spent moretime being physically active (40 minutes) than those in the teacher-ledclasses (33 minutes) or those in control classes (18 minutes) (Sallis et al.,1997).
The largest elementary-school-based intervention to date has beenCATCH, a multicenter trial (described above) that tested the effectivenessof a cardiovascular health promotion program in 96 elementary schools.Students in CATCH intervention schools participated in significantly moremoderate-to-vigorous physical activity during PE classes than did studentsin control schools, but significant improvements in physical fitness levels orbody weight were not observed (Luepker et al., 1996). An assessment ofCATCH 5 years later found that the proportion of PE time spent in moder-ate to vigorous physical activity had been maintained in interventionschools, but vigorous activity levels declined (McKenzie et al., 2003).School-based programs are less likely to increase physical activity outside ofPE classes, although students in the CATCH intervention schools did reportparticipating in more vigorous physical activity during out-of-school hours,an effect that a 3-year follow-up study noted was still being maintained(Nader et al., 1999).
Although some elementary-school-based interventions have shown in-creased physical activity in PE classes, few have shown significant effects onphysiological health risk variables such as body weight or composition.One notable exception was the South Australian Daily Physical ActivityProgram (Dwyer et al., 1983), which observed the effects of two interven-tions that markedly increased the exposure of elementary school children toPE. The first intervention emphasized participation in vigorous physicalactivity through endurance training for 75 minutes every day for 14 weeks,while the second maintained a traditional emphasis on motor-skill instruc-
423

SCHOOLS 257
tion but increased the duration and frequency to 75 minutes every day.Both of these interventions were compared to traditional PE classes for 30minutes three days per week. Only the intervention that emphasized vigor-ous physical activity produced a significant reduction in skinfold thicknessand an increase in objectively measured physical fitness, while traditionalPE, even at increased frequency and duration, did not. The findings of thisstudy suggest that physical education has the potential to improve bodycomposition in children, but only if activity is at high intensity, with in-creases in frequency and duration. Physical education classes of 75 or moreminutes are not feasible within most current school days; however, theimpact of this intervention on students’ BMI encourages the developmentof approaches for increasing physical activity that can realistically be imple-mented.
The other PE intervention that has demonstrated significant effects onbody weight was the Stanford Dance for Health intervention, which sub-stituted popular and aerobic dance classes (40 to 50 minutes, three timesper week, over 12 weeks) for the standard physical activity class (Flores,1995). In a randomized controlled trial among mostly low-incomeAfrican-American and Latino middle-school students, girls who were ran-domized to the dance intervention significantly improved their physicalfitness and reduced their BMI gain compared to girls in the standard class.There were no significant differences among boys. As in the South Austra-lian study, changes in fitness and body weight/fatness were seen when thecontent of PE was made more vigorous.
A small number of school-based studies have focused on increasingphysical activity in older students. The Lifestyle Education for ActivityProgram was a group randomized trial that examined the effects of a com-prehensive school-based intervention on high school girls’ physical activitylevels. Girls in the intervention schools were significantly more likely toparticipate in vigorous physical activity, both in PE classes and in othersettings, than girls in the control schools (Dishman et al., 2004). TheMiddle-School Physical Activity and Nutrition study tested the effects of anenvironmental and policy intervention on physical activity and fat intake in24 middle schools. Boys in the intervention schools participated in signifi-cantly more physical activity than boys in the control schools, both in andout of PE classes. The same across-the-board effect was not observed forgirls, although girls in the intervention schools did participate in morephysical activity during PE classes (Sallis et al., 2003). The study foundsignificant reductions in the BMIs of boys in the intervention schools ascompared to boys in the control schools, based on self-reports of height andweight; however, similar results were not seen for girls. Issues regardinggender differences had been considered (e.g., the outside-of-PE componentof the intervention was staffed primarily by female volunteers and the study
424

258 PREVENTING CHILDHOOD OBESITY
involved physical activities of interest to middle-school girls), but muchremains to be learned about how to design interventions that impact physi-cal activity levels in both boys and girls. A recent comprehensive review ofschool-based physical activity programs (Kahn et al., 2002) identified 12well-designed programs that met the CDC’s Guide to Community Preven-tive Services criteria (Dwyer et al., 1983; Simons-Morton et al., 1991;Hopper et al., 1992, 1996; Vandongen et al., 1995; Donnelly et al., 1996;Fardy et al., 1996; Luepker et al., 1996; McKenzie et al., 1996; Sallis et al.,1997; Ewart et al., 1998; Manios et al., 1999; Harrell et al., 1999). Thesestudies reported consistent increases in reported or observed time spent inphysical activity in school, primarily through increases in moderate to vig-orous physical activity in PE classes. Some of the studies also reportedincreases in energy expenditure and aerobic capacity. The effects on BMIand body fat, however, were minimal or inconsistent. Positive effects onphysical activity were observed in both elementary school and high schoolstudies, although the number of high school studies included in this reviewwas small.
Inexpensive ways to enhance school breaks and recess periods to in-crease opportunities for physical activity have also been examined, includ-ing providing game equipment such as balls and painting school play-ground areas with markings for games (Jago and Baranowski, 2004).
Extracurricular Programs to Increase Physical Activity
One initiative that has shown a positive effect on physical activity is theTitle IX legislation, which in recent decades increased the extent of inter-scholastic sports programs and participation, particularly for high schoolgirls (Lopiano, 2000). However, these programs tend to serve only youth atthe high school level, and only those who are attracted to competitivesports. The 2003 YRBSS nationwide survey found that 57.6 percent ofstudents (grades 9 to 12) played on one or more sports teams during theprevious year (CDC, 2004b). The 2000 SHPPS survey found that mostmiddle and high schools had interscholastic sports teams, while only 49percent offered intramural activities or PE clubs (Burgeson et al., 2001).
Research has shown that physical activity levels often decrease formiddle- and high school students, especially among girls (Sallis, 1993; Pateet al., 1994; Trost et al., 2002). In those grades, there are fewer options forstudents who are not advanced athletes to be involved in physical activity.To fill that void, intramural sports and other physical activity opportuni-ties—through clubs, programs, and lessons—can be tailored to meet theneeds and interests of all students, with a wide range of abilities, who maylack the time, skills, or confidence to play interscholastic sports. Encourag-
425

SCHOOLS 259
ing such a range of physical activity options in local schools and communi-ties, through the development of programs and provision of support, mayinvolve not only schools, but also the private sector and nonprofit founda-tions and organizations. It is critically important that a focused effort bemade to enhance funding and opportunities so that intramural sports teams,as well as nonteam sports and activities, become staples of school and after-school programs.
Next Steps
There are opportunities for schools to improve the extent and nature ofthe physical activity opportunities that are offered so that students canattain at least 50 percent of their daily recommended physical activity (orapproximately 30 minutes) while in school. Few studies of physical activityduring school have examined weight status or body composition measures;most studies have focused on changes in the intensity or duration of physi-cal activity during PE classes. School-based interventions that have involvedteacher training, PE curriculum changes, increases in duration or intensityof physical activity, and other changes have resulted in increased levels ofactivity and in some cases reported increases in energy expenditure andaerobic capacity. An expansion of physical activity opportunities availablethrough the school may result in benefits not only for students’ health andwell-being but also may potentially foster the formation of a lifelong prac-tice of daily physical activity.
Schools should ensure that all children and youth participate in a mini-mum of 30 minutes of moderate to vigorous physical activity during theschool day. This includes time spent being active during PE classes. Thisobjective is equally important for young children in child developmentcenters and other preschool and child-care settings, including Head Startprograms—the benefits to young children include the nurturing and refine-ment of their gross motor development skills.
Furthermore, schools should expand the physical activity opportunitiesavailable through the school, including intramural and interscholastic sportsprograms, and other physical activity clubs, programs, and lessons thatmeet the needs and interests of all students. This includes physical activityprograms both during the school day and after school.
Additionally, schools should promote walking and bicycling to school.As more thoroughly discussed in Chapter 6, schools should develop policiesand promote programs that encourage these active ways of getting betweenschool and home. Changes that are needed may include more support forcrossing guards, bike racks, and education on pedestrian and biking safety.
Strategies and recommendations to achieve these goals include:
426

260 PREVENTING CHILDHOOD OBESITY
• Schools should provide PE classes of 30 to 60 minutes’ duration ona daily basis. While attending these classes, children and youth should beengaged in moderate to vigorous physical activity for at least 50 percent ofclass time. Schools should examine innovative approaches that include anarray of diverse and fun activities to appeal to the broad range of studentinterests.
• Child development centers, elementary schools, and middle schoolsshould provide recess that includes a total of at least 30 to 60 minutes dailyof physical activity.
• Schools should offer a broad array of after-school programs, suchas interscholastic sports, intramural sports, clubs, and lessons, that togethermeet the physical activity needs and interests of all students.
• Schools and child development centers should support and encour-age physical activity opportunities for teachers and staff for their own well-being and because they are important role models for their students.
• Schools should be encouraged to extend the school day as a meansof providing expanded instructional and extracurricular physical activityprograms.
• Regulations for managing Head Start and other publicly funded orlicensed early-childhood-education programs should ensure that childrenengage in appropriate physical activity as part of the programs.
• Congress, state legislatures, state education agencies, local govern-ments, school boards, and parents should hold schools and child develop-ment centers responsible for providing students with recommended amountsof physical activity. Concurrently, these authorities should ensure thatschools and child development centers have the resources needed to meetthe applicable standards.
• Schools should regularly evaluate the quantity and quality of theirphysical activity programs, and the results of these evaluations should bereported to the public.
The committee acknowledges the constraints and pressures on schoolboards and administrators, particularly limited resources and the focus onacademic programs and homework to improve standardized test scores.Nevertheless, it urges schools and child-development centers to increaseopportunities for students to participate in physical activity and to imple-ment evidence-based programs. These institutions will need the help offederal, state, and local authorities, who should initiate and implement thenecessary regulatory and curriculum changes. Such actions could well haveinfluence beyond their nominal purposes. Programmatic requirements im-posed by the state or district—which likely will be evaluated systematically,with results reported to the public—could provide the impetus for signifi-cant changes and innovative programs.
427
SCHOOLS 261
Much research is needed to identify effective school-based interven-tions for promoting and providing physical activity to children and youth.Specifically, large-scale studies are needed to identify ways in which modi-fications of physical education, school sports, intramural programs, andrecess—singly and in combination—contribute to physical activity goals. Itis important, moreover, to learn the effects of such interventions not onlyon physical activity during the school day, but also after school. Studiesshould also determine the influence of district or school-level policies onschool practices and student physical activity. Furthermore, research isneeded to determine the effects of school-based physical activity interven-tions on student academic performance, dietary and nutritional outcomes,classroom behavior, and social outcomes.
Research specific to preschool and child-care settings should emphasizefeasible and generalizable interventions designed to increase physical activ-ity (e.g., manipulations of outdoor play time), decrease sedentary behaviors(e.g., parenting skills interventions to reduce children’s screen time), andimprove dietary behaviors (e.g., systematic exposure to fruits and veg-etables in a positive context to enhance taste preferences).
CLASSROOM CURRICULA
Health Education Requirements and Practices
National education and health organizations recognize the importantrole that schools can play in fostering healthful behaviors among childrenand youth (Kann et al., 2001). Priorities for health education include be-havioral skills development, a set amount of time devoted to energy balancein the classroom curricula, adequately trained teachers, and periodic cur-riculum evaluation (NASBE, 1990; Kann et al., 2001). A comprehensive setof guidelines and recommendations for school health programs has beendeveloped by CDC (1997). In practice, health education standards of theJoint Committee on National Health Education Standards (1995), whichare followed by most states and school districts, also emphasize the impor-tance of teaching students behavioral skills—such as effective decision-making and goal-setting—thereby making healthful behaviors more likely.
National data show that 69 percent of states require health educationcurricula to include instruction on nutrition and dietary behaviors, and 62percent require the inclusion of physical activity and fitness (Kann et al.,2001). In 69 percent of districts, schools are required to follow national,state, or district-level standards or guidelines; 77.8 percent of the schoolsuse the National Health Education Standards (Joint Committee on Na-tional Health Education Standards, 1995; Kann et al., 2001). Assessment of
428

262 PREVENTING CHILDHOOD OBESITY
students’ acquired skills is weak, however; only 16 percent of states requirethat they be tested on health education topics (Kann et al., 2001).
Numerous topics—including safety, first aid, alcohol and tobacco useprevention, growth and development, and personal hygiene—need to becovered in health education classes varying by the ages of the students. Inthe 2000 survey, 75 percent of health courses and 51 percent of othercourses included content on nutritional and dietary behavior, and 69 per-cent and 29 percent, respectively, addressed physical activity and fitness(Kann et al., 2001). An average total of about five hours per year is spent ontopics related to nutritional and dietary behavior, and about four hours peryear on physical activity and fitness (Kann et al., 2001).
Behavioral Nutrition and Physical Activity Curricula
As described below, research findings support the effectiveness of be-havior-oriented curricula—based on self-monitoring, goal-setting, feedbackabout behavior change efforts, incentives, and reinforcement methods—inpromoting healthful food choices and physical activity. Skill-building ac-tivities, in which students engage in the desired behaviors and have a chanceto practice new behaviors and receive feedback, are effective learning strat-egies.
However, there is still much to learn about the elements of nutritionand physical activity education programs that are key to changing behav-iors and, subsequently, body weight. The most commonly used theoreticalframework for developing behavior-based school interventions is socialcognitive theory (SCT) (Bandura, 1986). “Self-efficacy,” in particular, orthe confidence in one’s ability to perform a specific behavior, is a centralconcept in SCT. Self-efficacy is enhanced through skills building, practicingand mastering the behavior with feedback and reinforcement, and observ-ing modeled behavior.
A recent review of 16 school-based cardiovascular risk factor preven-tion intervention studies found that interventions were most effective inchanging cognitive variables, such as self-efficacy and outcome expecta-tions, and were least effective in changing physiological variables such asbody fatness (Resnicow and Robinson, 1997). However, these studies aredifficult to compare because of the diversity of their intervention compo-nents and the primary outcomes targeted. Some interventions were onlybased on classroom curricula, while others include changes in the schoolfood environment or PE classes.
Two of the most ambitious health behavior change interventions havebeen CATCH and Pathways, described above (Box 7-2). But despite tre-mendous commitments of resources and expertise, intervention effects weresignificant for some of the reported behavioral changes but not for the
429

SCHOOLS 263
objectively measured physiological changes, including BMI or body fatness(Luepker et al., 1996; Caballero et al., 1998; Davis et al., 1999). Thespecific effects of the classroom curricula could not be evaluated becausethe studies were implemented as multicomponent interventions, includingindividual-level intervention targets (e.g., student knowledge and behavior)and environmental intervention targets (e.g., school meals, PE classes).
An interesting contrast is provided by the results of the Planet Healthintervention (Gortmaker et al., 1999), which aimed to reduce the preva-lence of obesity among students in grades six through eight. Ten schoolswere randomized to intervention or control for a 2-year period, and theinterventions were classroom-based only; they did not include school foodservice, physical activity, or other environmental-change components. Class-room intervention sessions, which featured behavioral skills developmentand strategies (e.g., self-assessment and goal-setting) were incorporatedinto different curriculum content areas; behaviors targeted for change in-cluded increases in fruit and vegetable intake, increases in physical activity,and decreases in television viewing time. At the end of the study, obesityprevalence among girls in the five intervention schools was significantlylower than among girls in the five control schools. Differences in obesityprevalence were not significant among boys. Analysis of changes in behav-ioral variables showed that decreases in television viewing were signifi-cantly associated with decreases in obesity prevalence among the girls. Thereason for the lack of an intervention effect in boys is not clear. There arefew controlled studies in this area and further research is needed.
Curriculum-only interventions have also resulted in significant reduc-tions in BMI or skinfolds among both boys and girls. The Stanford Adoles-cent Heart Health Program targeted tenth-graders in a four-school random-ized controlled trial (Killen et al., 1988). In addition to changes in bodycomposition, the 20-session classroom curriculum also produced signifi-cant improvements in fitness.
Reducing Sedentary Behaviors
Television viewing time reduction has been examined in several school-based studies as a strategy for preventing obesity (Gortmaker et al., 1999;Robinson, 1999). In contrast to most other curriculum efforts, these inter-vention studies have shown positive effects on reducing the prevalence ofobesity or weight gain. For example, Robinson (1999) examined the effectsof the Stanford SMART (Student Media Awareness to Reduce Television)curriculum on changes in BMI among third- and fourth-grade children intwo public elementary schools. Students in the intervention school receivedan 18-lesson, six-month curriculum designed solely to help children andfamilies reduce television viewing time and videotape and video game use.
430

264 PREVENTING CHILDHOOD OBESITY
No other behaviors were targeted in the study in order to “isolate” thespecific effects of reduced television viewing on changes in BMI. In additionto the classroom curriculum, parents also received newsletters and a televi-sion time-management monitor that allowed them to set time limits on thehome television; 42 percent of parents reported that they actually installedthe device. Results revealed significant reductions in BMI, triceps skinfoldthickness, waist circumference, and waist-to-hip ratios among children inthe intervention school compared with children in the control school, overa single school year.
The Planet Health intervention—a curriculum-based intervention forsixth- and seventh-grade students using behavioral choice and social cogni-tive approaches (discussed earlier)—also focused on reducing televisionviewing (Gortmaker et al., 1999). Other lessons included an emphasis ondietary and physical activity change. Teacher training sessions were heldprior to implementation. Obesity prevalence decreased in girls in the inter-vention schools (from 23.6 percent to 20.3 percent) and increased in girls inthe control schools (from 21.5 percent to 23.7 percent). For boys, obesityprevalence decreased in both groups, with no significant differences be-tween groups. Number of television hours declined for both genders in theintervention schools as compared with controls and for girls in the interven-tion schools there was an increase in fruit and vegetable consumption.
The positive results of Stanford SMART and Planet Health suggest thatobesity prevention efforts should involve reductions in sedentary televisionviewing time (see Chapter 8) and that school curricula should include tele-vision viewing reduction components.
Next Steps
Evidence from school intervention studies demonstrates some effective-ness of behavior-based nutrition and physical activity curricula. Evidence ismost compelling from curricula for reducing television viewing, from vigor-ous PE interventions, and from large-scale, multicomponent interventionstudies.
The extent to which schools are currently implementing such curricula,however, is unclear. Constraints include the limited availability of healtheducators who are trained in behavior-change methods, and the lack ofsufficient time in the school day for specifically focusing on eating andphysical activity behaviors. More staff training and the allocation of moretime are two priorities. The impact of health education material can also beexpanded by incorporating nutrition and physical activity information intoscience, math, history, social studies, and other courses.
Schools should ensure that nutrition, physical activity, and wellnessconcepts are taught throughout the curriculum from kindergarten through
431

SCHOOLS 265
high school. Schools should implement as part of the health curriculum anevidence-based program that includes a behavioral skills focus on promot-ing physical activity, healthful food choices, and energy balance and de-creasing sedentary behaviors.
Given the limited resources in many schools and their varied prioritiesregarding the nature and duration of nutrition, health, and physical educa-tion classes and curricula, it is critically important for innovative approachesto be developed and evaluated to address obesity prevention in the schools.These approaches should involve evidence-based curricula that teach effec-tive decision-making skills in the areas of diet and physical activity. Teachertraining in health education and behavioral-change teaching methods isneeded. The departments of education and health at the state and federallevels, with input from relevant professional organizations, should developand evaluate pilot programs to explore innovative approaches to both staff-ing and teaching about wellness, healthful choices, nutrition, physical activ-ity, and sedentary behaviors. Furthermore, it is hoped that health educa-tors, school psychologists, and professional organizations (e.g., AmericanFederation of School Teachers, American Psychological Association) willbe brought into the discussions on how best to develop innovative curriculain this area.
ADVERTISING IN SCHOOLS
There have been growing concerns in recent years about the extent ofcommercial advertising in public schools and the influence that it may haveon children’s decision-making both for foods and other goods (ConsumersUnion, 1990, 1995; Greenberg and Brand, 1993; Bachen, 1998; Levine,1999). Branded products are often advertised to students in a variety ofschool venues. Examples of these venues include required in-school televi-sion viewing such as Channel One, school textbooks, corporate-sponsoredclassroom materials, sports equipment, school cafeteria foods, signage andequipment (refrigerated display cases), vending machine signage, uniformlogos, advertising on school buses, product giveaways, coupons, incentivecontests, book covers, mouse pads, and book clubs.
Commercial activities involving schools have been categorized as fol-lows (GAO, 2000; Wechsler et al., 2001):
• Product sales: short-term fundraising activities benefiting a specificstudent activity; cash or credit rebate programs; and commerce in productsthat benefit a district, school, or student activity (e.g., vending machinecontracts; class ring contracts)
• Direct advertising on school property: billboards, signs, and prod-uct displays; signs on school buses; corporate logos or brand names on
432

266 PREVENTING CHILDHOOD OBESITY
school supplies or equipment; ads in school publications; media-based ad-vertising (e.g., Channel One News); and free samples and coupons
• Indirect advertising: corporate-sponsored educational materials;teacher training; contests; incentive programs; and, in a small percentage ofschools (<2 percent), lesson plans or curricula sponsored by companies(Wechsler et al., 2001)
• Market research conducted through or at schools: questionnaires,taste tests, and Internet surveys.
Only limited data are available on the extent of advertising in schools.The 2000 SHPPS nationwide survey found that the majority of high schools(71.9 percent) have contracts with one or more companies to sell softdrinks at the school (Wechsler et al., 2001). The percentages at middleschools (50.4 percent) and elementary schools (38.2 percent) are lower butstill significant (Wechsler et al., 2001). Of those schools with soft drinkcontracts, most (91.7 percent) receive a proportion of the sales; some of thecontracts include incentives for increased sales such as equipment, supplies,or cash awards. Advertising by soft drink companies is allowed in theschool building at 37.6 percent of the schools with contracts; advertising isallowed on school grounds at 27.7 percent; and advertising on school busesis allowed by only 2.2 percent (Wechsler et al., 2001).
Data from the SHPPS survey (Table 7-1) give an overview of some ofthe commercial involvement of schools. In the 19 schools visited for theGAO report, most of the advertising was seen in high schools; examplesincluded advertising on scoreboards, vending machines, posters, and onpromotional materials such as free book covers and product samples (GAO,2000). In many schools television programming is provided through Chan-nel One News4 —10 minutes of news, music, contests, and public serviceannouncements interspersed with 2 minutes of commercials, including ad-vertisements for candy, food, and beverages.
Although there is little published research on school commercialism,there are some indications of increases in the extent of commercialism inschools. In a survey of high school principals in North Carolina, 51.1percent of the 174 respondents believed that corporate involvement in theirschool had increased over the past 5 years (Di Bona et al., 2003), the largestinvolvement being in the form of incentive programs (41.4 percent). Suchchanges have been noted by the press. An analysis of media references toschool commercialism has found significant increases over the past 6 years(Molnar, 2003).
4Launched in 1990, Channel One News is viewed in approximately 12,000 U.S. schoolsrepresenting an audience of 8 million teenagers (Di Bona et al., 2003).
433

SCHOOLS 267
TABLE 7-1 Schools That Allow Food Promotion or Advertising
Total Schools (%)
Soft drink contracts:Have contract with company to sell soft drinks Elementary schools: 38.2
Middle/junior highschools: 50.4
Senior high schools: 71.9
Of schools with soft drink contracts:Receive a specific percentage of soft drink sale
receipts 91.7Receive sales incentives from companya Elementary schools: 24.0
Middle/junior highschools: 40.9
Senior high schools: 56.7
Allow advertising by the company in the schoolbuilding 37.6
Allow advertising by the company on school grounds 27.7Allow advertising by the company on school buses 2.2
Promotion of candy, meals from fast food restaurants, and soft drinks:Allow promotion of these products through coupons 23.3Allow promotion of these products through sponsorship of school events 14.3Allow promotion of these products through school publications 7.7Prohibit or discourage faculty and staff from using these items as rewards 24.8
aSchools receive incentives such as cash awards or donations of equipment or suppliesonce receipts reach specified amounts.SOURCE: Wechsler et al., 2001.
As discussed in Chapter 5, a number of studies have shown that adver-tising influences children’s food and beverage choices. An extensive litera-ture review by Hastings and colleagues (2003) concluded that food adver-tisements trigger food purchase requests by children to parents; have effectson children’s product and brand preferences; and have an effect on con-sumption behavior. Furthermore, a recent analysis of the cognitive develop-mental literature (Wilcox et al., 2004) found that young children (generallyunder the age of 7 to 8 years) do not generally understand that differencebetween information and advertising.
Because public schools are institutions supported by taxpayer dollars,there are issues regarding whether it is appropriate for public schools to bea site for corporate or commercial advertising and marketing of products tochildren. Further, schools act in place of parents and advertising in schoolcan be viewed as circumventing parental control over the types of advertis-
434

268 PREVENTING CHILDHOOD OBESITY
ing to which children are exposed. Additionally, children may interpretschool-based advertising to mean that teachers or other adults at schoolendorse the use of the advertised product.
The problem of in-school advertising is complex and warrants a thor-ough and complete separate examination. Part of the difficulty in address-ing issues regarding food and beverage advertising in schools is the issue ofdistinguishing advertising and promotion of healthful foods and beveragesthemselves from the companies or brands that may be associated withseveral different food or beverage products, some of which may be health-ful and some less so. In addition, many foods and beverages currently soldin schools are packaged with branded corporate logos and labels. Theextent to which such packaging is considered to be advertising is unclear.
The committee acknowledges that there are significant barriers to re-moving advertising completely from the school environment. Foremost isthe anticipated loss of funding from corporate sponsors and what is per-ceived to be substantial revenue from the sale of soft drinks and otherbranded items (although this revenue often comes primarily from studentsand their families). Additionally, there is the potential for loss of free cur-riculum materials, incentives, sports equipment, food-service equipment,computers, televisions, and other items. However, as discussed earlier in thechapter, options need to be explored so that schools can provide the healthi-est possible environment for children. It is important to note that somecorporations donate goods, services, or money to schools without seekingadvertising or marketing rights in return.
Nineteen states have state laws or regulations that are relevant to thisissue, but in most cases they are not comprehensive (GAO, 2000). Through-out most of the United States, the local school districts make the decisionsregarding school commercialism and advertising, and some schools andschool districts appear to be more ready than others to eliminate suchadvertising. This presents an important opportunity to systematically studythe potential benefits of different policies on obesity and other health andpsychological parameters.
Research is needed to examine the impact of such advertising on youthdietary, physical activity, and sedentary behaviors within the school. As afirst step, the Department of Education and USDA should fund quasi-experimental research comparing schools that introduce and/or eliminatesuch advertising, with respect to food and physical activity choices andbehaviors at school and outside of school.
To date, the evidence on the impact of advertising in general, particu-larly on young children, favors removal of advertising and marketing fromschools. Furthermore, the school environment needs to reinforce nutritionand physical activity messages taught in the classroom, and advertising maypresent conflicting messages. Schools and school districts are urged to de-
435

SCHOOLS 269
velop, implement, and enforce school policies to create schools that areadvertising-free to the greatest possible extent.
SCHOOL HEALTH SERVICES
School health services should play a prominent role in addressing obe-sity-related issues among students and throughout the school environment.School health clinics and other school-based health services offer an oftenuntapped resource because they have the opportunity to reach large num-bers of students and the expertise to provide nutrition and health informa-tion as well as referrals to counseling and other health services. However,an emphasis on dietary behaviors and physical activity is not meant to becompetitive with the other vital issues that school health services and healtheducation curricula address, including prevention of tobacco and alcoholuse and sexual education.
Although the 2000 SHPPS survey found that more than 75 percent ofschools had at least a part-time school nurse, the extent and nature ofhealth services at schools vary widely (Brener et al., 2001). Nearly allschools have provisions for administrating medications and first aid, butmany lack the resources to deliver prevention services. The 2000 SHPPSsurvey found that 55.3 percent of schools reported offering nutrition anddietary behavior counseling and 37.2 percent offered physical activity andfitness counseling (Brener et al., 2001). Twenty-six percent of states re-quired height and weight to be measured, or BMI to be assessed, in schools;of those, about 61.5 percent required parent notification (Table 7-2). Simi-larly, the survey found that physical fitness tests were required by approxi-mately 20 percent of states or school districts.5 Some states have developedtheir own fitness test, while others use the President’s Challenge or theFitnessgram (Burgeson et al., 2001). In most schools (91.1 percent) teachersprovided students with explanations of what their fitness scores meant; in59.8 percent of the schools, teachers informed the students’ parents as well.
In Chapter 8, the committee recommends that parents make their child’sweight status a priority for discussion with their medical-care provider, andin Chapter 6 the committee offers recommendations on the high prioritythat this issue should be given by health-care professionals themselves.However, there are an estimated 9.2 million children and youth6 in the
5Physical fitness tests are required in elementary schools by 13.7 percent of states and 18.3percent of districts, in middle or junior high schools by 15.7 percent of states and 21.3percent of districts, and in senior high schools by 18 percent of states and 20.4 percent ofdistricts (Burgeson et al., 2001).
6In 2001, 12.1 percent of Americans aged 19 years or younger—9.2 million children andyouth—were without health insurance all year (Bhandari and Gifford, 2003).
436

270 PREVENTING CHILDHOOD OBESITY
TABLE 7-2 States and Districts Requiring Student Screening andFollow-Up
States Districts
% Requiring % Requiring% Requiring Parental % Requiring ParentalScreening Notification Screening Notification
Height and weight 26.0 61.5 38.4 81.1or BMI
Hearing 70.6 91.4 88.4 98.5
Vision 70.6 91.4 90.4 98.5
Oral health 17.6 87.5 31.1 98.3
Scoliosis 45.1 100.0 68.8 98.6
Tuberculosis 20.0 80.0 17.1 93.7
SOURCE: Brener et al., 2001.
United States whose families do not have health insurance (Bhandari andGifford, 2003) and who may not be seen on a regular basis by a medicalpractitioner. Additionally, many children, particularly in their mid-child-hood and teen years, do not have annual health-care visits. Parents often donot recognize that their child is overweight or obese, or they may believethat the child will outgrow his or her excess weight (Etelson et al., 2003;Maynard et al., 2003). If children were weighed and measured annually,the history of a particular child could be tracked and any increase in his orher gender- and age-specific BMI percentile would be detected, allowing foractions designed to prevent further increases and perhaps even lower theBMI.
Some states and school systems have begun providing an individualizedhealth “report card” focused on conveying weight-status information toparents (Box 7-4) (Chomitz et al., 2003; Scheier, 2004). Concerns havebeen raised about unintended consequences of this approach, includingpotential stigmatization of children, misinterpretation of BMIs, and place-ment of children on harmful diets (Scheier, 2004). However, such measuresare routinely collected at many schools (Table 7-2) and in health-care pro-viders’ clinics. Furthermore, many intervention studies have obtained weightand height measurements on large numbers of students. For example,CATCH collected weight, height, blood pressure, skinfold thickness, aero-bic fitness, dietary intake, and physical activity data on 4,019 students in 96schools in third grade and again in fifth grade (Luepker et al., 1996).
437

SCHOOLS 271
Participant safety was continuously monitored by an independent data andsafety monitoring board. A study of elementary school students and theirparents in Cambridge, Massachusetts, found that, among parents of over-weight children, those who received the health report card interventionwere more likely to begin or consider looking into clinical services, dieting,or physical activity than those parents who received general information orno information (Chomitz et al., 2003). Evaluation of the report card ap-proach is ongoing, but further research is needed on alternate methods forconducting weight-status assessments and conveying the information thusobtained to parents and to the students themselves (as age appropriate).
Schools should measure yearly each student’s weight, height, and gen-der- and age-specific BMI percentile and make this information available toparents and to the student (when age appropriate). Implementation of yearlymeasures may be resource-intensive for schools that are currently conduct-ing such measures. However, it is important for parents to have informa-tion about their child’s BMI and other weight-status and physical fitnessmeasures, just as they need information about other health or academicmatters.
The committee recognizes that providing follow-up health-care servicesfor children identified as being obese or at high risk for obesity will present
BOX 7-4Arkansas BMI Initiative
Arkansas Act 1220, approved by the Arkansas General Assembly and Gover-nor in 2003, established a multipronged state initiative to improve the health ofArkansas children (ACHI, 2004). The act mandated that parents be provided withtheir child’s annual BMI, as well as an explanation of the BMI measure and infor-mation on health effects associated with obesity.
This mandate is being implemented in three phases using a confidential healthreport. Eleven schools participated in Phase I in which measurement methodolo-gies, equipment, and reporting forms were developed and tested for validity andaccuracy. Phase II consisted of field testing in a second round of schools. The finalphase involves the statewide rollout of the program which began in Spring 2004(ACHI, 2004). Community health nurses are an important part of this effort, be-cause they are first certified in height and weight research measurements at Ar-kansas Children’s Hospital and subsequently train school nurses and other schoolpersonnel (ACHI, 2004). Training of health-care professionals involved in pediatricand adolescent development is also a part of this initiative.
The reports being sent to parents include the child’s BMI as well as informationto assist them in contacting local resources for additional information. Data alsowill be aggregated at the school, district, and state levels. Evaluation of the pro-gram is ongoing and will include focus groups with parents.
438

272 PREVENTING CHILDHOOD OBESITY
a number of challenges including the lack of a standardized referral system;pediatricians’ general lack of training in how to counsel parents and chil-dren on nutrition, physical activity, or weight management (Chapter 6);and the limited availability of nutrition education and physical activityprograms to absorb the potential demand. Therefore, efforts on this issuewill require working with health-care providers and others to provide theappropriate follow-up information and services.
There are sensitivities and concerns that surround this issue, and it isimportant that the data on each student are collected and reported validlyand appropriately, with the utmost attention to privacy concerns, and withinformation on referrals available if further evaluation is needed. The com-mittee urges CDC and other relevant federal, state, and local agencies todevelop guidelines that assist schools in developing protocols that are notonly reliable and useful, but that sensitively collect and communicate thisinformation.
AFTER-SCHOOL PROGRAMS ANDSCHOOLS AS COMMUNITY CENTERS
Organized after-school programs, both public and private, are dailyopportunities for engaging many children and youth in physical activityand promoting healthy food choices. In addition to serving students shortlyafter the school day is over, school facilities can also offer similar servicesduring other nonschool hours to the wider community.
An estimated 19 percent of 5- to 14-year-old children—some sevenmillion—care for themselves on a regular basis after school without adultsupervision (Smith, 2002). Approximately 14 percent of children ages 5 to12 with employed mothers attend after-school center programs, and an-other 15 percent are involved in lessons and other enrichment activities(Vandell and Shumow, 1999). These programs may be school- or commu-nity-based and can vary widely in their content, opportunities for physicalactivity, nature and focus, class size, staff education, and child-staff ratios(Vandell and Shumow, 1999; NRC, 2003).
Some after-school programs concentrate on homework help and tutor-ing; others emphasize enrichment opportunities (e.g., computer skills, art,and music programs); and some, focused on providing safe havens to chil-dren during after-school hours, offer a spectrum of options (NRC, 2000).Given the varied nature of these programs and the range of school orcommunity groups that are responsible, a broad-reaching infrastructuredoes not exist for disseminating new initiatives in general. However, theseprograms are often readily amenable to implementing or expanding nutri-tional and physical activity information and to providing venues for engag-ing in physical activity as well (Ross et al., 1985).
439

SCHOOLS 273
In that spirit, discussions are ongoing about how best to organize andstructure after-school programs, particularly regarding the balance betweenacademic and other pursuits (NRC, 2003). The 21st Century CommunityLearning Centers program is an example of successfully involving schoolsand communities in working together to address after-school needs. Fundedby the U.S. Department of Education, the program’s centers now serve 1.2million children and 400,000 adults in 6,800 schools (in all 50 states and inmore than 1,400 communities) (U.S. Department of Education, 2004).These centers focus on academic improvement but also involve programs inmusic and other arts and use of computers. Incorporating physical activityprograms and an emphasis on good nutrition into the 21st Century Com-munity Learning Centers program and other similar efforts is recommended.
As discussed in Chapter 6, research has shown that access to opportu-nities for physical activity is associated with increased physical activity. Inrecognition of the positive effects of family activities and parental modelingof healthful behaviors, schools with physical activity facilities that currentlygo unused during nonschool hours should explore ways of making themavailable for community use. Expanding the use of school facilities duringafternoons, evenings, weekends, and vacation periods is particularly impor-tant in communities that do not have publicly supported community recre-ation centers. For public schools, this objective would also expand the useof public funding.
It is important to take advantage of opportunities for improving nutri-tion and increasing physical activity for the large number of children whoattend after-school programs. Furthermore, communities with limited rec-reational facilities would benefit from access to school facilities during non-school hours. After-school programs should encourage and enable dailyphysical activity, provide healthful nutritional choices, and provide stu-dents with the information to foster a better understanding of energy bal-ance. Schools and communities should use school facilities as communitycenters that provide opportunities for physical activity and for programsthat promote energy balance. Such programs are particularly important forchildren in areas where neighborhood safety concerns may present a barrierto outside physical activity.
The committee acknowledges that there are hurdles to overcome inimplementing these recommendations, particularly in obtaining the fundingfor their increased staffing and maintenance implications. Coordinating thelogistics of the use of equipment and facilities could also be a challenge(Dryfoos, 1999). However, there are numerous benefits of expanding theuse of school facilities and offering programs for youth and families—including improved social skills, a heightened sense of community, andreduction in youth crime. Given that a large number of schools in theUnited States are now being built or refurbished, communities have an
440

274 PREVENTING CHILDHOOD OBESITY
opportunity to design these schools with facilities that can best accommo-date after-school or community center programs.
As these programs are pursued, it is critical that the effects of changesin after-school programs and other after-school uses of school facilities(e.g., in the form of community centers) be evaluated. Innovations to en-courage children and youth to participate in physical activities and learnabout nutrition are particularly encouraged, because they have the poten-tial to help prevent childhood overweight and obesity. Pilot results forafter-school obesity prevention programs in low-income African-Americancommunities are already showing promise in this regard (Beech et al., 2003;Robinson et al., 2003), though further research and evaluation is needed.
EVALUATION OF SCHOOL PROGRAMS AND POLICIES
In most if not all states, schools are mandated to perform periodicacademic testing to compare student performance against established stan-dards. The committee recommends extending these assessments to includeparameters related to healthful eating, physical activity, and other factorsrelated to the risk for obesity.
Recognizing that the school environment is one of the many influenceson a child’s dietary intake or energy expenditure, it is important to developeffective school-based programs. Thus, schools, school districts, state boardsof education, and regional and national institutions have already begun topromote and implement innovative approaches for addressing the risingrates of obesity in children and youth and for promoting their health andfitness. Although these programs can be costly in terms of finances, person-nel, and other resources, they have the potential to enhance the educationalprocess.
Without systematic and widespread assessments of obesity-related be-haviors and physical activity measures, however, there will be no way toidentify which of the many possible strategies are potentially effective,much less the most cost-effective. Specific cause-and-effect inferences willnot always be possible, but the availability of pertinent local data willenable schools, parents, school districts, states, policy makers, and research-ers to identify some of the more promising approaches for further testingand development.
Many schools now use the School Health Index developed by CDC asa school self-assessment tool (CDC, 2004a). This measure incorporatesphysical and nutritional education components into evaluations as well asassesses other areas, particularly school health, counseling, health policies,health promotion, and family and community involvement. The committeeencourages schools to use the School Health Index or similar school-specific
441

SCHOOLS 275
assessments to identify areas to improve the school’s health and safetypromotion policies and practices.
In addition, some schools may want to assess more direct measures(such as students’ gender- and age-specific BMI percentile, physical fitness,and dietary intake) to help determine whether or not the school’s policy andprogramming changes are reducing the levels of overweight and obesity.Commitment to performing these evaluations will require legislators andother policy makers to allocate sufficient funding, employ professional staff-ing, and develop statewide mechanisms for reporting these assessments’results to the public.
State and local education authorities should perform periodic assess-ments of each school’s policies and practices related to nutrition and physi-cal activity. These assessments should address curriculum, instructionalmethods, school environment, extracurricular programming, and relation-ships with the community. Other components that could be consideredbased on the needs of the schools are assessments of physical activity,physical fitness, dietary intake, and BMI percentile distribution of a repre-sentative sample of students. Results of school evaluations should be re-ported periodically to the public. If data are collected on a representativesample of students, the results should be publicly reported only in theaggregate.
Research is needed to determine optimum ways to assess the impacts ofschool programs, policies, and environments on obesity prevention. Re-search is also needed to explore program adaptations that may be needed toaccommodate schools with high levels of cultural diversity.
Potential hurdles in implementing these actions will need to be ad-dressed. In particular, if schools and school districts are to develop validand easy-to-use assessment measures and protocols, provide sufficient stafftraining to ensure reliable data collection, and then implement and reportthe results of these assessments, they will need sufficient funding. If schoolswere to meet the School Health Index standards under current economicconditions, there would likely be increased financial burden on most schoolsystems.
The committee acknowledges that there is limited published informa-tion on schools that have implemented this type of schoolwide evaluation.However, based on the public attention paid to standardized academictesting by parents, teachers, administrators, and policy makers, it is thebelief of the committee that assessment and public reporting of health-related outcomes will prove to be an incentive for schools to innovate andadopt more effective health promotion curricula, improved food-serviceoptions, and other health and fitness programming (e.g., after-school activi-ties, family-oriented physical activities).
442

276 PREVENTING CHILDHOOD OBESITY
RECOMMENDATION
Schools offer the opportunity for reaching large numbers of youngpeople, during a significant part of their day, and throughout much of theyear. Furthermore, schools present opportunities, both in and out of theclassroom, for the concepts of energy balance to be taught and put intopractice. As discussed throughout the chapter, several large-scale, well-designed school-based intervention studies have shown that multicompo-nent changes in the school environment can improve the food and beverageselections by students, the nutritional quality of foods offered, and theduration and extent of students’ physical activity while at school.
Schools should not only provide educational messages about nutrition,physical activity, and reducing sedentary behaviors, but should reinforceand support these concepts throughout the school environment. Changesthat can make the school environment more supportive of healthful eatingand physical activity behaviors begin with the development of nutritionalstandards for all food and beverage items sold in the schools and improve-ments in the federal school meal programs. Furthermore, opportunities forphysical activity need to be expanded through ensuring daily PE, as well asincreasing the options for both competitive and noncompetitive sports andactivities, enhancement of after-school programs, and the opening of schoolfacilities for use during other nonschool hours. It is also important todevelop and implement curricula that will encourage students to movebeyond an awareness of energy balance to the routine incorporation ofgood nutrition and physical activity into their daily lives.
There are numerous innovative programs and changes relevant to obe-sity prevention that are being implemented in schools throughout the coun-try, and it is important to adequately evaluate these efforts to determinewhether they should be continued, expanded, or refined. Furthermore, pre-schools and child-care centers should be included in these efforts.
The goal is for schools to implement evidence-based programs andapproaches that promote healthful physical activity and nutrition behaviorsfor all components of school interventions, including health education,physical education, after-school programs, and walk-/bike-to-school pro-grams. Adequate training and support for teachers, food-service personnel,and other leaders will be needed, along with adequate supplies and equip-ment. Federal and state agencies need to provide the resources for researchand evaluation of school programs and interventions and work to dissemi-nate those that are found to be effective in improving physical activity andnutrition behaviors.
Next steps for making progress on this issue will involve discussions ofthe relevant stakeholders in schools, communities, regions, and states so
443

SCHOOLS 277
that action plans can be tailored to best address the issues and high-riskpopulations in the area.
Recommendation 9: SchoolsSchools should provide a consistent environment that is conducive tohealthful eating behaviors and regular physical activity.
To implement this recommendation:
USDA, state, and local authorities, and schools should:
• Develop and implement nutritional standards for all competi-tive foods and beverages sold or served in schools
• Ensure that all school meals meet the Dietary Guidelines forAmericans
• Develop, implement, and evaluate pilot programs to extendschool meal funding in schools with a large percentage of children athigh risk of obesity
State and local education authorities and schools should:
• Ensure that all children and youth participate in a minimum of30 minutes of moderate to vigorous physical activity during theschool day
• Expand opportunities for physical activity through physicaleducation classes; intramural and interscholastic sports programsand other physical activity clubs, programs, and lessons; after-schooluse of school facilities; use of schools as community centers; andwalking- and biking-to-school programs
• Enhance health curricula to devote adequate attention to nutri-tion, physical activity, reducing sedentary behaviors, and energy bal-ance, and to include a behavioral skills focus
• Develop, implement, and enforce school policies to createschools that are advertising-free to the greatest possible extent
• Involve school health services in obesity prevention efforts• Conduct annual assessments of each student’s weight, height,
and gender- and age-specific BMI percentile and make this informa-tion available to parents
• Perform periodic assessments of each school’s policies and prac-tices related to nutrition, physical activity, and obesity prevention
444

278 PREVENTING CHILDHOOD OBESITY
Federal and state departments of education and health and profes-sional organizations should:
• Develop, implement, and evaluate pilot programs to exploreinnovative approaches to both staffing and teaching about wellness,healthful choices, nutrition, physical activity, and reducing seden-tary behaviors. Innovative approaches to recruiting and training ap-propriate teachers are also needed
REFERENCES
AAP (American Academy of Pediatrics), Committee on Sports Medicine and Fitness andCommittee on School Health. 2000. Physical fitness and activity in schools. Pediatrics105(5):1156-1157.
ACHI (Arkansas Center for Health Improvement). 2004. BMI Initiative. [Online]. Available:http://www.achi.net/BMI_Stuff/bmi.asp [accessed June 10, 2004].
Bachen CM. 1998. Channel One and the education of American youths. Ann Am Acad PolSoc Sci 557:132-147.
Bandura A. 1986. Social Foundations of Thought and Action: A Social Cognitive Theory.Prentice-Hall Series in Social Learning Theory. Englewood Cliffs, NJ: Prentice-Hall.
Beech BM, Klesges RC, Kumanyika SK, Murray DM, Klesges L, McClanahan B, Slawson D,Nunnally C, Rochon J, McLain-Allen B, Pree-Cary J. 2003. Child- and parent-targetedinterventions: The Memphis GEMS pilot study. Ethn Dis 13(1):S40-S53.
Bhandari S, Gifford E. 2003. Children with Health Insurance: 2001. Current PopulationReports P60-224. Washington, DC: U.S. Census Bureau.
Biddle S, Sallis JF, Cavill N. 1998. Young and Active? Young People and Health EnhancingPhysical Activity. Evidence and Implication. London: Health Education Authority.
Brener ND, Burstein GR, DuShaw ML, Vernon ME, Wheeler L, Robinson J. 2001. Healthservices: Results from the School Health Policies and Programs Study 2000. J Sch Health71(1):294-304.
Burgeson CR, Wechsler H, Brener ND, Young JC, Spain CG. 2001. Physical education andactivity: Results from the School Health Policies and Programs Study 2000. J Sch Health71(7):279-293.
Buzby J, Guthrie JF, Kantor LS. 2003. Evaluation of the USDA’s Fruit and Vegetable PilotProgram: Report to Congress. Washington, DC: USDA. [Online]. Available: http://www.ers.usda.gov/publications/efan03006/ [accessed March 15, 2004].
Caballero B, Davis S, Davis CE, Ethelbah B, Evans M, Lohman T, Stephenson L, Story M,White J. 1998. Pathways: A school-based program for the primary prevention of obesityin American Indian children. J Nutr Biochem 9(9):535-543.
Caballero B, Clay T, Davis SM, Ethelbah B, Rock BH, Lohman T, Norman J, Story M, StoneEJ, Stephenson L, Stevens J, Pathways Study Research Group. 2003. Pathways: A school-based, randomized controlled trial for the prevention of obesity in American Indianschoolchildren. Am J Clin Nutr 78(5):1030-1038.
Cavill N, Biddle S, Sallis JF. 2001. Health enhancing physical activity for young people:Statement of the United Kingdom Expert Consensus Conference. Pediatr Exer Sci 13:12-25.
CDC (Centers for Disease Control and Prevention). 1997. Guidelines for school and commu-nity programs to promote lifelong physical activity among young people. MMWRRecomm Rep 46(RR-6):1-36.
445

SCHOOLS 279
CDC. 2003. Health, United States, 2003. [Online]. Available: http://www.cdc.gov/nchs/hus.htm [accessed May 17, 2004].
CDC. 2004a. School Health Index. [Online]. Available: http://www.cdc.gov/HealthyYouth/shi/index.htm [accessed May 18, 2004].
CDC. 2004b. Youth risk behavior surveillance—United States, 2003. MMWR Surveill Summ53(2):1-96.
Chomitz VR, Collins J, Kim J, Kramer E, McGowan R. 2003. Promoting healthy weightamong elementary school children via a health report card approach. Arch PediatrAdolesc Med 157(8):765-772.
Consumers Union. 1990. Selling America’s Kids: Commercial Pressures on Kids of the 90’s.Yonkers, NY: Consumers Union Education Services. [Online]. Available: http://www.consumersunion.org/other/sellingkids/index.htm [accessed February 6, 2004].
Consumers Union. 1995. Captive Kids: Commercial Pressures on Kids at School. Yonkers,NY: Consumers Union Education Services. [Online]. Available: http://www.consumersunion.org/other/captivekids [accessed June 18, 2004].
Cullen KW, Zakeri I. 2004. Fruits, vegetables, milk, and sweetened beverages consumptionand access to à la carte/snack bar meals at school. Am J Public Health 94(3):463-467.
Cullen KW, Eagan J, Baranowski T, Owens E, de Moor C. 2000. Effect of à la carte andsnack bar foods at school on children’s lunchtime intake of fruits and vegetables. J AmDiet Assoc 100(12):1482-1486.
Davis SM, Going SB, Helitzer DL, Teufel NI, Snyder P, Gittelsohn J, Metcalfe L, Arviso V,Evans M, Smyth M, Brice R, Altaha J. 1999. Pathways: A culturally appropriate obesity-prevention program for American Indian schoolchildren. Am J Clin Nutr 69(4S):796S-802S.
DHHS (U.S. Department of Health and Human Services). 2000. Healthy People 2010: Under-standing and Improving Health. 2nd ed. Washington, DC: U.S. Government PrintingOffice. [Online]. Available: http://www.healthypeople.gov/document/tableofcontents.htm[accessed April 9, 2004].
Di Bona J, Chaudhuri R, Jean-Baptiste J, Menachem P, Wurzburg M. 2003. Commercialismin North Carolina high schools: A survey of principals’ perceptions. Peabody J Educ78(2):41-62.
Dishman RK, Motl RW, Saunders R, Felton G, Ward DS, Dowda M, Pate RR. 2004. Self-efficacy partially mediates the effect of a school-based physical-activity interventionamong adolescent girls. Prev Med 38(5):628-636.
Donnelly JE, Jacobsen DJ, Whatley JE, Hill JO, Swift LL, Cherrington A, Polk B, Tran ZV,Reed G. 1996. Nutrition and physical activity program to attenuate obesity and pro-mote physical and metabolic fitness in elementary school children. Obes Res 4(3):229-243.
Dryfoos JG. 1999. The role of the school in children’s out-of-school time. Future Child9(2):117-134.
Dwyer T, Coonan WE, Leitch DR, Hetzel BS, Baghurst RA. 1983. An investigation of theeffects of daily physical activity on the health of primary school students in South Aus-tralia. Int J Epidemiol 12(3):308-313.
Dwyer T, Sallis JF, Blizzard L, Lazarus R, Dean K. 2001. Relation of academic performanceto physical activity and fitness in children. Pediatr Exerc Sci 13(3):225-237.
Edible Schoolyard. 2004. The Edible Schoolyard. [Online]. Available: http://www.edibleschoolyard.org [accessed June 4, 2004].
Etelson D, Brand DA, Patrick PA, Shirali A. 2003. Childhood obesity: Do parents recognizethis health risk? Obes Res 11(11):1362-1368.
Ewart CK, Young DR, Hagberg JM. 1998. Effects of school-based aerobic exercise on bloodpressure in adolescent girls at risk for hypertension. Am J Public Health 88(6):949-951.
446

280 PREVENTING CHILDHOOD OBESITY
Fardy PS, White REC, Haltiwanger-Schmitz K, Magel JR, McDermott KJ, Clark LT, HursterMM. 1996. Coronary disease risk factor reduction and behavior modification in minor-ity adolescents: The PATH program. J Adolesc Health 18(4):247-253.
Flores R. 1995. Dance for health: Improving fitness in African American and Hispanic adoles-cents. Public Health Rep 110(2):189-193.
FNS/USDA (Food and Nutrition Service/U.S. Department of Agriculture). 2003. NationalSchool Lunch, Special Milk, and School Breakfast Programs: National average pay-ments/maximum reimbursement rates. Fed Regist 68(130):40623-40626.
French SA, Stables G. 2003. Environmental interventions to promote vegetable and fruitconsumption among youth in school settings. Prev Med 37(6):593-610.
French SA, Story M, Jeffery RW, Snyder P, Eisenberg M, Sidebottom A, Murray D. 1997.Pricing strategy to promote fruit and vegetable purchase in high school cafeterias. J AmDiet Assoc 97(9):1008-1010.
French SA, Jeffery RW, Story M, Breitlow KK, Baxter JS, Hannan P, Snyder MP. 2001.Pricing and promotion effects on low-fat vending snack purchases: The CHIPS study.Am J Public Health 91(1):112-117.
French SA, Story M, Fulkerson JA. 2002. School food policies and practices: A state-widesurvey of secondary school principals. J Am Diet Assoc 102(12):1785-1789.
French SA, Story M, Fulkerson JA, Faricy Gerlach A. 2003. Food environment in secondaryschools: À la carte, vending machines, and food policies and practices. Am J PublicHealth 93(7):1161-1168.
French SA, Story M, Fulkerson JA, Hannan P. 2004. An environmental intervention to pro-mote lower fat food choices in secondary schools: Outcomes of the TACOS study. Am JPublic Health 94(9):1507-1512.
GAO (U.S. General Accounting Office). 2000. Commercial Activities in Schools. GAO/HEHS-00-156. Washington, DC: U.S. General Accounting Office. [Online]. Available: http://www.gao.gov/archive/2000/he00156.pdf [accessed February 23, 2004].
GAO. 2003. School Lunch Program: Efforts Needed to Improve Nutrition and EncourageHealthy Eating. GAO-03-506. Washington, DC: U.S. General Accounting Office.[Online]. Available: http://www.gao.gov/new.items/d03506.pdf [accessed February 23,2004].
GAO. 2004. School Meal Programs: Competitive Foods Are Available in Many Schools;Actions Taken to Restrict Them Differ by State and Locality. GAO-04-673. Washing-ton, DC: U.S. General Accounting Office.
Gortmaker SL, Peterson K, Wiecha J, Sobol AM, Dixit S, Fox MK, Laird N. 1999. Reducingobesity via a school-based interdisciplinary intervention among youth: Planet Health.Arch Pediatr Adolesc Med 153(4):409-418.
Greenberg BS, Brand JE. 1993. Television news and advertising in schools: The Channel Onecontroversy. J Community 43(1):143-151.
Hannan P, French SA, Story M, Fulkerson JA. 2002. A pricing strategy to promote sales oflower fat foods in high school cafeterias: Acceptability and sensitivity analysis. Am JHealth Promot 17(1):1-6, ii.
Harnack L, Snyder P, Story M, Holliday R, Lytle L, Neumark-Sztainer D. 2000. Availabilityof à la carte food items in junior and senior high schools: A needs assessment. J Am DietAssoc 100(6):701-703.
Harrell JS, McMurray RG, Gansky SA, Bangdiwala SI, Bradley CB. 1999. A public health vs.a risk-based intervention to improve cardiovascular health in elementary school chil-dren: The Cardiovascular Health in Children Study. Am J Public Health 89(10):1529-1535.
447

SCHOOLS 281
Hastings G, Stead M, McDermott L, Forsyth A, MacKintosh A, Rayner, M, Godfrey C,Caraher M, Angus K. 2003. Review of Research on the Effects of Food Promotion toChildren. Glasgow, UK. Center for Social Marketing, University of Strathclyde. Finalreport prepared for the Food Standards Agency. [Online]. Available: http://www.foodstandards.gov.uk/multimedia/pdfs/foodpromotiontochildren1.pdf [accessedNovember 22, 2003].
Hearn MD, Baranowski T, Baranowski J, Doyle C, Lin LS, Smith M, Wang DT, Resnicow K.1998. Environmental determinants of behavior among children: Availability and accessi-bility of fruits and vegetables. J Health Educ 29:26-32.
Hopper CA, Gruber MB, Munoz KD, Herb RA. 1992. Effect of including parents in a school-based exercise and nutrition program for children. Res Q Exerc Sport 63(3):315-321.
Hopper CA, Munoz KD, Gruber MB, MacConnie SE, Schonfeldt B, Shunk T. 1996. A school-based cardiovascular exercise and nutrition program with parent participation: An evalu-ation study. Child Health Care 25(3):221-235.
IOM (Institute of Medicine). 2002. Dietary Reference Intakes for Energy, Carbohydrate,Fiber, Fat, Fatty Acids, Cholesterol, Protein, and Amino Acids. Washington, DC: TheNational Academies Press.
Jago R, Baranowski T. 2004. Non-curricular approaches for increasing physical activity inyouth: A review. Prev Med 39(1):157-163.
Joint Committee on National Health Education Standards, American Cancer Society. 1995.National Health Education Standards: Achieving Health Literacy. Atlanta, GA: Ameri-can Cancer Society.
Kahn EB, Ramsey LT, Brownson RC, Heath GW, Howze EH, Powell KE, Stone EJ, RajabMW, Corso P. 2002. The effectiveness of interventions to increase physical activity. Asystematic review. Am J Prev Med 22(4S):73-107.
Kann L, Brener ND, Allensworth DD. 2001. Health education: Results from the SchoolHealth Policies and Programs Study 2000. J Sch Health 71(7):266-278.
Killen JD, Telch MJ, Robinson TN, Maccoby N, Taylor B, Farquhar JW. 1988. Cardiovascu-lar disease risk reduction for tenth graders: A multiple-factor school-based approach. JAm Med Assoc 260(12):1728-1733.
Kubik MY, Lytle LA, Hannan PJ, Perry CL, Story M. 2003. The association of the schoolfood environment with dietary behaviors of young adolescents. Am J Public Health93(7):1168-1173.
Levine J. 1999. Food industry marketing in elementary schools: Implications for school healthprofessionals. J Sch Health 69(7):290-291.
Lopiano DA. 2000. Modern history of women in sports. Twenty-five years of Title IX. ClinSports Med 19(2):163-73, vii.
Los Angeles Unified School District. 2004. Healthy Beverage. [Online]. Available: http://cafe-la.lausd.k12.ca.us/healthy.htm [accessed May 28, 2004].
Luepker RV, Perry CL, McKinlay SM, Nader PR, Parcel GS, Stone EJ, Webber LS, Elder JP,Feldman HA, Johnson CC, Kelder SH, Wu M. 1996. Outcomes of a field trial to im-prove children’s dietary patterns and physical activity. The Child and Adolescent Trialfor Cardiovascular Health. CATCH Collaborative Group. J Am Med Assoc 275(10):768-776.
Manios Y, Moschandreas J, Hatzis C, Kafatos A. 1999. Evaluation of a health and nutritioneducation program in primary school children of Crete over a three-year period. PrevMed 28(2):149-159.
Maynard LM, Galuska DA, Blanck HM, Serdula MK. 2003. Maternal perceptions of weightstatus of children. Pediatrics 111(5 Pt 2):1226-1231.
448

282 PREVENTING CHILDHOOD OBESITY
McKenzie TL, Nader PR, Strikmiller PK, Yang M, Stone EJ, Perry CL, Taylor WC, EppingJN, Feldman HA, Luepker RV, Kelder SH. 1996. School physical education: Effect ofthe Child and Adolescent Trial for Cardiovascular Health. Prev Med 25(4):423-431.
McKenzie TL, Sallis JF, Kolody B, Faucette N. 1997. Long term effects of a physical educa-tion curriculum and staff development program: SPARK. Res Q Exerc Sport 68(4):280-291.
McKenzie TL, Li D, Derby CA, Webber LS, Luepker RV, Cribb P. 2003. Maintenance ofeffects of the CATCH physical education program: Results from the CATCH-ON study.Health Educ Behav 30(4):447-462.
Misako A, Fisher A. 2002. Healthy Farms, Healthy Kids: Evaluating the Barriers and Oppor-tunities for Farm-to-School Programs. Venice, CA: Community Food Service Coalition(CFSC). [Online]. Available: http://www.foodsecurity.org/healthy [accessed April 21,2004].
Molnar, A. 2003. No Student Left Unsold: The Sixth Annual Report on Trends in School-house Commercialism 2002-2003. [Online]. Available: http://www.asu.edu/educ/epsl/CERU/CERU_Annual_Report.htm [accessed November 20, 2003].
Morris J, Zidenberg-Cherr S. 2002. Garden-enhanced nutrition curriculum improves fourth-grade school children’s knowledge of nutrition and preferences for some vegetables. JAm Diet Assoc 102(1):91-93.
Nader PR, Stone EJ, Lytle LA, Perry CL, Osganian SK, Kelder S, Webber LS, Elder JP,Montgomery D, Feldman HA, Wu M, Johnson C, Parcel GS, Luepker RV. 1999. Three-year maintenance of improved diet and physical activity: The CATCH cohort. Child andAdolescent Trial for Cardiovascular Health. Arch Pediatr Adolesc Med 153(7):695-704.
NASBE (National Association of State Boards of Education). 1990. National Commission onthe Role of the School and Community in Improving Adolescent Health. Code Blue:Uniting for Healthier Youth. Alexandria, VA: NASBE.
NASPE (National Association for Sport and Physical Education). 2004. Physical Activity forChildren: A Statement of Guidelines for Children Ages 5-12. Reston, VA: NASPE.
Nestle M. 2000. Soft drink “pouring rights”: Marketing empty calories. Public Health Rep115(4):308-319.
NRC (National Research Council). 1999. Making Money Matter: Financing America’sSchools. Washington, DC: National Academy Press.
NRC. 2000. After-School Programs to Promote Child and Adolescent Development: Sum-mary of a Workshop. Washington, DC: National Academy Press.
NRC. 2003. Working Families and Growing Kids: Caring for Children and Adolescents.Washington, DC: The National Academies Press.
Pate RR, Long BJ, Heath G. 1994. Descriptive epidemiology of physical activity in adoles-cents. Pediatr Exerc Sci 6(4):434-447.
Pate RR, Heath GW, Dowda M, Trost SG. 1996. Associations between physical activity andother health behaviors in a representative sample of US adolescents. Am J Public Health86(11):1577-1581.
Perry CL, Bishop DB, Taylor G, Murray DM, Mays RW, Dudovitz BS, Smyth M, Story M.1998. Changing fruit and vegetable consumption among children: The 5-A-Day PowerPlus program in St. Paul, Minnesota. Am J Public Health 88(4):603-609.
Perry CL, Bishop DB, Taylor GL, Davis M, Story M, Gray C, Bishop SC, Mays RA, Lytle LA,Harnack L. 2004. A randomized school trial of environmental strategies to encouragefruit and vegetable consumption among children. Health Educ Behav 31(1):65-76.
Resnicow K, Robinson TN. 1997. School-based cardiovascular disease prevention studies:Review and synthesis. Ann Epidemiol 7(7S):S14-S31.
449

SCHOOLS 283
Reynolds KD, Franklin FA, Binkley D, Raczynski JM, Harrington KF, Kirk KA, Person S.2000. Increasing the fruit and vegetable consumption of fourth-graders: Results fromthe high 5 project. Prev Med 30(4):309-319.
Robinson TN. 1999. Reducing children’s television viewing to prevent obesity: A randomizedcontrolled trial. J Am Med Assoc 282(16):1561-1567.
Robinson TN, Killen JD, Kraemer HC, Wilson DM, Matheson DM, Haskell WL, Pruitt LA,Powell TM, Owens AS, Thompson NS, Flint-Moore NM, Davis GJ, Emig KA, BrownRT, Rochon J, Green S, Varady A. 2003. Dance and reducing television viewing toprevent weight gain in African-American girls: The Stanford GEMS pilot study. EthnDis 13(1S1):S65-S77.
Ross JG, Dotson CO, Gilbert GG, Katz SJ. 1985. After physical education: Physical activityoutside of school physical education programs. J Phys Educ Recr Dance 56(1):77-81.
Sallis JF. 1993. Epidemiology of physical activity and fitness in children. Crit Rev Food SciNutr 33(4/5):403-408.
Sallis JF, McKenzie TL, Alcaraz JE, Kolody B, Faucette N, Hovell MF. 1997. The effects of a2-year physical education program (SPARK) on physical activity and fitness in elemen-tary school students. Sports, Play and Active Recreation for Kids. Am J Public Health87(8):1328-1334.
Sallis JF, McKenzie TL, Conway TL, Elder JP, Prochaska JJ, Brown M, Zive MM, MarshallSJ, Alcaraz JE. 2003. Environmental interventions for eating and physical activity. Arandomized controlled trial in middle schools. Am J Prev Med 24(3):209-217.
Scheier LM. 2004. School health report cards attempt to address the obesity epidemic. J AmDiet Assoc 104(3):341-344.
Shephard RJ. 1997. Curricular physical activity and academic performance. Pediatr Exerc Sci9(2):113-126.
Simons-Morton BG, Parcel GS, Baranowski T, Forthofer R, O’Hara NM. 1991. Promotingphysical activity and a healthful diet among children: Results of a school-based interven-tion study. Am J Public Health 81(8):986-991.
Simons-Morton BG, Taylor WC, Snider SA, Huang IW. 1993. The physical activity of fifth-grade students during physical education classes. Am J Public Health 83(2):262-265.
Simons-Morton BG, McKenzie TJ, Stone E, Mitchell P, Osganian V, Strikmiller PK, EhlingerS, Cribb P, Nader PR. 1997. Physical activity in a multiethnic population of third grad-ers in four states. Am J Public Health 87(1):45-50.
Smith K. 2002. Who’s minding the kids? Child care arrangements: Spring 1997. CurrentPopulation Reports 70-86. Washington, DC: U.S. Census Bureau.
Stone M. 2002. A food revolution in Berkeley: Fighting malnutrition and disease, teachingecological literacy, and giving hope to family farmers begins with kids growing theirown food. Whole Earth (107):38-47.
Story M, Hayes M, Kalina B. 1996. Availability of foods in high schools: Is there cause forconcern? J Am Diet Assoc 96(2):123-126.
Stuhldreher WL, Koehler AN, Harrison MK, Deel H. 1998. The West Virginia standards forschool nutrition. J Child Nutr Management 22:79-86.
Trost SG, Pate RR, Sallis JF, Freedson PS, Taylor WC, Dowda M, Sirard J. 2002. Age andgender differences in objectively measured physical activity in youth. Med Sci SportsExerc 34(2):350-355.
United Kingdom Department of Health. 2002. The National School Fruit Scheme: EvaluationSummary. London: Wellington House. [Online]. Available: www.doh.gov.uk/schoolfruitscheme [accessed April 6, 2004].
USDA. 2001a. Foods Sold in Competition with USDA School Meal Programs: A Report toCongress. Washington, DC: USDA. [Online]. Available: http://www.fns.usda.gov/cnd/Lunch/CompetitiveFoods/report_congress.htm [accessed November 19, 2003].
450

284 PREVENTING CHILDHOOD OBESITY
USDA. 2001b. School Nutrition Dietary Assessment Study. II: Summary of Findings. Nutri-tion Assistance Program Report Series. CN-01-SNDAIIFR. Alexandria, VA: USDA.
USDA. 2002. School Lunch Salad Bars. Nutrition Assistance Program Report Series. Foodand Nutrition Service. CN-02-SB. Alexandria, VA: USDA.
USDA. 2003. The Food Assistance Landscape. Food Assistance and Nutrition Research Re-port Number 28-4. Washington, DC: USDA.
USDA. 2004a. National School Lunch Program. [Online]. Available: http://www.fns.usda.gov/cnd/lunch/AboutLunch/NSLPFactSheet.htm [accessed May 18, 2004].
USDA. 2004b. Menu Planner for Healthy School Meals. [Online]. Available: http://schoolmeals.nal.usda.gov/Recipes/menuplan/menuplan.html [accessed April 6, 2004].
USDA. 2004c. The School Meals Implementation Study. Third Year Report. [Online]. Avail-able: http://www.fns.usda.gov/oane/ [accessed April 6, 2004].
USDA (U.S. Department of Agriculture), DHHS (U.S. Department of Health and HumanServices). 2000. Nutrition and Your Health: Dietary Guidelines for Americans. Homeand Garden Bulletin No. 232, 5th ed. Washington, DC: Government Printing Office.
U.S. Department of Education. 2002. Projections of Education Statistics to 2012. NationalCenter for Education Statistics Report 2002-030. Washington, DC: U.S. Department ofEducation. [Online]. Available: http://nces.ed.gov/pubs2002/2002030.pdf [accessed May27, 2004].
U.S. Department of Education. 2004. 21st Century Community Learning Centers. [Online].Available: http://www.ed.gov/programs/21stcclc/index.html [accessed April 6, 2004].
Vandell DL, Shumow L. 1999. After-school child care programs. Future Child 9(2):64-80.Vandongen R, Jenner DA, Thompson C, Taggart AC, Spickett EE, Burke V, Beilin LJ, Milligan
RA, Dunbar DL. 1995. A controlled evaluation of a fitness and nutrition interventionprogram on cardiovascular health in 10- to 12-year-old children. Prev Med 24(1):9-22.
Walter HJ, Hofman A, Connelly PA, Barrett LT, Kost KL. 1985. Primary prevention ofchronic disease in childhood: Changes in risk factors after one year of intervention. AmJ Epidemiol 122(5):772-781.
Wechsler H, Devereaux RS, Davis M, Collins J. 2000. Using the school environment topromote physical activity and healthy eating. Prev Med 31(2 Part 2):S121-S137.
Wechsler H, Brener ND, Kuester S, Miller C. 2001. Food service and foods and beveragesavailable at school: Results from the School Health Policies and Programs Study 2000. JSch Health 71(7):313-324.
Whitaker RC, Wright JA, Finch AJ, Psaty BM. 1993. An environmental intervention toreduce dietary fat in school lunches. Pediatrics 91(6):1107-1111.
Whitaker RC, Wright JA, Koepsell TD, Finch AJ, Psaty BM. 1994. Randomized interventionto increase children’s selection of low-fat foods in school lunches. J Pediatr 125(4):535-540.
Wilcox BL, Kunkel D, Cantor J, Dowrick P, Linn S, Palmer E. 2004. Report of the APA TaskForce on Advertising and Children. Washington, DC: American Psychological Associa-tion.
Zive MM, Elder JP, Prochaska JJ, Conway TL, Pelletier RL, Marshall S, Sallis JF. 2002.Sources of dietary fat in middle schools. Prev Med 35(4):376-382.
451

285
Home
8
A child’s health and well-being are fostered by a home environmentwith engaged and skillful parenting that models, values, and en-courages sensible eating habits and a physically active lifestyle. By
promoting certain values and attitudes, by rewarding or reinforcing specificbehaviors, and by serving as role models, parents can have a profoundinfluence on their children. It is not surprising, therefore, that sedentarybehaviors, obesity, and other chronic disease risk factors tend to clusterwithin families. Although some of these risk factors may have a geneticcomponent, most have strong behavioral aspects. The family is thus anappropriate and important target for interventions designed to preventobesity in children through increasing physical activity levels and promot-ing healthful eating behaviors.
In the United States in the 21st century, there are a great many pres-sures on parents and children that can adversely affect daily family life. Forexample, with the frequent need for both parents to work long hours, it hasbecome more difficult for many parents to play with or monitor theirchildren and to prepare home-cooked meals for them. Of two-parent house-holds, 62.4 percent have both parents in the labor force; in one-parenthomes, 77.1 percent of the mothers and 88.7 percent of fathers are working(Fields, 2003). Because the school day is shorter than the work day, manychildren come home to an empty house, where they may be unsupervisedfor several hours (Smith, 2002). In a national survey, parents report beingwell aware of the need to spend more time with their children but believethey do not have such time available (Hewlett and West, 1998). Parents
452

286 PREVENTING CHILDHOOD OBESITY
from diverse socioeconomic categories actually cite a “parental time fam-ine”—insufficient time to spend with their children. Economic and timeconstraints, as well as the stresses and challenges of daily living, may makehealthful eating and increased physical activity a difficult reality on a day-to-day basis for many families (Devine et al., 2003).
The committee has adopted an ecological framework that considerschildren and youth as being influenced primarily by the family, particularlyin the younger years, though other micro-environments—including theneighborhood, workplace, and school—also have important impacts onparenting and on individual and family functioning (see Chapter 3). In thisecological framework, parenting is influenced by the larger (macro) eco-nomic, political, social, and physical environments, as well as by socioeco-nomic status, parental goals, personal resources, and child characteristics(Parke and Buriel, 1998). Cultural norms are also an important factor. Forexample, parents may feel pressured to contribute cookies or soft drinks tothe classroom or child-care setting if the other children are bringing insimilar foods and beverages. On the other hand, if new values about whatconstitutes appropriate food choices for children become normative, thiscan produce positive changes in individual families and in their children’sdaytime environments.
The ecological perspective leads to strategies that target parents di-rectly, as well as to other strategies designed to influence contextual factorsthat might otherwise serve to undermine healthful family values and prac-tices. Therefore, a number of the committee’s recommendations focus onpromoting changes in nonhome settings (e.g., schools, communities, thebuilt environment, the media) in order to support parents in their efforts toserve as positive models for children’s eating and physical activity and toallow them to provide children with appropriate environments for prevent-ing obesity. This is particularly important for families from high-risk popu-lations who live in conditions that are not supportive of healthful lifestyles.
From a practical standpoint, parents play a fundamental role as house-hold policy makers. They make daily decisions on recreational opportuni-ties, food availability at home, and children’s allowances; they determinethe setting for foods eaten in the home; and they implement countless otherrules and policies that influence the extent to which various members of thefamily engage in healthful eating and physical activity.
The committee acknowledges the broad and diverse nature of familiesin the United States. According to a recent U.S. Census Bureau report, in2002 there were more than 72 million children (under 18 years of age) inthe United States (Fields, 2003). Approximately 69 percent of them livedwith two parents, 23 percent lived with only their mother, approximately 5percent lived with their father, and 4 percent lived with other family mem-bers, usually grandparents, or in other situations (Fields, 2003). This report
453

HOME 287
uses the term “parents” in its broadest sense to incorporate all those whoare primary caregivers to children in the home.
Although treatment of childhood obesity is beyond the scope of thisreport, treatment studies have demonstrated that intensive involvement ofparents in interventions to change obese children’s dietary and physicalactivity behaviors has contributed to success in weight loss and long-termweight maintenance (Coates et al., 1982; Kirschenbaum et al., 1984; Epsteinet al., 1990, 1994; Golan et al., 1998; Golan and Crow, 2004). It is plau-sible that family-based strategies that prevent weight re-gain in these studiesare likely to be informative in the prevention of obesity. The fundamentalinfluence of parents on the eating behavior of their children has also beendemonstrated in the prevention of eating disorders (Graber and Brooks-Gunn, 1996). Finally, a 10-year longitudinal study conducted in Denmarkhas identified parental neglect as a powerful predictor of the subsequentdevelopment of obesity (as compared to putative biological predictors suchas obesity in one or both parents) (Lissau and Sorensen, 1994).
While the home is an influential setting, it is also the least accessible forhealth promotion efforts. Mechanisms for parent education are varied andmany provide only brief opportunities for health-care professionals, teach-ers, or others to interact with parents and share information and resources.As discussed throughout the report, there are resources in the school andthe broader community that can support and inform parents and caregivers,children, and youth (see Chapters 6 and 7).
In the remainder of this chapter, the committee explores some of theways in which parents and families can encourage healthful eating behav-iors and increased physical activity. This report is not the place for anexhaustive discussion of diet and physical activity, nor is it meant to be thedefinitive source for parental advice; rather, the committee sought to presentsome actionable steps that can be taken by parents, families, children, andyouth. It is important to note that many families are already quite physi-cally active and put time and effort into providing healthful meals. It isimportant that parents and children extend these efforts and priorities totheir schools, neighborhoods, and communities (Chapters 6 and 7) andbecome involved in ensuring that opportunities are made available andexpanded for all families.
PROMOTING HEALTHFUL EATING BEHAVIORS
For decades, scientists have suggested that there are critical periods inthe brain development of animals and humans that may profoundly affectfood intake and body weight (in particular, body fat) beginning in utero—when many of the systems that regulate food intake and body weightinitially develop. The factors that influence the quantity and quality of the
454

288 PREVENTING CHILDHOOD OBESITY
maternal diet at the time of conception and throughout pregnancy—someof which may be within the control of the mother, while others result fromsocial and economic environments—are thus important to consider. A re-cent study of 8,494 low-income children found that maternal obesity in thefirst trimester of pregnancy more than doubled the risk of the child beingobese at 2 to 4 years of age (Whitaker, 2004). Furthermore, there areconcerns that the offspring of mothers with gestational diabetes mellitusmay be at higher risk for obesity, but the results are inconsistent (Silvermanet al., 1998; Whitaker et al., 1998; Gillman et al., 2003). Needless to say,women of child-bearing years should pursue a healthful lifestyle that em-phasizes sound dietary and physical activity habits, and because of theimportance of a healthy maternal body weight at conception and adequateweight gain during pregnancy, these goals should be embraced and nur-tured by the entire family.
Infancy
Researchers are examining early determinants of obesity, including fac-tors during infancy; however, much remains to be learned. Issues beingexplored include the combined effects of low birthweight followed by rapidweight gain during early infancy (Stettler et al., 2002, 2003).
The associations between various feeding methods during infancy andchildhood obesity have been the most thoroughly explored. Epidemiologi-cal data suggest that breastfeeding, even as it is generally practiced in theUnited States—that is, as a nonexclusive source of nutrition, usually ofshort duration—confers a small but significant degree of protection fromchildhood obesity, although it is not certain why this is so or the extent towhich other factors may confound this finding. A recent review of 11epidemiologic studies with adequate sample size1 found that eight of thestudies showed breastfed children to be at a lower risk of overweight aftercontrolling for potential confounders (Dewey, 2003). Studies publishedsince that review have generally confirmed that finding but not in all sub-populations. For example, Bergmann and colleagues (2003) examined theweight status of a cohort of children at 6 years of age and found that thosewho were bottle fed as infants had a higher prevalence of obesity than thosewho were breastfed. Other risk factors for adiposity at 6 years of age
1Criteria for studies in this review were (1) sample size of greater than 100 children perfeeding group (in most cases breastfeeding versus formula feeding); (2) age at follow-up ofover 3 years; and (3) measured outcomes includes percentage of children who were over-weight (Dewey, 2003).
455

HOME 289
included overweight of the mother, maternal smoking during pregnancy,and low social status. In research on the weight status of 12,587 children inthe United States at 4 years of age, Grummer-Strawn and Mei (2004) foundthat greater duration of breastfeeding showed a protective effect on the riskof overweight among non-Hispanic whites, but not among non-Hispanicblacks or Hispanics. The reasons for differences among ethnic groups arenot clear; the study did not examine supplementation by formula or foodsor varying dietary or physical activity patterns. A study by Bogen andcolleagues (2004) also found no association between breastfeeding andobesity among 20,518 low-income black children (the study sample did notinclude Hispanics).
Breastfeeding is thought to promote the infant’s ability to regulateenergy intake, allowing him or her to eat in response to internal hunger andsatiety cues—that is, to assume greater control in determining meal size(Fisher et al., 2000). In contrast, a caregiver who is formula feeding aninfant may use visual information about how much remains in the bottle to“encourage” the infant to finish the bottle, potentially fostering overfeed-ing. Even if the caregiver makes no such effort, the uniform composition offormula, both during a single feeding and over the duration of infancy, maynot provide the infant with the same metabolic/hormonal cues that aresupplied with breast milk. Because the composition of breast milk changesduring each feed and from one feeding to the next over the course oflactation, the full effects of this variation are not experienced whenbreastfeeding is nonexclusive or of short duration (Lederman et al., 2004).
Factors in breast milk may elicit metabolic programming effects thatcontribute to the protective association between breastfeeding and child-hood obesity. There is the possibility that other parental lifestyle factorsand behaviors, not yet identified, may undermine or overwhelm that pro-tection (Dewey, 2003). Lifestyle and cultural factors may also explain thediscrepant findings among different ethnic groups. It is worth emphasizingthat a protective effect of breastfeeding was found in the majority of studiesreviewed although not in all. But in none of the 11 studies reviewed byDewey (2003) or those published since that review has breastfeeding beenassociated with increased risk for childhood obesity; breastfeeding wasfound to be either protective or neutral. None of the studies have foundformula feeding to be protective against childhood obesity.
Research indicates that many flavors from the mother’s diet are trans-mitted to her breast milk (Mennella and Beauchamp, 1991; Mennella,1995). By the time complementary foods are introduced, therefore, thebreastfed infant has already had experience with a variety of flavors fromthe adult diet, which may promote acceptance of foods during weaning(Sullivan and Birch, 1994; Mennella et al., 2001; Lederman et al., 2004).Experience with numerous flavors in breast milk (as opposed to the lack of
456

290 PREVENTING CHILDHOOD OBESITY
variety experienced by the formula-fed infant) may also have more generaleffects, promoting the infant’s acceptance of a wide range of new foods ashe or she matures; further research is needed in this area (Mennella andBeauchamp, 1998; Lederman et al., 2004).
Much remains to be learned about the extent of the association be-tween breastfeeding and childhood obesity. Nonetheless, breastfeeding islikely to be at least weakly protective against obesity, and despite the factthat the protective effects may be overwhelmed by events and environmen-tal factors that occur later in childhood, there are numerous ancillary ben-efits of breastfeeding (AAP, 2004). Breastfeeding is recommended for allinfants. Exclusive breastfeeding is recommended for the first 4 to 6 monthsof life and breastfeeding, along with the age-appropriate introduction ofcomplementary foods, is encouraged for the first year of life. This is inaccordance with the American Academy of Pediatrics (2004) statementrecommending breastfeeding and stating that in developed countries“complementary foods may be introduced between 4 and 6 months” andthe World Health Organization (2003) recommendation that encouragesexclusive breastfeeding for the first 6 months of life, to the extent that thisis practical for the mother and family.
Another issue that is discussed regarding infant feeding is serving size—ensuring that infants receive the appropriate amounts of milk or foods.Research has shown that early in life, infants are responsive to the energydensity of food and are capable of controlling the volume taken during afeeding. Thus, even by about 6 weeks of age, infants can adjust the volumeof formula consumed based on the energy density of the formula, so thattotal energy intake remains relatively constant (Fomon et al., 1975). None-theless, there is the possibility that infants can be coaxed to eat beyondsatiety and that has been postulated by several researchers as a potentialcontributor to childhood obesity (Bergmann et al., 2003; Dewey, 2003;Lederman et al., 2004). Concern has been expressed that precocious intro-duction of sweetened beverages and high-fat/sweet-tasting foods may beimportant contributors to childhood obesity by possibly developing earlypreferences for such foods and beverages (Fox et al., 2004; Lederman et al.,2004). Documentation that such concerns are well founded are the findingsfrom the Feeding Infants and Toddlers Study (FITS) that soft drinks andFrench fries are being fed to infants as young as 7 months of age (Fox et al.,2004).
Toddlers and Young Children
Children tend to avoid new foods. But during the transition from theexclusive milk diet of infancy to consuming a varied, modified adult diet,virtually all foods are new to the child. Fortunately, it has been found that
457

HOME 291
if children have opportunities to try new foods without being coerced to eatthem, many of these foods, even if initially rejected, will become part oftheir diet (Birch and Marlin, 1982; Loewen and Pliner, 1999). Such earlyexperience with new options will be especially important in learning toaccept fruits, vegetables, and other nutrient-rich foods later on in life (Birch,1999; Skinner et al., 2002).
Food flavor preferences are powerful determinants of intake for chil-dren. Because infants are predisposed to prefer sweet and salty tastes, theytend to readily accept foods that are sweet or salty (Cowart, 1981;Beauchamp and Cowart, 1985; Mennella and Beauchamp, 1998). In con-trast, preferences for foods that lack such tastes are learned, requiringrepeated positive experiences.
Initial rejection of new foods is expected and normal. As many as fiveto ten exposures may be needed before certain new foods are accepted, andrepeated experience is most critical during the first few years of life. Recentfindings reveal that parent-led exposure can increase children’s acceptanceof vegetables (Wardle et al., 2003; Lederman et al., 2004), and that child-care and preschool settings are also effective locations for promotingchildren’s acceptance of new foods (Nicklas et al., 2001). Research alsoshows that increasing the school-based availability and accessibility of fruitsand vegetables in particular can promote children’s intake, at school as wellas at home (Baranowski et al., 2000; Weber Cullen et al., 2000).
Of course, children can be equally responsive to less healthful optionswhen made available. Because their preferences for high-fat, energy-densefoods are, in part, learned, providing children with frequent exposure tosuch foods may reinforce their liking for them (Johnson SL et al., 1991). Inthe 2002 FITS, which examined the dietary intake of 3,022 infants andtoddlers, parents reported that 23 percent of infants and 33 percent oftoddlers had not consumed any fruit during the preceding 24 hours; simi-larly 18 percent and 33 percent of infants and toddlers, respectively, hadnot consumed any vegetables (Fox et al., 2004). This study also reportedchanges in intake from 4 to 8 months of age when deep yellow vegetables(e.g., carrots, sweet potatoes, squash) were the vegetables consumed mostoften, to the patterns at 15 to 18 months, when French fries or other friedpotatoes were the predominant vegetables (Fox et al., 2004). Parents shouldpromote healthful food choices among toddlers and young children bymaking a variety of nutritious, low-energy-dense foods, such as fruits andvegetables, available to them. Encouraging toddlers and young children totry a variety of foods, including fruits and vegetables, often involves offer-ing new foods multiple times.
Beyond quality is the issue of quantity. Limited empirical evidencesuggests that children, especially those in the toddler years, have a physi-ological sense of satiety that guides them to eat only until they are full.
458

292 PREVENTING CHILDHOOD OBESITY
McConahy and colleagues (2002) found that the food portion sizes con-sumed by children 1 to 2 years of age have been consistent over the past 20years. However, as children develop, they become increasingly responsiveto environmental cues such as portion size; by the age of 5 years, largerportions can lead to increased food intake (Rolls et al., 2000). This issue isdiscussed further below.
Older Children and Youth
As children develop, they play an expanding role in determining thefoods that are available to them. They make their own choices at schooland in other out-of-home settings, and they increasingly influence familyfood purchases. Furthermore, as they begin to be influenced by their peersand the broader culture, they may make certain food choices based onpopular appeal. It is also important to note, however, that parents areimportant role models and their dietary intake influences that of theirchildren (see section below on role models).
Food and Beverage Selection and Availability
Parents can promote wise food selections and a wholesome overall dietby making nutritious options available to children. Research has shownthat children’s consumption of fruit, 100 percent fruit juice, and vegetablesare positively influenced by the availability and accessibility of these foodsin the home (Nicklas et al., 2001; Cullen et al., 2003). Similarly, parentscan limit the types and quantity of energy-dense high-calorie foods (e.g.,cookies, chips) that are available in the home, particularly those that havelow nutrient content. Improved consumer nutrition information in restau-rants and on food labels (see Chapter 5) will provide parents and youngpeople with enhanced information on which to base their dietary decisions.
Parents are responsive to children’s attempts to influence food pur-chases (Galst and White, 1976). Interviews with 500 children and youthaged 8 to 17 years found that 78 percent of respondents noted that theyinfluence family food purchases (Roper ASW, 2003). For their part, 84percent of the parents stated that their children do indeed influence suchpurchases.
The Dietary Guidelines for Americans and the Food Guide Pyramidprovide information on the types of foods that make up a balanced andnutritious diet (USDA and DHHS, 2000; USDA, 2004). Although it is notthe purpose of this report to duplicate that information, the committeewishes to emphasize the responsibilities of children (particularly older chil-dren), youth, and parents in choosing and providing a balanced diet. Par-ents should promote healthful food choices by school-age children and
459

HOME 293
youth by making a variety of nutritious, low-energy-dense foods, such asfruits and vegetables, available in the home. Because nutrient quality shouldbe a major consideration in selecting the family’s foods and beverages,parents should limit their purchases of items characterized by high caloriccontent and low nutrient density.
The mealtime setting has been shown to affect diet quality in childrenand youth. Several studies have shown that increased frequency of familydinners is positively associated with older children’s and adolescents’ con-sumption of fruits and vegetables, grains, and calcium-rich foods, and nega-tively associated with their consumption of fried food and soft drinks(Gillman et al., 2000; Neumark-Sztainer et al., 2003a). The influence ofwatching television during mealtime is another area for further research.Coon and colleagues (2001) found that watching television during meal-time was associated with consumption of fewer fruits and vegetables andincreased consumption of soft drinks, salty snacks, pizza, and red meat.
One of the issues that has been raised regarding childhood obesity is thepotential role of sweetened beverages, such as soft drinks and “flavoreddrinks” (not 100 percent juices). These beverages do not provide nutrientsthat are needed by growing children, but do increase the caloric intake.Nevertheless, soft drink consumption more than tripled among adolescentboys between 1977-1978 and 1994, rising from 7 to 22 ounces per day(Guthrie and Morton, 2000; French et al., 2003). By the time they are 14years of age, 32 percent of adolescent girls and 52 percent of boys areconsuming three or more eight-ounce servings of soft drinks daily (Gleasonand Suitor, 2001). FITS reported that infants as young as 7 months of ageare consuming soft drinks as well (Fox et al., 2004). There are concernsabout the effect of increased soft drink consumption on reducing micronu-trient intakes and increasing energy intake (IOM, 2002) and on displacingthe intake of more nutrient-rich options such as milk (ADA, 2004). Milkconsumption by adolescents declined 36 percent from 1965 to 1996(Cavadini et al., 2000). An analysis of data from the 1994-1996, 1998Continuing Survey of Food Intakes by Individuals (CSFII) found that chil-dren and adolescents (>12 years of age) drank more soft drinks than milk,100 percent juices, or fruit drinks (Rampersaud et al., 2003).
The link between beverage consumption and body mass index (BMI) isnot definitive. In an analysis of CSFII data, Forshee and Storey (2003)reported that BMI calculated from self-reported height and weight had littleor no cross-sectional association with beverage consumption. In contrast,in a prospective study of middle schoolers in which height and weight weremeasured directly, Ludwig and colleagues (2001) reported significant posi-tive associations between sweetened beverage consumption and increases inBMI and obesity incidence. In a recent randomized controlled trial of a 1-year classroom-based intervention focused on carbonated beverages, dental
460
294 PREVENTING CHILDHOOD OBESITY
health, and dietary intake, James and colleagues (2004) reported a signifi-cant decrease in the prevalence of overweight and obesity in the group ofchildren receiving the intervention compared to controls. However, meth-odological limitations prevent conclusions regarding whether reducing softdrink consumption led to the observed changes in obesity prevalence (Frenchet al., 2004). Further, experimental studies of the effects of reducing sweet-ened beverage intakes are needed to examine the potential efficacy of thisapproach for reducing weight gain, as well as the hypothesized causal linkbetween sweetened beverage consumption and obesity.
Much remains to be learned about whether a unique association existsbetween intake of sweetened beverages and changes in BMI. Because ofconcerns about excessive consumption of sweetened options and the dis-placement of more nutrient-rich or lower calorie alternatives, childrenshould be encouraged to avoid high-calorie, nutrient-poor beverages.
Portion Control and Eating in the Absence of Hunger
In addition to ensuring the quality of children’s diets, it is important forparents to consider the quantity of food being consumed. Researchers ex-amining the recent increases in portion sizes have found that Americansconsumed larger portion sizes of nearly one-third of 107 widely consumedfoods when comparing 1989-1991 with 1994-1996 data (Nestle, 2003;Smiciklas-Wright et al., 2003).
Although long-term studies investigating the effects of portion size onweight gain are lacking, short-term studies confirm that larger portions doincrease intake, especially among adults and children aged 5 years andolder. In research involving a range of foods that included sandwiches,macaroni and cheese, popcorn, and cookies, the larger the portion sizeoffered, the larger the amount consumed (reviewed by Rolls, 2003; Dilibertiet al., 2004).
While evidence shows that infants and toddlers can self-regulate theirenergy intake (discussed earlier), a series of studies found that by the age of5 many children eat what they are served; physiological satiety cues, if theyare present, are overridden by environmental cues (such as larger portionsizes) that stimulate them to eat more, even if they are not hungry (Rolls etal., 2000). In this research, 3- to 5-year-olds were fed a standard lunch ontwo different days in their usual preschool setting. Lunches differed only inthe portion size of the entrée. Older preschoolers responded in much thesame way that adults do; when given a larger portion, they ate more. Butyounger children were relatively unresponsive to portion size, providingmore indirect support that they are still eating primarily in response tointernal signals of hunger and satiety (Rolls et al., 2000; see Rolls, 2003 fora review of the adult literature).
In subsequent research, Orlet-Fisher and colleagues (2003) explored
461

HOME 295
the effects of children’s chronic exposure to large portions. Results indi-cated that when served larger portions, children ate substantially morefood—but giving them the opportunity to serve themselves mitigated theseeffects because they tended to self-select smaller portions. In one study, theyconsumed 25 percent less of the lunch entrée when they served themselves,as compared to other occasions when a larger portion was served to them(Orlet-Fisher et al., 2003). The portion sizes that the children self-selectedand consumed were more similar to standard, recommended serving sizesthan to the large portions they had been offered, suggesting that givingchildren control over portion size may prevent overeating or eating in theabsence of hunger.
The goal for parents is to promote the normal and effective develop-ment of internal satiety cues so that children learn to rely on their own senseof fullness. However, research suggests that restricting palatable foods canlead to increased preference for these foods and that pressuring children to“clean the plate” can encourage overeating. Such practices can promptchildren to attend to external cues, such as the availability of food or theamount remaining on the plate, and divert them from internal cues ofhunger and satiety (Birch et al., 1987; Fisher and Birch, 1999; Orlet-Fisheret al., 2003). Golan and Crow (2004) point out the impact of parentingstyles on children’s eating behaviors: “authoritative parenting (in whichparents are both firm and supportive and assume a leadership role in theenvironmental change with appropriate granting of child’s autonomy) ratherthan authoritarian style (which controls child-feeding practices) was foundto be the effective parental child-feeding modality” (p. 358).
Child characteristics influence the choice of these feeding practices;overweight children tend to elicit higher levels of parental restriction, andthinner children are more likely to be pressured to eat. Pressure and restric-tion tend to be used with different foods (pressure with perceived “healthfulfoods” that parents want to encourage; restriction with some snack foodsthat parents want to limit), but a parent who uses one tactic is likely to usethe other as well (Fisher et al., 2002). However, one of the limitations ofthis research to date is that it has been conducted with middle-class whitefamilies and sometimes only with one gender, severely limiting the ability togeneralize.
Research has also shown that using foods as rewards or in other posi-tive contexts can result in greater preference for and intake of those foods(Birch et al., 1980; Birch, 1981). Furthermore, this practice dissociateseating from hunger. Parents should avoid using food as a reward.
More research is also needed to understand developmental progres-sion—the neural and physiological underpinnings of hunger and satiety—and the regulation of food intake and energy balance. It is also important tolearn more about how the timing of snacks and meals influence eating andweight status.
462

296 PREVENTING CHILDHOOD OBESITY
Meanwhile, research results that have been obtained thus far shouldprompt parents to consider making constructive family policies that moveaway from pressures and restrictions and more toward positive practicesregarding what, where, and when foods and beverages can be consumed.Such practices, by which parents can help children learn to regulate theirown energy intake, include the following:
• Allow children to determine their own portions at meals.• Encourage children to pay attention to their own internal signals of
fullness and permit them to decide when they have finished eating a meal.Do not insist on their “cleaning the plate.”
• Avoid using food as a reward. This practice dissociates eating fromhunger and clearly establishes preferences for foods used as rewards.
• Make fruits and vegetables readily available in the home to encour-age selection of these foods as snacks and desserts.
• Offer smaller portions of foods (e.g., smaller cookies or slices ofpizza).
• Carefully consider the quality of and the possible need to limit thetypes of snack foods and beverages that are available and accessible tochildren in the home.
Parents should educate their children, from a young age, about makingdecisions regarding dietary intake, so that as they get older, the children cantake on increasing responsibility for decisions regarding the types andamounts of foods and beverages they consume. While permitting childrento determine portion sizes for themselves, parents should encourage smallerportions with an option for seconds. For children too young to serve them-selves, parents should offer age-appropriate portion sizes.
PROMOTING PHYSICAL ACTIVITY
There is still much to be learned about the determinants of physicalactivity and fitness in children and adolescents and how to influence theirlevel of activity throughout the developmental stages. As discussed through-out the report, physical activity can influence the body-fat level of children(Gutin et al., 2004).
Correlates of Physical Activity
Developmental, Biological, and Psychosocial Correlates
Children’s gender and age are both important factors to consider inexamining physical activity levels. Boys are generally more involved in
463

HOME 297
moderate to vigorous physical activity than are girls (DHHS, 1996; Sallis etal., 2000). Explanations may include differential development of motorskills, body composition differences during growth, variations in socializa-tion regarding sports and physical activity, and other social and environ-mental factors (Sallis et al., 1992; Kohl and Hobbs, 1998). From a develop-mental perspective, unstructured gross motor play is important in youngchildren for optimal brain development and is important for social, emo-tional, and cognitive development (Butcher and Eaton, 1989; Pica, 1997).As children get older they are generally less physically active, although thismay be more true for girls than for boys (Goran et al., 1999). The social,psychological, and behavioral effects of puberty may play an important rolein physical activity levels (Lindquist et al., 1999), although more research isneeded, particularly research that focuses on measured physical activity(e.g., using accelerometry) rather than self-report or other indirect methodsof documenting physical activity.
The personal psychosocial factors that influence physical activity differsomewhat between children and adolescents. Intention to be physicallyactive, preference for physical activity, positive beliefs about physical activ-ity, enjoyment of physical activity, and enjoyment of physical educationclasses have been shown to be positively associated with physical activity inchildren (Stucky-Ropp and DiLorenzo, 1993; Pate et al., 1997; Trost et al.,1997, 1999; DiLorenzo et al., 1998; Sallis et al., 2000). Perceived barriersto physical activity (including not enough time or the activity is too hard)have been found to be negatively associated with physical activity behaviorin children (Sallis et al., 2000).
In adolescents, correlates of physical activity include perceived activitycompetence, intention to be active, sensation seeking, perception of aca-demic rank and academic expectations, and depression (an inverse corre-late) (Sallis et al., 2000; Motl et al., 2002; Schmitz et al., 2002). Perceivedself-worth, perceived time constraints, and value placed on health and ap-pearance may influence prevalence of physical activity or change in physicalactivity levels in adolescent girls (Schmitz et al., 2002; Neumark-Sztainer etal., 2003b).
Physical activity self-efficacy (confidence in one’s ability to participatein exercise) has been widely studied as a potential psychosocial correlate ofincreased levels of physical activity, but the association is not clear inchildren and adolescents (CDC, 1997).
Social Environment Correlates
The social environment in which children live strongly influences theirhealth behaviors in general and levels of physical activity in particular, andthe primary social influences on young people are their family and peers.But although it is intuitively attractive to hypothesize that parents’ physical
464
298 PREVENTING CHILDHOOD OBESITY
activity behavior correlates with that of their children, research does notdefinitively support that hypothesis. Sallis and colleagues (2000), in a re-view of correlational studies, reported that parents’ physical activity had anindeterminate relationship to children’s physical activity. Kohl and Hobbs(1998), however, reported that children whose parents are physically activeare much more likely than other children to be physically active.
In any case, parents’ support for a child or adolescent’s physical activ-ity, and the perceptions of their parents’ physical activity behavior, doappear to be important correlates of physical activity in children and youth.Parental support can include a wide range of actions, from encouraging thechild or adolescent to try or to continue a new activity, to providing trans-portation to an activity class, to purchasing sports equipment.
Researchers have identified several family variables, including supportfor physical activity, mother’s perception of barriers to physical activity,and parental modeling of physical activity, to be associated with physicalactivity levels in fifth- and sixth-grade boys and girls (Stucky-Ropp andDiLorenzo, 1993; DiLorenzo et al., 1998). Trost and colleagues (1997,1999) found that perception of mother’s physical activity level was a corre-late of vigorous physical activity in fifth-grade girls and that active sixth-grade boys were more likely than nonactive boys to report that their moth-ers were physically active. Other studies have also identified family supportfor physical activity as a correlate of children’s physical activity (Sallis et al.,2000; Zakarian et al., 1994).
Although the focus of influence in adolescence shifts from family topeers, parents and other family members continue to influence teenagers’physical activity. In the studies reviewed by Sallis and colleagues (2000),parental support, direct help from parents in being physically active, andsiblings’ physical activity were consistently correlated with adolescents’physical activity. McGuire and colleagues (2002) found a significant, thoughmodest, relationship between parents’ reported encouragement and physi-cal activity levels in female adolescents of all racial and ethnic groups and inAfrican-American and white boys. In a population of inactive adolescentgirls, social support from parents, peers, and teachers was consistently andpositively associated with change in physical activity over time (Neumark-Sztainer et al., 2003b). Researchers did not find a clear positive correlationbetween parents’ reported physical activity behaviors and those of theirteenage children (McGuire et al., 2002).
Although Schmitz and colleagues (2002) found that young adolescentswho received free or reduced-price lunches reported higher levels of physi-cal activity, most studies report a positive correlation between parents’education and socioeconomic status (SES) and children’s physical activity(Pate et al., 1996; Gordon-Larsen et al., 2000). Parents who have the timeand resources to participate in physical activity themselves may be better
465

HOME 299
able to encourage their children to do likewise, and they are more apt tohave the resources to enroll their children in sporting activities and providesports equipment and the associated transport (Koivisto et al., 1994; Salliset al., 1999). Researchers have identified other barriers faced by low-income families with regard to healthful physical activity behaviors, includ-ing a lack of safe places for physical activity (AAP, 2003).
Physical Environment Correlates
As discussed in Chapters 6 and 7 on communities and schools, there aremany factors—including safety and access to physical activity opportuni-ties—that play important roles in determining when, where, and how chil-dren engage in physical activity. One of the strongest correlates of physicalactivity in children is the amount of time spent outside (Klesges et al., 1990;Baranowski et al., 1993; Sallis et al., 1993). In most homes, after all, thereare limited options for physical activity inside the home, and it is outdoorswhere children are generally more physically active and where more energyis expended.
Family-Based Interventions
A recent comprehensive review of physical activity interventions identi-fied 11 studies that were family-based and met the methodological criteriaof the Task Force on Community Preventive Services (Kahn et al., 2002).Most of these interventions were implemented as parts of multicomponentschool-based studies such as the Child and Adolescent Trial for Cardiovas-cular Health (described in Chapter 7) and generally involved parent-childactivities that were completed at home (Johnson CC et al., 1991; Hopper etal., 1992, 1996; Davis et al., 1995; Edmundson et al., 1996; Sallis et al.,1997; Manios et al., 1999). Four other family-based studies (Nader et al.,1983, 1989; Bishop and Donnelly, 1987; Baranowski et al., 1990) exam-ined interventions to educate families on nutrition and physical activitythrough sessions at community centers or schools. The interventions thatwere part of a school-based program were marginally more effective inincreasing physical activity or improving indicators of cardiovascular fit-ness, but it was not possible to differentiate the effects of the family inter-vention from those of the other study components. In another study, Taggartand colleagues (1986) demonstrated that a program that used parent train-ing and family contracting increased physical activity in children with lowfitness levels.
More remains to be learned about developmentally appropriate inter-ventions to encourage physical activity, as well as about the changes in thenature and duration of physical activity throughout childhood and adoles-
466

300 PREVENTING CHILDHOOD OBESITY
cence. The development of better tools for measuring physical activity willhelp to eliminate some of the inconsistencies found in the data and is animportant research need. It is also important to learn more about the fac-tors during childhood and adolescence that foster lifelong habits of dailyphysical activity.
Promoting Physical Activity
Parents should promote physical activity by supporting and encourag-ing children and youth to be active and play outdoors and participate inopportunities for physical activity. This may increase the time that parentsspend outdoors interacting with their children or ensuring their safety orgoing with their children to the park, playground, gymnasium, or otherappropriate location for physical activity. The ancillary benefits of physicalactivity and outdoor play and interaction are numerous. For children, youth,and parents, the time spent interacting outdoors increases opportunities forsocial contact, nurturing, bonding, and maturational guidance. In someresidential areas, where safety is such a concern that parents cannot let theirchildren play outside the home, there is a particular need for the communityto develop and foster opportunities for outside play—including parks, play-grounds, and recreational facilities (see Chapter 6).
There are numerous ways in which parents can help to increase theirchild’s or adolescent’s physical activity levels by supporting and engaging ina range of recreational or utilitarian (e.g., walking to the grocery store)activities that may promote lifelong habits of regular physical activity (ShapeUp America, 2004). Examples include:
• Walking or bicycling (with proper safety measures including hel-mets) to run errands or as a regular means of transport
• Encouraging and monitoring outdoor play• Assessing the community for opportunities for physical activity
and supporting participation by the child and family (e.g., parks, baseballfields, soccer fields, lakes, pools, gyms, community and youth programs,recreational leagues, and camps)
• Engaging in family outings and vacations that are centered aroundphysical activity
• Giving gifts (e.g., jump ropes, balls, sports equipment) that encour-age activity.
Not every parent has the skills to coach a child in a particular physicalactivity, but parents can still function as “cheerleaders” for their child andadolescent. This type of emotional support is not only meaningful andrewarding to the child but also may encourage still more physical activity.
467
HOME 301
Furthermore, parents can be effective advocates in their schools and com-munities for increased recess, physical education, recreational facilities, play-grounds, parks, and sidewalks.
It is also important for parents, children, and youth to take advantageof the opportunities for physical activity that come along throughout theday and to realize that not all physical activity has to be a planned event.Examples include walking to do errands or having children walk at thegrocery store or mall rather than ride in shopping carts or strollers.
DECREASING INACTIVITY
A complementary strategy for promoting physical activity among chil-dren and youth is to decrease their inactivity. Of the sedentary behaviorsthat may be linked to the upsurge in childhood obesity, television watchinghas been most widely studied. Other types of screen time (such as computeruse and video game playing) have not been researched as extensively withregard to obesity, though they share many similarities in principle; variouscombinations, in fact, are often examined along with television in studies ofmedia use and obesity. One study found that the time spent watchingtelevision, taped television shows, or commercial videos averaged per day:2.5 hours for children between the ages of 2 and 7, 4.5 hours for 8- to 13-year-olds, and 3.3 hours for 14- to 18-year-olds (Roberts et al., 1999). The2003 Youth Risk Behavior Surveillance nationwide survey found that 38.2percent of high school students reported watching television three hours orlonger on an average school day; 67.2 percent of African-American stu-dents, 45.9 percent of Hispanic students, and 29.3 percent of white stu-dents reported three or more hours of television viewing (CDC, 2004c).
Television viewing may have a negative effect on both sides of theenergy balance equation. It may displace active play and physical activitytime, and it is associated with increased food and calorie intake—as anaccompaniment of television viewing, as a result of food advertising, orboth (Robinson, 2001a). Many epidemiological studies have found positiveassociations between increased prevalence of obesity or overweight andgreater lengths of television viewing time, although comparing the results isdifficult due to differences in methods and reporting (reviewed by Robinson,2001b). Gortmaker and colleagues (1996) found a strong positive associa-tion between parent or child reports of children’s television watching timeand prevalence of obesity. This study of 746 children and youths (ages 10to 15 years) found that those who watched more than five hours of televi-sion per day were 4.6 times as likely to be obese as those watching zero totwo hours. This observation held when adjusted for maternal overweight,SES, and other factors.
Similarly, Crespo and colleagues (2001) found that in a sample of
468

302 PREVENTING CHILDHOOD OBESITY
4,069 children and adolescents aged 8 to 16 years, the prevalence of obesitywas highest for those watching four or more hours of television a day andlowest among those watching one hour or less. Other studies have reportedassociations that were not statistically significant, but all have generallyfound associations of similar magnitude (reviewed by Robinson, 2001b).Dennison and colleagues (2002) found in a cross-sectional survey that chil-dren with televisions in their bedrooms spent an additional 4.6 hours perweek watching television or videos. Furthermore, the investigators observedthat the prevalence of BMIs greater than the 85th percentile was higher inchildren with a television in their bedroom than in those without one.
In attempting to determine how television viewing may promote child-hood obesity, studies have examined the advertising of foods (particularlyhigh-calorie, high-fat, or high-sugar foods and beverages), eating whilewatching television, decreased physical activity levels while viewing televi-sion, and the potential for physical activity that is lost due to time spentwatching. An analysis of commercial advertising during children’s pro-gramming time (Saturday morning television, in this study) found thatmore than half of the commercials (56.5 percent) were for food (Kotz andStory, 1994). A recent review of the literature on food advertising to chil-dren found that the four primary categories of food items advertised arebreakfast cereals, snacks, candy, and soft drinks (Hastings et al., 2003).Additionally, the authors found a recent trend towards increased advertis-ing by fast food restaurants. Research has shown that television advertisinginfluences children’s food knowledge, choices, and consumption of particu-lar food products, as well as influencing purchase-related behavior andpurchasing decisions (Gorn and Goldberg, 1982; Hastings et al., 2003).
Also, as noted earlier in this chapter, watching television during meal-time is associated with decreased intake of fruits and vegetables and in-creased consumption of soft drinks, salty snacks, pizza, and red meat (Coonet al., 2001). Children report consuming a large proportion of their dailycalories while watching television, although there has not been evidence todate that the types or energy densities of foods that children eat whilewatching television differ significantly from those eaten when not watching(Matheson et al., 2004).
Studies of the nature and extent of associations between increasedtelevision viewing and decreased physical activity have produced inconsis-tent findings—possibly due, in part, to the known limitations of self- andparent-reporting on how children spend their time (Robinson, 2001b). Areview by Sallis and colleagues (2000) noted that studies of children ages 4to 12 had mixed results regarding the associations of sedentary behaviors(specifically, watching television and playing video games) with extent ofphysical activity, while in teenagers ages 13 to 18, there appeared to be noassociation. In one study of 191 3- to 4-year-olds that used direct observa-
469

HOME 303
tions of physical activity and television watching, physical activity levelswere lowest during the longest periods of television watching (DuRant etal., 1994). In a study of sixth- and seventh-grade-girls, more hours oftelevision watching was significantly but weakly associated with less re-ported physical activity (Robinson et al., 1993). Additionally, one experi-mental study of 13 8- to 12-year-old nonobese children did not find signifi-cant changes in short-term physical activity or energy expenditure whensedentary behavior (including television viewing) was decreased by 50 per-cent from baseline (Epstein et al., 2002). Natural experiments have foundsome evidence that introduction of television into communities where it didnot exist previously does displace other more physical activities (Brown etal., 1974; Williams and Hanford, 1986). Thus, although a link betweenmore screen time and less physical activity has face validity, clarification ofthis relationship must await the results of additional experimental studieswith more objective measures.
Other factors that have been considered in the association of sedentarybehaviors and obesity include computer use and video game play, parentalpatterns of sedentary behavior, parental monitoring of television viewinghours, and neighborhood characteristics such as safety of the area for out-side play (Davison and Birch, 2001). Research has also been conducted toexamine the possibility that television watching is associated with a de-crease in children’s metabolic rates, but results from those studies have beenmixed (Klesges et al., 1993; Dietz et al., 1994; Buchowski and Sun, 1996).
A few family-based interventions have focused on reducing sedentarybehaviors, particularly television watching, to influence eating and activitypatterns, and ultimately to produce weight loss. Early results from thesestudies have shown promise, but are still too preliminary for making con-clusions about their efficacy (Robinson et al., 2003). Indirect evidence sup-porting this approach, however, has come from two studies by Epstein andcolleagues (1995, 2000) that tested the effect of reducing sedentary behav-iors as part of an intensive, family-based weight-loss program for childrenwho were already overweight. The program showed effects on weight lossthat were at least comparable to efforts that targeted increasing physicalactivity directly or targeted the combination of decreasing sedentary behav-ior and increasing physical activity. This study demonstrates the validity oftargeting decreased inactivity as a potentially effective strategy that is dis-tinct from strategies seeking to increase physical activity.
Of most direct relevance to recommendations for preventing obesityare experimental studies showing that reducing the amount of televisionviewing and other sedentary behaviors reduces weight gain and prevalenceof obesity both among population-based samples of children and adoles-cents (Gortmaker et al., 1999; Robinson, 1999) and groups of overweightchildren (Epstein et al., 1995). From a primary prevention perspective, two
470

304 PREVENTING CHILDHOOD OBESITY
school-based interventions with population-based samples of children andadolescents demonstrated that reductions in screen time, whether alone(Robinson, 1999) or as part of a more comprehensive obesity preventionprogram (Gortmaker et al., 1999), resulted in decreased gain in BMI andbody fatness and reduced prevalence of obesity.
Although the specific mechanism(s) of how reducing television viewinginfluences weight gain is, as yet, undetermined, these demonstrated effectson reduced weight gain and obesity provide sufficient rationale for therecommendation to reduce children’s screen time. The committee concludesthat reducing children’s and youth’s screen time is an important popula-tion-based strategy for preventing obesity in children and youth, and that atime-limit recommendation would be most useful to parents, policy mak-ers, and child health and education advocates and professionals. The com-mittee notes that there are many ancillary reasons for recommending limitson children’s television viewing time (despite the demonstrated benefits ofsome media content). The American Academy of Pediatrics has recom-mended that televisions not be placed in children’s bedrooms, and it urgesparents to limit their children’s television viewing time to no more than oneto two hours of quality programming per day; it also recommends thattelevision viewing among children younger than 2 years be discouragedaltogether (AAP, 2001). Many other child and health advocacy organiza-tions and agencies have made comparable recommendations for reductionsin television and other screen viewing time for a variety of reasons includingviolent media content (APA and AAP, 1995; AMA, 1996; NEA, 1999;DHHS, 2000; AACAP, 2001; National PTA, 2001).
The committee recommends that parents should limit their children’stelevision viewing and recreational screen time to less than two hours perday. This specific time limit is derived from the evidence provided by thetwo school-based primary prevention intervention studies that demonstratedreductions in body weight, body fat, and prevalence of obesity. The inter-ventions in those trials set goals to limit television, videotape, and videogame use to no more than seven hours per week (Robinson, 1999) and tolimit television viewing to less than two hours in any one day (Gortmaker etal., 1999). (It should be noted that a key word here is “recreational.” Thecommittee’s recommendation does not preclude the use of computers andother media for educational purposes.)
An important part of parenting involves monitoring children’s behav-iors and setting and enforcing limits on those behaviors. Such family poli-cies should be set for a variety of reasons, including the protection of youngchildren (e.g., keeping them from playing in the street) and assurance oftheir healthy development. Naturally, there is great variation in the natureand extent to which parents set limits and how those limits change as thechild matures. One challenge for parents of older children is knowing how
471

HOME 305
to involve them in decision-making so that they learn to apply limits forthemselves; they should come to realize, for example, that they are respon-sible for their own health and need to practice health-promoting behaviors.But in the current food and activity environment—where palatable, energy-dense, and inexpensive foods are readily available and opportunities forsedentary behaviors are abundant—a degree of parental monitoring andlimit setting is still needed to support eating and physical activity patternsthat can maintain children’s energy balance at a healthy weight.
PARENTS AS ROLE MODELS
Parents’ eating behaviors can serve as models for children’s behavior(Fisher and Birch, 1995; Cutting et al., 1999). Such models, however, canbe either positive or negative. The current epidemic of adult obesity and theepidemiological data on adults’ dietary and physical activity patterns sug-gest cause for concern (CDC, 2004a,b). But the public’s growing awarenessof the obesity epidemic and of the health consequences of obesity, in chil-dren and adults alike, may change these patterns. When parents adopt ahealthier lifestyle, they may foster the development of healthful behaviorsand patterns in their children, in addition to positively affecting their ownwell-being. Researchers have provided evidence that modeling and enhancedfamiliarity have independent significant effects on food intake (Cullen etal., 2000, 2003). With respect to physical activity, the provision of instru-mental support for children’s sports participation is associated with greaterlevels of physical activity among children (Davison et al., 2003).
Parents who consume fruits and vegetables, for example, have childrenwho do the same (Cullen et al., 2001; Nicklas et al., 2001; Fisher et al.,2002). Comparable patterns are seen with milk intake, at least for mothersand daughters (Fisher et al., 2001). Similarly, parents who display theirmastery of portion control can provide positive influences. Hill and col-leagues have reported that mothers who diet or are restrained eaters tend tohave daughters who show the same kinds of patterns (Hill et al., 1990; Pikeand Rodin, 1991). Abramovitz and Birch (2000) found that mothers’ diet-ing is the best predictor of their 5-year-old daughters’ knowledge of dieting.Cutting and colleagues (1999) showed that familial similarities in mothers’and daughters’ overweight status are mediated by similarities in“disinhibited overeating” (overeating in the absence of hunger).
As discussed earlier in this chapter, parents who are supportive ofphysical activity have children who are more physically active (Sallis et al.,1988; Davison et al., 2003). However, evidence for a direct effect of parentmodeling on youth physical activity is inconsistent at best. This is in con-trast to the stronger evidence for modeling regarding eating patterns. Thediscrepant findings may be explained by different mediators. If parents are
472

306 PREVENTING CHILDHOOD OBESITY
eating fruits and vegetables and drinking milk, it means those foods arereadily available to the child. However, parents often engage in differenttypes of physical activities than children or in different settings, so theparent going to a health club or on a run may not facilitate the child’sphysical activity and could serve as a barrier.
Researchers have compared the effects of different families’ eating andactivity patterns on their children. Families can be categorized as either“obesogenic,” where physical activity is relatively low and energy and fatintakes are high, or nonobesogenic, where parents show higher levels ofactivity and lower energy intakes. For example, in one study, girls living inobesogenic families gained more weight from age 5 to 7 than girls fromnonobesogenic families, and the former were more likely to be overweightat age 7 (Davison and Birch, 2002). These effects were mediated by simi-larities in mother-daughter eating patterns and father-daughter physicalactivity patterns, suggesting that while mothers were effective models fordaughters’ eating habits, fathers’ levels of physical activity influenced theirdaughters in that area.
It is not known to what extent the observed effects of modeling reflectmodeling per se or result simply from the fact that parents either do or donot establish routine access to healthful options so that these options arefamiliar to their children. That is, parents who eat a healthful diet and areactive typically provide access to healthful food and opportunities for physi-cal activity for their children as well. As discussed in Chapter 3, guidanceregarding a balanced diet and regular physical activity is available throughthe Dietary Guidelines for Americans.
Parents should provide positive role models of eating and physicalactivity behaviors for their children. The committee urges parents to bepositive role models for their children by decreasing the amount of timethey engage in sedentary activities such as watching TV, increasing theamount of time they engage in physical activity each day, and modelingeating habits that include balance and variety in their food choices andportion control.
RAISING AWARENESS OF WEIGHT AS A HEALTH ISSUE
It is critically important that parents view childhood obesity as a healthissue and realize that obesity can have a deleterious impact on physical aswell as mental health, both during childhood and later in life. Yet parents ofoverweight or obese children do not always recognize their child’s weightstatus and many are not fully aware of its adverse consequences (Young-Hyman et al., 2000; Etelson et al., 2003; Maynard et al., 2003).
Because children often exhibit idiosyncratic growth patterns, it is im-portant to evaluate a child within the context of his or her own particular
473

HOME 307
growth history as well as relative to a healthy and appropriate referencepopulation. For individuals under 20 years of age, BMI is a complex con-cept; not only do weight and height change as the body grows, but body-fatcontent and muscular development are also changing, and there are signifi-cant gender differences in the pattern of change. Thus it is important to usegender- and age-specific BMI percentiles to determine whether a particularchild has excess weight.
During infancy, parents tend to be well aware of their child’s weightand height, and it is not unusual for them to know where his or hermeasurements fall on the health-care provider’s growth curves, which arederived from reference populations of healthy children of the same age andsex. However, as children grow, and particularly in the late elementary andmiddle- and high school years, this information often is not familiar toparents—unless they think their child is failing to grow, which may sensi-tize them to the need for careful monitoring and tracking. Parents may alsonotice particular periods of height change, as when the child rapidly out-grows his or her clothes. Because of the variable timing of growth spurts,and the sometimes dramatic changes in body composition with age, contin-ued monitoring of growth on an annual basis is warranted; if concerns ariseabout the child’s growth trajectory, parents should then discuss these issueswith a qualified health-care professional.
Routine determination of children’s BMI percentile, and regular com-munication between parents and health-care providers regarding theirchild’s BMI-percentile history and current status, are crucial to increasingthe knowledge base of parents regarding their child’s growth pattern andweight status. Parents also need to be aware of the strong connectionbetween good nutrition and physical activity to the child’s weight—and tohis or her health. If excessive weight gain is observed, it is important forparents to discuss follow-up steps and behavior changes with their child’shealth-care provider (see Chapter 6). These discussions should be sensitiveto parental concerns about the stigma of obesity and its potential impact onthe child’s self-esteem and should take care to allay concerns about eatingdisorders (Borra et al., 2003).
Just as vaccination schedules require parental intervention during child-hood, parents should be discussing the prevention of obesity with theirhealth-care providers to make sure that the child is on a healthy growthtrack. Parents should consider the weight of their children to be a criticallyimportant indicator of health. They should ensure that a trained profes-sional routinely (at least once a year) measures their child’s height andweight in order to track his or her age- and gender-specific BMI percentile.
But given that many families do not have the health insurance to coverpreventive services, and these types of health-care visits may therefore im-pose a financial burden, the committee also recommends (in Chapter 7)
474

308 PREVENTING CHILDHOOD OBESITY
that schools conduct periodic assessments of students’ weight status andprovide the resulting information to parents—and to the children them-selves, as age-appropriate.
RECOMMENDATION
Home environments that support healthful eating and physical activityare important in helping children maintain energy balance at a healthyweight. Preventing childhood obesity starts with a healthful diet and lifestyleat conception and throughout pregnancy and is promoted by exclusivebreastfeeding during infancy. As discussed throughout this chapter, parentscan ensure that healthful foods are available in the home and that healthfuleating behaviors (e.g., family meals, limited snacking, and portion control)are promoted. Older children and youth must be aware of their own eatinghabits and activity patterns and engage in health-promoting behaviors. Bybeing supportive of their children’s athletic and other interests in physicalactivity and by encouraging children to play outside, parents can enhanceopportunities for moderate to vigorous physical activity and promote physi-cal fitness. Furthermore, parents can set a good example for their childrenby modeling healthful eating behaviors and being physically active. Parentscan also be effective advocates by becoming involved in efforts in theirneighborhoods, schools, and community to improve neighborhood safetyand to expand the access and availability of opportunities such as recre-ational facilities, playgrounds, sidewalks, bike paths, and farmers’ markets(Chapters 6 and 7).
Recommendation 10: HomeParents should promote healthful eating behaviors and regular physicalactivity for their children.
To implement this recommendation parents can:
• Choose exclusive breastfeeding as the method for feeding in-fants for the first four to six months of life
• Provide healthful food and beverage choices for children bycarefully considering nutrient quality and energy density
• Assist and educate children in making healthful decisions re-garding types of foods and beverages to consume, how often, and inwhat portion size
• Encourage and support regular physical activity• Limit children’s television viewing and other recreational screen
time to less than two hours per day
475

HOME 309
• Discuss weight status with their child’s health-care providerand monitor age- and gender-specific BMI percentile
• Serve as positive role models for their children regarding eatingand physical activity behaviors
REFERENCES
AACAP (American Academy of Child and Adolescent Psychiatry). 2001. Children and Watch-ing TV. Facts for Families, No. 54. [Online]. Available: http://www.aacap.org/publica-tions/factsfam/tv.htm [accessed June 7, 2004].
AAP (American Academy of Pediatrics). 2001. Children, adolescents, and television. Pediat-rics 107(2):423-426.
AAP. 2003. Prevention of pediatric overweight and obesity. Pediatrics 112(2):424-430.AAP. 2004. Pediatric Nutrition Handbook. 5th ed. Washington, DC: AAP.Abramovitz BA, Birch LL. 2000. Five-year-old girls’ ideas about dieting are predicted by their
mothers’ dieting. J Am Diet Assoc 100(10):1157-1163.ADA (American Dietetic Association). 2004. Position of the American Dietetic Association:
Dietary guidance for healthy children ages 2 to 11 years. J Am Diet Assoc 104(4):660-677.
AMA (American Medical Association). 1996. Physician Guide to Media Violence. Chicago,IL: AMA.
APA (American Psychological Association), AAP (American Academy of Pediatrics). 1995.Raising Children to Resist Violence: What You Can Do. Washington, DC: APA andAAP.
Baranowski T, Simons-Morton B, Hooks P, Henske J, Tiernan K, Dunn JK, Burkhalter H,Harper J, Palmer J. 1990. A center-based program for exercise change among black-American families. Health Educ Q 17(2):179-196.
Baranowski T, Thompson WO, DuRant RH, Baranowski J, Puhl J. 1993. Observations onphysical activity in physical locations: Age, gender, ethnicity, and month effects. Res QExerc Sport 64(2):127-133.
Baranowski T, Davis M, Resnicow K, Baranowski J, Doyle C, Lin LS, Smith M, Wang DT.2000. Gimme 5 fruit, juice, and vegetables for fun and health: Outcome evaluation.Health Educ Behav 27(1):96-111.
Beauchamp GK, Cowart BJ. 1985. Congenital and experiential factors in the development ofhuman flavor preferences. Appetite 6(4):357-372.
Bergmann KE, Bergmann RL, von Kries R, Bohm O, Richter R, Dudenhausen JW, Wahn U.2003. Early determinants of childhood overweight and adiposity in a birth cohort study:Role of breast-feeding. Int J Obes Relat Metab Disord 27(2):162-172.
Birch LL. 1981. Generalization of a modified food preference. Child Dev 52:755-758.Birch LL. 1999. Development of food preferences. Annu Rev Nutr 19:41-62.Birch LL, Marlin DW. 1982. I don’t like it; I never tried it: Effects of exposure on two-year-
old children’s food preferences. Appetite 3(4):353-360.Birch LL, Zimmerman S, Hind H. 1980. The influence of social-affective context on pre-
school children’s food preferences. Child Dev 51:856-861.Birch LL, McPhee L, Shoba BC, Pirok E, Steinberg L. 1987. What kind of exposure reduces
children’s food neophobia? Looking vs. tasting. Appetite 9(3):171-178.Bishop P, Donnelly JE. 1987. Home based activity program for obese children. Am Correct
Ther J 41(1):12-19.Bogen DL, Hanusa BH, Whitaker RC. 2004. The effect of breast-feeding with and without
concurrent formula use on the risk of obesity at 4 years of age. Obes Res 12:1528-1536.
476
310 PREVENTING CHILDHOOD OBESITY
Borra ST, Kelly L, Shirreffs MB, Neville K, Geiger CJ. 2003. Developing health messages:Qualitative studies with children, parents, and teachers help identify communicationsopportunities for healthful lifestyles and the prevention of obesity. J Am Diet Assoc103(6):721-728.
Brown JR, Cramond JK, Wilde RJ. 1974. Displacment effects of television and the child’sfunctional orientation to the media. In: Blumler JG, Katz E, eds. The Uses of MassCommunications: Current Perspectives on Gratifications Research. Beverly Hills, CA:Sage Publications. Pp. 93-112.
Buchowski MS, Sun M. 1996. Energy expenditure, television viewing and obesity. Int J Obes20(3):236-244.
Butcher JE, Eaton WO. 1989. Gross motor proficiency in preschoolers: Relationships withfree play behavior and activity level. J Hum Movement Stud 16:27-36.
Cavadini C, Siega-Riz AM, Popkin BM. 2000. US adolescent food intake trends from 1965 to1996. Arch Dis Child 83(1):18-24.
CDC (Centers for Disease Control and Prevention). 1997. Guidelines for school and commu-nity programs to promote lifelong physical activity among young people. MMWRRecomm Rep 46(RR-6):1-36.
CDC. 2004a. Prevalence of no leisure-time physical activity—35 states and the District ofColumbia, 1988-2002. MMWR 53(4):82-86.
CDC. 2004b. Trends in intake of energy and macronutrients—United States, 1971-2000.MMWR 53(4):80-82.
CDC. 2004c. Youth risk behavior surveillance—United States, 2003. MMWR Surveill Summ53(SS-2):1-96.
Coates TJ, Killen JD, Slinkard LA. 1982. Parent participation in a treatment program foroverweight adolescents. Int J Eat Disord 1(3):37-48.
Coon KA, Goldberg J, Rogers BL, Tucker KL. 2001. Relationships between use of televisionduring meals and children’s food consumption patterns. Pediatrics 107(1):E7.
Cowart BJ. 1981. Development of taste perception in humans: Sensitivity and preferencethroughout the life span. Psychol Bull 90:43-73.
Crespo CJ, Smit E, Troiano RP, Bartlett SJ, Macera CA, Andersen RE. 2001. Televisionwatching, energy intake, and obesity in US children: Results from the third NationalHealth and Nutrition Examination Survey, 1988-1994. Arch Pediatr Adolesc Med155(3):360-365.
Cullen KW, Baranowski T, Rittenberry L, Olvera N. 2000. Social-environmental influenceson children’s diets: Results from focus groups with African-, Euro- and Mexican-Ameri-can children and their parents. Health Educ Res 15(5):581-590.
Cullen KW, Baranowski T, Rittenberry L, Cosart C, Hebert D, de Moor C. 2001. Child-reported family and peer influences on fruit, juice and vegetable consumption: Reliabil-ity and validity of measures. Health Educ Res 16(2):187-200.
Cullen KW, Baranowski T, Owens E, Marsh T, Rittenberry L, de Moor C. 2003. Availability,accessibility, and preferences for fruit, 100% fruit juice, and vegetables influencechildren’s dietary behavior. Health Educ Behav 30(5):615-626.
Cutting TM, Fisher JO, Grimm-Thomas K, Birch LL. 1999. Like mother, like daughter:Familial patterns of overweight are mediated by mothers’ dietary disinhibition. Am JClin Nutr 69(4):608-613.
Davis SM, Lambert LC, Gomez Y, Skipper B. 1995. Southwest Cardiovascular CurriculumProject: Study findings for American Indian elementary students. J Health Educ26(Suppl):S72-S81.
Davison KK, Birch LL. 2001. Childhood overweight: A contextual model and recommenda-tions for future research. Obes Rev 2(3):159-171.
477

HOME 311
Davison KK, Birch LL. 2002. Obesigenic families: Parents’ physical activity and dietary in-take patterns predict girls’ risk of overweight. Int J Obes Relat Metab Disord 26(9):1186-1193.
Davison KK, Cutting TM, Birch LL. 2003. Parents’ activity-related parenting practices pre-dict girls’ physical activity. Med Sci Sports Exerc 35(9):1589-1595.
Dennison BA, Erb TA, Jenkins PL. 2002. Television viewing and television in bedroom asso-ciated with overweight risk among low-income preschool children. Pediatrics109(6):1028-1035.
Devine CM, Connors MM, Sobal J, Bisogni CA. 2003. Sandwiching it in: Spillover of workonto food choices and family roles in low- and moderate-income urban households. SocSci Med 56(3):617-630.
Dewey KG. 2003. Is breastfeeding protective against child obesity? J Hum Lact 19(1):9-18.DHHS (U.S. Department of Health and Human Services). 1996. Physical Activity and Health:
A Report of the Surgeon General. Atlanta, GA: CDC.DHHS, Agency for Health Care Policy and Research. 2000. Child Health Guide: Put Preven-
tion into Practice. Rockville, MD: Agency for Health Care Policy and Research. [Online].Available: http://www.ahrq.gov/ppip/childguide/ [accessed June 10, 2004].
Dietz WH, Bandini LG, Morelli JA, Peers KF, Ching PL. 1994. Effect of sedentary activitieson resting metabolic rate. Am J Clin Nutr 59(3):556-559.
Diliberti N, Bordi PL, Conklin MT, Roe LS, Rolls BJ. 2004. Increased portion size leads toincreased energy intake in a restaurant meal. Obes Res 12(3):562-568.
DiLorenzo TM, Stucky-Ropp RC, Vander Wal JS, Gotham HJ. 1998. Determinants of exer-cise among children. II. A longitudinal analysis. Prev Med 27(3):470-477.
DuRant RH, Baranowski T, Johnson M, Thompson WO. 1994. The relationship amongtelevision watching, physical activity, and body composition of young children. Pediat-rics 94(4 Pt 1):449-455.
Edmundson E, Parcel GS, Feldman HA, Elder J, Perry CL, Johnson CC, Williston BJ, StoneEJ, Yang M, Lytle L, Webber L. 1996. The effects of the Child and Adolescent Trial forCardiovascular Health upon psychosocial determinants of diet and physical activitybehavior. Prev Med 25(4):442-454.
Epstein LH, Valoski A, Wing RR, McCurley J. 1990. Ten-year follow-up of behavioral,family-based treatment for obese children. J Am Med Assoc 264(19):2519-2523.
Epstein LH, Valoski A, Wing RR, McCurley J. 1994. Ten-year outcomes of behavioral fam-ily-based treatment for childhood obesity. Health Psychol 13(5):373-383.
Epstein LH, Valoski AM, Vara LS, McCurley J, Wisniewski L, Kalarchian MA, Klein KR,Shrager LR. 1995. Effects of decreasing sedentary behavior and increasing activity onweight change in obese children. Health Psychol 14(2):109-115.
Epstein LH, Paluch RA, Gordy CC, Dorn J. 2000. Decreasing sedentary behaviors in treatingpediatric obesity. Arch Pediatr Adolesc Med 154(3):220-226.
Epstein LH, Paluch RA, Consalvi A, Riordan K, Scholl T. 2002. Effects of manipulatingsedentary behavior on physical activity and food intake. J Pediatr 140(3):334-339.
Etelson D, Brand DA, Patrick PA, Shirali A. 2003. Childhood obesity: Do parents recognizethis health risk? Obes Res 11(11):1362-1368.
Fields J. 2003. Children’s Living Arrangements and Characteristics: March 2002. CurrentPopulation Reports. Washington, DC: U.S. Census Bureau.
Fisher JO, Birch LL. 1995. Fat preferences and fat consumption of 3- to 5-year-old childrenare related to parental adiposity. J Am Diet Assoc 95(7):759-764.
Fisher JO, Birch LL. 1999. Restricting access to foods and children’s eating. Appetite32(3):405-419.
478

312 PREVENTING CHILDHOOD OBESITY
Fisher JO, Birch LL, Smiciklas-Wright H, Picciano MF. 2000. Breast-feeding through the firstyear predicts maternal control in feeding and subsequent toddler energy intakes. J AmDiet Assoc 100(6):641-646.
Fisher JO, Mitchell DC, Smiciklas-Wright H, Birch LL. 2001. Maternal milk consumptionpredicts the tradeoff between milk and soft drinks in young girls’ diets. J Nutr131(2):246-250.
Fisher JO, Mitchell DC, Smiciklas-Wright H, Birch LL. 2002. Parental influences on younggirls’ fruit and vegetable, micronutrient, and fat intakes. J Am Diet Assoc 102(1):58-64.
Fomon SJ, Filer LJ, Thomas LN, Anderson TA, Nelson SE. 1975. Influence of formula con-centration on caloric intake and growth of normal infants. Acta Paediatr Scand64(2):172-181.
Forshee RA, Storey ML. 2003. Total beverage consumption and beverage choices amongchildren and adolescents. Int J Food Sci Nutr 54(4):297-307.
Fox MK, Pac S, Devaney B, Jankowski L. 2004. Feeding infants and toddlers study: Whatfoods are infants and toddlers eating? J Am Diet Assoc 104(1 Suppl 1):S22-S30.
French SA, Lin BH, Guthrie JF. 2003. National trends in soft drink consumption amongchildren and adolescents age 6 to 17 years: Prevalence, amounts, and sources, 1977/1978 to 1994/1998. J Am Diet Assoc 103(10):1326-1331.
French SA, Hannan PJ, Story M. 2004. School soft drink intervention study. Br Med J329(7462):E315-E316.
Galst J, White M. 1976. The unhealthy persuader: The reinforcing value of television andchildren’s purchase influencing attempts at the supermarket. Child Dev 47:1089-1096.
Gillman MW, Rifas-Shiman SL, Frazier AL, Rockett HR, Camargo CA Jr, Field AE, BerkeyCS, Colditz GA. 2000. Family dinner and diet quality among older children and adoles-cents. Arch Fam Med 9(3):235-240.
Gillman MW, Rifas-Shiman S, Berkey CS, Field AE, Colditz GA. 2003. Maternal gestationaldiabetes, birth weight, and adolescent obesity. Pediatrics 111(3):e221-e226.
Gleason P, Suitor C. 2001. Children’s Diets in the Mid-1990’s: Dietary Intake and Its Rela-tionship with School Meal Participation. Report No. CN-01-CD1. Alexandria, VA:USDA.
Golan M, Crow S. 2004. Targeting parents exclusively in the treatment of childhood obesity:Long-term results. Obes Res 12(2):357-361.
Golan M, Weizman A, Apter A, Fainaru M. 1998. Parents as the exclusive agents of changein the treatment of childhood obesity. Am J Clin Nutr 67(6):1130-1135.
Goran MI, Reynolds KD, Lindquist CH. 1999. Role of physical activity in the prevention ofobesity in children. Int J Obes Relat Metab Disord 23(Suppl 3):S18-S33.
Gordon-Larsen P, McMurray RG, Popkin BM. 2000. Determinants of adolescent physicalactivity and inactivity patterns. Pediatrics 105(6):E83.
Gorn GJ, Goldberg ME. 1982. Behavioral evidence for the effects of televised food messageson children. J Consumer Res 9:200-205.
Gortmaker SL, Must A, Sobol AM, Peterson K, Colditz GA, Dietz WH. 1996. Televisionviewing as a cause of increasing obesity among children in the United States, 1986-1990.Arch Pediatr Adolesc Med 150(4):356-362.
Gortmaker SL, Peterson K, Wiecha J, Sobol AM, Dixit S, Fox MK, Laird N. 1999. Reducingobesity via a school-based interdisciplinary intervention among youth: Planet Health.Arch Pediatr Adolesc Med 153(4):409-418.
Graber JA, Brooks-Gunn J. 1996. Prevention of eating problems and disorders: Includingparents. Eat Disord 4(4):348-363.
Grummer-Strawn LM, Mei Z. 2004. Does breastfeeding protect against pediatric overweight?Analysis of longitudinal data from the Centers for Disease Control and Prevention Pedi-atric Nutrition Surveillance System. Pediatrics 113(2):e81-e86.
479

HOME 313
Guthrie JF, Morton JF. 2000. Food sources of added sweeteners in the diets of Americans. JAm Diet Assoc 100(1):43-51.
Gutin B, Barbeau P, Yin Z. 2004. Exercise interventions for prevention of obesity and relateddisorders in youths. Quest 56:120-141.
Hastings G, Stead M, McDermott L, Forsyth A, MacKintosh A, Rayner, M, Godfrey C,Caraher M, Angus K. 2003. Review of Research on the Effects of Food Promotion toChildren. Glasgow, UK: Center for Social Marketing, University of Strathclyde. Avail-able: http://www.food.gov.uk/multimedia/pdfs/foodpromotiontochildren1.pdf [accessedNovember 22, 2003].
Hewlett SA, West C. 1998. The War Against Parents. New York: Houghton Mifflin.Hill AJ, Weaver C, Blundell JE. 1990. Dieting concerns of 10-year-old girls and their mothers.
Br J Clin Psychol 29(Pt 3):346-348.Hopper CA, Gruber MB, Munoz KD, Herb RA. 1992. Effect of including parents in a school-
based exercise and nutrition program for children. Res Q Exerc Sport 63(3):315-321.Hopper CA, Munoz KD, Gruber MB, MacConnie SE, Schonfeldt B, Shunk T. 1996. A school-
based cardiovascular exercise program with parent participation: An evaluation study.Child Health Care 25(3):221-235.
IOM (Institute of Medicine). 2002. Dietary Reference Intakes for Energy, Carbohydrate,Fiber, Fat, Fatty Acids, Cholesterol, Protein, and Amino Acids. Washington, DC: TheNational Academies Press.
James J, Thomas P, Cavan D, Kerr D. 2004. Preventing childhood obesity by reducing con-sumption of carbonated drinks: Cluster randomized controlled trial. Br Med J328(7450):1237.
Johnson CC, Nicklas TA, Arbeit ML, Harsha DW, Mott DS, Hunter SM, Wattigney W,Berenson GS. 1991. Cardiovascular intervention for high-risk families: The Heart SmartProgram. South Med J 84(11):1305-1312.
Johnson SL, McPhee L, Birch LL. 1991. Conditioned preferences: Young children preferflavors associated with high dietary fat. Physiol Behav 50(6):1245-1251.
Kahn EB, Ramsey LT, Brownson RC, Heath GW, Howze EH, Powell KE, Stone EJ, RajabMW, Corso P. 2002. The effectiveness of interventions to increase physical activity. Asystematic review. Am J Prev Med 22(4 Suppl):73-107.
Kirschenbaum DS, Harris ES, Tomarken AJ. 1984. Effects of parental involvement in behav-ioral weight loss therapy for preadolescents. Behav Ther 15(5):485-500.
Klesges RC, Eck LH, Hanson CL, Haddock CK, Klesges LM. 1990. Effects of obesity, socialinteractions, and physical environment on physical activity in preschoolers. HealthPsychol 9(4):435-449.
Klesges RC, Shelton ML, Klesges LM. 1993. Effects of television on metabolic rate: Potentialimplications for childhood obesity. Pediatrics 91(2):281-286.
Kohl HW, Hobbs KE. 1998. Development of physical activity behaviors among children andadolescents. Pediatrics 101(3 Pt 2):549-554.
Koivisto UK, Fellenius J, Sjoden PO. 1994. Relations between parental mealtime practicesand children’s food intake. Appetite 22(3):245-257.
Kotz K, Story M. 1994. Food advertisements during children’s Saturday morning televisionprogramming: Are they consistent with dietary recommendations? J Am Diet Assoc94(11):1296-1300.
Lederman SA, Akabas S, Moore BJ, Bentley ME, Devaney B, Gillman MW, Kramer MS,Mennella JA, Ness A, Wardle J. 2004. Summary of the presentations at the Conferenceon Preventing Childhood Obesity, December 8, 2003. Pediatrics 114:1146-1173.
Lindquist CH, Reynolds KD, Goran MI. 1999. Sociocultural determinants of physical activityamong children. Prev Med 29(4):305-312.
480

314 PREVENTING CHILDHOOD OBESITY
Lissau I, Sorensen TI. 1994. Parental neglect during childhood and increased risk of obesity inyoung adulthood. Lancet 343(8893):324-327.
Loewen R, Pliner P. 1999. Effects of prior exposure to palatable and unpalatable novel foodson children’s willingness to taste other novel foods. Appetite 32(3):351-366.
Ludwig DS, Peterson KE, Gortmaker SL. 2001. Relation between consumption of sugar-sweetened drinks and childhood obesity: A prospective, observational analysis. Lancet357(9255):505-508.
Manios Y, Moschandreas J, Hatzis C, Kafatos A. 1999. Evaluation of a health and nutritioneducation program in primary school children of Crete over a three-year period. PrevMed 28(2):149-159.
Matheson DM, Killen JD, Wang Y, Varady A, Robinson TN. 2004. Children’s food con-sumption during television viewing. Am J Clin Nutr 79(6):1088-1094.
Maynard LM, Galuska DA, Blanck HM, Serdula MK. 2003. Maternal perceptions of weightstatus of children. Pediatrics 111(5 Pt 2):1226-1231.
McConahy KL, Smiciklas-Wright H, Birch LL, Mitchell DC, Picciano MF. 2002. Food por-tions are positively related to energy intake and body weight in early childhood. J Pediatr140(3):340-347.
McGuire MT, Hannan PJ, Neumark-Sztainer D, Cossrow NH, Story M. 2002. Parentalcorrelates of physical activity in a racially/ethnically diverse adolescent sample. J AdolescHealth 30(4):253-261.
Mennella JA. 1995. Mother’s milk: A medium for early flavor experiences. J Hum Lact11(1):39-45.
Mennella JA, Beauchamp GK. 1991. Maternal diet alters the sensory qualities of human milkand the nursling’s behavior. Pediatrics 88(4):737-744.
Mennella JA, Beauchamp GK. 1998. Early flavor experiences: Research update. Nutr Rev56(7):205-211.
Mennella JA, Jagnow CP, Beauchamp GK. 2001. Prenatal and postnatal flavor learning byhuman infants. Pediatrics 107:E88.
Motl RW, Dishman RK, Ward DS, Saunders RP, Dowda M, Felton G, Pate RR. 2002.Examining social-cognitive determinants of intention and physical activity among blackand white adolescent girls using structural equation modeling. Health Psychol 21(5):459-467.
Nader PR, Baranowski T, Vanderpool NA, Dunn K, Dworkin R, Ray L. 1983. The FamilyHealth Project: Cardiovascular risk reduction education for children and parents. J DevBehav Pediatr 4(1):3-10.
Nader PR, Sallis JF, Patterson TL, Abramson IS, Rupp JW, Senn KL, Atkins CJ, Roppe BE,Morris JA, Wallace JP, Vega WA. 1989. A family approach to cardiovascular risk reduc-tion: Results from the San Diego Family Health Project. Health Educ Q 16(2):229-244.
National PTA (National Parent Teachers Association), Cable in the Classroom, NationalCable and Telecommunications Association. 2001. Taking Charge of Your TV: A Guideto Critical Viewing for Parents and Children. [Online]. Available: http://www.ciconline.com/Enrichment/MediaLiteracy/TakingCharge/ParentsGuide/default.htm[accessed July 6, 2004].
NEA (National Education Association). 1999. 52 Ways to Help Your Child Learn. Washing-ton, DC: NEA.
Nestle M. 2003. Increasing portion sizes in American diets: More calories, more obesity. JAm Diet Assoc 103(1):39-40.
Neumark-Sztainer D, Hannan PJ, Story M, Croll J, Perry C. 2003a. Family meal patterns:Associations with sociodemographic characteristics and improved dietary intake amongadolescents. J Am Diet Assoc 103(3):317-322.
481

HOME 315
Neumark-Sztainer D, Story M, Hannan PJ, Tharp T, Rex J. 2003b. Factors associated withchanges in physical activity: A cohort study of inactive adolescent girls. Arch PediatrAdolesc Med 157(8):803-810.
Nicklas TA, Baranowski T, Baranowski JC, Cullen K, Rittenberry L, Olvera N. 2001. Familyand child-care provider influences on preschool children’s fruit, juice, and vegetableconsumption. Nutr Rev 59(7):224-235.
Orlet-Fisher J, Rolls BJ, Birch LL. 2003. Children’s bite size and intake of an entree aregreater with large portions than with age-appropriate or self-selected portions. Am JClin Nutr 77(5):1164-1170.
Parke RD, Buriel R. 1998. Socialization in the family: Ethnic and ecological perspectives. In:Damon W, ed. Handbook of Child Psychology. 5th ed. New York: Wiley.
Pate RR, Heath GW, Dowda M, Trost SG. 1996. Associations between physical activity andother health behaviors in a representative sample of US adolescents. Am J Public Health86(11):1577-1581.
Pate RR, Trost SG, Felton GM, Ward DS, Dowda M, Saunders R. 1997. Correlates ofphysical activity behavior in rural youth. Res Q Exerc Sport 68(3):241-248.
Pica R. 1997. Beyond physical development: Why young children need to move. Young Child52(6):4-11.
Pike KM, Rodin J. 1991. Mothers, daughters, and disordered eating. J Abnorm Psychol100(2):198-204.
Rampersaud GC, Bailey LB, Kauwell GPA. 2003. National survey beverage consumptiondata for children and adolescents indicate the need to encourage a shift toward morenutritive beverages. J Am Diet Assoc 103(1):97-100.
Roberts D, Foehr U, Rideout V, Brodie M. 1999. Kids and Media at the New Millennium.Menlo Park, CA: The Henry J. Kaiser Family Foundation. [Online]. Available: http://www.kff.org/content/1999/1535/KidsReport%20FINAL.pdf [accessed April 15, 2004].
Robinson TN. 1999. Reducing children’s television viewing to prevent obesity: A randomizedcontrolled trial. J Am Med Assoc 282(16):1561-1567.
Robinson TN. 2001a. Population-based obesity prevention for children and adolescents. In:Johnston FE, Foster GD, eds. Obesity, Growth and Development. London: Smith-Gor-don. Pp. 129-141.
Robinson TN. 2001b. Television viewing and childhood obesity. Pediatr Clin North Am48(4):1017-1025.
Robinson TN, Hammer LD, Killen JD, Kraemer HC, Wilson DM, Hayward C, Taylor CB.1993. Does television viewing increase obesity and reduce physical activity? Cross-sec-tional and longitudinal analyses among adolescent girls. Pediatrics 91(2):273-280.
Robinson TN, Killen JD, Kraemer HC, Wilson DM, Matheson DM, Haskell WL, Pruitt LA,Powell TM, Owens AS, Thompson NS, Flint-Moore NM, Davis GJ, Emig KA, BrownRT, Rochon J, Green S, Varady A. 2003. Dance and reducing television viewing toprevent weight gain in African-American girls: The Stanford GEMS pilot study. EthnDis 13(1 Suppl 1):S1.65-S1.77.
Rolls BJ. 2003. The supersizing of America. Portion size and the obesity epidemic. Nutr Tod38(2):42-53.
Rolls BJ, Engell D, Birch LL. 2000. Serving portion size influences 5-year-old but not 3-year-old children’s food intakes. J Am Diet Assoc 100(2):232-234.
Roper ASW. 2003. 2003 Roper Youth Report. New York. [Online]. Available: http://www.roperasw.com/newsroom/press/p0310002.html [accessed May 3, 2004].
Sallis JF, Patterson TL, Buono MJ, Atkins CJ, Nader PR. 1988. Aggregation of physicalactivity habits in Mexican-American and Anglo families. J Behav Med 11(1):31-41.
482

316 PREVENTING CHILDHOOD OBESITY
Sallis JF, Simons-Morton BG, Stone EJ, Corbin CB, Epstein LH, Faucette N, Iannotti RJ,Killen JD, Klesges RC, Petray CK, Rowland TW, Taylor WC. 1992. Determinants ofphysical activity and interventions in youth. Med Sci Sports Exerc 24(6 Suppl):S249-S257.
Sallis JF, Nader PR, Broyles SL, Berry CC, Elder JP, McKenzie TL, Nelson JA. 1993. Corre-lates of physical activity at home in Mexican-American and Anglo-American preschoolchildren. Health Psychol 12(5):390-398.
Sallis JF, McKenzie TL, Alcaraz JE, Kolody B, Faucette N, Hovell MF. 1997. The effects of a2-year physical education program (SPARK) on physical activity and fitness in elemen-tary school students. Sports, Play and Active Recreation for Kids. Am J Public Health87(8):1328-1334.
Sallis JF, Alcaraz JE, McKenzie TL, Hovell MF. 1999. Predictors of change in children’sphysical activity over 20 months. Variations by gender and level of adiposity. Am J PrevMed 16(3):222-229.
Sallis JF, Prochaska JJ, Taylor WC. 2000. A review of correlates of physical activity ofchildren and adolescents. Med Sci Sports Exerc 32(5):963-975.
Schmitz KH, Lytle LA, Phillips GA, Murray DM, Birnbaum AS, Kubik MY. 2002. Psychoso-cial correlates of physical activity and sedentary leisure habits in young adolescents: TheTeens Eating for Energy and Nutrition at School study. Prev Med 34(2):266-278.
Shape Up America! 2004. 99 Tips for Family Fitness Fun. [Online]. Available: http://www.shapeup.org/pubs/99tips/index.html [accessed June 24, 2004].
Silverman BL, Cho NH, Rizzo TA, Metzger BE. 1998. Long-term effects of the intrauterineenvironment: The Northwestern University Diabetes in Pregnancy Center. Diab Care21(S2):B142-B149.
Skinner JD, Carruth BR, Bounds W, Ziegler P, Reidy K. 2002. Do food-related experiences inthe first 2 years of life predict dietary variety in school-aged children? J Nutr EducBehav 34(6):310-315.
Smiciklas-Wright H, Mitchell D, Mickle S, Goldman J, Cook A. 2003. Foods commonlyeaten in the United States, 1989-1991 and 1994-1996: Are portion sizes changing? J AmDiet Assoc 103(1):41-47.
Smith K. 2002. Who’s Minding the Kids? Child Care Arrangements: Spring 1997. CurrentPopulation Reports P70-86. Washington, DC: U.S. Census Bureau.
Stettler N, Zemel BS, Kumanyika S, Stallings VA. 2002. Infant weight gain and childhoodoverweight status in a multicenter, cohort study. Pediatrics 109(2):194-199.
Stettler N, Kumanyika SK, Katz SH, Zemel BS, Stallings VA. 2003. Rapid weight gain duringinfancy and obesity in young adulthood in a cohort of African Americans. Am J ClinNutr 77(6):1374-1378.
Stucky-Ropp RC, DiLorenzo TM. 1993. Determinants of exercise in children. Prev Med22(6):880-889.
Sullivan SA, Birch LL. 1994. Infant dietary experience and acceptance of solid foods. Pediat-rics 93(2):271-277.
Taggart AC, Taggart J, Siedentop D. 1986. Effects of a home-based activity program. A studywith low fitness elementary school children. Behav Modif 10(4):487-507.
Trost SG, Pate RR, Saunders R, Ward DS, Dowda M, Felton G. 1997. A prospective study ofthe determinants of physical activity in rural fifth-grade children. Prev Med 26(2):257-263.
Trost SG, Pate RR, Ward DS, Saunders R, Riner W. 1999. Correlates of objectively measuredphysical activity in preadolescent youth. Am J Prev Med 17(2):120-126.
USDA. 2004. Food Guide Pyramid for Young Children. Washington, DC: USDA, CNPP.[Online]. Available: http://www.usda.gov/cnpp/KidsPyra/ [accessed April 15, 2004].
483

HOME 317
USDA (U.S. Department of Agriculture), DHHS (U.S. Department of Health and HumanServices). 2000. Nutrition and Your Health: Dietary Guidelines for Americans. Homeand Garden Bulletin No. 232, 5th ed. Washington, DC: Government Printing Office.
Wardle J, Cooke LJ, Gibson EL, Sapochnik M, Sheiham A, Lawson M. 2003. Increasingchildren’s acceptance of vegetables: A randomized trial of parent-led exposure. Appetite40(2):155-162.
Weber Cullen K, Baranowski T, Rittenberry L, Cosart C, Owens E, Hebert D, de Moor C.2000. Socioenvironmental influences on children’s fruit, juice and vegetable consump-tion as reported by parents: Reliability and validity of measures. Public Health Nutr3(3):345-356.
Whitaker RC. 2004. Predicting preschooler obesity at birth: The role of maternal obesity inearly pregnancy. Pediatrics 114(1):e29-36.
Whitaker RC, Pepe MS, Seidel KD, Wright JA, Knopp RH. 1998. Gestational diabetes andthe risk of offspring obesity. Pediatrics 101(2):e9.
WHO (World Health Organization). 2003. Global Strategy for Infant and Young ChildFeeding. Geneva: WHO.
Williams TM, Handford AG. 1986. Television and other leisure activities. In: Williams TM,ed. The Impact of Television: A Natural Experiment in Three Communities. Orlando,FL: Academic Press. Pp. 143-213.
Young-Hyman D, Herman LJ, Scott DL, Schlundt DG. 2000. Care giver perception ofchildren’s obesity-related health risk: A study of African American families. Obes Res8(3):241-248.
Zakarian JM, Hovell MF, Hofstetter CR, Sallis JF, Keating KJ. 1994. Correlates of vigorousexercise in a predominantly low SES and minority high school population. Prev Med23(3):314-321.
484

485

319
Confrontingthe Childhood
Obesity Epidemic
9
Obesity in U.S. children and youth is an epidemic characterized byan unexpected and excess number of cases on a steady increase inrecent decades. The epidemic is relatively new but widespread,
and one that is disproportionately affecting those with the fewest resourcesto prevent it. Although it does not have the exotic nature or immediatemortality of severe acute respiratory syndrome, anthrax, or Ebola virus, itis harming a much broader cross section of our young people and maysignificantly undermine their health and well-being throughout their lives.Obesity can affect a child’s health immediately through physical or psycho-logical conditions such as type 2 diabetes, hypertension, steatohepatitis,depression, and stigma. Obesity can also affect a child’s health in the longerterm with additional illnesses that include arthritis, cancer, and cardiovas-cular disease.
Infectious disease epidemics require and usually receive immediate high-level attention, with resources invested to control the problem and preventits recurrence. Childhood obesity must be treated with comparable ur-gency. As with other emerging health problems, our degree of knowledgeand arsenal of effective interventions are quite limited. But we do not havethe luxury of waiting to accumulate large bodies of evidence. Therefore, itbehooves us to chart our course of action wisely based on what evidence wehave—drawing from our dealings with analogous problems and the out-comes of natural experiments—and learn as we proceed. Complicating theprocess will be the multiple causes and correlates of childhood obesity andthe need for many concurrent actions and interventions. Nevertheless, as
486

320 PREVENTING CHILDHOOD OBESITY
we carefully evaluate our programs and policies in terms of efficacy, effec-tiveness, and cost utility, we can devise new and innovative approachesbased on our experience, discard those that are less useful, promote thosethat work, and follow through accordingly.
Childhood obesity is complex because it has biological, behavioral,social, economic, environmental, and cultural causes, which collectivelyhave created over decades an adverse environment for maintaining a healthyweight. This environment is characterized by:
• Urban and suburban designs that discourage walking and otherphysical activities
• Pressures on families to minimize food costs and acquisition andpreparation time, resulting in frequent consumption of energy-dense conve-nience foods that are high in calories and fat
• Reduced access and affordability in some communities to fruits,vegetables, and other nutritious foods
• Decreased opportunities for physical activity at school and afterschool, and reduced walking or biking to and from school
• Competition for leisure time that was once spent playing outdoorswith sedentary screen time—including watching television or playing com-puter and video games.
The result is that obesity from unhealthful eating and inactivity hasrapidly become the social norm in many communities across America. Inthat respect, the nation is moving away from—instead of toward—the“healthy people in healthy communities” vision of Healthy People 2010.Although assigning blame for this situation may be easy, it is unlikely to beaccurate or productive. In general, the average person does not make theconscious choice to become obese, despite the adverse health and socialconsequences. No industry aims to promote weight gain among its custom-ers. Nonetheless, excess weight is gained slowly over time as companiesdevelop and market foods and beverages to maximize revenues; communityzoning and street-design decisions are influenced by numerous social andfinancial pressures; schools face scheduling constraints in fitting everythinginto the school day while facing the reality of budgetary limits; and indi-viduals make small but cumulative behavioral decisions daily about eatingand physical activity in the obesogenic environment that surrounds them.
Now that the nation has begun to realize the significant health, psycho-logical, and societal costs of an unhealthy weight, it is time to re-examine itsway of thinking and revise the social norms that are now accepted. Thisprocess should span virtually the entire spectrum of society, from corporateboard rooms to federal agencies, from elected officials to health insurersand employee unions, from health and medical professionals to teachers
487

CONFRONTING THE CHILDHOOD OBESITY EPIDEMIC 321
and school administrators, from foundations and public service organiza-tions to medical and public health researchers, and of course, it must in-volve entire communities and families, including parents, relatives, friends,and the children themselves. Although this challenge may appear to beoverwhelming, there have been many examples over the past century—relating to smoking, seatbelts, and children’s car seats, for example—ofsubstantial shifts in the American culture, society’s outlook, and, mostimportant, in people’s behavior and their health outcomes. Culture is not astatic set of values and practices. It is continuously recreated as peopleadapt and redefine their values and behaviors to changing realities. Thesechanges have occurred once there has been a collective understanding of theseverity of the problem, its impact on health, and mobilization around thepotential for improvement. Similar conditions now apply to childhood obe-sity, and the need for change should be particularly compelling in that thehealth of America’s children is at stake.
As institutions, organizations, and individuals across the nation beginto make changes, social norms are also likely to change, so that obesity inchildren and youth will be acknowledged as an important and preventablehealth outcome and healthful eating and regular physical activity will be theaccepted and encouraged standard.
Changing the social norms toward healthful lifestyles will have ampli-fied benefits. Individual-level changes toward nutritious diets and increasesin physical activity levels have short- and long-term potential for improvedhealth and well-being. Likewise, the enhancements and improvements madeto the built and social environments in our communities to improve accessto healthful foods and opportunities for physical activity may also improvethe safety of neighborhoods and street crossings and strengthen communitycohesion.
Preventing childhood obesity should become engrained as a collectiveresponsibility requiring individual, family, community, corporate, and gov-ernmental commitments. The key will be to bring changes to bear on thisissue from many directions, at multiple levels, and through collaborationwithin and between many sectors. For example, shared responsibilitieson issues such as increasing outdoor play opportunities and walking- orbiking-to-school programs will require attention from zoning and plan-ning commissions, public works departments, public safety and policeagencies, school boards, parks commissions, community members, andparents.
This is a major societal health problem that will be minimally affectedby isolated measures or selectively assigned responsibilities. It will alsorequire a long-term commitment spanning many years and possibly decadesbecause the epidemic has taken years to develop and will require persistentefforts and the investment of sustained resources to effectively ameliorate.
488

322 PREVENTING CHILDHOOD OBESITY
As with many health issues, there are high-risk populations, includinglow-income and ethnic minority communities, for which obesity preventioninitiatives will need to be particularly focused. Resources will need to ad-dress a range of issues such as safety, language barriers, limited access tofood and health services, income differentials, and the influence of cultureon food selection and preferences for available physical activities.
Tough choices will have to be made at all levels of society. There will betrade-offs in convenience, in cost, in what’s “easy,” in pushing one’s selfand one’s organization, in choosing between priorities, in devising newlaws and regulations, and in setting limits on individuals and on industries.
Science can best help by integrating a traditional biomedical approachto such health concerns with behavioral and social science research. Effec-tive solutions lie not in a magical “eat all you want” pill but rather inintensive, often laborious, and long-term improvements in the environ-ments that surround children in their homes, schools, communities, com-mercial markets, and modes of entertainment. While biology may oftenencourage us to eat more than we need to, biological solutions are not theanswer from an ethical or practical perspective. Nor is genetics the primaryproblem or the sole determinant. Rather, it is the complex interplay amongan individual’s knowledge, attitudes, values, behaviors, and environmentsthat play the most influential roles in promoting obesity.
In reviewing the available evidence to inform this report, there was anabundance of scientific studies on the causes and correlates of obesity butfew studies testing potential solutions within diverse and complex socialand environmental contexts, and no proven effective population-based so-lutions. Moreover, a concern of the committee is that even if many of therecommended actions are implemented, research should contain a betterbalance between studies that continue to address the underlying causes ofthe obesity epidemic and studies that test potential solutions—that is, iden-tifying appropriate methodologies for effectively promoting healthful eat-ing and physical activity and reducing sedentary behaviors that will supportobesity prevention in children and youth.
NEXT STEPS FOR ACTION AND RESEARCH
Recognizing the multifactorial nature of the problem, the committeedeliberated on how best to prioritize the next steps for the nation in pre-venting obesity in children and youth. The traditional method of prioritiz-ing recommendations of this nature would be to base these decisions on thestrength of the scientific evidence demonstrating that specific interventionshave a direct impact on reducing obesity prevalence and to order the evi-dence-based approaches based on the balance between potential benefitsand associated costs including potential risks. However, a robust evidence
489

CONFRONTING THE CHILDHOOD OBESITY EPIDEMIC 323
base is not yet available. Instead, we are in the midst of compiling thatmuch needed evidence at the same time that there is an urgent need torespond to this epidemic of childhood obesity. Therefore, the committeeused the best scientific evidence available—including studies with obesity asthe outcome measure and studies on improving dietary behaviors, increas-ing physical activity levels, and reducing sedentary behaviors as well asyears of experience and study on what has worked in addressing similarpublic health challenges—to develop the recommendations presented inthis report. These recommendations constitute the committee’s prioritiesand the recommended steps to achieve them.
As evidence was limited, yet the health concerns are immediate andwarrant preventive action, it is an explicit part of the committee’s recom-mendations that obesity prevention actions and initiatives should includeevaluation efforts to help build the evidence base that continues to beneeded to more effectively fight this epidemic.
From the report’s ten recommendations, the committee has identified aset of immediate steps based on the short-term feasibility of the actions andthe need to begin a well-rounded set of changes that recognize the diverseroles of multiple stakeholders (Table 9-1). In discussions and interactionsthat have already begun and will follow with this report, each communityand stakeholder group will determine their own set of priorities and nextsteps. Furthermore, action is urged for all areas of the 10 recommendations,as the list in Table 9-1 is only meant as a starting point.
The committee was also asked to set forth research priorities. There isstill much to be learned about the causes, correlates, prevention, and treat-ment of obesity in children and youth. Because the focus of this study is onprevention, the committee concentrated its efforts throughout the report onidentifying areas of research that are priorities for progress toward prevent-ing childhood obesity. The three research priorities discussed throughoutthe report are:
• Evaluation of obesity prevention interventions—The committeeencourages the evaluation of interventions that focus on preventing obesity,improving dietary behaviors, increasing physical activity levels, and reduc-ing sedentary behaviors. Specific policy, environmental, social, clinical, andbehavioral intervention approaches should be examined for their feasibil-ity, efficacy, effectiveness, and sustainability. Evaluations may be in theform of randomized controlled trials and quasi-experimental trials. Costeffectiveness research should be an important component of evaluationefforts.
• Behavioral research—The committee encourages experimental re-search examining the fundamental factors involved in changing dietarybehaviors, physical activity levels, and sedentary behaviors. This research
490

324 PREVENTING CHILDHOOD OBESITY
TABLE 9-1 Immediate Steps
Federal government • Establish an interdepartmental task force andcoordinate federal actions
• Develop nutrition standards for foods andbeverages sold in schools
• Fund state-based nutrition and physical activitygrants with strong evaluation components
• Develop guidelines regarding advertising andmarketing to children and youth by convening anational conference
• Expand funding for prevention interventionresearch, experimental behavioral research, andcommunity-based population research;strengthen support for surveillance, monitoring,and evaluation efforts
Industry and media • Develop healthier food and beverage productand packaging innovations
• Expand consumer nutrition information• Provide clear and consistent media messages
State and local governments • Expand and promote opportunities for physicalactivity in the community through changes toordinances, capital improvement programs, andother planning practices
• Work with communities to support partnershipsand networks that expand the availability ofand access to healthful foods
Health-care professionals • Routinely track body mass index in childrenand youth and offer appropriate counselingand guidance to children and their families
Community and nonprofit • Provide opportunities for healthful eating andorganizations physical activity in existing and new community
programs, particularly for high-risk populations
State and local education • Improve the nutritional quality of foods andauthorities and schools beverages served and sold in schools and as
part of school-related activities• Increase opportunities for frequent, more
intensive and engaging physical activity duringand after school
• Implement school-based interventions to reducechildren’s screen time
• Develop, implement, and evaluate innovativepilot programs for both staffing and teachingabout wellness, healthful eating, and physicalactivity
Parents and families • Engage in and promote more healthful dietaryintakes and active lifestyles (e.g., increasedphysical activity, reduced television and otherscreen time, more healthful dietary behaviors)
491

CONFRONTING THE CHILDHOOD OBESITY EPIDEMIC 325
should inform new intervention strategies that are implemented and testedat individual, family, school, community, and population levels. This wouldinclude studies that focus on factors promoting motivation to change be-havior, strategies to reinforce and sustain improved behavior, identificationand removal of barriers to change, and specific ethnic and cultural influ-ences on behavioral change.
• Community-based population-level research—The committee en-courages experimental and observational research examining the most im-portant established and novel factors that drive changes in populationhealth, how they are embedded in the socioeconomic and built environ-ments, how they impact obesity prevention, and how they affect society atlarge with regard to improving nutritional health, increasing physical activ-ity, decreasing sedentary behaviors, and reducing obesity prevalence.
The recommendations that constitute this report’s action plan to pre-vent childhood obesity commence what is anticipated to be an energeticand sustained effort. Some of the recommendations can be implementedimmediately and will cost little, while others will take a large economicinvestment and require a longer time to implement and to see the benefits ofthe investment. Some will prove useful, either quickly or over the longerterm, while others will prove unsuccessful. Knowing that it is impossible toproduce an optimal solution a priori, we more appropriately adopt surveil-lance, trial, measurement, error, success, alteration, and dissemination asour course, to be embarked on immediately. Given that the health of today’schildren and future generations is at stake, we must proceed with all dueurgency and vigor.
492

493

327
Acronyms
A
AAFP American Academy of Family PhysiciansAAP American Academy of PediatricsADA American Dietetic Association; also American Diabetes
AssociationALSPAC Avon Longitudinal Study of Pregnancy and ChildhoodAMA American Medical AssociationAPA American Psychological AssociationARS Agricultural Research ServiceASSIST American Stop Smoking Intervention Study
BLS U.S. Bureau of Labor StatisticsBMI Body mass indexBRFSS Behavioral Risk Factor Surveillance System
CACFP Child and Adult Care Food ProgramCaltrans California Department of TransportationCARU Children’s Advertising Review UnitCATCH Child and Adolescent Trial for Cardiovascular Health
programCDC Centers for Disease Control and PreventionCFSC Community Food Security CoalitionCHD coronary heart diseaseCHSI Community Health Status Indicators projectCMS Centers for Medicare & Medicaid Services
494

328 PREVENTING CHILDHOOD OBESITY
CNU Congress for the New UrbanismCSF Curriculum and Standards FrameworkCSFII Continuing Survey of Food Intakes by IndividualsCSPI Center for Science in the Public InterestCVD Cardiovascular disease
DALYs Disability-adjusted life yearsDHHS U.S. Department of Health and Human ServicesDRI Dietary Reference IntakeDV Daily Value (as in % DV)DVD Digital video discDXA Dual energy X-ray absorptiometry
EER Estimated Energy RequirementEFNEP Expanded Food and Nutrition Education ProgramEPA U.S. Environmental Protection Agency
FAO Food and Agricultural OrganizationFCC U.S. Federal Communications CommissionFDA U.S. Food and Drug AdministrationFGP Food Guide PyramidFITS Feeding Infants and Toddlers StudyFMI Food Marketing InstituteFMNV Foods of minimal nutritional valueFNB Food and Nutrition BoardFSP Food Stamp ProgramFTC Federal Trade Commission
GAO U.S. Government Accountability Office(previously U.S. General Accounting Office)
GEMS Girls Health Enrichment Multi-site Study
HDL High-density lipoproteinHEI Healthy Eating IndexHPDP Health Promotion and Disease Prevention Board
IFIC International Food Information CouncilIMPACT Improved Nutrition and Physical Activity ActIOM Institute of MedicineITE Institute of Transportation Engineers
KEDS Kids’ Eating Disorders Survey
495

APPENDIX A 329
LDL Low-density lipoproteinLEAP Lifestyle Education for Activity ProgramLSRO Life Sciences Research Organization
MEPS Medical Expenditure Panel SurveyMHHP Minnesota Heart Health ProgramMOVE Measurement of the Value of Exercise ProjectM-SPAN Middle-School Physical Activity and Nutrition
NACCHO National Association of County and City Health OfficialsNASPE National Association for Sport and Physical EducationNCHS National Center for Health StatisticsNCI National Cancer InstituteNCQA National Committee for Quality AssuranceNEA National Education AssociationNHANES National Health and Nutrition Examination SurveyNHES National Health Examination SurveyNHIS National Health Interview SurveyNHLBI National Heart, Lung, and Blood InstituteNHS National Health Service (United Kingdom)NHTS National Household Travel SurveyNICHD National Institute of Child Health and Human DevelopmentNIDDK National Institute of Diabetes and Digestive and Kidney
DiseasesNIH National Institutes of HealthNLEA Nutrition Labeling and Education ActNLSAH National Longitudinal Study of Adolescent HealthNLSY National Longitudinal Survey of YouthNPTS National Personal Transportation SurveyNRC National Research CouncilNSLP National School Lunch Program
OECD Organization for Economic Cooperation and Development
PE Physical educationPPHEAL Partnership to Promote Healthy Eating and Active Living
RCT Randomized controlled trialRDA Recommended Dietary AllowanceRWJF The Robert Wood Johnson Foundation
SARS Severe acute respiratory syndromeSBP School Breakfast Program
496

330 PREVENTING CHILDHOOD OBESITY
SCT Social cognitive theorySES Socioeconomic statusSHPPS School Health Policies and Programs StudySMART Student Media Awareness to Reduce Television curriculumSNDAS School Nutrition Dietary Assessment StudySPARK Sports, Play, and Active Recreation for Kids program
USDA U.S. Department of AgricultureUSPSTF U.S. Preventive Services Task Force
VCR video cassette recorder
WHO World Health OrganizationWIC Special Supplemental Nutrition Program for Women, Infants,
and Children
YMCLS Youth Media Campaign Longitudinal SurveyYRBS Youth Risk Behavior SurveyYRBSS Youth Risk Behavior Surveillance System
497

331
Glossary
B
Active living A way of life that integrates physical activity into dailyroutines. The two types of activities that comprise active living are recre-ational or leisure, such as jogging, skateboarding, and playing basketball;and utilitarian or occupational such as walking or biking to school, shop-ping, or running errands.
Away-from-home foods Foods categorized according to where they areobtained such as restaurants and other places with wait service; fast foodestablishments and self-service or carry-out eateries; schools, including daycare, after-school programs, and summer camp; and other outlets, includ-ing vending machines, community feeding programs, and eating at some-one else’s home.
Balanced diet The overall dietary pattern of foods consumed that provideall the essential nutrients in the appropriate amounts to support life pro-cesses, such as growth in children without promoting excess weight gain.
Basal metabolism The amount of energy needed for maintenance of lifewhen a person is at digestive, physical, and emotional rest.
Body mass index BMI is an indirect measure of body fat calculated as theratio of a person’s body weight in kilograms to the square of a person’sheight in meters.
498

332 PREVENTING CHILDHOOD OBESITY
BMI (kg/m2) = weight (kilograms) ÷ height (meters)2
BMI (lb/in2) = weight (pounds) ÷ height (inches)2 × 703
In children and youth, BMI is based on growth charts for age andgender and is referred to as BMI-for-age which is used to assess under-weight, overweight, and risk for overweight. According to the Centers forDisease Control and Prevention (CDC), a child with a BMI-for-age that isequal to or greater than the 95th percentile is considered to be overweight.A child with a BMI-for-age that is equal to or between the 85th and 95thpercentile is considered to be at risk of being overweight. In this report, thedefinition of obesity is equivalent to the CDC definition of overweight.
Built environment The man-made elements of the physical environment;buildings, infrastructure, and other physical elements created or modifiedby people and the functional use, arrangement in space, and aesthetic quali-ties of these elements.
Calorie A kilocalorie is defined as the amount of heat required to changethe temperature of one gram of water from 14.5 degrees Celsius to 15.5degrees Celsius. In this report, calorie is used synonymously with kilocalo-rie as a unit of measure for energy obtained from food and beverages.
Community A social entity that can be spatially based on where peoplelive in local neighborhoods, residential districts, or municipalities, or rela-tional such as people who have common ethnic or cultural characteristicsor share similar interests.
Co-morbidity In relation to obesity, an associated condition such as hy-pertension, type 2 diabetes, or asthma that worsens with weight gain andimproves with weight loss.
Competitive foods Foods and beverages offered at schools other thanmeals and snacks served through the federally reimbursed school lunch,breakfast and after-school snack programs. Competitive foods includesfood and beverages items sold through à la carte lines, snack bars, studentstores, vending machines, and school fundraisers.
Dietary Guidelines for Americans A federal summary of the latest dietaryguidance for the public based on current scientific evidence and medicalknowledge, issued by the U.S. Department of Health and Human Servicesand U.S. Department of Agriculture, and is revised every 5 years.
499

APPENDIX B 333
Dietary Reference Intakes A set of four, distinct nutrient-based referencevalues that replace the former Recommended Dietary Allowances in theUnited States. They include Estimated Average Requirements, Recom-mended Dietary Allowances, Adequate Intakes, and Tolerable Upper LevelIntakes.
Disability A physical, intellectual, emotional, or functional impairmentthat limits a major activity, and may be a complete or partial impairment.
Disease An impairment, interruption, disorder, or cessation of the normalstate of the living animal or plant body or of any of its components thatinterrupts or modifies the performance of the vital functions, being a re-sponse to environmental factors (e.g., malnutrition, industrial hazards, cli-mate), to specific infective agents (e.g., worms, bacteria, or viruses), toinherent defects of the organism (e.g., various genetic anomalies), or tocombinations of these factors; conceptually, a disease (which is usuallytangible or measurable but may be symptom-free) is distinct from illness(i.e., the associated pain, suffering, or distress, which is highly individualand personal).
Energy balance A state where energy intake is equivalent to energy expen-diture, resulting in no net weight gain or weight loss. In this report, energybalance in children is used to indicate equality between energy intake andenergy expenditure that supports normal growth without promoting excessweight gain.
The relation between intake of food and output of work that is positivewhen the body stores extra food as fat and negative when the body drawson stored fat to provide energy for work.
Energy density The amount of energy stored in a given food per unitvolume or mass. Fat stores 9 kilocalories/gram (gm), alcohol stores 7 kilo-calories/gm, carbohydrate and protein each store 4 kilocalories/gm, fiberstores 1.5 to 2.5 kilocalories/gm, and water has no calories. Foods that arealmost entirely composed of fat with minimal water (e.g., butter) are moreenergy dense than foods that consist largely of water, fiber, and carbohy-drates (e.g., fruits and vegetables).
Energy expenditure Calories used to support the body’s basal metabolicneeds plus those used for thermogenesis, growth, and physical activity.
Energy intake Calories ingested as food and beverages.
500

334 PREVENTING CHILDHOOD OBESITY
Environment The external influences on the life of an individual or com-munity.
Epidemic A condition that is occurring more frequently and extensivelyamong individuals in a community or population than is expected.
Exercise Planned, structured, and repetitive body movements done to im-prove or maintain one or more components of physical fitness, such asmaintaining or increasing muscle tone and strength.
Fast food Foods designed for ready availability, use, or consumption andsold at eating establishments for quick availability or take-out.
Fat The chemical storage form of fatty acids as glycerol esters, also knownas triglycerides. Fat is stored primarily in adipose tissue located throughoutthe body, but mainly under the skin (subcutaneously) and around the inter-nal organs (viscerally). Fat mass is the sum total of the fat in the body while,correspondingly, the remaining, nonfat components of the body constitutethe fat-free mass. Lean tissues such as muscle, bone, skin, blood, and theinternal organs are the principal locations of the body’s fat-free mass. Incommon practice, however, the terms “fat” and “adipose tissue” are oftenused interchangeably. Furthermore, “fat” is commonly used as a subjectiveor descriptive term that may have a pejorative meaning.
Fitness A set of attributes, primarily respiratory and cardiovascular, relat-ing to ability to perform tasks requiring physical activity.
Food Guide Pyramid An educational tool designed for the public thattranslates and graphically illustrates recommendations from the DietaryGuidelines for Americans and nutrient standards such as the Dietary Refer-ence Intakes into food-group-based advice that promotes a healthful diet.
Food security Access by all people, at all times to sufficient food for anactive and healthful life, including, at a minimum, the ready availability ofnutritionally adequate and safe foods and an assured ability to acquirefoods in socially acceptable ways.
Food system The interrelated functions that encompass food production,processing, and distribution; food access and utilization by individuals,households, communities, and populations; and food recycling, composting,and disposal.
501

APPENDIX B 335
Foods of minimal nutritional value Foods prohibited by federal regula-tion for sale in school food service areas during meal periods. For artifi-cially sweetened foods, FMNV are defined as providing less than 5 percentof the Reference Daily Intake (RDI) for each of eight specified nutrients(protein, vitamin A, vitamin C, niacin, riboflavin, thiamine, calcium, iron)per serving; for all other foods, defined as providing less than 5 percent ofthe RDI for each of eight specified nutrients per 100 calories and less than5 percent of the RDI for each of eight specified nutrients per serving. Thefour categories of foods specified in the regulation are: soda water, waterices, chewing gum, and certain candies (i.e., hard candy, jellies and gums,marshmallow candies, fondant, licorice, and spun candy).
Health A state of complete physical, mental, and social well-being andnot merely the absence of disease or infirmity.
Health promotion The process of enabling people to increase control overand to improve their health. To reach a state of complete physical, mental,and social well-being, an individual or group must be able to identify and torealize aspirations, to satisfy needs, and to change or cope with the environ-ment. Health is a resource for everyday life, not the objective of living, andis a positive concept emphasizing social and personal resources, as well asphysical capacities.
Healthy weight In children and youth, a level of body fat where co-morbidities are not observed. In adults, a BMI between 18.5 and 24.9 kg/m2.
Nutrient density The amount of nutrients that a food contains per unitvolume or mass. Nutrient density is independent of energy density although,in practice, the nutrient density of a food is often described in relationshipto the food’s energy density. Fruits and vegetables are nutrient dense butnot energy dense. Compared to foods of high-fat content, soda or softdrinks are not particularly energy dense because these are made up prima-rily of water and carbohydrate, but because they are otherwise low innutrients, their energy density is high for the nutrient content.
Nutrition Facts panel Standardized detailed nutritional information onthe contents and serving sizes of nearly all packaged foods sold in themarketplace. The panel was designed to provide nutrition information toconsumers and was mandated by the Nutrition Labeling and Education Actof 1994.
502

336 PREVENTING CHILDHOOD OBESITY
Obesity An excess amount of subcutaneous body fat in proportion to leanbody mass. In adults, a BMI of 30 or greater is considered obese. In thisreport, obesity in children and youth refers to the age- and gender-specificBMI that are equal to or greater than the 95th percentile of the CDC BMIcharts. In most children, these values are known to indicate elevated bodyfat and to reflect the co-morbidities associated with excessive body fatness.
Obesogenic Environmental factors that may promote obesity and encour-age the expression of a genetic predisposition to gain weight.
Overweight In children and youth, BMI is used to assess underweight,overweight, and risk for overweight. Children’s body fatness changes overthe years as they grow. Girls and boys differ in their body fatness as theymature, thus, BMI for children, also referred to as BMI-for-age, is genderand age specific. BMI-for-age is plotted on age- and gender-specific BMIcharts for children and teens 2 to 20 years. According to CDC, at risk ofoverweight is defined as BMI-for-age 85th percentile to < 95th percentile.Overweight is defined as BMI-for-age ≥ 95th percentile.
Physical activity Body movement produced by the contraction of skeletalmuscles that result in energy expenditure above the basal level. Physicalactivity consists of athletic, recreational, housework, transport, or occupa-tional activities that require physical skills and utilize strength, power,endurance, speed, flexibility, range of motion, or agility.
Physical education Refers to a planned, sequential program of curriculaand instruction that helps students develop the knowledge, attitudes, motorskills, self-management skills, and confidence needed to adopt and main-tain physically active lifestyles.
Physical fitness A set of attributes that people have or achieve that relatesto the ability to perform physical activity. The ability to carry out dailytasks with vigor and alertness, without undue fatigue, and with ampleenergy to enjoy leisure-time pursuits and meet unforeseen emergencies.
Physical inactivity Not meeting the type, duration, and frequency of rec-ommended leisure-time and occupational physical activities.
Population health The state of health of an entire community or popula-tion as opposed to that of an individual. It is concerned with the interre-lated factors that affect the health of populations over the life course, andthe distribution of the patterns of health outcomes.
503

APPENDIX B 337
Prevention With regard to obesity, primary prevention represents avoid-ing the occurrence of obesity in a population; secondary prevention repre-sents early detection of disease through screening with the purpose of limit-ing its occurrence; and tertiary prevention involves preventing the sequelaeof obesity in childhood and adulthood.
Risk The possibility or probability of loss, injury, disadvantage, or de-struction.
Risk analysis Risk analysis is broadly defined to include risk assessment,risk characterization, risk communication, risk management, and policyrelating to risk, in the context of risks of concern to individuals, to public-and private-sector organizations, and to society at a local, regional, na-tional, or global level.
Safety The condition of being protected from or unlikely to cause danger,risk or injury that either may be perceived or objectively defined.
School meals Comprises the food service activities that take place withinthe school setting. The federal child nutrition programs include the Na-tional School Lunch Program, School Breakfast Program, Child and AdultCare Food Program, Summer Food Service Program, and Special MilkProgram.
Sedentary A way of living or lifestyle that requires minimal physical activ-ity and that encourages inactivity through limited choices, disincentives,and/or structural or financial barriers.
Well-being A view of health that takes into account a child’s physical,social, and emotional health.
504

505

339
Literature Review
C
The committee reviewed and considered a broad array of informationin its work on issues potentially involved in the prevention of obesity andoverweight in children and youth. Information sources included the pri-mary research literature in public health, medicine, allied health, psychol-ogy, sociology, education, and transportation; reports, position statements,and other resources (e.g., websites) from the federal government, stategovernments, professional organizations, health advocacy groups, tradeorganizations, and international health agencies; textbooks and other scien-tific reviews; federal and state legislation; and news articles.
LITERATURE REVIEW
In order to conduct a thorough review of the medical and scientificliterature, the committee, Institute of Medicine (IOM) staff, and outsideconsultants conducted online bibliographic searches of relevant databases(Box C-1) that included Medline, AGRICOLA, CINAHL, Cochrane Data-base, EconLit, ERIC, PsycINFO, Sociological Abstracts, EMBASE, TRIS,and LexisNexis. To begin the process of identifying the primary literaturein this field, the IOM staff at the beginning of the study conducted generalbibliographic searches on topics related to prevention interventions of obe-sity in children and youth. These references (approximately 1,000 citations)were categorized and annotated by the staff and reference lists of keycitations were provided to the committee. After examining the initial searchand identifying key indexing terms in each of the databases, a comprehen-
506

340 PREVENTING CHILDHOOD OBESITY
BOX C-1Online Databases
AGRICOLA is a bibliographic database of citations to the agricultural literature.Production of these records in electronic form began in 1970, but the databasecovers materials in all formats, including printed works from the 15th century. Therecords describe publications and resources encompassing aspects of agricultureand allied disciplines such as agricultural economics, animal and veterinary sci-ences, earth and environmental sciences, entomology, extension and education,farming and farming systems, fisheries and aquaculture, food and human nutrition,forestry, and plant sciences. AGRICOLA indexes more than 2,000 serials as wellas books, pamphlets, conference proceedings, and other resources. This data-base is updated and maintained by the National Agricultural Library.
CINAHL (Cumulative Index to Nursing and Allied Health Literature) is a biblio-graphic database of citations of the literature related to nursing and allied healthprofessions from 1982 to the present. Over 1,200 English language journals areindexed with online abstracts available for more than 800 of these titles. Some full-text articles are available. The database also indexes health-care books, disserta-tions in nursing, conference proceedings, standards of professional practice, edu-cational software, and audiovisual media.
Cochrane Database (Cochrane Database of Systematic Reviews) is a databasecontaining the full text of over 1,600 systematic reviews of the effects of healthcare. The reviews are highly structured and systematic, with evidence included orexcluded on the basis of explicit quality criteria, to minimize bias. Data are oftencombined statistically (with meta-analysis) to increase the power of the findings ofnumerous studies, each too small to produce reliable results individually. It is pre-pared by the Cochrane Collaboration and is now published by John Wiley & Sons,Ltd. (Chichester, UK). These reviews are regularly updated.
EconLit is the American Economic Association’s bibliographic database of eco-nomics literature published in the United States and other countries from 1969 tothe present. EconLit contains citations and abstracts from more than 500 econom-ics journals. Some full-text articles are available. The database also indexes books,book chapters, book reviews, dissertations, essays, and working papers. The data-base covers subjects including accounting, consumer economics, monetary policy,labor, marketing, demographics, modeling, economic theory, and planning.EconLit contains over 350,000 records and is updated monthly.
EMBASE (Excerpta Medica) database is a major biomedical and pharmaceuticalcontaining more than 9 million records from 1974 to the present from over 4,000journals; approximately 450,000 records are added annually. Over 80 percent ofrecent records contain full author abstracts. This bibliographic database indexesinternational journals in the following fields: drug research, pharmacology, phar-maceutics, toxicology, clinical and experimental human medicine, health policyand management, public health, occupational health, environmental health, drugdependence and abuse, psychiatry, forensic medicine, and biomedical engineer-ing/instrumentation. EMBASE is produced by Elsevier Science.
ERIC (Educational Resources Information Center) is a national education data-base containing nearly 100,000 citations and abstracts published from 1993 to the
507

APPENDIX C 341
present. ERIC contains over one million citations of research documents, journalarticles, technical reports, program descriptions and evaluations, and curricularmaterials in the field of education. ERIC is sponsored by the U.S. Department ofEducation, Office of Educational Research and Improvement.
LexisNexis provides access to full-text information from over 5,600 sources, in-cluding national and regional newspapers, wire services, broadcast transcripts,international news, and non-English language sources; U.S. federal and state caselaw, codes, regulations, legal news, law reviews, and international legal informa-tion; and business news journals, company financial information, Securities andExchange Commission filings and reports, and industry and market news. It isproduced by Reed Elsevier, Inc.
MEDLINE is the U.S. National Library of Medicine’s premier bibliographic data-base containing citations from the mid-1960s to the present, and covering thefields of medicine, nursing, dentistry, veterinary medicine, the health-care system,and the preclinical sciences. PubMed provides online access to over 12 millionMEDLINE citations. MEDLINE contains bibliographic citations and author abstractsfrom more than 4,600 biomedical journals published in the United States and 70other countries. PubMed includes links to many sites providing full-text articles andother related resources. This database can be accessed at http://www.ncbi.nlm.nih.gov/PubMed.
PsycINFO is a bibliographic database of psychological literature with journal cov-erage from the 1800s to the present and book coverage from 1987 to the present.It contains more than 1,900,000 records including citations and summaries of jour-nal articles, book chapters, books, and technical reports, as well as citations todissertations, all in the field of psychology and psychological aspects of relateddisciplines. Journal coverage includes full-text article links to 42 American Psycho-logical Association journals including peer-reviewed international journals. Psy-cINFO is produced by the American Psychological Association.
Sociological Abstracts indexes the international literature in sociology and relat-ed disciplines in the social and behavioral sciences from 1963 to the present. Thisbibliographic database contains citations (from 1963) and abstracts (only after1974) of journal articles, dissertations, conference reports, books, book chapters,and reviews of books, films, and software. Approximately 1,700 journals and 900other serials published in the United States and other countries in over 30 languag-es are screened yearly and added to the database bi-monthly. The SociologicalAbstracts database contained approximately 600,000 records in 2003. A limitednumber of full-text references are available. Sociological Abstracts is prepared byCambridge Scientific Abstracts.
TRIS (Transportation Research Information Services) is a bibliographic databaseon transportation information published from 1970 to the present. The databasecontains more than 535,000 records and includes journal articles, government re-ports, technical reports, books, conference proceedings and ongoing research.Major subjects include aviation, highways, maritime, railroads, and transit; designand construction; environmental issues; finance; human factors; materials; opera-tions; planning; transportation and law enforcement; and safety. TRIS is producedand maintained by the Transportation Research Board at the National Academies.
508

342 PREVENTING CHILDHOOD OBESITY
sive search strategy was designed in consultation with librarians at theGeorge E. Brown Jr. Library of the National Academies. Search termsincorporated relevant MeSH (Medical Subject Headings) terms as well asterms from the EMBASE thesaurus. To maximize retrieval, the search strat-egy incorporated synonymous terms on the topics of obesity, overweight,or body weight; dietary patterns (including breastfeeding); and physicalactivity (including exercise, recreation, physical fitness, or physical educa-tion and training). The searches were limited to English language and tar-geted to retrieve citations related to infants, children, or youth (less than 18years of age). The searches were not limited by date of publication. Thisbroad search resulted in over 40,000 citations. Subsequent analysis of theresulting database focused on resources published since 1994 (approxi-mately 19,000 citations).
As the study progressed, additional focused searches were conducted.Topics of these searches included prevention of obesity in adults (primarilymeta-analyses and reviews); prevention interventions focused on co-mor-bidities of obesity in children (i.e., diabetes, hypertension); behaviorallyfocused interventions; and statistical information on trends in obesity andphysical activity. Additional references were identified by reviewing thereference lists found in major review articles, key reports, prominentwebsites, and relevant textbooks. Committee members, workshop present-ers, consultants, and IOM staff also supplied references.
The committee maintained the reference list in a searchable databasethat was indexed to allow searches by keywords, staff annotations, type ofliterature (e.g., literature review), or other criteria. Additionally, an Internet-based site was developed to facilitate the committee’s access to subjectbibliographies that were developed from the search as well as to full text ofsome of the key resources. After indexing the citations, subject bibliogra-phies were developed for the committee on topics including definition andmeasurement of childhood obesity and overweight; correlates and determi-nants (breastfeeding, dietary patterns, physical activity, television viewing,etc.); economic issues; etiology/epidemiology; ethnology and disparities;prevention interventions (family-based, school-based, community-based,etc.); and prevalence. Bibliographies were updated throughout the studyand committee members requested the full text of journal articles and otherresources as needed for their information and analysis.
509

343
Lessons Learned fromPublic Health Effortsand Their Relevance
to PreventingChildhood Obesity
Michael Eriksen, Sc.D.1
D
INTRODUCTION
As a nation, we are experiencing an epidemic of obesity that is un-precedented in its magnitude or rapidity. Overweight and obesitynot only plague the majority of adults, but children are becoming
increasingly overweight, with corresponding decrements in health statusand quality of life.
While the problem clearly exists, the causes are less clear. There is littleclarity about the relative importance of possible causative factors such aschanges in dietary patterns, increases in fast food and soft drink consump-tion, increases in portion size, decreases in physical activity, increases intelevision viewing, or most likely, a mix of all these factors. Clearly, athorough understanding of the precise causes of childhood obesity, andhow these factors interact, would increase the probability of developingeffective prevention and control strategies. In the absence of a precise un-derstanding of the etiology of the problem, it may be useful to look at thelessons learned from other public health campaigns and to try to determineif these lessons have any relevance for the prevention of childhood obesity.
One way to better understand how to deal with a particular publichealth problem is to look at the experience in dealing with other publichealth issues, especially those where there has been a modicum of success.
1Professor and Director, Institute of Public Health, Georgia State University, Atlanta, GA
510

344 PREVENTING CHILDHOOD OBESITY
For the purposes of this appendix, the experience with public health pro-grams, such as tobacco control, injury prevention, underage alcohol use,gun control, and others are qualitatively examined with particular attentionto their possible relevance for the prevention of childhood obesity.
PUBLIC HEALTH LESSONS LEARNED
The purpose of this paper is not to suggest specific intervention strate-gies to prevent childhood obesity, but rather to learn from other publichealth experiences and to glean lessons that might help inform efforts toprevent childhood obesity. There is certainly no shortage of theories, mod-els, and approaches to help guide public health program planning. Thereare multiple health behavior theories that are commonly used to guidepublic health efforts (Glanz et al., 2002), and popular planning models havebeen designed to help diagnose health problems (Green and Kreuter, 2000),identify the factors that contribute to these problems, and devise appropri-ate interventions. In general, these theories and models recommend taking abroad view of changing health behaviors and conditions, suggesting multi-factorial, comprehensive interventions that address multiple aspects of theproblem. Recently, the Institute of Medicine (2002) endorsed this broadapproach to public health interventions, recommending the adoption of an“ecological model” for viewing public health problems and interventions,where the individual is viewed within a larger context of family, commu-nity, and society. Overall, there is increasing interest in public health inter-ventions being comprehensive, addressing the multiple factors that influ-ence the health problem, and striving to strike a balance between effortsdirected at the individual and the social-environmental context in whichpeople live. It is likely that this approach will be as relevant for the preven-tion of childhood obesity as it is for other contemporary public healthchallenges. However, as previously stated, the purpose here is not to pro-pose a comprehensive intervention program for childhood obesity, butrather to identify the factors associated with success in other public healthareas, both as a result of planned interventions and also corresponding tosocial, cultural, or temporal factors.
Despite the notable successes in public health over the past century,there are no generally agreed on approaches or interventions that can beapplied to multiple public health problems, with the same interventioneffect seen with different problems. There are general guidelines and recom-mendations, core functions for public health, but no generic model pro-gram, best practices, or common lessons learned that could be applied tomost or all public health problems.
There are “best practices” for specific public health problems, but littleresearch or insight of the extent to which these categorical approaches are
511

APPENDIX D 345
generalizable to other public health challenges. For example, the Centersfor Disease Control and Prevention’s (CDC’s) Best Practices for Compre-hensive Tobacco Control Programs (CDC, 1999a) describes nine program-matic areas (i.e., community programs, school programs, statewide pro-grams, etc.) that have been shown to be effective in reducing tobacco use.2
In practice, these programs are typically delivered “comprehensively,” andit is difficult, if not impossible, to tease out the relative impact of specificprogram components within these comprehensive, real-life campaigns. Forthis reason, program evaluations of large-scale public health campaignstend to assess the collective effort, rather than the impact of individualprogram components. Because of the difficulty in teasing out the effect ofone component of a comprehensive program, evaluations have tended tofocus on the overall program impact and on the relationship between finan-cial investment in program activities and changes in health behaviors. Dataon the impact of comprehensive programs is strong, both in terms of changesin health behavior, as well as in terms of health outcomes (CDC, 2000).Recent analysis has confirmed that the greater the investment in compre-hensive programs, composed of evidence-based programs, the larger thepublic health benefit (Farrelly et al., 2003).
In addition to tobacco control, recent review articles have analyzed theevidence for the effectiveness of public health interventions for a variety ofpublic health problems, including dietary behavior, underage drinking,and motor vehicle injuries, to name just a few. For example, a recentreview by Bowen and Beresford (2002) concluded that although much hasbeen learned about trying to change dietary practices clinically, it is par-ticularly important to learn how to transform the successes obtained frominterventions aimed at the individual to community and public healthsettings. Gielen and Sleet (2003) reviewed the injury prevention literatureand concluded that a simplistic belief that imparting information wouldresult in behavior change and injury risk reduction resulted in an over-reliance on engineering solutions alone as the basis for injury preventionprograms. These authors reinforce the need for interdisciplinary ap-proaches to injury prevention, using behavioral science theory, coupledwith engineering solutions.
These observations from other public health problems (e.g., determin-ing how to expand clinical success to communities, combining behavioral
2For example, in 1999, the CDC’s Best Practices for Comprehensive Tobacco ControlPrograms was developed to guide state health departments in planning and allocating fundsfrom the Master Settlement Agreement. The Best Practices document does not explicitlyrecommend policy or regulatory actions, such as an increase in the excise tax on tobaccoproducts, or clean indoor air laws, because they did not require budget expenditures.
512

346 PREVENTING CHILDHOOD OBESITY
and environmental approaches) are informative and relevant for the devel-opment of programs to prevent childhood obesity.
Ten Greatest Public Health Achievements in the 20th Century
To begin to understand the potential generalizability of “best prac-tices” for specific health problems, it is useful to look at the evidence for thespecific success stories and determine if there are any common elements, orlessons learned, that tend to span multiple problems.
In 1999, acknowledging public health successes, CDC published a listof the ten greatest public health achievements of the 20th century (CDC,1999b) (Box D-1).
The subsequent Morbidity and Mortality Weekly Reports (MMWR)documented the reason these achievements were selected and described theprogress made in each area in terms of death and disease prevented. Al-though efforts were made to account for the reasons for the progress, therewas no systematic effort to attribute improvements in health status tospecific interventions, and no attempt was made to determine if there werecommon interventions that contributed to the amelioration of multiplehealth problems.
A preliminary review of the MMWR reports reveals a pattern of cat-egories of interventions that appear to have played a role in accomplishingmultiple achievements. The goal was to identify instances, across achieve-ments, of community intervention categories found in the past to havestrong evidence of effectiveness with multiple health behaviors or problems.As Table D-1 shows, intervention categories identified most frequentlyincluded community-wide campaigns, mass-media strategies, changes to
BOX D-1Ten Great Public Health Achievements
United States, 1900-1999
• Vaccination• Motor vehicle safety• Safer workplaces• Control of infectious disease• Decline in deaths from coronary heart disease and stroke• Safer and healthier foods• Healthier mothers and babies• Family planning• Fluoridation of drinking water• Recognition of tobacco use as a health hazard
513

347
TA
BL
E D
-1C
omm
unit
y In
terv
enti
on C
ateg
orie
s an
d 10
Gre
ates
t Pu
blic
Hea
lth
Ach
ieve
men
ts 1
900-
1999
Prov
ider
Red
ucin
gC
omm
unit
y-W
ide
Scho
ol-B
ased
Mas
s-M
edia
Law
s an
dR
emin
der
Cos
ts t
oC
ampa
igns
Inte
rven
tion
sSt
rate
gies
Reg
ulat
ions
Syst
ems
Pati
ents
Vac
cina
tion
XX
XX
Mot
or-v
ehic
le s
afet
yX
XX
X
Safe
r w
orkp
lace
sX
X
Con
trol
of
infe
ctio
usdi
seas
esX
XX
X
Dec
line
in
deat
hs f
rom
coro
nary
hea
rt d
isea
sean
d st
roke
XX
Safe
r an
d he
alth
ier
food
sX
XX
XX
Hea
lthi
e r m
othe
rs a
ndba
bie s
XX
XX
Fam
ily
plan
ning
XX
X
Fluo
rida
tion
of
drin
king
wat
e rX
Re c
ogni
tion
of
toba
c co
use
as a
hea
lth
haza
rdX
XX
514

348 PREVENTING CHILDHOOD OBESITY
laws and regulations, and reductions in patient costs. Those categoriesmentioned least frequently included school-based interventions, and pro-vider reminder systems. In addition, some contextual factors were similaracross achievements. For example, in nearly all cases, policy changes werefollowed by the emergence of new government leadership structures thatwere effective enforcers of the new policies and oversaw the developmentand implementation of new programs. Additionally, improved surveillancemethods, control measures, technologies, and treatments, and expandingsystems of service delivery and provider education, were frequently cited asdriving factors in these achievements.
The Guide to Community Preventive Services
Intensive effort has been devoted to reviewing the evidence of effective-ness, first for clinical preventive services (AHRQ, 2002) and now for com-munity preventive services (CDC, 2004c), but these efforts focus on thequality of evidence for specific diseases and health behaviors, rather thandrawing conclusions, or generalizing, across health problems.
The task force has completed the analysis of the evidence in nine majorareas. More reports, including those central to preventing childhood obe-sity (e.g., school-based programs, community fruit and vegetable consump-tion, consumer literacy, and food and nutrition policy) have not yet beenreleased (CDC, 2004c). Of the nine completed reports (most of whichfocused on adult health behaviors), the task force has determined that 34interventions could be recommended based on “strong” scientific evidence,another 14 could be recommended as having “sufficient” scientific evi-dence, and for 42, there was insufficient evidence to make a recommenda-tion. The Guide emphasizes that “…a determination that evidence is insuf-ficient should not be confused with evidence of ineffectiveness.”
There was relatively little overlap in the nearly 50 recommended inter-ventions, primarily because the interventions studied were very specific tothe health behavior or health condition studied. However, certain catego-ries of interventions appear to have strong evidence of effectiveness formultiple health behaviors and problems. The interventions listed in TableD-2 appear to be effective in multiple areas.
Thus, there are at least seven types of macrolevel interventions thatappear to have evidence supporting their effectiveness for multiple publichealth problems. Other interventions that are effective for multiple behav-iors and conditions may be identified in future work by the task force.Similarly, some of the types of interventions that currently have insufficientevidence may in fact have relevance for multiple health problems, but thecurrent body of research is insufficient in relation to rules of evidence. As is
515
APPENDIX D 349
often the case, the requisite research is difficult to conduct, or has yet to beconducted.
Based on the experience to date from The Guide to Community Pre-ventive Services, it appears that comprehensive programs that involve com-munities, schools, mass media, health providers, and laws and regulationsare most likely to be effective for a number of health problems. It is reason-able to assume that some or all of the types of interventions may have utilityin preventing childhood obesity
Lessons Learned Across Multiple Public Health Problems
The focus on “internal validity” has greatly improved the practice ofpublic health and the implementation of evidence-based approaches shownto be effective for specific health problems. This focus on disease- or behav-ior-specific evidence has not, however, advanced our understanding of the
TABLE D-2 Recommended Public Health Interventions Common toMultiple Health Behaviors and Conditions, The Guide to CommunityPreventive Services
Type of Intervention Health Behavior or Condition
Community-wide campaigns Physical activity**Motor vehicle occupant injuries*Oral health (water fluoridation)**
School-based interventions Physical activity**Oral health (sealants)**Vaccine preventable diseases (requirement for
school admission)*Skin cancer*
Mass-media strategies Tobacco initiation and cessation**Motor vehicle occupant injuries**
Laws and regulations Reducing exposure to secondhand smoke**Motor vehicle occupant injuries**
Provider reminder systems Vaccine preventable diseases**Tobacco cessation*
Reducing costs to patients Tobacco cessation*Vaccine preventable diseases**
Home visits Vaccine preventable diseases*Violence prevention**
* Sufficient evidence.** Strong evidence.SOURCE: CDC, 2004c.
516

350 PREVENTING CHILDHOOD OBESITY
“external validity” or generalizability of interventions across multiple healthproblems. Namely, extant research has failed to determine if there arecommon approaches that may be effective across a variety of health prob-lems.
There is a clear need for “lessons learned” from public health interven-tions and an assessment of the generalizability of interventions, and a deter-mination of under what conditions, and for which populations, they maywork. While analysis of the same degree of rigor that has been applied toassessing the evidence for effectiveness of specific programs does not existacross multiple programs, some efforts have been made to analyze theexperiences of successful public health campaigns, and to identify elementsthat appear to be associated with program success. Some of this work hasbeen done by academic researchers and some advanced by the public healthpractice community, most notably the articulation of the Ten EssentialPublic Health Services (CDC, 2004a) and the National Public Health Per-formance Standards (CDC, 2004b). While these efforts to improve practiceare noteworthy and of critical importance, the following section highlightssome of the academic reviews focused on factors associated with successfulhealth movements.
For example, based on analysis of success with lead, fluoride, autosafety, and tobacco, Isaacs and Schroeder (2001) concluded that the ingre-dients of success for public health programs include a mixture of (1) highlycredible scientific evidence, (2) campaigns with highly effective advocates,(3) a supportive partnership with the media, and (4) laws and regulations,often, but not always, at the federal level.
Drawing on social movement and other sociological theories,Nathanson analyzed the tobacco and gun control movements and con-cluded that successful health-related social movements had the followingelements in common: a socially and scientifically credible threat to thepublic health, mobilization of a diverse constituency, and “the convergenceof political opportunities with target vulnerabilities.”
Some researchers have looked for public health lessons that may bedirectly applicable to obesity or dietary change. Researchers at CDC ana-lyzed the experience with the tobacco control movement in relation topossible implications for preventing obesity (Mercer et al., 2003). Theyused the intervention framework described in the 2000 Surgeon General’sReport, Reducing Tobacco Use, and reflected on the relevance of educa-tional, clinical, regulatory, economic, and comprehensive interventions forthe prevention of obesity (DHHS, 2000).
Researchers at the World Health Organization (WHO) looked at therecently adopted Framework Convention on Tobacco Control (FCTC) interms of its possible implications for improving global dietary and physicalactivity levels (Yach et al., 2003). These researchers concluded that strate-
517

APPENDIX D 351
gies to improve diet and physical activity levels must be different from thoseemployed for tobacco control, because the nature of the behaviors aredifferent, but also in relation to possible private-sector interactions. Ac-cording to the authors, a formal treaty approach is not warranted ,3 butthat the organizing framework for the FCTC may be useful for the develop-ment of national plans and policies. In their article, Yach and colleagues(2003) draw comparisons between tobacco and food strategies, using thetemplate of the FCTC, including a discussion of (1) price and tax measures,(2) labeling and product content, (3) educational campaigns, (4) productmarketing, (5) clinical interventions, (6) product supply, (7) liability andcorporate behavior, and (8) supportive and facilitative measures.
Economos and colleagues (2001) conducted a global analysis of socialchange models by interviewing 34 key informants. These investigators con-cluded that a number of factors are being associated with a successful socialchange. These factors included having the issue being perceived as a crisis,a persuasive science base, important economic implications, strategic lead-ership (spark plugs), a coalition or mobilizing network, community andmedia advocacy, government involvement, media involvement, policy andenvironmental change, and a coordinated, but flexible plan.
A synthesis of these studies suggests a set of core factors that appear tobe associated with successful health-related social change efforts. Thesecore factors include:
• A persuasive science base documenting a socially and scientificallycredible threat to the public health with important economic implications;
• A supportive partnership with the media;• Strategic leadership and a prominent champion;• A diverse constituency of highly effective advocates; and• Enabling and reinforcing laws, regulations, and policies.
It is not clear whether all these factors need to be present for eachpublic health campaign, or if there is a preferred sequence of activities,although the order presented above corresponds roughly to the tobaccocontrol movement and exhibits some face validity for these core concepts.
In summary, some of the factors associated with successful public healthcampaigns are formal, planned interventions (e.g., mass-media campaigns,
3However, an accompanying commentary (Daynard, 2003) suggested that considerationshould be given to a treaty model for global obesity prevention, similar to the FCTC, if onlyfor the increased awareness of civil society and governments of the problem resultant fromtreaty development and negotiations process.
518

352 PREVENTING CHILDHOOD OBESITY
school-based programs), while other elements associated with success arecultural or social factors (e.g., leadership, advocacy, scientific evidence).Althougth these social factors are less likely to be planned in the same wayas formal interventions are, they can and should be cultivated and com-bined with more traditional intervention strategies This mix of formal in-terventions, typically provided by the medical and public health communi-ties, coupled with social change strategies, typically stimulated by advocacyorganizations and civil society, are most likely to result in successful andsustained health-related social change. Empirical data are lacking, but somecould argue that the two types of interventions are inextricably linked, andeither alone is unlikely to achieve success. If anything, anecdotal evidencesuggests that social factors (those less likely to be initiated by the healthcommunity) are more likely to be associated with success in health-relatedsocial movements, if only serving to create a “tipping point” for socialchange (Gladwell, 2000).
AN ORGANIZING FRAMEWORK FORPUBLIC HEALTH INTERVENTIONS
To learn from the lessons of other public health experiences and deter-mine whether there is any utility or relevance for preventing childhoodobesity, it is useful to have a conceptual framework to organize the experi-ences, principles, and strategies. In the 2000 Surgeon General’s Report,Reducing Tobacco Use, a framework was developed to categorize the dif-ferent types of tobacco control interventions (DHHS, 2000). This frame-work reviewed the evidence within the following categories: educational,clinical, legal, economic, regulatory, and comprehensive. Although it wasdeveloped for tobacco control, this framework may be useful in categoriz-ing interventions for other types of public health problems and has alreadybeen used to analyze similarities and differences between tobacco controland the prevention of obesity (Mercer et al., 2003). Analyzing strategies toprevent underage drinking, Komro and Toomey (2002) identified six differ-ent types of alcohol prevention strategies: school, extracurricular, family,policy, community, and multicomponent.
Drawing on and expanding the framework in the 2000 SurgeonGeneral’s Report and from other sources, the next section reviews findingsfrom a variety of public health campaigns, particularly efforts to reducetobacco use, and other public health experiences that have commercialdimensions, or that have been politically sensitive (e.g., underage alcoholconsumption, injury prevention). The following section reviews six catego-ries of interventions that may have relevance for the prevention of child-hood obesity. These categories are:
519

APPENDIX D 353
• The information environment• Access and opportunity• Economic factors• The legal and regulatory environment• Prevention and treatment programs• The social environment
The Information Environment
The environment in which people are informed about public healthissues is of critical importance, but also fraught with controversy, particu-larly when dealing with the marketing of commercial products. As a rule,the public health community tends to favor restrictions on commercialspeech, if felt necessary to insure the public health. On the other hand,commercial interests tend to view any restrictions on marketing as infringe-ments of their constitutional right to freedom of speech. A thorough discus-sion on individual speech versus commercial speech is beyond the scope ofthis paper; however, this tenet was a central argument in the Food andDrug Administration’s (FDA’s) attempt to regulate tobacco products(Kessler, 2001), and it remains an argument whenever legislators or regula-tors attempt to restrict the advertising for commercial products such astobacco, alcohol, and foods.
Although product advertising may result in a public health benefitwhen the advertising promotes healthy products (Ippolito and Mathios,1995), the majority of the debate about product marketing focuses on thoseproducts that may have harmful effects, particularly among children. De-spite the concerns of commercial interests, governments do have the right toalter the informational environment, particularly when the informationbeing conveyed is considered to be false, misleading, or deceptive. In theUnited States, the regulatory authority in this area is shared by multiplefederal agencies, but particularly by the FDA and the Federal Trade Com-mission (FTC). Gostin (2003) notes that government’s power to alter theinformational environment is one of the major ways in which governmentscan “assure the conditions for people to be healthy.” The article goes on todescribe that governments can alter the informational environment in anumber of ways, including by sponsoring health education campaigns andother persuasive communications, requiring product labeling, and restrict-ing harmful or misleading advertising.
Most of the effort in altering the information environment has beendone in relation to children and adolescents, particularly when it is believedthat the information being conveyed may be harmful or misleading tochildren (Strasburger and Donnerstein, 1999). Because of this, the qualityof the evidence documenting the effect of informational efforts, particularly
520
354 PREVENTING CHILDHOOD OBESITY
the marketing of commercial products to children is intensely debated. Asone might assume, public health advocates are convinced that marketingefforts are a substantial contributing factor to youth risk behaviors, par-ticularly in the areas of tobacco use, underage drinking, and consumptionof high-fat and calorie-dense foods. The manufacturers of these products(and their legal counsel) take just the opposite position, claiming there isinsufficient empirical evidence to prove the precise role of marketing on therelevant behaviors of children. At most, manufacturers may concede thatmarketing may influence the selection of a particular brand of a productbut that there is little evidence that marketing contributes to the initiationor use of a product, or causes an overall increase in demand for thatproduct. Despite the lack of existence of the single, definitive, experimentalstudy that unarguably proves that advertising affects the health behaviorsof young people, including the initiation and continuation of consumption,most public health authorities agree that the overall weight of the scientificevidence points inescapably to this conclusion.
Concern about the effect of the information environment, particularlythe effect of the marketing of harmful products on children, became promi-nent during the early 1990s corresponding to the increase in youth smok-ing. Discovering that very young children were more likely to recognize JoeCamel than Mickey Mouse, and that adolescents were much more likelythan adults to smoke the most advertised brands, led regulators to attemptto restrict the information environment, particularly as it relates to youngpeople (Kessler, 2001). The battles have continued over the last decade,with litigation replacing public policy as the primary vehicle to restrictadvertising, or at least receive compensation for the harm caused. To alarge extent, the 1998 Master Settlement Agreement (MSA) attempted toresolve this issue, combining cash payments to states and voluntary limita-tions on marketing practices (Schroeder, 2004). However, most believe theproblem continues and marketing for tobacco products is unabated. Fol-lowing the MSA agreement with the states, in 1999 the U.S. Department ofJustice4 filed suit against the tobacco industry under racketeering and orga-nized crime statues, including the claim that tobacco companies aggres-sively marketed cigarettes to children. This case was scheduled to go to trialin September 2004. In February 2004, the U.S. District Court denied amotion by the tobacco companies to dismiss the section of the case relatedto youth marketing of tobacco products.4
Thus, the issue of the impact of product marketing on the health-related behaviors of young people continues to be reviewed scholarly, as
4USA v. Philip Morris USA Inc., Civil Action 99-2496.
521

APPENDIX D 355
well as legally. Overall, there is good evidence that the advertising andmarketing of food products influences parental and child food choice (FoodStandards Agency, 2003). Additional empirical studies clearly documentthe increase in the number of television commercials viewed by children(Kunkel, 2001), the increase in ads for high-fat and high-sodium conve-nience foods (Gamble and Cotugna, 1999), the effect of even brief exposureto television commercials on food preferences of young children(Borzekowski and Robinson, 2001), and an association between televisionviewing and the consumption of fast foods (French et al., 2001). Mostrecently, and directly related to the dietary behaviors of children, the KaiserFamily Foundation (2004) reviewed the evidence on the effect of all types ofmedia on children’s dietary behavior, and recommended the reduction orregulation of food ads targeted to children, among other policy options.The American Psychological Association (APA, 2004) recently concludedthat televised advertising messages can lead to unhealthy eating habits,particularly for children under 8 years of age who are unable to criticallycomprehend advertised messages. The APA report went on to recommend:
Restrict advertising primarily directed to young children of eight yearsand under. Policymakers need to take steps to better protect young chil-dren from exposure to advertising because of the inherent unfairness ofadvertising to audiences who lack the capability to evaluate biased sourc-es of information found in television commercials.
Currently, there are no legal restrictions on the marketing of unhealthyfood to children. Correspondingly, food companies are unfettered in theirmarketing of calorie-dense and low-nutritional-quality food to children.Some consider it to be “open season” on children, with cartoon characters,celebrities, promotional tie-ins, product placement, sponsorship, games,and toys all be used to market unhealthy foods to children. Candy, softdrinks, and high-fat and high-sodium foods are even marketed in elemen-tary schools (Levine, 1999). None of these strategies are still used to pro-mote tobacco products to children, mainly because it is illegal to sell to-bacco products to minors, some states prohibit the use and possession oftobacco products by minors, and the tobacco companies themselves haveeither voluntarily agreed not to market to children, or have been prohibitedfrom doing so as the result of the settlement of legal proceedings. There isgood evidence to suggest that restrictions on the advertising of unhealthyfoods, the promotion of healthy choices, and possibly paid counter-adver-tising campaigns will improve the information environment relative to theprevention of childhood obesity. It is unlikely, however, that such actionswill be forthcoming from the federal government, especially the FTC. Re-cently, Tim Muris, a month after announcing he would step down as FTCChairman, penned a commentary in The Wall Street Journal entitled, “Don’t
522

356 PREVENTING CHILDHOOD OBESITY
Blame TV” where he stated, “Banning junk food ads on kids’ programmingis impractical, ineffective and illegal” (Muris, 2004).
Warning Labels, Ingredient Disclosure, and Labeling
As part of being an informed consumer, public health experts are call-ing for the full disclosure of ingredients. Commercially purchased foodproducts currently have nutritional labels, which contain ingredients usedin the food product, as well as nutritional information on calories, fat, andother nutritional parameters. As product packaging has increased, manynutritional labels still present the nutritional parameters for a “serving”rather than for the contents of the package. The FDA is currently investigat-ing the need to require the provision of “whole package data” in additionto nutritional information per serving (Day, 2003; Matthews et al., 2003;Stein, 2003). Food purchased in restaurants and fast food establishmentsdo not contain nutritional information on the menus or with the meals,although many fast food establishments have nutritional information postedor available on request.
Warning labels have been required on cigarette packages since the late1960s; however, U.S. warning labels have not kept pace with internationalstandards and generally are not noticed by smokers. Starting with Canadaand now required by a number of other countries, graphic and vivid warn-ing labels are required on all tobacco products. Similar labels are requiredby member states who are signatory to the FCTC (WHO, 2003). Graphicand vivid warning labels, similar to those used in Canada, have been shownto attract the attention of smokers, contribute to their interest in quittingsmoking, and increase quit attempts (Hammond et al., 2003). They haveeven been associated with a reduction in cigarette smoking (Hammond etal., 2004). Currently, there are no warnings labels for food products, otherthan for alcoholic products, and in some instances, for certain food prod-ucts that may contain a high risk of infectious disease (e.g., uncookedshellfish). The 2004 report of the APA on the effect of advertising onchildren concluded that any warnings, disclosures, or disclaimers aboutproducts advertised to children should be communicated in clear languagecomprehensible to the intended audience (APA, 2004).
Access and Opportunity
Children’s and adolescents’ ease of access and ready opportunity topurchase foods with high sugar, fat, and sodium content likely contributeto the increase in the prevalence of childhood overweight and obesity.Although empirical evidence on the precise contribution of easy availabilityand access to food products is not strong, some restrictions on access for
523

APPENDIX D 357
children are appropriate, at a minimum, to establish a foundation for sub-sequent public health interventions.
The Community Environment
Community access to food products is ubiquitous and, before recom-mending restrictions or limitations on access in the community, it may beuseful to examine the experience with attempting to restrict minors’ accessto tobacco products. Because the sale, and frequently the possession, oftobacco products by minors is illegal, various steps have been enacted toenforce tobacco access restrictions. Federal legislation has been promul-gated to require states to enforce a prohibition on the sale of tobaccoproducts to minors, and some stores voluntarily restrict access to tobaccoproducts by keeping inventory behind the counter and requiring a personalinteraction between the sales clerk and the customer to obtain the product.The evidence, however, is unclear about the effectiveness of enforcement ofminors’ access laws in reducing the use of tobacco products (Warner et al.,2003). Increasingly, minors have used other means (shoplifting, purchasingby friends, social acquisition) to obtain cigarettes. Whether or not theserestrictions are effective by themselves, enforcement of laws to prevent thesale of tobacco products by minors sends a strong and consistent messageon the hazard of tobacco use and should be considered as necessary, but notnecessarily sufficient action, to prevent adolescent tobacco use.
Regarding calorie-dense or low-nutritional-quality foods, there is norestriction whatsoever on their retail and commercial availability. As is thecase with cigarettes, these snack and fast food products are ubiquitouslyavailable—in vending machines, gas stations, convenience stores, and manyother places. In fact, nearly every retail and commercial outlet sells gums,candies, crackers, cookies, and soft drinks. However, in reviewing the lit-erature on the influence of availability on food choices, French and col-leagues (1997) concluded that the relationship is inconsistent, particularlycompared to the strong inverse relationship between price and consump-tion. Further research is needed to determine if restricting commercial ac-cess and availability would be effective in reducing the consumption ofcalorie-dense and low-nutritional-quality foods. As long as these productscan be sold legally to minors, it is unlikely that widespread restriction ofaccess to these products is feasible, and even if feasible, whether restrictionwould have a public health effect.
In addition to examining access to certain food products, it is perhapsmore important to understand the changing patterns of consumption andhow these patterns may inform interventions to reduce the risk of obesity.The published literature indicates that over the past few decades, and accel-erating in the past few years, there have been increases in eating outside the
524

358 PREVENTING CHILDHOOD OBESITY
home (particularly at fast food restaurants) (Guthrie et al., 2002; Nielsen etal., 2003; Bowman et al., 2004), increases in portion size (Young andNestle, 2002; Nielsen and Popkin, 2003), and increases in soft drink con-sumption (AAP, 2004).
The School Environment
Schools are an important setting to encourage health-promoting behav-iors, including the prevention of obesity (Dietz and Gortmaker, 2001).CDC has issued guidelines for schools to prevent nicotine addiction thatinclude smoke-free policies, tobacco prevention policies, and smoking ces-sation assistance for teachers, staff, and students (CDC, 1994). Similarguidelines exist for nutrition and physical activity programs in schools(CDC, 1996). There is good scientific evidence that manipulation of theschool cafeteria and physical activity environment can improve the cardio-vascular health of elementary school children, including body mass index(Wechsler et al., 2000). However, the presence of vending machines, con-cerns about cafeteria menus, and the declining requirement for physicaleducation in schools suggest that the school environment may need im-provement.
The American Public Health Association (2003) has called for the de-velopment of school policies for the promotion of healthful eating environ-ments and the prohibition of soft drinks and other low-nutrition foodsduring the school day. The American Academy of Pediatrics (2004) calls forschool policies that restrict the sale of soft drinks. There has been someprogress in removing soft drinks and snack foods in vending machines fromelementary and middle schools particularly in California. This has beenachieved by state legislation or local school board policy (e.g., Los AngelesUnified School District), with the major concerns being loss of school dis-trict revenue and commitment to long-term contracts with soft drink manu-facturers. There is a clear need for additional research on the relative im-portance of the school environment in contributing to the problem ofoverweight and obesity among children, as well as the role schools mayplay in ameliorating this problem. Recently, the National Institutes ofHealth announced a new funding program to support research in this area(NIH, 2004).
Economic Factors
In addition to altering the informational environment, Gostin (2003)also notes that the government’s power to tax and spend is one of the majorways in which governments can “assure the conditions for people to behealthy.” He goes on to note that the power to levy taxes can provide
525

APPENDIX D 359
incentives to engage in healthy behaviors and disincentives to practice riskyones, but also notes that these taxes can be inequitable and regressive.
Most of the public health experience with manipulating economic fac-tors to encourage healthy behaviors or to discourage risky behaviors hasbeen related to excise tax policy on products like tobacco, gasoline, andalcohol. Because of the popularity of increasing tobacco taxes as a publichealth strategy and the parallels that are frequently drawn between tobaccotax policy and a possible similar tax scheme for certain foods, the followingsection highlights some of the specific aspects of the taxation of tobaccoproducts.
Tobacco products, like most consumer products, have been shown tobe price sensitive; as price increases, consumption decreases. Children havebeen shown to be most price sensitive, with an approximate 7 percentdecrease in consumption for every 10 percent increase in price (DHHS,2000). As a result of this well-established price elasticity, an excise taxincreases on tobacco products has been a common and popular way toreduce adolescent tobacco use, and to increase much-needed state revenue.In 2002-2003, nearly half the states increased their excise tax on tobaccoproducts (Campaign for Tobacco Free Kids, 2004). Some states have ear-marked or dedicated a portion of the excise tax increase for tobacco pre-vention or health promotion programs. This approach of excise tax in-crease and earmarking for prevention programs could be considered to helpprevent childhood obesity, especially because one of the most frequentlyheard argument for not removing vending machines and soft drinks fromschools is concerns about loss of much-needed revenue.
It is likely that the same strategy for calorie-dense and low-nutritional-quality foods would have the same effect as seen for tobacco—as priceincreases, consumption falls. However, it is also likely that efforts to taxthese products would be even more difficult than taxing tobacco products.In California, an effort to levy a one-cent excise tax on soft drinks tocompensate for the lost revenue from removing soft drinks from vendingmachines in schools had to be removed in order for the vending machinelegislation to pass. Internationally, a plan to tax foods such as dairy prod-ucts, pastries, chocolates, pizzas, and burgers at a higher rate than otherfood products was briefly considered, then dismissed as unworkable by theBritish government (Food Navigator, 2004). Jacobson and Brownell (2000)suggest that to avoid the possible negative reaction to the levying of largeexcise taxes on soft drinks and snack foods, municipalities should considersmall tax increases, and the proceeds from these increases should be used tofund health promotion programs, including subsidizing the availability ofhealthier food choices. The American Public Health Association adopted asimilar policy recommendation at its 2003 annual meeting (APHA, 2003).
In addition to considering excise taxes on calorie-dense or low-nutri-
526

360 PREVENTING CHILDHOOD OBESITY
tional-quality foods, incentives or subsidies to make fruits and vegetablesmore available and affordable could be considered. French and colleagues(1997) reviewed the literature on the relationship between price and con-sumption of fruits and vegetables and found a consistent pattern, namelythat lower prices are associated with higher consumption. In their ownempirical work, these researchers found this same pattern among adoles-cents and found it to be robust across different age groups and food types.
As efforts progress in reducing tobacco use, concern has been expressedabout the economic well-being of tobacco farmers and cigarette manufac-turing workers and their communities. Similar concerns could be expressedif economic pressures were exerted on certain segments of the food produc-tion, manufacturing, and distribution systems.
The Legal and Regulatory Environment
Laws and regulations have become increasingly prominent and effec-tive in improving the public health. Public health law has emerged as astrategic element in planning public health interventions (Goodman et al.,2003), and the IOM has identified law and policy as one of the eightemerging themes for the future of public health training (IOM, 2002). Lawsand regulations seem to be one of the few common themes spanning mul-tiple reports from the Ten Greatest Achievements in Public Health to TheGuide to Community Preventive Services, and also appear to be an essentialfactor in successful health-related social movements. The following sectiondiscusses the importance of laws, regulations, and litigation.
Laws
Laws have played a critical role in the achievement of many publichealth accomplishments in the 20th century. Starting with infectious dis-ease control, and moving to public health preparedness, the presence oflaws has made the critical difference for public health authorities to safe-guard the public health, and correspondingly, the absence of legal authorityhas consistently served as an impediment. Mensah and his colleagues (2004)reviewed the use of law as a tool for preventing chronic disease with par-ticular attention to the impact of bans or restrictions on public smoking,laws on blood alcohol concentration, food fortification, and the FCTC. Inaddition to these examples, the public health literature is replete with ex-amples of the use of laws to promote the public health.
With respect to laws related to preventing childhood obesity, there islittle related federal legislation, other than efforts to provide liability pro-tection to food and soft drink manufacturers. Therefore, most of the legis-lative initiatives have occurred at the state level. The Kansas Health Insti-
527

APPENDIX D 361
tute (2004) recently reviewed obesity-related legislation passed by statesbetween 1999 and 2003.
There are a number of examples of federal legislation with relevancefor the prevention of childhood obesity. Review articles attest to the im-portance of laws in preventing motor vehicle injuries, such as the creationof the National Highway Traffic Safety Administration in 1970, and theuse of federal legislation in implementing conditional funding mechanismsthat encourage state legislatures to pass injury prevention laws (IOM,1999). With respect to firearm legislation, there is a complex structure tokeep firearms out of the hands of criminals, but no federal agency hasregulatory authority over gun design. A recent report from the CommunityPreventive Services Taskforce did not find sufficient evidence of the effec-tiveness of firearms laws, such as bans on specified firearms or ammuni-tion, restrictions on firearm acquisition, waiting periods for firearm acqui-sition, firearm registration and licensing of firearm owners, “shall issue”concealed weapon carry laws, child access prevention laws, zero tolerancelaws for firearms in schools, and combinations of firearms laws in prevent-ing firearm-related injuries (Hahn et al., 2003). As discussed earlier, how-ever, insufficient evidence should not be confused with evidence of ineffec-tiveness.
Regulation
Legislation often results in administrative actions to regulate productsthat might have an adverse effect on the public’s health. There does notappear to be a clear relationship between potential harm from products andthe level of regulation. For example, food products are relatively tightlyregulated, particularly by the FDA as a result of the authority contained inthe Food, Drug and Cosmetic Act. On the other hand, tobacco and gundesign are virtually unregulated. The lack of regulation of tobacco productsand the public health communities’ call for meaningful FDA regulatoryauthority may provide a useful framework for the potential that productregulation may play in preventing childhood obesity.
Despite substantial progress in reducing tobacco use, tobacco productscontinue to be relatively unregulated, although the tobacco industry hasmade protestations to the contrary (Eriksen and Green, 2002). The 1990ssaw unprecedented efforts to regulate tobacco products, with the FDA,under the direction of the President, exerting jurisdiction over tobaccoproducts, only to be rebuffed by the Supreme Court, which ruled thatCongress has not provided the FDA with the explicit authority to regulatetobacco products.5
5FDA v Brown and Williamson.
528
362 PREVENTING CHILDHOOD OBESITY
Food products, on the other hand, do come under FDA authority andare clearly regulated in terms of certain aspects of health and safety, includ-ing nutritional labeling and health claims. However, the FDA does notcurrently regulate the nutritional content of food products, portion size, ormarketing strategies. Currently, if a food product were to make an unjusti-fied health claim, the FDA could act. Similarly, if the advertising weredeemed to be false, misleading, or deceptive, the FTC could take action.However, concerns about food product marketing are not focused prima-rily on health claims or deception, but rather focus on making calorie-denseand low-nutritional-quality food particularly attractive to children. So, it isunlikely that traditional FDA or FTC authority would help in the area ofgreatest concern regarding marketing unhealthful food products to chil-dren.
If governmental regulation is not likely or possible, mandatory industrystandards could be considered to guide minimum nutrient content, portionsize, and marketing of products targeted to children. In addition to federalregulation, local authorities also have the ability to regulate food products,particularly in the areas of licensing, sampling, zoning restrictions, land use(Ashe et al., 2003), and conditional use permits (Bolen and Kline, 2003).Local restrictions on advertising may be more difficult with regards to FirstAmendment considerations and free speech. Local efforts to regulate to-bacco ads have often been stymied because of federal preemptive legisla-tion. The same pre-emption of local authority may not exist for local con-trol over food marketing.
Litigation
In addition to laws and regulation, litigation has recently become apowerful tool in preventing product-related injuries and ensuring the publichealth in areas such as tobacco, gun violence, and lead paint. In a recentreview, Vernick and colleagues (2003) conclude that although litigation isnot a perfect tool, it is an important one, and one that has made someproducts safer. Parmet and Daynard (2000) reach similar conclusions andagree that litigation can deter dangerous activities and contribute to thepublic health. However, both reviews agree that there is a dearth of empiri-cal evidence on the actual impact of litigation, but litigation appears to havea modest and important role in protecting the public’s health. Others arguethat product liability litigation has unacceptable social costs and may di-minish the role of personal responsibility. Everyone agrees, however, thatlitigation has played an extremely important role in tobacco control(Jacobson and Warner, 1999), and many see that experience as a model forpreventing obesity (Mello et al., 2003).
529

APPENDIX D 363
For tobacco control, the 1990s were the era of tobacco litigation. Amyriad of individual, class action, and state Attorney General suits trans-formed the tobacco control environment and resulted in lasting change inthe way tobacco products are marketed and how the public views tobaccocompanies. Perhaps of most note, the MSA of November 1998 required theparticipating tobacco companies to agree to restrict certain marketing prac-tices, disband trade associations, reform their corporate behavior, and pro-vide hundreds of billions of dollars to settling states over the next 25 years(Schroeder, 2004). In addition to significant financial disgorgement, to-bacco litigation in the 1990s also resulted in an unprecedented level oftobacco industry document disclosure that has served as a treasure trove ofinsight, scholarship, and, perhaps most importantly, changed the social-normative opinion of the general public toward tobacco companies (Bero,2003).
With respect to food-related litigation, there have been some initialattempts to sue fast food restaurants based on the claim that they are atleast partially responsible for the epidemic of childhood obesity, and forother reasons, such as consumer safety (e.g., excessive temperature of coffeeresulting in customer harm). To date, these efforts have been less thansuccessful, but are widely seen as the vanguard of future litigation efforts(Mello et al., 2003). In fact, attorneys experienced in tobacco litigationrecently sponsored a conference to develop strategies and resources to di-rect individual and class action efforts toward the problems of childhoodobesity.
At this point, it is not clear whether these efforts will follow the tobaccomodel and be successful in obtaining settlements or court victories. Theprocess of discovery is likely to yield internal documents that could bedamaging to, at least, the public’s perception of food companies. On theother hand, the current cases have tended to be seen by the public asfrivolous, and as disregarding the dimension of personal responsibility. Inresponse to the increase in litigation directed against food severs and manu-facturers, Senator Mitch McConnell, a pro-tobacco legislator from Ken-tucky, introduced “The Common Sense for Consumption Act,” which seeksto stop frivolous law suits against restaurants and the food industry(Higgins, 2003). A dozen states have introduced legislation aimed at pro-hibiting lawsuits against food and beverage manufacturers for obesity-re-lated health problems (Campos, 2004). This approach is consonant withthe effort to provide immunity to manufacturers and distributors of poten-tially harmful products such as tobacco, alcohol, and guns. Congress iscurrently considering providing immunity to gun manufacturers and deal-ers from civil suits by victimized families and local governments (New YorkTimes, 2004). Public attitudes toward suing fast food restaurants, docu-
530

364 PREVENTING CHILDHOOD OBESITY
ments obtained through discovery, and federal efforts at tort reform are alllikely to shape the litigation environment over the next few years.
Prevention and Treatment Programs
In addition to the effects of product marketing, different environments,economic factors, and laws on health-related behaviors, there is also thestrong and direct role played by individual efforts and planned interven-tions to improve health behaviors. The impact of specific interventions onpublic health success stories is described earlier in this paper. It is not theintent here to review the literature on the quality of the scientific evidencefor changing dietary behaviors, but rather to highlight lessons from otherpublic health areas that may have some utility for multiple health problems,and may be generalizable to preventing childhood obesity.
School-Based Interventions
As previously discussed, school-based programs appear to have robustand generalizable benefits to a number of public health programs, includingoral health, motor vehicle safety, and tobacco control. With respect totobacco use prevention programs, evidence has found them to be effective,especially those that have been conducted in coordination with comprehen-sive community and mass-media prevention programs (DHHS, 1994; Jagoand Baranowski, 2004). It is likely that school-based nutrition and physicalactivity programs could be even more effective in preventing childhoodobesity than school tobacco programs are in reducing tobacco use (Dietzand Gortmaker, 2001). This opinion is due to the fact that nutrition andphysical activity behaviors are a normal part of every school day and publichealth approaches could be fairly easily adopted and implemented. Vendingmachine policies, school breakfast and lunch programs, and required physi-cal activity programs are all significant components to childhood obesityprevention programs in which schools can play a constructive role.
Media Campaigns
Mass-media efforts that build on sophisticated marketing approachescan also be effective in improving dietary behavior and increasing physicalactivity levels among young people. In tobacco control, themes of tobaccoindustry manipulation, the health effects of involuntary smoking on non-smokers, and graphic depictions of the harm of smoking among real peoplehave proven to be effective (Hersey et al., 2004; Sowden and Arblaster,2004). It is not clear whether these themes will be relevant for preventing
531

APPENDIX D 365
childhood obesity, particularly the extent to which the practices and behav-ior of food companies will be exploited.
Individual and Clinical Efforts
Historically, the mainstay of efforts to reduce the burden of obesity hasfocused on individual and clinical efforts. There are well-established inter-ventions for both preventing and controlling obesity, but the challenge nowis take the individual and clinical efforts and to extend them so as to have apopulation effect. The same is the case with helping smokers quit smoking(Fiore et al., 2004). Most smokers would like to quit and wish they hadnever started, but overcoming nicotine addiction is difficult, with mostsuccessful quitters making multiple attempts before achieving success.Smoking cessation is extremely important in order to make public healthprogress during the next few decades. The public health benefit from cessa-tion is almost immediate, while the benefit from keeping children fromstarting to smoke will not be reaped for decades. While both preventionand treatment are important, the benefits from treatment or cessation willaccrue more quickly. The same is likely to be true for obesity and itssequelae.
Most successful smoking cessation is achieved through individual self-help efforts. Pharmacologic interventions are assuming increasing impor-tance, as is physician counseling, but still, most smokers quit on their own.Similarly, it is important to understand the relative importance of self-helpversus medical or health professions intervention in the prevention andtreatment of childhood obesity. Because of the lifestyle behaviors associatedwith obesity (diet and physical activity), it is likely that individual, self-helpinterventions will be common, but also that the role of the health-careprofessional is critical, particularly that of the pediatrician (Dietz andGortmaker, 2001; AAP, 2003).
Efforts to quit smoking may be initially successful, but after a few daysor weeks they are plagued by relapse. In fact, after a year, only about 30percent of short-term quitters have achieved long-term abstinence. Again, asimilar situation exists for obesity prevention and treatment, where long-term success in weight loss is often even more elusive than that for smokingcessation.
The Social Environment
The social environment—the way in which citizens, communities, theprivate sector, and governments interact to create norms and expectations—is a subtle but essential dimension of health-related social movements. Con-cern about the increase in alcohol-related motor vehicle fatalities created an
532

366 PREVENTING CHILDHOOD OBESITY
environment receptive to increases in public involvement and support forpublic policies to reduce the harm caused by alcohol-impaired driving(DeJong and Hingson, 1998; Shults et al., 2001). The popularity of desig-nated drivers, minimum legal drinking age, blood alcohol concentrationlaws, community traffic safety programs, and other interventions are adirect result of changing social norms. The desire of nonsmokers to beprotected from exposure to secondhand smoke is a critical element in chang-ing the tobacco control environment and how smoking is perceived insociety. As a result of nonsmokers’ rights advocacy, most workplaces aresmoke-free, serum cotinine levels have been reduced by nearly 75 percent inthe last decade (CDC, 2003), and the social norms associated with smokinghave been permanently changed. It is not clear, however, that the preven-tion of childhood obesity has a dimension that can serve as a parallel tononsmokers’ exposure to secondhand smoke.
There are a number of possible ways to engage the interest and involve-ment of society in the issue of childhood obesity in a similar way that it hasbeen secured by other public health problems. One way, which is alreadyhappening, is the increasing public concern about the magnitude of theproblem and the need for collective action. Given the rapid increase in theprevalence of childhood obesity, the “visibility” of the problem, and theseriousness of the problem for the affected individuals, social and norma-tive change is already beginning to occur. Further, the social costs of obesitythat are being borne by society as a whole, suggest the appropriateness ofcollective and policy interventions.
One of the biggest changes in the social environment for tobacco con-trol is that some tobacco companies are beginning to acknowledge thattheir products are harmful and addicting. Despite the decades of scientificevidence on the adverse health effects of tobacco use, tobacco companies,primarily for legal reasons, have denied the harm and addictiveness oftobacco products. As a result of the MSA, tobacco companies have begunto become more candid about the harm caused by their products, both inpublic statements and on their websites. But the level of candor is notconsistent among all companies, nor is it consistent in all instances, espe-cially in litigation, where companies tend to continue to deny that theirproduct contributed to the harm claimed by the plaintiff.
At this point in time, it is not clear how the food industry will respondto social and public health pressures to limit marketing of unhealthfulproducts to children and to assume at least partial responsibility for theepidemic of childhood obesity in this country and around the world(Daynard, 2003). However, some change has already begun, with compa-nies such as Kraft announcing changes in portion size and fat content insome of the products most popular with children. Like tobacco companies,it is likely that the food industry will not respond monolithically. Instead
533

APPENDIX D 367
those market leaders that can afford to have market share frozen, or thosecompanies that want to be perceived as a leader, or can carve out a “health”niche with their customers, will likely respond differently from other com-panies.
If the tobacco experience is any guide, it is likely that the food compa-nies will act just enough to avoid government regulation, but will fall shorton making structural changes in product design or marketing that willfundamentally alter their marker position. To date, companies have beenmuch more comfortable with educational campaigns emphasizing personalresponsibility and the need for increased physical activity than with propos-ing major policy or structural changes.6
In trying to anticipate possible changes in corporate behavior, it shouldbe remembered that marketing and selling unhealthy food, as opposed totobacco for minors, is completely legal. On the other hand, documentdiscovery has not yet taken place, and if it does, it may change publicperceptions pertaining to the legality versus morality of marketing to chil-dren those products with known adverse health effects.
The recognition for collaborative approaches to preventing obesity hasalready begun, and various governments are beginning to launch broad-based national strategies for tackling obesity (Mayor, 2004). In fact, theWHO approved a Global Strategy for Diet, Physical Activity and Health(WHO, 2004) that calls for multisectoral collaboration to address the in-creasing global prevalence of obesity.
SUMMARY
Efforts to address contemporary public health problems are often diffi-cult to evaluate for a number of reasons including the urgency and need fora rapid response, the lack of classical experimental design, often not havingan unexposed control group, difficulty in measuring social factors, and notunderstanding the dynamics between social forces and health behaviors(McQueen, 2002).
While difficult, it is important to understand the factors that contributeto public health advances and the reasons for the failure of unsuccessfulpublic health programs. This is particularly true as we face new problemsthat have complex, multifactorial, and often commercially linked dimen-sions. Rather than “reinventing the wheel,” making mistakes previouslymade, or overlooking interventions that have been shown to be effective, it
6For example, see the website of the American Council on Food and Nutrition, http://www.acfn.org/about/, or the Center for Consumer Freedom, http://www. consumerfreedom.com/.
534

368 PREVENTING CHILDHOOD OBESITY
is prudent to look at other public health experiences when developingstrategies to reduce public health problems, such as the prevention of child-hood obesity.
In reviewing other public health experiences and determining if thereare lessons for preventing childhood obesity, it is useful to compare andcontrast the similarities and differences between the other public healthproblems and the causes of childhood obesity. For example, when onecompares the prevention of tobacco use to the prevention of childhoodobesity, the first and most obvious difference is that tobacco use, from apublic health standpoint, is a behavior to be avoided; it presents a serioushealth risk and no health benefit. Diet and physical activity, on the otherhand, are essentials of life, cannot be avoided, and must be kept in balanceto ensure good health. Thus, for tobacco, there is the simple message ofavoidance, whereas for diet and physical activity there is the much morecomplex message that includes concepts such as quality, quantity, frequency,and balance (Mercer et al., 2003; Yach et al., 2003).
In summary, the “environmental classifications” of types of interven-tion strategies may serve as a useful template to determine the utility ofdifferent public health interventions for the prevention of childhood obe-sity. More broadly, categories such as these may be useful in conceptualiz-ing intervention strategies for various public health problems. To increasethe utility of this approach, and determine the relevance of specific publichealth interventions, it may be useful to further analyze the public healthproblem in terms of specific criteria to ascertain the similarity of certainproblems and the likelihood that an approach that was successful with onepublic health problem, may be generalizable to another. Possible criteria forcomparison could include:
• Description of the behavior (addictiveness, possible health benefits,legal aspects)
• Epidemiologic significance (number of deaths, disease burden)• Clear understanding of etiology• Feasibility of change• Availability of effective interventions• Level of public interest and awareness• Extent to which public is affected by problem• Salience to policy makers• Nature of relation with product manufacturer• Role of government• Degree of product regulation• International dimensions
535

APPENDIX D 369
CONCLUDING PRINCIPLES AND IMPLICATIONS
Individual Responsibility Versus Collective Action
One of the greatest challenges in our efforts to prevent childhood obe-sity is to strike the right balance between individual versus structural orenvironmental efforts. With tobacco control, most observers believe thatmajor progress was not achieved until clinical efforts in smoking cessationwere subjugated to policy efforts to change the social environment. Thissame debate is central to our efforts in preventing childhood obesity (Kershand Morone, 2002; Zernike, 2003). As with many public health problems,a critical issue is the role of coercion versus individual rights, and strikingthe appropriate balance between commercial interests and the commongood (Gostin, 2000).
Need to Change Social Norms About Food and Physical Activity
Fifty years ago, smoking was the norm. The majority of men smoked,smoking was widely advertised on television and radio, and smoking couldoccur anywhere, including airplanes, schools, hospitals, and doctor’s of-fices. Today, the situation is reversed, with smoking no longer being nor-mative, and nearly considered, if not a deviant behavior, at least one that istypically done in private. Fifty million Americans have quit smoking andthere are more ex-smokers than current smokers. No one could have pre-dicted the magnitude of change in perceptions and public opinion that hasoccurred with tobacco, but similar changes are possible with respect tofood and physical activity. Today, foods are “super-sized” to provide themost food or value for the dollar, but with virtually no consideration fordiet or health. While there is nothing wrong in seeking “value,” it is notinconceivable that, in the future, health considerations will enter the equa-tion in calculating “value.” Similarly, nearly all smokers who quit, enjoyedsmoking a great deal, but quit because they were more concerned abouttheir health than they were about the pleasure of smoking. The same can beachieved with food.
Learn from Other Public Health Experiences,But Don’t Necessarily Duplicate
Much has been learned from the successes, and continuing challenges,in previous public health experiences. However, there are major differencesin these earlier efforts and efforts to prevent childhood obesity. The differ-ences are particularly striking for tobacco control. Most notably, peopleneed to eat, but do not need to smoke. In addition, it is illegal to selltobacco products to minors, marketing to minors is prohibited, and non-
536

370 PREVENTING CHILDHOOD OBESITY
smokers’ rights is a powerful social movement that has changed publicnorms related to smoking. None of these elements exist for preventingchildhood obesity. From a macroperspective, and although progress hastaken decades, tobacco control is relatively simple compared to the com-plexities presented by childhood obesity. Accordingly, childhood obesityprevention strategies should be developed with an appreciation for thiscomplexity.
The Role of the Food Industry Is Critical but Uncertain
Part of the success of the tobacco control movement has been theattacks on and marginalization of the tobacco companies. This was a fairlypredictable strategy because of their intransigence over decades and theharm resulting from a product that, when used as intended, kills one out oftwo lifetime users. While predictable, this strategy has also been effective inchanging social norms and focusing youth empowerment against tobaccoindustry tactics. At this point, it is unclear whether a similar strategy di-rected against food companies is warranted or would be effective. Thisquestion will be partially answered by the extent to which food companiesdeal honestly and constructively with the obesity epidemic, including acandid assessment of their role in helping to create it (Revill, 2003). To theextent that commercial interests respond, if not lead, on behalf of the publicgood, they may obviate the need for government action. To the extent thatthey fail, government action will be demanded (Yach et al., 2003). In eitherrespect, it appears clear to most that the overall environment in which foodproducts are produced, marketed, and sold, must be improved (Ebbeling etal., 2002).
The Problem Is Multifactorial, and So Must Be the Solutions
Based on the experience with many different public health problems(e.g., tobacco control, motor vehicle and firearm injuries), it seems clearthat comprehensive and multifactorial approaches are required. At a mini-mum these approaches should address both the individual behaviors andthe social environment in which these behaviors take place, particularly themarketing, price, availability, and accessibility related to both dietary andphysical activity behaviors. It is important to avoid glib and simple solu-tions to complex and poorly understood problems.
Need Evidence on Best Practices and Effective Interventions
The rise in childhood obesity is well documented, but less well under-stood. The relationships among and relative contribution of dietary factors,
537

APPENDIX D 371
the social environment, and physical activity need to be better understoodto develop effective interventions (BMJ, 2004). Recent reports by the APA(2004) and the Kaiser Family Foundation (2004) advance the understand-ing of the role of the media in childhood obesity, but similar analyses areneeded for other aspects of childhood obesity prevention, such as the role offast foods and soft drinks, and how the social environment can be struc-tured to contribute to the prevention of childhood obesity. For tobaccocontrol, we may not know all the answers, but we know enough to make adifference. Research underlies tobacco control guidelines and recommenda-tions, and similar research, recommendations, and guidelines are beingdeveloped for preventing childhood obesity. Once the relative effectivenessof various interventions is better known, there needs to be a concertedeffort to disseminate and implement approaches that have been found to beeffective. The lack of emphasis on the systematic diffusion of effectiveinterventions has plagued multiple public health initiatives.
Need to Consider the Global Dimension
The epidemic of childhood obesity first appeared in the United States,but every indication is that it is beginning to appear in other developedcountries, as well as in the developing world. The global implications of ourdomestic solutions should be considered, so we do not solve our problemsby creating a larger one overseas (Yach et al., 2003; WHO, 2004).
REFERENCES
AAP (American Academy of Pediatrics). 2003. Prevention of pediatric overweight and obe-sity. Pediatrics 112(2):424-430.
AAP. 2004. Policy statement: Soft drinks in schools. Pediatrics 113(1):152-154.AHRQ (Agency for Healthcare Research and Quality). 2002. Guide to Clinical Preventive
Services. [Online]. Available: http://www.ahrq.gov/clinic/cps3dix.htm [accessed Febru-ary 24, 2004].
APA (American Psychological Association). 2004. Report of the APA Task Force on Adver-tising and Children. [Online]. Available: http://www.apa.org/releases/childrenads.html[accessed February 24, 2004].
APHA (American Public Health Association). 2003. Food Marketing and Advertising Di-rected at Children and Adolescents: Implications for Overweight. Policy # 200317-1.Adopted November 2003. [Online]. Available: http://www.apha.org/legislative/policy/2003/2003-017.pdf [accessed February 24, 2004].
Ashe M, Jernigan D, Kline R, Galaz R. 2003. Land use planning and the control of alcohol,tobacco, firearms, and fast food restaurants. American Journal of Public Health93(9):1404-1408.
Bero L. 2003. Implications of the tobacco industry documents for public health and policy.Annual Review of Public Health 24:267-288.
BMJ (British Medical Journal). 2004. Fighting obesity: Evidence of effectiveness will be neededto sustain policies. British Medical Journal 328:1327-1328.
538

372 PREVENTING CHILDHOOD OBESITY
Bolen E, Kline R. 2003. Applying the Legal Tools of Tobacco Control to the Problem ofObesity. Presented at the annual meeting of the American Public Health Association,San Francisco, November 17, 2003.
Borzekowski DLG, Robinson TN. 2001. The 30-second effect: An experiment revealing theimpact of television commercials on food preferences of preschoolers. Journal of theAmerican Dietetic Association 101(1):42-46.
Bowen DJ, Beresford SA. 2002. Dietary interventions to prevent disease. Annual Review ofPublic Health 23:255-286.
Bowman SA, Gortmaker SL, Ebbeling CB, Pereira MA, Ludwig DS. 2004. Effects of fast-foodconsumption on energy intake and diet quality among children in a national householdsurvey. Pediatrics 113(1):112-118.
Campaign for Tobacco Free Kids. 2004. Tobacco Tax Fact Sheets. [Online]. Available: http://www.tobaccofreekids.org/research/factsheets/pdf/0239.pdf [accessed August 22, 2004].
Campos C. 2004. Suing Mickey D’s? Fat chance. Atlanta Journal Constitution, February 25,2004.
CDC (Centers for Disease Control and Prevention). 1994. Guidelines for school health pro-grams to prevent tobacco use and addiction. MMWR 43(RR-2):1-24.
CDC. 1996. Guidelines for school health programs to promote lifelong healthy eating.MMWR 45(RR-9):1-47.
CDC. 1999a. Best Practices for Comprehensive Tobacco Control Programs—August 1999.Atlanta GA: CDC National Center for Chronic Disease Prevention and Health Promo-tion, Office on Smoking and Health.
CDC. 1999b. Achievements in public health, 1990-1999. MMWR 48(50):1141-1147.CDC. 2000. Declines in lung cancer rates: California—1988-1997. MMWR 49(47):1066-
1069.CDC. 2003. Second National Environmental Exposure Report. [Online]. Available: http://
www.cdc.gov/exposurereport/2nd/pdf/tobaccosmoke.pdf [accessed August 22, 2004].CDC. 2004a. The Essential Public Health Services. [Online]. Available: http://
www.phppo.cdc.gov/nphpsp/10EssentialPHServices.asp [accessed August 23, 2004].CDC. 2004b. National Public Health Performance Standards Program. [Online]. Available:
http://www.phppo.cdc.gov/nphpsp/index.asp [accessed August 23, 2004].CDC. 2004c. The Guide to Community Preventive Services. At-A-Glance. [Online]. Avail-
able: http://www.thecommunityguide.org/overview/at-a-glance.pdf [accessed February12, 2004].
Day S. 2003. U.S. considers food labels with whole-package data. New York Times. Novem-ber 21, 2003.
Daynard RA. 2003. Lessons from tobacco control for the obesity control movement. Journalof Public Health Policy 24(3/4):291-295.
DeJong W, Hingson R. 1998. Strategies to reduce driving under the influence of alcohol.Annual Review of Public Health 19:359-378.
DHHS (U. S. Department of Health and Human Services). 1994. Preventing Tobacco UseAmong Young People: A Report of the Surgeon General, Atlanta, GA: Centers forDisease Control and Prevention, National Center for Chronic Disease Prevention andHealth Promotion, Office on Smoking and Health.
DHHS (U.S. Department of Health and Human Services). 2000. Reducing Tobacco Use: AReport of the Surgeon General. Atlanta, GA: Centers for Disease Control and Preven-tion, National Center for Chronic Disease Prevention and Health Promotion, Office onSmoking and Health.
Dietz WH, Gortmaker SL. 2001. Preventing obesity in children and adolescents. AnnualReview of Public Health 22:337-353.
539

APPENDIX D 373
Ebbeling CB, Pawlak DB, Ludwig DS. 2002. Childhood obesity: Public health crisis, commonsense cure. Lancet 360(9331):473-482.
Economos CD, Brownson RC, DeAngelis MA, Foerster SB, Foreman CT, Gregson J,Kumanyika SK, Pate RR. 2001. What lessons have been learned from other attempts toguide social change? Nutrition Reviews 59(3):S40-S56.
Eriksen MP, Green LW. 2002. Progress and next steps in reducing tobacco use in the UnitedStates. In: Scuthfield D, Keck W, eds. Principles of Public Health Practice. 2nd edition.Delmar Learning.
Farrelly MC, Pechacek TF, Chaloupka FJ. 2003. The impact of tobacco control programexpenditures on aggregate cigarette sales: 1981-2000. Journal of Health Economics 22:843-859.
Fiore MC, Croyle RT, Curry SJ, Cutler CM, Davis RM, Gordon C, Healton C, Koh HK,Orleans CT, Richling D, Satcher D, Seffrin J, Williams C, Williams LN, Keller PA, BakerTB. 2004. Preventing 3 million premature deaths and helping 5 million smokers quit: Anational action plan for tobacco cessation. American Journal of Public Health 94(2):205-210.
Food Navigator. 2004. Tax Plans Dismissed as Unworkable. [Online]. Available: http://www.foodnavigator.com/news/news-NG.asp?id=50054 [accessed February 25, 2004].
Food Standards Agency. 2003. Does Food Promotion Influence Children? A Systematic Re-view of the Literature. Ref R769-36. United Kingdom Food Services Agency, September25, 2003.
French SA, Story M, Jeffery RW, Snyder P, Eisenberg M, Sidebottom A, Murray D. 1997.Pricing strategy to promote fruit and vegetable purchase in high school cafeterias. Jour-nal of the American Dietetic Association 97(9):1008-1010.
French SA, Story M, Neumark-Sztainer D, Fulkerson SA, Hannan P. 2001. Fast food restau-rant use among adolescents: Associations with nutrient intake, food choices and behav-ioral and psychological variables. International Journal of Obesity 25(12):1823-1833.
Gamble M, Cotugna N. 1999. A quarter century of TV food advertising targeted at children.American Journal of Health Behavior 23(4):261-268.
Gielen AC, Sleet D. 2003. Application of behavior-change theories and methods to injuryprevention. Epidemiologic Reviews 25:65-76.
Gladwell M. 2000. The Tipping Point: How Little Things Can Make a Big Difference. NewYork: Little Brown and Company.
Glanz K, Rimer BK, Lewis FM, eds. 2002. Health Behavior and Health Education: Theory,Research and Practice. 3rd edition. San Francisco, CA: Jossey-Bass.
Goodman RA, Rothstein MA, Hoffman RE, Lopez W, Matthews GW, eds. 2003. Law inPublic Health Practice. New York: Oxford University Press.
Gostin LO. 2000. Public health law in a new century. Part 1: Law as a tool to advance thecommunity’s health. JAMA 283 (21): 2837-2841.
Gostin LO. 2003. Law and Ethics in Population Health. Keynote address at the Inaugurationof the National Centre for Public Health Law of Australia, Melbourne, Australia, July21, 2003.
Green LW, Kreuter M. 2000. Health Promotion Planning: An Educational and EcologicalApproach. New York: McGraw-Hill.
Guthrie JF, Lin BH, Frazao E. 2002. Role of food prepared away from home in the Americandiet, 1977-78 versus 1994-96: Changes and consequences. Journal of Nutrition Educa-tion and Behavior 34:140-150.
Hahn RA, Bilukha OO, Crosby A, Fullilove MT, Liberman A, Moscicki EK, Snyder S, TumaF, Briss P, Task Force on Community Preventive Services. 2003. First reports evaluatingthe effectiveness of strategies for preventing violence: Firearms laws. Findings from theTask Force on Community Preventive Services. MMWR Recomm Rep 52(RR-14):11-20.
540

374 PREVENTING CHILDHOOD OBESITY
Hammond D, Fong GT, McDonald PW, Cameron R, Brown KS. 2003. Impact of the graphicCanadian warning labels on adult smoking behaviour. Tobacco Control 12:391-395.
Hammond D, Fong GT, McDonald PW, Brown KS, Cameron R. 2004. Graphic Canadianwarning labels and adverse outcomes: Evidence from Canadian smokers. American Jour-nal of Public Health 94:1442-1445.
Hersey JC, Niederdeppe J, Evans WD, Nonnemaker J, Blahut S, Farrelly MC, Holden D,Messeri P, Haviland ML. 2004. The effects of state counterindustry media campaigns onbeliefs, attitudes, and smoking status among teens and young people. Preventive Medi-cine 37(6 Pt 1):544-552.
Higgins M. 2003. Obesity lawsuit curbs sought. The Washington Times October 22, 2003.IOM (Institute of Medicine). 1999. Reducing the Burden of Injury: Advancing Prevention
and Treatment. Washington, DC: National Academy Press.IOM. 2002. Who Will Keep the Public Healthy? Washington, DC: The National Academies
Press.Ippolito PM, Mathios AD. 1995. Information and advertising: The case of fat consumption in
the United States. The American Economic Review 85(2):91-95.Isaacs SL, Schroeder SA. 2001. Where the public good prevailed: Lessons from success stories
in health. The American Prospect 12(10):26-30.Jacobson MF, Brownell KD. 2000. Small taxes on soft drinks and snack foods to promote
health. American Journal of Public Health 90:854-857.Jacobson PD, Warner KE. 1999. Litigation and public health policy making: The case of
tobacco control. Journal of Health Politics, Policy and Law 24(4):769-804.Jago R, Baranowski T. 2004. Non-curricular approaches for increasing physical activity in
youth: A review. Preventive Medicine 39:157-163.Kaiser Family Foundation. 2004. The Role of Media in Childhood Obesity. Issue Brief,
February 2004. [Online]. Available: http://www.kff.org [accessed February 25, 2004].Kansas Health Institute. 2004. Obesity and public policy: Legislation passed by states—1999-
2003. Interim Report to the Sunflower Foundation. [Online]. Available: http://www.khi.org/ [accessed August 23, 2004].
Kersh R, Morone J. 2002. The politics of obesity: Seven steps to government action. HealthAffairs 21(6):142-153.
Kessler D. 2001. A Question of Intent. New York: Public Affairs.Komro KA, Toomey TL. 2002. Strategies to prevent underage drinking. Alcohol Research
and Health 26(1):5-14.Kunkel D. 2001. Children and television advertising. In: Singer D, Singer J, eds. Handbook of
Children and the Media. Thousand Oaks, CA: Sage Publications.Levine J. 1999. Food industry marketing in elementary schools: Implications for school health
professionals. Journal of School Health 69(7):290-291.Matthews AW, McKay B, Ellison S. 2003. FDA re-examines ‘serving sizes,’ may change
misleading labels. Wall Street Journal, November 20, 2003.Mayor S. 2004. Government task force needed to tackle obesity. British Medical Journal
328:363.McQueen DM. 2002. Strengthening the evidence base for health promotion. Health Promo-
tion International 16(3):261-268.Mello MM, Rimm EB, Studdert DM. 2003. The McLawsuit: The fast-food industry and legal
accountability for obesity. Health Affairs 22(6):207-216.Mensah GA, Goodman RA, Zaza S, Moulton AD, Kocher PL, Dietz WH, Pechacek TF,
Marks JS. 2004. Law as a tool for preventing chronic disease: Expanding the range ofeffective public health strategies. Preventing Chronic Disease 1(1):1-8.
541

APPENDIX D 375
Mercer SL, Green LW, Rosenthal AC, Husten CG, Khan LK, Dietz WH. 2003. Possiblelessons from the tobacco experience for obesity control. American Journal of ClinicalNutrition 99(Suppl):1073S-1082S.
Muris T. 2004. Don’t blame TV. The Wall Street Journal. p. A10, June 25, 2004.New York Times. 2004. The gun’s lobby bull’s eye. New York Times. February 25, 2004.Nielsen SJ, Popkin BM. 2003. Patterns and trends in food portion sizes, 1977-1998. JAMA
289:450-453.Nielsen SJ, Siega-Riz AM, Popkin BM. 2003. Trends in food locations and sources among
adolescents and young adults. Preventive Medicine 35:107-113.NIH (National Institutes of Health). 2004. School-Based Interventions to Prevent Obesity.
[Online]. Available: http://grants.nih.gov/grants/guide/pa-files/PA-04-145.html [accessedAugust 22, 2004].
Parmet WE, Daynard RA. 2000. The new public health litigation. Annual Review of PublicHealth 21:437-454.
Revill J. 2003. Food giants join Britain’s war on flab. The Observer. November 16, 2003.Schroeder SA. 2004. Tobacco control in the wake of the 1998 Master Settlement Agreement.
New England Journal of Medicine 350(3):293-301.Shults RA, Elder RW, Sleet DA, Nichols JL, Alao MO, Carande-Kulis VG, Zaza S, Sosin DM,
Thompson RS, Task Force on Community Preventive Services. 2001. Reviews of evi-dence regarding interventions to reduce alcohol-impaired driving. American Journal ofPreventive Medicine 21(4S):66-88.
Sowden AJ, Arblaster L. 2004. Mass media interventions for preventing smoking in youngpeople (Cochrane Review). The Cochrane Library Issue 3.
Stein R. 2003. Obesity on FDA’s plate? Washington Post. November 20, 2003.Strasburger VC, Donnerstein E. 1999. Children, adolescents and the media: Issues and solu-
tions. Pediatrics 103(1):129-139.Vernick JS, Mair JS, Teret SP, Sapsin JW. 2003. Role of litigation in preventing product-
related injuries. Epidemiologic Reviews 25:90-98.Warner KE, Jacobsen PD, Kaufman NJ. 2003. Innovative approaches to youth tobacco con-
trol: Introduction and overview. Tobacco Control 12(June):ii.Wechsler H, Devereaux RS, Davis M, Collins J. 2000. Using the school environment to
promote physical activity and healthy eating. Preventive Medicine 31:S121-S137.WHO (World Health Organization). 2003. Framework Convention on Tobacco Control.
[Online]. Available: http://www.who.int/tobacco/fctc/en/ [accessed February 25, 2004].WHO. 2004. Global Strategy on Diet, Physical Activity and Health. [Online]. Available:
http://www.who.int/gb/ebwha/pdf_files/WHA57/A57_9-en.pdf [accessed August 22,2004].
Yach D, Hawkes C, Epping-Jordan JE, Galbraith S. 2003. The World Health Organization’sFramework Convention on Tobacco Control: Implications for global epidemics of food-related deaths and disease. Journal of Public Health Policy 24(3/4):274-290.
Young LR, Nestle M. 2002. The contribution of expanding portion sizes to the US obesityepidemic. American Journal of Public Health 92:246-249.
Zernike K. 2003. Is obesity the responsibility of the body politic? New York Times. Novem-ber 9, 2003.
542

543

377
Workshop Programs
E
STRATEGIES FOR DEVELOPING SCHOOL-BASED POLICIES THAT PROMOTE
NUTRITION AND PHYSICAL ACTIVITY AMONG CHILDREN AND YOUTH
WORKSHOP SPONSORED BY THE
COMMITTEE ON PREVENTION OF OBESITY IN CHILDREN AND YOUTH
INSTITUTE OF MEDICINE
JUNE 16, 20031:00 PM—5:30 PM
NATIONAL ACADEMY OF SCIENCES AUDITORIUM
NAS BUILDING
2100 C STREET, NWWASHINGTON, DC 20418
PROGRAM
1:00 pm Welcome and IntroductionsJeffrey Koplan, M.D., M.P.H., Chair, Committee on
Prevention of Obesity in Children and Youth
1:10 Strategies for Developing School-Based HealthPromotion PoliciesHarold Goldstein, Dr.P.H., California Center for Public
Health Advocacy, Davis, CA
544

378 PREVENTING CHILDHOOD OBESITY
1:30 Helping Public Schools Meet Expectations: Balancing ObesityPrevention and Physical Activity Goals with Fiscal andCurriculum RealitiesAlex Molnar, Ph.D., Education Policy Studies
Laboratory, Arizona State University, Tempe, AZ
1:50 Discussion
2:30 Break
2:50 Panel DiscussionMark Vallianatos, J.D., Occidental College,
Los Angeles, CAJudith Young, Ph.D., National Association for Sport
and Physical Education, Reston, VAJennifer Wilkins, Ph.D., R.D., Division of Nutritional
Sciences, Cornell University, Ithaca, NYPaula Hudson Collins, M.H.D.L., R.H.Ed.,
North Carolina Department of Public Instruction,Raleigh, NC
3:30 Discussion
4:30 Open ForumTracy Fox, M.P.H., R.D., Produce for Better Health
FoundationDianne Ward, M.S., Ed.D., University of North Carolina
at Chapel HillMargo Wootan, Sc.D., Center for Science in the Public
InterestKimberly F. Stitzel, M.S., R.D., The American Dietetic
AssociationBill Wilkinson, A.I.C.P., National Center for Bicycling
& WalkingAlicia Moag-Stahlberg, M.S., R.D., L.D., Action for
Healthy KidsWilliam Potts-Datema, M.S., Harvard School of Public
HealthAmy Harris, R.N., National Association of Orthopedic
NursesVivian Pilant, M.S., R.D., South Carolina Department of
Education
545

APPENDIX E 379
Donna Mazyck, R.N., B.S.N., N.C.S.N., Maryland StateDepartment of Education; National Association ofSchool Nurses
Sandra Hassink, M.D., A.I. duPont Hospital forChildren; American Academy of Pediatrics (AAP)
5:30 Adjourn
546

380 PREVENTING CHILDHOOD OBESITY
THE PREVENTION OF CHILDHOOD OBESITY:UNDERSTANDING THE INFLUENCES OF MARKETING,
MEDIA, AND FAMILY DYNAMICS
WORKSHOP SPONSORED BY THE
COMMITTEE ON PREVENTION OF OBESITY IN CHILDREN AND YOUTH
INSTITUTE OF MEDICINE
TUESDAY, DECEMBER 9, 20031:00 PM—5:30 PM
KECK CENTER OF THE NATIONAL ACADEMIES
CONFERENCE ROOM 100500 FIFTH STREET, N.W.Washington, DC 20001
PROGRAM
1:00 pm Welcome and IntroductionsJeffrey Koplan, M.D., M.P.H., Chair, Committee on
Prevention of Obesity in Children and Youth
1:10 Marketing and Media Influences: IdentifyingChallenges and Effective Strategies for thePrevention of Childhood Obesity
1:10 – 1:30 pmNeal Baer, M.D., Executive Producer
University City, CA
1:30 – 1:50 pmEric Rosenthal, B.B.A., M.S., Marketing Specialist,
Frankel, Chicago, IL
1:50 – 2:10 pmMary Engle, Esq., Division of Advertising Practices,
Federal Trade Commission, Washington, DC
2:10 Discussion Among Presenters and the Committee
3:10 Break
547

APPENDIX E 381
3:30 Family Dynamics: Challenges and Opportunities forPreventing Childhood Obesity and Promoting HealthfulLifestylesSusan McHale, Ph.D., The Pennsylvania State University,
University Park, PA
4:00 Discussion
4:45 Open ForumJoan Almon, U.S. Alliance for ChildhoodLilian Cheung, D.Sc., R.D., Harvard School of Public HealthJessica Donze, M.P.H., R.D., American Dietetic AssociationTracy Fox, M.P.H., R.D., Produce for Better Health
FoundationLynn Fredericks, B.A., FamilyCook ProductionsVelma LaPoint, Ph.D., Howard UniversityDavid Meyers, M.D., United States Breastfeeding CommitteeJill Nicholls, Ph.D., National Dairy Council/Dairy
Management Inc.Anne-Marie Nocton, M.S., M.P.H., R.D., Sports,
Cardiovascular, and Wellness NutritionistsRobert Pallay, M.D., American Academy of Family
PhysiciansMercedes Rubio, Ph.D., American Sociological AssociationMargo Wootan, Sc.D., Center for Science in the Public
Interest
5:30 Adjourn
548

549

383
Biographical Sketches
F
Jeffrey P. Koplan, M.D., M.P.H. (Chair), is the Vice President for AcademicHealth Affairs at the Woodruff Health Sciences Center at Emory Universityin Atlanta. He received a B.A. from Yale College, M.D. from Mt. SinaiSchool of Medicine, and M.P.H. from the Harvard School of Public Health.He is board certified in internal and preventive medicine. From 1998 to2002, Dr. Koplan served as the Director of the Centers for Disease Controland Prevention (CDC) and Administrator of the Agency for Toxic Sub-stances and Disease Registry. He worked in the area of enhancing theinteractions between clinical medicine and public health by leading thePrudential Center for Health Care Research, a nationally recognized healthservices research organization. Dr. Koplan has worked on a broad range ofmajor public health issues, including infectious diseases such as smallpoxand HIV/AIDS, environmental issues such as the Bhopal chemical disaster,and the health toll of tobacco and chronic diseases, both in the UnitedStates and globally. Dr. Koplan is a Master of the American College ofPhysicians, an Honorary Fellow of the Society of Public Health Educators,and a Public Health Hero of the American Public Health Association. Hewas elected to the Institute of Medicine (IOM) in 1999. He has served onmany advisory groups and consultancies on public health issues in theUnited States and overseas and authored more than 170 scientific papers.
Dennis M. Bier, M.D., is Professor of Pediatrics and the Director of the U.S.Department of Agriculture/Agricultural Research Service (USDA/ARS)Children’s Nutrition Research Center at the Baylor College of Medicine in
550

384 PREVENTING CHILDHOOD OBESITY
Houston. Prior to this appointment, he was Co-director of the PediatricEndocrinology and Metabolism Division and Director of the Pediatric Clini-cal Research Center at Washington University School of Medicine in St.Louis. Dr. Bier received his B.S. from LeMoyne College and his M.D. fromNew Jersey College of Medicine. Dr. Bier’s primary research interests arefocused on the regulation of inter-organ transport of metabolic fuels with aspecial emphasis on the substrate and hormonal regulation of glucose, lipid,and protein/amino acid fuels. He has expertise in the areas of nutrition inhuman health and in the prevention and treatment of disease, particularlythe role of maternal, fetal, and childhood nutrition on the growth, develop-ment, and health of children through adolescence; the long-term conse-quences of nutrient inadequacy during critical periods of embryonic andfetal life, infancy, and childhood on the pathogenesis of adult chronic dis-eases; macronutrients; intermediary metabolism; tracer kinetics; and diabe-tes, obesity, and endocrine disorders. Dr. Bier has served as President of theInternational Pediatric Research Foundation, Chair of the USDA/ARS Hu-man Studies Review Committee, Councilor for the American Pediatric Soci-ety, and as a member of the 1995 USDA/HHS Dietary Guidelines AdvisoryCommittee, the IOM’s Food and Nutrition Board (FNB), and the IOMCommittee on Implications of Dioxin in the Food Supply. He was elected tothe IOM in 1997. He currently serves on the Board of the International LifeSciences Institute (ILSI) North America, and he is a member of theMcDonald’s Global Advisory Council on Healthy Lifestyles.
Leann L. Birch, Ph.D., is the Distinguished Professor of Human Develop-ment and Nutritional Sciences at The Pennsylvania State University in Uni-versity Park. She holds a Ph.D. in psychology from the University of Michi-gan. Dr. Birch’s research has focused on the development of eating behaviorsin infants, children, and adolescents. Her research explores factors shapingfood preferences in infants and children, regulation of food intake in chil-dren, dieting and problems of energy balance in school-age girls, predictorsof maternal child feeding styles, and parental and environmental influenceson children’s dietary practices. She currently receives research support fromthe National Institute of Child Health and Human Development (NICHD).Dr. Birch has received national and international recognition for her workincluding the Lederle Award from the American Society for NutritionalSciences. She is the author of more than 150 publications.
Ross C. Brownson, Ph.D., is Professor of Epidemiology and the Chair ofthe Department of Community Health at St. Louis University School ofPublic Health in Missouri. He was formerly Division Director with theMissouri Department of Health. He received his Ph.D. in environmentalhealth and epidemiology at Colorado State University. Dr. Brownson is a
551

APPENDIX F 385
chronic disease epidemiologist whose research has focused on tobacco useprevention, promotion of physical activity, and the evaluation of commu-nity-level interventions. He is the principal investigator of a CDC-fundedPrevention Research Center that is developing innovative approaches tochronic disease prevention among high-risk rural adults. Dr. Brownson isalso developing and testing effective dissemination strategies for CDC de-signed to increase rates of physical activity among adults. Dr. Brownsonreceives research support from the National Institutes of Diabetes and Di-gestive and Kidney Diseases to conduct a diabetes prevention study aimedat promoting walking among high-risk rural adults. Dr. Brownson receivessupport from the Robert Wood Johnson Foundation (RWJF) to understandthe environmental characteristics of activity-friendly communities and tomeasure the perceptual qualities of urban settings through RWJF’s ActiveLiving Research program. He is a member of numerous editorial boardsand is associate editor of the Annual Review of Public Health. Dr. Brownsonis the author or editor of several books including Chronic Disease Epidemi-ology and Control, Applied Epidemiology, and Evidence-Based PublicHealth.
John Cawley, Ph.D., is an Assistant Professor in the Department of PolicyAnalysis and Management at Cornell University. Dr. Cawley received hisundergraduate degree in economics from Harvard University and his Ph.D.in economics from the University of Chicago. Dr. Cawley joined the Cornellfaculty in 2001 after spending two years as a Robert Wood Johnson Scholarin Health Policy Research at the University of Michigan. His research fo-cuses on health economics, in particular the economics of obesity. He iscurrently studying the effect of body weight on labor market outcomes suchas wage rates, unemployment, and employment disability; the role of bodyweight in the decision of adolescents to initiate smoking; the demand foranti-obesity pharmaceuticals; and the extent to which consumption of calo-ries can be considered addictive. His research is conducted with supportfrom the Economic Research Initiative on the Uninsured, the University ofMichigan Retirement Research Consortium, J.P. Morgan Private Bank Glo-bal Philanthropic Services, RWJF, Merck, and USDA. In addition to hisaffiliation with Cornell, Dr. Cawley is a Faculty Research Fellow of theNational Bureau of Economic Research in the Health Economics and HealthCare programs. He also serves on an advisory board to the CDC’s ProjectMOVE: Measurement of the Value of Exercise.
George R. Flores, M.D., M.P.H., is a Senior Program Officer with TheCalifornia Endowment, a major health foundation, where his focus is ondisparities in health status, prevention of childhood obesity, community-based public health, and health policy. Dr. Flores served previously as
552

386 PREVENTING CHILDHOOD OBESITY
Health Officer and Director of Public Health in San Diego and SonomaCounties, Deputy Health Officer in Santa Barbara County, Assistant Clini-cal Professor at the University of California San Francisco School of Medi-cine, and Program Director for Project HOPE in Guatemala. He is a founderand member of the Board of Directors of the Latino Coalition for a HealthyCalifornia. Dr. Flores is an alumnus of the University of Utah College ofMedicine, the Harvard School of Public Health, the Kennedy School ofGovernment, and the Public Health Leadership Institute. He has served onthe IOM Committee on Assuring the Health of the Public in the 21stCentury.
Simone A. French, Ph.D., is Professor in the Division of Epidemiology inthe School of Public Health at the University of Minnesota in Minneapolis.She received a B.A. in psychology from Macalester College in St. Paul,Minnesota, and a Ph.D. in psychology from the University of Minnesota inMinneapolis. Dr. French’s expertise and research focuses broadly on thesocial and environmental influences on eating and physical activity behav-iors, community-based strategies for eating behavior change, and adoles-cent nutrition and physical activity. Her obesity prevention research hasfocused on pricing strategies to promote sales of lower fat foods in cafete-rias and vending machines, and changing the availability and promotion ofhealthful foods in school cafeterias to influence student food choices. Shehas also researched eating disorders, dieting, and other weight managementstrategies among adolescents and adults. Dr. French presently receives re-search support that focuses on obesity and nutrition from the NationalHeart, Lung, and Blood Institute and NICHD. She serves as co-editor of theInternational Journal of Behavioral Nutrition and Physical Activity. Dr.French has authored more than 100 scientific papers in peer-reviewed aca-demic journals.
Susan L. Handy, Ph.D., is an Associate Professor in the Department ofEnvironmental Science and Policy, University of California at Davis. Sheearned a B.S. in civil engineering from Princeton University, an M.S. in civilengineering from Stanford University, and a Ph.D. in city and regionalplanning from the University of California at Berkeley. Dr. Handy’s re-search focuses on the relationships between transportation and land use,including the impact of land use on travel behavior, and the impact oftransportation investments on land development patterns. Her work is di-rected toward developing strategies to enhance accessibility and reduceautomobile dependence, including land use policies and telecommunica-tions services. She is the Chair of the Committee on Telecommunicationsand Travel Behavior and a member of the Committee on Transportationand Land Development of the Transportation Research Board. She is also a
553

APPENDIX F 387
co-principal investigator on a project funded by The RWJF’s Active Livingand Environmental Studies Program.
Robert C. Hornik, Ph.D., is the Wilbur Schramm Professor of Communica-tion and Health Policy at the Annenberg School for Communication, Uni-versity of Pennsylvania in Philadelphia. He has a wide range of experiencein mass-media communication evaluations, ranging from breastfeeding pro-motion, AIDS education, immunization and child survival projects, to anti-drug and domestic violence media campaigns at the community, national,and international levels. Dr. Hornik has served as a member of the IOMCommittee on International Nutrition Programs, the National ResearchCouncil (NRC) Committee on Communication for Behavior Change in the21st Century: Improving the Health of Diverse Populations, and the NRCCommittee to Develop a Strategy to Prevent and Reduce Underage Drink-ing. He has received the Andreasen Scholar award in social marketing, andthe Fisher Mentorship award from the International Communication Asso-ciation. He has also been a consultant to other agencies such as the U.S.Agency for International Development, UNICEF, CDC, and the WorldBank. Dr. Hornik serves on the editorial boards of several journals, includ-ing Social Marketing Quarterly and the Journal of Health Communication.Dr. Hornik was the scientific director for the evaluation of the Office ofNational Drug Control Policy’s National Youth Anti-Drug Media Cam-paign and he is currently the director of the University of Pennsylvania’sNational Cancer Institute-funded Center of Excellence in Cancer Commu-nication Research. He most recently edited Public Health Communicationand was the author of Development Communication, and co-author ofEducational Reform with Television: The El Salvador Experience, and To-ward Reform of Program Evaluation.
Douglas B. Kamerow, M.D., M.P.H., is the Chief Scientist for Health,Social, and Economics Research at RTI International where he focuses onhealth-related behaviors, evidence-based care, and improving the quality ofhealth care. Among his responsibilities is serving as principal investigatoron an evaluation of the RWJF’s National Diabetes Program. He is also aClinical Professor of Family Medicine at Georgetown University. A familyphysician who is also board certified in preventive medicine, Dr. Kamerowreceived his A.B. from Harvard College, M.D. from the University of Roch-ester, and M.P.H. from Johns Hopkins University. While a CommissionedOfficer in the U.S. Public Health Service, he served as Director of the Centerfor Practice and Technology Assessment, Agency for Healthcare Researchand Quality, Department of Health and Human Services and Director ofthe Clinical Preventive Services staff of the Public Health Service Office ofDisease Prevention and Health Promotion. He conceived and supervised
554

388 PREVENTING CHILDHOOD OBESITY
the creation of the Evidence-based Practice Centers Program and the Na-tional Guideline Clearinghouse, was managing editor of the first and sec-ond editions of the U.S. Preventive Services Task Force Guide to ClinicalPreventive Services, and led the development of the Put Prevention intoPractice campaign, which sought to incorporate clinical preventive services,including nutrition counseling, into routine medical practice.
Shiriki K. Kumanyika, Ph.D., M.P.H., R.D., is Professor of Epidemiologyin the Department of Biostatistics and Epidemiology, Associate Dean forHealth Promotion and Disease Prevention, and the Director of the Gradu-ate Program in Public Health Studies at the University of PennsylvaniaSchool of Medicine. She received her B.A. from Syracuse University, M.S.W.from Columbia University, Ph.D. in human nutrition from Cornell Univer-sity, and M.P.H. from Johns Hopkins University. The main themes in Dr.Kumanyika’s research concern the role of nutritional factors in the primaryand secondary prevention of chronic diseases with a particular focus onobesity, sodium reduction, and related health problems such as hyperten-sion and diabetes. She directs a National Institutes of Health (NIH)-fundedEXPORT (Excellence in Partnerships for Community Outreach, Research,and Training) Center that focuses on reduction of obesity-related healthdisparities. Dr. Kumanyika is the lead investigator or a collaborator onseveral federally-funded studies of obesity prevention and treatment inadults and children, of which some focus specifically on African Americans.She has served on a number of expert panels, including the 1995 and 2000U.S. Dietary Guidelines Advisory Committees, and she served on the NIHAdvisory Committee for the National Children’s Study in 2002-2003. Shewas vice-chair of the Joint WHO/FAO Expert Consultation on Diet, Nutri-tion and the Prevention of Chronic Diseases in 2002, and also chaired the2002 WHO Expert Consultation on Appropriate BMI Standards for AsianPopulations. Dr. Kumanyika’s current activities include serving on theIOM’s FNB, the NIH Clinical Obesity Research Panel, and the PreventionGroup of the International Obesity Task Force. She was elected to the IOMin 2003.
Barbara J. Moore, Ph.D., is the President and Chief Executive Officer ofShape Up America!, a national initiative to promote healthy weight andincreased physical activity in America. She earned an undergraduate degreein philosophy from Skidmore College, received her M.S. and Ph.D. in nutri-tion from Columbia University, and served as a Postdoctoral Fellow innutrition and physiology at the University of California at Davis. Previouspositions include service as Deputy Director in the Division of NutritionResearch Coordination at the NIH, Acting Assistant Director of Social and
555

APPENDIX F 389
Behavioral Sciences at the White House Office of Science and TechnologyPolicy, Chief Nutritionist of Weight Watchers International, and AssistantProfessor of Nutrition at Rutgers University. Dr. Moore has conductedresearch on animal models of obesity and on addressing the public healthand socioeconomic implications of obesity in the United States. She hasserved on the IOM Subcommittee on Military Weight Management.
Arie L. Nettles, Ph.D., is an Assistant Professor and Assistant ResearchScientist of Education, and previously served as Clinical Assistant Professorof Pediatrics and Communicable Diseases at the University of Michigan.Her research focuses on the study of academic achievement and the impactof sickle cell disease on children and equity issues in educational assess-ment. Prior to her appointment at the University of Michigan, she was anAssistant Professor of School Psychology at the University of Tennessee.Other faculty appointments include Tennessee State University, Fisk Uni-versity, and Trenton State College. Dr. Nettles has been a public schoolteacher in Iowa and Tennessee and a practicing school psychologist inKentucky and New Jersey. She is a licensed psychologist in Tennessee andMichigan, and nationally certified in school psychology, endorsed by theNational Association of School Psychology. She has a B.S. in social scienceeducation and M.S. in education administration from the University ofTennessee at Knoxville. She received a Ph.D. in psychology from VanderbiltUniversity specializing in clinical and school psychology. Dr. Nettles hasserved on the NRC Committee on Goals 2000 and the Inclusion of Studentswith Disabilities.
Russell R. Pate, Ph.D., is the Associate Dean for Research and a Professorat the Norman J. Arnold School of Public Health, University of SouthCarolina in Columbia. He received a B.S. in physical education from Spring-field College, and M.S. and Ph.D. in exercise physiology from the Univer-sity of Oregon. Dr. Pate’s research interest and expertise focuses on physi-cal activity measurement, determinants, and promotion in children andyouth. He also directs a national postgraduate course aimed at developingresearch competencies related to physical activity and public health. Dr.Pate is also involved in the CDC-funded Prevention Research Center at theUniversity of South Carolina. His research includes studies on preschoolers’physical activity levels and how schools can influence these levels and multi-center trials on the promotion of physical activity among middle and highschool-age girls. Dr. Pate serves as an investigator for the RWJF Active forLife program that encourages physical activity among seniors. He is a Past-President of both the American College of Sports Medicine and the Na-tional Coalition on Promoting Physical Activity.
556

390 PREVENTING CHILDHOOD OBESITY
John C. Peters, Ph.D., is the Associate Director of Food and BeverageTechnology and Director of the Nutrition Science Institute at Procter &Gamble Company in Cincinnati. He received his B.S. in biochemistry fromthe University of California at Davis and his Ph.D. in biochemistry andnutrition from the University of Wisconsin at Madison. Dr. Peters’ researchhas focused on amino acid metabolism and dietary intake, triglycerides andlipid levels in humans, effects of weight cycling on susceptibility to obesity,and effects of fat replacements on energy, fat intake, and micronutrientmetabolism. He has served on the scientific advisory board of the ArkansasChildren’s Hospital Research Institute; on the planning committee of theCincinnati Health Improvement Collaborative; as Vice Chair of the scien-tific advisory board of the ILSI Center for Health Promotion; and Treasurerof the public-private Partnership for Healthy Eating and Active Living. Dr.Peters is currently President of the ILSI Center for Health Promotion.
Thomas N. Robinson, M.D., M.P.H., is an Associate Professor of Pediat-rics and of Medicine in the Division of General Pediatrics and StanfordPrevention Research Center, Stanford University School of Medicine. Dr.Robinson received both his B.S. and M.D. from Stanford University andM.P.H. in maternal and child health from the University of California atBerkeley. He completed his internship and residency in pediatrics atChildren’s Hospital in Boston and at Harvard Medical School, and thenreturned to Stanford for postdoctoral training as a Robert Wood JohnsonClinical Scholar. Dr. Robinson’s community-, school-, and family-basedhealth behavior change research has focused on nutrition, physical activity,and smoking behavior in children and adolescents; the effects of televisionviewing on health-related behaviors; childhood obesity prevention and treat-ment; and using interactive communication technologies to promote healthbehavior change. Dr. Robinson was an RWJF Generalist Physician FacultyScholar awardee during his participation on this committee. Dr. Robinsonis board certified in pediatrics, a Fellow of the American Academy of Pedi-atrics, and practices general pediatrics and directs the Center for HealthyWeight at the Lucile Packard Children’s Hospital at Stanford.
Charles Royer, B.S., is a Senior Lecturer at the University of Washingtonwith appointments in the School of Public Health and Community Medi-cine and in the Evans School of Public Affairs. He is also National ProgramDirector of the Urban Health Initiative, an effort to improve the health andsafety of children across five regions. He holds a B.S. from the University ofOregon. From 1990 to 1994, Mr. Royer was Director of the Institute ofPolitics at Harvard University and Lecturer at the Kennedy School of Gov-ernment. Prior to this, Mr. Royer served as Mayor of Seattle from 1978 to1989, following a career in newspaper and television journalism. He has
557
APPENDIX F 391
served as President of the National League of Cities and as a member of theNational Commission on State and Local Public Service, the DemocraticNational Committee, and the President’s Commission on White HouseFellowships. He was named one of the top 20 American mayors in 1988and received the 1989 Distinguished Urban Mayor Award from the Na-tional Urban Coalition.
Shirley R. Watkins, M.Ed., is an Educational and Nutrition Services Con-sultant. From 1997 to 2001, she was Under Secretary for Food, Nutrition,and Consumer Services at USDA, the first African-American woman tohold that position. In that capacity she oversaw USDA’s food assistanceprograms and its dietary guidance promotion efforts. She also served USDAas Deputy Assistant Secretary for Marketing and Regulatory Programs andDeputy Under Secretary for Food, Nutrition, and Consumer Services. Be-fore joining USDA in 1993, Ms. Watkins was Director of Nutrition Servicesfor Memphis, Tennessee city schools. Previous positions included food-service supervisor, home economics teacher, elementary school teacher, anda home demonstration agent with the University of Arkansas ExtensionService. She is a past president of the American School Food Services Asso-ciation. She received a B.S. in home economics from the University ofArkansas at Pine Bluff and an M.Ed. from the University of Memphis.
Robert C. Whitaker, M.D., M.P.H., is a Senior Fellow at MathematicaPolicy Research, Inc., in Princeton, New Jersey. Before joining Mathematicahe was a Visiting Senior Research Scholar at the Center for Health andWellbeing at the Woodrow Wilson School of Public and International Af-fairs at Princeton University, and was an Associate Professor of Pediatricsat the University of Cincinnati College of Medicine and CincinnatiChildren’s Hospital Medical Center. His research has focused on the child-hood antecedents of adult chronic disease. This has included studies onschool nutrition, obesity prevention strategies in preschool children, par-ent-child feeding interaction, the epidemiology of childhood obesity, andthe determinants of social and emotional well-being in children. He servedon the IOM Committee on Dietary Risk Assessment in the WIC Program.Dr. Whitaker received a B.A. in chemistry from Williams College, an M.D.from The Johns Hopkins University School of Medicine, and an M.P.H.from the University of Washington School of Public Health and Commu-nity Medicine. Dr. Whitaker completed his residency and fellowship inpediatrics at the University of Washington School of Medicine, and hereceived postdoctoral training as a Robert Wood Johnson Clinical Scholar.
558

392 PREVENTING CHILDHOOD OBESITY
IOM Staff
Tazima A. Davis is a Research Associate in the FNB at the IOM and hasbeen with the FNB since September 2000. Prior to joining the NationalAcademies, she worked as a Quality Control Supervisor with Kraft Foodsand Bestfoods Foodservice. Ms. Davis earned a B.S. in food science fromthe University of Illinois at Urbana-Champaign (UIUC). During her under-graduate years at UIUC, she participated in research internships includingice cream ingredient development in Chicago; applied food microbiologyresearch in Boslwart, Netherlands; and carotenoid research in Urbana, Illi-nois.
Vivica I. Kraak, M.S., R.D., is a Senior Program Officer in the IOM’s FNB.In addition to working on the Prevention of Obesity in Children and YouthStudy, she directs the international activities within FNB. She received herB.S. in nutritional sciences from Cornell University and completed a coordi-nated M.S. in nutrition and dietetic internship at Case Western ReserveUniversity and the University Hospitals of Cleveland. Prior to joining theIOM in 2002, she worked as a Clinical Dietitian at Columbia-PresbyterianMedical Center and as a Public Health Nutritionist specializing in HIVdisease in New York City. From 1994 to 2000, she was a Research Nutri-tionist in the Division of Nutritional Sciences at Cornell University, whereshe collaborated on several domestic and international food policy andcommunity nutrition research initiatives. She has co-authored a variety ofpublications related to food security and community food systems, nutri-tion and HIV/AIDS, international food aid and food security, viewpointsabout genetically engineered foods, use of dietary supplements, and theinfluence of commercialism on the food and nutrition-related decisions andbehaviors of children and youth.
Catharyn T. Liverman, M.L.S., is a Senior Program Officer in the FNB andthe Board on Health Sciences Policy at the IOM. She served as study direc-tor for this study. In 12 years at IOM, she has worked on projects address-ing a number of topics, including veterans’ health, drug abuse, injury pre-vention, and clinical trials of testosterone therapy. IOM reports she hasco-edited include Testosterone and Aging: Clinical Research Directions;Gulf War and Health, Vol. 1; Reducing the Burden of Injury; Toxicologyand Environmental Health Information Resources; and The Developmentof Medications for the Treatment of Opiate and Cocaine Addiction. Herbackground is in medical library science, with previous jobs at the NationalAgricultural Library and the Naval War College Library. She received herB.A. from Wake Forest University and her M.L.S. from the University ofMaryland.
559

APPENDIX F 393
Rose Marie Martinez, Sc.D., is the Director of the IOM’s Board on HealthPromotion and Disease Prevention . Prior to joining the IOM, Dr. Martinezwas a Senior Health Researcher at Mathematica Policy Research from 1995to 1999 where she conducted research on the impact of health systemchange on the public health infrastructure, access to care for vulnerablepopulations, managed care, and the health-care workforce. Dr. Martinez isa former Assistant Director for Health Financing and Policy with the U.S.General Accounting Office where she directed evaluations and policy analy-sis in the area of national and public health issues. She also served as Chiefof Health Studies at the Regional Institute for Health and Social Welfare,the research arm of the Regional Ministry of Health in Madrid, Spain. Dr.Martinez received her B.A. from the University of Southern California andher Doctor of Science from the Johns Hopkins School of Hygiene andPublic Health.
Linda D. Meyers, Ph.D., is the Director of the IOM’s FNB. She has alsoserved as FNB Deputy Director and as a Senior Program Officer. Prior tojoining the IOM in 2001, she worked for 15 years in the Office of DiseasePrevention and Health Promotion in the U.S. Department of Health andHuman Services where she was a Senior Nutrition Advisor, Deputy Direc-tor, and Acting Director. Dr. Meyers has received a number of awards forher contributions to public health, including the Secretary’s DistinguishedService Award for Healthy People 2010 and the Surgeon General’s Medal-lion. Dr. Meyers has a B.A. in health and physical education from GoshenCollege in Indiana, M.S. in food and nutrition from Colorado State Univer-sity, and Ph.D. in nutritional sciences from Cornell University.
Janice Rice Okita, Ph.D., R.D., is a Senior Program Officer in the IOM’sFNB. Since joining the IOM in 2002, she has worked on projects involvingevaluation of the safety of dietary supplements for the Food and DrugAdministration, and reviewing the food packages used in the USDA SpecialSupplemental Food Program for Women, Infants, and Children. Dr. Okitaparticipated in biomedical research in the Department of PharmaceuticalSciences, College of Pharmacy, Washington State University in Pullmanfrom 1990-2001; the Department of Biochemistry, Medical College of Wis-consin in Milwaukee from 1988-1990; and the Platelet Biochemistry Labo-ratory, Blood Center of Southeastern Wisconsin in Milwaukee from 1982-1988. Dr. Okita earned a B.S. in human food and nutrition from FloridaState University in Tallahassee, and Ph.D. in biochemistry from the Univer-sity of Texas Health Science Center at Dallas. She is a Registered Dietitianand practiced clinical dietetics in Dallas from 1972 to 1974.
560

394 PREVENTING CHILDHOOD OBESITY
Shannon L. Ruddy is a Senior Program Assistant in the FNB at the IOM.She has also worked with the NRC where she worked on several reports,including Partnerships for Reducing Landslide Risk, Fair Weather: Effec-tive Partnerships in Weather and Climate Services, Government Data Cen-ters: Meeting Increasing Demands, Resolving Conflicts Arising from thePrivatization of Environmental Data, Review of EarthScope IntegratedScience, and National Spatial Data Infrastructure Partnership Programs:Rethinking the Focus. She has been with the National Academies since2001. She holds a B.A. in environmental science from LaSalle University inPhiladelphia. Previously, she worked as a Researcher for Booz-Allen &Hamilton in the Environmental Protection Agency’s Region 3 CERCLA/Superfund Records Center.
561

395
Index
A
Abdominal obesity, 69, 70Academic performance, 105, 215, 252, 253Action plan for prevention
clinical medicine approach, 107-108,109
contexts for, 25-44definitions and terminology, 79-83developing recommendations, 16, 111-
115, 323energy balance, 3, 90-106evidence-based strategies, 3, 16, 107-
115, 322-323framework, 83-85goals, 4-5, 86-90, 115public health approach, 108-110, 115,
127, 129Active Living by Design, 206Added caloric sweeteners, 31, 145-146, 290Adolescents. See Children and adolescent
obesity; Older Children and YouthAdopted children, studies, 93Adults
diabetes, 68energy balance, 90, 160obesity, 5, 22, 43-44, 63-65, 68overweight, 80physical activity, 29, 35, 179
prevention goals, 88treatment for obesity, 108TV viewing time, 160-161
Advertising and marketingalcoholic beverages, 175bans and restrictions on, 174-175, 178,
268, 353, 362, 363codes and monitoring mechanisms, 176-
177and eating behavior, 169-170, 172-173energy density of advertised foods, 172and energy imbalance, 172, 173, 174,
355ethnic groups targeted by, 106evidence of effects of, 353-354, 355expenditures, 172exposure time for children, 171, 174First Amendment rights, 174-175, 353,
362health and nutrient claims, 169-170, 176litigation, 354packaging, 172, 356prevention through, 128, 268, 353, 367;
see also Public educationquantity and nature of commercials, 172recommendations, 9, 177research needs, 177, 268in schools, 176, 251, 265-269self-regulation by industry, 175, 354
562

396 INDEX
social and public health pressures, 366standards development, 175-176targeting children, 106, 145, 172, 174,
355television commercials, 8, 44, 172-173,
174, 265, 301, 302, 355vulnerability of children to, 8, 172-173,
267-268, 302, 353-354, 355Advertising Council, 184Advocacy
community mobilization, 210-211by health professionals, 223-225media, 181, 183, 351by parents, 300
Ageand BMI, 56-57, 63-65and child obesity trends, 1, 63
AGRICOLA database, 339, 340Agricultural policies, 6-7, 144-146, 148, 217African Americans. See also Ethnic groups;
Racial and ethnic disparitiesbody image dissatisfaction, 66, 104defined, 58 n.4diabetes, 68interventions for, 200, 274obesity trends, 60, 105targeted marketing of foods to, 106
Alabama, 61Alaska, 61Alcohol prevention analogies, 175, 352,
354, 366America on the Move initiative, 141American Academy of Family Physicians,
224American Academy of Pediatrics, 174, 224,
253, 290, 358American Cancer Society, 201American Council on Food and Nutrition,
367 n.6American Federation of School Teachers,
265American Indians. See also Ethnic groups;
Racial and ethnic disparitiesbody image dissatisfaction, 66, 104defined, 58 n.4diabetes, 68obesity trends, 60, 105school-based dietary interventions, 245,
246, 247-248American Medical Association, 224American Planning Association, 210, 218
American Psychological Association, 265,371
PsychINFO database, 341Task Force on Advertising and Children,
173-174, 355, 356American Public Health Association, 132,
358, 359-360American Stop Smoking Intervention Study
(ASSIST), 199Americans in Motion, 224Americans’ Use of Time Study, 29, 159Animal studies, 94Appetite. See also Hunger; Satiety
regulatory systems, 95, 157Arkansas BMI initiative, 271Asian/Pacific Islanders. See also Ethnic
groups; Racial and ethnic disparitiesbody image dissatisfaction, 104defined, 58 n.4diabetes, 68obesity trends, 105
Association of State and Territorial HealthOfficials, 132, 218
Atherosclerosis, 69Australia, 44, 180, 256-257Avon Longitudinal Study of Pregnancy and
Childhood (ALSPAC), 140-141Away-from-home foods. See also Fast food;
Restaurant industry; School food andbeverages
consumption trends, 27-28, 30, 161,357-358
costs and convenience, 26defined, 331energy density, 92, 162, 163energy intake, 30, 158, 161frequency of dining out, 161-162leisure/social aspects, 28nutrition labeling, 163-164, 165, 168,
197, 356portion sizes, 158
B
Back to Sleep campaigns, 179Balanced diet
benefits associated with, 97defined, 91, 331dietary guidelines, 96-97ethnically appropriate foods, 144, 156responsibility to provide, 292-293
563

INDEX 397
Basal metabolism, 331Behavioral research, 17, 323-324Behavioral Risk Factor Surveillance System
(BRFSS), 29, 35, 36, 61, 160Behavioral settings. See Community
environment; Home environment;School environment
Better Business Bureau, 175Beverages. See also Food and beverage
industry; Milk and other dairyproducts; School food and beverages;Sodas and fruit drinks
consumption trends, 33Blood pressure. See High blood pressure;
HypertensionBlue Cross of California, 201Body fat, 54, 80, 93, 137, 140, 334. See
also Body mass indexBody image, 66, 91-92, 100, 103-104, 199Body mass index
age-specific trends, 56-57, 63-65, 80,336
beverage consumption and, 293-294calculation, 80charts, 1 n.1, 55, 79-80, 88, 89-90clinical screening and tracking, 221-222,
307-308and co-morbidities, 62, 80crossing percentiles, 89-90defined, 79, 331-332and diabetes, 24, 62, 68distribution trends, 61-62, 80, 336ethnicity and, 58-60gender tends, 56-58obesity definition, 1 n.1, 22, 54-55, 63optimum population goals, 86, 88-90overweight, 80, 336revised growth reference, 55school screening, 270-271, 308socioeconomic status and, 60-61TV viewing and, 302
Body weightCDC guidelines for children, 89and energy intake, 159goals, 89-90growth spurts and, 91, 307as health issue, 306-308healthy, 335heritability, 91, 93, 94inappropriate gain, 90measurement, 137, 140
monitoring, 306-308physiological regulation of, 159survey data, 89, 137, 140
Boy Scouts, 202Boys and Girls Clubs of America, 44, 202Brain
regulation of energy balance, 69-70, 94,95, 157
stress response, 70Breastfeeding, 222, 288-290Built environment. See also Local
communitiescity planning, 210community interventions, 203, 204-217correlation studies, 206-208defined, 332designing for physical activity, 11, 12,
125, 132, 196, 204-211, 273-274evaluation of interventions, 208-209food access, 215-217land development codes, 210race/ethnicity and, 205rating, 218recommendations, 11, 209-211, 213-
214, 220recreational facilities, 206, 211research needs, 208-209safety considerations, 11, 205, 207-208,
211schools, 213-215, 273-274smart growth principles, 209, 210socioeconomic status and, 205, 207street-scale interventions, 208transportation issues, 38, 205walking and biking opportunities, 207,
208, 209, 210, 211-215
C
California, 71, 103-104, 180, 200, 201,213, 214, 242, 248, 358, 359
Caloric sweeteners. See Added caloricsweeteners
Calories, defined, 332. See also Energyexpenditure; Energy intake
Canada, 44, 68, 356Cancer, 69, 107, 169Carbohydrates, 34Cardiovascular disease
food label health claims, 169
564

398 INDEX
prevention interventions, 107, 109, 196,200, 223, 262
risk factors, 23, 69Center for Consumer Freedom, 367 n.6Centers for Disease Control and Prevention,
346BMI charts, 1 n.1, 55, 79-80, 88, 89-90grants program, 132, 133guidelines for healthy weight, 89health curriculum recommendations,
261Healthy Days Measures, 218physical activity promotion, 141, 255Project MOVE, 136-137REACH 2010 initiative, 200recommended role, 130-131research funding, 135, 204revised growth reference, 55School Health Index, 274-275surveillance and monitoring, 29, 37, 61,
137tobacco prevention policies, 358VERB campaign, 141, 182-183, 184
Check-off programs, 145Child and Adolescent Trial for
Cardiovascular Health (CATCH),245, 246, 256, 262-263, 270
Child and Adult Care Food Program(CACFP), 142, 143
Childhood and adolescent obesity. See alsoEpidemic of childhood/adolescentobesity; Prevalence of childhood/adolescent obesity
abuse and neglect and, 287adult obesity trends and, 63-65age-related trends, 1, 63and co-morbid health risks, 62, 67-69,
319definitions, 1 n.1, 22, 56, 63, 79-81,
115, 336food insecurity and, 215genetics and, 65, 91, 94, 106health care costs, 72intergenerational transmission, 65international dimensions, 2, 22medical conditions and, 91public interest, 40-43
Children and youth. See also Infants; Olderchildren and youth; Toddlers andyoung children
balanced diet, 91
BMI distributions, 61-62, 80, 336diabetes, 23, 73energy balance, 90, 97energy expenditure, 90energy requirements, 97, 158, 167-168free time, 36, 38, 160physical activity trends, 35-36, 160purchasing influence, 172, 292, 302
Children’s Advertising Review Unit, 175-176
Cholelithiasis, 67, 72Cholesterol, dietary, 180Church-based interventions, 199-200CINAHL (Cumulative Index to Nursing and
Allied Heath Literature), 339, 340Class of 1989 Study, 197Clinical medicine. See also Treatment of
obesityeffectiveness of interventions, 365evidence-based approach, 107-108, 109preventive services, 221-224, 226
Clinical practice guidelines, 107Coalition building, 7, 128, 198-199, 200,
202-203, 225-226Cochrane Database, 339, 340Common Sense for Consumption Act, 363Community-based interventions. See also
Built environment; Localcommunities
advocacy, 210-211categories of, 346-349child/youth programs, 197-198, 201-204church-based, 199-200coalition building, 7, 10, 11, 128, 198-
199, 200, 202-203, 225-226culturally appropriate and targeted
strategies, 198, 199-201, 203demonstration projects, 132, 200, 204,
208-209, 213dietary changes, 196, 197ecological framework, 196-199, 203by employers, 195, 202evaluation of, 11, 17, 203-204, 217-219,
325evidence of effectiveness, 46, 196-198,
222-223, 348food-access-related, 11, 144, 216-217,
218, 357-358funding, 132-133, 209guide to preventive services, 209, 348-
349
565

INDEX 399
large-scale, 196-197, 217-219, 345, 347neighborhood associations, 210-211nutrition education, 198, 201physical activity, 12, 179-180, 196, 197,
201, 202, 211-215public health preventive services, 125,
200, 346, 347, 348-349recommendations, 10-12, 201-204, 219-
221, 225recreational programs, 202“report cards,” 218by youth organizations, 201
Community centers, schools as, 272-274Community environment. See also Built
environment; Local communitiesaccess to food products, 144, 215-217,
357-358health impact assessment, 217-219
Community health careadvocacy by professional organizations,
224-225counseling by health-care professionals,
221-223insurance coverage, 225-226preventive services, 12, 221-225, 226,
348-349quality-improvement programs, 226recommendations, 12, 225, 226-227
Community Health Status IndicatorsProject, 218
Community Preventive Services Taskforce,361
Co-morbidities of obesity. See also DiabetesBMI and, 62, 80defined, 332disorders, 67economic costs, 23, 70-71health risks of children, 62, 67-69trends, 22, 62
Congress for the New Urbanism, 210Consumer attitudes. See also Public interest
in obesitytrends, 40-43
Consumer information, 128, 141-142,163
Continuing Survey of Food Intakes byIndividuals, 97, 137, 138, 159, 163,293
Corn subsidies, 146Coronary artery disease, 69Cost-reduction interventions, 46, 347, 349
Costs of childhood obesity. See alsoEconomic costs of obesity
health-care-related, 70-72integrated view of, 69-70physical health, 65, 67-69, 71, 73social and emotional health, 22-24, 65,
66-67, 69-70, 71, 73Counseling
by health-care professionals, 221-223at school, 269-270
Current Population Survey, 45
D
Dairy products. See Milk and other dairyproducts
Deaths, 67, 68, 73Demographic trends, 25-40Demonstration projects, 132, 200, 204,
208-209, 213Denmark, 287Depression and depressive symptoms, 66,
67, 69-70, 105Diabetes, type 1, 67 n.5Diabetes, type 2
in adults, 68BMI and, 24, 62, 68in children, 23, 73complications of, 68, 69in ethnic minority groups, 23, 68gestational, 65, 288health care costs, 71-72high-fructose corn syrup and, 146lifetime risk, 2, 23, 67-68prevalence, 67-68, 225risk factors, 68
Diet. See also Balanced dietdeaths related to, 67, 73nutrient density, 96
Dietary Guidelines Advisory Committee,131
Dietary Guidelines for Americans, 13, 96-97, 131, 164, 165, 239, 240, 292,332
Dietary intakeeconomic environment and, 100, 101,
215-216, 358and energy balance, 95-98, 101health claims advertising and, 169-170by macronutrient, 34physiological regulation of, 159
566

400 INDEX
psychosocial and behavioralconsiderations, 95-98, 105
research challenges, 97-98trends, 28, 30-33, 97
Dietary interventionscommunity-based, 196, 197education campaigns, 180, 345effectiveness of, 241, 244-247, 364school based, 240-241, 244-247, 252-
253, 364self-help, 365tobacco control interventions compared,
350-351Dietary Reference Intakes, 168, 333Disability, defined, 333Disease
defined, 333emergency response to, 133
Discrimination, 66, 67, 100, 178Dyslipidemia, 62, 67
E
Eating behaviorin absence of hunger, 294-296, 305advertising and, 172-173brain’s regulation of, 69, 95, 157breastfeeding and, 222, 288-290“clean the plate” pressures and, 295energy density of foods and, 156-157,
159, 291, 293flavor preferences, 289, 291food as reward and, 295health-claims advertising and, 169-170home environment and, 14-15, 287-296introducing new foods, 291package size and, 159parental influence, 287-289, 305-306portion size and, 158, 291-292, 294-
296, 305selection and availability of foods, 292-
294self-regulation, 289, 294TV viewing during meals and, 222, 293
Eating disorders, 43, 287Eating patterns, trends, 27-28, 30-35Ecological systems theory model, 83-85,
115EconLit database, 339, 340Economic costs of obesity, 23, 70-71, 72,
225
Economic environmentand food intake, 100, 101, 215-216,
358-360funding of school meals, 250, 252and physical activity, 100, 102in schools, 238, 250-252, 358, 359taxation and pricing interventions, 44,
128, 146-147, 178, 358-360Edible Schoolyard, 248Education. See Public educationElectronic media. See also Television
viewinghome environment, 39-40, 303time spent by children on, 171, 172
EMBASE (Excerpta Medica), 339, 340, 342Employers and worksite interventions, 195,
202Energy balance
action plan for prevention, 90-106adults, 90, 160body image, 103-104in children and youth, 90, 97central nervous system regulation of, 69-
70, 94, 95, 157, 159defined, 83 n.2, 90, 115, 333dietary intake and, 95-98, 101ecological systems theory model, 83-85,
115environmental influences, 100-106food marketing and advertising practices
and, 172, 173, 174, 355genetic variation and biological
considerations, 91, 93-95, 159physical activity and, 92, 98-99, 102promotion, 115psychosocial and behavioral
considerations, 69-70, 95-99racial and ethnic disparities, 105-106sociocultural environment and, 84-85,
91-92, 100-106socioeconomic status, 104-105, 146-147stigmatization considerations, 100, 103surveys, 137transportation patterns and, 37TV viewing and, 301-302
Energy density of foods, 28access and affordability issues, 216of advertised foods, 172of away-from-home foods, 92, 162, 163defined, 333and eating behavior, 156-157, 159, 291,
293
567

INDEX 401
and energy storage, 156-157infant response to, 290labeling foods for, 170, 171and satiety, 157, 159of school foods, 240, 243taxes on energy-dense foods, 44, 146-
147Energy expenditure
adult patterns, 160defined, 90, 333measurement of, 99, 332physical activity and, 92, 99resting metabolism and, 92 n.6
Energy imbalance, 83-85, 93Energy intake
away-from-home foods, 30, 158, 161body weight and, 159defined, 91, 333by gender, 35measurement, 332physiological regulation of, 289, 294predictors of, 158-159trends for children, 97
Energy requirements for children andadolescents, 97, 158, 167-168
Entertainment industry. See Leisure,entertainment, and recreationindustries; Television viewing
Environmental influences. See alsoCommunity environment; Homeenvironment; School environment
defined, 334ecological layers, 15, 100, 101-102, 286,
320on energy balance, 100-106genetic interactions, 93-94monitoring needs, 140obesogenic, 2, 306, 320, 336
Epidemic of childhood/adolescent obesityadult obesity epidemic and, 63-65BMI distribution, 61-62consumer attitudes and, 40-43contexts for action, 25-44costs for children and society, 22-24, 65-
72defined, 21 n.1, 55, 334demographic trends, 1, 25-40eating patterns and, 27-28, 30-35in ethnic groups, 1, 26-27, 58-61family life and, 25-26health-care costs, 70-72
high-risk population subgroups, 58-61,134
lifestyle trends, 25-26, 27-39media and, 39-40overall burden, 55-58physical activity and, 29, 35-39physical health implications, 22-23, 67-
69prevalence and time trends, 22, 54-65programs and policies, 43-44public awareness, 40-43public health implications, 22-24public health precedents, 21, 44-47,
343-371regional differences, 61social and emotional consequences, 23,
66-67socioeconomic difference, 60-61, 104-
105ERIC (Educational Resources Information
Center) database, 339, 340-341Ethnic groups. See also Racial and ethnic
disparities; Sociocultural environmentbody image perceptions, 199definitions, 58 n.4diabetes, 23, 68diversity trends, 26-27food preferences, 27, 106genetic susceptibility to obesity, 106high-risk groups, 58-61, 68, 199-201interventions targeted to, 199-201, 203,
257media education campaigns, 182-183obesity prevalence, 1, 10, 26-27, 58-61,
94, 105-106physical activity, 29-30, 205, 257and protective effects of breastfeeding in,
289regional differences, 61socioeconomic difference, 60-61, 106,
201targeted marketing of foods to, 106trust issues, 106, 200TV viewing time, 301
Evaluation of prevention interventionsBMI distribution as measure of change,
88community-based participatory studies,
17, 203-204, 217-219, 325demonstration projects, 132, 200, 204,
208-209, 213
568

402 INDEX
design of studies, 304funding for, 204, 215health impact assessment, 217-219intermediate goals and, 6, 17, 86-87,
323natural experiments, 209pilot programs, 242, 247-248, 251, 252,
274, 277pretest/posttest design, 208prospective approach, 217-219
Exercise. See also Physical activitydefined, 334
Expanded Food and Nutrition EducationProgram, 141, 142
F
Family Interaction, Social Capital andTrends in Time Use Data, 29, 160
Family life, trends, 25-26, 285-286Farmers’ markets, 144, 216, 248Fast food. See also Restaurant industry
advertising and marketing, 302, 355consumption trends, 162, 163, 358defined, 334energy density, 92, 163litigation, 363-364nutrient density, 162nutrition labeling, 356sales, 162
Fat, dietary. See also Body fatconsumption trends, 30-31, 34, 245food supply trends, 34, 366saturated, 169
Fat-brain axis, 95Federal Trade Commission, 9, 153, 174,
175, 177, 355-356Federal Transportation Enhancements
Program, 209Feeding Infants and Toddlers Study (FITS),
290, 291Feet First, 206Finland, 196Fish and shellfish, 32Fit ‘n Active Kids program, 141Fitness. See also Physical fitness
cardiorespiratory, 179-180counseling, 269-270defined, 334
Five-a-Day media campaign, 141, 180, 244Fluoridation campaigns, 199, 350
Food and beverage industry. See alsoAdvertising and marketing;Restaurant industry; School food andbeverages
check-off programs, 145federal regulation, 361-362liability protection, 360, 362litigation, 362-364motivation for change, 154, 157, 170,
366packaging, 154, 158-159, 167, 172, 356portion sizes, 154, 158-159positive changes, 7, 155, 156, 266-267product development, 154, 155-157,
170recommendations, 8, 156, 166sales to young consumers, 153-154, 172self-regulation, 175-176, 366targeted marketing of foods, 106, 145,
172Food and Drug Administration
nutrition labeling regulation, 9, 167-171, 362
Obesity Working Group, 163tobacco regulation, 353
Food, Drug and Cosmetic Act, 361Food environment
access and opportunity, 27, 100, 101,105, 128, 144, 215-217, 292-294,356-358
away-from-home foods, 26, 27-28, 331built environment, 215-217community-based interventions, 144,
216-217, 218, 357-358and eating behavior, 292-294economic factors and, 100, 101, 215-
216, 358-360healthy foods, 105, 144, 215-217at home, 292-294policy and political considerations, 100,
101, 144-146, 369portion sizes, 27, 358, 369rating, 218recommendations, 217restricting availability, 357sociocultural considerations, 100, 101,
106Food Guide Pyramid, 28, 164-165, 292,
334Food insecurity, 88 n.3, 104-105, 143-144,
147, 215
569
INDEX 403
Food insufficiency, 104-105Food Marketing Institute, 167Food security, 215, 334Food service workers, 134Food Stamp Program, 141, 142-143, 144,
216Food supply, 34, 35, 145, 146Food system, 145, 334Foods. See also specific food groups
ethnic, 156of minimal nutritional value, 241, 335product groups with health claims, 169reduced-calorie products, 156as reward and, 295
4H Clubs, 202Framework Convention on Tobacco
Control (FCTC), 350-351, 356, 360France, 44Fruits and vegetables
access to fresh foods, 144, 216, 242,251
children’s acceptance of, 291consumption trends, 28, 32costs, 216, 360health benefits, 107, 169, 223promotion, 107, 141, 180, 198, 200,
223school offerings, 240, 242, 247-248,
251, 291subsidies, 360
Fundingcommunity-based interventions, 132-
133, 209for evaluation studies, 204, 215of school meals, 250, 252
G
Genderand BMI, 56-58and body image dissatisfaction, 104and energy intake, 35and physical activity, 257-258
Geneticsand energy balance, 91, 93-95, 159environmental interactions, 93-94and body fatness, 93and body weight, 91, 93, 94and prevalence of obesity, 94single-gene disorders, 94susceptibility to obesity, 65, 106
Georgia, 211, 250Germany, 44Girl Scouts, 44, 198, 202Girls Health Enrichment Multi-site Study
(GEMS), 200, 203Girls on the Run, 197Global Strategy for Diet, Physical Activity
and Health, 367Glucose intolerance/insulin resistance, 67,
68, 69, 70Go for Health, 256Growth charts, 89 n.4. See also Body mass
index, chartsGrowth spurts, 91, 307Guidelines for School and Community
Programs to Promote LifelongPhysical Activity Among YoungPeople, 255
Gun control analogies, 350, 361, 362
H
Healthbody weight and, 306-308costs of obesity, 22-23, 65, 67-69, 71,
73defined, 335food security and, 215impact assessments, 217-219population, 215, 336promotion, 100, 106, 128, 335, 359-360report cards, 270-271
Health-care professionalsadvocacy role, 223-225obesity screening and counseling by, 10,
221-223, 272school referrals to, 272training, 224-225
Health-care system, 128Health education, 106
classroom requirements and practices,261-262
recommendations, 264-265teacher training, 264, 265
Health insurance coverage, 60-61, 225-226,307
Health services. See also Community healthcare
costs, 70-72school-based, 269-272
Healthful diet. See Balanced diet
570

404 INDEX
HealthStyles Survey, 38, 211Healthy Days Measures, 218Healthy Eating Index (HEI), 96-97Healthy People 2000, 156Healthy People 2010, 129, 194, 321Hepatic steatosis, 67High blood pressure, 62, 69. See also
HypertensionHigh-density lipoprotein (HDL) cholesterol,
69High fructose corn syrup, 145-146High-risk population subgroups, 6, 58-61,
68, 134, 199-201, 322Highway safety analogies, 44-45, 126, 128,
132, 350, 361, 366Hispanics. See also Ethnic groups; Racial
and ethnic disparitiesbody image dissatisfaction, 66, 104energy gaps, 93defined, 58 n.4diabetes, 68obesity trends, 60, 105
HIV prevention, 107Home environment. See also Parents;
Television viewingand eating behavior, 14-15, 287-296electronic media, 39-40, 303family characteristics and, 25-26, 285-
287food and beverage selection and
availability, 292-294meal preparation, 26, 28obesogenic families, 306and physical activity, 14-15, 296-301recommendations, 14-15, 290, 308-309
Home visits, 46, 349Hunger. See also Appetite; Satiety
eating in absence of, 294-296, 305in U.S., 88
Hypertension, 62, 67, 225Hypertriglyceridemia, 69Hypothalamic-pituitary-adrenal axis, 70
I
Illinois, 213Inactivity
deaths related to, 67decreasing, 114, 301-305defined, 336health care costs of, 71, 73
prevalence, 29-30safety reasons, 207technology and, 160TV viewing and, 301-305
Indiana, 247Industry. See also Advertising and
marketing; Food and beverageindustry; Leisure, entertainment, andrecreation industries; Restaurantindustry
health promotion by, 128, 161, 182recommendations, 8, 165-166, 177self-regulation, 175, 354
Infantsbreastfeeding, 222, 288-290food insecurity, 105low birthweight, 288mortality rates, 21overweight, 55, 58 n.3, 80-81
Information environment. See Advertisingand marketing; Public education
Injury prevention campaigns, 345, 361Institute of Medicine, 144, 168, 344, 360Institute of Traffic Engineers, 210Insulin levels, 62. See also Diabetes; Glucose
intolerance/insulin resistanceInternational dimensions of obesity, 2, 22,
367, 371International Food Information Council,
40-41Intervention programs. See also
Community-based interventionsbehavioral theory and, 345comprehensive approaches, 46-47, 128,
131, 196-199, 203, 262-263, 345,349-352
ethnic groups targeted, 199-201, 203,257
evaluation of, 133, 134, 136-137, 142,214-215
evidence of effectiveness, 45-46, 196-198, 222-223, 262-263, 348, 349-352, 370-371
funding, 6, 44, 128, 131, 132-133, 142,148, 359-360
industry-sponsored, 161international efforts, 44large-scale, 196-197, 217-219, 345, 347parental involvement, 287registry of, 44school-based, 239, 244, 246-247
571

INDEX 405
successful elements of, 46-47, 350-351taxes on soft drinks and snack foods,
44, 128, 146-147translation and diffusion of, 134-135
Intrauterine environment, 65, 95, 288Iowa, 247
J
Joint Committee of National HealthEducation Standards, 261
Jump Up and Go Program, 225
K
Kaiser Family Foundation, 184, 355, 371Kidney failure, 69Kids Off the Couch, 201Know Your Body study, 244
L
Labeling. See Nutrition labelingLaws and regulations, 357
evidence of effectiveness, 46, 347, 349Lead paint control analogies, 350, 362Leisure, entertainment, and recreation
industries, 7-8, 159-161, 166, 172,175-176
Leisure timeavailability, 36, 38, 159-160physical activity trends, 29, 35, 36,
37Leptin, 95Lexis/Nexis, 339, 341Life expectancy, 23Lifestyle Education for Activity Program,
257Lifestyle trends, 25-26, 27-39Litigation, 128, 154, 354, 362-364Local communities. See also Community
health care; Communityinterventions
built environment, 132, 204-217defined, 193-194, 332food environment, 215-217mobilization, 43-44, 128, 194-221recommendations, 213, 217, 219-221stakeholders and coalitions, 128, 133,
194, 195, 196-204
Louisiana, 61, 250Low-income populations
built environment, 205, 207community-based interventions, 199,
206, 217, 274food access issues, 215-216, 217nutrition programs, 142-144overweight in, 206
Lung cancer prevention, 107
M
Macronutrients. See Carbohydrates; Fat,dietary; Protein, dietary
Marketing. See Advertising and marketingMaryland, 207Mass media
advertising and marketing, 8, 171-177,178
advocacy, 181, 183, 351anti-drug campaigns, 181-182anti-tobacco campaigns, 178, 181-182,
347dietary interventions, 180effectiveness of campaigns, 46, 179, 347,
349, 364-365obesity coverage, 40-41, 154, 181, 202obesity epidemic, 39-40physical fitness promotion, 179-180public education campaigns, 8, 9-10,
177-185, 349, 364, 371public service announcements, 184
Massachusetts, 225, 271Meals. See also Balanced diet; Eating
behaviorbreakfast, 28“clean the plate” pressures, 295eating out, 26home preparation, 26snacks, 28TV viewing during, 222, 293
Meat and poultryconsumption trends, 32
Media. See also Electronic media; Massmedia; Television viewing
Medicaid, 61, 71Early and Periodic Screening, Diagnostic,
and Treatment program, 226Medical Expenditure Panel Survey
Household Component, 61Medicare, 61, 71
572

406 INDEX
Medline, 339, 341Menstrual abnormalities, 67Metabolic syndrome, 69, 70Metabolism. See Basal metabolism; Energy
balanceresting, 92 n.6, 93
Metropolitan Planning Organizations, 210Michigan, 61, 247Micronutrient deficiencies, 88 n.3Middle-School Physical Activity and
Nutrition study, 257Midwestern Prevention Project, 197Military recruits, weight-for-height
standards, 24Milk and other dairy products, 31-32, 240,
293Minnesota, 104, 242-243
Heart Health Program, 179, 180, 196,197
Mississippi, 61, 250Monitoring the Future Survey, 40Montana, 207
N
National Association for Sport and PhysicalEducation, 98, 253
National Association of County and CityHealth Officials, 132, 218
National Cancer Institute, 180, 199National Center for Health Statistics, 54National Committee for Quality Assurance,
226National Governors Association, 132National Health and Nutrition Examination
Survey (NHANES), 6, 29, 36, 54,55-56, 60, 61, 63, 68, 89, 137, 138,139, 140, 148, 157, 160
National Health Education Standards, 261National Health Examination Survey
(NHES), 36, 60National Health Interview Survey, 29, 159-
160, 221National Heart, Lung, and Blood Institute,
179, 225National Highway Traffic Safety
Administration, 361National Household Travel Survey (NHTS),
38, 39, 138National Human Activity Pattern Survey,
160
National Institutes of Health, 358Task Force on Obesity Prevention, 131,
135National Library of Medicine, 341National Longitudinal Study of Adolescent
Health, 60, 138National Longitudinal Survey of Youth
(NLSY), 60, 61, 62, 139National Personal Transportation Surveys,
39National School Lunch Program, 142, 143,
145, 237 n.1, 239-241, 250National Walk Our Children to School Day,
213National Youth Anti-Drug Media
Campaign, 182Native Americans. See American IndiansNeighborhood associations, 210-211Neonatal critical period, 95New Mexico, 247North Carolina, 266North Carolina Black Churches United for
Better Health project, 199-200North Karelia Project, 179, 196-197Nutrient density of foods, 96, 115, 162,
171, 172, 243, 335Nutrition Academic Award Program, 225Nutrition and Physical Activity Program to
Prevent Obesity and Other ChronicDiseases, 204
Nutrition assistance programs, 6-7, 142-144, 148
Nutrition educationavailability, 100behavioral curricula, 262-263community-based interventions, 198,
201, 273food service personnel, 134health education curriculum, 261-262media campaigns, 141programs, 141-142, 148, 225recommendations, 6, 142, 148by restaurant industry, 164-166at school, 261-263, 273
Nutrition labelingcalorie content, 168comparative claims, 170-171consumer understanding and use, 167,
169-170and eating behavior, 169-170energy density and nutrient density, 170,
171
573

INDEX 407
health claims, 9, 167, 169-170, 171, 362ingredient disclosure, 356nutrient claims, 9, 167, 168-169, 171Nutrition Facts Panel, 9, 158, 166-168,
169, 171, 335percent Daily Value, 166-167, 171recommendation, 8-9, 171research needs, 9, 171restaurant foods, 163-164, 165, 168,
197, 356serving size, 167, 168, 356warnings, 353, 356
Nutrition Labeling and Education Act, 166,170 n.8
Nutrition standards, 44, 125, 129-130, 131,134
O
Obesity. See also Childhood and adolescentobesity; Epidemic of childhood/adolescent obesity; Prevalence ofchildhood/adolescent obesity
BMI, 22, 54-55, 63Ohio, 67, 206, 207, 247Older children and youth
family decision-making responsibilities,304-305
fast food consumption, 163healthful eating behaviors, 290-292
1% or Less campaign, 180Orthopedic problems, 67Overweight
age-specific trends, 63, 80BMI, 80, 336defined, 55, 80, 336
P
Parentsas advocates, 300defined, 14eating behavior, 305-306involvement in interventions, 287labor force participation, 25, 26media campaigns targeting, 179, 183nutrition education, 142, 287, 299obese or overweight, 64-65, 93, 104,
199, 289perception of weight as health issue, 42-
43, 65-66, 269, 306-308
physical activity patterns of, 297-298,302
physician counseling for, 222promoting healthy food choices, 14-15,
287-296promoting physical activity, 14-15, 299,
300-301as role models, 183, 195, 197, 273, 286,
292, 298, 305-306Partnership for a Walkable America, 141,
213 n.2Partnership for the Public’s Health, 200Partnership to Promote Healthy Eating and
Active Living, 84, 141Pathways, 245, 246, 262-263Pawtucket Heart Health Program, 179, 196Pediatric Nutrition Surveillance System
(PedNSS), 139Pennsylvania, 207Physical activity. See also Inactivity;
Sedentary behaviorand academic performance, 253active living, 155 n.1, 331adults, 29, 35, 179after-school programs, 260, 272-274age and, 98, 296-297, 302-303benefits of, 98-99, 253, 300biological correlates, 69, 296-297built environment and, 38, 125, 132,
196, 204-211changes needed, 128, 252-263classroom curricula, 255, 262-263community mobilization, 44, 179-180,
196, 197, 201, 202, 211-215competitive sports, 202, 258-259, 299counseling, 223dance classes, 257defined, 97, 336developmental correlates, 296-297economic environment and, 100, 102education programs, 141-142, 299effectiveness of interventions, 256-258,
262-263endurance training, 256-257and energy balance, 92, 98-99, 102environmental influences, 102, 105, 257evaluation of programs and policies,
213, 260, 274-275, 364extracurricular programs, 258-259family-based interventions, 299-300food intakes and, 91, 245funding for programs, 44
574

408 INDEX
gender differences, 257-258, 296-297home environment and, 14-15, 296-301industry-sponsored efforts, 182interactive effects of diet and, 92-93interventions, 136-137, 141-142, 179-
180, 182, 211-215, 223, 245leisure time, 36, 105, 159-160measurement of, 98-99, 205, 209media campaigns, 179-180outdoor play, 205, 222, 299, 300parental role, 299PE classes and recess, 35, 37, 125, 253-
258, 259, 336physical environment and, 125, 132,
196, 204-211, 299promoting, 44, 141-142, 148, 161, 179-
180, 200-201, 222, 299psychosocial and behavioral correlates,
98-99, 297public programs, 141-142race/ethnicity and, 29-30, 205, 257recommendations, 6, 259-261, 273recommended levels, 29 n.3, 98, 253reducing sedentary behaviors, 263-264,
301-305research needs, 261, 300safety issues, 205, 211, 299, 300school-based interventions, 43, 245,
256-258, 299social environment and, 297-299socioeconomic status and, 105, 201,
205, 206, 298-299surveillance, 29, 137, 140transportation patterns and, 37-39, 71trends, 29, 35-39, 160TV viewing and, 301-305types, 29walking and biking, 37, 38-39, 92, 125,
141, 160, 211-215, 259, 300Physical environment. See also Built
environment; Food environment;School food and beverages
and food intake, 100, 101and physical activity, 100, 102
Physical fitness, 129, 137, 140, 141, 269-270, 334, 336
Planet Health, 137, 245, 246-247, 263, 264Policy/political environment
agricultural policies, 144-146food environment and, 100, 101, 144-
146, 369
and implementation of interventions,348
and physical activity, 100, 102, 214public opinion and, 178-179
Portion sizes, 358, 369age and, 165of away-from-home foods 158control, 165, 294-296defined, 158 n.3and eating behavior, 158, 291-292, 294-
296marketing strategy, 158-159, 366quantifying dietary intakes, 98regulation of, 362trends, 27, 30
Potatoes, 28Pregnancy
gestational diabetes, 65, 288intrauterine environment, 65, 95, 288,
289obesity during, 65, 288, 289
President’s Council on Physical Fitness andSports, 141
Prevalence of childhood/adolescent obesityadult obesity and, 22, 63-65away-from-home foods and, 26, 331BMI distribution, 61-62, 73in ethnic groups, 1, 26-27, 58-61, 94,
105-106food environment and, 356-357high-risk population subgroups, 58-61,
72-73overall burden, 1-2, 55-58population genetics and, 94regional differences, 61socioeconomic status and, 60-61, 104-
105Prevention of childhood/adolescent obesity.
See also Action plan for prevention;Intervention programs
annual report on, 130-131behaviors targeted, 222clinical screening and tracking, 221-224,
226community health services, 221-225,
226, 348-349congressional support, 131, 177coordinating task force, 5-6, 130-131,
147cost considerations, 100current efforts, 125-126
575

INDEX 409
definitions, 81-83, 337economic benefits of, 72energy balance, 90-106federal commitment to, 5, 129-131food industry as target of, 370global dimension, 371government support and funding, 5-6,
128guide to preventive services, 209, 348-349individual-level approach, 86, 87, 107-
108, 109, 110, 221-223individual responsibility vs. collective
action, 369insurance coverage, 100, 224, 225-226intermediate goals, 86-87legislation and regulations, 360-361lessons learned from other initiatives,
103, 109, 125, 128, 179-183, 344-352, 369-370
longitudinal studies, 140-141, 209multifactorial approaches, 16, 46-47,
81-82, 83, 109, 125, 126, 128, 178,179, 245-246, 249, 299, 322, 344,349-352, 370
national priorities, 5-7, 127, 129-131,147-148
population-level approach, 82, 86, 87,88-90, 107-109, 125, 199-201
primary prevention approach, 82, 107,115, 337
psychosocial considerations, 222public health precedents for, 24, 44-47,
83, 107, 179-183, 321, 350-351public-private partnerships, 141social environment and, 320, 365-367sociocultural considerations, 100, 103,
106, 109-110, 369stakeholders, 16, 19, 127, 320, 321, 324state and local priorities, 6, 131-134,
148targeted to high-risk populations, 81,
142treatment distinguished from, 81-82
Prevention research. See also Evaluation ofprevention interventions
best practices and effectivenessevaluations, 97-115, 344-345, 346,370-371
causality and, 108-109clinical practice approach, 107-108, 109,
110community-based, 134, 344-345
components of, 112-113cost-effectiveness analyses, 136-137developing recommendations, 111-115experimental behavioral, 134, 135-136falsifiability, 108federal investment in, 135, 177framework, 136generalizability, 107-108, 111, 260, 345,
346, 350, 364incorporation into program planning
and implementation, 136interdisciplinary and interdepartmental
collaborations, 130, 134, 135literature on, 114, 339-342phases, 108population-based, 110, 134predictability, 107public health approach, 108-110randomized controlled trials, 110, 111,
114recommendations, 148replicability, 107-108review of evidence, 107-115scientific uncertainty and, 109social values and, 109-110standard of evidence, 111, 114
Project MOVE (Measurement of the Valueof Exercise), 136-137
Protein, dietaryconsumption trends, 34food supply trends, 34
Provider reminder systems, 46, 347, 348,349
PsychINFO database, 339, 341Psychosocial and behavioral considerations
depression and depressive symptoms, 66,67, 69-70, 105
and dietary intake, 95-98, 105in energy balance, 69-70, 95-99health costs of obesity, 23, 65, 66-67,
69-70, 71, 73and physical activity, 98-99stigmatization of obesity, 2, 23, 103
Puberty, 297Public education
areas of focus, 183-184audience exposure, 180-181barriers to success, 180-181complementary components, 178dietary interventions, 180, 345evaluation and monitoring component,
178
576

410 INDEX
funding for, 184media campaigns, 9-10, 43, 128, 177-
185, 353nutrition and physical activity programs,
141-142of parents, 179, 183recommendations, 9-10, 183-185sensitivity in design of, 178
Public health. See also Prevention ofchildhood/adolescent obesity
access and opportunity issues, 356-358achievements of 20th century, 21, 44-46,
346-348action plan for preventions, 108-110,
115, 127, 129agricultural policies and, 144-146, 148community preventive services, 7, 125,
200, 346, 347, 348-349criteria for comparison of prior
approaches, 368economic factors, 347, 358-360evidence-based approach, 108-110, 126framework for interventions, 352-367implications of obesity epidemic, 22-24individual and clinical efforts, 348, 365information environment, 353-356leadership, coordination, and priority
setting, 7, 129-134legal environment, 349, 360-361lessons learned, 125, 128, 179-183, 344-
352, 369-370litigation, 362-364media campaigns, 179-183, 346, 347,
349, 364-365multi-problem approaches, 126, 349-
352nutrition assistance programs, 142-144,
148nutrition education programs, 141-142oversight and enforcement role, 133-134physical activity programs, 141-142precedents for prevention, 21, 24, 44-47,
83, 125-126, 128, 179-183, 343-371prevention and treatment programs,
107-109, 364-365product labeling, 356recommendations, 131, 134, 135, 137,
140, 141, 142, 144, 147-148regulatory environment, 361-362research and evaluation, 107-109, 134-
137, 148
school-based interventions, 347, 348,349, 364
social environment and, 126-127, 365-367
state and local agencies, 133-134, 148surveillance and monitoring, 137-141,
148taxes on food and beverages, 146-147
Public Health Foundation, 218Public interest in obesity
and policy changes, 178-179, 365-367raising, 306-308trends, 40-43, 154triggers for, 126-127
R
Racial and ethnic disparities. See also Ethnicgroups; Sociocultural environment
in BMI, 58-60in body size dissatisfaction, 103-104in built environment, 205community health interventions, 203in energy balance, 105-106in food access, 215-216in physical activity opportunities, 205in prevalence of obesity, 105-106
REACH 2010 initiative, 200Recommendations
evidence-based approach to developing,16, 111-115, 323
Recreation industry. See Leisure,entertainment, and recreationindustries
Recreational facilities and programs, 202,206, 211
Regional differences in prevalence ofobesity, 61
Research priorities, 16-17, 88, 177, 322-325. See also Prevention research
Restaurant industry. See also Away-from-home foods; Fast food
advertising, 172, 175-176healthier food options, 162, 163-164nutrition education, 164-166nutrition labeling, 163-164, 165, 168,
197, 356recommendations, 8, 165-166sales, 162self-regulation, 175-176
Reyes Syndrome campaigns, 179
577

INDEX 411
Risk, defined, 337Risk analysis, defined, 337Robert Wood Johnson Foundation, 206,
218Role models
health professionals as, 223parents as, 183, 195, 197, 273, 292,
298, 305-306Roper Youth Report, 173
S
Safe Routes to School programs, 213, 214Safety
in built environment, 205, 207-208, 211defined, 337
Satiety, 157, 159, 289, 294, 295School Breakfast Program, 142, 143, 237
n.1, 239-241, 258-259School environment
after-school and extracurricularprograms, 200, 258-259, 260, 272-274
behavioral nutrition curricula, 262-263changes needed in, 248-250, 252-263,
264-265Channel One News, 265, 266classroom curricula, 253, 261-265as community center, 272-274competitive sports, 258-259evaluation of programs and policies,
260, 274-275, 277-278fitness screening and counseling, 269-
272health education, 14, 261-262health services, 14, 269-272, 308, 349interventions, 46, 114-115, 128, 137,
141, 197, 211-215, 244-247, 256-258, 349
location in community, 213-215nutrition education programs, 141, 249-
250, 273PE classes, 125, 336, 253-258, 259, 260,
358physical activity, 13, 14, 43, 211-215,
253-261, 262-263, 276-277, 358prevention opportunities, 12-13, 237-
238rating, 218recess, 255, 258
recommendations, 12-14, 114-115, 259-261, 264-265, 273, 276-278
reducing sedentary behaviors, 263-264research needs, 261tobacco prevention policies, 358
School food and beveragesaccess to, 44, 252, 358advertising, 14, 176, 251, 265-269bonus commodities, 145, 248, 250cafeteria offerings, 238-239, 240changes needed in, 248-250, 252-263competitive foods, 13, 241-244, 250,
251-252, 332dietary intervention studies, 240-241,
244-247, 252-253, 364energy density of, 240, 243energy intakes, 237environmental interventions, 245-246federal meal programs, 142, 143, 145,
237, 239-241, 250, 337, 358, 364fresh fruits and vegetables, 217, 242,
243, 247-248, 251, 291funding of meals, 250, 252, 277garden programs, 217, 248menu planning, 239-240nutrition guidelines, 239nutritional quality and standards, 13,
240, 241, 243, 245, 249, 251, 277pilot programs, 242, 247-248, 251, 252,
274, 277pricing strategies, 251-252recommendations, 13-14, 114-115, 248-
250, 252-253, 276-277research needs, 252-253restricting sales of, 241-242, 249, 250,
358, 359revenue issues, 250-252, 358, 359standards setting, 44, 125, 129-130,
131, 134training of food service personnel, 249-
250vending machines, 44, 114-115, 239,
241, 242, 243, 250, 251-252, 266,358, 359, 364
School Health Index, 274-275School Health Policies and Programs Study
(SHPPS), 137, 139, 242, 253, 254,266, 269
School Meals Initiative for HealthyChildren, 240
578

412 INDEX
School Nutrition Dietary Assessment Study,240, 250
Section 402 State and Community HighwaySafety Grant program, 132
Sedentary behaviordefined, 337electronic media and, 40energy expenditure patterns, 160health care costs, 70reducing, 263-264
Self-efficacy, 262Self-esteem issues, 43
race/ethnicity and, 66Self-help interventions, 126, 365Serving size. See also Portion size
defined, 158 n.3infant feeding and, 290package size and, 167, 168, 356recommended, 165
Shaping America’s Youth, 44, 161Sleep apnea, 67, 72Small Steps campaign, 181Smart Growth America, 210Smart Growth Network, 210Smart growth principles, 209, 210Snacks and snacking
activities needed to burn calories in, 92energy-dense foods, 28, 92
Social change models, 351-352Social cognitive theory, 262, 264Social marketing campaign, 182-183, 184Social movement theory, 350-351, 360Social norms and values, 8, 15-16, 84-85,
91-92, 100, 103, 106, 126, 286, 320,321, 369
Sociocultural environmentbody image, 66, 91-92, 100, 103-104and energy balance, 84-85, 91-92, 100-
106and food intake, 100, 101, 106and obesity, 64, 100and physical activity, 100, 102and prevention, 100, 103, 369, 371prior reform movements, 45stigmatization, 23, 43, 66, 100, 103targeting interventions to, 198, 199-201,
203, 275Socioeconomic status. See also Low-income
populationsand BMI, 60-61and community interventions, 10, 203,
205
and energy balance, 104-105, 146-147and healthy food access, 105, 106, 201and intergenerational obesity, 65and obesity prevalence, 10, 60-61, 104-
105and physical activity opportunities, 105,
201, 205, 207racial/ethnic disparities, 60-61, 106, 201
Sociological Abstracts, 339, 341Sodas and fruit drinks
bans on school sales, 242and BMI, 293-294consumption trends, 293, 358diet beverages, 156energy density and nutrient density, 170
n.7, 293limiting consumption, 222, 242marketing contracts with schools, 251,
266taxes on, 44, 128, 146-147, 359
South Australian Daily Physical ActivityProgram, 256-257
South Carolina, 61Special Supplemental Nutrition Program for
Women, Infants and Children (WIC),55, 65, 141, 142, 143-144, 216
Sports, Play and Active Recreation for Kids(SPARK), 247, 256
Stanford Adolescent Heart Health Program,245, 247, 263
Stanford Dance for Health, 257Stanford Five-City Project, 179-180, 196Stanford SMART (Student Media
Awareness to Reduce Television),247, 263-264
Stanford Three Community Study, 179, 196Steps to a Healthier U.S. Initiative, 132-133,
181, 204Stereotyping, negative, 66Stigmatization, 2, 23, 43, 66, 100, 103,
178, 222, 270Stress response, 70Stroke, 69Sudden Infant Death Syndrome, 179Summer Food Service Program, 142Surveillance and monitoring. See also
individual surveysadolescent health and behavior, 60, 61,
62, 138, 139, 209body weight, 89, 137, 140collaborations, 137-138dietary intake, 97, 137, 138
579

INDEX 413
energy balance, 137funding, 140longitudinal studies, 140-141needs, 140nutrition and health, 29, 36, 54, 55-56,
60, 61, 63, 68, 89, 137, 138, 139physical activity, 29, 137, 140public health, 137-141recommendations, 6, 140-141school health policies and programs,
137, 139time use, 60, 61, 62, 139, 159-160transportation patterns, 38, 39, 138
Sweden, 44Sweeteners. See Added caloric sweeteners
T
Task Force on Community PreventiveServices, 299
Taxation and pricing interventions, 44, 128,146-147, 178, 358-360
Team Nutrition, 141Teasing, 100, 178Television viewing
advertising, 8, 44, 172, 174, 265, 301,302, 355
bedroom sets, 39, 302, 304household sets, 39interventions to reduce, 200, 222, 247,
263-264, 303-304mealtime viewing, 222, 293, 302and obesity prevalence, 177-178, 301-
302, 303position statements of medical
professionals, 224, 304recommended limits, 15, 304, 308time management monitor, 264time spent, 39-40, 41, 114, 160-161,
301-302Texas, 61Tobacco control analogies, 45, 103, 107,
126, 128, 133, 146, 154, 178, 197,199, 223, 350-351, 352-356, 357,360, 361, 362, 363, 364, 366, 368,369-371
Toddlers and young childrenfood insecurity, 105healthful eating behaviors, 290-292predictors of energy intake, 158-159
Tort reform, 363-364
Transportationand access to healthy foods, 216patterns, 37-39, 205, 211-212
Transportation Alternatives, 214Transportation Research Board, 205, 341Treatment of obesity
prevention distinguished from, 81-82research approach, 108
TRIS (Transportation Research InformationServices) database, 339, 341
21st Century Community Learning Centersprogram, 273
Twin studies, 93, 942 Fruit ‘n’ 5 Veg Every Day, 180
U
United Kingdom, 44, 213, 214, 248University of California Cooperative
Extension, 201U.S. Census Bureau, 105U.S. Conference of Mayors, 132U.S. Department of Agriculture, 268, 332
Agricultural Marketing Service, 145Cooperative Extension Service, 141dietary guidelines, 96-97, 131, 164-165,
332dietary intake surveys, 137-138Farm Service Agency, 145Healthy Eating Index, 96-97and industry, 153nutrition programs, 129, 141-142, 144,
145, 238, 239, 240, 250, 252obesity prevention role, 13, 129, 130,
131research on nutrition, 135
U.S. Department of Defense, 130, 131Fresh Produce Program, 145, 248
U.S. Department of Education, 130, 131,268, 273, 341
U.S. Department of Health and HumanServices, 253, 332
collaboration with CDC, 200dietary guidelines, 96-97, 131, 164, 332funding of community-based health
efforts, 132-133, 208guideline development for advertising
and marketing, 9, 175-176, 177health and nutrition survey, 29, 36, 54,
55-56, 60, 61, 63, 68, 89, 137-138,139, 140, 148
580

414 INDEX
and industry, 153, 175-176obesity prevention role, 129, 130, 131,
147, 204, 220-221registry of research and intervention
programs, 44Small Steps campaign, 181, 184
U.S. Department of Housing and UrbanDevelopment, 130, 131
U.S. Department of Justice, 354U.S. Department of the Interior, 130, 131U.S. Department of Transportation, 130,
131, 208, 220-221U.S. Preventive Services Task Force
(USPSTF), 221
V
Vegetables. See Fruits and vegetablesVERB campaign, 141, 182-183, 184Virginia, 207
W
Walking and biking opportunitiesbuilt environment and, 207, 208, 209,
210, 211-215
Walking School Bus program, 213Washington, 206Weight. See Body weightWell-being, defined, 65, 337West Virginia, 61, 250White House Office of National Drug
Control Policy, 182Whites. See also Racial and ethnic
disparitiesbody image dissatisfaction, 66, 104defined, 58 n.4obesity prevalence, 143
World Health Organization, 290, 350, 367
Y
YMCA, 202Youth Media Campaign Longitudinal
Survey, 37Youth Risk Behavior Surveillance System
(YRBSS), 35, 137, 139, 209, 256,258, 301
Z
Zuni Indian Tribal Organization, 247
581

Exhibit 8
582

Lincoln County School District Nutrition Services
Nutrition Services is operated under ODE and USDA guidelines and must maintain a non-profit separatefund accounting. This means that Nutrition Services operates just like a business, if we fall short, theschools District's General Fund would need to cover the loss, taking funds away from our students'direct education support. The entire meal program is funded with USDA program reimbursements,vended meal agreements with community partners, and a small catering operation. The funding is abalancing act with our partner Sodexo to cover food and labor costs as well as keeping kitchenequipment working well and up to health code standards, and implementing new items to provideoutstanding customer service to our students.
Community Eligibility Provision or CEP, the program that allows Lincoln County School District to offerfree breakfast and lunches to all students regardless of income, is based on the number of studentsdirectly certified plus a multiplier designated by ODE annually. Direct Cert students are students whoreceive SNAP, are in the DHS Foster system, are categorized as Migrant, or identify as Homeless. Themultiplier used is to represent students who may qualify for a reduced-price lunch or are unable toapply for benefits.
Newport High enrollment is just over 600 students. With 28.23% direct cert students identified plus themultiplier of 1. 6%, NHS has a poverty rate of 45%. Almost half, yet to qualify for the universal meals,each school alone needs to be at 40% direct cert. LCSD groups all schools into one large group in orderto extend the benefit across the entire county.
CEP puts all students on the same level and offers much needed and appreciated financial relief toworking families who do not meet income thresholds to qualify for free meals. Even a charged mealprice at the low rate of $2.50 for breakfast and $3. 75 lunch per day add up for the month to over $125per child.
LCSD does not receive 100% reimbursement for all meals served. We receive reimbursement at the freerate for approximately 65% of participation. The remaining 35% is reimbursed at the USDA reducedmeal rate. Any funding left over from paying labor and meal costs is used to purchase and repair kitchenequipment.
Another factor is student participation in the program. 2018-19 was the last year for which we haveregular statistics. NHS's participation rate in the lunch program was 27%. This is for an open campuswith food options directly across the street (Cubs Cave). Waldport High, Toledo Jr/Sr High and Taft 7-12's participation rates were 60%, 72% and 50% respectively. In those areas there is an open campusbut limited choices close by and no options across the street. Participation in all of these schools ishigher than NHS. The other higher participating schools carry or subsidize NHS because they have thelowest participation in the district. Participation increased to 40% during Covid because there was acompletely closed campus. Each 5% reduction in participation represents only 7 meals. A 10% reductionbrings it to only 17% participation and represents a loss of only 14 meals per day. As shown below, NHSmeal service already falls short of breakeven by about 100 meals per day. This school is already beingsubsidized by participation at the other schools.
583

Breakeven is 15 meals/labor hourLead
Assistant
Dishwasher
1 Additional Staff for Enrollment
Days/MonthMeals Needed to Maintain
Staffing
18/19 Monthly Meals
Shortfall Monthly
Daily Shortfall in Meals Served
Labor
Hours
7
6
4
4
21
# Meals/Dayto Break Even
105906060
31520
6,300
4, 280
(2, 020)
(101)
LCSD has invested heavily over the last few years to increase participation. NHS piloted the 2nd chancebreakfast, which offered a hallway kiosk for a grab-n- go breakfast between 1st and 2nd period. Breakfastparticipation increased from 13% to 28%. The cafeteria is currently being remodeled at the cost of anestimated $150,000 to update the outdated room and make it a safe place for students to eat a healthymeal and hang with friends. Polished concrete flooring with updated panel walls and a sound systemwith Ws, bistro style tables, updated salad bar and a lounge area with USB charging stations are alreadyin the works. A "coffee" bar will be added along with a grab-n-go cooler for faster service.
If CEP was no longer an option at Newport High, what does this mean?
. LCSD would again have to ask families to provide free and reduced meal applications, only SNAPkids would automatically qualify
. LCSD would have to process and vet all those applications
. Benefits such as Summer EBT would only be extended to "free" families
. Participation would likely fall even further, resulting in the loss of kitchen staff
. Impact to our meal service to our Infant and Cubby Program, forcing applications (we arecurrently able to provide formula to all families at no charge all day)
. Participation drop would also affect product deliveries from some suppliers and would need tobe dropped at a neighboring school and trucked over by LCSD/Sodexo staff
. CEP allows for additional grant opportunities that would no longer be available
. Working families would need to pay for meals and in many cases, students would go without
HB3454 or the "lunch shaming" house bill would become a real concern. This House bill prevents aschool from withholding meal service from a student or giving them the "cheese sandwich" option ifthey are unable to pay. Now, LCSD long ago got rid of the "cheese sandwich" option, and stands behindfeeding kids no matter what, but with HB3454, students can and do in many districts, rack up large lunch
584

balances that many families will never pay. This can take away from program updates and neededrepairs. Many districts are forced to clear the debt with general fund.
During the Covid shut down, LCSD operated an impressive ftmealsonthebus program, serving thousandsof meals daily. Because ALL schools are included in CEP, we could run busses to any corner of the countyserving 3 meals a day. If a CEP status had changed for Newport, areas of Newport would have notqualified for delivery or even a supper meal under area eligibility restrictions.
Will a drop in participation really matter?
The short answer is yes, and not just for NHS but also for Lincoln County School District and LincolnCounty as a whole.
The balancing act that is food service has many variables. At some point, other schools may not be ableto make up for the shortfall at NHS. We will not be able to provide enough meals to justify the staffing.This could mean meal choices will be limited to balance to the new staff level. The Newport MiddleSchool kitchen may need to prepare the meals and we will transport them down. We will need to getcreative. LCSD will always feed kids but these meals may no longer be free.
585

Exhibit 9
586

USDAUnited States Department of Agriculture
School Meals Patterns with Flexibilities for SY 2018/2019
(per Interim Final Rule 82 FR 56703, Nov. 30, 2017)
Food Components
Fruits(cups)bc
egetables (cups)
Dark green
Red/Orange
Beans and peas(legumes)
Starchy
Other
Grains (oz eq)d
Meats/Meat Alternates (ozeq)eFluid milkf (cups)
Other Specifications:
Min-max calories (kcal)eh
Saturated fat (% of totalcalories)11
Sodium Target l(mg)hi^ncfath^
Grades K-5
5(1)0
0
0
0
0
0
7-10 (1)0
5(1)
Breakfast Meal Pattern
Grades 6-8
Amount of Food0 per Week
(minimum per day)
5(1)0
0
0
0
0
0
8-10 (1)
0
5(1)
Grades 9-12
5(1)0
0
0
0
0
0
9-10 (1)
0
5(1)Daily Amount Based on the Average for a 5-Day Week
350-500
<10
<540
400-550
<10
^600
450-600
<10
<640
zero grams of trans fat per serving.
Food items included in each group and subgroup and amount equivalents. Minimum creditable serving is ,3 cup.
One quarter cup of dried fruit counts as l/z cup of fruit; 1 cup of leafy greens counts as l/z cup of vegetables. Nomore than half of the fruit or vegetable offerings may be in the form of juice. All juice must be 100% full-strength.
'Schools must offer 1 cup of fruit daily and 5 cups of fruit weekly. Starchy vegetables can be served at any timeduring the week provided the menu planner offers at least 2 cups from the under consumed subgroups during thatsame week. Under consumed vegetable subgroups are the dark green, red/orange, legumes, and "othervegetables" subgroups, as defined in 7 CFR 210. 10(c)(2)(iii).
USDA is an Equal Opportunity Provider, Employer and Lender
587

'All grains must be whole-grain-rich. Exemptions are allowed as specified in 7 CFR 220.8(c)(2)(iv)(B). Schools maysubstitute 1 oz. eq. of meat/meat alternate for 1 oz. eq. of grains after the minimum daily grains requirement ismet.
There is no meat/meat alternate requirement.
fAII fluid milk must be fat-free (skim) or low-fat (1 percent fat or less). Milk may be unflavored or flavored.
'The average daily calories for a 5-day school week must be within the range (at least the minimum and no morethan the maximum values).
h Discretionary sources of calories (solid fats and added sugars) may be added to the meal pattern if within thespecifications for calories, saturated fat, trans fat, and sodium. Foods of minimal nutritional value and fluid milkwith fat content greater than 1 percent milk fat are not allowed.
' Sodium Target 1 (shown) is effective from July 1, 2014 (SY 2014-2015) through June 30, 2019 (SY 2018-2019). Forsodium targets due to take effect beyond SY 2018-2019, see 7 CFR 220. 8(f)(3).
Food products and ingredients must contain zero grams of trans fat (less than 0.5 grams) per serving.
588

Food Components
Fruits (cups)
egetables (cups)
Dark green0
Red/0rangec
Beans and peas(legumes)
Starchy0
Other0d
dditional Vegetables to ReachotaF
rains (oz eq)f
Meats/Meat Alternates (oz eq)
Fluid milk (cups)6
Other Specifications:
Min-max calories (kcal)
Saturated fat (% of totalcalories)
Sodium Target 1 (mg)ransfathj
Grades K-5
21/2 ( 1/2 )
33/4 ( 3/4 )
V23/4x/2
1/2V21
8-9 (1)
8-10 (1)
5(1)
Lunch Meal Pattern
Grades 6-8 Grades 9-12
Amount of Fooda per Week
(minimum per day)
21/2(1/2)33/4(3/4)
^
3/4V2
1/21/21
8-10 (1)
9-10 (1)
5(1)
5(1)
5(1)V2
11/4^
^
3/411/2
10-12 (2)
10-12 (2)
5(1)Daily Amount Based on the Average for a 5-Day Week
550-650
<10
<1, 230
600-700
<10
<1, 360
750-850
<10
<1,420
zero grams oftransfat per serving.
Food items included in each group and subgroup and amount equivalents. Minimum creditable serving is l/g cup.
One quarter-cup of dried fruit counts as 1/2 cup of fruit; 1 cup of leafy greens counts as l/z cup of vegetables. Nomore than half of the fruit or vegetable offerings may be in the form of juice. All juice must be 100% full-strength.
c Larger amounts of these vegetables may be served.
d This category consists of "Other vegetables" as defined in 7 CFR 210. 10(c)(2)(iii)(E). For the purposes of the NSLP,the "Other vegetables" requirement may be met with any additional amounts from the dark green, red/orange,and beans/peas (legumes) vegetable subgroups as defined in 7 CFR 210. 10(c)(2)(iii).
589

Any vegetable subgroup may be offered to meet the total weekly vegetable requirement.
'All grains must be whole grain-rich. Exemptions are allowed as specified in 7 CFR 210. 10(c)(2)(iv)(B).
EAII fluid milk must be fat-free (skim) or low-fat (1 percent fat or less). Milk may be unflavored or flavored asspecified in 7 CFR 210.10(d)(l)(i).
h Discretionary sources of calories (solid fats and added sugars) may be added to the meal pattern if within thespecifications for calories, saturated fat, trans fat, and sodium. Foods of minimal nutritional value and fluid milk
with fat content greater than 1 percent are not allowed.
Sodium Target 1 (shown) is effective from July 1, 2014 (SY 2014-2015) through June 30, 2019 (SY 2018-2019). Forsodium targets due to take effect beyond SY 2018-2019, see 7 CFR 210. 10(f)(3).
Food products and ingredients must contain zero grams oftransfat (less than 0. 5 grams) per serving.
590

Exhibit 10
591

11T
592

593

594
595

\
596

597

598

\
599

/
600

Exhibit 11
601

^50132 Federal Register / Vol. 81, No. 146/Friday, July 29, 2016/Rules and Regulations
DEPARTMENT OF AGRICULTURE
Food and Nutrition Service
7 CFR Parts 210 and 220
[FNS-2011-0019]
RIN 0584-AE09
National School Lunch Program andSchool Breakfast Program: NutritionStandards for All Foods Sold in Schoolas Required by the Healthy, Hunger-Free Kids Act of 2010
AGENCY: Food and Nutrition Service,USDA.ACTION: Final rule and interim final rule.
SUMMARY: This rule adopts as final, withsoine modifications, the National SchoolLunch Program and School BreakfastProgram regulations set forth in theinterim final rule published in theFederal Register on June 28, 2013. Therequirements addressed in this mleconform to the provisions in theHealthy, Hunger-Free Kids Act of 2010regarding nutrition standards for allfoods sold in schools, other than foodsold under the lunch and breakfastprograms. Most provisions of this finalrule were implemented on July 1, 2014,a full year subsequent to publication ofthe interim final rule. This was in
compliance with section 208 of theHealthy, Hunger-Free Kids Act of 2010,which required that State and localeducational agencies have at least onefull school year from the date ofpublication of the interim final rule toimplement the competitive foodprovisions.
Based on comments received on theinterim final rule and implementationexperience, this final rule makes a fewmodifications to the nutrition standardsfor all foods sold in schools
implemented on July 1, 2014. Inaddition, this final rule codifies specificpolicy guidance issued after publicationof the interim rule. Finally, this ruleretains the provision related to thestandard for total fat as interim andrequests further comment on this singlestandard.
DATES: Effective date: This final rule iseffective September 27, 2016.
Comment date; Comments on theinterim final rule total fat standard mustbe submitted by September 27, 2016.
Compliance dates: Except as noted inthis final rule, compliance with thenutrition standards and other provisionsof the interim final rule began on July1, 2014. The potable water provisionwas effective on October 1, 2010, and
compliance with that provision wasrequired no later than August 27, 2013.
ADDRESSES: To be considered, writtencomments must be submitted by one ofthe following methods;
. Federal eRuIemaking Portal: Go tohttp://www.regulations.gov, select"Food and Nutrition Service" from theagency drop-down menu, and click"Submit". In the Docket ID column ofthe search results select "FNS-2011-0019" to submit or view publiccomments and to view supporting andrelated materials availableelectronically. Information on usingRegulations.gov, including instructionsfor accessing documents, submittingcomments, and viewing the docket afterthe close of the comment period isavailable through the site's "User Tips"link.
. By Maj7; Send comments to TinaNamian, Branch Chief, School MealsBranch, Policy and ProgramDevelopment Division, Child NutritionPrograms, Food and Nutrition Service,3101 Park Center Drive, Alexandria,Virginia 22302. Mailed comments mustbe postmarked on or before thecomment deadline identified in the
DATES section of this preamble to beassiired of consideration.
All submissions received in responseto the interim final provision on total fatwill be included in the record and willbe available to the public. Please beadvised that the substance of thecomments and the identity of theindividuals or entities submittingcomments will be subject to publicdisclosure. FNS also will make thecomments publicly available by postinga copy of all comments on http://regulations. gov.FOR FURTHER INFORMATION CONTACT: TinaNamian, Branch Chief, School MealsBranch, Policy and PrograniDevelopment Division, Child NutritionPrograms, Food and Nutrition Service,3101 Park Center Drive, Alexandria,Virginia 22302, or by telephone at (703)305-2590.SUPPLEMENTARY INFORMATION:
I. Overview
This rule affirms, with somemodifications, the interim final rule(IFR) that implemented amendmentsmade by sections 203 and 208 of PublicLaw 111-296, the Healthy, Hunger-FreeKids Act of 2010 (HHFKA), to the ChildNutrition Act of 1966 (CNA) and theRichard B. Russell National School
Lunch Act (NSLA) for schools thatparticipate in the School BreakfastProgram (SEP) and the National SchoolLunch Program (NSLP). The final ruleaddresses public comments submittedin response to the IFR and makes someadjustments that improve clarity of the
provisions set forth in the IFR. Inresponse to comments andimplementation experience as shared byoperators, the final rule alsoincorporates and codifies some policyguidance to allow additional foods andcombinations to meet the nutritionstandards. Specifically, the regulationfinalizes the IFR, with the followingchanges:
Modifies definitions as follows:. Adds the term "main dish" to the
definition of "Entree" for clarification;. Adds the tenn "grain-only"
breakfast entrees to the definition of"Enta-ee" to codify policy guidance
issued during implementation; and. Adds a definition of "Paired exempt
foods" to codify policy guidance issuedduring implementation.
(s exemptions as follows:. Adds a specific exemption to the
total fat and saturated fat standard foreggs; and
. Modifies the exemption to theGeneral Standards for canned vegetablesto exempt low sodium and no-saltadded vegetables with no added fat tomore closely align with USDA Foodsstandards and industry productionstandards.
Retains as interim with a request forcomment:
. The nutrient standard for total fat.Makes a technical change as follows:. In § 210.11(i) and § 2lb. ll(]), a
revision is made to clarify that thecalorie and sodium limits apply to allcompetitive food items available onschool campus and not just to those solda la carte during the meal service.
Impact of the 2015-2020 DietaryGuidelines for Americans
The original development of thestandards contained in this regulationwas informed by the 2010 DietaryGuidelines for Americans (DGA), whichwere published in December 2010.Based on a thorough review of therecently published 2015-2020 DGA,USDA has determined that thestandards contained in this regulationare also consistent with the new DGA.Key recommendations from the 2010DGA are maintained in the 2015-2020DGA, and so continue to be in line withthe standards included in this rule. The2015-2020 DGA contain a specificadditional recommendation on limitingadded sugar. A discussion of thisrecommendation and its relationship tothe standards included in this rule iscontained in this preamble in thediscussion of the standard for sugar.II. Background
The NSLP served an average of 30.4million children per day in Fiscal Year
602

Federal Register/Vol. 81, No. 146/Friday, July 29, 2016/Rules and Regulations 50133
(FY) 2014. In that same FY, the SEPserved an average of 13. 6 millionchildren daily.
TheNSLA (42 U.S.C. 1751 e(seg.)and the CNA (42 U.S.C. 1771 et seq.]require the Secretary to establishnutrition standards for meals servedunder the NSLP and SBP, respectively.Prior to the enactanent of the HHFKA,section 10 of the CNA limited theSecretary's authority to regulatecompetitive foods, i. e., foods sold incompetition with the school lunch andbreakfast programs, to those foods soldin the food service area during mealperiods. The Secretary did not haveauthority to establish regulatoryrequirements for food sold in other areasof the school campus or at other timesin the school day.
The HHFKA, enacted December 13,2010, directed the Secretary topromulgate regulations to establishscience-based nutrition standards forfoods sold in schools other than thosefoods provided under the NSLP andSEP. Section 208 of the HHFKAamended section 10 of the CNA (42U. S. C. 1779) to require that suchnutrition standards apply to all foodssold:
. Outside the school meal programs;
. On the school campus; and
. At any time during the school day.Section 208 requires that such
standards be consistent with the mostrecent DGA and that the Secretaryconsider authoritative scientificrecommendations for nutritionstandards; existing school nutritionstandards, including voluntarystandards for beverages and snack foods;current State and local standards; thepractical application of the nuta-itionstandards; and special exemptions forinfrequent school-sponsoredfundraisers.
In addition, the amendments made bysection 203 of the HHFKA amendedsection 9(a) of the NSLA (42 U. S.C.1758(a)) to require that schoolsparticipating in the NSLP make potablewater available to children at no chargein the place where meals are servedduring the meal service. This is anondiscretionary requirement of theHHFKA that became effective October 1,2010, and was required to beimplemented by August 27, 2013.
ie Department published a proposedrule in the Federal Register on February8, 2013 (78 FR 9530), titled NationalSchool Lunch Program and SchoolBreakfast Program: Nutrition Standardsfor All Foods Sold in School as Requiredby the Healthy, Hunger-Free Kids Act of2010. This rule proposed nuta-itionstandards for foods offered for sale tostudents outside of the NSLP and SEP,
including foods sold a la carte and inschool stores and vending machines.The standards were designed tocomplement recent improvements inschool meals, and to help promote dietsthat contribute to students' long termhealth and well-being, The proposedrule also would have required schoolsparticipating in the NSLP andafterschool snack service under NSLP tomake water available to children at nocharge diiring the lunch and afterschoolsnack service. USDA received a total of247,871 public comments to theproposed rule during the 60-daycomment period from February 8, 2013through April 9, 2013. This totalincluded several single comment letterswith thousands of identical comments.Approximately 245, 665 of these wereform letters, nearly all of which wererelated to 104 different mass mailcampaigns. The remaining comments-over 2,200-were unique commentsrather than form letters. Commentsrepresented a diversity of interests,including advocacy organizations,industry and trade associations, farmand other industry groups, schools,school boards and school nutrition andeducation associations. Statedepartments of education, consumergroups and others. USDA appreciatedthe public interest in the proposed ruleand carefully considered all commentsin drafting the IFR,
As referenced earlier in this preamble,the Department published an IFR in theFederal Register on June 28, 2013, (78FR 39068] titled National School Lunchand School Breakfast Program: NutritionStandards for All Foods Sold in Schoolas Required by the Healthy, Hunger-FreeKids Act of 2010, and all provisionswere required to be implemented onJuly 1, 2014, a full year subsequent topublication of the IFR standards. Thiswas in compliance with section 208 ofthe HHFKA requirement that State andlocal educational agencies have at leastone hill school year from the date of
publication of the IFR to implement thecompetitive food provisions.
III. General Summary of CommentsReceived on the Interim Rule
A total of 520 public comments on theIFR were received during the 120-daycomment period that ended on October28, 2013. Fifty-three of these commentswere copies of form letters related tonine different mass mail campaigns. Theremaining comments included 460letters with unique content rather thanform letters. A total of 386 of thesecomments were substantive. Comments
represented a diversity of interests,including advocacy organizations;health care organizations; industay and
trade associations; farm and industrygroups; schools, school boards andschool nuta-ition and educationassociations; State departments ofeducation; consumer groups; and others.A relatively modest number ofcomments were received on the IFR,many of which reiterated previouscomments received during the proposedmle comment period and which hadbeen taken into consideration as the IFRwas drafted. This final mle, therefore,incorporates relatively minormodifications to the provisions of theLFR.
In general, there was support for theIFR. Stakeholders were very supportiveof the IFR, and some had specificcomments and suggestions on severalprovisions included in the rule. Of the520 comments, 103 were in full supportof the rule. Fifty commenters objected toimplementation of this rule, indicatingthat no standards for competitive foodshould be implemented in schools. Theremaining commenters includedsuggested revisions to various aspects ofthe rule and its implementation.
Commenters recommendedexpanding exemptions to several of thestandards for specific food items, suchas side items served in the NSLP andthe SEP, while others recommendedcontinuing the initial sodium stajadardfor snack foods. Several commentersrecommended that the General Standardwhich allowed foods meeting the 10percent Daily Value for nuta-ients ofpublic health concern be madepermanent rather than eliminated onJuly 1, 2016, as was included in the IFR.More detailed discussions of thesespecific issues are included in thispreamble.
Twenty-five comments expressedgeneral support for the IFR, many citingconcerns for childhood obesity andstating that coinpetitive food standardswill reinforce healthy eating habits inschool and outside of school. Inaddition to their overall support of therule, an advocacy organization and anindividual commenter stated that lowerincome students may not have theopportunity to experience healthier fooditems outside of the school. Thesecommenteis asserted that this rule willintroduce these students to healthierfoods and possibly influence home foodconsumption patterns and protect thenutritional needs of children. One tradeassociation applauded the Department'sencouragement of dairy foodsconsumption throughout the rule andurged that these changes be retained.One individual commenter remarkedthat the inclusion of recordkeeping andcompliance requirements, considerationof special situations, and
603

50134 Federal Register / Vol. 81, No. 146/Friday, July 29, 2016/Rules and Regulations
implementation information makes thisrule even more complete.
Although in support of the IFR ingeneral, two commenters asserted thatthere are other factors that cause obesityin our society besides foods available inschools. For example, these commenterssuggested that reducing physicaleducation class in school has led toincreased sedentary lifestyles ofchildren. Commenters also noted theimportance of supplementing nutritionrequirements for foods available inschools with nutrition and healtheducation in schools.
Some of those commenters concernedabout the competitive food standardsestablished in the IFR asserted thatfoods sold in schools are not the causeof childhood obesity and that the mlewill result in significant revenue lossesfor school food service, citing financialstoain on schools caused by the recentlyrevised NSLP standards. Most of these
comments were opposed to the rule inits entirety and did not comnient onspecific provisions of the IFR.
The Department acknowledges thatthere are many factors conta'ibuting tochildhood obesity and supports the ideathat developing a healthy nutritionenvironment in school plays animportant role in combatting childhoodobesity, as well. This rule reinforces thedevelopment of a healthy school
environment. In addition, theDepartment recognizes that nutritionand health education as well as physical'activity are important to thedevelopment of a healthy lifestyle andencourages schools to develop localschool wellness standards thatincorporate these items into the schoolday.
In addition to public commentssubmitted during the formal commentperiod, USDA continued to respond tofeedback and questions from programoperators and other impacted partiesthroughout the implementation year inorder to provide clarification, developpolicy guidance, and inform us as thefinal rule was being developed.
The description and analysis ofcomments in this preamble focus ongeneral comment themes, most frequentcomments, and those that influencedrevisions to this final rule. Provisionsnot addressed in the preamble to thisfinal rule did not receive significant orsubstantial public comments andremain unchanged. The reasonssupporting the provisions of theproposed and interim regulations werecarefully examined in light of thecomments received to determine thecontinued applicability of thejustifications. Those reasons, enunciatedin the proposed and interim regulations,should be regarded as the basis for this
final rule unless otherwise stated, orunless inconsistent with this final ruleoi this preamble. A thoroughunderstanding of the rationale forvarious provisions of this final rule mayrequire reference to the preamble ofboth the proposed rule published onFebmary 8, 2013 (78 FR 9530) and theinterim final rule published on June 28,2013 (78 FR 39068).
To view all public comments on theIFR, go to www.regu7dyojis.gov andsearch for public submissions underdocument number FNS-2011-0019-4716. Once the search results populate,click on the blue text titled, "OpenDocket Folder. " USDA appreciates thepublic comments and shared operatorexperiences as they have been essentialin developing a final rule that isexpected to improve the quality of allfoods sold outside of the NSLP and SEP.
IV. Siunmary of the Final RuleCompetitive Food Standards
The competitive foods and beveragesstandards included in the June 28, 2013,IFR were implemented on July 1, 2014,and are retained in this final rule withsome modifications, as noted in thefollowing chart in bold letters. Themodifications or changes made in thisfinal rule are discussed next in thepreamble.
SUMMARY OF FINAL RULE COMPETITIVE FOOD STANDARDS
Food/nutrient Standard
General Standard for Com-petitive Food.
To be allowable, a competitive FOOD item must:(1) Meet all of the proposed competitive food nutri-
ent standards; and(2) Be a grain product that contains 50% or more
whole grains by weight or have whole grains asthe first ingredient; or
(3) Have as the first ingredient one of the non-grain main food groups: fruits, vegetables, dairy,or protein foods (meat, beans, poultry, seafood,eggs, nuts, seeds, etc. ); or
(4) Be a combination food that contains at least 1Acup fruit and/or vegetable.
(5) If water is the first ingredient, the second ingre-dientjnust be one of the above.
Any entree item offered as part of the lunch program orthe breakfast program is exempt from all competitivefood standards if it is served as a competitive foodon the day of service or the day after service in thelunch or breakfast program.
Grain Items .......................... Acceptable grain items must include 50% or morewhole grains by weight, or have whole grains as thefirst ingredient.
Total Fats1 ........................... Acceptable food items must have <35% calories from
total fat as served.
Exemptions to the standard
Fresh and frozen fruits and vegetables with no addedingredients except water are exempt from all nutrientstandards.
Canned fruits with no added ingredients exceptwater, which are packed in 100% juice, extra lightsyrup, or light syrup are exempt from all nutrientstandards.Low sodium/No salt added canned vegetables withno added fats are exempt from all nutrient standards.
NSLP/SBP Entree ItemsSold a la Carte.
. Reduced fat cheese (including part-skim mozzarella)is exempt from the total fat standard.
. Nuts and seeds and nut/seed butters are exemptfrom the total fat standard.
. Products consisting of only dried fruit with nuts and/or seeds with no added nutritive sweeteners or fatsare exempt from the total fat standard.
. Seafood with no added fat is exempt from the totalfat standard.
604

Federal Register / Vol. 81, No. 146/Friday, July 29, 2016/Rules and Regulations 50135
SUMMARY OF FINAL RULE COMPETITIVE FOOD STANDARDS-Continued
Food/nutrient Standard
Saturated Fats Acceptable food items must have <10% calories fromsaturated fat as served.
Trans Fats
SugarZero grams of trans fat as served (<0, 5 g per portion).Acceptable food items must have <35% of weight from
total sugar as served.
Sodium ................................. Snack items and side dishes: <200 mg sodium per itemas served, including any added accompaniments.
Entree items: <480 mg sodium per item as served, in-eluding any added accompaniments.
Calories ................................ Snack items and side dishes: £200 calories per item asserved, including any added accompaniments.
Entree items: ^350 calories per item as served includ-ing any added accompaniments.
Accompaniments .................. Use of accompaniments is limited when competitivefood is sold to students in school. The accompani-ment must be included in the nutrient profile as partof the food item served and meet all proposed sland-ards.
Caffeine ................................ Elementary and Middle School: foods and beveragesmust be caffeine-free with the exception of traceamounts of naturally occurring caffeine substances.
High School: foods and beverages may contain caf-feine.
Beverages ............................ Elementary School. Plain water or plain carbonated water (no size limit);. Low fat milk, unflavored (SB fl oz);. Non-fat milk, flavored or unflavored (<8 fl oz), includ-
ing nutritionally equivalent milk alternatives as per-mitted by the school meal requirements;
. 100% fruit/vegetable juice (^8 fl oz); and.
. 100% fruiWegetable juice diluted with water (with orwithout carbonation), and no added sweeteners {S8 floz).
Middle School. Plain water or plain carbonated water (no size limit);. Low-fat milk, unflavored (512 fl oz);. Non-fat milk, flavored or unflavored ($12 fl oz), in-
eluding nutritionally equivalent milk alternatives aspermitted by the school meal requirements;
. 100% fruit/vegetable juice (<12 fl oz); and
. 100% fruit/vegetable juice diluted with water (with orwithout carbonation), and no added sweeteners (<12fl oz).
High School. Plain water or plain carbonated water (no size limit);. Low-fat milk, unflavored (S12 fl oz);
Exemptions to the standard
. Whole eggs with no added fat are exempt from thetotal fat standard.
Combination products other than paired exempt foodsare not exempt and must meet all the nutrient stand-ards.
. Reduced fat cheese (including part-skim mozzarella)is exempt from the saturated fat standard.
. Nuts and seeds and nuVseed butters are exemptfrom the saturated fat standard.
. Products consisting of only dried fruit with nuts and/or seeds with no added nutritive sweeteners or fatsare exempt from the saturated fat standard.
. Whole eggs with no added fat are exempt from thesaturated fat standard.
Combination products other than paired exempt foodsare not exempt and must meet all the nutrient stand-ards.
. Dried whole fruits or vegetables; dried whole fruit orvegetable pieces; and dehydrated fruits or vegetableswith no added nutritive sweeteners are exempt fromthe sugar standard.
. Dried whole fruits, or pieces, with nutritive sweet-enere that are required for processing and/or palat-ability purposes (f. e., cranberries, tart cherries, orblueberries) are exempt from the sugar standard.
. Products consisting of only dried fruit with nuts and/or seeds with no added nutritive sweeteners or fatsare exempt from the sugar standard.
605

50136 Federal Register / Vol. 81, No. 146/Friday, July 29, 2016/Rules and Regulations
Food/nutrient
Sugar-free Chewing Gum
SUMMARY OF FINAL RULE COMPETITIVE FOOD STANDARDS-Continued
Standard
. Non-fat milk, flavored or unflavored (S12 fl oz), in-eluding nutritionally equivalent milk alternatives aspermitted by the school meal requirements;
. 100% fruiVvegetable juice (<12 fl oz);
. 100% fruifvegetable juice diluted with water (with orwithout carbonation), and no added sweeteners (<12fl oz);
. Other flavored and/or carbonated beverages (^20 floz) that are labeled to contain <5 calories per 8 fl oz,or <10 calories per 20 fl oz;and
. Other flavored and/or carbonated beverages (<12 floz) that are labeled to contain <40 calories per 8 floz, or <60 calories per 12 fl oz.
Sugar-free chewing gum is exempt from all of the com-petitive food standards and may be sold to studentsat the discretion of the local educational agency.
Exemptions to the standard
V. Discussion ofComjnents andChanges to the Final Rule
Definitions
The amendments made by theHHFKA stipulate that the nuta-itionstandards for competitive food apply toall foods and beverages sold: (a) Outsidethe school meals programs; (b) on theschool campus; and (c) at any timeduring the school day. The IFR at§210.11(a) included definitions ofCompetitive food. School day, andSchool campus.
Competitive food means all food andbeverages other than meals reimbursedunder programs authorized by the NSLAand the CNA available for sale tostudents on the School campus duringthe School day. Fifteen comments werereceived on this definition. Severalcommenters, including advocacyorganizations and professionalassociations, generally agreed with thedefinition for "competitive food. " Morespecifically, these commenterssupported that the competitive foodstandards will apply to all foods andbeverages sold across the school campusand throughout the school day (until "atleast 30 minutes after school ends). Anadvocacy organization and anindividual commenter suggested thatFNS substitute the word "served" forthe term "available for sale" in thedefinition of "competitive food"because doing so would send a moreconsistent message to students andfamilies by assuring that all foodsbrought into the school were subject tothe same standards. The Department
1 Please note that the Total Fat nutrient standardis bemg maintained as m interim final standard.The Department is requesting additional cominentson this standard in this rulemaldiig. Please seefurther discussion in Part V of this preamble.
wishes to point out that theamendments made by the HHFKA donot provide the Secretary withjurisdiction over foods brought fromoutside of the school. Therefore, thedefinition for "competitive food" isunchanged in this rule.
School day means, for the purpose ofcompetitive food standardsimplementation, the period from themidnight before, to 30 minutes after theend of the official school day. Thirtycomments were received on thisdefinition. Nine of those commentsmentioned the applicability of the IFRto non-school hours.
Some commenters, including a tradeassociation, a food manufacturer, and aschool district, expressed support forthe IFR definition for "school day."However, more commenters disagreedwith the IFR definition of "school day"primarily requesting that the definitionshould be expanded to include all timesduring which students are on campusand engaged in school-sponsoredactivities or all after-school hours inorder to achieve the objective ofpromoting healthy food choices forchildren. Some commented thatimposing competitive food standardsduring the school day but eliminatingthem after school sends a mixedmessage with regard to the need to eathealthy foods at all times.
In conta-ast, a ta-ade association and afood manufacturer suggested that USDAshould more narrowly define "schoolday" to exclude foods sold at schoolprograms and activities that occurbefore the start of the instructionalschool day to achieve consistency withthe treatment of afterschool activities.Other individual commenters suggestedthat the school day should start at thebeginning of school and end at thedismissal bell in order to allow morning
and after school sales of noncompliantcompetitive foods.
THe Department wishes to reiteratethat section 208 of the HHFKA amendedthe CNA to require that the competitivefood standards apply to foods sold atany time during the school day, whichdoes not include afterschool programs,events and activities. In addition'. as areminder, these standards are minimumstandards. If an LEA wishes to expandthe application of the standards toafterschool activities, they may do so.The definition of "school day is,therefore, unchanged in this final rule.In addition, in order to clarify theapplicability of the competitive foodsnuta-ition standards, if a school operatesa before pr after-school program throughthe Child and Adult Care Food Programor the NSLP, the meal patternrequirements of the appropriate programshall be followed.
Paired Exempt FoodsThe competitive food standards
provide exemptions for certain foodsthat are nutrient dense, even if they maynot meet all of the specific nutrientrequirements. For example, all fresh,frozen and most canned fruits asspecified in § 210. 11(d)(l] are exemptfrom all of the nuta-ient standardsbecause we want to encourage studentsto consume more of these foods.Similarly, peanut butter and other nutbutters are exempt from the total fat andsaturated fat standards, since thesefoods are also nutrient dense andprimarily consist of healthier fats.
A combination food is defined as aproduct that contains two or more foodsrepresenting two or more of the foodgroups: Fruit, vegetable, dairy, proteinor grains. When foods are combined,they no longer retain their individualexemptions and must meet the nutrientstandards that apply to a single item.
606

Federal Register / Vol. 81, No. 146/Friday, July 29, 2016/Rules and Regulations 50137
However, the regulation did notspecifically address the treatment offoods that are exempt from theregulatory requirements when they aresimply paired and packaged with otherproducts (without added ingredients)that are also exempt from one or moreof the standards. Many of these "pairedexemptions" are nutrient dense andcontain foods that meet the intent of the
competitive foods requirements. Inresponse to concerns raised by operatorsin the first year of implementation, FNSissued policy guidance clarifying that"paired exempt foods" retain theirindividually designated exemption fortotal fat, saturated fat, and/oi sugarwhen packaged together and sold.Paired exempt foods are required tomeet the designated calorie and sodiumstandards specified in paragraphs§ 210.11(1) and (j) at all times. Someexamples of paired exemptions include:
. Peanut Butter and celery. Peanutbutter is exempt from the total fat andsaturated fat requirements. When it ispaired with a vegetable or fruit, such ascelery, the paired snack retains the totalfat and saturated fat exemptions andmay be served as long as the calorie andsodium limits are met.
. Celery paired with peanut butterand unsweetened raisins. As notedabove, celery and peanut butter bothhave exemptions. Similarly, dried fruit,such as unsweetened raisins, are exemptfrom the sugar limit. However, calorieand sodium limits still apply to thesnack as a whole.
. Reduced fat cheese served withapples. Reduced fat cheese is exemptfroin the total fat and saturated fat
limits. When it is paired with avegetable or fruit, such as apples, thepaired snack is only required to meetthe calorie and sodium limits.
. Peanuts and apples. Peanuts areexempt from the total fat and saturatedfat limits. When peanuts are paired witha vegetable or fruit, such as apples, thepaired snack is only required to meetcalorie and sodium limits.
Operator implenientation using thepolicy guidance was positive. Therefore,FNS is formalizing this policyclarification through this final rule byadding a definition of Paired exempt/oodsat§210. 11(a)(6).
Definition of Entree ItemEntree item was defined in
§ 210. 11(a)(3) as an item that includesonly the following three categories ofmain dish food items:
. A combination food of meat or meatalternate and whole grain rich food;
. A combination food of vegetable orfruit and meat or meat alternate; or
. A meat or meat alternate alone,with the exception of yogurt, low-fat orreduced fat cheese, nuts, seeds and nutor seed butters.
During the course of implementation,some questions were received withregard to packaging and selling twosnack items together, such as a cheesestick and a pickle or a whole grain-richcookie and yogurt, and considering thatitem to be an entree in order to sellproducts with the higher enta-ee calorieand sodium limits. The proposed ruleclearly expressed the Department'sintent that an entree be the main dishin the meal, Therefore, in order toclarify the definition of'Enta-ee item",the phrase "intended as the main dish"is being added to the regulatorydefinition.
Some commenters, including tradeassociations and food manufactiu-ers,urged FNS to expand the definition ofentree to include a grain only, whole-grain rich enta-ee, on the basis that suchfoods are commonly served entree itemsin the SEP (e.g., pancakes, cereal, orwaffles). A ti-ade association and a foodmanufacturer commented that if a
breakfast item does not qualify for thedefinition of entree item, it will berestricted to the 200-calorie limit forsnack items, which falls well below theminimum calorie requirements forbreakfast under the SEP.
An individual commenterrecommended creating a separatedefinition of "breakfast enta-ee" to allowgrain/bread items as an option. Aprofessional association and a foodmanufacturer requested that typicalbreakfast foods, such as a bagel and itsaccompaniments be considered anentree rather than a snack/side item atbreakfast time or at lunch time.However, a State department ofeducation, a community organization,and some individual commentersrecommended that FNS not allow agrain-only enta-ee to qualify as abreakfast entree item. The communityorganization argued that these items areof minimal nutritional value andtypically involve the addition of high-sugar syrups. The State department ofeducation commented that allowinggrain-only entree items under thecompetitive food regulations wouldallow schools to sell SEP entree itemssuch as muffins, waffles, and pancakesthat would not otherwise meet thecompetitive food standards.
In view of the comments as well asinput received on grain-only entreesduring implementation of the IFR, theDepartment published PolicyMemorandum SP 35-2014 to clarifythat, although grain-only items were notincluded in the IFR as entrees, an SFA
is permitted to determine which item(s]are the entree items for breakfastsoffered as part of the SEP. The policyflexibility was well received and,therefore, this final rule amends thedefinition of "Entree item" to includereference to whole grain rich, grain-onlybreakfast items served in the SEP,making them allowable breakfast entreessubject to the entree exemptionsallowed in the rule on the day of andthe day after service in the SBP. Suchentree items also may be served at lunchin the NSLP on the day of 01 the dayafter service in the SBP.
In summary, this final rule makes nochanges to the IFR definitions ofCompetitive food, Combination foods,School day, and School campus at§ 210.11(a), This mle adds a definitionof Paired exempt foods to allow pairedexemption items to be sold in schools,and amends the definition of Entreeitem to include: (1) A specific referenceto grain only breakfast entrees served inthe SEP, and (2) to incorporate the term"intended as the main dish" into thedefinition to further clarify therequirements for entrees as well asentree exemptions.
State and Local Educational AgencyStandards
Under § 210. 11(b)(l) of the IFR, Stateand/or LEAs have the discretion toestablish more rigorous restrictions oncompetitive food, as long as they areconsistent with the provisions set forthinjprogram regulations.
Thirty-five comments addressed thisdiscretion and numerous commentersexpressly supported the provision.Several commenters, including a schoolprofessional association, and individualcommenters, urged FNS to not allowadditional standards for competitivefoods beyond the Federal standardsbecause a national standard will allowmanufacturers to produce food items ata lower cost. A ta-ade associationrecognized that the IFR may not bepreemptive, but requested that USDAnot encourage States to create additionalcriteria for competitive foods. Thiscommenter expressed concerns thatinconsistent State policies forcompetitive foods will limitreformulation opportunities.
However, 12 advocacy organizationsand an individual commenter expressedthe need for a national framework forcompetitive foods and also expressedsupport for allowing States andlocalities to implement locally-tailored,standards that are not inconsistent withthe Federal requirements. Similarly,some school professional associationsand individual commenters supportedallowing States the flexibility to create
607

50138 Federal Register/Vol. 81, No. 146/Friday, July 29, 2016/Rules and Regulations
their own restrictions on competitivefoods, as needed,
The ability of State agencies and LEAsto establish additional standards that donot conflict with the Federalcompetitive food requirements isconsistent with the intent of section 208of the HHFKA, and with the operationof the Federal school meal programs ingeneral. That discretion also provides anappropriate level of flexibility to Statesand LEAs to set or maintain additionalrequirements that reflect their particularcircumstances consistent with thedevelopment of their local schoolwellness policies. Any additionalrestrictions on competitive foodestablished by school districts must beconsistent with both the Federalrequirements as well as any Staterequirements.
This final rule makes no change to theprovision allowing States and LEAs toestablish additional competitive foodstandards that are not inconsistent withthe Federal requirements. Thisprovision may be found at§210.1l(b)(l].
Suggestions To Prohibit Foods WithArtificial Colors, Flavors and/orPreservatives
FOTU- individual commentersexpressed concerns about continuing toallow the sale of foods that containgenetically modified organisms (GMO)and foods containing artificialingredients, colors, and flavors. Justover 30 comments were received onother issues relating to foodrequirements. These commentsincluded suggestions such aseliminating or putting limitations onhigh fructose corn syrup, sugar, fiber,and GMO foods. One individualcommenter lu-ged that all foods sold inschools should be organic.
The Food and Drug Administration(PDA) makes determinations regardingthe safety of particular food additivesand USDA defers to PDA on suchdeterminations. As discussedpreviously, these standards are minimalstandards that must be met regardingcompetitive foods sold in schools. Thisfinal rule continues to provide theflexibility to implement additionalstandards at the State and/or local level.
General Competitive Foods StandardsThe rationale for many comments
received on the IFR was consistencywith the HUSSC and Alliance for aHealthier Generation standards. TheDepartment wishes to point out thatwhile those standards were consideredin the development of the proposedmle, both of those standards haveconformed to the USDA competitive
foods standards subsequent topublication of the IFR.
Combination Foods
The general nuta-ition standard in therule at §210. 11(c)(2)(iv) specifies thatcombination foods must contain V4 cupof fruit or vegetables. The Departmentreceived 45 comments on this provisionof the IFR, the majority of which urgedus to reduce the fruit or vegetablecomponents to Vs cup to be consistentwith NSLP/SBP standards, which allowschools to credit Ve cup of fruit orvegetable toward the total quantityrequired for school meals. As indicatedin the preamble to the IFR rule,maintaining the higher V4 cup quantityrequirement for fruits/vegetables incombination foods generally supportsthe availability of more nutritiouscompetitive food products and isconsistent with the Institute of Medicine(IOM) recommendations and the DGA.Competitive foods are evaluated on thebasis of the qualities of the individualproduct being sold as opposed to thequantity of the ingredients of theproduct being credited toward the mealpattern requirement in the NSLP or SBP.Moreover, it is important to note thatcombination foods with less than V4 cupof a fruit or vegetable may indeedqualify under the other foodrequirements specified in the rule, suchas the whole grain rich or food groupcriteria, depending on the compositionof the food item. It is only for thosefoods that qualify solely on the basis ofbeing a competitive food product thatcontains a fruit or vegetable that this 1Acup specification is required. This foodstandard as specified in§210.11(c)(2)(iv) is, therefore, retainedin the final rule.
Whole Grains
One of the general standards forcompetitive foods included in§ 210.11(c)(2)(ii) and (e) requires thatgrain products be whole-grain rich,meaning that they must contain 50percent or more whole grains by weightor have whole grains as the firstingredient.
About 60 comments addressed thisIFR requirement. Many commenters,including a State department ofeducation, urged USDA to make thecompetitive food whole grain standardconsistent with the NSLP/SBP wholegrain standard. Several commenters,including a school professionalassociation and individual commenters,supported the "whole grain rich"requirement. In particular, foodmanufacturers, trade associations, and aschool district emphasized theimportance of including the criteria that
the whole grains per serving should begreater than or equal to 8 grams in thewhole grain-rich identifying criteria.Three individual commenters generallyopposed the whole grain-richrequirement.
LS indicated in the preamble to theproposed rule, this standard isconsistent with the DGArecommendations, the whole grain-richrequirements for school meals" and theprior HUSSC whole grain-richrequirement (HUSSC has subsequentlyupdated the standards to conform tothese competitive food standards). TheDepartment wishes to point out that thewhole graiu criteria for competitivefoods is used as a criterion fordetermining the allowability of anindividual item to be sold as acompetitive food, while school meals'whole grain-rich criteria determine thecrediting of the menu items toward thegrain component of the meal. Allowingthe additional measures for grainsuggested by some commenters such as>8 grams of whole grain would notensure that grain products incompetitive food contain at least 50percent whole grains and would requireadditional information from themanufacturer. Therefore, the wholegrain-rich standard established in theinterim final mle is affirmed in thisfinal rule.
The food industry has made asignificant effort to reformulate productsto meet this standard and to reinforcethe importance of whole grains to thegeneral public as well. These effortshave resulted in the availability ofnumerous whole grain-rich products inthe general public marketplace as wellas in the foods available for service andpurchase in schools. Maintaining thisstandard ensures that students have theflexibility to make choices among thenumerous whole grain-rich productsthat are now available to them in school.
Since this competitive food standardis consistent with the DGArecommendations, the whole grain-richrequirements for school meals", andHUSSC standards, this final rule affirmsthe requirement as established byinterim final rule.
DGA Nutrients of Public Health ConcernIn recognition of the marketplace and
implementation limitations, but alsomindful of important national nuta-itiongoals, the IFR implemented a phased-inapproach to identifying allowablecompetitive foods under the generalstandard. For the initial implementationperiod in School Year 2014-15 throughJune 30, 2016 (School Year 2015-16),"the general food standard included acriterion that if a competitive food met
608

Federal Register/Vol. 81, No. 146/Friday, July 29, 2016/Rules and Regulations 50139
none of the other General Standards,that food may be considered allowableif it contained 10 percent of the DailyValue of a nutrient of public healthconcern (i.e., calcium, potassium,vitamin D, or dietary fiber). EffectiveJuly 1, 2016, this criterion was removedas a general criterion.
Eight commenters, including somefood manufacturers, opposed the phaseout of this criterion as a GeneralStandard for allowable foods. However,information available to the Departmentindicates that industry has made majorstrides over the past three years andmany manufactiirers have come intocompliance with the competitive foodstandards by reformulating theirproducts in recognition of the fact thatthe 10-percent DV General Standardwould become obsolete as of July 1,2016. Prior to July 1, 2016, fewer than21 products that depended solely on the10-percent DV General Standardappeared on the Alliance for a HealthierGeneration (AHG) Food Navigator asSmart Snacks compliant foods. Thereare currently about 2, 500 Smart Snackscompliant products listed in the AHGproduct database. This means that itemsthat had qualified based solely upon the10-percent DV General Standardrepresented less than 1 percent (0. 84percent] of the products that had beencaptured in the Alliance Navigator.
Therefore, this final rule makes nochanges to the General Standards forcompetitive foods established by the IFRand the 10-percent DV standard hasexpired as scheduled. Eliminating the10-percent DV criterion more closelyaligns the competitive food standardswith the DGA, as required by theHHFKA.
Elimination of this standard aligns thecompetitive foods rule with the DGAwhich states that "nuti-ients shouldcome primarily from foods" as well asthe IOM recommendations whichindicate that this approach "reinforcesthe importance of improving the overallquality of food intake rather thannuta-ient-specific sta-ategies such asfortification and supplementation."
Specific Nutrient Standards §210. 11(d)-M
In addition to the General Standards,the mle includes nutrient standards forspecific nutrients contained inallowable foods. These includestandards for total fat, saturated fat,ti-ans fat, total sugars, calories andsodium. These standards apply tocompetitive foods as packaged or servedto ensure that the competitive foodstandards apply to the item sold to thestudent,
Twenty commenters expressedgeneral support for the IFR nutrientstandards for competitive foods withoutdiscussing a specific element of thenutrient standards. Several advocacyorganizations and professionalassociations agreed with requiring thatall foods sold in schools meet the
nutrient standards and with limitingcalories, fats, sugars, and sodium insnack foods and beverages. A healthcare association expressed support forthe nutrition standards adopted in theIFR suggesting that any changes madeshould sti-engthen the standards and notweaken them. Another health careassociation expressed the belief that theestablished limits will inherentlypreclude the sale of candy and otherconfections and products with addedsugars that promote tooth decay. Anindividual commented that the nutrientstandards will eliminate manyseemingly healthy foods that aresurprisingly laden with sugar, calories,fat, or salt. A ta-ade associationsupported the use of a nuta-ition criteria-based system for competitive foodstandards, as opposed to a sta-ucture thatallows and disallows specific foods,because manufacturers will have theopportunity to reformulate and innovateto meet the rule's provisions.
Seven commenters expressed generalopposition to the IFR nutrient standardsfoi competitive foods withoutdiscussing a specific element of thenutrient standards. A few individualcommenters expressed concerns that theIFR nutrient standards will encouragechemically processed low-fat foods andsugar substitutes at the expense ofwhole foods and natural sugars. A foodmanufacturer urged USDA to simplifythe criteria for competitive foods byusing only the calorie limit andeliminaUng the total fat, saturated fat,and sugar limits, arguing that thecombined calorie limit and food groupstandards would be less burdensome toimplement and would inherently limitfats and sugars.
The overwhelming majority ofcomments received on the proposedrule supported the nutrient standardsand those standards were incorporatedinto the IFR with some minor changes.The IFR comments received on thisissue were minimal and primarilysupported the established standards.Therefore, this mle finalizes thenuti-ient standards as included in theIFR with the addition of severalmodifications being made to itemsexempt from those nutrient standards asdiscussed below.
Fruits and VegetablesGenerally consistent with both the
IOM and the DGA, the IFR included anexemption to the nutrient standards forfresh, frozen and canned fruits andvegetables with no added ingredientsexcept water or, in the case of fruit,packed in 100 percent fruit juice, extralight syrup or light syrup; and forcanned vegetables that contain a smallamount of sugar for processing purposesin order to maintain the quality andstructure of the vegetable^
Ten comments expressed support forthe IFR exemption from the nutrientstandards for fresh, frozen, or cannedfruits and vegetables. In particular, aschool professional association andsome individual commenters agreedwith the decision to include "lightsyrup" in the exemption. A foodmanufacturer supported the inclusion ofall forms of fruit, and products madewith fruit, without added nutritivesweeteners, as competitive foods.
Three commenters recommended thatthe exemption for fruits and vegetablesbe more sta-ingent. These commenterssuggested that any added syrupcontributes added unneeded sugars.Two t-ade associations supported theTFR provision that fruit packed in lightsyrup is exempt from the nufa-itionstandards.
However, a few comments werereceived addressing the exemptionparameters for canned vegetables-allowing an exemption only for thosecanned vegetables containing water anda small amount of sugar for processing.A trade association and a foodmanufacturer stated that they were notaware of any canned vegetables thatcontain only water and sugar forprocessing purposes. They indicatedthat sodium, citric acid, and otheringredients are commonly used in theprocessing of canned vegetables. Theyalso pointed out that those processingaids are allowed to be used in the lowsodium vegetables packed for the USDAFoods Program.
The Department wishes to point outthat, although some sodium is used inprocessing canned vegetables, mostcanned vegetables would sUll meet thenutrient standards for sodium withoutbeing given a specific exemption.However, in light of the importantnutrients provided by vegetables, forease of operator implementation and inrecognition of common processingprocedures, the Department agrees thatlow sodium/no salt added cannedvegetables should also benefit from thefruit and vegetable exemption. Thisfinal rule, therefore, revises the cannedvegetable exemption to allow low
609
50140 Federal Register / Vol. 81, No. 146/Friday, July 29, 2016/Rules and Regulations
sodium/no salt added canned vegetableswith no added fat to be exempt fromeach of the competitive food nutrientstandards.
Total Fat. Saturated Fat and Trans Fat
To qualify as an allowablecompetitive food, the IFR at § 210. ll(f)requires that no more than 35 percent ofthe total calories per item as packagedor served be derived from total fat andrequires that the saturated fat content ofa competitive food be less than 10percent of total calories per item aspackaged or served. In addition, asspecified in § 210.11(g), a competitivefood must contain zero grams of ta-ansfat per portion as packaged or served(not more than 0. 5 grams per portion).
While there are no exemptions fromthe teans fat standard, there are anumber of exemptions from the total fatand the saturated fat standards. Seafoodwith no added fat is exempt from thetotal fat standard but is still subject tothe saturated fat, brans fat, sugar, calorieand sodium standards. Exemptionsincluded in the IFR to both the total fatand saturated fat standards include
reduced fat cheese and part skimmozzaiella cheese not included in acombination food item, nuts and seedsand nut/seed butters not included in acombination food item and productsthat consist of only dried fruit with nutsand/or seeds with no added nutritive
sweeteners or fat. Such exempt productsare still subject to other competitivefood nuta-ient standards such as theta-ans fat, sugar, calorie and sodiumstandards.
Total Fat
Fifteen commenters, including aschool professional association andseveral individuals, expressed supportfor the IFR competitive food restrictionon total fat. No comments were receivedto make this standard more stringent.However, about 30 comments opposedthe IFR resti'iction on total fat, arguingin favor of either making the restrictionless stringent or eliminating thestandard entirely. Two tradeassociations asserted that the total fatlimit is inconsistent with the NSLP/SBPstandards, which limit saturated fat andtrans fat but not total fat. Thesecommenters suggested that limitationson calories, saturated fat, and ta'ans fatin competitive food standards willensure that the foods are low in total fat.Similarly, a school district alsorecommended removing the total fatlimit, asserting that such a limit isinconsistent with the NSLP/SBPrequirements and will place an undueburden on menu planners.
Fifty-five comments addressed theIFR exemptions from the total fat limit.Three trade associations and a foodmanufacturer expressed support for theexemption for part-skim mozzarella.Two individual cominenters, however,opposed the exemption for reduced-fatcheese and part-skim mozzaiella,asserting that whole foods may behealthier than low-fat alternatives.Three trade associations and a schooldistrict favored extending theexemption for reduced-fat cheese to allcheese that meets the calorie limits.
Some commenters suggested variousother modifications to the standards forindividual foods, such as eggs, yogurt,and full fat cheese. A couple ofcomments dealt with variouscombinations of food items that areeffectively dealt with in this final rulewith the addition of a definition ofPaired exempt foods discussedpreviously in this preamble.
One commenter mistakenly noted thatalternative milk products allowed in thereimbursable meals programs may notmeet these requirements. We wish toclarify that total fat, saturated fat andtrans fat standards do not apply tobeverages.
The Department recognizes that theremay be foods that are commonlyenjoyed by students and are generallyhealthy, but do not currently meet thecompetitive food standards due to thetotal fat content. Specifically, we areaware that some legume-based spreads/dips may offer significant nutritionalbenefits, but may not be able to meettotal fat standards due to the inherentfat content of key ingredients intraditional legume based spreads ordips, such as hummus. Anothercommon and generally healthy snackfood is guacamole. Although avocado iscurrently exempt from the total fatstandard because it is a fruit, whenother non-fruit or vegetable ingredientsare added to make a dip, the exemptionis lost and the total fat standard isexceeded. Other common and generallyhealthy foods that may benefit fromremoval of the total fat standard includesnack bars and salads with dressing.
Because the DGAs are based on tlielatest scientific research and do nothave a key recommendation for total fatand to address commenter requests forconsistency between standards forcompetitive foods sold in schools andthe NSLP/SBP, the Department hasdetermined that further commentshould be accepted on the total fatstandard. In particular, comments arerequested on whether the standard fortotal fat should be eliminated given thatthere will continue to be standards inplace for calories, sodium, saturated fat,
and ta-ans fats which will limitunhealthy fats. Comments are alsosought on whether the total fat standardshould be maintained but shouldexempt certain food items. While thetotal fat standard as ciurentlyimplemented will continue to be inplace, this single, individual standardremains an interim final standard. TheDepartment, as previously noted, willaccept public comments on thisstandard only. The Department isinterested in comments related to theimpact revising or eliminating the totalfat standard may have. This couldinclude allowing more items to be soldthat are lower in unhealthy, saturatedfats but that might be higher in healthy,unsaturated fats and simplifyingimplementation for local operators.Commenters also should considerwhether there could be unintendedconsequences to revising or eliminatingthe total fat standard. As noted above,commenters should keep in mind thatthe standards for calories, sodium,saturated fat, and trans fat remain inplace and will continue to limit thetypes of foods that may be sold inschools.
Saturated Fat (<10% of Calories)Twenty comments expressed support
for the IFR competitive food restrictionon saturated fat. A school districtrecommended consistency with NSLP/SEP by only calculating saturated fatand total calories.
Twenty-five commenters wereopposed to the IFR restriction onsaturated fat, arguing in favor of eithermaking the restriction less stringent oreliminating the standard entirely. Aschool professional association andindividual commenters argued that thestandard is too restrictive and willexclude grilled cheese, chicken tenders,hot dogs, pizza, and healthy optionentrees.
Forty-five comments addressed theIFR exemptions from the saturated fatlimit. Most of the comments requestedsaturated fat exemptions for the sameproducts for which they requested totalfat exemptions discussed above. Threetrade associations and a school districtfavored extending the saturated fatexemption to all cheese that meets thecalorie limits.
Additional comments specificallyaddressed exemptions from thesaturated fat limit. A professionalassociation and several individualcommenters suggested that the saturatedfat standard should exclude eggs orcheese packaged for individual sale andfornon-fried vegetables and legumes.
Seven comment letters inclu'ded othercomments relating to the IFR saturated
610

Federal Register/Vol. 81, No. 146/Friday, July 29, 2016/Rules and Regulations 50141
fat limit. Two trade associations and a
food manufactiu-er requested that FNSclarify a conflict in the IFR. Thesecommenters stated that the "Summaryof Major Provisions" in the preamblestates that competitive foods mustcontain "no more than 10 percent" oftotal calories from saturated fat, but§ 210. 11(f)(l)(ii) states that the saturatedfat content of a competitive food mustbe "less than 10 percent" of totalcalories. The Department wishes toclarify that the requirement as includedin the regulatory provision at§ 210. 11(f)(l)(h) that the saturated fatcontent of a competitive food must beless than 10 percent of total calories iscorrect.
The Department does not agree thatall cheese should be exempt from thetotal fat and saturated fat standardsbecause the total fat standard includedin the IFR is identical to therecommended IOM standard for totalfat, and the saturated fat standard isconsistent with the DGArecommendations.
Trans Fat (Og as Stated on the Label)Twenty comments addressed the IFR
traas fat restriction. Severalcoramenters, including a schoolprofessional association and someindividual commenters who supportedthe total fat and saturated fat limits, alsoexpressed support for the IFR ta-ans fatlimit. A school district also expressedsupport for the IFR limitation of zerograms of trans fat in competitive foods.To reduce confusion among school foodservice workers and State auditors, atrade association and a foodmanufacturer recommended that thephrasing of the ta-ans-fat provision forcompetitive foods should be consistentwith the provision in the NSLP/SBPrequirements, which does not apply tonaturally occurring torans fats present inmeat and dairy products. While toans fatcontent is normally indicated on thelabel, the Department will provideadditional guidance as necessary on thisissue through technical assistanceresources.
Exemption for Eggs With No Added FatThe competitive food standards in the
IFR provided that, in order to qualify asan allowable competitive food, no morethan 35 percent of calories may beconta-ibuted by total fat, and less than 10percent of a food's calories may comefrom saturated fat. Eggs do exceed thesefat standards. However, similar to nutbutters, leduced-fat cheese, and seafood,eggs exceed the competitive foods fatstandards and are nutrient dense. Eggsare high in protein and contain essentialnutrients including, B vitamins. Vitamin
E, Vitamin D, iron, zinc, and
magnesium. While eggs are high in fat,the DGA recommends increasedconsumption of nuta'ient dense foodsand includes eggs in a healthy eatingpattern. Evidence suggests that one egga day does not increase a person's riskfor high cholesterol or cardiovasculardiseases. In addition, some previousState agency standards as well as theprevious standards implemented by theAlliance for a Healthier Generation didallow eggs for the reasons cited above.
Therefore, in response to comments,the nutrient profile of eggs mentionedabove and operator requests to allowthis nutrient dense and low cost option,this final rule is amended to add anexemption from the total fat andsaturated fat standards for whole eggswith no added fat. This exemptionappears in § 210.11(f](iv).
Calorie and Sodium Standards forCompetitive Foods
Calories
Some commenters supported the IFRcompetitive food calorie limits. Inparticular, a health care associationurged USDA not to grant requests toincrease the IFR calorie limits becausedoing so would increase the likelihoodthat students would choose andconsume more than the recommended
number of calories, which thiscommenter asserted would undermineUSDA's efforts to address the childhoodobesity epidemic. A food manufacturerurged replacing the sugar and fatsnuti'ition standards with only the calorielimit.
Many commenters expressedopposition to the calorie limits forcompetitive foods. Commenters said theproposed limits were too stringent andwould limit student access to many foodproducts, particularly a la carte foodssold during the meal service. Somecommenters provided specificsuggestions for alternative calorie limitsfor snacks, ranging from 240 to 300calories, and for entrees, ranging from400 to 500 calories.
Fifteen commenters addressed ageand grade groupings, several suggestingseparate calorie limits by grade, similarto the structure of the school mealpatterns, reasoning that children havedifferent calorie needs as they grow.
This final rule retains the calorielimits for snacks/side dishes (200calories per item as packaged or served),and enti-ee items (350 calories per itemas packaged or served), which areconsistent with IOM recommendationsand some voluntary standards. TheDepartment does not agree that higherlimits are appropriate, as suggested by
some commenters, particularly since itis not possible to limit the number ofcompetitive food items that may bepiu-chased. We appreciate that separatecalorie limits by grade levels for snackswould align with existing voluntarystandards that many schools haveadopted, and would be more tailored tothe nutritional needs of children ofdifferent ages. However, separate calorielimits for different grade levels wouldalso add complexity for local programoperators with schools ofvarying'gradelevels. State agencies or school districtscould choose to implement varyingcalorie limits based on grades, providedthe maximum level does not exceed thelimit in this final rule. Please note thatthe calorie limit for enti-ee items wouldapply to all entrees that do not meet theexemption for NSLP/SBP entree items.
The Department wishes to point outthat great strides have been made in theavailability of competitive foods thatmeet the standards. Numerous productshave been reformulated and/orrepackaged to ensure that the productsmeet the competitive foods standardsand those products have been madeavailable to schools for sale to students.In addition, many changes have beenmade to the a la carte offerings availablein the cafeteria and these changes areconta-ibuting greatly to the overallhealthy environment that is soimportant in our schools.
Sodium
Under the IFR at § 210. 11(i), snackitems and side dishes sold a la cartecould contain no more than 200 caloriesand 230 mg of sodium per portion asserved, including the calories andsodium in any accompaniments, andmust meet all other nub-ient standardsfor non-entree items. The IFR stipulatedthat as of July 1, 2016, snack items andside dishes must have not more than200 calories and 200 mg of sodium peritem as packaged or served. Under theIFR at § 210.11(j), enta-ee items sold a lacarte could contain no more than 350calories and 480 mg sodium per portionas served, including anyaccompaniments, and meet all othernutrient standards.
Several comments, including onefrom a health care association and twofrom individuals, agreed with the IFRsodium provisions. The health careassociation argued that although somecommenters iirge USDA to create"consistent" sodium standards for theNSLP/SBP and competitive foodsstandards, the sodium limits for theschool meals program apply to an entiremeal, while the sodium limits forcompetitive foods only apply to onecomponent of a meal-a single entree,
611

50142 Federal Register / Vol. 81, No. 146/Friday, July 29, 2016/Rules and Regulations
side dish, or snack. Therefore, thiscommenter reasoned that the sodiumlimits for competitive food items shouldbe lower than those for a reimbursablemeal. An individual commenteracknowledged that sodium limits willalter the tastes of many foods, butsuggested that there are many otherspices, herbs, and other ways toenhance the flavors of foods withoutincreasing the risk of hypertension.
commenters recommendedthat the sodium reductions shouldcontinue to be phased in gradually toallow taste preferences andmanufacturers additional time to adjust.Some commenters provided suggestionsfor higher sodium limits, ranging from230 mg to 360 mg for snacks and 550 mgto 650 mg for entrees. One commenter,a manufacturer, wanted USDA to add anexemption to the sodium limit fornatural reduced fat cheese and reducedfat, reduced sodium pasteurizedprocessed cheese.
The Department's standards forsodium were based on the IOMrecommendations. The proposed "perportion as served" standards forcompetitive food were considered in thecontext of the DGAs and of the overallsodium limits for school meals, the firstof which took effect in School Year2014-15, the same school year thesecompetitive food standards wereimplemented. USDA acknowledges thatsodium reduction is an issue thatimpacts the broader marketplace, notjust schools, and understands thatsodium reduction is a process that willtake time.
In recognition of the fact that therewere existing voluntary standards forcompetitive food that had the highersodium limit of 230 mg for snacks/sidedishes, which meant there were existingproducts that had been formulated tomeet the higher standard available toschools, the IFR set the initial limit forsodium for snacks and side dishes at230 mg per item as packaged or served,for the first two years of implementationof these standards. The IFR providedthat, as of July 1, 2016, the sodium limitfor snacks and side dishes shall bereduced to 200 mg per item as packagedor served.
It is evident that many manufacturershave developed new products orreformulated existing products to meetthe July 1, 2016, 200 mg standard. TheDepartment believes that the phased inapproach taken in the IFR did work toensure product availability for schoolsfor initial implementation and providedample time for manufacturers to adjustto meet the lower limit. Therefore, thisfinal rule does not change the sodiumrequirement for snacks and side dishes.
The sodium standard of 230 mg forsnacks and side dishes expired asscheduled and the 200 mg standard isimplemented as of July 1, 2016. Inaddition, the entree limit of 480 mg peritem as packaged and served willremain in place. The Department wishesto point out that any entrees served inschool meals will be covered under theNSLP/SBP entree item exemption in§210. 11(c)(3)(i).
Total Sugars in Competitive FoodsThe IFR at § 210.11(h)(l) provided
that not more than 35 percent of theweight per item as packaged and servedcould be derived from total sugars. Inaddition, § 210.11(h)(2) provided thefollowing exemptions to the total sugarstandard:
. Dried whole fruits or vegetables;dried whole fruit or vegetable pieces;and dehydrated fruits or vegetables withno added nutritive sweeteners;
. Products that consist of only driedfruit with nuts and/or seeds with noadded nutritive sweeteners or fat; and
. Dried fruit with nuta-itivesweeteners required for processing and/or palatability piirposes. (At this time,this applies to dried cranberries, tartcherries and dried blueberries only.)
Most commenters generally supportedthe application of the total sugars byweight standard. Many commentersstated that this standard providesflexibility and would allow the sale ofmore products that are favorites amongstudents.
A trade association expressed theopinion that a restriction on sugar is nota necessary component of thecompetitive food standards becausecalorie limits will prevent excess sugarconsumption. A State department ofeducation and an individual suggestedexpressing the sugar limit in gramsrather than percentages. Severalcommenters indicated that sugar limitswould force manufacturers to producefoods which are actually less healthy inorder to meet that standard. Anotherfood manufacturer expressed supportfor a sugar restriction based on percentcalories by weight, although stating thatit did not believe a total sugar limit iswarranted. A trade association and afood manufactitrer asserted that thesugar criterion of 35 percent by weightis in line with the Alliance for aHealthier Generation guidelines, whichwas the basis of many productsspecially formulated for schools. Theti-ade association added that for foodsthat natiirally contain fat and sugar,such as dairy products, making lower fatversions of these products reduces thepercentage of calories from fat, whichincreases the percentage of calories from
sugar, so a sugar limit based on weightis preferable.
Two comments, one received from anadvocacy organization and another froman individual commenter, favored asugar limit as a percent of caloriesarguing that such an alternative wouldbe more protective. The individualasserted that there are many foods thatwould be disallowed were the standard35 percent sugar by calories, but will beallowed because the sugar limit is apercentage of calories by weight.
The Department acknowledges thatthis standard allows more products toqualify to be sold as a competitive foodin schools but wishes to point out thatthe portion sizes of these and all foodswould be limited by the calorie and fatstandards. State agencies and schooldistricts could choose to implement asugar standard based on calories,provided that it is at least as resta-ictiveas the regulatory standard [i.e., noallowable product under the caloriemeasure could exceed 35 percent sugarby weight).
Most commenters supported theexemptions to the total sugarrequirement as well as the provisionallowing an exemption for dried fruitwith nutritive sweeteners required forprocessing and/or palatability piirposes.(At this time, this applies to driedcranberries, tart cherries and blueberriesonly. ) A school dista-ict requestedguidance listing specific dried fruits thatrequire nutritive sweeteners and urgedthat this list be maintained as guidancerather than as part of the rule so thatUSDA has flexibility to modify the listas warranted without requiringrulemaking. A trade associationcommended USDA for agreeing to issuefuture guidance on determining whichdried fruits with added nutritivesweeteners qualify for the exemption.The portion sizes of these dried fruitswould be limited by the caloriestandards.
A few commenters requested thatprocessed fruit and vegetable snacks[e.g., fruit strips, fruit feathers or fruitdrops) be included under the exemptionfor dried fruit, as many are processedwith concenta-ated fruit puree. TheDepartment, however, does not agreethat processed fruit and vegetablesnacks should be included under eitherdried fruit/vegetable exemption. Thesesnack type products are not whole driedfiruit pieces and the concentrated fruitpuree or juice concentrate used to makethese products is often the primaryingredient. These products could stillqualify without the exemption as acompetitive food if they meet all of thestandards, including having a fruit orvegetable as the first ingredient.
612
Federal Register / Vol. 81, No. 146/Friday, July 29, 2016/Rules and Regulations 50143
The 2015-2020 DGA contain specificrecommendations on limiting addedsugar. This recommendation specifiesthat no more than 10 percent of caloriesshould come from added sugars. Thecompetitive food standards addresssugar content in the context of thepercentage of sugar by weight of theproduct sold. The standards do notinclude a focus on added sugars, oradded sugars representing a particularpercentage value compared to calories.The rationale for limiting sugar byweight in the IFR was that a sugar byweight standard was included in anumber of voluntary standards reviewedduring the development of the proposedrule, and, generally, this standard wassupported by commenters as providingthe most flexibility for programoperators. The Departmentacknowledged in both the proposed ruleand IFR that a sugar standard based onadded sugars is preferable but that sucha standard would be very difficult forlocal program operators to implementand for State agencies to monitor,because the current Nutrition Facts labeldoes not differentiate between naturallyoccurring and added sugars. TheDepartment has consistently indicatedthat the sugar standard included in thisrule will be reconsidered if theNutrition Label is updated to reflectadded sugars. On May 27, 2016, theFDA published a final regulation whichincluded a requirement that addedsugars in foods be included on theNutrition Facts Label (81 FR 34000). Thenew labeling requirements will be fullyimplemented by summer 2019. Becauseof the implementation period of thelabeling rule, FNS is maintaining in thisfinal rule the sugar standard that wasput forth in the interim final rule. TheDepartment will monitorimplementation of the new labelingrequirements and, in the future,anticipates updates to programregulations and guidance regarding thesugar standard, particularly consideringhow to set standards for added sugars incompetitive foods sold to students onthe school campus during the schoolday.
Therefore, this final rule continues torequire in § 210. 11(h)(l], that the totalsugar content of a competitive foodmust be not more than 35 percent ofweight per item as packaged or servedand retains the exemption included in§ 210. 1 l(h) (2) to the total sugar contentstandards for dried fruit with addednutritive sweeteners that are requiredfor processing and/or palatabilitypurposes (currently dried cranberries,tart cherries and blueberries). USDA
will issue any necessary futiue guidance
when a determination is made toinclude any additional dried fruits withadded nutritive sweeteners forprocessing and/or palatability to qualifyfor this exemption.
Exemptions for Some or All of theNutrition Standards for Menu ItemsProvided as Part of the NSLP/SBP
The IFR exempts NSLP/SBP entreeitems from the competitive foodstandards when served as a competitivefood on the day of service or the dayafter service in the reimbursable lunchor breakfast program. Six commentersexpressed support for this approachregarding NSLP/SBP menu items sold ascompetitive foods. Most of thesecommenters, including advocacyorganizations and a health careassociation, urged USDA not to grantrequests to expand the exemption forNSLP/SBP items sold a la carte to, forexample, include side dishes. Some ofthese commenters stated that expandingthe exemption would undermine orweaken the competitive food standards.One advocacy organization expressedsupport that the IFR will require NSLP/SEP side dishes sold a la carte to meetthe competitive food standards. Anotheradvocacy organization stated that theapproach taken in the IFR will allow forreasonable flexibility for the school foodservice while also addressing concernsregarding the frequency with whichparticular food items are available.
Fifteen comments recommended thatNSLP/SBP entrees should not receive anexemption from the competitive foodstandards at any time. Somecommenters argued that reimbursablemeals are designed to provide a varietyof foods and beverages that, over thecourse of a week, create a balance of allnutrients, while limiting calories, fatsand sodium, and this balance can bedisrupted when individual foods maybe chosen at the expense of the wholemeal. Specifically, a health careassociation commented that becauseschools are allowed to balance thenutrition components of reimbursablemeals over a week, foods that mayexceed the limits for fat, sodium, andcalories can be included in areimbursable meal when balanced overthe week with healthier sides. For thisreason, an advocacy organization statedthat the exemption for a la carte NSLP/SEP enb-ees from the competitive foodstandards will allow children tocontinue to purchase less healthy entreeitems a la carte instead of nuta-itioussnack foods or more balancedreimbursable meals.
Several advocacy organizations and aprofessional association argued thatallowing the sale of any foods that are
inconsistent with the competitive foodstandards will undermine the IFR andefforts of parents to provide healthyfood options to children. Thiscommenter asserted that although theexemption for a la carte NLSP/SBPentree items only exists on the day andday after it is served as part of areimbursable meal, many schools-particularly high schools that offermultiple meals each day-may offerpopular items like pizza, breadedchicken nuggets, and burgers every dayor nearly every day.
One advocacy organizationrecognized the importance ofconsistency between foods served inmeals and a la carte and argued thatthere can be consistency withoutexempting a significant number of a lacarte items from competitive foodstandards. This commenter stated that ifindividual items meet the competitivefood standards, they should have noproblem fitting into healthful NSLP/SBPmenus, which would allow forconsistency and flexibility, while alsosafeguarding children's health.
One hundred commenters suggestedthat the competitive food standudsshould exempt NSLP/SBP entree itemssold a la carte regardless of the day onwhich they are served as part of thereimbursable meal. Many of thosecommenters argued that once an item isserved that meets reimbursable mealpattern guidelines, it should be allowedto be sold as a competitive food withoutfrequency restrictions. Some stated thatsuch an exemption would ease menuplanning and operational issues as wellas reduce confusion. These commentswere primarily made by ta-adeassociations and food industrycommenteis as well as some school foodservice organizations.
Closely associated with the issue ofexempting NSLP and SEP entrees on theday served and the day after served inthe reimbursable meal is the lack of anexemption for side dishes served in thereimbiirsable meals. Commenters werealso split on whether or not such fooditems should enjoy an exemption fromthe competitive food standards. Eightycommenters urged that NSLP/SBP'sideitems sold a la carte should be exemptfrom competitive food standards. Manyof the arguments made to support thisview were the same as those-discussedabove related to the suggestion that allNSLP/SBP entree items'should beexempt from all competitive foodstandards regardless of day served.Other commenters indicated that sideitems should not be exempt from thecompetitive food standards.
USDA understands the concerns ofcommenters on both sides of this issue.
613

50144 Federal Register / Vol. 81, No. 146/Friday, July 29, 2016/Rules and Regulations
Given the circumstances surroundingNSLP and SEP meal planning as well asthe increase in healthful entrees beingserved, it is important to maintain someflexibility when it comes to NSLP andSEP entrees. However, there is adistinction to be made between the meal
patterns for reimbursable meals and thecompetitive food standards. The NSLPand SEP offer meals over the course ofthe school week and less nuti-itiousselections may be balanced out withhealthier items over the course of theweek. Competitive food standards arebased on the nuta-ients that are providedby individual food items that are sold tostudents on the school campus duringthe school day. In addition, it isimportant to note that it appears thatmany schools have successfully adaptedto this requirement, some by expandingthe number of entrees available tostudents on a daily basis and others byincorporating side items that meet thecoinpetitive foods requirements intotheir reimbursable meal menus.
Therefore, the exemption for NSLP/SBP entree items only is retained. Sidedishes sold a la carte would be requiredto meet all applicable competitive foodstandards. The exemption for the entreeitems is available on the day the entreeitem is served in NSLP/SBP, and thefollowing school day. Entree items areprovided an exemption, but side dishesare not, in an attempt to balancecommenter opposition to anyexemptions for NSLP/SBP menu itemsand needed menu planning flexibilities.The approach adopted in this rulesupports the concept of school meals asbeing healthful, and provides flexibilityto program operators in planning a lacarte sales and handling leftovers. Weanticipate that this approach, along withthe recent changes to school mealstandards will continue to result inhealthier menu items in meals than inthe past, including entrees. Exemptentrees that are sold as competitive foodmust be offered in the same or smallerportion sizes as the NSLP and SEP.
Guidance on Competitive FoodsSeveral commenters requested
information on a variety of other issuesspecific to individual foods. Many ofthese questions have been clarified inthe extensive guidance issued by theDepartment in policy memoranda andother materials that are available on ourWeb site at http://www.fns.usda.gov/healthierschoolday/tools-schools-focusing-smart-snacks. We encourageinterested parties to review thesematerials since they are updatedfrequently. In addition, the Alliance fora Healthier Generation, in partnershipwith FNS, has developed extensive
resources including guidance materialsand the Competitive Foods Calculatorand Navigator, which provide a way toevaluate individual foods and beveragesas well as a listing of Smart Snacksallowable foods and beverages,respectively. These items are availableat www. healthiergeneration. org.
AccompanimentsThe IFR at § 210.11(n) limited the use
of accompaniments to competitive food,such as cream cheese, jelly, butter, saladdressing, etc., by requiring that allaccompaniments be included in thenutrient profile as part of the food itemserved. Two commenters supportedrequiring accompaniments to beincluded in the nutrient profile as partof the food item seryed. A Statedepartment of education commentedthat the requirement to include thenutoient content of accompaniments inthe nutrient profile of the product isappropriate and reasonable becausecondiments can conta-ibute significantcalories, sugar, fat and/or sodiiun. Aschool district expressed support for theIFR requirements relating toaccompaniments not requiring pre-portioning, but requiring that they beincluded in the nutrient profile ofcompetitive foods. Forty-fivecommenters opposed the requirementby suggesting that a weekly calorierange should be applied or that thereshould be no consideration ofaccompaniments.
The Department maintains that it isimportant to account for the dietarycontribution of accompaniments indetermining whether a food item may beserved as a competitive food.Accompaniments can providesubstantial sodium, sugar and/orcalories to food items sold. Therefore,the requirement that accompanimentsbe included in the nub-ient profile offoods is retained. As provided in theIFR, schools may determine the averageserving size of the accompaniments atthe site of service (e.g., school district).This is similar to the approach schoolshave used in conducting nutrientanalysis of school meals in the past.Schools have successfully implementedthis requirement and have not haddifficulty in determining the averageserving size of accompaniments that areused in schools, but the Department willprovide further guidance if necessary.Nutrition Standards for Beverages
The IFR at § 210. 11(m) establishedstandards for allowable beverage typesfor elementary, middle and high schoolstudents. At all grade levels, water, lowfat and nonfat milk, and 100 percentjuice and 100 percent juice diluted with
water with no added sweeteners areallowed in specified maximumcontainer sizes, which varied by gradelevel. The rule also allows additionalbeverages for high school students inrecognition of the wide range ofbeverages available to high schoolstudents in the broader marketplace andthe increased independence suchstudents have, relative to youngerstudents, in making consumer choices.
General Comments on BeverageRequirements
Ten commenters expressed generalsupport for the beverage standardsincluded in the IFR. Sfxty-fivecommenters generally opposed the ICRbeverage standards and cited a variety ofreasons, from wanting to allow all gradelevels to have no-calorie/low caloriebeverages to opposing allowing highschool students to have no-calorie/lowcalorie beverages available to them inschool. A few commenters asserted thatmilk is produced in 8 ounce and 16ounce containers and that requiring alimit of 12 ounce size milk for middleschool and high school students may beproblematic. While some commentersrecommended larger portion sizes for allbeverages, others recommended smallerportion sizes, particularly related tojuice products. Still other commenterswished to resta'ict food colorings andother ingredients in 100 percent juice.Several commenters indicated that no-calorie/low calorie beverages should notbe allowed in high school due to theinclusion of non-nutritive sweeteners insuch beverages. While about 40commenters supported the removal ofthe time and place restriction on thesale of other beverages in high schoollunchrooms during the mealservice,several commenters objected to theelimination of the restriction and a fewindicated that such beverages shouldnot be sold in any location at any timein high schools.
A few commenters suggested thatUSDA use only two grade groups for thebeverage standards-elementary andsecondary-to ease implementation.Some commenters stated that it wouldbe difficult and/or costly to administerthe beverage requirements in combinedgrade campuses, such as 7-12 or K-12.In response, USDA appreciates thatimplementation could be more difficultin schools with overlapping gradegroups, but considers it important tomaintain in the final rule the three gradegroupings included in the IFR. Thesegroupings reflect the IOMrecommendations and appropriatelyprovide additional choices to highschool students, based on theirincreased level of independence. USDA
614

Federal Register / Vol. 81, No. 146/Friday, July 29, 2016/Rules and Regulations 50145
has provided guidance on this issue andwill continue to provide technicalassistance and facilitate the sharing ofbest practices as appropriate.
Other Beverages for High SchoolMost of the comments received on the
IFR beverage requirements dealt withthe standards for other beveragesallowed in high school. A number ofcommenters wanted no-calorie and low-
calorie beverages to be available inelementary and middle schools as wellas high schools, while others opposedthese beverages at any grade level.Several commenters stated that althoughschools may impose more stringentstandards, schools may choose to selldiet beverages because the sale of suchdrinks are profit making. Othercommenters indicated that if schools arenot allowed to sell no-calorie/lowcalorie beverages in high schoolstudents will purchase them elsewhereand bring them to school.
USDA appreciates the input providedby commenters. The Departmentmaintains that, given the beveragesavailable in the broader marketplaceand the independence that high schoolstudents enjoy, low calorie/no-caloriebeverages may be sold in high schools.However, we do not agree that suchbeverages should be available toelementary and middle school studentsin school. No changes are made to thisstandard,
Caffeine
The IFR at § 210. 11(1) required thatfoods and beverages available inelementary and middle schools to becaffeine free, with the exception of ta-aceamounts of naturally occurring caffeinesubstances. This is consistent with IOMrecommendations. The IFR did,however, permit caffeine for high schoolstudents.
Four commenters agreed with the IFRcaffeine provisions. A food industa-ycommenter expressed support forlimited beverage choices for youngchildren but allowing a broader range ofproducts, including those containingtypical amounts of caffeine, in highschools, given the increasedindependence of high school students.A trade association agreed that highschool students should have access tobeverages that contain caffeine andasserted that in 1987 PDA found noevidence to show that the use of caffeinein carbonated beverages would rendersuch beverages injurious to health. Thiscommenter asserted that its membersprovide a wide array of low- and no-calorie beverages to high schools, someof which contain modest amounts ofcaffeine, but member companies have
voluntarily instituted policies againstthe sale of caffeinated beveragesmarketed as energy drinks to schools.Two school disti"icts supportedcaffeinated beverages for high schoolstudents.
Forty-five commenters opposed theIFR caffeine provisions, generallybecause it will allow foods andbeverages in high school to containcaffeine. Those commenters wereprimarily concerned about the use ofcaffeinated low-calorie energy drinksthat contain unregulated amounts ofcaffeine and other additives.
An advocacy organization citedwarnings from the American Academyof Pediatrics and added that aggressivemarketing of caffeinated products isdesigned to appeal to youth and there isa lack of information on caffeine contenton food labels. Several commentersopposed allowing the sale of caffeinateddrinks in high schools, particularlydrinks with high levels of caffeine andno nutritive value.
USDA is concerned, as are somecommenters, that some foods andbeverages with very high levels ofcaffeine may not be appropriate to besold in schools, even at the high schoollevel. The FDA has not set a dailycaffeine limit for children, but the
American Academy of Pediatricsdiscourages the consumption of caffeineand other stimulants by children andadolescents, However, the health effectsof caffeine are currently beingconsidered by the PDA and the IOM.PDA did announce that it willinvestigate the safety of caffeine in foodproducts, particularly its effects onchildren and adolescents. The PDAannouncement cited a proliferation ofproducts with caffeine that are beingaggressively marketed to children,including "energy drinks. " PDA,working with the IOM, convened apublic workshop on August 5-6, 2013,to review existing science on safe levelsof caffeine consumption and thepotential consequences to children ofcaffeinated products in the food supply.The workshop did not result in anyrecommendations but a report wasproduced and may be found at http://iom.nationalacadeinies.org/Reports/2014/Caffeine-in-Food-and-Dietary-Supplements-Examming-Safety.aspx],USDA will continue to monitor effortsby FDA to identify standards regardingthe consumption of caffeine by highschool aged children.
Therefore, given the lack ofauthoritative recommendations at thistime, this rule will not prohibit caffeinefor high school students. However,USDA acknowledges commenters'concerns and encourages schools to be
mindhil of the level of caffeine in foodand beverages when selecting productsfor sale in schools, especially whenconsidering the sale of high caffeineproducts such as energy drinks. It is alsoimportant to note that local jurisdictionshave the discretion to further resta-ict theavailability of caffeinated beveragesshould they wish to do so.
The caffeine provisions as included inthe IFR at § 210. 1 l(k) are not changed.Non-Nutritive Sweeteners
The IFR did not explicitly address theissue of non-nutritive sweeteners;however, the rule allowed calorie-freeand low-calorie beverages in highschools, which would implicitly allowbeverages including non-nutritivesweeteners,
Ten commenters addressed the use ofnon-nutritive sweeteners in food
products. Some commenters opposedallowing artificially sweetenedbeverages. For example, somecommenters opposed the sale of dietsodas, whereas others stated that thereis little evidence regarding theadvisability of intake of sugar-sweetened beverages versus intake ofnon-nutritive sweeteners in beverages.In conta-ast, some commenters supportedthe use of non-nutritive sweeteners.USDA appreciates commenter input butis not explicitly addressing the use ofnon-nutritive sweeteners in theregulatory text of this final rule. Localprogram operators can decide whetherto offer food and/or beverage items forsale that include non-nutritivesweeteners.
Other RequirementsFundraisers
The IFR at § 210.11(b)(4) requires thatfood and beverage items sold during theschool day meet the nuta-ition standardsfor competitive food but allows forspecial exemptions for the purpose ofconducting infrequent school-sponsoredfundraisers, as specified in the HHFKA.The provision included in the IFR wasthat exempt fundraiser frequency wouldbe determined by the State agencyduring such periods that schools are insession. The IFR also reauired that nospecially exempted fundraiser foods orbeverages may be sold in competitionwith school meals in the food servicearea during the meal service.
Ten commenters indicated that USDAshould establish the number and type offundraisers that are exempt from thecompetitive food standsirds to ensureconsistency among States. Othercommenters recommended that theDepartment set parameters for theminimum and maximum numbers of
615

50146 Federal Register/Vol. 81, No. 146/Friday, July 29, 2016/Rules and Regulations
exempt fundraisers based on the size of
schools. Thirty comments suggested thatall food fundraisers taking place inschools be required to adhere to thecompetitive food standards at all times.Some commenters indicated thatallowing exempt fundraisers will createconfusion among parents, students andstaff. A number of commenters notedthat the approval of exempt fundraisersshould be governed by the schoolwellness policies. Thirty commentersindicated that time and placerestrictions on exempt fundraisersshould apply not only to the foodservice area during the meal service butto all locations in the school during themeal service and some suggestedplacing timeframes on when suchfundraisers may be held (for example:one hour after the school lunch serviceis completed).
The final rule retains therequirements regarding theresponsibility of the State agency todetermine the frequency of exemptfundraisers in schools. In addition, therule continues to stipulate that there areno limits on the sale of food items thatmeet the competitive food requirements(as well as the sale of non-food items)at school fundraisers. In addition, theDepartment wishes to remind the publicthat the fundraiser standards do not
apply to food sold during non-schoolhours, weekends and off-campusfundraising events such as concessionsduring after-school sporting events.
USDA is confident that State agenciespossess the necessary knowledge,understanding and resources to makedecisions about what an appropriatenumber of exempt fundraisers inschools should be and that the most
appropriate approach to specifying thestandards for exempt fundraisers is toallow State agencies to set the allowedfrequency of such fundraisers. If a Stateagency does not specify the exemptionfirequency, no fundraiser exemptionsmay be granted. It is not USDA's intentthat the competitive food standardsapply to fundraisers in which the foodsold is clearly not for consumption onthe school campus during the schoolday. It is also important to note thatLEAs may implement more restrictivecompetitive food standards, includingthose related to the frequency withwhich exempt fundraisers may be heldin their schools, and may impose furtherresta-ictions on the areas of the schoolsand the times diuing which exemptfundraisers may occur in the schoolsdiu-ing the school day.
In addition, USDA has providedguidance on fundraisers in response toa variety of specific questions receivedduring implementation and this
guidance may be found in Policy MemoSP 23-2014(V. 3) available on our Website at http://www. fns. usda. gov/nslp/policy.
In summary, the exempt fundraiserprovisions contained in § 210. 11(b)(4) ofthe IFR are unchanged and the final rulecontinues to specify that competitivefood and beverage items sold during theschool day must meet the nutritionstandards for competitive food, and thata special exemption is allowed for thesale of food and/or beverages that do notmeet the competitive food standards forthe purpose of conducting an infrequentschool-sponsored fundraiser. Suchspecially exempted fundraisers must nottake place more than the frequencyspecified by the State agency duringsuch periods that schools are in session.Finally, no specially exemptedfundraiser foods or beverages may besold in competition with school mealsin the food service area during the mealservice.
Availability of Water During the MealService
The IFR codified a provision of theHHFt^A that requires schoolsparticipating in the NSLP to make free,potable water available to children inthe place lunches are served during themeal service. Just over 40 commentsaddressed the part of the IFR thatrequires schools participating in theNSLP to make free, potable wateravailable to children in the placelunches are served during the mealservice and in the cafeteria duringbreakfast meal service.
Many of these commenters, includingadvocacy organizations, professionalassociations and individualcommenters, expressed support for thepotable water requirement. Twoadvocacy organizations commented thatwater has zero calories and is a healthyalternative to sugary drinks. Thesecommenters stated that making thewater free and easily accessible mayhelp combat obesity and promote goodhealth. Similarly, one individualcommenter stated that the free, potablewater requirement will help reduce thepi irchase of other drinks that are high inadded sugars. A few individualcommenters remarked that low-incomestudents do not have the luxury ofbringing or buying water bottles or evenhave access to clean running wateroutside of school, and free potable wateris imperative to these students. Twoindividual commenters recommended
that free potable water be availableduring breakfast, lunch, and all breakand recess times regardless of wherefood is being served,
Section 210.10(a)(l) of the final rulecontinues to require that schools naakepotable water available and accessiblewithout restriction to children at nocharge in the place where lunches areserved during the meal service. Inaddition, §220.8(a)(l) requires thatwhen breakfast is served in the cafeteria,schools must make potable wateravailable and accessible withoutrestriction to children at no charge. TheDepartment continues to encourageschools to make potable water availablewithout restriction at all meal and snackservices when possible.
RecordkeepingThe IFR at § 210. 11(b)(2), outlined the
recordkeeping requirements associatedwith competitive foods. Localeducational agencies and school foodauthorities would be required tomaintain records documentingcompliance with the requirements.Local educational agencies would beresponsible for maintaining recordsdocumenting compliance with thecompetitive food nuta-ition standards forfood sold in areas that are outside of thecontrol of the school food serviceoperation. Local educational agenciesalso would be responsible for ensuringany organization designated asresponsible for food service at thevarious venues in the school (other thanthe school food service) maintainsrecords documenting compliance withthe competitive food nutritionstandards. The school food authoritywould be responsible for maintainingrecords documenting compliance withthe competitive foodnuta-ition standardsfor foods sold in meal service areasduring meal service periods. Requiredrecords would include, at a minimum,receipts, nuta-ition labels and/or productspecifications for the items available forsale.
About 120 commenters expressedconcerns about recordkeeping,monitoring and compliance. Twentycommenters specifically addressedrecordkeeping. Some of thosecommenters suggested thatrecordkeeping is costly, unrealistic and/or not necessary. Yet othersrecommended minimizing therecordkeeping on non-school groups. Anumber of commenters representingschool food service were concerned thatthe local educational agency wouldrequire school food service to beresponsible for recordkeeping on behalfof school food service as well as otherentities/organizations within the localeducational agency. Additionally, theywere concerned that school food servicecould not affect the requirementsthroughout the local educational agency
616

Federal Register / Vol. 81, No. 146/Friday, July 29, 2016/Rules and Regulations 50147
since they have no authority over otherschool organizations.
The Department appreciates that thisregulation may have created some newchallenges initially, as schoolsimplemented the IFR and took steps taimprove the school nutritionenvironment, Such challenges may beongoing for some schools. However,maintaining a record that substantiatesthat the food items available for sale inthe schools meet the standards isessential to the integrity of thecompetitive food standards. Todetermine whether a food item is anallowable competitive food, the localeducational agency designee(s) niustassess the nutritional profile of the fooditem. This may be accomplished byevaluating the product Nutrition FactsLabel and/or using the Alliance for aHealthier Generation Calculator to do soand retaining a copy of that evaluationin the files, retaining receipts for thefood items ordered or purchased forsecondary sale at the various venues atthe schools, etc. Absent an evaluation ofthe nuta-itional profile of the competitivefoods available for sale at the schools,the local educational agency has no wayof knowing whether a food item meetsthe nutrition standards set forth in thisrule. The recordkeeping requirementsimply requires the local educationalagency to retain the revieweddocumentation (e.g., the nutritionlabels, receipts, and/or productspecifications) in their files.
Commenters also expressed concernabout the designation of responsibilityfor this activity. As stated in the IFR, theDepartment does not expect theresponsibility to rest solely with thenonprofit school food service. Schoolfood service personnel are expected tohave a clear understanding of thenutrition piofile of foods purchasedusing nonprofit school food servicefunds for reimbursable meals, a la carteofferings, etc. Their authority andresponsibilities are typically limited tothe nonprofit school food service. Localeducational agencies are responsible forensuring that all entities involved infood sales within a school understandthat the local educational agency as awhole must comply with theserequirements.
As stated in the IFR, the Departmentcontinues to recommend thatcooperative duties associated with thesale of competitive foods be coordinatedand facilitated by the local school .wellness policy designee(s). Section 204of the FIHFKA amended the NSLA byadding section 9A (42 U. S. C. 1758b)which requires each local educationalagency to: (a) Establish a local schoolwellness policy which includes
nutrition standards for all foodsavailable on each school campus, and(b) designate one or more localeducational agency officials or schoolofficials, to ensure that each schoolcomplies with the local school wellnesspolicy. State agencies were advised ofthe section 204 requirements in FNSMemorandiun, Child NutritionReauthorization 2010: Local SchoolWellness Policies, issued July 8, 2011(SP 42-2011). In addition, theDepartment published a proposed mletitled Local School Wellness PolicyImplementation Under the Healthy,Hunger Free Kids Act of 2010 onFebruary 26, 2014 at 79 FR 10693.Comments were submitted by the publicand those comments are being analyzedfor the development of an upcomingfinal rule.
The Department believes, and theexperience of many operators confirms,that if the LEA local school wellnessdesigneeCs), school food service, andother entities and groups involved withthe sale of food on the school campusduring the school day work together toshare information on allowable foodsand coordinate recordkeepingresponsibilities, the result is thesuccessful implementation andmaintenance of a healthy schoolenvironment. As always, State agenciesand the Department will providetechnical assistance to facilitate ongoingimplementation of the competitive foodnutrition standards.
Therefore, there are no changes to therecordkeeping requirements and§ 210. 11(b)(2) of the IFR is affimied.
Compliance and MonitoringSection 210. 18(h)(6) requires State
agencies to ensure that local educationalagencies comply with the nutritionstandards for competitive food andretain documentation demonstratingcompliance with the competitive foodservice and standards.
As indicated above, about 120commenters submitted commentsrelated to recordkeeping, monitoringand compliance. A number ofcommenters, largely school food servicepersonnel, expressed concerns abouthow monitoring would occur for foodssold by groups outside of the schoolfood service. Some commentersbelieved technical assistance would beinsufficient and raised questions aboutmeans to effect compliance. Othercommenters expressed concerns aboutthe need to brain and educate non-school food service personnel as to howto comply with the regulations. SeveralState agencies, school districts andindividuals requested that the SFA not
be held accountable for complianceissues outside of the conta-ol'of the SFA.
The Department agrees that trainingwill be needed to ensure compliancewith the nutrition standards. Asmentioned under the discussion ofRecordkeeping above, the Departmentenvisions local educational agencydesignees, potentially the local schoolwellness coordinator(s), taking the leadin developing performance orcompliance standards and training forall local educational personnel taskedwith selling compeUtive food on theschool campus during the school day.The Department and State agencies willalso offer training to ensure localeducational agencies are able to complyin^the most efficient manner possible.
The Department published a proposedrule titled Administrative Reviews in theSchool Nutrition Programs on May 11,2015 (80 FR 26846) addressing an'updated administrative review processthat includes these new monitoringresponsibilities. This rule, together withadministrative review guidance,provides information regarding theproposed conduct and scope of reviews,and the monitoring and records reviewthat will be conducted with regard tocompetitive foods. Currently, USDA isreviewing the comments received fromthe public on the proposed rule inpreparation for the development of animplementing rule.
ie Department would like to assurecommenters that we see technicalassistance and ta-aining as the firstapproach to non-compliance; however,we recognize that egregious, repeatedcases of non-compliance may require amore aggressive approach. In thisregard, section 303 of the HHFKAamended section 22 of the NSLA (42U.S.C. 1769c) to provide the Deparbnentwith the authority to impose finesagainst any school or school foodauthority repeatedly failing to complywith program regulations, thisauthority will be addressed in aproposed mle dealing with a number ofintegrity issues related to localeducational agencies administering theChild Nub-ition Programs which iscurrently under development. Interestedparties will have an opportunity tocomment on the proposed integrity rule.Special Situations/Applicability
This mle continues to require that alllocal educational agencies and schoolsparticipating in the NSLP and SBP meetthe nutrition standards for competitivefoods sold to students on the schoolcampus during the school day. Severalquestions have been received regardingthe applicability of these standards toafter school programs operated in
617

50148 Federal Register / Vol. 81, No. 146/Friday, July 29, 2016/Rules and Regulations
schools that participate in NSLP/Childand Adult Care Food Program (CACFP).The Department wishes to clarify thatsuch programs are required to complywith their specified meal patterns. Onlyif food is sold to their programparticipants outside of their mealpattern would the competitive foodsstandards be applicable for 30 minutesafter the end of the official school day,consistent with the definition of Schoolday specified in §210.11(a)(5).
Forty comments addressed impacts ofthe IFR on culinary teaming programs.These commenters urged for completeexemption from the competitive foodstandards for foods prepared and sold aspart of culinary education programs. Inconta-ast, a school district, school foodservice staff, and other individual
commenters urged USDA to apply thecompetitive food standards to foods soldto students during the school day byculinary arts programs.
The Department addressed theapplicability of the competitive foodsregulation on culinary arts programs inPolicy Memo SP 40-2014, published onApril 22, 2014. That memo recognizedthat culinary education programsproviding students with technical careertoaining operate in some schoolsnationwide. Some of those culinaryeducation programs operate food serviceoutlets that sell foods to students,faculty, or others in the community,with a minority of programs doing soduring the school day. The memo alsoclarified that the competitive foodsnutrition standards have no impact onthe culinary education programs'curriculum in schools, nor do they haveany impact on foods sold to adults atany time or to students outside of theschool day. However, to the extent thatsuch programs are selling food tostudents on campus during the schoolday, the statutory applicability of theSmart Snacks nutrition standards to allfoods sold outside of the School mealsprograms is clear. Section 12(1)(4)(J] ofthe NSLA (42 U.S.C. 1760(1)(4)(J),prohibits the Secretary from granting awaiver that relates to the requirementsof the NSLA, the CNA, or any regulationissued under either statute with regardto the sale of foods sold outside of theschool meal programs. The nutritionstandards included in the final rulecontinue to apply to all foods sold tostudents on the school campus duringthe school day, including food preparedand/or sold by culinary educationprograms.
Related Information
Implementation
The competitive food provisionscontained in the IFR were implementedby State agencies and local educationalagencies on July 1, 2014. Changes madein this final rule may be implementedas specified in the DATES section of thispreamble. While the total fat standardremains in place, additional commentson the interim final total fat standard arebeing accepted and must be received asspecified in the DATES section of thispreamble. The saturated fat and ta-ans fatstandards are finalized in this rule. Thisfinal rule removes § 210-lla and itscorresponding Appendix B, whichreferences the sale of foods of minimalnutritional value, since those standardswere eliminated as of July 1, 2014, thedate that competitive food standardswere implemented in their place.Similar changes are made to thebreakfast program regulations at 7 CFRpart 220.
Procedural Matters
Executive Order 12866 and ExecutiveOrder 13563
Executive Orders 12866 and 13563direct agencies to assess all costs andbenefits of available regulatoryalternatives and, if regulation isnecessary, to select regulatoryapproaches that maximize net benefits(including potential economic,environmental, public health and safetyeffects, distributive impacts, andequity]. Executive Order 13563emphasizes the importance ofquantifying both costs and benefits, ofreducing costs, of harmonizing rules,and of promoting flexibility.
This Final rule has been designatedan "economically significant regulatoryaction" under section 3(f] of ExecutiveOrder 12866. Accordingly, the mle hasbeen reviewed by the Office ofManagement and Budget.
Regulatory Flexibility AnalysisThis rule has been reviewed with
regard to the requirements of theRegulatory Flexibility Act of 1980 (5U.S.C.601-612). The rule directlyregulates the 54 State educationagencies and 3 State Departments ofAgriculture that operate the NSLPpursuant to agreements with USDA'sFood and Nuta-ition Service. While Stateagencies are not considered smallentities as State populations exceed the50,000 threshold for a small governmentjurisdiction, many of the service-providing institutions that work withthem to implement the program do meetdefinitions of small entities.
The requirements established by thisfinal rule will apply to school districts,which meet the'definitions of "smallgovernmental jurisdiction" and otherestablishments that meet the definitionof "small entity" in the RegulatoryFlexibility Act". The RegulatoryFlexibility Act analysis is published aspart of the docket (FNS-2011-0019) onwww.regu7afiozis.gov.
Regulatory Impact Analysis SummaryAs required for all rules that have
been designated as significant by the NOffice of Management and Budget, aRegulatory Impact Analysis (RIA) wasdeveloped for this final rule A summaryis presented below. The fall MA ispublished as part of the docket (FNS-2011-0019) on wwtv. regulations. gov.Need for Action
The final rule responds to twoprovisions of the Healthy, Hunger-FreeKids Act of 2010. Section 208 ofHHFKA amended Section 10 of theChild Nutrition Act of 1966 to requirethe Secretary to establish science-basednutrition standards for all foods sold inschools during the school day. Inaddition, the amendments made bysection 203 of the HHFKA amendedsection 9(a] of the NSLA (42 U. S.C.1758(a)) to require that schoolsparticipating in the NSLP make potablewater available to children at no" chargein the place where meals are servedduring the meal service. This is anondiscretionary requirement of theHHFKA that became effective October 1,2010, and was required to beimplemented by August 27, 2013.Response to Comments
The full Regulatory Impact Analysisincludes a brief discussion of commentssubmitted by school officials, publichealth organizations, indusb'yrepresentatives, parents, students, andother interested parties on the costs andbenefits of the final mle submitted. Theanalysis also contains a discussion ofhow USDA modified the final rule inresponse, and the effect of thosemodifications on the costs and benefitsof the rule.
Benefits
The primary purpose of the rule is toensure that nutrition standards forcompetitive foods are consistent withthose used for the NSLP and SEP,holding competitive foods to standardssimilar to the rest of foods available tostudents during the school day. Thesestandards, combined with recentimprovements in school meals, willhelp promote diets that contribute tostudents' long-term health and well-
618

Federal Register/Vol. 81, No. 146/Friday, July 29, 2016/Rules and Regulations 50149
being. In addition, these standardscontinue to support a healthy schoolenvironment and the efforts of parentsto promote healthy choices for childrenat home and at school.
Obesity has become a major publichealth concern in the U. S., with one-third of U. S. children and adolescents
now considered overweight or obese(Beydoun and Wang 20112), withcurrent childhood obesity rates fourtimes higher in children ages six to 11than they were in the early 1960s (19 vs.4 percent), and three times higher (17vs. 5 percent) for adolescents ages 12 to19. 3 Research focused specifically onthe effects of obesity in childrenindicates that obese children feel theyare less capable, both socially andathletically, less attractive, and lessworthwhile than their non-obesecounterparts, 4 Further, there are directeconomic costs due to childhoodobesity: $237. 6 million (in 2005 dollars)in inpatient costs5 and annual
prescription dmg, emergency room, andoutpatient costs of $14. 1 billion.6
Because the factors that contributeboth to overall food consumption and toobesity are so complex, it is not possibleto define a level of disease or cost
reduction expected to result fromimplementation of the rule. There issome evidence, however, thatcompetitive food standards can improvechildren's dietary quality.
2Beydoun, M.A. and Y. Wang. 2011. Socio-demographic disparities in distribution shifts overtime in various adiposity measures amongAmerican children and adolescents: What changesin prevalence rates could not reveal. InternationalJournal ofPediatric Obesity, 6:21-35. As cited mFood Labeling: Calorie Labeling of Articles of Foodin Vending Machines NPRM. 2011. PreliminaryRegulatory Impact Analysis, Docket No. FDA-2011-F-0171.
3 Ogden et al. Prevalence of Obesity AmongChildren and Adolescents: United States, Trends1963-1985 Through 2007-2008. CDC-NHCS, NCHSHealth E-Stat, June 2010. On the web at http://www.cdc.gov/nchs/data/hestat/obesity_child_07_08/obesity_child_07_0e. htm.
4Riazi, A., S. Shakoor, I. Dundas, C. Eisar, andS.A. McKenzie. 2010. Health-related quality of lifein a clmical sample of obese children andadolescents. Health and Quality of Life Outcames,8:134-139. Samuels & Associates. 2006. CompetitiveFoods. Policy Brief prepared by Samuels &Associates for The California Endowment andRobert Wood Johnson Foundation. Available at:http://www. healthyeatingactivecommunities. org/downloads/
5 Trasande, L., Y. Liu, G. Fryer, md M. Weitzman.2009. Trends: Effects of Childhood Obesity onHospital Care and Costs, 1999-2005. Health Affairs,2B:w751-w760.
6Cawley, J. 2010. The Economics of ChildhoodObesity. Health Affairs, 29:364-371. As cited inFood Labeling: Calorie Labelmg of Articles of Foodm Vending Machines NPRM. 2011. PreliminaryRegulatory Impact Analysis, Docket No. FDA-2011-F-0171.
. Taber, Chriqui, and Chaloupka(2012 7) concluded that California highschool students consumed fewercalories, less fat, and less sugar at schoolthan students in other States. Theiranalysis "suggested that Californiastudents did not compensate forconsuming less within school byconsuming more elsewhere" (p. 455).
. In an assessment of the reach andeffectiveness of childhood obesitysta'ategies, Gortmaker et al, 8 project thatimplementing nuta-ition standards for allfoods and beverages sold in schoolsoutside of reimbursable school meals
will prevent an estimated 345,000 casesof childhood obesity in 2025 (p. 1937).
. Schwartz, Novak, and Fioi-e,(2009 9) determined that healthiercompetitive food standards decreasedstudent consumption of low nutritionitems with no compensating increase athome.
. Researchers at Healthy EatingResearch and Bridging the Gap foundthat "[t]he best evidence availableindicates that policies on snack foodsand beverages sold in school impactchildren's diets and their risk forobesity. Strong policies that prohibit orrestrict the sale of unhealthycompetitive foods and drinks in schoolsare associated with lower proportions ofoverweight or obese students, or lowerrates of increase in student BMI"
(Healthy Eating Research and Bridgingthe Gap, 2012, p. 310).
A comprehensive assessment of theevidence on the importance ofcompetitive food standards conductedby the Pew Health Group concludedthat a national competitive foods policywould increase student exposure tohealthier foods, decrease exposiire toless healthy foods, and would alsolikely improve the mix of foods thatstudents purchase and consume atschool. Researchers concluded thatthese kinds of changes in food exposureand consumption at school areimportant influences on the overallquality of children's diets.
7 Taber, D.R., J.F. Chriqui, and F. ]. Chaloupka.2012. Differences in Nutrient Intake AssociatedWith State Laws Regarding Fat, Sugar, and CaloricContent of Competitive Foods. Archives ofPediatricS'Adolescent Medicine, 166:452-458.
» Gortmakei SL, Claire Wang Y, Long MW, GilesCM, Ward ZJ, Bairett JL, Kenney EL, Sonneville KR,Afzal AS, Resch SC, Cradock AL., Health Affairs,34, no. 11 (2015).
9 Schwartz, M. B., S.A. Navak, and S. S. Fiore.2009. The Impact of Removing Snacks of LowNutritional Value from Middle Schools. HealthEducation S'Behavior, 36:999-1011.
10 Healthy Eating Research and Bridging the Gap.2012. Influence of Competitive Food and BeveragePolicies on Children's Diets and Childhood Obesity.AvaUable at http://www. healthyeatingresearch. org/images/stones/her_research briefs/CompetitiveFoods_Issue_Brief_HER_BTC_7-2012. pdf
Although nuti-ition standards forfoods sold at school alone may not bea determining factor in children'soverall diets, they are critical toproviding children with healthy foodoptions throughout the entire schoolday. Thus, these standards will help toensure that the school nutritionenvironment does all that it can topromote healthy choices, and help toprevent diet-related health problems.Ancillary benefits could derive from thefact that improving the nutritional valueof competitive foods may reinforceschool-based nutrition education andpromotion efforts and contributesignificantly to the overall effectivenessof the school nutrition environment inpiomoting healthful food and physicalactivity choices. 11
Coste
While there have been numeroussuccess stories, best practices, andinnovative practices, it is too early todefinitively ascertain the overall impactto school revenue. The changes andtechnical clarifications in the final ruledo not change the methodology of thecost benefit analysis from themethodology used in the interim finalregulatory impact analysis, however theestimates are updated using the mostrecent data available to assess theimpacts to revenue and to account forthe potential variation inimplementation and sustainabilityexperiences across SFAs and schools.
ie limited information availableindicates that many schools havesuccessfully inta-oduced competitivefood reforms with little or no loss ofrevenue and in a few cases, revenuesfrom competitive foods increased afterintroducing healthier foods. Is. some ofthe schools that showed declines incompetitive food revenues, losses fromreduced sales were fully offset byincreases in reimbursable meal revenue.In other schools, students respondedfavorably to the healthier options andcompetitive food revenue declined littleor not at all.
But not all schools that adopted orpiloted competitive food standards faredas well. Some of the same studies andreports that highlight school successstories note that other schools sustainedsome loss after implementing similarstandards. While in some cases thesewere short-term losses, even in the long-
11 PBW Health Group and Robert Wood JohnsonFoundation. 2012. Heath Impact Assessment:NaUonal Nutrition Standards for Snack and a laCarte Foods and Beverages Sold in Schools.Available online: http://www. pewhealth. org/uploadedFiles/PHG/Content_Level_Pages/Reports/KS%20HIA_FULL%20Report%Z0062212WEB%20FINAL-v2. pdf. ~
619

50150 Federal Register / Vol. 81, No. 146/Friday, July 29, 2016/Rules and Regulations
term the competitive food revenue lostby those schools was not offset (at leastnot fully) by revenue gains from thereimbursable meal programs.
Our analysis examines the possibleeffects of the rule on school revenuesfrom competitive foods and theadministrative costs of complying withthe rule's competitive foods provisions.The analysis uses available data toconstruct model-based scenarios thatdifferent schools may experience inimplementing the rule. While these varyin their impact on overall school foodrevenue, each scenario's estimatedimpact is relatively small (+0. 5 percentto -1. 3 percent). That said, the databehind the scenarios are insufficient to
assess the frequency or probability ofschools experiencing the impacts shownin each.
Unfunded Mandates Reform ActTitle II of the Unfunded Mandates
Reform Act of 1995 (UMRA), PublicLaw 104-4, establishes requirements forFederal agencies to assess the effects oftheir regulatory actions on State, local,and Tribal governments and the privatesector. Under section 202 of the UMRA,the Department generally must preparea written statement, including a cost/benefit analysis, for proposed and finalrules with Federal mandates that mayresult in expenditures by State, local, orTribal governments, in the aggregate, orby the private sector, of $100 million ormore in any one year. When such astatement is needed for a rule, section205 of the UMRA generally requires theDepartment to identify and consider areasonable number of regulatoryalternatives and adopt the least costly,more cost-effective or least burdensomealternative that achieves the objectivesof the mle. Because data is not availableto meaningfully estimate thequantitative impacts of this rule onschool food authority revenues, we arenot certain that this rule is subject to therequirements of sections 202 and 205 ofthe UMRA. That said, it is possible thatthe rule's requirements could imposecosts on State, local, or Tribalgovernments or to the private sector of$100 million or more in any one year.FNS therefore conducted a regulatoryimpact analysis that includes a cost/benefit analysis substantially meetingthe requirements of sections 202 and205oftheUMRA.
Executive Order 12372
The NSLP is listed in the Catalog ofFederal Domestic Assistance under No.
10. 555. The SBP is listed in the Catalogof Federal Domestic Assistance underNo. 10.553. For the reasons set forth inthe final rule in 7 CFR part 3015,
subpart V and related notice (48 FR29115, Jime 24, 1983), these programsare included in the scope of ExecutiveOrder 12372, which requiresintergovernmental consultation withState and local officials.
Executive Order 13132
Executive Order 13132 requiresFederal agencies to consider the impactof their regulatory actions on State andlocal governments. Where such actionshave federalism implications, agenciesare directed to provide a statement forinclusion in the preamble to theregulations describing the agency'sconsiderations in terms of the three
categories called for under section(6)(b](2)(B) of Executive Order 13132.USDA has considered the impact of thisrule on State and local governments andhas determined that this rule does nothave federalism implications. This ruledoes not impose substantial or directcompliance costs on State and localgovernments. Therefore, under Section6(b) of the Executive Order, a federalismsummary impact statement is notrequired.
Executive Order 12988
This rule has been reviewed underExecutive Order 12988, Civil JusticeReform. This rule is intended to have
preemptive effect with respect to anyState or local laws, regulations orpolicies which conflict with itsprovisions or which would othenviseimpede its full implementation. Thisrule is not intended to have retroactiveeffect unless specified in the DATESsection of the final rule. Prior to anyjudicial challenge to the provisions ofthis rule or the application of itsprovisions, all applicable administrativeprocedures must be exhausted.
Civil Rights Impact Analysis
FNS has reviewed this rule inaccordance with DepartmentalRegulations 4300-4, "Civil RightsImpact Analysis, " and 1512-1,"Regulatory Decision MakingRequirements. " After a careful review ofthe rule's intent and provisions, FNShas determined that this rule is notintended to limit or reduce in any waythe ability of protected classes ofindividuals to receive benefits on thebasis of their race, color, national origin,sex, age or disability nor is it intendedto have a differential impact on minorityowned or operated businessestablishments and woman-owned oroperated business establishments thatparticipate in the Child NutritionPrograms.
Paperwork Reduction Act
In accordance with the PaperworkReduction Act of 1995 (44 U. S. C. 3501et seq.), this final rule does not containsubstantive changes to informationcollection requirements that requireadditional approval by 0MB. Thepaperwork requirements for this finalrule were previously approved by theOffice of Management and Budget(0MB) for the interim final rule under0MB control #0584-0576 and mergedinto #0584-0006.
E-Government Act ComplianceThe Food and Nub-ition Service is
committed to complying with the E-Government Act of 2002, to promote theuse of the Internet and other"information technologies to provideincreased opportunities for citizenaccess to Government information andservices and for other purposes.Executive Order 13175-Consultationand Coordination With Indian TribalGovernments
Executive Order 13175 requiresFederal agencies to consult andcoordinate with Tribes on agovernment-to-government basis onpolicies that have Tribal implications,including regulations, legislativecomments or proposed legislation, andother policy statements or actions thathave substantial direct effects on one ormore Indian Tribes, on the relationshipbetween the Federal Government andIndian Tribes, or on the distribution ofpower and responsibilities between thefederal government and Indian Tribes.In the spring of 2011, FNS offeredopportunities for consultation withTribal officials or their designees todiscuss the impact of the Healthy,Hunger-Free Kids Act of 2010 on tribesor Indian Tribal governments. Theconsultation sessions were coordinatedby FNS and held on the following datesand locations:1. HHFKA Webinar & Conference Call-
April 12, 20112. Mountain Plains-HHFKA
Consultation, Rapid City, SD-March 23, 2011
3. HHFKA Webinar & Conference Call-June, 22, 2011
4. Tribal Self-Governance AnnualConference in Palm Springs, CA-May 2, 2011
5. National Congress of AmericanIndians Mid-Year Conference,Milwaukee, WI-June 14, 2011
The five consultation sessions in totalprovided the opportunity to addressTribal concerns related to school meals.There were no comments about thisregulation during any of the
620

Federal Register / Vol. 81, No. 146/Friday, July 29, 2016/Rules and Regulations 50151
aforementioned Tribal consultationsessions.
Ciirrently, FNS provides regularlyscheduled quarterly consultationsessions as a venue for collaborativeconversations with Tribal officials ortheir designees. The most recent specificdiscussion of the Nutrition Standardsfor All Foods Sold in Schools mle wasincluded in the consultation conductedon August 19, 2015. No questions orcomments were raised specific to thisrulemaking at that time.
Reports from these consultations arepart of the USDA annual reporting onTribal consultation and collaboration.FNS will respond in a timely andmeaningful manner to Tribalgovernment requests for consultationconcerning this rule.
List of Subjects
7 CFH Part 210
Grant programs-education; Grantprograms-health; Infants and children;Nutrition; Reporting and recordkeepingrequirements; School breakfast andlunch programs; Surplus agriculturalcommodities.
7 CFR Part 220
Grant programs-education; Grantprograms-health; Infants and children;Nuta-ition; Reporting and recordkeepingrequirements; School breakfast andlunch programs.
Accordingly, for the reasons set forthin the preamble, 7 CFR parts 210 and220 are amended as follows:
PART 210-NATIONAL SCHOOLLUNCH PROGRAM
1. The authority citation for 7 CFRpart 210 continues to read as follows:
Authority: 42 U.S.C. 1751-1760, 1779.
2. In §210. 11:a. Revise paragraph (a)(3);b. Add paragraph (a) (6);c. Remove paragraph (c)(2)(v);d. Paragraph (c)(2)(vi) is redesignated
as (c)(2](v);e. Revise paragraph (d);f. Add paragraph (f)(3)[iv);g. Revise the heading and the firstntence of paragraph (i); andh. Revise paragraph (j);The revisions and additions read as
follows:
§210.11 Competitive food service andstandards.
(a) * * *(3) Entree item means an item that is
intended as the main dish and is either:(i) A combination food of meat or
meat alternate and whole grain richfood;or
(ii) A combination food of vegetableor fruit and meat or meat alternate; or
(iii) A meat or meat alternate alonewith the exception of yogurt, low-fat orreduced fat cheese, nuts, seeds and nutor seed butters, and meat snacks (suchas dried beef jerky); or
(iv) A grain only, whole-grain richenta-ee that is served as the main dish ofthe School Breakfast Programreimbursable meal.** * * *
(6) Paired exempt foods mean fooditems that have been designated asexempt from one or more of the nuta-ientrequirements individually which arepackaged together without anyadditional ingredients. Such "pairedexempt foods" retain their individuallydesignated exemption for total fat,saturated fat, and/or sugar whenpackaged together and sold but arerequired to meet the designated calorieand sodium standards specified in§§ 210.11 (i) and (j) at all times.* * ** *
(d) Fruits and vegetables. W Fresh,frozen and canned fruits with no addedingredients except water or packed in100 percent fruit juice or light syrup orextra light syrup are exempt from thenutrient standards included in this
section.(2) Fresh and fi-ozen vegetables with
no added ingredients except water andcanned vegetables that are low sodiumor no salt added that contain no addedfat are exempt from the nuta-ientstandards included in this section.** * * *
(f)* * *(3) * * *[iv] Whole eggs with no added fat are
exempt from the total fat and saturatedfat standards but are subject to the transfat, calorie and sodium standards.** * * *
(i) Calorie and sodium content forsnack items and side dishes sold as
competitive foods. Snack items and sidedishes sold as competitive foods musthave not more than 200 calories and 200mg of sodium per item as packaged orserved, including the calories andsodium contained in any addedaccompaniments such as butter, creamcheese, salad dressing, etc., and mustmeet all of the other nutrient standardsin this section. * * *
(j) Calorie and sodium content forentree items sold as competitive foods.Enta'ee items sold as competitive foods,other than those exempt from thecompetitive food nutrition standards inparagraph (c)(3)(i) of this section, musthave not more than 350 calories and 480mg of sodium per item as packaged orserved, including the calories and
sodium contained in any addedaccompaniments such as butter, creamcheese, salad dressing, etc., and mustmeet all of the other nuta-ient standardsin this section.
§210.11 a [Removed]3. Section 210. 1 la is removed.
Appendix B to Part 210 [Removed]
4. Appendbc B to part 210 is removed.
PART 220-SCHOOL BREAKFASTPROGRAM
5. The authority citation for 7 CFRpart 220 continues to read as follows:
Authority: 42 U. S.C. 1773, 1779, unlessotherwise noted.
§ 220.12a [Removed]. 6. Removes 220. 12a.
Appenduc B to Fart 220 [Removed andReserved]
7. Remove and reserve Appendix B topart 220.
Dated: June 21, 2016.Kevin W. Concannon,
Under Secretary, Food, Nutrition, andConsumer Services.
[FR Doc. 2016-17227 FUed 7-28-16; 8:45 am]BILLING CODE 3410-30-P
DEPARTMENT OF AGRICULTURE
Food and Nutrition Service
7 CFR Parts 210 and 220
[FNS-2014-0010]
RIN 0584-AE25
Local School Wellness PolicyImplementation Under the Healthy,Hunger-Free Kids Act of 2010
AGENCY: Food and Nuta-ition Service,USDA.
ACTION: Final rule.
SUMMARY: This final mle requires alllocal educational agencies thatparticipate in the National SchoolLunch and School Breakfast Programs tomeet expanded local school wellnesspolicy requirements consistent with therequirements set forth in section 204 ofthe Healthy, Hunger-Free Kids Act of2010. The final rule requires each localeducational agency to establishminimum content requirements for thelocal school wellness policies, ensurestakeholder participation in thedevelopment and updates of suchpolicies, and periodically assess anddisclose to the public schools'
621

1
Sherri Marineau
From: Derrick TokosSent: Monday, July 26, 2021 3:29 PMTo: Jim Patrick; jim & Joann Hanselman; Lee Hardy; Bill Branigan; 'Braulio Escobar'Cc: Sherri MarineauSubject: FW: Food carts/trucksAttachments: Good trucks; Food trucks
Additional food cart/truck testimony (below and attached). Derrick
From: Lacee Horton <[email protected]> Sent: Monday, July 26, 2021 3:14 PM To: Derrick Tokos <[email protected]> Subject: FW: Food carts/trucks
[WARNING] This message comes from an external organization. Be careful of embedded links.
Lacee Horton RN Case Manager, MAT Confederated Tribes of Siletz Indians Clininc: 541-444-1030 ext. 1617 Dircect: 541-444-9617 Cell 541-272-1176 [email protected]
From: Lacee Horton Sent: Monday, July 26, 2021 3:10 PM To: [email protected] Subject: Food carts/trucks Good afternoon, As a citizen of Newport for 30 years I have seen a lot of things come and go. One thing is restaurants. With the economy largely based on tourism and the influx of people it can be very hard for one to remain open and lucrative. One way to help and support small businesses is to allow variety. One major variety of restaurants is food trucks. They can come and go as needed based on seasons, tourism and need. If you look at larger models, like Albany and Eugene these cities welcome them. The smaller cities have opened their doors to allow these small businesses to join in the local economy too; like Waldport. Another great example is the city of Tillamook. They have a couple city blocks dedicated to food carts/trucks. They’re alive and well and not harming other businesses. There are plenty of consumers to go around and we all want somethingdifferent.
622

2
Let our community grow in diversity and culture. By allowing these carts you will do just that. Don’t let the decision be made by a few larger restaurants by way of greed and fear they won’t have enough. This is an entrepreneurship country; support it. Sincerely Foodie and local…
Lacee Horton RN Case Manager, MAT Confederated Tribes of Siletz Indians Clininc: 541-444-1030 ext. 1617 Dircect: 541-444-9617 Cell 541-272-1176 [email protected]
623

1
Sherri Marineau
From: Marc Horton Sent: Monday, July 26, 2021 3:22 PMTo: Derrick TokosSubject: Good trucks
[WARNING] This message comes from an external organization. Be careful of embedded links. ________________________________ My family and I are in support of food trucks here in Newport. Thanks Sent from my iPhone
624

1
Sherri Marineau
From: debbie gehlken Sent: Monday, July 26, 2021 3:22 PMTo: Derrick TokosSubject: Food trucks
[WARNING] This message comes from an external organization. Be careful of embedded links. ________________________________ Food trucks would be a great enterprise for Newport. Workers from various businesses would be able to get a fast lunch and return to work. Tourists would enjoy the different types of food. It wouldn’t stop them from going to sit down restaurants for a dining experience. The trucks would further the GOOD fast food experience. Works well in Waldport! Would work well in Newport. On the Bayfront, Nye beach turn around and refresh the awful Deco district with nothing but closed or rarely opened store fronts. Debbie Gehlken Sent from my iPhone
625