Jensen jaarverslag 2019_ENG_v9.indd
134
JENSEN-GROUP ANNUAL REPORT 2019
-
Upload
khangminh22 -
Category
Documents
-
view
0 -
download
0
Transcript of Jensen jaarverslag 2019_ENG_v9.indd

JENSEN-GROUPA N N U A L R E P O R T 2 0 1 9

2 A N N U A L R E P O R T 2 0 1 9
The Dutch language text of the Annual Report is the official version. The English language version is provided
as a courtesy to our shareholders. JENSEN-GROUP has verified the two language versions and assumes full
responsibility for matching both language versions.
In this report, the terms “JENSEN-GROUP” or “Group” refer to JENSEN-GROUP NV and its consolidated companies
in general. The terms “JENSEN-GROUP NV” and “the Company” refer to the holding company, registered in
Belgium. Business activities are conducted by operating subsidiaries throughout the world. The terms “we”,
“our”, and “us” are used to describe the Group.

3A N N U A L R E P O R T 2 0 1 9
Table of contents
Consolidated Key figures p4
Message to our shareholders p6
Profile of the JENSEN-GROUP p9
Information for shareholders and investors p14
Financial report p17
Report of the Board of Directors p18
Statement of the Responsible Persons p58
Report of the Statutory Auditor p59
Consolidated statement of financial position p64
Consolidated statement of comprehensive income p66
Consolidated statement of changes in equity p68
Consolidated cash flow statement p70
Notes to the consolidated financial statements p72
Summary statutory financial statements JENSEN-GROUP NV p125
General information p131

4 A N N U A L R E P O R T 2 0 1 9
Consolidated Key FiguresFinancial Year Ended Key Figures (in thousands of euro)
December 312019
December 312018
Revenue 332,178 343,782
Operating profit (EBIT) 23,016 26,936
Operating cash flow (EBITDA) 31,235 33,525
Net interest charges 1,242 447
Profit before taxes 20,523 25,601
Profit for the period from continuing operations 15,385 18,039
Result from assets held for sale -118 -128
Share in result of associates and companies consolidated under equity method -229 866
Result attributable to Non Controlling Interest -675 -331
Consolidated result attributable to equity holders 15,712 19,108
Added value 135,886 139,984
Net cash flow 23,932 25,697
Equity 132,374 125,969
Net financial debt (+)/Net cash (-) 4,362 -5,354
Working capital 126,723 132,743
Non-Current Assets (NCA) 46,182 28,462
Capital Employed (CE) 172,905 161,206
Market capitalization (high) 282,266 353,419
Market capitalization (low) 240,043 238,479
Market capitalization (average) 265,064 293,994
Market capitalization (December 31) 271,319 265,846
Entreprise value (December 31) (EV) 275,682 260,492
RATIOS
EBIT/Revenue 6.93% 7.84%
EBITDA/Revenue 9.40% 9.75%
ROCE (EBIT/CE) 13.78% 18.08%
ROE (Net profit/Equity) 12.16% 15.96%
Gearing (Net debt(+) net cash (-)/Equity) 3.30% -
EBITDA Interest coverage 25.15 75.01
Net financial debt (+) or net cash (-)/EBITDA -0.02 -0.42
Working capital/Revenue 39.06% 34.65%
EV/EBITDA (December 31) 8.83 7.77

5A N N U A L R E P O R T 2 0 1 9
DEFINITIONS - EBITDA (Earnings before Interest, Taxes, Depreciation and Amortization) = Operating profit (EBIT) + Depreciation, amortization, write-downs on trade receivables, write-downs on inventory, changes in provisions (refer to Note 13)
- The JENSEN-GROUP has adjusted the definition of EBITDA in order to further improve transparency: in recent years, the movement in the related bal-ance sheet accounts was used for the changes in provisions. As from 2019 onwards the JENSEN-GROUP uses the P&L amount, as disclosed in note 13. The 2018 ratio is restated accordingly. In 2018, EBITDA was reported 33,525 thousand euro, the restated EBITDA for the same period amounts to 31,823 thousand euro.
- Net interest charges = interest charges – interest income - Added value = EBIT + remuneration, social security costs and pensions + depreciation, amortization, write-downs on trade receivables, write-downs on inventory, changes in provisions (refer to Note 13)
- Net cash flow = Consolidated result attributable to the equity holders + depreciation, amortization, write-downs on trade receivables, write-downs on inventory, changes in provisions (refer to Note 13)
- Net financial debt (+)/Net cash (-)= Borrowings (non-current and current) – cash and cash equivalents - Working capital = Inventory + advance payments + current trade receivables + contract assets – trade payables – contract liabilities - Non-current assets = Goodwill + other intangible assets + property plant and equipment. - Capital employed = Working capital + non-current assets (see definitions above) - Market capitalization = share price x number of shares outstanding - Enterprise value = Market capitalization (December 31) + net financial debt (+)/Net cash (-) (see definitions above) - EBITDA interest coverage = EBITDA/Net interest charges (see definitions above)
For ratio’s comparing figures from the consolidated statement of comprehensive income with figures from the consolidated statement of financial position, the average figure from the consolidated statement of financial position is used. The average is the opening balance + closing balance divided by two:
- ROCE (return on capital employed) = EBIT/ average capital employed - ROE (return on equity) = consolidated result attributable to equity holders / average equity - Average net financial debt (+) or net cash (-)/EBITDA.
Key figures per shareFinancial year ended (in euro)
December 312019
December 312018
Operating cash flow (EBITDA) 3.99 4.29
Consolidated result attributable to equity holders (= earnings per share) 2.01 2.44
Net cash flow 3.06 3.29
Equity (= book value) 16.93 16.11
Gross dividend 1.00 1.00
Number of shares outstanding (average) 7,818,999 7,818,999
Number of shares outstanding (year-end) 7,818,999 7,818,999
Share price (high) 36.10 45.20
Share price (low) 30.70 30.50
Share price (average) 33.90 37.60
Share price (December 31) 34.70 34.00
Price/earnings (high) 18.00 18.50
Price/earnings (low) 15.30 12.50
Price/earnings (average) 16.90 15.40
Price/earnings (December 31) 17.30 13.90

6 A N N U A L R E P O R T 2 0 1 9
Message to our Shareholders
Creating the future in laundry automation
After an excellent start into the year with record first quarter revenues, sales from the second quarter onwards
were lower than in the comparable period of the previous year. While we were able to secure many smaller
orders with short deliveries, these were unable to compensate the decrease in large projects. The full year
profitability is affected by lower revenues, fluctuating capacity utilization in some factories and necessary
restructuring measures.
The impact of hurricane Michael, which hit our American facility on October 10, 2018, causing extensive damage,
continued to influence operations. Thanks to the great dedication and flexibility of our American colleagues,
improvements were achieved during the year. Discussions with our insurance company continue. We confirm
that our insurance coverage is adequate.
We maintain our strategy of building a local presence in every significant market, thereby increasing our global
presence. We continue to expand our market reach by offering both individual machines and combinations of
machines on a project basis. These machines have varying degrees of automation in response to customers’
specific requirements. This will secure growth as we create a larger customer base for our equipment and
solutions. This year, the JENSEN-GROUP won some advanced high-tech projects for which we tendered in
partnership with Inwatec, Denmark. Our joint efforts extend our market offering and support our strategy to
automate laundries as much as possible using robotics and AI (Artificial Intelligence) applications. We also
increased our shareholding in Tolon, Turkey, to reach the level defined in the original contract.
Our dedicated Material Handling and Automation business unit, created in 2018, is helping us to better capture
opportunities by improving the material flow and logistics in heavy-duty laundries. Significant improvements
in the execution of large projects were also achieved. As the number of large projects decreased, the Group
decided to reorganize the Material Handling and Automation unit and to adapt capacities where needed. This
reorganization will be implemented in 2020.
After significant investments in our Chinese facility, we further deployed our extended product range strategy
with a combination of high-tech products from our Western factories and single machines exported from China
under the ‘ALPHA by JENSEN’ product line. This extended product range strategy allows us to better meet our
customers’ requirements. The positive results achieved in 2018 with our extended product range strategy were
confirmed this year too.
Gotli Labs, our cooperation with ABS, the leading laundry software provider, is developing at a slower pace
than expected. We are continually improving our laundry management software solution GLOBE to increase
our customers’ productivity and expand our offering of state-of-the art software solutions to the heavy-duty
laundry industry. 2019 was the final year of development of a new GLOBE software version. The integration of
technology and software allows customers to monitor and track production in real-time, and to use the data
to improve their performance. The new software takes our industry to a new level of data management and
prepares us for Industry 4.0 and the IoT (Internet of Things).
7A N N U A L R E P O R T 2 0 1 9
In summary, our investments in the past years are supporting our activities. With two new factories, new
distribution companies, the acquisition of a sub-supplier, a cooperation for laundry management software, an
investment in robotics and a higher participation in TOLON, a manufacturer of stand-alone equipment, we are
preparing the ground for future growth. The Board of Directors and management strongly believe in the vision
behind these investments and the growth opportunities that they will offer to the JENSEN-GROUP in the years to
come.
Our staff and employees continue to live the JENSEN spirit. They continuously seek to make a difference in
support to our customers. We are preparing our management and employees for the future. This requires an
open mind as we break down silos within the organization and develop entrepreneurial skills across all functions
to improve our agility in meeting customer requirements. The reorganization and a new structure will support
these efforts.
In our “Go East” strategy, we continue to focus on market leadership in China. In Japan we have established a
strong base to increase market share step by step by introducing new products and solutions. Our presence in
the rest of South East Asia and Australia/New Zealand is further strengthened by our continued investment in
sales and service presence.
We have enjoyed strong orders in Europe and in the United States. We continue our efforts to decrease our
dependence on Europe, with almost 42% of our turnover now outside Europe.
Despite a decrease in working capital, we closed the year with a much higher debt level than last year owing to
the impact of the newly introduced IFRS standard on leasing (13.7 milion euro). The cash flow generated by the
business allowed us to fund our investments and operations. Furthermore, we re-financed the mortgage loans
at our facility in Denmark at market conditions.
Continued investment in product development, alignment of our core processes, a new structure and increased
market presence are enabling us to better meet our customers’ needs and expectations. Many of these product
developments are targeted at reducing energy and water consumption as well as increasing the throughput
and up-time of our equipment. Our CleanTech products and approach enable customers to reduce their average
water and energy consumption. Our new product developments and our latest software developments allow
our customers to monitor in real time the critical KPIs of typical heavy-duty laundries and are enabling them to
reach even lower water and energy consumption figures and costs.
Our activity level over the past four years demonstrates our ability to adapt quickly to changes in market
conditions, thereby strengthening our brand, our products and our employees. Our performance in recent years
confirms that our investments in Asia and in geographic expansion are creating healthy and sustainable growth
opportunities.

8 A N N U A L R E P O R T 2 0 1 9
In 2019, the JENSEN-GROUP received 326.3 million euros of orders, 1.4% above 2018. The market continues to
be very active, but more volatile with fewer large projects. Our objective is to maintain our high volume level
in 2020. We rely on our highly motivated staff to continue to pursue each business opportunity in all existing
markets. Furthermore, our global presence makes the JENSEN-GROUP less vulnerable to a downturn in any given
region of the world.
We thank our customers for their continued trust and loyalty. We will continue to meet their expectations in
terms of productivity, reliability, cost effectiveness and reduced environmental impact of our products and
solutions.
We also thank our staff throughout the world for their dedication, their commitment to the JENSEN-GROUP
values, their ability to constantly adapt and their drive to improve. As we set our performance standards higher,
we expect more from our people. We will continue to invest in our employees, which will enable the Group to
continue its growth.
Last but not least, we thank our shareholders for their support of the Board of Directors and management in our
journey to be the leader in this industry.
Jesper Munch Jensen Raf Decaluwé
Chief Executive Officer Chairman of the Board of Directors

9A N N U A L R E P O R T 2 0 1 9
Profile of the JENSEN-GROUP
Mission statement
It is the aim of the JENSEN-GROUP to offer the best solutions to our customers worldwide in the heavy-duty
laundry industry. We work for and with our customers to supply sustainable single machines, systems, turnkey
solutions and laundry process automation. Laundries supplied by JENSEN aim to reach the highest level of
labor efficiency in the industry. We will continuously grow our people and our efficiency so that we can offer
environmentally friendly innovative products and services. By combining our global skills and offering local
presence to our customers, we are able to create profitable growth and responsible industry leadership.
Making a difference
Through technical excellence, significant investment in product development and specialized industry know-
ledge, the JENSEN-GROUP is able to plan, develop, manufacture, install and service everything from single
machines and processing lines to complete turnkey solutions. Our partners include textile rental suppliers,
industrial laundries, central laundries as well as on-premise laundries in hospitals, hotels and cruise ships. We
believe that our customers know their laundry better than anybody else and that with the help of the JENSEN-
GROUP’s comprehensive laundry competence and experience we are able to find the right solution for their
specific requirements.
Organization
All products designed and manufactured by the JENSEN-GROUP are under the responsibility of three technology
centers: washroom technology, finishing technology (flatwork, garments and mats) and Material Handling and
Automation. In order to better align the production structure and processing standards, the technology centers
report to the Chief Operating Officer. Next to this, the JENSEN-GROUP is organized into five Business Regions
spanning the world. The three technology centers develop, manufacture and deliver a full, innovative and
competitive range of JENSEN products to our customers through our worldwide network of Sales and Service
Centers (SSCs) and authorized local distributors. This worldwide distribution network together with our laundry
design capabilities, project management expertise and our after-sales service capability make the JENSEN-
GROUP uniquely positioned to act locally while meeting our customer’s expectations fast and reliably whether
the requirement is a single machine or a complete turnkey solution anywhere in the world.
Jensen-group Management
Finishing Technology
Washroom Technology
Material Handling
Technology Centers:
Business Regions:
BR I: Western Europe Mediterranean Countries and South America
BR II: Northern, Eastern and Central Europe, Africa
BR IV: North America and Caribbean
BR V: China
BR III: Asia, Australia, New Zealand, Arab Peninsula

10 A N N U A L R E P O R T 2 0 1 9
JENSEN-GROUP (fully controlled entities)
JENSEN GROUP
SALES AND SERVICE CENTERS
JENSEN AG BurgdorfSwitzerland
Business UnitWashroom Technology
Business UnitFinishing Technology
Business UnitMaterial Handling and Automation
JENSEN ChinaChina
JENSEN ChinaChina
JENSEN SwedenSweden
JENSEN ComponentsGermany
JENSEN DenmarkDenmark
JENSEN USAUSA
JENSEN GmbHGermany
JENSEN USAUSA
JENSEN ChinaChina
JENSEN ItalyItaly
JENSEN New ZealandNew Zealand
JENSEN AsiaAsia
JENSEN DenmarkDenmark
JENSEN JapanJapan
JENSEN NorgeNorway
JENSENBenelux
JENSEN FranceFrance
JENSEN Laundry SystemsAustralia
JENSEN ÖsterreichAustria
JENSEN BrazilBrazil
JENSEN GmbHGermany
JENSENMiddle East
JENSEN SpainSpain
JENSEN SverigeSweden
JENSEN UKUK
JENSEN USAUSA
MANUFACTURING COMPANIES

11A N N U A L R E P O R T 2 0 1 9
Manufacturing
The JENSEN-GROUP has a manufacturing platform of six factories in five countries (three continents). Each
manufacturing site focuses on specific technologies for the heavy-duty laundry industry:
y Washroom Technology: JENSEN China in Xuzhou, China, JENSEN GmbH in Harsum and JENSEN Components in
Pattensen, Germany and JENSEN USA in Panama City, FL, USA;
y Finishing Technology: JENSEN China in Xuzhou, China, JENSEN Denmark in Rønne, Denmark;
y Material Handling and Automation: JENSEN Sweden in Borås, Sweden and JENSEN USA in Panama City, FL,
USA.
Distribution
The JENSEN-GROUP sells its products and services under the JENSEN name and the ALPHA by JENSEN name
through wholly-owned sales and service centers and through independent authorized distributors worldwide.
The relative share of sales through our own SSCs has increased in recent years. These SSCs operate in the most
important heavy-duty markets: Australia, Austria, Benelux, Brazil, China, Denmark, France, Germany, Italy, Japan,
Middle East, New Zealand, North America, Norway, Singapore, Spain, Sweden, Switzerland and United Kingdom.
Sales and service centers play a critical coordination role for the increasing number of complex installation
projects involving several of our production companies simultaneously. Local presence enables us to deliver
after-sales services on demand to our customers. On top of that, we have an experienced distributor network
base in more than 50 countries.
Competitive advantage
Our market coverage, our extensive know-how, our turnkey project expertise and our range of heavy-duty
machines, systems and software are unique for the heavy-duty laundry industry.
Product Development
The JENSEN-GROUP’s key technologies encompass the entire laundry process, including the washroom itself, the
logistics of moving linen and textiles inside the laundry, finishing with feeders, ironers and folders, as well as
software technology to control the overall process. In short, a large number of different technologies are used in
the process of turning soiled linen and textiles into clean linen with a perfect finish.
Given the wide range of technologies needed to cater for the needs of our customer base, we do not focus on
fundamental research and development. Our task is to make use of existing technologies and incorporate them
into our industry’s processes.
In recent years we have invested in further upgrading and expanding our product range in particular in
laundry robotics, AI (Artificial Intelligence), automation, new software applications for our industry and in
environmentally friendly products. Many developments that target natural resource and energy savings for our
customers are grouped under our CleanTech brand. Together with ABS Laundry Business Solutions, the JENSEN-
GROUP created Gotli Labs AG. Gotli Labs offers of state-of-the-art software solutions for the heavy-duty laundry
industry. The integration of technology and software allows customers to monitor and track production in real
time and use the acquired information to improve productivity based on relevant data. The new product from
Gotli Labs labelled GLOBE and the investments in Inwatec for automation and AI bring our industry up to a new

12 A N N U A L R E P O R T 2 0 1 9
level and prepare us for Industry 4.0 and the Internet of Things. Process control and production monitoring
software have become crucial in offering the customer a total laundry-operation solution.
The Group has numerous patents on particular features of our machinery, and our product development teams
in our various competence centers are continuously examining the possibility of protecting our innovative
developments. Our ambition is to automate heavy-duty laundries as far as possible.
Patents and notarial depositions are used primarily to prove prior art. We protect our patents on a case-by-case
basis and primarily in the larger markets.
In general, the JENSEN-GROUP invests in the range of 2% to 3% of its turnover in Product Development every
year. We believe this figure represents more or less the industry average.

13A N N U A L R E P O R T 2 0 1 9
JENSEN-GROUP in the World
9
7
16
21
5
4
15
20
26
25
8
23
1014
1
13
624
18
19
22
12
11
17
23

14 A N N U A L R E P O R T 2 0 1 9
Information for shareholders and investors
The JENSEN-GROUP NV share is quoted on the Euronext Stock Exchange under the ticker JEN (Reuters: JEN.BR
Bloomberg JEN.BB) since June 1997. The ISIN code is BE0003858751. The quote of the JENSEN-GROUP shares can
be found online on the following websites:
y JENSEN-GROUP: https://www.jensen-group.com/investor-relations/share-price.html
y Euronext: https://live.euronext.com/en/product/equities/BE0003858751-XBRU
Share price evolution
The JENSEN-GROUP NV stock price increased from 34.0 euro at the end of 2018 to 34.7 euro at the end of 2019,
with an average daily trading volume of 2,592 shares compared with 3,913 in 2018.
0,00
20,00
40,00
60,00
80,00
100,00
120,00
140,00
02/0
1/20
19
11/0
1/20
19
22/0
1/20
19
31/0
1/20
19
11/0
2/20
19
20/0
2/20
19
01/0
3/20
19
12/0
3/20
19
21/0
3/20
19
01/0
4/20
19
10/0
4/20
19
23/0
4/20
19
03/0
5/20
19
14/0
5/20
19
23/0
5/20
19
03/0
6/20
19
12/0
6/20
19
21/0
6/20
19
02/0
7/20
19
11/0
7/20
19
22/0
7/20
19
31/0
7/20
19
09/0
8/20
19
20/0
8/20
19
29/0
8/20
19
09/0
9/20
19
18/0
9/20
19
27/0
9/20
19
08/1
0/20
19
17/1
0/20
19
28/1
0/20
19
06/1
1/20
19
15/1
1/20
19
26/1
1/20
19
05/1
2/20
19
16/1
2/20
19
JENSEN-GROUP share relative price performanceJENSEN-GROUP BEL ALL-Share Index BEL Small Index
28,0
29,0
30,0
31,0
32,0
33,0
34,0
35,0
36,0
37,0
-
5.000
10.000
15.000
20.000
25.000
30.000
35.000
40.000
45.000
50.000
55.000
60.000
04/0
1/20
19
15/0
2/20
19
29/0
3/20
19
15/0
5/20
19
26/0
6/20
19
07/0
8/20
19
18/0
9/20
19
30/1
0/20
19
11/1
2/20
19
JENSEN-GROUP share price and volumeVolume (left scale) Share price (right scale)

15A N N U A L R E P O R T 2 0 1 9
Communication strategy
JENSEN-GROUP will maintain its communication strategy based on the following principles:
y Organizing two analysts’ meetings per year, following publication of the half year and the full year results;
y Communicating any major changes in the financial position and earnings of the Company;
y Distributing its press releases to professional and private investors and posting them on its corporate
website;
y Posting the votes and minutes of the Shareholders’ meetings on its corporate website;
y Providing all communication, including the corporate website, in English and Dutch;
y Making information on shareholdings and the financial calendar available on the corporate website;
y Attending small cap investor events upon request;
y Phone conferences with analysts and existing or potential shareholders upon request.
Change in ownership structure
During 2019, JENSEN-GROUP did not receive any notification. JENSEN-INVEST A/S purchased 100,000 shares in the
course of 2019.
The ownership structure as per December 31, 2019 is set out below:
JENSEN Invest A/S
Free Float
Lazard Frères Gestion SAS
40.40%
54.40%
5.20%

16 A N N U A L R E P O R T 2 0 1 9
Shareholders’ calendar
y May 19, 2020: 10 a.m. Annual Shareholders’ Meeting at the JENSEN-GROUP Headquarters, Ghent;
y August 2020: Half year results 2020 (analysts’ meeting);
y March 2021: Full year results 2020 (analysts’ meeting).
The Investor Relations Manager is also available to meet individual shareholders, analysts, specialized journalists
and institutional investors to enable them to see the JENSEN-GROUP’s short and long-term potential, with
respect to both the business as a whole and/or specific activities. Presentations, meetings and site visits are
organized upon request.
The JENSEN-GROUP’s Annual Report, press releases and other information are available on the corporate website
(http://www. jensen-group.com).
Shareholders wishing to convert registered shares into dematerialized shares can contact the Investor
Relations Manager.
Shareholders and investors who want to receive the Annual Report, the financial statements of
JENSEN-GROUP NV, press releases or other information with respect to JENSEN-GROUP can also contact
the Investor Relations Manager:
JENSEN-GROUP NV
Mrs. Scarlet Janssens
Bijenstraat 6
BE 9051 Ghent (Sint-Denijs-Westrem)
Belgium
Tel. +32.9.333.83.30
E-mail: [email protected]

17A N N U A L R E P O R T 2 0 1 9
FINANCIAL REPORT 2019

18 A N N U A L R E P O R T 2 0 1 9
Report of the Board of Directors
The JENSEN-GROUP’s revenue for the year amounts to 332.2 million euro compared to 343.8 million euro
last year. A large number of smaller orders with fast delivery could not fully compensate the decrease in large
projects.
The full-year profitability reflects these by lower revenues, fluctuating but lower capacity utilization in some
factories and necessary restructuring measures.
The own sales and service centers (SSCs) continued to generate the majority of our turnover, confirming the
importance of having our own local presence in the main markets.
On the balance sheet, working capital at closing date was 6.0 million euro lower than last year because of the
lower activity level. At the end of 2019, the net financial debt amounts to 4.4 million euro, up 9.7 million euro
compared to the previous year. The increase is especially due the new IFRS 16 accounting rule on operating
leases, which added 13.7 million euro to the financial debt. The Group re-financed the mortgage loans at its
facility in Denmark at market conditions. The Group’s borrowing agreements include financial covenants with
one of the financial institutions on solvency, a positive EBITDA on an annual basis and a maximum debt/EBITDA
ratio. At the end of 2019, the JENSEN-GROUP was in full compliance with its bank covenants.
Headcount remained stable, reflecting a prudent approach in relation to the current activity level.
Results 2019
Operating profit decreased by 14.6% to 23.0 million euro. The full year profitability is affected by lower revenues,
fluctuating but lower capacity utilization in some factories and costs associated with restructuring measures.
EBIT is positively affected by a partial insurance payment for the impact of hurricane Michael (+3.8 million euro
income, -1.1 million euro costs related to hurricane Michael). As this part of the insurance claim is certain, the
Group recognized this income. Management believes that the insurance coverage is adequate. A provision of
1.6 MEUR was taken as restructuring costs to adapt the structure and the production capacity.
Net financial charges increased from 1.3 million euro to 2.5 million euro including 0.4 million euro of interest
related to IFRS 16 (treatment of leases).
Taxes decreased by 32% as profit before taxes as well as disallowed expenses decreased.
The result from companies accounted for by the equity method (participations in TOLON and Inwatec) decreased
from 0.9 million euro to -0.2 million euro. The loss is due to the negative result of TOLON and a negative
currency impact from the devaluation of the TRY.
The above-mentioned factors together resulted in a decrease in net profit from 19.1 million euro to 15.7 million
euro (-17.8%).

19A N N U A L R E P O R T 2 0 1 9
Outlook 2020
In 2019, the JENSEN-GROUP received 326.3 million euro of orders, 1.4% above 2018. The JENSEN-GROUP expects a
slow-down in activities due to the spread of Covid-19 in several countries . A close monitoring process for orders
and capacity needs is in place.
The main business risks have not changed materially from last year. Major risk factors are the volatility in the
financial markets affecting our customers’ investment decisions and their capacity to find financing, competitive
pressure, political instability and uncertainty in certain parts of the world. The Group does not expect a
significant impact from Brexit. The potential impact of possible protectionist movements in various parts of the
world cannot be assessed today. We are unable to assess for the moment the duration of the Covid-19 crisis and
therefore cannot estimate the impact on our performance. This slow-down will have a significant impact on the
revenue and on the profitability of the Company in 2020. Other risks that mainly affect our margin are exchange
rate volatility and fluctuating raw material prices and energy and transportation costs.
The operational objectives for 2020 are the implementation of a new group structure and reduction of capacity
where needed. The market share in Europe, the cooperation with Inwatec and the further growth in markets
like North America and in several countries in Asia are the main challenges for 2020. In product development,
we are focusing our activities on further automation, decreased use of natural resources and energy, and
on efficiency gains for our customers. Optimizing our internal processes remains another area of continuous
improvement.
Risk factors
Risks related to the JENSEN-GROUP’s financial situation
Net profit depends on reaching a certain level of sales to absorb overhead costs.
Any major drop of activity has an immediate effect on operating profits.
The Group has six fully-owned production sites, in the following countries:
y China
y Denmark
y Germany
y Sweden
y USA
Each production and engineering center (“PEC”) is specialized in a specific part of the laundry operation
(Washroom, Finishing Technology, Material Handling) or in a specific type of linen (flatwork, garment or special
applications such as mats, continuous roller towels or wipers).

20 A N N U A L R E P O R T 2 0 1 9
The Group has its own distribution channels (Sales and Service Centers – or “SSC”) in the most important
markets:
y Australia
y Austria
y Benelux
y Brazil
y China
y Denmark
y France
y Germany
y Italy
y Japan
y Sweden
y Middle East
y New Zealand
y Norway
y Singapore
y Spain
y Switzerland
y UK
y USA
Alongside to the SSCs, JENSEN-GROUP has sales representatives in:
y Czech Republic
y Poland
On top of that, the JENSEN-GROUP has an experienced distributor network in more than 50 countries.
Each SSC is staffed to handle turnkey projects and systems, single machine sales and after-sales services.
In each PEC and SSC we have the supporting functions needed to administer the legal entity. In order to absorb
these overheads, sufficient volume is needed. The activity level determines production volume and can be
influenced by factors beyond our control. Since our products are investment goods, the international investment
climate more particularly in healthcare, hospitality (hotels and restaurants) and in industrial clothing can have
a significant influence on the overall market demand and sales opportunities. The impact of a sudden decrease
in turnover cannot be fully offset by a decrease in overheads and infrastructure costs and as such can have a
negative impact on our activity level, our financial condition and our operating results.

21A N N U A L R E P O R T 2 0 1 9
Currency risks and the economic and political risks of selling products in foreign countries.
Sales of equipment and projects to international customers represent a major part of the net revenues. Demand
for our products is and may be affected by economic and political conditions in each of the countries in which
we sell our products and by certain other risks of doing business abroad, including fluctuations in the value of
currencies (which may affect demand for products produced in the euro zone). We do hedge exchange rate
fluctuations between the major currencies used in our operations, these being the AUD, CHF, CNY, DKK, EUR,
GBP, JPY, NOK, NZD, SEK, SGD and USD.
Interest rate fluctuations could have an adverse effect on our revenues and financial results.
The Group is exposed to market risk associated with adverse movements in interest rates. The JENSEN-GROUP
maintains long-term interest rate hedges and loans with fixed interest rates in order to limit this risk, but a
general increase in interest rates might have an unfavorable effect on the overall investment climate and as
such on our business, financial condition and results of operations.
The use of debt could adversely affect our financial health if covenants are not met.
The JENSEN-GROUP’s major financial institution partners are Nordea, KBC and Nykredit. The Group’s borrowing
agreements include financial covenants with one of the financial institutions covering solvency, a positive
EBITDA on an annual basis and a maximum debt/EBITDA ratio. These covenants could have a restricting effect on
our financial capacity.
To service its debt, JENSEN-GROUP will require a certain amount of cash flow. The ability to generate
cash depends on many factors beyond our control.
The ability to make scheduled payments of principal and interest with respect to our debt, to fund our planned
capital expenditures and our research and development efforts and to finance our expansion in capacity, will
depend on our ability to generate cash, on future financial results and the development of the major financial
institutions we work with. These institutions, to a certain extent, are subject to the risk factors mentioned
above.
Risks related to the issuer’s business activities and industry
Our largest customers are getting larger as they consolidate and become increasingly international.
An important part of the business is to deliver solutions and machines to the textile rental industry. The ongoing
consolidation and internationalization in this industry is making a significantly greater part of the business
dependent on relations with these larger groups.
Price fluctuations or shortages of raw materials and the possible loss of suppliers could adversely
affect the operations.
The JENSEN-GROUP purchases a large number of different components as well as raw materials such as black
iron, stainless steel and aluminum. The price and availability of these raw materials and components are subject
to changes in duties, market conditions affecting supply and demand. In a competitive market, there is no
assurance that increases or decreases in raw material and other costs will be translated quickly into higher sales
or lower purchase prices. Nor can there be any assurance that the loss of suppliers or components would not
have a material adverse effect on our business, financial condition and results of operations. We currently do not
undertake commodity hedging.

22 A N N U A L R E P O R T 2 0 1 9
JENSEN-GROUP operates in a competitive market.
Within the worldwide heavy-duty laundry market, the JENSEN-GROUP encounters several competitors, both small
and large. There can be no assurance that significant new competitors or increased competition from existing
competitors will not have an adverse effect on our business, financial condition and results of operations.
In addition, the Group may face competition from companies outside of the United States or Europe who
have lower costs of production (including labor or raw materials). These companies may pass on these lower
production costs as price decreases to customers and as a result, our revenues and profits could be adversely
affected.
Vendor financing.
Since the 2008 financial crisis, many customers have experienced difficulties in obtaining financing to invest
in expansion or equipment renewal. Under certain specific conditions the JENSEN-GROUP is offering financing
solutions to customers. This creates exposure for the Company in terms of having to take back machinery over
the lifetime of the financing contract. We manage our exposure by aligning the take-back price to the second-
hand market values as much as possible.
Legal and regulatory risk
Policy choices can affect the healthcare sector.
The JENSEN-GROUP sells to industrial laundries which handle, amongst others, linen for the healthcare sector.
Policy choices at country level can affect the standards of hygiene or the financial capability of hospitals. This
may influence sales at specific points in time as well as product development in order to find solutions for the
most stringent hygiene requirements.
JENSEN-GROUP may incur product liability expenses.
The Group is exposed to potential product liability risks that arise from the sale of our products. In addition to
direct expenditures for damages, settlements and defense costs, there is a possibility of adverse publicity as
a result of product liability claims. We cannot be sure that our existing insurance or any additional insurance
will provide adequate coverage against potential liabilities and any such liabilities could adversely affect our
business, financial condition and results of operations.
The JENSEN-GROUP is subject to risks of future legal proceedings.
At any given time, JENSEN-GROUP is a defendant in various legal proceedings and litigation arising in the
ordinary course of business. Although we maintain insurance coverage, there is no assurance that this insurance
coverage will be adequate to protect us from all material expenses related to potential future claims for personal
and property damage or that these levels of insurance coverage will be available in the future at economical
prices or for that matter, available at all. A significant judgment against us, the loss of a significant permit or
other approval or the imposition of a significant fine or penalty could have an adverse effect on our business,
financial condition and future prospects.
23A N N U A L R E P O R T 2 0 1 9
Environmental, social and governance risks
The JENSEN-GROUP is dependent on key personnel.
The JENSEN-GROUP is dependent on the continued services and performance of the senior management team
and certain other key employees. The employment agreements with senior management and key employees
are for an indefinite period of time. The loss of any key employee could have a material adverse effect on
the business, financial condition and results of operations because of their experience and knowledge of our
business and customer relationships.
The nature of the business exposes JENSEN-GROUP to potential liability for environmental claims and
JENSEN-GROUP could be adversely affected by new, more stringent environmental, health and safety
requirements.
The Group is subject to comprehensive and frequently changing federal, state and local, environmental, health
and safety laws and regulations, including laws and regulations governing emissions of air pollutants, discharges
of waste and storm water and the disposal of hazardous wastes. We cannot predict the environmental liabilities
that may result from legislation or regulations adopted in the future, the effect of which could be retroactive.
The enactment of more stringent laws or stricter interpretation of existing laws could require additional
expenditures by us, some of which could have an adverse effect on our business, financial condition and results
of operations.
The Group is also subject to liability for environmental contamination (including historical contamination
caused by other parties) at the sites it owns or operates. As a result, the Group is involved, from time to
time, in administrative and judicial proceedings and inquiries related to environmental matters. There can be
no assurance that we will not be involved in such proceedings in the future, and we cannot be sure that our
existing insurance or additional insurance will provide adequate coverage against potential liability resulting
from any such administrative and judicial proceedings and inquiries. The aggregate amount of future clean-up
costs and other environmental liabilities could have a material adverse effect on our business, financial condition
and results of operations.
For the past several years, the JENSEN-GROUP has strictly followed an environmental remediation plan relating
to our former Cissell manufacturing facility in the United States. A third-party indemnity for the remediation
plan exists, with Cissell as the legal beneficiary. The most recent sampling tests, done by a third party
environmental-engineering company each year and, with an exhaustive review every five years, are in line
with expectations. The latest projected end date for this remediation plan is 2025. However, there can be no
complete assurance that significant additional civil liability or other costs will not be incurred by us in the future
with respect to the Cissell facility or other facilities.
The operations are also subject to various hazards incidental to the manufacturing and transportation of heavy-
duty laundry equipment. These hazards can cause personal injury and damage to and destruction of property
and equipment. There can be no assurance that as a result of past or future operations, there will not be injury
claims by employees or third parties. Furthermore, we also have exposure to present and future claims with
respect to worker safety, workers’ compensation and other matters. There can be no assurance as to the actual
amount of these liabilities or the timing of them. Regulatory developments requiring changes in operating
practices or influencing demand for, and the cost of providing, our products and services or the occurrence of
material operational problems, including but not limited to the above events, may also have an adverse effect
on our business, financial condition and results of operations.

24 A N N U A L R E P O R T 2 0 1 9
The JENSEN-GROUP operates in several locations and is subject to natural hazards.
The JENSEN-GROUP operates in 23 countries and is therefore exposed to natural hazards such as earthquakes,
windstorms or floods. Insurance coverage is taken when possible and compliance with specific building codes is
reviewed carefully. The entities are required to have disaster recovery plans. Any severe natural disaster could
affect our business, financial conditions and operational results.
Internal control risk
JENSEN-GROUP operates with several information and communication technologies (ICT).
The JENSEN-GROUP uses for its worldwide operations several tools, devices and software in its ICT and
machine operating environment. Digital technologies, devices and media bear manifest risks and opportunities.
Machinery is more interconnected and prepared for IoT (Internet of Things). As a result, the Group faces cyber
risks. Any ICT failure in the area of security and systems access or in machine operating environments might
cause operational disruption, damage to reputation, and financial losses. The JENSEN-GROUP manages these
risks by closely following the latest technological developments. Next to this, the Group selects the best
suppliers for software and ICT. Cybersecurity is a major criterion when selecting these suppliers.
Non-financial information
In accordance with Directive 2014/95/EU (further ‘the Directive’) of the European Parliament and of the Council
of 22 October 2014 and as required by the Belgian Companies and Associations code art. 3:6 § 4 and art. 3:34,
we have added this separate section containing non-financial information which is considered to be relevant for
the stakeholders of the JENSEN-GROUP.
In providing this information, we have taken into account the requirements defined by the Directive and the
Companies’ Code, while also drawing inspiration from the GRI Sustainability Reporting Standards: Core option.
Alongside the financial information on the JENSEN-GROUP (which can be found in the ‘Financial Report
2019’ section of this Annual Report), this section describes non-financial activities which are relevant to our
stakeholders and by which we make a difference.
Materiality analysis
We conducted a materiality analysis in 2019 to identify and confirm sustainability topics that are most important
to our business and stakeholders, and to further strengthen our sustainability and corporate responsibility policy
and reporting, by prioritizing topics that matter the most.

25A N N U A L R E P O R T 2 0 1 9
We identified topics which are considered important for reflecting JENSEN’s economic, environmental and social
impact or which influence the decisions of JENSEN’s stakeholders, such as our customers, suppliers, employees,
governments and shareholders. During this analysis, both external and internal factors were taken into
consideration, including JENSEN’s vision, mission, brand and long-term strategy. The result is illustrated in the
materiality matrix below.
The upper right quadrant represents priority topics which are relevant for society, our stakeholders and our
business. JENSEN’s sustainability approach focuses mainly on these areas. The upper left quadrant represents
strategically significant topics, which are considered relevant from our stakeholders and our business point of
view. The areas defined below are topics to be monitored closely and to be managed internally.
Management made a materiality analysis and will update it on a yearly basis.
We summarize our sustainability approach in three dimensions. These are:
Environment People Society (including corporate governance)
Financial Healthy Company
Influ
ence
on
stak
ehol
der d
ecisi
ons
Significance of economic, environmental and social impacts
Very
hig
hVe
ry lo
w
Very low Very high
Long Term Strategy
2 Tier Strategy
Company Culture
Automation & Artificial Intelligence
IT Security & Data Protection
Corporate Governance
Education for all
Well-being of employees
Energy & WaterConsumption – Clean Tech
Safety & Reliability of Equipment
Waste Reduction
Climate Change
Social Involvement
Digital Waste – Collaborative Tools
Diversity & Inclusion
Code of Conduct
Remote access to machinery
Sustainability Reporting
SOCIETY PEOPLE ENVIRONMENT
Priority topicsSignificant topics

26 A N N U A L R E P O R T 2 0 1 9
In order to understand the different dimensions, we briefly elaborate on the business model of the
JENSEN-GROUP. For more information on this model, we also refer to other sections of the Annual Report.
Business model
The aim of the JENSEN-GROUP is to lead by providing the best solutions to its worldwide customers in the
heavy-duty laundry industry. Technical excellence, significant investment in product development and
specialized industry knowledge enable the JENSEN-GROUP to plan, develop, manufacture, install and service
everything from single machines to complete systems, turnkey solutions and process automation.
We consider product development a key part of our business model, as scarcity of resources and a greater focus
on ecology increase the need for sustainable laundry solutions.
All products designed and manufactured by the JENSEN-GROUP fall under the responsibility of three technology
centers: Washroom Technology, Finishing Technology (flatwork, garments and mats) and Material Handling &
Automation. The three technology centers develop, manufacture and deliver a full range of innovative and
competitive JENSEN products to our customers through our worldwide network of Sales and Service Centers
(SSCs) and authorized local distributors, organized into five Business Regions. This worldwide distribution
network together with our laundry manufacturing capability, project management expertise and after-sales
service make the JENSEN-GROUP a credible one-stop supplier uniquely positioned to act locally, meeting our
customer’s requirements and expectations fast and reliably, whether for a single machine or a complete turnkey
solution, anywhere in the world.
The relative share of sales through our own SSCs has increased in recent years. These SSCs operate in the most
important heavy-duty markets: Australia, Austria, Benelux, Brazil, China, Denmark, France, Germany, Italy,
Japan, Middle East, New Zealand, North America, Norway, Singapore, Spain, Sweden, Switzerland and the
United Kingdom.
The JENSEN-GROUP mission is “Creating the future in laundry automation”, a one-liner that we also use in
our marketing communication. The JENSEN-GROUP is committed to offering the best solutions to heavy-duty
laundries worldwide. For this we are in a constant dialogue with our customers, through local presence, in order
to identify the best solutions for them. Based on our global experience, these solutions take into account the
total cost of ownership and are aimed at continuously raising productivity and reducing the ecological impact of
our equipment and our own processes. In recent years, we have invested in further upgrading and expanding
our product range, in particular in laundry robotics, AI (Artificial Intelligence), automation, new software
applications for our industry and in environmentally friendlier products. We are committed, engaged, dedicated
and responsible every time we interact with our customers.
Finally, part of our business model is to expand geographically. We have recently enlarged our offices in China,
Dubai and Japan as part of our ‘Go East’ strategy. Believing in the benefits of local presence, we continue to
expand throughout the world in order to keep communication lines with our end-customers as short as possible.

27A N N U A L R E P O R T 2 0 1 9
ENVIRONMENT
Nowadays our customers, and by extension all of our stakeholders, face a rapidly changing environment. The
JENSEN-GROUP takes sustainability and environmental protection seriously and is pursuing a continuous energy
reduction strategy in order to rise to the challenges of the future like climate change and the finiteness of fossil
fuels. In particular, the increasing scarcity of water and energy call for an increased focus on ecology.
We have installed appropriate internal policies to help us identify any environmental risks of our business,
both internal (arising during the manufacturing process) and external (created by the use of our equipment).
Environmental risks are identified and evaluated as part of the yearly risk mapping exercise. Three main
environmental risks are included in the risk map, based on the probability of the risk occurring and based on its
impact:
y Risk of damage due to a natural disaster;
y Risk of non-compliance with new local laws and regulations regarding environmental protection;
y Risk of being held responsible for environmental contamination without knowledge of having caused the
contamination.
Risk mitigating measures are defined, implemented and evaluated on a yearly basis by the Executive
Management Team. A dedicated project has been introduced to ensure that the JENSEN-GROUP is fully compliant
with local laws and regulations. For further information on environmental risks we refer the reader to the ‘Risk
Factors’ and ‘Risk Management and Internal Control’ sections in the 2019 Annual Report.
Continuous investment in product development, alignment of our core processes and in-depth market presence
enable us to better meet our customers’ needs. Many of these developments are targeted at reducing energy
and water consumption as well as increasing the up-time of our equipment. In general, JENSEN-GROUP invests in
the range of 2% to 3% of its turnover in Product Development every year.
A major share of our product development work is directed at natural resource and energy savings and at
reducing the environmental impact of our equipment. This includes continuously monitoring the performance
of our equipment during the development phase. Many product developments that target natural resource and
energy savings for our customers are grouped under our CleanTech concept.

28 A N N U A L R E P O R T 2 0 1 9
CleanTech
The JENSEN-GROUP takes sustainability and environmental protection seriously and is pursuing a continuous
energy saving strategy in order to meet the challenges of the future, such as climate change and the finiteness
of fossil fuels.
CleanTech embraces knowledge-based products and services that improve operational performance, productivity
and efficiency while reducing costs, input, energy consumption, waste or pollution. The objective of the JENSEN
CleanTech concept is to increase the efficient use of primary energy and to ensure this is consumed more
economically in gas-heated laundry equipment.
In developing laundry machines, the JENSEN-GROUP focuses on high performance with as little energy and fresh
water input as possible. As well as the use of direct gas operation, this involves integrating water- and energy
recovery systems into machines.
In this context, the JENSEN-GROUP has developed a new gas-heated Water Removal dryer, with a consumption
of just 0.95 kWh/l, this is currently the world’s most energy-efficient dryer. The EcoSafeguard process monitors
the pH- and conductivity value as well as water hardness. Additionally, the heat of ironers is re-used to heat the
water in the tunnel washer.
Moreover, the JENSEN-GROUP does not just confine itself to reducing CO2 emissions and energy and water
consumption in its machines. The JENSEN-GROUP also handles valuable resources and energy sources carefully at
the production stage.
Our CleanTech technology has produced some remarkable resource and energy savings for our customers in
recent years. Average water consumption of under 3 liters per kg linen processed, and energy consumption
of under 1 KW/h per kg linen processed can be reached today with our products and solutions. Our advanced
solutions offer energy savings of up to 60% per year, combined with lower investment and installation costs.
Productivity is up to 25% higher thanks to shorter drying and finishing cycle times.
Record figures in CleanTech laundries supplied by:
y Senking Universal tunnel washer: consuming 1.6 l/kg or 0.2 gal/lb water
y WR Dryers: 0.95 kWh/l or 1,474 btu/lb
y Jenfeed Express: 1800 pcs/h
y Greater throughput, higher availability: 0.8 kWh/kg or 0.36 kWh/lb of linen
We are working to take the energy reduction program a step further through investments in software and by
on-site measurement of the KPIs of typical heavy-duty laundries: Globe by Gotli Labs, a real-time production
management tool, provides information to monitor equipment, staff, utilities and energy in a laundry.

29A N N U A L R E P O R T 2 0 1 9
Manufacturing process
The JENSEN-GROUP has a manufacturing platform of six factories in five countries on three continents. Each
manufacturing site focuses on specific technologies for the heavy-duty industry. We develop environmentally
friendly equipment, manufactured in the most ecologically responsible way. Furthermore, we are continuously
monitoring our factories in order to reduce their impact on the environment.
An environmentally friendly manufacturing process starts with selecting the most appropriate supplier. The
JENSEN-GROUP is therefore constantly looking for partnerships with suppliers who can contribute any resource
and energy-savings opportunity.
PEOPLE
Our second sustainability dimension relates to people. Our customers and employees are the basis of our
success and they are in a constant dialogue through our local presence, in order to identify the best solution for
each customer.
Health & Safety
At the JENSEN-GROUP, the wellbeing of our employees and customers is crucial.
We want our employees around the globe to work in safe and ergonomically sound environments. We
encourage all employees to help build safe work environments by applying safety measures in their day-to-
day activities. Health and safety are a priority at each JENSEN-GROUP location. At all our production sites, plant
managers’ performance evaluations include the prevention of work accidents and remedial initiatives taken.
Every JENSEN factory employs a Health & Safety Manager, who is responsible for implementing Health & Safety
measures in their respective factory, starting from local regulations and requirements. At JENSEN China, an
equipment operation safety management system analyses the key safety points in the production process.
Quarterly work environment committees, consisting of local management and employee representatives, are
organized at different JENSEN factories to discuss Health & Safety procedures and to review work accidents.
Compliance with local health and safety laws and regulations is also part of the annual risk mapping exercise by
the Executive Management Team.
Our responsibility for safety continues after our equipment is manufactured and has left our premises. We
consider the safety of our customers’ operators and anyone using our equipment to be as important as that
of our own employees. Our equipment complies with all European safety regulations (European Standards,
ENs) and other local requirements. At the same time, we believe that machine safety has to go beyond
regulations. Already during the product development phase, we focus on the ergonomics and overall safety of
our equipment. Specific security measures include ironer line with integrated design of walkway and railing,

30 A N N U A L R E P O R T 2 0 1 9
safety covers for chain drives, installation of a safety door on the press, emergency stop buttons or pull cords
for belts near operators. Ergonomic solutions have been integrated in sorting, handling and finishing processes,
e.g. optimized sorting belt height to reduce stress and strain caused by bending, engineered sorting stations
which bring the bin chutes closer to the operators and individual adjustable height loading stations. Next to that,
JENSEN-GROUP is the only supplier of corner less remote stations and systems.
With this mindset we have been able to reduce work accidents to an absolute minimum; even so, we consider
each occupational accident as one too many. Health and safety is and will therefore remain a cornerstone of
our strategy.
Employees
The JENSEN-GROUP is fully aware of its responsibility to its employees. Driven by what we call the JENSEN spirit,
our culture is open and international. We offer opportunities for achievement, recognize people’s contributions,
give each team member as much responsibility as possible, and offer training and development opportunities.
This open culture results in job satisfaction for each employee and in long-term employment at the
JENSEN-GROUP, as shown by the high average career lengths.
The JENSEN-GROUP makes no distinction in terms of age, gender, culture, religion, origin or other diversity
feature. We are committed to providing equal opportunity in employment and to respecting the rights and dignity
of each employee. We also prohibit all forms of discrimination in recruitment and promotion. We have decided to
drive the JENSEN-GROUP by culture. When we all live the JENSEN spirit, we naturally do the right things.
We count 62 nationalities in the JENSEN-GROUP.
Female/male (total workforce 2019) Female/male (management 2019)
12% 88% 16% 84%
As a direct consequence of our type of business, the percentage of women is rather low, though with a higher
percentage in management. Furthermore, the Belgian Law of 28 July 2011 on gender diversification requires that
at least one third of the Board of Directors be female. JENSEN-GROUP is in full compliance with this law.
People development
To fulfil our mission and to sustain our JENSEN spirit, we need to attract and retain talented people and develop
the skills of our current and future leaders. In recent years, the JENSEN-GROUP has invested heavily in the
development of its employees, through corporate training, local training and individual initiatives. Training is
given through the JENSEN Academy to all organizational levels, through webinars and by onboarding training for
new employees, new managers and new project managers. The JENSEN factories also offer apprenticeships in
a range of professions. Training programs include technical and function-specific training, as well as leadership
modules that help our employees develop and cooperate in a global business environment. We believe that
developing teamwork and collaboration is critical to our success.

31A N N U A L R E P O R T 2 0 1 9
Social dialogue
We want to further strengthen our open culture and to embed it throughout the Group. For this, we use a variety
of communication channels and platforms to inform our employees about corporate targets, strategies and
current developments. Jennet, the intranet of the JENSEN-GROUP, offers information on a wide range of subjects,
including product information, HR information, and our Ethics Code, Principles and Guidelines. While Jennet is
a valuable tool for disseminating information within the JENSEN-GROUP, we also encourage the use of internal
social media, including an app on employees’ smartphones, as a modern way of sharing news and interacting.
The various departments then determine their own priorities using these general communication tools and
implement action plans to achieve them.
With our ‘we think globally, and act locally’ approach, a lot of authority is shifted towards local management.
This requires us to make sure that a number of rules are respected. At the JENSEN-GROUP, these are summarized
in our ‘Principles and Guidelines’ which can be found on the JENSEN intranet. In addition, the JENSEN-GROUP
has developed a whistleblowing procedure and set up a Whistleblowing Hotline. We refer also to the paragraph
below on social responsibility. We also encourage managers to enter into dialogue with their teams, putting
transparency into practice.
Customers
The JENSEN culture makes the difference: our corporate culture incorporates our past, our presence with
the preferred values that we live by, and our future. We want to be able to deepen our JENSEN-GROUP
culture throughout the organization. We believe that our corporate culture is a dynamic process that directly
incorporates the needs of our customers. As our customers know the laundry business better than anybody
else, we want to create partnerships with them. Constant dialogue with our customers, through local presence,
results in long-term relationships. In this way we know their needs and can focus on efficiencies to provide
sustainable laundry solutions and systems. Our CleanTech solutions are helping us gain new customers that
require ecological processes to meet Corporate Social Responsibility guidelines or to obtain quality certificates.
With the JENSEN-GROUP, our customers have a strong partner they can rely on from the initial consultation, on
to the planning stage, correct installation and start-up of the equipment and through to after-sales service. This
includes regular technical inspections of the JENSEN equipment and customer training. Both of these reduce
maintenance costs for our customers and help avoid equipment downtime, resulting into increased productivity
and profitability. We believe this strong business partnership between the JENSEN-GROUP and its customers
places us in a win-win position.

32 A N N U A L R E P O R T 2 0 1 9
SOCIETY
Our last sustainability dimension relates to all the ways the JENSEN-GROUP is making a difference for society
at large. At the JENSEN-GROUP, we are convinced that our responsibility goes beyond our employees and our
customers, towards the communities where we provide employment and to society at large.
Strategy and brand
Our strategy is to expand our global reach by building a local presence in every significant market. Our brand
represents quality and tailor-made solutions for our customers. It is this message that we want also to convey
to the wider community: we bring quality to the community by complying with all legal requirements, we make
a difference by entering into local level partnerships and respecting local habits and needs. We also want our
JENSEN equipment to be as efficient and as environmentally friendly as possible. We refer to the Environment
section of this report for further information on this topic.
In 2017, we introduced our two-tiers sales strategy with high-tech products from our Western factories and
single machines exported from China under the ALPHA by JENSEN product line brand. Under this brand, the
JENSEN-GROUP manufactures and promotes its value-engineered machine range made in China, targeting
customers who were buying standard solutions from other vendors. This extended product range strategy allows
us to better meet our customers’ requirements. In combination with our standalone partner TOLON, we can in
this way cater to the needs of smaller commercial laundries as well as large on-premise laundries.
Changing markets
Today the world is becoming a global village, where people travel more than ever before, both for business and
for leisure, to traditional and new destinations (emerging markets). This offers opportunities for growth, with
an increased need to process hotel and catering linen, and for increasing the JENSEN-GROUP’s positive social
contribution through providing environmentally friendly equipment.
The JENSEN-GROUP is keen to increase its presence in certain emerging markets. For these markets we develop
standardized, less expensive and low wear-and-tear equipment. We have branded this equipment ALPHA by
JENSEN. This is one example of the JENSEN-GROUP being flexible and adaptive to changing customer and society
needs.
Corporate governance
As the JENSEN-GROUP NV share is quoted on the Euronext Stock Exchange, the Group has adopted the Belgian
Corporate Governance Code, in its revised 2009 version, and a risk management and internal control process. For
more information on these, we refer to the separate Corporate Governance chapter in the Annual Report and to
the Corporate Governance Charter on our website.

33A N N U A L R E P O R T 2 0 1 9
We acknowledge that adopting the Corporate Governance Code positively contributes to a better society by
inspiring greater trust among our investors and other stakeholders. We consider trust in our brand and our
organization to be a crucial part of our strategy. We have therefore also implemented a strict policy to prevent
Insider Trading as well as a whistle-blowing procedure. These policies significantly reduce the risk of improper
conduct or appearance thereof. We also refer to page 38 of the Annual Report for more information on this
policy.
Social responsibility initiatives
We strive to maintain an open culture throughout the organization. Our Code of Conduct outlines the
responsibilities for proper practices of both individuals and the organization. These contribute to the welfare
of and respect for all stakeholders. Next to this, we have created an environment in which personal initiatives
are highly appreciated. We are strongly convinced that our employees are best placed to identify local needs in
which the JENSEN-GROUP can make a difference. We believe that our people live our value statement ‘we think
globally and act locally’. This has resulted in many different initiatives and activities on company-wide and local
levels.
On global level, a fundraising was organized to support our colleagues at JENSEN USA after hurricane Michael.
Instead of printing Christmas cards, we also made a donation to “Doctors without Borders”, an international
humanitarian medical NGO.
Education and training are highly valued at JENSEN-GROUP. As a result, relationships with local schools and
local student initiatives are strongly encouraged. JENSEN Germany and JENSEN Denmark organize several tours
for local schools and act as regional employers for internships. JENSEN Sweden participates in the annual
“Night of Industry”, an initiative where 8th grade students visit industrial companies in order to understand
how a technical production company works. At JENSEN France, a selection of young students is offered a one
week observation internship. JENSEN Denmark employs 60 apprentices and won the DI prize in 2018, of the
Confederation of Danish Industry. JENSEN China successfully hired welders after providing them with a welder
training as part of their cooperation with a local technical school.
Many JENSEN employees have also participated or contributed to different local charity initiatives, such as sport
fundraising events to promote good health or to help combat cancer. JENSEN Spain supported the NPO ACCEM
refugee program by employing a refugee from Venezuela. Thanks to this employment contract, our employee
was able to bring his family to Spain on a permanent basis.
The JENSEN-GROUP holds integrity, honest business practices as well as lawful conduct amongst its topmost
priorities. No business requirement can justify an illegal, unethical or unprofessional act. Our success in business
depends upon maintaining the trust of our employees, company directors, shareholders, customers, suppliers
and other commercial partners, as well as government authorities and the public at large. In order to achieve
this, the JENSEN-GROUP has developed an Ethical Business Policy Statement that reflects our values and the
ethical, legal and business expectations that we have towards all our employees and stakeholders. Appropriate
disciplinary actions will be imposed against any officer and employee who violate the Ethical Business Policy
and Code of Conduct. To the best of our knowledge, no violation of the Ethical Business Policy and Code of

34 A N N U A L R E P O R T 2 0 1 9
Conduct has been observed within the JENSEN-GROUP hence no disciplinary actions have already been imposed
on any officer or employee of the JENSEN-GROUP. The JENSEN-GROUP has not taken any remedial action so far
towards a supplier nor had to stop a commercial relationship so far due to violation of the Ethical Business Policy
and Code of Conduct or violation of human rights.
In order to secure effective compliance with the Ethical Business Policy Statement, the JENSEN-GROUP has
developed a whistleblowing procedure and set up a Whistleblowing Hotline. The Whistleblowing Hotline
is available on our website: https://www.jensen-group.com/investor-relations/corporate-governance/
whistleblowing-procedure.html.
Conflict of interest
Under Belgian company law, the members of the Board of Directors are required to give the Chairman prior
notice of any agenda items in respect of which they have a conflict of interest with the Company, either direct or
indirect, whether of a financial or other nature, and to refrain from participating in the discussions of and voting
on those items. This is also a standard item on the agenda of each Board meeting. Two potential conflicts arose
in the course of 2019 at the meeting of the Board of Directors which was held on February 21, 2019. During this
meeting, the re-elections of Pubal Consulting LLP and Inge Buyse bvba as members of the Board of Directors,
along with the dividend proposal were discussed.
The minutes of the meeting are included below:
“On February 21, 2019 at 10.30 a.m., the Board of Directors of JENSEN-GROUP NV held a meeting at the office of
JENSEN-GROUP NV, Bijenstraat 6 in 9051 Sint-Denijs-Westrem, Belgium.
The following directors were present:
y Gobes Comm. V., represented by Mr. Raf Decaluwé
y SWID AG, represented by Mr. Jesper Munch Jensen
y TTP bvba, represented by Mr. Erik Vanderhaegen
y Inge Buyse bvba, represented by Mrs. Inge Buyse
y Mr. Peter Rasmussen
y Cross Culture Research LLc, represented by Mrs. Anne Munch Jensen
The following directors was represented:
y Pubal Consult LLP, represented by Mr. Jobst Wagner (by proxy)
The following invitees were attending:
y Werner Vanderhaeghe, Esq.
y Mr. Markus Schalch

35A N N U A L R E P O R T 2 0 1 9
Mr. Decaluwé presided. Mr. Vanderhaeghe acted as Secretary. The Chairman pointed out that notice of the meeting had
been given by email of February 15, 2019, that all of the directors were present or represented and that the meeting was
thus validly constituted. The Chairman then suggested that the meeting consider the following items of business.
Conflict of interest
The Chairman informed the members of the Board that by letters dated February 20, 2019 and addressed to the Board
of Directors and to the Corporation’s statutory auditor, SWID AG, Pubal Consulting LLP and Cross Culture Research LLc had
given notice of a conflict of interest in relation to the item proposal for dividend and that Pubal Consulting LLP and Inge
Buyse bvba had given such notice with respect to the item re-election as a member of the Board of Directors The letters
were handed over to the Secretary for filing with the Board’s records. Messrs. Jensen and Wagner and Mmes. Jensen and
Buyse confirmed that they would abstain from the discussion and the vote relative to those items on the agenda. The
other members of the Board then confirmed that none of the items on the present agenda raised a conflict of interest.
Following a brief review of the items on the agenda by the Chairman and of the various documents relative to these
items that were sent to the members of the Board, the Chairman then moved for a decision on the items that required
approval of the Board and after discussion, the Board resolved as follows:
…
The Chairman then recalled for the members of the Board the issue of the expiration of the mandates of Pubal Consult
LLP and of Inge Buyse bvba as a director and the proposal for their reappointment by the Remuneration Committee
referred to earlier in the meeting. The Chairman confirmed that both Mr. Jobst Wagner and Mrs. Inge Buyse had
expressed an intention to seek reelection and that under current law both directors would maintain the qualification as
an independent director. Following a brief discussion by the Committee of the incumbent directors’ credentials and track
record on the Board and its Committees, the Chairman moved for a decision and the Committee adopted the following
resolution:
“Upon a motion duly made, the Board of Directors resolved unanimously, with Mr. Wagner and Mrs. Buyse abstaining
from the discussion and vote, to propose Pubal Consult LLP and Inge Buyse bvba for reappointment by the shareholders
to the Board of Directors for a term of 4 years and with the qualification as independent director; resolved further to
submit such proposal for approval by the shareholders at its Annual Meeting to be held on May 21, 2019.”
...
Presentation and approval Financial Statements 2018 JENSEN-GROUP NV and Consolidated Accounts 2018 JENSEN-GROUP
– Preparation and approval of Report to Shareholders – Preparation and approval of Corporate Governance Statement -
Proposal for dividend
The Chairman reviewed with the Board the draft financial statements and consolidated accounts of the Corporation for
the year ended as at December 31, 2018, the proposal for the Report to the Shareholders on the Corporation’s activities
in the course of 2018 and the proposal for the payment of a dividend. Copies of the draft financial statements, the
consolidated accounts and the draft annual report are annexed to these minutes as Appendix 1. At the suggestion of the
Chairman, the Board resolved to adopt the following resolution:
36 A N N U A L R E P O R T 2 0 1 9
“Upon a motion duly made, the Board of Directors resolved unanimously to approve the financial statements of the
Corporation for the year ended as at December 31, 2018 and the proposal for the Report to the Shareholders on the
Corporation’s activities and the Corporate Governance Statement, as presented at this meeting and as annexed to the
minutes of this meeting; resolved further that the Chairman and the Managing Director are authorized to amend such
Report if and when such amendments are necessary and provided such amendments are not material; resolved further
that the Chairman and the Managing Director are authorized and directed to finalize and formally file the Corporation’s
financial statements.”
“Upon a motion duly made, the Board of Directors resolved unanimously to approve the consolidated accounts for the
year ended as at December 31, 2018 including the explanatory notes, as presented at this meeting and as annexed to
the minutes of this meeting; resolved further that the Chairman and the Managing Director are authorized and directed
to finalize such consolidated accounts and to amend such notes if and when such amendments are necessary and
provided such amendments are not material.”
“Upon a motion duly made, the Board of Directors resolved unanimously, but with Messrs. Jensen and Wagner and
Mrs. Jensen abstaining from the deliberation and vote, to approve the proposal for the payment of a dividend to the
Corporation’s shareholders in the amount of 1.00 Euro per share, payable as of May 31, 2019.”
...
There being no further business to discuss, the meeting was adjourned at 2.35 p.m.”
Investments and capital expenditures
Investments and capital expenditures in 2019 amounted to 9.0 million euro (5.5 million euro in 2018), consisting
primarily of the increase in the shareholding in TOLON GLOBAL MAKINA Sanyi Ve Tikaret Sirketi A.S., Turkey,
by 6.34% to 49%, building repairs at JENSEN USA in the wake of hurricane Michael, extension of the building
in Sweden, purchase and extension of the Inwatec building and equipment and vehicles. Capital expenditures
in 2018 consisted primarily of the participation of 30% in Inwatec, ApS, the increase in shareholding in TOLON
GLOBAL MAKINA Sanyi Ve Tikaret Sirketi A.S., Turkey, by 6.33% to 42.66%, and equipment and vehicles.
Capex outlook 2020
The Group expects capital expenditure in 2020 to be higher than in 2019. The Group will invest primarily in its
facilities in JENSEN USA and JENSEN Sweden, in ICT and in machinery.
Use of financial instruments
The Company uses derivative financial instruments to reduce its exposure to adverse fluctuations in interest
rates and foreign exchange rates. It is the Company’s policy not to hold derivative instruments for speculative
and trading purposes.
At December 31, 2019, currency bought forward hedges existed in an amount of 3.1 million euro and currency
sold forward hedges existed in an amount of 12.7 million euro. The Company also had an Interest Rate Swap
(IRS) outstanding in amounts of 17.7 million DKK with maturity 2039 and a fixed rate of 0.4350%.
37A N N U A L R E P O R T 2 0 1 9
Litigation
Provisions have been set up in respect of all claims that, based on prudent judgment, are reasonably founded.
We keep track of all potential litigation and pending legal cases at Group level. In this chapter, we only cover
cases against the Company or one of its subsidiaries. Pending issues per major category are:
Product liability claims:
y 3 product liability claims in the USA
y 7 product liability claims in the EU
y 1 product liability claim in Asia
Claims from employees:
y 2 claims from an employee in the USA
Commercial claims:
y 2 claims in the EU
Environmental risk:
y One ongoing case in the USA
Most of these claims are covered by insurance. Based on legal advice taken, management does not expect
these claims to significantly impact the Group’s financial position or profitability. Where necessary, a realistic
provision has been made.
Human Resources
The number of employees at year-end has developed as follows:
Number of employees
2019 2018
1,660 1,634
Product Development
JENSEN-GROUP does not perform fundamental research but undertakes continuous product development. These
expenses in respect of the continued operations amounted to 7.6 million euro in 2019 (6.2 million euro in 2018).
JENSEN-GROUP does not capitalize development expenses since its business reality makes it very difficult to
distinguish product enhancements from adaptations to specific circumstances, and to define the future cash
flows that will originate from these efforts. Furthermore, as the development expenses are relatively stable and
are a continuous process, JENSEN-GROUP does not capitalize these efforts but expenses them as incurred.

38 A N N U A L R E P O R T 2 0 1 9
Corporate Governance Statement
Statement on Corporate Governance
The JENSEN-GROUP NV (“the Company”) has adopted the 2009 Belgian Corporate Governance Code, which is
available on www.corporategovernancecommittee.be, as its reference Code. The Company has implemented the
Belgian Corporate Governance Code (the “Code”) since 2004, has consistently reviewed the major requirements
and evolution thereof, and regularly evaluates the degree of compliance within the JENSEN-GROUP. To the best
of our knowledge and belief and subject to the comments on exceptions as explained hereinafter, the
JENSEN-GROUP has been and remains compliant with the Code.
The Company also reviewed the new 2020 Belgian Code on Corporate Governance, which is similarly available
on www.corporategovernancecommittee.be and which has become the reference code since its entry into force
on 1 January 2020. The Company has adapted its Charters accordingly and the Board of Directors has adopted
and published the following revised documents:
y Charter of the Board of Directors, including standards of independence and requirements for Directors;
y Charter of the Nomination and Remuneration Committee;
y Charter of the Audit and Risk Committee;
y Communication Policy;
y Role and Responsibilities of the Chairperson of the Board of Directors; and
y Role and Responsibilities of the Executive Management.
The Charters can be found on our website www.jensen-group.com under the heading “Investor Relations/
Corporate Governance” and are regularly reviewed and evaluated by the Board of Directors. The Charters are
part of the day-to-day proceedings of the Company’s Board of Directors and Board Committees and have been
and remain to the best of our knowledge and belief compliant with the Code.
According to the “comply or explain” principle, the Company may deviate from the Code provided it duly
explains the reasons for such deviation, which could be linked to the Company’s nature, organization and/or size.
Based on its internal risk assessment as well as on the size of its operations, the Company has outsourced the
internal audit function to external parties and does not have an internal audit staff because:
y The JENSEN-GROUP consists of multiple smaller entities with limited turnover, which are closely monitored
by local management teams;
y The management teams are further monitored by the JENSEN-GROUP headquarters through quarterly
operational and financial reviews as well as through regular site visits by the management of the JENSEN-
GROUP headquarters;
y All the JENSEN-GROUP subsidiaries are aware of the JENSEN-GROUP policies and procedures, and the relative
size of the JENSEN-GROUP continues to allow for regular communication and face-to-face meetings with all
local management teams; and
y All the JENSEN-GROUP companies are audited by the same accounting firm and significant risk factors are
consistently reviewed in the external audit scopes of the different subsidiaries.
39A N N U A L R E P O R T 2 0 1 9
For these reasons, the Company’s Audit Committee has concluded that an in-house internal audit function would
not be an effective function. Instead, the Audit Committee develops internal audit priorities in consultation with
the external auditor and on the basis of a risk analysis and retains an independent outside audit firm for specific
internal audit projects. This approach is considered more effective than an in-house internal audit function. The
Audit Committee can outsource the internal audit activity to a locally competent internal audit service provider.
The professional qualifications and duties of the Directors to be re-appointed were not stipulated in the invitation
and notices to the next Annual Shareholders’ Meeting, given that these qualifications are already published in
several press releases and annual reports and include broad international experience, operational knowledge
and adequate financial knowledge in order to function in an audit committee or nomination and remuneration
committee.
The Company has no formal arrangement for, and therefore does not regularly assess, the interaction between
the non-executive Directors and the Executive Management. In practice, the CEO and CFO always attend Board
and Board Committee meetings, while the non-executive Directors can meet the executive managers whenever
they wish to by visiting locations or requesting a separate meeting to discuss specific topics if they feel the
need for it. In addition, the non-executive Directors also have the opportunity to meet at least once a year in the
absence of the CEO and the other executives.
The main terms and conditions of the contracts of the CEO and the other executives are approved by the Board
of Directors further to the advice of the Company’s Nomination and Remuneration Committee. The Board of
Directors may include provisions that would enable the Company to recover variable remuneration paid or
withhold the payment of variable remuneration, and specify the circumstances in which it would be appropriate
to do so, insofar as enforceable by law. The contracts contain specific provisions relating to early termination.
The information found in the Corporate Governance Charter is provided “as is” and is solely intended for
clarification purposes. The recommendations and policies found in the Charters are in addition to, and not
intended to change or interpret, any law, regulation, or the Certificate of Incorporation or Bylaws of the
Company. By adopting these Charters, attachments and possible sub-charters, the Company does not enter into
any obligation or contractual or unilateral commitments whatsoever. The Charters are intended as guidelines in
the day-to-day operations of the Company. Competences and tasks attributed to the Board of Directors are to be
seen as enabling clauses, not as mandatory rules or compelling lines of conduct.
Risk Management and Internal Control
In accordance with the provisions on corporate governance in the Law of December 17, 2008 and in the so-called
Corporate Governance Law of April 6, 2010 (hereinafter referred to as “the Law”), the Company has adopted and
implemented a risk management and internal control process.
The following description of this process is based on the Integrated Internal Control Framework and the
Enterprise Risk Management Framework as published by the Committee of Sponsoring Organizations of the
Treadway Commission (COSO).
40 A N N U A L R E P O R T 2 0 1 9
The Board of Directors supervises the proper functioning of risk management and internal control process
through the Audit Committee. The Board of Directors has delegated to the Executive Management Team the task
of implementing a risk management process and an internal control system and of reporting back to the Board
of Directors on both topics at regular intervals.
Risk management
Based on a framework model prepared by an external consultant, the JENSEN-GROUP Executive Management
Team has developed a risk map describing the financial, operational, strategic and legal risks. This risk map
was prepared for the first time in 2008 and is now reviewed on a regular basis. The map outlines both the
probability of the different risks occurring, as well as the impact of their occurrence on the results, and evaluates
measures to mitigate the risk exposure. The Executive Management Team presents the conclusions of this risk
management exercise to the Audit Committee and to the Board of Directors. The Board of Directors discusses
the significant risks and changes in risks with management on an as needed basis, but at least once a year.
The Executive Management Team discloses, on a quarterly basis, a certain number of risk areas as reported
during the quarterly review process by the reporting entities. The Executive Management Team then re-
examines those risks, formulates mitigation approaches, and looks at various ways to transfer these risks to
third parties in the areas in which a material risk exposure to the Company remains.
Internal control
Definition
Internal control is a process that is effected by the Board of Directors, management, and other personnel and
that is designed to provide reasonable assurance regarding the achievement of objectives in the following
categories: a) strategic – high-level goals, aligned with and supporting its mission; b) effectiveness and
efficiency of operations; c) reliability of financial reporting and d) compliance with laws and regulations.
Control environment
The Board of Directors and the Executive Management Team have approved and adopted the JENSEN-GROUP
Ethical Business Statement (hereinafter referred to as “the Statement”). The Statement sets forth the
JENSEN-GROUP’s mission and ethical values and describes the JENSEN-GROUP’s rules of conduct as well as the
transactions that are permissible between the JENSEN-GROUP and third parties to the extent that these
transactions are not covered by the legal provisions on conflict of interest. Implementation and application of the
Statement is mandatory for all of the companies of the JENSEN-GROUP. A review of the Statement is integrated
into every training session that is organized. The Statement is available on the corporate website
www.jensen-group.com under the heading “Investor Relations/ Corporate Governance.”
The JENSEN-GROUP also has a whistleblowing procedure that is available on its corporate website for all
stakeholders.

41A N N U A L R E P O R T 2 0 1 9
Control activities and monitoring
The JENSEN-GROUP consists of several entities which are closely monitored by local management teams. The
JENSEN-GROUP headquarters further monitors the local management teams through quarterly operational and
financial reviews. In addition, the Company’s Group Control and Reporting function reviews the different entities
on a quarterly basis.
The JENSEN-GROUP monitors its business with a view towards achieving a certain level of Return on Capital
Employed (ROCE).
The local management teams are responsible for implementing the JENSEN-GROUP Procedures and Guidelines.
Conformity with reporting requirements
All applicable IFRS accounting principles, guidelines and interpretations are incorporated in the accounting
manual, which is part of the JENSEN-GROUP Procedures and Guidelines. The JENSEN-GROUP Procedures and
Guidelines are available on the JENSEN-GROUP intranet and accessible to all local management and staff of
the JENSEN-GROUP. The accounting manual is updated on a regular basis. Additional reporting is undertaken as
requested by management and/or the Audit Committee and is, where appropriate, included in the accounting
manual.
The Financial Managers of the JENSEN-GROUP meet at regular intervals. During each such meeting, the Financial
Managers are informed of relevant changes in IFRS. Training is provided on an as needed basis to ensure a
correct implementation of such changes.
All the JENSEN-GRUP companies are converting to the same ERP system over a set timeframe. The policy has
been adopted to move all of the JENSEN-GROUP companies to the same ERP system over time. All companies
use the same software to report the financial data for consolidation purposes.
The JENSEN-GROUP management has introduced, after discussion with the Audit Committee, a set of key controls
to provide reasonable assurance about the reliability of financial reporting and of the financial statements made
available to external parties starting in 2009. Local management has implemented these key controls. The set
of key controls is reassessed from time to time and amended if necessary and compliance with key controls at
local level is checked periodically.
Financial Reviews
To ensure the accuracy of the reported data, the JENSEN-GROUP Controlling and Reporting function reviews
every quarter the financial accuracy, consistency with the budget, and deviations from the budget with related
explanations, of all data submitted for consolidation. The JENSEN-GROUP management then ensures proper
follow-up and actions on any deviations from the budget.
Operational reviews
Monitoring is performed during the quarterly Business Board Reviews, which include a financial review that
specifically focuses on major changes in P&L and balance sheet items, deviations from budgets or forecasts, and
consistency in applying IFRS rules. The internal control system is monitored on a quarterly basis.

42 A N N U A L R E P O R T 2 0 1 9
Management’s monitoring of internal controls is performed on a continuous basis. The performance of the
individual companies is measured and compared to budgets and to figures of previous years, which may identify
anomalies indicative of a control failure. Failures are promptly remedied.
For consolidation purposes, all JENSEN-GROUP companies are audited or reviewed by the same accounting firm
and significant risk factors are reviewed consistently in the external audits of the different subsidiaries. The
external auditor reports to the Audit Committee twice a year on the findings of such audits or reviews and on
significant issues.
Relevant findings by the Internal Audit (which is outsourced as described above) and/or by the Statutory Auditor
are reported to both the Audit Committee and to the management concerned. Periodic follow-up is performed to
ensure that corrective action has been taken.
All relevant financial information is presented to the Audit Committee and to the Board of Directors so as
to enable them to analyze the financial statements. Prior to external reporting, all press releases and other
financial information are subject to:
y Appropriate review and controls by JENSEN-GROUP headquarters;
y Review by the Audit Committee; and
y Approval of the Board of Directors.
The Company’s Audit Committee believes that an in-house internal audit function is not the most effective and
efficient way to perform audit work within our group. In consultation with the external auditor and on the basis
of a risk analysis, the Audit Committee has worked out an internal audit plan and retains an independent outside
audit firm for specific internal audit projects. This approach is considered more effective than an in-house
internal audit function. The Audit Committee outsources the internal audit activity to a locally competent audit
service provider.
In 2019, an internal audit was performed on proper documentation of the Internal Control System in the
JENSEN-GROUP’s European companies.
Also in 2019, an internal review was performed on the sales quotes with a view to compliance with IFRS 15,
revenue recognition.
Significant results from prior internal audit reports are regularly reviewed with respect to progress until the
related issues are fully resolved.
Information and communication
The JENSEN-GROUP Controlling provides management with transparent and reliable management information in
a form and timeframe that enables management to effectively carry out its responsibilities.

43A N N U A L R E P O R T 2 0 1 9
Every year, Group Controlling prepares a financial calendar for reporting in consultation with the Board of
Directors and the Executive Management Team. The financial calendar is designed to allow accurate and timely
reporting to external stakeholders.
In August, condensed consolidated half-year information is reported and at year-end the full Annual Report is
published. Prior to external reporting, all press releases and other financial information are subject to appropriate
controls by the JENSEN-GROUP headquarters, to a review by the Audit Committee, and require approval by the
Board of Directors.
Composition of the Board of Directors
The members of the Board of Directors are appointed by the shareholders, by a simple majority vote, during the
Annual Shareholders’ Meeting.
The Company Bylaws allow for appointment by cooptation, which is considered a transitional arrangement
whereby the Director-elect completes the mandate of the outgoing Director as opposed to taking on a new
mandate. For this reason the transition period is not considered a mandate for the purpose of the independence
rule review, where the Company looks at total years of service on the Board of Directors.
The Company´s Bylaws require the Board of Directors to have at least three, but not more than eleven,
members. Board members are elected for terms of office of no more than four years.
The Company´s Bylaws are supplemented by the Charter of the Board of Directors, which outlines and details the
Board’s role and responsibilities. This Charter is revised from time to time and includes the following four major
chapters:
1. “Functioning of the Board,” which addresses Directors’ responsibilities, number of Board and Committee
meetings, Company Secretary responsibilities, setting the agenda of Board meetings, Director compen-
sation, orientation and training, CEO evaluation, management succession, Director access to officers and
employees, and use of independent advisors.
2. “Board Structure,” which addresses size of the Board, selection of Directors, required qualifications, including
the criteria of independence, resignation from the Board and term limits.
3. “Committees of the Board,” which addresses the establishment of the Audit Committee and of the -Nomina-
tion and Remuneration Committee.
4. “Other Board practice,” which addresses Directors’ roles and responsibilities, the terms of reference of the
Board Chairman and of the Executive Management Team, interaction with institutional investors, analysts,
media, customers and members of the public at large, limitation of liability, policy to prevent insider trading
and market abuse, conflict of interest policy and code of conduct and evaluation of Board performance.
For more details, please consult our website on www.jensen-group.com under Investor Relations/Corporate
Governance.

44 A N N U A L R E P O R T 2 0 1 9
As in the past, the Company selects its Board members in a manner that allows for a balance in the profiles
of the different Directors. A balance is sought between executive and non-executive Directors, Directors
representing shareholders and independent Directors, and in respect of Directors’ professional backgrounds,
experience and gender. A majority of the members of the Board of Directors is not related to the Company’s
controlling shareholders.
The composition of the Board of Directors of the Company, the attendance records of the individual Directors,
and the remuneration packages of the individual Directors, are as follows:
Name Function Independent TermExpiry
Attendance Board meetings
Commit-tees
Attendance committees
Remunera-tion
GOBES CV1 Chairman 2020 100% 100,000
represented by Mr. Raf Decaluwé NRC 100%
SWID AG2 Director 2021 100% -
represented by Mr. Jesper Munch Jensen
TTP bvba1 Director 2021 100% AC 100% 43,500
represented by Mr. Erik Vanderhaegen
Mr. Peter Rasmussen4 Director V 2019 100% NRC 100% 42,000
YquitY bvba5 Director V 2022 100% NRC 100% 12,500
represented by Mr. Rudy Provoost
Mr. Jobst Wagner1 Director V 2023 100% NRC 100% 56,500
AC 100%
Inge Buyse1 Director V 2023 100% AC 100% 43,500
represented by Mrs. Inge Buyse
Cross Culture Research LLC3 Director 2022 100% 30,000
represented by Mrs. Anne Munch Jensen
Total 328,000
1. Non-executive director
2. Executive director, CEO, representing the reference shareholder
3. Non-executive director, representing the reference shareholder
4. Board member until November 14, 2019
5. Board member as from November 14, 2019
AC : Audit committeeNRC : Nomination and Remuneration Committee
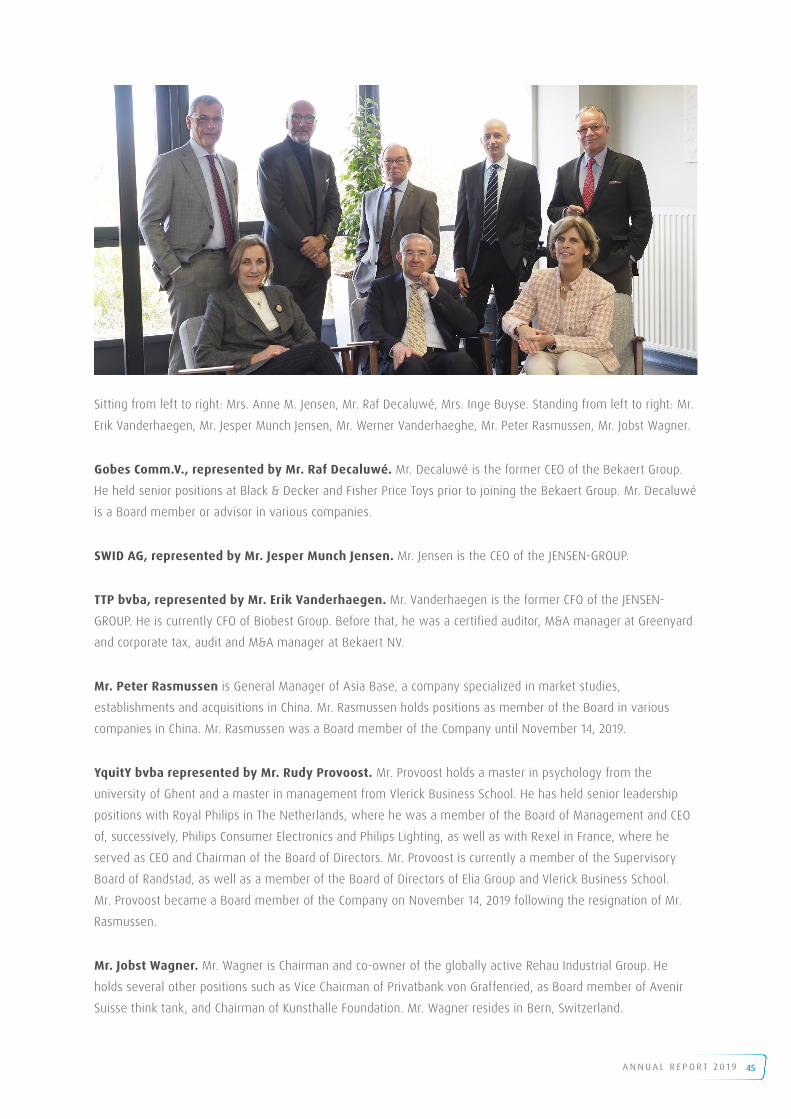
45A N N U A L R E P O R T 2 0 1 9
Sitting from left to right: Mrs. Anne M. Jensen, Mr. Raf Decaluwé, Mrs. Inge Buyse. Standing from left to right: Mr.
Erik Vanderhaegen, Mr. Jesper Munch Jensen, Mr. Werner Vanderhaeghe, Mr. Peter Rasmussen, Mr. Jobst Wagner.
Gobes Comm.V., represented by Mr. Raf Decaluwé. Mr. Decaluwé is the former CEO of the Bekaert Group.
He held senior positions at Black & Decker and Fisher Price Toys prior to joining the Bekaert Group. Mr. Decaluwé
is a Board member or advisor in various companies.
SWID AG, represented by Mr. Jesper Munch Jensen. Mr. Jensen is the CEO of the JENSEN-GROUP.
TTP bvba, represented by Mr. Erik Vanderhaegen. Mr. Vanderhaegen is the former CFO of the JENSEN-
GROUP. He is currently CFO of Biobest Group. Before that, he was a certified auditor, M&A manager at Greenyard
and corporate tax, audit and M&A manager at Bekaert NV.
Mr. Peter Rasmussen is General Manager of Asia Base, a company specialized in market studies,
establishments and acquisitions in China. Mr. Rasmussen holds positions as member of the Board in various
companies in China. Mr. Rasmussen was a Board member of the Company until November 14, 2019.
YquitY bvba represented by Mr. Rudy Provoost. Mr. Provoost holds a master in psychology from the
university of Ghent and a master in management from Vlerick Business School. He has held senior leadership
positions with Royal Philips in The Netherlands, where he was a member of the Board of Management and CEO
of, successively, Philips Consumer Electronics and Philips Lighting, as well as with Rexel in France, where he
served as CEO and Chairman of the Board of Directors. Mr. Provoost is currently a member of the Supervisory
Board of Randstad, as well as a member of the Board of Directors of Elia Group and Vlerick Business School.
Mr. Provoost became a Board member of the Company on November 14, 2019 following the resignation of Mr.
Rasmussen.
Mr. Jobst Wagner. Mr. Wagner is Chairman and co-owner of the globally active Rehau Industrial Group. He
holds several other positions such as Vice Chairman of Privatbank von Graffenried, as Board member of Avenir
Suisse think tank, and Chairman of Kunsthalle Foundation. Mr. Wagner resides in Bern, Switzerland.

46 A N N U A L R E P O R T 2 0 1 9
Inge Buyse bvba, represented by Mrs. Inge Buyse. Mrs. Buyse is CEO of AZ Groeninge. Prior to assuming
her current role she held CEO positions in Sapa, Koramic Roof Tiles and Telindus. Mrs. Buyse is also a Board
member of RealDolmen and the Flemish Symphony Orchestra.
Cross Culture Research LLC, represented by Mrs. Anne M. Jensen. Mrs. Jensen was raised in Europe
and educated in the United States, where she studied cross- cultural communication. Mrs. Jensen began her
career as a business analyst and later started her own wholesale and consulting company selling fine art for
children and specializing in hospitals. Mrs. Jensen then returned to her original field of developing and teaching
cross-cultural curricula and is currently an independent consultant offering qualitative market research with an
emphasis on identifying culturally-patterned user behavior.
Werner Vanderhaeghe bvba, represented by Werner Vanderhaeghe, Mr. Vanderhaeghe, a Senior Counsel
at the Awerian law firm in Brussels, Belgium, is the Company Secretary and acts as General Counsel of the
JENSEN-GROUP. Before that, Mr. Vanderhaeghe was a Partner at the international law firm White & Case LLP
and held General Counsel positions at the Bekaert Group and the Agfa-Gevaert Group.
The Board of Directors held five meetings in 2019. The topics of discussion at these meetings included:
y The JENSEN-GROUP overall strategy, strategic plans, organization and budgets;
y Economic and market developments;
y The JENSEN-GROUP financial structure, financial performance and external reporting;
y Convening of the Annual Meeting and Extraordinary Meeting of Shareholders;
y Investment and M&A projects;
y Shareholder value creation and shareholder return;
y Corporate governance and compliance;
y (Re-)appointment of Directors; and
y Status of internal controls and risk management.
Depending on the items on the agenda, members of the JENSEN-GROUP Executive Management Team were
invited to the meetings of the Board of Directors and of the Board Committees.
Evaluation of the Board of Directors
The Board of Directors and the Board Committees conduct from time to time a self-evaluation exercise to
determine their effective functioning. This process includes the completion by all members of a self-evaluation
questionnaire, after which the Group General Counsel or an external party summarizes the results, trends and
comments from the individual replies. The summaries focus on the contribution of the Board of Directors and
the Board Committees to the Company and specifically on areas where the Board or the Executive Management
believes the Board or its Committees could improve. The results, trends and comments are then discussed
within the Board of Directors, after which action points are derived and implemented.
In addition, informal individual assessments of the Board members are made on an ongoing basis during Board
meetings. In 2019, the Board of Directors conducted a self-evaluation exercise, the results of which will be
discussed during the Board meeting of March 2020.
47A N N U A L R E P O R T 2 0 1 9
Committees established by the Board of Directors
Nomination and Remuneration Committee
Until November 14, 2019, the Nomination and Remuneration Committee consisted of Gobes Comm.V.,
represented by Mr. Raf Decaluwé, acting as Chairman of the Committee, as well as of Mr. Jobst Wagner and
Mr. Peter Rasmussen.
Two of the three members of the Committee, including Mr. Rasmussen up to the date of his resignation,
were deemed to qualify as independent Directors. As of November 14, 2019, two of the three members of the
Committee qualify as independent Directors.
The Nomination and Remuneration Committee met four times in the course of 2019. The topics of discussion at
these meetings included:
y Recruitment of two new board members who meet the independence criteria;
y Discussion and approval of the remuneration report and the remuneration policy;
y Remuneration and the bonuses of the Executive Management Team of the JENSEN-GROUP;
y Fees of the Board of Directors;
y (Re-)election of Board members;
y Succession planning of the CEO and of the Board of Directors;
y Status of the leadership and competence program; and
y Corporate governance and compliance.
In 2019, the Nomination and Remuneration Committee conducted a self-evaluation exercise. The results of this
will be discussed, together with the proposed action points for improvement, during the Nomination and
Committee meeting of March 2020.
The Nomination and Remuneration Committee uses its Charter as its terms of reference. The Charter can be
found on our website www.jensen-group.com under the heading “Investor Relations/Corporate Governance”
and covers:
y Authority;
y Objectives;
y Composition;
y Role of the Chairperson;
y Responsibilities;
y Meetings;
y Attendance;
y Non-consensus;
y Objectivity;
y Access to members of management;
y Reporting and appraisal;
y Remuneration report;
y Performance Evaluation.
48 A N N U A L R E P O R T 2 0 1 9
Audit Committee
The Audit Committee consists of TTP bvba, represented by Mr. Erik Vanderhaegen, acting as Chairman of the
Committee, as well as of Inge Buyse bvba, represented by Mrs. Inge Buyse, and Mr. Jobst Wagner.
Two of the three members of the Committee qualify as independent Directors. The Audit Committee met four
times in the course of 2019. Two meetings were held in the presence of the external auditor PwC, represented
by Mrs. Lien Winne. Items on the agenda of these meetings included:
y Discussion of the findings of the external auditor on the financial statements as at December 31, 2018;
y Discussion of the findings of the specified procedures on the financial statements as at June 30, 2019;
y Discussion of the financial statements including non-financial information and condensed financial
statements;
y The JENSEN-GROUP financial structure;
y XBRL reporting;
y Self-assessment;
y Review of accounting treatments: new IFRS standards affecting the Company, mainly IFRS 16: Leases and
IFRIC 23: uncertain tax positions;
y Insurances;
y Corporate governance and compliance;
y Tax audit and transfer pricing;
y Risk Management and Internal Control System; and
y Internal audit plan and Internal audit findings on sales quotes focusing on revenue recognition (IFRS 15) and
on a review of compliance with the Internal Control System.
In 2018, the Audit Committee conducted a self-evaluation exercise, the results of which were discussed
during the Audit Committee meeting of February 21, 2019. The self-evaluation report concluded that the Audit
Committee rates its performance as good and effective.
The Audit Committee uses its Charter as its terms of reference. The Charter is published on our website www.
jensen-group.com under the heading “Investor Relations/Corporate Governance” and covers such items as:
y Roles and responsibilities;
y Number of meetings;
y Composition of the Audit Committee;
y Role of the Chairperson;
y Presence of the external auditor; and
y Performance evaluation.
Senior management attends each Audit Committee meeting in part, with the remainder of the meeting reserved
for an executive session with the external auditor for the Committee members only.
49A N N U A L R E P O R T 2 0 1 9
Conflicts of Interest within the Board of Directors
As required under Belgian Company Law, the members of the Board of Directors are expected to give the Board
Chairman prior notice of items on the agenda in respect of which they have a direct or an indirect conflict
of interest with the Company, either of a financial or other nature, and to refrain from participating in the
discussion and vote on those items. The Board of Directors and the Board Chairman constantly monitor potential
conflicts of interest that do not fall within the definition as set forth by Company Law. The review of a potential
conflict of interest is a standard item on the agenda of each meeting of the Board of Directors.
Two potential conflicts arose at the meeting of the Board of Directors on February 21, 2019. During this meeting,
the dividend proposal and the re-elections of Pubal Consulting LLP and Inge Buyse bvba as members of the
Board of Directors were discussed.
In case of doubt, written confirmation is sought from the Director or the senior executive involved, stating the
reasons for the absence of a conflict of interest as more broadly defined.
Policy to prevent Insider Trading
The Company has had a longstanding policy on insider trading and the prevention of improper conduct or
appearance in that regard. Following the recent introduction of new EU legislation and applicable regulations
on market abuse, the Board of Directors has revised its guidelines on the subject as set forth in a Protocol to
prevent Market Abuse.
The purpose of this Protocol is, inter alia, to inform:
y any person who possesses inside information (either as a shareholder, Director, member of the Executive
Management Team, employee, service provider or any other person by virtue of his function, duties or
employment), of (i) their legal and regulatory duties regarding the prevention of insider dealing, tipping and
the unlawful disclosure of inside information; and of (ii) the applicable sanctions;
y any person who has been identified as a Reference Shareholder, Key Manager, Person with Management
Responsibility or Key Employee of the Company of the fact that they and, by extension, their spouses,
children of age living at home and advisors, may under no circumstances trade the Company’s securities
during a closed period i.e.:
y (i) the period of sixty (60) calendar days immediately preceding the announcement of the Company’s
annual results and extending through and including 48 hours following such announcement; and
y (ii) the period of thirty (30) calendar days immediately preceding the announcement of the Company’s
half-year results and extending through and including 48 hours following such announcement;
y any person who has been identified as a Reference Shareholder, Key Manager, Person with Management
Responsibility or Key Employee of the Company of the fact that they and, by extension, their spouses,
children of age living at home and advisors, must notify the Compliance Officer of the Company and the
Belgian Regulator (i.e. the Financial Services and Market Authority or “FSMA”) of every transaction in the
Company’s securities if and when the total amount of transactions has reached or exceeds the threshold of
5,000 euro within a given calendar year.

50 A N N U A L R E P O R T 2 0 1 9
The Company requires a signed statement from all those concerned, acknowledging that they have read the
Protocol to prevent Market Abuse, that they understand its content and that they agree to comply with its
provisions.
Notwithstanding the above, all trading in the Company’s shares requires prior authorization from the Compliance
Officer. In addition, all Directors and members of the Executive Management Team are required to inform the
Compliance Officer on a quarterly basis of any trading respectively to confirm any non-trading in the Company’s
shares. Mrs. Scarlet Janssens is the Compliance Officer of JENSEN-GROUP NV. As of December 31, 2019, the
members of the Board of Directors and the Executive Management Team jointly held 19,305 shares. Next to this,
Mrs. Anne M. Jensen and Mr. Jesper Munch Jensen indirectly own shares in JENSEN-GROUP NV, see Note 8 –
Equity. No warrants are outstanding.
The Policy to prevent Insider Trading and the relevant provisions of the Protocol to prevent Market Abuse are
included in the Charter of the Board of Directors. The Charter can be found on our website www.jensen-group.
com under the heading “Investor Relations/Corporate Governance.”
Executive Management
In 2005, the Bylaws of the Company were amended so as to authorize the Board of Directors to delegate its
powers of day-to-day management to an executive committee in conformity with art. 7:104 (previously art. 524
bis) of the Belgian Company Law. The Board of Directors has not acted on that authorization to date.
In the course of 2009, an Executive Management Team was appointed. The Executive Management Team
consists of the CEO, the CFO, the Chief Sales Officer & Innovation (CSO), the Chief Operating Officer (COO) and the
Executive Director Finishing Technology. The CEO chairs the Executive Management Team meetings.
The Executive Management Team is responsible for:
y Development of the overall JENSEN-GROUP strategy;
y Introduction and implementation of an internal control framework and risk management processes, that are
in line with the nature, organization and size of the JENSEN-GROUP;
y Implementation and deployment of the Ethical Business Statement;
y Preparation of the financial statements and disclosures;
y Report of the CEO and CFO to the Board of Directors with respect to the financial situation of the JENSEN-
GROUP;
y Presentation at regular intervals to the Board of Directors of all information necessary for the Board of
Directors to carry out its duties; and
y Evaluation of the manufacturing footprint.
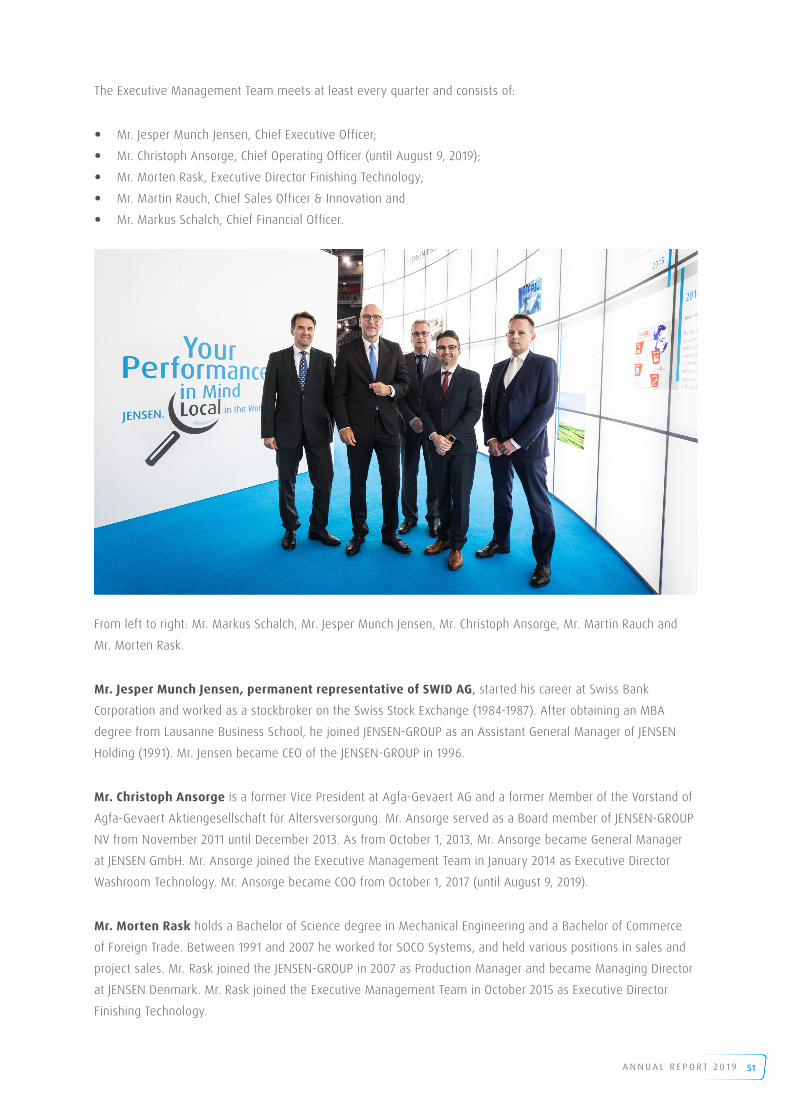
51A N N U A L R E P O R T 2 0 1 9
The Executive Management Team meets at least every quarter and consists of:
y Mr. Jesper Munch Jensen, Chief Executive Officer;
y Mr. Christoph Ansorge, Chief Operating Officer (until August 9, 2019);
y Mr. Morten Rask, Executive Director Finishing Technology;
y Mr. Martin Rauch, Chief Sales Officer & Innovation and
y Mr. Markus Schalch, Chief Financial Officer.
From left to right: Mr. Markus Schalch, Mr. Jesper Munch Jensen, Mr. Christoph Ansorge, Mr. Martin Rauch and
Mr. Morten Rask.
Mr. Jesper Munch Jensen, permanent representative of SWID AG, started his career at Swiss Bank
Corporation and worked as a stockbroker on the Swiss Stock Exchange (1984-1987). After obtaining an MBA
degree from Lausanne Business School, he joined JENSEN-GROUP as an Assistant General Manager of JENSEN
Holding (1991). Mr. Jensen became CEO of the JENSEN-GROUP in 1996.
Mr. Christoph Ansorge is a former Vice President at Agfa-Gevaert AG and a former Member of the Vorstand of
Agfa-Gevaert Aktiengesellschaft für Altersversorgung. Mr. Ansorge served as a Board member of JENSEN-GROUP
NV from November 2011 until December 2013. As from October 1, 2013, Mr. Ansorge became General Manager
at JENSEN GmbH. Mr. Ansorge joined the Executive Management Team in January 2014 as Executive Director
Washroom Technology. Mr. Ansorge became COO from October 1, 2017 (until August 9, 2019).
Mr. Morten Rask holds a Bachelor of Science degree in Mechanical Engineering and a Bachelor of Commerce
of Foreign Trade. Between 1991 and 2007 he worked for SOCO Systems, and held various positions in sales and
project sales. Mr. Rask joined the JENSEN-GROUP in 2007 as Production Manager and became Managing Director
at JENSEN Denmark. Mr. Rask joined the Executive Management Team in October 2015 as Executive Director
Finishing Technology.

52 A N N U A L R E P O R T 2 0 1 9
Mr. Martin Rauch holds a Bachelor of Science degree in Electrical Engineering. After his studies in 1989, he
joined JENSEN AG Burgdorf and held various positions in the technical and commercial areas. Mr. Rauch became
General Manager of JENSEN AG Burgdorf in 2003 and Managing Director of JENSEN SWEDEN AB following the
formation of the Garment Technology Business Unit in 2006. Mr. Rauch joined the Executive Management Team
as Director of Garment Technology that year and is, as per January 1, 2014, Executive Director of Sales and
Innovations. Mr. Rauch became CSO in 2017.
Mr. Markus Schalch holds a Master of Arts in Finance and Accounting from the Hochschule St. Gallen. He
started his career in an audit firm, where he worked for two years prior to joining the Alstom Group in various
finance positions. In 2000, Mr. Schalch joined a leading Swiss telecommunication firm where he became CFO of
Swisscom Systems Ltd. (2002-2004) and was then appointed CFO of Swisscom Solutions AG (2005 till August
2007). Mr. Schalch joined the JENSEN-GROUP in September 2007 as CFO.
Remuneration Report
The remuneration policy is intended to attract and retain the qualified and talented employees that are needed
to support the long-term development and growth of the Company.
By offering a competitive compensation package, the Company seeks to stimulate individual performance and to
align the individual interests of its employees with those of the shareholders and other stakeholders.
The Company provides information regarding its remuneration policy for one year only as variable remuneration
is part of the annual budget review process, whereby the budget is first evaluated in the context of the strategic
plan and variable compensation is based on a full payout in the year in which the compensation is earned.
To that affect, the Company’s shareholders approved and extended an exemption from the Law on Corporate
Governance of April 6, 2010 and its requirement to spread objectives and variable compensation payments over
several years.
As in the past, the Board, on recommendation of the Nomination and Remuneration Committee, will again ask
shareholders to approve an exemption from spreading payout of variable compensation over two or more years.
We believe that spreading out variable compensations has more disadvantages than advantages. In the
JENSEN-GROUP the focus is certainly on long term strategic performance, with internal milestones set to
evaluate progress and performance on an at least annual basis.
The compensation of the Board of Directors, the CEO and the Executive Management Team are reviewed by the
Nomination and Remuneration Committee and approved by the Board of Directors. The shareholders approve
the remuneration report.
The market conformity of the compensation packages of the Board of Directors and the Executive Management
Team is periodically checked with the support of external, independent advisors.

53A N N U A L R E P O R T 2 0 1 9
Remuneration of the Board of Directors
The remuneration of the non-executive Directors is based on their responsibilities and their specific tasks within
the Board of Directors. With the exception of the Board Chairman, the fees for non-executive Directors consist
of a fixed remuneration of 17,000 euro and an attendance fee of 3,000 euro per Board meeting or 1,000 euro if
the meeting is by telephone. Members of Board Committees receive a fixed fee of 7,500 euro per year and an
attendance fee of 1,500 euro per meeting. The Chairman of the Board of Directors in turn receives a fixed fee
of 100,000 euro per year, which deemed to correspond to the actual services to be rendered. Directors do not
receive any variable compensation and the CEO does not receive any compensation as a member of the Board
of Directors. The total fees paid to Board members and members of the Board Committees amounted in 2019 to
328,000 euro, which is within the amount of 350,000 euro approved by the shareholders.
In 2019, JENSEN USA bought 125,456 USD worth of components from Global Industries A/S. Mr. Rasmussen owns
51% of the shares of this Company.
Mr. Jobst Wagner owns 16,805 shares. Mrs. Anne M. Jensen and Mr. Jesper Munch Jensen indirectly own shares
in JENSEN-GROUP NV, see Note 8 – Equity.
Remuneration of the Executive Management Team
The Nomination and Remuneration Committee prepares all recommendations relating to the appointment and
the remuneration of the Executive Management Team based on proposals made by the CEO. The Committee
discusses in detail the remuneration policy, the pay levels and the individual performance evaluations of
members of the Executive Management Team. The external auditor reviews the conformity of the remuneration
paid to the Executive Management Team with the amounts proposed by the Nomination and Remuneration
Committee and approved by the Board of Directors. The remuneration report is approved by the shareholders.
The remuneration of the Executive Management Team is composed of a base salary and variable compensation
that is paid out in cash or used for pension plan contributions depending on the managers’ country of residence,
life insurance, other customary insurances and benefits. Appointments to the Board of Directors of certain
subsidiaries can also be remunerated. Executive managers are provided with all resources necessary to perform
their duties.
The variable compensation target of the Executive Management Team is in a range of 20% to 30% of the base
remuneration except for that of the CEO, whose variable compensation is targeted to amount to up to 60% of his
base remuneration. There are both a cap above and a minimum target below which no variable compensation is
paid. The variable remuneration of the CEO and the Executive Management is based on performance against the
following objectives:
y Individual, qualitative objectives for 20% to 40% of the total target amount. Qualitative objectives focus on
important projects and actions to be realized during the year;
y Quantitative objectives for 60% to 80% of the total, divided between:
y The financial results against target of the Group in terms of profitability, capital employed, specific
elements of capital employed and/or cash flow;
y The financial results against target of the unit for which the individual manager is accountable.

54 A N N U A L R E P O R T 2 0 1 9
The JENSEN-GROUP targets are defined by the Board of Directors following review and discussion in the
Nomination and Remuneration Committee. The targets are defined as part of the annual budget review process,
whereby the budget is evaluated in the context of the strategic plan.
For 2019, the JENSEN-GROUP targets were set on the basis of the operating profit and working capital as
percentage of turnover.
During the Annual Meeting of May 2014, the shareholders approved an extension of the exemption from the
Law on Corporate Governance of April 6, 2010 and in particular of its provision requiring the spread of objectives
and variable compensation payments over several years during a term of five years expiring at the Annual
Meeting of May 2019. In view of this expiry, the Nomination and Remuneration Committee in 2019 concluded,
following a reassessment, that the current system of variable compensation based on a full pay out in the year
in which the compensation is earned remains effective. The Committee therefore recommended a renewal of
the exemption with retroactive effect as of May 21, 2019, which is listed for deliberation and decision on the
agendas of the upcoming Board meeting on March 25, 2020 and of the Annual Shareholders’ Meeting on
May 19, 2020.
Where pension plans are customary, the Executive Management Team participates in such pension plans.
As set forth in the above section on Remuneration of the Board of Directors, the CEO does not receive any
compensation as a member of the Board of Directors.
Total gross salaries paid to the Executive Management Team, including the CEO, in the course of 2019 amounted
to 2,232,942 euro. The amount is composed as follows:
2019 2019 2018 2018
In euro CEO EMT, excluding CEO
CEO EMT, excluding CEO
Basic remuneration 941,848 990,982
Invoiced services 681,353 594,391
Variable remuneration 245,125 260,660 233,000 310,753
Fixed expenses 21,874 21,086
Fringe benefits 28,602 31,978
Pension plan 53,480 57,342
Total 926,478 1,306,464 827,391 1,412,141
The basic remuneration includes the salaries of the members of the Executive Management Team and
represents their total fixed compensation before local taxes and obligatory pension contributions. The basic
remuneration includes the remuneration received for appointments to the Board of Directors of certain
subsidiaries.
The CEO invoices his services through the separate company SWID AG. The amounts disclosed above consist
of the amounts, totaling 926,478 euro (827,391 euro in 2018) that SWID AG invoiced to the Company. Invoiced

55A N N U A L R E P O R T 2 0 1 9
services include basic remuneration, variable remuneration, fixed expenses, fringe benefits and pension plans.
The variable remuneration is based on performance against objectives as described above. The amount paid out
in 2019 is based on the performances of 2018. Depending on the applicable legislation and on the employee’s
preferences, the variable remuneration is paid out in cash, into the employees’ pension plan, or in the form of
other benefits.
Fixed expenses relate primarily to representation allowances.
The fringe benefits include the value of the company cars of the employees as well as the related car insurance
premiums.
The pension plan is the contribution of the employer to a pension plan above contributions required by law. One
manager participates in a defined contribution pension plan, and two managers participate in a defined benefit
plan.
As required by law, salaries of the members of the Executive Management Team are disclosed on a global
basis. The Nomination and Remuneration Committee discusses all individual salaries and checks whether
the remuneration paid is in line with market conditions. The market conformity of compensation packages is
periodically checked with the assistance of external, independent advisors. The Board of Directors approves the
remuneration amounts, and the shareholders approved the last remuneration report.
The agreements with respect to termination of senior managers vary from country to country, subject to the
locally applicable legislation. Legal regulations apply in countries where there is a legal framework, while a
severance payment of up to, but not exceeding, two years’ salary is granted for countries where there is no
legal framework. Mr. Jesper Munch Jensen has a severance pay arrangement of 18 months, which is deemed in
line with current market practice based on periodic reviews by the Nomination and Remuneration Committee of
the market conformity of the compensation packages of the Executive Management Team.
There are no change of control clauses included in the management contracts. Two managers have a two-year
non-compete clause exercisable at the request of the Company. No special compensation is given in the event
of voluntary departure.
No loans have been granted to members of the Executive Management Team. No unusual transactions or
conflicts of interest have occurred.
The Executive Management Team holds a total of 2,500 shares in the following manner:
y Mr. Jesper M. Jensen owns indirectly shares in JENSEN-GROUP NV, see Note 8 – Equity;
y Mr. Morten Rask: 1,000 shares;
y Mr. Martin Rauch: 1,500 shares;
y Mr. Markus Schalch: no shares.
No warrants are outstanding. There are no stock option plans.

56 A N N U A L R E P O R T 2 0 1 9
Policy with respect to the appropriation of the result
Based on the result of the past year and the current financial situation, the Board of Directors will propose an
appropriate dividend.
Shareholding structure
The following are the major shareholders of the Company:
JENSEN INVEST A/S: 54.4%
Lazard Frères Gestion SAS: 5.2%
Free float: 40.4%
The voting rights are described in note 8 - Equity.
Acquisition of own shares
The JENSEN-GROUP does not own any treasury shares and there is no repurchase program.
Relationships among shareholders
There is no agreement between the reference shareholders listed above.
Statutory Auditor
The Statutory Auditor is PwC Bedrijfsrevisoren, represented by Mrs. Lien Winne.
The Statutory Auditor received worldwide fees of 379,295 euro (excl. VAT) for auditing the statutory accounts
of the various legal entities, and the consolidated accounts of the JENSEN-GROUP. Apart from its mandate, the
Statutory Auditor received during 2019 additional fees of 71,007.95 euro (excl. VAT). Of this amount, 2,000 euro
was invoiced to JENSEN-GROUP NV. The JENSEN-GROUP has appointed a single audit firm for the audit of the
consolidated financial statements.
Issued capital
As at December 31, 2019, the issued share capital of the Company is 30.7 million euro, represented by 7,818,999
ordinary shares without nominal value.
There are no preference shares.
The Bylaws of the Company allow the purchase of own shares. The JENSEN-GROUP does not hold any treasury shares.
Pursuant to article 74, §6, of the Law of April 1, 2007, JENSEN INVEST A/S disclosed to both the FSMA and to
JENSEN-GROUP NV that, as at September 1, 2007, it held in concert more than 30% of the shares with voting
rights in JENSEN-GROUP NV.
Further details of the shareholders’ notification are disclosed in note 8 - equity.

57A N N U A L R E P O R T 2 0 1 9
Dividend proposal
The Board proposes to the Annual Shareholders’ meeting to approve a dividend of 1.00 euro per share. The
orders received and the financial position at the beginning of the year give management confidence that the
Group has got off to a good start in 2020. The dividend pay-out will amount to 7,818,999.00 euro, based on the
number of shares outstanding as per December 31, 2019.
Appropriation of results
JENSEN-GROUP NV reported in its statutory accounts a net profit of 8,114,242.52 euro. The Board of Directors
proposes to appropriate this result as follows:
In euro
Profit of the year 8,114,242.52Dividend 7,818,999.00Appropriation to retained earnings 295,243.52
This brings the total amount of retained earnings to 56,256,642.79 euro.
Significant post-balance sheet events
The JENSEN-GROUP expects a slow-down in activities due to the spread of Covid-19 in several countries.
A close monitoring process for orders is in place to assess the consequences of order postponements.
The JENSEN-GROUP is taking measures to guarantee the safety of its customers and its personnel and to
safeguard business continuity. In addition, the capacity needs are adapted where possible and immediate
actions to reduce our cost base are being implemented. The Group also monitors the support granted in several
countries by the respective Authorities and aligns the level of activity with restrictions imposed by Authorities.
We are unable to assess for the moment the duration of the Covid-19 crisis and therefore cannot estimate
the impact on our performance. This slow-down will have a significant impact on the revenue and on the
profitability of the Company in 2020. The JENSEN-GROUP makes every effort to ensure the maximum possible
business continuity and to continue production where possible in order to guarantee expected delivery dates.
The JENSEN-GROUP is of the opinion that there is no material impact on the financial statements as per
December 31, 2019 of the consequences of the worldwide spread of the Covid-19 virus. The Group is of the
opinion that the consequences of Covid-19 are manageable for the coming period with the knowledge as of
today.
Ghent, March 25, 2020

58 A N N U A L R E P O R T 2 0 1 9
Statement of the Responsible Persons
We hereby certify, to the best of our knowledge, that the consolidated financial statements as of December
31, 2019, prepared in accordance with International Financial Reporting Standards, as adopted by the European
Union, and with the legal requirements applicable in Belgium, give a true and fair view of the assets, liabilities,
financial position and profit or loss of the Company and the entities included in the consolidation taken as a
whole, and that the management report includes a fair review of the development and performance of the
business and the position of the Company and the entities included in the consolidation taken as a whole,
together with a description of the principal risks and uncertainties that they face.
Jesper M. Jensen Markus Schalch
Chief Executive Officer Chief Financial Officer
59A N N U A L R E P O R T 2 0 1 9
FREE TRANSLATION
STATUTORY AUDITOR’S REPORT TO THE GENERAL SHAREHOLDERS’ MEETING OF THE COMPANY JENSEN-GROUP NV
ON THE CONSOLIDATED FINANCIAL STATEMENTS FOR THE YEAR ENDED 31 DECEMBER 2019
We present to you our statutory auditor’s report in the context of our statutory audit of the consolidated financial
statements of JENSEN-GROUP NV (the “Company”) and its subsidiaries (jointly “the Group”). This report includes
our report on the consolidated financial statements, as well as the other legal and regulatory requirements. This
forms part of an integrated whole and is indivisible.
We have been appointed as statutory auditor by the general meeting d.d. 16 May 2017, following the proposal
formulated by the board of directors and following the recommendation by the audit committee. Our mandate
will expire on the date of the general meeting which will deliberate on the annual financial statements for the
year ended 31 December 2019. We have performed the statutory audit of the consolidated financial statements
of JENSEN-GROUP NV for 18 consecutive years.
Report on the consolidated financial statementsUnqualified opinion
We have performed the statutory audit of the Group’s consolidated financial statements, which comprise the
consolidated statement of financial position as at 31 December 2019, the consolidated statement of comprehensive
income, the consolidated statement of changes in equity and the consolidated cash flow statement for the year then
ended, and notes to the consolidated financial statements, including a summary of significant accounting policies
and other explanatory information, and which is characterised by a consolidated statement of financial position total
of ‘000 EUR 276,666 and a profit for the year, share of the Group, of ‘000 EUR 15,712 .
In our opinion, the consolidated financial statements give a true and fair view of the Group’s net equity and
consolidated financial position as at 31 December 2019, and of its consolidated financial performance and its
consolidated cash flows for the year then ended, in accordance with International Financial Reporting Standards
as adopted by the European Union and with the legal and regulatory requirements applicable in Belgium.
Basis for unqualified opinion
We conducted our audit in accordance with International Standards on Auditing (ISAs) as applicable in Belgium.
Furthermore, we have applied the International Standards on Auditing (ISAs) as approved by the IAASB which
are applicable to the year- end and which are not yet approved at the national level. Our responsibilities under
those standards are further described in the “Statutory auditor’s responsibilities for the audit of the consolidated
financial statements” section of our report. We have fulfilled our ethical responsibilities in accordance with the
ethical requirements that are relevant to our audit of the consolidated financial statements in Belgium, including
the requirements related to independence.
We have obtained from the board of directors and Company officials the explanations and information necessary
for performing our audit. We believe that the audit evidence we have obtained is sufficient and appropriate to
provide a basis for our opinion.

60 A N N U A L R E P O R T 2 0 1 9
Emphasis of matter - subsequent eventAs far as the outbreak of COVID-19 is concerned, we draw your attention to the significant post-balance sheet
events included in the board of directors’ report and Note 25: Events after the Balance Sheet date of the
consolidated accounts in which the board of directors expresses their view that, although the consequences
thereof may have a significant impact on the Group’s operations in 2020, such consequences do not have a
material impact on the Group’s financial position for the year ended 31 December 2019. Our opinion is not
qualified in respect of this matter.
Key audit mattersKey audit matters are those matters that, in our professional judgment, were of most significance in our audit of
the consolidated financial statements of the current period. These matters were addressed in the context of our
audit of the consolidated financial statements as a whole, and in forming our opinion thereon, and we do not
provide a separate opinion on these matters.
Key audit matter 1: revenue recognition of construction contracts
Description of the key audit matter
We focused on revenue recognition on construction contracts because JENSEN-GROUP substantially generates its
revenue from projects which qualifies as construction contracts under IFRS. The recognition of revenue and the
estimation of the outcome of fixed price construction contracts is complex and requires significant management
judgement, in particular with respect to estimation of the cost incurred and the cost to complete the contracts.
For these reasons, we identified revenue from construction contracts as a key audit matter. Reference is made
to Note 1: Summary of significant accounting policies: Revenue Recognition and Note 6 Contract assets and
liabilities . At December 31, 2019 contract assets included EUR 8.0 million of accrued profits.
How our audit addressed the key audit matter
Our testing of revenue recognition of construction contracts included both tests of the design and operating
effectiveness of controls, as well as substantive procedures. We tested the controls that the company has put
in place over its process to record contract costs and contract revenues and the determination of the stage of
completion. Our audit procedures included considering the appropriateness of the Group’s revenue recognition
accounting policies. We also included an evaluation of the significant judgements made by management based
on an examination of the associated project documentation and discussion on the status of projects under
construction with finance and technical staff of the company for specific individual transactions/projects. In
addition, in order to evaluate the reliability of management’s estimates, we performed a rundown of subsequent
costs incurred for closed projects. We also performed testing over manual journals posted to revenue to identify
unusual or irregular items. We found no material misstatements from our testing.
Key audit matter 2: recognition of warranty and take back obligation provisions
Description of the key audit matter
Significant management judgement is required to assess the provision for expected warranty claims and take
back obligations on the construction contracts. JENSEN records a provision for expected warranty claims on
products sold during the year and a provision for take back obligations on products sold to a customer for
which the customer wants to enter into a leasing contract with a Leasing Company, where a take back clause
is included in the leasing contract. Assumptions used to calculate the provision for warranty claims are based
on current sales levels and current information on warranty calls. For the provision for take back obligations,

61A N N U A L R E P O R T 2 0 1 9
JENSEN-GROUP assesses the transfer of the risks and rewards and the potential costs to take over and resell the
machines. We considered this to be a key audit matter due to the size of provisions and because the recognition
of those provisions required significant judgement from management. Reference is made to Note 11: Provision
for other liabilities and charges. The provisions for warranties and take back obligations amounted to EUR 9.4
million per December 31, 2019.
How our audit addressed the key audit matter
Our testing included both tests of the design and operating effectiveness of controls, as well as substantive
procedures. We tested the controls that the company has put in place to review the sales contracts with specific
attention to standard warranty period and take back obligations, record and monitor the ongoing and expected
claims and take back cases on products and review and compare provisions to actual costs incurred. Our
audit procedures included considering the appropriateness of the Group’s accounting policies. We challenged
management’s assumption used in determining the provision through discussions with management and
performing the following specific substantive procedure. On a sample basis we reviewed the contracts with take
back obligations and reviewed the market value of the machines based on the history of cases where JENSEN-
GROUP needed to take over the machines or similar transactions in their second hand business. For the provision for
warranty we performed a rundown of subsequent costs incurred. We also performed testing over manual journals
posted to revenue to identify unusual or irregular items. We found no material misstatements from our testing.
Responsibilities of the board of directors for the preparation of the consolidated financial statements
The board of directors is responsible for the preparation of consolidated financial statements that give a true and
fair view in accordance with International Financial Reporting Standards as adopted by the European Union and
with the legal and regulatory requirements applicable in Belgium, and for such internal control as the board of
directors determines is necessary to enable the preparation of consolidated financial statements that are free
from material misstatement, whether due to fraud or error. In preparing the consolidated financial statements,
the board of directors is responsible for assessing the Group’s ability to continue as a going concern, disclosing, as
applicable, matters related to going concern and using the going concern basis of accounting unless the board of
directors either intends to liquidate the Group or to cease operations, or has no realistic alternative but to do so.
Statutory auditor’s responsibilities for the audit of the consolidated financial statements
Our objectives are to obtain reasonable assurance about whether the consolidated financial statements as a whole
are free from material misstatement, whether due to fraud or error, and to issue an auditor’s report that includes
our opinion. Reasonable assurance is a high level of assurance, but is not a guarantee that an audit conducted in
accordance with ISAs will always detect a material misstatement when it exists. Misstatements can arise from
fraud or error and are considered material if, individually or in the aggregate, they could reasonably be expected to
influence the economic decisions of users taken on the basis of these consolidated financial statements.
In performing our audit, we comply with the legal, regulatory and normative framework applicable to the audit
of the consolidated financial statements in Belgium. A statutory audit does not provide any certainty in relation
to the group’s future viability nor the efficiency or effectiveness of the Board of Director’s current and future
business management.
62 A N N U A L R E P O R T 2 0 1 9
As part of an audit in accordance with ISAs, we exercise professional judgment and maintain professional
skepticism throughout the audit. We also:
y Identify and assess the risks of material misstatement of the consolidated financial statements, whether due
to fraud or error, design and perform audit procedures responsive to those risks, and obtain audit evidence
that is sufficient and appropriate to provide a basis for our opinion. The risk of not detecting a material
misstatement resulting from fraud is higher than for one resulting from error, as fraud may involve collusion,
forgery, intentional omissions, misrepresentations, or the override of internal control.
y Obtain an understanding of internal control relevant to the audit in order to design audit procedures that are
appropriate in the circumstances, but not for the purpose of expressing an opinion on the effectiveness of
the Group’s internal control.
y Evaluate the appropriateness of accounting policies used and the reasonableness of accounting estimates
and related disclosures made by the board of directors.
y Conclude on the appropriateness of the board of directors’ use of the going concern basis of accounting and,
based on the audit evidence obtained, whether a material uncertainty exists related to events or conditions
that may cast significant doubt on the Group’s ability to continue as a going concern. If we conclude that a
material uncertainty exists, we are required to draw attention in our statutory auditor’s report to the related
disclosures in the consolidated financial statements or, if such disclosures are inadequate, to modify our
opinion. Our conclusions are based on the audit evidence obtained up to the date of our statutory auditor’s
report. However, future events or conditions may cause the Group to cease to continue as a going concern.
y Evaluate the overall presentation, structure and content of the consolidated financial statements, including
the disclosures, and whether the consolidated financial statements represent the underlying transactions
and events in a manner that achieves fair presentation.
y Obtain sufficient and appropriate audit evidence regarding the financial information of the entities or
business activities within the Group to express an opinion on the consolidated financial statements. We are
responsible for the direction, supervision and performance of the Group audit. We remain solely responsible
for our audit opinion.
We communicate with the audit committee regarding, among other matters, the planned scope and timing of
the audit and significant audit findings, including any significant deficiencies in internal control that we identify
during our audit. We also provide the audit committee with a statement that we have complied with relevant
ethical requirements regarding independence, and to communicate with them all relationships and other matters
that may reasonably be thought to bear on our independence, and where applicable, related safeguards.
From the matters communicated with the audit committee, we determine those matters that were of most
significance in the audit of the consolidated financial statements of the current period and are therefore the
key audit matters. We describe these matters in our auditor’s report unless law or regulation precludes public
disclosure about the matter.
Other legal and regulatory requirementsResponsibilities of the board of directors
The board of directors is responsible for the preparation and the content of the directors’ report on the
consolidated financial statements, the separate report on non-financial information and the other information
included in the report on the consolidated financial statements.

63A N N U A L R E P O R T 2 0 1 9
Statutory auditor’s responsibilities
In the context of our mandate and in accordance with the Belgian standard which is complementary to the
International Standards on Auditing (ISAs) as applicable in Belgium, our responsibility is to verify, in all material
respects, the directors’ report on the consolidated financial statements, the separate report on non-financial
information and the other information included in the report on the consolidated financial statements and to
report on these matters.
Aspects related to the directors’ report on the consolidated financial statements and to the other infor-
mation included in the annual report on the consolidated financial statements
In our opinion, after having performed specific procedures in relation to the directors’ report on the consolidated
financial statements, this report is consistent with the consolidated financial statements for the year under audit,
and it is prepared in accordance with article 3:32 of the Companies’ and Associations’ Code. In the context of
our audit of the consolidated financial statements, we are also responsible for considering, in particular based
on the knowledge acquired resulting from the audit, whether the directors’ report is materially misstated or
contains information which is inadequately disclosed or otherwise misleading. In light of the procedures we
have performed, there are no material misstatements we have to report to you.
The non-financial information required by virtue of article 3:32, §2 of the Companies’ and Associations’ Code is
included in the directors’ report on the consolidated financial statements. The Company has prepared the non-
financial information, based on Global Reporting Initiative Standards. However, in accordance with article 3:80,
§1, 5° of the Companies’ and Associations’ Code, we do not express an opinion as to whether the non-financial
information has been prepared in accordance with the Global Reporting Initiative Standards as disclosed in the
consolidated financial statements.
Statement related to independence
y Our registered audit firm and our network did not provide services which are incompatible with the
statutory audit of the consolidated financial statements, and our registered audit firm remained independent
of the Group in the course of our mandate.
y The fees for additional services which are compatible with the statutory audit of the consolidated financial
statements referred to in article 3:65 of the Companies’ and Associations’ Code are correctly disclosed and
itemized in the notes to the consolidated financial statements.
Other statements
y This report is consistent with the additional report to the audit committee referred to in article 11 of the
Regulation (EU) N° 537/2014.
Ghent, 26 March 2020
The statutory auditor
PwC Reviseurs d’Entreprises SRL / PwC Bedrijfsrevisoren BV
Represented by
Lien Winne
Réviseur d’Entreprises / Bedrijfsrevisor

64 A N N U A L R E P O R T 2 0 1 9
Consolidated Statement of Financial Position
Assets
(in thousands of euro) Notes December 312019*
December 312018*
Total Non-Current Assets 62,597 40,887
Goodwill 4.1 6,861 6,867
Intangible assets 4.1 38 67
Land and buildings 11,620 9,685
Plant, machinery and equipment 6,369 7,644
Furniture and vehicles 4,068 4,071
Right of use assets 13,526 0
Other tangible fixed assets 0 0
Assets under construction and advance payments 3,698 128
Property, plant and equipment 4.2 39,283 21,528
Companies accounted for under equity method 22 7,574 7,015
Trade receivables 2,941 1,015
Other amounts receivable 814 619
Trade and other long-term receivables 7 3,755 1,634
Deferred taxes 5 5,087 3,776
Total Current Assets 214,069 214,770
Raw materials and consumables 31,843 28,145
Goods purchased for resale 17,778 15,887
Inventory 49,620 44,032
Advance payments 1,478 3,430
Trade receivables 7 69,775 80,863
Other amounts receivable 7 5,837 6,768
Contract assets 6 41,466 45,775
Derivative Financial Instruments 7, 20 79 131
Trade and other receivables 7 117,156 133,537
Cash and cash equivalents 18 45,369 33,333
Assets held for sale 21 445 437
TOTAL ASSETS 276,666 255,656
The notes on pages 72-124 are an integral part of these consolidated financial statements.

65A N N U A L R E P O R T 2 0 1 9
Consolidated Statement of Financial Position
Liabilities
(in thousands of euro) Notes December 312019
December 312018
Equity 8 132,374 125,969
Share Capital 30,710 30,710
Share Premium 5,814 5,814
Other reserves -6,776 -6,345
Retained earnings 103,501 95,990
Non-Controlling Interest 22 -874 -200
Non-Current Liabilities 49,062 36,040
Borrowings 9 31,940 21,333
Deferred income tax liabilities 5 904 789
Provisions for employee benefit obligations 10 16,194 13,715
Derivative financial instruments 20 24 204
Current Liabilities 95,230 93,647
Borrowings 9 17,792 6,646
Provisions for other liabilities and charges 11 12,597 11,540
Trade payables 12 25,255 26,895
Contract liabilities 6/12 10,360 14,463
Remuneration and social security 12 14,141 14,053
Other amounts payable 12 1,572 1,820
Accrued expenses 12 8,255 13,367
Derivative financial instruments 20 96 0
Trade and other payables 12 59,680 70,598
Current income tax liabilities 5,162 4,863
TOTAL EQUITY AND LIABILITIES 276,666 255,656
The notes on pages 72-124 are an integral part of these consolidated financial statements.

66 A N N U A L R E P O R T 2 0 1 9
Consolidated Statement of Comprehensive Income
(in thousands of euro) Notes December 312019
December 312018
Revenue 6 332,178 343,782
Trade goods -158,288 -157,719
Services and other goods -41,606 -45,949
Remuneration, social sec. costs and pensions -104,650 -106,458
Depreciation, amortisation, write downs of assets, impairments 13 -8,219 -4,887
Total expenses -312,764 -315,013
Other Income / (Expense) 14 3,602 -1,833
Operating profit before tax and finance (cost)/income (EBIT) 23,016 26,936
Interest income 998 1,420
Other financial income 1,309 1,755
Financial income 15 2,307 3,175
Interest charges -2,240 -1,867
Other financial charges -2,560 -2,644
Financial charges 15 -4,800 -4,510
Profit before tax 20,523 25,601
Income tax expense 16 -5,138 -7,562
Profit for the year from continuing operations 15,385 18,039
Result from assets held for sale 21 -118 -128
Share in result of associates and companies accounted for using the equity method -229 866
Consolidated profit for the year 15,037 18,777
Result attributable to Non-Controlling Interest 22 -675 -331
Consolidated result attributable to equity holders 15,712 19,108

67A N N U A L R E P O R T 2 0 1 9
(in thousands of euro) Notes December 312019
December 312018
Other comprehensive income (OCI):
Items that may be subsequently reclassified to Profit and Loss
Financial instruments 209 233
Currency translation differences 942 178
Items that will not be reclassified to Profit and Loss
Actual gains/(losses) on Defined Benefit Plans -2,017 1,535
Tax on OCI 452 -443
Other comprehensive income for the year -414 1,504
OCI attributable to Non-Controlling Interest 0 0
OCI attributable to the equity holders -414 1,504
Total comprehensive income for the year 14,624 20,280
Profit attributable to:
Non-Controlling Interest -675 -331
Equity holders of the company 15,712 19,108
Total comprehensive income attributable to:
Non-Controlling Interest -675 -331
Equity holders of the company 15,298 20,612
Basic and diluted earnings per share (in euro) 17 2.01 2.44
Weighted average number of shares 7,818,999 7,818,999
The notes on pages 72-124 are an integral part of these consolidated financial statements.

68 A N N U A L R E P O R T 2 0 1 9
Consolidated Statement of Changes in Equity
In thousands of euro Capital Sharepremium
Total ShareCapital
Translation differences
Hedging Reserves
Actuarialgains andlosses on
DefinedBenefit
Plans
Total other Reserves
Retained earnings
Total Non- Controlling
Interest
Total Equity
December 31, 2017 30,710 5,813 36,523 276 -334 -7,774 -7,832 84,684 113,375 131 113,506
Result of the period 0 0 0 0 0 0 0 19,108 19,108 -331 18,777
Other comprehensive income
Currency Translation Difference 0 0 0 162 0 0 162 16 178 0 178
Financial instruments 0 0 0 0 233 0 233 0 233 0 233
Defined Benefit Plans 0 0 0 0 0 1,535 1,535 0 1,535 0 1,535
Tax on OCI 0 0 0 0 -58 -384 -443 0 -443 0 -443
Total other comprehensive income/(loss) for the year, net of tax
0 0 0 162 175 -1,151 -1,478 16 1,504 0 1,504
Dividend paid out 0 0 0 0 0 0 0 -7,818 -7,818 0 -7,818
December 31, 2018 30,710 5,813 36,523 438 -159 -6,623 -6,345 95,990 126,169 -200 125,968
The notes on pages 72-124 are an integral part of these consolidated financial statements.

69A N N U A L R E P O R T 2 0 1 9
In thousands of euro Capital Sharepremium
Total ShareCapital
Translation differences
Hedging Reserves
Actuarialgains andlosses on
DefinedBenefit
Plans
Total other Reserves
Retained earnings
Total Non- Controlling
Interest
Total Equity
December 31, 2018 30,710 5,813 36,523 438 -159 -6,623 -6,345 95,990 126,169 -200 125,968
Result of the period 0 0 0 0 0 0 0 15,712 15,712 -675 15,037
Uncertain tax positions -Implementation IFRIC 23
0 0 0 0 0 0 0 -400 -400 0 -400
Other comprehensive income
Currency Translation Difference 0 1 1 924 0 0 924 17 942 0 942
Financial instruments 0 0 0 0 209 0 209 0 209 0 209
Defined Benefit Plans 0 0 0 0 0 -2,017 -2,017 0 -2,017 0 -2,017
Tax on OCI 0 0 0 0 -52 504 452 0 452 0 452
Total other comprehensive income/(loss) for the year, net of tax
0 1 1 924 157 -1.513 -431 17 -414 0 -414
Dividend paid out 0 0 0 0 0 0 0 -7,818 -7,818 0 -7,818
December 31, 2019 30,710 5,814 36,524 1,362 -2 -8,136 -6,776 103,501 133,249 -875 132,374
The notes on pages 72-124 are an integral part of these consolidated financial statements.

70 A N N U A L R E P O R T 2 0 1 9
Consolidated Cash Flow Statement
(in thousands of euro) Notes December 312019*
December 312018*
Cash flows from operating activities
Consolidated result attributable to equity holders 15,712 19,108
Result attributable to non-controlling interest 22 -675 -331
Adjusted for
- Current and deferred tax 3,943 9,271
- Interest and other financial income and expenses 2,493 1,335
- Depreciation, amortization and impairments 13, 14 7,178 6,070
- Write downs of trade receivables 13 -329 659
- Write downs of inventory 13, 14 394 280
- Changes in provisions 10, 11 1,623 -744
- Companies accounted for using equity method 22 91 -271
Interest received 15 998 1,420
Changes in working capital Increase (-), decrease (+) -382 -27.717
Changes in advance payments 6 1,952 -633
Changes in inventory -5,982
Changes in long- and short-term amounts receivable 14,589 -31,418
Changes in trade and other payables 12 -10,941 4,334
Corporate income tax paid -4,840 -10,826
Corporate income tax paid -4,840 -10,826
Net cash generated from operating activities - continuing operations 26,207 -1,747
Net cash generated from operating activities - Result from assets held for sale -8 -20
Net cash generated from operating activities - total 26,199 -1,767
Net cash used in investing activities -9,047 -5,501
Purchases of intangible and tangible fixed assets 4 -8,775 -3,123
Sales of intangible and tangible fixed assets 4 379 401
Acquisition of subsidiaries and participations (net of cash acquired) 23 -651 -2,779

71A N N U A L R E P O R T 2 0 1 9
(in thousands of euro) Notes December 312019
December 312018
Cash flow before financing 17,153 -7,268
Net cash used in financing activities -8,299 -1,531
Other financial charges and currency losses 15 -2,560 -2.644
Other financial income and currency gains 15 1,309 1,755
Dividend 8 -7.818 -7.818
Proceeds of borrowings 9 6.515 10,198
Repayments of borrowings 9 -3,506 -1,156
Interest paid 15 -2,240 -1.867
Net Change in cash and cash equivalents 8,853 -8,799
Cash, cash equivalent and bank overdrafts at the beginning of the year 27,806 36,450
Exchange gains/(losses) on cash and bank overdrafts 839 156
Cash, cash equivalent and bank overdrafts at the end of the year 18 37,499 27,806
The notes on pages 72-124 are an integral part of these consolidated financial statements.
* In view of a more transparent presentation of the Consolidated financial statements, the JENSEN-GROUP
decided to present the Goodwill and the Intangible Fixed assets separately as well as the inventory and contract
assets in the consolidated statement of financial position. Next to that, the JENSEN-GROUP has decided to
present in the consolidated cash flow statement the cash flows from the companies accounted for by the equity
method as well as the result attributable to non-controlling interests as cash generated from operating activities
as from 2019 onwards (impact -584 thousand euro). In 2018, these cash flows were included in cash flow from
financing activities and amounted to 602 thousand euro.

72 A N N U A L R E P O R T 2 0 1 9
Notes to the Consolidated Financial Statements
Note 1: Summary of significant accounting policies
Basis of Preparation
The JENSEN-GROUP (hereafter “the Group”) is one of the major suppliers to the heavy-duty laundry industry.
The Group markets its products and services under the JENSEN and ‘ALPHA by JENSEN’ brands and is one of the
leading suppliers to the heavy-duty market. The product range varies from transportation and handling systems,
tunnel washers, separators, feeders, ironers and folders to complete project management for fully-equipped and
professionally managed industrial laundries. The JENSEN-GROUP has operations in 23 countries and distributes its
products in more than 50 countries. Worldwide, the JENSEN-GROUP employs 1,660 people.
JENSEN-GROUP NV (hereafter “the Company”) is incorporated in Belgium. Its registered office is at Bijenstraat 6,
9051 Sint-Denijs-Westrem, Belgium.
The JENSEN-GROUP shares are quoted on the Euronext Stock Exchange.
The Board of Directors approved the present consolidated financial statements for issue on March 25, 2020.
These consolidated financial statements are for the 12 months ended December 31, 2019 and are prepared
in accordance with International Financial Reporting Standards (IFRS) as adopted by the European Union.
These annual financial statements have been prepared in accordance with those IFRS standards and IFRIC
interpretations issued and effective as at December 31, 2019 and which have been adopted by the European
Union.
These consolidated financial statements have been prepared under the historical cost convention with financial
assets and financial liabilities (including derivative instruments) stated at fair value through profit or loss.
These consolidated financial statements are prepared on an accrual basis and on the assumption that the Group
is a going concern and will continue in operation for the foreseeable future.
The preparation of the financial statements requires management to make estimates and assumptions that
affect the reported amounts of revenue, expenses, assets and liabilities and disclosure of contingent assets and
liabilities at the date of the financial statements. The areas involving a higher degree of judgment or complexity,
or where assumptions and estimates are significant to the consolidated financial statements, are disclosed in the
accounting policies.
The following new standards and amendments to standards are mandatory for the first time for the financial
year beginning 1 January 2019 and have been endorsed by the European Union:

73A N N U A L R E P O R T 2 0 1 9
y IFRS 16, ’Leases’ (effective 1 January 2019);
y Amendments to IFRS 9, ‘Prepayment features with negative compensation’ (effective 1 January 2019 with
the EU);
y IFRIC 23, ‘Uncertainty over income tax treatments’ (effective 1 January 2019;
y Amendments to IAS 28, ‘Long term interests in associates and joint ventures’ (effective 1 January 2019);
y Amendments to IAS 19, ‘Plan Amendment, Curtailment or Settlement’ (effective 1 January 2019);
y Annual improvements to IFRS Standards 2015-2017 cycle, applicable as of 1 January 2019 and containing the
following amendments to IFRSs:
y IFRS 3 Business combination, paragraph 42A;
y IFRS 11 Joint Arrangements, paragraph B33CA;
y IAS 12 Income Taxes, paragraph 57A;
y IAS 23 Borrowing Costs, paragraph 14.
The following new standards and amendments have been issued, but are not mandatory for the first time for
the financial year beginning 1 January 2019 and have been endorsed by the European Union:
y Amendments to References to the Conceptual Framework in IFRS Standards (effective 1 January 2020);
y Amendments to the definition of material in IAS 1 and IAS 8 (effective 1 January 2020);
y Amendments to IFRS 9, IAS 39 and IFRS 7: Interest Rate Benchmark Reform (effective 1 January 2020).
The following new standards and amendments have been issued, but are not mandatory for the first time for
the financial year beginning 1 January 2019 and have not been endorsed by the European Union:
y Amendments to the guidance of IFRS 3 Business Combinations, that revises the definition of a business
(effective 1 January 2020);
y IFRS 17 ‘Insurance contracts’ (effective 1 January 2022).
The following standard is mandatory since the financial year beginning 1 January 2016 (however not yet
subjected to EU endorsement). The European Commission has decided not to launch the endorsement process of
this interim standard but to wait for the final standard:
y IFRS 14, ‘Regulatory deferral accounts’ (effective 1 January 2016).
The Group is currently assessing the impact of these standards.
The main accounting policies defined by the Group are as follows:

74 A N N U A L R E P O R T 2 0 1 9
Consolidation Methods
The consolidated financial statements are presented in euro and rounded to the nearest thousand.
Subsidiaries are all entities (including structured entities) over which the group has control. The group controls
an entity when the group is exposed to, or has rights to, variable returns from its involvement with the entity
and has the ability to affect those returns through its power over the entity.
Subsidiaries are fully consolidated from the date on which control is transferred to the group. They are de-
consolidated from the date that control ceases.
The group applies the acquisition method to account for business combinations. The consideration transferred
for the acquisition of a subsidiary is the fair value of the assets transferred, the liabilities incurred to the former
owners of the acquiree and the equity interests issued by the group. The consideration transferred includes
the fair value of any asset or liability resulting from a contingent consideration arrangement. Identifiable
assets acquired and liabilities and contingent liabilities assumed in a business combination are measured
initially at their fair values at the acquisition date. The group recognizes any non-controlling interest in any
acquired company on an acquisition-by-acquisition basis, either at fair value or at the non-controlling interest’s
proportionate share of the recognized amounts of the acquiree’s identifiable net assets.
Acquisition-related costs are expensed as incurred.
Inter-company transactions, balances and unrealized gains on transactions between group companies are
eliminated. Unrealized losses are also eliminated. When necessary, amounts reported by subsidiaries have been
adjusted to conform with the group’s accounting policies.
Investments in associates and joint ventures are accounted for under the equity method set out in IAS28, subject
to certain exceptions. Under the equity method, the investment is initially recognized at cost, and the carrying
amount is increased or decreased to recognize the investors’ share in the profit or loss of the investee after
the date of acquisition. Associates are those investments where the investor has significant influence. A joint
venture is a joint arrangement where the investor has joint control but does not have direct rights to assets or
obligation for liabilities. For entities where the Group holds 20% or more of the voting power of another entity,
either directly or indirectly, the Group is presumed to have significant influence over that entity. The presumption
of significant influence from a 20% or more investment can be rebutted where the Group can demonstrate
that it has or does not have significant influence. Likewise, significant influence could be demonstrated for an
investment of less than 20%. The existence of a substantial or majority ownership by another entity does not
necessarily preclude the Group from having significant influence.
Use of estimates
The preparation of the financial statements involves the use of estimates and assumptions, which may have an
impact on the reported values of assets and liabilities at the end of the period as well as on certain items of
income and expense for the period. Estimates are based on economic data, which are likely to vary over time,
and are subject to a degree of uncertainty. These mainly relate to non-current assets - right to use, contracts in
progress (percentage of completion method), pension liabilities and provisions for other liabilities and charges.

75A N N U A L R E P O R T 2 0 1 9
We refer to note 4 – Non-current assets, note 6 – Contracts in progress, note 10 – provision for employee benefit
obligations and note 11 – provision for other liabilities and charges.
Translation of Foreign Currency
The conversion of assets, liabilities and commitments which are denominated in foreign currencies is based on
the following guidelines:
y monetary assets and liabilities are translated at closing rates;
y transactions in foreign currencies are converted at the foreign exchange rate prevailing at the date of the
transaction;
y Foreign exchange gains and losses resulting from the settlement of such transactions and from the
translation at year-end exchange rates of monetary assets and liabilities denominated in foreign currencies
are recognized in the income statement, except when deferred in other comprehensive income as qualifying
cash flow hedges and qualifying net investment hedges;
y non-monetary assets and liabilities are translated at the foreign exchange rate prevailing at the date of the
transaction.
Foreign currency translation - Group companies
Translation
The results and financial positions of all the Group entities (none of which has the currency of a hyperinflationary
economy) that have a functional currency different from the presentation currency are translated into the
presentation currency as follows:
y assets and liabilities for each balance sheet presented are translated at the closing rate at the date of that
balance sheet;
y income and expenses for each income statement are translated at average exchange rates (unless this
average is not a reasonable approximation of the cumulative effect of the rates prevailing on the transaction
dates, in which case income and expenses are translated at the rates of the dates of the transactions); and
y all resulting translation differences are recognized as a separate component of equity.
Initial Recognition
On consolidation, exchange differences arising from the translation of the net investment in foreign operations
and of borrowings are taken to shareholders’ equity. When a foreign operation is sold, exchange differences that
were recorded in equity are recognized in the income statement as part of the gain or loss on sale.
Goodwill and fair value adjustments arising on the acquisition of a foreign entity are treated as assets and
liabilities of the foreign entity and translated at the closing rate.

76 A N N U A L R E P O R T 2 0 1 9
Revenue Recognition
The JENSEN-GROUP has developed a five-step model for recognizing revenue from contracts with customers:
Step 1. Identifying the customer contracts
A contract creates enforceable rights and obligations. The contract may be written, oral or implied by customary
business practice. A contract contains a promise (or promises) to transfer goods or services to a customer.
When identifying the customer contracts, first the customer should be determined and then it should be
assessed whether a contract exists. JENSEN-GROUP defines a “customer” and a “contract” as follows:
y Customer: a party that has contracted to obtain goods or services that are an output of ordinary activities in
exchange for consideration;
y Contract: an agreement between two or more parties that creates enforceable rights and obligations.
Contracts shall be combined when they are entered into at or near the same time and are negotiated as
a package, payment of one depends on the other, or goods/services promised are a single performance
obligation.
A contract modification or change order is accounted for as a separate contract or as a continuation of the
original contract prospectively or with cumulative catch-up, depending on facts and circumstances.
Step 2. Identifying performance obligations
The second step in accounting for a contract with a customer is identifying the performance obligations.
Performance obligations are the unit of account for the purposes of applying the revenue standard and therefore
determine when and how revenue is recognized. A performance obligation is a promise to provide a distinct
good or service or a series of distinct goods or services, including those a customer can resell or provide to its
customers.
Step 3. Determining the transaction price
The transaction price in a contract reflects the amount of consideration to which the Company expects to be
entitled from a customer in exchange for goods or services transferred to that customer.
The transaction price includes only those amounts to which the Company is entitled under the present contract.
Step 4. Allocating the transaction price
The transaction price is allocated to the performance obligation in the contract based on relative standalone
selling prices of the goods or services being provided to the customer.
Step 5. Recognizing revenue
Revenue is recognized when (or as) the performance obligations are satisfied. Revenue is allocated to the
individual performance obligations when or as the customer obtains control over the products to be delivered or
services to be performed under the customer contract.

77A N N U A L R E P O R T 2 0 1 9
The Group has identified one performance obligation within its contracts: the installation of a heavy duty
laundry system. Revenue related to this performance obligation is recognized over time as both the JENSEN-
GROUP does not create an asset with an alternative use (not practically possible to direct or transfer the
constructed asset in its completed state to another customer as the installations are typically designed
around the specific needs and requirements of the customer) and its contracts provides the JENSEN-GROUP an
enforceable right to payment for performance completed to date. This enforceable right to payment represents
an amount that at least compensates Jensen for performance completed to date if the contract is terminated by
the customer or another party for reasons other then Jensens’ failure to perform as promised.
The JENSEN-GROUP recognizes revenue over time by measuring the progress toward complete satisfaction of
the performance obligation. The JENSEN-GROUP uses the input method (costs incurred up to the balance sheet
date as compared to the total estimated costs to incur to complete the project) recognizing the revenue based
on the Group’s effort to satisfy the performance obligation. Any costs linked to uninstalled materials or costs
incurred that relate to future activities are excluded from measuring progress towards satisfying a performance
obligation.
When the outcome of a construction contract cannot be estimated reliably, contract revenue is recognized only
to the extent of contract costs incurred that are likely to be recoverable.
When the outcome of a construction contract can be estimated reliably and it is probable that the contract
will be profitable, contract revenue is recognized over the period of the contract. When it is probable that total
contract costs will exceed total contract revenue, the expected loss is recognized as an expense immediately.
The JENSEN-GROUP presents a contract as a contract asset, excluding any amounts already received by means
of progress billings, if the Group has performed by transferring goods or services to a customer before the
customer pays consideration or before payment is due. A contract asset is an entity’s right to consideration in
exchange for goods or services that the entity has transferred to a customer.
The JENSEN-GROUP presents a contract as a contract liability when the payment is made or the payment is due
(whichever is earlier), if the customer has paid a consideration before the Group transfers a good or service to
the customer. A contract liability is an entity’s obligation to transfer goods or services to a customer for which
the entity has received consideration (or an amount of consideration is due) from the customer.
The timing of invoicing and the payment terms are discussed case by case. The billing schedule and the typical
timing of the payment does not materially differentiate from pattern of revenue recognition.
The projects generally have a lifetime of less than one year.
Royalties and rentals are recognized as income when it is probable that the economic benefits associated with
the transaction can be sufficiently measured and will flow to the Group. The income is recognized on an accrual
basis in accordance with the substance of the relevant agreement.

78 A N N U A L R E P O R T 2 0 1 9
Goodwill
On the acquisition of a new subsidiary or participation, the difference between the acquisition price and the
Group share of the identifiable assets, liabilities and contingent liabilities of the consolidated subsidiary or
participation, after adjustments to reflect fair value, is recorded in the consolidated balance sheet under assets
as goodwill. Goodwill is not amortized but tested for impairment annually, or more frequently, if events or
changes in circumstances indicate a possible impairment. Gains and losses on the disposal of an entity include
the carrying amount of goodwill relating to the entity sold. Goodwill is allocated to a cash-generating unit for
the purpose of impairment testing.
Intangible assets
Research and development expenses
Research costs are charged to the income statement in the year in which they are incurred.
The JENSEN-GROUP does not capitalize development expenses since its business reality makes it very difficult
to distinguish product enhancements from adaptations to specific circumstances, and to define the future cash
flows that will originate from these efforts. Since moreover the development expenses are relatively stable and
are a continuous process, the JENSEN-GROUP does not capitalize these efforts but expenses them as incurred.
Concessions, patents, licenses, know-how and other similar rights etc.
Investments in licenses, trademarks, etc. are capitalized from 50,000 euro upwards and amortized over 5 years.
Investments in licenses, trademarks below EUR 50,000 are deemed to be not material and are not capitalized
but are expensed as incurred.
Property, plant and equipment
Property, plant and equipment are recorded at their acquisition value or construction cost less accumulated
depreciation and impairment losses and increased, where appropriate, by ancillary costs.
The Group has broken down the cost of property plant and equipment into major components. These major
components, which are replaced at regular intervals, are depreciated over their useful lives.
Tangible fixed assets are depreciated on a straight-line basis over their estimated useful lives from the month
of acquisition onwards. If necessary, tangible fixed assets are considered as a combination of various units with
separate useful lives.
The annual depreciation rates are as follows:
Annual Depreciation rates
Buildings 3.33% 30y
Infrastructure 10% 10y
Roof 10% 10y
Installations, plant and machinery 10% – 33% 3y – 10y
Office equipment and furnishings 10% – 20% 5y – 10y
Computer 20% - 33% 3y – 5y
Vehicles 20% - 33% 3y – 5y
79A N N U A L R E P O R T 2 0 1 9
Leases where the Group is acting as a lessee – Right of use assets
The Group recognizes on the balance sheet nearly all leases reflecting the right to use an asset over the lease
term as well as the associated lease liability for payments required to be made by the lessee to the lessor over
the lease term.
The Group recognizes right-of-use assets at the commencement date of the lease (i.e., the date the underlying
asset is available for use). Right-of-use assets are measured at cost, less any accumulated depreciation and
impairment losses, and adjusted for any remeasurement of lease liabilities. The cost of right-of-use assets
includes the amount of lease liabilities recognized, initial direct costs incurred, and lease payments made at or
before the commencement date less any lease incentives received.
Unless the Group is reasonably certain to obtain ownership of the leased asset at the end of the lease term, the
recognized right-of-use assets are depreciated on a straight-line basis over the shorter of their estimated useful
life and the lease term. Right-of-use assets are subject to impairment.
Lease liabilities
At the commencement date of the lease, the Group recognizes lease liabilities measured at the present value
of lease payments to be made over the lease term. The lease payments include fixed payments (including
in-substance fixed payments) less any lease incentives receivable, variable lease payments that depend on an
index or a rate, and amounts expected to be paid under residual value guarantees. The lease payments also
include the exercise price of a purchase option reasonably certain to be exercised by the Group and payments
of penalties for terminating a lease, if the lease term reflects the Group exercising the option to terminate. The
variable lease payments that do not depend on an index or a rate are recognized as expense in the period in
which the event or condition that triggers the payment occurs.
The Group presents interest paid on its lease liabilities as financing activities in the cashflow statement. Variable
payments as well as amounts paid for short-term and low-value leases are presented in the ‘operating activities’
line.
In calculating the present value of lease payments, the Group uses the incremental borrowing rate at the
lease commencement date if the interest rate implicit in the lease is not readily determinable. After the
commencement date, the amount of lease liabilities is increased to reflect the accretion of interest and reduced
for the lease payments made. In addition, the carrying amount of lease liabilities is remeasured if there is a
modification, a change in the lease term, a change in the in-substance fixed lease payments or a change in the
intention to purchase the underlying asset.
Short-term leases and leases of low-value assets
The Group applies the short-term lease recognition exemption to its short-term leases of machinery and
equipment (i.e., those leases that have a lease term of 12 months or less from the commencement date and do
not contain a purchase option). It also applies the lease of low-value assets recognition exemption to leases of
office equipment that are considered of low value (i.e., below 5,000 euro). Lease payments on short-term leases
and leases of low-value assets are recognized as expenses on a straight-line basis over the lease term.

80 A N N U A L R E P O R T 2 0 1 9
Significant judgement in determining the lease term of contracts with renewal options
The Group determines the lease term as the non-cancellable term of the lease, together with any periods
covered by an option to extend the lease if it is reasonably certain to be exercised, or any periods covered by an
option to terminate the lease, if it is reasonably certain not to be exercised.
The Group applies judgement in evaluating whether it is reasonably certain to exercise the option to renew.
That is, it considers all relevant factors that create an economic incentive for it to exercise the renewal. After
the commencement date, the Group reassesses the lease term if there is a significant event or change in
circumstances that is within its control and affects its ability to exercise (or not to exercise) the option to renew
(e.g., a change in business strategy).
Impairment of assets
Assets other than inventories, deferred tax assets, employee benefits and derivative financial instruments
and assets arising from construction contracts are reviewed for impairment whenever events or changes in
circumstances indicate that their carrying amount may not be recoverable.
Whenever the carrying amount of an asset exceeds its recoverable amount (being the higher of its fair value
less cost to sell and its value in use), an impairment loss is recognized in the profit and loss statement. The
value in use is the present value of estimated future cash flows expected to arise from the continuing use of an
asset and from its disposal at the end of its useful life.
Recoverable amounts are estimated for individual assets or, if this is not possible, for the cash-generating unit to
which the assets belong.
Reversals of impairment losses recognized are recorded in income up to the initial amount of the impairment
loss. Goodwill is tested for impairment at least once a year. Impairment on goodwill can never be reversed at a
later date.
Financial Leases (the Group is lessee) – Applicable until December 2018
A financial lease is a lease that transfers substantially all risks and rewards incident to ownership of an asset to
the lessee. When a fixed asset is held under a financial lease, its value is recorded as an asset at the present
value, at the beginning of the lease term, of the future minimum lease payments during the lease term. Lease
payments are apportioned between the finance charge and the reduction of the outstanding liability in order to
obtain a constant rate of interest on the debt over the lease term.
Property, plant and equipment acquired under finance leases is depreciated over the shorter of the useful life of
the asset and the lease term.
Financial lease (the Group is a lessor) - Applicable until December 2018
When assets are leased out under a finance lease, the amount due from the lessee should be recognized in
the balance sheet as a receivable at an amount equal to the Group’s net investment in the lease, and the same
amount is reflected in turnover. Over the lease term, rentals are apportioned between a reduction in the net
investment in the lease and finance income. The recognition of finance income is based on a pattern reflecting

81A N N U A L R E P O R T 2 0 1 9
a constant periodic rate of return on the Group’s net investment. The net investment in the lease is the gross
investment in the lease discounted at the interest rate implicit in the lease. The gross investment in the lease is
equal to the minimum lease payments plus any unguaranteed residual accruing to the Group as lessor.
Operating lease - Applicable until December 2018
Leases in which a significant portion of the risks and rewards of ownership are retained by the lessor are
classified as operating leases. Property held under an operating lease contract are recognized on the balance
sheet as ‘assets, right-of-use’.
Inventories and contracts in progress
Inventories are valued at the lower of cost or net realizable value. Depending on the different ERP systems,
cost is determined by the first-in, first-out (FIFO) method or by the weighted average method. For produced
inventories, cost means the full cost including all direct and indirect production costs required to bring the
inventory items to the stage of completion at the balance sheet date. Net realizable value is the estimated
selling price in the ordinary course of business, less the costs of completion and variable selling expenses.
Provisions for liabilities and charges
A provision is recognized in the balance sheet when the Group has a present obligation (legal or constructive) as
a result of a past event, and when it is probable that an outflow of resources embodying economic benefits will
be required to settle the obligation and a reliable estimate can be made of the amount of the obligation.
The amount of the provision is the best estimate of the expenditure required to settle the present value of the
obligation at the balance sheet date. The provisions are discounted when the impact of the time value of money
is material.
Provisions for take-back obligations are recorded when JENSEN-GROUP sells equipment to a customer for which
the customer wants to enter into a leasing contract with a Leasing Company. In case of customer default,
the leasing company can request JENSEN-GROUP to take back the machine in certain situations (see ‘Vendor
financing, p.22). Based on historical data an appropriate percentage of the outstanding receivable is recorded
and reversed a rato of the repayment by the customer.
Employee benefits
Some of the Group’s employees are eligible for retirement benefits under defined contribution and defined
benefit plans.
The provision for employee benefit plans is based on the calculation of an external, independent actuary. The
calculation is based on the projected unit credit method.

82 A N N U A L R E P O R T 2 0 1 9
Defined contribution plans
Contributions to defined contribution plans are recognized as an expense in the income statement as incurred.
Defined benefit plans
For defined benefit plans, the amount recorded in the balance sheet is determined as the present value of the
benefit obligation less the fair value of any plan assets. All past service costs are recognized in P&L.
The actuarial gains and losses are recognized in the period in which they occur outside profit and loss, in the
consolidated statement of comprehensive income.
Deferred Taxes
Deferred income tax is provided in full, using the liability method, on temporary differences arising between
the value of assets and liabilities for tax purposes and their carrying amounts in the consolidated financial
statements. However, deferred income tax is not accounted for if it arises from initial recognition of an asset or
liability in a transaction other than a business combination that at the time of the transaction affects neither
accounting nor taxable profit or loss.
Deferred income tax is determined using tax rates (and laws) that have been enacted or substantially enacted
by the balance sheet date and are expected to apply when the related deferred income tax asset is realized or
the deferred income tax liability is settled.
Deferred income tax assets are recognized to the extent that it is probable that future taxable profit will be
available against which the temporary differences can be utilized.
Deferred income tax is provided on temporary differences arising on investments in subsidiaries and associates,
except where the timing of the reversal of the temporary difference is controlled by the Group and it is probable
that the temporary difference will not reverse in the foreseeable future.
Deferred income tax assets and liabilities are offset when there is a legally enforceable right to offset current tax
assets against current tax liabilities and when the deferred income tax assets and liabilities relate to income tax
levied by the same taxation authority on either the same taxable entity or different taxable entities where there
is an intention to settle the balances on a net basis.
Current taxes
The tax expense for the period comprises current and deferred tax. Tax is recognized in the income statement,
except to the extent that it relates to items recognized in other comprehensive income or directly in equity. In
this case, the tax is also recognized in other comprehensive income or directly in equity, respectively.
The current income tax charge is calculated on the basis of the tax laws enacted or substantively enacted at
the balance sheet date in the countries where the company and its subsidiaries operate and generate taxable
income. Management periodically evaluates positions taken in tax returns with respect to situations in which
applicable tax regulation is subject to interpretation. It establishes provisions where appropriate on the basis of
amounts expected to be paid to the tax authorities.

83A N N U A L R E P O R T 2 0 1 9
Accrued charges and deferred income
Accrued charges are costs that have been charged against income but not yet disbursed at balance sheet date.
Deferred income is revenue that will be recognized in future periods.
Financial instruments
Financial instruments are recorded at trade date. The fair value of the financial instruments is determined by
using valuation techniques. The Group uses a variety of methods and makes assumptions that are based on
market conditions existing at each balance sheet date.
Accounts and notes receivable
Trade receivables are recognized initially at fair value and subsequently measured at amortized cost using
the effective interest method, less provision for impairment. A provision for impairment of trade receivables
is established when there is objective evidence that the Group will not be able to collect all amounts due
according to the original terms of receivables. The JENSEN-GROUP applies the life time expected credit
loss model. For specific cases, significant financial difficulties of the debtor, probability that the debtor will
enter bankruptcy or financial reorganization, default or delinquency in payments as well as forward-looking
information such as economic forecasts, regulatory environment, GDP, employment, politics or other external
market indicators are considered indicators that the trade receivable is impaired. The amount of the provision
is the difference between the asset’s carrying amount and the present value of estimated future cash flows,
discounted at the effective interest rate. This policy of credit risk management is applied throughout the JENSEN-
GROUP by the individual entities based on the local historical data and forward-looking information.
The simplified approach is applied.
Cash and cash equivalent
Cash and cash equivalent includes cash in hand, deposits held at call with banks and bank overdrafts. Bank
overdrafts are shown within borrowings in current liabilities on the balance sheet.
Payables (after one year and within one year)
Amounts payable are carried at nominal value at the balance sheet date.
Derivative financial instruments
The Company uses derivative financial instruments to reduce the exposure to adverse fluctuations in interest
rates and foreign exchange rates. It is the Company’s policy not to hold derivative financial instruments for
speculative or trading purposes.
Derivative financial instruments are recognized initially at fair value. Subsequent to initial recognition, derivative
financial instruments are stated at fair value. Recognition of any resulting gain or loss depends on the nature
of the item being hedged. Derivative financial instruments that are either hedging instruments that are not
designated or do not qualify as hedges are carried at fair value, with changes in value included in the income
statement.

84 A N N U A L R E P O R T 2 0 1 9
Cash flow hedges
Where a derivative financial instrument is designated as a hedge of the variability in cash flows of a recognized
asset or liability, a firm commitment or a highly probable forecasted transaction, the effective part of any gain
or loss on the derivative financial instrument is recognized directly in other comprehensive income. When the
firm commitment or forecasted transaction results in the recognition of an asset or liability, the cumulative gain
or loss is removed from other comprehensive income and included in the initial measurement of the acquisition
cost or other carrying amount of the asset or liability.
Otherwise the cumulative gain or loss is removed from other comprehensive income and recognized in the
income statement at the same time as the hedged transaction. The ineffective part of any gain or loss is
recognized in the income statement immediately. Any gain or loss arising from changes in the time value of the
derivative financial instrument is excluded from the measurement of hedge effectiveness and is recognized in
the income statement immediately.
When a hedging instrument or hedge relationship is terminated but the hedged transaction is still expected to
occur, the cumulative gain or loss at that point remains in other comprehensive income and is recognized in
accordance with the above policy when the transaction occurs. If the hedged transaction is no longer probable,
the cumulative unrealized gain or loss recognized in other comprehensive income is recognized in the income
statement immediately.
Borrowings
Borrowings are recognized initially at fair value, net of transaction costs incurred. Borrowings are subsequently
stated at amortized cost; any difference between the proceeds (net of transaction costs) and the redemption
value is recognized in the income statement over the period of the borrowings using the effective interest
method.
Non-current assets (or disposal groups) held for sale
Non-current assets (or disposal groups) are classified as assets held for sale and stated at the lower of
carrying amount and fair value less costs to sell if their carrying amount is recovered principally through a sale
transaction rather than through a continuing use.
Consolidated statement of cash flows
The consolidated cash flow statement reports the cash flow during the period classified by analyzing the cash
flow from operating, investing and financing activities.
Business combination
On an acquisition-by-acquisition basis, the Group recognizes any non-controlling interest in the acquiree either at
fair value or at the non-controlling interest’s proportionate share of the acquiree’s net assets.
Segment reporting
The Company is operating in a single business segment: Heavy-Duty Laundry.

85A N N U A L R E P O R T 2 0 1 9
Closing date and length of accounting period
All accounting periods presented represent 12 months of operations starting on January 1 of each year.
Change in valuation rules
There are two changes in the accounting policies compared with the accounting policies used in the preparation
of the consolidated financial statements as per December 31, 2018. These changes relate to the implementation
of IFRS 16 and to the implementation of IFRIC 23:
Implementation IFRS 16
The new IFRS standard on leases, IFRS 16, is effective as from January 1, 2019. The new standard requires lessees
to recognize on the balance sheet nearly all leases reflecting the right to use an asset over the lease term as
well as the associated lease liability for payments required to be made by the lessee to the lessor over the
lease term. IFRS 16 supersedes IAS 17 Leases, IFRIC 4 Determining whether an Arrangement contains a Lease,
SIC-15 Operating Leases-Incentives and SIC-27 Evaluating the Substance of Transactions Involving the Legal Form
of a Lease.
Nature of the effect of adoption of IFRS 16
Leases where the Group is acting as a lessee under contracts that were previously classified as operating lease
contracts
The Group mainly acts as a lessee under lease contracts for buildings, vehicles and computer equipment.
The Group adopted IFRS 16 on January 1 2019, in accordance with the transitional provisions of IFRS 16, using
the modified retrospective approach. Therefore, the Group has chosen to measure the right-of-use asset at an
amount equal to the lease liability, adjusted by the amount of any prepaid or accrued lease payments relating
to these leases recognized in the balance sheet immediately before the data of initial application. Consequently,
the cumulative effect of adopting IFRS 16 was recognized as an adjustment to the opening balance of retained
earnings as at January 1 2019, with no restatement of the comparative figures.
The Group has applied the following practical expedients, as permitted by IFRS 16, on the transition date:
y No reassessment as to whether a contract is, or contains, a lease at the date of initial application. Instead,
the Group applied IFRS 16 to contracts that were previously identified as leases applying IAS 17 Leases and
IFRIC 4 Determining whether an Arrangement contains a Lease;
y The use of a single discount rate to a portfolio of leases with reasonably similar characteristics;
y Reliance on previous assessments on whether leases are onerous instead of performing an impairment
review;
y Not to recognize operating leases with a remaining lease term of less than 12 months; and
y Not to recognize a right-of-use asset and a lease liability for low-value leases (5,000 euro).
Other leases of the Group
The Group has no other major lease contracts than those recognized under the new IFRS 16 standard.

86 A N N U A L R E P O R T 2 0 1 9
Impact of IFRS 16 upon transition and as per December 31, 2019:
Implementing IFRS 16 affected the following items on the balance sheet on January 1, 2019:
Upon transition, the lease liabilities were measured at the present value of the remaining lease payments (for
buildings: intention to stay), discounting at the lessee’s incremental borrowing rate as of January 1, 2019. Our
weighted average incremental borrowing rate applied to the lease liabilities on January 1, 2019 was 2.5 %. The
leases are recognized as right-of-use assets and corresponding liabilities. The right-of-use assets are depreciated
over the asset’s useful life on a straight-line basis. The following amounts were recognized as per January 1,
2019:
Fixed assets – Right-of-use assets - Buildings: + 14.7 million euro
Fixed assets – Right-of-use assets – Other: + 1.4 million euro
Long-term lease liabilities: + 13.1 million euro
Short-term lease liabilities: + 3.0 million euro
Implementing IFRS 16 affected consolidated statement of comprehensive income for the year ending on
December 31, 2019:
The impact as per December 31, 2019 is as follows:
Impact on EBIT (Earnings before Interest and Taxes): +0.4 million euro
Impact on EBITDA (Earnings before Interest, Taxes, Depreciation and Amortization): +3.2 million euro
Impact on financial result: - 0.4 million euro
Impact on net result: 0 million euro
Change in accounting policies with effect from January 1, 2019 as a result of the adoption of IFRS 16:
Since January 1, 2019, the Group applies the following accounting policy regarding IFRS 16:
Right-of-use assets
The Group recognizes right-of-use assets at the commencement date of the lease (i.e., the date the underlying
asset is available for use). Right-of-use assets are measured at cost, less any accumulated depreciation and
impairment losses, and adjusted for any remeasurement of lease liabilities. The cost of right-of-use assets
includes the amount of lease liabilities recognized, initial direct costs incurred, and lease payments made at or
before the commencement date less any lease incentives received.
Unless the Group is reasonably certain to obtain ownership of the leased asset at the end of the lease term, the
recognized right-of-use assets are depreciated on a straight-line basis over the shorter of their estimated useful
life and the lease term. Right-of-use assets are subject to impairment.
Lease liabilities
At the commencement date of the lease, the Group recognizes lease liabilities measured at the present value
of lease payments to be made over the lease term. The lease payments include fixed payments (including
in-substance fixed payments) less any lease incentives receivable, variable lease payments that depend on an
index or a rate, and amounts expected to be paid under residual value guarantees. The lease payments also
include the exercise price of a purchase option reasonably certain to be exercised by the Group and payments
of penalties for terminating a lease, if the lease term reflects the Group exercising the option to terminate. The

87A N N U A L R E P O R T 2 0 1 9
variable lease payments that do not depend on an index or a rate are recognized as expense in the period on
which the event or condition that triggers the payment occurs.
The Group presents interest paid on its lease liabilities as financing activities in the cashflow statement. Variable
payments as well as amounts paid for short-term and low-value leases are presented in the ‘operating activities’
line.
In calculating the present value of lease payments, the Group uses the incremental borrowing rate at the
lease commencement date if the interest rate implicit in the lease is not readily determinable. After the
commencement date, the amount of lease liabilities is increased to reflect the accretion of interest and reduced
for the lease payments made. In addition, the carrying amount of lease liabilities is remeasured if there is a
modification, a change in the lease term, a change in the in-substance fixed lease payments or a change in the
intention to purchase the underlying asset.
Short-term leases and leases of low-value assets
The Group applies the short-term lease recognition exemption to its short-term leases of machinery and
equipment (i.e., those leases that have a lease term of 12 months or less from the commencement date and do
not contain a purchase option). It also applies the lease of low-value assets recognition exemption to leases of
office equipment that are considered of low value (i.e., below 5,000 euro). Lease payments on short-term leases
and leases of low-value assets are recognized as expenses on a straight-line basis over the lease term.
Significant judgement in determining the lease term of contracts with renewal options:
The Group determines the lease term as the non-cancellable term of the lease, together with any periods
covered by an option to extend the lease if it is reasonably certain to be exercised, or any periods covered by an
option to terminate the lease, if it is reasonably certain not to be exercised.
The Group applies judgement in evaluating whether it is reasonably certain to exercise the option to renew.
That is, it considers all relevant factors that create an economic incentive for it to exercise the renewal. After
the commencement date, the Group reassesses the lease term if there is a significant event or change in
circumstances that is within its control and affects its ability to exercise (or not to exercise) the option to renew
(e.g., a change in business strategy).
Implementation IFRIC 23 – Uncertain tax positions
IFRIC 23 – Uncertainty over income tax treatments is effective as from January 1, 2019. The JENSEN-GROUP used
the expected value method and estimated the uncertain tax positions and concluded to account for a provision
amounting to 0.4 million euro. The amount relates to tax-deductible expenses that might be challenged during a
possible tax audit. This provision is accounted for directly in equity.

88 A N N U A L R E P O R T 2 0 1 9
Note 2 - Scope of consolidation
The parent Company, JENSEN-GROUP NV, and all the subsidiaries that it controls are included in the consolidation.
On March 27, 2019, the JENSEN-GROUP increased its shareholding in TOLON GLOBAL MAKINA Sanyi Ve Tikaret
Sirketi A.S., Turkey, by 6.34% to 49%. As the JENSEN-GROUP only holds a 49% participation and does not control
the company, this participation is consolidated under the equity method.
On January 2, 2018, JENSEN-GROUP acquired an equity stake of 30% in Inwatec ApS (Denmark). As the JENSEN-
GROUP only holds a 30% participation and does not control the company, this participation is consolidated under
the equity method.
In 2018, JENSEN-GROUP increased its shareholding in TOLON GLOBAL MAKINA Sanyi Ve Tikaret Sirketi A.S., Turkey,
by 6.33% to 42.66% and does not control the company. This participation is consolidated by the equity method.
Note 3 - Segment reporting
The Board of Directors has examined the Group’s performance and has identified a single business segment. The
total laundry industry can be split up into Consumer, Commercial and Heavy-Duty laundry. The JENSEN-GROUP
entities serve end-customers in the Heavy-Duty laundry segment. They all follow the same process. The JENSEN-
GROUP sells its products and services under the ‘JENSEN’ and ‘ALPHA by JENSEN’ names through own sales and
service companies and independent distributors worldwide. In this way the JENSEN-GROUP operates only in a
single segment.
The following table presents revenue and certain asset information based on the Group’s geographical areas.
The basis for attributing revenues is based on the location of the customer:
Europe + CIS America Middle East, Far East and Australia TOTAL Attribtuable
to Belgium
(in thousands of euro) 2019 2018 2019 2018 2019 2018 2019 2018 2019 2018
Revenue from external customers 193,802 195,986 77,552 85,908 60,824 61,888 332,178 343,782 14,637 21,204
Other segment information
Non-current assets 44,263 31,505 3,949 1,401 9,299 4,205 57,511 37,111 96,959 97,026
Non allocated assets 219,155 218,545
Total assets 276,666 255,656
Capital expenditure -6,757 -4,696 -2,220 -215 -173 -612 -9,150 -5,523
The difference between non-current assets in the table above (57.5 million euro) and the non-current assets as
per the consolidated statement of financial position (62.6 million euro) relates to the deferred tax assets (5.1
million euro).

89A N N U A L R E P O R T 2 0 1 9
Note 4 - Non-current assets
4.1 Intangible assets
(in thousands of euro) Know how Goodwill Otherintangibles
Licenses TOTAL
Gross carrying amount January 1, 2018 343 8,896 432 830 10,501
Translation differences 0 -48 0 8 -40
Additions 0 0 0 10 10
Disposals 0 0 0 0 0
Gross carrying amount December 31, 2018 343 8,848 432 848 10,471
Translation differences 0 -6 0 0 -6
Additions 0 0 0 0 0
Disposals 0 0 0 0 0
Gross carrying amount December 31, 2019 343 8,842 432 848 10,465
Accumulated amortization, write-downs, impairments January 1, 2018
343 1,973 432 724 3,472
Additions 0 8 0 57 65
Accumulated amortization, write-downs, impairments December 31, 2018
343 1,981 432 781 3,537
Additions 0 0 0 29 29
Accumulated amortization, write-downs, impairments December 31, 2019
343 1,981 432 810 3,566
Net carrying amount December 31, 2018 0 6,867 0 67 6,934
Net carrying amount December 31, 2019 0 6,861 0 38 6,899
Know-how
The know-how relates to the technology for specific folding equipment, purchased in the acquisition of JENSEN
Italia s.r.l.
Goodwill
The goodwill arises mainly from the acquisitions of JENSEN Australia, JENSEN Austria, JENSEN Benelux, JENSEN
France, JENSEN Italia, JENSEN Norway, JENSEN Spain, JENSEN Sverige (Sweden) and JENSEN Switzerland.
JENSEN-GROUP identifies the cash flow-generating units (CGU) as being the Group. JENSEN-GROUP assists the
heavy-duty laundry industry worldwide by designing and supplying sustainable single machines as well as
systems and integrated solutions. The success of JENSEN-GROUP results from combining the global skills with
the local presence. The non-current assets of the plants are managed together and the cash flows generated by
the usage of these plants come from one group of local, regional or global customers that are approached with
same deliverable, being the optimization of the heavy duty laundry activity. Therefore the non-current assets of
the plants are allocated to one CGU for impairment testing purposes.
Goodwill is subject to a yearly impairment test that is based on a number of critical judgments, estimates
and assumptions, based on value in use and applying a discounted free cash flow approach. JENSEN-GROUP

90 A N N U A L R E P O R T 2 0 1 9
believes that its estimates are very reasonable; they are based on the past experience, external sources of
information (such as long-term growth rate and discount rate) and reflect the best estimates by management.
The recoverable amount of the goodwill is determined based on a calculation of its value in use to the cash-
generating unit to which it is allocated.
The main judgments, assumptions and estimates for the cash-generating unit are:
y The first two years of the model are based on management’s best estimate of the free cash flow outlook for
the coming years;
y For the third, fourth and fifth years of the model, cash flows are based on the previous year’s cash flows,
applying a growth rate of 2% per year;
y Cash flows beyond the first five years are extrapolated, usually with a growth rate of 2% of free cash flows;
y Projections are discounted at the weighted average cost of capital (WACC), which lies between 5% and 9%;
y This calculated enterprise value is compared to the book value.
The test includes a sensitivity analysis on key assumptions used, among them the WACC, free cash flow and
long-term growth percentage: the occurrence of any of the following individual less favorable assumptions
would not lead to an impairment of goodwill: WACC of 10%, free cash flow of 95% of the projections of free
cash flows used for the calculation of the impairment test and a long-term growth of 1%. JENSEN-GROUP has
completed its annual impairment test on goodwill and concluded from this that no impairment allowance is
necessary.
Although JENSEN-GROUP believes that its judgments, assumptions and estimates are appropriate, actual results
may differ from these estimates under different assumptions or conditions.
Licenses
The licenses relate to the capitalization of the license costs of the ERP system and for other IT tools.
Development costs of 7.6 million euro (6.2 million euro in 2018) were expensed during the year. These costs
are accounted for in the lines ‘services and other goods’, ‘employee compensations and benefit expense’ and
‘depreciation, amortization, write-down of assets’.

91A N N U A L R E P O R T 2 0 1 9
4.2. Property, plant & equipment
(in thousands of euro) Land & Buildings
Plant, machinery
and equipment
Furniture and
vehicules
Right to use assets
Other tangible
assets
Assets under
construction
TOTAL
Gross carrying amount January 1, 2018
30,164 28,010 11,086 36 410 69,706
Translation differences 293 2 16 0 1 -1 312
Additions 357 683 2.008 0 0 65 3,113
Disposals 0 -280 -1,142 0 -4 0 -1,427
Transfers 0 179 167 0 0 -346 0
Gross carrying amount December 31, 2018
30,813 28,594 12,135 0 33 128 71,704
Translation differences 138 95 66 -5 0 14 308
Entry in the consolidation 16,396 16,396
Additions 2,687 523 1,663 257 0 3,644 8,775
Disposals 0 -193 -777 -320 -30 0 -1,320
Transfers 2 221 -136 0 0 -87 0
Gross carrying amount December 31, 2019
33,640 29,241 12,951 16,328 3 3,698 95,863
Accumulated depreciation, write down and impairment January 1, 2018
18,939 19,148 7,328 0 36 0 45,451
Translation differences 149 18 24 0 -4 0 186
Depreciation 2,040 2,010 1,512 0 1 0 5,563
Disposals 0 -172 -854 0 0 0 -1,026
Transfers 0 -54 54 0 0 0 0
Accumulated depreciation, write down and impairment December 31, 2018
21,128 20,950 8,065 0 33 0 50,175
Translation differences 93 52 50 4 -1 0 198
Depreciation 799 1,818 1,684 2,847 1 0 7,150
Disposals 0 -123 -740 -49 -30 0 -941
Transfers 0 175 -176 0 -1
Accumulated depreciation, write down and impairment December 31, 2019
22,020 22,872 8,883 2,802 3 0 56,580
Net carrying amount December 31, 2018
9,686 7,645 4,071 0 0 128 21,529
Net carrying amount December 31, 2019
11,620 6,369 4,068 13,526 0 3,698 39,282
During 2019, the net carrying amount of tangible fixed assets increased by 17.8 million euro. Of this increase,
13.5 million euro is related to IFRS 16, the new standard that requires lessees to recognize nearly all leases on
the balance sheet reflecting the right to use an asset over the lease term. We refer to note 1, valuation rules for
more details.
The investments in 2019 related mainly to repairs to the building in JENSEN USA after the impact of the hurricane
Michael, extension of the building in Sweden, purchase and extension of the Inwatec building, and equipment
and vehicles.

92 A N N U A L R E P O R T 2 0 1 9
The investments in 2018 related mainly to equipment and vehicles.
The net book value of the property, plant and equipment pledged as security for liabilities amounts to 6.8
million euro (4.6 million euro at December 2018).
Note 5 - Deferred taxes
Deferred tax assets and liabilities are attributable to the following items:
(in thousands of euro) December 31, 2017
Charged/credited to the income
statement
Charged/credited to
equity
Exchange differences
December 31, 2018
December 31, 2018 Deferred
Tax Assets
December 31, 2018 Deferred Tax Liabilities
Inventories 122 -1,388 0 0 -1,266 -1,616 350
Fixed assets 457 6 0 0 463 594 -131
Provisions 4,758 -278 -384 0 4.096 4.327 -231
Tax losses 156 70 0 0 226 122 104
Deferred taxes on differences between tax and local books
-135 111 0 236 212 355 -143
Currency result in permanent financing
-657 -81 -738 -738
Financial instruments -5 57 -58 0 -6 -6 0
Total deferred tax assets (net) 4,696 -1,503 -442 236 2,987 3,776 -789
(in thousands of euro) December 31, 2018
Charged/credited to the income
statement
Charged/credited to
equity
Exchange differences
December 31, 2019
December 31, 2019 Deferred
Tax Assets
December 31, 2019 Deferred Tax Liabilities
Inventories -1,266 685 0 0 -581 -272 -309
Fixed assets 463 -30 0 0 433 263 170
Provisions 4,096 -86 504 0 4,514 4,559 -45
Tax losses 226 -103 0 0 123 117 6
Deferred taxes on differences between tax and local books
212 -20 0 251 443 398 45
Currency result in permanent financing
-738 -34 -772 -772
Financial instruments -6 80 -52 0 22 22
Total deferred tax assets (net) 2,987 492 452 251 4,182 5,087 -905
The split between long-term and short-term deferred taxes is as follows:
(in thousands of euro) Deferred taxes
Long-term 3,292
Short-term 891
Total Deferred Tax Assets 4,182

93A N N U A L R E P O R T 2 0 1 9
The deferred tax assets originate mainly from JENSEN USA (1.0 million euro), JENSEN Italia (0.4 million euro),
JENSEN AG Burgdorf (0.7 million euro) and JENSEN GmbH (1.7 million euro).
Deferred tax assets have been recorded because management and the Board are convinced that, in accordance
with the Company’s valuation rules, the assets can be realized within a reasonable time frame.
The increase relates in particular to the deferred tax assets recognized on the timing differences related to the
employee benefit obligations. The employee benefit obligations increased as a result of lower discount rates. We
refer to note 10 for more details.
Note 6 - Contracts assets and contract liabilities
(in thousands of euro) December 31, 2019 December 31, 2018
Contract revenue 332,178 343,782
Contract assets 41,466 45,775
Contract liabilities 10,360 14,463
The above contract assets represent The Group’s right to consideration in exchange for goods or services that it
has transferred to a customer. Amounts could however not already be invoiced as the right to consideration is
not yet unconditional because additional obligations remain to be delivered to the customer.
Construction contracts are valued based on the percentage of completion method. At December 31, 2019
contract assets included 8.0 million euro of accrued profit (12.4 million euro at December 31, 2018).
The revenue is related to sales contracts. The payment conditions are negotiated per sales contract individually.
The billing schedule and the typical timing of the payment do not materially differ from the pattern of revenue
recognition. The aim is that the payments reflect the timing of the satisfaction of the performance obligation.
We have 20.1 million euro of outstanding performance obligations resulting from current contracts (27.6 million
euro at December 31, 2018). There are performance obligations for contracts that will be completed till 2024.
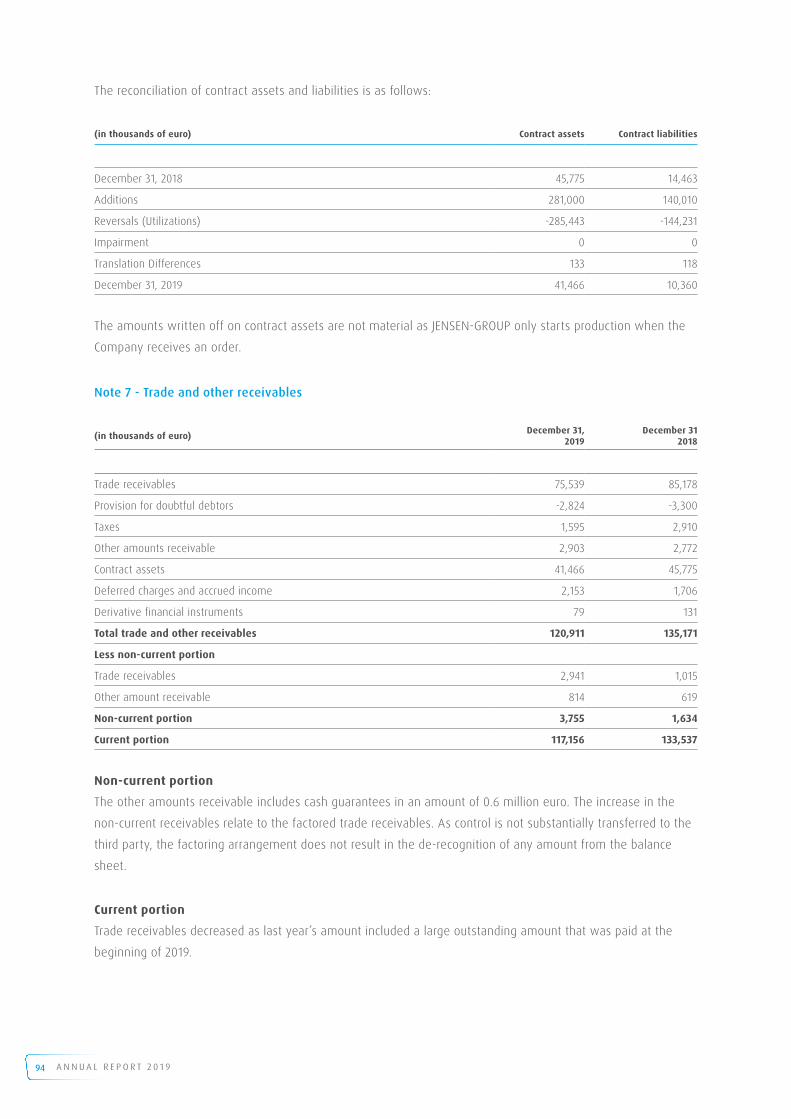
94 A N N U A L R E P O R T 2 0 1 9
The reconciliation of contract assets and liabilities is as follows:
(in thousands of euro) Contract assets Contract liabilities
December 31, 2018 45,775 14,463
Additions 281,000 140,010
Reversals (Utilizations) -285,443 -144,231
Impairment 0 0
Translation Differences 133 118
December 31, 2019 41,466 10,360
The amounts written off on contract assets are not material as JENSEN-GROUP only starts production when the
Company receives an order.
Note 7 - Trade and other receivables
(in thousands of euro) December 31, 2019
December 312018
Trade receivables 75,539 85,178
Provision for doubtful debtors -2,824 -3,300
Taxes 1,595 2,910
Other amounts receivable 2,903 2,772
Contract assets 41,466 45,775
Deferred charges and accrued income 2,153 1,706
Derivative financial instruments 79 131
Total trade and other receivables 120,911 135,171
Less non-current portion
Trade receivables 2,941 1,015
Other amount receivable 814 619
Non-current portion 3,755 1,634
Current portion 117,156 133,537
Non-current portion
The other amounts receivable includes cash guarantees in an amount of 0.6 million euro. The increase in the
non-current receivables relate to the factored trade receivables. As control is not substantially transferred to the
third party, the factoring arrangement does not result in the de-recognition of any amount from the balance
sheet.
Current portion
Trade receivables decreased as last year’s amount included a large outstanding amount that was paid at the
beginning of 2019.

95A N N U A L R E P O R T 2 0 1 9
Advances received from customers, mainly on project activities, are recognized in “Contract liabilities” in
accordance with the accounting principle whereby receivables and payables may not be netted against each
other.
Note 8 – Equity
Issued capital
As at December 31, 2019, the issued share capital was 30.7 million euro, represented by 7,818,999 ordinary
shares without nominal value. There were no preference shares. All shares are fully paid.
As at December 31, 2018, the issued share capital was 30.7 million euro, represented by 7,818,999 ordinary
shares without nominal value. There are no preference shares. All shares are fully paid.
Detailed information on the capital statement as per December 31, 2019 and 2018 is set out below.
CAPITAL STATEMENT (position as at December 31, 2019) Amounts(in thousands of euro) Number of shares
A. Capital
1. Issued capital
- At the end of the previous year 30,710
- Changes during the year 0
- At the end of this year 30,710
2. Capital representation
2 1. Shares without nominal value 30,710 7,818,999
2 2. Registered or bearer shares
- Registered 4,319,987
- Dematerialized 3,499,012
B. Own shares held by
- the company or one of its subsidiaries 0 0
C. Commitments to issue shares
1. As a result of the exercise of CONVERSION RIGHTS 0 0
2. As a result of the exercise of WARRANTS 0 0
D. Authorized capital not issued 30,710

96 A N N U A L R E P O R T 2 0 1 9
The following notifications have been received of holdings in the company’s share capital:
JENSEN Invest A/S, JF Tenura ApS, the heirs of Mr. Jørn M. Jensen, Mr. Jesper M. Jensen, The Jørn M.
Jensen and Lise M. Jensen Family Trust, Mrs. Anne M. Jensen and Mrs. Karine Munk Finser
JENSEN INVEST A/S, Ejnar Jensen Vej 1, 3700 Rønne, Denmark
Number of shares Total shares %
- Number of shares 4,253,781 7,818,999 54.40%
- Voting rights 4,253,781 7,818,999 54.40%
The chain of control is as follows: 54% of the shares in JENSEN-GROUP NV are held by JENSEN Invest A/S and
0.03% by the heirs of Mr. Jørn M. Jensen. JF Tenura Aps holds 100% of the shares in Jensen Invest A/S. SWID
AG, represented by Mr. Jesper M. Jensen holds and controls 51% of the shares in JF Tenura Aps. The other 49%
of the shares in JF Tenura Aps are held by Mrs Anne Munch Jensen and Mrs Karine Munk Finser as the ultimate
beneficial owners of the Jørn Munch Jensen and Lise Munch Jensen Family Trust.
Lazard Frères Gestion SAS
25, rue de Courcelles 75008 PARIS France
Number of shares Total shares %
- Number of shares 403,429 7,818,999 5.16%
- Voting rights 403,429 7,818,999 5.16%
The chain of control is as follows: Compagnie Financière Lazard Frères SAS controls Lazard Frères Gestion SAS,
Lazard Group LLC controls Compagnie Financière Lazard Frères SAS, Lazard Ltd controls Lazard Group LLC. Lazard
Frères Gestion SAS acts independently from Compagnie Financière Lazard Frères, Lazard Group LLC, Lazard Ltd
and from the rest of the Lazard Group, including Lazard Asset Management, a Company under American law.
CAPITAL STATEMENT (position as at December 31, 2018) Amounts(in thousands of euro) Number of shares
A. Capital
1. Issued capital
- At the end of the previous year 30,710
- Changes during the year 0
- At the end of this year 30,710
2. Capital representation
2 1. Shares without nominal value 30,710 7,818,999
2 2. Registered or bearer shares
- Registered 4,214.009
- Dematerialized 3,604,990

97A N N U A L R E P O R T 2 0 1 9
B. Own shares held by
- the company or one of its subsidiaries 0 0
C. Commitments to issue shares
1. As a result of the exercise of CONVERSION RIGHTS 0 0
2. As a result of the exercise of WARRANTS 0 0
D. Authorized capital not issued 30,710
The following declarations have been received of holdings in the company’s share capital:
JENSEN Invest A/S, JF Tenura ApS, the heirs of Mr. Jørn M. Jensen, Mr. Jesper M. Jensen, The Jørn M.
Jensen and Lise M. Jensen Family Trust, Mrs. Anne M. Jensen and Mrs. Karine Munk Finser
JENSEN INVEST A/S, Ejnar Jensen Vej 1, 3700 Rønne, Denmark
Number of shares Total shares %
- Number of shares 4,153,781 7,818,999 53.12%
- Voting rights 4,153,781 7,818,999 53.12%
The chain of control is as follows: 53% of the shares in JENSEN-GROUP are held by JENSEN Invest A/S and
0.02% by the heirs of Mr. Jørn M. Jensen. JF Tenura Aps holds 100% of the shares in Jensen Invest A/S. SWID
AG, represented by Mr. Jesper M. Jensen holds and controls 51% of the shares in JF Tenura Aps. The other 49%
of the shares in JF Tenura Aps are held by Mrs Anne Munch Jensen and Mrs Karine Munk Finser as the ultimate
beneficial owners of the Jørn Munch Jensen and Lise Munch Jensen Family Trust.
Lazard Frères Gestion SAS
25, rue de Courcelles 75008 PARIS France
Number of shares Total shares %
- Number of shares 403,429 7,818,999 5.16%
- Voting rights 403,429 7,818,999 5.16%
The chain of control is as follows: Compagnie Financière Lazard Frères SAS controls Lazard Frères Gestion SAS,
Lazard Group LLC controls Compagnie Financière Lazard Frères SAS, Lazard Ltd controls Lazard Group LLC. Lazard
Frères Gestion SAS acts independently from Compagnie Financière Lazard Frères, Lazard Group LLC, Lazard Ltd
and from the rest of the Lazard Group, including Lazard Asset Management, a Company under American law.
Each share has one vote. The voting rights are in line with the Companies’ and Associations’ Code. The articles
of association do not include other regulations with respect to voting rights.
The regulations with respect to transfer of shares are in line with the Companies’ and Associations’ Code. The
articles of association do not include other regulations with respect to transfer of shares.
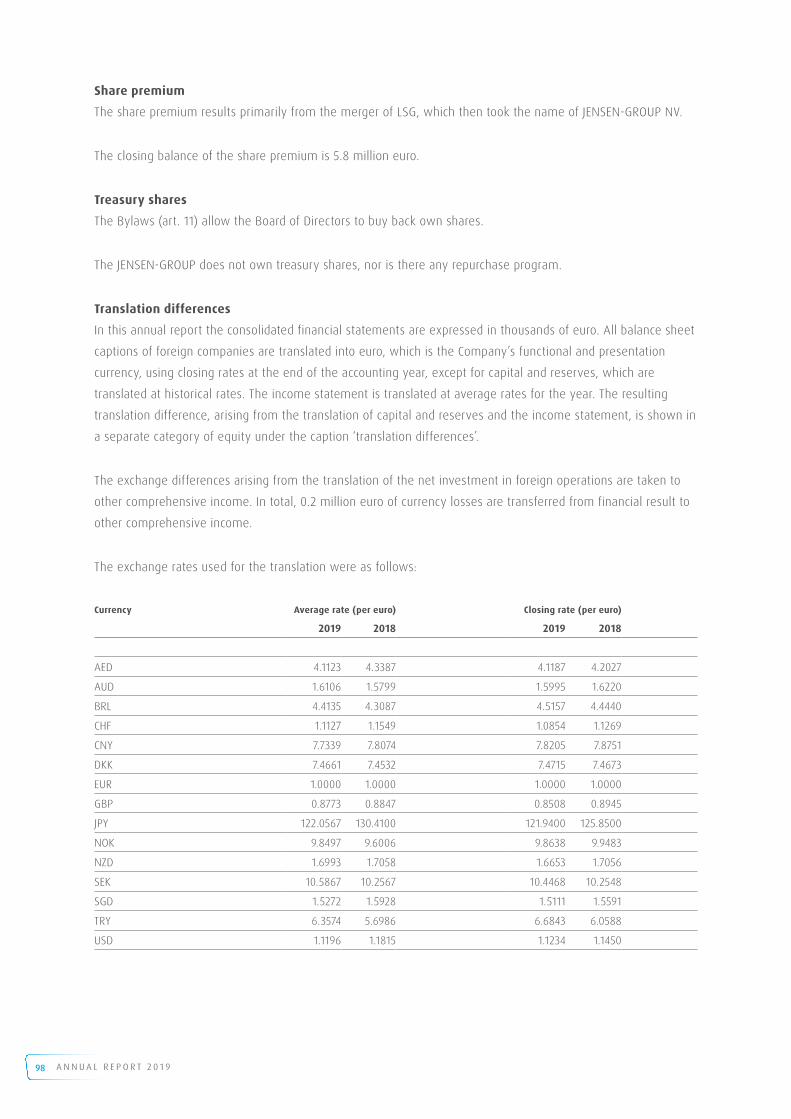
98 A N N U A L R E P O R T 2 0 1 9
Share premium
The share premium results primarily from the merger of LSG, which then took the name of JENSEN-GROUP NV.
The closing balance of the share premium is 5.8 million euro.
Treasury shares
The Bylaws (art. 11) allow the Board of Directors to buy back own shares.
The JENSEN-GROUP does not own treasury shares, nor is there any repurchase program.
Translation differences
In this annual report the consolidated financial statements are expressed in thousands of euro. All balance sheet
captions of foreign companies are translated into euro, which is the Company’s functional and presentation
currency, using closing rates at the end of the accounting year, except for capital and reserves, which are
translated at historical rates. The income statement is translated at average rates for the year. The resulting
translation difference, arising from the translation of capital and reserves and the income statement, is shown in
a separate category of equity under the caption ‘translation differences’.
The exchange differences arising from the translation of the net investment in foreign operations are taken to
other comprehensive income. In total, 0.2 million euro of currency losses are transferred from financial result to
other comprehensive income.
The exchange rates used for the translation were as follows:
Currency Average rate (per euro) Closing rate (per euro)
2019 2018 2019 2018
AED 4.1123 4.3387 4.1187 4.2027
AUD 1.6106 1.5799 1.5995 1.6220
BRL 4.4135 4.3087 4.5157 4.4440
CHF 1.1127 1.1549 1.0854 1.1269
CNY 7.7339 7.8074 7.8205 7.8751
DKK 7.4661 7.4532 7.4715 7.4673
EUR 1.0000 1.0000 1.0000 1.0000
GBP 0.8773 0.8847 0.8508 0.8945
JPY 122.0567 130.4100 121.9400 125.8500
NOK 9.8497 9.6006 9.8638 9.9483
NZD 1.6993 1.7058 1.6653 1.7056
SEK 10.5867 10.2567 10.4468 10.2548
SGD 1.5272 1.5928 1.5111 1.5591
TRY 6.3574 5.6986 6.6843 6.0588
USD 1.1196 1.1815 1.1234 1.1450
99A N N U A L R E P O R T 2 0 1 9
Hedging reserves
The Group designates foreign exchange contracts and interest rate swaps as ‘cash flow hedges’ of its foreign
currency and interest exposure. Any change in fair value of the hedging instrument and the hedged item
(attributable to the hedged risk), as of inception of the hedge, is deferred in OCI if the hedge is deemed
effective (note 20).
At year-end, an amount of 0.002 million euro was deferred in equity.
Gains and losses recognized in the hedging reserve in OCI (Other Comprehensive Income) on forward foreign
exchange contracts as of December 31, 2019 will be released to the income statement at various dates between
one and six months.
Gains and losses recognized in the hedging reserve in equity on interest rate swap contracts as of December 31,
2019 will be continuously released to the income statement until the repayment of the bank borrowings.
Actuarial gains and losses on Defined Benefit Plans
JENSEN-GROUP has four defined benefit plans. In line with prior years, the Group adopted the amended IAS 19
‘Employee Benefits’ and to recognize all actuarial gains and losses directly in OCI. The accumulated loss of the
four plans amounts to 8.1 million euro.
Dividend
The Board proposes to the Annual Shareholders’ meeting to approve a dividend of 1.00 euro per share. The
orders received and the financial position at the beginning of the year give management confidence that the
Group has got off to a good start in 2020. The dividend pay-out will amount to 7,818,999.00 euro, based on the
number of shares as per December 31, 2019.
The Shareholders decided at the Annual Meeting of May 2019, to distribute a dividend of 1.00 euro per share on
the results of 2018, amounting to 7,818,999.00 euro.
Capital risk management
JENSEN-GROUP’s objectives when managing capital are to safeguard the Group’s ability to continue as a going
concern in order to provide returns for shareholders and benefits for other stakeholders and to maintain an
optimal structure to minimize the cost of capital.
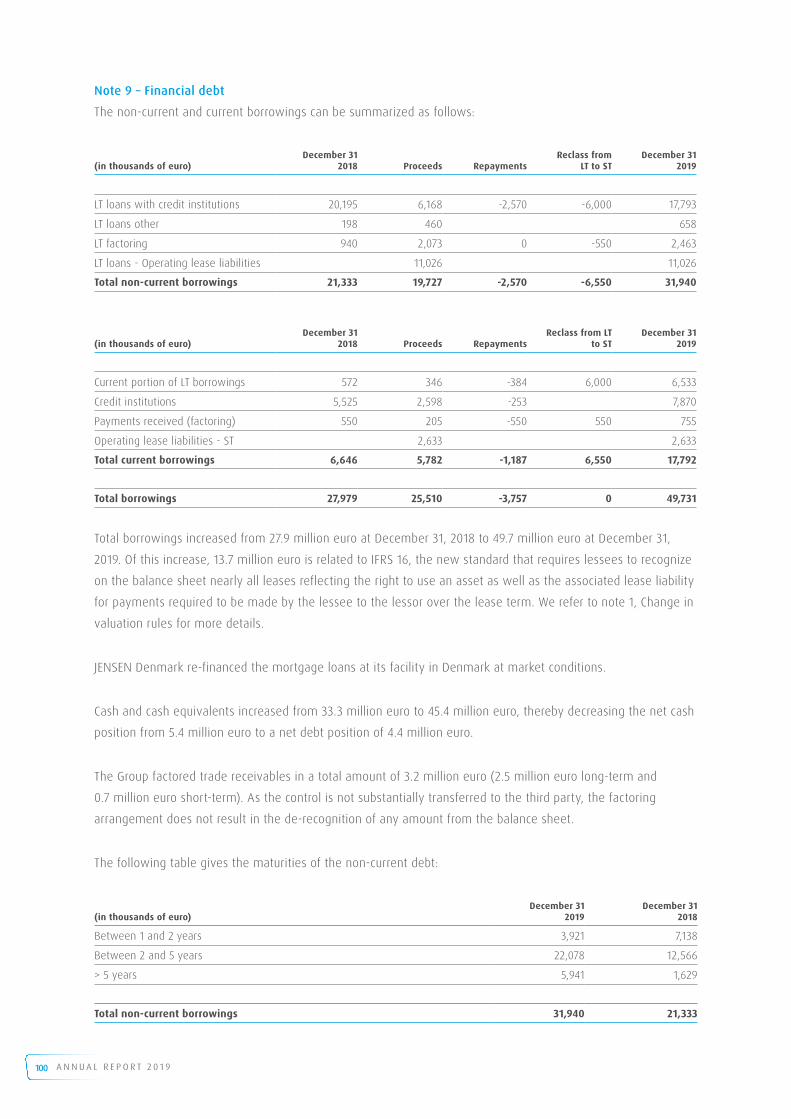
100 A N N U A L R E P O R T 2 0 1 9
Note 9 – Financial debt
The non-current and current borrowings can be summarized as follows:
(in thousands of euro)December 31
2018 Proceeds RepaymentsReclass from
LT to STDecember 31
2019
LT loans with credit institutions 20,195 6,168 -2,570 -6,000 17,793
LT loans other 198 460 658
LT factoring 940 2,073 0 -550 2,463
LT loans - Operating lease liabilities 11,026 11,026
Total non-current borrowings 21,333 19,727 -2,570 -6,550 31,940
(in thousands of euro)December 31
2018 Proceeds RepaymentsReclass from LT
to STDecember 31
2019
Current portion of LT borrowings 572 346 -384 6,000 6,533
Credit institutions 5,525 2,598 -253 7,870
Payments received (factoring) 550 205 -550 550 755
Operating lease liabilities - ST 2,633 2,633
Total current borrowings 6,646 5,782 -1,187 6,550 17,792
Total borrowings 27,979 25,510 -3,757 0 49,731
Total borrowings increased from 27.9 million euro at December 31, 2018 to 49.7 million euro at December 31,
2019. Of this increase, 13.7 million euro is related to IFRS 16, the new standard that requires lessees to recognize
on the balance sheet nearly all leases reflecting the right to use an asset as well as the associated lease liability
for payments required to be made by the lessee to the lessor over the lease term. We refer to note 1, Change in
valuation rules for more details.
JENSEN Denmark re-financed the mortgage loans at its facility in Denmark at market conditions.
Cash and cash equivalents increased from 33.3 million euro to 45.4 million euro, thereby decreasing the net cash
position from 5.4 million euro to a net debt position of 4.4 million euro.
The Group factored trade receivables in a total amount of 3.2 million euro (2.5 million euro long-term and
0.7 million euro short-term). As the control is not substantially transferred to the third party, the factoring
arrangement does not result in the de-recognition of any amount from the balance sheet.
The following table gives the maturities of the non-current debt:
(in thousands of euro)December 31
2019December 31
2018
Between 1 and 2 years 3,921 7,138
Between 2 and 5 years 22,078 12,566
> 5 years 5,941 1,629
Total non-current borrowings 31,940 21,333

101A N N U A L R E P O R T 2 0 1 9
The exposure of the Group’s borrowings to interest rate changes and the contractual re-pricing dates before and
after the effect of the IRS (interest rate swaps) at balance sheet date are as follows:
(in thousands of euro) Less than 1 year Between 1and 2 years
Between 2and 5 years
Over 5 years TOTAL
Credit institutions 14,403 533 11,977 5,283 32,196
Other 0 0 0 658 658
Payments received (factoring) 755 755 1,708 0 3,218
Operating lease liabilities 2,633 2,633 8,393 13,659
Total 17,791 3,921 22,078 5,941 49,731
IRS covered 0 119 356 1,899 2,374
Total non-covered 17,791 3,802 21,722 4,042 47,357
Management believes that the carrying value of the loans at fixed rate approximates to the fair value.
For details on the IRS we refer to note 20.
The carrying amounts of the Group’s borrowings are denominated in the following currencies:
(in thousands of euro)December 31
2019December 31
2018
EUR 25,494 21,437
DKK 7,021 2,563
NZD 0 258
CNY 3,557 3,721
Total 36,072 27,979
Operating lease liabilities 13,660 0
Total borrowings 49,732 27,979
With respect to the Group’s borrowings, debt covenants are in place (solvency, positive EBITDA on an annual
basis and a maximum debt/EBITDA ratio). During the year, there were no breaches of these covenants.
Debt covered by guarantees
(in thousands of euro)December 31
2019December 31
2018
Mortgages 6,486 3,282
Letter of Intent 9,152 6,976
Total 15,638 10,258
The carrying value of the property, plant and equipment pledged as security for liabilities amounts to 6.8 million
euro.

102 A N N U A L R E P O R T 2 0 1 9
Note 10 – Provision for employee benefit obligations
(in thousands of euro)December 31
2019December 31
2018
Provisons for Defined Benefit Plan 15,760 13,432
Provisions for other employee benefits 434 283
Total Provisions for employee benefit obligations 16,194 13,715
The provision for other employee benefits relate to a defined contribution plan in Austria and Germany.
Benefit plan
JENSEN GmbH, JENSEN France, JENSEN Italia and JENSEN AG Burgdorf maintain defined retirement benefit plans.
These plans generally provide benefits that are related to an employee’s remuneration and years of service.
The weighted average duration of the defined benefit obligation is 17.6 years.
The Group recognizes all actuarial gains and losses directly in Other Comprehensive Income (OCI). The
accumulated actuarial loss of the four plans amounts to 8.1 million euro.
At December 31, 2019, the total net liability amounted to 15.8 million euro. The net liability increased because of
changes in the assumptions, especially in the discount rates. Discount rates decreased significantly throughout
2019.
For the defined benefit plans, the net cost for 2019 was -0.6 million euro.
(in thousands of euro) 2019 2018
Current service cost 369 483
Interest cost 266 232
Interest income on plan assets -58 -38
Administrative expenses and taxes 18 18
Pension expenses 595 696
The change in net liability recognized during 2019 and 2018 is set out in the table below:
(in thousands of euro) 2019 2018
Net (liability)/assets at the start of the year
Unfunded status -13,433 -14,849
Pension expenses recognized in the income statement -595 -696
Employer contribution or benefits paid by employer 648 674
Amounts recognised in OCI -2,246 1,549
Translation differences -134 -111
Net (liability) at December 31 -15,760 -13,433

103A N N U A L R E P O R T 2 0 1 9
The changes in defined benefit obligations and plan assets can be summarized as follows:
(in thousands of euro) 2019 2018
Change in Defined Benefit Obligation (DBO)
DBO at January 1 19,109 20,098
Current service costs 369 483
Interest cost 266 232
Benefits paid -766 -506
Premiums paid 0 -90
Participants’ contribution 192 178
Effect of changes in financial assumptions 2,261 -1,414
Effect of experience adjustments -152 -193
Exchange rate differences 351 320
DBO at December 31 21,631 19,109
(in thousands of euro) 2019 2018
Change in Plan Assets
Fair value of plan assets at January 1 5,677 5,250
Contributions 840 852
Return on plan assets -137 -58
Interest income on plan assets 58 38
Benefits paid -766 -506
Premiums paid 0 -90
Administrative expenses -18 -18
Translation differences 217 208
Fair value of plan asset at December 31 5,871 5,677
(in thousands of euro) 2019 2018
Defined Benefit Obligation at the end of the period -21,631 -19,109
Fair value of plan assets at the end of the period 5,871 5,677
Unfunded status -15,760 -13,432
The major assumptions made in calculating the provisions can be summarized as follows:
Discount rate Rate of price inflation Expected rates of salary increase
(in thousands of euro) 2019 2018 2019 2018 2019 2018
Switzerland 0.20% 1.00% 1.00% 1.00% 1.50% 1.50%
France 0.76% 1.55% 1.50% 1.75% 2.00% 2.00%
Germany 1.00% 1.75% 1.50% 1.75% 3.00% 3.00%
Italy 0.77% 1.60% 1.50% 1.75% N/A N/A

104 A N N U A L R E P O R T 2 0 1 9
Discount rates decreased significantly throughout 2019. With regard to the inflation rate in the Eurozone, we
calculated with a price inflation of 1.50% (1.75% used last year) as the ECB has decreased also their long term
inflation expectation to 1.70%, compared to 1.90% at the end of 2018. The expected rates of salary increase
remained unchanged.
For the Swiss plan, the assets match the liabilities.
Through its defined benefit plans, the Group is exposed to a number of risks, the most significant of which are
detailed below:
Asset volatility: The plan liabilities are calculated using a discount rate set with reference to corporate bond
yields. The rate used to discount post-employment benefit obligations is determined by reference to market
yields at the end of the reporting period on high quality corporate bonds, as required by IAS 19.83. If plan assets
underperform this yield, this will create a deficit.
The sensitivity of the defined benefit obligation to changes in the assumptions is:
(in thousands of euro) Change in assumption Impact on DBO
Discount rate -25bp 1,542
+25bp -1,373
Weighted avg duration (in years) -25bp 19
+25bp 17
The above sensitivity analyses are based on a change in assumption while holding all other assumptions
constant. In practice, this is unlikely to occur and changes in some of the assumptions may be correlated.
The percentage of plan assets by asset allocation is as follows:
Equity securities: 6.3%
Debt securities: 59.0%
Real estate: 17.1%
Other: 17.6%
The contributions expected to be paid to the plan during the annual period beginning after the reporting period
is estimated to 0.9 million euro.
There is one pension plan in place in Belgium that is legally structured as a Defined Contributions plan. The cost
of this plan for JENSEN-GROUP NV amounted to 0.07 million euro for accounting year 2019.
Because of the Belgian legislation applicable to 2nd pillar pension plans (so-called “Vandenbroucke Law”),
all Belgian Defined Contribution plans have to be considered under IFRS as Defined Benefit plans. The
Vandenbroucke Law states that in the context of defined contribution plans, the employer must guarantee a
minimum of 1.75% annual return on contributions as of 2016, and a minimum of 3.75% on contributions made
before 2016.

105A N N U A L R E P O R T 2 0 1 9
Because of this minimum guaranteed return for Defined Contributions plans in Belgium, the employer is exposed
to a financial risk (there is a legal obligation to pay further contributions if the fund does not hold sufficient
assets to pay all employee benefits relating to employee service in the current and prior periods). These plans
should therefore be classified and accounted for as Defined Benefit plans under IAS 19.
In the past the Company did not apply the Defined Benefit accounting for these plans because higher discount
rates were applicable and the return on plan assets provided by insurance companies was sufficient to cover the
minimum guaranteed return. As a result of the continuously low interest rates offered by the European financial
markets, employers in Belgium effectively assumed a higher financial risk related to the pension plans with a
minimum fixed guaranteed return than in the past, requiring them to measure the potential impact of Defined
Benefit accounting for these plans.
We asked an external party to estimate the potential additional liabilities and they concluded that no potential
additional liabilities exist as at December 31, 2019.
Note 11 - Provisions for other liabilities and charges
(in thousands of euro)December 31
2019December 31
2018
Provisons for warranties 8,969 9,948
Provisions for take-back obligations 422 309
Other provisions 3,206 1,283
Provisions for other liabilities and charges 12,597 11,540
Changes in provisions can be analyzed as follows:
(in thousands of euro) December 31, 2018
Additions Reversals(Utilizations)
Translation Differences
December 31, 2019
Provisions for warranties 9,948 6,419 -7,447 49 8,969
Provisions for take-back obligations 309 253 -140 0 422
Other provisions 1,283 2,007 -38 -46 3,206
Total provisions 11,540 8,679 -7,625 3 12,597
Warranties
A provision is recorded for expected warranty claims on products sold during the year. Assumptions used to
calculate the provision for warranty claims are based on current sales levels and current information on warranty
calls under the standard warranty period (up to 18 months) for the main products.
Take-back obligations
A provision for take-back obligations is recorded when JENSEN-GROUP sells equipment to a customer for which
the customer wants to enter into a leasing contract with a Leasing Company. In some cases, the Leasing
Company requires a take-back clause. In case of customer default, the leasing company can request JENSEN-
GROUP to take back the machine. This creates exposure for the Company in terms of having to take back
machinery over the lifetime of the financing contract.

106 A N N U A L R E P O R T 2 0 1 9
Other provisions
The other provisions are set up for legal claims that, based on prudent judgment, are reasonably funded. Most of
these claims are covered by insurance. Based on legal advice taken, management does not expect these claims
to significantly impact the Group’s financial position or profitability. The increase is related to the reorganization
and restructuring measures.
Note 12 - Trade and other payables
(in thousands of euro)December 31
2019December 31
2018
Trade payables 25,255 26,895
Contract liabilities 10,360 14,463
Remuneration and social security 14,141 14,053
Other amounts payable 1,572 1,820
Accrued expenses and deferred income 8,255 13,367
Derivative financial instruments 96 0
Total trade and other payables 59,680 70,598
Because of lower activities at the end of 2019 compared the previous year, the contract liabilities as well as the
accrued expenses decreased. Readers are reminded that in 2018 the deferred income included the advances
received from the insurance company (2.6 million euro) related to hurricane Michael. We refer also to note 14,
Other operating result for more details.
Note 13 - Depreciation, amortization, write-downs of assets, impairments
(in thousands of euro)December 31
2019December 31
2018
Depreciation, amortization 7,178 4,494
Write downs on trade receivables -329 659
Write downs on inventory 394 280
Change in provisions 977 -546
Total depreciation, amortization, write downs of assets 8,219 4,887
Depreciation charges increased as a result of the new IFRS 16 standard, that requires lessees to recognize on
the balance sheet nearly all leases reflecting the right to use an asset. These recognized assets are depreciated
resulting in higher depreciation charges. We refer to note 1 – Change in valuation rules for more details.
Note 14 – Other operating result
(in thousands of euro)December 31
2019December 31
2018
Other Income / ( Expense) 3,602 -1,833

107A N N U A L R E P O R T 2 0 1 9
On October 10, 2018, JENSEN USA was hit by hurricane Michael. The effect of hurricane Michael on Panama City
and the surrounding areas was truly devastating.
The main JENSEN USA facility was still standing, albeit with extensive damage. JENSEN USA had a disaster plan
in place and implemented it immediately. Our local team together with disaster recovery companies worked to
re-start production. As from Monday 29 October 2018, JENSEN USA has been running close to normal capacity.
The other operating result of 2018 is affected by the impact of hurricane Michael (-2.1 million euro). Despite
receiving an advance from the insurance company, JENSEN-GROUP decided to defer the income from the
insurance claims until these are completely settled. Management believes that the insurance coverage is
adequate.
In 2019 the JENSEN-GROUP recognized 3.8 million euro income as part of the insurance claim is certain. The
other operating result of 2019 includes -1.1 million euro costs related to hurricane Michael.
Note 15 – Financial income and financial charges
Financial income and expenses and other financial income and expenses break down as follows:
(in thousands of euro)December 31
2019December 31
2018
Financial income 2,307 3,175
Interest income 998 1,420
Other financial income 147 209
Currency gains 1,162 1,547
Financial cost -4,800 -4,510
Interest charges -2,240 -1,867
Other financial charges -906 -891
Currency losses -1,654 -1,752
Total net finance cost -2,493 -1,335
The interest income relates to the income from the cash pool and interest received from customers on long
outstanding receivables.
The interest charges include 0.4 million euro related to IFRS 16 (the interest component). We refer to note 1 –
Change in valuation rules for more details.
The revaluation of balance sheet positions and hedging contracts at closing rate results in a currency gain or
loss. Depending on the nature of the currency result, it is recorded in operating or financial result.
The other financial charges relate especially to bank charges.

108 A N N U A L R E P O R T 2 0 1 9
Note 16 - Income tax expense
Income tax expenses can be analyzed as follows:
(in thousands of euro)December 31
2019December 31
2018
Current taxes -5,630 -6,059
Deferred taxes 492 -1,504
Total income tax expense -5,138 -7,562
Tax expenses decreased as the result before taxes and the disallowed expenses are lower.
For the disaggregation of the deferred taxes we refer to the table in note 5 – Deferred taxes.
Relationship between tax expense and accounting profit as per December 31, 2019 and December 31, 2018:
Reconciliation of effective tax rate:
(in thousands of euro)December 31
2019December 31
2018
Accounting profit before taxes 20,523 25,601
Theoretical income tax expense 4,926 6,256
Theoretical tax rate 24% 24%
Tax effect of disallowed expenses 607 1,197
Tax effect of tax losses 281 109
Reimbursement not recognized for tax books -675 0
Actual tax expenses 5,138 7,562
Effective tax rate 25% 30%
Two tax audits were concluded in 2018.
The theoretical tax rate is the weighted average of the theoretical tax rates of the different entities.
Note 17 - Earnings per share
Basic earnings per share are calculated by dividing the Group share in the profit for the year of 15.7 million euro
(19.1 million euro in 2018) by the weighted average number of ordinary shares outstanding during the years
ended December 31, 2019 and 2018.
December 312019
December 312018
Basic earnings per share (in euro) 2.01 2.44
Weighted avg shares outstanding 7,818,999 7,818,999

109A N N U A L R E P O R T 2 0 1 9
Note 18 - Statement of cash flows
Cash, cash equivalents and bank overdrafts include the following for the purpose of the cash flow statement:
(in thousands of euro)December 31
2019December 31
2018
Cash and cash equivalent 45,369 33,333
Overdraft -7,870 -5,525
Net cash and cash equivalents 37,499 27,808
The changes in liabilities arising from financing activities in the cashflow statement, are all changes arising from
cash flows. There are no material non-cash flows. The consolidated statements of cash flows are presented on a
consistent basis. As such, they do not isolate the effect of currencies on individual line items but only in total via
the ‘translation gains/(losses) on cash and bank overdrafts’ caption. With respect to the evolution, the following
comment can be made:
Cash increased because of the lower working capital requirements.
Note 19 - Commitments and contingencies
JENSEN-GROUP has given the following commitments.
(in thousands of euro)December 31
2019December 31
2018
Letters of intent 9,152 6,976
Bank guarantees 9,199 9,424
Mortgages 6,486 3,282
Repurchase commitments 4,219 3,090
Management does not expect these contingencies to significantly impact the Group’s financial position or
profitability. Mortgages increased as JENSEN Denmark re-financed its mortgage loans at market conditions.
Note 20 - Financial instruments – Market and other risks
The table below gives an overview of the Group’s financial instruments. The carrying amounts are assumed to
be close to the fair value.
Reconciliation of assets and liabilities
(in thousands of euro)December 31
2019December 31
2018
Financial assets
Trade receivables 72,716 81,878
Derivative Financial Instruments - FX contracts 79 131
Cash and cash equivalent 45,369 33,333
Total 118,163 115,341

110 A N N U A L R E P O R T 2 0 1 9
Financial Liabilities
Financial debts - floating rate 8,849 7,233
Financial debts - fixed rate 22,026 17,785
Financial debts - factoring 2,773 1,326
Trade Payables 25,255 26,895
Derrivative Financial Instruments - FX contracts 96 -1
Derrivative Financial Instruments -IRS -24 -205
Total 59,000 53,238
The following methods and assumptions were used to estimate the fair values:
y Trade receivables, cash and cash equivalent and trade payables approximate to their carrying amounts due
to the short-term maturities of these instruments;
y Trade receivables are evaluated by the Group based on parameters such as interest rates, specific country
risk factors, individual creditworthiness of the customer and the risk characteristics of the financed project.
Based on this evaluation, allowances are made to account for expected losses on these receivables. As at
December 31, 2019, we believe the carrying amounts of such receivables, net of allowances, are not to be
materially different from their calculated fair value;
y The fair value of the financial debts is estimated by discounting future cash flows using the effective interest
rates currently available for debt on similar terms, credit risk and remaining maturities. As of December 31,
2019, the effective interest rate is not materially different from the nominal interest rate of the financial
obligation.
y The Group enters into derivative financial transactions with financial institutions. Derivatives valued using
valuation techniques with market observable input are mainly interest rate swaps and foreign exchange
forward contracts. The most frequently applied valuation techniques include forward pricing and swap
models, using present value calculations. The models incorporate various inputs including foreign exchange
spot and forward rates and interest rate curves.
Exposure to foreign currency, interest rate and credit risk arises in the normal course of the JENSEN-GROUP
business. The Company analyzes each of these risks individually and defines strategies to manage the economic
impact on the JENSEN-GROUP’s performance in line with its internal policies.
Derivative financial instruments are valued by an independent financial institution, based on the interest and
currency rates on the liquid markets. The financial instruments are measured at fair value in the level 2 category.

111A N N U A L R E P O R T 2 0 1 9
Reconciliation of assets and liabilities
(in thousands of euro)December 31
2019December 31
2018
Assets: Derivative Financial Instruments 79 131
Long-term liabilities: Derivative Financial Instruments -24 -204
Short-term liabilities: Derivative Financial Instruments -96 -0
Total -41 -73
Fair value forex contracts -17 132
Fair value Interest Rate Swaps -24 -205
Total -41 -73
Foreign currency risk
JENSEN-GROUP incurs currency risks on borrowings, investments, (forecasted) sales, (forecasted) purchases
whenever they are denominated in a currency other than the functional currency of the subsidiary. The
currencies giving rise to risk are primarily the US Dollar, Swiss Franc, Swedish Krona, Danish Krone, British Pound,
Chinese Yuan, Australian Dollar and New Zealand Dollar.
The main derivative financial instruments used to manage foreign currency risk are forward exchange contracts.
It is the Company’s policy not to hold derivative instruments for speculative or trading purposes.
With respect to currencies, JENSEN-GROUP adopts the policy of:
y Having hedges on all firm commitments in foreign currencies on a rolling 12 months basis;
y All deviations from the policy need to be approved by the Audit Committee.
As such these hedges are considered as cash flow hedges. They are contracted as a matter of procedure
regardless of any expectations with regard to foreign currency developments. The objective is to lock in the
margin at the time of signing a project contract with a customer.
All foreign exchange contracts are centralized within the JENSEN-GROUP treasury department and are contracted
purely on the basis of the input of the different subsidiaries.
The currency risks resulting from translations of the financial statements of non-euro based companies are not
hedged (note 8 – Equity).
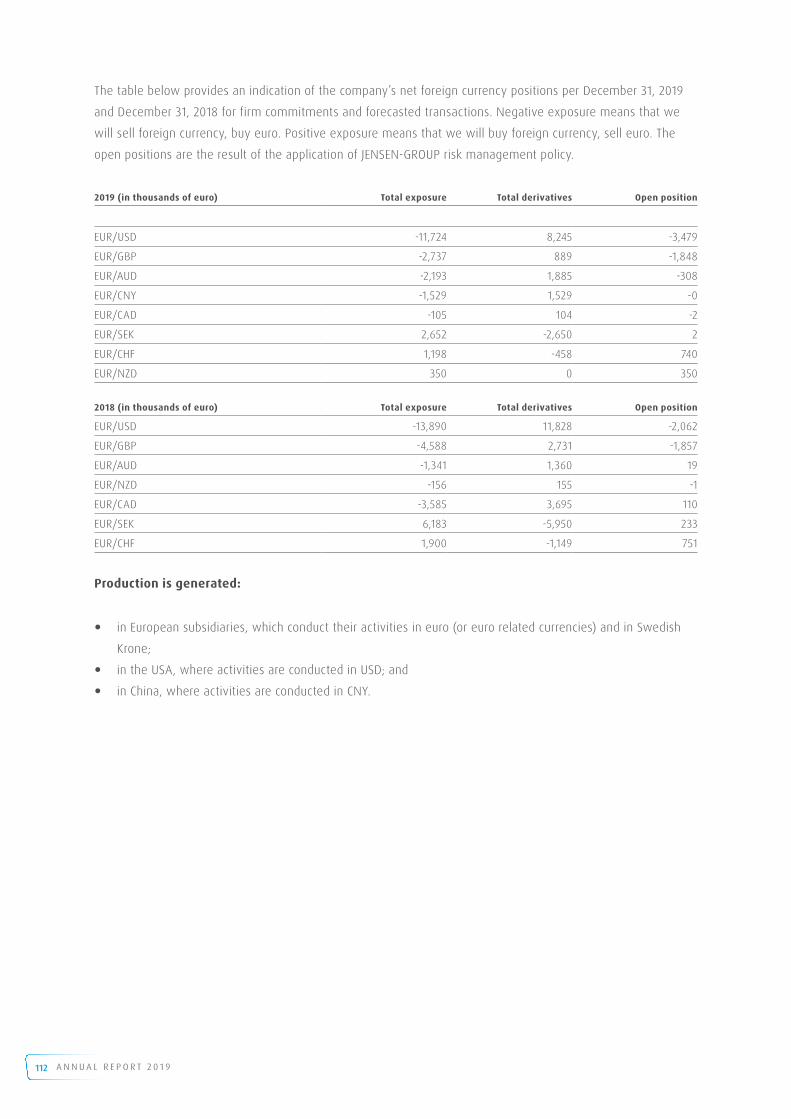
112 A N N U A L R E P O R T 2 0 1 9
The table below provides an indication of the company’s net foreign currency positions per December 31, 2019
and December 31, 2018 for firm commitments and forecasted transactions. Negative exposure means that we
will sell foreign currency, buy euro. Positive exposure means that we will buy foreign currency, sell euro. The
open positions are the result of the application of JENSEN-GROUP risk management policy.
2019 (in thousands of euro) Total exposure Total derivatives Open position
EUR/USD -11,724 8,245 -3,479
EUR/GBP -2,737 889 -1,848
EUR/AUD -2,193 1,885 -308
EUR/CNY -1,529 1,529 -0
EUR/CAD -105 104 -2
EUR/SEK 2,652 -2,650 2
EUR/CHF 1,198 -458 740
EUR/NZD 350 0 350
2018 (in thousands of euro) Total exposure Total derivatives Open position
EUR/USD -13,890 11,828 -2,062
EUR/GBP -4,588 2,731 -1,857
EUR/AUD -1,341 1,360 19
EUR/NZD -156 155 -1
EUR/CAD -3,585 3,695 110
EUR/SEK 6,183 -5,950 233
EUR/CHF 1,900 -1,149 751
Production is generated:
y in European subsidiaries, which conduct their activities in euro (or euro related currencies) and in Swedish
Krone;
y in the USA, where activities are conducted in USD; and
y in China, where activities are conducted in CNY.

113A N N U A L R E P O R T 2 0 1 9
The table below gives an overview of the sensitivity analysis as per 2019:
(in thousands of euro) Change in currency Impact net profit1 Impact on equity
USD -3.74% -580 -963
3.74% 524 514
GBP -8.05% -221 -316
8.05% 188 371
AUD -3.98% -200 -126
3.98% 195 137
NZD -5.53% -119 -17
5.53% 123 19
CAD -4.24% -5 0
4.24% 4 0
CNY -4.09% 12 -191
4.09% -19 207
SEK -5.20% 258 -270
5.20% -400 300
CHF -4.37% 112 -361
4.37% -114 393
DKK -0.16% 63 -7
0.16% -62 175
SGD -2.92% -51
2.92% 54
JPY -6.34% -9
6.34% 11
BRL -8.68% 19
8.68% -23
AED -4.03% -7
4.03% 8
NOK -5.13% -14
5.13% 16
1: The estimation is based on the standard deviation of daily volatilities of the foreign exchange rates during the
past 360 days at December 31, 2019 and using a 95% confidence interval.
These calculations are a purely theoretical calculation and do not take into account the gain or loss of sales
resulting from the increased relative weakness or strength of currencies.
At December 31, 2019, the Group held the following foreign exchange contracts. Balances due within 12 months
equal their carrying balances as the impact of the discount is not significant.

114 A N N U A L R E P O R T 2 0 1 9
2019 Curr Sell Avg exchange rate MaturityFair value
(in thousands of euro)
EUR/USD 9,231,978 1.12 10/02/20 38
EUR/GBP 799,641 0.90 4/02/20 -52
EUR/AUD 3,079,231 1.63 2/03/20 -45
EUR/CNY 11,988,220 7.84 21/01/20 -1
USD/CAD 154,035 1.32 31/01/20 -2
2019 Curr Buy Avg exchange rate Maturity Fair value(in thousands of euro)
EUR/CHF 500,000 1.09 31/01/20 3
EUR/SEK 28,161,543 10.63 18/02/20 42
All of these foreign exchange contracts are designated and effective as cash flow hedges. The changes in fair
value over 2019 amounting to 0.01 million euro after taxes have been deferred in equity. No ineffectiveness has
been recorded.
At December 31, 2018, the Group held the following foreign exchange contracts. Balances due within 12 months
equal their carrying balances as the impact of the discount is not significant.
2018 Curr Sell Avg exchange rate MaturityFair value
(in thousands of euro)
EUR/USD 13,728,641 1.16 19/03/19 -112
EUR/GBP 2,417,999 0.89 18/02/19 29
EUR/AUD 2,223,038 1.63 22/02/19 -5
USD/AUD 668,948 1.39 20/03/19 7
EUR/NZD 265,917 1.72 20/05/19 1
USD/CAD 5,565,035 1.32 28/01/19 131
2018 Curr Buy Avg exchange rate Maturity Fair value(in thousands of euro)
EUR/CHF 1,300,000 1.13 4/03/19 4
EUR/SEK 61,701,751 10.37 13/03/19 77
All of these foreign exchange contracts were designated and effective as cash flow hedges. The changes in
fair value over 2018 amounting to 0.1 million euro after taxes were deferred in equity. No ineffectiveness was
recorded.
Interest rate risk
The Company uses derivative financial instruments to reduce exposure to adverse fluctuations in interest rates. It
is the Company’s policy not to hold derivative instruments for speculative or trading purposes.
All financing within the JENSEN-GROUP is centralized in the treasury department. This makes it easier for the
JENSEN-GROUP to respect its policy of hedging using IRS.
In respect of interest-bearing financial liabilities, the table below indicates their effective interest rates at
balance sheet date as well as the periods in which they roll over. Balances due within 12 months equal their
carrying balances as the impact of the discount is not significant.

115A N N U A L R E P O R T 2 0 1 9
2019:
2019:(in thousands of euro)
Effectiveinterest rate
Carrying amount < 1 month > 1 month < 3 months
> 3 months< 12 months
1-5 years > 5 years
Floating rate
EUR 1.15% 5,595 5,595 0 0 0 0
CNY 4.5% - 6.08% 3,557 2,274 45 134 1,104 0
Total floating 9,152 7,869 45 134 1,104 0
Fixed rate
EUR 1.22% - 2.52% 16,681 1 2 6,006 10,014 658
DKK1 0.44% - 1.5% 7,021 29 58 260 1,392 5,283
Total Fixed 23,702 30 60 6,266 11,406 5,941
Factoring
EUR 3,218 63 126 566 2,463 0
Total 36,072 7,961 231 6,966 14,973 5,941
1: Includes both loans at fixed rates and loans at floating rate covered by IRS.
2018:(in thousands of euro)
Effectiveinterest rate
Carrying amount < 1 month > 1 month < 3 months
> 3 months< 12 months
1-5 years > 5 years
Floating rate
EUR 1.15% 3,717 2,997 16 42 267 395
CNY 4.84% - 7.23% 3,721 2,269 45 134 1,274 0
NZD 1.15% 258 258
Total floating 7,696 5,524 61 175 1,541 395
Fixed rate
EUR 1.22% - 2.52% 16,228 1 1 6 16,022 198
DKK1 2.5% - 5.11% 2,565 0 82 246 1,201 1,036
Total Fixed 18,793 1 83 252 17,223 1,234
Factoring
EUR 1,490 46 92 413 940 0
Total 27,979 5,571 236 840 19,704 1,629
1: Includes both loans at fixed rates and loans at floating rate covered by IRS.
The following table sets out the conditions of the interest rate swaps:
2019 Curr SWAP amount Fixed interest MaturityFair value
(in thousands of euro)
DKK 17,738,000 0.44% 30/12/39 -25
TOTAL in EUR 2,374,088 -25
The interest rate swaps are designated and effective as cash flow hedges. The changes in fair value over 2019
amounting to 0.1 million euro after taxes have been deferred in equity. No ineffectiveness has been recorded.
During 2019, JENSEN Denmark re-financed its mortgage loans including the Interest Rate Swap.

116 A N N U A L R E P O R T 2 0 1 9
2018:
2018 Curr SWAP amount Fixed interest MaturityFair value
(in thousands of euro)
DKK 4,570,305 4.86% 30/12/22 -65
DKK 6,678,397 5.11% 30/12/24 -140
TOTAL in EUR 1,508,010 -205
The interest rate swaps were designated and effective as cash flow hedges. The changes in fair value over 2018
amounting to 0.06 million euro after taxes were deferred in equity. No ineffectiveness was recorded.
As disclosed in the above table, 9.1 million euro of the Company’s interest-bearing financial liabilities bear a
variable interest rate. This amount does not include the 2.4 million EUR loan that is covered by an Interest Rate
Swap. The Company estimates that the reasonably possible change of the market interest rates applicable to its
floating rate debt is as follows:
(in thousands of euro) Carrying amount Effective interest ratePossible rates at
December 31, 2019
EUR 5,595 1.15% 1.29% – 1.01%
CNY 3,557 4.5%-6.08% 4.50% – 6.08%
Total in EUR 9,152
Applying the reasonably possible increase/decrease in the market interest rate mentioned above to our floating
rate debt at December 31, 2019, with all other variables held constant, 2019 profit would have been 0.06 million
euro lower/higher.
Credit risk
Credit risk is the risk that one party to a financial instrument will fail to discharge an obligation and cause the
other party to incur a financial loss.
As part of the credit risk policy historical data about trade receivables overdue is used. As explained in the
valuation policies additional forward-looking information is used.
Under the Group’s credit policy, project customers are required to either provide an advance payment or to
provide a guarantee (ex. L/C, bank guarantees). We examine the creditworthiness of each new customer and of
existing customers that start buying higher amounts.

117A N N U A L R E P O R T 2 0 1 9
The consolidated ageing schedule of the trade receivables is as follows.
2019(in thousands of euro) Current < 60 days
> 60 days < 90 days overdue
> 90 days < 120 days overdue
> 120 days overdue Total
Outstanding trade receivables 55,620 8,790 1,970 1,593 4,626 72,599
Collateral held as security 0 0
Net exposure 55,620 8,790 1,970 1,593 4,626 72,599
Provisions accounted for -2,824
Total 69,775
2018(in thousands of euro) Current < 60 days
> 60 days < 90 days overdue
> 90 days < 120 days overdue
> 120 days overdue Total
Outstanding trade receivables 42,823 17,626 2,365 12,767 8,582 84,163
Collateral held as security 0 0
Net exposure 42,823 17,626 2,365 12,767 8,582 84,163
Provisions accounted for -3,300
Total 80,863
Balances due within 12 months equal their carrying balances as the impact of the discounting is not significant.
Trade debtors and other amounts receivable are shown on the balance sheet at amortized cost (in general, the
original amount invoiced) less an allowance for doubtful debts and less an amount for expected credit losses.
Allowances are calculated on an individual basis, based on an ageing analysis of the trade debtors. For the
determination of the expected credit loss, the Group has applied the simplified approach and record lifetime
expected losses on all trade receivables.
In 2019, the total overdue trade receivables amount to 17.0 million euro (2018 41.3 million euro), resulting in 18
days overdue DSO (2018: 43 days overdue DSO). The bad debt reserve in 2019 amounts to 61.0% of the trade
receivables overdue more than 120 days (38.4% in 2018).
In 2018 the Group applied the IFRS 9 simplified approach to measure expected credit losses which uses a
lifetime expected loss allowance for all trade receivables based on historical losses. The Group analyzed the
impact of IFRS 9 and concluded there was no material impact on the bad debt reserved booked. The Group also
assessed whether the historic pattern would change materially in the future and expected no significant impact.
The roll forward of the provision for doubtful debtors is set out below:
(in thousands of euro)
Provision Doubtful Debtors opening balance 3,300
Additions 401
Reversals -902
Exchange difference 25
Provision Doubtful closing balance 2,824

118 A N N U A L R E P O R T 2 0 1 9
The bank credit ratings (S&P) as per December 31, 2019 are as follows:
Nordea: AA-
KBC: A+
Nykredit: AA-
Note 21 – Assets held for sale
The assets held for sale amounting to 0.4 million euro relate to the former Cissell building in Kentucky (former
CLD activities).
The costs related to the building (0.1 million euro) are presented as result from assets held for sale.
Note 22 – Related party transactions
The shareholders of the Company as per December 2019 are:
JENSEN INVEST A/S: 54.4%
Lazard Frères Gestion SAS: 5.2%
Free float: 40.4%
Key management compensation can be summarized as follows:
(in thousands of euro) 2019 2018
Fees paid to Board members 328 275
Gross salaries paid to senior managers 2,233 2,240
JENSEN USA bought components for 125,456 USD in the course of 2019 from Global Industries A/S. Mr.
Rasmussen owns 51% of the shares of this Company.
For more details on the remuneration of senior management, we refer to the Remuneration Report included in
the Report of the Board of Directors.
Companies accounted for using the equity method
On January 29, 2016 JENSEN-GROUP acquired an equity stake of 30% in TOLON GLOBAL MAKINA Sanyi Ve Tikaret
Sirketi A.S., Turkey and agreed to acquire in total an additional 19% of the shares over the coming three years.
In 2017, the JENSEN-GROUP increased its shareholding by 6.33% to 36.33%, in 2018 by another 6.33% to 42.66%
and finally in 2019 by 6.34% to 49%.
On January 2, 2018, JENSEN-GROUP acquired an equity stake of 30% in Inwatec ApS (Denmark).
As the JENSEN-GROUP holds less than 50% of both companies, these participations are consolidated by the
equity method.
(in thousands of euro)December 31
2019December 31
2018
Companies accounted for using the equity method 7,574 7,015

119A N N U A L R E P O R T 2 0 1 9
Minority interest
The JENSEN-GROUP and ABS Laundry Business Solutions joined forces to form a new company, Gotli Labs AG.
As the JENSEN-GROUP has de jure control over Gotli Labs AG (over 50% of the shares), this participation is fully
consolidated. Contractually, JENSEN-GROUP is entitled to 40% of the results, with the other 60% shown in the
income statement as “income attributable to non-controlling interest”.
(in thousands of euro)December 31
2019December 31
2018
Result attributable to Minorty Interest -675 -331
Equity part of MI 60% -875 -200
For the legal structure, we refer to note 26.
Note 23 – Acquisitions
On March 27, 2019, the JENSEN-GROUP increased its shareholding in TOLON GLOBAL MAKINA Sanyi Ve Tikaret
Sirketi A.S., Turkey, by 6.34% to reach the level defined in the original contract of 49%.
The table below gives an overview of the acquisition-date fair value of the total consideration transferred and
the remaining amount of goodwill recognized for the acquisition:
(in thousands of euro) 2019
Non current assets 3,693
Current assets 8,688
Non current liabilities -7,443
Net assets acquired 4,937
Group share in net assets acquired 313
Goodwill 338
Purchase price 651
Net cash out for acquisitions of subsidiaries 651
The fair value of the assets and liabilities acquired in the above transaction is determined on a provisional basis.
Any adjustment to the provisional amounts will be recorded within twelve months of acquisition date.
Note 24 – Non-audit fees
The statutory Auditor is Pwc Bedrijfsrevisoren, represented by Mrs. Lien Winne.
The Statutory Auditor received worldwide fees of 379,295 euro (excl. VAT) for auditing the statutory accounts
of the various legal entities, and the consolidated accounts of the JENSEN-GROUP. Apart from its mandate, the
Statutory Auditor received during 2019 additional fees of 71,007.95 euro (excl. VAT). Of this amount, 2,000 euro
was invoiced to JENSEN-GROUP NV. The JENSEN-GROUP has appointed a single audit firm for the audit of the
consolidated financial statements.

120 A N N U A L R E P O R T 2 0 1 9
Note 25 - Events after the Balance Sheet date
The JENSEN-GROUP expects a slow-down in activities due to the spread of Covid-19 in several countries.
A close monitoring process for orders is in place to assess the consequences of order postponements.
The JENSEN-GROUP is taking measures to guarantee the safety of its customers and its personnel and to
safeguard business continuity. In addition, the capacity needs are adapted where possible and immediate
actions to reduce our cost base are being implemented. The Group also monitors the support granted in several
countries by the respective Authorities and aligns the level of activity with restrictions imposed by Authorities.
We are unable to assess for the moment the duration of the Covid-19 crisis and therefore cannot estimate
the impact on our performance. This slow-down will have a significant impact on the revenue and on the
profitability of the Company in 2020. The JENSEN-GROUP makes every effort to ensure the maximum possible
business continuity and to continue production where possible in order to guarantee expected delivery dates.
The JENSEN-GROUP is of the opinion that there is no material impact on the financial statements as per December
31, 2019 of the consequences of the worldwide spread of the Covid-19 virus. The Group is of the opinion that the
consequences of Covid-19 are manageable for the coming period with the knowledge as of today.
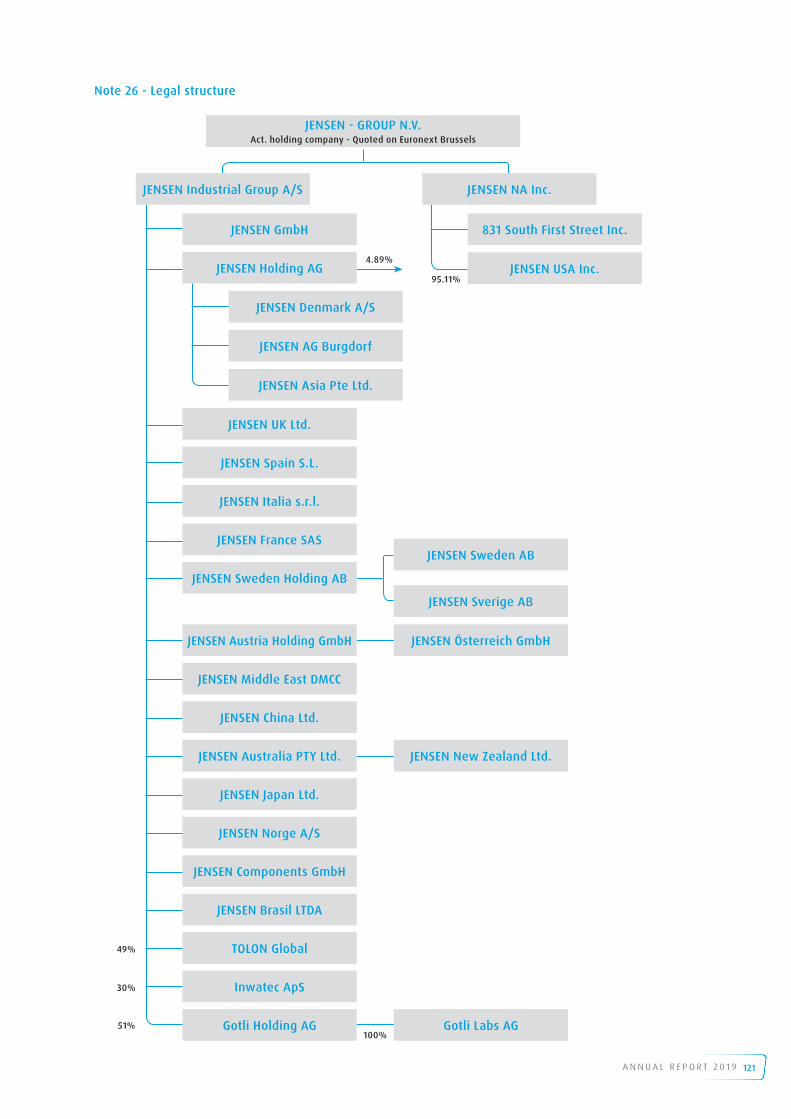
121A N N U A L R E P O R T 2 0 1 9
Note 26 - Legal structure
JENSEN GmbH
JENSEN UK Ltd.
JENSEN Italia s.r.l.
JENSEN Sweden Holding AB
JENSEN Austria Holding GmbH
JENSEN Sweden AB
JENSEN Sverige AB
JENSEN Österreich GmbH
JENSEN New Zealand Ltd.
JENSEN Holding AG
JENSEN Spain S.L.
JENSEN France SAS
JENSEN - GROUP N.V.Act. holding company - Quoted on Euronext Brussels
JENSEN Denmark A/S
831 South First Street Inc.
JENSEN AG Burgdorf
JENSEN USA Inc.
JENSEN Asia Pte Ltd.
95.11%
100%51%
30%
49%
4.89%
JENSEN Industrial Group A/S JENSEN NA Inc.
Gotli Labs AG
JENSEN China Ltd.
JENSEN Components GmbH
JENSEN Japan Ltd.
TOLON Global
JENSEN Middle East DMCC
JENSEN Norge A/S
JENSEN Australia PTY Ltd.
JENSEN Brasil LTDA
Inwatec ApS
Gotli Holding AG
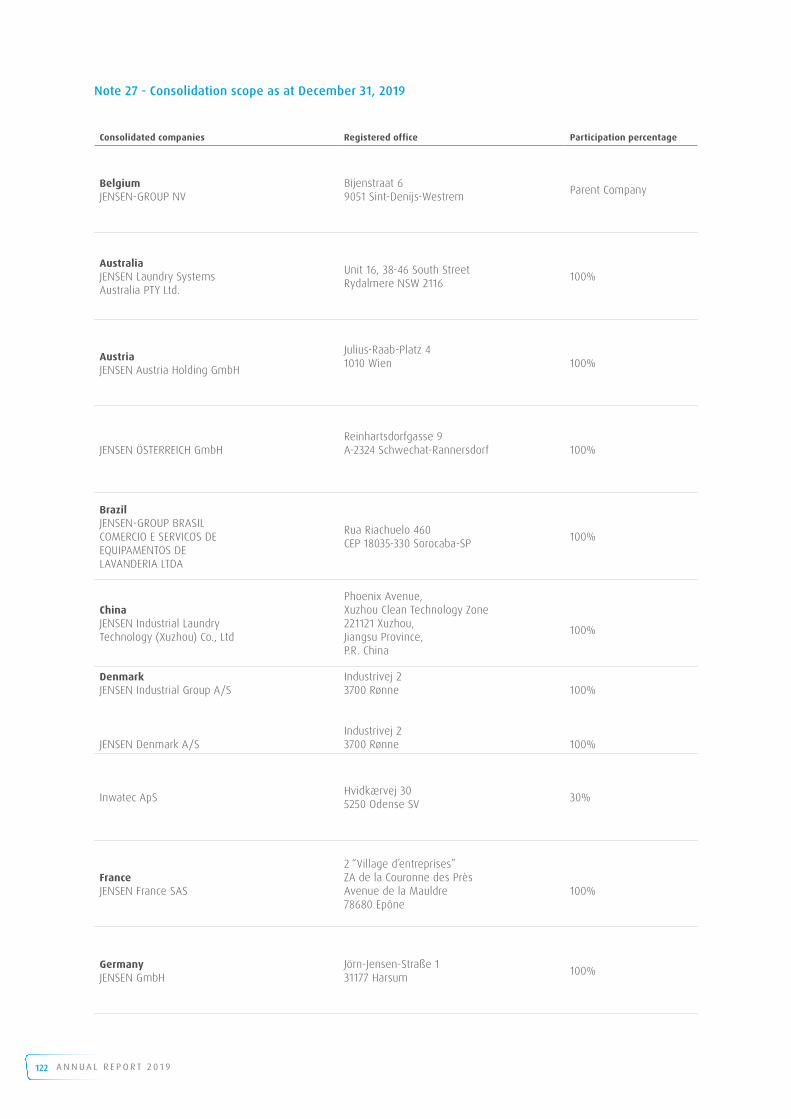
122 A N N U A L R E P O R T 2 0 1 9
Note 27 - Consolidation scope as at December 31, 2019
Consolidated companies Registered office Participation percentage
BelgiumJENSEN-GROUP NV
Bijenstraat 69051 Sint-Denijs-Westrem Parent Company
AustraliaJENSEN Laundry SystemsAustralia PTY Ltd.
Unit 16, 38-46 South StreetRydalmere NSW 2116 100%
AustriaJENSEN Austria Holding GmbH
Julius-Raab-Platz 41010 Wien 100%
JENSEN ÖSTERREICH GmbHReinhartsdorfgasse 9A-2324 Schwechat-Rannersdorf 100%
BrazilJENSEN-GROUP BRASIL COMERCIO E SERVICOS DEEQUIPAMENTOS DE LAVANDERIA LTDA
Rua Riachuelo 460 CEP 18035-330 Sorocaba-SP 100%
ChinaJENSEN Industrial LaundryTechnology (Xuzhou) Co., Ltd
Phoenix Avenue, Xuzhou Clean Technology Zone221121 Xuzhou, Jiangsu Province, P.R. China
100%
DenmarkJENSEN Industrial Group A/S
JENSEN Denmark A/S
Industrivej 23700 Rønne
Industrivej 23700 Rønne
100%
100%
Inwatec ApS Hvidkærvej 305250 Odense SV 30%
FranceJENSEN France SAS
2 “Village d’entreprises”ZA de la Couronne des PrèsAvenue de la Mauldre78680 Epône
100%
GermanyJENSEN GmbH
Jörn-Jensen-Straße 131177 Harsum 100%

123A N N U A L R E P O R T 2 0 1 9
JENSEN Components GmbH Ludwig-Erhard-Strasse 18 30982 Pattensen
100%
ItalyJENSEN Italia s.r.l.
Strada Provinciale Novedratese 4622060 Novedrate 100%
JapanJENSEN Japan Co., Ltd.
4-9-1-203 Imagawa, Urayasu-city279-0022 Japan 100%
Middle EastJENSEN Industrial Laundry SystemsM.E. DMCC
JENSEN Industrial Laundry Systems M.E. DMEEUnit No: 204 Fortune Tower Plot No: JLT-PH1-C1A Jumeirah Lakes Towers Dubai UAE
100%
NorwayJENSEN NORGE AS
Østensjøveien 360667 OSLO 100%
New ZealandJENSEN New Zealand Ltd
Minter Ellison Rudd Watts88 Shortland StreetAuckland, 1010
100%
SingaporeJENSEN Asia PTE Ltd.
No. 6 Jalan Kilang #02-01Dadlani Industrial HouseSingapore 159406
100%
SpainJENSEN Spain S.L. Calle Energia, 34
Poligono FamadesES-08940 Corn ella de Llobregat (Barcelona)
100%
SwedenJENSEN Sweden AB
Företagsgatan 68504 94 Borås 100%
JENSEN SVERIGE AB P.O. Box 1088171 22 Solna 100%

124 A N N U A L R E P O R T 2 0 1 9
JENSEN Sweden Holding AB Box 363503 12 Borås 100%
SwitzerlandJENSEN AG Burgdorf
Buchmattstrasse 83400 Burgdorf 100%
JENSEN Holding AG Buchmattstrasse 83400 Burgdorf 100%
GOTLI Holding Industriestrasse 516312 Steinhausen 51%
GOTLI Labs AG Industriestrasse 516312 Steinhausen 51%
TurkeyTOLON GLOBAL MAKINA Sanyi Ve Tikaret Sirketi A.S.
A.O.S.B. 10007. . No:9 Çiğli, İzmir 49%
United KingdomJENSEN UK Ltd.
Unit 5, Network 11Thorpe Way Industrial EstateBanbury, Oxfordshire OX16 4XS
100%
USJENSEN NA Inc.
Corporation Trust CenterOrange Street 1209Wilmington - Delaware 100%
JENSEN USA, Inc. Aberdeen loop 99 Panama City, FL 32405 100%
831 South 1st Street, Inc.831 South 1st StreetLouisville, KY 40203 100%

125A N N U A L R E P O R T 2 0 1 9
SUMMARY STATUTORY FINANCIAL STATEMENTS JENSEN-GROUP NV

126 A N N U A L R E P O R T 2 0 1 9
Summary balance sheet of JENSEN-GROUP NV
Assets as at (in thousands of euro)
December 312019
December 312018
Fixed assets 96,959 97,026
Intangible assets 0 0
Tangible fixed assets 303 370
Financial fixed assets 96,656 96,656
Current assets 28,890 28,943
Stocks and contracts in progress 2,916 2,312
Amounts receivable within one year 4,082 4,448
Treasury shares 0 0
Cash at bank and on hand 21,835 22,106
Deferred charges and accrued income 57 76
TOTAL ASSETS 125,849 125,969
Liabilities as at(in thousands of euro)
December 312019
December 312018
Capital and reserves 95,852 95,557
Capital 30,710 30,710
Share premium account 5,814 5,814
Reserves 3,071 3,071
Accumulated profits 56,257 55,962
Provisions and deferred taxes 1,060 1,245
Provisions for liabilities and charges 1,060 1,245
Long-term debts 10,000 16,000
Bank loans 10,000 16,000
Short-term debts 6,000 0
Amounts payable 12,937 13,167
Amounts payable within one year 12,710 12,795
Accrued charges and deferred income 227 372
TOTAL LIABILITIES 125,849 125,969

127A N N U A L R E P O R T 2 0 1 9
Summary income statement of JENSEN-GROUP NV
Financial year ended(in thousands of euro)
December 312019
December 312018
Operating income 16,786 19,629
Turnover 14,637 21,204
finished goods and contracts in progress 669 -2,913
Other operating income 1,480 1,338
Operating charges -16,206 -19,627
Raw materials, consumables and goods for resale 7,681 10,960
Services and other goods 5,974 6,033
Remuneration, social security and pensions 2,377 2,433
Depreciation 140 142
Write-downs -104 -28
Provisions for liabilities and charges 0 0
Other operating charges 137 86
Operating profit 581 2
Financial result 7,681 8,269
Financial income 7,986 8,481
Financial charges -304 -212
Profit for the year before taxes 8,262 8,271
Taxes -148 141
Income taxes -148 141
Profit for the year 8,114 8,411
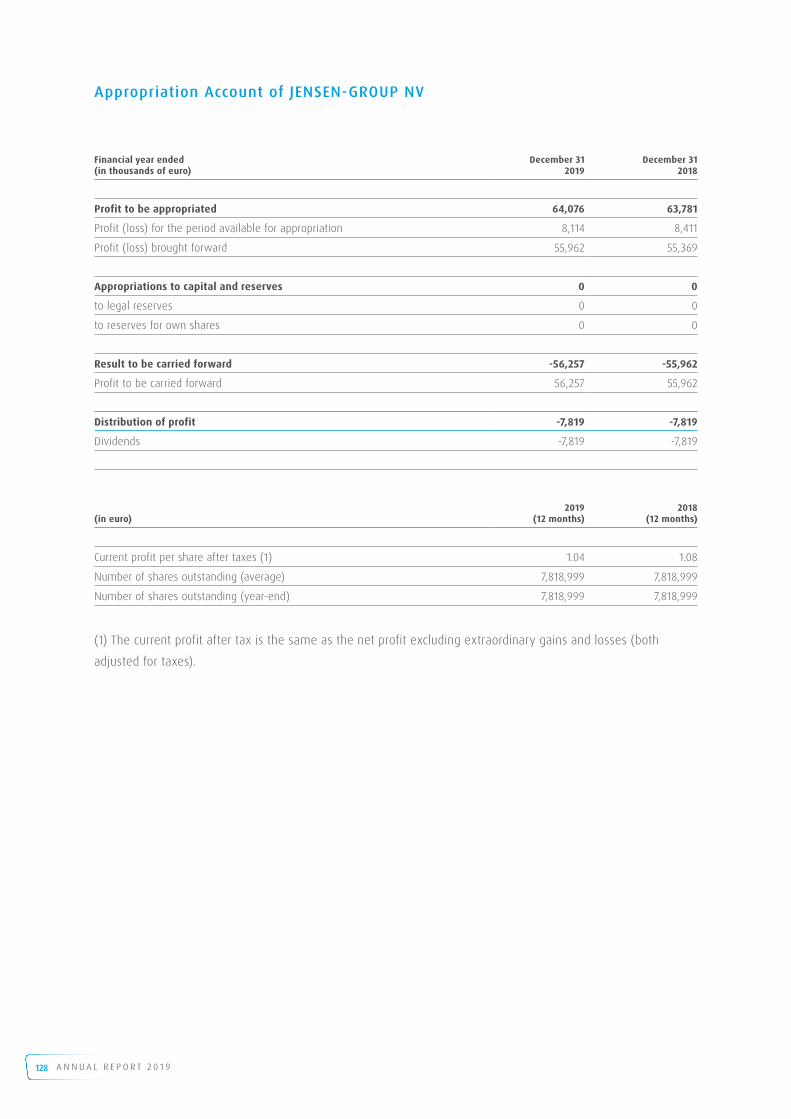
128 A N N U A L R E P O R T 2 0 1 9
Appropriation Account of JENSEN-GROUP NV
Financial year ended(in thousands of euro)
December 312019
December 312018
Profit to be appropriated 64,076 63,781
Profit (loss) for the period available for appropriation 8,114 8,411
Profit (loss) brought forward 55,962 55,369
Appropriations to capital and reserves 0 0
to legal reserves 0 0
to reserves for own shares 0 0
Result to be carried forward -56,257 -55,962
Profit to be carried forward 56,257 55,962
Distribution of profit -7,819 -7,819
Dividends -7,819 -7,819
(in euro)2019
(12 months)2018
(12 months)
Current profit per share after taxes (1) 1.04 1.08
Number of shares outstanding (average) 7,818,999 7,818,999
Number of shares outstanding (year-end) 7,818,999 7,818,999
(1) The current profit after tax is the same as the net profit excluding extraordinary gains and losses (both
adjusted for taxes).

129A N N U A L R E P O R T 2 0 1 9
Statutory financial statements of JENSEN-GROUP NV
In accordance with the Belgian Companies’ and Associations’ Code, a summary version of the statutory financial
statements of JENSEN-GROUP NV is presented. These have been prepared in accordance with Belgian Accounting
Standards. The management report and statutory financial statements of JENSEN-GROUP NV and the report of
the Statutory Auditor thereon are filed with the appropriate authorities, and are also available at the Company’s
registered offices.
The Statutory Auditor has issued an unqualified opinion on the statutory financial statements of JENSEN-GROUP
NV.
JENSEN-GROUP NV has both a holding function and a commercial function as the sales and service company for
the Benelux area.
During 2019, JENSEN-GROUP NV received dividends from its subsidiaries amounting to 7.8 million euro.
The full version of the statutory financial statements of JENSEN-GROUP NV is available on the corporate website
www.JENSEN-GROUP.com.
Valuation rules
The valuation rules are in accordance with the Royal Decree of January 31, 2001.
Financial fixed assets
Since JENSEN-GROUP NV has a holding function, we emphasize that, in accordance with our valuation rules and
accounting legislation in Belgium, financial fixed assets are valued at their initial acquisition price or paid-in
capital. Write-offs on the financial fixed assets are taken when they are deemed to be of a permanent nature.
If it appears that write-offs taken previously are no longer needed, they are reversed. Financial fixed assets are
never valued above acquisition price or paid-in capital.
Intangible fixed assets
The intangible fixed assets consist of goodwill that arises from the acquisitions of the distribution activity in the
Benelux. For statutory purposes, goodwill is amortized over a period of five years.
Tangible fixed assets
Tangible fixed assets are recorded at their acquisition value or construction cost, increased, where appropriate,
by ancillary costs. Tangible fixed assets are depreciated on a straight-line basis over their estimated useful life
from the month of acquisition onwards.

130 A N N U A L R E P O R T 2 0 1 9
On tangible fixed assets, the depreciation rules are:
Caption Method Rate
Infrastructure Straight line 10%
Installations, machinery and equipment Straight line 20%
Office equipment and furniture Straight line 20%
Vehicles Straight line 20%
Inventories and contracts in progress
Inventories are valued at the lower of cost or net realizable value. Cost is determined by the first-in, first-out
(FIFO) method. For produced inventories, cost means the full cost including all direct and indirect production
costs required to bring the inventory items to the stage of completion at the balance sheet date. Net realizable
value is the estimated selling price in the ordinary course of business, less the costs of completion and variable
selling expenses.
The Company uses the ‘percentage of completion method’ to determine the appropriate amount to recognize
in a given period. The stage of completion is measured by reference to the contract costs incurred up to the
balance sheet date as a percentage of total estimated costs for each contract. Costs incurred in the year in
connection with future activity on a contract are excluded from contract costs in determining the stage of
completion. They are presented as inventories, prepayments or other assets, depending on their nature.
Amounts receivable
Trade amounts receivable and other amounts receivable are carried at nominal value. Allowances are made to
amounts receivable where uncertainty exists as to the receipt or payment dates of the whole or a part of the
balance. Supplementary write-offs are also recorded where the realizable value at the balance sheet date is
lower than the carrying value.
Investments and cash at bank and in hand
Deposits with financial institutions are carried at nominal value. Write-downs are applied where the realizable
value at the balance sheet date is lower than the historical cost.
Provisions for liabilities and charges
Provisions for liabilities and charges are assessed on an individual basis to address the risks and future costs
which they are intended to cover. They are maintained only to the extent that they are required following an
updated assessment of the liabilities and charges for which they were created.
Amounts payable (after one year and within one year)
Amounts payable are carried at nominal value at the balance sheet date. The only elements which are recorded
in the accrued charges and deferred income accounts are charges payable at the balance sheet date in respect
of past or prior years.
131A N N U A L R E P O R T 2 0 1 9
Financial instruments
The Company uses derivative financial instruments to reduce its exposure to adverse fluctuations in interest
rates and foreign exchange rates. It is the Company’s policy not to hold derivative instruments for speculative or
trading purposes.
Derivative financial instruments are recognized initially at cost, their premium is amortized pro rata temporis.
At year-end, the financial instruments are measured at market value using the mark-to-market mechanism. The
unrealized losses are recognized in the income statement whereas the unrealized gains are deferred.
The hedged balance sheet positions (outstanding receivables and payables) are recorded at the hedging rate.
General Information
1. Identification
y Name: JENSEN-GROUP NV
y Registered office: Bijenstraat 6, 9051 Sint-Denijs-Westrem.
y The Company was incorporated on April 23, 1990 and exists for an unlimited period of time.
y The Company has the legal form of a “naamloze vennootschap/société anonyme” and operates under
Belgian Company Law.
y The statutory purpose of the Company consists in the following, both in Belgium and abroad, on its own
behalf or in the name of third parties, for its own account or for the account of third parties:
1. Any and all operations related directly or indirectly or connected with the engineering, production, purchase
and sale, distribution, import, export and representation of laundry machines and systems and the manu-
facture thereof;
2. Providing technical, commercial, financial and other services for affiliated businesses, including commercial
and industrial activities in support;
3. Obtaining an interest, in any manner, in any and all businesses that pursue the same, a similar or related
purpose or that are likely to further its own business or facilitate the sale of its products or services, also co-
operating or merging with these businesses and, in general, investing, subscribing, purchasing, selling and
negotiating financial instruments issued by Belgian or foreign businesses;
4. Managing investments and participations in Belgian or foreign businesses, including the standing of sure-
ties, guaranteeing bills, making payments in advance, loans, personal or material sureties for the benefit of
these businesses and acting as their proxy holder or representative;
5. Acting in the capacity of director, providing advice, management and other services for the benefit of the
management and other services for the benefit of other Belgian or foreign businesses, by virtue of contrac-
tual relations or statutory appointment and in the capacity of external consultant or governing body of any
such business.
The Company may undertake both in Belgium and abroad, any and all industrial, trade, financial, bonds and
stocks and real property transactions that are likely to extend or further its business directly or indirectly or that
are related therewith. It may acquire any and all movable and real property items, even if these are related
neither directly nor indirectly to the Purpose of the Company.

132 A N N U A L R E P O R T 2 0 1 9
It may obtain, in any manner, an interest in any and all associations, ventures, business or companies that
pursue the same, a similar or related purpose or that are likely to further its business or facilitate the sale of its
products or services, and it may cooperate or merge therewith.
y The Company is registered in the Commercial Register of Ghent and is subject to VAT under the number BE
0440.449.284
y The Bylaws of the Company can be consulted at the registered office of the Company and on its corporate
website www.jensen-group.com. The annual accounts are filed with the National Bank of Belgium. Financial
reports of the Company are published in the financial press and are also available on the website www.
jensen-group.com. Other documents that are publicly available and that are mentioned in the reference
document can be consulted at the registered office of the Company or on its corporate website www.
jensen-group.com. The Annual Report of the Company is sent every year to the holders of registered shares
as well as to any shareholder who wish to receive it.
2. Share Capital
y The registered share capital amounts to 30,710,108 euro and is represented by 7,818,999 shares without
nominal value. There are no shares that do not represent the share capital. All shares are ordinary shares;
there are no preference shares. The shares are dematerialized or registered shares, depending on the
shareholder’s preference. The dematerialized shares have been issued either by way of an increase of
capital or by exchanging existing registered or bearer shares for dematerialized shares. Each shareholder
may request the exchange of his/her shares either into registered shares or into dematerialized shares. At
least two directors will sign a share certificate. Signature stamps may replace the signatures.
y Evolution of the share capital:
Date Share capital Currency Number of shares
24/05/2002 42,714,560 euro 8,264,842
20/05/2008 42,714,560 euro 8,252,604
13/01/2009 42,714,560 euro 8,039,842
30/11/2011 42,714,560 euro 8,002,968
04/10/2012 30,710,108 euro 8,002,968
12/05/2016 30,710,108 euro 7,818,999

133A N N U A L R E P O R T 2 0 1 9

www.jensen-group.com
JENSEN-GROUP N.V. • Bijenstraat 6 • 9051 Sint-Denijs-Westrem (Gent) - BelgiumT +32 (0)9 333 83 30 • F +32 (0)9 333 83 39 • www.jensen-group.com