
CHAP 3.indd
38
93 Chapter 3 Risks and Capital Adequacy In the course of their activity the banks are exposed to a wide range of risks, including credit risks, market risks, liquidity risk, operational risks and legal risks. In this section, we will focus on credit risks, market risks and liquidity risk. We will analyze the changes that have occurred in capital adequacy, which acts as a cushion for absorbing unexpected losses which the banks could incur if those risks actually materialize, we will calculate the Risk Adjusted Return on Capital (RAROC) and describe the development of the Robustness Index for examining the resilience of the Israeli banking system over time. The banking system’s aggregate credit risk exposure continued to decline in 2007 as a result of the sustained growth in the economy. However, the global credit crunch, which developed in the second half of 2007 began to be felt towards the end of the year, when the volatility in the financial markets and the risk premium on corporate bonds increased. This trend became even more apparent in the first quarter of 2008 and was reflected by a slower pace of growth. We expect that these changes in the business environment in which the banks operate to lead to a growth in their aggregate credit risk. Credit risk is analyzed on the basis of three criteria: the quality, the concentration and the size of the credit portfolio. Credit quality improved in 2007, and the improvement was apparent in most principal industries as well as among private customers. A negative development was an increase in the concentration of the credit portfolio due to the higher proportion of the financial services and the construction and real estate industries. The industries, which were dominant in the portfolio from the outset, accounted for a third of bank credit in 2007. The size of the credit portfolio also expanded, at a higher rate than the growth in the economy. During the year reviewed, the banks’ exposure to market risk increased due to the high level of volatility in the financial markets, interest rates and exchange rates. But despite the increased volatility, their level of exposure remained low. The ratio of capital to risk-weighted assets rose slightly due to a growth in Tier I capital. The capital base expanded inter alia because the Banking Supervision Department recently instructed the banks to include a capital target of 12 percent in their business plans by the end of 2009.
-
Upload
khangminh22 -
Category
Documents
-
view
4 -
download
0
Transcript of CHAP 3.indd
93
Chapter 3Risks and Capital Adequacy
In the course of their activity the banks are exposed to a wide range of risks, including credit risks, market risks, liquidity risk, operational risks and legal risks. In this section, we will focus on credit risks, market risks and liquidity risk. We will analyze the changes that have occurred in capital adequacy, which acts as a cushion for absorbing unexpected losses which the banks could incur if those risks actually materialize, we will calculate the Risk Adjusted Return on Capital (RAROC) and describe the development of the Robustness Index for examining the resilience of the Israeli banking system over time.
The banking system’s aggregate credit risk exposure continued to decline in 2007 as a result of the sustained growth in the economy. However, the global credit crunch, which developed in the second half of 2007 began to be felt towards the end of the year, when the volatility in the financial markets and the risk premium on corporate bonds increased. This trend became even more apparent in the first quarter of 2008 and was reflected by a slower pace of growth. We expect that these changes in the business environment in which the banks operate to lead to a growth in their aggregate credit risk.
Credit risk is analyzed on the basis of three criteria: the quality, the concentration and the size of the credit portfolio. Credit quality improved in 2007, and the improvement was apparent in most principal industries as well as among private customers. A negative development was an increase in the concentration of the credit portfolio due to the higher proportion of the financial services and the construction and real estate industries. The industries, which were dominant in the portfolio from the outset, accounted for a third of bank credit in 2007. The size of the credit portfolio also expanded, at a higher rate than the growth in the economy. During the year reviewed, the banks’ exposure to market risk increased due to the high level of volatility in the financial markets, interest rates and exchange rates. But despite the increased volatility, their level of exposure remained low. The ratio of capital to risk-weighted assets rose slightly due to a growth in Tier I capital. The capital base expanded inter alia because the Banking Supervision Department recently instructed the banks to include a capital target of 12 percent in their business plans by the end of 2009.
94
BANK OF ISRAEL: BANKING SYSTEM 2007
1. CREDIT RISK
Credit risk is the principal financial risk to which a bank is exposed in the course of its activity. In this section we will analyze exposure to credit risk in terms of the size, quality and concentration of credit. We will also examine the development of loan activity and risk in the principal industries.
The improvement in the quality of the credit portfolio, which began in 2005, continued in 2007 and was reflected by the portfolio quality indices. However, the size of the credit portfolio and its concentration increased, as reflected by a growth in the proportion of the financial services industry and the construction and real estate industry. The global credit crunch, which developed in the second half of 2007, began to be felt towards the end of the year when the volatility in the financial markets and the risk premium on corporate bonds increased.
a. The size of the credit portfolio1
The credit portfolio expanded by 10 percent in 2007 compared with 7 percent in 2006, thereby increasing the banks’ exposure to credit risks. The expansion of the portfolio was reflected in balance-sheet items (9 percent) and in off-balance-sheet items (13 percent), and encompassed all principal industries and especially the financial services industry and the construction and real estate industry, credit to which accounted for approximately one third of the entire credit portfolio. In addition, the rate of expansion in balance-sheet credit exceeded the growth rate in the economy for the first time since 2002 (Table 1.4),2 a development that is indicative of an increase in credit risk. At the same time however, the ratio between this credit and the capital base, which is intended to absorb the banks’ losses including their losses, in respect of credit risk, rose slightly, by 7 percentage points.
b. The quality of the credit portfolio
In 2007 as well, the favorable pattern of economic developments since the end of 2003 had the effect of increasing borrowers’ repayment ability and reducing the materialization of credit risks. The result was an improvement in the quality of the credit portfolio as reflected in the majority of indices based on the annual financial statements.3 The onset of the global credit crunch in the second half of 2007 triggered an economic slowdown
1 The size of the credit portfolio includes balance-sheet credit risk and off-balance-sheet credit risk, on the basis of the aggregate credit risk reported to the public in Appendix F to the financial statements. See Chapter 1 for further details.2 See Chapter 1 for more details.3 The credit quality indices express the probability of a borrower or borrower group failing to repay part of their liabilities to the bank (principal and/or interest) on time.
95
CHAPTER 3: RISKS AND CAPITAL ADEQUACY
in many countries. The moderate impact of the credit crunch on the Israeli economy was apparent from the increased volatility in the market and the rise in the risk premium on corporate bonds, which reflect the credit risk of companies in the economy, from the reduced volume of issues by high-risk companies, and from forecasts of a slower pace of annual growth in the economy.
The analysis of the quality of the credit portfolio in this review is based on the indices generally employed for measuring the quality of the portfolio, which are derived from the financial statements, on the quarterly credit exposure report4 via which the banks report on their credit exposure to large borrowers, and on indicators from the capital market. Part of the indices show an improvement in credit quality, part of them are indicative of stability, and part of them show an increase in credit risk.
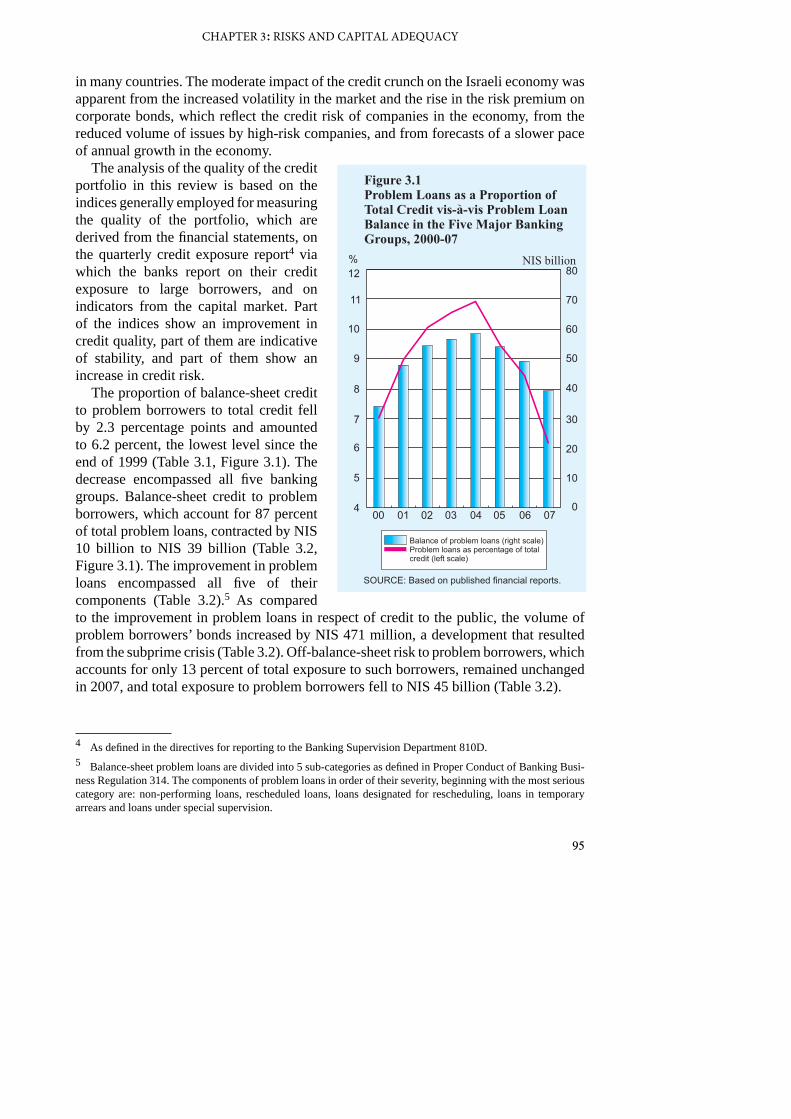
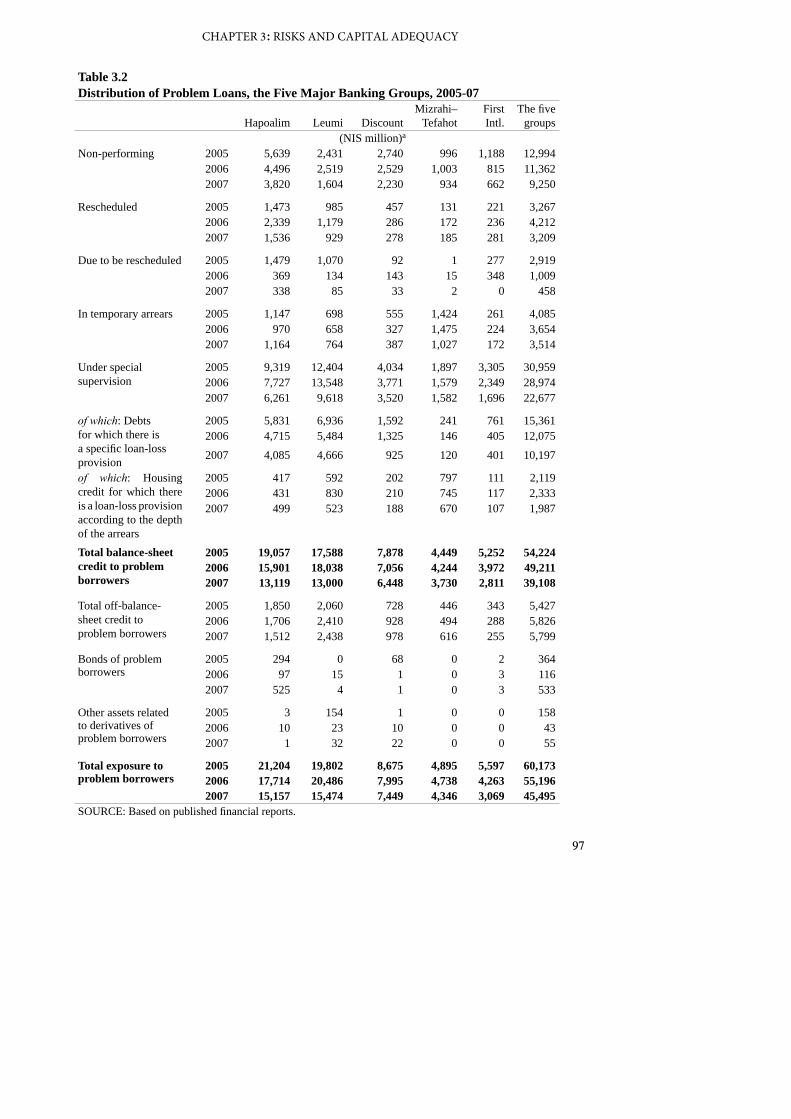
The proportion of balance-sheet credit to problem borrowers to total credit fell by 2.3 percentage points and amounted to 6.2 percent, the lowest level since the end of 1999 (Table 3.1, Figure 3.1). The decrease encompassed all five banking groups. Balance-sheet credit to problem borrowers, which account for 87 percent of total problem loans, contracted by NIS 10 billion to NIS 39 billion (Table 3.2, Figure 3.1). The improvement in problem loans encompassed all five of their components (Table 3.2).5 As compared to the improvement in problem loans in respect of credit to the public, the volume of problem borrowers’ bonds increased by NIS 471 million, a development that resulted from the subprime crisis (Table 3.2). Off-balance-sheet risk to problem borrowers, which accounts for only 13 percent of total exposure to such borrowers, remained unchanged in 2007, and total exposure to problem borrowers fell to NIS 45 billion (Table 3.2).
4 As defined in the directives for reporting to the Banking Supervision Department 810D.5 Balance-sheet problem loans are divided into 5 sub-categories as defined in Proper Conduct of Banking Busi-ness Regulation 314. The components of problem loans in order of their severity, beginning with the most serious category are: non-performing loans, rescheduled loans, loans designated for rescheduling, loans in temporary arrears and loans under special supervision.
96
BANK OF ISRAEL: BANKING SYSTEM 2007
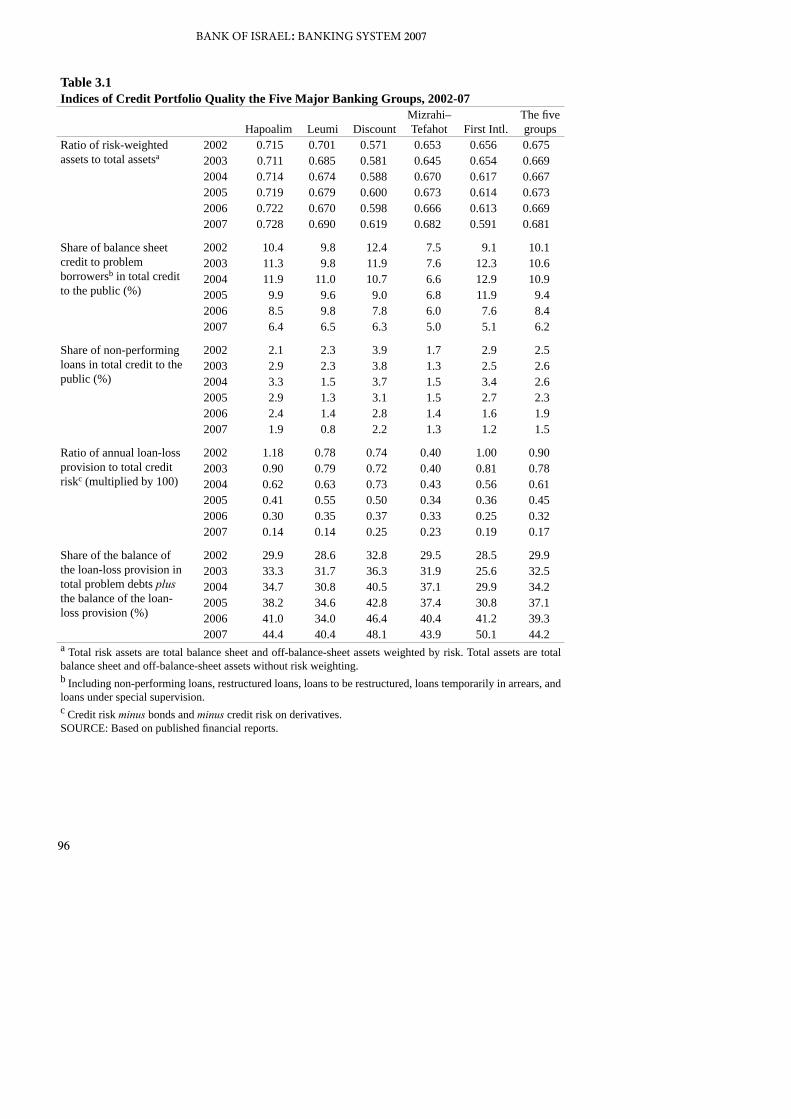
Table 3.1Indices of Credit Portfolio Quality the Five Major Banking Groups, 2002-07
Hapoalim Leumi DiscountMizrahi– Tefahot First Intl.
The five groups
Ratio of risk-weighted assets to total assetsa
2002 0.715 0.701 0.571 0.653 0.656 0.6752003 0.711 0.685 0.581 0.645 0.654 0.6692004 0.714 0.674 0.588 0.670 0.617 0.6672005 0.719 0.679 0.600 0.673 0.614 0.6732006 0.722 0.670 0.598 0.666 0.613 0.6692007 0.728 0.690 0.619 0.682 0.591 0.681
Share of balance sheet credit to problem borrowersb in total credit to the public (%)
2002 10.4 9.8 12.4 7.5 9.1 10.12003 11.3 9.8 11.9 7.6 12.3 10.62004 11.9 11.0 10.7 6.6 12.9 10.92005 9.9 9.6 9.0 6.8 11.9 9.42006 8.5 9.8 7.8 6.0 7.6 8.42007 6.4 6.5 6.3 5.0 5.1 6.2
Share of non-performing loans in total credit to the public (%)
2002 2.1 2.3 3.9 1.7 2.9 2.52003 2.9 2.3 3.8 1.3 2.5 2.62004 3.3 1.5 3.7 1.5 3.4 2.62005 2.9 1.3 3.1 1.5 2.7 2.32006 2.4 1.4 2.8 1.4 1.6 1.92007 1.9 0.8 2.2 1.3 1.2 1.5
Ratio of annual loan-loss provision to total credit riskc (multiplied by 100)
2002 1.18 0.78 0.74 0.40 1.00 0.902003 0.90 0.79 0.72 0.40 0.81 0.782004 0.62 0.63 0.73 0.43 0.56 0.612005 0.41 0.55 0.50 0.34 0.36 0.452006 0.30 0.35 0.37 0.33 0.25 0.322007 0.14 0.14 0.25 0.23 0.19 0.17
Share of the balance of the loan-loss provision in total problem debts plus the balance of the loan-loss provision (%)
2002 29.9 28.6 32.8 29.5 28.5 29.92003 33.3 31.7 36.3 31.9 25.6 32.52004 34.7 30.8 40.5 37.1 29.9 34.22005 38.2 34.6 42.8 37.4 30.8 37.12006 41.0 34.0 46.4 40.4 41.2 39.32007 44.4 40.4 48.1 43.9 50.1 44.2
a Total risk assets are total balance sheet and off-balance-sheet assets weighted by risk. Total assets are total balance sheet and off-balance-sheet assets without risk weighting.b Including non-performing loans, restructured loans, loans to be restructured, loans temporarily in arrears, and loans under special supervision.c Credit risk minus bonds and minus credit risk on derivatives.SOURCE: Based on published financial reports.
97
CHAPTER 3: RISKS AND CAPITAL ADEQUACY
Table 3.2Distribution of Problem Loans, the Five Major Banking Groups, 2005-07
Hapoalim Leumi DiscountMizrahi–
TefahotFirst Intl.
The five groups
(NIS million)a
Non-performing 2005 5,639 2,431 2,740 996 1,188 12,994 2006 4,496 2,519 2,529 1,003 815 11,362 2007 3,820 1,604 2,230 934 662 9,250
Rescheduled 2005 1,473 985 457 131 221 3,267 2006 2,339 1,179 286 172 236 4,212 2007 1,536 929 278 185 281 3,209
Due to be rescheduled 2005 1,479 1,070 92 1 277 2,919 2006 369 134 143 15 348 1,009 2007 338 85 33 2 0 458
In temporary arrears 2005 1,147 698 555 1,424 261 4,085 2006 970 658 327 1,475 224 3,654 2007 1,164 764 387 1,027 172 3,514
Under special supervision
2005 9,319 12,404 4,034 1,897 3,305 30,959 2006 7,727 13,548 3,771 1,579 2,349 28,974 2007 6,261 9,618 3,520 1,582 1,696 22,677
of which: Debts for which there is a specific loan-loss provision
2005 5,831 6,936 1,592 241 761 15,361 2006 4,715 5,484 1,325 146 405 12,075
2007 4,085 4,666 925 120 401 10,197
of which: Housing credit for which there is a loan-loss provision according to the depth of the arrears
2005 417 592 202 797 111 2,119 2006 431 830 210 745 117 2,333 2007 499 523 188 670 107 1,987
Total balance-sheet credit to problem borrowers
2005 19,057 17,588 7,878 4,449 5,252 54,224 2006 15,901 18,038 7,056 4,244 3,972 49,211 2007 13,119 13,000 6,448 3,730 2,811 39,108
Total off-balance-sheet credit to problem borrowers
2005 1,850 2,060 728 446 343 5,427 2006 1,706 2,410 928 494 288 5,826 2007 1,512 2,438 978 616 255 5,799
Bonds of problem borrowers
2005 294 0 68 0 2 364 2006 97 15 1 0 3 116 2007 525 4 1 0 3 533
Other assets related to derivatives of problem borrowers
2005 3 154 1 0 0 158 2006 10 23 10 0 0 43 2007 1 32 22 0 0 55
Total exposure to problem borrowers
2005 21,204 19,802 8,675 4,895 5,597 60,173 2006 17,714 20,486 7,995 4,738 4,263 55,196 2007 15,157 15,474 7,449 4,346 3,069 45,495
SOURCE: Based on published financial reports.
98
BANK OF ISRAEL: BANKING SYSTEM 2007
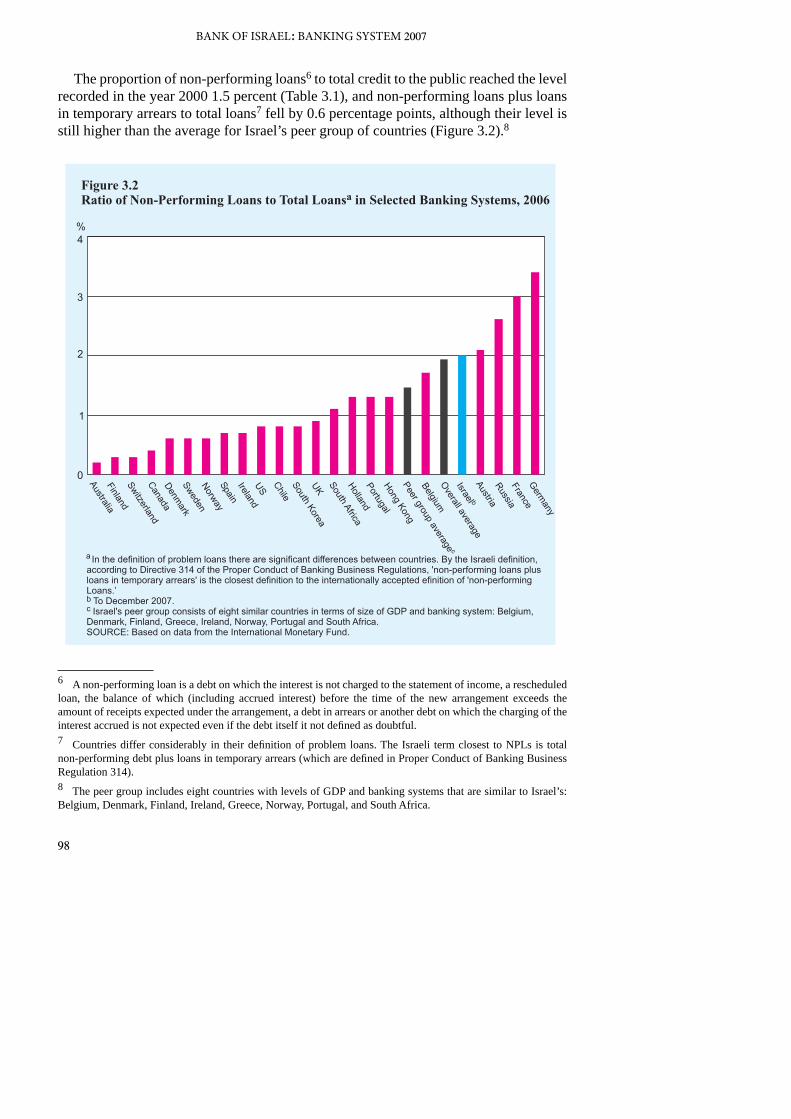
The proportion of non-performing loans6 to total credit to the public reached the level recorded in the year 2000 1.5 percent (Table 3.1), and non-performing loans plus loans in temporary arrears to total loans7 fell by 0.6 percentage points, although their level is still higher than the average for Israel’s peer group of countries (Figure 3.2).8
6 A non-performing loan is a debt on which the interest is not charged to the statement of income, a rescheduled loan, the balance of which (including accrued interest) before the time of the new arrangement exceeds the amount of receipts expected under the arrangement, a debt in arrears or another debt on which the charging of the interest accrued is not expected even if the debt itself it not defined as doubtful.7 Countries differ considerably in their definition of problem loans. The Israeli term closest to NPLs is total non-performing debt plus loans in temporary arrears (which are defined in Proper Conduct of Banking Business Regulation 314).8 The peer group includes eight countries with levels of GDP and banking systems that are similar to Israel’s: Belgium, Denmark, Finland, Ireland, Greece, Norway, Portugal, and South Africa.
99
CHAPTER 3: RISKS AND CAPITAL ADEQUACY
The amount of the loan-loss provision charged to the statement of income fell considerably in 2007 to NIS 1,776 million.9 The decrease derived from the continued improvement in the economy and in companies’ financial position, and as a result of the special provisions for housing loans recorded in 2006 in accordance with a Bank of Israel directive.10 The large decrease in the rate of the provision together with the increased volume of credit led to a continuation of the downtrend in the ratio of the annual expense on the loan-loss provision to credit to the public, which began in 2003 and reached its lowest level since 1996 (Table 3.1). Due to the global crisis, which began in the subprime mortgage market in the USA and its rapid spread to financial and non-financial markets worldwide and in view of the slower pace of growth in the Israeli economy, it is doubtful whether the ratio of the expense on the loan-loss provision to credit to the public fully reflects the credit risk currently inherent in the banks’ credit portfolios. In 2007, the proportion of the balance of the loan-loss provision to balance-sheet problem loans plus the balance of the loan-loss provision11 increased due to the large decrease in the ratio of problem loans, although the increase was slightly offset by the reduction in the provision.12 In contrast to the major improvement in all the credit quality indices reviewed so far, a deterioration was recorded in the ratio of risk-weighted assets to total assets,13 reflecting the extent of the risk in the asset mix. The increase in this ratio encompassed all the banking groups except for the First International group (Table 3.1), and resulted from the expansion in credit the public,14 which is regarded as a higher risk asset, and from the decrease in cash in hand and deposits at banks, which are notable for a low level of risk. In addition, the rate of expansion in credit during 2007 exceeded the rate of growth in GDP, which is the source for credit repayment. The ratio of credit to GDP thereby rose for the first time in four years, to a level of 1.34 (Table 1.4). The increase in this ratio expresses an increase in credit risk.
In the credit exposure report, the banks grade the credit risk of every borrower.15 Since the grading scales reported by the banks differ, for the purpose of this review we have constructed a standard grading scale for all five largest banks, whose values range between 0 and 100.16 The lower the value reported, the higher is the company’s credit quality. We examined borrowers whose outstanding credit risk exceeded NIS 20 million,
9 See Chapter 2 for more details.10 See the Annual Survey for 2006, page 73.11 This ratio measures the bank’s assessment of the loan losses that will materialize in the future and which have been recognized in the statement of income, relative to the size of the credit portfolio which it has classified as problematic. A high ratio reflects a low potential for future losses from the bank’s problem loan portfolio. 12 See Chapter 2 for further details.13 The ratio between balance-sheet credit risk-weighted assets and off-balance-sheet credit risk, as calculated in accordance with the Supervisor of Banks’ directives concerning the minimum capital ratio, and outstanding balance-sheet and off-balance-sheet credit.14 See Chapter 1 for more details.15 Credit risk includes balance-sheet credit risk and off-balance-sheet credit risk after provision for loan losses.16 The credit grade 0-36 denotes low risk, 37-57 medium risk, and 58-100, high risk.
100
BANK OF ISRAEL: BANKING SYSTEM 2007
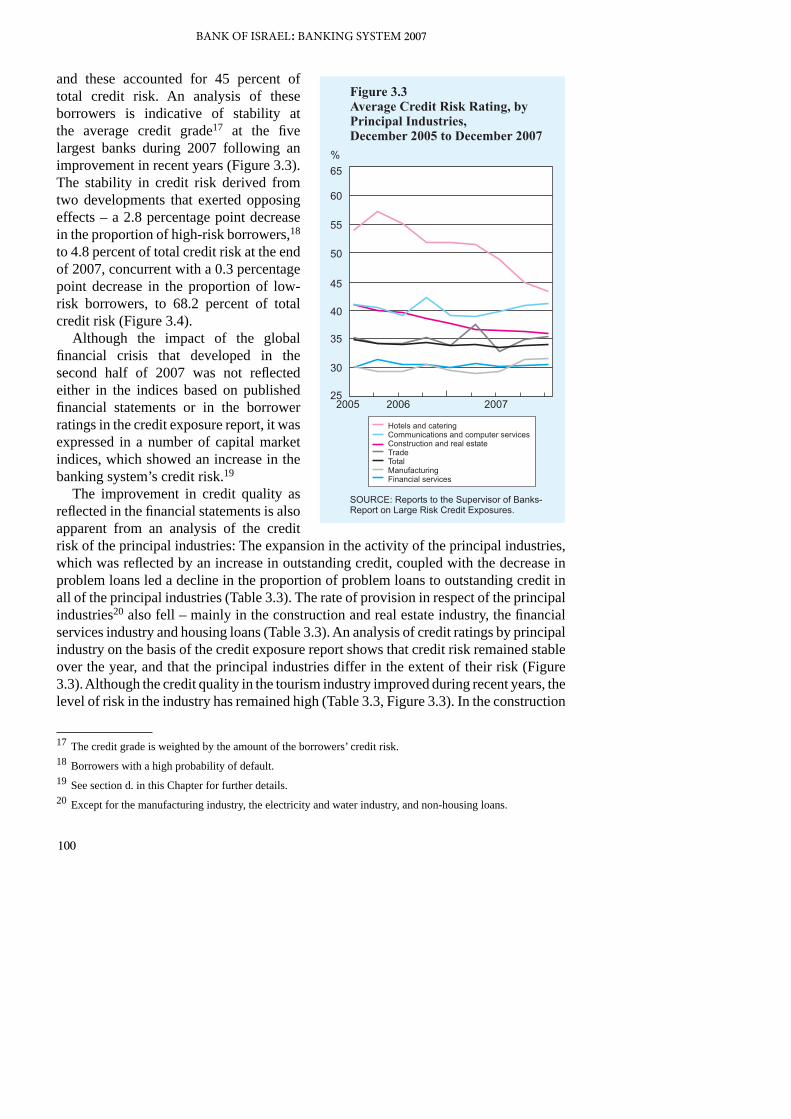
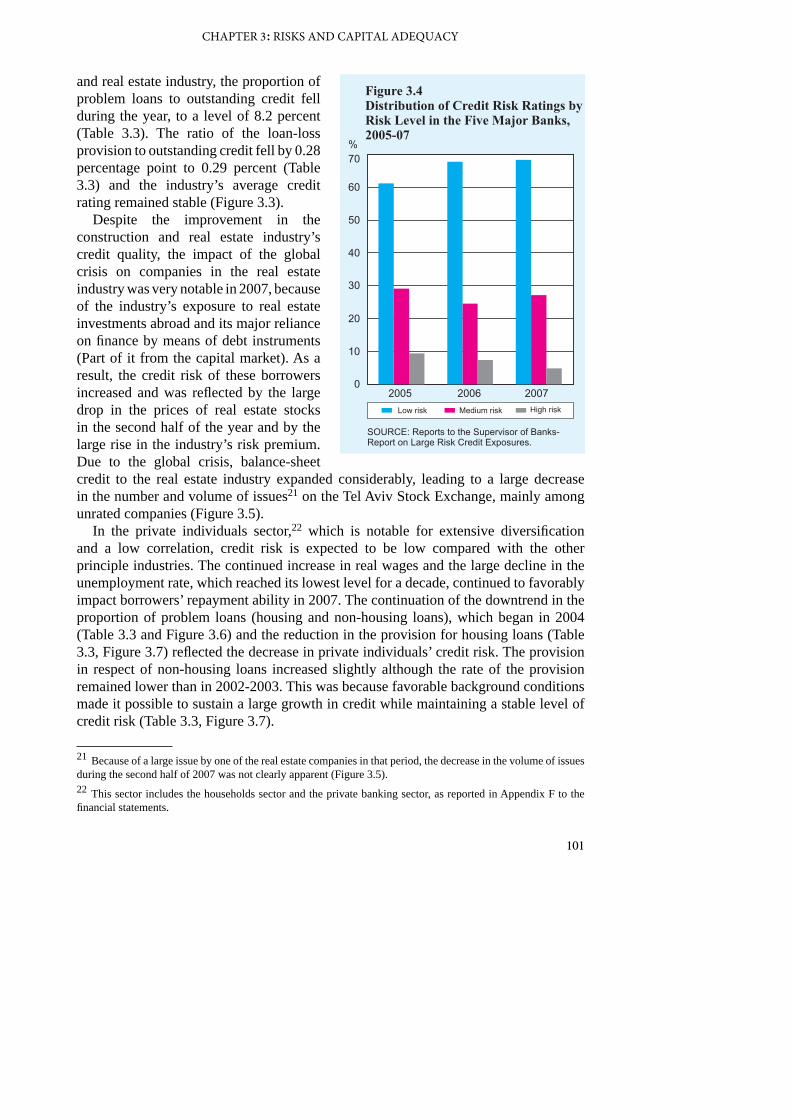
and these accounted for 45 percent of total credit risk. An analysis of these borrowers is indicative of stability at the average credit grade17 at the five largest banks during 2007 following an improvement in recent years (Figure 3.3). The stability in credit risk derived from two developments that exerted opposing effects – a 2.8 percentage point decrease in the proportion of high-risk borrowers,18 to 4.8 percent of total credit risk at the end of 2007, concurrent with a 0.3 percentage point decrease in the proportion of low-risk borrowers, to 68.2 percent of total credit risk (Figure 3.4).
Although the impact of the global financial crisis that developed in the second half of 2007 was not reflected either in the indices based on published financial statements or in the borrower ratings in the credit exposure report, it was expressed in a number of capital market indices, which showed an increase in the banking system’s credit risk.19
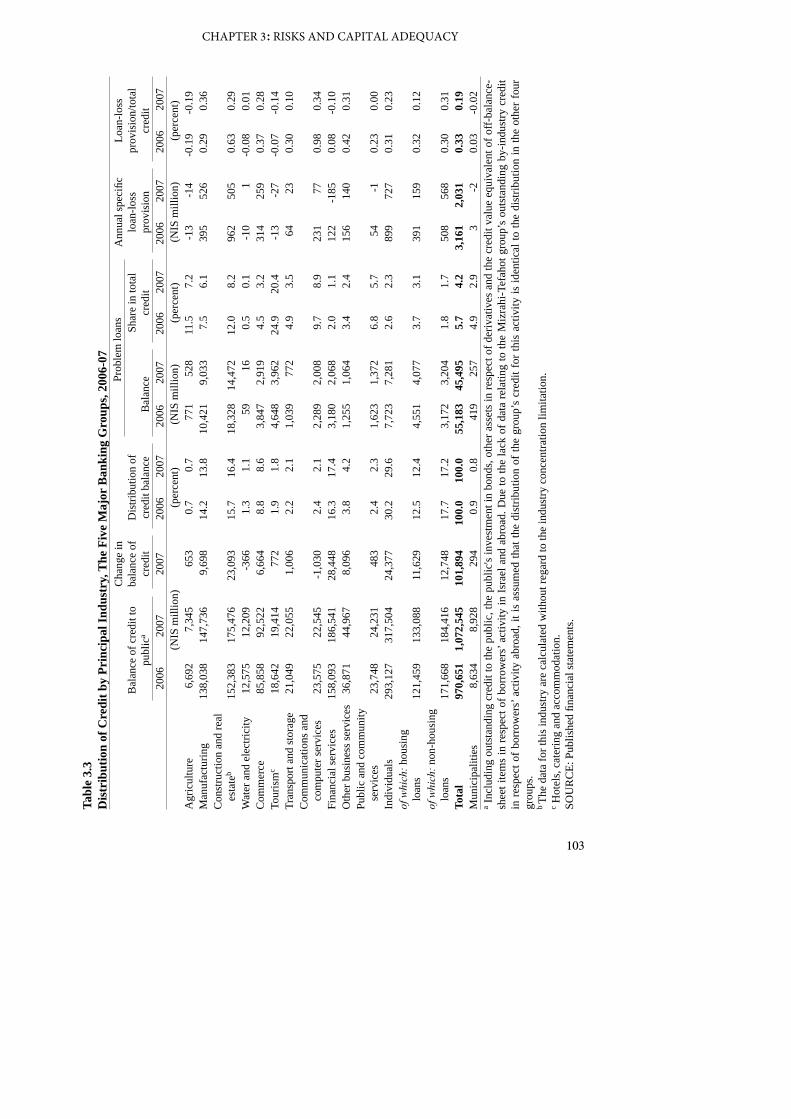
The improvement in credit quality as reflected in the financial statements is also apparent from an analysis of the credit risk of the principal industries: The expansion in the activity of the principal industries, which was reflected by an increase in outstanding credit, coupled with the decrease in problem loans led a decline in the proportion of problem loans to outstanding credit in all of the principal industries (Table 3.3). The rate of provision in respect of the principal industries20 also fell – mainly in the construction and real estate industry, the financial services industry and housing loans (Table 3.3). An analysis of credit ratings by principal industry on the basis of the credit exposure report shows that credit risk remained stable over the year, and that the principal industries differ in the extent of their risk (Figure 3.3). Although the credit quality in the tourism industry improved during recent years, the level of risk in the industry has remained high (Table 3.3, Figure 3.3). In the construction
17 The credit grade is weighted by the amount of the borrowers’ credit risk. 18 Borrowers with a high probability of default.19 See section d. in this Chapter for further details.20 Except for the manufacturing industry, the electricity and water industry, and non-housing loans.
101
CHAPTER 3: RISKS AND CAPITAL ADEQUACY
and real estate industry, the proportion of problem loans to outstanding credit fell during the year, to a level of 8.2 percent (Table 3.3). The ratio of the loan-loss provision to outstanding credit fell by 0.28 percentage point to 0.29 percent (Table 3.3) and the industry’s average credit rating remained stable (Figure 3.3).
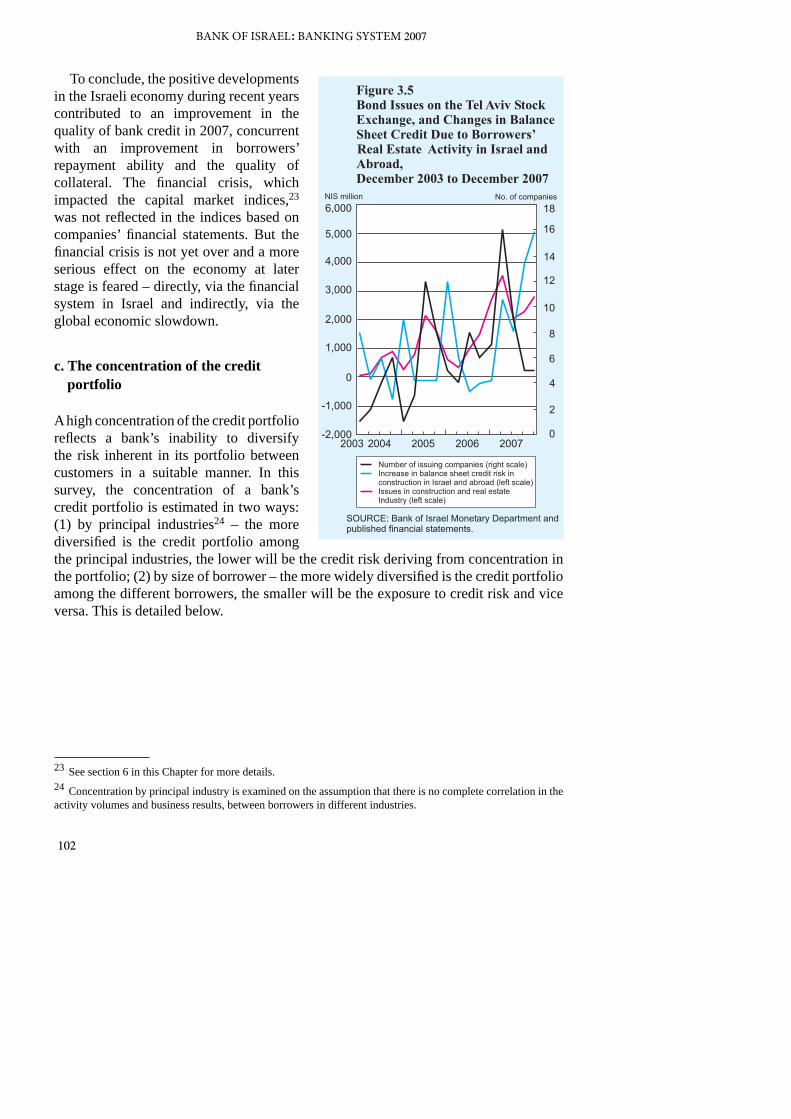
Despite the improvement in the construction and real estate industry’s credit quality, the impact of the global crisis on companies in the real estate industry was very notable in 2007, because of the industry’s exposure to real estate investments abroad and its major reliance on finance by means of debt instruments (Part of it from the capital market). As a result, the credit risk of these borrowers increased and was reflected by the large drop in the prices of real estate stocks in the second half of the year and by the large rise in the industry’s risk premium. Due to the global crisis, balance-sheet credit to the real estate industry expanded considerably, leading to a large decrease in the number and volume of issues21 on the Tel Aviv Stock Exchange, mainly among unrated companies (Figure 3.5).
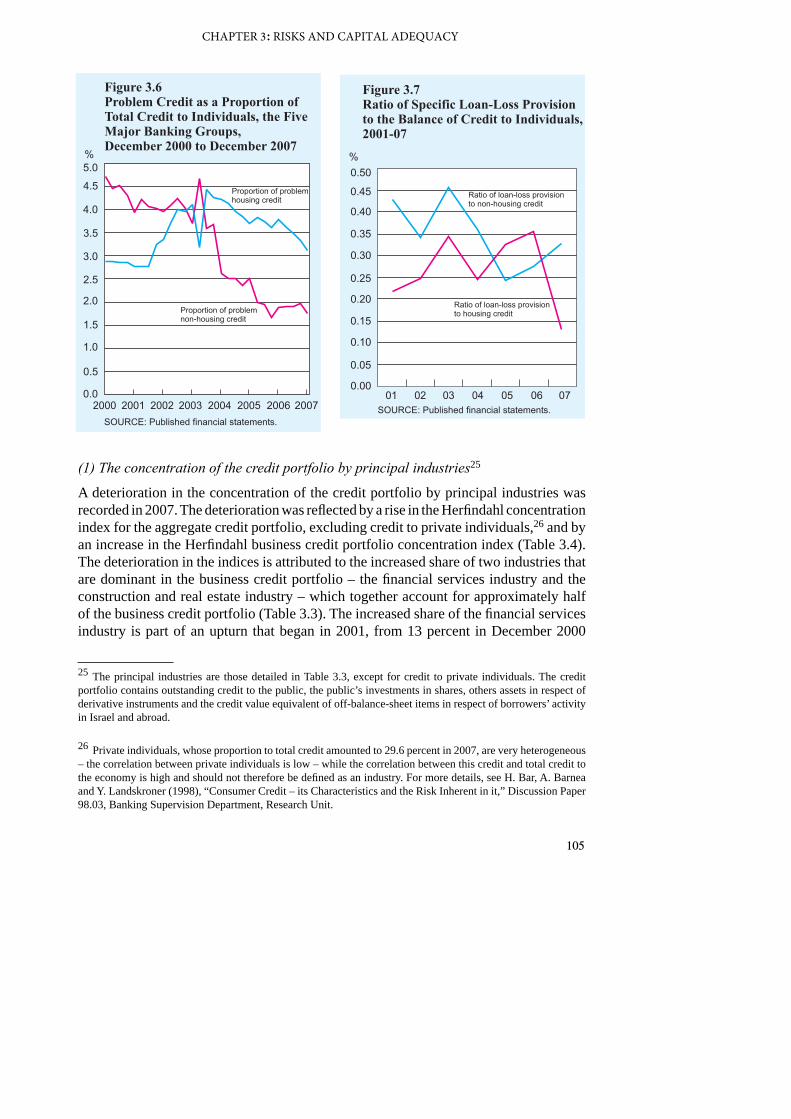
In the private individuals sector,22 which is notable for extensive diversification and a low correlation, credit risk is expected to be low compared with the other principle industries. The continued increase in real wages and the large decline in the unemployment rate, which reached its lowest level for a decade, continued to favorably impact borrowers’ repayment ability in 2007. The continuation of the downtrend in the proportion of problem loans (housing and non-housing loans), which began in 2004 (Table 3.3 and Figure 3.6) and the reduction in the provision for housing loans (Table 3.3, Figure 3.7) reflected the decrease in private individuals’ credit risk. The provision in respect of non-housing loans increased slightly although the rate of the provision remained lower than in 2002-2003. This was because favorable background conditions made it possible to sustain a large growth in credit while maintaining a stable level of credit risk (Table 3.3, Figure 3.7).
21 Because of a large issue by one of the real estate companies in that period, the decrease in the volume of issues during the second half of 2007 was not clearly apparent (Figure 3.5).22 This sector includes the households sector and the private banking sector, as reported in Appendix F to the financial statements.
102
BANK OF ISRAEL: BANKING SYSTEM 2007
To conclude, the positive developments in the Israeli economy during recent years contributed to an improvement in the quality of bank credit in 2007, concurrent with an improvement in borrowers’ repayment ability and the quality of collateral. The financial crisis, which impacted the capital market indices,23 was not reflected in the indices based on companies’ financial statements. But the financial crisis is not yet over and a more serious effect on the economy at later stage is feared – directly, via the financial system in Israel and indirectly, via the global economic slowdown.
c. The concentration of the credit portfolio
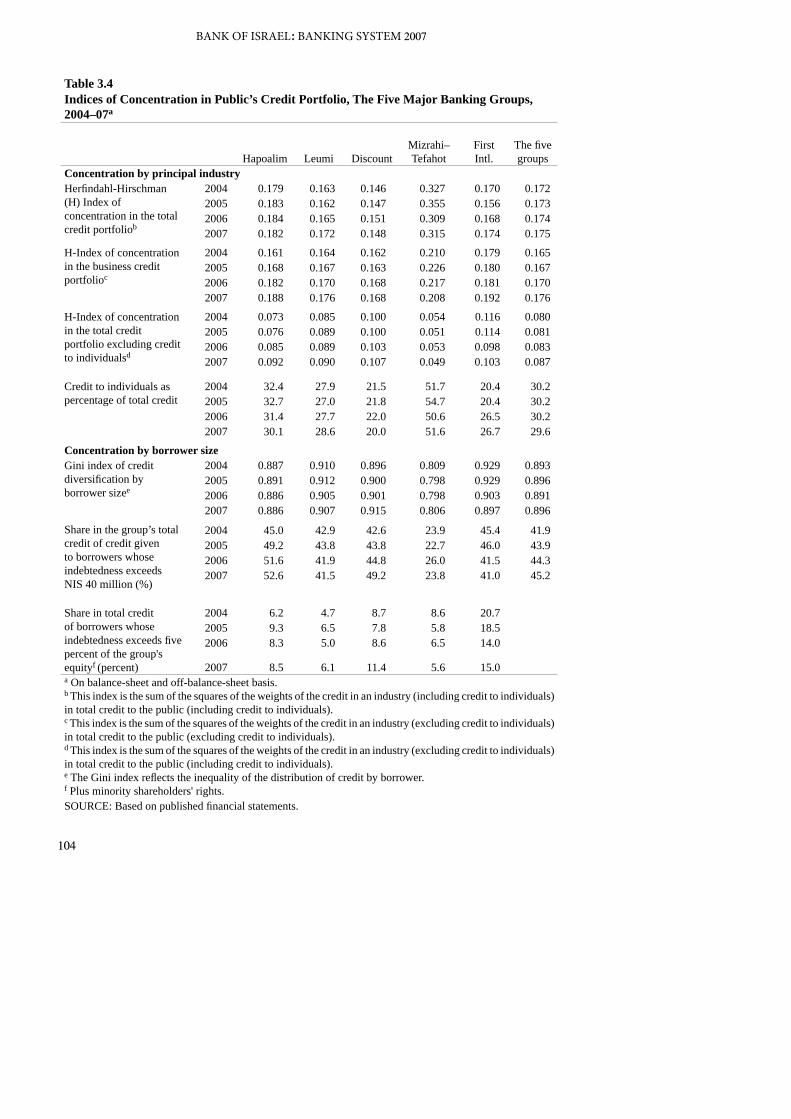
A high concentration of the credit portfolio reflects a bank’s inability to diversify the risk inherent in its portfolio between customers in a suitable manner. In this survey, the concentration of a bank’s credit portfolio is estimated in two ways: (1) by principal industries24 – the more diversified is the credit portfolio among the principal industries, the lower will be the credit risk deriving from concentration in the portfolio; (2) by size of borrower – the more widely diversified is the credit portfolio among the different borrowers, the smaller will be the exposure to credit risk and vice versa. This is detailed below.
23 See section 6 in this Chapter for more details.24 Concentration by principal industry is examined on the assumption that there is no complete correlation in the activity volumes and business results, between borrowers in different industries.
103
CHAPTER 3: RISKS AND CAPITAL ADEQUACY
Tabl
e 3.
3D
istr
ibut
ion
of C
redi
t by
Prin
cipa
l Ind
ustr
y, T
he F
ive
Maj
or B
anki
ng G
roup
s, 20
06-0
7
Bal
ance
of c
redi
t to
publ
ica
Cha
nge
in
bala
nce
of
cred
itD
istri
butio
n of
cr
edit
bala
nce
Prob
lem
loan
sA
nnua
l spe
cific
lo
an-lo
ss
prov
isio
n
Loan
-loss
pr
ovis
ion/
tota
l cr
edit
Bal
ance
Shar
e in
tota
l cr
edit
2006
20
07
2007
20
06
2007
20
06
2007
20
06
2007
20
06
2007
20
06
2007
(N
IS m
illio
n)(p
erce
nt)
(NIS
mill
ion)
(per
cent
)(N
IS m
illio
n)(p
erce
nt)
Agr
icul
ture
6,69
2 7,
345
653
0.7
0.7
771
528
11.5
7.
2 -1
3-1
4-0
.19
-0.1
9 M
anuf
actu
ring
138,
038
147,
736
9,69
8 14
.2
13.8
10
,421
9,
033
7.5
6.1
395
526
0.29
0.
36
Con
stru
ctio
n an
d re
al
es
tate
b15
2,38
3 17
5,47
6 23
,093
15
.7
16.4
18
,328
14
,472
12
.0
8.2
962
505
0.63
0.
29
Wat
er a
nd e
lect
ricity
12,5
75
12,2
09
-366
1.
3 1.
1 59
16
0.
5 0.
1 -1
01
-0.0
8 0.
01
Com
mer
ce85
,858
92
,522
6,
664
8.8
8.6
3,84
7 2,
919
4.5
3.2
314
259
0.37
0.
28
Tour
ism
c18
,642
19
,414
77
2 1.
9 1.
8 4,
648
3,96
2 24
.9
20.4
-1
3-2
7-0
.07
-0.1
4 Tr
ansp
ort a
nd st
orag
e21
,049
22
,055
1,
006
2.2
2.1
1,03
9 77
2 4.
9 3.
5 64
23
0.
30
0.10
C
omm
unic
atio
ns a
nd
com
pute
r ser
vice
s23
,575
22
,545
-1
,030
2.
4 2.
1 2,
289
2,00
8 9.
7 8.
9 23
1 77
0.
98
0.34
Fi
nanc
ial s
ervi
ces
158,
093
186,
541
28,4
48
16.3
17
.4
3,18
0 2,
068
2.0
1.1
122
-185
0.08
-0
.10
Oth
er b
usin
ess s
ervi
ces
36,8
71
44,9
67
8,09
6 3.
8 4.
2 1,
255
1,06
4 3.
4 2.
4 15
6 14
0 0.
42
0.31
Pu
blic
and
com
mun
ity
serv
ices
23,7
48
24,2
31
483
2.4
2.3
1,62
3 1,
372
6.8
5.7
54
-10.
23
0.00
In
divi
dual
s29
3,12
7 31
7,50
4 24
,377
30
.2
29.6
7,
723
7,28
1 2.
6 2.
3 89
9 72
7 0.
31
0.23
of
whi
ch: h
ousi
ng
lo
ans
121,
459
133,
088
11,6
29
12.5
12
.4
4,55
1 4,
077
3.7
3.1
391
159
0.32
0.
12
of w
hich
: non
-hou
sing
lo
ans
171,
668
184,
416
12,7
48
17.7
17
.2
3,17
2 3,
204
1.8
1.7
508
568
0.30
0.
31
Tota
l97
0,65
1 1,
072,
545
101,
894
100.
0 10
0.0
55,1
83
45,4
95
5.7
4.2
3,16
1 2,
031
0.33
0.
19
Mun
icip
aliti
es8,
634
8,92
8 29
4 0.
9 0.
8 41
9 25
7 4.
9 2.
9 3
-20.
03
-0.0
2 a I
nclu
ding
out
stan
ding
cre
dit t
o th
e pu
blic
, the
pub
lic's
inve
stm
ent i
n bo
nds,
othe
r ass
ets i
n re
spec
t of d
eriv
ativ
es a
nd th
e cr
edit
valu
e eq
uiva
lent
of o
ff-ba
lanc
e-sh
eet i
tem
s in
resp
ect o
f bor
row
ers’
activ
ity in
Isra
el a
nd a
broa
d. D
ue to
the
lack
of d
ata
rela
ting
to th
e M
izra
hi-T
efah
ot g
roup
’s o
utst
andi
ng b
y-in
dust
ry c
redi
t in
resp
ect o
f bor
row
ers’
activ
ity a
broa
d, it
is a
ssum
ed th
at th
e di
strib
utio
n of
the
grou
p’s
cred
it fo
r thi
s ac
tivity
is id
entic
al to
the
dist
ribut
ion
in th
e ot
her f
our
grou
ps.
b Th
e da
ta fo
r thi
s ind
ustry
are
cal
cula
ted
with
out r
egar
d to
the
indu
stry
con
cent
ratio
n lim
itatio
n.
c Hot
els,
cate
ring
and
acco
mm
odat
ion.
SOU
RC
E: P
ublis
hed
finan
cial
stat
emen
ts.
104
BANK OF ISRAEL: BANKING SYSTEM 2007
Table 3.4Indices of Concentration in Public’s Credit Portfolio, The Five Major Banking Groups, 2004–07a
The five groupsHapoalim Leumi Discount
Mizrahi–Tefahot
First Intl.
Concentration by principal industryHerfindahl-Hirschman (H) Index of concentration in the total credit portfoliob
2004 0.179 0.163 0.146 0.327 0.170 0.1722005 0.183 0.162 0.147 0.355 0.156 0.1732006 0.184 0.165 0.151 0.309 0.168 0.1742007 0.182 0.172 0.148 0.315 0.174 0.175
H-Index of concentration in the business credit portfolioc
2004 0.161 0.164 0.162 0.210 0.179 0.1652005 0.168 0.167 0.163 0.226 0.180 0.1672006 0.182 0.170 0.168 0.217 0.181 0.1702007 0.188 0.176 0.168 0.208 0.192 0.176
H-Index of concentration in the total credit portfolio excluding credit to individualsd
2004 0.073 0.085 0.100 0.054 0.116 0.0802005 0.076 0.089 0.100 0.051 0.114 0.0812006 0.085 0.089 0.103 0.053 0.098 0.0832007 0.092 0.090 0.107 0.049 0.103 0.087
Credit to individuals as percentage of total credit
2004 32.4 27.9 21.5 51.7 20.4 30.22005 32.7 27.0 21.8 54.7 20.4 30.22006 31.4 27.7 22.0 50.6 26.5 30.22007 30.1 28.6 20.0 51.6 26.7 29.6
Concentration by borrower sizeGini index of credit diversification by borrower sizee
2004 0.887 0.910 0.896 0.809 0.929 0.8932005 0.891 0.912 0.900 0.798 0.929 0.8962006 0.886 0.905 0.901 0.798 0.903 0.8912007 0.886 0.907 0.915 0.806 0.897 0.896
Share in the group’s total credit of credit given to borrowers whose indebtedness exceeds NIS 40 million (%)
2004 45.0 42.9 42.6 23.9 45.4 41.92005 49.2 43.8 43.8 22.7 46.0 43.92006 51.6 41.9 44.8 26.0 41.5 44.32007 52.6 41.5 49.2 23.8 41.0 45.2
Share in total credit of borrowers whose indebtedness exceeds five percent of the group's equityf (percent)
2004 6.2 4.7 8.7 8.6 20.72005 9.3 6.5 7.8 5.8 18.52006 8.3 5.0 8.6 6.5 14.0
2007 8.5 6.1 11.4 5.6 15.0a On balance-sheet and off-balance-sheet basis.b This index is the sum of the squares of the weights of the credit in an industry (including credit to individuals) in total credit to the public (including credit to individuals).c This index is the sum of the squares of the weights of the credit in an industry (excluding credit to individuals) in total credit to the public (excluding credit to individuals).d This index is the sum of the squares of the weights of the credit in an industry (excluding credit to individuals) in total credit to the public (including credit to individuals).e The Gini index reflects the inequality of the distribution of credit by borrower.f Plus minority shareholders' rights.SOURCE: Based on published financial statements.
105
CHAPTER 3: RISKS AND CAPITAL ADEQUACY
(1) The concentration of the credit portfolio by principal industries25
A deterioration in the concentration of the credit portfolio by principal industries was recorded in 2007. The deterioration was reflected by a rise in the Herfindahl concentration index for the aggregate credit portfolio, excluding credit to private individuals,26 and by an increase in the Herfindahl business credit portfolio concentration index (Table 3.4). The deterioration in the indices is attributed to the increased share of two industries that are dominant in the business credit portfolio – the financial services industry and the construction and real estate industry – which together account for approximately half of the business credit portfolio (Table 3.3). The increased share of the financial services industry is part of an upturn that began in 2001, from 13 percent in December 2000
25 The principal industries are those detailed in Table 3.3, except for credit to private individuals. The credit portfolio contains outstanding credit to the public, the public’s investments in shares, others assets in respect of derivative instruments and the credit value equivalent of off-balance-sheet items in respect of borrowers’ activity in Israel and abroad.
26 Private individuals, whose proportion to total credit amounted to 29.6 percent in 2007, are very heterogeneous – the correlation between private individuals is low – while the correlation between this credit and total credit to the economy is high and should not therefore be defined as an industry. For more details, see H. Bar, A. Barnea and Y. Landskroner (1998), “Consumer Credit – its Characteristics and the Risk Inherent in it,” Discussion Paper 98.03, Banking Supervision Department, Research Unit.
106
BANK OF ISRAEL: BANKING SYSTEM 2007
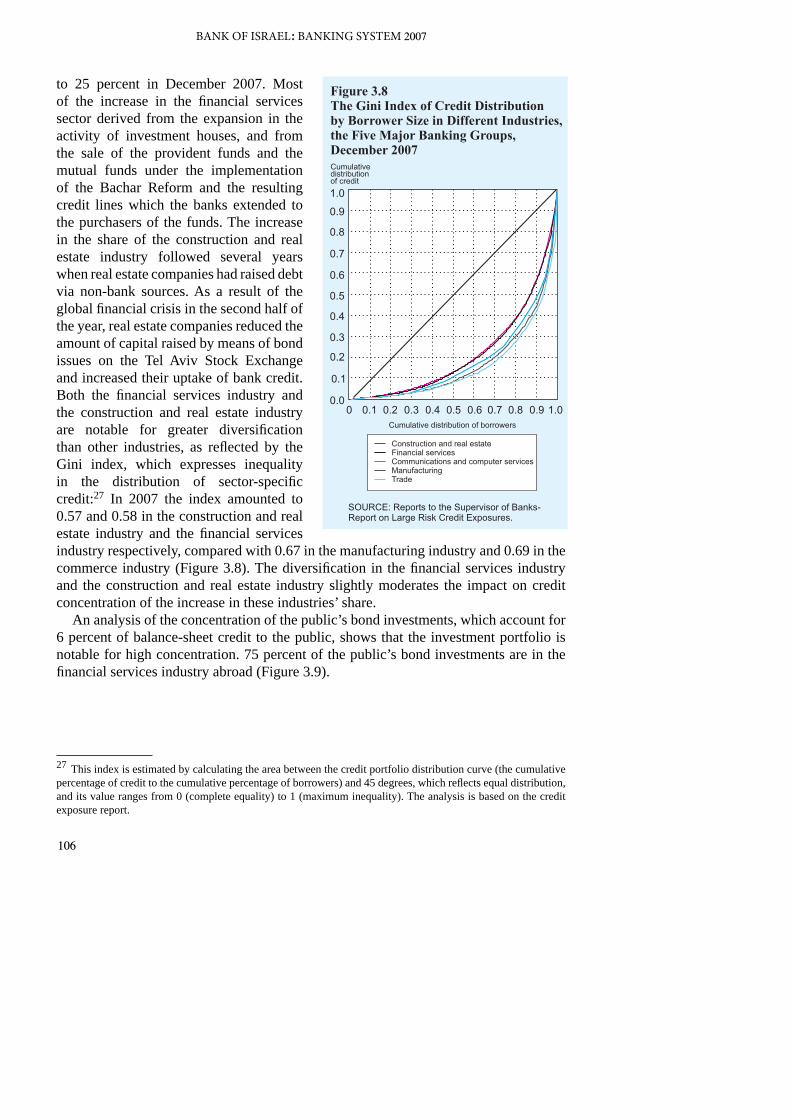
to 25 percent in December 2007. Most of the increase in the financial services sector derived from the expansion in the activity of investment houses, and from the sale of the provident funds and the mutual funds under the implementation of the Bachar Reform and the resulting credit lines which the banks extended to the purchasers of the funds. The increase in the share of the construction and real estate industry followed several years when real estate companies had raised debt via non-bank sources. As a result of the global financial crisis in the second half of the year, real estate companies reduced the amount of capital raised by means of bond issues on the Tel Aviv Stock Exchange and increased their uptake of bank credit. Both the financial services industry and the construction and real estate industry are notable for greater diversification than other industries, as reflected by the Gini index, which expresses inequality in the distribution of sector-specific credit:27 In 2007 the index amounted to 0.57 and 0.58 in the construction and real estate industry and the financial services industry respectively, compared with 0.67 in the manufacturing industry and 0.69 in the commerce industry (Figure 3.8). The diversification in the financial services industry and the construction and real estate industry slightly moderates the impact on credit concentration of the increase in these industries’ share.
An analysis of the concentration of the public’s bond investments, which account for 6 percent of balance-sheet credit to the public, shows that the investment portfolio is notable for high concentration. 75 percent of the public’s bond investments are in the financial services industry abroad (Figure 3.9).
27 This index is estimated by calculating the area between the credit portfolio distribution curve (the cumulative percentage of credit to the cumulative percentage of borrowers) and 45 degrees, which reflects equal distribution, and its value ranges from 0 (complete equality) to 1 (maximum inequality). The analysis is based on the credit exposure report.

107
CHAPTER 3: RISKS AND CAPITAL ADEQUACY
The onset of the global financial crisis in the second half of the year and the high proportion of investment in that industry to total bonds of the public led to a rise in the credit risk of part of the banks.28
(2) Credit concentration by borrower size
Another index employed for examining the concentration of the credit portfolio is the extent of the portfolio’s diversification between different borrowers. The banks’ credit portfolio is notable for high concentration by borrowers: The credit risk of the ten largest borrowers was equivalent to 4.1 percent of total credit risk and 73.4 percent of shareholders’ equity in 2007, and the proportion of the six largest borrowers groups amounted to 9.4 percent of total credit risk and 160 percent of shareholders’ equity.29 Although large business firms increased their bond issues on the Tel Aviv Stock Exchange in recent years, which favorably affected the distribution of the bank credit portfolio,30 the proportion of large borrowers in the banking system remained high.
The increase in the concentration of the credit portfolio by borrower size in 2007 was expressed by a number of indices: The Gini index of credit portfolio diversification by borrower size at the five largest banking groups rose slightly during the year, from 0.891 to 0.896 (Table 3.4), because the rate of expansion in business credit exceeded that in credit to private individuals – a group notable for high diversification among small borrowers.31 The changes in the composition of the credit portfolio in 2007 followed several years of a static level of business credit and a large increase in credit to private individuals resulting from the increased availability of non-bank credit substitutes for business firms concurrent with the lack of such credit substitutes for private individuals. The proportion of credit to large borrowers with an obligo in excess of NIS 40 million to total credit rose by one percentage point (Table 3.4). The proportion of credit to the ten largest and six largest borrowers to total credit increased by 0.5 percentage point and 0.2 percentage point respectively.
28 See Box 3.1 for further details.29 Source: Credit exposure report.30 For further details on this subject, see M. Zilberberg and D. Ruthenberg (2008), “Characteristics of Business Firms with Indebtedness to the Bank which Issued Bonds on the Tel Aviv Stock Exchange in Recent Years,” Bank of Israel, Banking Supervision Department, Research Unit, Discussion Paper 08.01.31 See Chapter 1 for more details.
108
BANK OF ISRAEL: BANKING SYSTEM 2007
2. MARKET RISK
a. General
Market risk is defined as the risk of erosion in a bank’s net work due to unexpected changes in market prices (interest rates, share prices, the exchange rate and inflation).
The analysis of market risks in this survey is based on Value at Risk (VaR). This value expresses the maximum loss to be expected on the holding of financial instruments that are sensitive to changes in market prices for a given planning horizon and a given confidence level at a particular point in time. In this section VaR is calculated in respect of the interest-rate risks in the three indexation segments (the unindexed local currency segment, the CPI-indexed segment and the foreign currency segment) and in respect of indexation base risks (exchange rates and inflation), by means of the normal distribution approach, which is based on the following assumptions: (1) a normal distribution of risk factors;32 (2) a planning horizon of 10 days; (3) a confidence level of 99 percent; (4) no account is taken of correlations between changes in different market prices; (5) daily data for the past year are used; (6) the positions are based on the data presented in the bank’s financial statements (including the effect of futures transactions).
b. Interest-rate risks
(1) General
Interest-rate risk is the risk that unexpected changes in interest rates will cause a bank’s financial position to deteriorate (or will reduce the bank’s net worth33). This risk arises when the relative sensitivity of the bank’s assets to unexpected changes in interest rates differs from that of its liabilities. The exposure to interest-rate risk, which is reflected
32 There are two other approaches for estimating VaR: the Monte Carlo simulations approach and the historical simulations approach. The former is built on a specific distribution while the latter does not assume the existence of a specific model, and is based on the prices of assets in the past. Each of the methods has its advantages and disadvantages. The Monte Carlo simulations approach is difficult to apply and the risk inherent in it is that the distribution selected for a scenario may not reflect the future. The historical simulations approach requires a long data-sampling period in order to calculate VaR over a time interval. As an example, in order to calculate VaR over 10 days, a data base ten times larger than that required in the normal approach is necessary. This approach could be heavily affected by past events. The normal distribution approach assumes that daily yields are not interdependent, with the result that a change in prices over a period of 10 days is distributed normally with an average and variability equal to 10 times the average and the daily variability. It should be noted that the assumption of the normality of changes in each of the risk factors is reasonable (if not accurate) – except in the case of options, which do not behave normally, but it is assumed that the gap between this behavior and normal behavior is not significant.33 The economic value of a bank’s financial capital (net worth) is calculated by means of the difference between the present value of assets and the present value of liabilities. The present value of assets and liabilities is obtained by discounting the future flow (principal and interest) by the market interest rate in accordance with the timing structure of the relevant interest rates for each segment, i.e., for every asset and liability with a similar duration.
109
CHAPTER 3: RISKS AND CAPITAL ADEQUACY
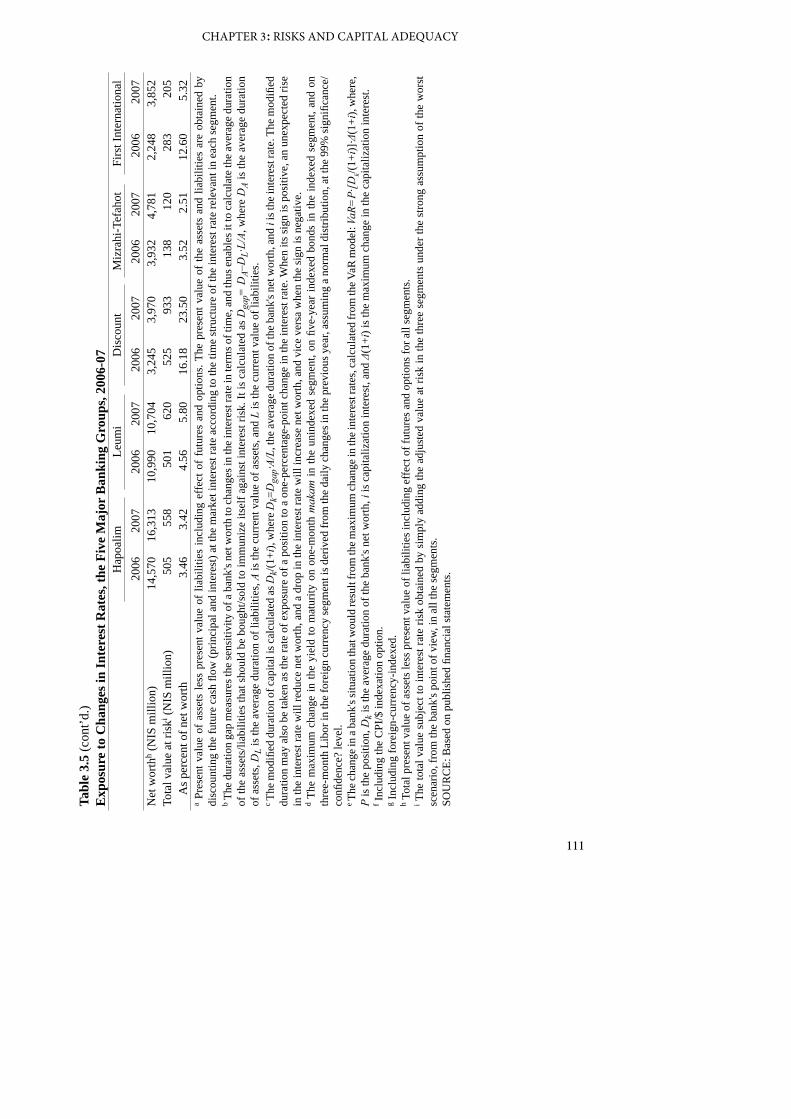
by the VaR of the bank’s positions34, is affected by three elements: (1) the difference between the present value of assets and the present value of liabilities plus the effect of futures transactions (hereinafter: the position);35 (2) the position’s sensitivity to changes in interest rates, which is measured via duration (average term to maturity), or adjusted duration; (3) the maximum change in the interest rate during the planning horizon. The first two elements are dependent on the distribution of the assets and liabilities of each and every bank and their characteristics over time, while the third is uniform for all of them since it is derived from the volatility in interest rates.
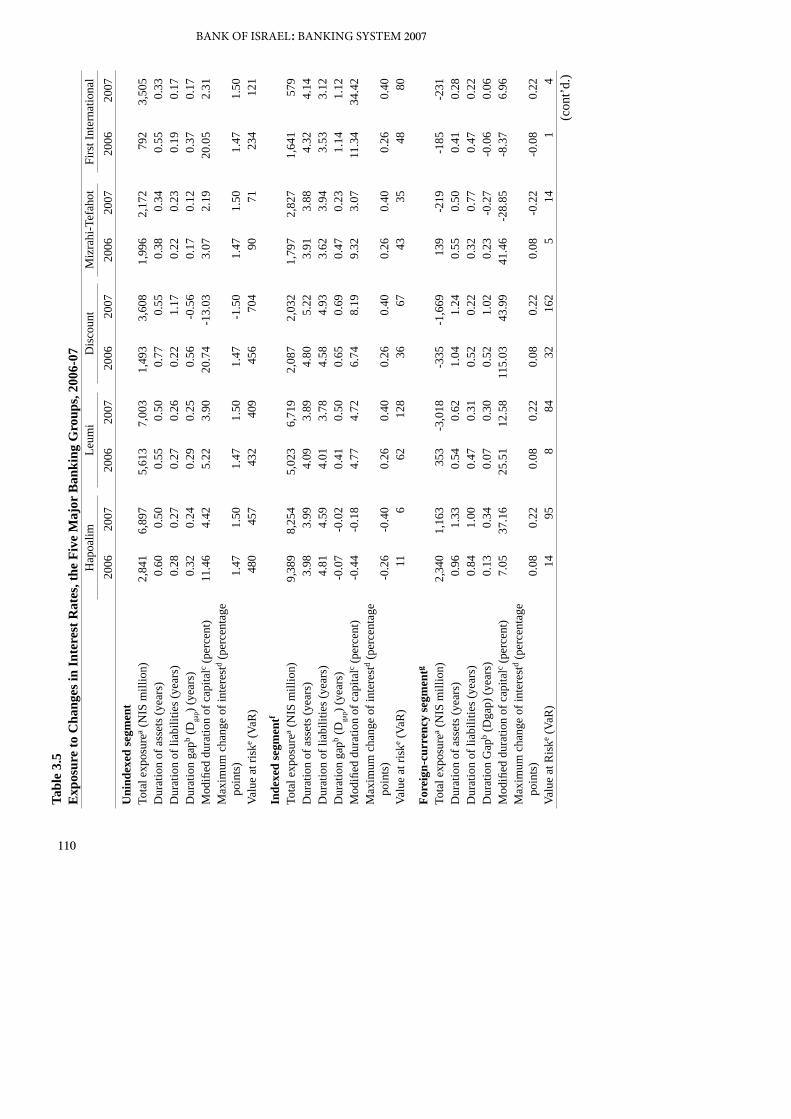
(2) Value at interest-rate risk
Total value at interest-rate risk rose during the year at most of the banking groups except the First International, and amounted to NIS 2.4 billion compared with NIS 2.0 billion in 2006 (Table 3.5). The value at interest-rate risk at the five banking groups ranged between 3.4 percent and 5.8 percent of net worth except at the Discount group, where the ratio was particularly high and amounted to 23.5 percent.
Most of the growth in the value at interest-rate risk during 2007 was recorded in the foreign-currency segment. The value at interest-rate risk in the foreign-currency segment is generally lower than in the local currency segments due to the banks’ policy of maintaining
34 This value is the change expected in the economic value of a position in the event of the maximum change expected in the interest rate, and is calculated by means of the following equation:
where P – the position, kD – the duration of the economic value of the bank’s capital , i – the discount inter-
est rate and ( )i1+Δ – the maximum change in the interest rate at a probability of 99 percent (that is, the change in the interest rate will be less than it at a probability of 99 percent and greater than it at a probability of 1 per-cent). The second term on the right-hand side of the equation is the adjusted duration of the capital. The longer is the adjusted duration of an asset, the larger will the change in the asset’s present value resulting from an inter-est rate adjustment, and thereby reflects a high interest-rate risk. See Table 3.5 for details.35 Based on the accounting report in Appendix D to the published annual report.
)1()1( ik
p VaRi
DPVaR +⋅
+⋅= Δ(1+i)
110
BANK OF ISRAEL: BANKING SYSTEM 2007Ta
ble
3.5
Exp
osur
e to
Cha
nges
in In
tere
st R
ates
, the
Fiv
e M
ajor
Ban
king
Gro
ups,
2006
-07
Hap
oalim
Leum
iD
isco
unt
Miz
rahi
-Tef
ahot
Firs
t Int
erna
tiona
l20
0620
0720
0620
0720
0620
0720
0620
0720
0620
07U
nind
exed
segm
ent
Tota
l exp
osur
ea (N
IS m
illio
n)2,
841
6,89
75,
613
7,00
31,
493
3,60
81,
996
2,17
279
23,
505
Dur
atio
n of
ass
ets (
year
s)0.
600.
500.
550.
500.
770.
550.
380.
340.
550.
33D
urat
ion
of li
abili
ties (
year
s)0.
280.
270.
270.
260.
221.
170.
220.
230.
190.
17D
urat
ion
gapb (
Dga
p) (y
ears
)0.
320.
240.
290.
250.
56-0
.56
0.17
0.12
0.37
0.17
Mod
ified
dur
atio
n of
cap
italc (
perc
ent)
11.4
64.
425.
223.
9020
.74
-13.
033.
072.
1920
.05
2.31
Max
imum
cha
nge
of in
tere
std (
perc
enta
ge
poin
ts)
1.47
1.50
1.47
1.50
1.47
-1.5
01.
471.
501.
471.
50Va
lue
at ri
ske (
VaR
)48
045
743
240
945
670
490
7123
412
1
Inde
xed
segm
entf
Tota
l exp
osur
ea (N
IS m
illio
n)9,
389
8,25
45,
023
6,71
92,
087
2,03
21,
797
2,82
71,
641
579
Dur
atio
n of
ass
ets (
year
s)3.
983.
994.
093.
894.
805.
223.
913.
884.
324.
14D
urat
ion
of li
abili
ties (
year
s)4.
814.
594.
013.
784.
584.
933.
623.
943.
533.
12D
urat
ion
gapb (
Dga
p) (y
ears
)-0
.07
-0.0
20.
410.
500.
650.
690.
470.
231.
141.
12M
odifi
ed d
urat
ion
of c
apita
lc (pe
rcen
t)-0
.44
-0.1
84.
774.
726.
748.
199.
323.
0711
.34
34.4
2M
axim
um c
hang
e of
inte
rest
d (pe
rcen
tage
poin
ts)
-0.2
6-0
.40
0.26
0.40
0.26
0.40
0.26
0.40
0.26
0.40
Valu
e at
risk
e (Va
R)
116
6212
836
6743
3548
80
Fore
ign-
curr
ency
segm
entg
Tota
l exp
osur
ea (N
IS m
illio
n)2,
340
1,16
335
3-3
,018
-335
-1,6
6913
9-2
19-1
85-2
31D
urat
ion
of a
sset
s (ye
ars)
0.96
1.33
0.54
0.62
1.04
1.24
0.55
0.50
0.41
0.28
Dur
atio
n of
liab
ilitie
s (ye
ars)
0.84
1.00
0.47
0.31
0.52
0.22
0.32
0.77
0.47
0.22
Dur
atio
n G
apb (
Dga
p) (y
ears
)0.
130.
340.
070.
300.
521.
020.
23-0
.27
-0.0
60.
06M
odifi
ed d
urat
ion
of c
apita
lc (pe
rcen
t)7.
0537
.16
25.5
112
.58
115.
0343
.99
41.4
6-2
8.85
-8.3
76.
96M
axim
um c
hang
e of
inte
rest
d (pe
rcen
tage
poin
ts)
0.08
0.22
0.08
0.22
0.08
0.22
0.08
-0.2
2-0
.08
0.22
Valu
e at
Ris
ke (Va
R)
1495
884
3216
25
141
4(c
ont’d
.)
111
CHAPTER 3: RISKS AND CAPITAL ADEQUACY
Tabl
e 3.
5 (c
ont’d
.)E
xpos
ure
to C
hang
es in
Inte
rest
Rat
es, t
he F
ive
Maj
or B
anki
ng G
roup
s, 20
06-0
7H
apoa
limLe
umi
Dis
coun
tM
izra
hi-T
efah
otFi
rst I
nter
natio
nal
2006
2007
2006
2007
2006
2007
2006
2007
2006
2007
Net
wor
thh (
NIS
mill
ion)
14,5
7016
,313
10,9
9010
,704
3,24
53,
970
3,93
24,
781
2,24
83,
852
Tota
l val
ue a
t ris
ki (N
IS m
illio
n)50
555
850
162
052
593
313
812
028
320
5
As p
erce
nt o
f net
wor
th3.
463.
424.
565.
8016
.18
23.5
03.
522.
5112
.60
5.32
a Pre
sent
val
ue o
f as
sets
less
pre
sent
val
ue o
f lia
bilit
ies
incl
udin
g ef
fect
of
futu
res
and
optio
ns. T
he p
rese
nt v
alue
of
the
asse
ts a
nd li
abili
ties
are
obta
ined
by
disc
ount
ing
the
futu
re c
ash
flow
(prin
cipa
l and
inte
rest
) at t
he m
arke
t int
eres
t rat
e ac
cord
ing
to th
e tim
e st
ruct
ure
of th
e in
tere
st ra
te re
leva
nt in
eac
h se
gmen
t.b T
he d
urat
ion
gap
mea
sure
s the
sens
itivi
ty o
f a b
ank'
s net
wor
th to
cha
nges
in th
e in
tere
st ra
te in
term
s of t
ime,
and
thus
ena
bles
it to
cal
cula
te th
e av
erag
e du
ratio
n of
the
asse
ts/li
abili
ties t
hat s
houl
d be
bou
ght/s
old
to im
mun
ize
itsel
f aga
inst
inte
rest
risk
. It i
s cal
cula
ted
as D
gap=
DA–
DL·
L/A,
whe
re D
A is
the
aver
age
dura
tion
of a
sset
s, D
L is
the
aver
age
dura
tion
of li
abili
ties,
A is
the
curr
ent v
alue
of a
sset
s, an
d L
is th
e cu
rren
t val
ue o
f lia
bilit
ies.
c The
mod
ified
dur
atio
n of
capi
tal i
s cal
cula
ted
as D
k/(1+
i), w
here
Dk=
Dga
p·A/
L, th
e ave
rage
dur
atio
n of
the b
ank'
s net
wor
th, a
nd i
is th
e int
eres
t rat
e. T
he m
odifi
ed
dura
tion
may
als
o be
take
n as
the
rate
of e
xpos
ure
of a
pos
ition
to a
one
-per
cent
age-
poin
t cha
nge
in th
e in
tere
st ra
te. W
hen
its si
gn is
pos
itive
, an
unex
pect
ed ri
se
in th
e in
tere
st ra
te w
ill re
duce
net
wor
th, a
nd a
dro
p in
the
inte
rest
rate
will
incr
ease
net
wor
th, a
nd v
ice
vers
a w
hen
the
sign
is n
egat
ive.
d
The
max
imum
cha
nge
in th
e yi
eld
to m
atur
ity o
n on
e-m
onth
mak
am in
the
unin
dexe
d se
gmen
t, on
five
-yea
r in
dexe
d bo
nds
in th
e in
dexe
d se
gmen
t, an
d on
th
ree-
mon
th L
ibor
in th
e fo
reig
n cu
rren
cy se
gmen
t is d
eriv
ed fr
om th
e da
ily c
hang
es in
the
prev
ious
yea
r, as
sum
ing
a no
rmal
dis
tribu
tion,
at t
he 9
9% si
gnifi
canc
e/co
nfide
nce?
leve
l.e T
he ch
ange
in a
bank
's si
tuat
ion
that
wou
ld re
sult
from
the m
axim
um ch
ange
in th
e int
eres
t rat
es, c
alcu
late
d fr
om th
e VaR
mod
el: V
aR=
P·[D
k/(1+
i)]·Δ
(1+i
), w
here
, P
is th
e po
sitio
n, D
k is t
he a
vera
ge d
urat
ion
of th
e ba
nk's
net w
orth
, i is
cap
italiz
atio
n in
tere
st, a
nd Δ
(1+i
) is t
he m
axim
um c
hang
e in
the
capi
taliz
atio
n in
tere
st.
f Inc
ludi
ng th
e C
PI/$
inde
xatio
n op
tion.
g Inc
ludi
ng fo
reig
n-cu
rren
cy-in
dexe
d.h T
otal
pre
sent
val
ue o
f ass
ets l
ess p
rese
nt v
alue
of l
iabi
litie
s inc
ludi
ng e
ffect
of f
utur
es a
nd o
ptio
ns fo
r all
segm
ents
.i T
he to
tal v
alue
sub
ject
to in
tere
st ra
te ri
sk o
btai
ned
by s
impl
y ad
ding
the
adju
sted
val
ue a
t ris
k in
the
thre
e se
gmen
ts u
nder
the
stro
ng a
ssum
ptio
n of
the
wor
st
scen
ario
, fro
m th
e ba
nk's
poin
t of v
iew
, in
all t
he se
gmen
ts.
SOU
RC
E: B
ased
on
publ
ishe
d fin
anci
al st
atem
ents
.
112
BANK OF ISRAEL: BANKING SYSTEM 2007
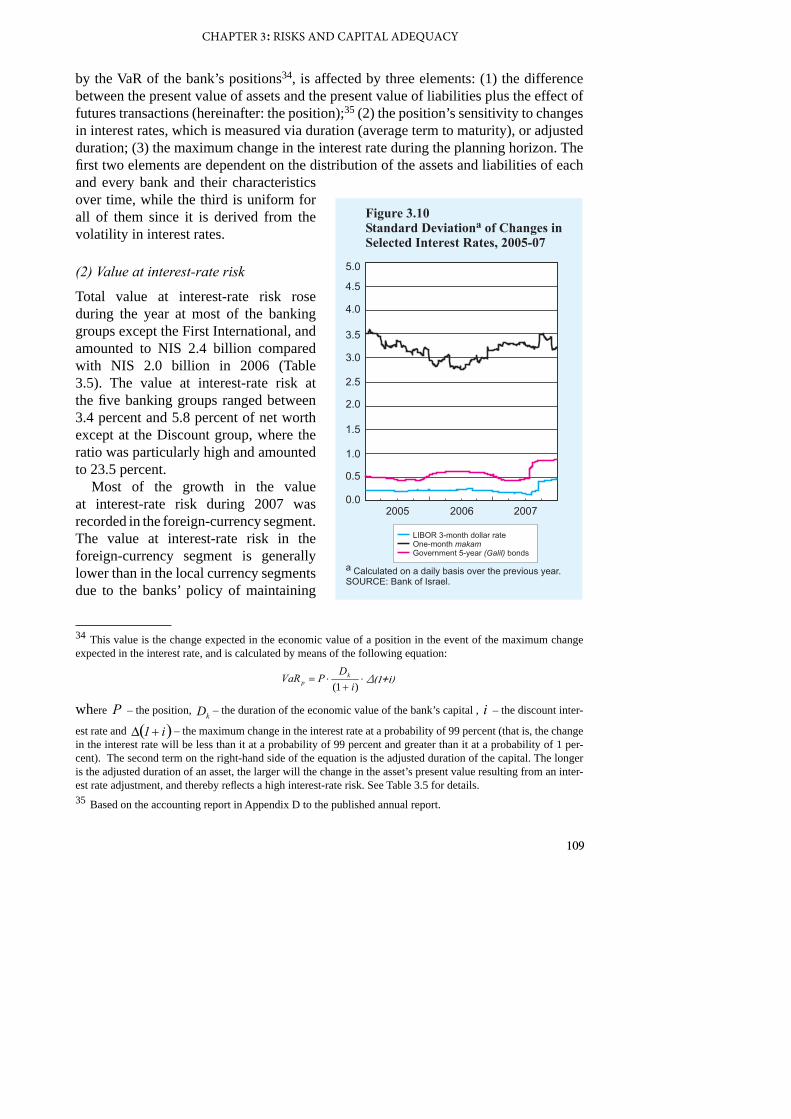
small positions and the low volatility of the interest rate in it, as reflected by the implied volatility of the Libor interest rate (Figure 3.10). In 2007 however, the positions at the Leumi and Discount groups increased and interest-rate volatility rose during the second half of the year because of the Fed’s rate cut, which was aimed at weakening the impact of the credit crunch.
In the unindexed local currency segment, the value at interest-rate risk fell at most of the banking groups, despite the increased position, due to a contraction of the duration gap, The price in that segment, which is derived from volatility in the yields-to-maturity of Treasury bills (Makam), did not change compared with 2006 and remained high relative to the CPI-indexed segment and the foreign-currency segment (Figure 3.10).
c. Indexation-base risks
(1) General
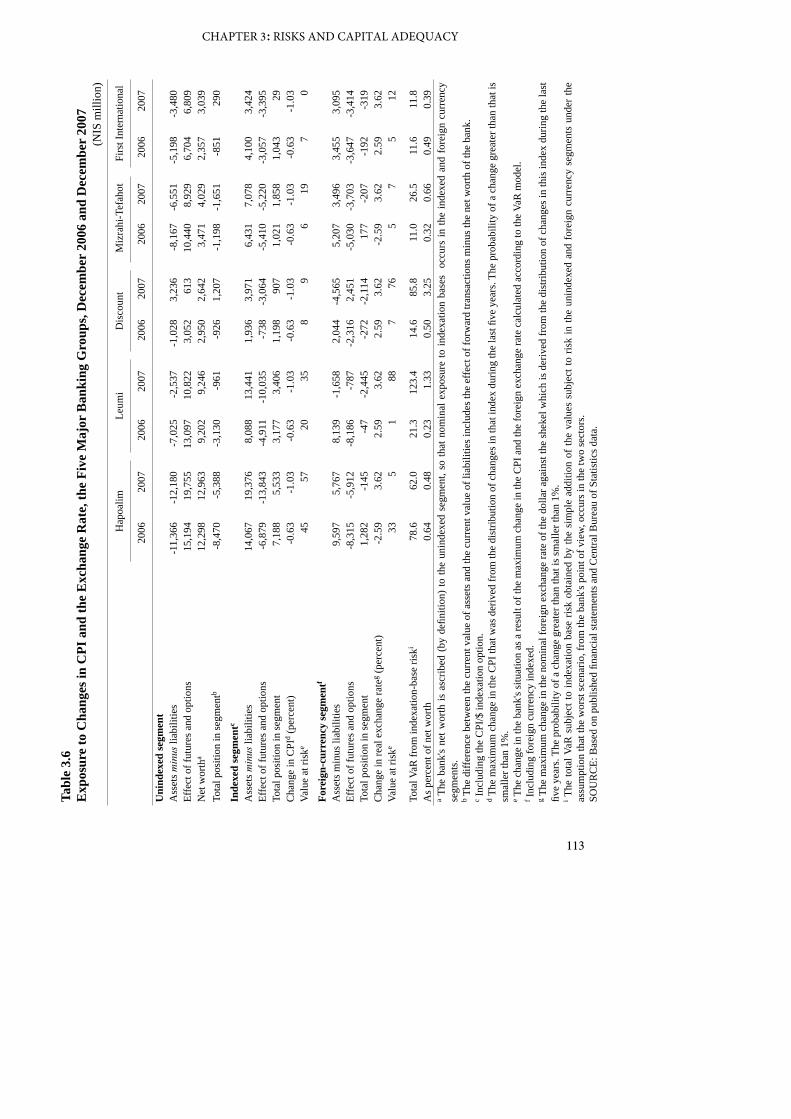
Exposure to indexation-base risk is affected by two elements: One element is the quantity effect – the difference between the value of assets and the value of liabilities, plus the net effect of futures transactions (hereinafter: the position).36 The other element, the price effect, is an unexpected change in the relative prices between the different indexation segments. The analysis in this survey is centered on the three indexation segments alone (without reference to diverse foreign currencies), on the assumption that financial capital is defined as unindexed. Accordingly, market risk in the CPI-indexed local currency segment materializes in the event of an unexpected decrease in prices (deflation) that erodes its liabilities (when the value of the liabilities is higher than the value of the assets. Similarly, market risk in the foreign-currency segment materializes when an unexpected rise in the nominal exchange rate of the shekel against the dollar (a deprecation) erodes a bank’s liabilities, when the value of liabilities exceeds the value of assets, and when an unexpected fall in the exchange rate (an appreciation) erodes the bank’s assets when the value of assets exceeds the value of liabilities.
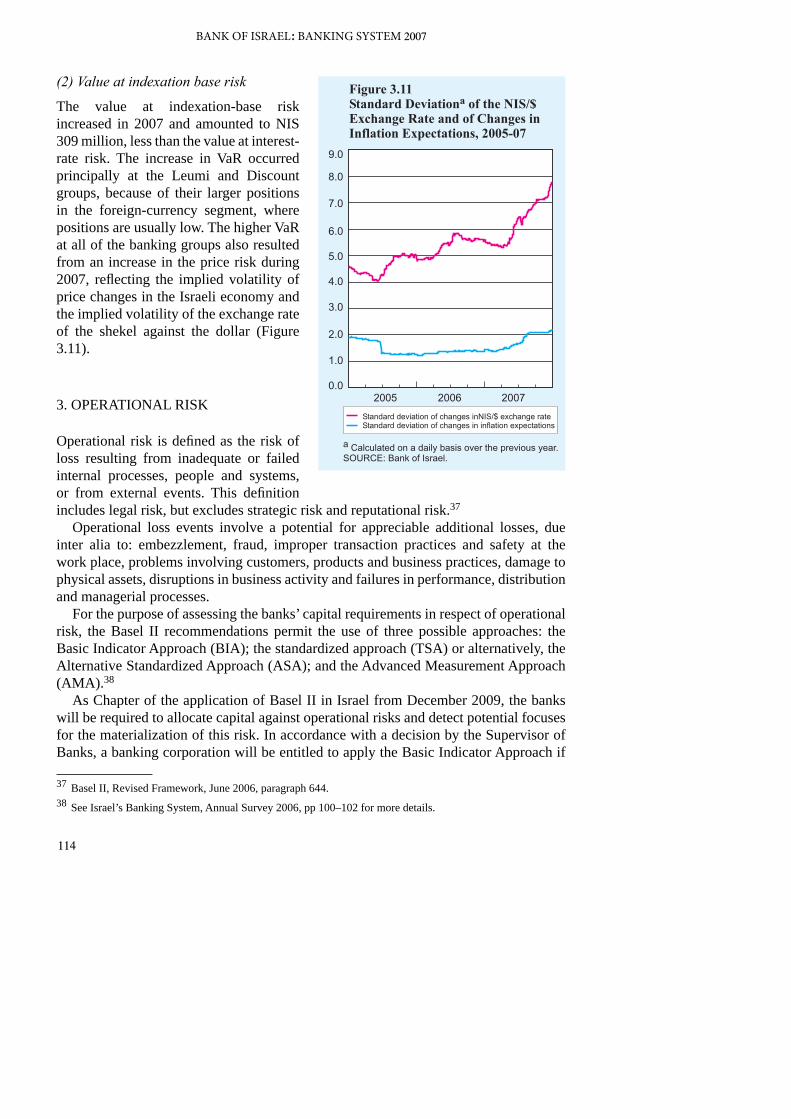
The consumer price index rose by 3.4 percent in 2007, above the upper limit of the level defined as price stability (1 percent to 3 percent). The deviation from the upper limit of price stability and from the inflation expectations derived from the capital market (break-even inflation), which amounted to 1 percent at the beginning of the year, had the effect of increasing the net worth of the five large banking groups, which had a surplus of assets over liabilities in the CPI-indexed segment (Table 3.6). The 9.0 percent strengthening of the shekel against the dollar during 2007 concurrent with the five largest banking groups’ liability surplus in the foreign-currency segment also led to an increase in net worth, although its impact was less notable because of the small positions in that segment at most of the banks. In 2007 the level of risk rose compared with the previous year, reflecting the high implied volatility of the exchange rate of the shekel against the dollar and price developments in the Israeli economy (Figure 3.11).
36 On the basis of Note 16 to the published annual report.
113
CHAPTER 3: RISKS AND CAPITAL ADEQUACY
Tabl
e 3.
6E
xpos
ure
to C
hang
es in
CPI
and
the
Exc
hang
e R
ate,
the
Five
Maj
or B
anki
ng G
roup
s, D
ecem
ber
2006
and
Dec
embe
r 20
07(N
IS m
illio
n)
Hap
oalim
Leum
iD
isco
unt
Miz
rahi
-Tef
ahot
Firs
t Int
erna
tiona
l
2006
2007
2006
2007
2006
2007
2006
2007
2006
2007
Uni
ndex
ed se
gmen
tA
sset
s min
us li
abili
ties
-11,
366
-12,
180
-7,0
25-2
,537
-1,0
283,
236
-8,1
67-6
,551
-5,1
98-3
,480
Effe
ct o
f fut
ures
and
opt
ions
15,1
9419
,755
13,0
9710
,822
3,05
261
310
,440
8,92
96,
704
6,80
9N
et w
orth
a12
,298
12,9
639,
202
9,24
62,
950
2,64
23,
471
4,02
92,
357
3,03
9To
tal p
ositi
on in
segm
entb
-8,4
70-5
,388
-3,1
30-9
61-9
261,
207
-1,1
98-1
,651
-851
290
Inde
xed
segm
entc
Ass
ets m
inus
liab
ilitie
s14
,067
19,3
768,
088
13,4
411,
936
3,97
16,
431
7,07
84,
100
3,42
4Ef
fect
of f
utur
es a
nd o
ptio
ns-6
,879
-13,
843
-4,9
11-1
0,03
5-7
38-3
,064
-5,4
10-5
,220
-3,0
57-3
,395
Tota
l pos
ition
in se
gmen
t7,
188
5,53
33,
177
3,40
61,
198
907
1,02
11,
858
1,04
329
Cha
nge
in C
PId (
perc
ent)
-0.6
3-1
.03
-0.6
3-1
.03
-0.6
3-1
.03
-0.6
3-1
.03
-0.6
3-1
.03
Valu
e at
risk
e45
5720
358
96
197
0
Fore
ign-
curr
ency
segm
entf
Ass
ets m
inus
liab
ilitie
s9,
597
5,76
78,
139
-1,6
582,
044
-4,5
655,
207
3,49
63,
455
3,09
5Ef
fect
of f
utur
es a
nd o
ptio
ns-8
,315
-5,9
12-8
,186
-787
-2,3
162,
451
-5,0
30-3
,703
-3,6
47-3
,414
Tota
l pos
ition
in se
gmen
t1,
282
-145
-47
-2,4
45-2
72-2
,114
177
-207
-192
-319
Cha
nge
in re
al e
xcha
nge
rate
g (pe
rcen
t)-2
.59
3.62
2.59
3.62
2.59
3.62
-2.5
93.
622.
593.
62Va
lue
at ri
ske
335
188
776
57
512
Tota
l VaR
from
inde
xatio
n-ba
se ri
ski
78.6
62.0
21.3
123.
414
.685
.811
.026
.511
.611
.8A
s per
cent
of n
et w
orth
0.64
0.48
0.23
1.33
0.50
3.25
0.32
0.66
0.49
0.39
a The
ban
k's
net w
orth
is a
scrib
ed (
by d
efini
tion)
to th
e un
inde
xed
segm
ent,
so th
at n
omin
al e
xpos
ure
to in
dexa
tion
base
s o
ccur
s in
the
inde
xed
and
fore
ign
curr
ency
se
gmen
ts.
b The
diff
eren
ce b
etw
een
the
curr
ent v
alue
of a
sset
s and
the
curr
ent v
alue
of l
iabi
litie
s inc
lude
s the
effe
ct o
f for
war
d tra
nsac
tions
min
us th
e ne
t wor
th o
f the
ban
k.c I
nclu
ding
the
CPI
/$ in
dexa
tion
optio
n.d T
he m
axim
um c
hang
e in
the
CPI
that
was
der
ived
from
the
dist
ribut
ion
of c
hang
es in
that
inde
x du
ring
the
last
five
yea
rs. T
he p
roba
bilit
y of
a c
hang
e gr
eate
r tha
n th
at is
sm
alle
r tha
n 1%
.e T
he c
hang
e in
the
bank
's si
tuat
ion
as a
resu
lt of
the
max
imum
cha
nge
in th
e C
PI a
nd th
e fo
reig
n ex
chan
ge ra
te c
alcu
late
d ac
cord
ing
to th
e Va
R m
odel
.f I
nclu
ding
fore
ign
curr
ency
inde
xed.
g The
max
imum
cha
nge
in th
e no
min
al fo
reig
n ex
chan
ge ra
te o
f the
dol
lar a
gain
st th
e sh
ekel
whi
ch is
der
ived
from
the
dist
ribut
ion
of c
hang
es in
this
inde
x du
ring
the
last
fiv
e ye
ars.
The
prob
abili
ty o
f a c
hang
e gr
eate
r tha
n th
at is
smal
ler t
han
1%.
i The
tota
l VaR
sub
ject
to in
dexa
tion
base
ris
k ob
tain
ed b
y th
e si
mpl
e ad
ditio
n of
the
valu
es s
ubje
ct to
ris
k in
the
unin
dexe
d an
d fo
reig
n cu
rren
cy s
egm
ents
und
er th
e as
sum
ptio
n th
at th
e w
orst
scen
ario
, fro
m th
e ba
nk's
poin
t of v
iew,
occ
urs i
n th
e tw
o se
ctor
s.SO
UR
CE:
Bas
ed o
n pu
blis
hed
finan
cial
stat
emen
ts a
nd C
entra
l Bur
eau
of S
tatis
tics d
ata.
114
BANK OF ISRAEL: BANKING SYSTEM 2007
(2) Value at indexation base risk
The value at indexation-base risk increased in 2007 and amounted to NIS 309 million, less than the value at interest-rate risk. The increase in VaR occurred principally at the Leumi and Discount groups, because of their larger positions in the foreign-currency segment, where positions are usually low. The higher VaR at all of the banking groups also resulted from an increase in the price risk during 2007, reflecting the implied volatility of price changes in the Israeli economy and the implied volatility of the exchange rate of the shekel against the dollar (Figure 3.11).
3. OPERATIONAL RISK
Operational risk is defined as the risk of loss resulting from inadequate or failed internal processes, people and systems, or from external events. This definition includes legal risk, but excludes strategic risk and reputational risk.37
Operational loss events involve a potential for appreciable additional losses, due inter alia to: embezzlement, fraud, improper transaction practices and safety at the work place, problems involving customers, products and business practices, damage to physical assets, disruptions in business activity and failures in performance, distribution and managerial processes.
For the purpose of assessing the banks’ capital requirements in respect of operational risk, the Basel II recommendations permit the use of three possible approaches: the Basic Indicator Approach (BIA); the standardized approach (TSA) or alternatively, the Alternative Standardized Approach (ASA); and the Advanced Measurement Approach (AMA).38
As Chapter of the application of Basel II in Israel from December 2009, the banks will be required to allocate capital against operational risks and detect potential focuses for the materialization of this risk. In accordance with a decision by the Supervisor of Banks, a banking corporation will be entitled to apply the Basic Indicator Approach if
37 Basel II, Revised Framework, June 2006, paragraph 644.38 See Israel’s Banking System, Annual Survey 2006, pp 100–102 for more details.
115
CHAPTER 3: RISKS AND CAPITAL ADEQUACY
it fulfills two conditions: One condition is that its shareholders’ equity is less than NIS 4 billion. The other condition is that it does not have material international activity. A banking corporation that does not meet these conditions will be permitted to apply the BIA approach for a period of up to thee years from the initial date of application. In addition, a banking corporation that allocates capital in respect of credit risk by means of advanced IRB approaches will not be permitted to apply the BIA approach. Banks may apply the Alternative Standardized Approach under certain conditions.39 The internal estimates approach is not permitted for use at this stage.40
A number of operational risks were realized in the banking system during 2007. Two major events created legal risks: (1) The Heftsiba company episode, as a result of which the banks involved recorded overall provisions of NIS 290 million; (2) The filing of a class action that was approved by the Tel Aviv District Court against a number of banks in January, claiming that the banks had coordinated their interest rates and fees. In 2007 the Banking Supervision Department changed the manner in which it deals with violations of the Prohibition of Money Laundering Law: In the past, the Banking Supervision Department imposed a large monetary fine of up to NIS 2 million only when an inspection report was issued on the violation. Since 2007, the Banking Supervision Department has imposed a fine in the case of any violation of the Law. As a result, the operational risk connected with violation of the Prohibition of Money Laundering Law has increased. In 2007 sanctions were taken against three banks due to violations of the Law.41 A number of specific cases were recorded in which the banks were exposed to operational risks in the area of customer activity on the Internet.
4. LIQUIDITY RISK
Liquidity risk derives from a banking corporation’s uncertainty regarding the extent of the public’s withdrawals from its deposits, from the expectation that deposits will not be renewed once their contractual repayment date is due, and from unexpected demand for credit. The materialization of this risk could cause a shortage of liquidity for the bank, as the result of which it will have to sell assets at less than the market price and/or raise sources in the secondary market, such as interbank loans and loans from the Bank of Israel (monetary loans) at more than the market price. Accordingly, liquidity risk, which is a short-term risk, is mainly apparent in Israel in the unindexed local currency segment and in the foreign currency segment, where balance sheet items without a predetermined contractual repayment date exist (e.g., demand deposits, SROs,
39 Banks will only be permitted to apply this approach if their income from the retail and corporate segments is at least 90 percent of their total income, and the probability of default (PD) is more than 3.5 percent.40 http://www.boi.gov.il/deptdata/pikuah/basel/h_letter_13022008.pdf (Hebrew).41 Bank Leumi, the First International Bank and Bank Poalei Agudat Israel.
116
BANK OF ISRAEL: BANKING SYSTEM 2007
and current loan accounts), as well as short-term deposits whose repayment dates are uncertain.
A banking corporation is required to develop an internal model for the reliable measurement of the liquid sources available to it and its liquidity requirements to ensure that it has enough liquid sources to cover its liquidity requirements during the coming month. If the banking corporation does not use an internal model, it will be required to hold liquid assets worth at least as much as its liabilities for terms of maturity of up to a month.42
Since the standard model is a rough model, with a very high liquid assets requirement, liquidity risk is measured and managed in the Israeli banking system by means of internal models, which estimate liquidity risk under different scenarios. The internal models developed by the banks differ in their working assumptions and calculation methods, and are derived from the characteristics of different customer bases. These models take account of additional elements such as the extent of the bank’s reliance on large depositors (depositor concentration), the bank’s ability to obtain credit lines from foreign banks and its parent bank, the composition of its securities portfolio, and its reputation. The banks use these internal models to calculate their liquidity requirements, taking into account the statistically calculated rate at which deposits will be rolled over, estimated credit activity and other expenses such as salary payments. At the same time, the models calculate the ability to realize specific assets, principally from the securities portfolio. On the basis of these estimates, the banks calculate their liquidity indices daily. These indices are the liquidity gap by terms to maturity (a day, up to a week, up to a month, up to three months, up to six months, up to a year, over a year) and the ratio of liquid assets to liabilities for a repayment period of up to a month for each of the indexation segments. These models need to refer to three extreme scenarios (a normal situation, a crisis at the bank and a general systemic crisis) and to define triggers for these situations. In order to test the reliability of the models, the banks must conduct stress tests and back tests, and determine restrictions for the extreme scenarios connected with a crisis situation at the bank, or a general crisis such as war, a political shock, a shock in the financial markets and an economic crisis. These tests make it possible to examine how the bank would be able to function for a month in a crisis situation, at a reasonable cost.
In 2007 the banks in Israel increased their holdings of bonds (Figure 1.15), which are highly liquid assets, and reduced their deposits at the Bank of Israel, on which the yield is lower.
The Real Time Gross Settlement (RTGS) System for the settlement of large payments (known by its Hebrew acronym, Zahav) was launched in 2007. The Zahav system makes it necessary for the banks in Israel to monitor their ability to maintain a suitable level of liquidity on a current basis and in a more precise manner as they transfer large amounts of money to other banks in the course of the business day. Following the introduction of the Zahav system, the banks have had to provide specific collateral in addition to the
42 Proper Conduct of Banking Business Regulation No. 342.
117
CHAPTER 3: RISKS AND CAPITAL ADEQUACY
collateral provided against monetary loans. This has increased the banking system’s liquidity requirements while the ratio of liquid assets held against liquidity risks is the same as in the past.
As a result of the subprime mortgage crisis in the US, large banks worldwide experienced a liquidity crisis in 2007 and had to raise capital.43 Although the liquidity risk of the banks in Israel were not realized because the exposure of most of them to the subprime mortgage market was limited, the level of their liquidity risk rose slightly due to growing global uncertainty and concern over the impact of the financial crisis on the money and capital markets in Israel. As result of these developments, the Supervisor of Banks ordered the banks to re-examine their liquidity risk management policy, including the suitability of their policy and models to more stringent extreme scenarios and the required level of liquidity.
5. CAPITAL ADEQUACY
Capital adequacy expresses the amount of capital that enables a bank to absorb the unexpected losses likely to be caused as the result of the realization of the range of risks to which it is exposed. Capital adequacy is currently calculated in accordance with the recommendations of the Basel Committee and includes an allocation of capital against credit risks (as per the Basel Accord published July 1988) and the allocation of capital against market risks (the Amendment to the Capital Accord to Incorporate Market Risks, published January 1996). Accordingly, the minimum capital ratio required by the Supervisor of Banks is currently 9 percent.44 From December 2009, the banks in Israel will be required to calculate the capital allocation in accordance with the Basel II recommendations as in the Revised Framework of June 2006. A Part from the capital requirement in respect of credit and market risks specified in the Basel I recommendations, under the Basel II recommendations an allocation of capital in respect of operational risks is required. The application of the Basel II recommendations is intended to enhance the quality of risk management and lead to more risk-focused capital requirements.45
Following the Supervisor of Banks’ statement that he expects the banks’ capital ratio to rise to at least 12 percent by the end of 2009, the banks in Israel confirmed that they would conform to this requirement. Accordingly, the risk-weighted capital ratio in the five major banking groups increased in 2007, albeit by a mere 0.13 percent point, to 10.95 percent, its highest level for the past decade. The increase in the capital ratio was
43 See Section 6 below for further details of the subprime mortgage crisis.44 Although the minimum capital ratio required worldwide is 8 percent, in March 1999 the Supervisor of Banks raised the minimum capital ratio for the banks to 9 percent.45 See Israel’s Banking System, Annual Survey 2006, pp 103–109 and Chapter 4 of this survey.
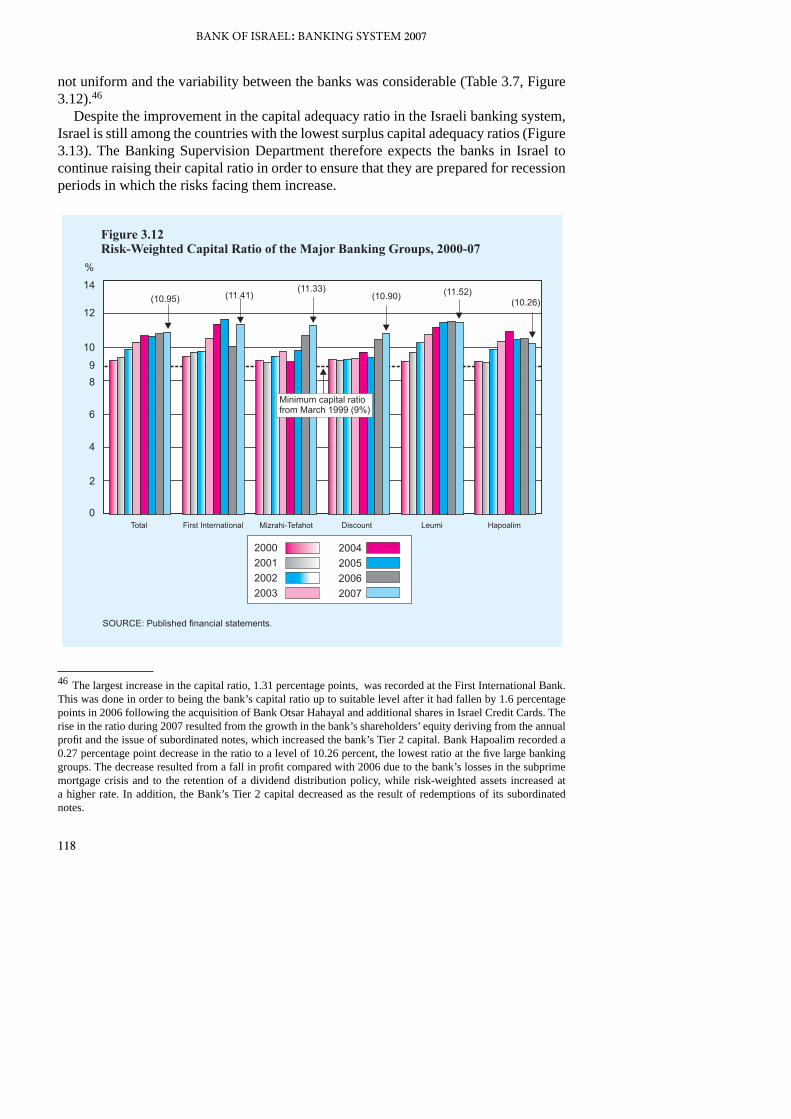
118
BANK OF ISRAEL: BANKING SYSTEM 2007
not uniform and the variability between the banks was considerable (Table 3.7, Figure 3.12).46
Despite the improvement in the capital adequacy ratio in the Israeli banking system, Israel is still among the countries with the lowest surplus capital adequacy ratios (Figure 3.13). The Banking Supervision Department therefore expects the banks in Israel to continue raising their capital ratio in order to ensure that they are prepared for recession periods in which the risks facing them increase.
46 The largest increase in the capital ratio, 1.31 percentage points, was recorded at the First International Bank. This was done in order to being the bank’s capital ratio up to suitable level after it had fallen by 1.6 percentage points in 2006 following the acquisition of Bank Otsar Hahayal and additional shares in Israel Credit Cards. The rise in the ratio during 2007 resulted from the growth in the bank’s shareholders’ equity deriving from the annual profit and the issue of subordinated notes, which increased the bank’s Tier 2 capital. Bank Hapoalim recorded a 0.27 percentage point decrease in the ratio to a level of 10.26 percent, the lowest ratio at the five large banking groups. The decrease resulted from a fall in profit compared with 2006 due to the bank’s losses in the subprime mortgage crisis and to the retention of a dividend distribution policy, while risk-weighted assets increased at a higher rate. In addition, the Bank’s Tier 2 capital decreased as the result of redemptions of its subordinated notes.
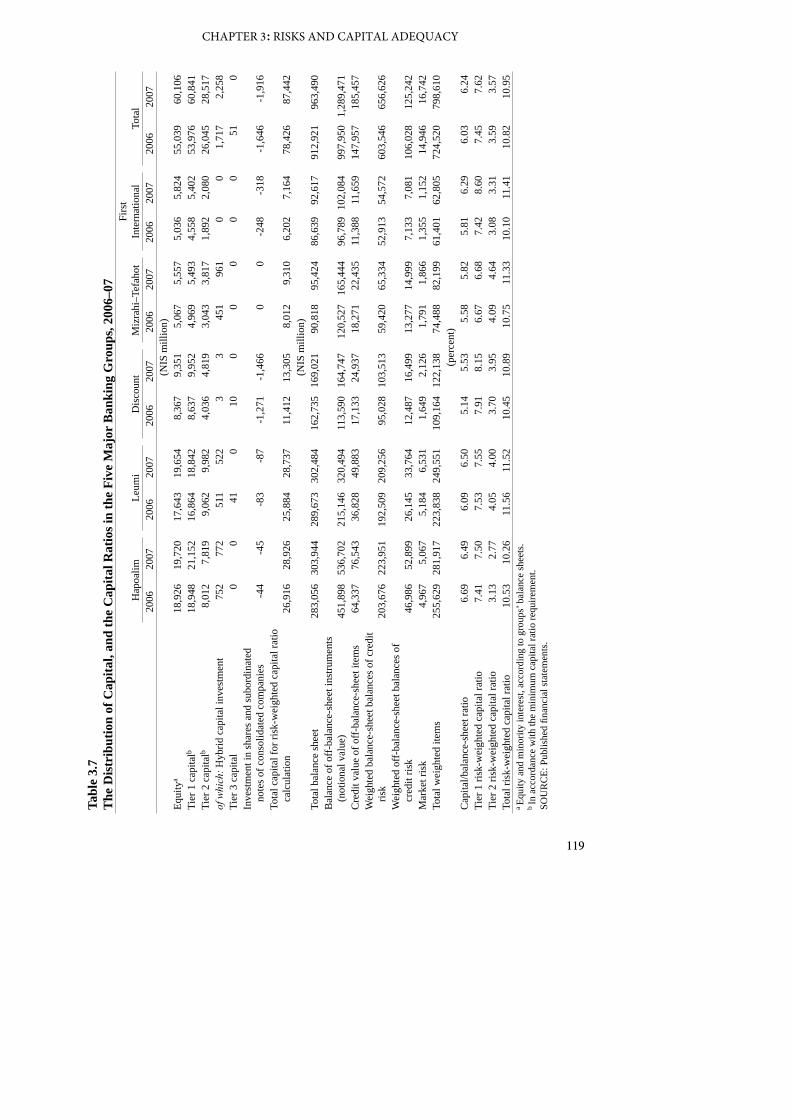
119
CHAPTER 3: RISKS AND CAPITAL ADEQUACY
Tabl
e 3.
7T
he D
istr
ibut
ion
of C
apita
l, an
d th
e C
apita
l Rat
ios i
n th
e Fi
ve M
ajor
Ban
king
Gro
ups,
2006
–07
Hap
oalim
Leum
iD
isco
unt
Miz
rahi
–Tef
ahot
Firs
t In
tern
atio
nal
Tota
l20
06
2007
20
06
2007
20
06
2007
20
06
2007
20
06
2007
20
06
2007
(N
IS m
illio
n)Eq
uity
a18
,926
19,7
2017
,643
19,6
548,
367
9,35
15,
067
5,55
75,
036
5,82
455
,039
60,1
06Ti
er 1
cap
italb
18,9
4821
,152
16,8
6418
,842
8,63
79,
952
4,96
95,
493
4,55
85,
402
53,9
7660
,841
Tier
2 c
apita
lb8,
012
7,81
99,
062
9,98
24,
036
4,81
93,
043
3,81
71,
892
2,08
026
,045
28,5
17of
whi
ch: H
ybrid
cap
ital i
nves
tmen
t75
277
251
152
23
345
196
10
01,
717
2,25
8Ti
er 3
cap
ital
00
410
100
00
00
510
Inve
stm
ent i
n sh
ares
and
subo
rdin
ated
note
s of c
onso
lidat
ed c
ompa
nies
-44
-45
-83
-87
-1,2
71-1
,466
00
-248
-318
-1,6
46-1
,916
Tota
l cap
ital f
or ri
sk-w
eigh
ted
capi
tal r
atio
ca
lcul
atio
n26
,916
28,9
2625
,884
28,7
3711
,412
13,3
058,
012
9,31
06,
202
7,16
478
,426
87,4
42(N
IS m
illio
n)To
tal b
alan
ce sh
eet
283,
056
303,
944
289,
673
302,
484
162,
735
169,
021
90,8
1895
,424
86,6
3992
,617
912,
921
963,
490
Bal
ance
of o
ff-ba
lanc
e-sh
eet i
nstru
men
ts
(n
otio
nal v
alue
)45
1,89
853
6,70
221
5,14
632
0,49
411
3,59
016
4,74
712
0,52
716
5,44
496
,789
102,
084
997,
950
1,28
9,47
1C
redi
t val
ue o
f off-
bala
nce-
shee
t ite
ms
64,3
3776
,543
36,8
2849
,883
17,1
3324
,937
18,2
7122
,435
11,3
8811
,659
147,
957
185,
457
Wei
ghte
d ba
lanc
e-sh
eet b
alan
ces o
f cre
dit
ris
k20
3,67
622
3,95
119
2,50
920
9,25
695
,028
103,
513
59,4
2065
,334
52,9
1354
,572
603,
546
656,
626
Wei
ghte
d of
f-ba
lanc
e-sh
eet b
alan
ces o
f
cred
it ris
k46
,986
52,8
9926
,145
33,7
6412
,487
16,4
9913
,277
14,9
997,
133
7,08
110
6,02
812
5,24
2M
arke
t ris
k4,
967
5,06
75,
184
6,53
11,
649
2,12
61,
791
1,86
61,
355
1,15
214
,946
16,7
42To
tal w
eigh
ted
item
s25
5,62
928
1,91
722
3,83
824
9,55
110
9,16
412
2,13
874
,488
82,1
9961
,401
62,8
0572
4,52
079
8,61
0(p
erce
nt)
Cap
ital/b
alan
ce-s
heet
ratio
6.69
6.49
6.09
6.50
5.14
5.53
5.58
5.82
5.81
6.29
6.03
6.24
Tier
1 ri
sk-w
eigh
ted
capi
tal r
atio
7.41
7.50
7.53
7.55
7.91
8.15
6.67
6.68
7.42
8.60
7.45
7.62
Tier
2 ri
sk-w
eigh
ted
capi
tal r
atio
3.13
2.77
4.05
4.00
3.70
3.95
4.09
4.64
3.08
3.31
3.59
3.57
Tota
l ris
k-w
eigh
ted
capi
tal r
atio
10.5
310
.26
11.5
611
.52
10.4
510
.89
10.7
511
.33
10.1
011
.41
10.8
210
.95
a Eq
uity
and
min
ority
inte
rest
, acc
ordi
ng to
gro
ups’
bala
nce
shee
ts.
b In
acc
orda
nce
with
the
min
imum
cap
ital r
atio
requ
irem
ent.
SOU
RC
E: P
ublis
hed
finan
cial
stat
emen
ts.
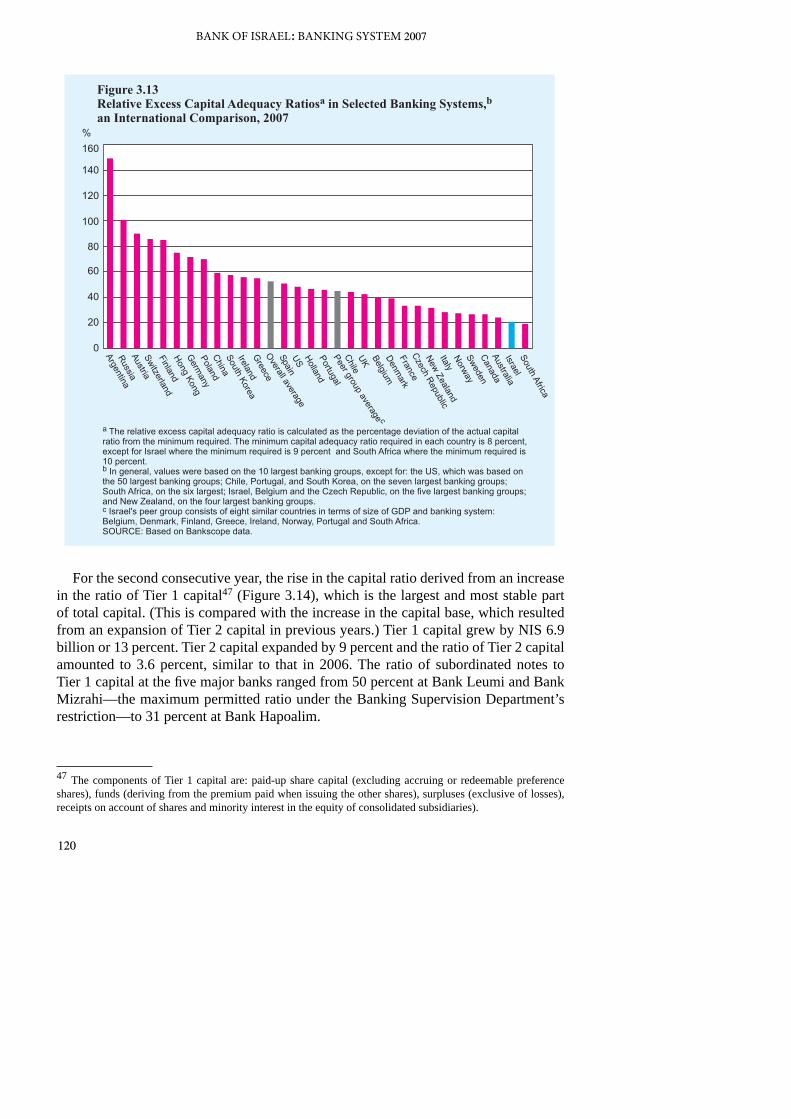
120
BANK OF ISRAEL: BANKING SYSTEM 2007
For the second consecutive year, the rise in the capital ratio derived from an increase in the ratio of Tier 1 capital47 (Figure 3.14), which is the largest and most stable part of total capital. (This is compared with the increase in the capital base, which resulted from an expansion of Tier 2 capital in previous years.) Tier 1 capital grew by NIS 6.9 billion or 13 percent. Tier 2 capital expanded by 9 percent and the ratio of Tier 2 capital amounted to 3.6 percent, similar to that in 2006. The ratio of subordinated notes to Tier 1 capital at the five major banks ranged from 50 percent at Bank Leumi and Bank Mizrahi––the maximum permitted ratio under the Banking Supervision Department’s restriction––to 31 percent at Bank Hapoalim.
47 The components of Tier 1 capital are: paid-up share capital (excluding accruing or redeemable preference shares), funds (deriving from the premium paid when issuing the other shares), surpluses (exclusive of losses), receipts on account of shares and minority interest in the equity of consolidated subsidiaries).
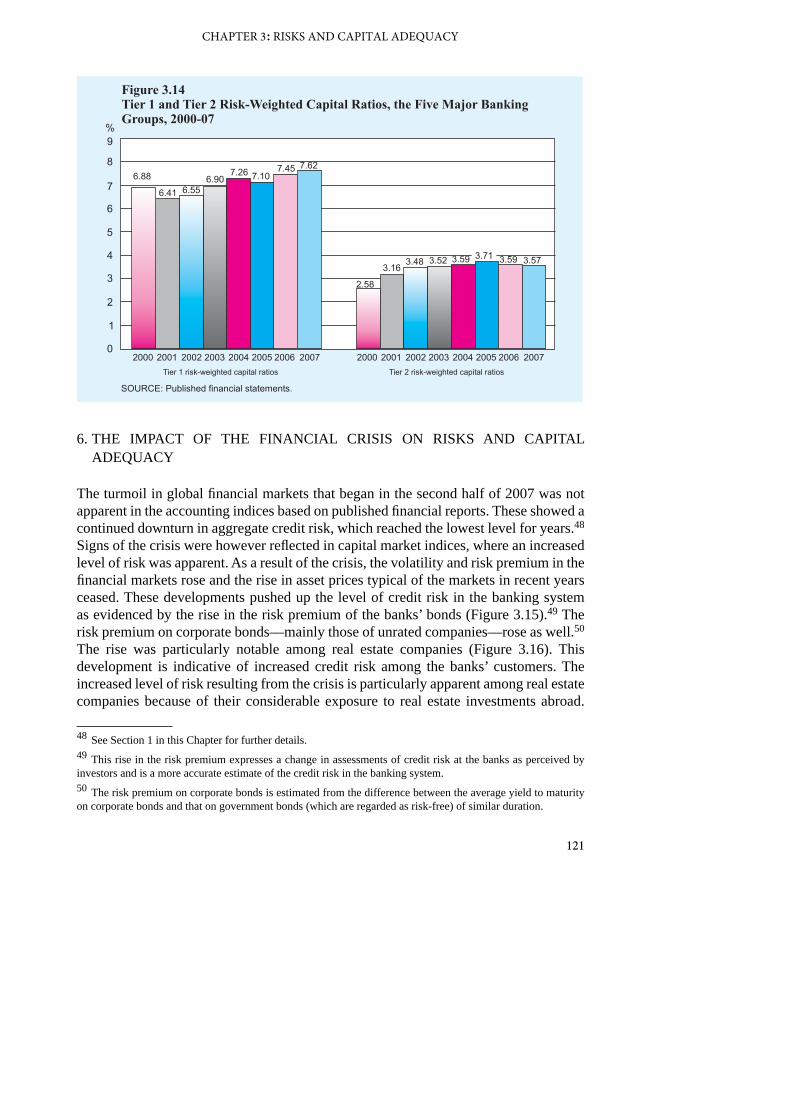
121
CHAPTER 3: RISKS AND CAPITAL ADEQUACY
6. THE IMPACT OF THE FINANCIAL CRISIS ON RISKS AND CAPITAL ADEQUACY
The turmoil in global financial markets that began in the second half of 2007 was not apparent in the accounting indices based on published financial reports. These showed a continued downturn in aggregate credit risk, which reached the lowest level for years.48 Signs of the crisis were however reflected in capital market indices, where an increased level of risk was apparent. As a result of the crisis, the volatility and risk premium in the financial markets rose and the rise in asset prices typical of the markets in recent years ceased. These developments pushed up the level of credit risk in the banking system as evidenced by the rise in the risk premium of the banks’ bonds (Figure 3.15).49 The risk premium on corporate bonds––mainly those of unrated companies––rose as well.50 The rise was particularly notable among real estate companies (Figure 3.16). This development is indicative of increased credit risk among the banks’ customers. The increased level of risk resulting from the crisis is particularly apparent among real estate companies because of their considerable exposure to real estate investments abroad.
48 See Section 1 in this Chapter for further details.49 This rise in the risk premium expresses a change in assessments of credit risk at the banks as perceived by investors and is a more accurate estimate of the credit risk in the banking system.50 The risk premium on corporate bonds is estimated from the difference between the average yield to maturity on corporate bonds and that on government bonds (which are regarded as risk-free) of similar duration.
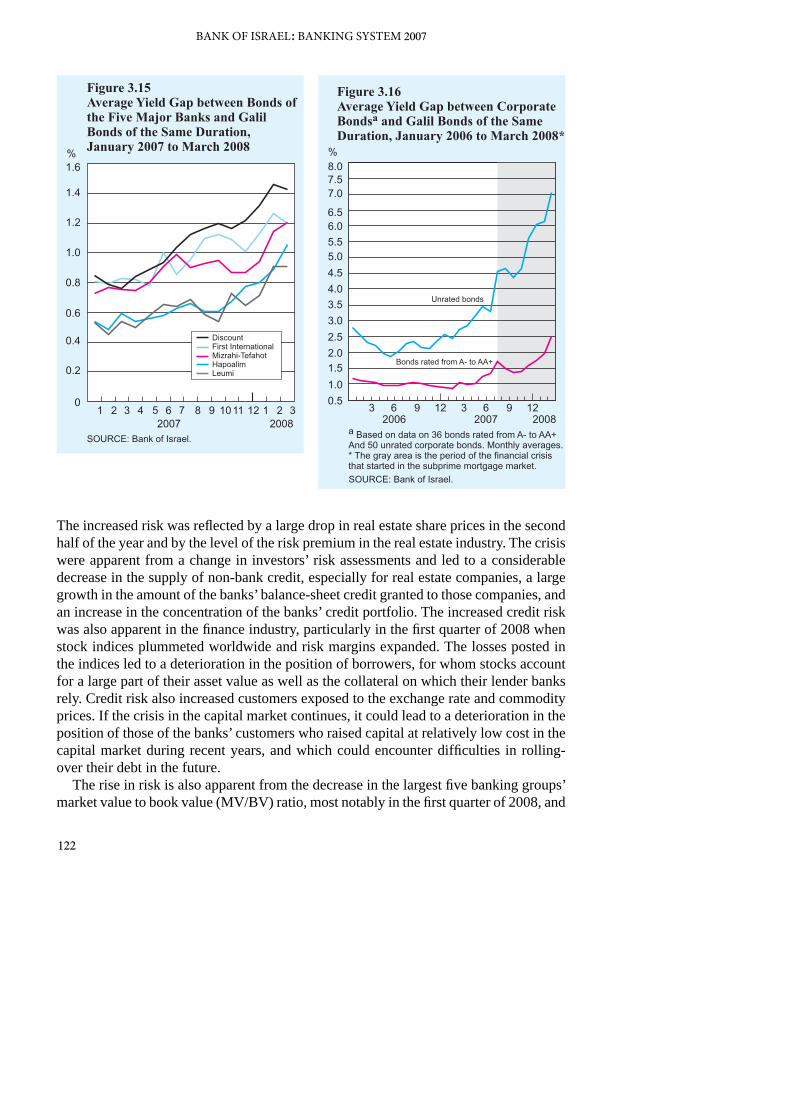
122
BANK OF ISRAEL: BANKING SYSTEM 2007
The increased risk was reflected by a large drop in real estate share prices in the second half of the year and by the level of the risk premium in the real estate industry. The crisis were apparent from a change in investors’ risk assessments and led to a considerable decrease in the supply of non-bank credit, especially for real estate companies, a large growth in the amount of the banks’ balance-sheet credit granted to those companies, and an increase in the concentration of the banks’ credit portfolio. The increased credit risk was also apparent in the finance industry, particularly in the first quarter of 2008 when stock indices plummeted worldwide and risk margins expanded. The losses posted in the indices led to a deterioration in the position of borrowers, for whom stocks account for a large part of their asset value as well as the collateral on which their lender banks rely. Credit risk also increased customers exposed to the exchange rate and commodity prices. If the crisis in the capital market continues, it could lead to a deterioration in the position of those of the banks’ customers who raised capital at relatively low cost in the capital market during recent years, and which could encounter difficulties in rolling-over their debt in the future.
The rise in risk is also apparent from the decrease in the largest five banking groups’ market value to book value (MV/BV) ratio, most notably in the first quarter of 2008, and
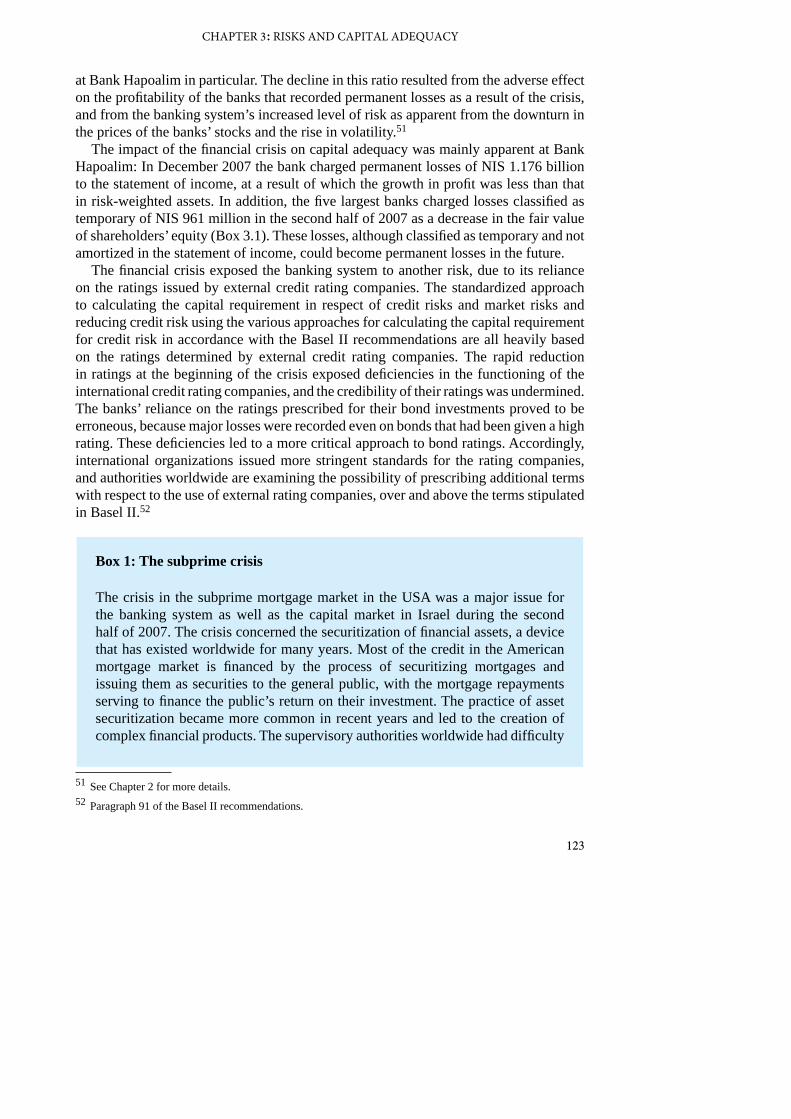
123
CHAPTER 3: RISKS AND CAPITAL ADEQUACY
at Bank Hapoalim in particular. The decline in this ratio resulted from the adverse effect on the profitability of the banks that recorded permanent losses as a result of the crisis, and from the banking system’s increased level of risk as apparent from the downturn in the prices of the banks’ stocks and the rise in volatility.51
The impact of the financial crisis on capital adequacy was mainly apparent at Bank Hapoalim: In December 2007 the bank charged permanent losses of NIS 1.176 billion to the statement of income, at a result of which the growth in profit was less than that in risk-weighted assets. In addition, the five largest banks charged losses classified as temporary of NIS 961 million in the second half of 2007 as a decrease in the fair value of shareholders’ equity (Box 3.1). These losses, although classified as temporary and not amortized in the statement of income, could become permanent losses in the future.
The financial crisis exposed the banking system to another risk, due to its reliance on the ratings issued by external credit rating companies. The standardized approach to calculating the capital requirement in respect of credit risks and market risks and reducing credit risk using the various approaches for calculating the capital requirement for credit risk in accordance with the Basel II recommendations are all heavily based on the ratings determined by external credit rating companies. The rapid reduction in ratings at the beginning of the crisis exposed deficiencies in the functioning of the international credit rating companies, and the credibility of their ratings was undermined. The banks’ reliance on the ratings prescribed for their bond investments proved to be erroneous, because major losses were recorded even on bonds that had been given a high rating. These deficiencies led to a more critical approach to bond ratings. Accordingly, international organizations issued more stringent standards for the rating companies, and authorities worldwide are examining the possibility of prescribing additional terms with respect to the use of external rating companies, over and above the terms stipulated in Basel II.52
51 See Chapter 2 for more details.52 Paragraph 91 of the Basel II recommendations.
Box 1: The subprime crisis
The crisis in the subprime mortgage market in the USA was a major issue for the banking system as well as the capital market in Israel during the second half of 2007. The crisis concerned the securitization of financial assets, a device that has existed worldwide for many years. Most of the credit in the American mortgage market is financed by the process of securitizing mortgages and issuing them as securities to the general public, with the mortgage repayments serving to finance the public’s return on their investment. The practice of asset securitization became more common in recent years and led to the creation of complex financial products. The supervisory authorities worldwide had difficulty
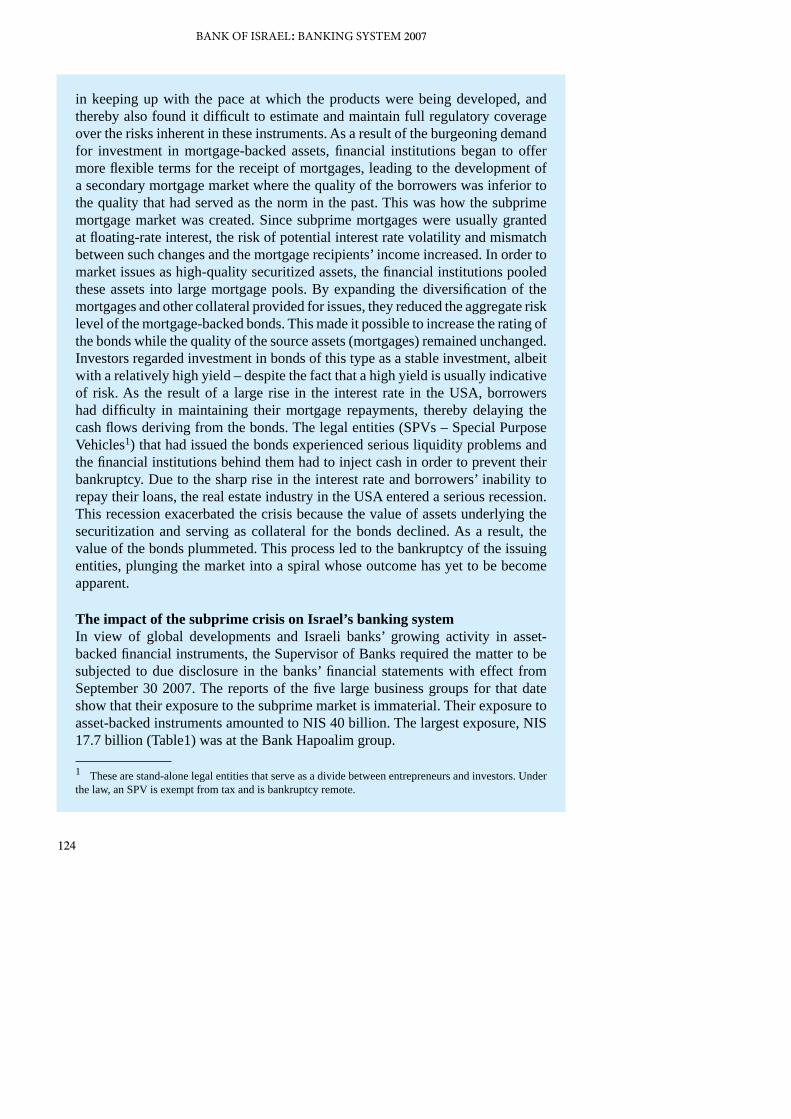
124
BANK OF ISRAEL: BANKING SYSTEM 2007
in keeping up with the pace at which the products were being developed, and thereby also found it difficult to estimate and maintain full regulatory coverage over the risks inherent in these instruments. As a result of the burgeoning demand for investment in mortgage-backed assets, financial institutions began to offer more flexible terms for the receipt of mortgages, leading to the development of a secondary mortgage market where the quality of the borrowers was inferior to the quality that had served as the norm in the past. This was how the subprime mortgage market was created. Since subprime mortgages were usually granted at floating-rate interest, the risk of potential interest rate volatility and mismatch between such changes and the mortgage recipients’ income increased. In order to market issues as high-quality securitized assets, the financial institutions pooled these assets into large mortgage pools. By expanding the diversification of the mortgages and other collateral provided for issues, they reduced the aggregate risk level of the mortgage-backed bonds. This made it possible to increase the rating of the bonds while the quality of the source assets (mortgages) remained unchanged. Investors regarded investment in bonds of this type as a stable investment, albeit with a relatively high yield – despite the fact that a high yield is usually indicative of risk. As the result of a large rise in the interest rate in the USA, borrowers had difficulty in maintaining their mortgage repayments, thereby delaying the cash flows deriving from the bonds. The legal entities (SPVs – Special Purpose Vehicles1) that had issued the bonds experienced serious liquidity problems and the financial institutions behind them had to inject cash in order to prevent their bankruptcy. Due to the sharp rise in the interest rate and borrowers’ inability to repay their loans, the real estate industry in the USA entered a serious recession. This recession exacerbated the crisis because the value of assets underlying the securitization and serving as collateral for the bonds declined. As a result, the value of the bonds plummeted. This process led to the bankruptcy of the issuing entities, plunging the market into a spiral whose outcome has yet to be become apparent.
The impact of the subprime crisis on Israel’s banking system In view of global developments and Israeli banks’ growing activity in asset-backed financial instruments, the Supervisor of Banks required the matter to be subjected to due disclosure in the banks’ financial statements with effect from September 30 2007. The reports of the five large business groups for that date show that their exposure to the subprime market is immaterial. Their exposure to asset-backed instruments amounted to NIS 40 billion. The largest exposure, NIS 17.7 billion (Table1) was at the Bank Hapoalim group.
1 These are stand-alone legal entities that serve as a divide between entrepreneurs and investors. Under the law, an SPV is exempt from tax and is bankruptcy remote.
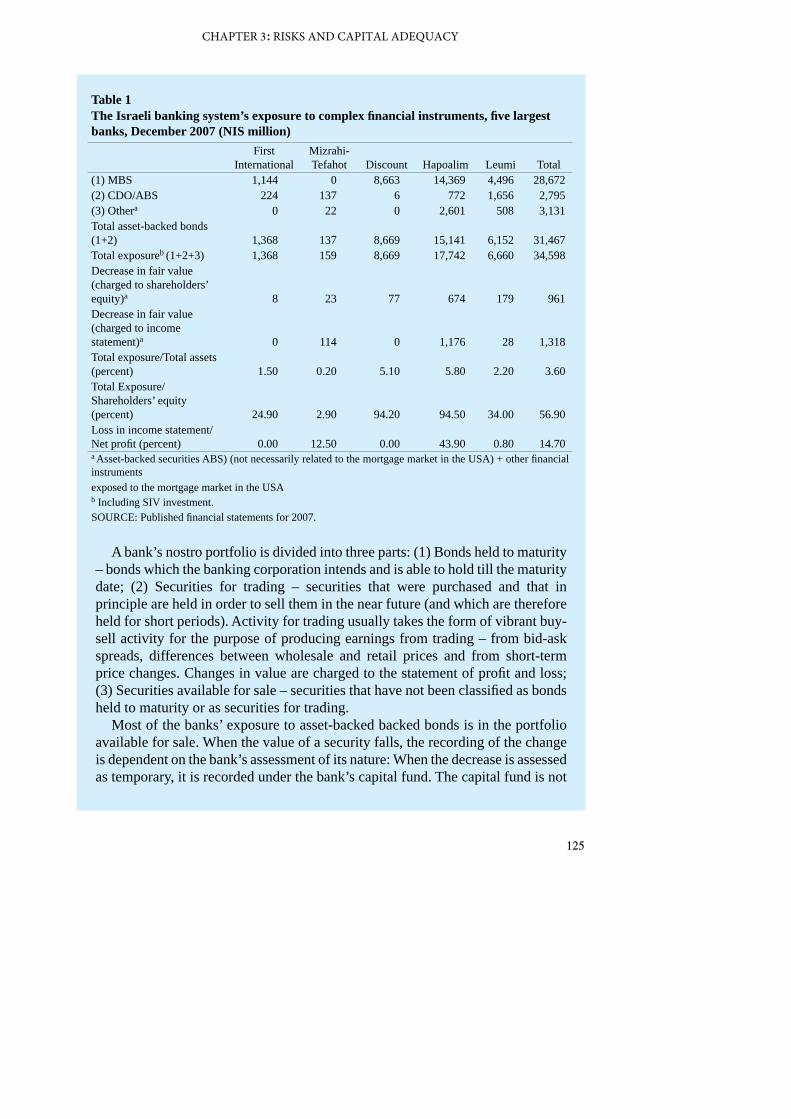
125
CHAPTER 3: RISKS AND CAPITAL ADEQUACY
A bank’s nostro portfolio is divided into three parts: (1) Bonds held to maturity – bonds which the banking corporation intends and is able to hold till the maturity date; (2) Securities for trading – securities that were purchased and that in principle are held in order to sell them in the near future (and which are therefore held for short periods). Activity for trading usually takes the form of vibrant buy-sell activity for the purpose of producing earnings from trading – from bid-ask spreads, differences between wholesale and retail prices and from short-term price changes. Changes in value are charged to the statement of profit and loss; (3) Securities available for sale – securities that have not been classified as bonds held to maturity or as securities for trading.
Most of the banks’ exposure to asset-backed backed bonds is in the portfolio available for sale. When the value of a security falls, the recording of the change is dependent on the bank’s assessment of its nature: When the decrease is assessed as temporary, it is recorded under the bank’s capital fund. The capital fund is not
Table 1The Israeli banking system’s exposure to complex financial instruments, five largest banks, December 2007 (NIS million)
First International
Mizrahi-Tefahot Discount Hapoalim Leumi Total
(1) MBS 1,144 0 8,663 14,369 4,496 28,672(2) CDO/ABS 224 137 6 772 1,656 2,795(3) Othera 0 22 0 2,601 508 3,131Total asset-backed bonds (1+2) 1,368 137 8,669 15,141 6,152 31,467Total exposureb (1+2+3) 1,368 159 8,669 17,742 6,660 34,598Decrease in fair value (charged to shareholders’ equity)a 8 23 77 674 179 961Decrease in fair value (charged to income statement)a 0 114 0 1,176 28 1,318Total exposure/Total assets (percent) 1.50 0.20 5.10 5.80 2.20 3.60Total Exposure/Shareholders’ equity (percent) 24.90 2.90 94.20 94.50 34.00 56.90Loss in income statement/Net profit (percent) 0.00 12.50 0.00 43.90 0.80 14.70a Asset-backed securities ABS) (not necessarily related to the mortgage market in the USA) + other financial instruments exposed to the mortgage market in the USAb Including SIV investment.SOURCE: Published financial statements for 2007.
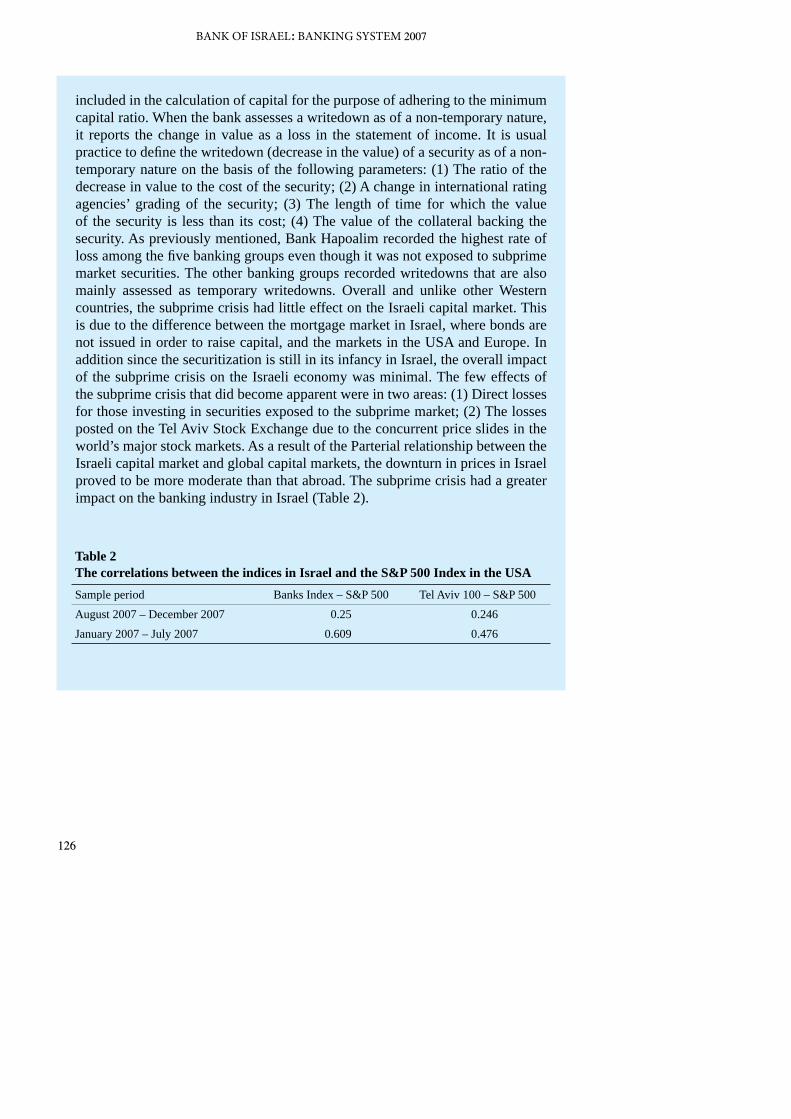
126
BANK OF ISRAEL: BANKING SYSTEM 2007
included in the calculation of capital for the purpose of adhering to the minimum capital ratio. When the bank assesses a writedown as of a non-temporary nature, it reports the change in value as a loss in the statement of income. It is usual practice to define the writedown (decrease in the value) of a security as of a non-temporary nature on the basis of the following parameters: (1) The ratio of the decrease in value to the cost of the security; (2) A change in international rating agencies’ grading of the security; (3) The length of time for which the value of the security is less than its cost; (4) The value of the collateral backing the security. As previously mentioned, Bank Hapoalim recorded the highest rate of loss among the five banking groups even though it was not exposed to subprime market securities. The other banking groups recorded writedowns that are also mainly assessed as temporary writedowns. Overall and unlike other Western countries, the subprime crisis had little effect on the Israeli capital market. This is due to the difference between the mortgage market in Israel, where bonds are not issued in order to raise capital, and the markets in the USA and Europe. In addition since the securitization is still in its infancy in Israel, the overall impact of the subprime crisis on the Israeli economy was minimal. The few effects of the subprime crisis that did become apparent were in two areas: (1) Direct losses for those investing in securities exposed to the subprime market; (2) The losses posted on the Tel Aviv Stock Exchange due to the concurrent price slides in the world’s major stock markets. As a result of the Parterial relationship between the Israeli capital market and global capital markets, the downturn in prices in Israel proved to be more moderate than that abroad. The subprime crisis had a greater impact on the banking industry in Israel (Table 2).
Table 2The correlations between the indices in Israel and the S&P 500 Index in the USASample period Banks Index – S&P 500 Tel Aviv 100 – S&P 500August 2007 – December 2007 0.25 0.246January 2007 – July 2007 0.609 0.476
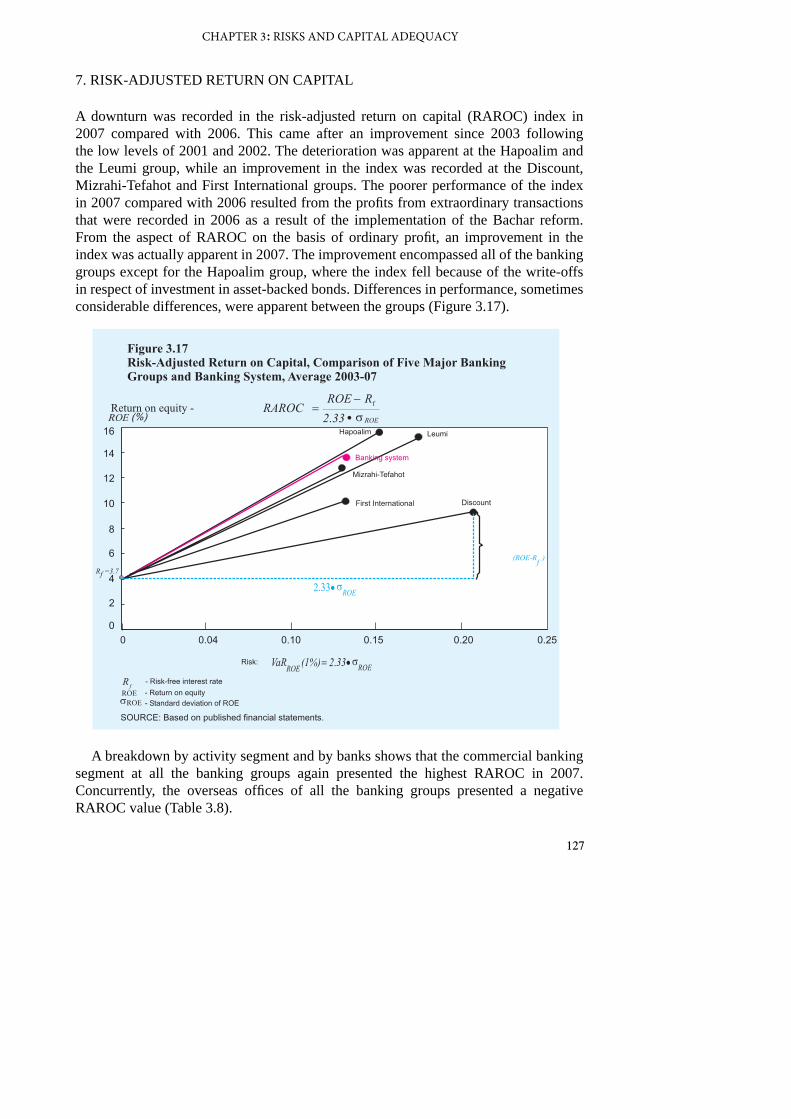
127
CHAPTER 3: RISKS AND CAPITAL ADEQUACY
7. RISK-ADJUSTED RETURN ON CAPITAL
A downturn was recorded in the risk-adjusted return on capital (RAROC) index in 2007 compared with 2006. This came after an improvement since 2003 following the low levels of 2001 and 2002. The deterioration was apparent at the Hapoalim and the Leumi group, while an improvement in the index was recorded at the Discount, Mizrahi-Tefahot and First International groups. The poorer performance of the index in 2007 compared with 2006 resulted from the profits from extraordinary transactions that were recorded in 2006 as a result of the implementation of the Bachar reform. From the aspect of RAROC on the basis of ordinary profit, an improvement in the index was actually apparent in 2007. The improvement encompassed all of the banking groups except for the Hapoalim group, where the index fell because of the write-offs in respect of investment in asset-backed bonds. Differences in performance, sometimes considerable differences, were apparent between the groups (Figure 3.17).
A breakdown by activity segment and by banks shows that the commercial banking segment at all the banking groups again presented the highest RAROC in 2007. Concurrently, the overseas offices of all the banking groups presented a negative RAROC value (Table 3.8).
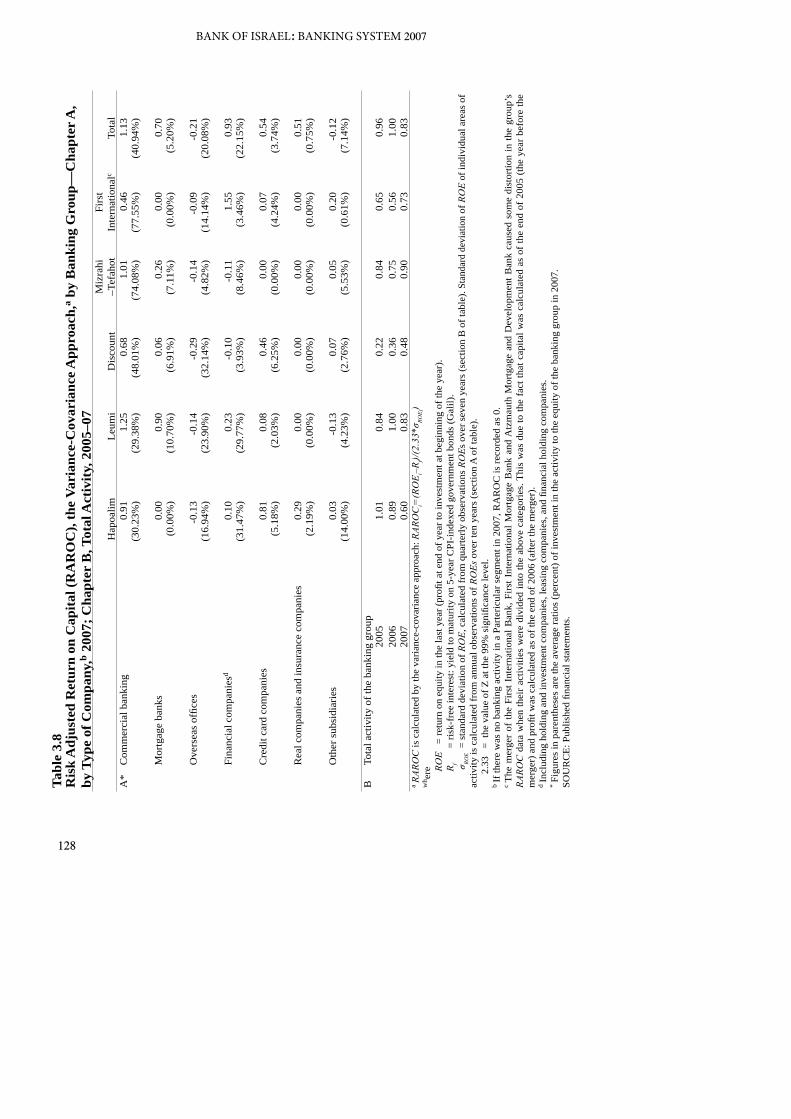
128
BANK OF ISRAEL: BANKING SYSTEM 2007Ta
ble
3.8
Ris
k A
djus
ted
Ret
urn
on C
apita
l (R
AR
OC
), th
e V
aria
nce-
Cov
aria
nce
App
roac
h,a b
y B
anki
ng G
roup
––C
hapt
er A
, by
Typ
e of
Com
pany
,b 20
07; C
hapt
er B
, Tot
al A
ctiv
ity, 2
005–
07
Hap
oalim
Leum
iD
isco
unt
Miz
rahi
–T
efah
otFi
rst
Inte
rnat
iona
lcTo
tal
A*
Com
mer
cial
ban
king
0.91
1.25
0.68
1.01
0.46
1.13
(30.
23%
)(2
9.38
%)
(48.
01%
)(7
4.08
%)
(77.
55%
)(4
0.94
%)
Mor
tgag
e ba
nks
0.00
0.90
0.06
0.26
0.00
0.70
(0.0
0%)
(10.
70%
)(6
.91%
)(7
.11%
)(0
.00%
)(5
.20%
)
Ove
rsea
s of
fices
-0.1
3-0
.14
-0.2
9-0
.14
-0.0
9-0
.21
(16.
94%
)(2
3.90
%)
(32.
14%
)(4
.82%
)(1
4.14
%)
(20.
08%
)
Fina
ncia
l com
pani
esd
0.10
0.23
-0.1
0-0
.11
1.55
0.93
(31.
47%
)(2
9.77
%)
(3.9
3%)
(8.4
6%)
(3.4
6%)
(22.
15%
)
Cre
dit c
ard
com
pani
es0.
810.
080.
460.
000.
070.
54(5
.18%
)(2
.03%
)(6
.25%
)(0
.00%
)(4
.24%
)(3
.74%
)
Rea
l com
pani
es a
nd in
sura
nce
com
pani
es0.
290.
000.
000.
000.
000.
51(2
.19%
)(0
.00%
)(0
.00%
)(0
.00%
)(0
.00%
)(0
.75%
)
Oth
er s
ubsi
diar
ies
0.03
-0.1
30.
070.
050.
20-0
.12
(14.
00%
)(4
.23%
)(2
.76%
)(5
.53%
)(0
.61%
)(7
.14%
)
BTo
tal a
ctiv
ity o
f the
ban
king
gro
up20
051.
010.
840.
220.
840.
650.
9620
060.
891.
000.
360.
750.
561.
0020
070.
600.
830.
480.
900.
730.
83a RA
ROC
is c
alcu
late
d by
the
varia
nce-
cova
rianc
e ap
proa
ch: R
ARO
Ci=
(RO
E i–R f)/
(2.3
3*σ R
OE i
)w
h ere
ROE
= re
turn
on
equi
ty in
the
last
yea
r (pr
ofit a
t end
of y
ear t
o in
vest
men
t at b
egin
ning
of t
he y
ear)
.
R f
=
risk
-fre
e in
tere
st: y
ield
to m
atur
ity o
n 5-
year
CPI
-inde
xed
gove
rnm
ent b
onds
(Gal
il).
σRO
E =
stan
dard
dev
iatio
n of
RO
E, c
alcu
late
d fr
om q
uarte
rly o
bser
vatio
ns R
OEs
ove
r sev
en y
ears
(sec
tion
B o
f tab
le).
Stan
dard
dev
iatio
n of
RO
E of
indi
vidu
al a
reas
of
activ
ity is
cal
cula
ted
from
ann
ual o
bser
vatio
ns o
f RO
Es o
ver t
en y
ears
(sec
tion
A o
f tab
le).
2
.33
= t
he v
alue
of Z
at t
he 9
9% s
igni
fican
ce le
vel.
b If
ther
e w
as n
o ba
nkin
g ac
tivity
in a
Par
teric
ular
seg
men
t in
2007
, RA
RO
C is
reco
rded
as
0.c
The
mer
ger
of th
e Fi
rst I
nter
natio
nal B
ank,
Firs
t Int
erna
tiona
l Mor
tgag
e B
ank
and
Atz
mau
th M
ortg
age
and
Dev
elop
men
t Ban
k ca
used
som
e di
stor
tion
in th
e gr
oup’
s RA
ROC
dat
a w
hen
thei
r ac
tiviti
es w
ere
divi
ded
into
the
abov
e ca
tego
ries.
Thi
s w
as d
ue to
the
fact
that
cap
ital w
as c
alcu
late
d as
of
the
end
of 2
005
(the
year
bef
ore
the
mer
ger)
and
pro
fit w
as c
alcu
late
d as
of t
he e
nd o
f 200
6 (a
fter t
he m
erge
r).
d In
clud
ing
hold
ing
and
inve
stm
ent c
ompa
nies
, lea
sing
com
pani
es, a
nd fi
nanc
ial h
oldi
ng c
ompa
nies
.*
Figu
res
in p
aren
thes
es a
re th
e av
erag
e ra
tios
(per
cent
) of i
nves
tmen
t in
the
activ
ity to
the
equi
ty o
f the
ban
king
gro
up in
200
7.SO
UR
CE:
Pub
lishe
d fin
anci
al s
tate
men
ts.
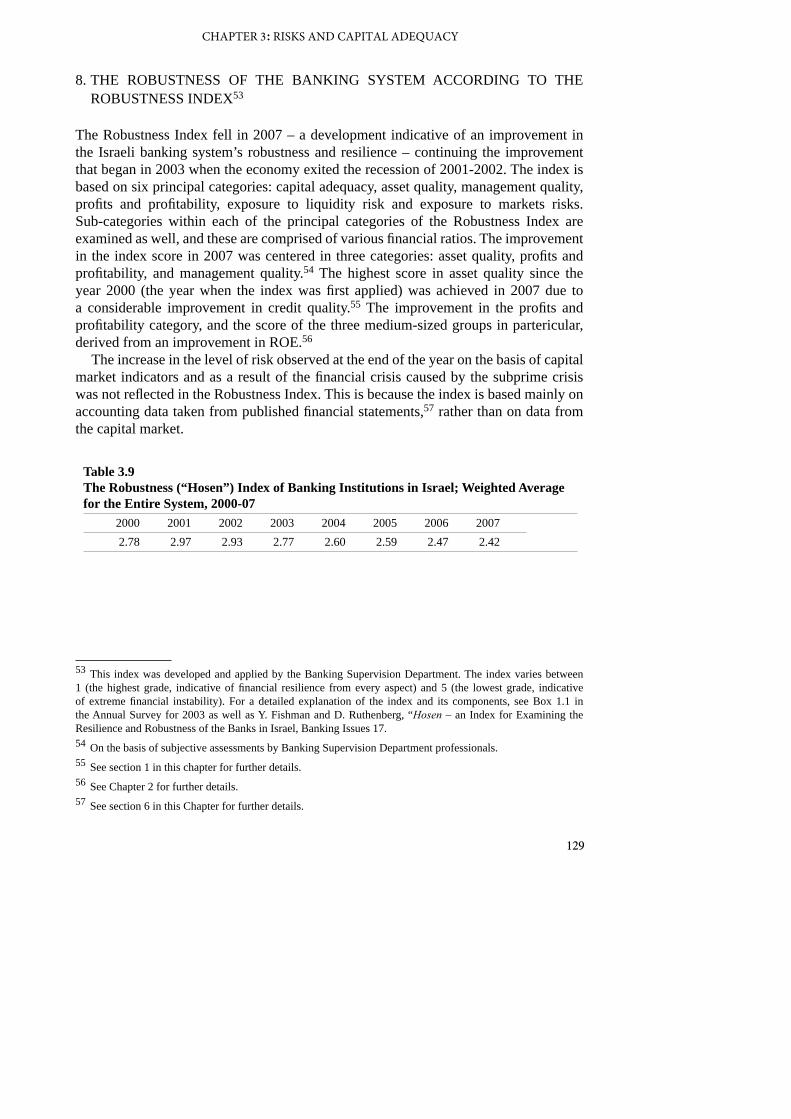
129
CHAPTER 3: RISKS AND CAPITAL ADEQUACY
8. THE ROBUSTNESS OF THE BANKING SYSTEM ACCORDING TO THE ROBUSTNESS INDEX53
The Robustness Index fell in 2007 – a development indicative of an improvement in the Israeli banking system’s robustness and resilience – continuing the improvement that began in 2003 when the economy exited the recession of 2001-2002. The index is based on six principal categories: capital adequacy, asset quality, management quality, profits and profitability, exposure to liquidity risk and exposure to markets risks. Sub-categories within each of the principal categories of the Robustness Index are examined as well, and these are comprised of various financial ratios. The improvement in the index score in 2007 was centered in three categories: asset quality, profits and profitability, and management quality.54 The highest score in asset quality since the year 2000 (the year when the index was first applied) was achieved in 2007 due to a considerable improvement in credit quality.55 The improvement in the profits and profitability category, and the score of the three medium-sized groups in partericular, derived from an improvement in ROE.56
The increase in the level of risk observed at the end of the year on the basis of capital market indicators and as a result of the financial crisis caused by the subprime crisis was not reflected in the Robustness Index. This is because the index is based mainly on accounting data taken from published financial statements,57 rather than on data from the capital market.
53 This index was developed and applied by the Banking Supervision Department. The index varies between 1 (the highest grade, indicative of financial resilience from every aspect) and 5 (the lowest grade, indicative of extreme financial instability). For a detailed explanation of the index and its components, see Box 1.1 in the Annual Survey for 2003 as well as Y. Fishman and D. Ruthenberg, “Hosen – an Index for Examining the Resilience and Robustness of the Banks in Israel, Banking Issues 17.54 On the basis of subjective assessments by Banking Supervision Department professionals.55 See section 1 in this chapter for further details.56 See Chapter 2 for further details.57 See section 6 in this Chapter for further details.
Table 3.9The Robustness (“Hosen”) Index of Banking Institutions in Israel; Weighted Average for the Entire System, 2000-07
2000 2001 2002 2003 2004 2005 2006 20072.78 2.97 2.93 2.77 2.60 2.59 2.47 2.42
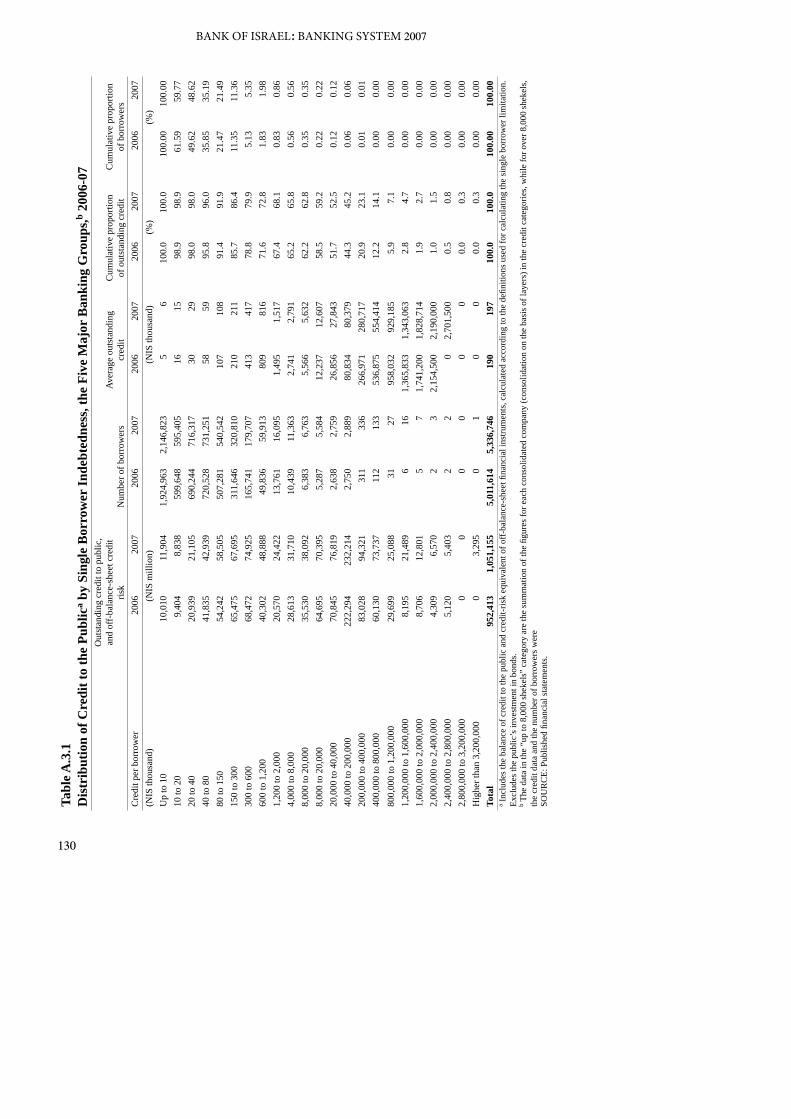
130
BANK OF ISRAEL: BANKING SYSTEM 2007
Tabl
e A.3
.1D
istr
ibut
ion
of C
redi
t to
the
Publ
ica b
y Si
ngle
Bor
row
er In
debt
edne
ss, t
he F
ive
Maj
or B
anki
ng G
roup
s,b 200
6-07
Out
stan
ding
cre
dit t
o pu
blic
, an
d of
f-ba
lanc
e-sh
eet c
redi
t ris
kN
umbe
r of b
orro
wer
sAv
erag
e ou
tsta
ndin
g cr
edit
C
umul
ativ
e pr
opor
tion
of o
utst
andi
ng c
redi
t C
umul
ativ
e pr
opor
tion
of b
orro
wer
s C
redi
t per
bor
row
er20
06
2007
2006
20
0720
06
2007
2006
20
0720
06
2007
(NIS
thou
sand
)
(
NIS
mill
ion)
(NIS
thou
sand
)
(%)
(%
)U
p to
10
10,
010
11,
904
1,9
24,9
63
2,1
46,8
23
5
6
100.
010
0.0
100.
0010
0.00
10 to
20
9,4
04
8,8
38
599
,648
5
95,4
05
16
15
98.9
98.9
61.5
959
.77
20 to
40
20,
939
21,
105
690
,244
7
16,3
17
30
29
98.0
98.0
49.6
248
.62
40 to
80
41,
835
42,
939
720
,528
7
31,2
51
58
59
95.8
96.0
35.8
535
.19
80 to
150
54,
242
58,
505
507
,281
5
40,5
42
107
1
08
91.4
91.9
21.4
721
.49
150
to 3
00 6
5,47
5 6
7,69
5 3
11,6
46
320
,810
2
10
211
85
.786
.411
.35
11.3
630
0 to
600
68,
472
74,
925
165
,741
1
79,7
07
413
4
17
78.8
79.9
5.13
5.35
600
to 1
,200
40,
302
48,
888
49,
836
59,
913
809
8
16
71.6
72.8
1.83
1.98
1,20
0 to
2,0
00 2
0,57
0 2
4,42
2 1
3,76
1 1
6,09
5 1
,495
1
,517
67
.468
.10.
830.
864,
000
to 8
,000
28,
613
31,
710
10,
439
11,
363
2,7
41
2,7
91
65.2
65.8
0.56
0.56
8,00
0 to
20,
000
35,
530
38,
092
6,3
83
6,7
63
5,5
66
5,6
32
62.2
62.8
0.35
0.35
8,00
0 to
20,
000
64,
695
70,
395
5,2
87
5,5
84
12,
237
12,
607
58.5
59.2
0.22
0.22
20,0
00 to
40,
000
70,
845
76,
819
2,6
38
2,7
59
26,
856
27,
843
51.7
52.5
0.12
0.12
40,0
00 to
200
,000
222
,294
2
32,2
14
2,7
50
2,8
89
80,
834
80,
379
44.3
45.2
0.06
0.06
200,
000
to 4
00,0
00 8
3,02
8 9
4,32
1 3
11
336
2
66,9
71
280
,717
20
.923
.10.
010.
0140
0,00
0 to
800
,000
60,
130
73,
737
112
1
33
536
,875
5
54,4
14
12.2
14.1
0.00
0.00
800,
000
to 1
,200
,000
29,
699
25,
088
31
27
958
,032
9
29,1
85
5.9
7.1
0.00
0.00
1,20
0,00
0 to
1,6
00,0
00 8
,195
2
1,48
9 6
1
6 1
,365
,833
1
,343
,063
2.
84.
70.
000.
001,
600,
000
to 2
,000
,000
8,7
06
12,
801
5
7
1,7
41,2
00
1,8
28,7
14
1.9
2.7
0.00
0.00
2,00
0,00
0 to
2,4
00,0
00 4
,309
6
,570
2
3
2
,154
,500
2
,190
,000
1.
01.
50.
000.
002,
400,
000
to 2
,800
,000
5,1
20
5,4
03
2
2
0
2,7
01,5
00
0.5
0.8
0.00
0.00
2,80
0,00
0 to
3,2
00,0
00 0
0
0
0
0
0
0.
00.
30.
000.
00H
ighe
r tha
n 3,
200,
000
0
3,2
95
0
1
0
0
0.0
0.3
0.00
0.00
Tota
l 9
52,4
13
1,0
51,1
55
5,0
11,6
14
5,3
36,7
46
190
1
97
100
.0
100
.0
100
.00
100
.00
a Inc
lude
s the
bal
ance
of c
redi
t to
the
publ
ic a
nd c
redi
t-ris
k eq
uiva
lent
of o
ff-ba
lanc
e-sh
eet fi
nanc
ial i
nstru
men
ts, c
alcu
late
d ac
cord
ing
to th
e de
finiti
ons u
sed
for c
alcu
latin
g th
e si
ngle
bor
row
er li
mita
tion.
Ex
clud
es th
e pu
blic
’s in
vest
men
t in
bond
s.b T
he d
ata
in th
e “u
p to
8,0
00 sh
ekel
s” c
ateg
ory
are
the
sum
mat
ion
of th
e fig
ures
for e
ach
cons
olid
ated
com
pany
(con
solid
atio
n on
the
basi
s of l
ayer
s) in
the
cred
it ca
tego
ries,
whi
le fo
r ove
r 8,0
00 sh
ekel
s, th
e cr
edit
data
and
the
num
ber o
f bor
row
ers w
ere
SOU
RC
E: P
ublis
hed
finan
cial
stat
emen
ts.