From sleep medicine to medicine during sleep – a clinical ...
Upload
khangminh22Category
view
1download
0
Online ISSN 2313-1519Print ISSN 1812-2892www.clinmedkaz.org
№18 (6) 2021
Evaluation of the ability of the C-reactive protein-to-albumin ratio to predict short-term mortality in patients with COVID-19
Job satisfaction, burnout and turnover intention of nurses working in hospital during the pandemic COVID-19 in Turkey
How can cancer screening centers improve the healthcare system of Kazakhstan?
> See page 20 and 24 > See page 35 and 39 > See page 69 and 75

Scientific and practical journal
Turgut Teke, (Тurkey)Kubes Jiri, (Czech Republic)Yaroslav Tolstyak, (Ukraine)Rustam Mustafin, (Bashkortostan,Russian Federation)Adem Kucuk, (Turkey)Yana Sotskaya, (Ukraine)Ainura Dzhangaziyeva, (Kyrgyz Republic)Mehtap Tinazli, (Turkey)Yulia Lunitsyna, (Russian Federation)Yuksel Ersoy, (Turkey)Rikhsi Sabirova, (Uzbekistan)Nurdin Mamanov, (Kyrgyz Republic)Mariya Derbak, (Ukraine)Anatoliy Kolos, (Kazakhstan)Vitaliy Koikov, (Kazakhstan)Saule Abseitova, (Kazakhstan)Almagul Kushugulova, (Kazakhstan)Marlen Doskali, (Kazakhstan)Kakharman Yesmembetov, (Kazakhstan)Nelya Bissenova, (Kazakhstan)Gauri Bapayeva, (Kazakhstan)Bagdat Imasheva, (Kazakhstan)Galiya Shaimardanova, (Kazakhstan)Nasrulla Shanazarov, (Kazakhstan)Adilzhan Albazarov, (Kazakhstan)Elmira Chuvakova, (Kazakhstan)Zhannat Taubaldieva, (Kazakhstan)Aidos Konkayev, (Kazakhstan)Samat Saparbayev, (Kazakhstan)Olga Ulyanova, (Kazakhstan)Galiya Orazova (Kazakhstan)
Editorial Office: Journal of Clinical Medicine of Kazakhstan Ave Abylay-khan #42, 010009, Nur-Sultan, KazakhstanPhone: +7(7172) 577411; Fax: +7(7172) 232927E-mail: [email protected] Web Adress: www.clinmedkaz.org
ADVISORY BOARD
Online ISSN 2313-1519Print ISSN 1812-2892
№18 (6) 2021г.Published since 2004.
FOUNDER and HONORED EDITORAbay Baigenzhin, (Kazakhstan)
EDITOR-IN-CHIEFAbduzhappar Gaipov, (Kazakhstan)
ASSOCIATE EDITORSSinan Kardes, (Turkey)Ashish Jaiman, (India)Mathias Hossain Aazami, (Iran)
EXECUTIVE SECRETARYLaura Dybyssova, (Kazakhstan)
PRODUCTION AND PRINTING MANAGERBekzat Pulatov (Kazakhstan)
Yasin Uzuntarla, (Turkey)Temirlan Karibekov, (Kazakhstan)Sakir Ahmed (India)Saltanat Tuganbekova, (Kazakhstan)Manarbek Askarov, (Kazakhstan)Zulfiya Orynbayeva, (USA)Rimantas Benetis, (Lithuania)Galina Fedotovskikh, (Kazakhstan)Ospan Mynbaev, (Russian Federation)Gunay Akbarova, (Azerbaijan)Selman Unverdi, (Turkey)Ulan Kabayev, (Kazakhstan)Talgat Nurgozhin, (Kazakhstan)Yuriy Kazakov, (Ukraine)Almaz Makenjan uulu, (Kyrgyz Republic)Jakhongir Alidjanov, (Uzbekistan)Praveen Kumar Potukuchi, (USA)Oybek Rustamov (Australia)
EDITORIAL
EDITORIAL BOARD
Journal “Clinical Medicine of Kazakhstan” (ISSN 1812-2892) is a multi-field dedicated peer-reviewed medical journal. The main thematic scope – publication of materials on medical science and practice, education and healthcare organization. Joint Stock Company “National Scientific Medical Center” publishes the journal bimonthly in a year (in February, April, June, August, October, and December). All articles sent to editors undergo double-blind review. Manuscripts are judged by two experts exclusively on the basis of their contribution to initial data, ideas and their presentations. Editors accept articles for consideration and publication at no cost. Detailed information is available in the section Information for authors at the end of this material.The Journal of “Clinical Medicine ofKazakhstan” to the full extent is wedded to initiative of open access and ready to provide free access to full texts of articles, as soon as they will be published and available in the Internet (www.clinmedkaz.org).Journal was registered in the Ministry of Information of the RK on 05.04.2004 and currently included to the list of Publications, approved by the Committee for Control of Education and Science of the Ministry of Education and Science of the Republic of Kazakhstan for publication of the main outcomes of scientific activity.The journal is indexed in such international scientific-information bases as Russian Science Citation Index, “Cyberleninka” scientific electronic library, Index Copernicus International, Google Scholar, CrossRef. DOAJ.
JOURNAL OF CLINICAL MEDICINE OF KAZAKHSTAN
AIMS AND SCOPE OF THE JOURNAL

The latest HIFU installation- JC therapy has been in use in NSMC since January 2010. This installation allows noncontact complete eliminating the endogenic tumor using high intensity focused ultrasound without cutting the tissues and injury of not affected organs.NSMC successfully treats: mammary and alvus fibroadenoma; breast cancer; liver tumors and cysts (primary liver cancer, liver metastases, echinococcosis, alveococcosis); benign and malignant pancreatic tumors; benign and malignant tumors of kidneys; osteogenic and myelosarkoma of extremities (soft tissues and bones cancer of the extremities).HIFU-therapy of echinococcosis and alveococcosis developed in the clinic is the one and only in the world and is an alternative to surgical treatment of this disease, causing the economic feasibility.
NATIONAL SCIENTIFIC MEDICAL CENTER JSC, NUR-SULTAN CITY,REPUBLIC OF KAZAKHSTAN
TREATMENT OF TUMORS AND PARASITIC CYSTS USING HIGH-INTENSITY FOCUSED ULTRASOUND

4Journal of Clinical Medicine of Kazakhstan: 2021 Volume 18, Issue 6
Review Article DOI: https://doi.org/10.23950/jcmk/11328
JOURNAL OF CLINICAL MEDICINE OF KAZAKHSTAN (E-ISSN 2313-1519)
AbstractThe concept of pain differs from individual personal physical,
emotional, social, and cognitive-behavior conditions. Pain in its nature of existence is a complex psychoneurotic syndrome that requires a multidisciplinary inclusive approach to deal with complicated disorders. The psychological issues are a central concern in dealing with pain syndrome, resulting in maximizing emotional outbursts and disabilities. The particular immediate context of occurrences hugely influences the perception of intensity over acute pain syndrome. The cognitive-behavioral psychotherapeutic is the one approach that effectively addresses the nature of total pain in the context where it occurs and the associated factors. The pain syndrome needs to be applied by understanding specific components associated with pain and through the optimal comprehensive assessment interventions at a multidisciplinary level. The psychopharmacology aspect of pain management in conjunction with the patient's primary needs is a productive assessment method with several positive outcomes.
Objective: The article aims to present the importance of understanding the relationship between pain and psychological distress-related symptoms and how it influences pain intensity. The study also explores the existing psychological methods and techniques of pain assessment for quality of life.
Material and method: The present study is a qualitative retrospective method on existing literature and documents.
Key words: pain, psychological symptoms, cognitive-behavioral therapy, anxiety, opioid
Received: 2020-11-01. Accepted: 2021-10-03
The psychological aspect of pain and symptom management in clinical practices: Scoping reviewSuantak Demkhosei Vaiphei1Department of Psychology, Assam Down Town University, Guwahati, India
Corresponding author: Suantak Demkhosei Vaiphei. E-mail: [email protected]; ORCID: 0000-0002-4134-2926
Introduction"We must all die. But that I can save him from days
of torture that is what I feel as my great and ever new privilege. Pain is a more terrible lord of mankind than even death itself." - J.J. Bonica.
Being with pain is a stressful, complicated, and multifactorial experience that destroys individual cognitive and behavioral functioning in dealing with pain symptoms. These psycho-emotional feelings depict the level of pain that maximizes the level of anxiety, stress, and depression. Pain is the one factor that proved the direct link between the human mind and body. The perception of pain demands different understanding paradigms in defining and seeking multidimensional approaches through multidisciplinary team interventions in clinical
practices. Pain is not confined within the bio-medicinal realm alone; it is a wide-ranging phenomenon that requires holistic assessment. There are multiple layers of complex thoughts and feelings in the human brain that construct the level or the amount of pain a person experience and can tolerate. Since it is the human thoughts and feelings that determine how the individual deals with pain symptoms, controlling personal perception and emotion can serve as an effective coping mechanism to modify and cope with the physical pain symptoms [1]. Thus, understanding the psychological aspect of human pain and symptom could significantly enhance patient treatment and deliver the quality of life. The psychological assessment is visible, playing an essential role in managing and reducing patient discomfort and other pain-associated problems.
J Clin Med Kaz 2021; 18(6):4-8

5Journal of Clinical Medicine of Kazakhstan: 2021 Volume 18, Issue 6
Psychological distress and physical pain symptom
Pain is the factor that ruins everyday behavior and interrupts all activities, and is more than a sensational experience. It is a complex component of both physiological and psychological responses in the individual experience. Pain is an unpleasant combination of human sensory and emotion that damages tissues, brain, and memory functioning. The pain symptom demands regular comprehensive assessment to identify the patient physical, psychological, social, and spiritual dimensions through multidisciplinary team interventions for psychodynamic and neurotic assessments. The perception of pain is an individual response to factors like childhood experience, socio-cultural, heredity that usually produces different aspects of pain and suffering. Pain becomes more severe and unbearable, mainly to those with a distressing socio-cultural group of people. In contrast, the pain thresholds were at a lower rate among the socio-culturally stable group of people with faster recovery rates. The context of pain and the behavioral condition of the patient also hugely determine the severity perception of pain experienced by the individual, which requires cognitive and practical aspects of psychological care assessment to the earliest [2]. In all the existing ill-related experiences, pain is the underlying source that produces disability and risk anxiety disorders leading to several suicidal activities. Several studies recognize that pain intensity in its nature of existence is in connection with psychological symptoms. The longer duration of pain, the higher intensity of mood disorder, depression, and anxiety increase the level of pain symptoms. The fMRI (Functional Magnetic Resonance Imaging) mainly depicts how pain symptoms influence mood disorders and emotional aspects in clinical practices. Most research findings stated that the psychological depressive symptoms and pain frequency are the two determining factors of human health. The epidemiological evidence also affirms the high intensity of psychological distress over pain symptoms among medically advance ill patients. The ovarian hormones are also equally responsible for pain intensity in a different region of the human brain/mind state [3].
Another finding suggested that the particular immediate context of occurrences hugely influences intensity over acute pain syndrome. Thereby, if the individual is preoccupied with existential fear and anxiety, even opioids and other related drugs are visible less effective. It instead worsens the intensity of physical pain syndrome. The recent experimental study also found the feeling of hypochondria or somatic visible in increasing the intensity of physical pain symptoms. On the other hand, timely addressing the pain syndrome by distracting the patient thoughts into another interest is an effective coping mechanism that reduces the sensitivity rates of pain and suffering [1]. Pain is a distressful and prominent symptom that affected 75-78% of patients with advanced medical illness. It is also evidence that 68% of death due to stroke have experience pain and symptom disorders. The study also depicted that pain syndromes highly affected the individual ways of life, physical functioning, concentration, increasing disease risks, and helplessness. Being with pain is a stressful event that makes the psychological factors central to the individual experience of pain and for quality treatment policy. Stress is the contributing factor for health problems and chronic pain, including blood pressure, heart disease, obesity, diabetes, and trigger muscle tension that maximize pain intensity. The treatment procedure demands the associations of the sensory, cognitive, emotional, behavioral, and environmental factors that need immediate assessment in the possible ways for effective pain management [5].
Thus, understanding the individual concept of physical pain is essential to understand the endurable pain level and develop effective coping strategies in dealing with both acute and chronic pain symptoms. Chronic pain accompanied several psychological and mood disorders that usually destroyed patients' peace of mind and quality of life in their nature of existence. The factors responsible for the causes of chronic pain in the human body are; nerve fibers dysfunction through injuries or surgery, patient medical condition, some portions of brain neurons dysfunction, through accident or illness [4].
Adapted from Bettina Sandgathe Husebø, 2020[7].
The Psychological Aspects of Pain and Symptom Management
Despite the advanced modern medical science and technologies in clinical practices, psychological distress remains the underlying issue in dealing with chronic pain. The intensity of psycho-emotional grief associated with pain increases disease risk rates in the individual experience and reduces inpatient quality of life. Pain in its nature of existence is a complex psychoneurotic syndrome that requires a multidisciplinary inclusive approach to deal with complicated disorders. Effective total pain management hugely depends on the holistic assessment of the patient's physical, psycho-emotional, social, and spiritual aspects. Identifying psychological distress-related symptoms and the significant examination of factors associated with pain-related distress are the two essential elements to be identified in pain assessment. Identifying the patient's pain frequency and the amount of pain accounted for health variables is also equally crucial as it significantly differs from the individual cognitive-biological and environmental context [6]. Thus, the

6Journal of Clinical Medicine of Kazakhstan: 2021 Volume 18, Issue 6
psychotherapeutic interventions inpatient total pain management becomes an essential coping mechanism in reducing the intensity of pain. The psychological assessment is also visible in identifying and understanding the patient's negative thoughts, emotional sufferings, and other associated ill behavior, which usually produces discomfort and increases the pain inpatient experience. The pain syndrome needs proper assessment by understanding specific components associated with pain and through the optimal comprehensive assessment interventions at a multidisciplinary level. The psychopharmacology aspect of pain management in conjunction with the patient's primary needs is a productive assessment method with several positive outcomes [5].
Adapted from Bettina Sandgathe Husebø, 2020[7].
On the other hand, recognizing the role of psychologists
in pain management begins during the 1950s and 1960s with the rapidly growing problems of patients experiencing disabilities through constant chronic pain. On the other hand, the patients were not able to explain the extent of damage caused in their daily experience with the pain symptoms. In finding the nature of pain that interrupts the individual cognitive function, the clinicians focus on biomedicine asper and ignore the psychological factors accompanying the pain syndrome. Failing to acknowledge the psychological components resulted in long-term psychological damage and makes the pharmacological treatment ineffective [8]. In addressing the total pain, it is essential to understand the context and the factors involved. The cognitive-behavioral psychotherapeutic is the one approach that effectively addresses the nature of real pain in the context where it occurs and the associated factors. Cognitive Behavior Therapy is a humanistic approach that constructs unique coping skills through several relaxation techniques for managing and controlling the total pain symptoms. It adopts the diversion techniques against the psychosocial-spiritual signs that accompanied the patient physical pain through its positive therapeutic approach. The therapeutic assessment effectively manages specific body functioning, brain waves, stress response, relaxing muscular tension, and reducing the overall body response to pressure [9]. Acknowledging the patient's socio-cultural background, economic status, and belief system is another critical area to be identified to deliver quality treatment procedures in total pain management.
The biopsychosocial model is a modern humanistic approach that incorporates patient sensory, cognitive, emotional, behavioral, and environmental factors in understanding and managing the pain symptoms. Mainly for adults with chronic pain, the cognitive-behavioral model is an essential coping mechanism for relieving pain and recover from symptoms. The study on pain experience among the medically ill population found that pain is due to patient psycho-emotional and behavior factors like beliefs, fear, and addiction to drugs. In addition to chronic pain, the majority of the patients experience physical organ dysfunction, sleep disorder, fatigue, isolation, and care assessment dissatisfaction. The side effects of pain hugely affect the patient's cognitive process, emotional outbreak, and other phobic responses. It requires the psychological understanding and assessment of patient pain experience alongside the bio-medicinal supports for effective pain management in clinical practices. On the other hand, the psychosocial approach is the model of care that encounters the environmental challenges and other inevitable cognitive issues in the chronic pain experience.
A pilot study done on chronic pain management shows the increasing reliability of the psychological instruments used to treat patient cognitive-behavioral therapy towards chronic pain. The treatment aims to reduce the patient's maladaptive behavior, beliefs, negative thoughts and identify those associated harmful components that make pain treatment ineffective. The therapeutic assessment helps in re-organizing the patient cognitive process through pain therapists, anesthetists, clinical psychologists, and physiotherapists in the clinical practices. The pain management medicinal contents differ as per the patient's perception of the pain and cognitive-behavioral context. It is basing on seven fundamental principles; Direct positive reinforcement of pain behavior, Indirect positive support of pain behavior, Positive reinforcement of good behavior, Physical fitness and function, Cognitive reframing, Education and empowerment, Critical process factors, and The evidence base [10,7,8].
Challenges and discussion The emerging issues in pain and symptom management
are opioids and other related drugs that lead to addiction or total dependency. This addiction and total dependency make the psychological intervention more essential to control the dependence or total reliance on opioids and other drugs through its non-drugs psychotherapeutic techniques. The patient mainly develops total dependence on drugs in chronic pain when their psychosocial-emotional sufferings were not identified and treated on time. On the other hand, chronic pain is a stressful event, subjective experience, self-limiting but not self-evident, which becomes the underlying public health concern. To encounter frustrating patient events and difficult situations effectively demands multimodal approaches to care with multidisciplinary team interventions. No doubt that humans are destined to die, but the pain is a terrible lord rather than death itself. So, saving the individual from the torture of pain and its side effects becomes the core concern for the multidisciplinary teams involves in clinical pain management [11]. However, in a country like India, the distressing psychological symptoms are still considered as symptoms not to be treated in its clinical practices. The painful patient symptoms and emotional suffering are not considered an illness to be treated in most cases. It is only through identifying and acknowledging the psychosocial-spiritual distressing symptoms associated with pain, the influential 'total pain' management policy can be successfully implemented. The holistic assessment in clinical practices is satisfactory for the patient and is a rewarding activity even for the health care professionals.
The war against chronic pain symptoms remains a difficult one in clinical practices. It is always co-existed with several psychological distressing symptoms, which sometimes resulted in a patient physical disability. Albert Schweitzer wrote: "The use of narcotics in terminal cancer is to be condemned if it can be avoided. Morphine and terminal cancer are in no way synonymous. Morphine usage is an unpleasant experience for the majority of human subjects because of its undesirable side effects. Dominant in the list of these unfortunate effects is addiction" [12]. The psychological non-drugs therapeutic approach is the only way to relieve pain that prolongs suffering without addiction and zeroes adverse side effects. Pain management is a unique challenge to health care professionals that requires several sensible and pragmatic diagnostic approaches to intervention, alongside quality management skills and strategies. At present, realistic expectations and recognition of the limitation in chronic pain medication are the two emerging challenges

7Journal of Clinical Medicine of Kazakhstan: 2021 Volume 18, Issue 6
in chronic pain management. The use of an opioid is another fundamental challenge to every health care professional. The dangers of opioids and other related drugs can be mainly visible in worsening a patient's ill condition, loss of memory, untimely death, and maximizing tension if overprescribed. It requires an appropriate pain management policy and comprehensive strategies that work in the patient's best interest with the minimal inclusion of the use of opioids or total avoidance of opioids and other related drugs. The pain management strategies should optimize effectiveness with minimal adverse side effects through the psychological mind-body therapeutic approaches. The primary aim of chronic pain management is not to eradicate the pain, instead to help the patient adjust its thresholds through appropriate care interventions [13].
In chronic pain management, the patient and even those clinicians addressing the pain symptoms experience several psychological disorders like stress, stigmatizes, isolation, and being disturbed in their everyday life that require special considerations. Thus, psychological issues become the central concern in dealing with pain symptom management in clinical practices. It is to be noted that improving the pain management standards will inevitably enhance the patient/clinician's quality of life and wellbeing of the whole in any clinical practice. The psychological cognitive-behavioral therapeutic approach is the existing effective model of care to encounter the complexity of pain experience through its biofeedback and relaxation therapy. It is essential to establish a patient referral model to pain clinics, financial support, acknowledging patient attribution, and consistent evaluation of patient treatment outcome or progress in pain management. Patient physical fitness also plays a vital role in managing pain-related symptoms that can provide patient self-reinforcement with a positive outlook towards environmental challenges. Some of the underlying factors that need to be evaluated in psychological pain assessment are; care goals, present/past adherence to diagnosis/prognosis, patient beliefs, and cultural background. Comorbidities and related symptoms apart from the pain syndrome, patient history of drugs consumptions, ongoing patient cognitive functioning with the treatment, and socio-economic status are also essential [5].
The clinicians should be cautious in differentiating between the patient's physiological tolerance, physical and psychological dependency on opioids, and related drugs in pain assessment. The amount of medications for pain control and the negative phenomenon after the withdrawal of drugs is an important domain that requires special considerations. The psychological assessment is another critical area of care to help the patient develop the ability to create self-defeating and self-denigrating insights to encounter reality and pseudo-addiction behaviorism. It will also help enhance the individual capability of stress
management to undergo effective self-relaxation therapy that will lead the individual to identify and solve their problems. The psychological assessment is also visible effective in reforming or improving the daily habits of the patient physical activity by not allowing pain symptoms to take over the individual happiness. Developing a healthy lifestyle, distracting pain through social integration, and engaging with newly form hobbies is also an essential coping mechanism against pain syndrome [14,7]. The psychological aspect of pain management is a growing public health concern that identifies the patient pain frequency to establish a quality treatment plan and policies. The psychological cognitive-behavior and evidence-based strategical therapeutic approaches are effective with chronic pain of every age and complex cultural background. The psychospiritual model is also another effective pain and symptom management mechanism, mainly with those psychological depressive symptoms through chronic pain [15]. Thus the underlying factor in pain management is to acknowledge both the mental and physical risk factors for effective pain management strategies. The concept of total care approaches that address patient socio-economic and other bio-environmental challenges through multidisciplinary team interventions could effectively help the patient in their pain experience than any other method.
Conclusion Pain is a stressful, complicated, and multifactorial
experience. It is a universal symptom that disturbs the whole process of normal human organ functioning. Whether acute or chronic pain it is always accompanied by several unwanted, ill feelings that increase the disease risk. The psychological assessment is a safer approach of care that provides a non-drug method that directly deals with the origin of pain symptoms. It helps reduce the psychological depressive stressors that worsen the individual pain and cope effectively with several factors associated with pain and suffering. Thus, learning how to cope with the problems and stressors related to pain and suffering is the core criterion for effectively dealing with the pain symptoms.
Disclosures: There is no conflict of interest for all authors.
Acknowledgements: None.
Funding: None.
Informed consent: Informed consent was obtained from all individual adult participants included in the study; assent was obtained from children.
References 1. George R. Hansen, George R & Streltzer, John. The Psychology of Pain. Emerg Med Clin N Am. 2005; 23 (1): 339–348.
Doi:10.1016/j.emc.2004.12.005.2. Meldrum ML. Pain: Physiology and Psychology in Encyclopedia Britannica. https://www.britannica.com/science/pain.
Accessed from the web on December 17, 2019.3. Gorczyca R, Filip R, Walczak E. Psychological Aspects of Pain. Ann Agric Environ Med. 2013; Special Issue (1):23-27.4. Intermountain Healthcare. Pain and Symptom Management. https://intermountainhealthcare. org /services/hospice-palliative-
care/services/pain-and-symptom-management. Accessed on December 18, 2019.5. Rizk Dahlia. Palliative Care: Pain Management. https://www.cancertherapyadvisor. com/home/decision-support-in-medicine/
hospital-medicine/palliative-care-pain-management/. Accessed on December 18, 2019.6. Baker, T.A., Krok-Schoen, J.L. & McMillan, S.C. Identifying factors of psychological distress on the experience of pain and
symptom management among cancer patients. BMC Psychol. 2016; 4 (52): 1-7. Doi:10.1186/s40359-016-0160-1.

8Journal of Clinical Medicine of Kazakhstan: 2021 Volume 18, Issue 6
7. Sandgathe Husebø et al. Innovating the clinical pathway for home-dwelling people with dementia and their caregivers: study protocol for a mixed-method, stepped-wedge, randomized controlled trial. Trials. 2020; 21(510). Accessed from the web https://trialsjournal.biomedcentral.com/articles/10.1186/s13063-020-04414-y.
8. Eccleston C. Role of psychology in pain management. BJA: British Journal of Anaesthesia. 2001; 87 (1); 1:144–152, https://doi.org/10.1093/bja/87.1.144.
9. APA. Managing Chronic Pain: How psychologists can help with pain. managementhttps://www.apa.org/helpcenter/pain-management. Accessed on December 19, 2019.
10. Zara, C, Baine, N. Cancer pain and psychosocial factors: a critical review of the literature. Journal of Pain and Symptom Management. 2002;24:526–542. https://doi.org/10.1016/S0885-3924(02)00497-9
11. Turk DC, Rudy TE. Neglected factors in chronic pain treatment outcome studies—referral patterns, failure to enter treatment, and attrition. Journal of Pain. 1990; 43(1): 7–25. DOI: 10.1016/0304-3959(90)90046-g.
12. Bonica J. J. History of pain concepts and therapies. 1990: 2–13. In Thomas MA. Pain management - the challenge. Ochsner Journal. 2003; 5(2):15–21.
13. Thomas MA. Pain Management - The Challenge. Ochsner Journal. 2003; 5 (2):15–21.14. Harvard Medical School. Challenges of Managing Chronic Pain. https://www.bmj.com/content/356/bmj.j741. Accessed on
December 22, 2019.15. Groninger Hunter. Pharmacologic Management of Pain at the End of Life. American Family of Physician. 2014; 90(1):27-32.16. Lee, Y., Wu, C., Chiu, T. et al. The relationship between pain management and psychospiritual distress in patients with advanced
cancer following admission to a palliative care unit. BMC Palliat Care. 14(1):1-7. Doi:10.1186/s12904-015-0067-2.

9Journal of Clinical Medicine of Kazakhstan: 2021 Volume 18, Issue 6
Review Article DOI: https://doi.org/10.23950/jcmk/11346
JOURNAL OF CLINICAL MEDICINE OF KAZAKHSTAN (E-ISSN 2313-1519)
AbstractAccording to the study literature, urolithiasis remains one of the
most common nosologies among the child population. In connection with the global changes in the health status of the population of our planet, the social significance of urolithiasis has recently acquired new relevance. The mechanism of stone formation is a complex process; stones are formed as a result of urine saturation with oxalates, calcium, uric acid, cystine. Most stones in children are located in the upper urinary tract. In 15%-25% of cases in children, urolithiasis may be asymptomatic. Diagnostics today are not difficult. If urolithiasis is suspected, first, among the instrumental research methods, ultrasound examination of the urinary tract is used, which identifies both X-ray-positive and X-ray-negative stones. Nowadays, not all standards for treating obstructing stones of the upper urinary tract in children of various sizes and localizations, as well as the type of pelvis structure, have been defined. Simultaneously, new trends in treatment may change already existing standards. It should be noted that in the modern world and ways of metaphylaxis urolithiasis in children studied insufficiently. In the world literature, there is insufficient information on predicting the occurrence of recurrence of urolithiasis and ways to eliminate them. This literature review examines the epidemiology, etiopathogenesis of urolithiasis, diagnosis, existing treatment standards and metaphylaxis. Methods of active tactics of treatment of obstructive stones of the upper urinary tract are analysed in more detail.
Key words: urolithiasis in children, etiopathogenesis, kidney stones, prevalence, diagnosis, treatment, metaphylaxis
Received: 2021-07-11. Accepted: 2021-11-09.
Modern vision on the problem of urolithiasis in children: epidemiology, etiopathogenesis, clinical, diagnostics, treatment, metaphylaxisАssel Sagymbayeva1,2
1Department of Pediatric Surgery, Asfendiyarov Kazakh National Medical University, Almaty, Kazakhstan2Pediatric Urology Department, Scientific Center of Pediatrics and Pediatric Surgery, Almaty, Kazakhstan
Corresponding author: Аssel Sagymbayeva. E-mail: [email protected]; ORCID: 0000-0001-6367-8327
IntroductionUrolithiasis of the upper and lower urinary tract is a
widespread disease, despite the fact that this pathology has been known since ancient times (in 1901, the archaeologist Smith found a bladder stone near the Egyptian village of El Amrah in a mummy buried 7000 years ago). Currently, urolithiasis is called a disease of civilization, since the factors that contribute to the increase in growth include modern living conditions, such as physical inactivity, leading to metabolic disorders, unbalanced nutrition. The prevalence of urolithiasis in some countries has increased
by more than 7 times over the past century (Apolikhin O.I., 2017). It should be noted that an increase in the incidence of urolithiasis is noted in all age groups. According to the results of a comprehensive epidemiological study by Romero in 2010, the incidence of urolithiasis over the past 20 years in economically developed countries such as the USA, Germany, Italy, Spain and Japan has doubled, with a progressive increase in this indicator in those years. [1]. In our country, according to Alchinbaev M.K. (2016) among the adult population, there is an increase in the incidence of urolithiasis in the region from 42.3 per 100 thousand of the adult population in 2000 to 76.6 per 100 thousand of
J Clin Med Kaz 2021; 18(6):9-14

10Journal of Clinical Medicine of Kazakhstan: 2021 Volume 18, Issue 6
the population in 2015 [2]. It should be noted that when studying scientific publications over the past 20 years, there are no data on the frequency of urolithiasis in children in our country. In Russia, the incidence of urolithiasis in children is 19-20 cases, and in adolescents it reaches 80-90 cases per 100 thousand of the child population (Alyaev Yu.G., 2004). Other authors, such as Straub M., Gschwend J., Zorn C. (2010), also note an increase in the incidence of the disease in those periods, especially in children under the age of 1 year [3,4].
According to the information of the National Health and Nutrition Examination Survey (NHANES), which helps analyze trends in the prevalence of kidney stones in the United States, shows that the prevalence increased from 5.2% between 1988-1994 to 8.8% between 2007-2010 [5]. Thus, urolithiasis is a widespread disease, which tends to increase from year to year.
Despite the fact that urolithiasis has been studied for a long time, today there are no exact comprehensive unified scientific points of view about the etiopathogenesis of this pathology.
Exogenous and endogenous factors contribute to the stone formation. Exogenous factors include environmental and climatic conditions of the environment (air humidity, temperature fluctuations, precipitation and the influence of insolation), peculiarities of the chemical composition of soil and water, nutrition, social factors (physical inactivity).
Endogenous causes include genetically determined hereditary factors, endocrine disorders (hyperparathyroidism), diseases of the digestive tract (malabsorption syndrome, Crohn's disease), abnormalities of the urinary system, urinary infections.
There are many theories explaining the causes and mechanisms of pathogenic stone formation. The main ones are: microbial theory (Meckel, 1856); physical and chemical theory (Ultsman, 1890); the theory of colloid-crystalline equilibrium (Lichwitz and Schade, 1889); Matrix Theory (Randal, 1936). It is worth noting that all theories of stone formation are united by the main condition - the presence of urine supersaturation with stone-forming substances (minerals) and indicators, more precisely, the stability of the urine reaction (pH).
It is known that the stone formation initially begins in the renal collecting system, terminal collecting ducts, or attached to the renal papillary surface or epithelial surface of the terminal collecting ducts [6].
In 1937, Randall suggested that kidney stone formation "requires an initial injury that precedes kidney stone formation" [7]. He reported that 17% of the 429 pairs of kidneys examined at autopsy had "calcium deposits on the walls and intertubular spaces of the renal papilla". He also described these plaques as the "natural process of repairing a type of tubular injury". After dissecting 1,154 pairs of kidneys, Randall found that 19.6% showed signs of calcified lesions in at least one renal papilla and 65 kidneys had a primary kidney stone attached to the papillary plaque [8, 9]. He hypothesized that interstitial calcium phosphate (CaP) and calcium carbonate deposits break out on the renal papilla surface and form a type I precalculus lesion [8], now known as Randall's plaques [10]. He also suggested that excessive urinary supersaturation, or "hypersecretion", leads to salt crystallization of stone formation and clogging of the collecting ducts, creating a type II precalculus lesion [9], now known as Randall's plaque [11]. Thus, Randall proposed two pathways for the formation of kidney stones. The first is through changes in the renal parenchyma and the formation of Randall's plaques, and the other, requiring changes in urine composition or supersaturation, leading to the development of Randall's plaques.
Khan et al. performed detailed scanning (SEM) and transmission electron microscopy (TEM) analysis of RPL and renal papillary tissue at the calculus attachment site. The plaque looked like a small ledge. SEM analysis showed that plaques were aggregates of spherical CaP crystals mixed with fibers of various thicknesses and other cellular products [12].
Sidorenko S.V. (2001) indicates the infectious genesis of stone formation in his work. Solkh R.M., Andryukhin M.I., Makarov O.V., Fedchenkov V.V. (2017) studied pathogenic urease-producing bacterial strains, in particular intestinal strains [13]. The cascade of reactions in the interaction of uropathogenic microorganisms and urothelium cells leads to disruption of the assembly of new villi and the expression of E. coli virulence genes [14-17].
In their works, the authors Carla G. Monico, Dawn S. Milliner (2011) describes the genetic determinants of urolithiasis, in particular idiopathic (polygenic and monogenic) forms of urolithiasis, which are caused by various disorders in the gene locus. For the common polygenic form of urolithiasis, studies of familial relationships and candidate genes have revealed abnormalities in calcium metabolism. It should be noted that monogenic forms of urolithiasis are mainly found in children and adolescents [18].
In few previous studies, 50-60% of cases of urolithiasis are inherited predisposition; the probability of developing in patients of the first-degree relatives and more distant family members has been estimated at 15% to 65%, while 5-20% has relatives being affected by this disease [19]. In 65% of patients with calcium nephrolithiasis and in 70% with hypercalciuria may have a family history of the disorder [20]. More than 80 monogenic forms of urolithiasis are known, for example, xanthinuria, primary hyperoxaluria, cystinuria types A, B and AB, metabolic disorders of 2,8-dihydroxyadenine, Lesch-Nyhan syndrome and others [19, 21]. However, the main form of urolithiasis represented by polygenic inheritance [22].
Urolithiasis can be classified according to location, size, aetiology of formation, composition, and risk of recurrence. According to the European Association of Urology guidelines for urolithiasis, upper urinary tract stones can be classified according to size, as ≤5 mm, 5–10 mm, 10–20 mm, and> 20 mm [19]. Stones can be classified according to anatomical position: in the calyx (upper, middle, lower), renal pelvis, ureter (proximal, middle, and distal) and urinary bladder. The composition and density of urinary stones can be assessed using native-computed tomography, which determines the X-ray density of stones in Hounsfield units. Based on the results of determining the density of stones, they are divided into 4 groups: 1) the density of stones is up to 500 units. H; 2) the density of stones is from 501 to 1000 units. H; 3) the density of stones is from 1001 to 1500 units. H; 4) the density of stones is over 1500 units. H.
It should also be noted that according to the radiological characteristics, the stones are divided into radiopaque ones: calcium oxalate dihydrate, calcium oxalate monohydrate, calcium phosphate; low-contrast: magnesium and ammonium phosphate, apatite, cystine; non-contrast: uric acid, ammonium urate, xanthine, 2,8-dihydroxyadenine, medicinal stones (Table 1).
By chemical composition:- Inorganic: calcium oxalate, calcium phosphate,
ammonium magnesium, calcium carbonate.- Organic: uric acid, ammonium urate, protein calculi:
cystine, xanthine, 2,8-dihydroxyadenine. [23]About 80% of urinary stones are calcium, most of which
are calcium oxalate [24].

11Journal of Clinical Medicine of Kazakhstan: 2021 Volume 18, Issue 6
Clinical manifestationsThe most common manifestations of urolithiasis in children
are abdominal pain, dysuria, vomiting, oliguria, haematuria, pyuria, and urinary tract infections. Macroscopic or microscopic haematuria can be found in 90% of children with urolithiasis.
In a series of studies by Bayen M., Hamdi L., Hamdi A. et al. (2017), urinary tract infection and abdominal pain were the main clinical signs of urolithiasis in children. Most children with urolithiasis have a positive family history. 29.5% of patients had a family history of urolithiasis, which was an important factor in the etiological study and diagnosis of urolithiasis [25].
In 15-25% of cases in children, urolithiasis may be asymptomatic, which requires more attention [26]. It should be noted that, in infants, general symptoms of urolithiasis prevail, such as vomiting, nausea, abdominal pain without clear localization, while in school-age children, pain can be characterized as attack of acute pain in the form of renal colic. According to the study literature, approximately 80% of urinary tract calculi can be excreted spontaneously [27].
Pyuria is an almost constant symptom of urolithiasis. A pathological sign of urolithiasis is the excretion of stones in the urine. Spontaneous discharge of stones has observed in 51.21% of children [25]. The diameter of these stones is usually 4-5 mm; however, in children, stones with a diameter of 9-10 mm may be discharged spontaneously, which is related to the greater elasticity of the urinary tract [4].
DiagnosticsWith the introduction of modern ultrasound devices, X-ray
research methods, at present, the diagnosis of urolithiasis does not cause any difficulties.
The simplest, non-invasive, readily available method for diagnosing urolithiasis is ultrasound (ultrasound). B-mode ultrasonography can detect stones in the kidney, in the proximal ureter at about the height of the inferior pole of the kidney, and in the distal ureter. As a rule, stones in other segments of the ureter cannot be visualized due to intestinal gas. The expansion
Table 1 The characteristic features of the most common urinary tract stones
Composition Frequency of the occurrence
Radiological characteristics CT appearance (X-ray density of stones) in Hounsfield units (H)
Aetiological Factors
Calcium oxalate monohydrate/dihydrate
40-80% Radiopaque 1700-2800Н Metabolic disorders (idiopathic hypercalciuria or hyperoxaluria)
Hydroxyapatite (calcium phosphate)
20-60% Radiopaque 1200-1800Н No metabolic abnormality
Brushite 2-4% Radiopaque 1700-2800Н Not associated with urinary tract infection
Uric acid 5-10% Non-contrast 200-450Н Idiopathic hyperuricemia
Struvite 5-15% Radiopaque 600-900 Н Renal infection
Cystine 1-2,5% Low-contrast 600-1100Н Renal tubular defect

12Journal of Clinical Medicine of Kazakhstan: 2021 Volume 18, Issue 6
of the calyx-pelvis system is an indirect sign of a kidney stone. The sensitivity and specificity of ultrasound diagnostics of nephrolithiasis is approximately 61–93% and 95–100%, respectively. The accuracy of ultrasound examination for urolithiasis in children is also different. Stones could be found in 33-100% of cases. The information content of detecting stones by ultrasound is much higher in the kidneys than in comparison with the ureter [28].
Intravenous urography can reveal radiopaque stones. This method allows you to assess the excretory and evacuation function of the kidneys. According to the study literature, the specificity of urography is 82%, and the sensitivity is 69% [29]. With obstructing stones of the upper urinary tract, an increase in the renal cavity system (calyx, pelvis) is noted, manifests itself in the form of secondary hydronephrosis.
Non-contrast computed tomography (NСT) is a method with the highest sensitivity of 91–100%, corresponding to specificity (95–100%, respectively) for examining ureteral stone. Using thin sections (<5 mm) to detect small stones. Non-contrast CT is superior to all other imaging techniques [30,31]. The measurement of density (Hounsfield unit) also facilitates the assessment of stone composition, which is important for treating urolithiasis [32].
However, the radiation dose in non-contrast computed tomography is about 2.8-5.0 mSv [33], which is significantly higher than with traditional radiological methods. Because children with urinary stones are at a high risk of recurrence in their lifetime, they are likely to need multiple stone examinations over the course of their lives. Therefore, radiation exposure is an important issue in pediatric urology. Kuhns et al. calculated that the ratio of the risk of abdominal and pelvic cancer due to a single tubing for stones to the risk of natural cancer during the child's life is from 2/1000 to 3/1000 [34].
During the last decade, examination protocols with lower doses of radiation (the so-called ultra-low dose tubing) have been developed. However, this term is not standardized. Using these protocols, the radiation dose can be reduced to about 1–2.2 mSv [35, 36]. However, the informative value decreases, especially with regard to the composition of the stone (measured in Hounsfield units), which jeopardizes the effectiveness of the treatment.
In addition, computed tomography makes it possible to assess the condition of the renal parenchyma, the presence of anomalies of the urinary system, more accurate localization of the stone, the density and volume of the calculus, which is an important step in planning treatment.
The laboratory methods for the study of urolithiasis include, in addition to a general blood test, a cogaulogram, a general urine analysis, the following methods are included: urine pH-metry, urine sediment study for leukocytes, erythrocytes, salts and bacteria; creatinine clearance; bacteriological culture of urine.
A complex of biochemical studies makes it possible to determine compounds such as calcium, phosphorus, magnesium and uric acid in blood serum and daily urine. In the scientific literature, a number of specialists indicate the advisability of determining oxalates and amino acids (cystine) in urine [37, 38]. X-ray crystallography or infrared spectroscopy; electron microscopy is currently used to study the chemical composition of a stone. These methods have both advantages and disadvantages. The advantages of infra-red spectroscopy are the speed of obtaining spectra of sufficient specificity, while using the minimum amount of the investigated material.
The combination of infrared spectroscopy and X-ray
examination makes it possible to perform not only the qualitative, as well as the quantitative composition of the samples, determining the structure of the urinary calculus and the quantitative proportions of the constituent elements.
TreatmentStone healing is mentioned in ancient Egyptian medical
scriptures from 1500 BC. The first urinary stones were found in Egyptian mummies 4000–5000 BC. Between the 5th and the 3rd centuries BC, doctors vowed to refrain from operations with stones, since the Hippocratic Oath states: “I will not use a knife even for patients with stones, but I will give it up in favour of those involved in this work.” In the Middle Ages stone removal operations were performed by surgeons called lithotomists. For 500 years lithotomists travelled around Europe with their stone-cut “lithotomy tables.” In 1561, Pierre Franco performed the first suprapubic lithotomy to remove a stone in the bladder.
Advances in the treatment of urolithiasis in children were revolutionary with the development of shock wave lithotripsy in the early 1980s, making it the treatment of choice for most upper urinary tract stones. Although recent advances in the improvement and modification of modern endoscopic equipment and techniques, treatment options and subsequent access to the urinary system have expanded. Extracorporeal shock wave lithotripsy is indicated for children without anomalies of the urinary tract and musculoskeletal system, with a stone size of up to 1 cm. Although there is data in the literature where ESWL was used for stones measuring 1.5-2 cm, this approach should take into account repeated ESWL sessions to achieve complete extraction of stones "stone-free rates" [39-42]. Some studies report that the frequency of complete stone clearance for isolated stones in the lower calyx group varies from 50% to 62% [43-45]. For large and coral stones, as well as for stones in the lower calyx group, the use of ESWL is limited.
In 1929 Young was the first to report ureteroscopy. Since then, methods have been developed to avoid open surgical procedures and the need for “faceting”.
Surgical methods of treatment are used for obstructing stones of the upper urinary tract. Over the past 20 years, a major breakthrough has been made in pediatric urology in the treatment of urolithiasis in favor of the use of endoscopic treatments such as ureteroscopy, intrarenal retrograde surgery, and transurethral ureteroscopic lithotripsy/lithoextraction.
Recent literature reported, in the last decades, percutaneous nephrolithotripsy (PNL) is used by urologists with stones more than 2 cm, coral, large stones. The effectiveness of treatment when using PNL in children, according to various authors, was 50–98% [46, 47]
PNL is the treatment of choice for kidney stones> 2 cm [46, 47] and for cystine and whewellite stones [47]. Due to the miniaturization of instruments (so-called mini-, micro-, ultramini-PNL), indications have also expanded to include smaller kidney stones (10–20 mm) and lower calyx stones (> 10 mm) [48].
Over the past 20 years, open surgical interventions in developed countries have been used in exceptional cases, such as unsuccessful repeated endoscopic methods for removing stones, anomalies of the urinary tract, and strictures of the ureter.
Urologic Diseases of America, funded by the National Institute of Diabetes and Digestive and Kidney Diseases (NIDDK), estimated the annual cost of kidney stones at $ 10 billion in 2012, making it the most costly urological disease.

13Journal of Clinical Medicine of Kazakhstan: 2021 Volume 18, Issue 6
MetaphylaxisSpecial attention should be paid to the prevention of
recurrence of urolithiasis. In particular, to infectious stones, so according to Iqbal M., 2013, the recurrence rate for these groups of stones reaches 15%. The risk of recurrence of kidney stones after treatment of infectious stones reaches 100% (Johri N., 2010; El-Nahas A., 2012). Which is explained as follows: bacteria can stay in kidney stones for a long time in the biofilm after crushing; the remaining small residual fragments form the nucleus of the stone, a new center of stone formation, which serves as a matrix for precipitating salts. The concept of metaphylaxis includes a complex of dietary, phytotreatic, medicinal, general health measures aimed at preventing the occurrence of recurrent stones. Metaphylaxis should start with general measures such as adequate fluid intake, balanced nutrition, treatment of concomitant diseases, phyto-prevention, and normalization of work and rest.
Metaphylaxis may primarily involve regulating fluid intake and diet. Increased fluid intake increases the volume of urine and prevents oversaturation and crystallization of crystals. In children, the fluid intake required for adequate diuresis should be calculated per 1.5 L/m2 body area. Sugary drinks should be avoided as liquids containing glucose and fructose increase the excretion of calcium and oxalate. In addition, fluid intake should be spread throughout the day. Therefore, in stone metaphylaxis, water intake is the approach that has the best cost-benefit ratio [49]. However, it is impossible to control children's fluid intake at school and in general, children do not adhere well to the rules of hydration. Because fluid requirements depend on temperature and activity level, parents may be advised to monitor hydration based on urine color and density, if possible. The density of urine, many times higher than 1010, indicates insufficient fluid intake [50].
ConclusionDespite the fact that the problem of urolithiasis has
been studied for centuries, many questions remain open, in particular etiopathogenesis, the rapid progressive development of urolithiasis in children and metaphylaxis. If we talk about the diagnosis of urolithiasis, clinical signs in children can be erased, however, changes in urine tests should alert the clinician, send a child suspected of urinary tract pathology for an ultrasound examination, which allows to identify stones, both X-ray positive and X-ray-negative calculi. For obturation stones of the upper urinary tract, according to this literature review, percutaneous lithotripsy is the first-line surgical treatment. In the last decade, endoscopic devices have been improved, instruments have been minimized, which makes it possible to use this method for removing stones in all age groups of children. Every year, the number of morbidity and prevalence of this pathology is increasing, which entails large financial costs. In modern urology, much attention is paid to minimally invasive methods of treatment; unfortunately, there are little data on metaphylaxis in the world literature. According to the study literature, there is information about general measures for preventing recurrence of stone formation. Urolithiasis is a multifactorial, polyetiologic disease, therefore, in the management of this pathology, the approach should be multidisciplinary, patient management should be individual.
Disclosures: There is no conflict of interest.
Acknowledgements: None.
Funding: None.
References 1. Romero V, Akpinar H, Assimos DG. Kidney stones: a global picture of prevalence, incidence, and associated risk factors. Rev Urol.
2010;12(2-3): 86-96.2. Alchinbaev MK, Urolithiasis in Kazakhstan. Analysis of the situation and prospects [in Russian]. Urology and Nephrology of
Kazakhstan. 2016; 2; 9-21.3. Akimoto M, Higashihara E, Kumon H, Masaki Z, Orikasa S. Treatment of Urolithiasis. Germany: Springer-Verlag; 2001. 126 p.4. Straub M, Gschwend J, Zorn C. Pediatric urolithiasis: the current surgical management. Pediatr Nephrol. 2010;25(7):1239-44. https://
doi: 10.1007/s00467-009-1394-4.5. Sorokin I, Mamoulakis, K. Miyazawa, A. Rodgers, J. Talati, Y. Lotan Epidemiology of stone disease across the world. World J. Urol.
2017. 35 (9):1301-1320. https://doi: 10.1007/s00345-017-2008-66. Khan SR, Pearle MS, Robertson WG, Gambaro G, Canales BK, Doizi S, Traxer O, Tiselius HG. Kidney stones. Nat Rev Dis Primers.
2016; 2:16008. https://doi: 10.1038/nrdp.2016.8.7. Randall A. The origin and growth of renal calculi. Ann Surg. 1937; 105(6):1009-27. https://doi: 10.1097/00000658-193706000-00014.8. Randall A. Papillary pathology as a precursor of primary renal calculus. Journal of Urology. 1940; 44:580. https://doi.org/10.1016/
S0022-5347(17)71305-59. Randall A. The etiology of primary renal calculus. International Abstract of Surgery. 1940; 71:209.10. Stoller ML, Low RK, Shami GS, McCormick VD, Kerschmann RL. High resolution radiography of cadaveric kidneys: unraveling the
mystery of Randall's plaque formation. J Urol. 1996;156(4):1263-6. https://doi: 10.1016/s0022-5347(01)65565-4.11. Khan SR, Canales BK. Unified theory on the pathogenesis of Randall's plaques and plugs. Urolithiasis. 2015 ;43 Suppl 1(01):109-23.
https://doi: 10.1007/s00240-014-0705-9.12. Khan SR, Rodriguez DE, Gower LB, Monga M. Association of Randall plaque with collagen fibers and membrane vesicles. J Urol.
2012 ;187(3):1094-100. doi: 10.1016/j.juro.2011.10.125.13. Solkh RM, Andryukhin MI, Makarov OV, Fedchenkov VV Improvement of treatment results in patients with ureteral calculi after
contact ureterolithotripsy. Research and practice in medicine [in Russian]. 2017; 2:8-12.14. Seregin AV, Mulabaev NS, Tolordava ER. Modern aspects of the etiopathogenesis of urolithiasis [in Russian]. Medicine. 2012; 4:4-10.15. Pasupuleti S, Sule N, Manson MD, Jayaraman A. Conversion of Norepinephrine to 3,4-Dihdroxymandelic Acid in Escherichia coli
Requires the QseBC Quorum-Sensing System and the FeaR Transcription Factor. J Bacteriol. 2017; 200(1):e00564-17. https://doi: 10.1128/JB.00564-17.
16. Tao Y, Pinzón-Arango PA, Howell AB, Camesano TA. Oral consumption of cranberry juice cocktail inhibits molecular-scale adhesion of clinical uropathogenic Escherichia coli. J Med Food. 2011; 14(7-8):739-45. https://doi: 10.1089/jmf.2010.0154.
17. David G. Thanassi, James B. Bliska, Peter J. Christie, Surface organelles assembled by secretion systems of Gram-negative bacteria: diversity in structure and function, FEMS Microbiology Reviews. 2012; 36(6):1046–1082. https://doi.org/10.1111/j.1574-6976.2012.00342.x

14Journal of Clinical Medicine of Kazakhstan: 2021 Volume 18, Issue 6
18. Monico CG, Milliner DS. Genetic determinants of urolithiasis. Nat Rev Nephrol. 2011; 8(3):151-62. https://doi: 10.1038/nrneph.2011.211.19. Turk C, Neisius A, Petrik A, et al. EAU Guidelines on urolithiasis. European Association of Urology. 2021; 8720. Maltsev S.V., Mikhailova T.V. Genetic and clinical aspects of nephrolithiasis and nephrocalcinosis in children with hypercalciuria [in
Russian]. Pediatrics 2014; 9 (85): 118-25.21. Filippova T.V. Rudenko V.I. Genetic aspects of primary hyperoxaluria: epidemiology, aetiology, pathogenesis and clinical manifestations
[in Russian]. Bulletin of the Russian Society of Urology. 2019; (3): 24-522. Svetlichnaya D. V. Litvinova M. M. Molecular genetic panel in the assessment of susceptibility to urolithiasis. [in Russian] Materials of
the Congress. XIX Congress of the Russian Society of Urology (September 19-21, Rostov-on-Don) 2019; from. 19523. Kambadakone AR, Eisner BH, Catalano OA, Sahani DV. New and evolving concepts in the imaging and management of urolithiasis:
urologists' perspective. Radiographics. 2010;30(3):603-23. https://doi: 10.1148/rg.303095146.24. Alelign T, Petros B. Kidney stone disease: an update on current concepts. Adv Urol. 2018;2018:1–12. https://doi:10.1155/2018/306836525. Maalej B, Louati H, Abid H, Zitouni H, Weli M, et al. Pediatric Urolithiasis in Children: Diagnosis and Management. Med Sur Urol .
2017; 6: 196. https://doi:10.4172/2168-9857.100019626. VanDervoort K, Wiesen J, Frank R, Vento S, Crosby V, Chandra M, Trachtman H. Urolithiasis in pediatric patients: a single center study
of incidence, clinical presentation and outcome. J Urol. 2007;177(6):2300-5. https://doi: 10.1016/j.juro.2007.02.002.27. Dincel N, Resorlu B, Unsal A, et al. Are small residual stone fragments really insignificant in children? J Pediatr Surg. 2013;48:840-4.
https://doi:10.5505/kjms.2015.8038828. Strohmaier, Walter Ludwig. Imaging in pediatric urolithiasis-what's the best choice? Translational pediatrics. 2015; 4(1):36-40. https://
doi:10.3978/j.issn.2224-4336.2015.01.0129. Eray O, Cubuk MS, Oktay C, Yilmaz S, Cete Y, Ersoy FF. The efficacy of urinalysis, plain films, and spiral CT in ED patients with
suspected renal colic. Am J Emerg Med. 2003; 21(2):152-4. https://doi: 10.1053/ajem.2003.50027.30. Pfister SA, Deckart A, Laschke S, Dellas S, Otto U, Buitrago C, Roth J, Wiesner W, Bongartz G, Gasser TC. Unenhanced helical
computed tomography vs intravenous urography in patients with acute flank pain: accuracy and economic impact in a randomized prospective trial. Eur Radiol. 2003; 13(11):2513-20. https://doi: 10.1007/s00330-003-1937-1.
31. Yilmaz S, Sindel T, Arslan G, Ozkaynak C, Karaali K, Kabaalioğlu A, Lüleci E. Renal colic: comparison of spiral CT, US and IVU in the detection of ureteral calculi. Eur Radiol. 1998;8(2):212-7. https://doi: 10.1007/s003300050364.
32. Sheir KZ, Mansour O, Madbouly K, Elsobky E, Abdel-Khalek M. Determination of the chemical composition of urinary calculi by noncontrast spiral computerized tomography. Urol Res. 2005;33(2):99-104. https://doi: 10.1007/s00240-004-0454-2.
33. Chateil JF, Rouby C, Brun M, Labessan C, Diard F. Mesure pratique de l'irradiation en radiopédiatrie: utilisation du produit dose surface en fluorographie numérique et pour les radiographies pulmonaires néonatales [Practical measurement of radiation dose in pediatric radiology: use of the dose surface product in digital fluoroscopy and for neonatal chest radiographs]. J Radiol. 2004;85(5 Pt 1):619-25. French. https://doi: 10.1016/s0221-0363(04)97638-x.
34. Kuhns LR, Oliver WJ, Christodoulou E, Goodsitt MM. The predicted increased cancer risk associated with a single computed tomography examination for calculus detection in pediatric patients compared with the natural cancer incidence. Pediatr Emerg Care. 2011;27(4):345-50. https://doi: 10.1097/PEC.0b013e3182132016.
35. Liu W, Esler SJ, Kenny BJ, Goh RH, Rainbow AJ, Stevenson GW. Low-dose nonenhanced helical CT of renal colic: assessment of ureteric stone detection and measurement of effective dose equivalent. Radiology. 2000;215(1):51-4. https://doi: 10.1148/radiology.215.1.r00ap4051.
36. Rogalla P, Klüner C, Taupitz M. Ultra-Niedrigdosis-CT zur Steinsuche in Nieren und ableitenden Harnwegen [Ultra-low-dose CT to search for stones in kidneys and collecting system]. Aktuelle Urol. 2004;35(4):307-9. German. https://doi: 10.1055/s-2004-830031.
37. Kolpakov IS.Urolithiasis: a guide for doctors. Moscow. Medical News Agency. 2014. 368 p.38. Julka S, Gupta SK, Srivastava A. Protocol-based metabolic evaluation in high-risk patients with renal stones in North India. Indian J
Endocrinol Metab. 2012;16(2):283-287. https://doi:10.4103/2230-8210.93754.39. Ather MH, Noor MA. Does size and site matter for renal stones up to 30-mm in size in children treated by extracorporeal lithotripsy?
Urology. 2003;61(1):212-215. https://doi: 10.1016/s0090-4295(02)02128-3.40. Lottmann HB, Traxer O, Archambaud F, Mercier-Pageyral B. Monotherapy extracorporeal shock wave lithotripsy for the treatment
of staghorn calculi in children. J Urol. 2001;165(6 Pt 2):2324-7. https://doi: 10.1097/00005392-200106001-00027. PMID: 11371942.41. McAdams S, Shukla AR. Pediatric extracorporeal shock wave lithotripsy: Predicting successful outcomes. Indian J Urol. 2010;
26(4):544-548. https://doi:10.4103/0970-1591.7445742. Tan AH, Al-Omar M, Watterson JD, Nott L, Denstedt JD, Razvi H. Results of shockwave lithotripsy for pediatric urolithiasis. J Endourol.
2004;18(6):527-30. https://doi: 10.1089/end.2004.18.527.43. Demirkesen O, Onal B, Tansu N, Altintaş R, Yalçin V, Oner A. Efficacy of extracorporeal shock wave lithotripsy for isolated lower
caliceal stones in children compared with stones in other renal locations. Urology. 2006;67(1):170-4; discussion 174-5. https://doi: 10.1016/j.urology.2005.07.061.
44. Onal B, Demirkesen O, Tansu N, Kalkan M, Altintaş R, Yalçin V. The impact of caliceal pelvic anatomy on stone clearance after shock wave lithotripsy for pediatric lower pole stones. J Urol. 2004;172(3):1082-6. https://doi: 10.1097/01.ju.0000135670.83076.5c.
45. Ozgür Tan M, Karaoğlan U, Sen I, Deniz N, Bozkirli I. The impact of radiological anatomy in clearance of lower calyceal stones after shock wave lithotripsy in paediatric patients. Eur Urol. 2003;43(2):188-93. https://doi: 10.1016/s0302-2838(02)00492-x.
46. Hwang K, Mason MD, Peters CA. Clinical practice: surgical approaches to urolithiasis in children. Eur J Pediatr. 2011;170(6):681-8. https://doi: 10.1007/s00431-010-1373-6.
47. Smaldone MC, Docimo SG, Ost MC. Contemporary surgical management of pediatric urolithiasis. Urol Clin North Am. 2010;37(2):253-67. https://doi: 10.1016/j.ucl.2010.03.006.
48. Salah MA, Toth C, Khan AM, Holman E. Percutaneous nephrolithotomy in children: experience with 138 cases in a developing country. World J Urol. 2004;22(4):277–280. https://doi: 10.1007/s00345-004-0454-4.
49. Lotan Y, Buendia Jiménez I, Lenoir‐Wijnkoop I, Daudon M, Molinier L, Tack I, Nuijten MJ. Increased water intake as a prevention strategy for recurrent urolithiasis: Major impact of compliance on cost‐effectiveness. Journal of Urology. 2013;189(3):935-939. https://doi: 10.1016/j.juro.2012.08.254
50. Borghi L, Meschi T, Maggiore U, Prati B. Dietary therapy in idiopathic nephrolithiasis. Nutr Rev. 2006;64(7 Pt 1):301-12. https://doi: 10.1301/nr.2006.jul.301-312.

15Journal of Clinical Medicine of Kazakhstan: 2021 Volume 18, Issue 6
Review Article DOI: https://doi.org/10.23950/jcmk/11348
JOURNAL OF CLINICAL MEDICINE OF KAZAKHSTAN (E-ISSN 2313-1519)
AbstractThe concept of psychological depressive symptoms affecting the
terminally ill patient still stood as an unsolved mystery in many clinical practices. The psychological traumatic and depressive stressors are the factors responsible for destroying the quality of life, and affecting the terminally ill individual in the most degrading ways. Alongside the physical pain symptoms, the terminal ill experience is always accompanied by several unwanted mental disharmonies and emotional sufferings like toxins, mood disorder, trauma, and low self-esteem. The higher level of stress and depression determines the growth of tumors and cancer metastasis rate in any terminal diagnosis. This makes the assessment of the psychological non-pain symptoms essential alongside the physical pain symptoms. Failing to acknowledge the patient's traumatic experience, and depressive stressors will make the treatment unproductive and increase suicidal activities.
Key words: stress, depression, stressors, terminal diagnosis, cancer
Received: 2021-08-25. Accepted: 2021-11-18
Assessment and coping strategies for stress and depression among the terminally ill patients: Focus on cancerSuantak Demkhosei Vaiphei
1Department of Psychology, Assam Down Town University, Guwahati, India
Corresponding author: Suantak Demkhosei Vaiphei. E-mail: [email protected]; ORCID: 0000-0002-4134-2926
IntroductionTerminal illness in its nature of existence is a traumatic
event with stressful experience, resulting in developing the highest psychological depressive symptoms. Unlike any other ill diagnosis, the psychological depressive stressors in terminal ill experience worsen the individual physical pain symptom and increase tumor growth rate into its advanced stages in the most fruitful ways. It is essential to understand the tumor types to deal effectively with the patient's stressful and depressive symptoms in clinical practices. Several research findings suggested that it is not the tumor or pain symptoms alone that destroyed the patient hope and wellbeing. It is instead the depressive stressors that completely disturb the unique peaceful environment. Thus, understanding the psychological non-pain symptoms alongside the physical pain symptom treatment will better understand the patient's cognitive process with the stressors and its behavior outcomes in any terminal diagnosis [1]. The psychological assessment interventions in the patient's traumatic and depressive experience are also visible in
delivering quality of life, controlling the growth of cancer metastasis rate, and enhancing the patient surviving rate.
Purpose: To study the effect of the psychological stressor on various parts of immunological function and associated with cancer. The aim is also to bring out some of the essential assessment methods and propose strategies in dealing with stress and depressive symptoms.
Material and methods: The proposed study is an analytical method basing on the existing documents and literature.
Results and discussionCancer is a disease that affects individual physical
health, emotional feeling, social life, and having several psychological disorders as its outcomes. Being with cancer is when the individual develops unwanted habits like excessive use of alcohol and other related drugs to eased down their emotional suffering, pain symptoms, and mental disharmony. It is the times when they need people's support the most to deal with their isolation,
J Clin Med Kaz 2021; 18(6):15-19

16Journal of Clinical Medicine of Kazakhstan: 2021 Volume 18, Issue 6
loneliness, hopelessness, anxiety, and other depressive stressors. Psychological depressive stressors are found to be the most neglected area of care and are sometimes considered symptoms not treated in clinical practices. This negligence hugely affected the individual physical health stability and a higher level of disability. The story of depression is higher in women with terminal illnesses than their male counterparts. The psychological approach to terminal care with family and loved ones supporting the patient to face the existential challenges is visible as the core coping mechanism that delivers the quality of life and wellbeing in the end-of-life care.
Stress and depression in terminal ill experience
Though the advanced medical science technologies effectively address the wide-ranging needs of terminally ill patients, it mostly confined to the patient physical pain symptoms alone. Terminal ill diagnosis, unlike other illnesses, requires a whole-person treatment that acknowledges the psycho-emotional sufferings that affected the patients in the most degrading ways. Terminal illness is accompanied by several unwanted experiences that hugely disturb the individual wellbeing and quality of life. Some of the stressors that pre-occupied the terminally ill patients are trauma, anxiety, loss of will to live, and other mental disharmonies that serve as the underlying threat to patient quality of life and wellbeing [1,2]. Among all the factors, death anxiety is the main contributing factor affecting the patient immune system, unhealthy relationships, loss of sense over self-esteem, and poor decision making towards treatment plan and policy. The psychological stress and depression associated with the initial stage of cancer and its metastasis hugely decrease the patient's quality of life and wellbeing. Stress in its nature of existence is an adaptive reaction in cancer metastasis that usually produces physical, mental, and behavioral changes in patient terminal experience. It is a non-specific psychological reaction towards life situations' external and internal demands beyond the average human ability to deal with, killing the brain cells. Comparatively, stress is visible as the most common experience among terminally ill patients with long-term psychological distress [2]. In one of the latest findings, depression and stress are the two everyday unwanted experiences among cancer patients in India (n=320; 72.5%) [3]. Depression is higher in the age group of 18-40 among the women with breast cancer patients in India (n=270; 96.7%) [4]. Depression, on the other hand, is more than just a feeling of worthlessness or mood disorders; it is a symptom that is linked with human brain chemicals of serotonin and norepinephrine, which causes several pains like joint and back pain with sleep disorder and can even lead to a depressive episode. In the World Health Organization (WHO) latest report, depression accounts for patients adjusted with a physical disability, mental and behavior disorder to the patient of all ages [5].
Depression and stress are the two most psychological disorders among terminally ill patients in India. It decreases the patient's health stability, heightened self-depreciation, reduces energy, and is different from grief. The underlying features of depression that terminally ill patients usually experience include bipolar disorder, clinical depressive disorder, persistent depressive disorder, and seasonal affective disorder. The degree of depression varies from the individual experiences, and it has no age bar. The recent findings in India concluded that depression is higher among terminally ill women patients than the men group [6]. In another latest study among cancer patients in India, the depression rate ranges from 4.4% to
89.9%, emphasizing emotional distress. The rate of depression increases as per the stage of the cancer metastasis. On the other hand, lack of awareness, ignorance, social stigma, and discrimination becomes the underlying factors for worsening the patient's mental health conditions. Depression has no age bar and is hugely responsible for suicidal activities, which India is considered the most depressed country in the world. Some of the most depressive symptoms are loss of appetite, loss of self-esteem, energy, concentration, and slow cognitive process [7].
The genetic and biological factor plays an essential role in a patient experiencing depression and stress. Specific genes increase the risk of developing a mental illness, depending on one's life situation, which may trigger it like abuse or trauma (life experiences). While some mental health issue arises through the parent environmental exposures resulted in the child mental disorder. Exposure to environmental stressors, inflammatory conditions, toxins, alcohol, drugs while in the womb can sometimes make the child suffering from mental illness. Brain chemistry is also another cause for mental health problems; when the neurotransmitters that carry signals from one part to the other parts of the brain and body are impaired, nerve receptors and nerve systems change dramatically, leading to depression and other emotional disorders [8]. Cancer/terminal illness is a unique experience with both the disease and the situational challenges that produce uncertainty over life and huge psychological effects that disturb the individual nature of existence in the most rigorous way. It is essential to acknowledge the adaptive patient capacity over their environmental challenges and understand how the individual responds to the stressors events in terminal experience. Knowing the level of patient sense of sensitivity towards the stressors event is also essential in developing the coping strategies in the most effective way. Looking at the current condition of India, the depressive stressors that put the individual life into miserable conditions and severe problems in daily life and relationships remain unconcerned. Moreover, the signs and symptoms of depression can vary depending on the individual's mental or psychological state. In general mental health symptoms can affects emotions, behaviors, and the cognitive process [9].
AssessmentPsychological stress, anxiety, and depression are the
most common adverse outcomes in any terminal experience, which require special consideration in attending to the patient emotional needs and mental problems through effective coping strategies in the clinical practices. Coping is an ongoing process that needs several cognitive efforts and energy to deal with the depressive stressors; it requires skills and techniques to give the terminally ill patient the ability to adjust and overcomes the environmental challenges or reduce the stressors events in life. Though the level of depression and stress differ in terminally ill men and women, the coping strategies don't differ, in which the two most effective coping mechanisms are social support and problem-solving techniques. In dealing with depressive stressors, studying the patient's past and present history is essential for practical problem solving, decoding, and addressing the stressors in the most effective and appropriate ways. The hypothalamic-pituitary-adrenocortical axis (HPA) and the sympathetic-adrenal-medullary (SAM) system of the human organs responsible for mood disorders and negative emotional feelings demand special assessment in palliative end-of-life care [10, 8].
The HPA and SAM not only influence the effects of stress in cancer metastasis but also have several disease risks related

17Journal of Clinical Medicine of Kazakhstan: 2021 Volume 18, Issue 6
to physiological processes, affecting immune cells' activity, including natural killer (NK) cells, T cells, and macrophages as the outcomes of activating the stressful stimuli's. In dealing with psychological stress, the involvement of the family and friends to give emotional support to the patient is considered to be the best coping mechanism to fight against the immunological and endocrinological consequences of the patient psychological functioning. It is also visible that psychosocial-emotional supports is an effective mechanism in reducing tumor metastasis and associated symptoms. It serves as the factor that controls the degree of anxiety and depressive stressors that regularize the individual peripheral and central nervous system functioning in the most effective ways. Immuno-modulatory therapy is also an essential assessment in dealing with patient depressive stressors symptoms in clinical practices [11,9]. The psychotherapeutic intervention is more effective than psychotropic medicines with regards to patient recovery from depression and wellbeing. Moreover, the mere use of counseling therapy alone without psychotherapy has minimal impact on dealing with the depressed situation of the terminal patient. Person-centered therapy with a holistic approach to terminal care can successfully encounter psychological distress stems, emotional needs, reconstruct mental stability, and build practical coping skills. The early intervention of psycho-stimulant substances like dextroamphetamine or methylphenidate is also a well-recognized therapy against insomnia and hugely improves patient mood and wellbeing [12].
The intervention of the psychological approach to terminal care has been visible effective in three essential dimensions for patient quality of life; in effectively reducing the psychological depressive stressors, increasing the patient survivor period, and decreasing the cancer metastasis rate. The collaborations of psychotherapy and psychopharmacological approach to terminal care are also effective in reducing the rate of tumor growth and boosting the functions of the immune system [13]. The followings are the standard existing measuring scales to effectively measures the level of stress and depression in terminal ill diagnosis.
Figure 1 - Stress Measuring Scales [12,13].
The Hospital Anxiety and Depression Scale (HADS) is a fourteen-item scale depression rating tool use to indicate the antidepressant medical response, while Zung Self-Rating Depression Scale (ZSDS) is a twenty-item self-reporting depression measurement scale use to show the presence or absence or the level of depressive symptoms in palliative end-of-life care patients. The Edinburgh Depression Scale (EDS) is a ten-item postnatal depression tool used to measure the symptoms like guilt, hopelessness, mood swing, and another related cognitive process in a terminally ill patient. The Nagi Disability Scale (NDS) is the clinical instrument that identifies the degree of psycho-emotional suffering and other associated issues among cancer survivors. The Patient Health Questionnaire (PHQ-2) is used in screening cancer patients for undiagnosed depression. It is effective in screening larger groups of patients for depression [14, 8].
The use of verbal screening instruments by forming some relevant questionnaires regarding the low and high mood of a patient undergoing depression can also enhance the treatment policy to address the depressive stressors. According to DSM-
IV (Diagnostic and Statistical Manual of Mental Disorders), depression is mainly associated with patient loss of interest in daily activities, difficulty in making a quality decision, psychomotor agitation, and suicidal motive because of the disease effects, in which the psychological symptoms of depression is seen as the main characteristic of its outcomes. Thus, the early initiation of the psychological treatment within an adequate period needs to be assessed. If the depressive symptom of hopelessness is not addressed in its early period, it can easily combine with the grief response that usually causes the loss of specific abilities in the patient's terminal experience. The primary concern of the clinician should be adequate control over pain and symptom management and other disease risks in advanced patient illness and to prevent the patient from certain depressive disorders through any possible means [15,13]. Most importantly, the assessment should be regularly, including the appropriate time and place, intensity, quality of evaluation. It is also essential for the clinician working in palliative end-of-life care to identify the difference between physiological tolerance, physical and psychological dependency, and pseudo-addiction in assessing the patient [16].
Suggested coping strategiesAmong all the effective coping mechanisms against stress
and depression in terminal ill experiences, drawing a positive attitude to self and the given environmental challenges by accepting the life situations beyond control and adjusting is the most effective coping mechanism for those with terminal ill experience. Striving towards self-esteem and learning to relax over sensitive issues, rather than being aggressive towards what life brings. Adopting the habit of regular physical exercise, managing a balanced diet, avoiding things that create sleeping disorders, and abstaining from the excessive use of alcohol and other related drugs are the core factors to eliminate stress and depression and maximize the quality of life by minimizing the depressive stressors. Diagnosis with cancer/terminal illness is a challenging experience filled with anxiety, negative emotional feelings, and mental disharmony, yet understanding the kind of tumor involves, its metastasis, treatment policy, and the side effects would help in creating appropriate coping skills and the ability to deal with it in the most un-harmful way. Knowing the cultural and religious background is essential for every clinician, as in some cultures, death and dying are taboo that has no place for public discussion [16,17]. Preserving the patient autonomy by respecting the choice of the patient with regards to the disease risks information and the inclusion of the patient in the decision-making management team is also essential to produce a quality of life in end-of-life care. Honest conversations between the patient, clinicians, and the family on the disease and treatment outcomes cab serve as the platform where all the people involves in end-of-life care can come together for effective plan and policy to encounter the environmental and psychological challenges in patient terminal experiences [17].
There is no better coping mechanism than the early interventions with proper treatment plans and policy in dealing with the terminal illness diagnosis. The involvement of family loved ones, and the community inpatient terminal experience is the best coping mechanism to meet environmental demands like traveling, having quality time together, and creating good memories. The life review method is another coping mechanism that helps the patient set new life goals, which have the maximum possibilities to achieve before the inevitable death strikes. Assisting the patient in managing their financial income for treatment expenses through any possible means can serve

18Journal of Clinical Medicine of Kazakhstan: 2021 Volume 18, Issue 6
References 1. Deimling Gary, Kahana B, Bowman FK, Schaefer Michael L. Cancer survivorship and Psychological Distress in Later Life. Psycho-
Oncology. 2002; 11(6):479-94. DOI: 10.1002/pon.614.2. Tan Siang Yong, Yip A. Hans Selye (1907–1982): Founder of the Stress Theory. Singapore Med J. 2018; 59(4):170–171. Doi: 10.11622/
smedj.2018043.3. Vedprakash Sharma, Sunil Choudhary, Mona Srivastava, T. B Singh, Ravi Shankar. Prevalence of Depression, Anxiety and Stress
among Cancer and Chronic Kidney Disease Patients. International Journal of Health Sciences & Research. 2019; 9(4):1-6.4. Debasweta Purkayastha, Chitra Venkateswaran, Kesavankutty Nayar, and UG Unnikrishnan. Prevalence of Depression in Breast Cancer
Patients and its Association with their Quality of Life: A Cross-sectional Observational Study. Indian J Palliat Care. 2017; 23(3):268–273. Doi: 10.4103/IJPC.IJPC_6_17.
5. Cagliostro Dina. Depression Types, Causes, Symptoms, Statistics, & Treatment. https://www.psycom.net/depression.central.html. Accessed on December 3, 2019.
6. Encyclopedia Britannica. Depression Psychology. https://www.britannica.com/science/ depression-psychology. Accessed on December 6, 2019.
7. Annie Alexander, K Sreenath, R Srinivasa Murthy. Beyond numbers – Recent understanding of emotional needs of persons diagnosed with cancer 2007–2018. Indian Journal of Palliative care. 2020; 26(1): 120-128. https://doi.org/10.4103/IJPC.IJPC_86_19
8. Mayo Clinic. Mental Illness. http://www.mayoclinic.org/disease-conditions/mental-illness/symptoms-causes/syc-20374968. Accessed on December 4, 2019.
9. Cohen, S. Kessler, RC. Gordon UL. Strategies for Measuring Stress in Studies of Psychiatric and Physical Disorder: A Guide for Health and Social Scientists. New York: Oxford University Press, 1995.
as the contributing factor to improve patient quality of life and wellbeing in the clinical practices. Forming a small cell group within the cancer-affected community, including cancer survivors, to discuss their experiences, insights, feelings, in any terminal illness are other effective strategies to fight against cancer stigmas [4,5]. Some effective psychotherapeutic coping mechanisms are given below.
Figure 2 - Psychotherapeutic Coping Mechanism [4,5].
A spiritual coping mechanism is a modern humanistic approach to deal with stress and depression in the face of medical helplessness. Spiritual psychotherapy is a modern holistic approach to illness in health and medical sciences, which serves as an effective coping mechanism against several unwanted experiences like existential stress, anxiety, depression, and emotional suffering that pre-occupied the terminally ill patient in terminal diagnosis. When cure becomes uncertain in terminal diagnosis, spirituality becomes part of patient existence, potentially communion with self, others, nature, and the transcendent being. It is the coping mechanism that delivers the whole person treatment by addressing patient self-identity, inner peace, reconciliation, and hope with gratitude, which provides healing even when cure is impossible in terminal diagnosis. The involvement of psycho-social therapy is another effective coping mechanism that enables the dying individual
to connect with the society where they belong. The treatment makes the patient experience the feeling of being valued by eliminating the existing social stigma of being an outcast [18,15]. However, the absence of anti-anxiety, anti-psychotic, and mood-stabilizing therapeutic approaches to terminal care in the current health care system in India and other neighboring countries like Nepal, Bangladesh, Pakistan, Myanmar, etc., cancer/terminal patients undergo several unwanted feelings without any quality assessment. Due to the unavailability of the whole person treatment in the country's health care system in general and in the medical curriculum, psychological stress and depression remain untouched in its clinical practices. Thus, India is considered as a country not to die by many [19].
ConclusionThe psychological stress and depression destroyed
the patient peace of mind and possess the ability for cancer metastasis growth in the body parts and to disable the organs. The interplay between the environmental challenges, stressors, and the patient's socio-economic, cultural, and religious background needs special consideration in cancer diagnosis to produce the quality of life and wellbeing of the whole clinical practice. Developing positive mental health and a healthy lifestyle is the core of coping with psychological stress and depression in any terminal experience.[19,20] Moreover, even in the terminal stage when cure is not possible, finding purpose and meaning in life can benefit self and others and is also an effective coping mechanism to overcome mental health problems.
Disclosures: There is no conflict of interest for all authors.
Acknowledgements: None.
Funding: None.
Informed consent: Informed consent was obtained from all individual adult participants included in the study; assent was obtained from children.

19Journal of Clinical Medicine of Kazakhstan: 2021 Volume 18, Issue 6
10. Krohne, H.W. Individual Differences in Coping. Handbook of Coping: Theory, Research, Applications. New York: Wiley Publications, 1996.
11. Myrthala Moreno-Smith, Susan K Lutgendorf & Anil K Sood. Impact of stress on cancer metastasis. Future Oncology. 2010; 6(12):1863-1881. Doi: org/10.2217/fon.10.142
12. McEwen BS. Protective and damaging effects of stress mediators. New England Journal of Medicine. 1998; 338(3):171-179. DOI: 10.1056/NEJM199801153380307.
13. Lloyd-William Mari. Difficulties in Diagnosing and Treating Depression in the Terminally Ill Patient. Postgrad Med Journal. 2000; 76(899):555- 558. Doi.org/10.1136/pmj. 76.899.555.
14. Reiche Edna M et al. Stress, Depression, the Immune System, and Cancer. The Lancet Oncology. 2004; 5(10):617-25. DOI: 10.1016/S1470-2045(04)01597-9.
15. Lloyd-Williams Mari. Depression—the hidden symptom in advanced cancer. J R Soc Med. 2003; 96(12):577–581. Doi: 10.1258/jrsm.96.12.577.
16. Widera E and Block Susan D. Managing Grief and Depression at the End of Life. American Family Physician. 2012; 3(1):259-264.17. Groninger H and Vijayan J. Pharmacologic Management of Pain at the End of Life. American Family Physician. 2014; 90(1):26-32.18. Vaiphei Demkhosei suantak. The importance of holistic assessment in palliative end-of-life care and quality health outcomes. Journal
of Clinical Medicine of Kazakhstan. 2019; 3(52):6-10. DOI: 10.23950/1812-2892-JCMK-00700.19. Suantak Demkhosei Vaiphei & Devendra Singh Sisodia. Why Cancer/Terminal Ill Diagnosis Unsuccessful in India: A Qualitative
Analysis. Eurasian Journal of Medicine and Oncology-EJMO. 2019; 3(3):160–166. DOI: 10.14744/ejmo.2019.3235520. Suantak Demkhosei Vaiphei & Devendra Singh Sisodia. Terminal cancer in Northeast India: an analytical study on its rapid growth,
causes, and solutions. The European Research Journal. 2020; 6(3):248-256. DOI: 10.18621/eurj.519115.

20Journal of Clinical Medicine of Kazakhstan: 2021 Volume 18, Issue 6
Review Article DOI: https://doi.org/10.23950/jcmk/11390
JOURNAL OF CLINICAL MEDICINE OF KAZAKHSTAN (E-ISSN 2313-1519)
AbstractThis review article notes the importance of timely detection of
cancer and precancerous diseases by screening. The key objective is to analyze screening approaches in developed countries. Results of the study of the experience, effectiveness, and current situation in the organization of cancer screening trials in the Republic of Kazakhstan are considered. The analysis has been performed based on published data on oncology screening carried out in Kazakhstan (2008-2019) and independently collected data from the regions of the country. There is a tendency of growth of morbidity rate and decrease of mortality rate by screening localizations for the mentioned period. The percentage of detected malignant neoplasms is relatively low (from 15% in colorectal cancer screening to 35.4% in breast cancer screening). To study foreign experience in the organization of screening studies, the available data were taken from countries with different types of health care systems, including OECD countries (USA, UK, Germany, Turkey, Korea, Canada, Finland, Sweden, Belarus). The analysis has revealed the problematic issues of screening programs and early detection of cancer that exist in our country. Considering the experience of developed countries, proposals for upgrading the organizational and methodological approach of screenings are given to improve the quality and effectiveness of early cancer diagnosis.
Key words: oncoscreening, screening program, screening center, early cancer diagnosis, malignant neoplasms
Received: 2021-09-02. Accepted: 2021-11-23
How can cancer screening centers improve the healthcare system of Kazakhstan?Gulnara Kulkayeva1, Nurgul Azhdarova1, Bibigul Sarymsakova1, Assel Khassenova1, Gulnur Zhakhina2
1Center for Cancer Disease Control, National Research Oncology Center, Nur-Sultan, Kazakhstan2Science Department, National Research Oncology Center, Nur-Sultan, Kazakhstan
Corresponding author: Sarymsakova Bibigul. E-mail: [email protected]; ORCID: 0000-0002-2059-5262
IntroductionCancer is one of the main causes of death in the
world. Thus, in 2020, almost 10 million people died of this disease [1]. Mortality from cancer can be reduced if it is detected and treated at an early stage. One of the methods of early diagnosis of malignant neoplasms is screening.
The goal of screenings is the early active detection and treatment of asymptomatic cancer. Screening programs are effective for some but not all cancers, and these programs are usually much more complex and resource-intensive than early detection programs because they require special equipment and specially trained personnel [1].
Screening should lead to a decrease in mortality from the cancer type for which it is performed. Intermediate signs of the effectiveness of the method are a decrease in the frequency of detection of advanced forms, an increase in the frequency of early forms of cancer, and an improvement in survival rate.
Early detection of malignant tumors plays an important role in reducing mortality and, in some cases when it comes to detection of precancer, morbidity from malignant tumors. Therefore, the development of new screening methods, including the detection of molecular markers of early stages of carcinogenesis, is of great importance [2].
Material and methodsThe analysis was carried out based on published
data on cancer screenings conducted in the Republic of Kazakhstan (statistical collections of the Kazakh Research Institute of Oncology and Radiology for 2008-2019), articles, publications, and independently collected data from the regions of the country. To study foreign experience in organizing screening studies, open-source data such an information from WHO website were taken from countries with different types of health care systems, including OECD countries (USA, Great Britain, Germany, Turkey, Korea, Canada, Finland,
J Clin Med Kaz 2021; 18(6):20-24

21Journal of Clinical Medicine of Kazakhstan: 2021 Volume 18, Issue 6
Sweden, Belarus). Inclusion criteria: by keywords, availability of statistical data; exclusion criteria: screening types other than for cancer (for example, for early detection of cardiovascular diseases, glaucoma, diabetes mellitus).
Key goals of screeningThe era of modern screening dates to Wilson and Jenner's
historically important publication Principles and Practices of Disease Screening, published as a monograph by the World Health Organization, which introduced the concept of screening and proposed 10 principles to guide the appropriateness of screening for health promotion [3]. The concept of health screening has spread rapidly and is now widely accepted in most developed countries.
In European Union countries, screening programs vary widely, but there are key goals to strive for. These include a single national body in the country responsible for policy and program implementation, a clear commitment to long-established screening criteria, an accurate population register, greater universality of access in different areas of a given country, and different socioeconomic groups [3].
According to the experience of several foreign countries, risk groups, methods, and approaches vary, but all screening programs are aimed to detect certain diseases in the target groups. Moreover, many foreign countries with different types of health care systems are creating separate organizational structures to evaluate and select screening and other preventive interventions. The experience of the USA, UK, Germany, Turkey, Finland, as well as Belarus and Kazakhstan in conducting cancer screenings, is presented in Table 1 [4].
Table 1 World experience in conducting cancer screenings
Countries with different types of health systems have separate structures on the national and local level that focus on the assessment and selection of screening and other preventive measures. In the USA, Canada, Germany, Sweden, the Netherlands, there are state organizations on screening policy [4]. In the presence of such structures, the outcome depends on the appropriateness and effectiveness of screening programs, as well as on the interpretation of experts.
On the other hand, the experience of countries in which the adoption and implementation of screening decisions are delegated to regional and local administration shows that this type of a screening system can lead to systemic problems in health. Experts outline possible drawbacks as a larger gap in inequity and inequality, poor communication, and lack of cooperation between government and local organizations. Countries that are transitioning to a national screening system recognize many benefits in terms of their effectiveness [5].
CountryScreening type
Cervical cancer Breast cancer Colorectal cancer Others
USA 21-30 y.o.: every 3 years - cytology30-65 y.o.: every 3 years - cytology or every 5 years for HPV
50-74 y.o.: mammography every 2 years
50-75 y.o.: fecal occult blood test annually + colonoscopy every 10 years
Lung cancer: 55-80 y.o., low-dose CTSkin cancer: 10-24 y.o., doctor's consultation
UK 25-49 y.o.: Screening for cervical cancer every 3 years50-64 y.o.: smear for cytology every 5 years
50-71 y.o.: mammography every 3 years
60-74 y.o.: fecal occult blood test every 2 years
Germany Women over 20 y.o.: annually, smear for oncocytology
50-70 y.o.: mammography every 2 years
From the age of 50: analysis of feces for occult blood annually; From 55 y.o.: + colonoscopy
Skin cancer: over 35 y.o. (man/woman)Prostate cancer: over 45 years old
Turkey* There is a screening Women over 40 y.o.: mammography, ultrasound, mammologist consultation
Korea 20 years and older (women): every 2 years, smear for oncocytology
40 years and older (women): every 2 years, mammography
50 years and older (man/woman): every year1. Fecal occult blood test (FOBT)2. Colonoscopy (biopsy)
Stomach cancer: 40 years and older, every 2 yearsLiver cancer: high-risk group, ultrasound and AFP, every 6 months.
Canada 25-69 y.o.: every 3 years, smear for oncocytology
50-65 y.o.: mammography every 2 or 3 years
50-59 y.o., 60-75 y.o.: fecal occult blood test, every 2 years ORsigmoidoscopy every 10 years
Lung cancer: 55-80 y.o., low-dose CT
Finland* 25-65 y.o.: once every 5 years, smear for oncocytology
50-69 y.o.: once every 2 years, mammography
60-69 y.o. (man/woman): experimentally, fecal occult blood test
Sweden 23-50 y.o.: once every 3 years;51-60 y.o.: once every 5 years, smear for oncocytology
40-55 y.o.: every 18 months;55-74 y.o.: every 24 months
Belarus 30-65 y.o.: every 5 years, smear for oncocytology
50-70 y.o.: every 2-3 years, mammography
50-60 y.o.: man/woman, occult blood feces, colonoscopy
Prostate cancer: 50-65 y.o., men, PSA (prostate-specific antigen) level determination, prostate biopsy
Kazakhstan 30-70 y.o.: every 4 years, smear for oncocytology
40-70 y.o.: every 2 years, mammography
50-70 y.o., man/woman: hemoccult test, colonoscopy

22Journal of Clinical Medicine of Kazakhstan: 2021 Volume 18, Issue 6
Screenings in KazakhstanIn our country, screening studies are regulated by Article
87 (Screening studies) of the Code "On the health of the people and the health care system" of July 7, 2020 [6], which allows allocating screenings as a separate event, which requires ensuring control and timely monitoring.
The types of diseases for which it is necessary to introduce the screening, as well as the rules for organizing screening, are determined by the decision of the leadership of the Ministry of Health of the Republic of Kazakhstan (MOH RK) based on consideration by the relevant departments of the MOH RK and the conclusions of specialized institutions. The specialized republican health organizations are responsible for the methodological guidance and analysis of preventive medical examinations of target groups of the population [7].
According to the 2019 statistics of the Cancer Service of the Republic of Kazakhstan, lung cancer (20.6%), stomach cancer (11.9%), and prostate cancer (8.6%) have highest prevalence among men [8]. Among women, breast cancer is in the first place (27.2%), followed by cervical cancer (9.9%) and uterine body cancer (6.5%) [8]. At the same time, 10 localizations of cancer determine 74% of mortality from all causes of malignant neoplasms in men and women.
Today, in our country, there are 3 types of cancer screening aimed at prevention and early diagnosis of breast cancer among women (BC), cervical cancer (CC), and colorectal cancer (CRC) among men and women. Screening aims to reduce the incidence of malignant neoplasms in the target group by the timely recovery of precancerous pathology and to reduce mortality in these localizations by early diagnosis [9].
Screening programs in Kazakhstan have undergone certain evolution. It started in 2008, when first cervical cancer diagnostics (smear for oncocytology) and breast cancer diagnostics (mammography) were included [8]. Colorectal cancer screening has been performed since 2011 (iFOBT-test or total colonoscopy) [10]. The stages of development of screening programs in the Republic of Kazakhstan are graphically presented in Table 2 [11].
Statistical data for 11 years of screening (2008-2019) shows a continuing increase in the incidence rate by screening localizations. According to 2019 data, since 2008, the incidence of BC has increased by 27.8%, the incidence of CC has increased by 20%, and the incidence of CRC has increased by 16.1% since 2011 [8]. At the same time, mortality from breast cancer during the same period decreased by 4.7%, mortality from CC remained unchanged - 4.0 per 100 thousand population, and mortality from CRC decreased by 18.4% [8].
Table 2 Development of screening programs in Kazakhstan
Screening Year of start Examination Target group Cancellation year
Screening for the prevention and early diagnosis of cervical cancer
2008 Oncocytology smear 30-70 years old, women, every 4 years
functioning
Screening for prevention and early diagnosis of breast cancer
2008 Mammography 40-70 years old, women, every 2 years
functioning
Screening for the prevention and early diagnosis of colorectal cancer
2011 iFOBT test, total colonoscopy 50-70 years old, men/women, every 2 years
functioning
Screening for the prevention and early diagnosis of esophageal carcinoma and gastric cancer
2012 Esophagogastroduodenoscopy (EGDS)
50-60 years old, men/women, every 2 years
2018
Screening for the prevention and early diagnosis of prostate cancer
2012 Prostate-specific antigen (PSA) blood test, transrectal ultrasound (TRUS), and biopsy
50-66 years old, men, every 4 years
2018
Screening for the prevention and early diagnosis of hepatocellular carcinoma
2012 Blood for alpha-fetoprotein, ultrasound, liver CT if indicated
Persons on the "D" register with cirrhosis of the liver, viral and non-viral etiology
2018
Issues in cancer screeningDespite ongoing screening programs, increased diagnostic
capabilities, and the availability of highly effective diagnostic equipment in medical institutions, the proportion of patients with cancers detected by screening does not exceed some limits by type of screening: cervical cancer screening – 20.0%, breast cancer screening – 35.4%, and CRC screening – 15.0%.
The screening programs functioning in the Republic of Kazakhstan are aimed at examining large groups of the population. It requires considerable investments in equipment and personnel, which increases the burden on the health care system, especially on primary health care (PHC) organizations that carry the main burden of conducting screenings.
It should be considered that, in addition to screening tests for cancer, primary health care organizations conduct screenings for early detection of glaucoma, diabetes mellitus, circulatory diseases. In addition, in recent years, psychiatry, phthisiology, and drug treatment services have been delegated to the PHC level.
We believe that the route, which begins with identifying individuals who meet the criteria for selection into the target group, conducting the screening itself, and reporting the results of the program is an overwhelming task for quality screening studies in PHC.
The oncologic screening programs conducted have shown the following problems: low share of cancers detected during screening, lack of a single coordinating body controlling all screenings, overburdening of primary care organizations, which affect the quality of screening examinations. In addition, their quality, of course, depends on the level of qualification of specialists conducting screening examinations and the availability of necessary equipment. Thus, according to our analysis of the data on the current state of the domestic endoscopic service, there are also systemic drawbacks and unresolved problems in the organization of the service such as the lack of the necessary regulatory framework, insufficient provision of endoscopists and other equipment, low detectability of CRC. Consequently, there is no appropriate level of availability and quality of CRC screening.

23Journal of Clinical Medicine of Kazakhstan: 2021 Volume 18, Issue 6
Figure 1 - Algorithm for organizing screenings centers
In addition, in Kazakhstan, the main attention is paid to the conduct of the screening examinations themselves, and not enough work is being done in the direction of scientific and methodological support of screening programs [7].
Proposals for improving organizational approaches to screening
In order to improve the conduct of screenings, we propose to change the organizational approaches to screenings:
(1) According to the experience of some OECD countries (Belgium, Finland, Turkey), create screening centers, where the responsibility for coordinating screening lies with certified screening centers. At the same time, screening centers are responsible for providing information to the target group, sending out invitations, repeating tests, if necessary, collecting data, and transferring them to the treating physician. It is also necessary to develop uniform requirements for screening centers, which would expand the range of organizations to participate in screening, including the private sector. The screening algorithm for organizing screening centers is shown in Figure 1.
The establishment of screening centers would provide an opportunity for better screening in the country and would relieve the burden on PHC organizations. In addition, screening centers could conduct outreach work and draw the attention of both the population and employers to timely screenings.
(2) Strengthen the coordinating role of the branch state body in evaluating, controlling, and monitoring the screening programs conducted. Strategic leadership and accountability are key components to achieve screening program effectiveness and cost-effectiveness. They must be present at all levels of screening service delivery. From the outset of implementation, a team should be in place to guide the work of the program at the national or regional levels.
In this regard, we propose to create a permanent coordinating council on screening studies under the Ministry of Health, which will control and monitor all types of screenings carried out in the Republic of Kazakhstan, be an important central point of reference, when considering all issues related to screening studies, as well as allowing to influence the evaluation of the effectiveness of national screening programs and to determine areas for further research.
(3) Improving human resources capacity. The quality of screening depends largely on the skills of those, who perform it. All personnel needed for screening should be well trained. It should be noted that every year the list of health care organizations providing primary health care, which have been delegated the authority to conduct screening tests, is expanding and their training should be intensified.
4) Expanding the list of screenings and changing methodological approaches, taking into account the
morbidity structure of malignant neoplasms. We believe that today the specific weight of malignant neoplasms of the digestive system takes the first place and it is urgent for Kazakhstan.
Therefore, we consider it expedient to work out the issue of renewal of screening investigations for early diagnostics of esophageal and stomach cancer.
(5) We suggest working on the issue of improving existing screening programs (cervical and colorectal screening) and introducing new types of screenings, such as lung cancer screening.
Lung cancer is the deadliest cancer. In Kazakhstan, lung cancer invariably occupies the leading place regarding the mortality rate. Cancer symptoms appear mostly at a late stage when treatment is much less effective. Screening would allow cancer to be detected much earlier. The earlier cancer is detected, the more effective its treatment is, improving outcomes for people with the disease and reducing treatment costs.
Low dose computed tomography (LDCT) is the most effective screening for detecting lung cancer at an early stage [12], and it would also enable the use of artificial intelligence in making the diagnosis.
The largest study to date on lung cancer screening was conducted in Belgium and the Netherlands (results published in 2020). It was found that the number of deaths from lung cancer dropped by 24%, 10 years after LDCT was offered to people at high risk of developing the disease [12].
6) to develop scientifically grounded recommendations on screening for the Ministry of Health of the Republic of Kazakhstan, it is recommended to appoint a responsible organization that will function to organize work on the development of scientifically grounded recommendations for screening. The organization could use the algorithm of the work of the independent UK National Screening Committee (UK NSC) as an example.
Among the screening organizations of all European countries, the UK NSC is recognized as a best practice for organizing screening. Therefore, it is necessary to study the experience of UK to improve screening processes in the health care system of Kazakhstan. The UK NSC approach ensures uniformity of access, broad adherence to screening principles, and transparent decision-making and quality assurance processes, thereby optimizing the potential for screening to gain more than harm, given the resources available [5].
ConclusionThe introduction of screening studies in the Republic of
Kazakhstan is a significant contribution to the measures of early diagnosis of cancer and precancerous conditions. Although the existing clinical protocols show success, there is a need for more in-depth consideration of issues of screening effectiveness, increased attention to the assessment of the screening process. It is necessary to change the methodology, and conduct screening studies, based on the recommendations of the World Health Organization and the best foreign experience. It is also important to involve the population in the decision-making processes of screening and provide them with clear and understandable information about its consequences.
Disclosures: There is no conflict of interest for all authors.
Acknowledgements: None.
Funding: None.

24Journal of Clinical Medicine of Kazakhstan: 2021 Volume 18, Issue 6
References 1. World Health Organization. Cancer. Published March 3, 2021. Accessed August 2, 2021. URL: https://www.who.int/ru/news-room/fact-
sheets/detail/cancer2. Starinsky VV, Garin AM, Davydov MI, Kaprin AD, Licinitser MR, Moiseenko VM, et al. Early detection of malignant tumors - screening.
ONCOLOGY.ru (periodic scientific and practical, peer-reviewed and electronic publication). Viewed August 10, 2021. URL: http://www.oncology.ru/specialist/diagnostic/screening/procurement_performance_of_screening/.
3. Holland WW, Stewart S, Masseria C. Policy Foundations. Screening in Europe. European Observatory on Health Systems and Policies. 2008;1-72
4. Dombrowski VS, Khachatryan GR. Comparison of recommended screening programs in the United States, Canada, the Netherlands, and Germany. Pharmacoeconomics. Modern pharmacoeconomics and pharmacoepidemiology. 2016;9(4):46-53. https://doi.org/10.17749/2070-4909.2016.9.4.046-053
5. Health Council of Canada (2013). A scoping review of screening in Canada. URL: https://macsphere.mcmaster.ca/bitstream/11375/14854/1/fulltext.pdf Accessed August 13, 2021.
6. Ministry of Health of the Republic of Kazakhstan. The health of the People and Health System Code of July 7, 2020, No. 360-VI ZRC, Art. 87.
7. Salidat Kairbekova National Research center for Health Development. "What should be the rational decision-making process for screening programs?" Policy brief. URL: http://www.rcrz.kz/index.php/ru/2017-03-12-10-51-14/analiticheskaya-spravka-policy-brief. Accessed August 24, 2021.
8. Kaidarova DR, Baltabekov NT, Dushimova ZD, Shatkovskaya OV, Seisenbaeva GT, Azhmagambetova AE, Zhylkaidarova AJ, Lavrentieva IK. Indicators of oncological service of the Republic of Kazakhstan for 2019. KazIOR, Almaty 2020; 1-225
9. Ministry of Health of the Republic of Kazakhstan. On approval of target groups of persons subject to screening studies, as well as rules, volume, and periodicity of these studies of October 30, 2020.
10. Republican Center for Health Development of the Republic of Kazakhstan. Analytical report on problematic issues in the organization of screening in Kazakhstan. URL: http://www.rcrz.kz/100/p94-1.pdf Accessed August 20, 2021.
11. Suleimenov M. A program for early diagnosis of four types of cancer has been launched in Kazakhstan. URL: https://online.zakon.kz/Document/?doc_id=31321887#pos=3;-52 Accessed August 21, 2021.
12. Janette R, Georgia H, Nikolaos I.K. Lung cancer screening. European Lung Foundation, European Respiratory Society. 2021. URL: https://europeanlung.org/wp-content/uploads/2021/04/Lung-Cancer-Screening-Factsheet_RU.pdf

25Journal of Clinical Medicine of Kazakhstan: 2021 Volume 18, Issue 6
Review Article DOI: https://doi.org/10.23950/jcmk/11392
JOURNAL OF CLINICAL MEDICINE OF KAZAKHSTAN (E-ISSN 2313-1519)
AbstractMeasles is an acute infectious disease characterized by a
combination of catarrhal symptoms and specific exanthema. This is a highly contagious, potentially fatal infection with an airborne transmission mechanism. A distinctive feature of the pathogen of which is the ability to cause prolonged post-infectious immunosuppression. Fever in combination with one of the following manifestations: cough, runny nose, conjunctivitis are the first clinical manifestations of the disease. The Belsky-Filatov-Koplik spots are specific rashes on the mucous membrane of the cheeks, allowing to establish a diagnosis even before the appearance of exanthema. The rash usually appears 3-4 days after the onset of an increase in body temperature and is characterized by a gradual rash, initially occurs on the face and behind the ears, which is associated with the peak of the clinical picture. Measles is characterized by a polysystemic lesion, with a predominant involvement in the pathological process of the central and respiratory systems of the body, while pneumonia is one of the most frequent complications that lead to a fatal outcome. In the treatment of measles, supportive therapy, correction of dehydration and nutrient deficiency, as well as treatment of secondary bacterial infections and providing the body with vitamin A are of great importance. It is important to note that measles has lifelong immunity after an infection or vaccination, while vaccination against measles plays a crucial role in its elimination. Previously, it was believed that measles is on the verge of eradication, but its outbreaks in Europe at the present stage have led to the return and spread of this infection. Measles remains the leading cause of global child mortality in the world, as children from developing countries are most susceptible to this disease. About 45 million new cases of measles are registered annually in the world, among which almost a million people die.
Key words: measles, children, clinic, diagnosis, treatment, prevention
Received: 2021-08-31. Accepted: 2021-11-23
Measles at the present stageAygerim Zhuzzhasarova, Dinagul Bayesheva, Alena Altynbekova, Bayan Turdalina, Aliya Seidullayeva, Aitolkyn Mynzhanova, Almagul Kushugulova1Astana Medical University, Nur-Sultan, Kazakhstan2Multidisciplinary city Hospital No3, Nur-Sultan, Kazakhstan3Center of Life Sciences, Nazarbayev University, Nur-Sultan, Kazakhstan
Corresponding author: Aygerim Zhuzzhasarova. E-mail: [email protected]; ORCID: 0000-0001-6556-4489
J Clin Med Kaz 2021; 18(6):25-31
Modern views of measles in childrenMeasles is a viral disease with a high potential for
spread and the development of complications in about 30% of cases, the main contingent of patients are children under the age of 5 years, mainly with a nutritional deficiency and a weakened immune system. At the present stage, measles remains a significant morbidity and remains a significant cause of death worldwide, especially among young children, due to its widespread spread, even despite the availability of a safe and effective vaccine [1-7].
According to the World Health Organization, it was found that in 2013, about 145,700 people died from measles, most of them children, while about 95% of the deaths occurred in Africa and Asia [8-10].
The global measles burden exceeded 9.7 million cases in 2015. Of these, 254,928 cases were reported in six WHO regions, while 134,200 (95% CI=74,400-353,600) people
died from this infection 16. 27,086 (88%) of these cases were reported in 4 countries: Kyrgyzstan-17,779 (58%), Bosnia and Herzegovina-4,583 (15%), Germany-2,383 (8%) and Kazakhstan-2,341 (8%) [11,12].
Measles is a potentially liquidable disease, since the reservoir is exclusively a person. Safe, effective vaccines, as well as sensitive and specific laboratory diagnostic tests, have been developed and are widely used today.
The possibility of eliminating measles is due to the formation of lifelong immunity after an infection, the presence of a single antigenic variant of the measles virus worldwide, the absence of other than human reservoirs of the virus in nature, the pronounced manifestation of clinical forms of infection and the availability of effective live vaccines [13]. The World Health Organization (WHO) recommends a two-dose vaccination policy, with the first dose administered during the first year of life, and coverage

26Journal of Clinical Medicine of Kazakhstan: 2021 Volume 18, Issue 6
should be maintained at a level of at least 90-95% in order to interrupt the chain of transmission of the disease [14]. In 2015, measles outbreaks were registered in all 16 regions of the country in Kazakhstan. From January 1, 2015 to January 30, 2016, 2,679 suspected cases of measles were detected. The incidence of measles was recorded in people aged 20-29 years, 31% (n=719); adults aged 30 years and older, 26% (n=615); children under the age of one year, 25% (n=576); adolescents and young people aged 15-19 years, 13% (n=300). The registered incidence was the highest among people over 14 years of age, 70% (n=1634) [ 15].
The possibility of eradicating measles infection is due to the formation of lifelong immunity after infection, the presence of the only antigenic variant of the measles virus worldwide, the absence of other than human virus reservoirs in nature, the pronounced manifestation of clinical forms of infection and the availability of effective live vaccines [13]. The World Health Organization (WHO) recommends vaccination in two doses, with the first dose administered during the first year of a child's life, and vaccination coverage should be maintained at a level of at least 90-95% in order to interrupt the chain of transmission of the disease [14,15].
In Kazakhstan, measles outbreaks were registered in all 16 regions of the country in 2015. From January 1, 2015 to January 30, 2016, 2,679 suspected cases of measles were detected. The incidence of measles was recorded in people aged 20-29 years, 31% (n= 719); adults aged 30 years and older, 26% (n=615); children under the age of one year, 25% (n=576); adolescents and young people aged 15-19 years, 13% (n=300). At the same time, the incidence was highest among people over 14 years of age, 70% (n=1634).
Thus, the fact remains relevant that measles is dangerous at the present stage. It should be noted that the most highly effective and affordable vaccines (live weakened measles vaccines) provide 97% protection at two doses administered at the age of 12 to 15 months and from 4 to 6 years, with proven safety indicators [16].
According to the latest WHO data, since 2000, measles vaccination has prevented about 21 million deaths worldwide. Despite this, the set global goals were not achieved and the risk of an increase in the incidence of measles by 31% of the number of cases registered worldwide between 2016 and 2017 remained. The World Health Organization (WHO) reported 117,075 cases of measles and 1,205 deaths in Madagascar observed between the beginning of October 2018 and the beginning of April 2019. In Europe, the number of registered cases in 2018 increased three times compared to 2017 and 15 times compared to 2016. In addition, endemic measles has been reported in several European countries where the elimination of this infection was previously achieved. In the WHO European Region, from January 1 to October 30, 2018, this figure was 53,201. Of these, 89 % of all cases were registered in nine countries, such as: Ukraine-66% (n =35,120); Serbia-9.5% (n=5,057); France-5% (n=2,787;), Italy (n=2,373; 4.5%), Greece (n=2,192; 4%), the Russian Federation (n=1822; 3%), Georgia (n =1502; 3%), Albania (n=1405; 3%) and Romania (n=943; 2%). The maximum increase in the incidence is in April and May, such an increase corresponds to the literature data characterizing the seasonality of measles [16,17].
Monitoring of the disease in the Republic of Kazakhstan indicates that the incidence of measles from November 2018 to December 30, 2019, amounted to 13,873 cases, of which 71.2% (n=9875) were children aged 6 months to 14 years.
As shown in Figure 1, the total number of cases of measles in the Republic of Kazakhstan in 2018 was 576 cases, of which 84% were children, 16% were adults. In 2019, the total number of cases of measles increased 23 times compared to 2018 and amounted to 13,297 cases. Changes in the age structure are noteworthy, so in 2019 the number of sick children decreased from 84% to -71%, but the incidence rates in adults increased from 16% to -29% (Figure 1). The incidence took on an outbreak character in 4 regions of the country, where the number of cases exceeded 1000 patients: Nur-Sultan - 22.9% (n=3181), in Shymkent - 22.3% (n=3095), in Mangystau - 10.3% (n=1428) and in Turkestan region - 8% (n=1110). Regions where the number of measles cases ranged from 200 to 1000: Atyrau (n=775), Almaty (n=617), Kyzylorda (n=535), Karaganda (n=364), Zhambyl (n=433), Akmola (n=312), Aktobe (n=283), North Kazakhstan (n=280), Pavlodar (n=208) regions and Almaty (n=850), up to 200 cases of the disease were registered in Kostanay (n=193), as well as in West Kazakhstan (n=122) and East Kazakhstan (n=87) regions.
Given the high contagiousness of the virus (98-99%), almost complete vaccination coverage of the population is required to prevent epidemic outbreaks (collective immunity up to 95%). However, every year there are increasing cases of refusal of vaccination, which are associated with misconceptions about the safety of the vaccine, especially those that have arisen as a result of repeatedly refuted claims about the link between the vaccine and autism. In addition, some people reject vaccination for religious reasons. A significant reason for medical withdrawal from vaccination may be severe immunosuppression [18].
Unlike many infectious diseases, measles is primarily a public health problem with a clear scientific solution. Every complication or death associated with measles was a preventable tragedy that could have been avoided with timely vaccination. The increase in the incidence of measles at the present stage in the countries of Europe and the CIS, including in our republic, observed in 2017-2019, is a big step back, so today there is a need for a detailed study of the features of the epidemic process of measles to assess the effectiveness of measures taken, substantiate new directions for improving the system of epidemiological surveillance, which will allow to justify a set of measures differentiated in accordance with the conditions of a certain area.
Etiology and clinical manifestations of measles in children
The causative agent of measles is a virus that belongs to the genus Morbillivirus, the family Paramyxoviridae [18,19] it has a spherical shape and a diameter of 100 to 200 nm [20-22].
Transmission of the infection occurs from a sick person, including with an atypical form of measles [23]. The virus is
Figure 1 - Measles incidence in 2018 and 2019

27Journal of Clinical Medicine of Kazakhstan: 2021 Volume 18, Issue 6
transmitted by airborne droplets, which persists in the open air for up to 2 hours. The infection rate is 98-99% [24].
The genetic characteristics of the measles virus are determined by eight classes (A-H), which are divided into 24 genotypes. 20 group A viruses were distributed mainly in China, the United States, Russia and Argentina. The group of viruses B and C circulates most often in Japan, South Africa and the Philippines. Viruses of group D and E are registered mainly in Western Europe. Group F viruses are found in Africa. Group G viruses are circulating in Canada, Malaysia and Indonesia. Group H viruses were detected in China, Japan and Korea [24]. Genotypes of groups B, D and H were registered in Kazakhstan in the period 2010-2019. In the period from November 2018 to March 2019, there was a circulation of D8 and B3 strains (Figure 2), where the Dublin and Kabul genetic lines were established in the B3 genotype, which were characterized by high aggressiveness, pathogenicity and contagiousness.
Mild atypical forms of measles include abortive, mitiged, erased and subclinical.
A mild course of measles is observed in people with already existing, but not fully formed immunity from measles, previous contact with the measles virus, transplacental transmission of antibodies against measles or receiving intravenous immunoglobulin [44]. Such patients have a longer incubation period, but lighter and less characteristic clinical manifestations, with a rapid regression of existing symptoms. It should be noted that patients with this form of infection are less contagious [43].
Atypical measles is registered among children vaccinated with the measles vaccine of the killed virus, who were subsequently exposed to the wild-type measles virus. In the period from 1963 to 1967, the vaccine with the killed measles virus was used in the United States, it increased the sensitivity of people to the antigens of the measles virus, but did not provide full protection. The complaints characteristic of atypical measles are headache and prolonged fever. The rash is usually maculopapular, but it can have a vesicular or petechial character, with a bluish tinge, starting on the distal parts of the extremities (including the palms of the hands and the soles of the feet) and spreading throughout the body. As a complication, severe pneumonia often develops, bilateral infiltrates and intra-thoracic lymphadenopathy are characteristic [42]. There may be swelling of the hands and feet, paresthesia or hyperesthesia and hepatosplenomegaly [44]. Atypical measles is considered not contagious [45]. Complications after atypical measles occur in about 10-40% of patients, mainly in young children, the elderly, pregnant women, patients with malnutrition and immunodeficiency conditions [45].
A complication of measlesEvery fifth patient who has had measles has a risk of
complications, which are most often observed in children under the age of 5 years and adults over 20 years. The most common complications of measles occur as a result of immunosuppression and the layering of secondary bacterial flora.
Measles pneumonia is the cause of death in 60% of cases [20]. It can develop due to the action of the measles virus itself (Hecht's giant cell pneumonia), the layering of secondary viral (adenovirus, herpes simplex virus) or bacterial flora (Streptococcus pneumonia, staphylococcus aureus) [46]. Among the pathology from the ENT organs, complications may occur in the form of the development of otitis media, otosclerosis,
Figure 2 - Diversity of wild-type measles virus genotypes in the Republic of Kazakhstan, 2010-2019
Measles does not have gender selectivity, but literature data show that male children are mostly more likely to get sick [25]. Among the main causes of infection are contacts with sick people with fever and respiratory symptoms from areas endemic to measles, immunodeficiency conditions, insufficient nutrition and vitamin A deficiency, as well as the presence of an unfavorable premorbid background [26-33].
The incubation period of measles in general is from 7 to 21 days, on average it is 13-14 days from the moment of contact [34]. The prodromal period lasts from 2 to 4 days. Then comes the period of peak or catarrhal period of the disease, which is characterized by an increase in body temperature, a decrease in appetite, general weakness and the so-called triad of symptoms: runny nose, barking cough and conjunctivitis. Before the appearance of a rash on the mucous membrane of the cheeks, opposite the molars, an enanthema appears – these are the Belsky-Filatov-Koplik spots, which are a pathognomonic symptom of measles in the prodromal period. However, these spots are present only in 60-70% of patients and usually persist from 12 to 72 hours [35].
The appearance of an exanthema is possible in several ways: in the form of erythema, spots and papules that initially appear on the face, around the hairline, on the sides of the neck and behind the ears [27,36,37]. When spreading to the lower extremities, the rash merges in places [38,39-42]. (Fig. 3) More intensively rashes are located in the shoulder area [40,42]. The palms of the hands and the soles of the feet are almost always free of rash [21,42]. The rash period lasts from 5 to 10 days, then the rash disappears in the same order in which it appearsm[41,43]. As the rash disappears, there is pigmentation with slight peeling [21,42]. At the same time, there is a constant cough that persists for several weeks. Patients may also experience pain in the throat, abdomen, cervical lymphadenopathy and, less often, splenomegaly [42].
Figure 3 - Measles in a child of 12 months, the 6th day of the disease.

28Journal of Clinical Medicine of Kazakhstan: 2021 Volume 18, Issue 6
tonsillitis, sinusitis, laryngotracheobronchitis ("cinnamon croup"), bronchitis [47,48]. Gastrointestinal complications include gastroenteritis, gingivostomatitis, mesenteric lymphadenitis, hepatitis, pancreatitis and appendicitis [49]. Among ophthalmic complications, keratoconjunctivitis is observed, leading to blindness, especially in people with vitamin A deficiency and corneal ulcers. Hematological complications are most often thrombocytopenia and disseminated intravascular coagulopathy. Cardiac complications manifest themselves in the form of pericarditis and carditis [42]. Renal complications lead to glomerulonephritis and acute renal failure [50]. Among neurological complications, febrile convulsions, primary measles encephalitis, acute postinfectious encephalomyelitis, subacute sclerosing panencephalitis are observed [51].
The most severe complication of measles is measles encephalitis. Primary measles encephalitis develops in about one in 1000 measles patients, usually on the 5th day of the rash. At the same time, about 10% of cases end fatally. Acute post-infectious encephalomyelitis is an autoimmune demyelinating disease that occurs in about one in 1000 measles patients and manifests itself during the recovery period within 2 weeks after the rash.
During pregnancy, measles is particularly dangerous because of the increased risk of spontaneous abortion, premature birth, as well as low fetal body weight at birth, intrauterine death or stillbirth. Since a woman's immunity decreases during pregnancy, infection can lead to a fatal outcome [51].
Diagnosis and differential diagnosisThe most common confirmation of measles is carried out
by a laboratory method based on a positive serological study for antibodies to immunoglobulin M (IgM) to measles with a four-fold or more increase in the titer of specific IgG in dynamics, isolation of the virus from cultures of mononuclear cells of blood, urine, smears from the conjunctiva or nasopharynx and detection of measles virus RNA using reverse transcriptase polymerase chain reaction (RT-PCR) in blood samples, a smear from the pharynx and nasopharynx or urine [51]. Unfortunately, measles-specific IgM antibodies can be detected only 4 or more days after the rash appears, which can lead to false negative results if the examination is carried out earlier. Approximately 75% of patients with measles-specific IgM antibodies are detected within the first 72 hours after the rash appears, but almost all affected children will have measles-specific IgM detected 96 hours after the rash appears. In addition, false positive results can sometimes occur in patients with infectious mononucleosis, rubella, parvovirus infection B19 and rheumatological diseases. Testing of measles virus RNA using RT-PCR is more specific and gives a positive result before the characteristic IgM antibodies to measles appear, and allows identifying the genotype [52].
ObservationThe clinical picture of measles, depending on the seasonality
and geographical location, can simulate the manifestations of other viral diseases. It should be emphasized that MeV infection in people with weakened immunity may not cause the typical symptoms of measles, while often causing severe outcomes of the disease, with the development of pneumonia [53]. Virological surveillance data show a decrease in the overall genetic diversity of measles, since the number of genotypes in the examined patients decreased [54]. Sequencing of larger fragments of the MeV genome makes it possible to increase the resolution of MeV transmission routes, including the difference between several
import sources of the same genotype and jointly circulating lines in countries with an endemic virus. Areas of interest for extended sequencing include the non-coding region between the matrix (M) and F genes, as well as the entire genome, which can be sequenced by Sanger methods or next-generation methods [55,56]. The information obtained from MF-NCR provides phylogenetic trees with a topology similar to that obtained by sequencing the entire genome, demonstrating that this region is useful for improving molecular surveillance of measles [56-58].
TreatmentIn our country, the treatment of children with measles is
carried out in accordance with the Clinical Protocol "Diagnosis and treatment of measles in children" of the Republic of Kazakhstan №. 4 of June 9, 2016. The basis is symptomatic therapy, which includes the use of antipyretics, vitamins, preventive measures, proper and enhanced nutrition [44]. In the case of the addition of secondary bacterial flora, treatment is carried out with appropriate antibiotics [44]. According to the 2017 Cochrane Systematic Review, in the treatment of patients with measles, vitamin A should be added orally once a day for 2 consecutive days in age-related doses (50,000 IU, 100,000 IU and 200,000 IU for infants <6 months, infants aged 6 to 11 months and children older than 12 months, respectively), which is associated with a significant reduction in mortality and morbidity in children [49].
It should be noted that there is no specific antiviral therapy for measles patients. Although in vitro studies have shown that the measles virus is sensitive to ribavirin [36,59], however, its clinical efficacy and safety profile were not evaluated in any randomized controlled trial.
Prevention. Active immunizationToday, measles remains one of the causes of morbidity
and mortality of children worldwide, especially in developing countries [60]. Universal immunization of children and vaccination of all susceptible patients, including children aged 6-11 months who are at a higher risk of contracting measles: travelers to endemic areas, high school and college students, medical personnel and those who are in the regions of the measles outbreak with the measles vaccine [27,43] are recommended. The only measles vaccine currently in use contains live attenuated measles strains that multiply in the host body, causing both humoral and cellular immunity [36, 40]. To eliminate measles, vaccination coverage of the population should be more than 93% [36,40]. It should be noted that a dose of measles vaccine administered at the age of 1 year or older provides protection against measles from 93% to 95%, while two doses administered at appropriate intervals are almost 100% effective [22] a vaccine administered at the age of 9 months provides protection only by 85% 54. Children who received one dose of the measles vaccine before the age of 12 months should receive two additional doses at intervals of at least 28 days after 12 months, since doses administered before 12 months should not be considered valid [52].
The measles vaccine can be administered as a single component (for example, in Russia and some African countries), but more often they are administered in combination with mumps and rubella (MMR) and the measles-mumps-rubella-chickenpox vaccine. The vaccine against measles, mumps, rubella and chickenpox has the same immunogenicity and safety profiles as the CCP vaccine, except that the relative risk of febrile seizures is doubled [52].

29Journal of Clinical Medicine of Kazakhstan: 2021 Volume 18, Issue 6
References 1. Schoini P, Karampitsakos T, Avdikou M, Athanasopoulou A, Tsoukalas G, Tzouvelekis A. Measles pneumonitis. Adv Respir Med.
2019;87(1):63-67. doi: 10.5603/ARM.a2019.0010. 2. Imdad A, Mayo-Wilson E, Herzer K, Bhutta ZA. Vitamin A supplementation for preventing morbidity and mortality in children from six
months to five years of age. Cochrane Database Syst Rev. 2017;3(3):CD008524. doi: 10.1002/14651858.CD008524.pub3. 3. Ilyas M, Afzal S, Ahmad J, Alghamdi S, Khurram M. The Resurgence of Measles Infection and its Associated Complications in Early
Childhood at a Tertiary Care Hospital in Peshawar, Pakistan. Pol J Microbiol. 2020;69(2):1-8. doi: 10.33073/pjm-2020-020. 4. Duke T, Mgone CS. Measles: not just another viral exanthem. Lancet. 2003;361(9359):763-73. doi: 10.1016/S0140-6736(03)12661-X. 5. Moss WJ, Griffin DE. Measles. Lancet. 2012;379(9811):153-64. doi: 10.1016/S0140-6736(10)62352-5. 6. Robbins FC. Measles: clinical features. Pathogenesis, pathology and complications. Am J Dis Child. 1962; 103:266-73. doi: 10.1001/
archpedi.1962.02080020278018. 7. Hall V, Banerjee E, Kenyon C, Strain A, Griffith J, Como-Sabetti K, Heath J, Bahta L, Martin K, McMahon M, Johnson D, Roddy M,
Dunn D, Ehresmann K. Measles Outbreak - Minnesota April-May 2017. MMWR Morb Mortal Wkly Rep. 2017;66(27):713-717. doi: 10.15585/mmwr.mm6627a1.
8. Piccirilli G, Lazzarotto T, Chiereghin A, Serra L, Gabrielli L, Lanari M. Spotlight on measles in Italy: why outbreaks of a vaccine-preventable infection continue in the 21st century. Expert Rev Anti Infect Ther. 2015;13(3):355-62. doi: 10.1586/14787210.2015.1003808.
9. Sá Machado R, Perez Duque M, Almeida S, Cruz I, Sottomayor A, Almeida I, R Oliveira J, Antunes D. Measles outbreak in a tertiary level hospital, Porto, Portugal, 2018: challenges in the post-elimination era. Euro Surveill. 2018;23(20):18-00224. doi: 10.2807/1560-7917.ES.2018.23.20.18-00224.
10. WHO warns that progress towards eliminating measles has stalled [http:// www.who.int/mediacentre/news/releases/2014/eliminating-measles/en/. Accessed 5 April 2017.
11. Patel M.K., Gacic-Dobo M., Strebel P.M., Dabbagh A., Mulders M.N., Okwo-Bele J., Dumolard L., Rota P.A., Kretsinger K., Goodson J.L. Progress toward regional measles elimination—Worldwide, 2000–2015. Morb. Mortal. Wkly. Rep. 2016;65:1228–1233. doi: 10.15585/mmwr.mm6544a6.
12. World Health Organization Regional Office for Europe. EpiBrief. 2016;1:1-11. Available at.13. Seither R, Calhoun K, Knighton CL, Mellerson J, Meador S, Tippins A, Greby SM, Dietz V. Vaccination Coverage Among Children
in Kindergarten - United States, 2014-15 School Year. MMWR Morb Mortal Wkly Rep. 2015;64(33):897-904. doi: 10.15585/mmwr.mm6433a2.
14. Orenstein WA, Hinman A, Nkowane B, Olive JM, Reingold A. Measles and Rubella Global Strategic Plan 2012-2020 midterm review. Vaccine. 2018;36 Suppl 1:A1-A34. doi: 10.1016/j.vaccine.2017.09.026.
15. Abeev A, Zhylkibayev A, Kamalova D, Kusheva N, Nusupbaeva G, Tleumbetova N, Smagul M, Beissenova S, Aubakirova S, Kassenova Z, Demessinova B, Amanbayev A, Ramankulov Y, Shevtsov A. Epidemiological Outbreaks of Measles Virus in Kazakhstan during 2015. Jpn J Infect Dis. 2018;71(5):354-359. doi: 10.7883/yoken.JJID.2017.565.
16. Dabbagh A, Laws RL, Steulet C, Dumolard L, Mulders MN, Kretsinger K, Alexander JP, Rota PA, Goodson JL. Progress Toward Regional Measles Elimination - Worldwide, 2000-2017. MMWR Morb Mortal Wkly Rep. 2018;67(47):1323-1329. doi: 10.15585/mmwr.mm6747a6.
At the present stage, scientists in many countries are studying alternative methods of immunization to determine the possibility of overcoming the overwhelming effect of maternal antibodies, for the immunization of infants at an earlier age, especially in highly endemic regions [19]. Alternative routes are respiratory and intradermal vaccination using microneedles or disposable jet injectors without needles with cartridges, are also being considered in order to exclude the use of sharp objects that are currently injected subcutaneously [23,26].
The respiratory measles vaccine has been studied for the past 30 years, and in connection with this, the WHO Aerosol Medicines project was created to license a single respiratory method of delivering the measles vaccine. Understanding the average volume of an inhaled vaccine delivered deep into the lungs is important for determining the dose received during aerosolization. Studies show that an effective immune response occurs when the vaccine reaches the deep layers of the lungs, for this, the particles in aerosol form must have a size of <5 microns [27].
Reactions to the vaccine occur on average 5-12 days after vaccination, mainly manifested in the form of fever, rash and arthralgia [56]. Contraindications for vaccination are primarily hypersensitivity to any component of the vaccine, including gelatin and neomycin; a confirmed anaphylactic reaction to a previous measles vaccine in the anamnesis, cellular
immunodeficiency, moderate or severe disease in the acute period, any febrile disease, pregnancy [61]. Measles vaccination should be postponed for those who have recently taken high doses of corticosteroids, immunoglobulins or blood products [58].
ConclusionAn increase in measles disease in the Republic of
Kazakhstan for 2018-2019 has been registered. The majority of cases occur in children under 14 years of age 73% (n=10189). Measles at the present stage was accompanied with formidable complications, such as pneumonia, carditis, ARDS, etc. Thus, to eliminate measles among the population, universal immunization of children and vaccination of all susceptible people with an anti-measles vaccine is recommended. Immunization is the responsibility of society, the ultimate goal of which is the complete elimination and eradication of measles.
Disclosures: There is no conflict of interest for all authors.
Acknowledgements: None.
Funding: None.

30Journal of Clinical Medicine of Kazakhstan: 2021 Volume 18, Issue 6
17. Thornton J. Measles cases in Europe tripled from 2017 to 2018. BMJ. 2019;364:l634. doi: 10.1136/bmj.l634. 18. Griffin DE, Moss WJ. Measles. Lancet. 2012;379(9811):153-64. doi: 10.1016/S0140-6736(10)62352-5. 19. Thornton J. Measles cases in Europe tripled from 2017 to 2018. BMJ. 2019;364:l634. doi: 10.1136/bmj.l634. 20. Dardis MR. A review of measles. J Sch Nurs. 2012;28(1):9-12. doi: 10.1177/1059840511429004. 21. Bentley J, Rouse J, Pinfield J. Measles: pathology, management and public health issues. Nurs Stand. 2014;28(38):51-8. doi: 10.7748/
ns.28.38.51.e8765. 22. Rota PA, Moss WJ, Takeda M, de Swart RL, Thompson KM, Goodson JL. Measles. Nat Rev Dis Primers. 2016;2:16049. doi: 10.1038/
nrdp.2016.49. 23. Shanks GD, Hu Z, Waller M, Lee SE, Terfa D, Howard A, van Heyningen E, Brundage JF. Measles epidemics of variable lethality in the
early 20th century. Am J Epidemiol. 2014;179(4):413-22. doi: 10.1093/aje/kwt282. 24. Genetic Analysis of Measles Viruses. https://www.cdc.gov/measles/lab-tools/genetic-analysis.html25. Bernstein HH, Bocchini JA Jr; Committee on infectious diseases. The Need to Optimize Adolescent Immunization. Pediatrics.
2017;139(3):e20164186. doi: 10.1542/peds.2016-4186. 26. Klein SL, Marriott I, Fish EN. Sex-based differences in immune function and responses to vaccination. Trans R Soc Trop Med Hyg.
2015;109(1):9-15. doi: 10.1093/trstmh/tru167. 27. Rouse J, Bentley J. Pinfield J. Measles: pathology, management and public health issues. Nurs Stand. 2014;28(38):51-8. doi: 10.7748/
ns.28.38.51.e8765. 28. Huiming Y, Chaomin W, Meng M. Vitamin A for treating measles in children. Cochrane Database Syst Rev. 2005;2005(4):CD001479.
doi: 10.1002/14651858.CD001479.pub3. 29. Bello S, Meremikwu MM, Ejemot-Nwadiaro RI, Oduwole O. Routine vitamin A supplementation for the prevention of blindness due to
measles infection in children. Cochrane Database Syst Rev. 2016;(8):CD007719. doi: 10.1002/14651858.CD007719.pub4. 30. Bichon A, Aubry C, Benarous L, Drouet H, Zandotti C, Parola P, Lagier JC. Case report: Ribavirin and vitamin A in a severe case of
measles. Medicine (Baltimore). 2017;96(50):e9154. doi: 10.1097/MD.0000000000009154. 31. Imdad A, Mayo-Wilson E, Herzer K, Bhutta ZA. Vitamin A supplementation for preventing morbidity and mortality in children from six
months to five years of age. Cochrane Database Syst Rev. 2017;3(3):CD008524. doi: 10.1002/14651858.CD008524.pub3. 32. Kobaidze K, Wallace G. Forgotten but Not Gone: Update on Measles Infection for Hospitalists. J Hosp Med. 2017;12(6):472-476. doi:
10.12788/jhm.2752. 33. Piccirilli G, Lazzarotto T, Chiereghin A, Serra L, Gabrielli L, Lanari M. Spotlight on measles in Italy: why outbreaks of a vaccine-
preventable infection continue in the 21st century. Expert Rev Anti Infect Ther. 2015;13(3):355-62. doi: 10.1586/14787210.2015.1003808. 34. Klein NP, Zerbo O, Goddard K, Wang W, Fohner AE, Wiesner A, Shokoohi V, Coller J, Bok K, Gans HA. Genetic associations with
a fever after measles-containing vaccines. Hum Vaccin Immunother. 2021;17(6):1763-1769. doi: 10.1080/21645515.2020.1849520. Epub 2020 Dec 22.
35. Bester JC. Measles and Measles Vaccination: A Review. JAMA Pediatr. 2016;170(12):1209-1215. doi: 10.1001/jamapediatrics.2016.1787. 36. Lindberg C, Lanzi M, Lindberg K. Measles: Still a Significant Health Threat. MCN Am J Matern Child Nurs. 2015;40(5):298-305; quiz
E21-2. doi: 10.1097/NMC.0000000000000162. 37. Sood SB, Suthar K, Martin K, Mather K. Vaccine-associated measles in an immunocompetent child. Clin Case Rep. 2017;5(11):1765-
1767. doi: 10.1002/ccr3.1174. 38. Kumar D, Sabella C. Measles: Back again. Cleve Clin J Med. 2016;83(5):340-4. doi: 10.3949/ccjm.83a.15039. 39. Caldararo S. Measles. Pediatr Rev. 2007;28(9):352-4. doi: 10.1542/pir.28-9-352. 40. Moss WJ. Measles. Lancet. 2017;390(10111):2490-2502. doi: 10.1016/S0140-6736(17)31463-0. 41. Piccirilli G, Lazzarotto T, Chiereghin A, Serra L, Gabrielli L, Lanari M. Spotlight on measles in Italy: why outbreaks of a vaccine-
preventable infection continue in the 21st century. Expert Rev Anti Infect Ther. 2015;13(3):355-62. doi: 10.1586/14787210.2015.1003808. 42. 42. Gadler T, Martinez N, Ogg-Gress J. Recognizing Measles, Mumps, and Rubella in the Emergency Department. Adv Emerg Nurs J.
2018;40(2):110-118. doi: 10.1097/TME.0000000000000190. 43. 43. Imdad A, Mayo-Wilson E, Herzer K, Bhutta ZA. Vitamin A supplementation for preventing morbidity and mortality in children from
six months to five years of age. Cochrane Database Syst Rev. 2017;3(3):CD008524. doi: 10.1002/14651858.CD008524.pub3. 44. Dardis MR. A review of measles. J Sch Nurs. 2012;28(1):9-12. doi: 10.1177/1059840511429004. 45. Chovatiya R, Silverberg JI. Inpatient morbidity and mortality of measles in the United States. PLoS One. 2020;15(4):e0231329. doi:
10.1371/journal.pone.0231329. 46. Roose J, Rohaert C, Jadoul A, Fölster-Holst R, van Gysel D. Modified Measles: A Diagnostic Challenge. Acta Derm Venereol.
2018;98(2):289-290. doi: 10.2340/00015555-2825. 47. Bhatt JM, Huoh KC. Otolaryngological manifestations of Measles (Rubeola): A case report and brief review. Laryngoscope.
2016;126(6):1481-1483. doi: 10.1002/lary.25549. 48. Lai WS, Lin YY, Wang CH, Chen HC. Measles: A missed cause of acute tonsillitis. Ear Nose Throat J. 2017;96(10-11):E54-E55. doi:
10.1177/0145561317096010-1111. 49. Colombo I, Forapani E, Spreafico C, Capraro C, Santilli I. Acute myelitis as presentation of a reemerging disease: measles. Neurol Sci.
2018;39(9):1617-1619. doi: 10.1007/s10072-018-3416-0. 50. Fisher DL, Defres S, Solomon T. Measles-induced encephalitis. QJM. 2015;108(3):177-82. doi: 10.1093/qjmed/hcu11351. Garg RK, Malhotra HS, Rizvi I, Kumar N, Jain A. An unusual case of acute encephalitic syndrome: Is it acute measles encephalitis or
subacute sclerosing panencephalitis? Neurol India. 2017;65(6):1333-1344. doi: 10.4103/0028-3886.217942.52. Campos-Outcalt D. Measles: Why it's still a threat. J Fam Pract. 2017;66(7):446-449. 53. MacFadden DR, Gold WL. Measles. CMAJ. 2014;186(6):450. doi: 10.1503/cmaj.130958. 54. McCarthy M. US sees first measles death in 12 years. BMJ. 2015;351:h3653. doi: 10.1136/bmj.h3653. 55. Wyplosz B, Lafarge M, Escaut L, Stern JB. Fatal measles pneumonitis during Hodgkin's lymphoma. BMJ Case Rep.
2013;2013:bcr2013200252. doi: 10.1136/bcr-2013-200252.

31Journal of Clinical Medicine of Kazakhstan: 2021 Volume 18, Issue 6
56. Update of the nomenclature for describing the genetic characteristics of wild-type measles viruses: New genotypes and reference strains. Wkly. Epidemiol. Rec. 2003; 78:229–232.
57. Kessler, J.R.; Kremer, J.R.; Shulga, S.V.; Tikhonova, N.T.; Santibanez, S.; Mankertz, A.; Semeiko, G.V.; Samoilovich, E.O.; Tamfum, J.-J.M.; Pukuta, E.; et al. Revealing new measles virus transmission routes by use of sequence analysis of phosphoprotein and hemagglutinin genes. J. Clin. Microbiol. 2011; 49:677–683. doi: 10.1128/JCM.01703-10.
58. Gardy, J.L.; Naus, M.; Amlani, A.; Chung, W.; Kim, H.; Tan, M.; Severini, A.; Krajden, M.; Puddicombe, D.; Sahni, V.; et al. Whole-genome sequencing of measles virus genotypes H1 and D8 during outbreaks of infection following the 2010 Olympic winter games reveals viral transmission routes. J. Infect. Dis. 2015; 212:1574–1578. doi: 10.1093/infdis/jiv271.
59. Bichon A, Aubry C, Benarous L, Drouet H, Zandotti C, Parola P, Lagier JC. Case report: Ribavirin and vitamin A in a severe case of measles. Medicine (Baltimore). 2017;96(50):e9154. doi: 10.1097/MD.0000000000009154.
60. Paules CI, Marston HD, Fauci AS. Measles in 2019 - Going Backward. N Engl J Med. 2019;380(23):2185-2187. doi: 10.1056/NEJMp1905099.
61. Rota PA, Bankamp B. Whole-Genome Sequencing During Measles Outbreaks. J Infect Dis. 2015;212(10):1529-30. doi: 10.1093/infdis/jiv272.

32Journal of Clinical Medicine of Kazakhstan: 2021 Volume 18, Issue 6
Review Article DOI: https://doi.org/10.23950/jcmk/11423
JOURNAL OF CLINICAL MEDICINE OF KAZAKHSTAN (E-ISSN 2313-1519)
AbstractSensitization to human leukocyte antigens (HLA) antigens is the
main obstacle to getting the kidney either from a living or deceased donor. HLA sensitization occurs as the result of repeated pregnancy, blood transfusion, or previous transplantation. Overcoming the HLA incompatibility is one of the approaches to decrease the organ shortage. There are 3.5% highly sensitized patients among 3012 patients on the waiting list for kidney transplantation in Kazakhstan.
In this review, we have discussed most common approaches of desensitization for HS kidney recipients. Huge progress has been made in the field of desensitization in transplant medicine worldwide. We suppose, that implementation the desensitization protocols in clinical guidelines will improve patient survival and outcome after kidney transplantation.
Key words: kidney transplantation, HLA sensitization, immunology
Received: 2021-11-12. Accepted: 2021-12-09
Desensitization in kidney transplantation: ReviewJamilya Saparbay1, Mels Assykbayev1, Saitkarim Abdugafarov1, Gulnur Zhakhina1, Janat Spatayev1, Asan Zhexembayev1, Zhuldyz Zhanzakova2, Aida Turganbekova2, Saniya Abdrakhmanova2, Gulnara Kulkayeva1
1Department of Organ Transplantation, National Research Oncology Center, Nur-Sultan, Kazakhstan 2Department of Immunological Support of Organ Transplantation, Research and Production Center for Transfusiology, Nur-Sultan, Kazakhstan
Corresponding author: Jamilya Saparbay. E-mail: [email protected]; ORCID: 0000-0002-8478-5452
J Clin Med Kaz 2021; 18(6):32-34
IntroductionIn the last decade, organ transplantation is
developing fast in Kazakhstan. Internationally approved guidelines are used in all transplant centers in Kazakhstan. According to the Global Burden of Disease Study, the number of chronic kidney disease (CKD) patients is one million individuals, which is equal to 5.5% of the general population [1]. Nearly 100 kidney transplantations from living donors and 30 kidney transplantations from deceased donors are performed annually in Kazakhstan. Currently, 3012 patients are waiting for kidney transplantation in Kazakhstan [2]. In Kazakhstan there is a burden of organ shortage, mostly due to the low rate of cadaveric transplantation, this feature is very common for all Asian countries [3]. Moreover, there is one more obstacle for recipients to receive either cadaveric or living graft- sensitization to the human-leucocyte antigens. Totally 416 cases of kidney transplantation were performed in our center. 56 kidneys from deceased donors and 360 from living donors.
The mean waiting time for recipients was 28 months in patients, who underwent transplantation from deceased donors. According to our data, where 416 consecutive kidney transplantations were analyzed, 5-year graft survival in the group of recipients from living donors was 86.58% and 52% from cadaveric donors. Thus, in our
cohort, living donor kidney transplantation is a preferred treatment choice for patients with end-stage renal disease. However, for many patients with end-stage renal disease (ESRD) sensitization to human leukocyte antigens (HLA) antigens is the main obstacle to getting the kidney either from a living or deceased donor. HLA sensitization occurs as the result of repeated pregnancy, blood transfusion, or previous transplantation [4]. Overcoming the HLA incompatibility is one of the approaches to decrease the organ shortage. There are 3.5% highly sensitized patients among 3012 patients on the waiting list for kidney transplantation in Kazakhstan. Currently, there are no common guidelines for desensitization used in Kazakhstan. In this review, we discuss the current state of desensitization therapy for patients with HLA antibodies.
Desensitization strategiesThere are no widely accepted guidelines for
desensitization. The complex of approaches is used to eliminate circulating anti-HLA antibodies or lowering calculated panel reactive antibody (cPRA) in the plasma of potential kidney recipients (Figure 1). Plasmapheresis or immunoadsorption is used for the elimination of circulating anti-HLA antibodies. Monoclonal antibodies and intravenous immunoglobulin for prolonged inhibition of HLA antibody production.
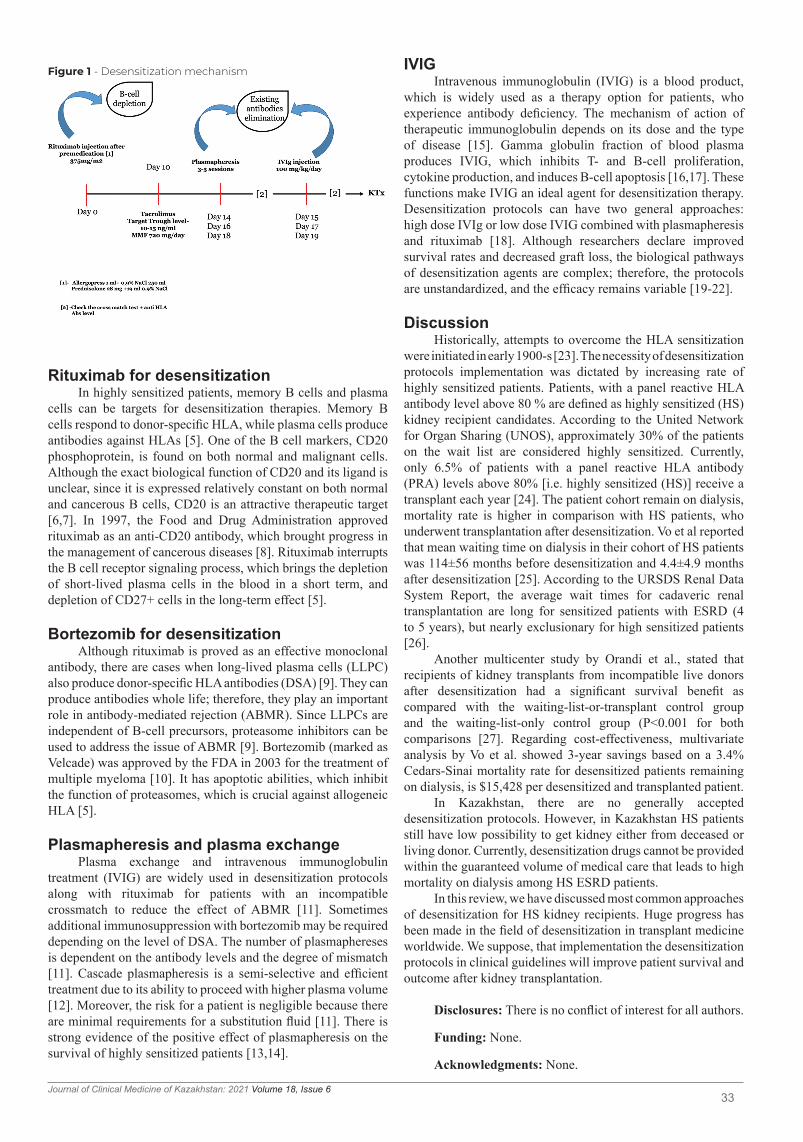
33Journal of Clinical Medicine of Kazakhstan: 2021 Volume 18, Issue 6
Rituximab for desensitizationIn highly sensitized patients, memory B cells and plasma
cells can be targets for desensitization therapies. Memory B cells respond to donor-specific HLA, while plasma cells produce antibodies against HLAs [5]. One of the B cell markers, CD20 phosphoprotein, is found on both normal and malignant cells. Although the exact biological function of CD20 and its ligand is unclear, since it is expressed relatively constant on both normal and cancerous B cells, CD20 is an attractive therapeutic target [6,7]. In 1997, the Food and Drug Administration approved rituximab as an anti-CD20 antibody, which brought progress in the management of cancerous diseases [8]. Rituximab interrupts the B cell receptor signaling process, which brings the depletion of short-lived plasma cells in the blood in a short term, and depletion of CD27+ cells in the long-term effect [5].
Bortezomib for desensitizationAlthough rituximab is proved as an effective monoclonal
antibody, there are cases when long-lived plasma cells (LLPC) also produce donor-specific HLA antibodies (DSA) [9]. They can produce antibodies whole life; therefore, they play an important role in antibody-mediated rejection (ABMR). Since LLPCs are independent of B-cell precursors, proteasome inhibitors can be used to address the issue of ABMR [9]. Bortezomib (marked as Velcade) was approved by the FDA in 2003 for the treatment of multiple myeloma [10]. It has apoptotic abilities, which inhibit the function of proteasomes, which is crucial against allogeneic HLA [5].
Plasmapheresis and plasma exchangePlasma exchange and intravenous immunoglobulin
treatment (IVIG) are widely used in desensitization protocols along with rituximab for patients with an incompatible crossmatch to reduce the effect of ABMR [11]. Sometimes additional immunosuppression with bortezomib may be required depending on the level of DSA. The number of plasmaphereses is dependent on the antibody levels and the degree of mismatch [11]. Cascade plasmapheresis is a semi-selective and efficient treatment due to its ability to proceed with higher plasma volume [12]. Moreover, the risk for a patient is negligible because there are minimal requirements for a substitution fluid [11]. There is strong evidence of the positive effect of plasmapheresis on the survival of highly sensitized patients [13,14].
Figure 1 - Desensitization mechanism IVIGIntravenous immunoglobulin (IVIG) is a blood product,
which is widely used as a therapy option for patients, who experience antibody deficiency. The mechanism of action of therapeutic immunoglobulin depends on its dose and the type of disease [15]. Gamma globulin fraction of blood plasma produces IVIG, which inhibits T- and B-cell proliferation, cytokine production, and induces B-cell apoptosis [16,17]. These functions make IVIG an ideal agent for desensitization therapy. Desensitization protocols can have two general approaches: high dose IVIg or low dose IVIG combined with plasmapheresis and rituximab [18]. Although researchers declare improved survival rates and decreased graft loss, the biological pathways of desensitization agents are complex; therefore, the protocols are unstandardized, and the efficacy remains variable [19-22].
DiscussionHistorically, attempts to overcome the HLA sensitization
were initiated in early 1900-s [23]. The necessity of desensitization protocols implementation was dictated by increasing rate of highly sensitized patients. Patients, with a panel reactive HLA antibody level above 80 % are defined as highly sensitized (HS) kidney recipient candidates. According to the United Network for Organ Sharing (UNOS), approximately 30% of the patients on the wait list are considered highly sensitized. Currently, only 6.5% of patients with a panel reactive HLA antibody (PRA) levels above 80% [i.e. highly sensitized (HS)] receive a transplant each year [24]. The patient cohort remain on dialysis, mortality rate is higher in comparison with HS patients, who underwent transplantation after desensitization. Vo et al reported that mean waiting time on dialysis in their cohort of HS patients was 114±56 months before desensitization and 4.4±4.9 months after desensitization [25]. According to the URSDS Renal Data System Report, the average wait times for cadaveric renal transplantation are long for sensitized patients with ESRD (4 to 5 years), but nearly exclusionary for high sensitized patients [26].
Another multicenter study by Orandi et al., stated that recipients of kidney transplants from incompatible live donors after desensitization had a significant survival benefit as compared with the waiting-list-or-transplant control group and the waiting-list-only control group (P<0.001 for both comparisons [27]. Regarding cost-effectiveness, multivariate analysis by Vo et al. showed 3-year savings based on a 3.4% Cedars-Sinai mortality rate for desensitized patients remaining on dialysis, is $15,428 per desensitized and transplanted patient.
In Kazakhstan, there are no generally accepted desensitization protocols. However, in Kazakhstan HS patients still have low possibility to get kidney either from deceased or living donor. Currently, desensitization drugs cannot be provided within the guaranteed volume of medical care that leads to high mortality on dialysis among HS ESRD patients.
In this review, we have discussed most common approaches of desensitization for HS kidney recipients. Huge progress has been made in the field of desensitization in transplant medicine worldwide. We suppose, that implementation the desensitization protocols in clinical guidelines will improve patient survival and outcome after kidney transplantation.
Disclosures: There is no conflict of interest for all authors.
Funding: None.
Acknowledgments: None.

34Journal of Clinical Medicine of Kazakhstan: 2021 Volume 18, Issue 6
References 1. Organization WH. Noncommunicable diseases (NCD) country profiles 2018: Kazakhstan. Geneva. Available at http//www.whoint/nmh/
countries/2018/irq_en.pdf: World Health Organization; 20182. RSE on PCV “Republican center for coordination of transplantation and high-tech medical services” of the Ministry of health of the
Republic of Kazakhstan. URL: https://transplant.kz/ru/statistika 3. Jager KI, Kovesdy C, Langham R, Rosenberg M, Jha V, Zoccali C. A single number for advocacy and communication- worldwide more
than 850 million individuals have kidney diseases. Nephrol Dial Transplant. 2019; 34(11):1 803-5. DOI: 10.1093/ndt/gfz1744. Cai J, Terasaki PI. The current trend of induction and maintenance treatment in patient of different PRA levels: a report on OPTN/UNOS
Kidney Transplant Registry data. Clin Transpl. 2010;45. PMID: 216960315. Ide, K., Tanaka, Y., Sasaki, Y., Tahara, H., Ohira, M., Ishiyama, K., & Ohdan, H. (2015). A phased desensitization protocol with rituximab
and bortezomib for highly sensitized kidney transplant candidates. Transplantation direct, 1(5). doi: 10.1097/TXD.00000000000005266. Pavlasova, G., & Mraz, M. The regulation and function of CD20: an “enigma” of B-cell biology and targeted therapy. Haematologica.
2020; 105(6):1494. doi: 10.3324/haematol.2019.2435437. Macklin, P. S., Morris, P. J., & Knight, S. R. A systematic review of the use of rituximab for desensitization in renal transplantation.
Transplantation. 2014; 98(8):794-805. DOI: 10.1097/TP.00000000000003628. Casan, J. M. L., Wong, J., Northcott, M. J., & Opat, S. Anti-CD20 monoclonal antibodies: reviewing a revolution. Human vaccines &
immunotherapeutics. 2018; 14(12):2820-2841. DOI: 10.1080/21645515.2018.15086249. Su, H., Zhang, C. Y., Lin, J. H., Hammes, H. P., & Zhang, C. The role of long-lived plasma cells in antibody-mediated rejection of kidney
transplantation: an update. Kidney Diseases. 2019; 5(4):211-219. DOI: 10.1159/00050146010. Kane, R. C., Bross, P. F., Farrell, A. T., & Pazdur, R. Velcade®: US FDA approval for the treatment of multiple myeloma progressing on
prior therapy. The oncologist. 2003; 8(6):508-513. DOI: 10.1634/theoncologist.8-6-50811. Clark, W. F., Huang, S. H. S., Walsh, M. W., Farah, M., Hildebrand, A. M., & Sontrop, J. M. (2016). Plasmapheresis for the treatment of
kidney diseases. Kidney international. 2016; 90(5):974-984. doi.org/10.1016/j.kint.2016.06.00912. Bajpai, M., Kakkar, B., Gupta, S., Rastogi, A., & Pamecha, V. Cascade plasmapheresis as a desensitization strategy for patients
undergoing ABO incompatible living donor liver transplantation (ABOi LDLT): A single center experience. Transfusion and Apheresis Science. 2019; 58(4):442-446. DOI: 10.1016/j.transci.2019.04.028
13. Montgomery RA, Lonze BE, King KE, et al. Desensitization in HLA- incompatible kidney recipients and survival. N Engl J Med. 2011; 365:318–326. DOI: 10.1056/NEJMoa1012376
14. Orandi BJ, Luo X, Massie AB, et al. Survival benefit with kidney transplants from HLA-incompatible live donors. N Engl J Med. 2016; 374:940–950. DOI: 10.1056/NEJMoa1508380
15. Jolles, S., Sewell, W. A. C., & Misbah, S. A. Clinical uses of intravenous immunoglobulin. Clinical and experimental immunology. 2005; 142(1):1. DOI: 10.1111/j.1365-2249.2005.02834.x
16. Kazatchkine, M. D., & Kaveri, S. V. Immunomodulation of autoimmune and inflammatory diseases with intravenous immune globulin. New England Journal of Medicine. 2001; 345(10):747-755. DOI: 10.1056/NEJMra993360
17. Watanabe, J., & Scornik, J. C. IVIG and HLA antibodies. Evidence for inhibition of complement activation but not for anti-idiotypic activity. American journal of transplantation. 2005; 5(11):2786-2790. DOI: 10.1111/j.1600-6143.2005.01056.x
18. Kuppachi, S., & Axelrod, D. A. Desensitization strategies: is it worth it? Transplant International. 2020; 33(3):251-259. DOI: 10.1111/tri.13532
19. Jordan, S. C., Legendre, C., Desai, N. M., Lorant, T., Bengtsson, M., Lonze, B. E., ... & Montgomery, R. A. Imlifidase Desensitization in Crossmatch-positive, Highly Sensitized Kidney Transplant Recipients: Results of an International Phase 2 Trial (Highdes). Transplantation. 2021; 105(8):1808. DOI: 10.1097/TP.0000000000003496
20. Orandi BJ, Garonzik-Wang JM, Massie AB, et al. Quantifying the risk of incompatible kidney transplantation: a multicenter study. Am J Transplant. 2014; 14:1573–1580. DOI: 10.1111/ajt.12786
21. Patel S, Benken J, West Thielke P, et al. Three year outcomes following positive cross match renal transplantation despite failure to convert to negative flow cross match after desensitization. J Clin Nephrol. 2018; 2:29–38. DOI: 10.29328/journal.jcn.1001016
22. Marfo K, Lu A, Ling M, et al. Desensitization protocols and their outcome. Clin J Am Soc Nephrol. 2011; 6:922–936. DOI: 10.2215/CJN.08140910
23. Marfo K, Lu A, Ling M, et al. Desensitization protocol and their outcomes. Clin J Am Soc Nephrol. 2011; 6:922,2011. DOI: 10.2215/CJN.08140910
24. Organ Procurement and Transplantation Network (OPTN).Scientific Registry of Transplant Recipients. 2012 Annual Data Report,2012);Scientific Registry of Transplant Recipients http://srtr.transplant.hrsa.gov/Resouces.aspx (9 January 2014, date last accessed)
25. Vo AA Choi J Cisneros Ket et al. Rituximab and intravenous immune globulin for desensitization during renal transplantation. N Engl J Med. 2008; 359:242-51. DOI: 10.1056/NEJMoa0707894
26. USRDS Renal Data System Report,200127. Orandi B.J.; Luo X., Massie A.B.; Garonzik-Wang J.M.; Lonze B.E. Survival Benefit with Kidney Transplants from HLA-Incompatible
Live Donors. 374:940-50). DOI: 10.1056/NEJMoa1508380

35Journal of Clinical Medicine of Kazakhstan: 2021 Volume 18, Issue 6
Original Article DOI: https://doi.org/10.23950/jcmk/11324
JOURNAL OF CLINICAL MEDICINE OF KAZAKHSTAN (E-ISSN 2313-1519)
AbstractObjective: This study aimed to determine the ability of the C-reactive
protein (CRP)-to-albumin ratio (CAR) to predict short-term mortality in patients with COVID-19.
Material and methods: This retrospective, observational, cohort study included patients with COVID-19. The patients’ demographics, clinical characteristics, CRP, albumin, CAR, blood urea nitrogen, creatinine, high-sensitive cardiac troponin I and all-cause mortality within 30 days after admission were noted. The receiver operating characteristic curve analysis was performed, and odds ratios (OR) were calculated to determine the discriminative ability of the parameters.
Results: A total of 103 patients with a median of age of 57 (25th – 75th percentiles: 32-76) years were included in the study. The rate of 30-day mortality was 4.8% for the study cohort. According to the best Youden’s index, the cut-off value for CRP was determined as 66.67 (sensitivity: 80%, specificity: 78.6%), and the area under curve (AUC) value was 0.801 (95% confidence interval [CI]: 71.1-87.3). According to the best Youden’s index, the cut-off value for CAR was 0.18 (sensitivity: 80%, specificity: 78.6%), and the AUC value was 0.806 (95% CI: 71.6-87.7). There was no statistically significant difference between the AUC values of CRP and CAR (DeLong equality test, p=0.938). The OR of CRP (>66.67 mg/L) and CAR (>0.18) for 30-day mortality were 14.667 (95% CI: 1.555-138.299) and 13.818 (95% CI: 1.468-130.076), respectively.
Conclusion: CAR was not useful in predicting 30-day mortality in patients with COVID-19. The calculation of CAR rather than CRP had no clinically significant contribution to the prediction of 30-day mortality in this patient group.
Key words: COVID-19, SARS-Cov-2, blood tests, coronavirus, C-reactive proteins, albumin, laboratory
Received: 2021-10-12. Accepted: 2021-11-04
Evaluation of the ability of the C-reactive protein-to-albumin ratio to predict short-term mortality in patients with COVID-19Serdar Özdemir1, Abdullah Algin1,2
1University of Health Sciences Turkey, Ümraniye Training and Research Hospital, Clinic of Emergency Medicine, İstanbul, Turkey2University of Health Sciences Turkey, Somalia Mogadishu Recep Tayyip Erdogan Faculty of Health Sciences, Mogadishu, Somalia
Corresponding author: Serdar Özdemir. E-mail: [email protected]; ORCID: 0000-0002-6186-6110
IntroductionSevere acute respiratory syndrome coronavirus 2
(SARS-CoV-2), a respiratory RNA virus that causes severe acute respiratory failure emerged as an epidemic in Wuhan, China at the end of 2019 [1]. It turned into a pandemic, spreading across the world and negatively affecting social lives, economies, and health systems of countries [2]. From March 2020, when the disease was declared a pandemic to June 2021, it infected more than 180 million people and caused the deaths of more than 3.5 million people.
With the spread of the disease around the world, many researchers have investigated the course of the disease and prognostic factors to use resources effectively [3-5]. It has been shown that an increase in inflammatory markers, such as C-reactive protein (CRP), interleukin-6, leucocyte count, and erythrocyte sedimentation rate can
be a marker of critical illness and mortality [3,4,6]. On the other hand, it has also been suggested that a decrease in markers, such as lymphocyte count and albumin can also be used in the detection of critical patients and predicting mortality. Researchers constantly attempt to identify better markers [5,6]. In order to achieve better predictability, hematological ratios, including neutrophil-to-lymphocyte, lymphocyte-to-CRP, lymphocyte-to-monocyte and platelet-to-lymphocyte ratios have been previously studies [5-7]. Acute-phase proteins (APPs) are proteins whose levels fluctuate in response to tissue injury, for example, trauma, acute infection, chronic inflammation, myocardial infarction, and malignancy. Their concentrations increase (positive APPs) or decrease (negative APPs) in response to the acute-phase reaction [8]. Based on the results reported in the literature, we considered that a ratio with a positive
J Clin Med Kaz 2021; 18(6):35-39

36Journal of Clinical Medicine of Kazakhstan: 2021 Volume 18, Issue 6
APP in the numerator and a negative APP in the denominator might be a near-ideal predictor [3-8]. Therefore, we chose CRP as a positive APP and albumin as a negative APP. In this study, we aimed to determine the ability of the CRP-to-albumin ratio (CAR) to predict short-term mortality in patients with coronavirus disease 2019 (COVID-19).
Material and methodsStudy design
This retrospective cohort study was conducted at Ümraniye Training and Research Hospital, a 695-bed tertiary education hospital with 1,110 daily patient admissions (annual average) to the emergency department (ED). The data of the patients admitted to our pandemic clinics between April 1, 2020 and May 1, 2020 were collected retrospectively.
Study populationOur study population consisted of patients who were
admitted to the pandemics clinic with the suspicion of COVID-19 between April 1, 2020 and May 1, 2020. All the patients with a positive test result for SARS-CoV-2, who were also tested for CRP and albumin, were included in the study. Patients chronic liver diseases were excluded from the study considering that their baseline albumin levels could be lower independent of COVID-19. The hospitalization and intensive care admission decisions of the patients were made by the emergency medicine specialist. The follow-up of the hospitalized patients was performed by a pulmonologist or an infectious disease specialist or an internist. The hospitalization decision and treatment planning were made in accordance with the COVID-19 Outbreak Management and Working Guideline of the Turkish Ministry of Health.
Data collectionThe patients’ demographics, clinical characteristics
(included comorbidities and symptoms), vital parameters on admission laboratory findings, and emergency department outcomes were obtained from the hospital computer-based patient data system and analyzed by the researchers. Comorbidities were recorded as coronary artery disease, diabetes mellitus, chronic obstructive pulmonary diseases, hypertension, congestive heart failure, chronic renal failure, and malignancy. The symptoms of the disease were recorded as fever, cough, sputum, dyspnea, weakness, muscle-joint pain, loss of smell or taste, headache, sore throat, vomiting-nausea, and diarrhea. Systolic blood pressure, diastolic blood pressure, pulse pressure, body temperature, respiratory rate, and peripheral oxygen saturation were recorded as vital parameters. The documented laboratory parameters were blood urea nitrogen (BUN), creatinine, CRP, D-dimer, high-sensitive cardiac troponin I (cTnI), CAR, albumin, white blood cell count, neutrophil count, lymphocyte count, platelet count, mean platelet volume, and mean corpuscular volume. The CAR values were calculated by two researchers.
To confirm SARS-CoV-2, the ORF1ab and N genes of SARS-CoV-2 were examined, and the Biorad CFX 96 platform was used. Ct values of 29 and above were considered as positive. The cases with a positive result for both genes were reported as SARS-CoV-2-positive.
Statistical analysisIBM Corp. Released 2020. IBM SPSS Statistics for Mac,
Version 27.0. Armonk, NY: IBM Corp. was used to perform
statistical analyses. To assess the conformance of variables to normal distribution, the Kolmogorov-Smirnov test was conducted. The data that matched the normal distribution were presented with mean and standard deviation values, and the remaining data were expressed as interquartile range and median values. Categorical data were presented with percentages and number of cases. For the comparison of qualitative and quantitative data between two groups, the Mann-Whitney U and chi-square tests were used. We also constructed a receiver-operating characteristic curve (ROC) for short-term mortality and obtained the area under the curve (AUC) values for individual variables using the MedCalc Statistical Software version 12.7.7 (MedCalc Software by, Ostend, Belgium; http://www.medcalc.org; 2013). The AUC values of the laboratory findings were calculated and tested mutually for significance with the DeLong equality test. The odds ratios (OR) was calculated for CRP, albumin, and CAR according to the optimum cut-off values obtained from the ROC analysis. A p value lower than 0.05 was considered statistically significant in all analyses.
EthicsEthical approval for the study was obtained from the
Ethics Committee of Ümraniye Training and Research Hospital (approval number: B.10. 1.TKH.4.34 .H.GP.0.01/113). We retrospectively reviewed the secondary data recorded in the computer-based patient data system of the hospital. The recorded data did not include any personally identifiable information, and it only consisted of clinical information. Therefore, informed patient consent was waived.
ResultsPatient characteristics
Of the 103 patients included in the study, 57 (55.3%) were male. The median of age of the 103 patients was 57 (25th-75th percentiles: 32-76) years. A total of five patients died within 30 days of ED presentation. The rate of 30-day mortality was 4.8% for the study cohort. The comparison of the demographic characteristics, clinical outcomes for the first 24 hours, comorbid diseases, symptoms, vital parameters at presentation, and mortality data between the survivor and non-survivor groups are shown in Table 1. The comparison of the initial laboratory findings between the two groups are presented in Table 2. Thirty-one patients (30.1%) were discharged, 70 (67.96%) and two (1.94%) were admitted to the intensive care unit. Thirty-one of the patients who survived were discharged, while 67 were hospitalized. Three of the patients that died had been hospitalized, and two had been admitted to the intensive care unit. There was a statistically significant difference between the survivor and non-survivor groups in terms of the ED outcomes (p=0.006).
Laboratory values and outcomesSignificant differences were observed between the survivor
and non-survivor groups in relation to chronic renal failure [1 (1%) versus 2 (40%), p = 0.006], systolic blood pressure [128 (90-175) versus 165 (121-180), p = 0.024], body temperature [36.6 (36-38.1) versus 37.5 (37.2-39) per minute, p = 0.023], and oxygen saturation [96 (85-99) versus 88 (80-95) %, p = 0.007]. There were also significant differences between the non-survivor and survivor groups in laboratory parameters: BUN [27.51 (10.68-61.9) versus 9.64 (4.59-47.28) mmol/L, p = 0.008], creatinine [0.43 (0.29-3.36) versus 0.3 (0.19-1.03) mmol/L, p

37Journal of Clinical Medicine of Kazakhstan: 2021 Volume 18, Issue 6
= 0.018], cTnI [ 0.003 (0.00-0.166) versus 0.19 (0.002-0.140) ng/mL, p = 0.011], CRP [85.71 (19.04-200) versus 28.57 (9.52-209.52) nmol/L, p= 0.020], platelet count [216 (22-54) versus 146 (83-210) 109/L, p = 0.017], and CAR [ 0.07 (0.02-0.53) versus 0.28 (0.04-0.59) p = 0.021].
The ROC curve analysis was performed to determine the discriminative ability of laboratory parameters in 30-day mortality. Table 3 and Figure 1 present the cut-off values of
BUN, creatinine, cTnI, CRP, albumin, and CAR according to the best Youden’s index, as well as their sensitivity, specificity, likelihood ratios (LR), AUC and 95% confidence interval (CI) values. There was no statistically significant difference between the AUC values of the laboratory parameters (DeLong equality test, for CRP and CAR, CRP and BUN, CRP and creatinine, CRP and cTnI, CAR and BUN, CAR and creatinine, CAR and cTnI, BUN and creatinine, BUN and cTnI, and creatinine and cTnI;
Table 2Laboratory parameters of the enrolled patients and comparison of these parameters between the survivor and non-survivor groups
Variables Total Survivor Non-survivor p valuesMedian (25th- 75th percentiles) Median (25th- 75th percentiles) Median (25th- 75th percentiles)
Blood urea nitrogen, mmol/L 9.64 (4.59-61,9) 9.64 (4.59-47.28) 27.51 (10.68-61.9) 0.008Creatinine, mmol/L 0.3 (0.19-3.36) 0.3 (0.19-1.03) 0.43 (0.29-3.36) 0.018D-dimer, µg/mL (DDU) 625 (230-4890) 590 (230-4,890) 1748 (1,530-1,966) 0.062Troponin (cTnI), ng/mL 0.003 (0.00-0.166) 0.003 (0.00-0.166) 0.19 (0.002-0.140) 0.011C-reactive protein, nmol/L 28.57 (9.52-209.52) 28.57 (9.52-209.52) 85.71 (19.04-200) 0.020Albumin, mg/dL 41.8 (30.7-49.6) 41.8 (30.7-49.6) 35.9 (32.7-47.3) 0.112White blood cell count, 109/L 7.6 (1.9-15.1) 8 (5.1-10.3) 5.3 (1.9-15.1) 0.846Neutrophil count. 109/L 5.16 (0.1-20.52 4.98 (0.1-20.52) 5.53 (1.96-13.03) 0.667Lymphocyte count, 109/L 1.58 (0.42-4.52) 1.59 (0.42-4.4.52) 1.07 (0.44-2.53) 0.234Platelet count, 109/L 213 (22-454) 216 (22-54) 146 (83-210) 0.017Mean platelet volume 9.2 (7.5-13.2) 9.2 (7.5-13.2) 9.4 (8.8-12.3) 0.303C-reactive protein-to-albumin ratio
0.08 (0.02-0.59) 0.07 (0.02-0.53) 0.28 (0.04-0.59) 0.021
Table 1Baseline characteristics of the enrolled patients and comparison of these characteristics between the survivor and non-survivor groups
The data is presented as number and percent, median and 25th to 75th percentiles.
Variables Total Survivor Non-survivor p valuesn = 103(%,25th – 75th percentiles)
n = 98 (%,25th – 75th percentiles) n = 5 (%,25th – 75th percentiles)
Age, years 57 (32-76) 56 (32-72) 59 (32-74) 0.162Gender
0.063Male 57 (55.3%) 52 (53.1%) 5 (100%)Female 46 (44.7%) 56 (56.9%) 0ComorbiditiesChronic obstructive pulmonary diseases
8(7.8%) 7 (7.1%) 1 (20%) 0.338
Hypertension 27 (26.2%) 25 (25.5%) 2 (40%) 0.604Diabetes mellitus 20 (19.4%) 19 (19.4%) 1 (20%) 0.999Coronary artery disease 7(6.8%) 7 (7.1%) 0 0.999Congestive heart failure 4 (3.9%) 3 (3.1%) 1 (20%) 0.183Chronic renal failure 3 (2.9%) 1 (1%) 2 (40%) 0.006Active malignancy 1 (1%) 1 (1%) 0 0.999Frequency of symptomsFever 44 (42.7%) 41 (41.8%) 3 (60%) 0.649Cough 60 (58.3%) 58 (59.2%) 2 (40%) 0.647Sputum 1 (1%) 1 (1%) 0 0.999Shortness of breath 32 (31.1%) 31 (31.6%) 1 (20%) 0.999Weakness 23 (22.3%) 22 (22.4%) 1 (20%) 0.999Muscle-joint pain 12 (11.7%) 11 (11.2%) 1 (20%) 0.469Loss of taste or smell 4 (3.9%) 4 (4.1%) 0 0.999Headache 8 (7.8%) 8 (8.2%) 0 0.999Sore throat 12 (11.7%) 11 (12.9%) 1 (20%) 0.469Nausea-vomiting 9 (8.7%) 9 (9.2%) 0 0.999Diarrhea 3 (2.9%) 3 (3.1%) 0 0.999Vital parametersSystolic blood pressure 129 (90-180) 128 (90-175) 165 (121-180) 0.024Diastolic blood pressure 80 (54-105) 78-(54-105) 85 (80-90) 0.024Pulse pressure 86 (59-180) 86 (59-145) 113 (83-180) 0.061Body temperature 836.6 (36-39) 36.6 (36-38.1) 37.5 8 (37.2-39) 0.023Respiratory rate 20 (16-27) 20 (16-27) 18 (17-19) 0.192Oxygen saturation 96 (80-99) 96 (85-99) 88 (80-95) 0.007

38Journal of Clinical Medicine of Kazakhstan: 2021 Volume 18, Issue 6
p values are 0.938 (0.801 versus 0.806), 0.494 (0.801 versus 0.849), 0.987 (0.801 versus 0.815), 0.374 (0.801 versus 0.838), 0.476 (0.806 versus 0.849), 0.993 (0.806 versus 0.815), 0.326 (0.806 versus 0.838), 0.718 (0.849 versus 0.815), 0.938 (0.849 versus 0.838), and 0.833 (0.815 versus 0.838), respectively). The OR of CRP (>66.67 mg/L), albumin (<35.9 mg/dL) and CAR (>0.18) for 30-day mortality were determined as 14.667 (95% CI: 1.555-138.299), 14.833 (95% CI: 2.183-100.781), and 13.818 (95% CI: 1.468-130.076), respectively.
DiscussionIn this study, we examined the ability of CAR to predict
short-term mortality in patient with COVID-19 presenting to ED. To the best of our knowledge, this is the first study that determines that CAR was not useful in predicting 30-day mortality in this patient group.
In our analysis, firstly, non-parametric comparison tests were used to determine the significant differences between the survivors and non-survivors in terms of the CRP, albumin, and CAR values. While CRP and CAR were significantly higher in the non-survivor group, no significant relationship was found between albumin and mortality. A further analysis was performed based on the ROC curve to control the ability of the two parameters to distinguish whether a patient survived or died. AUC values less than 0.5 were evaluated as indistinguishable from random, while those close to 1 were considered close to a
Table 3 Ability of the investigated laboratory parameters to predict 30-day all-cause mortality following ED admission
ED: emergency department; AUC: area under the curve; PPV: positive predictive value; NPV: negative predictive value; LR: likelihood ratio; CI: confidence interval; cTnI: high-sensitive cardiac troponin I, BUN: blood urea nitrogen; CRP: C-reactive protein; CAR: C-reactive protein-to-albumin ratio
AUC Cut-off Sensitivity Specificity PPV NPV LR+ LR- Accuracy 95% CI p-value
BUN 0.849 >10 100 55.1 10.2 100 2.23 0 55.1 76.5-91.2 <0.001
Creatinine 0.815 >0.36 80 76.5 14.8 98.7 3.41 0.26 56.53 72.7-88.5 0.004
cTnI 0.838 >0.01 80 87.8 28.6 98.6 6.56 0.23 67.80 74.3-90.8 0.002
CRP 0.801 >66.67 80 78.6 16 98,7 3.73 0,25 58.57 71.1-87.3 0.003
Albumin 0.711 ≤35.9 60 90.8 25 97.8 4.53 0.44 50.82 61.4-79.6 0.203
CAR 0.806 >0.18 80 78.6 16 98.7 3.73 0.25 58.57 71.6-87.7 0.005
Figure 1 - Receiver operating characteristic curves for C-reactive protein (CRP), C-reactive protein-to-albumin ratio (CAR), blood urea nitrogen (BUN), creatinine (Cre) and Troponin I (Trop) for the prediction of 30-day mortality in patients with COVID-19
perfect model [9,10]. In the literature, it has been reported that the AUC value should be greater than 0.8 for a model to predict mortality well [9,10]. In the discriminatory power analysis, we determined the AUC value of albumin as 0.711, which was unacceptable. However, the AUC value of CRP in predicting 30-day mortality was 0.801, and that of albumin in predicting 30-day mortality was 0.801, which indicated the predictive ability of this score for mortality. Thus, in this retrospective study, the ROC analysis confirmed that only CRP and CAR were predictors of 30-day mortality in patients with confirmed COVID-19. There was no significant difference between the AUC values of CPR and CAR. Furthermore, there was no significant difference between the ORs in the groups formed according to the cut-off values. Therefore, it is not clinically reasonable to calculate the CAR value when CRP can already predict short-term mortality according to the OR and ROC analysis. On the other hand, when LRs, which provide the clearest data on the way in which a scoring system can be used reliably [9-10], were examined, it was determined that CRP, albumin, and CAR could not be used clinically to predict short-term mortality in ED since their LR values were not in the range of below 0.2 or above 5, which is accepted to indicate strong evidence [11-13].
CAR is a biomarker that has been studied as a prognostic marker in inflammatory and infectious diseases, and malignancy [14-15]. In the current literature, there are studies on the predictive ability of CAR in patients with COVID-19. In a study conducted by Karakoyun et al., CAR was reported as an independent predictor of severe disease in hospitalized patients [16]. In that study, the AUC values of CRP and CAR were reported as 0.697 and 0.718, respectively, which do not represent a high predictive ability [9,10,16]. Furthermore, the OR for CAR in the prediction of severe disease was found to be 1.264, which is too low to be clinically significant [16]. Güney et al. investigated the predictive value of CAR for in-hospital mortality in patients with COVID-19 by dividing the cohort into three groups according to their CAR values (17). The authors found the OR as 8.2 between the group with a high CAR value and the reference group, which cannot be considered clinically significant [13,17]. El-Shabrawy et al. reported the AUC values as 0.939 and 0.955 for CRP and CAR, respectively and noted that these values were statistically significant in the prediction of 30-day mortality [18]. However, considering the very similar AUC values of the two parameters, we do not think that this clinical significance is sufficient to indicate that the calculation of CAR can replace that of CRP. In a study of Paliogiannis et al. with a small sample, no statistically significant difference was reported in terms of the CAR values between the survivor and non-survivor patient groups [19]. The results of our study also showed that CAR could not be used clinically to predict short-term mortality in patients presenting to ED with COVID-19. A

39Journal of Clinical Medicine of Kazakhstan: 2021 Volume 18, Issue 6
References 1. Eroglu SE, Aksel G, Altunok I, et al. Can Google® trends predict emergency department admissions in pandemic periods? Medicine
Science. 2021;10(1):111-117. https://doi.org/10.5455/medscience.2020.08.1622. Sert E, Mutlu H, Kokulu K, Sarıtaş A. Anxiety Levels and Associated Factors Among Emergency Department Personnel Fighting
COVID-19. J Contemp Med. 2020; 10(4): 556-561. https://doi.org/10.16899/jcm.9726643. Zhou B, Kojima S, Kawamoto A, et al. COVID-19 pathogenesis, prognostic factors, and treatment strategy: Urgent recommendations.
J Med Virol. 2021;93(5):2694-2704. https://doi.org/10.1002/jmv.26754. 4. Gallo Marin B, Aghagoli G, Lavine K, et al. Predictors of COVID-19 severity: A literature review. Rev Med Virol. 2021;31(1):1-10.
https://doi.org/10.1002/rmv.2146.5. Özdemir S, Eroğlu SE, Algın A, et al. Analysis of laboratory parameters in patients with COVID-19: Experiences from a pandemic
hospital. Ann Clin Anal Med. 2021;12 (Supp 4):518-523. https://doi.org/10.4328/ACAM.206786. Aksel G, İslam MM, Algın A, et al. Early predictors of mortality for moderate to severely ill patients with Covid-19. Am J Emerg Med.
2021;45:290-296. https://doi.org/10.1016/j.ajem.2020.08.076.7. Seyit M, Avci E, Nar R, et al. Neutrophil to lymphocyte ratio, lymphocyte to monocyte ratio and platelet to lymphocyte ratio to predict
the severity of COVID-19. Am J Emerg Med. 2021;40:110-114. https://doi.org/10.1016/j.ajem.2020.11.0588. Avramovski P, Avramovska M, Sotiroski K, Sikole A. Acute-phase proteins as promoters of abdominal aortic calcification in chronic
dialysis patients. Saudi J Kidney Dis Transpl. 2019;30(2):376-386. https://doi.org/10.4103/1319-2442.256845.9. Hanley JA, McNeil BJ. The meaning and use of the area under a receiver operating characteristic (ROC) curve. Radiology.
1982;143(1):29-36. https://doi.org/10.1148/radiology.143.1.7063747. 10. Hanley JA, McNeil BJ. A method of comparing the areas under receiver operating characteristic curves derived from the same cases.
Radiology. 1983;148(3):839-43. https://doi.org/10.1148/radiology.148.3.6878708. 11. Deeks JJ. Systematic reviews of evaluations of diagnostic and screening tests. Egger M Davey Smith G Altman DG eds. Systematic
reviews in health care: meta-analysis in context. Systematic reviews, 2nd ed 2001:248-282 BMJ Books London.12. Price CP, Newall RG, Boyd JC. Use of protein: creatinine ratio measurements on random urine samples for prediction of significant
proteinuria: a systematic review. Clin Chem. 2005;51(9):1577-86. https://doi.org/10.1373/clinchem.2005.049742.13. Fischer JE, Bachmann LM, Jaeschke R. A readers' guide to the interpretation of diagnostic test properties: clinical example of sepsis.
Intensive Care Med. 2003;29(7):1043-51. https://doi.org/10.1007/s00134-003-1761-8. 14. Özdemir S, Akça HŞ, Algın A, et al. Can C-reactive protein-to-albumin ratio be a predictor of short-term mortality in community-
acquired pneumonia? Ann Clin Anal Med. 2021;12(9):1043-1048. https://doi.org/ 10.4328/ACAM.20576.15. Acet H, Güzel T, Aslan B, et al. Predictive Value of C-Reactive Protein to Albumin Ratio in ST-Segment Elevation Myocardial
Infarction Patients Treated with Primary Percutaneous Coronary Intervention. Angiology. 2021;72(3):244-251. https://doi.org/10.1177/0003319720963697.
16. Karakoyun I, Colak A, Turken M, et al. Diagnostic utility of C-reactive protein to albumin ratio as an early warning sign in hospitalized severe COVID-19 patients. Int Immunopharmacol. 2021;91:107285. https://doi.org/10.1016/j.intimp.2020.107285.
17. Güney BÇ, Taştan YÖ, Doğantekin B, et al. Predictive Value of CAR for In-Hospital Mortality in Patients with COVID-19 Pneumonia: A Retrospective Cohort Study. Arch Med Res. 2021;52(5):554-560. https://doi.org/10.1016/j.arcmed.2021.02.006.
18. El-Shabrawy M, Alsadik M, El-Shafei M, et al. Interleukin-6 and C-reactive protein/albumin ratio as predictors of COVID-19 severity and mortality. The Egyptian Journal of Bronchology. 2021;15(1). https://doi.org/10.1186/s43168-021-00054-1
19. Paliogiannis P, Zinellu A, Scano V, et al. Laboratory test alterations in patients with COVID-19 and non-COVID-19 interstitial pneumonia: a preliminary report. J Infect Dev Ctries. 2020;14(7):685-690. https://doi.org/10.3855/jidc.12879.
plausible explanation for this may be the decrease in albumin due to reasons such as prolonged hospitalization and malnutrition [17]. Therefore, the initial albumin value in the denominator may not have made a clinically significant contribution to the predictive ability of CRP.
LimitationsThe main limitation of our study was its retrospective
nature. Secondly, we were not able to include patients with COVID-19 who had not been tested for CRP and albumin. This was the most important factor limiting our study population. Lastly, our study had a single-center design, and therefore the results cannot be generalized to other healthcare institutions. We recommend multicenter studies in larger populations to confirm our results and increase their generalizability.
ConclusionBased on the results of our study, CAR is a useful in
predicting 30-day mortality in patients with COVID-19. Calculating CAR rather than CRP had no clinically significant contribution to the prediction of 30-day mortality in this patient group.
Disclosures: There is no conflict of interest for all authors.
Acknowledgements: None.
Funding: None.

40Journal of Clinical Medicine of Kazakhstan: 2021 Volume 18, Issue 6
Original Article DOI: https://doi.org/10.23950/jcmk/11325
JOURNAL OF CLINICAL MEDICINE OF KAZAKHSTAN (E-ISSN 2313-1519)
AbstractAim: Aortic dissection is a cardiovascular disease with low incidence
but high mortality. The aim of our study is to evaluate the demographic, vascular pathologic and radio-anatomic features of aortic dissection and find out the relationship of these with aortic dissection.
Material and methods: One female and 12 male patients admitted to the hospital with severe chest pain and diagnosed with aortic dissection by Computed Tomography were included in this study. Patients were divided into three groups according to the De Bakey classification. Type I: starting from the ascending aorta and ending in the thoracic aorta, Type II: starting from the ascending aorta and ending in the brachiocephalic artery, Type III: starting from the subclavian artery and ending at the level of the diaphragm and abdomen.
Results: The highest aortic dissection incidence was found in group Type III with 54%. The ages of patients with aortic dissection were 56.67±12.50, 61.00±11.53 and 52.00±12.26, respectively according to the groups. According to the Pearson Correlation test, significant correlations were found between ascending aorta and age and aortic arch, between cardiothoracic ratio and heart width, and between thoracic width and thoracic aorta (p≤0.05). One Way Anova test was used for the analysis between dissection groups and significant correlation was found between Type II and Type III groups of ascending aorta parameter (p≤0.05). In addition, it was found that 54% of the patients had mild atherosclerosis and 46% had lumen.
Conclusion: A significant relationship was found between aortic dissection and radio-anatomic parameters, demographic and vascular pathologic features.
Key words: aortic dissection, computed tomography, De Bakey classification
Received: 2021-09-29. Accepted: 2021-11-03
Relationship of vascular pathology, demographic and radio-anatomical features in aortic dissections detected by multidetector CTYusuf Secgin1, Serkan Oner2*, Zulal Oner3
1Department of Anatomy, Faculty of Medicine, Karabük University, Karabük, Turkey2Department of Radiology, Faculty of Medicine, İzmir Bakırçay University, Izmir, Turkey3Department of Anatomy, Faculty of Medicine, İzmir Bakırçay University, Izmir, Turkey
Corresponding author: Serkan OnerE-mail: [email protected] ORCID: 0000-0002-7802-880X
IntroductionAortic dissection is a vascular pathology that results
in the rupture of the intima or adventitia layer of the aorta or the separation of these layers due to bleeding [1, 2]. Although the incidence of aortic dissection is low, it is a fatal disease with a mortality rate of 1-2% per hour in untreated patients in the acute period. Therefore, correct diagnosis is very important in terms of the prognosis of the disease. It should be diagnosed carefully since its symptoms are very similar to pathologies such as pulmonary embolism and acute myocardial infarct. Its symptoms include chest pain, hypotension and syncope [3, 4]. According to studies conducted, aortic dissection is more frequent in male and old individuals with
chronic disease (arterial hypertension, dyslipidemia, atherosclerosis, aortic aneurysm, etc.) when compared with female and young individuals. However, it has also been reported in high rates in young individuals with Loeys Dietz syndrome [1-3, 5].
According to the literature, there are two common methods to classify aortic dissection. The first of these is Stanford classification, while the second one is De Bakey classification [1, 4, 6]. Stanford classification is a more limited classification than De Bakey classification [3, 4, 6]. Stanford groups aortic dissections in two types, type A dissections are seen in ascending aorta, while type B dissections are seen in the distal of subclavian artery [3]. According to De Bakey, dissections are grouped
J Clin Med Kaz 2021; 18(6):40-44

41Journal of Clinical Medicine of Kazakhstan: 2021 Volume 18, Issue 6
in three types. Type I starts from ascending aorta and ends at thoracic aorta. Type II starts from ascending aorta and ends at brachiocephalic artery. Type III starts from subclavian artery and ends on diaphragm (IIIa) or in abdomen (IIIb) [3, 6-8]. In addition, depending on the bleeding between the aortic layers, the layers may separate from each other and a lumen structure may occur. The lumen structure is also grouped in two as true lumen and false lumen. If the lumen in the dissected part of the aorta continues in the undissected part, this is called true lumen, if it does not, it is called false lumen [9, 10].
Magnetic Resonance Imaging (MRI), Contrast Computed Tomography (CT), Chest X-ray and Transesophageal Echocardiography (TEE), Ultrasonography (US) are used for the diagnosis and typing of aortic dissections [1, 3, 5]. CT is a cheap, accessible method that does not require specialized personnel, with high sensitivity and specificity, and three-dimensional imaging [1, 3]. Early treatment of aortic dissections is very important and there are different treatment methods such as medical treatment, open thoracic surgery, thoracic endovascular aorta repair (TEVAR) treatment [3, 5-8, 11].
The aim of our study is to examine aortic dissections according to the most detailed De Bakey classification in the literature. Thus, demographic, pathological and radio-anatomical changes of aortic dissections detected on CT images were examined.
Material and methodsStudy Population
The study was initiated with the 2021/616 numbered decision of Non-interventional Clinical Researches Ethics Committee. The patients who had thoracoabdominal CT angiography between 2015 and 2021 were scanned in Karabük University Training and Research Hospital Radiology archive. A total of 13 patients (12M, 1F) with aortic dissection were found. The patients had presented with chest pain and hypotension symptoms.
MDCT Scanning Protocol and Image Analysis
All CT scans were performed by using a 16-row Multidetector CT scanner (Aquilion 16; Toshiba Medical Systems, Otawara, Japan). Scanning parameters were tube voltage: 120 kV, gantry rotation: 0.75 s, pitch: 1.0 mm and section thickness: 1 mm.
The images in Digital Imaging and Communications in Medicine (DICOM) format were transferred to personal workstation Horos Medical Image Viewer (Version 3.0, USA) program. All images were examined in axial, coronal and sagittal planes by a radiologist with at least 10 years of experience in the field and aortic dissection types, aortic lumen and atherosclerosis presence (mild-severe) were noted (Figure 1). The patients were grouped in three according to De Bakey classification. True and false lumen were distinguished radiologically and the veins emerging from the false lumen were determined (Figure 2). The following radio-anatomic measurements were made for all patients by using the measurement tool in the program:
• Ascending aorta diameter• Aortic arch diameter• Thoracic aorta diameter• Abdominal aorta diameter• Heart width• Thoracic width• Cardiothoracic ratio
Statistical AnalysisMinitab 17 and IBM SPSS Version 21 package programs
were used in statistical analyses. Median, minimum and maximum values were included in descriptive statistics. Kolmogorov Smirnov test was used to test whether the parameters were distributed normally. The relationship between parameters and the degree of relationship was tested with Pearson Correlation test. One Way Anova test (Post Hoc; Tukey, Dunnett T3) was used for the analysis of parameters according to aortic dissection types and Levene test was used to determine whether they were distributed homogeneously.
Results12 (92%) of the 13 patients with aortic dissection were
male. Mean age of the male patients was 54.00±11.49, while the female patient was 69 years old.
According to De Bakey classification, it was found that 3 patients were Type I, 3 patients were Type II and 7 patients were Type III (Figure 3).
Mean ages of the individuals by types were found as 56.67±12.50, 61.00±11.53 and 52.00±12.26, respectively. Mean age was found to be higher in Type II aortic dissection when compared with other dissection types (Figure 4).
The determined measurement parameters were grouped in types and median, minimum and maximum values were included in the descriptive statistics of each parameter. The highest median value of aortic arch and thoracic aorta diameter was found in Type I; the highest median value of age ascending
Figure 1 - Dissection types according to De Bakey classification (a: Type I, b: Type II, c: Type III).
Figure 2 - Lumen formation demonstration (1: False lumen at right renal artery, 2: Both true and false lumen at right common iliac artery, 3: Both true and false lumen at brachiocephalic artery, right common carotid artery and left subclavian artery).

42Journal of Clinical Medicine of Kazakhstan: 2021 Volume 18, Issue 6
aorta diameter and cardiothoracic ratio was found in Type II and the highest median value of heart width and thoracic width was found in Type III. The highest median value of abdominal aorta was found in both Type I and Type III (Table 1).
Table 1 Table of descriptive statistics for parameters
Parameters Types Median Minimum MaximumAge (Year) Type I 57.00 44.00 69.00
Type II 62.00 49.00 72.00Type III 56.00 29.00 65.00
Ascending Aorta Diameter (mm)
Type I 51.00 40.00 65.00Type II 61.00 45.00 65.00Type III 44.00 30.00 55.00
Aortic Arch Diameter (mm)
Type I 40.00 31.00 53.00Type II 36.00 34.00 50.00Type III 31.00 25.00 43.00
Thoracic Aorta Diameter (mm)
Type I 44.00 29.00 51.00Type II 27.00 24.00 28.00Type III 39.00 33.00 74.00
Abdominal Aorta Diameter (mm)
Type I 28.00 23.00 50.00Type II 24.00 20.00 25.00Type III 28.00 21.00 58.00
Heart Width (mm) Type I 131.00 130.00 152.00Type II 130.00 129.00 147.00Type III 148.00 213.00 164.00
Thoracic Width (mm) Type I 258.00 249.00 291.00
Type II 240.00 236.00 269.00Type III 269.00 250.00 287.00
Cardiothoracic Ratio Type I 0.520 0.500 0.520Type II 0.540 0.530 0.550Type III 0.510 0.420 0.650
Figure 3 - Distribution of patients by aortic dissection types
Figure 4 - Patient age distribution by aortic dissection types
Figure 5 - Distribution of patients in terms of atherosclerosis
Figure 6 - Distribution of patients in terms of false lumen
It was found that all parameters except abdominal aorta were normally distributed (p≤0.05). Positive and significant high correlation was found between ascending aorta diameter and age, positive and significant moderate correlation was found between aortic arch diameter and ascending aorta diameter, positive and significant moderate correlation was found between thoracic width and aorta thoracic diameter and positive and
significant high correlation was found between cardiothoracic ratio and heart width (p≤0.05). No significant correlation was found between the other parameters (p≥0.05), (Table 2).
Table 2 Pearson correlation matrix table
Parameters
Age
Asce
ndin
g Ao
rta
Diam
eter
Aort
ic A
rch
Diam
eter
Thor
acic
Aor
ta
Diam
eter
Hea
rt W
idth
Thor
acic
Wid
th
Ascending Aorta Diameter
0.7620.002
Aortic Arch Diameter
0.4610.113
0.6980.008
Thoracic Aorta Diameter
-0.1990.514
-0.1660.588
0.0690.824
Heart Width 0.1920.530
0.2440.421
0.2520.405
0.4090.165
Thoracic Width -0.3850.194
-0.3810.199
0.0080.978
0.6700.012
0.3190.289
Cardiothoracic Ratio
0.4310.141
0.4780.098
0.2460.417
-0.0000.999
0.8120.001
-0.2910.334
According to Levene test, it was found that all parameters except cardiothoracic ratio and thoracic aorta diameter showed a homogenous distribution. According to One Way Anova (Post Hoc; Dunnett T3) test, significant correlation was found between the Type II and Type III groups of thoracic aorta diameter (p≤0.05).
Individual’s atherosclerosis and lumen status were also evaluated in our study. In terms of atherosclerosis, while 7 (54%) of the 13 individuals were found to have mild atherosclerosis, there were no patients with severe atherosclerosis symptoms (46%) (Figure 5).
In terms of lumen, the presence of lumen was found in 6 of 13 individuals. In 6 of the patients, main veins coming out of the aorta were coming out of the false lumen. The presence of lumen was found in two veins of 1 of these patients, in three veins of 4 patients and in four veins of 1 patient (Figure 6).

43Journal of Clinical Medicine of Kazakhstan: 2021 Volume 18, Issue 6
DiscussionThe hypothesis of our study was based on finding out the
radio-anatomic, pathological and demographic changes of aortic dissection and to show the relationships between these changes. According to De Bakey classification, the highest aortic dissection ratio was found in Type III in the study population. As a result of the analysis of aortic parameters, positive and significant moderate correlation was found between aortic arch diameter and ascending aorta diameter and between thoracic width and thoracic aorta diameter (p≤0.05). As a result of the analysis of aortic dissection types in terms of parameters, significant correlation was found between Type II and Type III groups of thoracic aorta diameter (p≤0.05). In addition, mild atherosclerosis was found in 7 of the patients, while false lumen was found in 6.
Aortic dissection is a catastrophic disease with low incidence but high mortality [1]. The incidence of the disease is significantly increased in men who are over 40 years of age and who have a history of hypertension. The reasons for this significant age-related increase are degeneration of elastin and smooth muscle cells, which are the natural consequences of aging and the physiological 0.7-0.9 mm increase rate that occurs in aortic diameter every 10 years [1, 12-14]. In parallel with the literature, 12 of 13 patients were male and only 1 was female in this study, the mean age of male patients was found as 54.00±11.49, while the age of the female patient was 69.
Patients with aortic dissection mostly refer to the hospital with severe chest pain symptom. Since this symptom is also seen in many cardiovascular diseases, differential diagnosis is very important [3, 4]. Various radiological imaging devices (Chest X-ray, TEE, contrast CT, MRI, US) are used for differential diagnosis. These imaging technologies have their advantages and disadvantages. Although MRI has a specificity and sensitivity up to 98%, it also has many disadvantages since it cannot be used in the presence of metal implants such as cardiac pacemaker and since it is not widely used. Chest X-ray is a fast, common imaging technology with low sensitivity and specificity [3]. TEE is a fast method; however, it does not allow imaging of the whole aorta [3, 14]. On the other hand, contrast CT stands out as a fast method which has 98-100% sensitivity and specificity and which allows for imaging of the whole aorta. However, this method has a disadvantage of administration of contrast material [3, 14, 15]. We conducted this retrospective study with the contrast CT images we received from hospital archive system.
In their study they conducted on 108 patients with Type A aortic dissection, Gode et al. [16] found ascending aorta diameter as 52±2.4 mm and they stated that 67% of the patients with dissection were male patients. In their study they conducted
on 166 individuals with Type A aortic dissection, Kruger et al. [17] found the median value of ascending aorta diameter as 50 mm and they reported that 66% of the patients with dissection were male patients. In another study they conducted on Type A aortic dissection, Kruger et al. [12] found that 68% of 130 patients were male and the median value of the age of patients with dissection was 65 years. In a study they conducted with 225 patients with Type A aortic dissection between 2009 and 2017, Koechlin et al. [18] reported that 68% of the patients with dissection were male and the mean age of all patients was 63±12 years. In their study, they found ascending aorta diameter as 46±8 mm. In a study they conducted on 349 patients with aortic dissection in China population, Wu et al. [19] found the aorta diameter of 114 patients larger than 55 mm and reported that 82% of the patients were male. In our study, with De Bakey classification, which is a more detailed classification, we found the median values of ascending aorta diameter as 51, 61, 44 mm, respectively. We found that 92% of the patients in our study were male and median values of age were 57, 62, 56 years, respectively The information on ascending aorta diameter and demographic age support the literature. We believe that the reason for high percentage of male patients is due to the low population of our region and therefore low incidence of aortic dissection when compared with other studies. We think that the other reasons of this low incidence may be geographical differences, nutritional habits and stressors. The small number of cases in our study when compared with other studies in literature is a limitation of our study.
In their study they conducted on patients with aortic dissection, Barbetseas et al. [20] grouped the patients in two according to Stanford classification and found atherosclerosis pathology in 94% of Type A group and 67% of Type B group. In our study, mild atherosclerosis was found in 54% of 13 individuals with dissection. This suggests that there may be relationship between atherosclerosis and aortic dissections.
We believe that this retrospective study will contribute to early diagnosis and treatment of aortic dissections since it determines the demographic, pathological and radio-anatomical changes of aortic dissections. As a result of our study, significant correlations were found between aortic dissection and radio-anatomical, pathological and demographic findings.
Disclosures: There is no conflict of interest for all authors.
Acknowledgements: None.
Funding: None.
References 1. Finkelmeier BA, Marolda D. Aortic dissection. J Cardiovasc Nurs. 2001;15(4):15-24. https://doi.org/10.1097/00005082-200107000-
000032. Deplano V, Boufi M, Gariboldi V, Loundou AD, D'Journo XB, Cautela J, et al. Mechanical characterisation of human ascending aorta
dissection. J Biomech. 2019;94:138-46. https://doi.org/10.1016/j.jbiomech.2019.07.0283. Gawinecka J, Schonrath F, von Eckardstein A. Acute aortic dissection: pathogenesis, risk factors and diagnosis. Swiss Med Wkly.
2017;147:w14489. https://doi.org/10.4414/smw.2017.144894. Criado FJ. Aortic dissection: a 250-year perspective. Tex Heart Inst J. 2011;38(6):694-700. PMID: 221994395. Tchana-Sato V, Sakalihasan N, Defraigne JO. [Aortic dissection]. Rev Med Liege. 2018;73(5-6):290-5. PMID: 299265686. Hughes GC. Management of acute type B aortic dissection; ADSORB trial. The Journal of thoracic and cardiovascular surgery.
2015;149(2):S158-S62. https://doi.org/10.1016/j.jtcvs.2014.08.0837. Elsayed RS, Cohen RG, Fleischman F, Bowdish ME. Acute type A aortic dissection. Cardiology clinics. 2017;35(3):331-45. https://doi.
org/10.1016/j.ccl.2017.03.004

44Journal of Clinical Medicine of Kazakhstan: 2021 Volume 18, Issue 6
8. Davy H, Gates M. A case of dissecting aneurysm of the aorta. British medical journal. 1922;1(3195):471. https://doi.org/10.1136/bmj.1.3195.471
9. LePage MA, Quint LE, Sonnad SS, Deeb GM, Williams DM. Aortic dissection: CT features that distinguish true lumen from false lumen. American Journal of Roentgenology. 2001;177(1):207-11. https://doi.org/10.2214/ajr.177.1.1770207
10. McMahon MA, Squirrell CA. Multidetector CT of aortic dissection: a pictorial review. Radiographics. 2010;30(2):445-60. https://doi.org/10.1148/rg.302095104
11. Maunoir JP. Mémoires physiologiques et pratiques sur l'anévrisme et la ligature des artères: Paschoud; 1802.12. Kruger T, Forkavets O, Veseli K, Lausberg H, Vohringer L, Schneider W, et al. Ascending aortic elongation and the risk of dissection.
Eur J Cardiothorac Surg. 2016;50(2):241-7. https://doi.org/10.1093/ejcts/ezw02513. Schwartz SI, Durham C, Clouse WD, Patel VI, Lancaster RT, Cambria RP, et al. Predictors of late aortic intervention in patients with
medically treated type B aortic dissection. J Vasc Surg. 2018;67(1):78-84. https://doi.org/10.1016/j.jvs.2017.05.12814. Hines G, Dracea C, Katz DS. Diagnosis and management of acute type A aortic dissection. Cardiol Rev. 2011;19(5):226-32. https://doi.
org/10.1097/CRD.0b013e3182203ed915. Heuts S, Adriaans BP, Rylski B, Mihl C, Bekkers S, Olsthoorn JR, et al. Evaluating the diagnostic accuracy of maximal aortic diameter,
length and volume for prediction of aortic dissection. Heart. 2020;106(12):892-7. https://doi.org/10.1136/heartjnl-2019-31625116. Gode S, Akinci O, Ustunisik CT, Sen O, Kadirogullari E, Aksu T, et al. The role of the angle of the ascending aortic curvature on the
development of type A aortic dissection: ascending aortic angulation and dissection. Interact Cardiovasc Thorac Surg. 2019;29(4):615-20. https://doi.org/10.1093/icvts/ivz144
17. Kruger T, Sandoval Boburg R, Lescan M, Oikonomou A, Schneider W, Vohringer L, et al. Aortic elongation in aortic aneurysm and dissection: the Tubingen Aortic Pathoanatomy (TAIPAN) project. Eur J Cardiothorac Surg. 2018;54(1):26-33. https://doi.org/10.1093/ejcts/ezx503
18. Koechlin L, Macius E, Kaufmann J, Gahl B, Reuthebuch O, Eckstein F, et al. Aortic root and ascending aorta dimensions in acute aortic dissection. Perfusion. 2020;35(2):131-7. https://doi.org/10.1177/0267659119858848
19. Wu JL, Zhang L, Qiu JT, Yu CT. Morphological features of the thoracic aorta and supra-aortic branches in patients with acute Type A aortic dissection in China. Interact Cardiovasc Thorac Surg. 2018;27(4):555-60. https://doi.org/10.1093/icvts/ivy110
20. Barbetseas J, Alexopoulos N, Brili S, Aggeli C, Chrysohoou C, Frogoudaki A, et al. Atherosclerosis of the aorta in patients with acute thoracic aortic dissection. Circ J. 2008;72(11):1773-6. https://doi.org/10.1253/circj.CJ-08-0433

45Journal of Clinical Medicine of Kazakhstan: 2021 Volume 18, Issue 6
Original Article DOI: https://doi.org/10.23950/jcmk/11326
JOURNAL OF CLINICAL MEDICINE OF KAZAKHSTAN (E-ISSN 2313-1519)
AbstractIntroduction: This study sought to compare patients with ST-segment
elevation myocardial infarction and non-ST-segment elevation myocardial infarction in terms of the monocyte-to-HDL cholesterol ratio.
Material and methods: A total of 79 patients with non-ST-segment elevation myocardial infarction and 30 patients with 30 ST-segment elevation myocardial infarction were included in the study. Demographics, comorbidities, smoking status, medical history, and initial laboratory findings were retrospectively noted from the hospital computer-based patient data system.
Results: Significant differences were detected between the ST-segment elevation myocardial infarction and non-ST-segment elevation myocardial infarction groups in relation to the neutrophil count [7.27 (6.05-9.05) versus 5.41 (4.26-7.21), p<0.001] and mean platelet volume [9.4 (8.8-10) versus 8.6 (7.3-9.5), p=0.002]. There was no statistically significant difference between the two groups in the term of the monocyte-to-HDL cholesterol ratio [0.016 (0.012-0.021) versus 0.016 (0.011-0.024), p=0.757, Bonferroni-corrected p value: 0.0033)].
Conclusion: Based on the results of our study, the monocyte-to-HDL cholesterol ratio did not significantly differ between the patients with ST-segment elevation myocardial infarction and those with non-ST-segment elevation myocardial infarction.
Key words: atherosclerosis, coronary artery disease, high-density lipoprotein cholesterol, monocyte count
Received: 2021-08-08. Accepted: 2021-10-26
Comparison of the monocyte-to-HDL cholesterol ratio between patients with STEMI and NSTEMI: A retrospective observational studyAbdullah Algın1,2, Serdar Özdemir1
1University of Health Sciences Turkey, Ümraniye Training and Research Hospital, Clinic of Emergency Medicine, İstanbul, Turkey2University of Health Sciences Turkey, Somalia Mogadishu Recep Tayyip Erdogan Faculty of Health Sciences, Mogadishu, Somalia
Corresponding author: Serdar Özdemir. E-mail: [email protected]; ORCID: 0000-0002-6186-6110
IntroductionAcross the world, acute coronary syndrome (ACS)
is one of the most important causes of mortality and morbidity [1]. It is a clinical syndrome that includes unstable angina pectoris (USAP), ST-segment elevation myocardial infarction (STEMI), and non-ST-segment elevation myocardial infarction (NSTEMI) [1]. Along with the developing technologies in diagnostic and treatment modalities and the increase in survival in patients with acute coronary syndrome, the importance of the early diagnosis of diseases and modification of risk factors has increased [2]. Researchers have studied many biochemical markers, such as hematological
parameters, D-lactate, intestinal fatty acid-binding protein, and ischemia-modified albumin and scoring systems, including GRACE, SYNTAX, and Gensini scores in the diagnosis and risk scoring of patients [1-5]. Moreover, emerging biochemical markers provide better complementary information in risk assessment, although there is still a need to better recognize the pathophysiology of ACS and develop a specific treatment [6]. Recently, researchers have reported that the combination of monocyte count, which represents the pro-inflammatory effect of the monocytes, and high-density lipoprotein (HDL) cholesterol, which represents antioxidant and anti-inflammatory effects, can be used as a biomarker in
J Clin Med Kaz 2021; 18(6):45-49

46Journal of Clinical Medicine of Kazakhstan: 2021 Volume 18, Issue 6
ACS [7-11]. According to the literature, the value obtained by dividing the monocyte count by HDL cholesterol will have an increased predictive ability in patients with ACS [12].
When a thrombus that develops due to the rupture of a plaque causes total occlusion in the coronary artery, ST elevations are observed in the electrocardiogram, and all or almost all the affected ventricular wall remains within the necrosis area. This condition is referred to as transmural myocardial infarction or STEMI. In cases where the thrombus is less occlusive or there is less fibrin structure in the thrombus and platelets predominate, clinical USAP or NSTEMI develops [3,4,6]. Based on these different pathogeneses, we speculated that the monocyte-to-HDL cholesterol ratio (MHR) might differ between STEMI and NSTEMI cases. Therefore, in this study, we sought to compare patients with STEMI and NSTEMI in terms of MHR.
Material and methodsStudy design
This retrospective cohort study was conducted at a 695-bed tertiary teaching hospital with 1,050 patient admissions per day (annual average) to the emergency department (ED). The data of the patients who presented to our ED between November 1, 2018 and May 1, 2019 were retrospectively collected.
Study populationThe study population consisted of patients presenting
to our ED between April 1, 2020 and May 1, 2020 with ACS. Patients with USAP, cases in which ACS could not be confirmed with percutaneous coronary intervention, and patients with missing data were excluded from the sample. The flowchart of the study is shown in Figure 1. All the patients were admitted to the wards of our hospital.
Figure 1 - Flowchart of the study
Data collectionDemographics, clinical characteristics (included
comorbidities, smoking status, and medical history), and initial laboratory findings were obtained from the computer-based patient data system of the hospital and analyzed by the researchers. Comorbidities were recorded as chronic obstructive pulmonary diseases, hyperlipidemia, coronary artery disease, diabetes mellitus, hypertension, and congestive heart failure. Family history of coronary artery disease was noted. The documented laboratory parameters were total cholesterol, triglycerides, HDL cholesterol, low-density lipoprotein (LDL) cholesterol, monocyte count, monocyte %, white blood cell count, neutrophil count, lymphocyte count, platelet count, red
blood cell distribution width, and mean platelet volume. The neutrophil-to-lymphocyte ratio, mean platelet volume-to-platelet ratio, and MHR were calculated by the researchers (S. Ö., A. A.). MHR was calculated by dividing the monocyte count by the HDL cholesterol value. The patients were categorized into the STEMI and NSTEMI groups based on their electrocardiogram findings according to the guidelines of the American Heart Association.
HDL cholesterol was measured using the ARCHITECT ci16200 autoanalyzer with the ARCHITECT HDL Kit (Catalog number 3K33-21). Hematological parameters were analyzed with a hemogram device (Beckman Coulter Co.®LH 780 Analyzer, Krefeld, Germany).
Statistical analysisWe used IBM SPSS Statistics for Mac (NY, IBM Corp,
version 27.0.) Armonk to perform statistical analyses. To evaluate the conformance of variables to the normal distribution, the Kolmogorov-Smirnov test was conducted. The data that were normally distributed were presented with mean and standard deviation values, and the remaining data were expressed as median and 25th-75th percentile values. Categorical data were presented with the number of cases and percentages. For the comparison of qualitative and quantitative data between the two groups, the chi-square and Mann-Whitney U tests were used. A p value of 0.05 was considered as the cut-off value of statistical significance. To respond to the problem of multiple comparisons, the Bonferroni correction was used.
EthicsEthical approval was received from the local ethical
committee. We retrospectively reviewed secondary data recorded from the computer-based patient data system of the hospital. The recorded information did not include any personal identifiable information, and it only contained clinical information. Therefore, informed consent was waived.
ResultsPatient characteristics
Of the 109 patients included in the study for the final analysis, 72 (61.1%) were male. The median of age of the 109 patients was 59 (25th-75th percentile: 50-73) years. Ten (9.2%) patients had chronic obstructive pulmonary disease, 43 (39.4%) had hypertension, 43 (39.4%) had diabetes mellitus, 17 (15.6%) had coronary artery disease, and 10 (9.2%) had hyperlipidemia. Fifteen (13.8%) patients had a history of smoking and 19 (17.4%) had a family history of coronary artery disease. The comparisons of the characteristics between the STEMI and NSTEMI groups are shown in Table 1.
Laboratory values and outcomesWhen the laboratory parameters were analyzed, the
median (25th-75th percentile) values were 197 (158-223) mg/dL for total cholesterol, 144 (101-195) mg/dL for triglycerides, 36 (32-42) mg/dL for HDL cholesterol, 131 (98-150) mg/dL for LDL cholesterol, 0.61 (0.46-0.88) for the monocyte count, 6 (4.9-8) for monocyte %, 10.14 (8.36-12.23) for the white blood cell count, 5.92 (4.63-7.92) for neutrophil count, 2.48 (1.88-3.65) for the lymphocyte count, 253 (220-299) for the platelet count, 13.1 (12.4-13.9) for red blood cell distribution width, and 8.8 (8.2-9.7) for the mean platelet volume. The median (25th-75th percentile) values calculated for the neutrophil-to-lymphocyte ratio, mean platelet volume-to-platelet ratio,
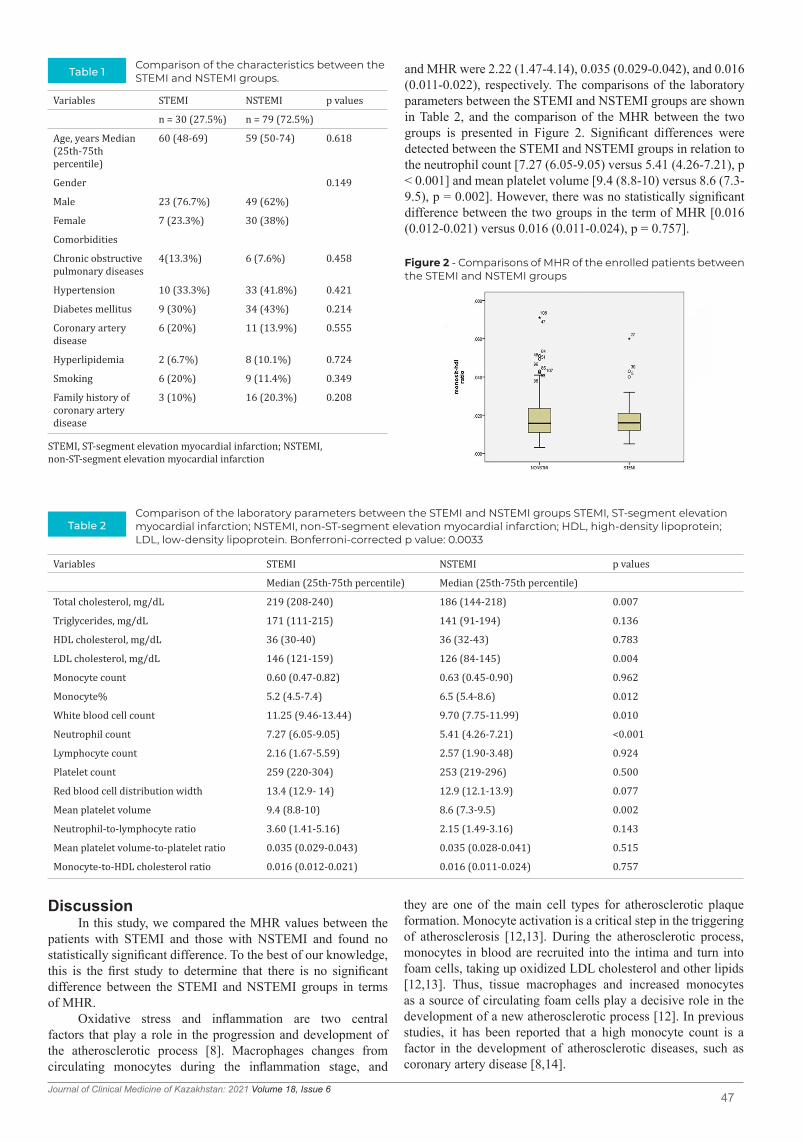
47Journal of Clinical Medicine of Kazakhstan: 2021 Volume 18, Issue 6
Figure 2 - Comparisons of MHR of the enrolled patients between the STEMI and NSTEMI groups
and MHR were 2.22 (1.47-4.14), 0.035 (0.029-0.042), and 0.016 (0.011-0.022), respectively. The comparisons of the laboratory parameters between the STEMI and NSTEMI groups are shown in Table 2, and the comparison of the MHR between the two groups is presented in Figure 2. Significant differences were detected between the STEMI and NSTEMI groups in relation to the neutrophil count [7.27 (6.05-9.05) versus 5.41 (4.26-7.21), p < 0.001] and mean platelet volume [9.4 (8.8-10) versus 8.6 (7.3-9.5), p = 0.002]. However, there was no statistically significant difference between the two groups in the term of MHR [0.016 (0.012-0.021) versus 0.016 (0.011-0.024), p = 0.757].
Table 1Comparison of the characteristics between the STEMI and NSTEMI groups.
STEMI, ST-segment elevation myocardial infarction; NSTEMI, non-ST-segment elevation myocardial infarction
Variables STEMI NSTEMI p values
n = 30 (27.5%) n = 79 (72.5%)
Age, years Median (25th-75th percentile)
60 (48-69) 59 (50-74) 0.618
Gender 0.149
Male 23 (76.7%) 49 (62%)
Female 7 (23.3%) 30 (38%)
Comorbidities
Chronic obstructive pulmonary diseases
4(13.3%) 6 (7.6%) 0.458
Hypertension 10 (33.3%) 33 (41.8%) 0.421
Diabetes mellitus 9 (30%) 34 (43%) 0.214
Coronary artery disease
6 (20%) 11 (13.9%) 0.555
Hyperlipidemia 2 (6.7%) 8 (10.1%) 0.724
Smoking 6 (20%) 9 (11.4%) 0.349
Family history of coronary artery disease
3 (10%) 16 (20.3%) 0.208
Table 2Comparison of the laboratory parameters between the STEMI and NSTEMI groups STEMI, ST-segment elevation myocardial infarction; NSTEMI, non-ST-segment elevation myocardial infarction; HDL, high-density lipoprotein; LDL, low-density lipoprotein. Bonferroni-corrected p value: 0.0033
Variables STEMI NSTEMI p values
Median (25th-75th percentile) Median (25th-75th percentile)
Total cholesterol, mg/dL 219 (208-240) 186 (144-218) 0.007
Triglycerides, mg/dL 171 (111-215) 141 (91-194) 0.136
HDL cholesterol, mg/dL 36 (30-40) 36 (32-43) 0.783
LDL cholesterol, mg/dL 146 (121-159) 126 (84-145) 0.004
Monocyte count 0.60 (0.47-0.82) 0.63 (0.45-0.90) 0.962
Monocyte% 5.2 (4.5-7.4) 6.5 (5.4-8.6) 0.012
White blood cell count 11.25 (9.46-13.44) 9.70 (7.75-11.99) 0.010
Neutrophil count 7.27 (6.05-9.05) 5.41 (4.26-7.21) <0.001
Lymphocyte count 2.16 (1.67-5.59) 2.57 (1.90-3.48) 0.924
Platelet count 259 (220-304) 253 (219-296) 0.500
Red blood cell distribution width 13.4 (12.9- 14) 12.9 (12.1-13.9) 0.077
Mean platelet volume 9.4 (8.8-10) 8.6 (7.3-9.5) 0.002
Neutrophil-to-lymphocyte ratio 3.60 (1.41-5.16) 2.15 (1.49-3.16) 0.143
Mean platelet volume-to-platelet ratio 0.035 (0.029-0.043) 0.035 (0.028-0.041) 0.515
Monocyte-to-HDL cholesterol ratio 0.016 (0.012-0.021) 0.016 (0.011-0.024) 0.757
DiscussionIn this study, we compared the MHR values between the
patients with STEMI and those with NSTEMI and found no statistically significant difference. To the best of our knowledge, this is the first study to determine that there is no significant difference between the STEMI and NSTEMI groups in terms of MHR.
Oxidative stress and inflammation are two central factors that play a role in the progression and development of the atherosclerotic process [8]. Macrophages changes from circulating monocytes during the inflammation stage, and
they are one of the main cell types for atherosclerotic plaque formation. Monocyte activation is a critical step in the triggering of atherosclerosis [12,13]. During the atherosclerotic process, monocytes in blood are recruited into the intima and turn into foam cells, taking up oxidized LDL cholesterol and other lipids [12,13]. Thus, tissue macrophages and increased monocytes as a source of circulating foam cells play a decisive role in the development of a new atherosclerotic process [12]. In previous studies, it has been reported that a high monocyte count is a factor in the development of atherosclerotic diseases, such as coronary artery disease [8,14].

48Journal of Clinical Medicine of Kazakhstan: 2021 Volume 18, Issue 6
References 1. Kumar A, Cannon CP. Acute coronary syndromes: diagnosis and management, part I. Mayo Clin Proc. 2009;84(10):917-938.
doi:10.1016/S0025-6196(11)60509-02. Lindahl B. Acute coronary syndrome - the present and future role of biomarkers. Clin Chem Lab Med. 2013;51(9):1699-706. doi:
10.1515/cclm-2013-0074. PMID: 23525876.3. Akça HŞ, Algın A, Özdemir S, Altunok İ, Acar Kurtuluş S, Eroğlu SE. Effect of Baseline RDW and Troponin Levels on Prognosis in
Patients with Acute Chest Pain. Signa Vitae. 2020;16(2):97-103. 4. Özkan A, Sönmez E, Özdemir S, Özer ÖF, Muharrem N, Gülen B, Keskin M. The Diagnostic Value of SCUBE1 in Unstable Angina
Pectoris Patients. Eurasian J Emerg Med. 2016;15:167-171. 5. Algın A, Akça HŞ, Özdemir S, Afacan MA, Eroğlu SE. Analysis of Relationship Between Imaging Features of Aortic Dissection and
Blood Parameters. Med Bull Haseki. 2020;58:193-9.6. Salvagno GL, Pavan C. Prognostic biomarkers in acute coronary syndrome. Ann Transl Med. 2016;4(13):258. doi:10.21037/
atm.2016.06.367. Cetin MS, Ozcan Cetin EH, Kalender E, et al. Monocyte to HDL Cholesterol Ratio Predicts Coronary Artery Disease Severity and
Future Major Cardiovascular Adverse Events in Acute Coronary Syndrome. Heart Lung Circ. 2016;25(11):1077-1086. doi: 10.1016/j.hlc.2016.02.023. Epub 2016 Apr 12. PMID: 27118231.
8. Canpolat U, Çetin EH, Cetin S, et al. Association of Monocyte-to-HDL Cholesterol Ratio with Slow Coronary Flow is Linked to Systemic Inflammation. Clin Appl Thromb Hemost. 2016;22(5):476-82. doi: 10.1177/1076029615594002. Epub 2015 Jul 1. PMID: 26139836.
9. Kanbay M, Solak Y, Unal HU, et al. Monocyte count/HDL cholesterol ratio and cardiovascular events in patients with chronic kidney disease. Int Urol Nephrol. 2014;46(8):1619-25. doi: 10.1007/s11255-014-0730-1. Epub 2014 May 23. PMID: 24853998.
10. Arısoy A, Altunkaş F, Karaman K, et al. Association of the Monocyte to HDL Cholesterol Ratio with Thrombus Burden in Patients With ST-Segment Elevation Myocardial Infarction. Clin Appl Thromb Hemost. 2017;23(8):992-997. doi: 10.1177/1076029616663850. Epub 2016 Aug 16. PMID: 27534422.
11. Kızıltunç E, Alsancak Y, Sezenöz B, et al. Relationship Between Monocyte/High-Density Lipoprotein Cholesterol Ratio and Angiographic Severity and Extent of Coronary Artery Disease. Koşuyolu Heart Journal. 2017; 20(1): 30-5.
12. Lambert JM, Lopez EF, Lindsey ML. Macrophage roles following myocardial infarction. Int J Cardiol. 2008;130(2):147-158. doi:10.1016/j.ijcard.2008.04.059
HDL cholesterol is a lipoprotein that plays an important role in reverse cholesterol transport. It transfers cholesterol back to the liver from peripheral tissue [15]. This is the main mechanism through which HDL cholesterol shows antioxidant, anti-inflammatory and antithrombotic effects [15]. HDL cholesterol has been shown to protect the endothelium against the harmful effects of LDL cholesterol and prevent the oxidation of LDL cholesterol [16]. In addition, HDL cholesterol is a highly active molecule in preventing monocyte recruitment into the arterial wall and inhibiting the endothelial release of adhesion molecules (17). Previous studies have detected that a low HDL cholesterol level increases the risk of coronary artery disease and is associated with the severity of myocardial infarction [17-19].
In light of all these data, an increase in MHR, calculated by the ratio of monocytes with antioxidant, anti-inflammatory and antithrombotic effects and HDL cholesterol with anti-inflammatory effects, is associated with an increase in inflammation and acceleration in the atherosclerotic process [7-11,18]. In a study conducted with more than 2,500 patients, Çetin at al. reported that MHR could be a predictor of the severity of coronary artery disease and future major adverse cardiovascular events in patients with ACS [7]. Canpolat et al. showed that high MHR values were associated with inflammation and a slow coronary flow [8]. In a study evaluating patients with chronic kidney disease, Kanbay et al. demonstrated MHR to be an independent predictor of major cardiovascular events [9]. In a study on patients with STEMI who underwent percutaneous coronary intervention, Arısoy et al. reported that MHR was an independent predictor of a high thrombus burden in STEMI [10]. In another study including over 750 patients with STEMI who underwent percutaneous coronary intervention, Kızıltunç et al. showed a correlation between the increased coronary atherosclerotic burden and MHR [11]. In light of this information in the literature, we sought to determine whether there was a
difference in MHR between patients with STEMI and those with NSTEMI patients. According to our results, MHR did not significantly differ between these two patient groups.
LimitationsThe main limitation of our study was its retrospective
nature. There may have been other risk factors that could not be measured due to the retrospective design. Retrospective studies cannot determine causation; they only evaluate association. Secondly, there was no control group in our study. Therefore, we were not able to reveal the relationship between increased MHR and myocardial infarction as in previous studies. On the other hand, our groups were similar to evaluate differences in MHR between the patients with STEMI and NSTEMI, which was the primary outcome of our study. Lastly, our study had a single-center design, and therefore the results cannot be generalized to other healthcare institutions.
ConclusionBased on the results of our study, there was no significant
difference between the patients with STEMI and those with NSTEMI in terms of MHR. Therefore, it can be concluded that MHR is of similar importance for these two patient groups. We recommend multicenter studies in larger populations to increase the generalizability of the results and to confirm our findings.
Disclosures: There is no conflict of interest for all authors.
Acknowledgements: None.
Funding: None.

49Journal of Clinical Medicine of Kazakhstan: 2021 Volume 18, Issue 6
13. Demir A, Eren F. Akut İskemik İnmeli Hastalarda, İnmenin Ciddiyeti İle Monosit/HDL-K Arasındaki İlişki. CBU-SBED. 2020; 7(4): 443-447.
14. Choi SH, Kim JH, Lim S, Lim JY, Kim KW, Park KS, Jang HC. Monocyte count as a predictor of cardiovascular mortality in older Korean people. Age Ageing. 2017;46(3):433-438. doi: 10.1093/ageing/afw226. PMID: 27932363.
15. Mineo C, Deguchi H, Griffin JH, Shaul PW. Endothelial and antithrombotic actions of HDL. Circulation Research. 2006;98(11):1352-1364. doi: 10.1161/01.res.0000225982.01988.93. PMID: 16763172.
16. Rysz J, Gluba-Brzózka A, Rysz-Górzyńska M, Franczyk B. The Role and Function of HDL in Patients with Chronic Kidney Disease and the Risk of Cardiovascular Disease. Int J Mol Sci. 2020;21(2):601. doi: 10.3390/ijms21020601. PMID: 31963445; PMCID: PMC7014265.
17. Ganjali S, Gotto AM Jr, Ruscica M, Atkin SL, Butler AE, Banach M, Sahebkar A. Monocyte-to-HDL-cholesterol ratio as a prognostic marker in cardiovascular diseases. J Cell Physiol. 2018;233(12):9237-9246. doi: 10.1002/jcp.27028.
18. Chen H, Li M, Liu L, Dang X, Zhu D, Tian G. Monocyte/lymphocyte ratio is related to the severity of coronary artery disease and clinical outcome in patients with non-ST-elevation myocardial infarction. Medicine (Baltimore). 2019;98(26):e16267. doi:10.1097/MD.0000000000016267
19. Kalyoncuoglu M, Durmus G. Relationship between C-reactive protein-to-albumin ratio and the extent of coronary artery disease in patients with non-ST-elevated myocardial infarction. Coron Artery Dis. 2020;31(2):130-136. doi: 10.1097/MCA.0000000000000768. PMID: 31233399.

50Journal of Clinical Medicine of Kazakhstan: 2021 Volume 18, Issue 6
Original Article DOI: : https://doi.org/10.23950/jcmk/11327
JOURNAL OF CLINICAL MEDICINE OF KAZAKHSTAN (E-ISSN 2313-1519)
AbstractBackground: Patient satisfaction is accepted as a criterion in the
evaluation of nursing care, it’s important to know the factors affecting satisfaction.
Aim: The aim of this study was to determine the satisfaction of elderly patients with orthopedic surgery and factors affecting.
Material and methods: This descriptive study was conducted with 135 patients who undergoing orthopedics surgery. Data were collected using Patient identification form and Newcastle Satisfaction with Nursing Scales. Mann Whitney U, Kruskal Wallis H tests and correlation analysis were performed.
Results: The mean score of the patients on the Newcastle Satisfaction with Nursing Scale was determined to be 83.5±15.5. It was found that the mean score of the patients on the Newcastle Nursing Care Satisfaction Scale varied according to the companion support and socioeconomic status (p<0.05).
Conclusion: It was determined that elderly patients who undergoing orthopedic surgery had a good level of satisfaction with nursing care.
Key words: elderly patient, nursing care, orthopedic surgery, patient satisfaction
Received: 2021-08-05. Accepted: 2021-10-22
Satisfaction of elderly patients undergoing orthopedic surgery in terms of nursing care and affecting factors Figen Dığın1, Zeynep Kızılcık Özkan2, Gürcühan Fidan3
1Department of Surgical Nursing, Faculty of Health Sciences, Kırklareli University, Kırklareli, Turkey2Department of Surgical Nursing, Faculty of Health Sciences, Trakya University, Edirne, Turkey3Oncological Surgery Clinics, Ankara City Hospital, Ankara, Turkey
Corresponding author: Figen Dığın E-mail: [email protected]; ORCID: 0000-0003-1861-0221
IntroductionThe rate of elderly admitted to healthcare institutions
is increasing with each passing day [1]. The elderly are admitted to healthcare institutions with chronic comorbidities, which require drug use, and with cognitive and functional disorders, which increase hospitalization risks [2]. With the functional losses and traumas in musculoskeletal system that appear because of aging, more orthopedic surgeries are performed especially in the last decade [3]. Elderly patients require longer postoperative care periods because of their physiological, psychological and emotional losses [4] and their surgical stress/anesthesia tolerances are more limited [5]. Depending on age and surgery, it is already known that the postoperative self-care requirements of elderly are semi-dependent/dependent, and the recovery process takes longer [5]. Failure in meeting the requirements in a timely manner and in providing care causes prolonged hospitalization and complications [6]. For this reason, providing quality surgical care to avoid the
persistence of morbidity, improve the quality of life, and maintain the success of surgery emerges as an important requirement in this respect [5].
Nursing care and patient satisfaction remain to be an up-to-date issue [7]. Patient satisfaction is the multi-factor personal evaluation regarding the healthcare service received by individuals and their expectations of these services [8,9]. Patient satisfaction is considered as the main determinant of the quality of nursing care [10]. Patient satisfaction is considered as an important criterion in evaluating the quality of healthcare and in determining the revision needs of institutions [11].
Although it is reported in the literature that patients experience dissatisfaction because of postoperative movement limitations [12] it was welcomed by patients that their self-care needs were covered by nurses [13] they were informed during treatment and care [14]. It was also recommended to shorten the length of hospital stay to increase patient satisfaction [15]. It is important
J Clin Med Kaz 2021; 18(6):50-55

51Journal of Clinical Medicine of Kazakhstan: 2021 Volume 18, Issue 6
to evaluate patient satisfaction in identifying factors that affect it, and in producing solutions to these problems [8]. Also, increasing satisfaction in nursing ensures patient agreement [16] and continuity of care [17] improving health and accelerating recovery [18].
The purpose of the study was to determine the elderly undergoing orthopedic surgery patients' satisfaction with nursing care.
Materials and methodsThis study, which had a descriptive design, was conducted
betweThis study, which had a descriptive design, was conducted between December 2020 and February 2021 with the participation of 135 elderly patients who undergoing scheduled major surgical intervention in orthopedics and traumatology surgery clinics of a public hospital.
Patients who were aged 65 and older undergoing orthopedic surgery constituted the universe of the study, and the minimum number of people who should be included in the sampling was calculated as 135 based on 95% confidence interval, 5% error margin, and with Newcastle Satisfaction with Nursing Scales total score average: 82.6(+/-14.8) [7]. Patients who were over the age of 65, who could communicate in Turkish, who were not previously diagnosed with a psychiatric disease, who undergoing orthopedic surgery, whose discharge was planned, and who volunteered to participate in the study were included in the sampling.
Patient identification form and Newcastle Satisfaction with Nursing Scales (NSNS) were used in the study as the data collection tools.
The Patient identification form was prepared by the researchers with literature support [7,19]. There are a total of 12 questions on sociodemographic characteristics (i.e. age, gender, educational status, marital status, working status, socioeconomic level, and comorbidity) and on disease-related characteristics (i.e. surgical intervention, hospitalization type, hospitalization frequency, hospitalization time, and companion support).
The Newcastle Satisfaction with Nursing Scales (NSNS) was developed by Thomas et al. [20] in 1995 to evaluate the satisfaction regarding the nursing care in hospitals. The Turkish validity and reliability of it was conducted by Akın and Erdogan in 2007. The scale, which is in the form of 5-point likert style, consists of 19 items. After the scores of all the items of the scale are added (I am not satisfied at all=1 / I am completely satisfied=5), the score is converted into 100, and the score evaluation is made over 0-100 points. As the score of the scale increases, the level of satisfaction is high. The fact that the total score is 100 shows that the patient is satisfied with all aspects of nursing care. The Cronbach alpha value was found to be 0.95 in the Turkish version of the scale [21]. In the present study, Cronbach Alpha value was found to be 0.76.
Patients who met the inclusion criteria were informed about the study; and their informed consents were received in writing. Patients were interviewed face-to-face in patient room; and the Patient identification form and NSNS were applied.
The study data were evaluated with IBM SPSS (Statistical Package for Social Sciences) version 22.0 program. Kolmogorov Smirnov test was used in determining the agreement to normal distribution, Mann Whitney U and Kruskal Wallis H tests were used in intragroup comparisons, and Spearman Correlation Analysis was used to determine the relations between the variables. Bonferroni-corrected Mann Whitney U test was used to determine the source of the difference in a group; and p<0.05 was considered as a statistically significant limit.
Before the study was commenced, the necessary written permissions were obtained from the Scientific Research Ethics Committee of the University (2020/06/23-P0243R00), and from the institution where the study was conducted. Patients were given verbal information about the study, and written permissions were obtained from those who volunteered to participate in the study. Patients were informed that the information they provided would only be used for study purposes, and that their privacy would be protected.
ResultsIt was determined that the mean age of the patients was
76.0±8.0 (65-92), 64.4% (n=87) were male, and 47.4% (n=64) were elementary school graduates. It was found that 74.8% of the patients had at least one chronic disease, and 54.1% had prosthetic surgery. The mean score of patients in NSNS was found to be 83.5±15.5 (p<0.05). It was found that socioeconomic status and companion support affected patient satisfaction (p<0.05) (Table 1).
The top three items that had the highest mean score in the study were determined as the care regarding the privacy of patients, the awareness in their requirements, and being treated as individuals. The reasons for dissatisfaction were determined as the inability to feel as if at home, the contents of information about the disease and treatment, and the lack of eliminating the concerns of relatives adequately (Table 2).
It was found that socioeconomic status and companion support affected patient satisfaction (p<0.05). Table 3 shows the variation of patients' satisfaction on scale-item terms according to their socioeconomic status. According to results of Bonferroni corrected Mann Whitney U test; patients with a moderate socioeconomic level are more satisfied than those with a high socioeconomic level (p<0.05).
When the statistical effect of companion support on scale item basis is evaluated; patients with companion support were more satisfied with the helpfulness of the nurse (p=0.006) and the way nurses explained things to patient (p=0.010) (Table 4).
DiscussionIt was determined in the present study that elderly surgical
patients had high-level satisfaction regarding the nursing care. Abd El-Moniem, Mahfouz and Elsoued Hussein [22] found that 67.9% of hospitalized geriatric patients had moderate satisfaction levels regarding nursing care. Heyman, Osman and Natan’s [23] study found that the satisfaction (treatment) of patients in geriatric rehabilitation facilities was high. The results of the study show that elderly patients are satisfied with nursing.
It was found in the study that patients who had moderate socioeconomic status were more satisfied than patients who had high socioeconomic status. In the fifteen items of the scale, it is seen that the satisfaction is significant in favor of the middle level socioeconomic level. Contradictory results are found in the literature regarding income levels. Deka et al. [24] found that satisfaction levels were higher in patients with low socioeconomic levels; however, Ozturk et al. [19] found that patients who had high socioeconomic levels were more satisfied. Also, a previous study [25] reported that patient satisfaction did not vary according to economic situation, but another study reported a linear relation between socioeconomic levels and patient satisfaction scores [26]. New studies are required to show the effectiveness of socioeconomic levels on patient satisfaction. Differences in study results may have been affected by factors such as patients' previous experiences, expectations, and characteristics.

52Journal of Clinical Medicine of Kazakhstan: 2021 Volume 18, Issue 6
Table 1 Patients’ Sociodemographic Characteristic (n = 135)
NSNS: Newcastle Satisfaction with Nursing Scales N: Number of patients, SD: standard deviation, U: Mann Whitney U test, KW: Kruskal Wallis H test, r: Spearman Correlation analysis
Characteristics n (%) NSNS Mean ± SD Mean rank Statistical valueGender Female 87(64.4) 83.0 ± 16.0 66.82 p = 0.629
U = 1985.000Male 48(35.6) 84.3 ± 14.6 70.15Education status İlliterate 45(33.3) 84.5 ± 13.0 67.14
p = 0.487 KW = 2.436
Primary education 64(47.4) 84.8 ± 15.7 73.32High school 15(11.1) 80.2 ± 16.3 61.03University 11(8.1) 76.5 ± 20.8 55.86
Marital status Married 82(60.7) 83.2 ± 16.3 67.87 p = 0.961 U = 2162.500Single 53(39.3) 84.0 ± 14.1 68.20
Working status I cannot work due to orthopedic problems
8(5.9) 88.6 ± 12.7 78.44p = 0.427 U = 424.500I cannot work for other
reasons127(94.1) 83.2 ± 15.6 67.34
Socioeconomic level High 35(25.9) 76.2 ± 16.9 66.20 p = 0.013 KW = 8.679P1-2 = 0.625P1-3 = 0.402P2-3 = 0.003
Moderate 95(70.4) 86.2 ± 14.3 74.07Low 5(3.7) 83.3 ± 10.6 51.77
Comorbidity Yes 101(74.8) 83.9 ± 15.1 68.77 p = 0.686 U = 1639.000No 34(25.2) 82.3 ± 16.6 65.71
Surgical intervention Prosthesis 73(54.1) 82.2 ± 15.8 64.53 p = 0.468 KW = 1.519Open reduction 48(35.6) 84.5 ± 15.5 70.85
Amputation 14(10.4) 86.8 ± 13.4 76.29Operation area Hip 74(54.8) 79.1 ± 14.8 67.42
p = 0.170 KW = 5.025
Knee 27(20.0) 76.0 ±15.6 58.83Lower extremity 27(20.0) 80.9 ± 14.0 72.09Upper extremity 7(5.2) 88.4 ± 8.44 93.71
Companion support Yes 130(96.3) 84.1 ± 15.2 69.31 p = 0.043 U = 155.000No 5(3.7) 69.0 ± 15.9 34.00
Hospitalization type From emergency room 108(80) 83.4 ± 14.7 67.00 p = 0.546 U = 1350.500From policlinic 27(20) 83.9 ± 18.6 71.98
Mean ± SDAgeyear 76.0 ± 8.0 83.5 ± 15.5 p = 0.875
r = 0.014Hospitalization timeday
7.8 ± 7.1 p = 0.161r = -0.121
Hospitalization frequencyday
3.1 ± 2.3 p = 0.411r = 0.071
It was also found in the study that patients who had companion support were more satisfied than patients without companion support. In their study, Kashkoli et al. [27] found that social support was a minor factor that affected patient satisfaction. Klem et al. [28] reported that the lack of familial support in elderly patients undergoing total hip arthroplasty reduced patient satisfaction. Another study reported that elderly patients without regular visitors/family support in an acute care environment had low satisfaction scores [29].
In the study, it was found that patients were highly satisfied with the care regarding their privacy (personal and bodily boundaries), awareness of their requirements, and being treated as individuals. Similarly, Zhang et al. [30] in their studies, it was determined that the highest satisfaction was respecting the privacy of patients and treating patients as individuals. These study results were supported by Dawood, GaleleAbd El Moneam and Al Anwer Ashour [31] that the care of nurses regarding privacy was highly welcomed by elderly patients. Ozsaker et al. [32] reported in their study that the care for privacy was a condition that created high satisfaction in surgical patients. Marcelina et al. [33] found that patients who undergoing radical prostatectomy were highly satisfied with their privacy. In the study conducted
Table 4Comparison of patient satisfaction according to subgroups of companion support (n = 135)
U = Mann-Whitney U test
Items Companion support Statistical valueYes (n = 130) No (n = 5)
Mean rank
Nurses’ helpfulness 69.68 24.30 p = 0.006U = 106.500
The way nurses explained things to you
69.58 26.80 p = 0.010 U = 119.000
by Yanmıs [34] it was highly welcomed that nurses were aware of the requirements of urology patients. Shankar, Bhaita and Schuur [35] reported that the lack of privacy was associated with low patient satisfaction in their study conducted with elderly emergency patients. In their systematic review in which they examined the acute care experiences of elderly patients Bridges et al. [29] found that failure in covering individual requirements caused dissatisfaction in patients. Zhang et al. [30] determine their study that patients who were hospitalized were highly satisfied with the way nurses treated patients as individuals (67.7%). Results of study show that patients care about privacy.

53Journal of Clinical Medicine of Kazakhstan: 2021 Volume 18, Issue 6
Items Min-Max Mean ± SD1. The amount of time nurses spent with you 2-5 4.18 ± 0.82. How capable nurses were at their job 2-5 4.24 ± 0.73. There always being a nurse around if you needed one 2-5 4.20 ± 0.84. The amount nurses knew about your care 2-5 4.16 ± 0.85. How quickly nurses came when you called for them 2-5 4.16 ± 0.86. The way the nurses made you feel at home 2-5 4.03 ± 0.87. The amount of information nurses gave to you about your condition and treatment 2-5 4.10 ± 0.88. How often nurses checked to see if you were OK 2-5 4.18 ± 0.89. Nurses’ helpfulness 2-5 4.24 ± 0.810. The way nurses explained things to you 2-5 4.16 ± 0.811. How nurses helped put your relatives or friends’ minds at rest 2-5 4.07 ± 0.812. Nurses manner in going about their work 2-5 4.21 ± 0.813. The type of information nurses gave to you about your condition and treatment 2-5 4.07 ± 0.814. Nurses treatment of you as an individual 2-5 4.25 ± 0.815. How nurses listened to your worries and concerns 2-5 4.12 ± 0.816. The amount of freedom you were given on the ward 1-5 4.12 ± 0.917. How willing nurses were to respond to your request 2-5 4.23 ± 0.718. The amount of privacy nurses gave you 2-5 4.35 ± 0.719. Nurses awareness of your needs on your care and treatment 2-5 4.30 ± 0.7
Table 2 Patients' responses to the NSNS (n = 135)
KW = Kruskal Wallis test, * = Bonferroni corrected Mann Whitney U test show that patients with a moderate socioeconomic level are more satisfied than those with a high socioeconomic level (p <0.05).
Table 3 Comparison of patient satisfaction according to subgroups of socioeconomic level (n = 135)
Items Companion support Statistical valueHigh (n = 35) Moderate (n = 95) Low (n = 5)
Mean rankThere always being a nurse around if you needed one 52.13 74.49 55.70 *p = 0.006
KW = 10.268The amount nurses knew about your care 52.11 73.97 65.80 *p = 0.010
KW = 9.130How quickly nurses came when you called for them 55.16 73.25 58.10 *p = 0.036
KW = 6.640The way the nurses made you feel at home 52.94 73.73 64.60 *p = 0.017
KW = 8.122The amount of information nurses gave to you about your condition and treatment
53.06 73.37 70.50 *p = 0.020KW = 7.831
Nurses’ helpfulness 60.30 72.99 60.30 *p = 0.045KW = 6.194
The way nurses explained things to you 55.04 72.98 64.00 *p = 0.044KW = 6.234
How nurses helped put your relatives or friends’ minds at rest 49.86 74.99 62.20 *p = 0.002KW = 12.015
Nurses manner in going about their work 50.84 74.05 73.10 *p = 0.005KW = 10.538
The type of information nurses gave to you about your condition and treatment
49.23 75.24 61.90 *p = 0.002KW = 12.888
Nurses treatment of you as an individual 54.74 73.26 60.80 *p = 0.032KW = 6.912
How nurses listened to your worries and concerns 49.93 75.07 60.10 *p = 0.002KW = 12.242
The amount of freedom you were given on the ward 51.14 74.66 59.40 *p = 0.005KW = 10.781
How willing nurses were to respond to your request 51.40 74.41 62.40 *p = 0.005KW = 10.414
Nurses awareness of your needs on your care and treatment 55.07 72.65 70.20 *p = 0.045KW = 6.181
In this respect, it can be said that privacy has a significant effect on patient satisfaction.
It was determined in the present study that the most dissatisfying situation was the inability to feel as if at home, the contents of information about the disease and treatment,
and the lack of adequate elimination of concerns of patient’s and his/her relatives’. It was reported in previous studies that environmental variables, such as the cleanliness of the room and lack of noise for elderly hospitalized patients increased patient satisfaction [36] Silero and Zabalegui [37] reported that patients

54Journal of Clinical Medicine of Kazakhstan: 2021 Volume 18, Issue 6
References 1. Wyman MF, Shiovitz-Ezra S, Bengel J. Ageism in the health care system: providers, patients, and systems. In: Ayalon L., Tesch-Römer
C. (Eds.), Contemporary perspectives on ageism. International Perspectives on Aging, 19. Cham: Springer; 2018.2. Svanström R, Sundler AJ, Berglund M, Westin L. Suffering caused by care-elderly patients’ experiences in community care. Int J Qual
Stud Health Well-Being. 2013; 8(1):20603. doi: 10.3402/qhw.v8i0.206033. Centers for Disease Control and Prevention (CDC). (2020). Keep on your feet—preventing older adult falls. Retrieved March 14, 2021,
from https://www.cdc.gov/injury/features/older-adult-falls/index.html Updated: December 16, 2020.4. Savcı A, Bilik O. Assessment of geriatric patients in the clinic of orthopaedic and traumatology. Dokuz Eylul University E-Journal of
Nursing Faculty. 2014; 7(2):156-163.5. Deiner S, Silverstein JH. Long-term outcomes in elderly surgical patients. Mt Sinai J Med. 2012; 79(1):95–106. doi:10.1002/msj.21288.6. Moreno-Monsivais MG, Moreno-Rodruguez C, Interial-Guzman MG. Missed nursing care in hospitalized patients. Aquichan. 2015;
15(3):318-328. doi: 10.5294/aqui.2015.15.3.27. Tekin F, Yıldız Fındık U. Level of perception of ındividualized care and satisfaction with nursing in orthopaedic surgery patients.
Orthop Nurs. 2015; 34(6):371-374. doi: 10.1097/NOR.00000000000001948. Apay SE, Arslan S. Satisfaction level of inpatient in an university hospital. TAF Preventive Medicine Bulletin. 2009; 8(3):239-244.9. Bourne RB, Chesworth BM, Davis AM, Mahomed NN, Charron KD. Patient satisfaction after total knee arthroplasty: who is satisfied
and who is not? Clin Orthop Relat Res. 2010; 468:57-63. doi: 10.1007/s11999-009-1119-910. Batbaar E, Dorjdagva J, Luvsannyamm A, Savino MM, Amenta P. Determinants of patient satisfaction: a systematic review. Perspectives
in Public Health. 2017; 137(2):89-101. doi: 10.1177/1757913916634136.11. Day MS, Hutzler LH, Karia R, Vangsness K, Setia N, Bosco 3rd JA. Hospital-acquired conditions after orthopedic surgery do not affect
patient satisfaction scores. J Healthc Quality. 2014; 36(6):33-40. doi: 10.1111/jhq.1203112. Kim SJ, Bamne A, Song YD, Kang YG, Kim TK. Patients still wish for key improvements after total knee arthroplasty. Knee Surg Relat
Res. 2015; 27(1):24-33. doi: 10.5792/ksrr.2015.27.1.24.13. Kelly MP, Calkins TE, Culvern C, Kogan M, Valle CJD. Inpatient versus outpatient hip and knee arthroplasty: which has higher patient
satisfaction? J Arthroplasty. 2018; 33:3402-3406. doi: 10.1016/j.arth.2018.07.02514. Sendir M, Büyükyılmaz F, Yazgan I, Bakan N, Mutlu A, Tekin F. Evaluation of experience and satisfaction with nursing care in orthopedic
and traumatology patients. Florence Nightingale J Nurs. 2012; 20(1):35-42.15. Padilla JA, Feng J, Anoushiravani AA, Hozack WJ, Schwarzkopf R, Macaulay B. Modifying patient expectations can enhance total hip
arthroplasty postoperative satisfaction. J Arthroplasty. 2019; 34(7):209-214. doi: 10.1016/j.arth.2018.12.03816. Janet HY, Luk HKB. Patient satisfaction: Concept analysis in the healthcare context. Patient Educ Couns. 2019; 102:790–796. doi:
10.1016/j.pec.2018.11.01317. Lautamatti E, Sumanen M, Raivio R, Mattila KJ. Continuity of care is associated with satisfaction with local health care services. BMC
Family Practice. 2020; 21:181. doi: 10.1186/s12875-020-01251-518. Azizi-Fini I, Mousavi MS, Mazroui-Sabdani A, Adib-Hajbaghery M. Correlation between nurses’ caring behaviors and patients’
satisfaction. Nurs Midwifery Stud. 2012; 1(1):36-40. doi: 10.5812/nms.790119. Ozturk H, Demirsoy N, Saylıgil O. Patients’ perceptions of nursing care in a university hospital. Nurs Sci Q. 2020; 33(1):12-18. doi:
10.1177/089431841988179820. Thomas LH, McColl E, Priest J. Newcastle satisfaction with nursing scales: An ınstrument for quality assessment of nursing care.
Quality in Health Care. 1996; 5:67–72.
who were better informed about the perioperative process felt more satisfied. In the study of Gebremedhn and Lemma [38] it was found that knowledge about the disease and operation was a predictive factor in patient satisfaction. Forsberg et al. [39] reported that individualized information affected patient satisfaction positively in adult surgery patients. Emotional conditions of patients also affect postoperative satisfaction levels [40] It was also reported in one previous study that the most neglected situation of nurses during care attempts was not meeting the patient’s/family’s requirements for emotional support [6]. As a result, it may be speculated that the satisfaction levels of patients regarding ambient comfort, contents of the information, and psychological support to their relatives are low.
ConclusionThe findings of the study showed that elderly orthopedic
patients had good satisfaction levels in terms of nursing care. It may be recommended that surgical nurses make elderly patients feel at home, individualize the contents of the information according to needs and preferences, and be more careful in addressing the concerns of the relatives of elderly patients
adequately. The expectations and needs of elderly patients who do not have companion support and who have high socioeconomic levels must be determined more clearly, and patients must be supported at points where they feel low satisfaction.
Strength and limitationsSatisfaction from nursing care was evaluated with a
valid and standardized scale in the present study. The study was conducted with a relatively small patient group, which affected the reliability of the results. In addition, postoperative complications were not questioned in the study. This may have affected patient satisfaction. Study findings should be interpreted with this situation in mind.
Disclosures: There is no conflict of interest for all authors.
Acknowledgements: None.
Funding: None.

55Journal of Clinical Medicine of Kazakhstan: 2021 Volume 18, Issue 6
21. Akın S, Erdoğan S. The Turkish version of the Newcastle Satisfaction with Nursing Care Scale used on medical and surgical patients. J Clin Nurs. 2007; 16(4):646-653.
22. Abd El-Moniem MM, Mahfouz MI, Elsoued Hussein HA. Geriatric inpatients perception of nurses’ communication: the relationship between patient-centered communication practices and satisfaction with nursing care. World Journal of Nursing Sciences. 2015; 1(3):138-151. doi: 10.5829/idosi.wjns.2015.138.151
23. Heyman N, Osman I, Natan MB. Ageist attitudes among healthcare professionals and older patients in a geriatric rehabilitation facility and their association with patients' satisfaction with care. Int J Older People Nurs. 2020; 15:1-10. e12307. doi: 10.1111/opn.12307
24. Deka C, Borboruah L, Sarmah PP. Paul I. A study on patient satisfaction among the patients admitted in the in-patient departments of a tertiary health care institution in North East India. Nati J Community Med. 2020; 11(9):356-361. doi: 10.5455/njcm.20200623063100
25. Amiri M, Sadeghi E, Khosravi A. Factors influencing patient satisfaction in Shahroud Hospitals in 2018. International Journal of Health Studies. 2018; 4(1):37-41. doi: 10.22100/ijhs.v4i1.382
26. Footman K, Roberts B, Mills A, Richardson E, McKee M. Public satisfaction as a measure of health system performance: A study of nine countries in the former Soviet Union. Health Policy. 2013; 112:62-69. doi: 10.1016/j.healthpol.2013.03.004
27. Kashkoli SA, Zarei E, Daneshkohan A, Khodakarim S. Hospital responsiveness and its effect on overall patient satisfaction. Int J Health Care Qual Assur. 2017; 30(8):728-736. doi: 10.1108/IJHCQA-07-2016-0098
28. Klem NR, Smith A, O’Sullivan P, Dowsey MM, Schütze R, Kent P, et al. What influences patient satisfaction after TKA? A qualitative investigation. Clin Orthop Relat Res. 2020; 478:1850-1866. doi: 10.1097/CORR.0000000000001284
29. Bridges J, Collins P, Flatley M, Hope J, Young A. Older people’s experiences in acute care settings: Systematic review and synthesis of qualitative studies. Int J Nurs Stud. 2020; 102:103469. doi: 10.1016/j.ijnurstu.2019.103469
30. Zhang J, Yang L, Wang X, Dai J, Shan W, Wang J. Inpatient satisfaction with nursing care in a backward region: a cross-sectional study from northwestern China. BMJ Open. 2020; 10:e034196. doi: 10.1136/bmjopen-2019-034196
31. Dawood SS, GaleleAbd El Moneam AA, Al Anwer Ashour HM. Nurses` caring behaviors as perceived by hospitalized geriatric patients' and its relation to their satisfaction with the quality of nursing care. IOSR Journal of Nursing and Health Science. 2020; 9(1):24-34. doi: 10.9790/1959-0901132434
32. Ozsaker E, Sevilmis H, Ozcan Y, Samast M. Nursing care perception and satisfaction levels of surgical patients. J Contemp Med. 2021; 1(2). doi: 10.16899/jcm.711131
33. Marcelina CF, Machado Saito KA, Mirancos da Cunha ALS, Elizabeth dos Santos A. Patient’s satisfaction with nursing care on the post-surgery of radical prostatectomy. Rev Rene. 2018; 19:e33961.
34. Yanmıs S. Patients’ satisfaction levels of nursing services at a urology unit of a university hospital. JOJ Nursing & Health Care. 2018; 9(2):1-6. doi: 10.19080/JOJNHC.2018.09.555759
35. Shankar KN, Bhatia BK, Schuur JD. Toward patient-centered care: A systematic review of older adults’ views of quality emergency care. Ann Emerg Med. 2014; 63(5):529-550. Doi: 10.1016/j.annemergmed.2013.07.509
36. Chumbler N, Otani K, Desai SP, Herrmann PA, Kurz RS. Hospitalized older adults’ patient satisfaction: inpatient care experiences. SAGE Open. 2016; 1-7. doi: 10.1177/2158244016645639
37. Silero AS, Zabalegui A. Satisfaction of surgical patients with perioperative nursing care in a Spanish tertiary care hospital. SAGE Open Medicine. 2020; 6:1-9. doi: 10.1177/2050312118818304
38. Gebremedhn EG, Lemma GF. Patient satisfaction with the perioperative surgical services and associated factors at a University Referral and Teaching Hospital, 2014: a cross-sectional study. Pan Afr Med J. 2017: 27:176-190. doi: 10.11604/pamj.2017.27.176.10671
39. Forsberg A, Vikman I, Wälivaara BM, Engström Å. Patients’ perceptions of quality of care during the perioperative procedure. J Perianesth Nurs. 2015; 30(4):280–289.
40. Bae JY, Kim JK, Yoon J, Kim JH, Ho BC. Preoperative predictors of patient satisfaction after carpal tunnel release. Orthop Traumatol Surg Res. 2018; 104:907–909. doi: 10.1016/j.otsr.2018.04.004

56Journal of Clinical Medicine of Kazakhstan: 2021 Volume 18, Issue 6
Original Article DOI: https://doi.org/10.23950/jcmk/11344
JOURNAL OF CLINICAL MEDICINE OF KAZAKHSTAN (E-ISSN 2313-1519)
AbstractIntroduction: The study was conducted to determine the
undiagnosed prevalence of urinary incontinence and its association with the quality of life in middle-aged and older women.
Material and methods: The sample of the study consisted of women aged 40 years or above who were admitted to a tertiary care center between March and July 2019. The data were collected by face-to-face interview method. “International Consultation on Incontinence Questionnaire-Short Form (ICIQ-SF)” and “Incontinence Quality of Life Questionnaire (I-QOL)” were used to collect data on urinary incontinence and quality of life.
Results: The screened sample included 140 women (mean age: 60.6±11.3 years). Urinary incontinence was detected in 90 subjects (64.3%). Urinary incontinence complaints were present for an average of four years. Self-rated effect on daily life was moderate (ICIQ-SF: 5.0±2.5), and more than half of them (64.4%) did not consider urinary incontinence as a health issue, More than half (62.9%) did not admit for professional care for many reasons. The average score was 85.0±14.7 from the "Psychosocial influence" sub-dimension, 71.0±16.9 from the "Social isolation" sub-dimension, 65.1±16.6 from the "Limitation of behaviors" sub-dimension, and 74.6±14.5 from the whole scale. There was no significant relationship between I-QOL total score and educational status, marital status, income level, chronic diseases, mode of delivery, and menopause.
Discussion and conclusion: This study found that more than half of women admitted to a hospital for other reasons have urinary incontinence complaints. Although the duration of symptoms was long and quality of life was somehow influenced, admission to a health facility was low.
Key words: urinary incontinence, quality of life, nursing, women's health
Received: 2021-07-05. Accepted: 2021-09-21
Undetected prevalence of urinary incontinence among middle-aged women and its association with quality of lifeIncilay Çelik1, Ayse Kilic Ucar2, Ümüt Güzelküçük3
1Gaziler Physical Medicine and Rehabilitation Training and Research Hospital, Ankara, Turkey2Florence Nightingale Hospital School of Nursing, Demiroglu Bilim University, Istanbul, Turkey3Gaziler Physical Medicine and Rehabilitation Training and Research Hospital, Ankara, Turkey
Corresponding author: Incilay Çelik. E-mail: [email protected]; ORCID: 0000-0002-1513-3469
IntroductionUrinary Incontinence (UI) is defined as “the
complaint of involuntary UI regardless of the amount” (International Incontinence Association). UI affects people of all ages and genders. However, it is two times more common among women and older individuals [1, 2]. The global prevalence of UI varies between 20% and 68% [3-5], while several studies from Turkey showed 40% to 60% UI depending on age [1, 6-9].
Major risk factors for UI are age, obesity, pregnancy, type of delivery, birth frequency, menopause, hysterectomy,
and social habits [3,7,10]. Stress incontinence, urge incontinence and mixed incontinence are the most common types of UI. Stress incontinence occurs due to efforts such as coughing, physical activity, sports activity, and position change. Urge incontinence is characterized by a sudden, strong urge to urinate. Mixed incontinence is the coexistence of both types [11,12].
UI negatively affects the person's health status in physical, social, psychological, and financial aspects. Although it is not life-threatening, it increases anxiety, decreases self-esteem, and causes emotional problems
J Clin Med Kaz 2021; 18(6):56-61

57Journal of Clinical Medicine of Kazakhstan: 2021 Volume 18, Issue 6
up to depression due to the continuous feeling of wetness and irritation [5,13,14]. Moreover, UI is not easily expressed by the patient and, therefore, frequently remains untreated. Only one in four women is estimated to claim medical treatment, and about half of them wait 2 to 5 years after the initiation of incontinence. The reasons for a late admission include privacy concerns, insufficient knowledge about the potential treatment options, and perception of the condition as a typical feature of aging and general negligence [2,15-18].
Therefore, women with UI complaints are usually not treated or late for the treatment. To cope with the problem, preventing low extremities from cold, warming the abdominal surface, reducing hydration, avoiding carrying heavy objects, and reducing social life are most frequently chosen as alternatives [19-21].
Healthcare staff, particularly the nurses, have an essential role in determining the UI in the early period [10]. All admissions to a healthcare facility should include a UI assessment even though there is no previous diagnosis of UI. This may help increase women's quality of life and prevent permanent health problems. UI is often ignored in women admitted to hospital with another health problem and it is not mentioned. Our study was conducted to determine the presence of UI, its frequency, coping methods, and its effect on quality of life in women admitted to the hospital with another health problem. In addition, this study aims to determine how important this issue is for healthcare personnel and women. In the present study, we aimed to determine UI prevalence, coping behaviors, and its impact on quality of life among hospitalized middle-aged women.
Material and methodsIn this cross-sectional and descriptive study, we enrolled
female patients admitted to Health Sciences University (SBU) Gaziler Physical Therapy and Rehabilitation Training and Research Hospital, Ankara-Turkey between March-July 2019. The main inclusion criteria were the age at or above 40 years knowing Turkish and absence of incontinence as the primary reason for admission. Patients who not able to communicate verbally or who did not provide consent to participate were excluded. The study was conducted following the Declaration of Helsinki, and the protocol was approved by the institutional review board (code: 46418926-19/90, date of approval: 12.03.2019). Participants gave written informed consent.
We collected data using a face-to-face interview method. In the first step, the following standard explanation was made to each participant: “Involuntary incontinence is very frequently in women. This situation may develop due to increased intra-abdominal pressure or it may occur without any reason. While women can hold urine easily, it may become impossible over time". Subsequently, the participants were asked, "Are you urinating unintentionally?". Individuals who answered "yes" to this question continued with the study procedures. Those who responded "no" completed the study, but they were given brief advice about preventive measures of UI.
Additional data were collected using a previously established questionnaire [12,16,17] which consisted of two parts. The first part included six questions about the sociodemographic characteristics. The second part included a survey of chronic diseases, obstetric history, and UI. The next step was to administer the Turkish version of The International Consultation on Incontinence Questionnaire Short Form (ICIQ-SF) developed by Avery et al. Turkish validity and reliability were done by Çetinel et al. ICIQ-SF can be used to evaluate
the prevalence, frequency, amount, perceived causes of urinary incontinence and the effect of urinary incontinence on quality of life in all groups, male-female, young-old. Stress incontinence is defined as "I leak urine while coughing, sneezing" and "I leak when I'm moving or doing sports" in determining the UI type. Urge incontinence should be considered if there is a feeling of urgency and inability to reach the toilet, and if both are seen together, mixed incontinence should be considered. The scale has four dimensions. It deals with how often urinary incontinence occurs in the first dimension, the amount of urinary incontinence in the second dimension. The effect of urinary incontinence in the third dimension on daily life and the situations that cause urinary incontinence in the fourth dimension are discussed. The first three dimensions are scored in the evaluation. The answers given to the fourth dimension, which is not scored, are used to determine the type of urinary incontinence based on the individual's complaints. Scoring was done by determining a single score instead of adding the dimension scores separately. A score of eight or higher for the ICIQ-SF score was determined to be the most appropriate cut-off point for irritating urinary incontinence. The scores that can be obtained from the scale range from 0 to 21.A low score indicates that urinary incontinence has little effect on quality of life, while a high score indicates that it affects the quality of life very much. The cronbach's alpha coefficient of the scale was found to be 0.71. In this study, the ICIQ-SF cronbach alpha value was calculated as 0.76. ICIQ-SF has four dimensions: frequency, degree, impact on daily life, and precipitating factor of UI. To evaluate the effect of UI on quality of life, scores from the first three dimensions summed up to determine a single score. The Turkish version of the ICIQ-SF was previously validated successfully [11]. The scores that can be obtained from the scale range from 0 to 21. Higher scores indicate a higher impact of UI on quality of life.
The Incontinence Quality of Life Scale (I-QOL) was also developed by Wagner et al. in 1996 in the United States to determine patients' quality of life with UI [22]. The scale was revised by Patrick et al. [23] in 1999, and psychometric measurements were implemented during the creation of European versions. I-QOL consists of three subdomains, including limitation of behaviors (LB) (items 1, 2, 3, 4, 10, 11, 13, and 20), psychosocial influence (PI) (items 5, 6, 7, 9, 15, 16, 17, 21, and 22) and social isolation (SI) (items 8, 12, 14, 18, and 19). The total score from the three domains is summed up to obtain a single score between 0 and 100. Higher scores indicate better quality of life. The Turkish validity and reliability of the I-QOL was performed by Özerdoğan and Beji, and the cronbach alpha coefficient was found to be 0.96 [24]. In this study, the I-QOL cronbach alpha value was found to be 0.92. The validity and reliability of the Turkish version of I-QOL were previously published.
The WHO classification was used for obesity grading in the study [25].
Statistical analysisAnalyses were performed using the Statistical Package
for Social Sciences (SPSS) 20.0 (IBM SPSS Inc., Chicago, IL) software. Categorical variables were compared using the Chi-square tests. Continuous variables were compared using the Student’s t-test or the Mann –Whitney U test. Bivariate correlations were evaluated using the Spearman or Pearson correlation analysis. P < 0.05 values were considered statistically significant.

58Journal of Clinical Medicine of Kazakhstan: 2021 Volume 18, Issue 6
Table 1Introductory characteristics of women, chronic disease status, obstetrics and gynecological characteristics (n=90)
Urinary Incontinence (Uİ) Minimum (Min)- Maximum (Max) Body Mass Index (BMI)* The "n" is folded because more than one option is answered
Variables N %Presence of UI (n=140) Urinary incontinence 90 64,3 Without incontinence 50 35,7Age (year) 40-49 22 24,450-59 17 18,960-69 30 33,470 and above 21 23,3X ± Min/Max 60,6±11,3Marital Status Married 74 82,2Single 16 17,8Education StatusLiterate 21 23,3Primary education 45 50,0High school 16 17,8University 8 8,9BMI (kg/m2) Normal weight 9 10,0 Over-weight 7 7,8Obese 50 55,6Morbidly obese 24 26,6Chronic illness *Have 69 76,7Don’t Have 21 23,3Number of births0-2 24 26,63 26 28,9≥ 4 40 44,5Mode of birthVaginal 78 87,6Caesarean section 11 12,4Menopausal statusYes 77 85,6No 13 14,4
Table 2 Characteristics of women related to UI (n=90)
Urinary Incontinence (Uİ) Minimum (Min)- Maximum (Max) * The "n" is folded because more than one option is answered
Variables N %Duration (year) 1 16 17,8 2 -4 34 37,8 5-7 20 22,2 ≥ 8 20 22,2Mean (min-max) 4 (1 – 20)Types Urge 11 12,2 Stress 43 47,8 Mixed 31 34,4 No apparent reason 5 5,6Urinary incontinence frequency Once a week or less 28 31,1 Two or three times a week 34 37,8 Once a day 9 10,0 Always 19 21,1The amount of urinary incontinence Little 45 50,0 Moderate 35 38,9 Much 10 11,1Urinary incontinence status *While coughing / sneezing 58 64,4While going to the toilet 42 46,7While on the move 40 44,4While getting dressed after the toilet 16 17,8While sleeping 7 7,8
ResultsA total of 140 women were enrolled, and 90 (64.3%)
reported UI problems. Table 1 shows the descriptive characteristics of the study population. The average age of the participants was 60.6±11.3 years (40 to 83 years). The majority of the participants (82.2%) were married, and a half (50%) were primary school graduates, more than half (55.6%) were obese, 76.7% had at least one chronic disease, and 85.6% were postmenopausal. The most frequent delivery type was vaginal.
Table 2 shows the data related to UI. Around one-third (37.8%) had UI complaints for 2-4 years, and 44.4% for more than five years. Stress and mixed type were recorded as 47.8% and 34.4%, respectively. UI was persistent in 21.1% and 2-3 times/week in 37.8% of the participants. The severity of UI was moderate to severe in half of the sample. Up to two-third of UI occurred during sneezing/coughing or urging.
Awareness of UI, the impact of UI on daily life, and coping methods are shown in Table 3. The mean score of women's UI effect on daily life was found to be 5.0±2.5. The majority of the participants (64.4%) considered UI a health issue, but a similar proportion (62.9%) did not claim professional help.
The reason for not claiming any help varied and mixed (Table 3). The average time to the first admission from the initial UI symptoms was 18 months (n=34). Regarding the coping behaviors with UI, 82.8% reported changing underwear frequently, followed by using pads/diapers, restricting fluid intake, and keeping feet warm.
Table 4 shows I-QOL scores. The average score was 85.0±14.7 from the "Psychosocial influence" sub-dimension, 71.0±16.9 from the "Social isolation" sub-dimension, 65.1±16.6 from the "Limitation of behaviors" sub-dimension, and 74.6±14.5 from the whole scale.
The data in Table 5 emerged as a result of the analysis carried out to determine whether there is a correlation between some characteristics of women and the I-QOL scale and its sub-dimensions. Accordingly, a negative, moderate (r=-0.379) and statistically significant correlation was found between age and I-QOL total score. (p<0.001). In addition, a statistically significant difference was found between age and all I-QOL subscales (respectively, p=0.001, p=0.004, p=0.002).
A negative, moderate (r=-0.262) and statistically significant correlation was found between body mass index (BMI) and I-QOL total score (p=0.013). In addition, a statistically significant difference was found between the BMI and I-QOL subscales in terms of behavior restriction score and social isolation score (respectively, p=0.001, p=0.005).
A statistically significant difference was found in terms of I-QOL total score, behavior restriction score and social isolation score among groups formed according to the number of births (respectively , p=0.025, p=0.002, p=0.029).
A negative, moderate (r=-0.254) and statistically significant (p=0.016) correlation was found between the duration of UI

59Journal of Clinical Medicine of Kazakhstan: 2021 Volume 18, Issue 6
Table 3The level of UI affecting the daily life of women, the characteristics of UI about being aware of and coping with UI (n=90)
Urinary Incontinence (Uİ) Minimum (Min)- Maximum (Max) Standard deviation (SD)* The "n" is folded because more than one option is answered
VariablesLevel of influence on daily lifeX± SD 5,0±2,5Mean (min/max) 4 (1 – 10)Status of seeing UI as a health problem N %Yes 58 64,4No 32 35,6Status of applying to a health care facilityYes 34 37,1No 56 62,9Reasons for not applying to a health care facility * (n=56)Disregard 51 91,1Seeing as a normal situation 36 64,3Not wanting to disturb the healthcare staff 28 50,0Refraining from being examined and being embarrassed
25 44,6
Thinking that there is no cure 17 30,4Not having time 7 12,5Coping behaviors with UI * (n=90)Frequently changing underwear 74 82,2Using pads and cloths 54 60,0Reducing fluid intake 53 58,9Keeping feet warm 42 46,7Taking care not to lift heavy 14 15,6Cleaning the genital area with hot water 11 12,2Seating on hot brick 7 7,8Applying hot water to the stomach 6 6,7Duration of application to health institution after UI complaints (month) (n=34)X± SD 18,4±15,4Mean (min/max) 12 (3 – 60)
and I-QOL total score. In addition, a statistically significant difference was found between the duration of UI and the I-QOL subscales in terms of behavior restriction score and social isolation score (respectively , p=0.032, p=0.008).
Although not shown in the table, no significant relationship was found between educational status, marital status, perception of income status, chronic disease status, mode of delivery, menopause status and I-QOL total score. In addition, it was determined that the I-QOL scale scores decreased as the age increased (40-49 age 82.9±11.19; 50-59 age 77.3±10.7; 60-69 age 71.8±14.0; 70 and over age 67.6±16.7).
DiscussionUI is a serious condition that often impacts all areas of
women's life and its frequency increases with age. However, most women do not get treated on time. In our study, UI was detected in 64.3% of women aged 40 years or older admitted to hospital for reasons other than UI, indicating that the frequency of UI is relatively high, but it remains unreported. These results show that healthcare personnel should question the presence of UI in all women for whatever reason they are admitted to the hospital.
The etiology of UI among women is often mixed. Aging, comorbid chronic diseases, and multiple deliveries are among the most frequently addressed related factors. Although UI may be diagnosed in the young and middle-aged population, bladder contractility, capacity, and ability to delay urination decrease with increasing age. The frequency UI was found 58.4% between the ages of 40-50 years, and 30-60% over the age of 65 in previous studies [6-9]. In our study, 24.4% of women between the ages of 40-49 and 56.7% of women aged 60 and over had UI. As stated in the literature, incontinence is a problem that increases in frequency with advancing age and affects individuals in many dimensions. According to the results of our study, it was found that women's quality of life scale scores decreased as age increased. These results are very important in terms of showing that women's quality of life decreases due to incontinence.
Among other risk factors of UI are BMI, type of delivery, and menopause [3,26]. We found that 90% of the participants were overweight, 76.7% had a chronic disease, 73.4% had three or more deliveries, 87.6% had vaginal deliveries, and 85.6% in the menopause period. The relationship between UI and some risk factors has been shown in many studies. Gözükara et al. found that chronic diseases and menopause increased the risk of UI 1.8 and 2.7 times, respectively [27]. Thubert et al. reported that the relative risk of UI in morbidly obese women was five times higher than non-obese women, and 10% weight loss reduced the frequency of urinary leakage by 50% [28]. These results indicate that women with obesity, chronic diseases, multiple delivery history, and menopause are more likely to experience UI.
The average duration of UI for women participating in the study was four years, while 44.4% had UI for five years or more. Previously, Acar and Yurtsever reported that, among 124 women aged 65 and over with UI complaints, 29.8% had UI for 1-3 years, 21% for 4-6 years, 28.2% for seven years or more [13]. In another study, however, Demir and Beji [2] observed that the longest duration of incontinence was one year (24.3%), while Kok et al. [16] identified 14.11% of the patients had UI complaints for at least eight years. It should be noted that many women live with UI as it is a normal part of daily life for a long time.
We identified that stress (47.8%) and mixed (34.4%) type UI were the most among our study population. Similar findings from different populations exist in the literature. Skyes et al. [29],
Table 4Analysis of women's I-QOL total and sub-dimension mean scores (n=90)
Incontinence Quality of Life Scale (I-QOL)
I-QOL and its sub-dimensions x̄ SD (±) Min. Max.Total I-QOL survey score 74,6 14,5 30,0 99,1Sub dimensionsPsychosocial influence 85,0 14,7 33,3 100,0Social Isolation 71,0 16,9 24,0 100,0Limitation of behavior 65,1 16,6 25,0 97,5
Table 5Correlation analysis between some characteristics of women and I-QOL (n=90)
DS: Limitation of Behavior, SI: Social Isolation, PE:Psychosocial Influence* Pearson correlation test ** Spearman correlation test
Variables I-QOL Total I-QOL DS I-QOL PE I-QOL SI
Age* R -0,379 -0,403 -0,300 -0,328P <0.001 <0.001 0.004 0.002
BMI* R -0,262 -0,335 -0,110 -0,290P 0.013 0.001 0.303 0.005
Number of births **
R -0,263 -0,264 -0,150 -0,257P 0.012 0.012 0.159 0.014
Durtaion of UI** R -0,254 -0,226 -0,188 -0,278P 0.016 0.032 0.075 0.008
Urinary incontinence frequency **
R -0,616 -0,528 -0,551 -0600P <0.001 <0.001 <0.001 <0.001

60Journal of Clinical Medicine of Kazakhstan: 2021 Volume 18, Issue 6
Karaca and Nur Demir [30], found that the frequency of mixed incontinence was the highest. However, studies conducted in the community and hospitalized individuals in Turkey, Japan, and Sweden have reported that stress UI occurs more frequently than other types (35.9% to 46%) [31-33], consistent with the current study.
In our study, 37.8% of the participants had UI two or three times a week, 10% once a day, and 12.2% persistently. In addition, half of the women had moderate to large amounts of urine leakage. These results confirm the previous studies conducted by Kocak et al., who found that 45.9% had UI less than twice a week, 17.4% 2-3 times a week, 9.9% every day, 13.2% several times a day, and 13.6% more frequently [7], Demir and Beji who reported 41.8% of women had UI once a week or less, 33.2% 2-3 times a week, 15.1% once a day, 9.9% a few times a day [2].
The consequences of UI include physical, social, and psychological issues. However, different studies have shown that only one-fourth of women seek help, and most women take no action [8,34,35]. Our findings in the present study indicated that the duration of UI was on average four years, and the daily life of women was moderately affected (X±SS: 5.0±2.5). Nevertheless, 64.4% of the participants stated that they did not consider it a health issue and did not claim help (62.9%). Considering the results of our study, individuals stated that they do not care about this situation to a large extent (91.1%) and they see it as normal (64.3%). In addition, they stated that they don't want to disturb the healthcare personnel for this problem (50%), they are embarrassed to be examined (44.6%), and they thought that there is no treatment (30.4%). These findings suggest that women change their lifestyle instead of receiving professional care to cope with UI. This is confirmed by the fact that those admitted to the hospital mentioned their complaints were present for an average of one year. The average I-QOL score of individuals with incontinence was 74.6±14.5, and it was seen that their quality of life was negatively affected. In the study conducted by Koçak et al. on 1012 women over the age of 18, they found that the mean ICIQ-SF of those with UI was 10.26 [7]. In the study of Ceyhan et al., it was determined that the mean ICIQ-SF score of the individuals was 10.65±4.40 and 80.9% of them experienced urinary incontinence at an uncomfortable level. All these results show strikingly that UI negatively affects the lives of individuals as age increases.
The reasons for ignoring professional help have been previously reported, including the belief that it is normal for the age, privacy concerns, and perception of no cure [34-36]. In our study, the reasons for no admission for care were consistent with the literature. Concerning the coping behaviors of the participants, most patients reported changing underwear more
frequently, pad/diaper use, and fluid restriction. Similar findings were reported by Saleh et al. [37], who reported that women took frequent showers, used pads, changed underwear frequently, and took measures such as reducing fluid intake as a coping behavior. Moreover, Demir and Beji [2] determined that women took precautions such as changing underwear frequently, used pads/diapers, kept the body warm, and avoided lifting heavy work. The present study and previous works have shown that women do not use pelvic muscle exercises (KEGEL) recommended for the treatment of UI [17,38].
Coping behaviors with UI impact women's physical, mental and social health, home, work, and sexual life and reduce the overall quality of life. In the current study, the participants had moderate quality of life scores. Quality of life was most negatively affected by psychosocial influences, social isolation, and limitation of behaviors. There was a statistically significant relationship between age, BMI, number of deliveries, frequency of UI and duration of UI, and quality of life. Similarly, in community-based and hospital-based studies, UI was reported to negatively affect women's quality of life at a mild-moderate level [30-32]. Various studies have shown that increasing age, BMI, number of deliveries, frequency, and duration of UI negatively affect the quality of life [31,32].
It was determined that the quality of life of the individuals in the study due to incontinence was affected in the sub-dimensions. It was determined that the mean of limiting behaviors 65.1±16.6, psychological impact 85.0±14.7 and social isolation 71.0±16.9 points were seriously affected. In the study of Ceyhan et al., I-QOL sub-dimension and total score averages were found to be seriously affected by limiting behaviors 20.00±4.83, psychological effects 29.04±3.78, and social isolation 13.52±3.83 points and overall I-QOL total scores were determined as 63.39±11.26 [39]. This shows that incontinence is a problem that negatively affects the quality of life of women, socially, behaviorally and psychologically, in all areas of the woman's life.
This study has some limitations. First, the sample consists of women over 40 years of age who were admitted to a tertiary care facility in a single center. Therefore, it does not reflect male patients, the general public, and younger aged individuals. Second, UI was determined using subjective assessment.
In conclusion, UI is common among women middle-aged women. Stress type UI was the most common, and the complaints were associated with mixed etiology. Most women do not claim professional help shortly after their symptoms start. UI impacts women's quality of life from many aspects. Evidence-based qualitative and quantitative studies are needed to increase the awareness of women about UI.
References 1. Bilgiç D, Bejı NK, Özbaş A, Çavdar İ, et al. Coping and help-seeking behaviors for management of urinary ıncontinence. LUTS. 2017;9,
9(3), https://doi: 10.1111/luts.12120.2. Demir S, Beji NK. Üriner inkontinanslı kadınlarda yaşam kalitesi ve sağlık arama davranışları. F.N. Hem. Derg. 2015; 23(1), 179-182.
https://doi: 10.17672/fnhd.688213. Chughtai B, Thomas D, Russell D, et al. Prevalence of and risk factors for urinary incontinence in home hospice patients. Eur Urol.
2018; 75(2), 268-271 https://doi: 10.1016/j.eururo.2018.10.027.4. Poomalar GK, Priyadharshini M. Prevalence of urinary incontinence in reproductive women and its impact on quality of life.
IJRCOG.2015;4(5), https://dx.doi.org/10.18203/2320-1770.ijrcog201507105. Seshan V. Coping strategies & self measures adopted by the women with urinary incontinence & its effects on QOL. Obstet Gynecol
Int J. 2016; 5(7): 00187. https://doi: 10.15406/ogij.2016.05.00187 6. Demirci N, Aba YA, Süzer F, et al. 18 yaş üstü kadınlarda üriner inkontinans ve yaşam kalitesine etkileri. Fırat Sağlık Hizmetleri
Dergisi. 2012;7(19),23-37: https://www.researchgate.net/publication/3112741857. Koçak İ, Okyay P, Dündar M, et al. Female urinary ıncontinence in the west of Turkey: Prevelance, risk factors and impact on quality of
life. Eur Urol. 2005;48(4):634-41. https://pubmed.ncbi.nlm.nih.gov/15963633/

61Journal of Clinical Medicine of Kazakhstan: 2021 Volume 18, Issue 6
8. Öztürk GZ, Toprak D, Basa E. 35 yaş üzeri kadınlarda üriner inkontinans sıklığı ve etkileyen faktörlerin değerlendirilmesi. Şişli Etfal Hastanesi Tıp Bülteni. 2012; 46: 170-6.
9. Yücel Ü, Hadımlı A, Çakır-Koçak Y, et al. Bornova’da yaşayan 20 yaş ve üzeri kadınlarda üriner inkontinans prevelansı ve risk faktörleri. Arch Health Sci Res. 2018; 5: 414-423. https://doi: 10.17681/hsp.385265
10. Öz Ö, Altay B. Üriner inkontinans risk faktörleri ve hemşirelik yaklaşımı. İnönü Üniversitesi Sağlık Bilimleri Dergisi. 2017; 6 (1), 34-37.
11. Çetinel B, Özkan B, Can G. [The validation study of ICIQ-SF Turkish version]. Türk Üroloji Derg. 2004;30(3):332-8.12. Akkuş Y. 18 yaş üstü kadınlarda üriner inkontinans sıklığı, tipi, şiddeti, risk faktörleri ve yaşam kalitesine etkisinin değerlendirilmesi.
Yüksek Lisans Tezi, Yıldırım Beyazıt Üniversitesi Sağlık Bilimleri Enstitüsü, Hemşirelik Anabilim Dalı. 2014.13. Acar NB. Üriner inkontinansı olan yaşlı kadınlarda yaşam kalitesi ve depresyon arasındaki ilişki. Yükseklisans Tezi, Mersin Üniversitesi
Sağlık Bilimleri Enstitüsü, Hemşirelik Anabilim Dalı. 2010.14. Ghafouri A, Alnaimi AR, Alhothi HM, et al. Urinary incontinence in Qatar: A study of the prevalence, risk factors and impact on quality
of life. Arab J Urol. 2014; 12(4): 269–274. https://doi.org/10.1016/j.aju.2014.08.00215. Howard F, Steggall M. Urinary incontinence in women: Quality of life and help-seeking. Br J Nurs. 2010; 19(12):742-749. https://doi
10.12968/bjon.2010.19.12.48651. 16. Kök G, Şenel N, Akyüz A. GATA jinekoloji polikliniğine başvuran 20 yaş üstü kadınların üriner inkontinans açısından farkındalık
durumlarının değerlendirilmesi. Gülhane Tıp Dergisi. 2006; 48(3), 132-136.17. Göral S. Akdeniz bölgesi huzurevlerinde yaşayan kadınlarda üriner inkontinans ve yaşam kalitesi. Yükseklisans Tezi, Akdeniz
Üniversitesi Sağlık Bilimleri Enstitüsü, Hemşirelik Anabilim Dalı. 2014.18. Wojtowicz U, Płaszewska-Zywko L, Stangel-W ´ ojcikiewicz ´K, Basta A. Barriers in entering treatment among women. Ginekol Pol.
2014; 85(5) doi: 10.17772/gp/1734.19. Delarmelindo RCA, Parada CMCGL, Rodrigues RAP, Bocchi SCM. Women’s strategies for coping with urinary incontinence. Rev Esc
Enferm USP[İnternet]. 2013;47(2):296-303. http://www.scielo.br/pdf/reeusp/v47n2/en_04.pdf 20. Ertem G. Üriner inkontinanslı hastaların hastalığıyla başa çıkma yollarının incelenmesi. Uluslararası İnsan Bilimleri Dergisi. 2009;
6(1), 177-18721. Li FL, Low LP, Lee DT. Chinese women's experiences in coping with urinary incontinence. J Clin Nurs. 2007;16(3):610-2. https://doi
10.1111/j.1365-2702.2006.01755.x. PMID: 1733553722. Wagner TH, Patrick DL, Bavendam TG, Martin ML, Buesching DP. Quality of life of persons with urinary incontinence: development
of a new measure. Urology. 1996;47(1):67-71; discussion 71-2https://doi 10.1016/s0090-4295(99)80384-7. PMID: 8560665. 23. Patrick DL, Martin ML, Bushnell DM, Yalcin I, Wagner TH, Buesching DP. Quality of life of women with urinary incontinence:
further development of the incontinence quality of life instrument (I-QOL). Urology. 1999;53(1):71-6. https://doi 10.1016/s0090-4295(98)00454-3. Erratum in: Urology 1999;53(5):1072. PMID: 9886591.
24. Özerdoğan NÖ, Beji NK. Eskisehir, Bilecik, Afyon, Kütahya illerinde 20 yaş ve üstü kadınlarda üriner inkontinansın prevalansı, risk faktörleri, yaşam kalitesine etkisi. Florence Nightingale Hemşirelik Dergisi. 2003; 13(51):37-50.
25. Organization WH. Physical status: The use of and interpretation of anthropometry, Report of a WHO Expert Committee. World Health Organization; 1995.
26. Nygaard CC, Schreiner L, Morsch TP, Saadi RP, Figueiredo MF, Padoin AV. Urinary Incontinence and Quality of Life in Female Patients with Obesity. Rev Bras Ginecol Obstet. 2018;40(9):534-539. English. doi: 10.1055/s-0038-1670626. Epub 2018 Sep 19. PMID: 30231292.
27. Gözükara F, Koruk I, Kara B. Urinary incontinence among women registered with a family health center in the Southeastern Anatolia Region and the factors affecting its prevalence. Turk J Med Sci. 2015;45(4):931-9. doi: 10.3906/sag-1410-31. PMID: 26422870.
28. Thubert T, Deffieux X, Letouzey V, Hermieu JF. Obesity and urogynecology: a systematic review. Prog Urol. 2012;22(8):445-53. French. doi: 10.1016/j.purol.2012.03.009. Epub 2012 May 30. PMID: 22732579.
29. Sykes D, Castro R, Pons ME, Hampel C, et al. Characteristics of female outpatients with urinary incontinence participating in a 6-month observational study in 14 European countries. Maturitas. 2005; 30(52), https://doi.org/10.1016/j.maturitas.2005.09.003
30. Karaca BŞ, Demir AN. Üriner inkontinansın kadın hastalarda yaşam kalitesi ve duygu durum üzerine etkisi ve hastaların egzersiz farkındalık düzeyleri. Med. J. Ankara Tr. Res. Hosp. 2019; 52(2), 133-137.
31. Kocaöz S, Talas MS, Atabekoǧlu CS. Urinary incontinence among Turkish women: An outpatient study of prevalence, risk factors, and quality of life. J Wound Ostomy Continence Nurs. 2012;39(4):431-9. https://doi 10.1097/WON.0b013e318259c42b.
32. Lasserre A, Pelat C, Guéroult V, Hanslik T, et al. Urinary incontinence in french women: prevalence, risk factors, and impact on quality of life. Eur Urol. 2009; 56(1), https://doi.org/10.1016/j.eururo.2009.04.006
33. Samuelsson E, Victor A, Svärdsudd K. Determinants of urinary incontinence in a population of young and middle-aged women. Acta Obstet Gynecol Scand. 2000; 79(3), https://doi.org/10.1034/j.1600-0412.2000.079003208.x
34. Hägglund D, Walker-Engström LM, Larsson G, Leppert J. Reasons why women with long-term urinary incontinence do not seek professional help: A cross-sectional population-based cohort study. Int Urogynecol J Pelvic Floor Dysfunct. 2007; 14(5), https://doi 10.1007/s00192-003-1077-9
35. Horrocks S, Somerset M, Stoddart H, Peters TJ. What prevents older people fom seeking treatment for urinary incontinence? Aqualitative exploration of barriers to the use of community community continence services. Family Practice. 2004; 21(2), https://doi.org/10.1093/fampra/cmh622
36. Kang Y, Crogan NL. Social and cultural construction of urinary incontinence among Korean-American elderly women. Geriatr Nurs. 2008; 29(2). doi: 10.1016/j.gerinurse.2008.01.002. PMID: 18394511.
37. Saleh N, Bener A, Khenyab N, Al-Mansori Z, Al Muraikhi A. Prevalence, awareness and determinants of health care-seeking behaviour for urinary incontinence in Qatari women: A neglected problem?. Maturitas. 2005; 50(1). doi: 10.1016/j.maturitas.2004.04.003
38. Güvenç G, Kocaöz S, Kök G. Quality of life in climacteric Turkish women with urinary incontinence. Int J Nurs Pract. 2016;22(6):649-659. https://doi.org/10.1111/ijn.12495
39. Ceyhan Ö, Göriş S, Zincir H. Yaşlı bireylerde uykuyu etkileyen önemli bir problem:inkontinans. Sağlık Bilimleri Dergisi (Journal of Health Sciences). 2018; 27(1): 29-35.

62Journal of Clinical Medicine of Kazakhstan: 2021 Volume 18, Issue 6
Original Article DOI: https://doi.org/10.23950/jcmk/11345
JOURNAL OF CLINICAL MEDICINE OF KAZAKHSTAN (E-ISSN 2313-1519)
AbstractAim: The purpose of this cross-sectional study was to explore a possible
relationship between exercise capacity and somatotype components, body composition, and quadriceps strength in individuals with coroner artery disease (CAD)
Material and methods: A convenient sample size of 60 participants between the ages of 45 and 60 years (mean age 56.6±4.7; 12 females [mean age 57.7±3.01], 48 males [mean age; 56.3±5.1] was established from patients referred to the Department of the Cardiopulmonary Rehabilitation. The exercise was assessed using graded symptom-limited exercise testing while Participants' body composition was detected via Bioelectrical impedance analysis (BIA) technique by using TANITA SC-330 (TANITA, Tokyo, Japan). Finally, quadriceps femoris muscles testing was conducted with Dr. Robert W. Lovett’s manual muscle testing method.
Results: In the whole sample, exercise capacity was found to be negatively and weakly correlated with the endomorph component (r=-0.39), whereas a slight and positive correlation was observed between the ectomorph component and exercise capacity (r=0.28). However, the correlations revealed between exercise capacity and somatotype components differentiated with gender-based analysis. A moderate and weak correlation was found out between exercise capacity and fat mass (FM) in the whole group and the male individuals (r1=-0.45 and r2=-0.34), respectively; in contrast, there was not a meaningful correlation between the same variables in the female individuals (r=-0.002). Exercise capacity had slight and negative relationships with free-fat mass variable (FFM) in both gender (r1=-0.28 and r2=-0.29), while small to moderate relationship with fat-mass variable (FM) in the male gender (r1=-0.34). Body composition elements, including FM, FFM and BMI, together explained a % 24 of variance in exercise capacity, while somatotype components together explained a % 16 of variance in the exercise capacity. Finally, quadriceps femoris strength was found to be the best predictor of exercise capacity of a patient with CAD (R2=0.44 or % 44)
Conclusion: Our results suggest that exercise capacity in individuals with CAD is directly associated with somatotype components, anthropometry/body composition elements, and quadriceps strength.
Key words: aerobic capacity, fat mass index, body mass index, coronary artery disease, peak metabolic equivalent
Received: 2021-08-04. Accepted: 2021-11-09
The relationship between the exercise capacity and somatotype components, body composition, and quadriceps strength in individuals with coronary artery diseaseMelike Gültekin1, Gülay Yeginoglu2, Hasan Bingol3
1 Department of Anatomy, Institute of Health Science, Karadeniz Technical University, Trabzon, Turkey2 Department of Anatomy, Faculty of Medicine, Karadeniz Technical University, Trabzon, Turkey3 Department of Therapy and Rehabilitation, Vocational School of Health Services, Mus Alparslan University, Muş, Turkey
Corresponding author: Hasan Bingol. E-mail:[email protected]/[email protected]; ORCID: 0000-0003-3185-866X
IntroductionCoronary artery disease (CAD) is a significant
cardiovascular disorder, which is the leading cause of death in both developed and developing countries [1]. Furthermore, because of both its most common causal factor of death in both genders and leading to diseases and social-economic burden, CAD is a significant health problem [2]. Although recently published reports have demonstrated
promising decreases in the mortality rate associated with the CAD, it remains a dominant causal factor for morbidity and mortality in many communities [3]. There are many risk factors for CAD, including both modifiable risk factors such as high blood pressure, high blood cholesterol level, smoking, diabetes, overweight or obesity, lack of physical activity, unhealthy diet, stress, and conventional risk factors such as age, sex, family history, and race [4]. In other words,
J Clin Med Kaz 2021; 18(6):62-68

63Journal of Clinical Medicine of Kazakhstan: 2021 Volume 18, Issue 6
biological, physiological, biochemical, environmental, and genetic risk factors are possible risk factors leading to a range of clinical phenotypes of cardiovascular diseases by interacting with one another [5]. Also, lifestyle has been found to play an essential role in developing such cardiovascular diseases [6]. The fact that the adiposity and muscularity are significantly associated with increased CAD [7] requires investigation of the possible relationship between somatotype components and coronary artery disease further. Previously, a possible relationship between somatotype components and anaerobic performance was reported in a cross-sectional study conducted by Ryan-Stewart et al. [8], indicating a significant correlation between somatotype ratings and anaerobic performance.
The relationship between physique and cardiovascular disease (CVD) has been previously investigated extensively; particularly, a possible relationship between body mass index (BMI) and coronary heart disease (CHD) has been frequently examined in cross-sectional studies [3,9,10]. A positive association was identified between morphological typology (somatotype) and muscle strength in children aged 10 to 11.5 years [11]. Ultimately, a relationship between body composition, peripheral muscle strength, and functional exercise capacity has been reported in a study by Hillman et al. [12], revealing that muscle strength and body mass might be predictive factors of functional exercise capacity. However, the body of evidence in this subject area is still insufficient and needs to be furthermore investigated. Additionally, aerobic capacity, described as a unit of metabolic equivalents (METs) or an estimate of the maximal oxygen uptake at a given workload, is one of the most common factors to predict a possible cardiovascular disease in healthy people [13,14]. As well, exercise capacity is known to be an important outcome for mortality in patients with cardiovascular disease as well as in healthy individuals [15]. Moreover, muscle strength, a significant component of physical fitness, has an essential role in preventing CAD. The existing evidence has suggested that muscle strength loss might lead to lower physical conditions and therefore reduced exercise capacity [16,17].
Despite these abundant findings, a possible relationship between exercise capacity and somatotype, body composition, and quadriceps femoris muscle strength remains to be determined. Therefore, our focus in this observational study was to explore a possible association between exercise capacity and somatotype, body composition, and quadriceps femoris in individuals with CAD.
Material and methodsSubjects
This current study was conducted in Cardiopulmonary Rehabilitation Unit of Trabzon Ahi Evren Thoracic and Cardiovascular Surgery Training and Research Hospital. The study protocol was approved by the Ethical Committee of the Faculty of Medicine of the Karadeniz Technical University for scientific research with the registration number of 24237859/187. The convenient sample size for this current cross-sectional study consisted of 60 individuals with CAD between the ages of 45 and 60 years (mean age; 56.6±4.7: 12 females [mean age; 57.7±3.01], 48 males [mean age; 56.3±5.1], who volunteered for this study. During the enrollment to the study, each patient was thoroughly informed about the study procedure, including testing procedures they would be gone through via illustrative and informative explanations. Furthermore, patients were asked to inform researchers whether they had a significant medical condition except for CAD. Also, each participant’s medical doctor was asked whether their patients had a critical medical
condition preventing them from conducting testing procedures. After insightful explanations, written informed consent was obtained from all patients who accepted to participate in our study. This current study’s process complied with the provisions of the Helsinki Declaration. Inclusion criteria: diagnosed with coronary artery disease by coronary angiography, at least three months after possible revascularization surgery, no habit of regular exercise, no smoking, using the same group of drugs, and having communication skills. Exclusion criteria: uncontrolled sinus tachycardia (> 120 beats/min), congestive heart failure, acute systemic disease or fever, orthostatic hypertension, uncontrolled diabetes (blood glucose> 400 mg/dl), unstable angina, thrombophlebitis, new embolism, endocarditis, acute pericarditis, severe cardiac rhythm disturbances, severe LV dysfunction, aortic dissection, severe aortic stenosis, resting systolic blood pressure >200mmHg, resting diastolic blood pressure> 110mmHg, uncontrolled atrial or ventricular arrhythmia, acute myocardial infarction (first two days) Left ventricular EF <50%, severe orthopedic impairment preventing walking and running, and balance-visual-cognitive impairment.
MeasurementsA physical therapist with ten years’ experience conducted
all measurements following standard procedures for each measurement under a senior medical doctor's supervision. The aim of the study was meticulously described to the patients who met inclusion criteria. Furthermore, before the assessment process, it was ensured that each participant was familiar with the testing procedures and equipment used. Finally, the reliability of the assessments was established by conducting several rehearsal assessments before the actual evaluation. There were no dropouts or adverse events throughout the study period.
Exercise capacityThe clinical exercise testing has been used to assess peak
aerobic capacity to detect a potential risk of CAD for many years [18]. The evaluation of peak aerobic capacity was carried out using graded symptom-limited exercise testing, which incorporates a treadmill (GG treadmill), blood pressure module, pulse analyzer system, and an electrocardiographic monitor, according to the American heart association exercise testing guidelines [19]. All study participants were evaluated according to the Bruce ramp protocol, a valid measurement approach for maximal aerobic capacity where patients initiate exercising at 1.7 mph per hour on a 10% grade [20]. In line with the Bruce protocol, the incline and speed of the treadmill were augmented every three minutes through a total of 7 phases. General principles for conducting the exercise testing regarding contraindications and reasons for stopping tests were established according to ACC/AHA guidelines for exercise testing by Gibbons et al. [19]. In accordance with this protocol, test sessions were terminated if the subjects displayed subjective unbearable symptoms (angina, dyspnea, and fatigue), abnormalities of rhythm and blood pressure, marked and progressive ST-segment deviation, or when they were not able to maintain [21]. Metabolic equivalent (MET), blood pressure (BP), and heart rate values (HR) were obtained throughout the testing sessions. The 12 lead ECG was being monitored continuously during the exercise test. Body composition assessment
Anthropometric measurements are a widely accepted reliable method to provide knowledge about the body's size and proportion of body fat and muscles by measuring body width, length, skinfold thickness (SF), and circumference (C)

64Journal of Clinical Medicine of Kazakhstan: 2021 Volume 18, Issue 6
[22]. Anthropometry was carried out on the right side of each participant’s body in conformity with the previously reported guidelines [7]. Body composition was measured via Bioelectrical impedance analysis (BIA) technique, using TANITA SC-330 (TANITA, Tokyo, Japan), a useful tool for body composition analysis in healthy adults and children [23]. The following BIA variables were obtained: body weight, percent body fat (% BF/FM), fat-free mass (FFM, kg). The body mass index (BMI) was calculated by dividing weight by the square of the subjects' height. Each participant was classified as “underweight,” “normal weight,” “overweight,” and “obese,” using the universal standard BMI equation [24].
Manual muscle testing for knee extensionManual muscle testing is the most common test used as
a reliable non-invasive and inexpensive method for assessing muscle strength in clinical settings [24]. In this study, quadriceps femoris (QF) muscles testing was conducted with Dr. Robert W. Lovett’s manual muscle testing method. This test classifies muscle strength in six levels, with a higher level indicating normal power (5, normal, and 0, total paralysis) [25]. Before the actual assessment, each participants was c informed about the test procedure in detail. The participant was seated on a chair with the hips and knees flexed at 90º, arms crossed on the chest, and was asked to straighten the dominant knee. Muscle strength was evaluated and recorded by giving values between 0 and 5 to the muscle resistance against gravity position and applied force. Previous research has revealed that manual muscle testing evaluation positively correlates with isokinetic dynamometry [26].
Somatotype ratingThe somatotype is a dominance in the human body related
to the concept of body shape, the evaluation methodology of which was first developed by Sheldon to define the variations in the human body. However, the method evolved by the Heath and Carter is now used to categorize the human physique based on the three-level scale, including endomorph, mesomorph, and ectomorph [3]. The somatotype components were determined based on the measurement of 16 parameters according to standard methods recommended by the International Society for the Advancement of Kinanthropometry [27]. Data from the anthropometric evaluations, including body height, values of the diameter, bicondylar width of femur and humerus, triceps, subscapular, supraspinal/ suprailiac and medial calf skinfold thickness (SF), arm and calf circumferences, body mass, were used to define characteristics of the human body (somatotype), by using Heath-Carter anthropometric somatotype method for anthropometric examination [28]. The skinfold thickness (SFs) was evaluated using the baseline skinfold caliper 12-1110 [29]. Knee and elbow widths were defined using the Holtain anthropometer set (Holstein Ltd., Crymych, Dyfed, Wales, UK). Weights were measured via Tanita body composition analyzer device (Tanita SC 330). Calf and arm circumferences were evaluated through the baseline circumference [30]. Finally, height was measured using the stadiometer (Denis -S200). Somatotype program v.1.2.6 established by Heath-Carter principles was utilized to describe somatotype values. According to the Heath-Carter classification system, the endomorphic component is characterized by a large subcutaneous fat deposit, while mesomorphic component describes a large bone mass and musculature. Finally, ectomorphic component signify a physique with slim or linear type [31]
Statistical analysisAll statistical analyses were carried out using the SPSS
25.0 package program. Descriptive data for the exercise capacity, somatotype components, BMI, FM, FFM, QF strength, and the ratio of each gender were given as percentage or mean and standard deviation, using descriptive statistics. Visual (histogram, probability plots), analytical method with Shapiro-Wilk test were performed to investigate whether or not that the variables were normally distributed. As well, the distortion or asymmetry of the data was investigated using kurtosis and skewness analyses. For these analyzes, a value range between 3 and + 3 was accepted for skewness and a value range of 10 to +10 for kurtosis. As the measurements ‘variables were either normally or non-normally distributed, both the Pearson and Spearman correlation coefficient (r) were used to reveal the strength of a linear association between exercise capacity and somatotype components, body composition, and quadriceps strength variables. Since the MET values were not normally distributed, the Mann-Whitney U test was used to compare this parameter between quadriceps femoris strength of 4 and 5. Finally, univariate, and multivariate linear regression analyses were performed to investigate the extent to which variables contributed to exercise capacity. A significance level of p <0.05 was used in the analysis of the data.
ResultsSixty patients with CAD (female=12 and male=48) were
included in the study. Table 1 outlines participants' baseline characteristics, including age, percentage of gender, MET, anthropometric variables, somatotype components by gender, mean body fat, BMI, and QF strength.
Table 1Descriptive Data of Exercise Capacity, Somatotype Components, BMI, Body Fat, and Quadriceps Strength
MET-Metabolic Equivalent; BMI-Body Mass Index; % FM-Percentage of Fat Mass; FFM-Free-Fat Mass
n=60 Mean, SDAge, years (Total)Female (n=12)Male (n=48)Weight (kg)Height (cm)
56.3±5.157.7±3.0156.3±5.186.3±14.4167.5±7.8
MET(Min-Max)
10.8±1.8 (7–13.5)
Endomorph(Min-Max)
6.3±1.3(2.8–9)
Mesomorph(Min-Max)
7.2±1.4 (4.3-11.5)
Ectomorph(Min-Max)
0.5±0.7 (-1.8-2.8)
FFM (kg)(Min-Max)
59.1±8.9 (36.8–79)
%FM(Min-Max)
30.9±8.2 (14.8–54)
BMI (kg/m²)(Min-Max)
30,7 ± 5,1 (21,7 – 49,6)
Quadriceps strength(Min-Max)
4.4±0.5 (4–5)
Distribution of Somatotype Within Gender Group
Endomorphic-mesomorphic
Mesomorphic-endomorphic
Total
Gender Male 27 (56.3%) 21 (43.8%) 48Female 3 (25.0 %) 9 (75.0 %) 12
Total 30 (50.0 %) 30 (50.0 %) 60

65Journal of Clinical Medicine of Kazakhstan: 2021 Volume 18, Issue 6
According to BMI values, the study subjects were from normal weight to obese (range of the BMI: 21,7 – 49,6 and mean BMI: 30,7±5,1). In the male sample, 27 (56.3%) presented with a body habit of endomorph-mesomorph, while 21 (43.8%) were characterized as mesomorph-endomorph. Of the female participants, 3 (25.0%) had an endomorph-mesomorphic body habit while 9 (75.0%) had a mesomorph-endomorphic one. On the other hand, the distribution of physical habits in the total sample was the same (50%). The participants of the study showed levels of both endomorph and mesomorph rather than ectomorph. In other words, endomorph and mesomorph were significantly dominant somatotype components compared with the ectomorph (6.3±1.3; 7.2±1.4; 0.5±0.7)
In the whole sample, exercise capacity was found to be negatively and weakly correlated with the endomorph and mesomorph components (r1=- 0.39 and r2=-0.23). In contrast, a positive and slight correlation was observed between the exercise capacity and ectomorph component (r=0.28). However, the correlations revealed between exercise capacity and somatotype components differentiated with gender-based analysis. For example, the relationship between exercise capacity and ectomorph component was trivial in male individuals (r=0.1), whereas significant in female individuals (r=0.71). Negatively moderate and weak correlations were found between exercise capacity and FM in the whole and male individuals (r1=-0.45 and r2=-0.34), respectively; on the other hand, there was no meaningful correlation between the same variables in the female individuals (r=-0.002). As for the correlation between exercise capacity and BMI, it was revealed a negative and moderate
Table 2Correlations between exercise capacity and somatotype components, FM, FFM, and BMI
MET-Metabolic Equivalent; BMI-Body Mass Index; % FM-Percentage of Fat Mass; FFM- Free-Fat Mass
MET
%FM FFM BMI (kg/m²) Endomorph Mesomorph EctomorphTotal (n=60) r = -0.45 r = -0.12 r = -0.42 r = - 0.39 r = -0.23 r = 0.28Male (n=48) r = -0.34 r = -0.28 r = -0.38 r = - 0.34 r = -0.14 r = 0.1Female (n=12) r = -0.002 r = -0.29 r = -0.55 r = -0.19 r = -0.33 r = 0.71
Table 3Comparison of Exercise Capacity (MET) by Quadriceps Femoris (QF) Strength
MET-Metabolic Equivalent; SD-Standard Deviation; QF-Quadriceps Femoris
QF: 4 QF: 5 Z P
METMean SD Mean SD
-5.458 0.0009.76 1.55 12.21 1.13
Figure 1a - Box Plot of Exercise Capacity by Quadriceps Femoris Muscle Strength
correlation between exercise capacity and BMI in the whole sample (r=-0.42). Based on the gender groups, exercise capacity was negatively and slightly correlated with the BMI in the male group (r=-0.38) and moderately in the female group (r=-0.55). (Table 2). A statistically significant difference was found between the MET variables for different QF muscle strengths (p<0.001) (Table 3). In other words, the mean MET values of individuals with muscle strength of 5 was significantly higher than those with muscle strength 4 (Figure 1).
Univariate regression analysis, conducted to investigate the influence of independent variables on exercise capacity separately, demonstrated that BMI, FM, and QF strength explained % 17, % 20, and % 44 of variance in exercise capacity testing score, respectively. For the remainder of the dependent variables, it was not found out any remarkable variance explained. As for multivariate analyses, body composition elements, including FM, FFM and BMI, together explained a % 24 of variance in exercise capacity testing score, while somatotype components together explained a % 16 of variance in the exercise capacity. Finally, QF strength was found to be the best predictor of exercise capacity of patient with CAD (R2=0.44 or % 44) (Table 4).
Table 4Univariate and Multivariate Regression Analyses on Exercise Capacity, Somatotype Components, Body Composition, and Quadriceps Strength
MET-Metabolic Equivalent; BMI-Body Mass Index; FM-Percentage of Fat Mass; FFM-Free-Fat Mass; QF-Quadriceps Femoris; NA-Not Applicable; R2-Explained Variance (%); df-Degree of Freedom
DiscussionIn the whole sample, exercise capacity was negatively and
slightly related to the endomorph and mesomorph components while positively and slightly related to the ectomorph component. Likewise, in the global approach, exercise capacity was found to be negatively and moderately correlated with fat mass and
BMI; on the contrary, no significant relationship was revealed between exercise capacity lean body mass. Body composition indices, including BMI, FM, and FFM, together explained % 24 of variance in the exercise capacity testing score, whereas somatotype components explained % 16 of variance in the exercise capacity testing score.
Univariate Analysis Multivariate analysis
Exer
cise
Cap
acity
(MET
R R2 df F t p-value B Adjusted R2 p-valueBMI 0.42 0.17 1 12.405 -3.522 0.001 -0.15
0.24 0.001FM 0.45 0.20 1 15.058 -3.88 0.000 -0.102FFM 0.11 0.01 1 0.811 0.901 0.37 0.024
Endomorph 0.39 0.15 1 10.995 -3.316 0.002 -0.550.16 0.02Mesomorph 0.23 0.05 1 3.287 -1.813 0.07 -0.288
Ectomorph 0.28 0.08 1 5.216 2.284 0.02 0.66QF 0.66 0.44 1 46.607 6.827 0.000 2.452 NA NA

66Journal of Clinical Medicine of Kazakhstan: 2021 Volume 18, Issue 6
As mentioned afore, as an atherosclerotic disease of the cardiovascular system, CAD has been reported one of the most causal factors of morbidity and mortality in both developed and developing countries [32]. Also, CAD has been demonstrated to be one of the essential factors of the disability [33]. Although advanced preventative and therapeutic approaches have significantly decreased the severity of the prognosis of cardiovascular diseases over the last decades [32]; however, CAD and related cardiovascular system diseases remain a vital risk of death in the global population. Physical bodily characteristics or body habitus, including fat-free mass, total body fat, subcutaneous fat pattern, somatotype (body shape), and relative weight and height (BMI measurements), have been reported as potential risk factors of cardiovascular diseases [3, 9]. Importantly, exercise or peak aerobic capacity was demonstrated to be a substantial prognostic factor in patients with or at risk of cardiovascular diseases [15, 34].
To date, many research focused on potential associations between somatotype components and cardiovascular diseases [3, 7, 35]. Furthermore, a previous study by Malina et al.[36] investigated possible relationships between somatotype components and cardiovascular risk factors in healthy adults, showing low to moderate relationships between these variables. As a result, considering that somatotype components are the important predictors of CAD [37], the varying degree of relationships between exercise capacity and somatotype components reported in this current study were not surprising. Marta et al.’s study [38] demonstrated that that the prevalence of coronary heart diseases in males was three times higher for endomorphic-mesomorphs than dominant ectomorphs. Similar to this result, we found that CAD was less relevant to ectomorph component than to endomorph-mesomorphic dyads. These additional results of our study confirmed that individuals characterized by ectomorphic dominance would be at a lower risk of coronary heart disease or CAD than their endomorphic-mesomorphic peers. In other words, in this current study, the aerobic capacity of participants qualified with the ectomorphic component was found to be greater than those with endomorphic-mesomorphic body habits. Another study [39] suggesting that the dominant somatotype affects exercise capacity and explosive strength in prepubescent children is closely related to our research results. The findings of a study demonstrating that the endomorph component negatively affects exercise capacity [40] are in line with these results of our study. In conclusion, considering that exercise capacity is a strong prognostic factor for cardiovascular diseases and mortality [15, 41, 42], it is vital to identify factors that negatively affect exercise capacity to improve or change them.
The modestly and inverse relationship between body fat percentage and exercise capacity in the current study can be attributed to the fact that a higher than normal body fat ratio may contribute less to energy production [43, 44]. As well, the relationship between body fat and endomorph physique [39] confirm this meaningful relationship. As a result, the present results add to the evidence that increased fat mass is intimately related to with decreased exercise capacity [39, 45]. Gorant et al.[46] suggested that body fat did not influence VO2max or peak exercise capacity. However, our study results on the relationship between body fat and exercise capacity contradicted these study results. Surprisingly, this meaningful relationship between exercise capacity and body fat ratio in the general population differed by gender factor: While our study's findings
show that body fat percentage negatively affects exercise capacity in men individuals, no such effect was found in women. This surprising result can be attributed to the small number of women in our study. Many researchers have reported that high BMI and increased body fat percentage in different populations adversely affect exercise capacity and physical fitness [47, 48]. Thus, a similar relationship exists in individuals with coronary artery disease, reinforcing that high BMI and increased body fat percentage predispose them to cardiovascular diseases. In this current study, it was found that knee extensor muscle strength was positively correlated with aerobic capacity. High lower extremity muscle strength paves the way for better exercise capacity; it results in less development of cardiovascular disease and consequently a lower risk of death. While the research on this subject mostly includes studies conducted on healthy individuals [49, 50], studies on individuals with coronary artery disease are extremely limited. Therefore, our study results reveal the relation between knee extensor muscle strength and right side in individuals with coronary artery disease to the limited literature. As a result, physical activity habits that increase physical fitness, as previously reported [24], are highly likely to reduce the risk of sudden cardiac death and acute myocardial infarction. It is critical in reducing coronary artery disease risk by keeping physical fitness parameters at an optimal level [51]. Also, a meta-analysis study conducted on this subject reported that Exercise-based cardiac rehabilitation reduced morbidity and mortality by 20-25% [52].
Study limitationsDespite its novel findings, our study may have several
limitations. Firs, almost all the relationships between exercise capacity and dependent variables differentiated with gender-based statistical analysis. This may have very likely arisen from the small number of female patients. Later, all study participants were randomly recruited from the patients referred to the Cardiopulmonary Rehabilitation Unit of Trabzon Ahi Evren Thoracic and Cardiovascular Surgery Training and Research Hospital. Thus, further research is needed to investigate this subject in a broader population with CAD.
ConclusionThe current study was the first to explore the relationship
between exercise capacity and body composition, somatotype components, and QF muscle strength in patients with CAD. Exercise capacity was found out to be negatively related to the endomorph and mesomorph components, suggesting that endomorphic-mesomorphs physique may negatively influence patients' aerobic capacity with CAD. In contrast, exercise capacity was revealed to be positively associated with the ectomorph physique, demonstrating that little fat mass may positively affect the exercise capacity. Likewise, in patients with CAD, exercise capacity was negatively and modestly associated with body fat mass and BMI, showing that lower body weight and adiposity in patients with CAD is essential. On the other hand, there was no meaningful relationship between exercise capacity and lean body mass. Finally, a significant and positive relationship between QF muscle strength and exercise capacity was revealed. In other words, quadriceps femoris strength might be a predictor of exercise capacity in patient CAD. Consequently, we suggested that somatotype components, adiposity, body composition, and QF muscle strength are meaningfully related to exercise capacity in the population with CAD.

67Journal of Clinical Medicine of Kazakhstan: 2021 Volume 18, Issue 6
References 1. Abubakar I, Tillmann T, Banerjee A. Global, regional, and national age-sex specific all-cause and cause-specific mortality for 240 causes
of death, 1990-2013: a systematic analysis for the Global Burden of Disease Study. Lancet.2013; 385:117-171. doi: 10.1016/S0140-6736(14)61682-2. Epub 2014 Dec 18.
2. Members WG, Go AS, Mozaffarian D, Roger VL, Benjamin EJ, Berry JD, et al. Heart disease and stroke statistics—2013 update: a report from the American Heart Association. Circulation. 2013; 127:e6. doi: 10.1161/CIR.0b013e31828124ad.
3. Williams S, Jones E, Bell W, Davies B, Bourne M. Body habitus and coronary heart disease in men: A review with reference to methods of body habitus assessment. Eur Heart J.1997;18(3):376-93. doi: 10.1093/oxfordjournals.eurheartj.a015258.
4. Hajar R. Risk factors for coronary artery disease: historical perspectives. Heart Views. 2017;18(3):109-114. doi: 10.4103/HEARTVIEWS.HEARTVIEWS_106_17.
5. Girelli D, Martinelli N, Peyvandi F, Olivieri O. Genetic architecture of coronary artery disease in the genome-wide era: implications for the emerging “golden dozen” loci. Semin Thromb Hemost. 2009;35(7):671-82. doi: 10.1055/s-0029-1242721.
6. Rosengren A, Hawken S, Ôunpuu S, Sliwa K, Zubaid M, Almahmeed WA, et al. Association of psychosocial risk factors with risk of acute myocardial infarction in 11 119 cases and 13 648 controls from 52 countries (the INTERHEART study): case-control study. Lancet. 2004; 11-177. doi: 10.1016/S0140-6736(04)17019-0.
7. Williams SR, Goodfellow J, Davies B, Bell W, McDowell I, Jones E. Somatotype and angiographically determined atherosclerotic coronary artery disease in men. Am J Hum Biol. 2000;12(1):128-138. doi: 10.1002/(SICI)1520-6300(200001/02)12:1<128::AID-AJHB14>3.0.CO;2-X
8. Ryan-Stewart H, Faulkner J, Jobson S. The influence of somatotype on anaerobic performance. PloS one. 2018 ;13(5):e0197761. doi: 10.1371/journal.pone.0197761.
9. Bastien M, Poirier P, Lemieux I, Després J-P. Overview of epidemiology and contribution of obesity to cardiovascular disease. Prog Cardiovasc Dis. 2014;56(4):369-81. doi: 10.1016/j.pcad.2013.10.016.
10. Pagidipati NJ, Zheng Y, Green JB, McGuire DK, Mentz RJ, Shah S, et al. Association of obesity with cardiovascular outcomes in patients with type 2 diabetes and cardiovascular disease: Insights from TECOS. Am Heart J. 2020;219:47-57. doi: 10.1016/j.ahj.2019.09.016.
11. Marta C, Marinho D, Costa A, Barbosa T, Marques M. Somatotype is more interactive with strength than fat mass and physical activity in peripubertal children. J Hum Kinet. 2011;29A:83-91. doi: 10.2478/v10078-011-0063-4.
12. Hillman C, Heinecke E, Hii J, Cecins N, Jenkins S, Eastwood P. Relationship between body composition, peripheral muscle strength and functional exercise capacity in patients with severe chronic obstructive pulmonary disease. Intern Med J. 2012;42(5):578-81. doi: 10.1111/j.1445-5994.2012.02771.x.
13. Maeder M, Muenzer T, Rickli H, Brunner-La Rocca H, Myers J, Ammann P. How accurately are maximal metabolic equivalents estimated based on the treadmill workload in healthy people and asymptomatic subjects with cardiovascular risk factors? Int J Sports Med. 2008;29(8):658-63. doi: 10.1055/s-2007-989319.
14. Kozlov S, Caprnda M, Chernova O, Matveeva M, Alekseeva I, Gazdikova K, et al. Peak responses during exercise treadmill testing using individualized ramp protocol and modified Bruce protocol in elderly patients. Folia Med (Plovdiv). 2020; 31;62(1):76-81. doi: 10.3897/folmed.62.e49809.
15. Myers J, Prakash M, Froelicher V, Do D, Partington S, Atwood JE. Exercise capacity and mortality among men referred for exercise testing. N Engl J Med. 2002; 4;346(11):793-801. doi: 10.1056/NEJMoa011858.
16. Kamiya K, Mezzani A, Hotta K, Shimizu R, Kamekawa D, Noda C, et al. Quadriceps isometric strength as a predictor of exercise capacity in coronary artery disease patients. Eur J Prev Cardiol. 2014;21(10):1285-91. doi: 10.1177/2047487313492252.
17. Volaklis KA, Halle M, Meisinger C. Muscular strength as a strong predictor of mortality: a narrative review. Eur J Intern Med. 2015 ;26(5):303-10. doi: 10.1016/j.ejim.2015.04.013.
18. Rodgers GP, Ayanian JZ, Balady G, Beasley JW, Brown KA, Gervino EV, et al. American College of Cardiology/American Heart Association clinical competence statement on stress testing: a report of the American College of Cardiology/American Heart Association/American College of Physicians–American Society of internal medicine task force on clinical competence. Circulation. 2000;102(14):1726-38. doi: 10.1161/01.cir.102.14.1726.
19. Gibbons RJ, Balady GJ, Beasley JW, Bricker JT, Duvernoy WF, Froelicher VF, et al. ACC/AHA guidelines for exercise testing: a report of the American College of Cardiology/American Heart Association task force on practice guidelines (committee on exercise testing). J Am Coll Cardiol. 1997;30(1):260-311. doi: 10.1016/s0735-1097(97)00150-2.
20. Banerjee A, Newman DR, Van den Bruel A, Heneghan C. Diagnostic accuracy of exercise stress testing for coronary artery disease: a systematic review and meta-analysis of prospective studies. Int J Clin Pract. 2012;66(5):477-92. doi: 10.1111/j.1742-1241.2012.02900.x.
21. Fletcher G, Ades P, Kligfield P, Arena R, Balady G, Bittner V,et al. Exercise standards for testing and training: a scientific statement from the American Heart Association. Circulation. 2013;128(8):873-934. doi: 10.1161/CIR.0b013e31829b5b44. Epub 2013 Jul 22.
22. Wang J, Thornton J, Kolesnik S, Pierson Jr. Anthropometry in body composition: an overview. Ann N Y Acad Sci.2000;904:317-26. doi: 10.1111/j.1749-6632.2000.tb06474.x.
Disclosures: There is no conflict of interest for all authors.Acknowledgements: The authors are gratitude to all
study participants for their commitment to research timeline and requirements and Prof Dr. Gamze ÇAN for her valuable contribution. Since this current study featured a cross-sectional study, we have not required to obtain a clinical trial registration number. There is no financial support to report..
Funding: None.Ethics approval: The study protocol was approved by the
Ethical Committee of the XXX University for scientific research with the registration number of 24237859/187.
Consent to participate: Informed consent was obtained and signed by all patients.
Consent for publication: All the authors consent for publications.
Data sharing and data availability: The data that support the findings of this study are available from the corresponding author upon reasonable request.

68Journal of Clinical Medicine of Kazakhstan: 2021 Volume 18, Issue 6
23. Engin B, Kutlubay Z, Yardımcı G, Vehid HE, Ambarcıoğlu P, Serdaroğlu S, et al. Evaluation of body composition parameters in patients with psoriasis. Int J Dermatol. 2014;53(12):1468-73. doi: 10.1111/ijd.12171.
24. Peterson CM, Thomas DM, Blackburn GL, Heymsfield SB. Universal equation for estimating ideal body weight and body weight at any BMI. Am J Clin Nutr. 2017;105(3):772. doi: 10.3945/ajcn.116.151985.
25. Naqvi U, Sherman AL. Muscle Strength Grading. 3. In: StatPearls [Internet]. Treasure Island (FL): StatPearls Publishing; 2021 –. PMID: 28613779.
26. Bohannon RW. Manual muscle testing: does it meet the standards of an adequate screening test? Clin Rehabil. 2005;19(6):662-7. doi: 10.1191/0269215505cr873oa.
27. Ross W, Marfell-Jones MJ. Kinanthropometry. Physiological testing of the high-performance athlete. 1991; Accessed at:https://books.google.com.tr/books/about/Physiological_Testing_of_the_High_perfor.html?id=t98LAQAAMAAJ&redir_esc=y
28. Yang LT, Wang N, Li ZX, Liu C, He X, Zhang JF, et al. Study on the adult physique with the Heath-Carter anthropometric somatotype in the Han of Xi'an, China. A Anat Sci Int. 2016;91(2):180-7. doi: 10.1007/s12565-015-0283-0. Epub 2015 May 5.
29. Norton K, Olds T. Anthropometrica: a textbook of body measurement for sports and health courses. UNSW press. Accessed at: https://books.google.com.tr/books/about/Anthropometrica.html?id=0amPPwAACAAJ&redir_esc=y
30. Quiterio ALD, Carnero EA, Baptista FM, Sardinha LB. Skeletal mass in adolescent male athletes and nonathletes: relationships with high-impact sports. J Strength Cond Res. 2011;25(12):3439-47. doi: 10.1519/JSC.0b013e318216003b.
31. Bell W, Davies J, Evans W, Scanlon M, Mullen R. Somatic characteristics and cardiovascular risk factors in growth hormone deficiency: A randomized, double-blind, placebo-controlled study of the effect of treatment with recombinant human growth hormone. Am J Hum Biol : The Official Journal of the Human Biology Association. 2004;16(5):533-43. doi: 10.1002/ajhb.20055.
32. Malakar AK, Choudhury D, Halder B, Paul P, Uddin A, Chakraborty S. A review on coronary artery disease, its risk factors, and therapeutics. J Cell Physiol. 2019 Aug;234(10):16812-16823. doi: 10.1002/jcp.28350.
33. Gupta R, Guptha S, Sharma KK, Gupta A, Deedwania P. Regional variations in cardiovascular risk factors in India: India heart watch. World J Cardiol. 2012;4(4):112-20. doi: 10.4330/wjc.v4.i4.112.
34. Malik A, Kanduri JS, Asbeutah AAA, Khraishah H, Shen C, Welty FK. Exercise Capacity, Coronary Artery Fatty Plaque, Coronary Calcium Score, and Cardiovascular Events in Subjects With Stable Coronary Artery Disease. J Am Heart Assoc. 2020;9(7):e014919. doi: 10.1161/JAHA.119.014919.
35. Herrera H, Rebato E, Hernández R, Hernández-Valera Y, Alfonso-Sánchez M. Relationship between somatotype and blood pressure in a group of institutionalized Venezuelan elders. Gerontology. 2004;50(4):223-9. doi: 10.1159/000078351.
36. Malina RM, Katzmarzyk PT, Song TM, Theriault G, Bouchard C. Somatotype and cardiovascular risk factors in healthy adults. Am J Hum Biol. 1997;9(1):11-19. doi: 10.1002/(SICI)1520-6300(1997)9:1<11::AID-AJHB3>3.0.CO;2-T.
37. Salimi HR, Heidari N, Salimi A. The relation between somatotype with aerobic capacity and balance in the boys 11-13 years. Turk J Kin. 2016; 2(2): 23-26 Accessed at: https://dergipark.org.tr/tr/download/article-file/220318
38. Spain D, Nathan D, Gellis M. Weight, body type and the prevalence of coronary atherosclerotic heart disease in males. Am J Med Sci . 1963 Jan;245:63-9. PMID: 13978493
39. Marta CC, Marinho DA, Barbosa TM, Carneiro AL, Izquierdo M, Marques MC. Effects of body fat and dominant somatotype on explosive strength and aerobic capacity trainability in prepubescent children. J Strength Cond Res. 2013;27(12):3233-44. doi: 10.1519/JSC.0000000000000252.
40. Çinarli F, Kafkas M. The effect of somatotype characters on selected physical performance parameters. Physical education of students. 2019;23(6):279-87. https://doi.org/10.15561/20755279.2019.0602
41. Aslanger E, Assous B, Bihry N, Beauvais F, Logeart D, Cohen-Solal A. Association between baseline cardiovascular mechanics and exercise capacity in patients with coronary artery disease. Anatol J Cardiol 2016;16(8):608-613. doi: 10.5152/AnatolJCardiol.2015.6471. Epub 2015 Nov 18.
42. Chang J, Froelicher VF. Clinical and exercise test markers of prognosis in patients with stable coronary artery disease. Curr Probl Cardiol. 1994;19(9):533-87. doi: 10.1016/0146-2806(94)90010-8.
43. İri R, Yılmaz A, Aktuğ Z . The comparison of physical fitness levels and motoric features of elite footballers and handball players. Journal of Sports and Performance Researches. 2017; (1) 8:19-25. Accessed at: https://dergipark.org.tr/tr/download/article-file/1032809.
44. Tuan S, Su H, Chen Y, Li M, Tsai Y, Yang C, et al. Fat mass index and body mass index affect peak metabolic equivalent negatively during exercise test among children and adolescents in Taiwan. Int J Environ Res Public Health 2018 Feb 4;15(2):263. doi: 10.3390/ijerph15020263.
45. Norman A-C, Drinkard B, McDuffie JR, Ghorbani S, Yanoff LB, Yanovski JA. Influence of excess adiposity on exercise fitness and performance in overweight children and adolescents. Pediatrics. 2005;115(6):e690-6. doi: 10.1542/peds.2004-1543.
46. Goran M, Fields D, Hunter G, Herd S, Weinsier R. Total body fat does not influence maximal aerobic capacity. Int J Obes Relat Metab Disord. 2000;24(7):841-8. doi: 10.1038/sj.ijo.0801241.
47. Willig AL, Hunter GR, Casazza K, Heimburger DC, Beasley TM, Fernandez JR. Body fat and racial genetic admixture are associated with aerobic fitness levels in a multiethnic pediatric population. Obesity (Silver Spring). 2011;19(11):2222-7. doi: 10.1038/oby.2011.
48. 48. Hsieh P-L, Chen M-L, Huang C-M, Chen W-C, Li C-H, Chang L-C. Physical activity, body mass index, and cardiorespiratory fitness among school children in Taiwan: a cross-sectional study. Int J Environ Res Public Health. 2014;11(7):7275-85. doi: 10.3390/ijerph110707275.
49. 49. Vaara JP, Kyröläinen H, Niemi J, Ohrankämmen O, Häkkinen A, Kocay S,et al. Associations of maximal strength and muscular endurance test scores with cardiorespiratory fitness and body composition. J Strength Cond Res. 2012;26(8):2078-86. doi: 10.1519/JSC.0b013e31823b06ff.
50. Guclu MB, Ince DI, Arikan H, Savci S, Tulumen E, Tokgozoglu L. A comparison of pulmonary function, peripheral and respiratory muscle strength and functional capacity in the heart failure patients with different functional classes. Anadolu Kardiyol Derg. 2011;11(2):101-6. doi: 10.5152/akd.2011.027.
51. Bruning RS, Sturek M. Benefits of exercise training on coronary blood flow in coronary artery disease patients. Prog Cardiovasc Dis. 2015;57(5):443-53. doi: 10.1016/j.pcad.2014.10.006.
52. Almodhy M, Ingle L, Sandercock GR. Effects of exercise-based cardiac rehabilitation on cardiorespiratory fitness: A meta-analysis of UK studies. Int J Cardiol. 2016;221:644-51. doi: 10.1016/j.ijcard.2016.06.101.

69Journal of Clinical Medicine of Kazakhstan: 2021 Volume 18, Issue 6
Original Article DOI: https://doi.org/10.23950/jcmk/11347
JOURNAL OF CLINICAL MEDICINE OF KAZAKHSTAN (E-ISSN 2313-1519)
AbstractAim: The turnover intention due to low job satisfaction and burnout
and the elimination of the negative effects it causes are of great importance during the pandemic COVID-19 particularly in some countries such as Turkey that public health is concerned, there has been an ongoing effort to improve its background and lack the number of nurses per capita. The aim of this study was to examine the relationship between job satisfaction, burnout, and turnover intention in nurses working in hospitals during the COVID-19 pandemic.
Material and methods: The descriptive research design was applied and conducted in a training and research hospital affiliated to the Ministry of Health in Ankara, Turkey. The subjects consisted of 251 nurses. The data were collected using the Minnesota Satisfaction Questionnaire, the Maslach Burnout Inventory and the Turnover Intention Scale. The Mann-Whitney U test, the Kruskal-Wallis Variance test, and the Structural Equation Modeling were used to analyze the data.
Results: Emotional exhaustion subscale had the greatest effect on turnover intention. An increase in job satisfaction score causes an average decrease on the turnover intention score. The low job satisfaction of the nurses who take care of COVID-19 diagnosed patients has been determined to have negative impact on their turnover intention and burnout.
Conclusion: Job satisfaction, burnout, and turnover intention in nurses were examined and all of these factors were found to be moderate. However, in this study, the job satisfaction of the nurses in caring of patients with COVID-19 infection was lower than that of the nurses who did not.
Key words: job satisfaction, burnout, turnover intention, nurses, COVID-19
Received: 2021-10-19. Accepted: 2021-11-07
Job satisfaction, burnout and turnover intention of nurses working in hospital during the pandemic COVID-19 in TurkeyNukhet Bayer1, Zehra Golbasi1, Yasin Uzuntarla2, Kamile Akarsu3
1Nursing Department, Faculty of Health Sciences, Lokman Hekim University, Ankara, Turkey2Department of Health Management, Gülhane Training and Research Hospital, Ankara, Turkey3Surgery of Nursing Department, Health Services Vocational School, Lokman Hekim University, Ankara, Turkey
Corresponding author: Yasin Uzuntarla. E-mail: [email protected]; ORCID: 0000-0002-5021-3763
IntroductionCOVID-19, a global pandemic has greatly
distressed the lives of millions of people since it first appeared in China in 2019. According to the World Health Organization (WHO), since October 2021, a total of 240 million people infected with the disease and nearly 5 million people died worldwide [1]. Nurses, who provide the majority of healthcare services, are also at the forefront of combating pandemic. It has been seen that the pandemic and the fight against it have psychological effects as well as health-related, social, and economic negative effects on people and societies. The stress of the urgent/unexpected delegation to intensive care units and COVID-19 services, the difficulty of working with protective equipment, the high rate of deaths, the risk of getting sick due to the lack of personal protective
equipment, and most importantly, the fear of infecting family members have had social and psychological effects on nurses [2]. In a study conducted in 34 hospitals in China, it was found that female nurses who provide frontline care to patients with COVID-19 have high levels of depression, anxiety, insomnia, and distress during this period [3]. During the pandemic COVID-19 in Iran, job satisfaction of the healthcare personnel was examined, and it was found that there was higher depression, anxiety, and lower job satisfaction in healthcare personnel whose COVID-19 test results were not known compared to 69.7% of the personnel who were reported to have negative COVID-19 test result. It was also found that the staff who had easier access to protective personal equipment had better physical health outcomes and job satisfaction [4].
J Clin Med Kaz 2021; 18(6):69-75

70Journal of Clinical Medicine of Kazakhstan: 2021 Volume 18, Issue 6
The first detected COVID-19 case in Turkey was announced by the Ministry of Health on March 10, 2020. As of October 2021, a total of 50 thousand people died as a result of COVID-19, while the total number of cases was reported to be 6 million in Turkey [1]. Predictably there has been no research study in this field during the pandemic COVID-19 in Turkey. Even before the pandemic COVID-19, the feeling of burnout, which stood out as an important problem in nurses, has been determined in some studies to be very common among nurses in Turkey as well. It was concluded that as job satisfaction increases, burnout decreases and quality of life increases accordingly [5]. In another study, a strong relationship was found between all elements of burnout and depression, while the depression score was higher in nurses aged thirty years and over with a chronic disease [6].
The feeling of burnout intensely experienced by nurses is defined as energy loss, exhaustion, weakness, and fatigue [7]. Burnout significantly affects institutional performance, patient care quality, patient safety, and as a result, patient health outcomes [8]. In this respect, preventing burnout is critical, because nurses, whose own lives and the lives of their loved ones are at risk, already have high turnover intention and low job satisfaction. Job satisfaction is undoubtedly one of the most important factors that keep them at work [4]. Among the factors affecting job satisfaction are work stress, resilience, perceived organizational support, task-oriented leadership, mobbing, job obligations, insufficient educational opportunities and support, perceived image of the nursing profession, and the sense of discrimination [9, 10].
As it is common in the other countries, nursing shortage is a worrying phenomenon affecting the quality of health services in Turkey as well. Compared to the countries of the Organization for Economic Co-operation and Development (OECD), the number of nurses per 100.00 population remains 301 in Turkey. That is why, Turkey has been ranked the last row among 35 OECD countries in terms of the number of nurses per capita [11]. During the COVID-19 admitting the patients to the hospital has been more than its capacity. Since some of the hospitals have become pandemic hospitals and the number of the nurses remained still the same, it can be concluded that the feeling of burnout in the nurses has risen up and job satisfaction has declined. Based on the data, it can be said that the high number of patients per nurse causes an increase in burnout in nurses and a decrease in job satisfaction. Among the factors that increase turnover intention of the nurses, job satisfaction and burnout have a direct effect on turnover intention. Nurses with low job satisfaction have higher turnover intention [12].
The aim of this study was to examine the relationship between job satisfaction, burnout, and turnover intention in nurses working in hospitals during the COVID-19 pandemic.
Material and methodsThe descriptive research was conducted in a training and
research hospital affiliated to Ministry of Health in Ankara, Turkey. The data of the study were collected in July and August 2020. The subjects of the study consisted of 476 nurses working at the training and research hospital for at least one year. Non-probability sampling method has been applied in the study and has been tried to reach the whole subjects. The subjects consist of the nurses who worked at least one year in the same hospital and were volunteer to participate in the study. From among the whole paper forms collected, after excluding 49 forms, which were missed, left blank and filled incompletely/incorrectly, a total of 251 forms included in the study. The participation rate in the survey was 52.7%.
Data collection toolThe data were collected via a form developed by the
researchers about the personal and professional characteristics of the nurses, the Turnover Intention Scale, Maslach Burnout Inventory and Minnesota Satisfaction Questionnaire.
Turnover Intention Scale (TIS): The scale was developed by Mobley, Horner, and Hollingsworth (1978) to measure employees’ intention to continue to work or quit by self-evaluation. The scale was adapted to Turkish subjects, its reliability and validity were measured [13]. While Cronbach's alpha value was 0.904, it was 0.817 in this study. The scale has 5-point Likert-type in three items and there is no subscale. The type of items ranges from "1" strongly disagree to "5" strongly agree. The turnover intention is calculated by dividing the total score by three.
Maslach Burnout Inventory (MBI): The scale was developed by Maslach and Jackson (1981) and has twenty-two 5-point Likert-type items in three subscales, containing options from ‘strongly disagree’ to ‘strongly agree’. The scale measures burnout in three subscales: Emotional exhaustion, depersonalization, and personal accomplishment. It was translated into Turkish by Ergin in 1992 and its validity and reliability study was calculated [14]. The scale contained 22 items and three subscales. From these subscales, the score of emotional exhaustion is calculated by summing up nine items, the depersonalization subscale score is obtained by adding the five items while personal accomplishment is gained by adding the eight items. In this study, the Cronbach's alpha value of the emotional exhaustion subscale was 0.848, the depersonalization subscale was 0.729, and the personal accomplishment subscale was 0.716.
Minnesota Satisfaction Questionnaire (MSQ): The scale was developed by Weiss et al. in 1967. The Turkish adaptation of the scale was performed by Baycan in 1985. The MSQ has twenty 5-point Likert-type items rated from ‘‘1’’ very dissatisfied to ‘‘5’’ very satisfied. Minnesota satisfaction questionnaire consists of two scales: intrinsic and extrinsic satisfaction. Intrinsic satisfaction score is obtained by dividing the total number of items by twelve and extrinsic satisfaction score is gained by diving the total number of items by eight. General satisfaction is also measured by dividing the total score of the items by twenty. In the present study, the Cronbach’s alpha value of general satisfaction subscale was 0.885, intrinsic satisfaction subscale was 0.824 and extrinsic satisfaction subscale was 0.785.
Statistical analysisResearch analysis was performed using the SPSS (Version
20, Chicago IL, USA) package program. Since the parametric test assumptions were not fulfilled, the Mann Whitney U test was used in paired groups and the Kruskal-Wallis test when there were more than two groups in comparing the similarity of the distributions of MBI, MSQ, and TIS total and subscale scores according to the individual and occupational characteristics of the nurses. In the multiple comparison, Bonferroni Test has been applied. p<0.05 was accepted as statistically significant. Structural Equation Modeling (SEM) was used to explain the effect of MSQ on the MBI subscale and the effect of these subscales on TIS.
Ethical Aspect of the StudyApproval for the study was obtained from Lokman
Hekim University Non-Interventional Clinical Research Ethics Committee (Decision number 2020/62 and Code no:

71Journal of Clinical Medicine of Kazakhstan: 2021 Volume 18, Issue 6
2020058). Written permission was obtained from the hospital administrations where the study was conducted. The nurses invited to the study were informed about the purpose of the study, and those who gave consent to be volunteers were included in the study. Nurses' credentials were not written on the data collection forms.
ResultsThe sociodemographic characteristics of the participants
are presented in Table 1. It was observed that 77.69% of the nurses were women and 22.31% were men. Their average age was 30.53±7.69 years.
Mean MSQ score was 2.85±0.57 (min=1; max=4.25). MSQ intrinsic satisfaction mean score was measured as 3.00±0.60 (min=1; max=4.25) and extrinsic satisfaction mean score was 2.62±0.64 (min=1; max=4.38). MBI emotional exhaustion mean score was 29.48±6.45 (min=13; max=45), depersonalization mean score was 11.94±2.92 (min=5; max=23), and personal accomplishment mean score was 28.12±4.15 (min=16; max=37,00). TIS mean score was 2.53±1.05 (min=1; max=5) (Table 2).
Table 3 presents the sociodemographic and professional characteristics of the nurses in relation with their average scores from the MSQ, MBI, and TIS. There was a negative linear and very weak correlation between age and the MBI depersonalization score (r=-0.143; p=0.023). There was a very weak linear positive correlation between age and the TIS score (r=0.133; p=0.036). There was a statistically significant difference between mean personal accomplishment scores of the group in terms of the status of having children (p<0.05). Personal accomplishment mean score of the nurses with children was statistically higher than that of those with no children. There was statistically significant difference in MSQ total and subscale scores in terms of being a nurse by their own choice (p<0.05). The MSQ total, intrinsic satisfaction, and extrinsic satisfaction mean scores were higher than those of the nurses who were reluctant to became a nurse (p<0.05), but their MBI emotional exhaustion and depersonalization mean scores were lower (p<0.05).
Table 1 Distribution of nurses by some sociodemographic characteristics
Variables n %Age 30.53±7.69Sex
Female 195 77.69Male 56 22.31
Education StatusVocational Health High School 35 13.94Associate Degree 31 12.35University Degree 177 70.52Master’s Degree 8 3.19
Marriage StatusMarried 109 43.43Single 142 56.57
Status of having childYes 100 39.84No 151 60.16
Became a nurse by choiceYes 169 67.33No 82 32.67
The number of years as a nurse 7.46±7.89The number of years at the current institution
5.29±6.65
The number of years at the current unit 2.50±2.63Position
Nurse-in-charge 14 5.58Department Nurse 230 91.63Supervisor Nurse 4 1.59Other 3 1.20
Working in the current unit by choice?Yes 178 70.92No 73 29.08
Type of ShiftAlways Day Shift 39 15.54Always Night Shift 9 3.59Shifting (Night+Day) 203 80.88
The Status of Providing Services for Covid-19 Patients in the Unit
Yes 203 80.88No 48 19.12
Table 2
MSQ: Minnesota Satisfaction Questionnaire, MBI: Maslach Burnout Inventory, TIS: Turnover Intention Scale
MSQ, MBI and TIS mean scores of the nurses
Scales Mean Standard Deviation Minimum MaximumMSQ 2.85 0.57 1.00 4.25
Internal Satisfaction 3.00 0.60 1.00 4.25External Satisfaction 2.62 0.64 1.00 4.38
MBIEmotional Exhaustion 29.48 6.45 13.00 45.00Depersonalization 11.94 2.92 5.00 23.00Reduced Personal Accomplishment
28.12 4.15 16.00 37.00
TIS 2.53 1.05 1.00 5.00
Mean TIS scores of the nurses who became a nurse by their own choice were lower than those who were reluctant to became a nurse. A directional very weak relationship was observed between the duration of working life as a nurse and depersonalization score (r=-0.162; p=0.010). There was a weak directional relationship between the duration of working life as a nurse and personal accomplishment and TIS scores (r=0.133;
r=0.128, respectively, p<0.05). There were statistically significant differences between working in the unit by their own choice and MSQ, extrinsic satisfaction, emotional exhaustion, and TIS means scores (p<0,05). MSQ total and extrinsic satisfaction scores of the nurses working in their units by their own choice were higher than those were reluctant to work in their units (p<0.05). Emotional exhaustion and TIS mean scores of the

72Journal of Clinical Medicine of Kazakhstan: 2021 Volume 18, Issue 6
Tab
le 3
A c
omp
aris
ons
of s
ome
char
acte
rist
ics
of t
he
nu
rses
an
d t
hei
r m
ean
sco
res
from
MSQ
, MB
I an
d T
IS
*Non
-nor
mal
ly d
istr
ibut
ed v
aria
bles
wer
e re
port
ed a
s med
ian
(min
imum
-max
imum
). t:
the
inde
pend
ent s
ampl
es t-
test
, z=
z sc
ore
of M
ann
Whi
tney
U te
st, K
= Kr
uska
l Wal
lis te
st sc
ore,
F: T
he o
ne-w
ay a
naly
sis o
f var
ianc
e F
stat
istic
. The
gro
up m
eans
diff
ered
sign
ifica
ntly
wer
e sh
own
by th
e sa
me
supe
rscr
ipt l
ette
r.
MSQ
: Min
nes
ota
Sati
sfac
tion
Qu
esti
onn
aire
, MB
I: M
asla
ch B
urn
out
Inve
nto
ry, T
IS: T
urn
over
Inte
nti
on S
cale
Vari
able
sM
SQ T
otal
Sco
reM
SQ In
tern
al S
atis
fact
ion
MSQ
Ext
erna
l Sat
isfa
ctio
nM
BI E
mot
iona
l Ex
haus
tion
MBI
Dep
erso
naliz
atio
nM
BI R
educ
ed P
erso
nal
Acco
mpl
ishm
ent
TIS
Mea
n±SD
Test
and
p
valu
eM
ean±
SDTe
st a
nd
p va
lue
Mea
n±SD
Test
and
p
valu
eM
ean±
SDTe
st a
nd
p va
lue
Mea
n±SD
Test
and
p
valu
eM
ean±
SDTe
st a
nd
p va
lue
Mea
n±SD
Test
and
p
valu
e
Age
(yea
r)r=
0.00
4 p=
0.95
2r=
-0.0
03 p
=0.9
57r=
0.01
3 p=
0.83
2r=
0.00
1 p=
0.98
6r=
-0.1
43 p
=0.0
23r=
0.10
5 p=
0.09
8r=
0.13
3 p=
0.03
6
Sex Fe
mal
e2.
81±0
.59
t=-2
.151
p=
0.03
22.
97±0
.62
t=-1
.895
p=
0.05
92.
58±0
.65
t=-2
.134
p=
0.03
429
.35±
6.75
t=-0
.649
p=
0.51
811
.94±
2.98
t=0.
022
p=0.
982
28.0
4±4.
24t=
-0.5
58
p=0.
577
2.58
±1.0
9t=
1.73
0 p=
0.08
6M
ale
2.99
±0.5
03.
14±0
.53
2.78
±0.5
829
.91±
5.31
11.9
3±2.
7228
.39±
3.83
2.35
±0.8
6
Educ
atio
n St
atus
Voca
tiona
l Hea
lth
Hig
h Sc
hool
2.90
(2.0
5-3.
75)
K=0.
251
p=0.
882
3.00
(2.0
0-3.
92)
K=0.
003
p=0.
998
2.50
(1.7
5-3.
75)
K=0.
255
p=0.
880
32(1
8-43
)K=
0.92
9 p=
0.62
913
(6-1
5)K=
7.18
8 p=
0.02
729
(20-
35)
K=2.
413
p=0.
299
3(1-
4.67
)aK=
12.0
17
p=0.
002
Asso
ciat
e De
gree
2.90
(1.2
5-3.
40)
3.08
(1.2
5-3.
58)
2.75
(1.2
5-3.
50)
30(2
0-43
)10
(7-1
9)a
29(2
4-37
)2.
67(1
-5)
Univ
ersi
ty/
Mas
ter’
s D
egre
e2.
90(1
.00-
4.25
)3.
08(1
.00-
4.25
)2.
63(1
.00-
4.38
)29
(13-
45)
12(5
-23)
a28
(16-
37)
2.33
(1-5
)a
Mar
riag
e St
atus
Mar
ried
2.86
±0.5
3t=
0.12
1 p=
0.90
43.
02±0
.56
t=0.
304
p=0.
762
2.61
±0.5
8t=
-0.1
59
p=0.
874
29.2
8±5.
88t=
-0.4
45
p=0.
657
11.4
6±3.
04t=
-2.2
91
p=0.
023
28.5
2±3.
91t=
1.35
1 p=
0.17
82.
61±0
.99
t=1.
027
p=0.
305
Sing
le2.
85±0
.60
3.00
±0.6
32.
63±0
.68
29.6
3±6.
8712
.3±2
.78
27.8
1±4.
312.
47±1
.09
Stat
us o
f hav
ing
child
ren
Yes
2.89
±0.5
4t=
0.93
0 p=
0.35
33.
08±0
.56
t=1.
415
p=0.
158
2.63
±0.6
0t=
0.08
5 p=
0.93
229
.15±
5.74
t=-0
.680
p=
0.49
711
.53±
2.9
t=-1
.803
p=
0.07
328
.81±
3.72
t=2.
160
p=0.
032
2.64
±1.0
4t=
1.34
4 p=
0.18
0N
o2.
83±0
.60
2.97
±0.6
22.
62±0
.66
29.7
±6.8
912
.21±
2.91
27.6
6±4.
362.
46±1
.05
Stat
us o
f bec
omin
g a
nurs
e by
cho
ice
Yes
2.93
±0.5
2t=
2.65
6 p=
0.00
93.
09±0
.54
t=2.
777
p=0.
006
2.68
±0.6
0t=
2.20
6 p=
0.02
828
.24±
6.05
t=-4
.546
p<
0.00
111
.67±
2.96
t=-2
.100
p=
0.03
728
.51±
3.74
t=1.
972
p=0.
051
2.43
±1.0
6t=
-2.1
32
p=0.
034
No
2.71
±0.6
62.
85±0
.68
2.50
±0.7
032
.04±
6.53
12.4
9±2.
7627
.32±
4.81
2.73
±0.9
9
Num
ber
of y
ears
as
a nu
rse
r=0.
049
p=0.
440
r=0.
043
p=0.
500
r=0.
049
p=0.
438
r=-0
.010
p=0
.874
r=-0
.162
p=0
.010
r=0.
133
p=0.
035
r=0.
128
p=0.
043
Num
ber
of y
ears
in
the
unit
r=0.
041
p=0.
516
r=0.
041
p=0.
517
r=0.
034
p=0.
589
r=0.
057
p=0.
370
r=-0
.104
p=0
.101
r=0.
013
p=0.
840
r=0.
091
p=0.
151
Stat
us o
f wor
king
in th
e un
it b
y ch
oice
Yes
2.91
±0.5
7t=
2.20
3 p=
0.02
93.
04±0
.60
t=1.
073
p=0.
284
2.71
±0.6
3t=
3.45
6 p=
0.00
128
.68±
6.27
t=-3
.114
p=
0.00
211
.90±
2.81
t=-0
.316
p=
0.75
228
.31±
4.18
t=1.
130
p=0.
260
2.40
±1.0
1t=
-3.1
42
p=0.
002
No
2.73
±0.5
52.
95±0
.60
2.41
±0.6
131
.42±
6.51
12.0
3±3.
1827
.66±
4.08
2.85
±1.0
6
Stat
us o
f pro
vidi
ng c
are
for
Covi
d-19
pat
ient
s in
the
unit
Yes
2.81
±0.5
7t=
-2.3
76
p=0.
018
2.97
±0.6
0t=
-2.3
01
p=0.
022
2.58
±0.6
2t=
-2.0
61
p=0.
040
29.4
8±6.
21t=
-0.0
01
p=0.
999
11.9
0±2.
82t=
-0.4
43
p=0.
658
28.1
2±3.
95t=
-0.0
09
p=0.
993
2.56
±1.0
4t=
0.94
6 p=
0.34
5N
o3.
03±0
.55
3.19
±0.5
72.
79±0
.67
29.4
8±7.
4612
.10±
3.33
28.1
3±4.
952.
40±1
.08

73Journal of Clinical Medicine of Kazakhstan: 2021 Volume 18, Issue 6
nurses working in their unit by their own choice were lower than those TIS scores of the nurses who became a nurse by their own choice were lower than those who were reluctant to work in their unit (p<0.05). MSQ total, intrinsic satisfaction, and extrinsic satisfaction mean scores of those providing healthcare services to COVID-19 patients in their units were lower than those who did not (p<0.05). No difference was observed between MBI and TIS in terms of the nurses’ status of providing healthcare services to COVID-19 patients in their units (p>0.05).
Structural Equation Modelling (SEM) was used to examine the relationship between the nurses’ job satisfaction, burnout, and turnover intention levels. Figure 1 presents the SEM design. When the fit index values of the structural model established are examined, it is observed that the model has acceptable fit values.
Table 4 presents the estimation results regarding the structural model. The model explains 32.3% of the turnover intention. When the results are evaluated, depersonalization subscale does not affect turnover intention (p>0.05). The emotional exhaustion subscale (β=0.424) has the greatest effect on turnover intention (p<0.05).
DiscussionIn this study, which was conducted to examine the
relationship between job satisfaction, burnout, and turnover intention of the nurses working in the hospital during the COVID-19 pandemic, it was observed that the nurses experienced burnout, emotional exhaustion, depersonalization, and a decrease in personal accomplishment, and half of them had turnover intention. It was found that the general job satisfaction as well as intrinsic and extrinsic satisfaction levels of the nurses were nearly the average. Some studies conducted before the COVID-19 pandemic have shown that nurses’ job satisfaction levels were even at low [15, 16] or medium level [17-20]. In our
Table 4 Structural model estimation results
Dependent Variables Independent Variables
Coefficient Standard Error Standardized Coefficient
t Value (p)
Emotion Exhaustion <--- Minnesota Satisfaction
-6.364 0.588 -0.565 -10.824 <0.001
Depersonalization <--- Minnesota Satisfaction
-1.333 0.311 -0.261 -4.283 <0.001
Personal Accomplishment
<--- Minnesota Satisfaction
2.236 0.436 0.308 5.128 <0.001
Turnover <--- Reduced Personal Accomplishment
-0.054 0.014 -0.212 -3.914 <0.001
Turnover <--- Minnesota Satisfaction
-0.269 0.119 -0.146 -2.258 0.024
Turnover <--- Depersonalization -0.031 0.020 -0.085 -1.505 0.132Turnover <--- Emotional
Exhaustion0.069 0.011 0.424 6.432 <0.001
Figure 1 - Structural Equation Model for the nurses’ job satisfaction, burnout, and turnover intention levels
study, however the average score of job satisfaction, intrinsic and extrinsic satisfaction subscale of the nurses who are caring for patients with COVID-19 has been determined to have scored lower, compared to those who are not. In a similar way, as it has been detected in our study, Savitsky et al., [21] in a study in Israel have been found that the level of job satisfaction of the nurses who take care of patients with COVID-19 was lower than that of the other nurses. The reason for these results can be associated with the tough conditions at the advent of the pandemic disease.
In our study, it was found that nurses experienced burnout. Emotional exhaustion and depersonalization were nearly medium, and personal accomplishment was rather high. However, a high level of professional burnout among nurses before the pandemic in Turkey were revealed in some studies [15, 22, 23]. In addition, many studies all around the world have found that nurses experience moderate to high levels of burnout [24-28]. In India, burnout levels among healthcare personnel were examined during the COVID-19 pandemic, and more than half of the participants (52.8%) had high level of burnout due to the pandemic [29].
Nurses' low job satisfaction and high burnout levels are among the reasons for their turnover intention, which is a global problem all over the world [9, 30]. In some pre-pandemic studies, it was found that more than half of the nurses participating in the study had high turnover intention [5, 31]. In our study, turnover intention scale mean score of the nurses was moderate. Despite the increased workload, stress, and anxiety during the pandemic, the fact that nurses' turnover levels remained at a moderate level, the turnover intention of the nurses can be prevented in case the government pays additional wages to the nurses during the COVID-19 pandemic. In a study, it was found that 45% of nurses were not satisfied with their current job because of their salaries [32]. In Philippine, in a research study during the COVID-19 pandemic, the job satisfaction of the nurses had decreased due to their fear of infection. At the same time, the turnover intention of the nurses had risen up both organizationally and professionally [33].
Job satisfaction of nurses has significantly affected their turnover intention. This outcome becomes even more important in countries, such as Turkey, where there are a relatively low number of nurses per capita. When the results of the Structural Equation Model are examined in our study, the model estimates the 32.3% of the turnover intention. Emotional exhaustion subscale (β=0.424) has the greatest effect on turnover intention. One unit increase in the nurses' job satisfaction score causes an average of 0.013 units of decrease on the turnover intention scale score. In a study comparing nurses' burnout and job

74Journal of Clinical Medicine of Kazakhstan: 2021 Volume 18, Issue 6
References 1. WHO. World Health Organization Coronavirus (COVID-19) dashboard 2021 [Available from: https://covid19.who.
int/?gclid=Cj0KCQjw6-SDBhCMARIsAGbI7Ug8NzsdYJjUkfGwTkwOe5ONLdhB53CxY4vrK72ShR327KgZ7zYzj5caAq96EALw_wcB. / Accessed; October 17, 2021.
2. Cabrera MA, Karamsetty L, Simpson SA. Coronavirus and its implications for psychiatry: A rapid review of the early literature. Psychosomatics. 2020;61(6):607-15. doi: 10.1016/j.psym.2020.05.018
3. Lai CC, Shih TP, Ko WC, Tang HJ, Hsueh PR. Severe acute respiratory syndrome coronavirus 2 (SARS-CoV-2) and coronavirus disease-2019 (COVID-19): The epidemic and the challenges. Int J Antimicrob Agents. 2020;55(3):105924. doi: 10.1016/j.ijantimicag.2020.105924
4. Zhang SX, Liu J, Afshar Jahanshahi A, Nawaser K, Yousefi A, Li J, et al. At the height of the storm: Healthcare staff's health conditions and job satisfaction and their associated predictors during the epidemic peak of COVID-19. Brain Behav. Immun. 2020;87:144-6. doi: 10.1016/j.bbi.2020.05.010
5. Çelik M, Yıldız B. Occupational commitment, identification and intention to leave of nurses: Public Sector and private sector comparison. Kastamonu Üniversitesi İktisadi ve İdari Bilimler Fakültesi Dergisi. 2018;20(2):47-57. doi:iibfdkastamonu.343309
6. Bakir B, Ozer M, Ozcan CT, Cetin M, Fedai T. The Association between burnout, and depressive symptoms in a Turkish military nurse sample. Bulletin of Clinical Psychopharmacology. 2010;20:160-3.doi: 10.1080/10177833.2010.11790651
7. Leiter MP, Maslach C. Latent burnout profiles: A new approach to understanding the burnout experience. Burn. Res. 2016;3(4):89-100.doi:10.1016/j.burn.2016.09.001
8. Ross J. The exacerbation of burnout during COVID-19: A major concern for nurse safety. J Perianesth Nurs. 2020;35(4):439-40. doi: 10.1016/j.jopan.2020.04.001
9. Lo W-Y, Chien L-Y, Hwang F-M, Huang N, Chiou S-T. From job stress to intention to leave among hospital nurses: A structural equation modelling approach. J. Adv. Nurs. 2018;74(3):677-88. doi: 10.1111/jan.13481
10. Gillet N, Fouquereau E, Coillot H, Bonnetain F, Dupont S, Moret L, et al. Ethical leadership, professional caregivers' well-being, and patients' perceptions of quality of care in oncology. Eur J Oncol Nurs. 2018;33:1-7. doi: 10.1016/j.ejon.2018.01.002
11. HSY. Health Statistics Yearbook The Ministry of Health of Turkey Health Statistics Yearbook 2018. [Available from: https://dosyasb.saglik.gov.tr/Eklenti/36164,siy2018en2pdf.pdf?0. / Accessed; September 17, 2021.
12. Chan ZCY, Tam WS, Lung MKY, Wong WY, Chau CW. A systematic literature review of nurse shortage and the intention to leave. J. Nurs. Manag.2013;21(4):605-13. doi: 10.1111/j.1365-2834.2012.01437.x.
13. Örücü E, Özafşarlioğlu S. The influence of organizational justice on the turnover intention: A study in the Republic of South Africa. Mustafa Kemal University Journal of Social Sciences Institute. 2013;10 (23):335-58.
14. Ergin C. Doktor ve Hemşirelerde Tükenmişlik ve Maslach Tükenmişlik Ölçeğin Uyarlanması. VII Ulusal Psikoloji Kongresi Bilimsel Çalışmaları El Kitabı. 1992:143-54.
15. Uzun LN, Mayda AS. Investigation of burnout levels in nurses according to different variables: Example of a universty hospital. Konuralp Med J. 2020;12(1):137-43. doi: 0.18521/ktd.493186
satisfaction levels, it was found that each subscale had a statistically significant relationship with each other [34]. It has been found that there has been a negative relationship between depersonalization subscale and turnover intention of the nurses. This can be interpreted as high depersonalization that can causes low turnover intention. Besides, job satisfaction of the nurses causes positive consequences in terms of organizational and professional performance. The high level of job satisfaction of the nurses has an impulsive impact on their intention to keep at work.
While some studies found a positive relationship between job satisfaction and nurses' low intention to keep them at work [35, 36], a negative relationship was found between emotional exhaustion and depersonalization and their intention to continue to work. Higher emotional exhaustion and depersonalization plays an important role in turnover intention of the nurses. Accordingly, an increase in emotional exhaustion and depersonalization causes an increase in turnover intention. Furthermore, job satisfaction in nurses has positive results on both organizational and professional levels. Job satisfaction is a very effective driving force in keeping nurses at work. Organization-based self-esteem, social support, and job satisfaction have a mediating effect on nurses' low turnover intention [37]. The mediating effect of job satisfaction in the relationship between professional identity and turnover among nurses was investigated and it was determined that job satisfaction had a full mediating effect on the impact of professional identity on turnover intention [38]. Job satisfaction and emotional/normative professional commitment
have positive effect on nurses’ low turnover intention [5, 39]. It was found that perceived organizational support, job control, and job satisfaction had positive predictive effects on low turnover intention, and also, job satisfaction and job control had a mediating effect on the model of intention to continue [40].
The research results are limited to the hospital where the research was conducted. One of the most significant limitations of the study is the low rate of participation that is 52.7%.
ConclusionAs a result, job satisfaction, burnout and turnover intention
of the nurses were at medium level. When the fit index values of the established structural model are examined, it is observed that the model has acceptable fit values. The emotional exhaustion subscale of the MBI has the greatest effect on turnover intention scale. The hospital management and decision makers should reduce the turnover intention of nurses by creating working conditions that will increase the job satisfaction and reduce their burnout, especially during the COVID-19 pandemic.
Disclosures: There is no conflict of interest for all authors.
Acknowledgements: We would like to thank all nurses for participating in this study.
Funding: None.

75Journal of Clinical Medicine of Kazakhstan: 2021 Volume 18, Issue 6
16. Kaçan CY, Örsal Ö, Köşgeroğlu N. Determination of job satisfaction levels among nurses. Hemşirelikte Araştırma Geliştirme Dergisi. 2016;18(2-3):1-12.
17. Kelleci M, Gölbaşı Z, Doğan S, Ata EE, Koçak E. The relationship of job satisfaction and burnout level with quality of life in hospital nurses. Cumhuriyet Medical Journal. 2011;33:144-52.
18. Çelik Y, Kiliç İ. The relationships between job satisfaction, professional burnout and quality of life in nurses. Kocatepe Medical Journal. 2019;20:230-8. doi: 10.18229/kocatepetip.444706
19. Aytekin A, Yilmaz Kurt F. Factors affecting the job satisfaction of nurses working in the neonatal intensive care unit. Journal of Dr Behcet Uz Children's Hospital. 2014;4(1):51-8. doi: 10.5222/buchd.2014.051
20. Aksoy NM. Job satisfaction and affecting factors of surgical unit nurses of 3 different hospitals in a province in mediterranean region. Journal of Education and Research in Nursing. 2013;10(2):45-53.
21. Savitsky B, Radomislensky I, Hendel T. Nurses' occupational satisfaction during Covid-19 pandemic. Appl Nurs Res. 2021;59:151416. doi: 10.1016/j.apnr.2021.151416
22. Kebapci A, Akyolcu N. The effects of the work environment on nurse burnout in emergency department. Turk. J. Emerg. Med. 2011;11(2):59-67. doi: 10.5505/1304.7361.2011.43827
23. Özmen Z. An investigation into the burnout levels of nurses by means of maslach burnout inventory: A sample from Bursa Sevket Yilmaz education and research hospital nurses. Istanbul: T.C. Beykent Üniversitesi; 2016.
24. Lasebikan VO, Oyetunde MO. Burnout among nurses in a Nigerian General Hospital: Prevalence and associated factors. International Scholarly Research Network ISRN Nurs. 2012;2012:402157. doi: 10.5402/2012/402157
25. Kelly LA, Gee PM, Butler RJ. Impact of nurse burnout on organizational and position turnover. Nurs Outlook. 2021;69(1):96-102. doi: 10.1016/j.outlook.2020.06.008
26. Rudman A, Arborelius L, Dahlgren A, Finnes A, Gustavsson P. Consequences of early career nurse burnout: A prospective long-term follow-up on cognitive functions, depressive symptoms, and insomnia. EClinicalMedicine. 2020;27:100565. doi: 10.1016/j.eclinm.2020.100565
27. Woo T, Ho R, Tang A, Tam W. Global prevalence of burnout symptoms among nurses: A systematic review and meta-analysis. J. Psychiatr. Res. 2020;123:9-20. doi: 10.1016/j.jpsychires.2019.12.015
28. Janeway D. The Role of psychiatry in treating burnout among nurses during the Covid-19 pandemic. J Radiol Nurs. 2020;39(3):176-8. doi: 10.1016/j.jradnu.2020.06.004
29. Khasne RW, Dhakulkar BS, Mahajan HC, Kulkarni AP. Burnout among healthcare workers during COVID-19 Pandemic in India: Results of a questionnaire-based survey. Indian J Crit Care Med. 2020;24(8):664-71. doi: 10.5005/jp-journals-10071-23518
30. Roelen CA, Mageroy N, van Rhenen W, Groothoff JW, van der Klink JJ, Pallesen S, et al. Low job satisfaction does not identify nurses at risk of future sickness absence: results from a Norwegian cohort study. Int. J. Nurs. Stud. 2013;50(3):366-73. doi: 10.1016/j.ijnurstu.2012.09.012
31. Haydari SM, Kocaman G, Tokat MA. A survey on the intention of the nurses’ of different generations to leave their job and profession and their organizational and professional commitment. Journal of Health and Nursing Management. 2016;3(3):119-31. doi:10.5222/SHYD.2016.119
32. Zhang L-F, You L-M, Liu K, Zheng J, Fang J-B, Lu M-M, et al. The association of Chinese hospital work environment with nurse burnout, job satisfaction, and intention to leave. Nurs Outlook. 2014;62(2):128-37. doi: 10.1016/j.outlook.2013.10.010
33. Labrague, LJ, de los Santos, J. Fear of COVID-19, psychological distress, work satisfaction and turnover intention among frontline nurses. J Nurs Manag. 2021; 29: 395– 403. doi: 10.1111/jonm.13168
34. Torun T, Çavuşoğlu H. Examining burnout and job satisfaction of nurses working in pediatric units. Journal of Education and Research in Nursing. 2018;15(2):71-80. doi: 10.5222/HEAD.2018.071
35. Al-Hamdan Z, Manojlovich M, Tanima B. Jordanian nursing work environments, intent to stay, and job satisfaction. J. Nurs. Scholarsh. 2017;49(1):103-10. doi: 10.1111/jnu.12265
36. Koy V, Yunibhand J, Angsuroch Y, Fisher M. Relationship between nursing care quality, nurse staffing, nurse job satisfaction, nurse practice environment, and burnout: Literature review. Int J Res Med Sci. 2015:1825-31.doi:10.18203/2320-6012.ijrms20150288
37. Chen M-F, Ho C-H, Lin C-F, Chung M-H, Chao W-C, Chou H-L, et al. Organisation-based self-esteem mediates the effects of social support and job satisfaction on intention to stay in nurses. J. Nurs. Manag. 2016;24(1):88-96. doi: 10.1111/jonm.12276.
38. Zhang B, Xiong S-C, Jiang H-B, Qiu Z-Y. Mediating effect of job satisfaction between professional identity and turnover intention in nurses. Chin. J. Clin. Psychol. 2016;24 (6):1123– 5. doi:10.1371/journal.pone.0258387
39. Satoh M, Watanabe I, Asakura K. Occupational commitment and job satisfaction mediate effort–reward imbalance and the intention to continue nursing. Jpn J Nurs Sci. 2017;14(1):49-60. doi: 10.1111/jjns.12135
40. Li X, Zhang Y, Yan D, Wen F, Zhang Y. Nurses' intention to stay: The impact of perceived organizational support, job control and job satisfaction. J. Adv. Nurs. 2020;76(5):1141-50. doi: 10.1111/jan.14305

76Journal of Clinical Medicine of Kazakhstan: 2021 Volume 18, Issue 6
Original Article DOI: https://doi.org/10.23950/jcmk/11391
JOURNAL OF CLINICAL MEDICINE OF KAZAKHSTAN (E-ISSN 2313-1519)
AbstractAim: Metabolic syndrome develops as a result of a combined effect
of environmental factors and genetics. Therefore, this study is an attempt to detect polymorphisms that influence the development of metabolic syndrome among people of reproductive age in the case of Nur-Sultan.
Material and methods: 128 polymorphisms were selected from those involved in metabolic disorders in other studied populations; further, their effect on developing metabolic syndrome in the focused group was studied. The study involved 717 respondents aged 18 to 49 with an average age of 40.2 years. Out of them, 243 participants were diagnosed with metabolic syndrome with IDF criteria.
Results: Based on the study results, five polymorphisms that influence the development of metabolic syndrome were found: rs7903146, rs157582, rs 4506565, rs7578597, rs4072037. T allele in polymorphisms as rs 7903146 - 1.56 (СI 1.14-2.14; p=0.004), rs 157582 - 1.54 (СI 1.16-2.04; p=0.001), rs 4506565 - 1.5 (СI 1.1-2.03; p=0.007), rs 7578597 - 1.59 (СI 1.02-2.46; р=0.016) increases the risk of metabolic syndrome development approximately by 1.5 times according to the additive model, whereas C allele by polymorphism rs 4072037 does the risk of MS development by 1.99 (СI 1,1-3,6; р=0,016) times according to the recessive model.
Conclusion: The identified five polymorphisms make it possible to assess the risks of MS and associated diseases.
Key words: metabolic syndrome, polymorphism, allele, genotype
Received: 2021-07-27. Accepted: 2021-11-23
Determination of the association of some polymorphisms with metabolic syndrome in residents of the city of Nur-SultanKamshat Akhmetova1,2, Tamara Vochshenkova1, Erbolat Dalenov2, Aigul Abduldayeva2, Talapbek Azhenov3
Corresponding author: Kamshat Akhmetova. E-mail: [email protected]; ORCID: 0000-0003-4225-3025
IntroductionMetabolic syndrome (MS) is a combination of
biochemical and clinical disorders caused by complex genetic and environmental elements. Genetic factors play a unique role in developing MS, in addition to such factors as malnutrition, hypodynamics, smoking, alcohol use [1]. Initially, MS was considered to be caused by metabolic disorders developed due to poor lifestyles. However, over time, scientists have begun to study the molecular and genetic factors of MS, particularly the gene that causes MS and the polymorphic complex of the components of this syndrome. As a result, genes that control the ethnic characteristics of patients, adipogenesis and inflammatory processes, carbohydrate and lipid metabolism, and a polymorphic complex of MS were established as evidence of genetic factors in the development of MS [2].
It is believed that genetic factors play a decisive role in the development of MS and, accordingly, have become
the subject of active genetic research. The importance of genetic contributions to the development of MS has been proven through family and twin studies. A study involving 2508 pairs of twins showed concordance in the aggregation of three elements (arterial hypertension, diabetes and obesity) MS [3]. According to research, the heritability of MS ranged from 23 to 27% in Europeans, and 51 to 60% in Asians [4]. Many genetic studies have been done to understand the genetic basis of MS and its components. Each component of MC has a significant genetic basis. According to the Northern Manhattan Family Study, heritability was 46% for WC, 24% for fasting glucose levels, 47% for triglyceride levels, 60% for HDL, and 16 and 21% for systolic and diastolic blood pressure [5]. The above data, as well as clustering of metabolic disorders, ethnic or racial differences in the prevalence of MS, prompted studies to look for common genetic determinants of MS [3].
J Clin Med Kaz 2021; 18(6):76-80
1 Сenter of Gerontology, Medical Centre Hospital of President’s Affairs Administration of the Republic of Kazakhstan, Nur-Sultan, Kazakhstan2 Department of Preventive Medicine and Nutrition, Astana Medical University, Nur-Sultan, Kazakhstan3Surgical department №1, Medical Centre Hospital of President’s Affairs Administration of the Republic of Kazakhstan, Nur-Sultan, Kazakhstan

77Journal of Clinical Medicine of Kazakhstan: 2021 Volume 18, Issue 6
Figure 1 - Graphical representation of the panel of genetic polymorphisms (n = 128)
Cho et al. [6] conducted a meta-analysis of 20 large-scale studies associated with metabolic diseases. According to the data, 61 polymorphisms were identified, 26 of which were associated in the European and Asian populations, 18 polymorphisms - only in the European population, and 17 polymorphisms - only in the Asian populations. This proves that there are ethnic differences in the frequencies of the alleles of the studied genes, and it is necessary to conduct separate studies on the Kazakh population.
Thus, this study aims to detect polymorphisms associated with MS among the population of Nur-Sultan.
Material and methodsStudy participants
Permission to conduct research was approved by the local bioethical committee (December 23, 2019, № 4).
Observational analytical one-time horizontal method of research was selected to achieve the goal of the study.
The study involved Nur-Sultan residents of reproductive age. Information consent was obtained from the respondents to participate in the study.
Emergency patients, pregnant women, young people under 18 years old, and adults over 49 years old were not included in the study.
The study involved 717 respondents with an average age of 40.2 years. 243 of them were diagnosed with MS, 474 were included in the control group. The samples in this study were ethnically homogeneous and included only persons of the Kazakh ethnic group in the third generation, which was established based on the results of the questionnaire.
The MS in respondents was revealed through the International Diabetes Federation (IDF) criteria: in addition to abdominal obesity (waist circumference (WC) ≥ 94 cm in men, WC≥80 cm in women), the combination of two of the following four factors are encountered: [7]:
1. High triglyceride levels: ≥150 mg/dl (1.7 mmol/l) or special treatment for this disorder;
2. Low levels of high-density lipoprotein (HDL) : <40 mg/dl (1.03 mmol/l) in men, ˂50 mg/dl (1.29 mmol/l) in women or special treatment for this disorder;
3. High blood pressure: critical systolic blood pressure ≥130 and diastolic blood pressure ≥80 mm Hg or special treatment for arterial hypertension;
4. Increased plasma glucose: ≥100 mg/dl (5.6 mmol/l) or type 2 diabetes mellitus.
Blood chemistryAll test blood samples were taken from patients’ ulnar
veins in the treatment room after 12 hours of fasting. 1000 × g (4C) of plasma was obtained by centrifugation for 10 min and kept at -30 ° C for biochemical analysis. On the day of blood collection, the serum was used for analysis after centrifugation. On the Abbott Architect c 8000 biochemical analyzer (Abbott Laboratories, USA), a glucose level was determined by using glucose-hexokinase, which is liquid chromatography.
Triglyceride and HDL were determined by spectrophotometric method on Abbott Architect c 8000 for biochemical analysis of a blood lipid profile. The results were evaluated in mmol/l.
Isolation of DNABlood was taken from respondents in the laboratory to
determine the occurrence of polymorphisms. Samples taken from the subjects' peripheral blood that was studied through the
reagent kit called PurLink Genomic DNA Mini Kit (Invitrogen, USA) were used to isolate the DNA genome.
The tubes were pre-numbered according to the DNA samples. Then, a Qubit working solution was prepared: the Qubit dsDNA BR reagent was diluted in Qubit dsDNA BR Buffer, 1: 200 for 1 patient.
Then 2 μl was removed from the buffer and reagent mixture and 2 μl of DNA was added. Concentration was measured on a Qubit 4 fluorometer using Qubit dsDNA BR Assay Kits.
GenotypingThe genotyping method is carried out using OpenArray
technology, which is a unique platform for reactions in nanoliter volumes. This technology uses special OpenArray slides. Each slide gives 3072 data points.
For genotyping, previously extracted DNA samples were combined with the reaction mixture in a 384-well sample plate. For 1 sample of the OpenArray Real-time master mix - 3.0 μl; DNA sample - 2.0 μl (concentration 50 ng/μl). The total volume of the reaction mixture per well is 5 μl. Each sample is duplicated. The reaction mixture was thoroughly mixed in the plate using a shaker and centrifuge.
Probes were then developed using the QuantStudio OpenArray AccuFill Plate Configurator. Genotyping plates were supplied with dried assays in the indicated vias. A unique plate was used for the analysis, in which there were 2 allele-specific probes, binding to the minor groove and 2 primers for PCR, to ensure high reliability and accuracy of genotyping calls.
OpenArray technology uses nanoliter fluidics and can be customized with 3.072 through holes in 6 different formats.
Then, in the plate settings file, a protocol was created for the applied samples with information about the analysis. The protocol was loaded into QuantStudio 12K Flex software to create and run the experiment.
The prepared chips were loaded into a QuantStudio 12K Flex using replaceable genotyping units. Then an amplification reaction takes place using microfluidic real-time PCR technology.
The analysis of the data obtained as a result of the amplification reaction is performed using the online tools of the Thermo Fisher Cloud service. According to the results of bioinformatic analysis, the genes under study were classified as homozygous for the major allele, homozygous for the minor allele, and heterozygotes.
Genotyping was performed through a panel consisting of 128 polymorphisms. The location of 128 polymorphisms is demonstrated in Figure 1 (https://www.snp-nexus.org).
In the panel, polymorphisms are located in different regions of chromosomes and various functional and intergenetic regions of genes [7].

78Journal of Clinical Medicine of Kazakhstan: 2021 Volume 18, Issue 6
Statistical analysisStatistical analysis was performed through the program
R statistics (Compare Groups R packages http://www.jstatsoft.org/). The average level of indicators of WC, triglyceride, HDL, blood pressure and glucose were determined using the nonparametric Mann-Whitney test.
Based on the obtained polymorphisms, the absolute and relative values of alleles and genotypes and the level of Hardy-Weinberg (p>0.05) equilibrium were found in respondents with MS and control group. In the SNP proved for the statistical validity and obtained after the Hardy-Weinberg, the values of alleles and genotypes were found in patients with MS and without MS (p<0.05). The genotype-phenotype association was conducted through different hereditary models: dominant, co-dominant, recessive, overdominant, and log-Additive. Five models of heredity were used to determine the genotype-phenotype association. Moreover, the reference (non-hazardous) allele in the analysis is likely to be a significant allele (which is often true); however, a minor allele might occur as well. Therefore, the analysis was conducted on two options (major and minor alleles). Additionally, the analysis was performed through a case-control design based on a generalized linear model (GLM). Since the basis of the genetic model is unknown, the genotype-phenotype association was performed through max 3-statistic [8].
ResultsThe average WC was 99 cm in all respondents, 102 cm
in patients with MS, and 94 cm in the control group (p<0.001). The mean triglyceride value was 1.6 mmol/l in all subjects, 1.8 mmol/l in patients with MS, and 1.2 mmol/l in the control group (p<0.001). The average HDL value was 1.2 mmol/l in all respondents, 1.1 mmol/l in respondents with MS, and 1.4 mmol/l in the control group (p<0.001). Systolic blood pressure in patients with MS was 125 mm Hg and 121 mm Hg in patients without MS. Diastolic blood pressure in the MS group was 82 mm Hg, in the control group was 77 mm Hg (p<0.001). The average fasting glucose level was 5.4 mmol/l in all subjects, 5.7 mmol/l in patients with MS, and 5.1 mmol/l in the control group (p<0.001).
During genotyping, most of the results for alleles corresponded to the Hardy-Weinberg equation (p>0.05). The results that did not complied with the terms of the equation (p≤0.05) have not been applied for further analysis (rs10923931, rs4072037, rs2791713, rs7554672, rs11634397, rs2398162, rs12601991, rs429358, rs4665630, rs7578597, rs13016963, rs2822693, rs1475591, rs1735151, rs1801282, rs181489, rs2737029, rs991316, rs6596140, rs4976790, rs7756992, rs1562430, rs17584499, rs62560775).
Since the statistical significance of differences in alleles and genotypes is at different levels (Table 1), the genotype-phenotype relationship was assessed at the next stage of the work, taking into account different hereditary patterns.
Table 1 Comparative assessment of differences in alleles and genotypes in groups with and without MS
Note: Only the MS association was established, and the five main polymorphisms were demonstrated due to the size of the tableMS+ with metabolic syndromeMS- without metabolic syndrome
Rs chromosome position reference group Allele count allele х2 p ORallele
Genotype count
genotype х2 p
rs4072037 1 155162067 C MS+/MS- T 346 685 | C 134 287
0.56 1.082 [0.844-1.391] | 0.924 [0.719-1.185] (p=0.539)
T/T 121 256 | C/T 104 173 | C/C 15 57
0.02
rs4506565 10 114756041 A MS+/MS- A 416 788 | T 64 184
0.01 1.517 [1.106-2.101] | 0.659 [0.476-0.904] (p=0.0076)
A/A 182 321 | A/T 52 146 | T/T 6 19
0.02
rs7903146 10 114758349 C MS+/MS- C 422 798 | T 58 174
0.01 1.586 [1.143-2.225] | 0.631 [0.45-0.875] (p=0.00476)
C/C 187 330 | C/T 48 138 | T/T 5 18
0.01
rs157582 19 45396219 C MS+/MS- C 404 749 | T 76 223
0.01 1.582 [1.179-2.139] | 0.632 [0.468-0.848] (p=0.0015)
C/C 173 293 | C/T 58 163 | T/T 9 30
0.01
rs7578597 2 43732823 T MS+/MS- C 457 893 | T 23 79
0.01 1.757 [1.076-2.972] | 0.569 [0.337-0.93] (p=0.0215)
C/C 221 418 | T/C 15 57 | T/T 4 11
0.05
Figure 2 - Graphical representation of p values (p.value) in phenotype-genotype associations analysis.
A graphical sample of the statistical accuracy of the obtained results p (p.value) is shown in Figure 2.
Through considering the sex and age of the subjects and without these indicators and relying on the statistical analysis of determining the genotype-phenotype association that was conducted in the ratio of 95% SI and opportunities, 15 polymorphisms with statistical validity in the development of MS were detected: rs7801190, rs11781551, rs4072037, rs11646213, rs181489, rs11868035, rs62106670, rs10923931, rs11787792, rs2791713, rs4072037, rs7578597, rs4506565 (p <0.05).
At the next stage of this study, polymorphisms with genotype-phenotype associations on the hereditary model were analyzed through max 3-statistics. It is the most extensive statistical analysis of the dominant, recessive, and additive models [9] (Table 2).

79Journal of Clinical Medicine of Kazakhstan: 2021 Volume 18, Issue 6
Figure 3 - Location of polymorphisms in chromosomes that influence the development of MS
Table 2The results of the max 3-statistics analysis to identify polymorphisms that influence the development of MS
polymorphism мax 3-statistic p
rs7903146 2.804 0.011
rs157582 3.118 0.004
rs4506565 2.688 0.016
rs7578597 2.371 0.037
rs4072037 2.323 0.044
The max 3-statistics analysis revealed five polymorphisms that affect the development of MS. The results of the identified polymorphisms on the hereditary model are demonstrated in Table 3.
Consequently, the study found out that the risk of MS development is approximately 1.5 times high according to the additive model of the allele in polymorphisms such as rs7903146 - 1.56 (CI 1.14-2.14; p=0.004), rs157582 - 1.54 (CI 1.16-2.04; p=0.001), rs4506565 - 1.5 (CI 1.1-2.03; p=0.007), rs7578597 1.59 (CI 1.02-2.46; p=0.016), whereas it increases by 1.99 (CI 1.1-3.6; p=0.016) according to the recessive model of C allele in the polymorphism rs4072037. Figure 3 shows the chromosome and position of these five polymorphisms (https://www.snp-nexus.org).
Table 3Genotype-phenotype association of polymorphisms that influence the development of MS
Model inheritance
MS- MS+ OR 95CI p
rs7903146 (log-Additive)C/C-C/T-T/T 33.1% 66.9% 1.56 [1.14-2.14] 0.004rs157582 (log-Additive)C/C-C/T-T/T 33.1% 66.9% 1.54 [1.16-2.04] 0.001rs4506565 (log-Additive)A/A-A/T-T/T 33.1% 66.9% 1.5 [1.1-2.03] 0.007rs7578597 (log-Additive)C/C-C/T-T/T 33.1% 66.9% 1.59 [1.02-2.46] 0.029rs4072037 (Recessive)T/T-C/T 93.8% 88.3% 1 0.016C/C 6.2% 11.7% 1.99 [1.1-3.6]
Table 4 Ways leading to the MS development of polymorphisms
Pathways leading to MS р polymorphismPathway ID description effectR-HSA-381771 Synthesis, secretion, and inactivation of
Glucagon-like Peptide-1 (GLP-1)Metabolism of proteins 0,007 rs7903146
R-HSA-400508 Incretin synthesis, secretion, and inactivation Metabolism of proteins 0,008 rs7903146R-HSA-977068 Termination of O-glycan biosynthesis Metabolism of proteins 0,008 rs4072037R-HSA-5205647 Mitophagy Autophagy 0,010 rs157582R-HSA-6782315 tRNA modification in the nucleus and cytosol Metabolism of RNA 0,016 rs7578597R-HSA-1268020 Mitochondrial protein import Protein localization 0,023 rs157582R-HSA-9663891 Selective autophagy Autophagy 0,030 rs157582R-HSA-2980736 Peptide hormone metabolism Metabolism of proteins 0,008 rs4506565R-HSA-72306 tRNA processing Metabolism of RNA 0,039 rs7578597R-HSA-5173105 O-linked glycosylation Metabolism of proteins 0,040 rs4072037R-HSA-1632852 Macroautophagy Autophagy 0,049 rs157582R-HSA-3781865 Diseases of glycosylation Disease 0,052 rs4072037R-HSA-9612973 Autophagy Autophagy 0,014 rs157582R-HSA-5668914 Diseases of metabolism Disease 0,088 rs4072037R-HSA-449147 Signaling by Interleukins Immune System 0,042 rs4072037R-HSA-2980736 Peptide hormone metabolism Metabolism of proteins 0.008 rs4506565R-HSA-3906995 Diseases associated with O-glycosylation of
proteinsDisease 0.006 rs4072037
R-HSA-913709 O-linked glycosylation of mucins Metabolism of proteins 0.005 rs4072037
Three images determining the location of polymorphisms on chromosomes were taken from a popular analytical tool called the SNP nexus [8]. Polymorphisms rs7903146 and rs4506565 are located in 10 chromosomes in the gene TCF7-L2, 2 chromosomes in rs7578597 - THADA gene, 19 chromosomes in rs157582 - TOMM40 gene, and 1 chromosome in rs4072037 - MUC1 gene.
DiscussionBased on the purpose of the study, five main polymorphisms
such as rs7903146, rs157582, rs4506565, rs7578597, rs4072037 that influence the MS development in people of reproductive age in Nur-Sultan were detected.
The risk of MS developement is about 1.5 times high according to the additive model of the allele in polymorphisms such as rs7903146 - 1.56 (CI 1.14-2.14; p=0.004), rs157582

80Journal of Clinical Medicine of Kazakhstan: 2021 Volume 18, Issue 6
- 1.54 (CI 1.16-2.04; p=0.001), rs4506565 - 1.5 (CI 1.1-2.03; p=0.007), rs7578597 1.59 (CI 1.02-2.46; p=0.016), whereas it increases by 1.99 (CI 1.1-3.6; p=0.016) according to the recessive model of C allele in the polymorphism rs4072037.
SNP rs4072037 in the MUC1 gene is located at 1q22 and is synonymous with polymorphism in the second exon of the gene [10]. Rs4072037 is associated with decreased intracellular reactive oxygen species levels, inflammation, and epithelial infection [11]. According to the results of our study, rs4072037 was associated with MS in the Kazakh population.
Based on the literature review results, there is a lack of information on the MS association with polymorphism rs157582. The results of several studies established that the polymorphism rs157582 is associated with cognitive changes [12]. The TOMM40 protein, which encodes the gene in which this polymorphism is located, accumulates ribosomal proteins in the mitochondria by acting as a molecular chaperone and accelerating the movement of ribosomal proteins after their translation [13]. Therefore, it leads to cognitive impairment. The relationship between MS and Alzheimer’s, one of the mental disorders, has been extensively studied. Inflammation in MS leads to inflammation of the nervous system, which aggravates the disease [14].
Phillips and his colleagues found that people with the polymorphism rs7903146 had a higher risk of MS development with decreased insulin sensitivity, abdominal obesity, and hypertension [15]. The effect of this polymorphism on the
formation of MS on the T allele is consistent with a study conducted in Pakistan [7]. Rs7903146 and rs4506565, located in the TCF7-L2 gene, were found to be directly due to the development of diabetes in Qatar [16]. Detection of these polymorphisms can prevent the development of MS and type 2 diabetes. According to the International Diabetes Federation, not every second adult is diagnosed with diabetes [17]. Type 2 diabetes is one of the primary diseases associated with MS.
One of the polymorphisms that influence the development of type 2 diabetes associated with MS is rs7578597. The association of rs7578597 polymorphism with MS disorders was found in Mexicans [18].
Thus, the identified five polymorphisms make it possible to assess the risks of MS and associated diseases.
Disclosures: There is no conflict of interest. Acknowledgements: None.
Funding: Scientific-technical program BR05236375 “Study of genetic risk features of diseases associated with metabolic syndrome in the Kazakh population”.
Scientific-technical program "National program for the introduction of personalized and preventive medicine in the Republic of Kazakhstan"..
References 1. Kang, Y. and J. Kim, Gender difference on the association between dietary patterns and metabolic syndrome in Korean population. Eur
J Nutr. 2016; 55(7):2321-30. https://doi.org/10.1007/s00394-015-1127-32. Biryukova, E.V., Molecular-genetic, hormonal-metabolic and clinical aspects of metabolic syndrome [in Russian]. Abstract. Doctor of
Medical Sciences: 14.00.03. 2009; p. 48.3. Stančáková, A. and M. Laakso, Genetics of metabolic syndrome. Rev Endocr Metab Disord. 2014; 15(4):243-52. https://doi.
org/10.1007/s11154-014-9293-94. Kong, X., et al., The Association of Type 2 Diabetes Loci Identified in Genome-Wide Association Studies with Metabolic Syndrome
and Its Components in a Chinese Population with Type 2 Diabetes. PLoS One. 2015; 10(11):e0143607. https://doi.org/10.1371/journal.pone.0143607
5. Lin, H.F., et al., Heritabilities of the metabolic syndrome and its components in the Northern Manhattan Family Study. Diabetologia. 2005; 48(10):2006-12. https://doi.org/10.1007/s00125-005-1892-2
6. Cho, Y.S., et al., Meta-analysis of genome-wide association studies identifies eight new loci for type 2 diabetes in east Asians. Nat Genet. 2011; 44(1):67-72. https://doi.org/10.1038/ng.1019
7. González, J.R., et al. Maximizing association statistics over genetic models. Genet Epidemiol. 2008; 32(3):246-54.8. Floud, S., et al., Marital status and ischemic heart disease incidence and mortality in women: a large prospective study. BMC Med.
2014;12:42. https://doi.org/10.1186/1741-7015-12-42 9. Abnet, C.C., et al., A shared susceptibility locus in PLCE1 at 10q23 for gastric adenocarcinoma and esophageal squamous cell carcinoma.
Nat Genet. 2010; 42(9):764-7. https://doi.org/10.1038/ng.64910. Yin, L., et al., Human MUC1 carcinoma antigen regulates intracellular oxidant levels and the apoptotic response to oxidative stress. J
Biol Chem. 2003; 278(37): 35458-64. https://doi.org/10.1074/jbc.M30198720011. Driscoll, I., et al., A candidate gene study of risk for dementia in older, postmenopausal women: Results from the Women's Health
Initiative Memory Study. Int J Geriatr Psychiatry. 2019; 34(5):692-699. https://doi.org/10.1002/gps.506812. Willette, A.A., et al., Family history and TOMM40 '523 interactive associations with memory in middle-aged and Alzheimer's disease
cohorts. Alzheimers Dement. 2017; 13(11):1217-1225. https://doi.org/10.1016/j.jalz.2017.03.00913. Pugazhenthi, S., L. Qin, and P.H. Reddy, Common neurodegenerative pathways in obesity, diabetes, and Alzheimer's disease. Biochim
Biophys Acta Mol Basis Dis. 2017; 1863(5):1037-1045. https://doi.org/10.1016/j.bbadis.2016.04.01714. Phillips, C.M., et al., Dietary saturated fat, gender and genetic variation at the TCF7L2 locus predict the development of metabolic
syndrome. J Nutr Biochem. 2012; 23(3):239-44. https://doi.org/10.1016/j.jnutbio.2010.11.02015. Zafar, U., et al. TCF7-L2 rs7903146 polymorphism in metabolic syndrome with and without acute coronary syndrome. J Pak Med
Assoc. 2020; 70(10):1774-1778. https://doi.org/10.5455/JPMA.4548016. O'Beirne, S.L., et al., Type 2 Diabetes Risk Allele Loci in the Qatari Population. PLoS One. 2016; 11(7):e0156834. https://doi.
org/10.1371/journal.pone.015683417. IDF., IDF Diabetes Atlas Eighth Edition. International Diabetes Federation, 2017.18. Gamboa-Meléndez, M.A., et al., Contribution of common genetic variation to the risk of type 2 diabetes in the Mexican Mestizo
population. Diabetes. 2012; 61(12):3314-21.https://doi.org/10.2337/db11-0550

81Journal of Clinical Medicine of Kazakhstan: 2021 Volume 18, Issue 6
Original Article DOI: https://doi.org/10.23950/jcmk/11421
JOURNAL OF CLINICAL MEDICINE OF KAZAKHSTAN (E-ISSN 2313-1519)
AbstractIntroduction: The worldwide spread of coronavirus over the last 20
years has resulted in its becoming a major threat to health. The virus is thought to be a zoonotic disease spread by means of direct and contact transmission. The purpose of this study was to investigate the symptoms, anxiety-depression levels, and quality of life of patients with Covid-19.
Material and methods: This descriptive, cross-sectional research was conducted in an education and research hospital between August and November 2020. An information form, the Hospital Anxiety and Depression Scale, and the Quality of Life Scale were employed as data collection tools. The study was completed with 103 individuals.
Results: The mean age of the patients enrolled in the study was 37.77±10.92 years, and 67% were women. Higher anxiety levels were determined in women compared to men (p=0.001) and in married participants compared to unmarried individuals (p=0.010). Significant negative correlation was determined between anxiety and the Quality of Life Scale sub-parameters of general health, physical health, psychological health, and environment. Positive correlation was found between Covid-19 severity and anxiety, and negative correlation between Covid-19 severity and physical health (p<0.001).
Conclusion: Higher anxiety was determined among women and married patients in this study, and quality of life (in the four sub-parameters) decreased as anxiety increased. Physical health decreased, while anxiety increased, with the severity of Covid.
Key words: anxiety, covid, depression, infection, life quality
Received: 2021-11-10. Accepted: 2021-12-11
A determination of the relationship between the symptoms, hospital anxiety and depression levels, and quality of life patients diagnosed with Covid-19Samet Sayilan1, Aylin Aydin Sayilan2, Melike Demir Doğan3, Emel Çetinkaya4, Nuray Olcayturk5
1Department of Internal Medicine, Medicine Faculty, Kirklareli University, Kirklareli, Turkey2Nursing Department, School of Health Science, Kirklareli University, Kirklareli, Turkey3Faculty School of Health Science, Gumushane University, Gümüşhane, Turkey4Unit of Internal Disease, Kirklareli Educational and Research Hospital, Kirklareli, Turkey5Unit of Infection Disease, Kirklareli Educational and Research Hospital, Kirklareli, Turkey
Corresponding author: Samet Sayilan. E-mail: [email protected]; ORCID: 0000-0002-8959-8381
IntroductionThe novel coronavirus SARS-CoV-2, officially
described as Covid-19 by the World Health Organization (WHO) on 11 February, 2020, is a highly pathogenic virus affecting humans. Molecular techniques, serology, and viral culture are employed as serological diagnostic tools [1].
Although symptoms in diagnosed patients vary from individual to individual, symptoms ranging from mild to severe and worsening from day to day include fever, headache, cough, sore throat, nasal obstruction,
nausea, diarrhea, hoarseness, painful eating-drinking, fatigue, myalgia, and severe respiratory failure [2, 3].
Patients diagnosed with Covid-19 and requiring hospitalization are known to experience psychological as well as physical problems. These patients are reported to experience high levels of anxiety and depression, with anxiety levels increasing still further and mental state worsening in patients with chronic disease and disability [4, 5]. At the same time, studies have reported that patients who have experienced Covid-19 experience more depressive symptoms and problems such as sleep
J Clin Med Kaz 2021; 18(6):81-85

82Journal of Clinical Medicine of Kazakhstan: 2021 Volume 18, Issue 6
disorder compared to other patients, while their mental health is also at risk and they require constant observation [6].
Quality of life, a dynamic characteristic, is an important parameter in the evaluation of health and is known to be closely linked to sociological, psychologial, cultural, and economic factors [7]. Studies have reported that the quality of life and mental health of the great majority of individuals are adversely affected by Covid-19, and that this can in turn trigger depression [8, 9]. It has also been emphasized that this persists even after discharge [10].
While previous studies have more frequently evaluated Covid-19-related symptoms in health workers, the general public, and patients with psychological problems [11-13], and post-discharge studies have been performed, there has to date been no investigation in hospitalized patients diagnosed with Covid-19 [10, 14]. This study was therefore intended to investigate symptoms, anxiety-depression levels, and quality of life in diagnosed patients.
Materials and methodsFollowing receipt of the requisite approvals, data were
collected using a questionnaire to be applied to patients diagnosed with Covid-19 presenting to and being treated at an education and training hospital between 15 August-15 November 2020. All patients giving consent between those dates were included in the study.
The questionnaire consisted of an information form, the HADS, and the WHO Quality of Life Scale.
1. Hospital Anxiety and Depression Scale (HADS)HADS was originally developed by Zigmond and Snaith
in 1983 [15].Its validity and reliability were subsequently confirmed by Aydemir et al. in 1997 [16]. This four-point Likert-type scale measures patient anxiety and depression. HADS contains 14 questions, seven involving anxiety and seven measuring depression.
2. World Health Organization Quality of Life ScaleThe short form of the WHO Quality of Life Scale for Turks
(WHOQOL BREF TR) was used to determine patients’ quality of life. The WHOQOL BREF TR consists of 27 questions. The form reveals individuals’ general health and quality of life (GHQL) and their physical, social, psychological, and environmental well-being. The short from of the Turkish-language Quality of Life Scale (WHOQOLBREF-TR) was developed by the WHO, and Eser et al. (1999) subsequently investigated its validity and reliability for Turkey [17]. The WHOQOLBREF contains 26 questions in four domains (physical, psychological, social relationships, and environmental) selected from the WHOQOL-100.
The requisite approval for the research was obtained from the Turkish Ministry of Health. Ethical committee approval was granted by the Gümüşhane University Scientific Research and Publication Ethics Committee (2020/7).
The patient’s sociodemographic characteristics were expressed using descriptive statistics, means, median, frequencies, and percentage values. Comparisons were made using the t test, Pearson’s Correlation, and Spearman's Correlation for all statistical analyses. A two-sided p value of less than 0.05 was considered statistically significant.
ResultsThe mean age of the patients in the study was 37.77±10.92
years; 67% were women, 70.9% were married, and 28.2% had at least one chronic disease. Almost all patients reported complying with precautions against contagion set out by the Ministry of Health (Table 1).
Table 1Sociodemographic characteristics of the study participants
n %GenderFemale 69 67.0Male 34 33.0Marital status
Married 73 70.9Unmarried 30 29.1Presence of chronic diseaseYes 29 28.2No 74 71.8Have you taken protective measures against the risk of Covid-19 infection?Yes 102 99.0No 1 1.0Have any members of your family been diagnosed with Covid-19? (Mother-Father-Spouse-Child-Brother-Sister) Yes 66 64.1No 37 35.9
The most frequent symptom was fatigue, observed in 76.7% of patients, followed by back and joint pain in 67.0%. In addition, 54.5% of patients experienced headache, 51.5% fever, and 47.6% cough (Table 2).
Table 2Symptoms observed (more than one answer was given)
n %Fever 53 51.5Cough 49 47.6Hoarseness 22 21.4Loss of taste and smell 49 47.6Lack of appetite 49 47.6Fatigue 79 76.7Respiratory distress 18 17.5Sore throat 31 30.1Headache 56 54.4Diarrhea 24 23.3Conjunctivitis 4 3.9Skin eruptions or color changes in the fingers or toes
5 4.9
Back pain 69 67.0Nasal discharge 33 32.0Loss of speech and movement 4 3.9Chest pain 19 18.4
Statistical analysis revealed significant correlation between gender and anxiety levels, with anxiety levels being higher in women than in men (t=3.42, p=0.001). The quality of life subdomains of physical health, psychological health, and environment differed significantly in terms of gender. Physical health was better among women than among men (t=3.37, p=0.001). Psychological health was also better in women than in men (t=-2.80, p=0.006). The environment subdimension was similarly better in women than in men (t=-2.62, p=0.010).
Anxiety was significantly correlated with marital status (t=2.64, p=0.010). Married participants had higher anxiety levels than single individuals. Anxiety levels were also higher among individuals with family members with a history of Covid compared to those with no infected relative (t=2.73, p=0.007).

83Journal of Clinical Medicine of Kazakhstan: 2021 Volume 18, Issue 6
Significant negative correlation was determined between anxiety and all four Quality of Life Scale domains (general health, physical health, psychological health, and environment) (p<0.001). Anxiety levels decreased as general health, physical health, psychological health, and environment-related quality of life increased. Significant negative correlation was determined between depression and the Quality of Life Scale sub-parameters of general health, physical health, psychological health, and environment (p<0.001). Depression levels decreased as general health, physical health, psychological health, and environment-related quality of life increased. A significant negative association was determined between Covid-19 severity and physical health (p<0,001). Physical health improved as the severity of Covid-19 decreased. A positive association was determined between severity of Covid-19 and anxiety levels (p<0.001). Anxiety levels rose in line with Covid-19 severity (Table 3).
Table 3Correlations between various parameters and Quality of Life and Hospital Anxiety and Depression Scale parameters
Depression Anxiety Covid severity
r p r p r pGeneral health
-0.630 p<0.001 -0.474 p<0.001 -0.156 0.115
Physical health
-0.657 p<0.001 -0.648 p<0.001 -0.388 p<0.001
Psychological health
-0.762 p<0.001 -0.673 p<0.001 -0.192 .052
Social relations
-0.500 p<0.001 -0.427 p<0.001 -0.110 0.269
Environment -0.530 p<0.001 -0.446 p<0.001 -0.188 0.058Anxiety 0.745 p<0.001 1 - 0.241 0.014Depression 1 - 0.745 p<0.001 0.189 0.056
DiscussionThe Covid-19 pandemic has been reported to trigger
anxiety and depression, with quality of life also being adversely affected [8, 14].
Statistical analysis revealed a significant gender difference in anxiety levels, being higher in women than in men. One meta-analysis performed to determine the effects of Covid-19 on mental health reported that the anxiety experienced by women is greater than that experienced by men [18]. A previous study from Turkey also determined higher Covid-19-related anxiety and depression levels in women [19]. Our finding is consistent with the previous literature and is important in showing that more anxiety is experienced by women. It can be thought that estrogen, progesterone and prolactin hormones increase the stress response in women.
Comparison of Quality of Life Scale subgroups revealed significant gender differences in physical health, psychological health, and environment, all three being better in women than in men. A meta-analysis by Vindegard & Benro (2020) investigating the effects of Covid-19 on mental health reported lower psychological health among women [18]. Ma et al. (2020) investigated depression and quality of life among individuals with Covid-19 but reported no gender difference in terms of quality of life [20]. The discrepancies among the findings may be due to the samples involved.
Anxiety levels were higher among married individuals in the present study compared to unmarried participants. In a study from Canada investigating the effect of Covid-19, Nkire et al. (2020) determined high levels of anxiety and depression in
single individuals [21]. Özdin & Bayrak Özdin 2020 and Passos et al. (2020) both found no difference in anxiety in terms of marital status [19, 22].
In the present study, anxiety and depression levels decreased as the Quality of Life subscale sub-parameters of general health, physical health, psychological health, and environment increased. One meta-analysis (1963 studies and 87 preprints) considered the psychiatric and neuropsychiatric symptoms of Covid-19 and reported that patients experienced symptoms such as intense sleeplessness, stress, anxiety, forgetfulness, and fatigue, even extending to psychosis in advanced stages, and that their quality of life was adversely affected [23]. Another study investigating the effect of Covid-19 on quality of life described anxiety and depression, fatigue, pain, and sleep and concentration problems as frequently experienced symptoms, and emphasized the adverse impacts of these on quality of life [10]. Another study of healthy individuals examined the general effects of Covid-19 on mental health and quality of life and reported that individuals experienced stress and anxiety because of the pandemic, but that family support enhanced quality of life [24]. Previous studies have more frequently involved healthy individuals or the post-discharge period, and no previous studies have investigated the hospitalization period. Consistent with the previous literature, anxiety and depression levels in the present study decreased as Covid-19-related quality of life increased.
Physical health improved in the present study as the severity of Covid-19 decreased. Precious studies have reported symptoms ranging from mild to severe in individuals with Covid-19, describing symptoms starting with cough, fatigue, and joint pain worsening from day to day, together with severe levels of respiratory and movement difficulty [25, 26]. The negative effect on physical and mental health in particular among individuals exposed to these symptoms has also been emphasized [27, 28].
Anxiety levels increased in line with the severity of Covid-19 in this study. Similarly, Mazza et al. (2020) also reported that anxiety and depression levels as the severity of the disease worsened among individuals with Covid-19 [29]. Another study from Ireland also reported that anxiety levels increased with disease severity [30]. These findings are consist with those of the present study.
Since the present study was performed in a single center, at a specific time, and during the first wave of Covid-19, the research results cannot be generalized.
ConclusionThe findings of this study show high levels of anxiety
among women and married patients, but that anxiety decreased as quality of life (general health, physical health, psychological health, and environment) increased. Physical health decreased as the severity of Covid-19 worsened, while anxiety increased. We recommend that the potential effects of the severity of the disease and quality of life should not be overlooked when caring for patients with Covid-19, and that programs aimed at reducing anxiety should be developed and implemented.
Disclosures: There is no conflict of interest for all authors.
Funding: None.
Acknowledgments: None.

84Journal of Clinical Medicine of Kazakhstan: 2021 Volume 18, Issue 6
References 1. Seyed Hosseini E, Riahi Kashani N, Nikzad H, Azadbakht J, Hassani Bafrani H, Haddad Kashani H. The novel coronavirus
Disease-2019 (COVID-19): Mechanism of action, detection and recent therapeutic strategies. Virology. 2020; 551:1-9. doi: 10.1016/j.virol.2020.08.011.
2. Umakanthan S, Sahu P, Ranade AV, Bukelo MM, Rao JS, Abrahao-Machado LF, Dahal S, Kumar H, Kv D. Origin, transmission, diagnosis and management of coronavirus disease 2019 (COVID-19). Postgrad Med J. 2020; 96(1142):753-758.
3. Yürük Bal E, Çelik H. COVID-19 Salgını ile Mücadelede Hemşirenin Rolü. Turkiye Klinikleri J Nurs Sci. 2020;12(2):300-4. https://doi.org/10.5336/nurses.2020-75315
4. Hajure M, Tariku M, Mohammedhussein M, Dule A. Depression, Anxiety and Associated Factors Among Chronic Medical Patients Amid COVID-19 Pandemic in Mettu Karl Referral Hospital, Mettu, Ethiopia, 2020. Neuropsychiatr Dis Treat. 2020; 16:2511-2518. https://doi.org/10.2147/NDT.S281995
5. Necho M, Birkie M, Gelaye H, Beyene A, Belete A, Tsehay M. Depression, anxiety symptoms, Insomnia, and coping during the COVID-19 pandemic period among individuals living with disabilities in Ethiopia, 2020. PLoS One. 2020; 15(12):e0244530. https://doi.org/10.1371/journal.pone.0244530
6. Huang Y, Zhao N. Generalized anxiety disorder, depressive symptoms and sleep quality during COVID-19 outbreak in China: a web-based cross-sectional survey. Psychiatry Res, 2020; 288:112954. https://doi.org/10.1016/j.psychres.2020.112954
7. Rubin RR, Peyrot M. Quality of life and diabetes. Diabetes Metab Res Rev. 1999; 15(3):205-18. https://doi.org/10.1002/(SICI)1520-7560(199905/06)15:3<205::AID-DMRR29>3.0.CO;2-O
8. Shader RI. COVID-19 and Depression. Clin Ther. 2020; 42(6):962-963. doi: 10.1016/j.clinthera.2020.04.010. 9. Choi EPH, Hui BPH, Wan EYF. Depression and Anxiety in Hong Kong during COVID-19. Int J Environ Res Public Health. 2020;
17(10):3740. doi: 10.3390/ijerph17103740.10. Garrigues E, Janvier P, Kherabi Y, Le Bot A, Hamon A, Gouze H, Doucet L, Berkani S, Oliosi E, Mallart E, Corre F, Zarrouk
V, Moyer JD, Galy A, Honsel V, Fantin B, Nguyen Y. Post-discharge persistent symptoms and health-related quality of life after hospitalization for COVID-19. J Infect. 2020; 81(6):e4-e6. doi: 10.1016/j.jinf.2020.08.029.
11. Wang S, Wen X, Dong Y, Liu B, Cui M. Psychological Influence of Coronovirus Disease 2019 (COVID-19) Pandemic on the General Public, Medical Workers, and Patients With Mental Disorders and its Countermeasures. Psychosomatics. 2020; 61(6):616-624. https://doi.org/10.1016/j.psym.2020.05.005
12. Talevi D, Socci V, Carai M, Carnaghi G, Faleri S, Trebbi E, di Bernardo A, Capelli F, Pacitti F. Mental health outcomes of the CoViD-19 pandemic. Riv Psichiatr. 2020; 55(3):137-144.
13. Arbelo N, López-Pelayo H, Sagué M, Madero S, Pinzón-Espinosa J, Gomes-da-Costa S, Ilzarbe L, Anmella G, Llach CD, Imaz ML, Cámara MM, Pintor L. Psychiatric Clinical Profiles and Pharmacological Interactions in COVID-19 Inpatients Referred to a Consultation Liaison Psychiatry Unit: a Cross-Sectional Study. Psychiatr Q. 2021; 7:1–13. doi: 10.1007/s11126-020-09868-6.
14. Klok FA, Boon GJAM, Barco S, Endres M, Geelhoed JJM, Knauss S, Rezek SA, Spruit MA, Vehreschild J, Siegerink B. The Post-COVID-19 Functional Status scale: a tool to measure functional status over time after COVID-19. Eur Respir J. 2020; 56(1):2001494. https://doi.org/10.1183/13993003.01494-2020
15. Zigmond AS, Snaith RP. Hastane Anksiyete Depresyon Ölçeği (HAD). Acta psychiatry scand. 1983; 67:361-370. https://doi.org/10.1111/j.1600-0447.1983.tb09716.x
16. Aydemir Ö, Güvenir T, Küey L, Kültür S. Hastane Anksiyete ve Depresyon Ölçeği Türkçe Formunun Geçerlilik ve Güvenirlik Çalışması. Türk Psikiyatri Dergisi. 1997; 8(4):280-287.
17. Eser E, Fidaner H, Fidaner C, Eser S, Elbi H, Göker E. Psychometric properties of the WHOQOL- 100 and WHOQOL-BREF. J Psychiatry Psychol Psychopharmacol. 1999; 7(2):2340.
18. Vindegaard N, Benros ME. COVID-19 pandemic and mental health consequences: Systematic review of the current evidence. Brain Behav Immun. 2020; 89:531-542. doi: 10.1016/j.bbi.2020.05.048.
19. Özdin S, Bayrak Özdin Ş. Levels and predictors of anxiety, depression and health anxiety during COVID-19 pandemic in Turkish society: The importance of gender. Int J Soc Psychiatry. 2020; 66(5):504-511. doi: 10.1177/0020764020927051.
20. Ma YF, Li W, Deng HB, Wang L, Wang Y, Wang PH, Bo HX, Cao J, Wang Y, Zhu LY, Yang Y, Cheung T, Ng CH, Wu X, Xiang YT. Prevalence of depression and its association with quality of life in clinically stable patients with COVID-19. J Affect Disord. 2020; 275:145-148. doi: 10.1016/j.jad.2020.06.033.
21. Nkire N, Nwachukwu I, Shalaby R, Hrabok M, Vuong W, Gusnowski A, Surood S, Greenshaw AJ, Agyapong VIO. COVID-19 pandemic: influence of relationship status on stress, anxiety, and depression in Canada. Ir J Psychol Med. 2021; 14:1-12. doi: 10.1017/ipm.2021.1.
22. Passos L, Prazeres F, Teixeira A, Martins C. Impact on Mental Health Due to COVID-19 Pandemic: Cross-Sectional Study in Portugal and Brazil. Int J Environ Res Public Health. 2020; 17(18):6794. doi: 10.3390/ijerph17186794.
23. Rogers JP, Chesney E, Oliver D, Pollak TA, McGuire P, Fusar-Poli P, Zandi MS, Lewis G, David AS. Psychiatric and neuropsychiatric presentations associated with severe coronavirus infections: a systematic review and meta-analysis with comparison to the COVID-19 pandemic. Lancet Psychiatry. 2020; 7(7):611-627. doi: 10.1016/S2215-0366(20)30203-0.
24. Zhang Y, Ma ZF. Impact of the COVID-19 Pandemic on Mental Health and Quality of Life among Local Residents in Liaoning Province, China: A Cross-Sectional Study. Int J Environ Res Public Health. 2020; 17(7):2381. doi: 10.3390/ijerph17072381.
25. Khan M, Khan H, Khan S, Nawaz M. Epidemiological and clinical characteristics of coronavirus disease (COVID-19) cases at a screening clinic during the early outbreak period: a single-centre study. J Med Microbiol. 2020; 69(8):1114-1123. doi: 10.1099/jmm.0.001231.
26. Adil MT, Rahman R, Whitelaw D, Jain V, Al-Taan O, Rashid F, Munasinghe A, Jambulingam P. SARS-CoV-2 and the pandemic of COVID-19. Postgrad Med J. 2021; 97(1144):110-116. doi: 10.1136/postgradmedj-2020-138386.

85Journal of Clinical Medicine of Kazakhstan: 2021 Volume 18, Issue 6
27. Holmes EA, O'Connor RC, Perry VH, Tracey I, Wessely S, Arseneault L, Ballard C, Christensen H, Cohen Silver R, Everall I, Ford T, John A, Kabir T, King K, Madan I, Michie S, Przybylski AK, Shafran R, Sweeney A, Worthman CM, Yardley L, Cowan K, Cope C, Hotopf M, Bullmore E. Multidisciplinary research priorities for the COVID-19 pandemic: a call for action for mental health science. Lancet Psychiatry. 2020; 7(6):547-560. doi: 10.1016/S2215-0366(20)30168-1.
28. Pieh C, Budimir S, Probst T. The effect of age, gender, income, work, and physical activity on mental health during coronavirus disease (COVID-19) lockdown in Austria. J Psychosom Res. 2020;136:110186. doi: 10.1016/j.jpsychores.2020.110186.
29. Mazza MG, De Lorenzo R, Conte C, Poletti S, Vai B, Bollettini I, Melloni EMT, Furlan R, Ciceri F, Rovere-Querini P; COVID-19 BioB Outpatient Clinic Study group, Benedetti F. Anxiety and depression in COVID-19 survivors: Role of inflammatory and clinical predictors. Brain Behav Immun. 2020; 89:594-600. doi: 10.1016/j.bbi.2020.07.037.
30. Hyland P, Shevlin M, McBride O, Murphy J, Karatzias T, Bentall RP, Martinez A, Vallières F. Anxiety and depression in the Republic of Ireland during the COVID-19 pandemic. Acta Psychiatr Scand. 2020;142(3):249-256. doi: 10.1111/acps.13219.

86Journal of Clinical Medicine of Kazakhstan: 2021 Volume 18, Issue 6
CONTENTS JOURNAL OF CLINICAL MEDICINE OF KAZAKHSTAN(E-ISSN 2313-1519)
Suantak Demkhosei Vaiphei THE PSYCHOLOGICAL ASPECT OF PAIN AND SYMPTOM MANAGEMENT IN CLINICAL PRACTICES: SCOPING REVIEW .............................................................................................................................................................................................................................................................4
Аssel Sagymbayeva MODERN VISION ON THE PROBLEM OF UROLITHIASIS IN CHILDREN: EPIDEMIOLOGY, ETIOPATHOGENESIS, CLINICAL, DIAGNOSTICS, TREATMENT, METAPHYLAXIS .............................. 9
Suantak Demkhosei Vaiphei ASSESSMENT AND COPING STRATEGIES FOR STRESS AND DEPRESSION AMONG THE TERMINALLY ILL PATIENTS: FOCUS ON CANCER ...........................................................................................................................15
Gulnara Kulkayeva, Nurgul Azhdarova, Bibigul Sarymsakova, Assel Khassenova, Gulnur Zhakhina HOW CAN CANCER SCREENING CENTERS IMPROVE THE HEALTHCARE SYSTEM OF KAZAKHSTAN? ..........20
Aygerim Zhuzzhasarova, Dinagul Bayesheva, Alena Altynbekova, Bayan Turdalina, Aliya Seidullayeva, Aitolkyn Mynzhanova, Almagul Kushugulova MEASLES AT THE PRESENT STAGE .......................................................................................................................................................................................................25 Jamilya Saparbay, Mels Assykbayev, Saitkarim Abdugafarov, Gulnur Zhakhina, Janat Spatayev, Asan Zhexembayev, Zhuldyz Zhanzakova, Aida Turganbekova, Saniya Abdrakhmanova, Gulnara Kulkayeva DESENSITIZATION IN KIDNEY TRANSPLANTATION: REVIEW ..................................................................................................................................32
Serdar Özdemir, Abdullah Algin EVALUATION OF THE ABILITY OF THE C-REACTIVE PROTEIN-TO-ALBUMIN RATIO TO PREDICT SHORT-TERM MORTALITY IN PATIENTS WITH COVID-19 ........................................................................................................35
Yusuf Secgin, Serkan Oner, Zulal Oner RELATIONSHIP OF VASCULAR PATHOLOGY, DEMOGRAPHIC AND RADIO-ANATOMICAL FEATURES IN AORTIC DISSECTIONS DETECTED BY MULTIDETECTOR CT ..........................................................................................40
Abdullah Algın, Serdar Özdemir COMPARISON OF THE MONOCYTE-TO-HDL CHOLESTEROL RATIO BETWEEN PATIENTS WITH STEMI AND NSTEMI: A RETROSPECTIVE OBSERVATIONAL STUDY ................................................................45
Figen Diğin, Zeynep KIZILCIK Özkan, Gürcühan Fidan SATISFACTION OF ELDERLY PATIENTS UNDERGOING ORTHOPEDIC SURGERY IN TERMS OF NURSING CARE AND AFFECTING FACTORS .......................................................................................................50
Incilay Çelik, Ayse Kilic Ucar, Ümüt Güzelküçük UNDETECTED PREVALENCE OF URINARY INCONTINENCE AMONG MIDDLE-AGED WOMEN AND ITS ASSOCIATION WITH QUALITY OF LIFE .............................................................................................................................................56
Melike Gültekin, Gülay Yeginoglu, Hasan Bingol THE RELATIONSHIP BETWEEN THE EXERCISE CAPACITY AND SOMATOTYPE COMPONENTS, BODY COMPOSITION, AND QUADRICEPS STRENGTH IN INDIVIDUALS WITH CORONARY ARTERY DISEASE .............62
Nukhet Bayer, Zehra Golbasi, Yasin Uzuntarla, Kamile Akarsu JOB SATISFACTION, BURNOUT AND TURNOVER INTENTION OF NURSES WORKING IN HOSPITAL DURING THE PANDEMIC COVID-19 IN TURKEY ..................................................................................................69
Kamshat Akhmetova, Tamara Vochshenkova, Erbolat Dalenov, Aigul Abduldayeva, Talapbek Azhenov DETERMINATION OF THE ASSOCIATION OF SOME POLYMORPHISMS WITH METABOLIC SYNDROME IN RESIDENTS OF THE CITY OF NUR-SULTAN .......................................................................................................................................76
Samet Sayilan, Aylin Aydin Sayilan, Melike Demir Doğan, Emel Çetinkaya, Nuray Olcayturk A DETERMINATION OF THE RELATIONSHIP BETWEEN THE SYMPTOMS, HOSPITAL ANXIETY AND DEPRESSION LEVELS, AND QUALITY OF LIFE PATIENTS DIAGNOSED WITH COVID-19 .............81

87Journal of Clinical Medicine of Kazakhstan: 2021 Volume 18, Issue 6
ДЛЯ ЗАМЕТОК

88Journal of Clinical Medicine of Kazakhstan: 2021 Volume 18, Issue 6
ДЛЯ ЗАМЕТОК


Copyright © 2022 FDOKUMEN