Javaheri, Hoda (2017) Wet granulated liquisolid drug delivery ...
270
Javaheri, Hoda (2017) Wet granulated liquisolid drug delivery systems with hydrophobic and hydrophilic drugs. Doctoral thesis, University of Sunderland. Downloaded from: http://sure.sunderland.ac.uk/id/eprint/8549/ Usage guidelines Please refer to the usage guidelines at http://sure.sunderland.ac.uk/policies.html or alternatively contact [email protected].
-
Upload
khangminh22 -
Category
Documents
-
view
3 -
download
0
Transcript of Javaheri, Hoda (2017) Wet granulated liquisolid drug delivery ...

Javaheri, Hoda (2017) Wet granulated liquisolid drug delivery systems with hydrophobic and hydrophilic drugs. Doctoral thesis, University of Sunderland.
Downloaded from: http://sure.sunderland.ac.uk/id/eprint/8549/
Usage guidelines
Please refer to the usage guidelines at http://sure.sunderland.ac.uk/policies.html or alternatively contact [email protected].

Wet granulated liquisolid drug delivery
systems with hydrophobic and
hydrophilic drugs
Hoda Javaheri
PhD November 2017

ii
Abstract of Research
The formulation of hydrophobic drugs into appropriate dosage forms is challenging due
to the problems associated with those drugs such as low solubility and poor dissolution.
Using a liquisolid system is a promising method to improve the dissolution of hydrophobic
drugs and in sustaining the release of hydrophilic drugs, in which solid drugs are
dispersed in non-volatile liquid vehicles. The aim of this research was to use the liquisolid
technique to enhance the dissolution rate of glibenclamide, a model hydrophobic drug,
and to sustain the release of metformin-HCl, as a model hydrophilic drug. The wet
granulation process was applied to liquisolid powders with the aim of overcoming issues
of poor powder flowability and compressibility, especially using high viscosity liquid
vehicles. This process was performed with liquisolid powders prior to compaction into
tablets. Different liquisolid formulations were prepared using three liquid vehicles
(polyethylene glycol400 (PEG® 400), Synperonic® PE/L44 and Cremophor® ELP), at 10
and 30 % w/w drug concentrations for glibenclamide; and 30% and 60% w/w drug
concentrations for metformin-HCl. Avicel®PH102 was used as a carrier, whilst colloidal
silicon dioxide was employed as a coating material to convert the wet mixtures into dry
powders. Potato starch, 5% w/w, as a disintegrant was blended with the mixtures
manually for 10 minutes and then 0.75% of magnesium stearate as a lubricant was added
and mixed for 5 minutes. The final powder (depending on its flowability and
compactability) was then compacted automatically using a single-punch tableting
machine to give tablets with 4 mg for glibenclamide and 40 mg for metformin-HCl.
Prepared liquisolid compacts were characterized by using British Pharmacopeia quality
control tests: uniformity of weight, friability, disintegration, hardness and drug dissolution.

iii
It was found, for both drugs, that by application of wet granulation to liquisolid powder
admixtures, the large-scale production of liquisolid compacts is feasible, which can be
easily adapted to the pharmaceutical industry. In addition to enhancing the flowability and
compressibility of the powders, the glibenclamide dissolution was also improved due to
the enhanced binding of particles and because of the wetting effect of liquid vehicles on
the hydrophobic drug, which make the drug more available for dissolution.
For the sustained release preparations of liquisolid metformin-HCl, hydroxyl propyl
cellulose (HPC) was used as a novel carrier in liquisolid compacts. The results showed
92% drug release after 12 hours using Cremophor®ELP (with 30% w/w drug
concentration) which was the best sustained drug release formulation. Additionally,
Eudragit® RL30D and Eudragit® RLPO have been used to study their effects on drug
release from liquisolid formulations, examining if they can sustain or give more rapid drug
release. Both types of Eudragit revealed immediate release with metformin-HCl rather
than sustained drug release, with the tablets disintegrating within seconds. This suggests
formulating orodispersible metformin-HCl tablets using Eudragit® RL30D as a liquid
vehicle.
In summary, liquisolid technology has led to promising results, not only in enhancing the
drug dissolution of hydrophobic drugs, but also in sustaining and promoting the release
of hydrophilic drugs.

iv
Research Activities
Research activities from the PhD research:
• Javaheri, H., Carter, Paul and Elkordy, Amal (2014) Wet granulation to overcome liquisolid technique issues of poor flowability and compactibility: A study to enhance Glibenclamide dissolution. Journal of Pharmaceutics and Drug Development, 1 (5). pp. 501-512. ISSN 2348-9782
• Javaheri, H., Elkordy, Amal and Carter, Paul (2015) Dissolution study of liquisolid compacts containing metformin: Overcoming the issue of poor powder flowability and compactibility using wet granulation technique. In: 6th APS International PharmSci 2015, Innovation in Pharmaceutical Sciences, 7 - 9 Sept 2015, East Midlands Conference Centre, Nottingham, UK. (Unpublished)
Research activities outside the PhD research:
• Sandhu, K., Javaheri, H., Essa, E.A. and Elkordy, Amal (2016) Preparation and
characterisation of floating tablets containing cinnarizine. In: 7th APS International
PharmSci 2016; Pharmaceutical Sciences: Improving World Health, 5 – 7 Sep
2016, Technology and Innovation Centre, Strathclyde, Glasgow, UK.
(Unpublished)
• Javaheri, H, Elkordy, Amal and Carter, Paul (2013) Preparation and Evaluation of Liquisolid Compacts Containing Salbutamol Base with PEG 400 and Synperonic® PE/L44. In: UK-PharmSci 2013 conference, 2 - 4 Sep 2013, Edinburgh, UK.
• Javaheri, H, Elkordy, Amal and Carter, Paul (2013) Preparation and Evaluation of Liquisolid Compacts Containing Griseofulvin with Synperonic® PE/L44 and Cremophor® ELP. In: 2013 UKICRS Symposium, 16 Apr 2013., University of Reading, Reading.
• Elkordy, Amal, Javaheri, H., Hussain, I. and Essa, E.A. (2011) Characterisation of
liquisolid tablets containing griseofulvin. In: The Science of Medicines: UK PharmSci 2011, 31 Aug-02 Sept 2011, East Midlands Conference Centre, Nottingham University, Nottingham. (Unpublished)
• Attended EPSRC EHDA Network second Pharmaceutical technology conference
2017, University College London

v
Acknowledgments
In the name of Allah, the most Merciful and Most gracious. Primarily and most
importantly my deepest praise goes to the dear Lord for supporting me giving me the
strength to continue my PhD journey. I would also like to express my special appreciation
and thanks to my dear supervisor Dr. Amal Ali Elkordy, for your patience and guidance-
you have been a tremendous advisor, supporter and leader for me. I would like to thank
you Dr. Amal for encouraging my research and for allowing me to grow as a research
scientist. I would also like to thank my second supervisor, Dr. Paul Carter for his time and
support. Additionally, I cannot thank enough all the laboratory technicians, librarians, IT
technicians, as well as, my dear colleagues who cared for me and encouraged me
throughout my time as a PhD researcher. I have been extremely lucky to have such a
supporting team to be working with me.
Moreover, a very special gratitude goes to the most caring and loving family. Thanks to
my amazing father who has been supporting me not only financially, but also morally and
emotionally. Also, my dearest mother, who never stopped praying for me to succeed and
was always available for me when I was having hard time throughout my research
journey. Your prayers for me was what sustained me thus far. Very special thanks goes
to my lovely siblings, Ahmad and Ali, for helping me with my work by cheering me and
making me laugh when I was full of tears. In particular, I would like to present my greatest
appreciation to Ahmad who helped me proof read my thesis and make my work look
professional. Last but not least, I would like to thank Aban, my wonderful, beloved

vi
husband for his continuous support, advice, and inspiration. I am also grateful to my other
family members and friends who have supported me along the way.
Indeed, I am very appreciative to you all, for being patient and for accepting me in my
worst moments. Words cannot express how grateful I am; it means the world to me. Thank
you for cheering me up and for all the sacrifices that you have made for me.

vii
Table of Contents
Abstract of Research ..................................................................................................... ii
Research Activities ....................................................................................................... iv
Acknowledgments ......................................................................................................... v
Table of Contents ........................................................................................................ vii
List of Tables ............................................................................................................... xv
List of Figures ............................................................................................................. xvii
Chapter 1 - Introduction .................................................................................................... 1
1.1. General introduction ............................................................................................... 2
1.2. Common challenges in the manufacturing of oral dosage forms ........................... 4
1.3. Strategies in overcoming poor solubility and dissolution ........................................ 6
1.4. Liquisolid compact technology and its mathematical principles ............................. 7
1.5. Liquisolid preparation methodology ..................................................................... 17
1.6. Mechanism of enhanced drug release from the liquisolid system: the advantages
and limitations of such system: ................................................................................... 19
1.6.1. Advantages of liquisolid technique include: ................................................... 20
1.6.2. Limitations of liquisolid technique includes: ................................................... 21
1.7. Pharmaceutical wet granulation: .......................................................................... 22
1.7.1. Mechanism of granule formation: .................................................................. 24
1.8. Poly vinyl pyrrolidone (PVP) as a liquid binder in the wet granulation process: ... 26

viii
1.9. Wet granulation and liquisolid tablets: .................................................................. 28
1.10. Liquisolid technique based sustained release formulations ............................... 29
1.11. Glibenclamide properties and characteristics .................................................... 31
1.12. Properties of Metformin-HCl ............................................................................... 32
1.13. Aims and objectives: .......................................................................................... 34
1.14. Structure of the Thesis ....................................................................................... 36
1.15 Novelty of the current research work .................................................................. 38
Chapter 2 - Materials and Methods ................................................................................ 40
2.1. Materials ............................................................................................................... 41
2.2. Pre-formulation studies ........................................................................................ 42
2.2.1. Calibration curve of glibenclamide ................................................................. 42
2.2.2. Calibration curve of metformin-HCl ................................................................ 44
2.2.3. Flowability studies and determination of flowable liquid retention ................. 46
2.3. Preparation of Liquisolid powders and compacts ................................................. 52
2.3.1 Glibenclamide and Meformin-HCl (immediate release) .................................. 52
2.3.2. Liquisolid metformin-HCl using hydroxypropylcellulose (HPC) as a sustained
release carrier and Eudragit®RL30D as a non-volatile liquid vehicle ....................... 55
2.4. Wet granulated liquisolid formulations ................................................................. 57
2.4.1. Wet granulation using Polyvinylpyrrolidone (PVP) ........................................ 57

ix
2.4.2. Wet granulation of liquisolid powder admixtures using Eudragit®RL30 D as a
liquid binder ............................................................................................................. 58
2.5. Pre-compression study characteristics ................................................................ 58
2.5.1. Determination of flow and packing properties of the prepared liquisolid
powders ................................................................................................................... 58
2.5.2. Fourier transform infrared (FT-IR) spectroscopy ........................................... 59
2.5.3. Differential scanning calorimetry (DSC) ......................................................... 60
2.5.4. Scanning electron microscopy (SEM) ............................................................ 60
2.6. Characterisation of liquisolid tablets (quality control tests) .................................. 61
2.6.1 In-vitro dissolution studies for immediate release formulations ...................... 61
2.6.2. In-vitro dissolution studies for sustained-release metformin-HCl tablets (HPC-
H) using flow through cell method ........................................................................... 62
2.6.3. Uniformity of tablet weight ............................................................................. 65
2.6.4. Tablet hardness ............................................................................................. 65
2.6.5. Friability ......................................................................................................... 65
2.6.6. Disintegration ................................................................................................. 65
2.6.7. Drug Content uniformity ................................................................................. 66
2.7 Kinetics model analysis of drug release ................................................................ 67
2.8 Stability study of metformin-HCl (immediate release) liquisolids .......................... 67
2.9 Statistical analysis ................................................................................................. 68

x
2.10. Metformin-HCl permeability test using Franz cell diffuser .................................. 68
Chapter 3 - Glibenclamide liquisolid preparation with the application of wet granulation
technique ........................................................................................................................ 70
3.1. Introduction: ......................................................................................................... 71
3.1. Determination of the angle of slide for Avicel® PH 102 (MCC) and Cab-o-sil® M-5
(fumed silica): .............................................................................................................. 75
3.2. Determination of flow and packing properties of the prepared liquisolid powders-
discussion ................................................................................................................... 77
3.4. Characterisation of liquisolid formulations ............................................................ 85
3.4.1 In-vitro dissolution studies .............................................................................. 85
3.4.2. Uniformity of tablet weight ............................................................................. 95
3.4.3. Tablet hardness ............................................................................................. 96
3.4.4. Friability ......................................................................................................... 96
3.4.5. Disintegration ................................................................................................. 97
3.4.6. Drug content .................................................................................................. 99
3.5. Scanning electron microscopy (SEM) ................................................................ 100
3.6. Fourier transform infrared spectroscopy (FTIR) ................................................. 102
3.7. Differential scanning calorimetry (DSC) ............................................................. 105
3.8 Conclusion .......................................................................................................... 107

xi
Chapter 4 - Application of liquisolid technology using wet granulation on metformin-HCl:
Immediate release and permeability studies ................................................................ 108
4.1. Introduction ........................................................................................................ 110
4.2. Determination of the angle of slide (θ) for determination of flowable liquid
retention potential (Φ values) for Avicel®PH102 (MCC) and Cab-O-sil®M-5 (fumed
silica) ......................................................................................................................... 111
4.3. Flowability and packing properties of the prepared liquisolid powders .............. 114
4.4. In-vitro dissolution studies of immediate release metformin-HCl ....................... 118
4.5. Tablet hardness, Friability, Disintegration (BP) and Uniformity of drug content and
Uniformity of tablet weight ......................................................................................... 125
4.6. Fourier transform infrared (FT-IR) spectroscopy ................................................ 131
4.7. Differential scanning calorimetry (DSC) ............................................................. 134
4.8. Scanning electron microscopy (SEM) ................................................................ 137
4.9. Stability study ..................................................................................................... 139
4.9.1. In-vitro dissolution study for stored metformin-HCl liquisolid tablets ........... 139
4.9.2. Fourier transform infrared (FT-IR) spectroscopy stability study of granulated
liquisolid metformin-HCl ......................................................................................... 141
4.9.3. Differential scanning calorimetry (DSC) of stored liquisolid metformin-HCl . 141
4.10. Metformin-HCl permeability test ....................................................................... 143
4.11. Different permeability studies ........................................................................... 145
4.11.1 Intestinal permeability test using Single-pass Intestinal Perfusion ............. 145

xii
4.11.2 In-vivo permeability study of liquisolid formulations using animals such as
beagle dogs and rabbits ........................................................................................ 146
4.11.3 Effect of Freezing and Type of Mucosa on Ex-Vivo Drug Permeability
Parameters ............................................................................................................ 148
4.11.4 Caco-2 Model ............................................................................................. 149
4.12. Passive diffusion fundamentals of drug substances ........................................ 149
4.13. Franz Cell ......................................................................................................... 150
4.14. Permeability study of metformin-HCl using stomach tissue and Franz cell ..... 151
4.15. Conclusion ....................................................................................................... 155
Chapter 5 - Preparation and characterisation of sustained release liquisolid metformin-
HCl formulations using Hydroxypropyl Cellulose (HPC-H) ........................................... 157
5.1. Introduction ........................................................................................................ 158
5.2 In-vitro dissolution study of sustained release liquisolid metformin-HCl using HPC-
H ................................................................................................................................ 161
5.3 Drug release mechanism and kinetics for metformin-HCl sustained release
formulations ............................................................................................................... 169
5.4. Tablet hardness, friability and uniformity of weight of sustained release
metformin-HCl using HPC ......................................................................................... 171
5.5. Scanning electron microscopy of sustained release metformin-HCl using HPC 175
5.6. Fourier transform infrared spectroscopy (FTIR) of HPC formulations ................ 177

xiii
5.7. Differential scanning calorimetry (DSC) of sustained release liquisolid metformin-
HCl ............................................................................................................................ 180
5.8. Conclusion ......................................................................................................... 181
Chapter 6 – Orodispersible liquisolid preparation of metformin-HCl immediate release
using Eudragit®RL-30D as a non-volatile liquid vehicle: A Novel discovery ................. 183
6.1. Introduction: ....................................................................................................... 185
6.2. Determination of the angle of slide for Avicel®PH102 (MCC), Eudragit®RLPO,
Eudragit®RLPO: Avicel®PH102 (3:7) (as the carrier) and Cab-o-sil®M-5 (fumed silica)
using Eudragit®RL30D as a non-volatile liquid vehicle ............................................. 186
6.3. In-vitro dissolution study of immediate release liquisolid metformin-HCl using
Eudragit®RL30D and Eudragit®RLPO ..................................................................... 190
6.4. Uniformity of tablet weight, Tablet hardness, friability, disintegration and
uniformity of drug content .......................................................................................... 196
6.5. Fourier transform infrared (FT-IR) spectroscopy ................................................ 203
6.7. Scanning electron microscopy (SEM) ................................................................ 207
6.8. Conclusion ......................................................................................................... 208
Chapter 7 - Conclusion and Future work ...................................................................... 209
Conclusion ................................................................................................................ 211
Future work ............................................................................................................... 215
Chapter 8 - References ................................................................................................ 217
Appendix ...................................................................................................................... 229

xiv
Chapter 3 .................................................................................................................. 229
Chapter 4 .................................................................................................................. 235
Chapter 5 .................................................................................................................. 238
xv
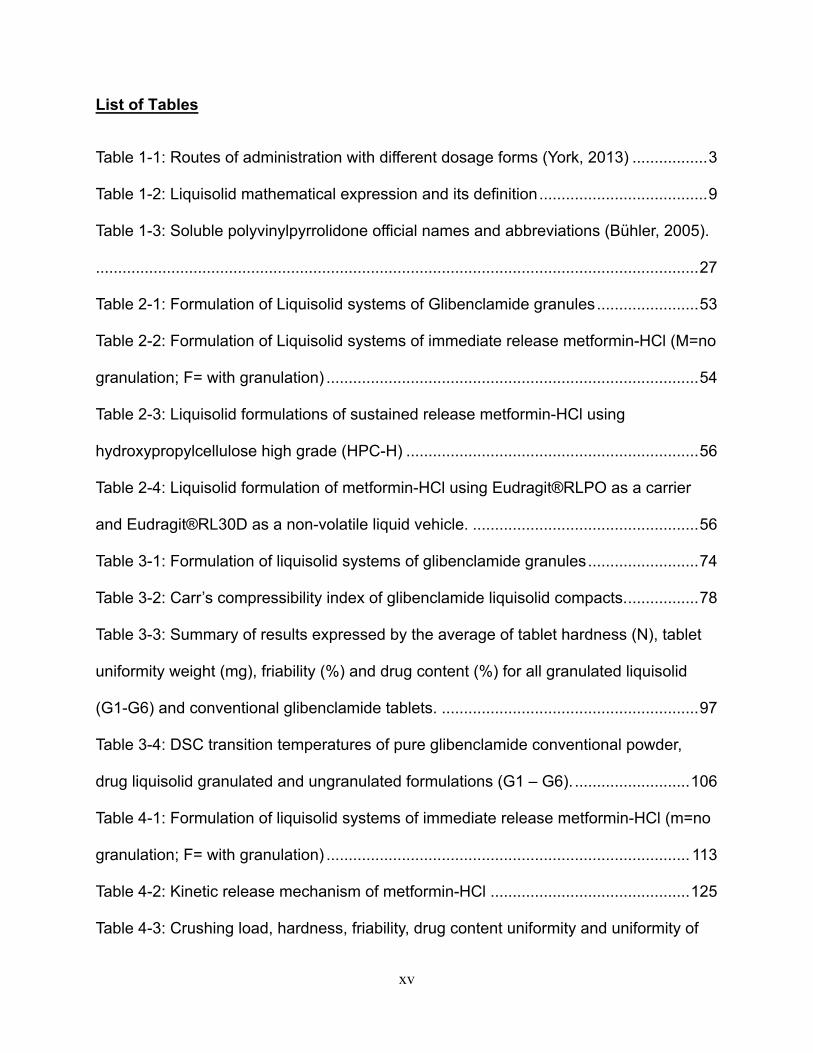
List of Tables
Table 1-1: Routes of administration with different dosage forms (York, 2013) ................. 3
Table 1-2: Liquisolid mathematical expression and its definition ...................................... 9
Table 1-3: Soluble polyvinylpyrrolidone official names and abbreviations (Bühler, 2005).
........................................................................................................................................ 27
Table 2-1: Formulation of Liquisolid systems of Glibenclamide granules ....................... 53
Table 2-2: Formulation of Liquisolid systems of immediate release metformin-HCl (M=no
granulation; F= with granulation) .................................................................................... 54
Table 2-3: Liquisolid formulations of sustained release metformin-HCl using
hydroxypropylcellulose high grade (HPC-H) .................................................................. 56
Table 2-4: Liquisolid formulation of metformin-HCl using Eudragit®RLPO as a carrier
and Eudragit®RL30D as a non-volatile liquid vehicle. ................................................... 56
Table 3-1: Formulation of liquisolid systems of glibenclamide granules ......................... 74
Table 3-2: Carr’s compressibility index of glibenclamide liquisolid compacts. ................ 78
Table 3-3: Summary of results expressed by the average of tablet hardness (N), tablet
uniformity weight (mg), friability (%) and drug content (%) for all granulated liquisolid
(G1-G6) and conventional glibenclamide tablets. .......................................................... 97
Table 3-4: DSC transition temperatures of pure glibenclamide conventional powder,
drug liquisolid granulated and ungranulated formulations (G1 – G6). .......................... 106
Table 4-1: Formulation of liquisolid systems of immediate release metformin-HCl (m=no
granulation; F= with granulation) .................................................................................. 113
Table 4-2: Kinetic release mechanism of metformin-HCl ............................................. 125
Table 4-3: Crushing load, hardness, friability, drug content uniformity and uniformity of

xvi
weight for metformin-HCl liquisolid tablets (for formulation compositions, refer to Table
4.1) ............................................................................................................................... 128
Table 4-4: Efflux (µg/ml/cm2) of metformin-HCl liquisolid in HCl (0.2M) solution using
Franz diffusion cell for permeability study. .................................................................... 153
Table 4-5: Percentage of metformin-HCl penetrated from liquisolid formulations using
Franz diffusion cell for permeability study. .................................................................... 154
Table 5-1: Liquisolid formulations of sustained release metformin-HCl using HPC-H .. 162
Table 5-2: Release kinetics of metformin-HCl liquisolid sustained release formulations
(for composition details, refer to Table 5.1) .................................................................. 171
Table 5-3: Thickness, crushing load, hardness, friability and uniformity of weight for
sustained release metformin-HCl liquisolid tablets using HPC (for formulations'
composition, refer to Table 5.1.) ................................................................................... 173
Table 5-4: DSC thermograms results of pure metformin-HCl and sustained release
metformin-HCl liquisolid formulations using HPC, for formulations' composition refer to
Table 5.1. ...................................................................................................................... 181
Table 6-1: Liquisolid formulation of metformin-HCl using Eudragit®RLPO as a carrier
and Eudragit®RL30D as a non-volatile liquid vehicle. ................................................. 189
Table 6-2: Crushing load, hardness, friability, drug content uniformity and uniformity of
weight for metformin-HCl liquisolid tablets using Eudragit®RL30D as the non-volatile
liquid vehicle (for formulation compositions, refer to table 6.1.). .................................. 198

xvii
List of Figures
Figure 1.1: Representation of effect of modification of drug surface on particle
properties. ........................................................................................................................ 5
Figure 1.2: Four classes of Biopharmaceutics Classification Systems (BCS) ................. 6
Figure 1.3: Flowchart summary of liquisolid powder preparation. .................................... 9
Figure 1.4: Theoretical model of liquisolid system ( Spireas , et al., 1992) .................... 12
Figure 1.5: Schematic diagram of the preparation of liquisolid tablets. .......................... 19
Figure 1.6: Ball growth mechanisms during granulation process (Summers & Aulton,
2013). ............................................................................................................................. 26
Figure 1.7: Poly vinyl pyrrolidone (PVP) Struc ture (Sigma Aldrich) ............................... 28
Figure 1.8: Glibenclamide structure (Royal Society of Chemistry-ChemSpider ............. 32
Figure 1.9: Metformin.HCl Structure (Sigma Aldrich) ..................................................... 34
Figure 1.10: Flowchart of liquisolid preparation work ..................................................... 39
Figure 2.1: Calibration curve of glibenclamide ............................................................... 44
Figure 2.2: Calibration curve of metformin-HCl, standard deviation values are included
........................................................................................................................................ 45
Figure 2.3: Diagrammatic representation of angle of slide ............................................. 47
Figure 2.4: Summary of liquisolid preparation work ....................................................... 48
Figure 2.5: The angle of slide of various mixtures of powder excipients (i.e. Avicel®PH
102 and Cab-o-Sil®M-5) with Synperonic®PE/L44 and Cremophor® ELP ................... 49
Figure 2.6: Flow through cell (open loop) dissolution station ......................................... 64
Figure 2.7: Franz cell diffusion equipment description (Permegear, 2015) .................... 69
Figure 2.8: Franz cell diffusion apparatus setting ........................................................... 69

xviii
Figure 3.1: Flowchart summary of the liquisolid work using glibenclamide as model
hydrophilic drug .............................................................................................................. 73
Figure 3.2: Carr’s compressibility index glibenclamide liquisolid granules and
conventional powder. For formulations’ composition refer to Table 3.1 .......................... 79
Figure 3.3: Glibenclamide and10% Cremophor®ELP powder without granulation ........ 81
Figure 3.4: Glibenclamide and10% Cremophor®ELP without granulation in the tablet
press. .............................................................................................................................. 81
Figure 3.5: Glibenclamide and 10% Cremophor®ELP granules after granulation ......... 82
Figure 3.6: Glibenclamide and 10% Cremophor®ELP tablets after granulation ............ 82
Figure 3.7a: Dissolution results of glibenclamide granulated liquisolid and conventional
tablets (10% drug concentrations) in distilled water. ...................................................... 87
Figure 3.7b: Dissolution results of glibenclamide granulated liquisolid and conventional
tablets (30% drug concentrations) in distilled
water…………………………………………………………………………………………….88
Figure 3.8a: Dissolution results of glibenclamide granulated liquisolid and conventional
tablets (10% drug concentrations) in phosphate buffer, pH 7.6. ..................................... 89
Figure 3.8b: Dissolution results of glibenclamide granulated liquisolid and conventional
tablets (30% drug concentrations) in phosphate buffer, pH 7.6. ..................................... 90
Figure 4.1: Flowchart summary of immediate release metformin-HCl liquisolid
preparation ................................................................................................................... 109
Figure 4.2: Carr’s compressibility index of metformin-HCl Liquisolid before granulation.
F5 and F6 powders were sticky and hence they were not flowable at all. ................... 115
Figure 4.3: Carr’s compressibility index of metformin-HCl liquisolid after granulation. For

xix
formulations’ composition refer to Table 4.1. ................................................................ 115
Figure 4.4: Dissolution study of immediate release metformin-HCl liquisolid in distilled
water (30% and 60% drug concentrations). Refer to Table 4.1 for formulations’
composition. ................................................................................................................. 121
Figure 4.5: Average disintegration time of liquisolid immediate release metformin-HCl.
Refer to Table 4.1 for composition. ............................................................................... 130
Figure 4.6: FT-IR spectra of pure metformin-HCl, pure excipients, conventional and
some of the liquisolid powders both granulated and ungranulated (F1, M1, M3, F3). For
formulations’ compositions refer to Table 4.1. .............................................................. 133
Figure 4.7: DSC thermograms of pure metformin-HCl, some liquisolid formulations,
conventional, and pure excipients used. Refer to Table 4.1 for formulations’ composition.
...................................................................................................................................... 137
Figure 4.8: SEM microphotographs (x1000) of pure metformin-HCl and liquisolid
powders being ungranulated and granulated. Refer to Table 4.1 for composition of
formulations. ................................................................................................................. 138
Figure 4.9: Dissolution profiles from stored liquisolid metformin-HCl (F1-F6). For
formulations’ composition refer to Table 4.1 ................................................................. 140
Figure 4.10: Fourier transform infrared (FT-IR) spectroscopy stability study of liquisolid
metformin-HCl. For composition refer to Table 4.1. ...................................................... 141
Figure 4.11: Differential scanning calorimetry (DSC) of stored liquisolid metformin-HCl
formulations, refer to Table 4.1 for composition. ........................................................... 143
Figure 5.1: Flowchart summary of metformin-HCl sustained release liquisolid
preparation using HPC-H ............................................................................................. 160

xx
Figure 5.2: The dissolution study of sustained release liquisolid metformin-HCl
formulations using HPC-H (refer to Table 5.1 for formulations’ composition). Note:
Standard deviation is presented but values are very small. ......................................... 163
Figure 5.3: SEM microphotographs of pure metformin-HCl and sustained release
metformin-HCl liquisolid powders using HPC. Refer to Table 5.1 for formulations'
composition .................................................................................................................. 176
Figure 5.4: FT-IR spectra of sustained release metformin-HCl liquisolid using HPC. .. 179
Figure 6.1: Flowchart metformin-HCl liquisolid formulation using Eudragit®L30D as non-
volatile liquid vehicle summary work. ........................................................................... 184
Figure 6.2: Dissolution study of immediate release liquisolid metformin-HCl (LSS1-
LSS4) using Eudragit®RL30D as a novel non-volatile liquid vehicle (refer to Table 6.1
for composition). ........................................................................................................... 192
Figure 6.3: Average disintegration profile of liquisolid sustained release metformin-HCl
granulated tablets. For formulations’ composition refer to Table 6.. ............................. 200
Figure 6.4: FT-IR spectra of metformin-HCl liquisolids using Eudragit® (LSS1-LSS4).For
formulations’ composition refer to Table 6.1 ................................................................. 205
Figure 6.5: DSC thermograms of metformin-HCl liquisolid formulations using
Eudragit®RL30D as the non-volatile liquid vehicle (LSS1-LSS4). Refer to Table 6.1 for
formulations composition details .................................................................................. 206
Figure 6.6: SEM microphotographs of LSS1, LSS2, LSS3 and LSS4 using
Eudragit®RL30D as the non-volatile liquid vehicle. Refer to Table 6.1 for formulations
composition details. ...................................................................................................... 208
Figure 7.1: Summary of liquisolid work ........................................................................ 210

xxi

1
Chapter 1 - Introduction

2
1.1. General introduction
There are several types of routes of drug administration available (Table 1.1) such as:
oral, rectal, parenteral, nasal, topical, eye and ear routes of drug delivery. However,
before choosing the right dosage form, special attention must be made to relate the drug
substance to the clinical complication and factors governing the correct choice of drug
administration such as bioavailability and solubility which must be taken into
consideration. Amongst the above-mentioned route of administration, oral drug delivery
remains the main and most appropriate and commonly employed route of administration
due to its safety with lowest microbial related restrictions during the manufacturing
process and high patient compliance due to ease of administration. It is mostly intended
for systemic effect resulting in drug absorption in the gastrointestinal tract (GIT). The drug
gets dissolved in the fluid of the mouth or stomach and then gets absorbed into the
systemic circulation (Alderborn, 2013). However, drawbacks are correlated with the high
desired route of administration and that is due to the slow onset of action and
gastrointestinal enzyme secretion which can affect the absorption of the drug into the
blood stream.
In the field of pharmacy or pharmaceutics, a route of drug administration is the path by
which a drug is taken into the human body. Additionally, a pure chemical substance must
be formulated into an appropriate dosage form to be taken by the patient in the chosen
route of administration. Active ingredients are not the only substances that play a role in
the manufacturing of medicines, simple solutions to complex drug delivery systems use
appropriate additives and excipients in the formulation where they provide specialised
3
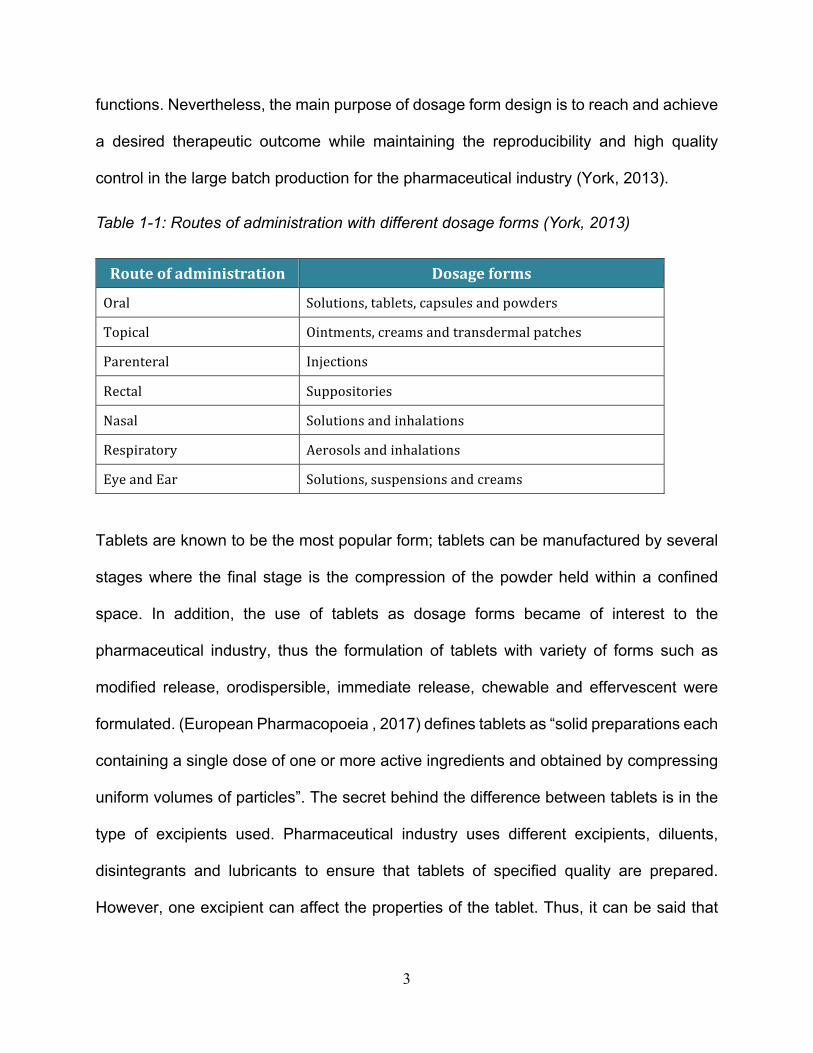
functions. Nevertheless, the main purpose of dosage form design is to reach and achieve
a desired therapeutic outcome while maintaining the reproducibility and high quality
control in the large batch production for the pharmaceutical industry (York, 2013).
Table 1-1: Routes of administration with different dosage forms (York, 2013)
Routeofadministration Dosageforms
Oral Solutions,tablets,capsulesandpowdersTopical Ointments,creamsandtransdermalpatchesParenteral InjectionsRectal SuppositoriesNasal SolutionsandinhalationsRespiratory AerosolsandinhalationsEyeandEar Solutions,suspensionsandcreams
Tablets are known to be the most popular form; tablets can be manufactured by several
stages where the final stage is the compression of the powder held within a confined
space. In addition, the use of tablets as dosage forms became of interest to the
pharmaceutical industry, thus the formulation of tablets with variety of forms such as
modified release, orodispersible, immediate release, chewable and effervescent were
formulated. (European Pharmacopoeia , 2017) defines tablets as “solid preparations each
containing a single dose of one or more active ingredients and obtained by compressing
uniform volumes of particles”. The secret behind the difference between tablets is in the
type of excipients used. Pharmaceutical industry uses different excipients, diluents,
disintegrants and lubricants to ensure that tablets of specified quality are prepared.
However, one excipient can affect the properties of the tablet. Thus, it can be said that

4
each excipient added has a specific role in the formulation of the oral tablets.
1.2. Common challenges in the manufacturing of oral dosage forms
The pharmaceutical industry has been facing challenges in the manufacturing of oral drug
delivery systems. The major obstacle that concerns the industry can vary from dissolution
rate to poor aqueous solubility and bioavailability of the active ingredient(s) (Dressman,
2007)This requires special attention for the pharmaceutical scientists because active
ingredients in tablets must undergo dissolution before they are available for absorption
from the GI tract (Javadzadeh, et al., 2007)Therefore, drugs with poor water solubility will
face problems in the dissolution and absorption into the blood stream. About 40% of the
newly developed drugs are known to be hydrophobic and thus do not dissolve in water
and have poor dissolution profiles (Lipinski, 2002). Moreover, the first site of drug
absorption is the stomach where an oral administration can release its active ingredient
(Dressman, 2007). Therefore, the dissolution is an essential step before absorption can
take place from the GI tract to the systemic circulation. According to the Food and Drug
Administration agency, drugs that are hydrophobic and have poor dissolution profiles can
cause therapeutic in-equivalence due to low and high variable bioavailability which can
be vital for patient’s health.
Dissolution rate in the fluid of the absorption site controls the absorption rate of a poorly
water-soluble drug. In other words, the rate of absorption is controlled by how fast the
drug dissolves in the fluid at the site of absorption. Therefore, it can be documented that
the dissolution rate is the rate limiting step in drug absorption (Javadzadeh, et al., 2007).
Dissolution rate can be calculated using the Noyes-Whitney equation (Equation 1.1):

5
!"!# =
%& ∙ ((*+ − *-) Equation 1.1
where “D” is the diffusion coefficient, “A” the surface area, “Cs” the solubility of the drug,
“Cb” the concentration of drug in the bulk solution and “h” is the thickness of the diffusion
layer around each drug particle (khorshed and Maghreby 2016). Each term has an
influence on drug dissolution and thus absorption. For example, if the surface area
increases, the dissolution rate will also increase which then improves drug bioavailability,
see Figure 1.1 below:
Figure 1.1: Representation of effect of modification of drug surface on particle properties.
(Mosharraf & Nystrom, 1995) have reported that “poorly water-soluble drugs can be
identified as small as 100µg/L solubility”. In addition to that, the biopharmaceutical
classification system has provided a mechanistic framework to help understand the
concept of drug absorption by means of solubility across the gastrointestinal (GI) pH

6
range 1-7.5 at 37°C and permeability across the GI mucosa. The drugs can be classified
into four categories or classes (Figure 1.2) in which the drug's dose, permeability and
solubility must be known (Helga, 2002)
Figure 1.2: Four classes of Biopharmaceutics Classification Systems (BCS)
1.3. Strategies in overcoming poor solubility and dissolution
One of the major roles of pharmaceutical industries is to enhance oral bioavailability by
improving drug solubility and dissolution. High doses of hydrophobic drugs being involved
to increase plasma concentration to a therapeutic level will result in poor absorption into
the blood stream, which can lead to accumulation of the drug in the GI tract and as a
result can lead to toxicity (Savjani, et al., 2012). Consequently, these drawbacks have
delayed several potential drugs in pre-clinical development. Since hydrophobic drugs are
difficult to formulate using a conventional tableting method, different techniques have
been reported in the literature to achieve enhanced drug dissolution rates. Some of these
methods are: a) Solvent evaporation method (its limitations include: difficulty in
completely removing the liquid solvent and higher cost of preparation) (Serajuddin, 1999),

7
b) Reducing particle size to increase surface area (particle size reduction using jet mill,
rotor stator colloidal mill and ball mill. Limitations include: degradation due to thermal and
physical stress, Takano et al 2004), c) Self-emulsifying drug delivery systems, SEDDS,
(limitations include: administration in lipid-filled gelatin capsules due to the liquid nature
of the system in which interaction between the drug and the capsule shell should be taken
into consideration). Additionally, SEDDS’ administration is not intended for long-term use
due to possibility of diarrhea effect (Shah, et al., 1994). Also, other attempts have been
made such as: d) Solid dispersion (Scale up problems, decomposition of the solvent
during process and dissolution reduction with ageing, Gowardhane et al.2014) e)
Nanosuspension (limitation includes: the drug needs to soluble in at least one solvent in
which this solvent must be miscible with the other non-solvents used (Muller, et al.,
2000)). Among the mentioned techniques to overcome poor dissolution, scientists have
reported in several articles a new and promising method to enhance aqueous solubility
of hydrophobic drugs known as “liquisolid technology” (Javazadeh , et al., 2005).
Therefore, the aim of this current work is to introduce and to apply the concept of the
liquisolid technique.
1.4. Liquisolid compact technology and its mathematical principles
The information on liquisolid technique was first introduced by (Spireas & Bolton, 1999),
several research papers have shown successful results in the use of liquisolid compacts,
yet, there are currently no liquisolid dosages available in the market. The concept of
“liquisolid tablets” was evolved from the powdered solution technology where liquid
medication can be used (Tiong & Elkordy, 2009), (Spireas & Sadu, 1998). The term

8
“liquisolid medication” implies to solid drugs dispersed in non-volatile solvent systems
with the addition of appropriate powder excipients such as carriers, coatings and
disintegrants. The incorporation of liquid surfactants into the oral hydrophobic drug allows
the formation of drug-liquid interaction that helps in the solubility of the nonpolar drug
molecules. Liquisolid compacts possess acceptable flowability and compactibility
properties depending on the non-volatile liquid vehicle used. Flowchart, Figure 1.3 shows
the summary for liquisolid compacts.

9
Table 1-2: Liquisolid mathematical expression and its definition
Symbol Definitions
Wliquid Weight of liquid medication Wsolid Weight of carrier and coating material Q Weight of carrier powder R Ration between carrier and coating Q Weight of coating powder Lf Liquid load factor ΦCa Flowable liquid retention potential of the carrier powder
ΦCo Flowable liquid retention potential of the coating powder
Figure 1.3: Flowchart summary of liquisolid powder preparation.
Before using equations (1.3-1.5) and formulating the liquisolid compacts, determination
of the optimal flowable liquid-retention potential for the carrier and coating used is
essential, which is the Φ value required for Equation (1.3). This is usually the first step in
the formulation. This measurement is termed as “angle of slide”, where it evaluates the
flowability of carrier and coating materials. Then, a graph of angle of slide (Θ) versus the
Step1• Angle of Slide determination ( Ɵ-value)• Using liquid vehicle with carrier or coating
Step 2
•Addition of carrier, coating and other additives such as disintegrant and lubricant
Step 3
•Compaction of liquisolid powder into tablets
Step 4
• Q and q amounts determination used for manufacturing of [liquid vehicle+drug]--> drugadmixture
medication
Step5
•Lf (liquidloadfactor)•Tocalculatetheamountofcarrier/coating(ΦCaandΦCo)
Step6
• Based on drug percentage (10%,30% and 60%) and R-value (R=/0) =20
•Lf (liquidloadfactor)canbedetermined

10
measured Φ value is plotted and hence the load factor is then calculated from the results
obtained (Figure 1.3; Table 1.2). The Φ value is defined as “the maximum weight of liquid
(Wliquid) that can be retained per unit weight of the sorbent (Wsolid) yielding a mixture
with acceptable flowability” ( Spireas , et al., 1992)
Φ
value
=
89:0;:<8=>9:<
Equation 1.2
Therefore, several equations are used to calculate the right amount of carrier, coating
and liquid medication needed for the formulation of the liquisolid compact:
Lf
= ΦCA
+ ΦCO
(EF) Equation 1.3
Where ΦCA is the flowable liquid-retention potential of the carrier�and ΦCO is the
flowable liquid-retention potential of the coating material.
Lf
= GH Equation 1.4
Where Lf is the “loading factor” where the maximum amount of drug liquid is loaded onto
the carrier material. Q is the amount of carrier (such as microcrystalline cellulose, Avicel®
PH102) and W is the liquid medication (such as: drug in PEG® 400 or Synperonic®PE/L44
or Cremophor® ELP or Eudragit® RL30D)
R = /J (R=20) Equation 1.5�
The amount of Q can be calculated (Equation 1.4) and applied to equation 1.5 to calculate
the amount of coating (for example: Silica, Cab-o-Sil® M-5 (q)) required. Hence, after the

11
calculation of Q and q, the formulation of the liquisolid dosage can be initiated. In addition,
the R value is the ratio between the carrier and the coating and it has been suggested
that a ratio of 20 will produce a flowable and compactible admixture (Tiong & Elkordy,
2009).
The liquisolid tablets that contain the hydrophobic drug are expected to show significant
increase in the wetting properties and surface area of the drug availability and thus,
enhance drug dissolution. Also, it is expected to show enhanced drug released
characterisation profiles. Nevertheless, this new dosage form will benefit the
pharmaceutical industry in offering the most efficient drugs that can then be released to
the market to improve patient compliance. With the new dosage form, the patient would
need a decreased dose that is administered less frequently due to the ability of the
hydrophobic liquisolid drug to release its contents faster allowing for maximum
bioavailability.

12
Figure 1.4: Theoretical model of liquisolid system adapted from ( Spireas , et al., 1992)
Figure 1.4 summarises liquisolid tablet formulation. The lipophilic drug gets dissolved in
a selected non-volatile liquid vehicle. Selected suitable fillers such as microcrystalline
cellulose act as carrier which carries the drug- liquid admixture. The liquid will then be
absorbed in the interior of the particles. The addition of coating material such as silica
powder converts the wet surface to a dry free flowing powder with acceptable
compactibility. Depending on the amount of coating added, either mono or multilayer can
be formed ( Spireas , et al., 1992).
Based on literature, liquisolid technology has been widely used to improve the dissolution
rate of hydrophobic drugs. In liquisolid systems, the wetting properties and surface of the
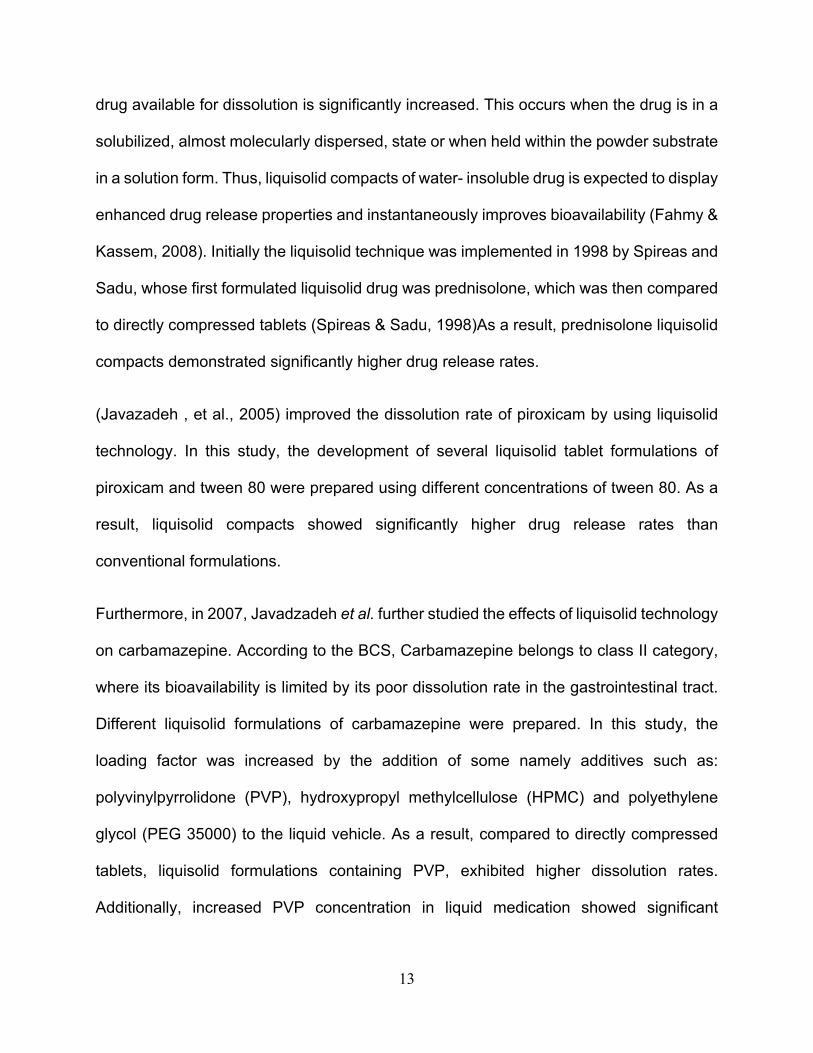
13
drug available for dissolution is significantly increased. This occurs when the drug is in a
solubilized, almost molecularly dispersed, state or when held within the powder substrate
in a solution form. Thus, liquisolid compacts of water- insoluble drug is expected to display
enhanced drug release properties and instantaneously improves bioavailability (Fahmy &
Kassem, 2008). Initially the liquisolid technique was implemented in 1998 by Spireas and
Sadu, whose first formulated liquisolid drug was prednisolone, which was then compared
to directly compressed tablets (Spireas & Sadu, 1998)As a result, prednisolone liquisolid
compacts demonstrated significantly higher drug release rates.
(Javazadeh , et al., 2005) improved the dissolution rate of piroxicam by using liquisolid
technology. In this study, the development of several liquisolid tablet formulations of
piroxicam and tween 80 were prepared using different concentrations of tween 80. As a
result, liquisolid compacts showed significantly higher drug release rates than
conventional formulations.
Furthermore, in 2007, Javadzadeh et al. further studied the effects of liquisolid technology
on carbamazepine. According to the BCS, Carbamazepine belongs to class II category,
where its bioavailability is limited by its poor dissolution rate in the gastrointestinal tract.
Different liquisolid formulations of carbamazepine were prepared. In this study, the
loading factor was increased by the addition of some namely additives such as:
polyvinylpyrrolidone (PVP), hydroxypropyl methylcellulose (HPMC) and polyethylene
glycol (PEG 35000) to the liquid vehicle. As a result, compared to directly compressed
tablets, liquisolid formulations containing PVP, exhibited higher dissolution rates.
Additionally, increased PVP concentration in liquid medication showed significant
14
increase in the drug dissolution rate in the first 30 min of dissolution. Therefore, these
additives were realized to have the capability to increase the liquid absorption capacity of
carrier and coating materials.
In 2008, Javadzadeh et al. utilized the liquisolid technique as a new approach to sustain
the release of propranolol hydrochloride from tablet matrices. In this study, propranolol
was dispersed in polysorbate 80, followed by the addition of a binary mixture of carrier–
coating materials Eudragit RL or RS (carrier) and silica (coating material) to the liquid
vehicle. In comparison with conventional matrix tablets, propranolol liquisolid tablets
exhibited a greater retardation property. Furthermore, (Gubbi & Jarag, 2009), have
reported the use of liquisolid technique to study the dissolution rate of bromhexine
hydrochloride and compared it with conventional bromhexidine. Furthermore, using
Avicel PH102 (carrier), Aerosil® 200 (coating material) and Explotab (disintegrant),
different liquisolid formulations were developed. The drug release rates of liquisolid
formulations were significantly (p<0.05) higher as compared to conventional tablets,
proving the great effect of liquisolid technique on dissolution properties.
In 2009, Javadzadeh et al. examined the effect of several commercial grades of
microcrystalline cellulose on flowability, compressibility, and dissolution rates of piroxicam
liquisolid tablets. Thus, several formulations were prepared using different MCC grades
(as carrier); propylene glycol as a non-volatile liquid, silica as a coating material, and
sodium starch glycolate as a disintegrant. Formulations containing MCC PH 101 and
PH102 resulted in better tablet properties, while enhanced flowability was observed with
MCC PH 101 grade.

15
In 2009, liquisolid technology was also practiced by Tiong and Elkordy, to study the
effects of liquisolid formulations on the dissolution rate of naproxen. The liquisolid tablets
were formulated with three different liquid vehicles - PEG® 400, Synperonic® PE/L64 and
Cremophor® EL, at 20%w/w and 40%w/w drug concentrations. Furthermore, Avicel®
PH102 was used as a carrier, Cab-o-sil® M-5 (silica) as a coating material and maize
starch was used as a disintegrant. The dissolution study was performed in simulated
gastric fluid (SGF), pH 1.2, and simulated intestinal fluid (SIF), pH 7.2, and was further
compared with conventional naproxen tablets. The results exhibited that naproxen
liquisolid tablets formulated with Cremophor®EL at 20%w/w (drug concentration)
produced the best dissolution profile with high release and improved tablet properties.
Additionally, stability studies showed that formulation prepared with Cremophor® EL was
negligibly affected by aging; while Differential Scanning Calorimetry revealed that drug
particles in liquisolid formulations were completely in a solubilised state.
Furthermore, liquisolid tablets of glipizide was applied by (Mahajan, et al., 2011).
Liquisolid tablets of glipizide were prepared by using Avicel® PH102 as a carrier, Aerosil®
200, as a coating material and gellan gum as a disintegrant to increase dissolution rate
of glipizide. Glipizide liquisolid tablets dissolution profiles were compared with the
commercial counterparts which exhibited higher dissolution rates of glipizide liquisolid
tablets in comparison to the marketed tablets. The study also showed that dissolution
rates increased with an increase in the concentration of non-volatile liquid vehicles and
the best drug release was achieved by formulations containing polyethylene glycol 400
(PEG® 400).

16
(Saeedi, et al., 2011) investigated a water insoluble drug, indomethacin, for enhancement
of drug dissolution rates. They applied liquisolid technology and found that in comparison
to conventional indomethacin, the liquisolid formulations exhibited significantly higher
drug dissolution rates. Enhanced dissolution rates of liquisolid indomethacin tablets was
due to an increase in the wetting properties and surface area of drug particles that are
available for dissolution. This indicates that, the fraction of molecularly dispersed drug in
the liquid medication of liquisolid systems is directly proportional to the indomethacin
dissolution rate.
In 2016, (Pezzini, et al., 2016)performed a study on the practicality of liquisolid
technology, not on compact form, but on pellets formation of a model drug, felodipine.
The study was conducted to record the effects of Kollidon®CL-SF (as a coating material
and as a disintegrating material) and the type of non-volatile solvents, PEG 400 or
Cremophor®EL, on felodipine dissolution behaviors. As a result, a higher drug release
was found in formulations using Cremophor®EL which were more effective in comparison
to PEG® 400. This is due to the formation of softer and more porous structures.
Remarkable positive effects were also seen in the amount of Kollidon®CL-SF used. The
study consists of an innovation of the current liquisolid technology of the development of
liquisolid pellets and the use of Kollidon®CL-SF as a coating material in liquisolid
formulations. The promising results revealed that it is feasible to adopt liquisolid pellets
as novel drug delivery systems to improve the dissolution rate of poorly water- soluble
drugs.

17
1.5. Liquisolid preparation methodology
Liquisolid preparation is commenced by blending the calculated amount of hydrophobic
drug with the non-volatile liquid vehicle. With the use of pestle and mortar, the drug is
satisfactorily mixed with the liquid to allow the liquid to penetrate between the hydrophobic
drug particles. The process takes around 5 to 10 min of continuous mixing. The admixture
is then allowed to rest. This is vital to allow the non-volatile liquid particles to be fully
absorbed into the interior of the powder particles. Gradually, and in small batches, the
carrier (usually microcrystalline cellulose) gets added to the admixture. The carrier's role
is to carry the drug along with the liquid vehicle. The coating (Silica Cab-o-Sil ® M-5) is
then added to coat any excess liquid particles present in the admixture (Figure 1.3) that
have not been absorbed into the internal structure of the carrier particles. At this stage,
the liquisolid system is formed with suitable flowability and compressibility profile. As a
final stage, 5% potato starch and 1% magnesium stearate (calculated according to the
weight formation) are added as a disintegrant and lubricant respectively, where starch is
required in the formulation to break up the tablets into primary powder particles in order
to increase the surface area of the drug in the GI fluid, thus promoting the dissolution rate
(Fahmy & Kassem, 2008). Magnesium stearate is added to reduce the friction between
the punch of the tableting machine and the powder. Additionally, as seen in Figure 1-5,
before the compaction stage, which is a novel step in this research, a wet granulation
step was introduced to enhance flowability and compressibility of the liquisolid powder
especially using highly viscous liquid vehicle such as Cremophor®. Evidence suggests that liquisolid tablets using hydrophobic drugs have shown enhanced
dissolution profile due to an increase in the surface area and wetting properties of the

18
water-insoluble drug particles (Spireas & Bolton, 1999); (Nokhodchi, et al., 2005). During
the process of liquisolid preparation, heating or drying does not take place; therefore, the
drug remains embraced by the non-volatile liquid vehicle. Hence, the chosen non-volatile
solvent must have a high boiling point with inert properties and preferably less viscous to
maintain even distribution of the drug inside the admixture. In addition, a highly viscous
liquid vehicle can affect the flowability and compactibility of the final liquisolid powder.
Therefore it is crucial to select a non-volatile liquid vehicle with good property
characteristics. Several studies have been conducted using different liquid vehicles such
as Polyethylene glycol, SynperonicÒPE/L44, Cremophor®ELP and TweenÒ80. Each liquid
vehicle possesses its own characteristics and behaviours when combined with a specific
hydrophobic drug, therefore, there is no common single liquid vehicle suitable for use in
liquisolid preparation for a wide range of non-polar drugs. Additionally, the carrier must
have a porous nature to be able to absorb more liquid and the coating must have
adsorptive properties to coat the admixture and form a thorough dry powder (Elkordy, et
al., 2013).

19
Figure 1.5: Schematic diagram of the preparation of liquisolid tablets.
1.6. Mechanism of enhanced drug release from the liquisolid system: the
advantages and limitations of such system:
Numerous mechanisms of enhanced drug release have been developed for liquisolid
technology to understand the dissolution theory of such a system. Improved wetting
properties, enhanced aqueous solubility and increased surface area of the hydrophobic
drug are the three principal mechanisms which have been suggested by several studies
(or groups or researchers). (Nagabandi, et al., 2011) , (Spireas & Sadu, 1998), (Darwish
& El-Kamel, 2001), (Akinlade, et al., 2010). Besides, the liquid vehicle acts as a surface

20
active and surface tension lowering agent. In return, the wettability of the liquisolid
particles can be enhanced. Such a theory is demonstrated by the determination of lower
contact angles and shorter water rising time resulting in an increase in aqueous solubility.
In addition to the above-mentioned mechanism of drug release enhancement, it is
expected that the solubility of the hydrophobic drug can be increased with liquisolid
systems. The increased drug solubility phenomenon of liquisolid system suggests that a
small amount of liquid vehicle in a conventional manner is not enough to solubilize the
total amount of drug; however, if the liquid vehicle acts as a co-solvent, it is possible that
this small amount of liquid vehicle diffusing from the total amount out of a single liquisolid
particle together with the drug molecules is sufficient to increase the aqueous solubility of
the drug at the solid liquid interface. Lastly, as the surface area of the drug increases, the
dissolution rate of the drug with the liquid vehicle also increases (Balaji, et al., 2014).
1.6.1. Advantages of liquisolid technique include:
• Numerous hydrophobic solid drugs can be formulated into liquisolid systems.
• Bioavailability improvement can be achieved as compared to conventional tablets.
• Liquisolid preparation is a straightforward method and similar to that of
conventional tablets preparation and industrial production is applicable.
• When compared to soft gel capsules, the production of liquisolid compacts are
considerably economical and affordable.
• Liquisolid system is not limited to the dissolution enhancement of hydrophobic
drugs, but also can be used to modify the release of highly water-soluble drugs
with the addition of certain surfactants known as sustaining agents.

21
1.6.2. Limitations of liquisolid technique includes:
• Small amount of active ingredient used in the liquisolid compacts, because as the
weight of the drug increases, this leads to an increase in the weight of the liquid
vehicle, carrier, coating materials and will yield a large tablet which can be difficult
to swallow and causes reduction in patient compliance. To solve this problem,
several suggested theories have been made in literature by which to select a
suitable liquid vehicle to which its loading factor would be high. Increase in loading
factor means a decrease in tablet weight (Elkordy, et al., 2013); (Nagabandi, et
al., 2011), ( Spireas , et al., 1992) (karmarkar, et al., 2009).
• High specific surface area and adsorption properties are required to be shown in
the used surfactants.
• Increasing the amount of silica Cab-o-Sil®M-5 (coating material) in the formulation
can affect negatively on drug release, due to the hydrophobicity of silica Cab-o-
Sil®M-5 (coating material), which can delay drug release if added in high quantities
(Spireas & Bolton, 1999).
• Depending on the liquid vehicle used, the liquid being squeezed out of the tablet
is possible during the compression process resulting in improper hardness and
even loss of shape (Javaheri et al 2014)
• Due to the use of highly viscous liquid vehicles, desired tablets cannot be achieved
into a suitable compression force, hardness and shape. However, wet granulation
as used in this research can overcome some of this limitation.

22
1.7. Pharmaceutical wet granulation:
Most pharmaceutical industries recognize wet granulation as a widely-used method of
tablet processing. It is no longer required to depend on the intrinsic properties of the drug
and the excipients used because via wet granulation process it has become feasible to
produce well-formed tablets. The granulation method is divided into two parts: dry
granulation, in which no liquid is used, and wet granulation, which incorporates the use
of liquid binder. The granulation mechanism can be defined as the process in which
primary powder particles agglomerate. In other words, the particles in the powder form
adhere in a way that they form larger multi-particle entities called granules. These
pharmaceutical granules have different sizes that can range between 0.2mm to 0.4mm
(Summers & Aulton, 2013). The reasons behind the use of granulation technique in
pharmaceutical industry are as follows:
• Segregation prevention of the constituents of the powder mix. Pharmaceutical
industries look for the ideal granule which contains all the constituents of the mix
in a proportional manner.
• Improvement of powder flow properties. Poor flowability will result in wide weight
variation in the final product due to the irregular shape and small size of the
powder. Granulation process with aid of liquid binder adds weight to the particle
and enhances the flowability.
• In addition to the above advantages, granulation is used to improve the compaction
characteristics of the powder mix. This is due to the adhesive properties within the
granules. Additionally, as the particle size gets evenly distributed using the

23
granulation process, this leads to increased density of the powder and
enhancement of its compactibility and compressibility.
• Toxic materials can be turned into granules using non-friable and suitable
mechanical strength granulation processes, reducing the hazard associated with
handling of toxic powders.
• Wet granulation can also be used to modify and improve drug release.
In the wet granulation process, the liquid solution known as the “liquid binder” gets added
to the dry primary powder to produce bonded particles via capillary forces that remain
adherent and strong enough to lock particles together (Summers & Aulton, 2013). The
liquid binder or the granulating fluid, must be non-toxic and volatile in nature in order to
be evaporated or removed by drying. Examples of such fluids include ethanol, water and
isopropanol. Water is widely used for its economic and ecological benefits. However, the
disadvantage of using water as a granulating fluid is that it may affect drug stability and
show adverse effects. Additionally, water requires longer drying time which can affect the
stability of the drug due to the extended exposure to heat.
Granulation process is known to be a simple method depending on the characteristics of
the powder and equipment used. Using traditional wet granulation method, the liquid
added to the dry powder gets distributed evenly through the powder particles using
mechanical agitation, which yields to particle adherence. Furthermore, wet granules are
formed using pharmaceutical grade sieves with desired sizes, by wet powder mass being
forced through which are then dried subsequently. A screening stage is then performed
to break granules agglomerates. There are five primary particle bonding mechanisms in

24
granulation process which include the following: (Kienkens, et al., 2000)
• Adhesion and cohesion forces between individual particles of the powder. As
the contact area between particles increases, this causes a decrease in their
interparticulate distance strengthening and increasing the bond among those
particles. This can happen only when sufficient liquid is added to the powder to
form a thin and immobile layer.
• Solid bridges formation upon solvent evaporation. This can be achieved using
three steps: crystallization of dissolved substances, partial melting and
hardening binders.
• Interfacial forces in mobile liquid films within the granules. The added liquid
during wet granulation gets distributed as films among and across particles of
the powder mix to form mobile films.
• Mechanical interlocking adhesion can occur when an adhesive enters into the
pores of the adhered surface of a substrate, and locks to the surface
mechanically.
• Attractive forces between solid particles. Solid bridges get formed using binding
agents in the absence of liquid. Electrostatic forces and Van der Waals forces
are the two main kinds of forces that run between particles.
1.7.1. Mechanism of granule formation:
The suggested granulation mechanism can be recognized in the following three stages:
(Shanmugam, 2015)

25
• Nucleation: This primary step of granulation process commences with particle-
particle adhesion due to liquid bridges. The even distribution of the liquid binder
inside the dry powder bed leads to the formation of nuclei granule.
• Transition: The presence of various number of small granules with a broad
distribution size is what describes the transition stage. Moreover, nuclei can grow
by either the addition of single particles to the nuclei by pendular bridge, or by the
combination of several nuclei.
• Ball growth: Depending upon the amount of liquid added and the characteristics of
the powder being granulated, granule coalescence will continue upon agitation
which produces an unfeasible and over massed system. The ball growth
mechanism is illustrated in Figure 1.6 which states the four possible stages or
mechanism of granule growth (Mirza, et al., 2007); (Summers & Aulton, 2013).
1) Coalescence: Is when several granules join to form a larger granule.
2) Breakage: The breakage of granules into fragments that can attached to other
granules. As a result, a layer of material over the surviving granule can be formed.
3) Abrasion transfer. At this stage, the granule beds get agitated can promote to the
attrition of material from granules. As a result, due adhesion to other granules, their
sizes will be increased.
4) Layering. Layering occurs when an extra batch of powder mix is being added to a
bed of granules, the powder then coheres to the granules and forms a layer over
the surface in which as a result, a rise in their size will occur.

26
Figure 1.6: Ball growth mechanisms during granulation process (Summers & Aulton, 2013).
1.8. Poly vinyl pyrrolidone (PVP) as a liquid binder in the wet granulation process:
Soluble polyvinylpyrrolidone or poly-[1-(2-oxo-1-pyrrolidinyl) (see Figure 1.7) was the
first polymerisation product of N-vinylpyrrolidone in water using hydrogen peroxide or
using an organic peroxide as initiator (Bühler, 2005). Moreover, Polyvinylpyrrolidone is a
free-flowing white or yellowish-white powder that comes in different particle sizes. The
method of synthesis determines the odour of individual product. Table 1.3 below lists

27
the official names and abbreviations of PVP that are specific to the pharmaceutical
industries.
Table 1-3: Soluble polyvinylpyrrolidone official names and abbreviations (Bühler, 2005).
Povidone� Current valid Pharmacopoeias (e.g. USP 26, Ph.Eur. 5, JP 14)
Polyvidon(e) Former editions of Pharmacopoeias (e.g. Ph.Fr. IX)
Povidonum Pharmacopoeias (e.g. Ph.Eur. 5)�
Polyvidonum
solubile Former edition of the DAC (1986)
Poly(1-vinyl-2-
pyrrolidon) Deutsches Arzneimittelgesetz 1984
PVP General abbreviation, commercial name for cosmetics/tech- nical grade
In addition to that, PVP polymers are obtainable in different viscosity grades and can
range from low to high molecular weight. The viscosity of aqueous solutions of PVP
depends on its average molecular weight. Additionally, polyvinylpyrrolidone is a stable
polymer which can be safely used in liquid and solid dosage forms. PVP possess very
useful application in the field of pharmaceutical industry. The feature that distinguishes
PVP is its excellent solubility in water. This is an advantageous property in almost all
dosage forms such as in wet granulation (for tablet production), oral solutions, and
injectable medications. Nevertheless, its fundamental adhesive and binding influence
allows it to be distinctive in the wet granulation and direct compression of tablet
manufacturing making it a good material to use in this research as a liquid binder. The
other feature that makes PVP a unique polymer is its wettability enhancement and these
important characteristics can improve the rate of dissolution of hydrophobic drugs if

28
tablets being formulated using PVP. Research article by (Javaheri, et al., 2014), has
shown dissolution enhancement of poorly water soluble, glibenclamide, when PVP has
been used as a liquid binder in wet granulation of liquisolid tablets. Nevertheless, as the
molecular weight of PVP increases, its dissolution rate decreases while the viscosity and
adhesive power still increases. Therefore, according to the properties of the molecular
weight, the optimum grade for individual dosage form can be provided in order to acquire
the best outcome. Other studies have also shown tablet quality enhancement after the
use of PVP, where wet granulation using PVP showed better flow properties, harder
granules, lower friability and enhanced dissolution results when compared with cellulose
derivatives (Bühler, 2005). Moreover, a study performed by (HIlton & Summers, 1986)
was conducted on a poorly water-soluble drug known as Indomethacin in different solid
dispersion formulations to test the drugs dissolution profile using PVP with different chain
length. Consequently, it was noticed that dissolution rate was slower in tablets containing
longer chain length of PVP and was higher in shorter chain ones.
Figure 1.7: Poly vinyl pyrrolidone (PVP) Struc ture (Sigma Aldrich)
1.9. Wet granulation and liquisolid tablets:
Several scientists in the field of pharmaceutics, specifically in the formulation of high

29
quality tablets with enhanced dissolution, have challenged the use of liquisolid technique
in their studies. Additionally, many have implemented new ideas in the manufacturing of
liquisolid tablets. Amongst the newer generation ideas was the use of wet granulation in
liquisolid preparation (Javaheri, et al., 2014). Wet granulation using PVP was applied on
liquisolid system using glibenclamide (hydrophobic drug) with three different non-volatile
liquid vehicles PEG®400, Synperonic®PE/L44 or Cremophor® ELP at 10 %w/w. The
study proved the advantages of using wet granulation when used in liquisolid preparation
not only enhances the solubility of glibenclamide, but also improves the flowability and
compactibility of the liquisolid powder. Another study by (Javadzadeh, et al., 2007), has
included polyvinylpyrrolidone (PVP) as an extra additive to the liquisolid systems to
enhance the release of the hydrophobic carbamazepine in dissolution media. As a result,
it was shown that the liquisolid tablets prepared with PVP improved dissolution rate in
comparison with other formulations. The reason behind the success in drug dissolution
enhancement is the ability of PVP to prevent drug retention in the spaces of porous
surfactant, thereby enhancing the release of the hydrophobic drug into the dissolution
medium.
1.10. Liquisolid technique based sustained release formulations
Development of sustained-release oral delivery systems are beneficial to achieve
therapeutically effective concentrations of the desired drug at a constant and
predetermined rate over a period of time which can be an optimal therapy in terms of
patient compliance, efficacy and possible side effects reduction. (Wadher, et al., 2011).
The most commonly used method of modifying the drug release is to use hydrophilic

30
matrix systems. A research on sustaining nicorandil release was performed by (Reddy,
et al., 2003). Hydroxypropyl methylcellulose (HPMC) was used as a hydrophilic matrix
agent. However, it was concluded that HPMC alone could not control the release of
nicorandil release over 24 hours effectively. Therefore, several different techniques of
sustaining the release of the drug over a desired time to deliver a constant concentration
of drug have been performed. Nevertheless, it has been suggested by several researches
that liquisolid technique has the potential to produce sustained release tablets by the
reduction of drug dissolution rate of water soluble drugs such as trimetazidine. (Pavani,
et al., 2013) investigated the release of trimetazidine dihydrochloride in polysorbate 80
and it was demonstrated that the use of polysorbate 80 can prolong the release of the
used hydrophilic drug. In 2008, Javadzadeh et al. successfully used liquisolid technique
to sustain the release of the water-soluble propranolol hydrochloride. Additionally,
polysorbate 80, EudragitÒ RL and RS grades were used as non-volatile liquid vehicles
along with carrier and coating materials to prepare a liquisolid system with prolonged
release mechanism. The importance of liquisolid technology on the ability to improve the
dissolution of the hydrophobic drug or lower the rate according to the excipients used was
understood. (Gonjari, et al., 2009) declared that the use of hydrophobic carriers such as
EudragitÒ RL or RS is likely to be a more efficient in the formulation of liquisolid prolonged
release tablets. These hydrophobic carriers can lead the liquisolid compact to poor
wettability, resulting in slower disintegration and slower drug release. In the case of
hydrophobic carriers being ineligible for use, it is suggested to use hydrophilic carriers
with the caveat that the hydrophilic carrier can be used only by the incorporation of a
retarding agent such as hydroxy propylmethyl cellulose (HPMC). Depending on its

31
molecular weight, HPMC can either form a hydrated matrix layer or swells as it gets in
contact with the gastrointestinal fluid which then allows the drug to erode and slowly
dissolve. The dissolution of such systems is controlled by diffusion mechanism and the
gel type formation of the HPMC acts as a protective barrier to the influx of water and efflux
of the drug (Wadher, et al., 2011).
Till date, a limited number of drugs and sustaining agents have been formulated into
liquisolid sustained release tablets. For instance, hydroxy propyl cellulose (HPC-H) has
not been used in the any liquisolid research study as an agent to prolong the release of
the water-soluble drug. Therefore, one aim of this work was to use liquisolid system with
HPC to sustain metformin-HCl (a model drug) release. Glibenclamdie and metformin-HCl
are used in this research as model drugs to be formulated into liquisolid tablets.
1.11. Glibenclamide properties and characteristics
Glibenclamide is an oral antidiabetic drug of the second-generation group known as
“sulfonylurea”. It is used to treat non-insulin dependent patients with type II diabetes
mellitus. It works by inhibiting the ATP-dependent potassium channels. It lowers blood
glucose level by stimulating the insulin release from pancreatic b-cells and by enhancing
the sensitivity to insulin by peripheral tissues (Manimaran, et al., 2010). In the b-cells of
the plasma membrane, the KATP channels have receptors that give high affinity to
glibenclamide to bind on to and stimulates the release of insulin. The drug is
manufactured into low doses of 2.5mg and 5 mg and is excreted readily from the body.
Also, due to glibenclamide’s active metabolites, hypoglycemic effects can be one of its
adverse effects. Moreover, several research papers have witnessed low dissolution rate

32
behavior of glibenclamide due to the poor solubility and wettability characteristics. As a
result, this can cause a reduction in its bioavailability. As seen in Figure 1-8, glibenclamide
is a weak acid with a pKa of 5.3 and thus it is a pH dependent of the medium (Gianotto,
et al., 2007). Several methods have been reported to enhance the poor solubility
properties of glibenclamide and in this work liquisolid technique was used to formulate
glibenclamide tablets into 4 mg dose. By this way any possible adverse effects may be
minimised, yet maintaining the enhanced dissolution properties by the aid of the liquisolid
system.
Figure 1.8: Glibenclamide structure (Royal Society of Chemistry-ChemSpider
1.12. Properties of Metformin-HCl
Metformin hydrochloride (dimethylbiguanide) has an empirical formula of C4H11N5•HCl
and its molecular weight is 165.63. Additionally, its structural formula can be seen in
Figure 1.9. Metformin-HCl belongs to the biguanide class of oral antidiabetics. For over
15 years, metformin-HCl has been the first line of treatment for the treatment of non-
insulin dependent type II diabetes mellitus. Prolong use of metformin to control blood
glucose decreases myocardial infarction and coronary diseases seen in overweight
diabetic patients (Block, et al., 2008). Metformin-HCl works by inhibiting the glucose

33
absorption from the intestine and suppressing the hepatic gluconeogenesis. Metformin-
HCl is associated with gastrointestinal side effects such as nausea, diarrhea and
abdominal discomfort which make a small percentage of patients intolerable to it. The
bioavailability of metformin-HCl is about 40% to 60% (approximately 30% unchanged
metformin-HCl excreted in urine) with a complete ingestion of approximately 6 hours and
a plasma half-life of 1.5-4.9 hours (Nanjwade, et al., 2011). It is absorbed in the small
intestine and partially in the stomach and negligible absorption is seen in the large
intestine. The therapeutic dose that is currently available in market is 500 mg and up to
1.5 g, which is a large tablet to formulate and it is sometimes difficult to swallow, thereby
discouraging patient compliance. Multiple dosing and big tablets can be a potential
problem to the pharmaceutical market and pharmacy world. Pharmaceutical industries
face formulation challenges when formulating metformin-HCl due to its poor
compressibility and high dose. According to the Biopharmaceutical Classification System
(BCS), metformin-HCl falls into the Class III of the BCS. It is a highly water-soluble drug
with low permeability (Nicklin, et al., 1996) resulting in the need to administer high
therapeutic doses to reach the desired plasma level. The other challenge that industries
face in metformin-HCl formulation is direct compression because of poor characteristics
of the drug, which can be a great problem on large-scale production. Metformin
hydrochloride is a white crystalline powder with PKa of 12.4. It is practically insoluble in
acetone, chloroform and ether. Nevertheless, the pH of a 1% aqueous solution of
metformin hydrochloride is 6.68.

34
Figure 1.9: Metformin.HCl Structure (Sigma Aldrich)
The above mentioned challenges make metformin-HCl a good drug candidate for
liquisolid system for enhancement of its properties. Therefore, not only highly water-
soluble drug to be formulated as sustained release formulations, but also liquisolid can
be useful to overcome problems such as low permeability.
1.13. Aims and objectives:
The primary aim of this research project is to use the liquisolid technique to enhance
the dissolution rate of glibenclamide tablets, model hydrophobic drug. The second aim is
to study the release and behavior of the water-soluble drug, metformin-HCl from
immediate and sustained release tablets in a liquisolid system to confirm the different
application of this technique and to evaluate its importance in powder technology.
Furthermore, a novel application of “Wet Granulation” conjointly with liquisolid technique
was achieved. It is used to overcome issues of poor powder flowability and compactibility
especially with using high viscosity liquid vehicles. Thus, this new technique was
performed as a last step upon preparation of liquisolid powders and before the automatic
compaction into tablets. The third aim of this research is to enhance the permeability of
metformin-HCl using liquisolid technique. Due to poor compactibility problem of
metformin-HCl, it was thought to improve and overcome the challenge using liquisolid
systems with and without granulation to observe the results.

35
The objectives of this research are as follows:
• Preparation of ungranulated and granulated liquisolid tablets of
Glibenclamide (4mg unit dose) as a hydrophobic model drug using three
liquid vehicles PEG®400, Synperonic®PE/L44 and Cremophor®ELP, at 10
%and 30 %w/w drug concentrations.
• Characterisation of tablets via B.P. quality control tests. The tests include
uniformity of weight, friability, disintegration, drug content uniformity and
dissolution tests.
• Preparation of liquisolid tablets of metformin-HCl (40mg unit dose) as a
hydrophilic model drug using three liquid vehicles PEG®400,
Synperonic®PE/L44 and Cremophor®ELP, at 30% w/w and 60 %w/w
concentrations.
• Investigating the effect of wet granulation process in combination with
liquisolid systems, in terms of flowability, compactibility and dissolution of
drugs.�
• Using Eudragit®RL30D as a non-volatile liquid vehicle with metformin-HCl
to study its influence on drug release behaviour (either sustain or
immediate release) thereby adding a new non-volatile liquid vehicle to
literature.
• Sustaining liquisolid metformin-HCl formulations using hydroxylpropyl
cellulose (HPC) as a carrier.

36
• Studying the permeability of immediate release metformin-HCl using Franz
cell diffusion with male Wistar rat biological gut membrane.
For sustained release preparations of liquisolid metformin-HCl, hydroxypropyle cellulose
(HPC) was used as a carrier instead of normal carrier. To our best knowledge, preparation
of sustained release liquisolid metformin-HCl using HPC is a new study and no
publications have been found on the uses of HPC in liquisolid technology. Therefore,
many challenges were experienced in using this new excipient. Additionally,
Eudragit®RL30D, as non-volatile liquid vehicle and Eudragit®RLPO as a carrier, were
used to prepare liquisolid metformin-HCl as immediate release tablets. However, this
study has showed that not all excipients work similarly on all drugs. Several publications
suggest the usage of Eudragit®RL as sustaining agent, however, when Eudragit®RL30D
and Eudragit®RLPO were used in this study to prepare liquisolid metformin-HCl, results
showed immediate release with fast disintegration time (within seconds), which can be a
new promising discovery for metformin-HCl as orodispersible tablets.
1.14. Structure of the Thesis
Chapter One: Introduction and Literature review to give a background for the application
and importance of liquisolid technology to improve drug performance either to enhance
or sustain the drug release characteristics.
Chapter Two: Materials and methodology applied in this current research.

37
Chapter Three: Glibenclamide liquisolid preparation with the application of wet
granulation technique. Glibenclamide was used as a model hydrophobic drugs with the
aim to enhance its release profiles.
Chapter Four: Application of liquisolid technology using wet granulation on metformin-
HCl: Immediate release and permeability studies. Based on the results of liquisolid
technology on glibencalmide release, another model drug - but it is water soluble –
metformin-HCl was chosen to compare and contrast the effects of liquisolid technology
on release behaviors of different drugs.
Chapter Five: Preparation and characterisation of sustained release liquisolid metformin-
HCl formulations using Hydroxypropyl Cellulose (HPC-H).
Chapter Six: Orodispersible liquisolid preparation of metformin-HCl immediate release
using Eudragit®RL-30D as a non-volatile liquid vehicle: A Novel discovery.
Chapter Seven: Conclusion and future work.
Chapter Eight: References.
Figure 1-10 shows the liquisolid preparations in this research.

38
1.15 Novelty of the current research work
The novelty of this work can be summarised in the following points:
• Liquisolid technique with the application of wet granulation prior to
compaction stage.
• Effect of liquisolid technique on metformin-HCl permeability with
Cremophor®ELP as a non-volatile liquid vehicle.
• Liquisolid compacts using Eudragit®RL30D as a non-volatile liquid vehicle to
produce orodispersible metformin-HCl tablets.
• Sustained release preparation of metformin HCl using hydroxypropyl cellulose
(HPC).

39
Figure 1.10: Flowchart of liquisolid preparation work
Liquisolid compact preparation
Model drugs for immediate drug release
Glibenclamide, Metformin-HCl
Angle of slide determination (q-value) determination forcarrier: Avicel®PH102
coating: Cab-O-Sil®M-5
Liquid load factor(Lf value) determination
Drug powder admixture with liquid vehiclePEG®400 Synperonic®PE/L44 and
Cremophor®ELP
Q,q(carrier to coating)amountR=20 Carrier: Avicel®Ph102
Coating: Cab-O-Sil® M-5
Mixing of drug powder, liquid vehicle,carrier,coating, disintegrant and lubricant in adjustable amount based on mathematical calculation
Powder admixture
wet granulation with 10%PVP
Automatic compaction
No granulation
Manual compaction
Metformin-HCl
Angle of slide determination (q-value) determination for carrier: Avicel®PH102,
Avicel®PH102:Eudragit®RLPO (7:3)coating: Cab-O-sil®M-5
Liquid load factor (Lf value) determination
Drug powder admixture with liquid vehicle
Eudragit®RL30D
Q,q (carrier to coating) amountR=20 Carrier: Avicel®PH102,
Avicel®PH 102 :Eudragit®RLPO (7:3)
Mixing of drug powder, liquid vehicle,carrier,coating, disintegrant
and lubricant based on mathematical calculation
Powder admixture=>wet granulation using Eudragit®RL30D
Automatic compaction
Model drug for sustained drug release
Metformin-HCl
Lf value pretermined from literature
Drug powder admixture with liquid vehicle
(PEG®400,Synperonic®PE/L44, Cremophor®ELP)
Q,q (carrier to coating) amountR=20 Carrier: HPC-H
Coating:Cab-O-Sil®M-5
Mixing of drug, liquid vehicle, carrier, coating and lubricant in adjustable amount based on mathematical
calculation
Powder admixture ==>wet granulation using 10% PVP
Automatic compaction

40
Chapter 2 - Materials and Methods

41
2.1. Materials
Pure glibenclamide and metformin-HCl hydrochloride were obtained from Sigma-Aldrich
UK.
The following excipients were provided by different companies: Microcrystalline cellulose
(Avicel® PH102) (FMC Corp., Philadelphia, USA), colloidal silicon dioxide (Cab-o-sil® M-
5) (cabot Corporation, Werk Rheinfelden, Germany), potato starch (BDH laboratory
supplies, Poole England), Polyethylene glycol 400(PEG®400)(Sigma- Aldrich, Poole,
UK), (Synperonic®PE/L44) (ICI surfactants, Everberg, Belgium), polyoxyl 35 castor oil
(Cremophor®ELP) (BASF Aktiengesselschaft, Ludwigshafen, Germany),
Polyvinylpyrrolidone (Sigma Aldrich, used for wet granulation) and magnesium stearate
(MEDEX, Morthants). Sodium Hydroxide pellets (Sigma-Aldrich, UK) were used. In
addition, buffer tablets pH= 4.0(BDH Chemical Ltd., England) and Buffer tablets pH=7.0
(Asons Laboratory reagent, UK) are used for calibrating Jenway 3505 pH meter.
For the purpose of sustaining metformin-HCl hydroxypropyl cellulose HPC-H (high grade)
was used and was obtained from NISSO Japan. Also, Eudragit®RL30D and
Eudragit®RLPO were obtained from Evonik for use in metformin-HCl formulations.
For metformin-HCl permeability study; 28 male Wistar rat stomach were used (Charles
River Laboratory, UK), there was no need for the ethical approval (Appendix for Chapter
4). Hydrochloric acid (0.2 M HCl) from Fisher Scientific, UK. In addition, Tyrode Buffer
was prepared fresh daily and ingredients were obtained from Fisher Scientific,UK. An
American pharmacologist “Maurice Tyrode” invented an isotonic with interstitial fluid

42
which is used in physiological experiments called Tyrode’s solution (buffer). It contains
the following ingredients:
Sodium chloride(NaCl), Glucose, Sodium Hydrogen carbonate (NaHCO3), Calcium
Chloride (CaCl2), Potassium chloride (KCl), Magnesium Chloride (MgCl2) and Sodium
dihydrogen phosphate (NaH2PO4). All materials used were either analytical or
pharmacological grade. In addition to that, the equipment used were calibrated.
2.2. Pre-formulation studies
2.2.1. Calibration curve of glibenclamide
A calibration curve is needed to calculate the concentration of the drug in the liquisolid
formulations in the in vitro dissolution study.
2.2.1.1. Solvent preparation (0.2 M Sodium hydroxide) Mw=40
Pure sodium hydroxide pellets were weighed (8.0 g) in a beaker and then dissolved in 1L
distilled water to make 0.2M sodium hydroxide solution (which is used for complete
dissolving of the drug). The pH meter was calibrated using two different solutions at pH=
7.0 and pH=4.0 before each measurement.
2.2.1.2. Preparation of stock solutions
Glibenclamide was weighed (5.0 mg) using a digital weighing balance (PJ Precisa
Junior, Swiss quality, Switzerland)and dissolved in 100 ml of 0.2 M NaOH solution. The
stock solution was mixed until the drug completely dissolved. By applying a suitable

43
dilution, the solution was scanned between 200 nm and 300 nm wavelengths with a
bandwidth equals to 1.5 nm by a double beam UV/Vis spectrophotometer (Nicolet
Evolution 300, Thermo electron corporation with Vision pro version 2.03 software) to
indicate the suitable drug wavelength using the stock solution. The glibenclamide peak
wavelength was 229nm.
2.2.1.3. Serial dilution preparation
Furthermore, Equation (2.1) was used to calculate the exact volume required to produce
the needed concentrations:
!"#"
= !&#& Equation 2.1
Serial dilutions were prepared by taking 0.5 ml, 1ml, 3 ml, 5 ml, 7ml and 10 ml and 12 ml
from the stock solution and added them to 50 ml volumetric flask and was made up to
50ml using 0.2M NaOH solution. The following were the concentrations of the resulting
serial dilutions: 0.5 mg/l, 1 mg/l, 3 mg/l, 5 mg/l, 7 mg/l and 10 mg/l and 12 mg/l
respectively. The calibration curve construction was repeated five times (Figure 2.1). The
same line equation was obtained for the calibration plot of the drug in phosphate buffer
pH 7.6.

44
Figure 2.1: Calibration curve of glibenclamide
2.2.2. Calibration curve of metformin-HCl
2.2.2.1. Preparation of stock solution
Pure metformin-HCl (500 mg) was weighed and dissolved in 500 ml of distilled water.
The solution was then scanned between 200 nm and 400 nm wavelengths by double
beam UV/Vis spectrophotometer (Model M501, Camspec Ltd., Cambridge, UK) to
determine the maximum wavelength peaks for the stock solution. The maximum peak
wavelength was at 233 nm, hence the absorbance of all metformin-HCl samples was
measured at 233nm.

45
2.2.2.2. Serial dilution preparation
Serial dilutions were prepared by taking 0.2 ml, 0.4 ml, 0.5 ml, 0.6 ml, 0.7ml and 0.8 ml
from the stock solutions and add them to 100 ml volumetric flask and was made up to
100 ml with distilled water. The resulting concentrations were: 2mg/l, 4 mg/l, 5 mg/l, 6
mg/l, 7 mg/l and 8 mg/l, respectively. The calibration curve construction was repeated five
times (Figure 2.2).
Figure 2.2: Calibration curve of metformin-HCl, standard deviation values are included
y=0.0788x- 0.0012R²=0.99988
0
0.1
0.2
0.3
0.4
0.5
0.6
0.7
0 1 2 3 4 5 6 7 8 9
Absorban
ce
Concentration(mg/l)
Metformincalibrationcurve

46
2.2.3. Flowability studies and determination of flowable liquid retention
2.2.3.1. Determination of the angle of slide for Avicel® PH 102 and Cab-o-
sil® M-5 (fumed silica)
Flowchart figure 2.4 reveals the steps for liquisolid compacts preparation. Angle of slide
is also referred to as the “optimal flowable liquid-retention potential” was measured (to
evaluate the flow properties of the excipients used): the angle of slide was obtained using
different liquid vehicles with Avicel®PH102 and Cab-o-sil® M-5 (fumed silica). Initially, 10g
of the carrier and the coating (separately weighed) were weighed and then 2g of the liquid
vehicle were added slowly in increasing intervals. This was then mixed which is known
as the admixture and placed on a polished metal plate. The plate was tilted gradually until
the admixture powder was about to slide. Then, the angle (Figure 2.3) that was formed
between the plate and the horizontal surface was measured “angle of slide (θ)”. This was
repeated several times with different amount of liquids to observe the flow properties of
the powder with the liquid vehicle. This then showed that the flow properties differed from
one excipient to the other, which was due to difference in adsorption of the liquid vehicle
(PEG®400, Synperonic® PE/L44 and Cremophor®ELP). From there, Equation 2.2 was
used to calculate the flowable liquid- retention potential (Φ- value) of each liquid/powder
admixture:
Φ- value = weight of liquid/weight of solid (Avicel® & Silica®) Equation 2.2
Eg: Weight of liquid= 4 g Weight of Solid= 10g Φ= 4/10= 0.4

47
Figure 2.3: Diagrammatic representation of angle of slide
(Tan x = Opp/adj x = inverse Tan; x= θ. Thus θ represents the angle of slide of the admixture in the plate)
With the aid of graphing, the liquid load factor of the vehicle was determined, by plotting
the θ values on a graph against the corresponding flowable liquid-retention values (Figure
2.5). Thus, the Φ value, which corresponds to an angle of slide of 33°, represents the
flowable liquid-retention potential of Avicel®PH102 (ΦCA) and Cab-O-Sil®M-5 (fumed
silica, (ΦCO). An angle of slide of 33° represents optimum flow (Javadzadeh, et al., 2007).

48
Figure 2.4: Summary of liquisolid preparation work
Liquisolid compact preparation
Model drugs for immediate drug release
Glibenclamide, Metformin-HCl
Angle of slide determination (q-value) determination forcarrier: Avicel®PH102
coating: Cab-O-Sil®M-5
Liquid load factor(Lf value) determination
Drug powder admixture with liquid vehiclePEG®400 Synperonic®PE/L44 and
Cremophor®ELP
Q,q(carrier to coating)amountR=20 Carrier: Avicel®Ph102
Coating: Cab-O-Sil® M-5
Mixing of drug powder, liquid vehicle,carrier,coating, disintegrant and lubricant in adjustable amount based on mathematical calculation
Powder admixture
wet granulation with 10%PVP
Automatic compaction
No granulation
Manual compaction
Metformin-HCl
Angle of slide determination (q-value) determination for carrier: Avicel®PH102,
Avicel®PH102:Eudragit®RLPO (7:3)coating: Cab-O-sil®M-5
Liquid load factor (Lf value) determination
Drug powder admixture with liquid vehicle
Eudragit®RL30D
Q,q (carrier to coating) amountR=20 Carrier: Avicel®PH102,
Avicel®PH 102 :Eudragit®RLPO (7:3)Mixing of drug powder, liquid
vehicle,carrier,coating, disintegrant and lubricant based on mathematical
calculation
Powder admixture=>wet granulation using Eudragit®RL30D
Automatic compaction
Model drug for sustained drug release
Metformin-HCl
Lf value pretermined from literature
Drug powder admixture with liquid vehicle (PEG®400,Synperonic®PE/L44,
Cremophor®ELP)
Q,q (carrier to coating) amountR=20 Carrier: HPC-H
Coating:Cab-O-Sil®M-5Mixing of drug, liquid vehicle, carrier,
coating and lubricant in adjustable amount based on mathematical
calculation
Powder admixture ==>wet granulation using 10% PVP
Automatic compaction

49
Figure 2.5: The angle of slide of various mixtures of powder excipients (i.e. Avicel®PH 102 and Cab-o-Sil®M-5) with Synperonic®PE/L44 and Cremophor® ELP
Then conventional glibenclamide and metformin-HCLl liquisolid powders were prepared
05
10152025303540
0 0.5 1 1.5
AngleofSlid
e(θ)
Φ Value(w/w)
DeterminationofΦ valueofAvicel®and
Cab-o-sil®withSynperonic®PE/L44
ΦAvicelPH102=0.26ΦCab-o-silM-5=0.12

50
by following those steps.
!" = %&' + %&)(1/-) Equation 2.3 Where ΦCA is the flowable liquid-retention potential of the carrier
and ΦCO is the flowable liquid-retention potential of the coating material.
!" = //0 Equation 2.4 Where Lf is the “loading factor” where the maximum amount of drug liquid loads on the
carrier material.
Q is the amount of carrier (Avicel®PH102)
and W is the liquid medication (PEG®400/Synperonic®PE/L44/Cremophor®ELP)
- = 0/1(- = 20) Equation 2.5 Lf can be calculated by substituting the flowable liquid retention potential of the carrier
(ΦCA,) and flowable liquid retention potential of the coating material (ΦCO), see below for
an example calculation, into Equation 2.3. As it was mentioned before the R is the ratio
between the carrier and the coating material which in this case is 20. By knowing the Lf
value and the liquid medication (W), it is then possible to calculate the amount of carrier
“Q” and coating “q” using Equations (2.4) and (2.5). Ultimately, the final admixtures were
compacted manually or automatically depending on its flow properties on a 10mm flat-
faced punch and die set using a single punch tableting machine (type 3, Manesty
Machines Ltd., Liverpool, UK). For high unit dose weight, each sample unit was divided
into 2 or 4 tablets so that they contain 40mg of metformin dose. This is to ensure that
tablet is within a practical hardness and size. Different formulations had different
compression force (to obtain tablets with suitable hardness of 47N) depending on various
factors in the formulation such as the tablet weight and the preparations and the use of
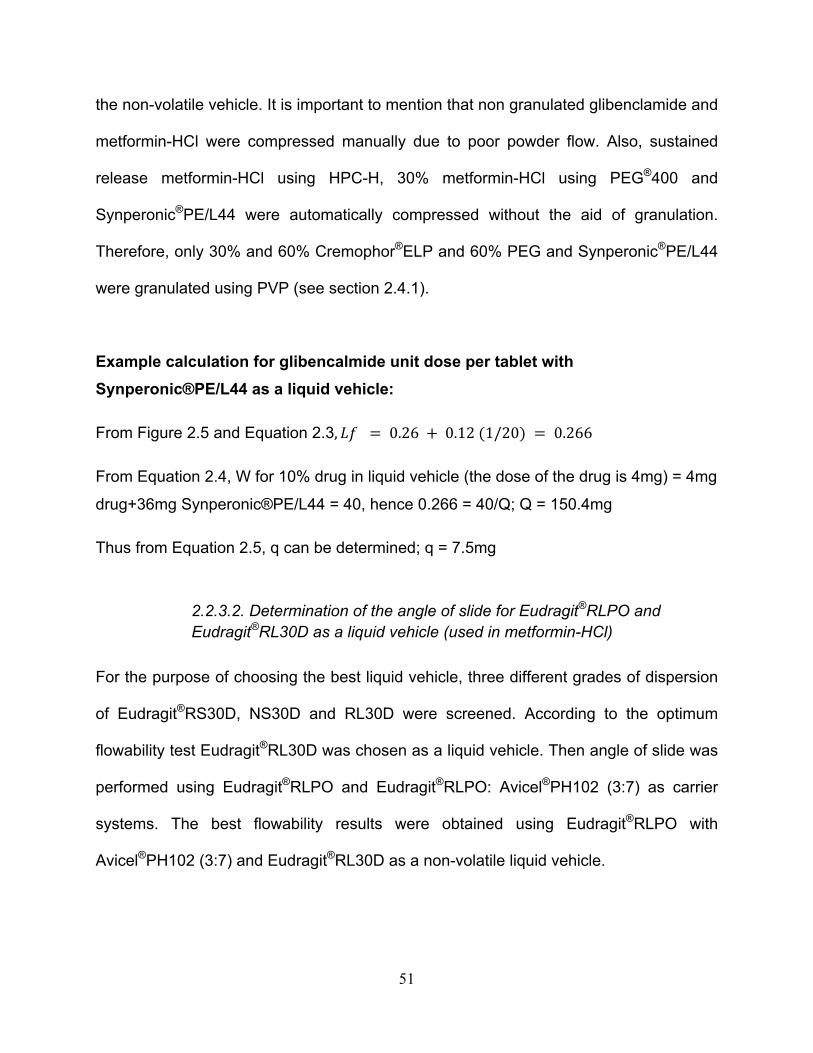
51
the non-volatile vehicle. It is important to mention that non granulated glibenclamide and
metformin-HCl were compressed manually due to poor powder flow. Also, sustained
release metformin-HCl using HPC-H, 30% metformin-HCl using PEG®400 and
Synperonic®PE/L44 were automatically compressed without the aid of granulation.
Therefore, only 30% and 60% Cremophor®ELP and 60% PEG and Synperonic®PE/L44
were granulated using PVP (see section 2.4.1).
Example calculation for glibencalmide unit dose per tablet with Synperonic®PE/L44 as a liquid vehicle:
From Figure 2.5 and Equation 2.3, !" = 0.26 + 0.12(1/20) = 0.266
From Equation 2.4, W for 10% drug in liquid vehicle (the dose of the drug is 4mg) = 4mg
drug+36mg Synperonic®PE/L44 = 40, hence 0.266 = 40/Q; Q = 150.4mg
Thus from Equation 2.5, q can be determined; q = 7.5mg
2.2.3.2. Determination of the angle of slide for Eudragit®RLPO and Eudragit®RL30D as a liquid vehicle (used in metformin-HCl)
For the purpose of choosing the best liquid vehicle, three different grades of dispersion
of Eudragit®RS30D, NS30D and RL30D were screened. According to the optimum
flowability test Eudragit®RL30D was chosen as a liquid vehicle. Then angle of slide was
performed using Eudragit®RLPO and Eudragit®RLPO: Avicel®PH102 (3:7) as carrier
systems. The best flowability results were obtained using Eudragit®RLPO with
Avicel®PH102 (3:7) and Eudragit®RL30D as a non-volatile liquid vehicle.

52
2.3. Preparation of Liquisolid powders and compacts
2.3.1 Glibenclamide and Meformin-HCl (immediate release)
Flow chart Figure 2.4 shows the steps for liquisolid powder preparation. Glibenclamide
granulated liquisolid formulations denoted as G1 to G6 (Table 2.1) including conventional
liquisolid and metformin-HCl ungranulated liquisolid denoted as M1 to M6 (Table 2.2)
including conventional liquisolid powder and F1 to F6 (Table 2.2) granulated liquisolid
metformin-HCl were prepared using PEG®400, Synperonic®PE/L44 and Cremophor®ELP
as liquid vehicles, with 10% and 30% drug concentration (gibenclamide) and 30% and
60% (metformin-HCl). From Table 2.1 and Table 2.2, the exact amount of drug and
excipients were measured using a digital weighing balance (PJ Precisa Junior, Swiss
quality, Switzerland). Batches of 100 tablets were prepared. The drugs were dispersed in
the liquid vehicle (PEG®400, Synperonic®PE/L44 and Cremophor®ELP) with continuous
mixing using pestle and mortar. The mixing process was performed for around 5 min until
no drug particles is seen undispersed. This was then followed by the gradual addition of
the appropriate amount of carrier which was Avicel®PH102. Again, the time of mixing was
between 5 to 10 min until proper paste has been formed. Following that, the Silica which
acts as a coating material was added to convert the wet mixture into dry powder under
continuous mixing (refer to Figure 1.4). The Avicel®PH102 and Cab-O-Sil®M-5 were used
at a fixed powder ratio (R) 20. Finally, a 5% w/w of potato starch which acts as a
disintegrant was added into the admixture and mixed for 10 min. Then the magnesium
stearate 0.75% was added at the end. The above steps were repeated with each liquid
vehicle and drug concentration.

53
Table 2-1: Formulation of Liquisolid systems of Glibenclamide granules
Liquisolidsystem
Non-volatileliquidvehicle
DrugConcetrationinliquidmedication
(%w/w)
Carrier:Coating(R)
Liquidloadfactor(Lf)
Liquidvehicle(mg)
Activeingredient
(mg)
Carrier(Q)(mg)
Coating(q)(mg)
Disintegrant(maizestarch)
(mg)
Lubricant(mg)
Unitdose(mg)
G1 PEG®400 10 20 0.17 36.00 4.00 238.10 11.90 15.40 2.31 308
G2 PEG®400 30 20 0.17 9.33 4.00 79.30 3.97 5.10 0.77 102
G3 Cremophor®ELP 10 20 0.52 36.00 4.00 76.90 3.80 6.40 0.96 128
G4 Cremophor®ELP 30 20 0.52 9.33 4.00 25.60 1.28 2.10 0.30 42to
250mg
G5 Synperonic®PE/L44 10 20 0.27 36.00 4.00 150.40 7.50 10.50 1.60 210
G6 Synperonic®PE/L44 30 20 0.27 9.33 4.00 50.10 2.50 3.50 0.52 70to
250mg
Conventional _ _ _ _ _ 4.00 238.10 11.90 13.50 2.00 270

54
Table 2-2: Formulation of Liquisolid systems of immediate release metformin-HCl (M=no granulation; F= with granulation)
Liquisolidsystem
Non-volatileliquidvehicle
DrugConcetrationinliquidmedication
(%w/w)
Carrier:Coating
(R)
Liquidloadfactor(Lf)
Liquidvehicle(mg)
Activeingredient
(mg)
Carrier(Q)(mg)
Coating(q)(mg)
Disintegrant(maize
starch)(mg)
Lubricant(mg)
Unitdose(mg)
M1 PEG®400 30 20 0.17 93.30 40.00 794.00 40.00 51.00 8.00 1026.30M2 PEG®400 60 20 0.17 26.70 40.00 397.00 20.00 26.00 4.00 513.70
M3 Synperonic®PE/L44 30 20 0.27 93.30 40.00 501.00 25.00 35.00 5.20 699.50
M4 Synperonic®PE/L44 60 20 0.27 26.70 40.00 251.00 13.00 18.00 2.60 351.30
M5 Cremophor®ELP 30 20 0.52 93.30 40.00 256.00 12.80 21.00 3.20 426.30
M6 Cremophor®ELP 60 20 0.52 26.70 40.00 128.00 6.40 11.00 1.60 213.70
Conventional _ _ _ _ _ 40.00 397.00 20.00 24.20 3.60 485.00F1 PEG400® 30 20 0.17 93.30 40.00 794.00 40.00 51.00 8.00 1026.30
F2 PEG400® 60 20 0.17 26.70 40.00 397.00 20.00 26.00 4.00 513.70
F3 Synperonic®PE/L44 30 20 0.27 93.30 40.00 501.00 25.00 35.00 5.20 699.50
F4 Synperonic®PE/L44 60 20 0.27 26.70 40.00 251.00 13.00 18.00 2.60 351.30
F5 Cremophor®ELP 30 20 0.52 93.30 40.00 256.00 12.80 21.00 3.20 426.30
F6 Cremophor®ELP 60 20 0.52 26.70 40.00 128.00 6.40 11.00 1.60 213.70

55
2.3.2. Liquisolid metformin-HCl using hydroxypropylcellulose (HPC) as a sustained release carrier and Eudragit®RL30D as a non-volatile liquid vehicle
Similarly, the above steps (Section 2.2.3.1) were used to prepare sustained release
metformin-HCl liquisolid using HPC (the sustaining agent) as a carrier instead of
Avicel®PH102 at two drug concentrations 30% and 60% (HPC1-HPC6) (Table 2.3). The
powders were then automatically compressed using the single punch tableting machine.
Additionally, Eudragit®RLPO (carrier powder) and Eudragit®RL30D as non-volatile liquid
vehicle were used to prepare liquisolid metformin-HCl in 30% and 60% drug
concentrations and are denoted as LSS1 to LSS4 (Table 2.4). Metformin-HCl was
weighed, followed by the addition of the liquid vehicle Eudragit®RL30D. All four liquisolid
preparations (LSS1-LSS4) have the same liquid vehicle Eudragit®RL30D, however
different carriers were used in LSS1 and LSS2, the carrier was Avicel®PH102. In LSS3
and LSS4, 3:7 of Eudragit®RLPO:Avicel®PH102 was used as a carrier system, after
mixing for obtaining a homogenous carrier mix, in a turbular mixer (WAB Turbula, system
Schatz, Willy A. Bacheofen machine, AG Maschinenfabrik, Glen Creston Ltd.,
Switzerland) and then were added to the drug and liquid vehicle admixture. Followed by
the addition of coating (Cab-O-Sil®M-5), disintegrant (potato starch) and lubricant
(magnesium stearate). Using wet granulation process (See section 2.4) the liquisolid
powders were turned into granules using Eudragit®RL30D as a liquid binder and were
compacted automatically into desired hardness tablets (refer to flowchart Figure 2.4 for
details).

56
Table 2-3: Liquisolid formulations of sustained release metformin-HCl using hydroxypropylcellulose high grade (HPC-H)
Liquisolidsystem Non-volatileliquidvehicle
Drugconcentrationin
liquidmedication(%w/w)
Carrier:Coating(R)
Liquidloadfactor(Lf)
Liquidvehicle(mg)
Activeingredient
(mg)
Carrier(Q)(mg)HPC-H
Coating(q)(mg)
Disintegrant(maizestarch)
(mg)
Lubricant(mg)
Unitdose(mg)
HPC1 PEG® 400 30 20 0.17 93.30 40.00 794.00 40.00 51.00 8.00 1026.30
HPC2 PEG® 400 60 20 0.17 26.70 40.00 397.00 20.00 26.00 4.00 513.70
HPC3 Synperonic® PE/L44 30 20 0.27 93.30 40.00 501.00 25.00 35.00 5.20 699.50
HPC4 Synperonic® PE/L44 60 20 0.27 26.70 40.00 251.00 13.00 18.00 2.60 351.30
HPC5 Cremophor® ELP 30 20 0.52 93.30 40.00 256.00 12.80 21.00 3.20 426.30
HPC6 Cremophor® ELP 60 20 0.52 26.70 40.00 128.00 6.40 11.00 1.60 213.70
Conventional _ _ _ _ _ 40.00 397.00 20.00 24.20 3.60 485.00
Table 2-4: Liquisolid formulation of metformin-HCl using Eudragit®RLPO as a carrier and Eudragit®RL30D as a non-volatile liquid vehicle.
Liquisolidsystem Non-volatileliquidvehicle
DrugConcetrationin
liquidmedication(%w/w)
Carrier:Coating(R)
Liquidloadfactor(Lf)
Liquidvehicle(mg)
Activeingredient
(mg)
Carrier(Q)(mg)
Coating(q)(mg)
Disintegrant(maizestarch)
(mg)
Lubricant(mg)
Unitdose(mg)
LSS1 Eudragit RL 30D 30 20 0.80 93.30 40.00 166.60 8.33 16.40 2.50 327.00
LSS2 Eudragit RL 30D 60 20 0.80 26.70 40.00 83.30 4.17 8.18 1.20 164.00
LSS3 Eudragit RL 30D 30 20 0.20 93.30 40.00 666.50 33.30 44.20 6.60 884.00
LSS4 Eudragit RL 30D 60 20 0.20 26.70 40.00 333.35 16.67 22.10 3.30 442.00
Note: * Eudragit®RLPO:Avicel®PH102 (3:7) = carrier

57
2.4. Wet granulated liquisolid formulations
2.4.1. Wet granulation using Polyvinylpyrrolidone (PVP)
The liquisolid powder (with glibenclamide and metformin-HCl) were formed into granules
using 10% Polyvinylpyrrolidone (PVP). The PVP was prepared by weighing 10g of PVP
and 90g of distilled water, and then was placed in water bath at 60 °C to dissolve the PVP
in water. Furthermore, the required amount of PVP was added to the prepared liquisolid
powder in intervals and mixed for approximately 2-3 minutes until a so wet mass reached
by feeling the wet mass. The correct moisture content was reached when the powder felt
like an agglomerated mass. The next step was to perform the “agglomerate mass
experiment” (Leuenberger, 2011), which is to take a hand full of wet mass and form an
agglomerate mass and drop it into a tray from half a meter above the surface, when the
agglomerate breaks into large pieces or only cracks, means the correct amount of
moisture was added to the wet mass. Finally, the wet mass was then sieved using two
mesh sizes 500μm-710μm. The formed granules were placed to dry at 45 °C for 120min.
It is important to mention that the granulation step was performed after the formulation of
the liquisolid powders and just before the compaction step, therefore, it was done as a
final step before tablet formation (as shown in flowchart Figure 2.4).

58
2.4.2. Wet granulation of liquisolid powder admixtures using Eudragit®
RL30 D as
a liquid binder
Similarly, the liquisolid metformin-HCl powders (flowchart Figure 2.4) using the liquid
vehicle (Eudragit®
RL30D), at two different drug concentrations (30 and 60%) undergone
wet granulation process using Eudragit®
RL30D as a non-volatile liquid vehicle as well as
a liquid binder. The experiment was also used to achieve the end point of the granulation
step, along with same temperature and time constants as above-mentioned granulation
using PVP (Section 2.4.1).
Furthermore, due to poor compressibility/compactibility of HPC liquisolid formulations,
wet granulation step with 10% PVP has been applied as well for formulations containing
Cremophor®
ELP, Synperonic®
PE/L44 (liquid vehicles) where good quality tablets were
produced.
2.5. Pre-compression study characteristics
2.5.1. Determination of flow and packing properties of the prepared liquisolid
powders
The powder flow and packing properties of each prepared liquisolid compact was
determined using tap volumeter (J. Engelsmann AG, Ludwigschafen, Germany). The
liquisolid powder was weighed then poured into a 100ml-measuring cylinder. The volume
of the poured powder was recorded as Vb and the tapped volume (after sufficient taps),
which recorded to give a constant volume on a tap density apparatus, was noted as Vt.

59
Hence, from the recorded volumes, the density of the liquisolid formulation was calculated
using the below eq. to give the bulk density (pb) and tapped density (pt) in g/mL.�pb =
Weight of powder/ Vb�pt = Weight of powder/Vt
From there, the compressibility index (CI %) of the formulations was calculated using
Equation 2.6 to investigate the flowability of the powders:
!"% = 100((*+,**-.
– *0123)/*+,**-. (Albertini, et al., 2008) Equation 2.6
According to the British Pharmacopoeia (2017), the smaller the value of CI% the better
the flow properties of the powder. Thus, CI% below 25 represents passable flow
properties and anything-above 40% are indicative of poor powder flow. The powders were
then compacted manually (non-granulated liquisolid powder) or automatically (liquisolid
granules) depending on their flow properties on a 10mm flat-faced punch and die set
using a single punch tableting machine (type 3, Manesty Machines Ltd., Liverpool, UK).
Different formulations had different compression force depending on various factors in
the formulation such as the tablet weight. For G4 and G6 (refer to Table 2.1) due to the
small unit dose, extra Avicel® PH102 was added as a filler to increase the tablet weight
to 250mg unit dose and to get a stronger and bigger tablets.�
2.5.2. Fourier transform infrared (FT-IR) spectroscopy
The FT-IR spectra were performed on all relative excipients, materials and formulations
(refer to Tables 2.1-2.4). Using Spectrum BX FTIR Spectrophotometer (Perkin–Elmer,

60
Cambridge, UK). The frequency ranged from 4000 cm-1
to 550 cm-1
at 1.0 cm-1
resolution. Small amount of individual sample was loaded into the system just to cover
the diamond and the peaks were obtained for reading and analysis.
2.5.3. Differential scanning calorimetry (DSC)
Using DSC Refrigerated Cooling System (Model Q1000, TA Instruments, UK), the DSC
thermograms of glibenclamide, metformin-HCl and all relative excipients and formulations
were analysed. DSC aluminium pans were used to weigh samples of about 3-6 mg and
then were hermatically sealed and transferred into the equipment for analysis. Prior to
running the samples, the instrument was calibrated with sapphire and indium. Thus, the
thermal behavior of each sample was studied at a scanning rate 10°C/min, from 0° C to
300°C.
2.5.4. Scanning electron microscopy (SEM)
Electron microscope (model: Hitachi S3000N, Hitachi High-Technologies UK-Electron
Microscopes, Wokingham Berkshire, UK) was used to perform SEM on glibenclamide,
metformin-HCl and all relative excipients and formulations used.
The samples were prepared by adding a small amount of each sample to 15mm diameter
aluminium specimen stubs that has double sided carbon adhesive tabs (Mikrostik
adhesive, Agar Scientific). Prior to examination, a thin layer of gold/palladium mixture
coated the samples for electric conductivity. The samples were then exposed to argon
atmosphere at 10 Pa and were then coated at current of 18-20mA for 3x15s.

61
2.6. Characterisation of liquisolid tablets (quality control tests)
The liquisolid compacts were evaluated via quality control tests in accordance to the
British Pharmacopoeia, 2017 specifications.
2.6.1 In-vitro dissolution studies for immediate release formulations
In vitro dissolution studies were performed for each batch of liquisolid formulation (refer
to Tables 2.1 and 2.2 for details), pure drug and conventional tablets for glibenclamide
and metformin-HCl immediate release and for liquisolid formulations using
Eudragit®
RL30D (LSS1-LSS4, refer to Table 2.4) using USP dissolution apparatus II
(Caleva Ltd., Dorset, UK); distilled water (glibenclamide and metformin-HCl) and
phosphate buffer, pH 7.6 (glibenclamide), were used as dissolution media. According to
British Pharmacopoeia 2017, the liquisolid tablets were placed in dissolution medium of
900mL at a temperature of 37± 0.10
C and stirred at a paddle speed of 100rpm. Ten
millilitres samples were collected at intervals of 5, 10, 15, 20, 25, 30, 45, 60 and 90 min
and were replaced by 10 ml of the dissolution medium to maintain a constant volume.
The collected samples of glibenclamide and metformin-HCl were then analysed using
UV/Vis spectrophotometer single beam at 229nm (glibenclamide) and 233 nm
(metformin-HCl) for determination of drug content using the calibration curve (Figures 2.1
and 2.2). The dissolution experiment in triplicate was achieved to compare the percentage
drug release of liquisolid tablets, pure drug and conventional tablets. Dissolution for

62
placebo tablets was performed (to be used as blanks) to eliminate any absorbance
interference from excipients.
2.6.2. In-vitro dissolution studies for sustained-release metformin-HCl tablets
(HPC-H) using flow through cell method
A USP apparatus 4 (CE 7 Smart with CP7 piston pump, Sotax AG, Switzerland) with 22.6
mm flow through cells was used during the dissolution study, hence the sink condition
was maintained. Each cell was prepared by placing a 5-mm ruby bead in the apex of the
cone to protect the inlet tube, and roughly 1 spoonful of 1 mm glass beads were added
to the cone area to form a glass bead bed. The temperature of the flow cell unit was
37.0±0.5°C. The flow rate of the liquid (distilled water) was set to 10 ml/min. Because this
is an open loop flow though cell, the washed solution was collected as waste in a separate
reservoir. The open-loop configuration is shown in Figure 2.6
Furthermore, the sample analysis was performed by following the solution absorbance
(Agilent 8453 spectrophotometer, Santa Clara, California 95051, United States).
Metformin-HCl samples were analysed at 233 nm with a 0.5 cm cell. All samples for
analysis were filtered through glass microfiber filters (Whatman, GF/ D). The dissolution
run was set to 12 hours, taking samples at, 10, 15, 20, 25, 30, 45, 60, 90, 120, 240, 360,
480, 600 and 720 min. Before analysis, calibration curve using serial dilutions was
prepared and entered into the system to get E value, which was then used, for percentage
drug release calculation. The UV reader was blanked with distilled water before running
the process. The “flow-through” method allows constant optimal sink conditions. This is

63
due to the continuous flow of fresh solvent and continuous sampling. It uses large volume
of solvent and that poor sink can avoid non-sink condition. Therefore, it is an ideal
apparatus to show an improved in-vitro/in-vivo correlation tests particularly for poor
soluble and modified release drugs forms.

64
Figure 2.6: Flow through cell (open loop) dissolution station

65
2.6.3. Uniformity of tablet weight
�Twenty tablets were selectively chosen from each formulation and weighed individually.
The average mass of the twenty tablets was calculated and the percentage deviation of
each tablet was determined.
2.6.4. Tablet hardness
Six tablets were selected from each formulation of the two drugs and the force in Newton
needed to crush them was examined using the hardness tester (Model 2E/205,
Schleuniger and Co., Switzerland). In addition to that, before the test was performed.
2.6.5. Friability
The friability tester (FRV 1000, Copley Scientific, UK) was used to measure the friability
of 10 selective tablets from different formulation. The weight of the tablets was recorded
before and after using the tester. The drum was rotating at 25rpm for 4 min. The weight
difference was recorded and the percentages of friability were calculated using Equation
(2.7).
%#$%&'%(%)* = ((-..-/0&../%2%)%&(0&..)4100 Equation 2.7
2.6.6. Disintegration
The disintegration test was performed on glibenclamide, immediate release metformin-
HCl and metformin-HCl using Eudragit®RL30D. Six tablets from different formulations at
37± 1 °C in distilled water using the disintegration unit (Manesty Machines Ltd., Liverpool,
66
UK) were used. The time of disintegration of the tablet was recorded when there was no
residue (soft mass with no palpably firm) in the cylindrical transparent tube, which
indicated that the tablet has fully disintegrated.
2.6.7. Drug Content uniformity
2.6.7.1. Glibenclamide content uniformity
Tablets containing glibenclamide were weighed and crushed by mortar and pestle in order
to determine the drug content in classical liquisolid, wet granulated liquisolid and
conventional tablets. Then, the powder was dissolved in 50 ml 0.2M NaOH to give a
concentration of 4mg/50ml (80mg/l). The solution was then filtered and diluted as
appropriate. Finally, the samples were analysed for determining the drug concentration
using UV spectrophotometer at 229 nm. The percentage of drug content with respect the
theoretical amount was determined. The experiment was repeated three times to ensure
accurate results.
2.6.7.2 Metformin-HCl Content uniformity
Metformin-HCl tablets, were crushed and placed in 100ml volumetric flask using distilled
water to give a concentration of 400mg/L. The solution was filtered and diluted with
distilled water. The samples were prepared for each formulation and the experiment was
repeated in triplicates and samples were analysed at 233nm using single beam UV-
spectroscopy.

67
2.7 Kinetics model analysis of drug release
In order to inspect the mechanism of metformin-HCl release from the immediate release
and sustained release liquisolid three kinetic release models were applied on data
obtained from dissolution tests. These models are: Zero order, First order and Higuchi
model of kinetics. With the aid of excel, the graph was conducted to obtain the equation
of the line and hence the highest square of coefficient of determination (R2) for the
indication of the most appropriate model to represent the release of metformin-HCl from
immediate and sustained release liquisolid formulations. Zero order model, is a system
that all drug particles transfer mechanism to dissolution medium is disclosed to the
surface area of the system. Hence, the cumulative percentage data of the drug release
is then plotted against the time. Additionally, first order kinetics drug release is related to
the drug concentration and can be plotted logarithm of the cumulative percentage release
of the remaining drug versus the time. Moreover, in Higuchi model, linear plotting of the
cumulative percentage of the drug release against the square root of time is expected
(Dash, et al., 2010).
2.8 Stability study of metformin-HCl (immediate release) liquisolids
The stability of the prepared tablets containing immediate release metformin-HCl and its
conventional tablet was performed in a stability chamber with 21°C and 75 % humidity for
12 month period time.
In vitro dissolution tests, DSC and FTIR analyses were applied after the storage periods
and the result were compared and evaluated to the fresh sample data.

68
2.9 Statistical analysis
In the tests of glibenclamide and metformin-HCl tablets evaluation, statistical analysis
was performed. Paired t-test was used to compare between the permeability test of
liquisolid formulation contained immediate release metformin-HCl using PEG®400,
Synperonic®PE/L44 and Cremophor®ELP. Additionally, one-way ANOVA using SPSS
was used to statistically analyse the dissolution drug release of metformin-HCl and
glibenclamide liquisolid formulations (Appendix for Chapter 3, 4 and 5). Consequently,
homogeneity of variance was not significant meaning that data were normally distributed
and hence ANOVA and T-test were applied in this research.
2.10. Metformin-HCl permeability test using Franz cell diffuser
Franz cell (Figure 2.7) diffuser was used to perform metformin-HCl permeability test. The
membrane used was male Wistar rat gut, cut into thin slice, washed and cleaned using
Tyrode buffer (prepared as in section 2.1). Individual tablets of each formulation (refer to
Table 2.2, F1-F6) were crushed and dissolved into 20ml distilled water. The sample was
then filtered and 1ml was withdrawn using micropipette and injected into the donor
chamber; the receiver chamber was filled with 14 ml HCl, 0.2M (pH 1.4), and was kept at
a constant temperature (37 ± 3 °C) (Figures 2.7 and 2.8). Furthermore, using small needle
and syringe, 1ml sample was withdrawn from receiver chamber every 5 min, 10min,
15min, 20min, 25min, 30min, 45min, 60 min, 90min, 120min and 2 hours. Then, samples
were analysed using single beam UV-vis spectrophotometer at 233nm. The withdrawn
sample was then returned into the receiver chamber to keep constant volume.
Additionally, the experiment was repeated five times.

69
Figure 2.7: Franz cell diffusion equipment description (Permegear, 2015)
Figure 2.8: Franz cell diffusion apparatus setting .

70
Chapter 3 - Glibenclamide liquisolid preparation with the application of wet granulation technique
(Results and Discussion)

71
3.1. Introduction:
Via several screening programmes, about 40% of the newly drug synthesis was identified
to be hydrophobic in nature. Thus pharmaceutical companies in manufacturing similar
drugs for oral delivery will face challenges with solubility and bioavailability difficulties.
One of these drugs is glibenclamide, which has been chosen in this research project to
be the model drug. Additionally, for the preparation of liquisolid compacts, a series of non-
volatile liquid vehicles have been selected such as, “PEG®400, Synperonic® PE/L44 and
Cremophor®ELP. Several researchers have mentioned the use of the above liquid
vehicles in the manufacturing of liquisolid immediate release tablets (Tiong & Elkordy,
2009). However, those authors have not used glibenclamide. PEG®400 (polyethylene
glycol) is a stable hydrophilic surfactant in solution and has a hydrophilic-lipophilic
balance (HLB) value of 12. It can be used to form liquid medication with a hydrophobic
drug that allows miscibility in water. According to Tiong and Elkordy 2009, naproxen
liquisolid tablets containing PEG®400 and Cremophor®ELP display a higher dissolution
rate than Synperonic®PE/L44. Therefore, PEG®400 is a good non-volatile solvent to be
used in preparation of immediate release liquisolid tablets. The second non-volatile liquid
vehicle used in this section is Synperonic®PE/L44 (Poloxamer 124), which is an ethylene
and propylene oxide block copolymer. Synperonic®PE/L44 is a water-soluble surfactant
with an effective wetting properties. Therefore, its application in liquisolid system using
hydrophobic drugs is ideal. Additionally, it has an HLB value of 12 and is classified as a
non-toxic substance. Polyoxyl 35 Hydrogenated Castor Oil, Cremophor®ELP, similarly,
is a non-volatile liquid vehicle. Its HLB value is 13 and is viscous in nature. Javaheri et al
2014 (the author of this thesis), demonstrated the use of Cremophor®ELP using

72
glibenclamide and showed the highest dissolution rate than PEG®400 and Synperonic®
PE/L44. Additionally, some non-ionic surfactants such as Cremophor®ELP can be
considered as effective pharmaceutical excipients for inhibiting p-glycoprotein function
and hence promoting the intestinal absorption of different drugs (Shono, et al., 2004).
Therefore, the uses of the water-soluble surfactants along with their desirable
physicochemical properties make them suitable for liquisolid technique.

73
Figure 3.1: Flowchart summary of the liquisolid work using glibenclamide as model hydrophilic drug

74
Table 3-1: Formulation of liquisolid systems of glibenclamide granules
Liquisolidsystem
Non-volatileliquidvehicle
DrugConcertationinliquidmedication
(%w/w)
Carrier:Coating(R)
Liquidloadfactor(Lf)
Liquidvehicle(mg)
Activeingredie
nt(mg)
Carrier(Q)(mg)
Coating(q)(mg)
Disintegrant(maizestarch)
(mg)
Lubricant(mg)
Unitdose(mg)
G1 PEG400 10 20 0.17 36.00 4.00 238.10 11.90 15.40 2.31 308.0
G2 PEG400 30 20 0.17 9.33 4.00 79.30 3.97 5.10 0.77 102.0
G3 CremophorELP 10 20 0.52 36.00 4.00 76.90 3.80 6.40 0.96 128
G4 CremophorELP 30 20 0.52 9.33 4.00 25.60 1.28 2.10 0.30
42to250mgwithfiller
G5 SynperonicPE/L44 10 20 0.27 36.00 4.00 150.40 7.50 10.50 1.60 210
G6 SynperonicPE/L44 30 20 0.27 9.33 4.00 50.10 2.50 3.50 0.52
70to250mgwithfiller
Conventional _ _ _ _ _ 4.00 238.10 11.90 13.50 2.00 270

75
3.1. Determination of the angle of slide for Avicel® PH 102 (MCC) and Cab-o-sil®
M-5 (fumed silica):
In order to calculate the required ingredient quantities, the flowable liquid retention
potentials (Φ values) of powder excipients were utilised which are required for the
calculation of Lf value. The angles of slides for Avicel® PH102 and fumed silica were
measured with the following liquid vehicles: PEG®400, Synperonic®PE/L44 and
Cremophor®ELP. The ΦCA value and ΦCO values decide the amount of carrier and coating
material required to produce a free flowing, non-adherent, readily compactible and dry-
looking liquisolid formulations. High Φ value is advantageous as it results in smaller sizes
of the formulated tablets ( Spireas , et al., 1992). It is vital to measure the angle of slide
because it is the preferred method to determine the flowability of powders with particle
sizes of less than 150µm ( Spireas , et al., 1992). In this study, as stated by the
manufacturer, the particle sizes of Cab-o-sil® M-5P and Avicel®PH102 were 133.8µm
and 0.2-0.3 µm respectively. In addition, Spireas et al (1992) and (Elkordy, et al., 2013)
clarified that when the drug particle dissolved in the liquid vehicle, the liquid initially
absorbed into the interior of the particles gets captured by its internal structure, thus
adsorption of the liquid starts taking place onto the internal and external surfaces of the
porous carrier particles after saturation state of this process has occurred (Fahmy &
Kassem, 2008). Furthermore, the coating material (Cab-O-Sil®M-5), which has high
adsorptive property and large surface area, gives the liquisolid system the desirable flow
characterisation. Thus determination of the flow properties of the powder excipient and
liquid/powder admixture is significant to ensure a success in liquisolid formulations.

76
Additionally, the viscosity of the liquid vehicle plays an important role in the formulation of
the liquisolid compacts. The viscosity of PEG®400 and Cremophor®ELP are 105-130 and
650-800 mPa s, respectively (Rowe, et al., 2003). (Tiong & Elkordy, 2009), reported that
the viscosity of the liquid vehicle is inversely proportional to the amount of carrier and
coating material required in a liquisolid formulation and accordingly the Lf increases with
increased viscosity of the liquid vehicle. High viscosity liquid vehicle such as
Synperonic®PE/L44 and Cremophor®ELP leads to poor powder flowability and
compactibility of liquisolid admixture even with application of compressibility index as
described by Spireas ( (Spireas & Bolton, 1999) (Suliman, et al., 2013) studied the
compressibility index of norfloxacin liquisolid powder using PEG®200 and
Synperonic®PE/L61 that required the application of an equation described by (Spireas &
Bolton, 1999). However, this method is very time consuming especially that the equation
needs to be understood thoroughly before application, which is not convenient for
manufacturing purposes. The application of compressibility index requires several
samples as a result loses excessive amount of powder before the liquisolid powders are
compressed, which is again a great disadvantage to the pharmaceutical industry.
Nevertheless, although the flowability of liquisolid powder using Synperonic®PE/L61 was
enhanced using the compressibility index as stated by (Suliman, et al., 2013) it is yet not
a promising method for enhanced flowability of liquisolid admixtures using high viscosity
liquid vehicles such as Synperonic®PE/L44 or Synperonic®PE/L61 and Cremophor®ELP.
Accordingly, wet granulation was applied in this research just before compaction (Flow
chart Figure 3.1) to overcome these problems, with hope that this process will be
beneficial for large-scale production in pharmaceutical industry.

77
3.2. Determination of flow and packing properties of the prepared liquisolid
powders-discussion
The determination of the powder flowability is important in handling, packing, mixing and
compression. One major obstacle pharmaceutical industries face is the poor flow
properties of powders. This affects the uniformity of flow out of the hopper and further
problems in compaction (Tiong & Elkordy, 2009); ( Spireas , et al., 1992) (Jain, et al.,
2014), because uniform and reliable flow from the hoppers into the die of the compressing
machine ensures uniform tablet weight and drug content. There are several factors that
can affect the flow properties of the liquisolid powder including physical, environmental
as well as mechanical. Therefore, the Carr’s compressibility index was calculated for each
liquisolid powder to determine its flow properties. This means the flow properties are
affected by particle shape, particle size, porosity, density, moisture content and surface
roughness. Additionally, Carr’s compressibility index is a good parameter in reflecting
interparticle friction. The calculated Carr’s compressibility index of glibenclamide liquisolid
granules is presented in Table 3.2 and Figure 3.2. It is a good parameter to evaluate the
flow of the prepared powder. The lower the Carr’s compressibility index is, the better the
flow of the powder would be. In this research project, as shown in Table 3.2. G1 and G5
(for composition refer to Table 3.1), conventional liquisolid powders were 12.6%, 8%, and
18%, respectively, all have CI below 25%. On the other hand, G2 and G3 results showed
poor flowability with CI% being above 25% (30% and 28% respectively). This can be
related to the amount, type and property of the liquid vehicle used (PEG®400,
Synperonic®PE/L44 and Cremophor®ELP). Nevertheless, the flowability results
obtained were only for granulated liquisolid powder. This is due to the poor flowability

78
properties of the ungranulated liquisolid powder using PEG®400, Synperonic®PE/L44
and Cremophor®ELP (viscous liquid vehicles). Thus, this shows that the properties of the
liquid vehicle can interfere with the flow property of the formulation making it better or
poor flowing. Moreover, in addition to the coating properties of Cab-o-Sil®M-5 (fumed
silica), it can also act as a glidant (concentration of 0.1-0.5 %) to improve powder
flowability. Furthermore, these granulated liquisolid powders were compacted
automatically (electronically) into tablets.
Table 3-2: Carr’s compressibility index of glibenclamide liquisolid compacts.
Carr'sindex(Cl%)ofpreparedliquisolidpowdersofglibenclamide
Liquisolidsystem* Carr'sindex(Cl%) TypeofFlowG1 12.60 ExcellentG2 30.00 PoorG3 28.00 PoorG4 25.00 PoorG5 8.00 ExcellentG6 16.00 veryGood
Conventional 18.00 Fair* For the composition of each formula refer to Table 3.1.

79
Figure 3.2: Carr’s compressibility index glibenclamide liquisolid granules and
conventional powder. For formulations’ composition refer to Table 3.1
It can be seen from Table 3.2, that the liquisolid granule formulations using
Cremophor®ELP (G5) showed best flowability outcome (due to the addition of excess
Avicel®PH102 (carrier) that was added to increase the weight of the tablet to 250 mg unit
dose). Therefore, it is clearly visible that granulation with the aid of excess Avicel®PH102
addition has enhanced the flowability properties of the liquisolid powder using one of the
viscous liquid vehicle i.e. Cremophor®ELP. On the other hand, liquisolid powders using
all three vehicles used in this study were not compacted automatically unless formed into
granules. This is due to poor flowability and compressibility properties of the liquisolid
powder and due to the elasticity properties of the powders with liquid vehicle used.
Elkordy et al 2013 experienced two liquisolid formulations using Synperonic® PE/L61 with
Solutol HS 15 (1:1) at both drug concentrations 10% and 30% which were incompactible,
0.0
5.0
10.0
15.0
20.0
25.0
30.0
35.0
Carr'sIndex(%
)
GibenclmideLiquisolidsystem

80
and hence no tablets were formed. The given explanation was linked to the liquid vehicle
used that lead to elastic behaviour of the powder that caused this incompactibility. The
powder deformed upon compression and returned to its original shape after removal of
the compaction force. This is clearly seen in this current research in the case of
glibenclamide liquisolid with Cremophor®ELP (see Figure 3.3). Compression of
ungranulated powder admixture was unsuccessful due to the elastic behavior of the
liquisolid formulation. As it is exhibited in Figure 3.4, the powder not only was not
compressed into tablets, but also formed a compressed unwanted shape, which is not
desirable for the industry (Figure 3.4). Therefore, granulation was used to overcome this
problem. After using granulation, the powder was compressed automatically into tablets
(Figures 3.5 and 3.6) with no capping or cracking which complied with quality control test
of the British Pharmacopeia 2017.

81
Before granulation
Figure 3.3: Glibenclamide and10% Cremophor®ELP powder without granulation
Figure 3.4: Glibenclamide and10% Cremophor®ELP without granulation in the tablet press.

82
After granulation
Figure 3.5: Glibenclamide and 10% Cremophor®ELP granules after granulation
Figure 3.6: Glibenclamide and 10% Cremophor®ELP tablets after granulation

83
In a concentrated suspension (liquid vehicle and drug), weak Van der Waal forces hold
flocculated particles together. This often results in plastic flow ( (Mahato & Narang, 2012).
If the shear stress is low, such materials might possess elastic behavior. However, when
the maximum yield stress is exceeded where the Van der Waal forces are broken, plastic
flow is exhibited. There must be a balance for plasticity. Although plastic deformation
helps the solid links to form between particles within the powder mix, excessive plasticity
leads to the formation of tablets with high extent of hardness. The powder mix produced
with Avicel®PH101 and the liquid vehicle takes advantage of the elastic properties of the
liquid vehicle and the plastic properties of Avicel®PH101. Thus, in the current research,
only few ungranulated liquisolid tablets were manually compressed for the purpose of
dissolution comparison test study. As shown in table3.1, liquisolid granules using
Cremophor®ELP (G5) showed best flowability outcome compared to PEG®400 (G1).
According to (Tiong & Elkordy, 2009), liquisolid naproxen showed best flowability with
PEG®400 and not with Cremophor®EL (poor flowability). This is due to the high viscosity
behaviour of the non-volatile liquid and due to load factor being above 0.25. The higher
the liquid load factor the poorer the flowability characteristics of the liquisolid powder (see
Table 3.1 for details). This is because there will be fewer amounts of carrier and coating
available in the formulation and excess amount of liquid vehicle being available leading
to agglomerates ( (Altememy & Altememy, 2014) (Darwish & El-Kamel, 2001), (Shangraw,
1989). Also, in this current study, Synperonic®PE/L44 (G3) showed poor flowability
compared to the conventional powder (fair flow) but both granules were automatically
compactible. This is clearly linked to the amount of liquid vehicle present that delays the
flow of the powder. According to (Javadzadeh, et al., 2007) using HPMC or PVP as

84
microsystems can improve flowability. Hence, Avicel®PH 102 was added as an additional
filler to produce 250mg tablets to improve tablets characteristics.
The new technique of wet granulation was used in this research. It has shown enhanced
flowabiity of liquisolid powders that contain viscous liquid vehicles such as
CremophorâELP. Not only did it enhance the flowability, but it also allowed for automatic
compression of the liquisolid granules, which was impractical, to achieve without
granulation. Also, the excipients used play a great role in the flowability and compactibility
of the liquisolid powder. For example, microcrystalline cellulose (MCC, Avicel®), is a
widely used excipient in pharmaceutical tableting, because of its good compactible
properties. This can be explained by the chemical properties of the microcrystalline
cellulose. The microcrystalline particles are held together with hydrogen bonds, which in
return affect the strength and cohesiveness of the tablets. Therefore, MCC
(Avicel®PH102) was used as a filler to increase the tablet size to a medium size tablet of
250mg unit dose. By the addition of MCC, the tablets were compacted evenly without any
cracking or capping. Nevertheless, glibenclamide and Cremophor®ELP 10% and 30%
without granulation were difficult to compact neither manually nor automatically but they
became elastic and showed an unexpected outcome, they were poorly flowable and were
cohesive as seen in Figures 3.3 and 3.4. Therefore, pre-granulation liquisolid powders
did not undergo flowability test. On the other hand, as seen in Figures 3.5 and 3.6; the
granulated liquisolid powder of glibenclamide using Cremophor®ELP showed better
shape with enhanced flowability and thus compactible tablets.

85
Therefore, granulation is a successful technique to convert incompactible elastic powder
into good flowability and compactability powders with excellent flowability properties
according to Carr’s compressibility index.
3.4. Characterisation of liquisolid formulations
3.4.1 In-vitro dissolution studies
The dissolution profiles of glibenclamide formulations were performed in both distilled
water (non-sink conditions) and phosphate buffer (pH 7.6; for sink conditions) to study the
effect of liquisolid technique on aqueous dissolution enhancement of the drug. The
dissolution profile of glibenclamide with 30% drug in Cremophor®ELP (Figure 3.7a and b)
shows highest drug dissolution rate (P< 0.05) (refer to Appendix for Chapter 3) when
compared to most formulations including the pure drug (which showed no drug release
at all in water). Also, the liquisolid glibenclamide with granulation showed higher drug
release than without granulation (P<0.05). It is shown in Figure 3.7, where G1 to G6 (refer
to Table 3.1 for composition) showed a higher drug release when granulation step was
performed and inversely, the drug release was to a minimum when manual compaction
was performed in the non-granulated form.
Therefore, it can be concluded that the in-vitro dissolution of liquisolid tablets is greatly
influenced by granulation and by other three major factors: the type of vehicle, the drug-
vehicle ratio and type of disintegrant in agreement with (Javadzadeh, et al., 2007);
(Nokhodchi, et al., 2005). Some carriers could have an effect on the drug dissolution, for
example in this case, microcrystalline cellulose (Avicel®PH102) was used and from

86
previous research it showed that microcrystalline cellulose (MCC) has disintegration
property which could facilitate disintegration of tablets and thus dissolution of drug
(Javadzadeh, et al., 2007). In addition, a study by (El-Gizawy, 2007), suggested that
single disintegrant has no significant effects on drug dissolution. Also, when explaining
the dissolution characterisation and the percentage drug release of the formulation better,
the Noyes-Whitney equation was used.
!"!# = &. (("* − ",)
where dC/dt is the dissolution rate of the drug particle; “k” is a constant, which is affected
by the viscosity of the dissolution medium and experimental conditions; “A” is the surface
area exposed to dissolution; “Cs” is the saturation solubility of the drug in the diffusion
layer; “Cb” is the concentration of drug in the bulk solution. Moreover, all dissolution tests
were done under same paddle speed of 100rpm and same dissolution medium. Thus, the
factors that will affect the dissolution outcomes of the liquisolid compacts are A and (Cs -
Cb). Additionally, there are some factors that can affect the solubility of the solid drug in
the dissolution medium such as temperature (endothermic or exothermic), dissolution
medium (acidic or neutral), crystalline structure, presence of solubilising agents and
molecular structure of the solute. In this study, the temperature was maintained constant
at 37±0.10C and the dissolution medium as have been mentioned previously was kept
constant for all formulation. Therefore, what could have affected the outcome is the
presence of other compounds, which are the non-volatile liquid vehicles. As a result, each
formulation had different dissolution profile (Figure 3.7), depending on its liquid vehicle
and its wetting property (El-Say, et al., 2010).
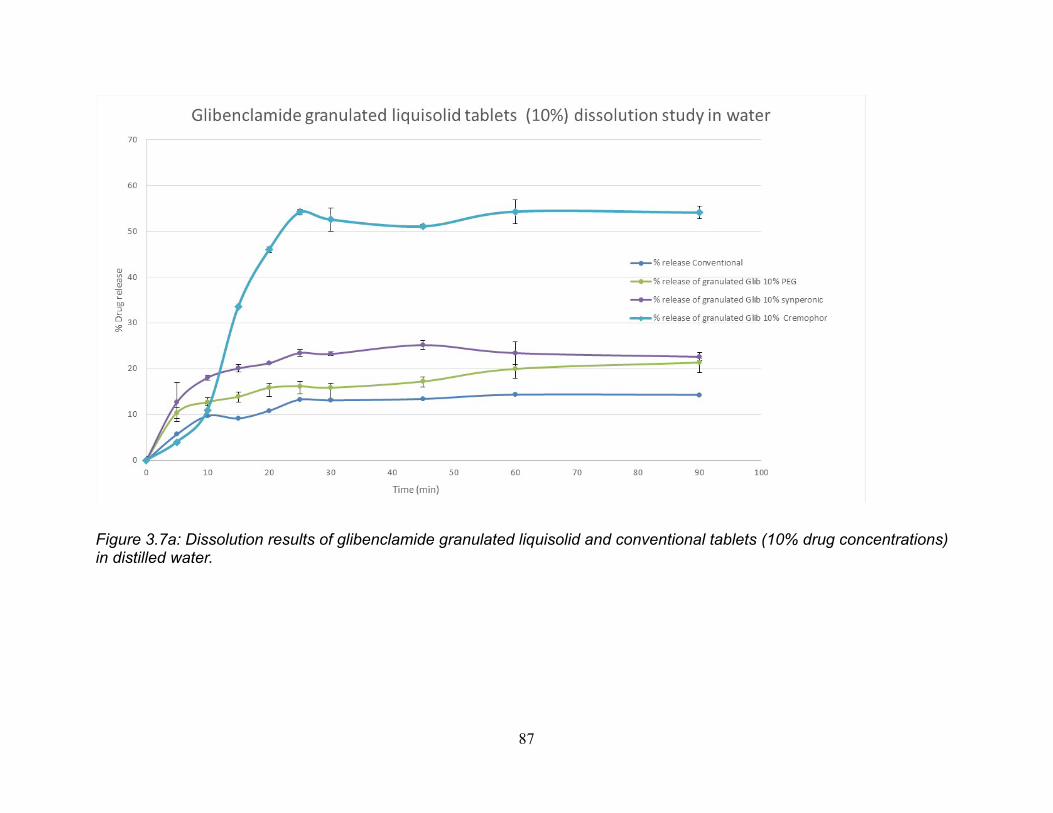
87
Figure 3.7a: Dissolution results of glibenclamide granulated liquisolid and conventional tablets (10% drug concentrations) in distilled water.

88
Figure 3-7b: Dissolution results of glibenclamide granulated liquisolid and conventional tablets (30% drug concentrations) in distilled water.

89
Figure 3.8a: Dissolution results of glibenclamide granulated liquisolid and conventional tablets (10% drug concentrations) in phosphate buffer, pH 7.6.

90
Figure 3-8b: Dissolution results of glibenclamide granulated liquisolid and conventional tablets (30% drug concentrations) in phosphate buffer, pH 7.6.

91
Basically, enhanced dissolution rate revealed in liquisolid formulations is due to the
mechanical treatment with the hydrophilic liquid vehicle, which increased the contact
between the drug, and the dissolution medium which was distilled water (Yadav & Yadav,
2010). In other words, surfactants increase the wettability of the drug making them more
available for water molecules to penetrate and thus increase the drug dissolution and
improve the absorption from the GI tract. Hence, to relate the results to the equation,
when formulating the liquisolid tablet, the drug particle was dispersed in the hydrophilic
liquid vehicle which increases the diffusion coefficient of the dissolved drug particle, which
is affected by the viscosity of the dissolution medium. In this study, PEG®400 behaved
with glibenclamide differently when compared to other drug in other literature as it showed
enhanced dissolution (Javadzadeh, et al., 2007), but with glibenclamide no great effect
was observed (see Figure 3.7). Therefore, not all liquisolid vehicles work to the same
extent with all hydrophobic drugs. The reasoning behind one formulation having higher
dissolution rate than another is due to the solubility effect of the liquid vehicle itself. In
other words, if the drug was soluble in that liquid then it can be predicted that formulation
will have higher dissolution profile. On the other hand, comparing drug release from
conventional tablets, the extent of the drug release was about 15% (Figure 3.7) and only
10% of the drug were released after 10 minutes. For PEG®400 containing liquisolid
formulations, the drug release was lower (however not significant P>0.05) in the case of
ungranulated compacts prepared manually. Presence of Synperonic®PE/L44 and
Cremophor®ELP enhanced glibenclamide release better than PEG®400 did. Hence,
based on this study, PEG®400 is not a good choice of liquid vehicle to enhance
glibenclamide dissolution in water. However, higher values were obtained in phosphate

92
buffer.
Interestingly, Cremophor®ELP containing liquisolid compacts, which was prepared after
granulation resulted in the highest drug release (>50% after 20 min in dissolution media)
(Figure 3.7 & Figure 3.8). The same formulation without the wet granulation step could
not be compacted into tablets even manually (Figure 3.4). On the other hand, as seen in
Figure 3.7, the granulated liquisolid tablets showed better release and thus higher
dissolution rate compared to the ungranulated ones. In a similar research paper,
(Javadzadeh, et al., 2007) used PVP not as a liquid binder to produce granules. PVP was
used to increase the load factor of the liquisolid formulations and therefore witness an
increase in dissolution rate with the presence of PVP. Moreover, because of its excellent
solubility, PVP normally has no delaying effect on the dissolution rate of the pure drug
and higher rate of dissolution is seen than that of the pure drug. According to Javadzadeh
et al 2007, the reason behind this enhancement could be due to the “crystal growth
inhibition”, which refers to one the characteristics of PVP that inhibits the precipitation of
the drug from the saturated solution. Additionally, as a result of the adsorption of the drug
on the carrier, this allows the drug to be exposed to the dissolution medium with a larger
surface area leading to a higher dissolution rate. Thus, wet granulation step has shown
an advantage to the liquisolid formulation in the release of the hydrophobic drug and
enhancement of the dissolution rate (Figure 3.7b) which may be leading to improved oral
bioavailability.
For choosing the most applicable kinetic model of the drug release in phosphate buffer
from the granulated glibenclamide liquisolid formulations, goodness of fit test must be
performed (Refer to Figure 3.9 for examples). The results for coefficient of determination

93
(R²) for glibenclamide liquisolid granulated tablets were revealed that the release of the
drug was governed by the Higuchi model (Figure 3.8). Higuchi model describes the
release of the drug from a matrix, in this case the matrix is the carrier mixed with the liquid
vehicle, as a square root of time, which is linked to Fick’s Law of diffusion (Prabakaran,
et al., 2003) This means that the driving force for diffusion of metformin-HCl molecule
from the tablet into the dissolution medium is the drug concentration gradient between
tablet and dissolution medium (Elkordy, et al., 2013), (Javadzadeh, et al., 2007). Also,
this can explain the slow diffusion rate of the drug as the distance of diffusion is increased
which is the Higuchi model (Square root of time). The zero-order model can be best
described when drug release rate is independent of its concentration. Whilst the first-
order model is when the drug release is dependent on its concentration.

94

95
Figure 3-9: Kinetic release models of glibenclamide from some granulated liquisolid
tablets (10% and 30% drug concentrations) in phosphate buffer, pH 7.6.
3.4.2. Uniformity of tablet weight
The permitted weight variation in BP is, not more than two tablets differ from the mean
by more than 5% if the average weight of the tablet was 250 mg or more, and for less
than 250 mg, the percentage deviation is 7.5 %. In this case, all prepared formulations
(Table 3.3), including the conventional tablet except Synperonic®PE/L44 and
glibenclamide 30%w/w (G4), did comply with British Pharmacopeia (BP) specifications.
The above uniformity of weight test was performed only on granulated liquisolid tablets
whilst non-granulated tablets were not tested for any quality control measures due to
elastic properties of these powders.

96
3.4.3. Tablet hardness
Generally, ideal tablet hardness should be produced without applying excessive
compression force where rapid tablet disintegration and drug dissolution are maintained
at the same time. In this study, G1 and G6 (table 3.1) showed best tablet hardness (5.93
Kg/f (58N) and 5.03 kg/f (49 N) respectively) compared to the other formulations. There
are several factors tablet hardness depends on such as particle size, interparticle force
and most importantly compression force. Usually, as compression force increased, tablet
hardness and fracture resistance also increases. Additionally, (El-Say, et al., 2010) found
a relationship between liquid load factor and the hardness of the tablets in the formulae
having approximately the same powder excipient ratio. When liquid load factor increased,
the hardness of the tablet decreased. However, this was not supported in this study; the
data obtained showed no relationship to the liquid load factor of the liquid vehicle used.
Our hypothesis is that not only the liquid load factor has an effect on the hardness of the
tablet, but also granulation process that was performed before compaction (refer to table
3.3). For example, G3 formulation, although hardness was small (1.8kg), but the tablet
complied with friability test (<1%).
3.4.4. Friability
All the liquisolid and conventional tablets complied with British pharmacopoeia 2017 (BP)
limits (less than 1%) of the percentages of weight loss in friability tests (Table 3.3). The
tablets showed no crack, chipped or broken marks during the test. Hence, liquisolid

97
tablets can withstand any handling and packaging attritions applied to them without losing
their physical properties.
Table 3-3: Summary of results expressed by the average of tablet hardness (N), tablet
uniformity weight (mg), friability (%) and drug content (%) for all granulated liquisolid
(G1-G6) and conventional glibenclamide tablets.
FORMULATION HARDNESS(N)
CRUSHINGLOAD(KG/F)
FRIABILITY(%)
DRUGCONTENT
(%)
UNIFORMITYOFWEIGHT(MG)
G1(GRANULATED) 58.21±11.2 5.93±1.14 0.60 107.00 307±7.70G2(GRANULATED) 84.86±12.9 8.65±1.32 0.05 98.00 109±1.90G3(GRANULATED) 17.82±5.63 1.82±0.57 0.40 102.00 211±2.80G4(GRANULATED) 23.87±3.44 2.43±0.35 0.23 85.00 179±15.3G5(GRANULATED) 38.10±0.74 3.88±0.08 0.06 104.00 248±7.40G6(GRANULATED) 49.38±1.34 5.03±0.14 0.50 103.00 251±1.30CONVENTIONAL 52.32±16.5 5.33±1.68 0.60 98.00 256±10.1
3.4.5. Disintegration
The presence of a non-volatile liquid vehicle is expected to delay the disintegration time
of the tablet. However, the presence of microcrystalline cellulose (MCC) speeds the
process of disintegration giving a low disintegration time (Javadzadeh, et al., 2007). In
addition to that, some literatures suggest that high hardness tablets are associated with
long disintegration time. Disintegration time can be affected by the type of liquid vehicle
used and also by other properties such as tablet porosity and pore structures (Tiong &
Elkordy, 2009). Studies suggest that there is a positive relationship between tablet
hardness and disintegration time. In other words, when the hardness increases, the
disintegration time increases (Kitazawa, et al., 1975). Additionally, in this research, G6
(refer to table3.1 for composition) records the lowest disintegration time of about 9
seconds and the longest time was seen in G2 (15 min). Figure 3.10 presents the average

98
disintegration time results of the liquisolid and conventional formulations. All formulations
including the conventional tablets showed disintegration time below 15 min except for G2.
This proves to some extent that the higher the crushing force, the longer the disintegration
time. Hence, the relationship between tablet hardness and disintegration time is directly
proportional. Thus, the way to overcome poor disintegration time is to reduce the
compression force. Nevertheless, all glibenclamide liquisolid tablets including the
conventional tablet did comply with BP specification of disintegration time meaning that
liquisolid technique was successful to produce enhanced disintegrated (hence enhanced
drug release as shown above) glibenclamide tablets.
Figure 3-10: Average disintegration time of glibenclamide liquisolid granulated tablets
and conventional tablets. (Refer to Table 3.1 for formulations’ composition)
13.490015.802
9.24833
14.3700 13.545
0.09 0.200.0000
5.0000
10.0000
15.0000
20.0000
25.0000
Time(m
in)
DisintegrationtimeofGlibenclamidegranulesandconventionaltablets

99
3.4.6. Drug content
British Pharmacopoeia 2017 drug content uniformity criteria suggests an accepted limit
between 85% and 115% of the average drug content. Accordingly, all liquisolid (G1-G6
granulated, and G1-G4 ungranulated) (Table 3.3) preparations except conventional
tablets complied with BP limit test. However the drug content for G4 was less than other
granulated formulations and this can be explained on the basis of large standard
deviations obtained from weight uniformity results of G4. Moreover, there are no
significant differences (p > 0.05) between either granulated and ungranulated as well as
conventional tablets. In other words, the presence of PVP and different quantities of liquid
vehicles carrier and coating did not affect the drug uniformity results. Thus, liquisolid
granules prepared by wet granulation technique using PVP show similar results to non-
granulated liquisolid tablets. Literature suggests that the adsorptive properties of
liquisolid system onto the carrier, which increases the surface area, could lead to a
homogeneous drug distribution within the batch (Fahmy & Kassem, 2008). It was also
suggested by (Elkordy, et al., 2012), that the large volume of the liquid vehicle, carrier
and coating being used affects the drug uniformity. Their results showed batches with
higher liquid vehicle concentration (10% w/w) complied with BP content uniformity
specifications (Cremophor®EL 20%, Synperonic®PE/L61 20% and CapryolTM 90 20%.
The reason is that the drug would need larger volume of liquid vehicle to be dispersed in,
thus a larger amount of carrier and coating would be needed to produce a free flowable
powder which leads to an even drug content.

100
3.5. Scanning electron microscopy (SEM)
SEM photomicrographs that show the surface morphology of the liquisolid formulations
(G1-G6 granulated, G1–G6 ungranulated) including conventional and pure drug are
displayed in Figure 3.11. Pure glibenclamide powder observed to be crystalline in nature
with fine particles which consists of flat shape. Also, conventional preparation showed
crystals on the surface of the carrier material. The scanning electron microscopy of the
liquisolid particles reveals irregular shapes with some long or rod-like structures which
usually represents the shape of Avicel®PH102 (Elkordy, et al., 2013). The change in
shape provides additional surface for deposition of the drug particle into the liquid vehicle.
Thus, the disappearance of glibenclamide crystals to large extent suggests solubilisation
of the drug into the liquisolid admixture, as will be confirmed by the DSC data. This may
be contributed to the enhanced dissolution properties of the drug (Altememy & Altememy,
2014). Furthermore, as seen in Figure 3.11, the SEM photomicrographs show different
particle shape between granulated and ungranulated formulations. The granulated
glibenclamide liquisolid formulations present with joint agglomerates, whereas the
ungranulated particles appear to be less bonded with rod-like structure shapes. This can
be indicative of the enhanced flowability using PVP in wet granulation. Liquisolid drug
particles after granulation become combined into a general sphere like shape that not
only means the drug has been dispersed well with the carrier and coating materials, but
also demonstrates the unique flow characteristics associated with this technique.

101
Pure glibenclamide
Conventional glibenclamide
G1 (Granulated)
G1 (ungranulated)
G3 (Granulated)
G3 (ungranulated)

102
G4 (Granulated)
G4 (ungranulated)
G6 (Granulated)
G6 (ungranulated)
Figure 3-11: SEM photomicrographs for pure (x1000) and conventional glibenclamide,
and glibenclamide liquisolid powders and granules (x500). Refer to Table 3.1 for
formulations’ composition.
3.6. Fourier transform infrared spectroscopy (FTIR)
Figures 3.12 illustrate the Fourier transform infrared spectral information of pure
glibenclamide powder, excipients (Avice®PH102, Cab-O-sil®M-5, potato starch, Mg
stearate and PVP) and non-volatile liquid vehicles (PEG®400, Synperonic®PE/L44,
Cremophor®ELP). Additionally, liquisolid formulations (G1-G6) (refer to Table 3.1 for
composition) in both granulated and ungranulated forms. The characteristics fingerprint
FTIR peaks between 1500 and 1800 cm-1 for glibenclamide, the C=O stretching region

103
can be seen in Figure 3.12. It shows noticeable change in the IR spectra associated with
liquisolid preparations. The peaks were either shifted or disappeared with even reduced
intensity, suggesting interaction between the drug (glibenclamide) and the excipients
used (Suliman, et al., 2013). Moreover, bands between 1000-1200 cm-1, show reduction
in percentage transmittance which is the C-O stretching region, implies to an interaction
between drug and non-volatile liquid vehicles leading to hydrogen bonding between
glibenclamide and the liquid vehicle. One of the contributing factors that can affect the
drug’s solubility is the formation of hydrogen bonding between the drug and liquid vehicles
and thus accelerates dissolution rate (Elkordy et al 2013). Also, the comparison between
ungranulated and granulated liquisolid glibenclamide do not show any change in their IR
spectra, both correspond to the same peak number. Thus, the granulation process using
PVP does not lead to any interaction with glibenclamide. Consequently, FTIR spectra
analysis complies with DSC results where the crystallinity of glibenclamide was
decreased leading to the solubilisation of glibenclamide crystals in the liquid vehicles.
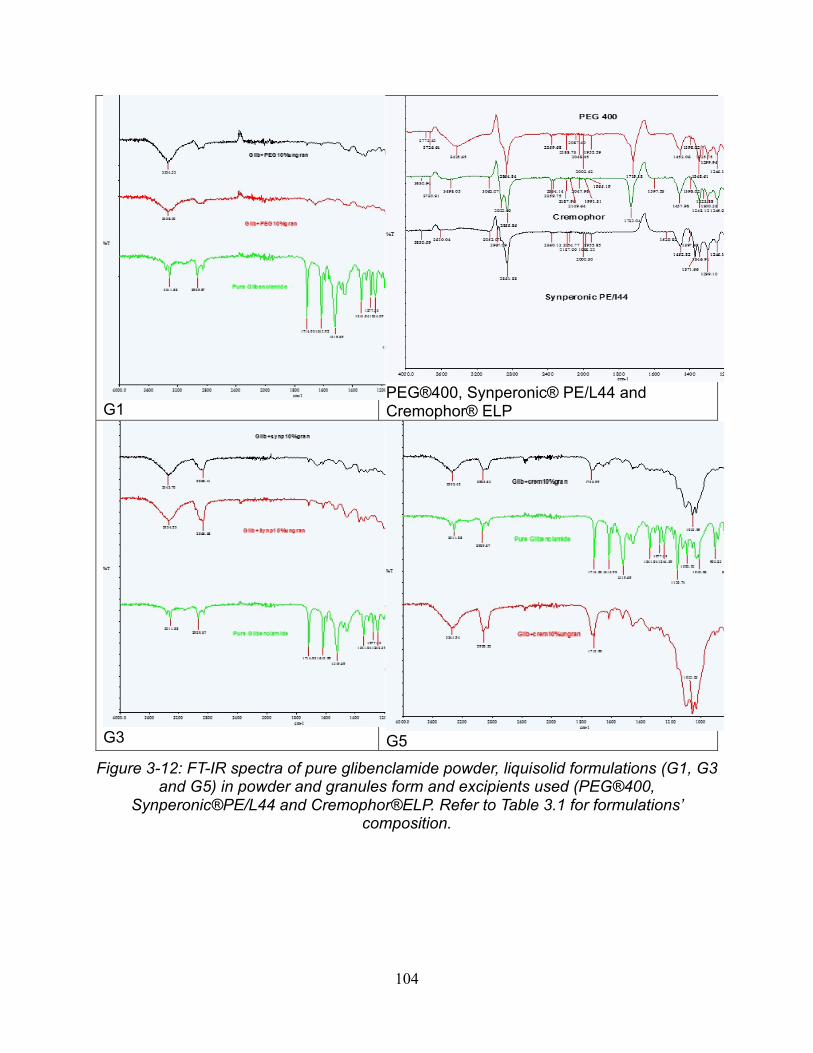
104
G1
PEG®400, Synperonic® PE/L44 and Cremophor® ELP
G3 G5
Figure 3-12: FT-IR spectra of pure glibenclamide powder, liquisolid formulations (G1, G3
and G5) in powder and granules form and excipients used (PEG®400,
Synperonic®PE/L44 and Cremophor®ELP. Refer to Table 3.1 for formulations’
composition.

105
3.7. Differential scanning calorimetry (DSC)
The DSC thermograms of pure glibenclamide, granulated and ungranulated liquisolid
glibenclamide including conventional powder should be in the range of the melting
temperature of glibenclamide in order to define the effect of liquisolid and wet granulation
on the drug. The presence of any change or shift in the melting temperature indicates the
outcome of PVP in wet granulation as well as the effect of liquid vehicles and other
excipients. Formulations G1-G6 (refer to Table 3.1 for composition), the excipients, pure
glibenclamide and conventional DSC thermograms are shown in (Appendix for Chapter
3) and Table 3.4 exhibits the DSC transition temperatures. The thermogram of pure
glibenclamide clearly shows a melting temperature of 175.9 0C and an enthalpy value of
91.5 J/g. At the 175.9 0C, the drug was in melting state with a sharp peak, which
corresponds to the crystalline form of the drug (Baskaran, et al., 2016). Furthermore, in
the liquisolid formulations (PEG®400, Synperonic®PE/L44 and Cremophor®ELP), the
sharp endothermic peak at the drug melting point was either disappeared from granulated
liquisolid containing PEG®400 (G1 and G2), and Cremophor®ELP (G3 and G4) liquid
vehicles (which corresponds to the solubilisation of the drug in the liquid vehicle or
causing change to the amorphous state of glibenclamide which was reflected in enhanced
drug release as shown above in Figure 3.7a and b) or broadened with reduced enthalpy
with granulated liquisolid containing Synperonic®PE/L44 (G5 and G6). In addition to that,
no interaction between drug and excipients were shown in the DSC thermograms but
compatibility was shown. In more detail, PVP granulated liquisolid formulations
thermograms display small changes at a temperature range of 110-130 0C in their
endothermic peaks compared to the ungranulated formulations. The probable reason

106
could be that the interaction between the non-volatile liquid vehicles and drug particles
are much larger than that between PVP, excipients and glibenclamide. Nevertheless, a
slight shift in the endothermic peaks in all granulation methods is evident compared to the
ungranulated formulations. Also, (Albertini, et al., 2004), debated whether the appearance
is due to drug interaction with PVP or with other excipients. It can be concluded that the
enhanced dissolution rate of glibenclamide is not only due to the interaction between the
drug and the excipients or reducing the crystallinity of the drug, but also due to the
wettability of the drug particles in the liquisolid systems by the aid of the liquid vehicle,
this is in agreement with the study by (Javadzadeh, et al., 2007).
Table 3-4: DSC transition temperatures of pure glibenclamide conventional powder,
drug liquisolid granulated and ungranulated formulations (G1 – G6).
Composition* Transitiontemperature(0C)Pureglibenclamide 175.88Conventional 109.38,smallpeakatabout176G1(granulated) 110.19G1(ungranulated) 130.47G2(granulated) 118.56G2(ungranulated) 117.87G3(granulated) 131.79G3(ungranulated) 133.94G4(granulated) 127.27G4(ungranulated) 136.17G5(granulated) 111.69,193.26G5(ungranulated) 106.70,141.08,189.85G6(granulated) 127.64,smallpeakat174G6(ungranulated) 139.27
* Refer to Table 3.1 for formulations’ composition.

107
3.8 Conclusion
Liquisolid technique changes the properties of glibenclamide by inclusion of the drug
particles (10%w/wand 30%w/w) in non-volatile liquid vehicles (PEG® 400,
Synperonic®PE/L44 and Cremophor ®ELP). Wet granulation of prepared liquisolid
powders successfully produced automatically compactible tablets using the above-
mentioned liquid vehicles. The best dissolution enhancement was seen with combination
of Cremophor® ELP with glibenclamide (10%w/w). However, the viscous behavior of
Cremophor ®ELP makes the flowability and automatic compaction of liquisolid powders
containing Cremophor® ELP very challenging. Using the new technique of wet
granulation developed in this study, those problems were resolved and well compressed
tablets were developed that were in compliance with B.P standards. Therefore, it can be
concluded, that the problem with liquisolid compacts, which is flowability and
compressibility, has been resolved by the introduction of wet granulation system to
liquisolid powder admixture before compression. This new technique enhances not only
the dissolution of the hydrophobic drug, but also the formation of wet tablets into strong
well-compacted tablets with no lamination or capping. The liquisolid system can use any
type of viscous liquid vehicles in its composition and by application of wet granulation
technique liquisolid powders can be compacted into tablets.

108
Chapter 4 - Application of liquisolid technology using wet granulation on metformin-HCl: Immediate release and permeability studies
Results and discussion

109
Figure 4.1: Flowchart summary of immediate release metformin-HCl liquisolid preparation
Liquisolid compact preparation
Model drugs for immediate drug release
Metformin-HCl
Angle of slide determination (q-value) determination for carrier: Avicel®PH102coating: Cab-O-Sil®M-5
Liquid load factor(Lf value) determination
Drug powder admixture with liquid vehiclePEG®400 Synperonic®PE/L44 and Cremophor®ELP
Q,q(carrier to coating)amountR=20 Carrier: Avicel®PH102 Coating: Cab-O-Sil® M-5
Mixing of drug powder, liquid vehicle ,carrier,coating, disintegrant and lubricant in adjustable amount based on mathematicalcalculation
Powder admixture
wet granulation with 10%PVP
Automatic compaction
No granulation

110
4.1. Introduction
The main goal in diabetic patients is to achieve controlled blood glucose levels with the
aid of insulin or antidiabetic drugs such as metformin-HCl. However, successful use of
metformin-HCl therapy is challenged due to the high incidence of associated
gastrointestinal symptoms such as diarrhoea and abdominal discomfort (BNF 73, 2017).
Additionally, metformin-HCl has a multiple dosage regimen of 500mg two to three times
daily or 850 mg once or twice per day. Therefore, such complications are not desirable
and should be avoided to maintain patient compliance. Moreover, metformin-HCl presents
other formulation challenges such as poor compressibility and poor permeability
(Nanjwade, et al., 2011). According to the biopharmaceutical classification system (BCS),
metformin-HCl belongs to class III with high water solubility and low permeability
properties and due to metformin-HCl’s poor compressibility properties, direct
compression is difficult on the commercial scale. This leads to poor content uniformity as
well as poor weight content uniformity, hardness and friability (Nanjwade, et al., 2011).
The aim of the work presented in Chapter 4 is to utilise liquisolid-based formulations of
metformin-HCl as immediate release preparations whereas in the following chapter the
formulation of metformin-HCl as a sustained release drug will be discussed. By use of
liquisolid technique, a reduction in drug dosage was successfully achieved for both
release types, meaning less costs for pharmaceutical industry and fewer side effects for
patients. For both metformin-HCl liquisolid immediate and sustained release formulations,
PEG®400, Synperonic®PE/L44 and Cremophor®ELP were used as non-volatile liquid
vehicles. Additionally, wet granulation using PVP was applied to both systems in order to

111
achieve acceptable powder flowability and compressibility. Also tested and discussed in
this chapter is the immediate release liquisolid metformin-HCl tablets used to perform
permeability test using FRANZ Diffusion Cell to study the permeability release of
immediate release metformin-HCl through Wistar rat stomach membrane.
4.2. Determination of the angle of slide (θ) for determination of flowable liquid
retention potential (Φ values) for Avicel®PH102 (MCC) and Cab-O-sil®M-5 (fumed
silica)
Flowchart Figure 4.1 shows the newly designed procedure. (Spireas & Sadu, 1998)
claimed that the liquisolid technology theory indicates that drug, upon dissolving in the
liquid vehicle, becomes merged into the carrier material. The carrier (Avicel®PH102), has
entangled fibres as cellulose in its interiors and also has a porous surface where
adsorption and absorption occurs. In other words, the non-volatile liquid gets absorbed in
the interior of the particles where then the saturation of this procedure leads to the
adsorption of the liquid onto the internal and external surface of Avicel®PH102 (carrier).
Thus, the adsorptive coating material and its large surface area offers the desirable flow
properties to the liquisolid system. Additionally, the angle of slide is used to determine the
flowable liquid-retention potential in order to calculate the Lf (as explained in sections 1.4
and 3.1). According to Spireas et al 1992, angle of slide is the preferred technique to
obtain the flowability of small particle size powders (less than 150μm.) The chosen non-
volatile liquid vehicles were PEG®400, Synperonic®PE/L44 and Cremophor®ELP. The Φ
values for Avicel®PH102 (MCC) and Cab-O-sil®M-5 using the three liquid vehicles were
obtained. Drugs in liquisolid formulations, with lower concentration require more liquid

112
vehicles, carriers and coating materials to produce larger tablets. Additionally, literature
values show that the liquid load factor (Lf) is inversely proportional to the amount of carrier
and coating used, and it increases with high viscosity liquid vehicles (refer to section 3.1
for more details). Table 4.1 reveals results for Lf value.

113
Table 4-1: Formulation of liquisolid systems of immediate release metformin-HCl (m=no granulation; F= with granulation)
Liquisolidsystem
Non-volatileliquidvehicle
DrugConcetrationinliquidmedication
(%w/w)
Carrier:Coating
(R)
Liquidloadfactor(Lf)
Liquidvehicle(mg)
Activeingredient
(mg)
Carrier(Q)(mg)
Coating(q)(mg)
Disintegrant(maize
starch)(mg)
Lubricant(mg)
Unitdose(mg)
M1 PEG®400 30 20 0.17 93.30 40.00 794 40.00 51.00 8.00 1026.30M2 PEG®400 60 20 0.17 26.70 40.00 397 20.00 26.00 4.00 513.70
M3 Synperonic®PE/L44 30 20 0.27 93.30 40.00 501 25.00 35.00 5.20 699.50
M4 Synperonic®PE/L44 60 20 0.27 26.70 40.00 251 13.00 18.00 2.60 351.30
M5 Cremophor®ELP 30 20 0.52 93.30 40.00 256 12.80 21.00 3.20 426.30
M6 Cremophor®ELP 60 20 0.52 26.70 40.00 128 6.40 11.00 1.60 213.70
Conventional _ _ _ _ _ 40.00 397 20.00 24.20 3.60 485.00F1 PEG®400 30 20 0.17 93.30 40.00 794 40.00 51.00 8.00 1026.30
F2 PEG®400 60 20 0.17 26.70 40.00 397 20.00 26.00 4.00 513.70
F3 Synperonic®PE/L44 30 20 0.27 93.30 40.00 501 25.00 35.00 5.20 699.50
F4 Synperonic®PE/L44 60 20 0.27 26.70 40.00 251 13.00 18.00 2.60 351.30
F5 Cremophor®ELP 30 20 0.52 93.30 40.00 256 12.80 21.00 3.20 426.30
F6 Cremophor®ELP 60 20 0.52 26.70 40.00 128 6.40 11.00 1.60 213.70

114
4.3. Flowability and packing properties of the prepared liquisolid powders
Powder flowability plays a crucial role in handling, packing, mixing and producing of
pharmaceutical dosage forms where a set of tablets with even drug distribution is required
to be compressed. Uniform powder fed through the hopper is required to maintain
uniformity of tablet weight and drug content (Ekordy et al 2012, British Pharmacopoeia
2017, (Mahato & Narang, 2012). Additionally, several factors such as physical,
environmental as well as mechanical aspects can affect the liquisolid powder flowability
properties. Therefore, to determine the flowability of powder, Carr’s compressibility index
(Cl%) is used. It is a suitable parameter to compare between bulk and tapped densities
of powder mass, which provides a measure to the reflecting interparticulate friction, and
thus is used to measure the flowability of all liquisolid powders. The calculated Carr’s
compressibility index of metformin-HCl liquisolids before and after granulation is
presented in Figure 4.2. Generally, in accordance to British Pharmacopoeia 2017, any
formulation with CI% below 15% indicates good flowability and CI% above 25 % suggests
formulation with poor powder flowability.
Therefore, the powder flow properties of the prepared granulated and ungranulated
liquisolid metformin-HCl were evaluated using CI%. However, liquisolid formulation using
Cremophor®ELP powder flow was very poor due to its high viscosity properties, hence no
CI% was obtained before wet granulation stage. The calculated CI% results show that
granulated liquisolid formulation have better flow properties than ungranulated ones (F1:
24.5%, F2: 18.6%, F3: 15.7%, F4: 14.6%, F5: 24.2%, F6: 24.5%, refer to Table 4.1 for
composition) as well as conventional metformin-HCl showed better flow properties in the
granulated form (18%, Figure 4.3).

115
Figure 4.2: Carr’s compressibility index of metformin-HCl Liquisolid before granulation. F5 and F6 powders were sticky and hence they were not flowable at all.
Figure 4.3: Carr’s compressibility index of metformin-HCl liquisolid after granulation. For formulations’ composition refer to Table 4.1.
This can be related to the amount, type and property of the liquid vehicle used (PEG®400,
Synperonic®PE/L44 and Cremophor®ELP) and the effect of wet granulation on the
enhancement of powder flow using PVP as a liquid binder. The ungranulated liquisolid
metformin-HCl showed fair flowability for F1 and F2 (24.5% and 23.1% respectively) and
poor flowability was seen in Synperonic®PE/L44 liquisolid powders with CI% of 28.3%
and 27% for F3 and F4 respectively. Also, CI% for F5 and F6 was not calculated due to

116
its unflowable powder characteristics (Figure 4.1). Thus, this shows that the properties of
the liquid vehicle can interfere with the flow property of the formulation making it better or
poor flowing.
Literature ( Spireas , et al., 1992), (Alderborn, 2013), (Javadzadeh, et al., 2007),
(Javazadeh , et al., 2005), (Nokhodchi, et al., 2005) mentioned that the amount of carrier
and coating materials in the liquisolid system can play a great role in determination of
powder flow property. The liquid vehicle gets adsorbed to the surface of the carrier
allowing the coating material (Cab-O-Sil®M-5) to absorb the excess liquid to form a freely
flowable powder. Furthermore, only granulated liquisolid metformin-HCl were
automatically compacted into tablets. This is due to poor flowability and compressibility
properties of the liquisolid ungranulated powder and due to the elasticity properties of the
liquid vehicle used, thus powders were manually compressed for the purpose of
dissolution and drug content uniformity evaluation. According to (Javaheri, et al., 2014),
ungranulated powder admixtures were uncompactible due to the elastic behavior of the
liquisolid formulations. The powder not only was not compressed into tablet, but also
formed a compactible unwanted shape. Similarly, such powder behavior was experienced
by Elkordy et al 2013, where two liquisolid formulations using Synperonic®PE/L61 with
Solutol HS 15 (1:1) at both drug concentrations 10% and 30% were incompactible, and
hence no tablets were formed. The two non-volatile liquid vehicles have a plastic flow
nature when combined, thus tablet formation was unachievable. In a concentrated
suspension, weak Van der Waal forces hold flocculated particles together. This often
results in plastic flow (Mahato & Narang, 2012). If the shear stress is low, such materials
might possess elastic behavior.

117
However, when the maximum yield stress is exceeded where the Van der Waal forces
are broken, plastic flow is exhibited. There must be a balance for plasticity. Although
plastic deformation helps the solid links to form between particles within the powder mix,
excessive plasticity leads to the formation of tablets with high extent of hardness. The
powder mix produced with Avicel®PH102 and the liquid vehicle takes advantage of the
elastic properties of the liquid vehicle and the plastic properties of Avicel, leading to the
formation of a powder mix that is mainly elastic (Elkordy et al.2013). (Javadzadeh, et al.,
2007) suggested using HPMC or PVP as microsystems can improve flowability
regardless of the liquid load factor being high. Although the flowability measured using
Carr’s index in this study was fairly poor after granulation, as per their study, HPMC was
only granulated and not the whole formulations. In the current research project,
ungranulated F5 and F6 (refer to Table 4.1 for composition) showed the least favourable
CI% results of all formulations. The suggested explanation is dependent on the high
viscosity property of the liquid vehicle (Cremophor®ELP with viscosity of 650-800 (Rowe,
et al., 2003) leading to a non-flowable liquisolid powder admixture. Similarly, (Tiong &
Elkordy, 2009) claimed the powder flow of liquisolid naproxen with Cremohpor®EL to be
poor due to the high viscosity of the liquid vehicle and high liquid load factor. In agreement
with (Javazadeh , et al., 2005), load factor above 0.25 along with high viscosity liquid
vehicle can induce poor powder flowability. For the reason that, there will be fewer
amounts of carrier and coating materials available in the formulation and excess amount
of liquid vehicle being available leading to the formation of agglomerates. As shown in
Figure 4.2 and Figure 4.3, liquisolid powders show better Carr’s compressibility index
when formed into granules.

118
According to (Javaheri, et al., 2014), liquisolid powders before granulation showed poor
flowability and therefore Carr’s compressibility index was not performed. However, after
using wet granulation using PVP 10%, enhanced flowabiity of liquisolid powder granules
was shown even with viscous liquid vehicles such as Cremophor®ELP. Not only did it
enhance the flowability, but it also allowed for automatic compression of the liquisolid
granules, which was previously unachievable without granulation. Granulated tablets,
appeared hard with no capping or cracking and complied with quality control test of the
British Pharmacopeia 2017. For this reason, wet granulation system, with a suitable liquid
binder, is a successful technique to convert incompactible elastic powder into compactible
powders with advanced tablet properties.
4.4. In-vitro dissolution studies of immediate release metformin-HCl
The in-vitro drug release (dissolution profiles) from immediate release metformin-HCl
liquisolid tablets (M1-M4 and F1-F6, refer to Table 4.1 for composition), including
conventional and pure metformin-HCl were performed in distilled water and are
graphically presented in Figure 4.4. It was found that, all the prepared granulated liquisolid
tablets released more than 80% of their metformin-HCl content after 60 min. After 5 min
in the dissolution apparatus, the percentage released from granulated metformin-HCl
liquisolid tablets was found to be 37.6, 41.0, 15.8, 16.0, 20.7 and 20.9 % from F1, F2, F3,
F4, F5 and F6 (refer to Table 4.1 for composition) respectively versus 73.8% and 101%
from the pure and conventional metformin-HCl respectively. The release for ungranulated
liquisolid metformin-HCl showed inconsistent drug release (Figure 4.4). This indicates

119
that the addition of wet granulation using PVP as a liquid binder to the liquisolid compacts
produces a steady with stable release of the drug over the time. Moreover, the extent of
drug release for F1-F6 liquisolid formulations after 90 min was 102,103, 91, 100, 105 and
103% for F1, F2 F3, F4, F5 and F6 respectively. Wet granulation process helps in having
good flowable liquisolid powders with good compaction and also good drug uniformity
content (Table 4.2). The uneven distribution of the drug in the tablets for M3 and M2
causes the drug release to be more than 100% (for M3) and less than 90% (for M2 due
to high friability of M2 tablets). This confirms that the liquisolid metformin-HCl when
formed into granules using PVP produced a strong binding effect that released the drug
gradually. Moreover, the main reason for the stable release of the drug in the presence of
PVP might be due to crystal growth inhibition, where PVP may serve to inhibit precipitation
of the drug from the supersaturated solution (Usui, et al., 1997) (Javadzadeh et al.2007).
According to (Javaheri, et al., 2014), similar outcome was not observed, although 10%
PVP was also used for wet granulation process. The ungranulated glibenclamide tablets
showed almost no release (however it is a hydrophobic drug but metformin-HCl is a water
soluble drug) when compared to the granulated formulations. This can explain, using
similar excipients does not necessarily give common results, as the drug’s structure and
characteristics can play a great role in the release profiles (El-Say, et al., 2010).
Additionally, higher dissolution rate was observed in pure metformin-HCl (Figure 4.4) and
not for pure gibenclamide; this is basically due to metformin-HCl’s solubility properties in
water which is not present in the water insoluble drug, glibenclamide.
For the tested liquid vehicles, PEG®400 within granulated liquisolid tablets (30 and 60%

120
drug concentration) showed fast drug release within the first 10 minutes, while
Cremophor®ELP and Synperonic®PE/L44 delayed the drug release over the time (Figure
4.4). This can be explained on the basis of viscosities of the two later vehicles which have
effects on the thickness of the diffusion layer around the drug particles (increased
thickness) and on the diffusion coefficient (reduce diffusion). Based on the Noyes Whitney
equation, these will properties cause the drug release to be reduced. This may be
desirable to enhance drug bioavailability by enhancing the drug permeability for the
released drug molecules. (Elkordy, et al., 2012).

121
Figure 4.4: Dissolution study of immediate release metformin-HCl liquisolid in distilled water (30% and 60% drug concentrations). Refer to Table 4.1 for formulations’ composition.

122
Enhanced in-vitro dissolution of the drug from liquisolid compacts can be denoted to
improved wettability via liquid vehicles Cremophor®ELP, a non-volatile hydrophilic liquid
vehicle (surfactant) with HLB of 12-14. It is responsible for wetting of drug particles in the
liquisolid system by decreasing the interfacial tension between particle’s surface and the
dissolution medium causing an increase in the surface area of drug particles. The choice
of the carrier can also affect the dissolution of the drug. After exposure to the dissolution
medium, the drug being present on the surface of the carrier material dissolves, leading
to an initial burst release of the drug that acts as a loading dose. (Butreddy & Dudhipala
, 2015). The liquisolid preparations with a higher R value contains a low liquid load factor,
a higher amount of microcrystalline cellulose (Avicel®) and a lower amount of the coating
material. This was confirmed by the study performed on griseofulvin liquisolid
formulations, where the use of microcrystalline cellulose with R-value of 20 resulted in a
significant higher percentage of drug release compared to a prepared formulation with
low R value (R=10) (Elkordy, et al., 2012)
Several liquisolid studies performed on hydrophobic drugs correlate the enhanced
dissolution rate to the increased wettability and surface availability of the lipophilic drug
to the liquid medium as a result of drug dispersion within the hydrophilic non-volatile liquid
such as PEG®400 ( (Butreddy & Dudhipala , 2015). Comparable outcomes were not
obtained in the current project due to the high water solubility of metformin-HCl, where
the non-volatile liquid vehicle (PEG®400, Synperonic®PE/L44 and Cremophor®ELP)
attached their hydrophilic head to the hydrophilic part of metformin-HCl (react differently
compared to hydrophobic drugs) allowing for a constant release of the drug. However,
the positive effect of liquisolid technique on metformin-HCl was the possibility of dose
123
reduction (40mg active ingredient) and steady release of the drug by performing wet
granulation in the final stage while maintaining the specified therapeutic effect of the drug
(permeability enhancement as will be shown later). Nevertheless, liquisolid metformin-
HCl release has been prolonged by using HPC-high grade which is another great
advantage of applying liquisolid on hydrophilic instead of lipophilic drugs to produce a
sustained release formulation (refer to Chapter 5).
Additionally, there are some factors that can affect the solubility of the solid drug in the
dissolution medium such as temperature (endothermic or exothermic), dissolution
medium (acidic or neutral), crystalline drug structure, presence of solubilising agents and
molecular structure of the solute. Moreover, not all liquisolid vehicles work to the same
extent with all hydrophobic drugs, as they can work differently depending on the solubility
of the drug. Therefore, the presence of other non-volatile liquid vehicles may have
affected the outcome. As a result, each formulation had a different dissolution profile
depending on its liquid vehicle and its wetting property (El-Say et al. 2010) as seen in this
current study (Figure 4.4). Principally, enhanced dissolution rate seen in liquisolid
formulations is due to the mechanical treatment with the hydrophilic liquid vehicle, which
is believed to raise the contact between the drug, and the dissolution medium (Yadav &
Yadav, 2010). In other words, surfactants increase the wettability of the drug making them
more available for water molecules to penetrate and thus increase the drug dissolution
and improve the absorption from the GI tract. However, the opposite can be seen in some
liquid vehicles. According to (Suliman, et al., 2013), conventional tablets gave a higher
drug release than the liquisolid formulation using norfloxacin (a hydrophobic drug), this

124
was explained due to the zwitterionic behaviour of the drug in water. This is observed with
hydrophobic nature drugs. Metformin-HCl behaves differently as it is freely soluble in
water and results in rapid dissolution from immediate release tablets but this drug is poorly
absorbed by the stomach (Hu , et al., 2006). The binding properties of the drug to the
liquid vehicle and other excipients too can play a role as exhibited in Figure 4.4. The
higher the concentration of the drug (60%) the higher the drug release compared to the
30% containing drug formulations. Ultimately, the hydrophilic liquid vehicle contains two
parts, a hydrophilic head and a hydrophobic tail, the tail attracts to the hydrophobic part
of the drug allowing for water solubility enhancement. However, in this case since
metformin-HCl is highly soluble in water, the opposite is happening, the hydrophilic head
binds the hydrophilic part of the drug allowing for gradual release of metformin-HCl
(Figure 4.4).
Therefore, it can be concluded that the in vitro dissolution of liquisolid tablets is greatly
influenced by wet granulation that causes strong binding, and by other factor such as the
type of liquid vehicle used and whether automatic or manual compaction was performed
on the powder admixture.
For choosing the most applicable kinetic model of the drug release from the granulated
metformin-HCl liquisolid formulations (F1-F6), goodness of fit test must be performed.
Table 4.2 shows the results after calculation being performed to get the coefficient of
determination (R²) for metformin-HCl liquisolid granules (F1-F6). The zero-order model
can be best described when drug release rate is independent of its concentration. On the
other hand, First-order model is when the drug release is dependent on its concentration.
The highest coefficient of determination is usually the most desirable model to be used in

125
which in this case it is the Higuchi model. It describes the release of the drug from a
matrix, which is usually insoluble as a square room of time, which is linked to Fick’s Law
of diffusion (Prabakaran, et al., 2003) This means that the driving force for diffusion of
metformin-HCl molecule from the tablet into the dissolution medium is the drug
concentration gradient between tablet and dissolution medium. Also, this can explain the
slow diffusion rate of the drug as the distance of diffusion is increased which is the Higuchi
model (Square root of time).
Table 4-2: Kinetic release mechanism of metformin-HCl
MetforminLiquisolidgranules ZeroOrder(R²) FirstOrder(R²) Higuchi(R²)
PEG®40030%(F1) 0.959 0.869 0.991PEG®40060%(F2) 0.872 0.788 0.987
Synperonic®PE/L4430%(F3) 0.931 0.797 0.988
Synperonic®PE/L4460%(F4) 0.921 0.790 0.973
Cremophor®ELP30%(F5) 0.889 0.743 0.972
Cremophor®ELP60%(F6) 0.931 0.797 0.996
4.5. Tablet hardness, Friability, Disintegration (BP) and Uniformity of drug content
and Uniformity of tablet weight
A summary of expressed average and the standard deviations results of tablet hardness,
friability, disintegration and drug content for all metformin-HCl liquisolid (F1-F6) and
conventional tablets are shown in the Table 4.3. The uniformity of weight test was
performed on liquisolid tablets with granulation (F1-F6, refer to Table 4.1 for composition)
whilst non-granulated tablets were not tested for any quality control measures due to the

126
manual compression of the liquisolid powders. Regarding the tablet hardness test, there
were variations in tablet thickness and hardness due to the compression force applied.
Generally, ideal tablet hardness should be produced without applying excessive
compression force where rapid tablet disintegration and drug dissolution are maintained
at the same time ( (Tiong & Elkordy, 2009), (Fahmy & Kassem, 2008) (Elkordy, et al.,
2013). Tablet hardness depends on particle size, interparticle force, and most importantly,
compression force. Usually, as compression force increases, tablet hardness and fracture
resistance increases as well (Bi, et al., 1999). Additionally, El-Say et al. (2010) found a
relationship between liquid load factor and the hardness of the tablets in the formulae
having approximately the same powder excipient ratio: when liquid load factor increased,
the hardness of the tablet decreased. In this study, M1 has the lowest liquid load factor
(refer to Table 4.1) and as a result showed highest hardness (hardness: 11.8 kg/f, 115.7N)
and inversely for F1 (8.2kg/f 80.4N), although M1 and F1 have same excipients’ ratio but
M1 is ungranulated and F1 was prepared from granulated powder mix. The M1 was
manually compacted. That would be another reason why the hardness is high in this
formulation as a high force was applied when compacting manually. Therefore, our
suggestion is that not only the liquid load factor has an effect on the hardness of the tablet,
but also the granulation process that was performed before compaction can be a factor
and also the binding substance, PVP, as well. In addition, hydrogen bonding between
hydrogen groups on Avicel®PH102 molecules can play a role in the strength of the
liquisolid tablets (Fahmy & Kassem, 2008). This is because microcrystalline cellulose,
MCC (a crystalline structure) undergoes plastic deformation when compression is applied
allowing for increased hydrogen bonding through closer contact between the surfaces of

127
the MCC molecules.

128
Table 4-3: Crushing load, hardness, friability, drug content uniformity and uniformity of weight for metformin-HCl liquisolid tablets (for formulation compositions, refer to Table 4.1)
FORMULATION CRUSHINGLOAD(KG/F)
HARDNESS(N)
FRIABILITYWEIGHT(%)
DRUGCONTENT
(%)
UNIFORMITYOFWEIGHT(MG)
M1 11.80±1.81 115.70 0.26% 103% 270±6.50
M2 7.10±0.52 69.60 10.00% 101% 255±4.50F1 8.15±0.26 79.90 1.00% 99% 276±1.70F2 6.83±0.89 67.00 0.87% 99% 263±4.10F3 6.18±0.26 60.60 0.01% 94% 372±7.40F4 11.97±0.42 117.40 0.01% 94% 377±14.4F5 5.98±0.45 58.60 0.10% 96% 231±4.00F6 6.37±0.24 62.50 0.02% 99% 213±5.90
CONVENTIONAL 4.98±0.97 48.80 0.80% 98% 371±30.0
All liquisolid granulated metformin-HCl tablets complied with BP limits of friability test
(<1%). There was no cracking or breaking of tablets after performing the test. However,
M2 (refer to Table 4.1 for composition), the ungranulated liquisolid metformin-HCl
formulation did not comply with BP and showed a very high friability percentage (10%;
this affects its drug release) (Figure 4.4). Therefore, the granulated liquisolid tablets are
expected to stay strong and withstand handling, packaging through, transportation.
Rapid disintegration is important during manufacturing of tablets to ensure fast breakup
of tablet into small particles, yielding a high surface area for enhanced dissolution
(Elkordy et al 2012, (Gubbi & Jarag, 2009), (Chebli & Cartilier, 1998)). Disintegration time
can be affected by several factors such as the type of liquid vehicle used, tablet porosity
and pore structures (Tiong & Elkordy, 2009). The presence of a non-volatile liquid vehicle

129
is expected to delay the disintegration time of the tablet. However, the presence of MCC
speeds the process of disintegration giving a low disintegration time (Javadzadeh et al.
2007). This is because water uptake into pores is enhanced causing pressure in the tablet
pores eventually breaking down of the tablet into smaller particles. In addition, literature
suggests a liner relationship between tablet hardness and disintegration time. In other
words, as hardness increases, the disintegration time also increases (Kitazawa, et al.,
1975). The higher the crushing force, the longer the disintegration time will be. However,
this finding was not achieved in this study, as seen in Figure 4.4 and Table 4.3, the
slowest disintegration formula was F3 (refer to Table 4.1 for composition) which took 43
minutes to disintegrate followed by F4 (32.5 minutes). The strong binding of PVP and
Synperonic®PE/L44 may cause the delay in the disintegration time. Although,
microcrystalline cellulose (Avicel®PH102) has disintegration property that can facilitate
disintegration and dissolution of drug, However, the presence of non-volatile liquid vehicle
(Synperonic®PE/L44) binds to the liquisolid powder and cause a delaying disintegration
time (Javadzadeh et al.2007). Therefore, this delay of the disintegration time in F3 in
addition to the extensive binding properties of PVP, lower dissolution rate (Figure 4.4).
Nevertheless, F1 and F2 showed a faster disintegration time (13.5 min and 13.6 min
respectively) compared to F3-F6 (Figure 4.5) and this could be linked to the nature of the
non-volatile liquid vehicle used (PEG®400 in F1 and F2). Thereby, F1 and F2
disintegrated within 13.5 min and 13.7 min, respectively and complied with BP
disintegration test. Thus, the type of non-volatile liquid vehicle, the quantity of the
disintegrant and the quantity and the type of the carrier are the major time controlling
factors of the liquisolid tablet disintegration. Taking into consideration, there are no big

130
difference in hardness of F1, F2, F3, F5 and F6 (Table 4.3 and Figure 4.5).
Figure 4.5: Average disintegration time of liquisolid immediate release metformin-HCl.
Refer to Table 4.1 for composition.
British Pharmacopoeia (2017) specifies the accepted limits of the percentage of the active
drug in tablets between 85% and 115% (BP 2017). The drug uniformity content was
performed only on granulated tablets (F1-F6, refer to Table 4.1 for composition) and
tablets that were manually compactable (M1 and M2). This is due to the lack of good
flowability and compactibility properties of M3-M6. Accordingly, all liquisolid formulations
including conventional tablet complied with British Pharmacopoeia (BP), 2017 drug
content uniformity. From the drug content result, it can be said that the granulated
formulation showed uniform drug content. This is a very important finding that drug
binding to PVP during granulation allows for better uniformity and distribution in tablets
when compacted. According to (Fahmy & Kassem, 2008), the higher the amount of liquid
medication and carrier used, the more uniform drug distribution is achieved. This is due
19.2080
3.84
13.54 13.68
43.00000
32.500036.485
28.43
0.150.0000
5.0000
10.0000
15.0000
20.0000
25.0000
30.0000
35.0000
40.0000
45.0000
50.0000
M1 M2 F1 F2 F3 F4 F5 F6 Conv
Time(m
in)
Disintegra/onprofileofliquisolidimmediatereleaseMe9ormin

131
to the adsorption process of the carrier to the liquid vehicle, which yields a higher surface
area with a homogeneous distribution of the drug. Moreover, the effect of liquid
medication and content of carrier did not play a great role and there was no major
difference in drug content, between 30% and 60% drug content of each batch used. In
other words, there was no significant differences between liquisolid formulations of
different liquid vehicles (PEG®400, Synperonic®PE/L44 and Cremophor®ELP) as well as
conventional tablets. The possible reason can be referred to the amount of the carrier
excipient in the unit dose of each formulation, which enhances the absorption of the liquid
medication into the internal part of the carrier, resulting in a homogeneous distribution of
the active ingredient ( Spireas , et al., 1992), (Akinlade, et al., 2010) (El-Say, et al., 2010)
(Javaheri, et al., 2014).
4.6. Fourier transform infrared (FT-IR) spectroscopy
Within a molecule, the IR-radiation causes the excitation of the vibrations of covalent
bonds, which can also be the bending and stretching means. Figure 4.6 below illustrates
the infrared spectra of pure metformin-HCl, pure excipients, conventional and some of
the liquisolid powders both granulated and ungranulated (M1-M6 and F1-F6). The
fingerprint region is usually between 500 – 1800 cm-1 and the functional group region is
between 2000-4000 cm-1. Metformin-HCl IR studies, revealed two typical bands at 3367
and 3292 cm -1 due to N-H primary stretching and a band at 3156 cm-1 due to N-H
secondary stretching. Additionally, characteristic bands at 1623 and 1561 cm-1 were
observed to be denoted for N-H asymmetric deformation. The FT-IR can be indicative of
shift due to hydrogen bonding interaction between the hydroxyl group of liquid vehicle
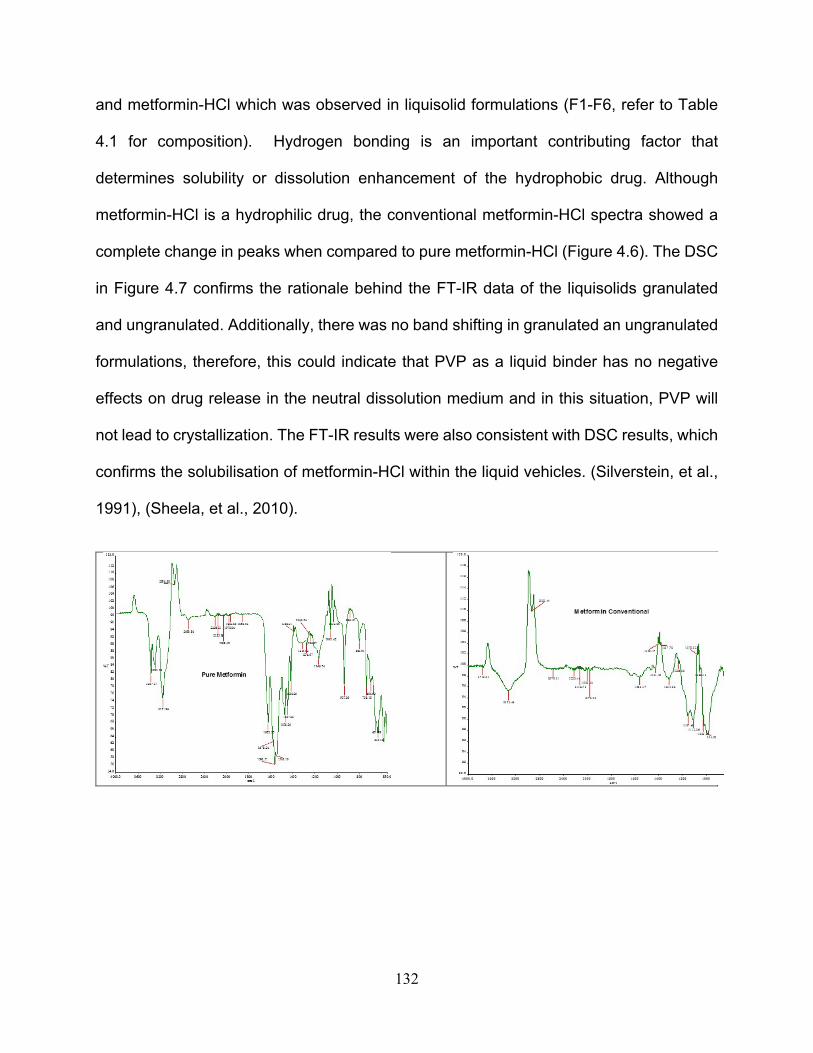
132
and metformin-HCl which was observed in liquisolid formulations (F1-F6, refer to Table
4.1 for composition). Hydrogen bonding is an important contributing factor that
determines solubility or dissolution enhancement of the hydrophobic drug. Although
metformin-HCl is a hydrophilic drug, the conventional metformin-HCl spectra showed a
complete change in peaks when compared to pure metformin-HCl (Figure 4.6). The DSC
in Figure 4.7 confirms the rationale behind the FT-IR data of the liquisolids granulated
and ungranulated. Additionally, there was no band shifting in granulated an ungranulated
formulations, therefore, this could indicate that PVP as a liquid binder has no negative
effects on drug release in the neutral dissolution medium and in this situation, PVP will
not lead to crystallization. The FT-IR results were also consistent with DSC results, which
confirms the solubilisation of metformin-HCl within the liquid vehicles. (Silverstein, et al.,
1991), (Sheela, et al., 2010).

133
Figure 4.6: FT-IR spectra of pure metformin-HCl, pure excipients, conventional and some of the liquisolid powders both granulated and ungranulated (F1, M1, M3, F3). For formulations’ compositions refer to Table 4.1.
134
4.7. Differential scanning calorimetry (DSC)
DSC is the most common parameter to determine the physicochemical properties and
interaction between the drug and the excipients. Figure 4.7 shows the DSC of pure
metformin-HCl, pure excipients, conventional and some metformin-HCl liquisolid
formulations. Pure metformin-HCl thermogram showed a sharp endothermic peak at
232.99°C with a melting enthalpy of 215.8J/g. This sharp peak indicates that the drug is
in its crystalline anhydrous state (Murra , et al., 2005) (Fahmy & Kassem, 2008). Very
broad peaks were displayed in Figure 4.7 for both thermograms of potato starch and
Avicel®PH102 with mid points of 139.180C and 145°C, respectively. In addition, Cab-o-
sil®M-5 thermogram showed a small peak at 117.770c which indicates the amorphous
state of the coating material. On the other hand, the DSC thermograms (Figure 4.7) of all
liquisolid formulations (except M5 and M6; F5 and F6) showed broadened peaks with
reduced intensities instead of the sharp melting peak of metformin-HCl; meaning
changing of the drug crystallinity. This signifies to the large solubilisation of metformin-
HCl in the liquid vehicle as well as the possibility of an interaction between the drug and
the excipients (Tiong and Elkordy, 2009) or a modification to a secondary amorphous
forms which were reflected in enhanced dissolution compared to Cremophor® ELP
containing formulations M5 and M6 (ungranulated powders) and F5 and F6 (granulated
powders). The thermograms of conventional and pure metformin-HCl showed sharp
peaks at ~229.290C and conventional metformin-HCl powder revealed a broad peak at
121.450C corresponding to the Avicel®PH102 broad peak and a sharp one at 235.200C
which resembles the pure drug melting point, indicating no major changes in crystallinity
of metformin-HCl in the conventional system.

135
Pure Metformin
F1
F2
F3
M5

136
F5
M6
Polyvinylpyrrolidone (PVP)
Avicel pH102
Potato Starch
�����<�
��<�������,
�����<�
���� <�������,
�� � �<�
������<��������,
���
�
��
�
��
�*'6��/29��%
�,�
� � � � � � � �� � �� �� �
"*03*4'674*��<��
!'03/*��0*6�(4*0��71,4'1!.;*��������0,�*6-2)�� '03�200*16��0*6+240.1
�!� �./*�������&��������&0*6�(4*0���71,4'1�
71��'6*�����71�������156470*16���!����$�����7./)���
�:2��291 #1.8*45'/�$ ����"���156470*165

137
Magnesium stearate
Figure 4.7: DSC thermograms of pure metformin-HCl, some liquisolid formulations, conventional, and pure excipients used. Refer to Table 4.1 for formulations’ composition.
4.8. Scanning electron microscopy (SEM)
Figure 4.8 displays the SEM microphotographs of pure metformin-HCl, conventional and
some liquisolid powders, granulated and ungranulated (M5, M6, F5, and F6). It can be
noted that the pure metformin-HCl powder shows the drug in crystalline form with particles
having well defined edges. This can be confirmed by the above results obtained from
DSC thermograms. On the other hand, the liquisolid powders present with a rod like
shape structure in which no crystals were seen. According to (Elkordy, et al., 2013) the
disappearance of the drug crystals indicates that there has been a full inclusion of the
drug molecule within the carrier, coating and liquid vehicle used. Moreover, conventional
metformin-HCl shows a more defined, smooth edged shape even though liquid
medication is not added. Therefore (Elkordy, et al., 2013) findings are confirmed by this
study. It can be observed from the images below that the granulated liquisolid metformin-
HCl shows a more defined yet smooth edged shape particles compared to the non-
granulated powders. It can be concluded that the SEM results below can be a promising

138
finding for permeability test (Section 4.14) as it indicated that the drug particles are
integrated in the liquid vehicles and the other excipients used.
Pure Metformin powder
Conventional Metformin
M5
F5
M6
F6
Figure 4.8: SEM microphotographs (x1000) of pure metformin-HCl and liquisolid powders being ungranulated and granulated. Refer to Table 4.1 for composition of formulations.

139
4.9. Stability study
4.9.1. In-vitro dissolution study for stored metformin-HCl liquisolid tablets
Dissolution stability results of metformin-HCl granulated (F1-F6) liquisolid tablets in figure
4.9 revealed that there was no significant difference (P > 0.05) between fresh and store
liquisolid formulations after storage at 250C with 76% relative humidity. This suggests that
metformin-HCl liquisolid formulations are stable under any stressful condition such as
high humidity, without affecting the drug properties (as detected from DSC and FT-IR
data– see below) or cause any changes in dissolution profile, making the production of
metformin-HCl liquisolid viable for pharmaceutical industrial manufacturing.

140
Figure 4.9: Dissolution profiles from stored liquisolid metformin-HCl (F1-F6). For formulations’ composition refer to Table 4.1
.
0
20
40
60
80
100
120
0 20 40 60 80 100
% d
rug
rele
ase
Time(min)
Dissolution stability study of liquisolid Metformin-HCl
%releaseF1
%releaseF2
%releaseF3
%releaseF4
%releaseF5
%releaseF6
%releaseconventional

141
4.9.2. Fourier transform infrared (FT-IR) spectroscopy stability study of granulated liquisolid metformin-HCl
The FT-IR results of stored liquisolid metformin-HCl tablets are shown in Figure 4.10. It
can be observed that there is no significant difference between the fresh and the stored
liquisolid metformin-HCl tablets. This further confirms the obtained dissolution results of
stored liquisolid metformin-HCl and that the liquisolid compacts are successful
formulations that maintain stability under stressful conditions.
F3 and F4
F5 and F6
Figure 4.10: Fourier transform infrared (FT-IR) spectroscopy stability study of liquisolid metformin-HCl. For composition refer to Table 4.1.
4.9.3. Differential scanning calorimetry (DSC) of stored liquisolid metformin-HCl
Figure 4.11 shows the DSC thermograms of liquisolid metformin-HCl (F1-F6) after
storage (at 76% humidity and 25°C) for 12 months. The thermograms revealed no
significant difference between fresh (Figure 4.4) and stored metformin-HCl liquisolid
tablets (Figure 4.9).

142
F1
F2
F3
F4
F5
F6

143
Conventional metformin
Figure 4.11: Differential scanning calorimetry (DSC) of stored liquisolid metformin-HCl formulations, refer to Table 4.1 for composition.
4.10. Metformin-HCl permeability test
The major goal in the design, drug selection and production of drugs intended for
noninvasive delivery is the prediction of human drug absorption. In different phases of
drug discovery and development, several techniques were employed to evaluate the
extent of drug absorption. Screening protocols include a variety of preclinical
methodologies to evaluate drug absorption such as in-vitro, in-vivo and ex-vivo. To
assess the absorption of drugs in preclinical studies, animal studies are the gold
standards despite the fact that this is an expensive and time consuming protocol that may
not precisely predict the drug in human behavior (Sarmento, et al., 2012). Additionally, in
the selection of compounds for clinical development, the in-vitro models that mimic the
mucosa in the human body are most appropriate protocol for absorptions data. The
presently used techniques for drug absorption and permeability tests other than using
human volunteers for some particular drugs in clinical trials, cell culture models, which
offers a highly defined tool, as well as human cell lines are currently considered as

144
convenient models. In order to thoroughly resemble the in-vivo tissues, the in-vitro cell
based model have been optimized which incorporates more than one single type of cell.
In an attempt to shorten drug development time, new and improved tissues based in-vitro
models are used to estimate the drug absorption. An alternative approach to test the
activity of drug across the biological tissue is the consideration of ex-vivo experiments
that closely represent human conditions. Based on the in-vitro drug permeation profiles,
the in-vitro-in-vivo correlation must provide a drug’s in-vivo pharmacokinetics prediction
(Pelkonen, et al., 2001). The key factor in the absorption and distribution of drugs is the
permeability across the biological membranes leading to poor absorption across the
gastrointestinal mucosa and distribution throughout the human body. This can also be
due to membrane based efflux mechanisms as well as structural features. Additionally,
the permeability classification can be determined directly by measuring the mass rate
transfer across the human intestinal or stomach membrane. An alternative method is by
indirect estimation of the amount of drug absorption in pharmacokinetics studies in
humans. Several other systems can be used for oral drug absorption prediction in humans
as well as for classification of drugs according to their permeability, such as intestinal
perfusion studies (in-situ methods), in-vitro cell cultures (Caco-2), artificial membranes
and ex-vivo studies using intestinal segments from animals or humans (Balimane, et al.,
2000). In this section, a review on the different types of drug permeability tests used and
their application in different publication is discussed. The goal of this work is to
demonstrate the use of prepared liquisolid metformin-HCl tablets in an ex-vivo experiment
using Franz Cell Diffusion. The permeability test was performed on Wistar male rats
stomach tissue to compare the absorption between pure metformin-HCl and liquisolid

145
formulations. To the best of our knowledge, no study or publication has been performed
on the use of liquisolid formulations in permeability test using Franz cell diffusion and
particularly using stomach tissue. Therefore, all the acquired data are purely based on
the experiments performed during the laboratory work, and the typical available methods
of drug permeability test such as Caco-cell based tests were not used.
4.11. Different permeability studies
4.11.1 Intestinal permeability test using Single-pass Intestinal Perfusion
A study by (Song, et al., 2006) used the Single-pass Intestinal Perfusion (SPIP) technique
to characterize the intestinal transport and mechanism of metformin-HCl in rats. They
have stated that this procedure is used in anesthetized rats whereby a section of intestine
is isolated and perfused with a solution of the drug. In the experimental procedures of
single-pass Intestinal Perfusion, modifications can be made to the length of the perfused
intestine, concentration of the drug and the flow rate. Additionally, as determined by the
difference between the inlet and outlet concentrations, the loss of compound is attributed
to absorption. The preliminary studies may consist of stability studies in the homogenates
of the intestine and the buffer intestine. As a result, it was found that metformin-HCl could
be absorbed from the whole intestine with the main absorption site being the duodenum.
Metformin-HCl is transported by passive and active carrier mediated mechanisms, which
is also concentration-dependent. Furthermore, the Peff values obtained, the human
fraction dose absorbed for metformin-HCl is estimated to be 74%-90% along human
intestine. Intestinal perfusion studies are closer to in-vivo conditions. Limitations of this

146
method are associated with the technical complexity of studies in anesthetized animals
making the method very low throughput. The permeability measurement is based on
disappearance of the drug from the intestinal lumen as the only indication of absorption
and a large number of animals are needed for a statistical significance
(Zakeri-Milania, et al., 2007) used SPIP in rats to predict the human intestinal permeability
and fraction absorbed upon oral dosing. They determined the permeability coefficients in
anaesthetized rats using fourteen compounds. The appropriate SPIP method used is
through the perfusion of the drug solution through a single-pass intestinal perfusion
(SPIP) in phosphate buffered saline (PBS) with 0.21ml/min flow rate. At different time
points, up to 90min, the samples were taken from outlet tubing. Using HPLC, drug
concentrations in samples were determined and permeability coefficients (Peff) were
calculated. In conclusion, the SPIP could be utilized with precision to predict the human
intestinal permeability. Additionally, this particular technique provides a complete blood
supply and functional intestinal barrier that simulates a normal physiological state, which
can be used as a reliable procedure for the prediction of the absorbed dose following oral
administration in humans.
4.11.2 In-vivo permeability study of liquisolid formulations using animals such as beagle dogs and rabbits
Khaled et al. 2001, carried out an in-vivo drug permeability test to examine the absorption
properties Hydrochlorothiazide liquisolid tablets by using six male beagle dogs. The
liquisolid hydrochlorothiazide was orally and intravenously administered in dogs.
Moreover, 25mg of a single oral liquisolid and commercial tablets in a randomized two-

147
way crossover design was administered on two occasions. The results of the oral
administration showed significant difference (P < 0.05) between the liquisolid and the
commercial tablets in the peak plasma concentration, and the absolute bioavailability.
Additionally, liquisolid tablets showed 15% higher absolute bioavailability than the
commercial tablets, indicating greater bioavailability of the liquisolid tablets.
Consequently, the absorption of liquisolid hydrochlorothiazide tablets showed
significantly higher extent of absorption than the commercial tablets. Thus, upon
performing the in-vivo test, production of liquisolid formulation has the potential to be used
for clinical trials on humans to provide large scale production of liquisolid
hydrochlorothiazide tablets by pharmaceutical industries (Khaled, et al., 2001).
(El-Houssieny, et al., 2010) studied the bioavailability and biological activity of repaglinide
liquisolid and its effect on glucose tolerance in rabbits. The rabbits were orally
administered with liquisolid repaglinide and blood samples were used to determine the
pharmacokinetic parameters of the liquisolid drug and then compared to pharmacokinetic
parameters of marketed tablets (Novonorm, 2 mg). For pharmacokinetic studies, high-
performance liquid chromatography was used to determine and validate the concentration
of repaglinide in the plasma of rabbits. It was found that the relative bioavailability of
repaglinide liquisolid tablets was significantly increased in comparison to the marketed
tablets. In regards to insulin levels, the liquisolid repaglinide tablets increased insulin level
with a significant change of 37.6% while an insignificant change of 3.52% was seen in
commercial tablets. Additionally, the glucose tolerance test showed a reduction in blood
glucose level (18.1 % change) upon administration of the commercial whereas the blood
glucose level percentage change in groups treated with liquisolid formulation decreased

148
29.98%. Consequently, the bioavailability of liquisolid repaglinide was enhanced upon
oral administration of the drug which showed significant decrease in blood glucose levels
and more control of blood sugar than in commercial tablets by stimulating the release of
insulin from the β-cell of the pancreas (El-Houssieny, et al., 2010).
4.11.3 Effect of Freezing and Type of Mucosa on Ex-Vivo Drug Permeability Parameters
(Caon & Simões, 2011) performed an ex-vivo permeability study of carmabazepine (CBZ)
and triamcinolone acetonide (TAC) on the porcine esophageal and buccal mucosa with
different permeabilities and physicochemical properties using a Franz diffusion cell
system and HPLC as A detection method. The evaluation of freezing effects on drug
permeability parameters by comparing fresh and frozen tissues was tested. As a result,
it was found that fresh and frozen esophageal mucosae provided higher permeation of
triamcinolone acetonide than on buccal mucosae while the permeability parameters
obtained for carmabazepine were similar on both mucosae. Additionally, involving
carmabazepine, porcine esophageal mucosa could be used as a substitute for buccal
mucosa on ex-vivo studies whereas triamcinolone acetonide cannot be used for buccal
mucosa study. With great care, substitution of frozen tissues could be used instead of
fresh in both cases with special attention to the results of previous tests due to results
obtained could differ depending on the tested drug. Thus, in permeability studies
involving carmabazepine and triamcinolone acetonide, frozen porcine mucosae could be
substituted by fresh porcine mucosae. Also, only in ex-vivo experiments comprising of
carmabazepine, esophageal mucosa could be used as a substitute for buccal mucosa.

149
Consequently, to study the buccal drug permeability, consideration of drug type and its
physicochemical characteristics are relevant during the development of an ex-vivo mode.
(Caon & Simões, 2011).
4.11.4 Caco-2 Model
Caco-2 cells have been considered the “gold standard” assay for the prediction of
intestinal absorption, since they are extracted from human colorectal carcinoma (Hidalgo,
2001). No passive diffusion is constituted in Caco-2. Additionally, intestinal epithelium
permeability is a vital property that determines the extent and the rate of human
absorption which eventually affects the bioavailability of drug candidates. Additionally, by
allowing rapid assessment of membrane permeability, the caco-2 permeability assay rank
compounds as high, medium and low permeability. Moreover, majority of the
morphological and functional characteristics of intestinal cells that are responsible for
absorption are expressed by enterocytes. On the other hand, the permeability of
hydrophilic drugs are generally low in the Caco-2 monolayer that are transported by the
paracellular pathway. This is due to the tighter junction of the hydrophilic drugs (Sun, et
al., 2008)
4.12. Passive diffusion fundamentals of drug substances
The main target upon drug administration by extravascular route is the systemic
absorption followed by distribution to tissues and organs. At the side of action, drug
receptor interaction usually takes place to exert the pharmacological or toxic effect of the
drug. The transport of drug molecules across the cellular barrier involves two types of

150
movements or diffusion caused by an external force such as hydrodynamic flow or gravity:
transcellular (across the cell) and paracellular (inbetween cells). Diffusion in the presence
of a concentration gradient causes a net transport of molecules. The movement of drug
molecules from a higher to a lower concentration without the need of energy is known as
“passive diffusion” and this type of movement or diffusion does not involve a carrier which
can mediates either transcellular or paracellular transports (Shargel and YU 1999).
Additionally, according to Cao et al. (2006), about 80-95% of drug are absorbed by
passive diffusion and is affected by physicochemical properties such as hydrogen
bonding, pKa and lipophilicity.
4.13. Franz Cell
The most common in-vitro release testing (IVRT) method that is currently being used is
called Franz diffusion cells. There are few studies for orally administered drugs using the
Franz diffusion cell. Traditionally, they are used with synthetic membranes such as skin
and only few studies have employed Franz diffusion cells to study drug permeability
across the stomach or small intestine tissue (Dezani, et al., 2013). The membrane is kept
between the two compartments that separates donor from the receptor chamber. The
donor compartment contains the test product and the receptor compartment is filled with
the collection medium. There are several advantages of using Franz diffusion cells
including the need for a small amount of drug substance and the minor amount of tissue
handling and the similarities between rat and human tissues (Cao, et al., 2008).

151
4.14. Permeability study of metformin-HCl using stomach tissue and Franz cell
The permeability study of liquisolid immediate release metformin-HCl was performed on
male Wistar rats’ stomach tissue (Refer to Appendix for Chapter 4). The tissue was stored
in freezer (-80 0 C) and prior to the test, the tissue was defrosted and placed in freshly
prepared tyrode solution. Throughout the experiment, fresh solutions of tyrode and 0.2M
HCl were prepared. The tyrode's solution resembles lactated Ringer's solution, but
contains magnesium, glucose uses bicarbonate and phosphate as a buffer. The isotonic
solution was invented by an American pharmacologist Maurice Vejux Tyrodeis and it is
used in physiological experiments and tissue culture. Metformin-HCl liquisolid tablet
containing roughly 40mg of active ingredient was dissolved in distilled water and filtered
using 0.2µm size filter. The stomach tissue, upon cleaning the inner lining and cutting into
appropriate thickness, was placed on the Franz diffusion cell opening designated for the
membrane. The chamber was filled with 14 ml of HCl, 0.2M solution. The Franz cell was
kept at a constant temperature over a magnetic stirrer. Using a micropipette,1 ml of the
filtered metformin-HCl solution was injected in the donor chamber and samples were
withdrawn from the receiver chamber after specific time intervals. The results of the
performed permeability study are shown in Table 4.4.
As an anti-diabetic biguanide, metformin-HCl through a reduction in gluconeogenesis,
works by suppressing the unnecessary production of hepatic glucose. It has a half-life of
about 5 hours with a renal clearance rate of 510±120 ml/min. Moreover, metformin-HCl
is not metabolized and is excreted unchanged only in the urine. The drug is distributed
into the tissues of the body, liver, kidney as well as intestines by cationic transporters

152
(Gong, et al., 2012). The current performed ex-vivo permeability study on the male wistar
rat stomach has shown a permeability difference between pure metformin-HCl and
liquisolid formulations. According to (Caon & Simões, 2011), the difference between fresh
and frozen tissues were insignificant. Thus, although the results shown in Table 4.4 were
using frozen tissue, the results obtained were promising and can be performed on
different types of liquisolid drugs. The possible explanation to the new findings could be
linked to several factors including: the properties of the surfactants (PEG®400,
Synperonic®PE/L44 and Cremophor®ELP), the excipients (Avicel®PH102 and Cab-O-
Sil® M-5) and the use of polyvenylpyrolidone (PVP). Volker Bühler (2005) presented a
work linking the effect of PVP (Povidone) with the bioavailability of different active drugs
administered via several routes. The oral bioavailability of a nifedipine coprecipitate in the
rat, phenobarbital coprecipitate in rabbits and upon percutaneous administration of
hydrocortisone coprecipitate on the human skin was evaluated. Additionally, similar dose
of the pure active substance without PVP was applied for reference. Interestingly, after
two hours, the plasma level of the nifedipine coprecipitate reached twice the plasma level
of pure substance, and in the case of the phenobarbital suppositories, it reached three
times the level of the pure active substance (Bühler, 2005). Therefore, a strong correlation
between the effect of PVP on the drug permeability and bioavailability is observed. Thus,
it is a suggested reason, other than the benefits of liquisolid technique on the
enhancement of drug bioavailability but also wet granulation by using PVP can contribute
to the permeability improvement.

153
Table 4-4: Efflux (µg/ml/cm2) of metformin-HCl liquisolid in HCl (0.2M) solution using Franz diffusion cell for permeability study.
0.2MHCL Efflux(µg/ml/cm2)Time(min) PEG30% PEG60% Synperonic30%
5 0.87 1.25 0.5010 0.97 1.12 0.5115 1.00 1.09 0.6120 1.02 1.08 0.7325 1.02 1.11 0.8430 1.10 1.13 0.9445 1.18 1.21 1.1260 1.33 1.34 1.3190 1.95 1.46 1.65120 2.64 1.61 1.20
Synperonic60% Cremophor30% Cremophor60% PureMetformin
0.61 0.62 1.07 0.310.68 0.71 0.90 0.300.96 0.74 0.75 0.320.99 0.78 0.77 0.351.01 0.77 0.95 0.361.08 0.80 1.43 0.481.15 0.86 1.52 0.571.46 0.97 1.72 0.671.71 1.16 1.79 0.852.03 1.41 2.21 0.93

154
Table 4-5: Percentage of metformin-HCl penetrated from liquisolid formulations using Franz diffusion cell for permeability study.
0.2MHCL Percentageofthedrugpermeated(%)Time(min) PEG30% PEG60% Synperonic30%
5 0.61 0.87 0.3510 0.68 0.78 0.3615 0.70 0.77 0.4320 0.71 0.75 0.5125 0.72 0.78 0.5930 0.77 0.79 0.6645 0.82 0.85 0.7860 0.93 0.94 0.9190 1.37 1.02 1.15120 1.85 1.13 0.84
Synperonic60% Cremophor30% Cremophor60% PureMetformin
0.42 0.44 0.75 0.250.47 0.50 0.63 0.210.65 0.52 0.52 0.230.69 0.54 0.54 0.250.70 0.54 0.67 0.250.76 0.56 1.00 0.340.80 0.60 1.06 0.401.02 0.68 1.21 0.471.20 0.81 1.25 0.591.42 0.99 1.55 0.65
Table 4.4 shows the permeability results efflux (µg/ml/cm2) and Table 4.5 reveals the data
as percentage. It can be seen that all liquid vehicles used (PEG®400, Synperonic®PE/L44
and Cremophor®ELP) significantly enhanced the metformin-HCl permeability (P < 0.05)
(refer to Appendix for Chapter 4), compared to the pure drug, hence they are good
penetration enhancers. PEG®400 increased the drug permeability by 3-fold, whilst
Synperonic®PE/L44 and Cremophor®ELP increased it by about 2-3 folds (Table 4.5).
Those liquisolid preparations are expected to enhance bioavailability if they have been
tried in-vivo. A study by (El-Houssieny, et al., 2010) reported the improvement of

155
bioavailability of liquisolid Repaglinide upon oral administration of the drug which showed
significant decrease in blood glucose levels and more control of blood sugar than from
commercial tablets by stimulating the insulin release from the β-cell of the pancreas.
Additionally, the permeability of hydrophobic drug via the lipid bilayer of the cell
membrane could be increased in the presence of surfactants as they can disrupt the lipid
bilayer arrangement on the cell membrane causing increased drug permeability; they can
enhance the absorption via the passive transcellular route (Swenson & Curatolo, 1992)
they (for example Cremophor RH40) can inhibit P-glycoprotein that reduces intestinal
absorption of hydrophobic drugs by efflux transportation (Elkordy, et al., 2012), Moreover,
some non-ionic surfactants such as Synperonic®PE/L44 and Cremophor®ELP can be
considered as effective pharmaceutical excipients for inhibiting p-glycoprotein function
and hence promoting the intestinal absorption of different drugs (Shono, et al., 2004). In
addition to the role of surfactants in dissolution rate improvements (Kim, et al., 2000).
Therefore, the liquid vehicles (PEG®400, Synperonic®PE/L44 and Cremophor®ELP) are
a good choice of surfactants to be used in this study to improve metformin-HCl
permeability.
4.15. Conclusion
Metformin-HCl is a water soluble drug that gives about 100% drug release for pure and
conventional formulation after 10 minutes. By using liquisolid technique with different
liquid vehicles used to enhance dissolution, the drug release has not reached 100% after
10 minutes (Figure 4.4) due to: the effect of processing technique; the effect of surfactants
(liquid vehicles) and the interaction of the vehicles with the drug. Accordingly, metformin-

156
HCl was chosen as a water soluble model drug to emphasis on the various impact of
liquisolid technique on hydrophobic and hydrophilic drugs using same liquid vehicles. At
present, metformin-HCl is commercially available in high dose tablets, 500 mg; the
granulated liquisolid formulations may assist in the reduction of this dose. The stability
studies showed that the dissolution of liquisolid tablets was not affected by ageing
significantly. Franz diffusion cell has been used to test the permeability of metformin
liquisolid using Wistar rat stomach tissue. The results have shown promising results in
using granulated liquisolid metformin-HCl tablets to enhance the bioavailability of
metformin-HCl. Consequently, liquisolid tablets can be further used in alternative animal
tests in order to confirm the beneficial use of liquisolid technology on permeability of drugs
with poor bioavailability. Figure 5-1 summarises the sustained release liquisolid
metformin-HCl preparation.

157
Chapter 5 - Preparation and characterisation of sustained release liquisolid metformin-HCl formulations using Hydroxypropyl Cellulose (HPC-H)
Results and Discussion

158
5.1. Introduction
The main goal in diabetic patients is to achieve controlled blood glucose levels with the
aid of insulin or antidiabetic drugs such as metformin-HCl; however, successful use of
metformin-HCl therapy is challenged due to the high incidence of associated
gastrointestinal symptoms such as diarrhoea and abdominal discomfort (BNF 73, 2017).
Metformin-HCl has a multiple dosage regimen of 500mg two to three times daily or 850
mg once or twice per day. Therefore, such complications are not desirable and should be
avoided to maintain patient compliance. Metformin-HCl presents other formulation
challenges such as poor compressibility and poor permeability (Nanjwade, et al., 2011).
According to the biopharmaceutical classification system (BCS), metformin-HCl belongs
to class III with high water solubility and low permeability properties and due to metformin-
HCl’s poor compressibility properties. Direct compression is not desirable on the
commercial scale as it can lead to poor content uniformity as well as poor weight content
uniformity, hardness and friability (Nanjwade, et al., 2011). Consequently, there is a need
to provide once daily dosing formulations that would deliver modified release metformin-
HCl, which would maintain drug plasma levels for 10 to 12 hours when consumed orally.
By applying sustained release on such drugs, minimised systemic adverse effects and
greater patient compliance as well as other advantages can be achieved. Thus,
researchers have used numerous approaches to modify drug release in the form of
tablets and one of the successful methods from the prospect of this research is the use
of liquisolid technique. Liquisolid formulations not only have the potential to be optimised
for the reduction of drug dissolution rate and thereby production of sustained release

159
systems for highly water soluble drugs, but also have the potential to enhance flowability,
compressibility and permeability of metformin-HCl (Pavani, et al., 2013) (Chandrasekar,
et al., 2011). The sustaining agent that has been used in this chapter is HPC –high grade.
HPC is a hydrophilic polymer which is solubilised by hydroxypropyl groups. It swells by
producing a state of hydrogel in water which then releases the drug slowly over period of
time with diffusion.
The aim of the presented work chapter 5, is to utilise liquisolid-based formulations of
metformin-HCl as sustained release preparations. By the aid of liquisolid technique,
reduction of dose was successfully achieved, meaning less cost for pharmaceutical
industry and fewer side effects for patients. For both metformin-HCl liquisolid immediate
and sustained release formulations, PEG®400, Synperonic®PE/L44 and Cremophor®ELP
were used as non-volatile liquid vehicles. Additionally, wet granulation using PVP was
applied to both systems in order to achieve acceptable flowability and compressibility.

160
Figure 5.1: Flowchart summary of metformin-HCl sustained release liquisolid
preparation using HPC-H
Liquisolid compact preparation
Metformin-HCl sustained release
Model drug for sustained drug release
Lf value predetermined from literature
Drug powder admixture with liquid vehicle (PEG®400,Synperonic®PE/L44, Cremophor®ELP)
Q,q (carrier to coating) amount R=20 Carrier: HPC-H Coating:Cab-O-Sil®M-5
Mixing of drug, liquid vehicle, carrier, coating, disintegrant and lubricant in adjustable amount based on mathematical calculation
Powder admixture ==>wet granulation using 10% PVP
Automatic compaction

161
5.2 In-vitro dissolution study of sustained release liquisolid metformin-HCl using
HPC-H
Several techniques have been defined to produce sustained release formulations. Among
these techniques, a new and promising method, that is the liquisolid formulation, is
currently being used in achieving modified release dosage forms. Liquisolid formulations
may not only help in reduction in the drug dose but also may help in production of
sustained release metformin-HCl formulations. This part of the project explored the role
of hydroxypropyl cellulose (HPC-H) as a carrier in liquisolid preparation as well as a
sustaining agent in preparation of the modified release metformin-HCl. This work is novel
in the field of liquisolid sustaining systems. Other studies tried to introduce new non-
volatile liquid vehicle (Kollicoat®SR30D) that comprise of sustaining the drug release
while using hydrophilic carrier (Elkordy, et al., 2012). Nevertheless, in this present work,
the used non-volatile liquid vehicles are PEG®400, Synperonic®PE/L44 and
Cremophor®ELP. The carrier (HPC) will be the main focus of this section. The R-value
was also kept constant (20) as an immediate release, meaning the amount of Cab-o-sil®
M-5 was kept at 1:20 ratio with the carrier. The dissolution release of metformin-HCl was
performed in distilled water to comply with the immediate release conditions. Moreover,
in designing the metformin-HCl sustained release formulation, six liquisolid compacts,
namely HPC1-HPC6 at 30% and 60% drug concentrations were prepared (Table 5.1).
Together with conventional metformin-HCl, HPC1-HPC6 dissolution profiles are shown in
(Figure 5.2)

162
Table 5-1: Liquisolid formulations of sustained release metformin-HCl using HPC-H
Liquisolidsystem
Non-volatileliquidvehicle
DrugConcetrationinliquid
medication(%w/w)
Carrier:Coating
(R)
Liquidloadfactor(Lf)
Liquidvehicle(mg)
Activeingredient
(mg)
Carrier(Q)(mg)HPC-H
Coating(q)(mg)
Disintegrant(maize
starch)(mg)
Lubricant(mg)
Unitdose(mg)
HPC1 PEG®400 30 20 0.17 93.30 40.00 794 40.00 51.00 8.00 1026.30
HPC2 PEG®400 60 20 0.17 26.70 40.00 397 20.00 26.00 4.00 513.70
HPC3 Synperonic®PE/L44 30 20 0.27 93.30 40.00 501 25.00 35.00 5.20 699.50
HPC4 Synperonic®PE/L44 60 20 0.27 26.70 40.00 251 13.00 18.00 2.60 351.30
HPC5 Cremophor®ELP 30 20 0.52 93.30 40.00 256 12.80 21.00 3.20 426.30
HPC6 Cremophor®ELP 60 20 0.52 26.70 40.00 128 6.40 11.00 1.60 213.70
Conventional _ _ _ _ _ 40.00 397 20.00 24.20 3.60 485.00

163
Figure 5.2: The dissolution study of sustained release liquisolid metformin-HCl formulations using HPC-H (refer to Table 5.1 for formulations’ composition). Note: Standard deviation is presented but values are very small.
0
10
20
30
40
50
60
70
80
90
100
0 100 200 300 400 500 600 700 800
Dru
g re
leas
e (%
)
Time(min)
Metformin Liquisolid sustained release using HPC Dissolution Study
%releaseMe3ormin+PEG30%(HPC1)
%releaseMe3romin+60%PEG(HPC2)
%releaseMe3ormin+30%synp(HPC3)
%ReleaseMe3ormin+60%synp(HPC4)
%releaseMe3ormin+30%Crem(HPC5)
%releaseMe3ormin+60%Crem(HPC6)
%releaseofConvenEonalMe3ormin

164
The results of dissolution indicated that HPC1, HPC2, HPC3, HPC4, HPC5, HPC6 (Table
5.1) released 55, 55, 60, 66, 80, and 72%, respectively after 4 hours and released 86, 84,
75, 88, 85 and 85% respectively after 12 hours (Figure 5.2) which showed good release
profiles to sustain drug release. In comparison to the immediate release (see Figure 4.4),
Cremophor®ELP was the best choice of liquid vehicles to produce immediate release
tablets; meaning that this liquid vehicle reduces the effect of HPC as a sustaining release
agent. Based on the mathematical calculations the HPC amount (in HPC5, 30% w/w drug
concentration in Cremophor®ELP) was less compared to that in HPC1, HPC2 and HPC3
(Table 5.1). On the other hand, PEG®400 (HPC1, HPC2) and Synperonic®PE/L44 (HPC3)
enhanced the action of HPC to sustain release of metformin-HCl compared to
conventional tablets which contain no liquid vehicle (Figure 5.2); confirming the interaction
of the liquid vehicles with the HPC to enhance the drug release sustaining effect of the
HPC (i.e. conventional tablets contain 397mg HPC similar to drug with PEG®400
(60%w/w) formula tablets that contains 397mg HPC, hence the liquid vehicle enhanced
the effect of the HPC). Also, the enhanced sustaining drug release effect of PEG®400 (in
HPC1, HPC2) and Synperonic®PE/L44 (in HPC3) can be explained by that those liquid
vehicles equipped the formed HPC pores and hence the dissolution medium can
penetrate slowly through the pores and accordingly the release of metformin-HCl was
retarded.
Comparing all independent dissolution parameters for liquisolid tablets showed that there
were no significant differences between the liquisolid sustained release tablets and
conventional metformin-HCl (p>0.05) (refer to Appendix for Chapter 5). According to

165
(Diwedi, et al., 2012), a polymer’s ability to retard the drug release rate is related to its
viscosity. They used HPMC K4M and K15M and K100M which exhibited viscosity values
of 4000, 15000, 100000 mPa respectively. And therefore, HPMC K4M and K15M released
the drug faster than HPMC 100M. This theory can be implemented on this study where
HPC-H has viscosity of 3040mPa.s (Nisso HPC 2012) which showed a retardation effect
on metformin-HCl liquisolid tablets. The high drug release observed with HPC5 (drug in
Cremophor®ELP, 30%w/w) could be due to the possible interaction between the liquid
vehicle and HPC which retarded the drug release over 12 hours and at the same time
maintained a high release of drug without trapping it in the matrix (the drug could not
diffuse out of the matrix in a short time). Moreover, the prolonged action of metformin-HCl
from the sustained liquisolid compacts was due to the concentration and swellable nature
of HPC-H polymer. HPC-H is responsible for the retardation of drug release and the use
of HPMC was responsible for the retardation of trandolapril release from liquisolid
compacts (Butreddy & Dudhipala , 2015). The study showed significant sustained
dissolution profiles of all liquisolid compacts using HPMC K15 M, where the percentage
drug release of one of the formulations (containing PEG®400 as a liquid vehicle) was
97.3% after 14 hours. This is in agreement with this study by using Cremophor®ELP with
HPC-H
Hydroxypropyl Cellulose (HPC-H) is solubilised by the hydroxypropyl groups that impede
the hydroxyl group hydrogen bonding of the cellulose. Since HPC is a hydrophilic polymer,
it can be an effective controlled release agent by swelling and becoming a hydro-gel in
water, through which the dosage composition is released in dissolution medium (Nisso

166
HPC 2012). The incorporation of HPC in liquisolid formulations demonstrates synergistic
effect on liquisolid metformin-HCl release retardation as shown in Figure 5.2. The
presence of HPC in liquisolid formulations decreased the percentage of drug release from
almost 98% in immediate metformin-HCl release (F5) (see Figure 4.4) to 36% drug
release (HPC5) within the first hour. However, the amount of HPC being added to the
liquisolid formulations (Table 5.1) affects the retardation of the drug (as the amount of the
HPC was different in HPC1 - HPC6, Table 5.1). The amount of HPC added corresponds
to the amount of carrier being loaded in the liquisolid formulas. This means that the carrier,
Avicel®PH102, for immediate release preparations (Figure 4.4) was replaced by HPC
polymer to make this novel discovery of joint use of HPC as a sustaining agent as well as
a carrier to be used in the liquisolid systems. (Nokhodchi, et al., 2010) showed agreement
with the present outcome where their results demonstrated the direct effect of HPMC
concentration on the drug release retardation. As more HPMC was integrated in the
formulation of liquisolid, a further reduction in drug release rate was seen where the
HPMC concentration of 10%w/w and 15%w/w gave drug percentage release of 31.3%
and 26.9% respectively (Nokhodchi, et al., 2010). (Wadher, et al., 2011) displayed the
relationship between the concentration of HPMC and the rate of drug release to be
inversely proportional. It is documented that some factors can affect the performance of
tablets when used with HPC-H. The degree of water solubility and molecular weight of
the drug as well as the particle size of the used HPC are considering crucial factors in
drug release performances, where some polymers can work beneficially for certain drugs
and not for others.

167
Researchers have tested the effect of the concentrations of the hydrophilic sustaining
agent polymer (HPC) on the percentage drug release e.g. (Nanjwade, et al., 2011). Their
results suggested that as the increase in concentration of the polyethylene oxide is
inversely proportional to the release rate of the drug. It is further explained that the highly
water-soluble drug found in polyethylene oxide matrix leads to faster polymer swelling
and thus increase in gel thickness which prevents the instant disintegration of the tablet
(as seen also in the current research with HPC-H), thus sustaining the rate of drug
release. The current project study focusses on the use of liquisolid technique along with
wet granulation to possibly reduce the amount of the active ingredient and sustain its
release while maintaining the therapeutic efficacy level in order to reduce possible side
effects and promote patient compliance. The results promise regarding sustaining the
drug release.
In this study, the effect of liquid vehicle on drug release was not significantly different
compared to the conventional metformin-HCl (Figure 5.2). A study by Nokhodchi et al
(2010) showed that liquisolid compacts containing polysorbate 80 revealed slower drug
release compared to conventional tablets without polysorbate 80. Additionally, they
examined the effect of coating (silica) to Eudragit ratio and have observed slowest drug
release when ratio of silica:Eudragit was 1:2 (Nokhodchi, et al., 2010). Hydroxyethyl
cellulose (HEC) matrices drug release unlike HPC can be a combination of erosion,
polymer swelling as well as drug diffusion (Sinha & Rohera, 2002). Moreover, HPC
demonstrates a low drug release rate with effect of lower penetration rate resulting in
moderate swelling. Javadzadeh et al (2007) also showed that formulation containing
polysorbate 80 (50%) with Eudragit ®RS as the carrier and HPMC as additive had a low

168
dissolution rate. The possible explanation can be due to the formation of gel around the
disintegrated particles by HPMC, a barrier is built against diffusion of the dissolved drug
into the dissolution medium.
In more details, the process of drug release from hydrogel matrix tablet is divided into four
stages: water penetration into the hydrogel matrix tablet upon insertion into the dissolution
medium, diffusion of the drug through the sustained release matrix and its dissolution, as
well as polymeric excipient erosion (Tack-Oon, et al., 2013). Also, diffusion of water into
the polymer matrix occurs as soon as the polymer matrices come in contact with water.
Due to this, an increase in the mobility of the polymer chains is caused by water
penetration, allowing entangled chains to embrace new configuration, causing the outer
surface of the polymer to dissolve and erode when becomes in contact with water. High
molecular weight polymers, such as HPC-H, form a more viscous layer causing a
decrease in the polymer matrix erosion due to the ability of these polymers to seal pores
before allowing more liquid to penetrate, resulting in the polymer to swell faster. (Tack-
Oon, et al., 2013) and (Wan, et al., 1991). Moreover, the presence of HPC as a drug
carrier retards the release of metformin-HCl to a great extent. Since HPC-H swells in
water forming stiff matrix retarding metformin-HCl release. The metformin-HCl release
mechanism from the HPC matrix. And this can be compared to the immediate release
liquisolid metformin-HCl did not show delayed release when Avicel®PH102 was used as
a carrier instead of HPC.
Additionally, the release of drug from matrix is highly dependent on the amount of polymer
used as seen in Figure 5.2. This is in agreement with (Tack-Oon, et al., 2013) who
investigated drug release from hydrophilic polymer matrices such as HPMC with different

169
drug to polymer ratios. It was found that as the concentration of the polymer increased,
the viscosity of the gel also increased and diffusional path being formed and thus drug
release rate was reduced by diffusion.
In vitro drug testing is crucial process to study the quality assurance as well as
determination of stability release properties of drugs over a certain period of time. Thus,
basket and paddle methods resemble the most popular approaches which operate under
closed sink condition, yet cannot mimic the GI system. In this study, the dissolution test
of the liquisolid sustained release metformin-HCl was performed using USP 4 operating
in open-loop manner. The flow through cell (open-loop) system is greatly beneficial for
low-solubility drugs as it can easily provide sink conditions by maintaining the continuous
flow of fresh medium throughout the dissolution period. However, in this project, open
loop configuration was used for high water soluble metformin-HCl to study its sustained
effect using this system, where results obtained are expressed as the drug instantaneous
concentration. Additionally, the open loop configuration (USP4) is strongly proficient in
simulating the digestive system environment and has the potential to provide in-vitro and
in-vivo relationship that can be easily applied by laboratories (Gao Z., 2009).
5.3 Drug release mechanism and kinetics for metformin-HCl sustained release
formulations
To interpret the kinetic release mechanisms of the metformin-HCl from matrix systems
(sustained release HPC), different Kinetic equations such as zero-order, first-order and

170
Higuchi’s equations were applied. The best plot with higher squared coefficient of
determination (R2) was found to represent the best kinetic release model formulation
(Wadher, et al., 2011).Table 5.2 represents the values of the squared coefficient of
determination for metformin-HCl liquisolid sustained release (HPC1-HPC6, refer to Table
5.1 for details), using zero order, first order and Higuchi kinetic release models. Different
kinetic equations were implied on release data in order to describe the kinetics of drug
release from matrix tablets (Figures are included in the appendix for chapter 5). Kinetics
analysis of in-vitro release data could be best expressed for all formulations containing
hydroxypropyl cellulose (HPC1-HPC6) by Higuchi’s equation, as the plot showed highest
linearity coefficient of determination (R2) of more than 0.97 (Table 5.2). The drug release
kinetic using Higuchi model describes the release from an insoluble matrix as a square
root of a time-dependent process based on Fickian diffusion (Pavani, et al., 2013).
Constant drug release, from the beginning to the end, in a zero order kinetic model is an
ideal matrix system (Pather, et al., 1998). With time, drug release from matrix tablets
becomes progressively slower. The zero-order kinetics is when the drug release rate is
independent of its concentration. On the other hand, the first order kinetic model
describes the release rate is concentration dependent (Wadher, et al., 2011).

171
Table 5-2: Release kinetics of metformin-HCl liquisolid sustained release formulations
(for composition details, refer to Table 5.1)
Metformin Liquisolid sustained (HPC)
formulations
Zero Order
(R² )
First Order
(R²)
Higuchi
(R² )
PEG®400 30% (HPC1) 0.959 0.686 0.999
PEG® 400 60% (HPC2) 0.965 0.699 0.999
Synperonic®PE/L44 30% (HPC3) 0.954 0.699 0.998
Synperonic® PE/L44 60% (HPC4) 0.941 0.656 0.977
Cremophor® ELP 30% (HPC5) 0.974 0.678 0.998
Cremophor® ELP 60%(HPC6) 0.944 0.661 0.994
Kinetic models which are more suitable for controlled release formulations are zero order
and Higuchi kinetic models. (Higuchi, 1963) declared that the drug release from non-
swellable matrices is governed primarily by diffusion. Systems that follow Higuchi kinetic
model show a decrease as a function of time in the rate of drug release from matrixes
containing water-soluble drug and a water insoluble carrier. This is due to the increase in
the drug release diffusional path length with time as the solvent moves towards the center
of the matrix (Higuchi 1963). Furthermore, drug release from the tablets was primarily
controlled by polymer swelling followed by drug diffusion through the swollen polymer and
then slow erosion of the tablet matrix (Nanjwade, et al., 2011).
5.4. Tablet hardness, friability and uniformity of weight of sustained release
metformin-HCl using HPC
Table 5.3 presents physical information about several quality control tests which include:

172
tablet thickness, hardness, friability test, and drug weight uniformity test for the liquisolid
tablet formulations of metformin-HCl sustained release including conventional tablets
using HPC (HPC1-HPC6). The aim of making those tests is to investigate the effect of
wet granulation using PVP and the use of HPC on the physicochemical characteristics of
the prepared liquisolid tablets. All liquisolid tablets except HPC 4 (2.94%) and
conventional tablets (1.54%) passed and complied with pharmacopeia BP required
specifications for friability test where the loss of the powder was less than 1%. This
indicates that the prepared liquisolid tablets were of sufficient strength to endure the
handling and packing process. The wet granulated liquisolid formulations using PVP as
liquid binder have a tremendous resistance to any adhesive forces with the wall of the
friability tester or cohesive forces among the tablets. Furthermore, using compression
force to produce hardness of 30-45N, liquisolid tablets with the hierarchical thickness of
3.35 to 4.47 mm were prepared. The thickness uniformity could be considered as a further
control to the increased reproducibility of liquisolid tablets (El-Say, et al., 2010). Also, the
acquired results in Table 5.3 show acceptable thickness uniformity for all metformin-HCl
liquidsolid tablets (HPC1-HPC6).
Considering the integration of liquid vehicle in the formation of liquisolid metformin-HCl
sustained release formulation, wet granulation was applied on formulations (HPC1-
HPC6) (Table 5.1) using PVP in order to enhance the flowability and compressibility of
the liquisolid powder. HPC is freely flowable and therefore due to the absence of non-
volatile liquid in the conventional metformin-HCl no granulation step was performed;
however, the friability result was >1%.

173
Table 5-3: Thickness, crushing load, hardness, friability and uniformity of weight for
sustained release metformin-HCl liquisolid tablets using HPC (for formulations'
composition, refer to Table 5.1.)
FORMULATION THICKNESS(MM)
HARDNESS(KG/F)
HARDNESS(N)
FRIABILITYWEIGHT(%)
UNIFORMITYOFWEIGHT
(MG)HPC1 4.06±0.06 4.67±0.69 45.78±6.76 0.38 288±3.00HPC2 4.47±0.01 5.93±0.81 58.21±7.99 0.75 293±4.40HPC3 3.56±0.28 1±0.00 9.81 0.97 279±3.70HPC4 3.34±0.01 1.80±0.85 12.43±5.50 2.90 246±4.40HPC5 3.55±0.17 <1±0.00 9.81 0.05 247±4.40HPC6 3.64±0.09 1.12±0.12 10.95±1.15 0.26 276±2.80
CONVENTIONAL 3.35±0.02 4.52±0.78 44.31±7.68 1.54 283±1.50
As the diameters for all tablets have approximately similar values (using same tablet
press), the cause for variations in the tablet thickness can be explained in terms of the
dissimilarity in the weights of the tablets which also complied with BP limit specifications.
Tablet hardness were shown to be good for HPC1, HPC2 and conventional (4.67, 5.93
and 4.52 kg/F = (45.78N, 58.21 N, 44.31 N) respectively where HPC3 - HPC6 showed
poor crushing load profile (1kg/f) even though granulation process was applied. A
correlation between tablet hardness and its porosity was observed: increasing the
compression force and hardness of tablets leads to the reduction of porosity among the
particles in the dosage and reduction in drug release (Figure 5.2 for HPC1 - HPC2).
Formation of solid bridges among the particles of the tablets can result, leading to a
decrease in the intermolecular distance (Pavani, et al., 2013). Moreover, a relationship
exists between tablet hardness and the quantity and type of the non-volatile liquid vehicle
as well as the amount and type of the carrier and coating that are being used in the
formulation of liquisolid tablets (Spireas & Bolton, 1999). It was found that a relation can
be found between tablet hardness and the liquid load factor (Lf), where the relationship

174
is inversely proportional. That is, when Lf increased, tablet hardness decreased and this
finding is illustrated in Table 5.3. This finding is confirmed by the following data where the
tablet hardness of HPC1-HPC6 is 4.67, 5.93, 1, 1.80, 1 and 1.12 kg/F respectively with a
corresponding Lf values of 0.168 (HPC1 and HPC2), 0.266 (HPC3 and HPC4) and 0.52
(HPC5 and HPC6). The proposed explanation to this inverse relationship is that as the Lf
value increases, the amount of liquid used also increases causing a reduction in the
quantity of powder excipients used, causing a drop in the tablet hardness. In a previous
study by Javaheri et al, 2014, it was found that wet granulation in combination with
liquisolid system can show positive impact on the hardness of the tablets. However, this
scientific fact was not seen in the liquisolid formulation of sustained release metformin-
HCl using HPC as carrier and as sustaining agent. The possible explanation could be due
to the high viscosity property of Cremophor®ELP creating an unfeasible environment in
having freely flowable powders. Nevertheless, the application of wet granulation has
shown promising results with such highly viscous non-volatile liquids (Javaheri, et al.,
2014) however, HPC in high grade has a gel type characteristic that makes it unpractical
to granulate easily using any applicable liquid binders. Therefore, it can be suggested that
for future, encapsulation of HPC 5 and HPC6 into size zero capsules would be strongly
recommended. Additionally, in regards to uniformity of weight, all liquisolid metformin-HCl
tablets were found to be practically within BP limits. Overall, granulated liquisolid
formulations of sustained metformin-HCl using HPC showed acceptable good tablets
within limits uniformity of weight, low friability with acceptable thickness and hardness.
Different liquid binders were tested in this research, and amongst them, only PVP worked

175
appropriately with HPC and was a suitable liquid binder that was used to granulate HPC,
however, poor friability tablets were obtained.
5.5. Scanning electron microscopy of sustained release metformin-HCl using HPC
The scanning electron microscope microstructure of liquisolid formulation using HPC
(HPC1-HPC6) including pure metformin-HCl and pure HPC are shown in Figure 5.3. It
can be seen from the images that pure drug is different in shape from the liquisolid
formulations indicating its crystalline nature of metformin-HCl. Generally, the SEM
photomicrographs of liquisolid powders (HPC1-HPC6) demonstrate the drug particles are
entrapped onto the surface of the carrier material (HPC) or within them and causes
surface modification of the drug particle (Nnamani, et al., 2016); ( (Butreddy & Dudhipala
, 2015).

176
Pure HPC
Pure metformin (x1000)
HPC1
HPC2
HPC3
HPC4
HPC5
HPC6
Figure 5.3: SEM microphotographs of pure metformin-HCl and sustained release
metformin-HCl liquisolid powders using HPC. Refer to Table 5.1 for formulations'
composition

177
5.6. Fourier transform infrared spectroscopy (FTIR) of HPC formulations
According to (Silverstein, et al., 1991), the interaction between drug and excipients or
liquid vehicles cause a shift in the peaks corresponding to the functional groups of the
drug to different wavenumbers. Additionally, the absorption bands of the functional groups
arise from stretching and deformation vibrations.
Figure 5.4. metformin-HCl IR studies, revealed two typical bands at 3367 and 3292 cm -1
due to N-H primary stretching and a band at 3156 cm -1 due to N-H secondary stretching.
Additionally, characteristics bands at 1623 and 1561 were observed to be denoted for
N-H asymmetric deformation. Furthermore, shifts or reduction in intensity for the FTIR
bands of pure metformin-HCl and disappearance of the sharp peak of metformin-HCl was
observed in liquisolid formulations (Figure 5.4) which depict clear change in the structure
of the drug after the interaction between the liquid vehicle, excipients and metformin-HCl.
HPC forms a peak at 1046 cm -1 and is clearly seen in all liquisolid formulations including
conventional powder and the fingerprint regions of liquisolid metformin-HCl and HPC are
superimposed. The study shows drug concentration has no impact on the FTIR spectra
and thus no difference appears between 30% and 60% drug concentrations in liquisolid
properties.

178
Pure metformin
Conventional powder and pure HPC
HPC1 and HPC2
HPC3 and HPC4

179
Figure 5.4: FT-IR spectra of sustained release metformin-HCl liquisolid using HPC.

180
5.7. Differential scanning calorimetry (DSC) of sustained release liquisolid
metformin-HCl
DSC thermograms of metformin-HCl HPC1-HPC6 are shown in Table 5.4. The analyses
were used in order to investigate the possible solid-state interactions between the
components (drug and excipients) and compatibility in all the examined liquisolid
formulations. DSC thermogram of pure metformin-HCl in table 5.4 exhibited a sharp
endothermic peak at Tm of 232.99 0C (melting point) and enthalpy of 215.8J/g indicating
fusion and crystallinity of metformin-HCl. The thermograms of all liquisolid metformin-HCl
(HPC1-HPC6) showed broad endothermic peaks and reduction in melting point (~1-3°C,
Table 5.4). In comparison with the pure metformin-HCl thermogram, the results of the
liquisolid formulations displayed shifted endothermic peaks towards the lower
temperature and greatly reduced the enthalpy, indicative of reduced drug crystallinity in
HPC and non-volatile liquid vehicles and solid-solid interaction (Nafady, et al., 2014). This
can also be explained on the bases of diluting effects or that most of metformin-HCl was
dissolved in the liquid vehicle, thus reducing the number of drug crystals particles in the
liquisolid formulations, this is in agreement with (Nokhodchi, et al., 2010). Moreover, the
thermogram of conventional metformin-HCl HPC shows peaks of drug melting point 233
0C, meaning crystallinity of the drug. For HPC1 to HPC6 (refer to Table 5.1) the drug
endothermic peak became broader and lost its sharpness, indicating the drug dispersion
and solubilisation in the liquid vehicle and the rest of the excipients including HPC within
the liquisolid system. However, the DSC thermograms of HPC1-HPC6 including
conventional show a second peak with melting point ranging between 99 0C - 117 0C that
is not seen in pure metformin-HCl thermogram. Thermograms of HPC1-HPC6 have
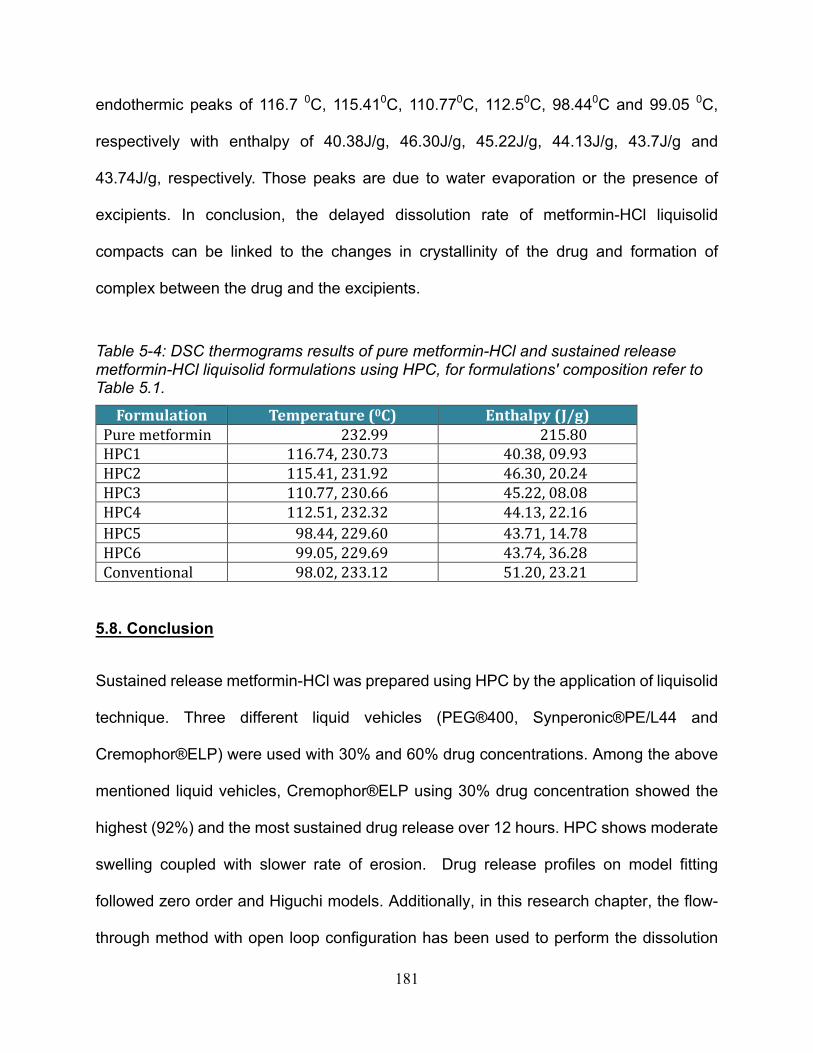
181
endothermic peaks of 116.7 0C, 115.410C, 110.770C, 112.50C, 98.440C and 99.05 0C,
respectively with enthalpy of 40.38J/g, 46.30J/g, 45.22J/g, 44.13J/g, 43.7J/g and
43.74J/g, respectively. Those peaks are due to water evaporation or the presence of
excipients. In conclusion, the delayed dissolution rate of metformin-HCl liquisolid
compacts can be linked to the changes in crystallinity of the drug and formation of
complex between the drug and the excipients.
Table 5-4: DSC thermograms results of pure metformin-HCl and sustained release
metformin-HCl liquisolid formulations using HPC, for formulations' composition refer to
Table 5.1.
Formulation Temperature(0C) Enthalpy(J/g)Puremetformin 232.99 215.80HPC1 116.74,230.73 40.38,09.93HPC2 115.41,231.92 46.30,20.24HPC3 110.77,230.66 45.22,08.08HPC4 112.51,232.32 44.13,22.16HPC5 98.44,229.60 43.71,14.78HPC6 99.05,229.69 43.74,36.28Conventional 98.02,233.12 51.20,23.21
5.8. Conclusion
Sustained release metformin-HCl was prepared using HPC by the application of liquisolid
technique. Three different liquid vehicles (PEG®400, Synperonic®PE/L44 and
Cremophor®ELP) were used with 30% and 60% drug concentrations. Among the above
mentioned liquid vehicles, Cremophor®ELP using 30% drug concentration showed the
highest (92%) and the most sustained drug release over 12 hours. HPC shows moderate
swelling coupled with slower rate of erosion. Drug release profiles on model fitting
followed zero order and Higuchi models. Additionally, in this research chapter, the flow-
through method with open loop configuration has been used to perform the dissolution

182
study of the sustained release metformin-HCl. Therefore, USP flow-through cell with open
loop configuration was a successful dissolution apparatus to study the release of
metformin-HCl over 12 hours.

183
Chapter 6 – Orodispersible liquisolid preparation of
metformin-HCl immediate release using Eudragit®RL-30D as
a non-volatile liquid vehicle: A Novel discovery
Results and Discussion

184
Figure 6.1: Flowchart metformin-HCl liquisolid formulation using Eudragit®L30D as non-volatile liquid vehicle summary work.
Liquisolid compact preparation
Model drugs for immediate drug release
Metformin-HCl

185
6.1. Introduction:
Eudragit®RL30D and Eudragit®RLPO are biocompatible copolymers synthesized from
acrylic and methacrylic acid esters. The structures of Eudragit®RL differ from the rest of
the Eudragit polymers only in the extent of the quaternary ammonium substitutions, more
substitution is seen with Eudragit®RL. Additionally, their water permeability is unaffected
by pH and water can also permeate more freely into Eudragit®RL due to the relative
hydrophilicity of the RL polymer (Patra , et al., 2017). This can be linked to the availability
of ammonium groups as salt, which makes Eudragit®RL more permeable. Eudragit® RL
has an improved protective and sustained-release performance along with an outstanding
gastrointestinal tract targeting (Evonik 2015), (Singh & Rana, 2013).
Liquisolid technique is initially designed to enhance the dissolution rate of poorly water-
soluble drugs and in recent studies has been used to sustain the release of water soluble
drugs such as metformin-HCl (as shown in chapter 5). However, in this section, liquisolid
is applied on metformin-HCl, a water soluble drug, using a novel non-volatile liquid vehicle
(Eudragit®RL30D), to produce tablets with enhanced properties. Eudragit®RL is a
polymer which is widely used in pharmaceutical industry to sustain drug release instead
of hydrophilic carrier or retarding agents (such as HPMC) (Azarmi, et al., 2002) in the
liquisolid formulations. In this current study, it did not have the potential to sustain the
release of metformin-HCl. Instead, it was capable of producing high yet steady release of
the drug with high standard quality control properties for the prepared tablets, and an
excellent fast disintegrating profile that makes them a successful discovery and addition
to the liquisolid system scheme as an orodispersible liquisolid tablets. This may be due

186
to the interaction between the drug and Eudragit®RL.
Inability to tablet taking is a common difficulty in most patient groups and predominantly
for geriatric, pediatric and psychiatric patients that fail in compliance with taking tablets
due to complications such as hand tremors, dysphasia and immature nervous and
muscular systems. The physical difficulty of swallowing is a common occurrence which
leads to poor efficiency of treatment. The emergence of fast dissolving tablets as an
alternative has resulted in overcoming the aforementioned disadvantages. Fast
dissolving tablets also known as orodispersible tablets swiftly break and disintegrate in
the mouth within 60 seconds and liquefy in saliva without the need for chewing or water.
These uncoated tablets are convenient and provide instant action that make them suitable
dosing with pronounced patient compliance due to ease of swallowing (Revathi, et al.,
2015), (Salunkhe, et al., 2013).
Flowchart 6.1 summarises the work performed in this chapter.
6.2. Determination of the angle of slide for Avicel®PH102 (MCC), Eudragit®RLPO,
Eudragit®RLPO: Avicel®PH102 (3:7) (as the carrier) and Cab-o-sil®M-5 (fumed
silica) using Eudragit®RL30D as a non-volatile liquid vehicle
In the formulation of liquisolid tablets, determination of angle of slide is one of the primary
steps of the system preparation. The flowable liquid retention potentials (Φ values) of
powder excipients were used for the calculation of Lf value. The Lf is used to calculate the
amount of liquid vehicle (Eudragit®RL30D) to be used in the liquisolid formulation. As
explained previously, the ΦCA value and ΦCO value determine the amount of carrier and

187
coating materials required to produce a free flowing, non-adherent, readily compactible
and dry- looking liquisolid formulations (Tiong & Elkordy, 2009). The preferred method
over other approaches to establish the flowability of powders is the determination of angle
of slide (θ) of fine powders with particle diameter less than 150μm. Moreover, this method
was applied due to the small particle sizes of Cab-o-sil®M-5P and Avicel®PH102 (133.8µm
and 0.2-0.3 µm respectively). Therefore, in order to calculate the required ingredient
quantities, the flowable liquid retention potential (Φ values) of powder were utilised. The
values of the flowable liquid retention potential for Avicel®PH102 and
Avicel®PH102:Eudragit®RLPO (7:3) and Cab-o-sil®M-5 with Eudragi®RL30D (the liquid
vehicle) were respectively calculated. Furthermore, the loading factor (Lf), the appropriate
amount of carrier (Avicel®PH102 and Avicel®PH102: Eudragit®RLPO (7:3) (Q) and the
required quantity of coating material (Cab-O-sil®M-5) (q) to convert a given mass of liquid
medication (W) into an reasonably flowing and compressible liquisolid admixture were
calculated using equations mentioned in chapter 2 (section 2.3.1). A sample calculation
is presented below:
1) !" = %&' + %&)(1/-); - = 20
!" = 0.8 + 02(0.05) è from angle of slide
!" = 0.8 2) !" = 5/6 ……. For 30% w/w drug in liquid vehicle
6 = 5/!"
6 = 133.3/0.8
6 = 166.66
5 = 309:(;<=:)è709:(?@A=@;BCℎ@E?C)

188
For 40mg drug/unit dose è liquid vehicle amount in mg will equal 40 ∗ 70/30 = 93.39:
Hence,
5 = 40 + 93.3 = 133.39:/IJK?CI
6/A = 20, ℎCMECA = 8.339:/IJK?CI
Table 6.1 shows the calculations’ results and the prepared formulations.

189
Table 6-1: Liquisolid formulation of metformin-HCl using Eudragit®RLPO as a carrier and Eudragit®RL30D as a non-volatile liquid vehicle.
Liquisolidsystem
Non-volatileliquidvehicle
DrugConcetration
inliquidmedication(%w/w)
Carrier:Coating(R)
Liquidloadfactor(Lf)
Liquidvehicle(mg)
Activeingredient
(mg)
Carrier(Q)(mg)
Coating(q)(mg)
Disintegrant(maize
starch)(mg)
Lubricant(mg)
Unitdose(mg)
LSS1 EudragitRL30D 30 20 0.80 93.30 40.00 166.60 8.33 16.40 2.50 327.00
LSS2 EudragitRL30D 60 20 0.80 26.70 40.00 83.30 4.17 8.18 1.20 164.00
LSS3 EudragitRL30D 30 20 0.20 93.30 40.00 666.50 33.30 44.20 6.60 884.00
LSS4 EudragitRL30D 60 20 0.20 26.70 40.00 333.35 16.67 22.10 3.30 442.00
Note: * Eudragit®RLPO:Avicel®PH102 3:7 = carrier

190
Several attempts have been made in order to achieve the optimum flowable retention
using different Avicel®PH102 to Eudragit®RLPO ratios. A ratio of 1:1 was also used and
the successful ratio of 7:3 (Avicel®PH102:Eudragit®RLPO) gave optimum flow and good
compactable tablets.
6.3. In-vitro dissolution study of immediate release liquisolid metformin-HCl using
Eudragit®RL30D and Eudragit®RLPO
In-vitro dissolution tests were performed to study the release behaviours of liquisolid
formulations in dissolution media (distilled water) (refer to Figure 6.2).
Dissolution profiles of liquisolid compacts using Eudragit®RL30D as a non-volatile liquid
vehicle (LSS1-LSS4) are shown in Figure 6.2. It is clear that the percentage of metformin-
HCl release in the distilled water dissolution medium is significantly high in a short time.
After 10 minutes, the percentage of the drug release was over 85% in all liquisolid tablets.
In this profile, after 2 hours LSS1 to LSS4 reached 100% release. It is clear from Figure
6.2 that the tablets prepared by liquisolid technique (LSS1 and LSS2) which contain
Avicel®PH102 as a carrier show faster drug release rate properties (100% after 1 hour)
in comparison with LSS4 and LSS5 drug release (93.5% and 87.4%, after 1 hour) matrix
tablets. The results showed that the percentage of drug release from liquisolid matrices
containing Eudragit®RLPO and Avicel®PH102 in the ration of 3:7 showed lower release
rate but (P>0.05). This could be due to difference in water permeability of those two
polymers as water can permeate more freely into Eudragit®RLPO than into Avicel®PH102
containing tablets due to the relative hydrophilicity of the RL polymer (Azarmi, et al.,
2002); (Javadzadeh, et al., 2008). Additionally, the drug concentration in liquid medication
191
used was 30% and 60% for all liquisolid tablets. Liquisolid formulations with 30% drug
concentration (high amount of liquid vehicle) showed insignificant higher percentage drug
release than 60% drug concentration. Comparably LSS1 and LSS2 have liquid load factor
of 0.8, thus higher percentage drug release was seen in these two formulations and not
in LSS3 and LSS4 where their liquid load factors were 0.2. This finding is also confirmed
by the comparison between LSS4 and LSS5. Higher drug release was seen in LSS4
(93.4%) with 30% drug concentration than LSS5 (87.4%) which contains 60%
concentration of drug. Therefore, the increase in the amount of liquid vehicle leads to an
increase in percentage drug release however insignificant (P > 0.05).

192
Figure 6.2: Dissolution study of immediate release liquisolid metformin-HCl (LSS1-LSS4) using Eudragit®RL30D as a novel non-volatile liquid vehicle (refer to Table 6.1 for composition).
0
20
40
60
80
100
120
140
0 20 40 60 80 100 120 140
Dru
g re
leas
e (%
)
Time(min)
Metformin and Eudragit Liquisolid granules Dissolution Study
LSS3 LSS1
LSS2 LSS4

193
As can be seen in Figure 6.2, no sustained-release effects were observed with metformin-
HCl LSS1-LSS5 liquisolid tablets which were prepared with Eudragit®RL30D as the non-
volatile liquid vehicle and Eudragit®RLPO as the carrier (in combination with
Avicel®PH102). Fast dissolution rate was observed using Eudragit®RL30D although
literature, such as (Boyapally, et al., 2009), suggests sustaining property reported for such
polymers. This can be attributed to the hydrophilic nature of Eudragit®RLPO, when
exposed to the dissolution medium, water, diffused into the free spaces of the matrix.
Upon solvation of the polymer chains due to polymer relaxation, an increase in the
dimensions of the polymer molecules can be observed.
Additionally, there was no significant difference among liquisolid tablets in their drug
release (p-value is >0.05). This finding can be related to the drug’s nature and the way it
interacts with the liquid vehicles and other excipients. Similarly, in a study performed by
Elkordy et al. (2013), they prepared liquisolid spironolactone tablets using
Kollicoat®SR30D as the non-volatile liquid vehicle and observed no sustained-release
effects. The proposed explanation was due to the drug’s interaction with the excipients,
rapid disintegration of tablets due to poor hardness or insufficient concentration of
Kollicoat®SR30D to produce sustained release effect. Therefore, this can also be a valid
explanation to the current results with metformin-HCl, taking into account that metformin-
HCl is highly water soluble and therefore could have reacted differently when being in
contact with Eudragit®RL30D and Eudragit®RLPO which was confirmed by FTIR and
DSC results.

194
A study by Javadzadeh et al. (2008) publicised the impact of granulation process on the
retardation of propranolol liquisolid release. In the same study, the authors claimed using
conventional tablets without the application of granulation process showed higher drug
release with Eudragit®RL than RS. However, when wet granulation was applied using
HPMC as a liquid binder on the same formulations, the results were the opposite;
Eudragit® RL showed slower drug release rate than those prepared using Eudragit®RS.
The possible explanation was linked to the use of HPMC in the granulation process and
its effect on release pattern as a result of drug particle coating containing Eudragit®RL
and not Eudragit® RS. Moreover, in this current research the use of Eudragit®RL30D as
the non-volatile liquid vehicle and liquid binder for the process of wet granulation did not
have any retardation effect on the release of metfromin liquisolid. On the contrary, it
produced steady and immediate release tablets. Unlike the polysorbate 80 which, is also
a non-volatile liquid vehicle used by Javadzadeh et al. (2008) along with Eudragit to
sustain the release of propranolol. One of the interesting properties of polysorbate 80 by
which it can reduce the glass transition temperature of the polymers in which leads to
release prolongation of liquisolid tablets due to its plasticity effect.
A study by (Shah, et al., 2012) performed a study on formulation of microsphere based
orodispersible tablets of itopride HCL, and in the dissolution profile, where the pH of the
medium was 1.2, it was observed that within the first 10 minutes, 90% of the drug was
released. Accordingly, in this current research project, the dissolution study performed in
distilled water and the result outcome was very interesting. After 10 minutes of dissolution
run, LSS1 released 91% of liquisolid metformin-HCl, followed by LSS2, LSS3 and LSS4
where the release was 98%, 87% and 85%, respectively. Therefore, it is expected that as

195
soon as Eudragit® dissolves in the acidic environment of the stomach, the drug will be
quickly released or even before reaching the stomach i.e. in the mouth (as tablets showed
fast disintegrating effect). Nevertheless, Javadzadeh et al. (2008) claimed the use of
granulation has greater impact on sustained release behaviour of liquisolid tablets.
Conversely, in the current study, wet granulation using Eudragit®RL30D as a liquid binder
showed no sustaining release behaviour on metformin-HCl Liquisolid tablets(LSS1-
LSS4), instead all tablets showed immediate release with fast disintegration profile (Refer
to Section 6.4). Moreover, the reason for choosing Eudragit ®RL over Eudragit®RS was
the published research papers. Javadzadeh et al. (2008) prepared liquisolid propranolol
as sustained release tablets using Eudragit®RL and Eudragit®RS where they compared
the retardation effect in the release of propranolol by using both polymers. As a result,
Eudragit®RS showed a more sustained release effect due to its hydrophobic properties
which reduces the permeability of water into the matrix. However, upon application of wet
granulation technique using HPMC, the outcome was reversed. Wet granulation had
remarkable impact with greater retardation effect on propranolol liquisolid tablets
containing Eudragit®RL (Javadzadeh, et al., 2008). Yet, after application of the above
principle, immediate release and fast disintegrating formulations of metformin-HCl
liquisolid tablets were obtained which adds a new approach and discovery to the liquisolid
list of achievements. For future work, taste masking excipients can be added to make the
metformin-HCl orodispersible tablets more customer friendly for patients.

196
6.4. Uniformity of tablet weight, Tablet hardness, friability, disintegration and
uniformity of drug content
Table 6.2 shows a comparison of the content uniformity, friability, hardness and
disintegration tests in terms of means and standard deviations between different
metformin-HCl liquisolids using Eudragit®RL30D, as a non-volatile liquid vehicle, and
Eudragit®RLPO, as a carrier in conjunction with Avicel®PH102 (3:7) that have been
granulated using Eudragit®RL30D as a liquid binder. The drug content uniformity results
show that the all formulations (LSS1-LSS4) are within the British Pharmacopoeia 2017
specific limits (85%-115%). Moreover, the changing in the quantities or type of carrier
shows significant effect on the uniformity of the drug in these formulations. For instance,
LSS1 and LSS2 show drug content of 110% and 104% where the used carrier was
Avicel®PH102 (microcrystalline cellulose only). On the other hand, when the carrier
constitution was made into a mixture of Avicel®PH102 and Eudragit®RLPO with a ratio of
3:7, the drug content uniformity has dropped to 95% and 87% for LSS3 and LSS4
respectively. As a consequence, the wet granulated formulations using Eudragit®RL30D
liquid binder and Eudragit®RLPO: Avicel®PH102 as carrier do affect the distribution of the
drug inside the Eudragit®RL30D liquisolid bed systems. The liquid binder
(Eudragit®RL30D) is compatible with the liquid vehicle (Eudragit®RL30D) and the
formation of the granules sustain the distribution of the liquid vehicle inside the solid
framework.
In regards to the friability tests, none of the liquisolid formulations reached 1% loss. The
friability percentage for LSS1-LSS4 are 0.01%, 0.03%, 0.45% and 0.42% respectively.

197
The results fulfilled the demands of the British Pharmacopoeia 2017 criteria that present
an excellent resistance to handling and packaging of the prepared tablets.
In this study, the range of hardness is between 6.95kg/f (68.11N) and 9.25 Kg/f (90.65N).
Using Avicel®PH102 as a carrier for LSS1 and LSS2 and Avicel®PH102 with
Eudragit®RLPO (7:3) as carriers for LSS3 and LSS4, leads to cover the surface and
increase solid bridges among particles. Particles undergo deformation and non-reversible
changes of their shapes as a response to compression forces being applied; therefore, it
can be said that carriers used in this study are capable of exhibiting plasticity behavior
(Fahmy & Kassem, 2008). Plastic deformation is a well-known property of Eudragit®
polymers which also have tendency to coat drug particles. (Apu, et al., 2009) noticed
highest hardness (216.14 kg/cm2)) in matrix tablets containing Eudragit®RLPO and
Eudragit®RSPO in ratio of 2:3. They explained that high compression forces can result in
hard, low porosity tablets that can markedly affect the drug release rate.

198
Table 6-2: Crushing load, hardness, friability, drug content uniformity and uniformity of weight for metformin-HCl liquisolid tabletsusingEudragit®RL30Dasthenon-volatileliquidvehicle(forformulationcompositions,refertotable6.1.).
FORMULATION CRUSHINGLOAD(KG/F) HARDNESS(N) FRIABILITY
WEIGHT(%)DRUG
CONTENT(%)UNIFORMITYOFWEIGHT(MG)
LSS1 9.25±0.23 90.74±2.30 0.01% 110.00%±1.17 174±2.10LSS2 7.70±0.43 75.54±4.21 0.03% 104.00%±2.44 176±1.70LSS3 6.95±0.21 68.18±2.03 0.45% 95.00%±1.63 223±2.10LSS4 9.03±0.34 88.62±3.38 0.42% 87.00%±2.40 239±1.80

199
For dissolution processes, rapid disintegration time is crucial due to fast division being
provided into surface fragments. Furthermore, balancing between disintegration time and
tablet hardness is an important factor from the industrial perception. According to the BP
specification of disintegration test, in no less than 15 minutes a tablet must disintegrate,
in which all liquisolid tablets have complied this specification. The data revealed an
average time of about 2.6min for the liquisolid formulations (LSS1-LSS4). The results in
Figure 6.3 show that the disintegration time comply with the BP specifications not only for
immediate release but also for fast disintegration time (<3min). LSS3 recorded the
shortest disintegration time of 15 seconds. Figure 6.3 presents the range of the
disintegration time of metformin-HCl liquisolid formulation using Eudragit®RL30D. LSS3
was found to be the fastest formula to disintegrate (16 seconds), followed by LSS4, LSS2
and LSS1 with disintegration time 2.30, 2.70 and 5.2 minutes, respectively. There are
fewer variations in the case of the Eudragit®RL30D liquisolid formulations compared with
the immediate release metformin-HCl using PEG®400, Synperonic®PE/L44 and
Cremophor®ELP formulations (chapter 4, section 4.5).

200
Figure 6.3: Average disintegration profile of liquisolid sustained release metformin-HCl granulated tablets. For formulations’ composition refer to Table 6.
5.2100
2.70
0.27
2.30
0.0000
1.0000
2.0000
3.0000
4.0000
5.0000
6.0000
7.0000
8.0000
LSS1 LSS2 LSS3 LSS4
Time(min)
DisintegrationprofileofMetforminLiquisolidusingEudragitRL30DandEudragitRLPO

201
Rapid disintegration is important during tablet formation to ensure quick breakage of
tablets into smaller segments during dissolution process for a larger surface area. The
rapid disintegration of liquisolid tablets might be accredited it to the presence of
Avicel®PH102 in conjunction with Eudragit®RLPO powders (7:3). They facilitate the
uptake of water into the pores of the tablet initiating an internal pressure which leads to
breakage of the tablets into fragments empowering rapid disintegration. Therefore, since
all liquisolid tablets disintegrate within 5 minutes (0.27 minutes in LSS3), these liquisolid
preparations can be used as fast disintegrating tablets that disintegrate or dissolve
promptly into the solution. With these changes, patient compliance can be ensured,
particularly for elderly patients who have difficulty in swallowing tablets or any other oral
dosage forms that causes a barrier or limitation for their compliance. Due to the effect of
Eudragit®RLPO on the disintegration time, with highest amount of carrier (666mg 3:7
Eudragit®RLPO to Avicel®PH102) in LSS3, the LSS3 gave the fastest disintegration time
(16 seconds), followed by LSS4 (2.3 minutes). El-Say et al. (2010) found an inversely
proportional relationship between liquid load factor (Lf) and disintegration time of the
liquisolid tablets. However, similar findings were not observed in this current study. A direct
positive correlation was found between the liquid load (Lf) and the disintegration time of
the liquisolid tablets. This principle was confirmed from the results of the following
formulae, LSS1 and LSS2 having Lf value of 0.8 with a mean disintegration time of 5.2
and 2.7 minutes respectively, and LSS3 and LSS4 having Lf value of 0.2 with mean
disintegration time of 0.16 minutes and 2.3 minutes respectively. Similar findings were
found in a study by (Egla & Abd Al Hammid, 2017)Lf decrease in two formulations F10
(containing 2.5 mg zolmitriptan, PG as non-volatile liquid vehicle and 9.3mg of CP a

202
superdisintegrant) and F11 (containing (containing 2.5 mg zolmitriptan, PG as non-volatile
liquid vehicle and 9.3mg of CP a superdisintegrant) where loading factors where 0.175
and 0.125 respectively. The wetting time (WT) and disintegration time (DT) of the two
specified formulations exhibited a proportional link with loading factor, where decrease in
WT and DT was seen as the loading factor was decreased (Egla & Abd Al Hammid, 2017).
The possible explanation was due to the reduction in loading factor, leading to an increase
in the amount of Avicel®PH102 (carrier) used. Furthermore, the high porosity of
Avicel®PH102 aids in the swelling and disintegration of the orodispersible tablets as a
result of water diffusion by capillary action into the hydrophilic matrix generating pressure
for rapid disintegration. On the other hand, (El-Say, et al., 2010) proposed a theory where
by increasing the liquid load factor the amount of liquid used significantly enhances the
wetting properties of the drug, thus increasing the accessibility of the drug to be freely
disintegrated causing a reduction in the disintegration time of the liquisolid tablets is
incompatible with entire range of liquid vehicles and drugs. In other words, drugs with
hydrophobic nature can preserve the above findings and show inverse relationship
between disintegration time and liquid load factor (Lf). Thus, when a hydrophilic drug is
being used, such as metformin-HCl, this relationship disappears leading to fast
disintegrant liquisolid tablets using Eudragit®RL30D as the non-volatile liquid vehicle. In
summary, the quantity of the carrier and the quantity of the disintegrants along with the
type of the liquid vehicle are the main factors controlling the disintegration time of the
liquisolid tablets. Wetting time is an indicator of the simplicity of tablet disintegration in the
buccal cavity. The acceptable time range for disintegration of orodispersible tablets must
be between 15-30 seconds and 3 minutes according to European Pharmacopoeia (Shah,

203
et al., 2012).
In most studies, fast disintegrating tablets were achievable by the use of fast disintegrants
such as crospovidone, (Egla & Abd Al Hammid, 2017). In this study they show the
importance of a balanced concentration in the orodispersible formulation. An optimal
concentration of the super disintegrant leads to an increase in the orodispersibility of the
tablet. Such a theory cannot be applied to the current work due to the fact that no
superdisintegrant was used, instead only potato starch was added to the liquisolid
formulation of metformin-HCl along with Eudragit®. Thus, to the best of our knowledge,
the model which played the role of fast disintegrating agent is believed to be
Eudragit®RLPO and this has been confirmed by disintegration and dissolution results.
6.5. Fourier transform infrared (FT-IR) spectroscopy
The functional groups absorption bands appear from the stretching, whereas the shape
and relative intensity of the IR absorption bands are used for assigning the vibrational
mode characteristics with assignments of bands. FT-IR samples of pure metformin-HCl
powder, pure Eudragit® and liquisolid metformin-HCl (LSS1-LSS4) granules are shown
in Figure 6.4. They were subjected to FT-IR spectroscopic analysis at spectral bands of
550-4000 cm-1. The characteristic absorption bands of pure metformin-HCl are between
3367 and 3292 cm -1 due to N-H primary stretching and a band at 3156 cm -1 due to N-H
secondary stretching (Sheela, et al., 2010)). Additionally, characteristics bands at 1623
and 1561 cm-1 were observed to be denoted for N-H asymmetric deformation (Sheela, et

204
al., 2010). The liquisolid formulations LSS1-LSS4 FT-IR showed complete disappearance
of the metformin-HCl pure peak, or reduction in intensity of peaks. This change might be
attributed to the interaction between the drug (metformin-HCl) and the excipients used
such as Eudragit®RL30D and Eudragit®RLPO.
Pure metformin
Eudragit®RL30D and Eudragit® RLPO
LSS1
LSS2

205
LSS3
LSS4
Figure 6.4: FT-IR spectra of metformin-HCl liquisolids using Eudragit® (LSS1-LSS4).For formulations’ composition refer to Table 6.1
6.6. Differential scanning calorimetry (DSC) Differential scanning calorimetry analysis was performed to determine the crystalline
nature of the drug and possible incompatibility of the drug with excipients used in the
liquisolid formulation development. Figure 6.5 depicts the thermal properties of liquisolid
formulations of metformin-HCl using Eudrgit®RL30D. DSC thermograms of pure
metformin-HCl showed a sharp endothermic peak at 232.990C corresponding to its
melting point with respective enthalpy of 215.8J/g. This sharp endothermic peak indicates
the crystalline nature of drug. The shifts of endothermic peak of metformin-HCl in the DSC
thermograms to lower temperatures indicates that the drug is mostly solubilised within
liquisolid mixture i.e. drug present mostly in a solution form (Butreddy & Dudhipala , 2015).
The small enthalpies of the drug’s melting point peak in liquisolid thermograms (Figure
6.4) imply that metformin-HCl in LSS1-LSS4 was mainly dispersed in the metformin-HCl

206
matrices (fast release observed) or the drug mostly exists in an amorphous form.
(Nnamani, et al., 2016).
LSS1
LSS2
LSS3
LSS4
Figure 6.5: DSC thermograms of metformin-HCl liquisolid formulations using Eudragit®RL30D as the non-volatile liquid vehicle (LSS1-LSS4). Refer to Table 6.1 for formulations composition details

207
6.7. Scanning electron microscopy (SEM)
SEM analysis showed pure metformin-HCl of irregular shapes and sizes. The SEM
microphotographs of all the liquisolid granules (LSS1-LSS4), shown in Figure 6.6, signify
the complete disappearance of metformin-HCl crystals, a fact that indicates that the drug
was solubilised in the liquisolid system. The liquisolid formulation hypothesis has been
proved by the fact that although the drug is in a solid dosage form, it is held within the
powder substrate in solution and it is observed in the dispersed state. This contributes to
the idea of free flowing and enhanced drug dissolution properties (Jain, et al., 2014).
Pure metformin (x1000)
LSS1
LSS2

208
LSS3
LSS4
Figure 6.6: SEM microphotographs of LSS1, LSS2, LSS3 and LSS4 using Eudragit®RL30D as the non-volatile liquid vehicle. Refer to Table 6.1 for formulations composition details.
6.8. Conclusion
This study demonstrated that the prepared liquisolid metformin-HCl using
Eudragit®RL30D as a liquid vehicle and Eudragit®RLPO as a carrier can possess fast oral
disintegrating time, thus shorter dissolution release pattern. Therefore, it can be
concluded that the rapid disintegration tablets formulated in this manner can easily help
in administration of liquisolid metformin-HCl in a greater satisfactory form. Hence, such
formulations can ensure higher patient compliance rate with minimum side effects making
it a suitable and sought after approach for the pharmaceutical industry. Figure 7-1 shows
the summary of liquisolid work performed in this research.

209
Chapter 7 - Conclusion and Future work

210
Figure 7.1: Summary of liquisolid work
Liquisolid compact preparation
Model drugs for immediate drug release
Glibenclamide, Metformin-HCl
Angle of slide determination (q-value) determination forcarrier: Avicel®PH102
coating: Cab-O-Sil®M-5
Liquid load factor(Lf value) determination
Drug powder admixture with liquid vehiclePEG®400 Synperonic®PE/L44 and
Cremophor®ELP
Q,q(carrier to coating)amountR=20 Carrier: Avicel®Ph102
Coating: Cab-O-Sil® M-5
Mixing of drug powder, liquid vehicle,carrier,coating, disintegrant and lubricant in adjustable amount based on mathematical calculation
Powder admixture
wet granulation with 10%PVP
Automatic compaction
No granulation
Manual compaction
Metformin-HCl
Angle of slide determination (q-value) determination for carrier: Avicel®PH102,
Avicel®PH102:Eudragit®RLPO (7:3)coating: Cab-O-sil®M-5
Liquid load factor (Lf value) determination
Drug powder admixture with liquid vehicle
Eudragit®RL30D
Q,q (carrier to coating) amountR=20 Carrier: Avicel®PH102,
Avicel®PH 102 :Eudragit®RLPO (7:3)
Mixing of drug powder, liquid vehicle,carrier,coating, disintegrant and
lubricant based on mathematical calculation
Powder admixture=>wet granulation using Eudragit®RL30D
Automatic compaction
Model drug for sustained drug release
Metformin-HCl
Lf value pretermined from literature
Drug powder admixture with liquid vehicle (PEG®400,Synperonic®PE/L44,
Cremophor®ELP)
Q,q (carrier to coating) amount R=20 Carrier: HPC-H Coating:Cab-O-Sil®M-5
Mixing of drug, liquid vehicle, carrier, coating and lubricant in adjustable amount based on mathematical
calculation
Powder admixture ==>wet granulation using 10% PVP
Automatic compaction

211
Conclusion
Solubility and dissolution are the major factors that affect the bioavailability and in vivo
performance of the drug. Moreover, based on literature, most current drugs have high
lipophilicity and poor aqueous solubility resulting in poor bioavailability. In an attempt to
improve bioavailability, it is crucial to improve the release behaviors of water insoluble
drugs. The aim of this research work was to enhance the solubility and dissolution of
hydrophobic drugs by the application of liquisolid technique. Liquisolid technology has the
capability to sustain the release water-soluble drugs and allow the development of
sustained release formulation with desirable release kinetics based on the work
presented in this research. A further aim was to prepare sustained release metformin-HCl
using liquisolid technique.
In chapter three, liquisolid technique changed the properties of glibenclamide, a
hydrophobic model drug by inclusion of the drug particles (10%w/w and 30%w/w) in non-
volatile liquid vehicles (PEG® 400, Synperonic® PE/L44 and Cremophor ®ELP). Wet
granulation of prepared liquisolid powders successfully produced automatically
compactible tablets using the above-mentioned liquid vehicles. The best dissolution
enhancement was seen with combination of Cremophor® ELP with glibenclamide
(10%w/w). However, the viscous behavior of Cremophor ®ELP made the flowability and
automatic compaction of liquisolid powders containing Cremophor® ELP very
challenging. Therefore, the new technique performed in this study (wet granulation by
incorporating PVP as a liquid binder) resolved the compactibility issues and produced
well-compressed liquisolid glibenclamide tablets which complied with B.P. quality control

212
tests. Therefore, the combination of the two methods wet granulation and liquisolid not
only showed dissolution enhancement of glibenclamide (hydrophobic drug), but also the
non-compressible tablets due to wet liquisolid powder mass, were formed into strong well-
compacted tablets with no lamination or capping. Simultaneously, incorporation of PVP
as a liquid binder did not affect the positive behavior of the liquid vehicles and also,
application of heat in the drying process upon wet massing did not lead to any evaporation
of the liquid vehicle. Accordingly, liquisolid system can use any type of viscous liquid
vehicles in its composition and by application of wet granulation technique liquisolid
powders can be compacted into tablets. The above-mentioned liquid vehicles
(Synperonic®PE/L44 and Cremophore®ELP) were chosen because there are limited
literature on their usage in liquisolid technology due to their viscous behavior and this
current research over-come the undesirable viscosity effects on the properties of the
liquisolid powders.
In chapter 4 the use of granulated liquisolid technique to generate stable metformin-HCl
tablets was tested. Metformin-HCl is a water-soluble drug, which gives about 100% drug
release for pure drug and the conventional formulation after 10 minutes. By using
liquisolid technique with different liquid vehicles used, the drug release has not reached
100% after 10 minutes due to: the effect of processing technique; the effect of surfactants
(liquid vehicles) and the interaction of the vehicles with the drug. Metformin-HCl was
chosen as a water-soluble model drug to emphasize on the various impact of liquisolid
technique on hydrophobic and hydrophilic drugs using same liquid vehicles. At present,
metformin-HCl is commercially available in high dose tablets, 500 mg; the granulated
liquisolid formulations may assist in the reduction of this dose. The stability studies

213
showed that the dissolution of liquisolid tablets was not affected by ageing significantly.
Franz diffusion cells have been used to test the permeability of metformin-HCl liquisolid
using Wistar rat stomach tissue. The results have shown promising results in using
granulated liquisolid metformin-HCl tablets to enhance the drug permeability and hence
may enhance drug bioavailability. Consequently, liquisolid tablets can be further used in
alternative animal tests in order to confirm the beneficial use of liquisolid technology on
permeability of drugs with poor bioavailability.
In Chapter 5, sustained release metformin-HCl was prepared using HPC polymer by the
application of liquisolid technique. Three different liquid vehicles (PEG®400,
Synperonic®PE/L44 and Cremophor®ELP) were used with 30% and 60% drug
concentrations. Among the above mentioned liquid vehicles, Cremophor®ELP using 30%
drug concentration showed the highest (92%) and the most sustained drug release over
a 12 hour period. HPC shows moderate swelling coupled with slower rate of erosion.
Drug release profiles on model fitting followed zero order and Higuchi models.
Additionally, the flow-through method with open loop configuration has been used to
perform the dissolution study of the sustained release metformin-HCl. Therefore, USP
flow-through cell with open loop configuration was a successful dissolution apparatus to
study the release of metformin-HCl over 12 hours.
The final chapter, Chapter 6, demonstrated the work on the preparation of liquisolid
metformin-HCl using Eudragit®RL30D as a liquid vehicle and Eudragit®RLPO as a carrier,
which can possess fast oral disintegrating properties, thus a shorter dissolution release
pattern. Therefore, it can be concluded that the rapid disintegration tablets formulated in
214
this manner can easily help in administration of liquisolid metformin-HCl in a more
customer friendly manner. Hence, such formulations can ensure higher patient
compliance rate with minimum side effects. This approach can be considered by the
pharmaceutical industry. This work discovered a new feature for Eudragit to produce fast
disintegrating effect with metformin-HCl and accordingly, this part was extended to
formulate liquisolid tablets with Eudragit. However, further future work is required.
In conclusion, although numerous techniques to handle solubility related issues already
exist, the liquisolid technology or powder solution technology is a novel and promising
technique for modifying the release of active pharmaceutical ingredients and to produce
pharmaceutically modified drugs with desirable characteristics. As the liquisolid
technology uses similar production processes as followed to develop conventional
tablets, this technology aims to improve the release rate of poorly water-soluble drugs via
a simple and cost effective method to positively improve patient compliance.
To go over the main points regarding the effect of the three non-volatile liquid vehicles
used (PEG®400, Synperonic®PE/L44 and Cremophor®ELP), Cremophor®ELP was the
most promising non-ionic surfactant as it enhances the dissolution of glibenclamide
significantly and improved the permeability of metformin-HCl. Additionally, it also
enhances the effect of Hydroxypropylcellulose(HPC) in sustaining the release of
metformin-HCl.

215
Future work
The current research project commenced with the investigation of applying the liquisolid
technique on glibenclamide (hydrophobic model drug) in order to enhance the solubility
and dissolution as well as flowability properties of the drug. Additionally, liquisolid
technique was also applied on metformin-HCl (hydrophilic model drug) in order to sustain
the release of the drug by the use of HPC-H in the aqueous media. The obtained results
with liquisolid preparations could be further investigated in vivo to check the bioavailability
of the drugs and to validate its enhancement to the drug solubility and dissolution.
Furthermore, using HPC-H was successful in sustaining the release of metformin-HCl by
the use of liquisolid technique can further be applied on other hydrophilic and can also be
filled into capsules, for more convenience. Additionally, stability test can be performed on
all liquisolid formulations containing Eudragit®RL30D as liquid vehicle (new
orodispersible liquisolid tablets) and HPC-H containing liquisolid metformin-HCl for further
quality control testing that is vital for industrial purposes.
The use of Eudragit® RL30D as liquid vehicle was a successful formulation to obtain fast
disintegration tablets in which as a result can be beneficial for elderly and vulnerable
people who have swallowing difficulties by including some flavor enhancer to mask the
taste of Eudragit® and make it more pleasant for patients. Also, similar liquisolid
technique can be applied on other available drugs in order to formulate orodispersible
tablets using Eudragit®RL30D.
Finally, the current research work showed promising results in enhancing the permeability
of metformin-HCl by using liquisolid technique and this test was performed on stomach

216
membrane of Wistar rats. This research can further be continued by using other
membranes such as small intestine in order to investigate the permeability of liquisolid
metformin-HCl.

217
Chapter 8 - References Spireas,S.,Jarowski,C.&Rohera,B.,1992.PowderedSolutionTechnology:PrinciplesandMechanism.PharmaceuticalResearch,9(10),pp.1351-1358.
Agrawal,V.,Siddiqui,A.,Ali,H.&Nazzal,S.,2009.DissolutionandPowderflowcharacterizationofsolidself-emulsifieddrugdeliverysystem(SEDDS).InternationalJournalofPharmaceutics,Volume366,pp.44-52.
Ahuja,N.,Katare,O.&Singh,B.,2007.Studiesondissolutionenhancementandmathematicalmodelingofdrugreleaseofapoorlywater-solubledrug.EuropeanJournalofPharmaceuticsandBiopharmaceutics,Volume65,pp.26-38.
Akinlade,B.,Elkordy,A.,Essa,E.&Elhagar,S.,2010.LiquisolidSystemstoImprovetheDissolutionofFurosemide.ScientiaPharmaceutica,Volume78,pp.325-344.
Albertini,B.etal.,2004.Characterizationandtaste-maskingevaluationofacetaminophengranules:comparisonbetweendifferentpreparationmethodsinahigh-shearmixer.EuropeanJournalofPharmaceuticalSciences,Volume21,pp.295-303.
Albertini,B.,Passerini,B.,Pattarino,F.&Rodriguez,L.,2008.Newspraycongealingatomizerforthemicroencapsulationofhighlyconcentratedsolidandliquidsubstances.EuropeanJournalofPharmaceuticsandBiopharmaceutics,Volume69,pp.348-357.
Alderborn,G.,2013.TabletsandCompaction.In:Aulton'sPharmaceutics-Thedesignandmanufactureofmedicines.s.l.:ChurchillLivingstone.
Altememy,D.&Altememy,J.,2014.FormulationandEvaluationofMeloxicamLiquisolidCompact.InternationalJournalofPharmacyandPharmaceuticalSciences,6(10),pp.453-463.
Anon.,March2017-September2017.BritishNationalFormulary(73).s.l.:s.n.
Anon.,2017.BritishPharmacopoeiaVomuleI.s.l.:s.n.
Apu,A.etal.,2009.InvestigationofinvitroReleasekineticsofCarbamazepinefromEudragit®RSPOandRLPOMatrixTablets.TropicalJournalofPharmaceuticalResearch,8(2),pp.145-152.
Augsburger,L.L.&Vuppala,M.K.,1997.HandbookofPharmaceuticalGranulationTechnology.GranulationTechnology,Volume81.
Aulton,M.,2013.Aulton'sPharmaceutics-Thedesignandmanufactureofmedicines.s.l.:ChurchillLivingstone.
Aulton,S.a.,2013.In:Pharmaceutics:TheScienceofdosageformdesign.s.l.:ChurchillLivingstone,p.410.

218
Azarmi,S.etal.,2002.ThermaltreatingasatoolforsustainedreleaseofindomethacinfromEudragitRSandRLmatrices.InternationJournalofPharmaceutics,246(1-2),pp.171-177.
Badawar,F.,2000.Effectofprocessparametersoncompressibilityofgranulationmanufacturedinahigh-shearmixer.InternationalJournalofPharmaceutics,198(1),pp.51-61.
Balaji,A.,Umashankar,M.&Kavitha,B.,2014.LiquisolidTechnology-Alatestreview.InternationalJournalofAppliedpharmaceutics,6(1),pp.11-19.
Balimane,P.,Chong,S.&Morrison,R.,2000.Currentmethodologiesusedforevaluationofintestinalpermeabilityandabsorption.JournalofPharmacologicalandToxicologicalMethods,Volume44,pp.301-312.
Baskaran,M.etal.,2016.FormulationdevelopmentofAtrovastatinCalciumtabletsbygelLiquisolidcompacttechniqueforimprovingsolidstatestabilityanddissolutionprofile.JournalofDrugResearchandDevelopmen,2(4),pp.1-7.
Bi,Y.,Yonezawa,H.&Sunada,H.,1999.Rapidlydisintegratingtabletspreparedbywetcompressionmethod:mechanismandoptimization.JournalofPharmaceuticalScience,Volume88,pp.1004-1010.
Block,L.etal.,2008.PharmaceuticalequivalenceofMetformintabletswithvariousbinders.JournalofBasicandAppliedPharmaceuticalSciences,29(1),pp.29-35.
Boyapally,H.,Nukala,R.&Douroumis,D.,2009.DevelopementandreleasemechanismofdiltiazemHClprolongedreleasematrixtablets.Drugdelivery,Volume16,pp.67-74.
Brusewitz,C.etal.,2007.Novelpoloxamer-basednanoemulsionstoenhancetheintestinalabsorptionofactivecom-pounds.InternationalJournalofPharmaceutics,Volume329,pp.173-181.
Bühler,V.,2005.PolyvinylpyrrolidoneExcipientsforPharmaceuticals:Povidone,CrospovidoneandCopovidone.Berlin,Heidelberg,NewYork:Springer.
Butreddy,A.&Dudhipala,N.,2015.EnhancementofsolubilityandDissolutionrateofTrandolaprilSustainedreleasematrixtabletsbyliquisolidcompactapproach.AsianJournalofPharmaceutics,9(4),pp.290-297.
Caon,T.&Simões,C.,2011.EffectofFreezingandTypeofMucosaonExVivoDrugPermeabilityParameters.AAPSPharmaceuticalScienceTechnology,12(2),pp.1-6.
Cao,X.etal.,2006.Whyisitchallengingtopredictintestinaldrugabsorptionandoralbioavailabilityinhumanusingratmodel.Pharmaceuticalresearch,Volume23,pp.1675-1686.
Cao,X.,Yu,L.&Sun,D.,2008.Drugabsorptionprinciples.In:Biopharmaceuticsapplicationsindrugdevelopment.NewYork:Springer,pp.75-100.
Carr,R.,1965.EvaluationFlowpropertiesofsolids.ChemicalEngineering,Volume72,pp.163-168.

219
Chandrasekar,M.,Diwedi,R.&Alexandar,S.,2011.PreparationandInVitroEvaluationofSustainedReleasetabletformulationsofMetforminHCL.AsianJournalofPharmaceuticalandClinicalResearch,5(1),pp.45-48.
Chebli,C.&Cartilier,L.,1998.Cross-linedcelluloseasatabletexcipient:binding/disintegrationagent.InternationalJournalofPharmaceutics,Volume171,pp.101-110.
D.,A.,1987.Sustainedreleasecompostionscomprisinghydroxypropylcelluloseethers.UnitedStates,PatentNo.4704285.
Darwish,I.&El-Kamel,A.,2001.Dissolutionenhancementofglibenclamideusingliquisolidtablettechnology.ActaPharm,51(1),pp.173-181.
Dash,S.,Murthy,P.N.,Nath,L.&Chowdry,P.,2010.Kineticmodelingondrugreleasefromcontrolleddrugdeliverysystems.ActaPoloniae-DrugResearch,Volume67,pp.217-223.
Dastmalchi,S.etal.,2005.Enhancingdissolutionserumconcentrationsandhypoglycemiceffectofglibenclamideusingsolventdepositiontechnique.JournalofPharmacyandPharmaceuticalScience,8(2),pp.175-181.
Dezani,A.etal.,2013.DeterminationoflamivudineandzidovudinepermeabilityusingadifferentexvivomethodinFranzcells.JournalofpharmacologicalandToxicologicalMethods,67(3),pp.194-202.
Dhiraja,K.,Sanjaya,A.,Chetan,C.&Ashish,V.,2013.Orodispersibletablets-anoverview.Internationaljournalofpharmaceuticalresearchandbio-sciences,2(6),pp.305-331.
Diwedi,R.,Alexandar,S.&Chandrasekar,M.,2012.PreparationandinvitroevaluationofsustainedreleasetabletformulationsofmetforminHCL.AsianJournalofPharmaceuticalandClinicalResearch,5(1),pp.45-48.
Dressman,J.,2007.Drugsolubility:howtomeasureit,howtoimproveit.AdvancedDrugDeliveryReviews,Volume59,pp.531-532.
Egla,M.&AbdAlHammid,S.,2017.DesignZolmitriptanLiquisolidorodispersibletabletsandtheirinvitroevaluation.InternationalJournalofPharmacyandPharmaceuticalSciences,9(1),pp.297-303.
El-Gizawy,S.,2007.EffectofformulationadditivesinthedissolutionofMeloxicamfromLiquisolidtablets.EqyptionJournalofBiomedicalScience,Volume25,pp.3-14.
Elhamili,A.etal.,2014.PharmaceuticalEvaluationofTypeIIoralAntidiabeticAgent.InternationalJournalofPharmaResearchandReview,3(6),pp.1-9.
El-Houssieny,B.,Wahman,L.&Arafa,N.,2010.Bioavailabilityandbiologicalactivityofliquisolidcompactformulaofrepaglinideanditseffectonglucosetoleranceinrabbits.BioScienceTrends,4(1),pp.17-24.

220
Elkordy,A.A.,Jatto,A.&Essa,E.,2012.InsitucontrolledcrystallizationasatooltoimprovethedissolutionofGlibenclamide.InternatinalJournalofPharmaceutics,428(1),pp.118-120.
Elkordy,A.,Bhangale,U.,Murle,N.&Zarara,M.,2013.Combinationoflactose(ascarrier)withCremophorEL(asaliquidvehicle)toenhancedissolutionofgriseofulvin.PowderTechnology,Volume246,pp.182-186.
Elkordy,A.,Essa,E.,Dhuppad,S.&Jammigumpula,P.,2012.Liquisolidtechniquetoenhanceandtosustaingriseofulvindissolution:eefectofchoiceof.InternationalJournalofPharmaceutics,Volume434,pp.122-132.
Elkordy,A.,Tan,X.&Essa,E.,2013.SpironolactonereleasefromliquisolidformulationspreparedwithCapryol90,solutolHS-15andKollicoatSR30Dasnon-volatileliquidvehicles.EuropeanJournalofPharmaceuticsandBiopharmaceutics,Volume83,pp.203-223.
El-Massik,M.,Darwish,I.,Hassan,E.&El-Khordagui,L.,1996.Developementofadissolutionmediumforglibenclamide.InternationalJournalofPharmaceutics,Volume140,pp.69-76.
El-Say,K.,Samy,A.&Fetouh,M.,2010.FormulationandevaluationofRofecoxibLiquisolidtablets.InternationalJournalofPharmaceuticalSciencesReviewandResearch,3(1),pp.135-142.
EuropeanPharmacopoeia,2017.9thed.s.l.:s.n.
Fahmy,R.&Kassem,M.,2008.Enhancementoffamotidinedissolutionratethroughliquisolidtabletsformulation:Invitroandinvivoevaluation.EuropeanJournalofPharmaceuticsandBiopharmaceutics,Volume69,pp.993-1003.
GaoZ.,2009.InVitroDissolutionTestingwithFlow-throughMethod:AtechnicalNote.PharmaceuticalScienceTechnology,10(4),pp.1401-1405.
Gianotto,E.etal.,2007.DissolutiontestforGlibenclamideTablets.QuimNova,30(5),pp.1218-1221.
Gong,L.etal.,2012.Metforminpathways:pharmacokineticsandpharmacodynamics.PharmacogenetGenomics,22(11),pp.820-827.
Gonjari,I.,Karmarkar,A.&Hosmani,A.,2009.EvaluationofinvitroDissolutionprofilecomparisonmethodsofsustainedreleaseTramadolHydrochlorideLiquisolidCompactFormulationswithmarketedsustainedreleaseTablets.DigestJournalofNanomaterialsandBiostructures,4(4),pp.651-661.
Gowardhane,A.,Kadam,N.&Dutta,S.,2014.ReviewonEnhancementofSolubilizationProcess..AmericanJournalofDrugDiscoveryandDevelopment,Volume4,pp.134-152.
Gubbi,S.&Jarag,R.,2009.LiquisolidTechniqueforEnhancementofDissolutionPropertiesofBromhexineHydrochloride.ResearchJournalofPharmaceuticalTechnology,2(2),pp.382-386.

221
Helga,M.,2002.TheBiopharmaceuticalClassificationSystem(BCS)anditsusage.DrugsMadeinGermany,Volume45,pp.63-65.
Hidalgo,J.,2001.Assessingtheabsorptionofnewpharmaceuticals.CurrenttopicsinMedicinalChemistry,1(5),pp.385-401.
Higuchi,T.,1963.Mechanismofsustained-actionmedication.Theoreticalanalysisofratesofreleaseofsoliddrugdispersedinsolidmatrices..JournalofPharmaceuticalSciences,52(12),pp.1145-1149.
HIlton,J.E.&Summers,M.P.,1986.Theeffectofwettingagentsonthedissolutionindomethacinsoliddispersionsystems.InternationalJournalofPharmaceutics,31(1-2),pp.157-164.
HPC,N.,2012.HighviscositygradehydroxypropylCellulose(HPC-H)forhydrophilicmatrix.SustainedReleaseFormulations.
Hu,L.-D.,Liu,Y.&Zhang,Q.,2006.Preparationandinvitro/vivoevaluationofsustained-releasemetforminhydrochloridepellets.EuropeanjournalofPharmaceuticsandBiopharmaceutics,Volume64,pp.185-192.
Inc.,A.,2013.PVPPolymers.BrochurebyAshlandInc..
Iveson,S.M.,Litster,J.D.,Hapgood,K.&Ennis,B.J.,2001.Nucleation,growthandbreakagephenomenainagitatedwetgranulationprocesses:areview.PowderTechnology,Volume117,pp.3-39.
Jain,H.,Ty,P.&Bhandari,A.,2014.Formulationandcharacterizationofliquisolidtabletsofvalsartanforimprovementofdissolutionrate.AsianJournalofPharmaceuticalandclinicalresearch,7(4),pp.21-26.
Javadzadeh,Y.,Jafari-Navimipour,B.&Nokhodchi,A.,2007.Liquisolidtechniquefordissolutionrateenhancementofahighdosewater-insolubledrug(carbamazepine).InternationalJournalofPharmaceutics,Volume341,pp.26-34.
Javadzadeh,Y.,Musaalrezaei,L.&Nokhodchi,A.,2008.Liquisolidtechniqueasnewapproachtosustainpropranololhydrochloridereleasefromtabletmatrices.InternationalJournalofPharmaceutics,Volume362,pp.102-108.
Javadzadeh,Y.,Shariati,H.,Danesh,M.&Ali,N.,2009.Effectofsomecommercialgradesofmicrocrystallinecelluloseonflowabilitycompressibilityanddissolutionprofileofpiroxicamliquisolidcompacts.DrugDevelopementandIndustrialpharmacy,Volume35,pp.243-251.
Javadzadeh,Y.,Siahi,M.R.,Asnaashari,S.&Nokhodchi,A.,2007.Liquidsolidtechniqueasatoolforenhancementofpoorlywater-solubledrugsandevaluationoftheirphysiochemicalproperties.ActaPharm,Volume57,pp.99-109.
Javaheri,H.,Carter,P.&Elkordy,A.,2014.WetgranulationtoovercomeLiquisolidTechniqueissuesofpoorFlowabilityandcompactibility:AstudytoEnhanceGlibenclamideDissolution.JournalofPharmaceuticsandDrugDevelopement,1(5),pp.1-12.

222
Javazadeh,Y.,Siahi-Shadbad,M.,Barzegar-Jalili,M.&Nokhodchi,A.,2005.EnhancementofDissolutionRateofPiroxicamusingliquisolidcompacts.ILFarmaco,Volume60,pp.361-365.
karmarkar,A.etal.,2009.Liquisolidtablets:Anovelapproachfordrugdelivery.InternationalJournalofHealthResearch,Volume2,pp.45-50.
Khaled,K.,Asiri,Y.&El-Sayed,Y.,2001.Invivoevaluationofhydrochlorothiazideliquisolidtabletsinbeagledogs.InternationalJournalofPharmaceutics,Volume222,pp.1-6.
Khaled,K.,Asiri,Y.&El-Sayed,Y.,2001.Invivoevaluationofhydrochlorothiazideliquisolidtabletsinbeagledogs.InternationalJournalofPharmaceutics,Volume222,pp.1-6.
Kienkens,F.,Zelco,R.&Remon,J.,2000.Influenceofdryingtemperatureandgranulationliquidviscosityontheinterandintragranulardrugmigrationintraydriedgranulesandcompacts.Pharm.Dev.Technol,5(1),pp.131-137.
Kim,H.etal.,2000.Preparationandinvitroevaluationofself-microemulsifyingdrugdeliverysystemscontainingidebenone.DrugDevelopementandIndustrialPharmacy,Volume26,pp.523-529.
Kitazawa,S.etal.,1975.Effectofhardnessonthedisintegrationtimeandthedissolutionrateoftheuncoatedcaffeinetablets.Journalofpharmacyandpharmacology,Volume27,pp.765-770.
Knoblauch,J.&Zimmermann,I.,2007.ThermochemicalanalysisofthedissolutionprocessofGriseofulvin.EuropeanJournalofPharmaceuticsandBiopharmaceutics,Volume67,pp.743-751.
Kuchekar,S.&Mohite,S.,2015.DesignandevaluationofextendedreleaseRanolazineliquisolidtabletssusingplacket-burmanscreeningdesign.AsianJournalofpharmaceuticalandclinicalresearch,8(3),pp.292-300.
Kumar,N.etal.,2015.EnhancementofDissolutionrateofGlibenclamideusingLiquisolidtechqniue.InternationalJournalofResearchinPharmaceuticalandNanoSciences,4(4),pp.206-216.
Leuenberger,H.,2011.ManufacturingPharmaceuticalGranules:istheGranulationEndpointaMyth?.s.l.,GranulationWorkshop.
Lipinski,C.,2002.Pooraqueoussolubility-anindustrywideproblemindrugdiscovery.AmericanPharmaceuticalReview,Volume5,pp.82-85.
Lipinski,C.,2004.Aqueoussolubilityindiscovery,chemistry,andassaychanges.In:DrugBioavailability:EstimationofSolubility,permeability,AbsorptionandBioavailability.s.l.:WileyonlineLibrary,pp.215-231.
Mahajan,H.etal.,2011.Enhanceddissolutionrateofglipizidebyaliquisolidtechnique.InternationalJournalofPharmaceuticalScienceandNanotechnology,Volume3,pp.1205-1213.

223
Mahato,R.&Narang,A.,2012.PharmaceuticaldosageformsandDrugdelivery.USA:TaylorandFrancisGroup.
Manimaran,V.etal.,2010.EnhancementofDissolutionRateofGlibenclamidebySolidDispersionTechnology.InternationalJournalofCurrentPharmaceuticalResearch,2(3),pp.14-17.
McCreight,L.,Bailey,C.&Pearson,E.,2016.Metforminandthegastrointestinaltract.Diabetologia,Volume59,pp.426-435.
Mei,L.etal.,2016.Liquisolidtechniqueanditsapplicationsinpharmaceutics.AsianJournalofPharmaceuticalSciences,pp.1-9.
Mirza,S.etal.,2007.Solidstatepropertiesandrelationshipbetweenanhydrateandmonohydrateofofbaclofen.J.Pharm.Sci.,96(9),p.2399–2408.
Mosharraf,M.&Nystrom,C.,1995.SolubilityCharacterisationofpracticallyinsolubledrugsusingtheCoultercounterprinciple.InternationalJournalofPharmaceutics,Volume122,pp.55-67.
Muller,R.,Bohm,B.&Grau,J.,2000.Nanosuspensions:aformulationapproachforpoorlysolubleandpoorlybioavailabledrugs.In:D.Wise,ed.HandbookofPharmaceuticalControlledReleaseTechnology.s.l.:s.n.,pp.345-357.
Murra,P.etal.,2005.Solid-statecharacterizationanddissolutionpropertiesofnaproxen-arginine-hydroxypropyl-B-Cyclodextrinternarysystem.EuropeanJournalofBiopharmaceutics,Volume59,pp.99-106.
Mutalik,S.,Anju,P.,Manoj,K.&Usha,A.N.,2008.Enhancementofdissolutionrateandbioavailabilityofaceclofenac:Achitosan-basedsolventchangeapproach.InternationalJournalofPharmaceutics,Volume350,pp.279-290.
Nafady,M.,Attalla,K.,Abdelwahab,M.&Abdul-Azim,M.,2014.FormulationandcharacterizationofMetforminhydrochloridefloatingcapsules.InternationalJournalofPharmaceutics,24(2),pp.315-320.
Nafady,M.,Attalla,K.&Sayed,M.,2014.FormulationandevaluationofextendedreleaseMetforminhydrochloridebeads.InternationalJournalofPharmacyandPharmaceuticalSciences,6(2),pp.433-441.
Nagabandi,V.,Ramarao,T.&JayaveeraK,2011.LiquisolidCompacts:Anovelapproachtoenhancebioavailabilityofpoorlysolubledrugs.InternationalJournalofPharmacyandBiologicalSciences,1(3),pp.89-102.
Nanjwade,B.,Mhase,S.&Manvi,F.,2011.FormulationofExtended-releaseMetforminHydrochlorideMatrixtablets.TropicalJournalofPharmaceuticalresearch,10(4),pp.375-383.
Nath,B.,Nath,L.&Sahu,B.,2010.PreparationandCharacterizationofSalbutamolSulphateLoadedEthylcellulosemicrospheresusingWater-in-oil-oilemulsiontechnique.IranianJournalofPharmaceuticalResearch,Volume9,pp.97-105.

224
Ng,S.,Rouse,J.,Sanderson,D.&Eccleston,G.,2010.AcomparativestudyofTransmembraneDiffusionandPermeationofIbuprofenacrossSyntheticMembranesusingFranzDiffusioncells.Pharmaceutics,2(1),pp.209-223.
Nicklin,P.etal.,1996.TransferofmetforminacrossmonolayersofhumanintestinalCaco-2cellsandacrossratintestine.InternationalJournalofPharmaceutics,Volume128,pp.155-162.
Nicolazzo,J.&Finnin,B.,2008.Invivoandinvitromodelsforassessingdrugabsorptionacrossthebucalmucosa.In:Drugabsorptionstudies:Insitu,invivoandinsilicomodels.NewYork:Springer,pp.89-111.
Nnamani,P.etal.,2016.Sustanied-releaseLiquisolidcompacttabletscontainingartemther-Lumefantrineasalternate-dayregimenformalariatreatmenttoimprovepatientcompliance.InternationalJournalofNanomedicine,Volume11,pp.6365-6378.
Nokhodchi,A.,Aliakbar,R.,Desai,S.&Javadzadeh,Y.,2010.Liquisolidcompacts:TheeffectofcosolventandHPMContheophyllinerelease.ColloidsandsurfacesB.Biointerfaces,Volume79,pp.262-269.
Nokhodchi,A.,Javadzadeh,Y.,Siahi-Shadbad,M.R.&Barzegar-Jalili,M.,2005.Theeffectoftypeandconcentrationofvehiclesonthedissolutionrateofapoorlysolubledrug(indomethacin)fromliquisolidcompacts.JournalofPharmacyandPharmaceuticalSciences,8(1),pp.18-25.
Özyazici,M.&Sevgi,F.,2003.FormulationandEvaluationofSalbutamolSulphateTabletsPreparedbyDirectCompressionUsingVariousExcipients:StatisticalComparisonofDissolutionMethodsandTabletProperties.JournalofPharmaceuticalScience,Volume28,pp.1-11.
Pather,S.,Russel,I.,Syce,J.&Neau,S.,1998.Sustainedreleasetheophyllinebydirectcompression.PartI.Formulationandinvitrotesting.InternationalJournalofPharmacy,Volume164,pp.1-10.
Patra,N.etal.,2017.PharmaceuticalsignificanceofEudragit:Areview.FutureJournalofPharmaceuticalSciences,Volume3,pp.33-45.
Pavani,E.,Noman,S.&Syed,I.,2013.LiquisolidTechniquebasedsustainedreleasetabletoftrimetazidinedihydrochlroide.DrugInventionalToday,5(1),pp.302-310.
Pelkonen,O.,Boobis,A.&Gundert,U.,2001.Invitropredictionofgastrointestinalabsorptionandbioavailability:anexperts’meetingreport.EuropeanJournalofClinicalPharmacology,57(9),pp.621-629.
Pezzini,B.etal.,2016.Liquisolidtechnologyappliedtopellets:Evaluationofthefeasibilityanddissolutionperformanceusingfelodipineasamodeldrug.ChemicalEngineeringResearchandDesign,pp.1-8.
Prabakaran,D.,Singh,P.,Kanaujia,P.&Vyas,S.,2003.Effectofhydrophilicpolymersonthereleaseofdiltiazemhydrochloridefromelementaryosmoticpumps.InternationalJournalofPharmaceutics,Volume259,pp.173-179.

225
Rao,M.,Mandage,Y.,Thanki,K.&Bhise,S.,2010.DissolutionImprovementofSimvastatinbySurfaceSolidDispersionTechnology.DissolutionTechnologies,pp.27-34.
Reddy,K.,Mutalik,S.&Reddy,S.,2003.Once-dailySustained-ReleaseMatrixofNicorandil:FormulationandInVitroEvaluation.AAPSPharmaceuticalScienceTechnology,4(4),pp.1-9.
Revathi,S.,Moulali,S.&Dhanaraju,M.,2015.Formulationandevaluationoforodispersiblevalsartantablets.DerPharmaciaLettre,7(1),pp.315-324.
Robinson,B.V.,Sullivan,F.M.,Borzelleca,J.F.&Schwartz,S.L.,1992.PVP-AcriticalreviewofthekineticsandToxicologyoflolyvinylpyrrolidone(Povidone).
Rohrs,B.etal.,2006.ParticleSizeLimitstoMeetUSPContentUniformityCriteriaforTabletsandCapsules.JournalofPharmaceuticalScience,95(5),pp.1049-1059.
Rouchotas,C.,Cassidy,O.&Rowley,G.,2000.Comparisonofsurfacemodificationandsoliddispersiontechniquesfordrugdissolution.InternationalJournalofPharmaceutics,Volume195,pp.1-6.
Rowe,R.,Sheskey,P.&Weller,P.,2003.HandbookofPharmaceuticalExcipients.Fourthed.Washington:PharmaceutialPress.
Saeedi,M.etal.,2011.Enhancementofdissolutionrateofindomethacinusingliquisolidcompacts.IranianJournalofPharmaceuticalResearch,Volume10,pp.25-34.
Salunkhe,S.etal.,2013.Impactofformulationparametersonfastdissolvingtabletofondasetronhydrochloridepreparedbypressurizedhomogenizationtechnique.WorldofjournalofPharmacyandPharmaceuticalsciences,2(6),pp.5654-5666.
Sarmento,B.etal.,2012.Cell-basedinvitromodelsforpredictingdrugpermeability.ExpertopiniononDrugmetabolismandtoxicology,8(5),pp.607-621.
Savjani,K.,Gajjar,A.&Savjani,J.,2012.DrugSolubility:ImportanceandEnhancementTechniques.InternationalScholarlyResearchNetworkPharmaceutics,pp.1-10.
Serajuddin,A.,1999.“soliddispersiontechnique”.JournalofPharmaceuticalScience,88(10),pp.891-900.
Shah,N.etal.,1994.Selfemulsifyingdrugdeliverysystems(SEDDS)withpolyglycolyzedglyceridesforimprovinginvitrodissolutionandoralabsorptionoflipophillicdrugs.InternationalJournalofPharmaceutics,Volume106,pp.15-23.
Shah,S.,Madan,S.&Agrawal,S.,2012.FormulationandevaluationofmicrospherebasedorodispersibletabletsofItoprideHCL.DARUjournalofpharmaceuticalsciences,20(24),pp.1-12.
Shangraw,R.,1989.Compressedtabletsbydirectcompression.In:H.Lieberman,L.Lachman&J.Schwartz,eds.PharmaceuticalDosageForms:Tablets.NewYork:MarcelDekker,pp.195-246.

226
Shangraw,R.,1989.Compressedtabletsbydirectcompression.In:H.Lieberman,L.Lachman&J.Schwartz,eds.Pharmaceuticaldosageforms:tablets.NewYork:s.n.,pp.195-246.
Shanmugam,S.,2015.Granulationtechniquesandtechnologies:recentprogresses.BioImpacts,5(1),pp.55-63.
Sheela,N.,Muthu,S.&Krishnan,S.,2010.FTIT,FTRamanandUV-VisbileSpectroscopicAnalysisonMetforminHydrochloride.AsianJournalofChemistry,22(7),pp.5049-5056.
Sheskey,P.J.,Rove,R.C.&Owen,S.C.,2006.HandbookofPharmaceuticalExcipients.Fifthed.London&Washington:PharmaceuticalPress&theAmericanPharmacistsAssociation.
Shono,Y.etal.,2004.ModulationofintestinalP-glycoproteinfunctionbycremophorELandothersurfactantsbyaninvitrodiffusionchambermethodusingtheisolatedratintestinalmembranes.JournalofPharmaceuticalScience,93(4),pp.877-885.
Siewert,M.,Dressman,J.,Brown,C.&Shah,V.,2003.GuidelinestoDissolutioninvitroReleaseTestingofNovel/SpecialDosageforms.AAPSPharmaceuticalScienceTechnology,Volume4,pp.1-10.
Silverstein,R.,Bassler,G.&Morril,T.,1991.Spectrometricidentificationoforganiccompounds.NewYork:Wiley.
Singh,I.&Rana,V.,2013.IronoxideinducedenhancementofmucoadhesivepotentialofEudragitRLPO:formulation,evaluationandoptimisationofmucoadhesivedrugdeliverysystem..Expertopiniondrugdelivery,Volume10,pp.1179-1191.
Singh,S.,Prakash,D.,Srinivasan,K.&Gowthamarajan,K.,2011.Liquisolidcompactsglimepiride:anapproachtoenhancethedissolutionofpoorlywatersolubledrugs.JournalofPharmacyResearch,4(1),pp.2263-2268.
Sinha,D.&Rohera,B.,2002.ComparativeevaluationofrateofhydrationandmatrixerosionofHECandHPCandstudyofdrugreleasefromtheirmatrices.EuropeanJournalofPharmaceuticalScience,16(3),pp.193-199.
Snow,R.,Allen,T.,Ennis,B.&Lister,J.,1997.Principlesofsizeenlargement.In:R.Perry&D.Green,eds.Perry'sChemicalEngineers.NewYork:McGrow-Hill,pp.20-56.
Song,N.,Li,Q.&Liu,C.,2006.IntestinalPermeabilityofMetforminusingsingle-passintestinalperfusioninrats.worldJournalofGastroenterelogy,12(25),pp.4064-4070.
Song,N.-N.,Li,S.-Q.&Liu,C.-X.,2006.Intestinalpermeabilityofmetforminusingsingle-passintestinalperfusioninrats.WorldJournalofGastroenterology,12(25),pp.4064-4070.
Song,R.,2016.MechanismofMetformin:ATaleofTwoSites.DiabetesCare,Volume39,pp.187-189.

227
Spireas,S.&Bolton,S.,1999.Liquisolidsystemsandmethodsofpreparingsame.UnitedStates,PatentNo.6096337.
Spireas,S.&Sadu,S.,1998.EnhancementofPrednisolonedissolutionpropertiesusingliquisolidcompacts.InternationalJournalofPharmaceutics,Volume166,pp.177-188.
Suliman,A.,Anderson,R.&Elkordy,A.,2013.NorfloxacinasamodelhydrophobicdrugwithuniquereleasefromliquisolidformulationspreparedwithPEG200andSynperonicPE/L-61non-volatileliquidvehicles.PowderTechnology,Volume257,pp.156-167.
Summers,1988.In:Pharmaceutics,theScienceofDosageFormDesign.NewYork:ChurchillLivingstone.
Summers,M.&Aulton,M.,2013.Granulation.In:Aulton'sPharmaceutics-Thedesignandmanufactureofmedicines.s.l.:ChurchillLivingstone.
Sun,H.etal.,2008.TheCaco-2cellmonolayer:usefulnessandlimitations.ExpertOpiniononDrugMetabolismandToxicology,4(4),pp.395-328.
Swenson,E.&Curatolo,W.,1992.Meanstoenhancepenetration.AdvancedDrugDeliveryReviews,Volume8,pp.39-92.
Tack-Oon,O.etal.,2013.Preparationofhighlyporousgastroretentivemetformintabletsusingasublimationmethod.EuropeanJournalofPharmaceuticsandBiopharmaceutics,Volume83,pp.460-467.
Tayel,S.,Soliman,L.&Louis,D.,2008.ImprovementofdissolutionpropertiesofCarbamazepinethroughapplicationoftheliquisolidtablettechnique.EuropeanJournalofPharmaceuticsandBiopharmaceutics,Volume69,pp.342-347.
Taylor,K.,2013.In:Aulton'sPharmaceutics-Thedesignandmanufactureofmedicines.s.l.:ChurchillLivingstone.
Thakkar,H.,Senthil,A.&Narayana,S.,2011.Formulationandevaluationofmouthdissolvingtabletsofondansertonhydrochloride.Pharmacologyonline,Volume2,pp.622-632.
Tiong,N.&Elkordy,A.,2009.Effectsofliquisolidformulationsondissolutionofnaproxen.EuropeanJournalofPharmaceuticsandBiopharmaceutics,Volume73,pp.373-384.
Tzankova,V.etal.,2011.Precision-CutSlicesasaToolforStudyingPhaseIIDrugMetabolisminRatSmallIntestineinVitro.pharmaceuticalBiotechnology,25(1),pp.2279-2283.
Usui,F.etal.,1997.Inhibitoryeffectofwater-solublepolymersonprecipitationofRS-8359.InternationalJournalofPharmaceutics,Volume154,pp.59-66.
VanDenDries,K.&Vromas,H.,2003.Experimentalandmodelisticapproachtoexplaingranuleinhomogeneitythroughpreferentialgrowth.Eur.J.Pharm.Sci.,Volume20,pp.409-417.

228
Varshosaz,J.,Talari,R.,Mostafavi,S.&Nokhodchi,A.,2008.DissolutionenhancementofGliclazideusinginsitumicronizationbysolventchangemethod.PowderTechnology,Volume187,pp.222-230.
Wadher,K.,Kakde,R.&Umekar,M.,2011.FormulationofsustainedreleaseMetforminHydrochlorideMatrixtablets:InfluenceofhydrophilicpolymersonthereleaserateandInVitroevaluation.InternationalJournalofResearchinControlledRelease,1(1),pp.9-16.
Wan,L.,Heng,P.&Wong,L.,1991.Theeffectofhydroxypropylmethylcelluloseonwaterpenetrationintoamatrixsystem.InternationalJournalofPharmaceutics,Volume73,pp.111-116.
Weiner,N.,1985.Norepinephrine,epinephrine,andthesympathomimeticamines.In:GoodmanandGilman’sthePharmacologicalBasisofTherapeutics.NewYork:MacmillanPublishingCompany,p.173.
Wong,S.,Kellaway,I.&Murdan,S.,2006.Enhancementofthedissolutionrateandoralabsorptionofapoorlywatersolubledrugbyformationofsurfactant-containingmicroparticles.InternationalJournalofPharmaceutics,Volume317,pp.61-68.
Yadav,V.&Yadav,A.,2009.ImprovementofSolubilityandDissolutionofIndomethacinbyLiquisolidandCompactionGranulationTechnique.JournalofPharmaceuticalScienceandresearch,Volume2,pp.44-51.
Yadav,V.&Yadav,A.,2010.EnhancementofSolubilityandDissolutionrateofBCSclassIIpharmaceuticalsbynonaquiousgranulationtechnique.InternationalJournalofpharmaResearchandDevelopment,pp.1-12.
York,P.,2013.Designofdosageforms.In:M.Aulton,ed.Pharmaceutics:TheScienceofdosageformdesign.s.l.:ChurchillLivingstone.
Zakeri-Milania,P.etal.,2007.PredictingHumanIntestinalPermeabilityusingSingle-passIntestinalPerfusioninrat.JournalofPharmacyandPharmaceuticalScience,10(3),pp.368-379.

229
Appendix
Chapter 3
Statistics results for glibenclamide release from granulated liquisolid preparations
Time(min) %releaseConventional %releaseofgranulatedGlib10%PEG %releaseofgranulatedGlib30%PEG0 0 0 05 5.698867899 10.44169296 5.29145444310 9.704406847 12.74716213 2.09614538115 9.162517902 13.91162574 3.10916179320 10.81741395 15.85633014 0.11125 13.23610574 16.18977161 2.29139156130 13.07318623 15.87783337 1.04225617845 13.37929179 17.23284525 6.00421304260 14.30175252 19.96671039 7.62560523290 14.28095345 21.3437423 7.14204867
TTest 0.004351204 0.001448477 0.001448477%releaseConventional %releaseofgranulatedGlib10%PEG %releaseofgranulatedGlib30%PEG
vs vs vs%releaseofgranulatedGlib30% %releaseofgranulatedGlib30% %releaseofgranulatedGlib30%Cremophorwithexcessavicel Cremophorwithexcessavicel Cremophorwithexcessavicel

230
%releaseofgranulatedGlib30%Synperonic %releaseofgranulatedGlib30%Cremophorwithexcessavicel0 0
6.51700323 08.391751478 50.1610923811.4528666 45.4467898513.88518877 46.0718994113.42027191 52.3317280715.17024265 52.9307495814.44746957 58.0849474215.1698552 61.6711611212.411985550.005396878 0.026005073
%releaseofgranulatedGlib30%Synperonic %releaseofgranulatedGlib30%Cremophorwithexcessavicelvs vs
%releaseofgranulatedGlib30%Cremophor %releaseofgranulatedGlib10%synperonicwithexcessavicel
%releaseofgranulatedGlib10%synperonic %releaseofgranulatedGlib10%Cremophorwithexcessavicel0 0
12.71988243 3.98884140918.0747401 10.9468779720.10604626 33.52647421.24673841 45.9840944823.46577155 54.1828129423.2550223 52.5747959825.17967281 51.1027421523.45457365 54.3120012422.63262514 54.103107680.026005073 0.336853453
%releaseofgranulatedGlib10%synperonic %releaseofgranulatedGlib10%Cremophorwithexcessavicelvs vs
%releaseofgranulatedGlib30%Cremophor %releaseofgranulatedGlib30%Cremophorwithexcessavicelwithexcessavicel

231
DSC thermograms of G1-G6 as liquisolid powder and liquisolid granules. Pure
Glibenclamide, market Glibenclamide, Conventional Glibenclamide as well as
nonvolatile liquid vehicles (PEG®400, Synperonic® PE/L44, Cremophor®ELP) and
excipients such as Avicel® PH102, Cab-O-Sil® M-5, potato starch, Mg stearate and
PVP.
G1G1(ungranulated)
G2G2(ungranulated)

232
G3G3(ungranulated)
G4G4(ungranulated)
G5G5(ungranulated)
G6G6(ungranulated)

233
Pure Glibenclamide Conventional Glibenclamide
Market Glibenclamide Avicel PH102
Potato starch PVP

234
Magnesium Stearate Silica

235
Chapter 4
PEG30% PEG60%Synperonic 30% Synperonic 60% Cremophor 30% Cremophor 60% Pure Metformin
0.865 1.246 0.497 0.605 0.624 1.069 0.3070.973 1.119 0.51 0.675 0.713 0.897 0.2940.999 1.094 0.6117 0.935 0.739 0.745 0.3241.018 1.075 0.73 0.992 0.777 0.77 0.3541.024 1.113 0.84 1.005 0.777 0.953 0.3621.1 1.132 0.938 1.081 0.802 1.43 0.481
1.176 1.214 1.119 1.145 0.859 1.519 0.5741.329 1.341 1.305 1.462 0.973 1.722 0.6711.951 1.456 1.648 1.709 1.157 1.792 0.8492.636 1.614 1.199 2.027 1.411 2.211 0.933
Significance(Pvalue) versusPuremetformin 5.75211E-18 5.6096E-07 0.008418363 0.001222167 0.002606373 0.000550413
amountpenetratedin14ml12.11 17.444 6.958 8.47 8.736 14.966 4.29813.622 15.666 7.14 9.45 9.982 12.558 4.11613.986 15.316 8.5638 13.09 10.346 10.43 4.53614.252 15.05 10.22 13.888 10.878 10.78 4.95614.336 15.582 11.76 14.07 10.878 13.342 5.06815.4 15.848 13.132 15.134 11.228 20.02 6.734
16.464 16.996 15.666 16.03 12.026 21.266 8.03618.606 18.774 18.27 20.468 13.622 24.108 9.39427.314 20.384 23.072 23.926 16.198 25.088 11.88636.904 22.596 16.786 28.378 19.754 30.954 13.062
%penetrated Time (min) PEG30% PEG60%Synperonic 30% Synperonic 60% Cremophor 30% Cremophor 60% Pure Metformin
5 0.6055 0.8722 0.3479 0.4235 0.4368 0.7483 0.214910 0.6811 0.7833 0.357 0.4725 0.4991 0.6279 0.205815 0.6993 0.7658 0.42819 0.6545 0.5173 0.5215 0.226820 0.7126 0.7525 0.511 0.6944 0.5439 0.539 0.247825 0.7168 0.7791 0.588 0.7035 0.5439 0.6671 0.253430 0.77 0.7924 0.6566 0.7567 0.5614 1.001 0.336745 0.8232 0.8498 0.7833 0.8015 0.6013 1.0633 0.401860 0.9303 0.9387 0.9135 1.0234 0.6811 1.2054 0.469790 1.3657 1.0192 1.1536 1.1963 0.8099 1.2544 0.5943
120 1.8452 1.1298 0.8393 1.4189 0.9877 1.5477 0.6531
PEG30% PEG60%Synperonic 30% Synperonic 60% Cremophor 30% Cremophor 60%
Fold Time (min)Increase 5 2.817589577 4.058631922 1.618892508 1.970684039 2.03257329 3.482084691
10 3.30952381 3.806122449 1.734693878 2.295918367 2.425170068 3.05102040815 3.083333333 3.37654321 1.887962963 2.885802469 2.280864198 2.29938271620 2.875706215 3.036723164 2.062146893 2.802259887 2.194915254 2.17514124325 2.828729282 3.074585635 2.320441989 2.776243094 2.14640884 2.63259668530 2.286902287 2.353430353 1.95010395 2.247401247 1.667359667 2.97297297345 2.048780488 2.114982578 1.949477352 1.994773519 1.496515679 2.64634146360 1.980625931 1.998509687 1.94485842 2.178837556 1.450074516 2.56631892790 2.297997644 1.714958775 1.941107185 2.012956419 1.362779741 2.110718492
120 2.825294748 1.729903537 1.285101822 2.172561629 1.512325831 2.36977492
3fold 2fold 2-3foldPEG Synperonic Cremophor
Appendix for Chapter 4
Statistics results for permeability study of metformin using stomach tissue and Franz cell

236
Purchased animal tissue (ethical exemption)
Dear Hoda Please include the forwarded e mails in the thesis's appendix. Best wishes Amal ________________________________________ From: Amal Elkordy Sent: 20 April 2016 16:48 To: Kimberley Moore Subject: FW: FW: Hoda Javaheri Hi Kimberley I have forwarded Etta' email, we will not need ethical approval. Many thanks Amal ________________________________ From: Etta Evans [[email protected]] Sent: 20 April 2016 16:43 To: Amal Elkordy Subject: Re: FW: Hoda Javaheri I think that you would not need ethics approval if you purchase "dead" animal tissue. Kind regards, Etta On 20/04/2016 16:38, Amal Elkordy wrote: Many thanks Etta for your reply Also, if we are going to buy animal tissue from a company, do we need ethical approval? Many thanks Amal ________________________________ From: Etta Evans [[email protected]<mailto:[email protected]>] Sent: 20 April 2016 16:32 To: Amal Elkordy Subject: Re: FW: Hoda Javaheri Hello Amal, Michelle asked me a question regarding animal tissue and ethics approval but she did not provide any context ..... Cutting things short, obviously you do not need ethics approval for research on animal tissue purchased at a local butcher's shop.

237
Sorry for the confusion! Kind regards, Etta -- Dr Etta Evans Chair of the University Research Ethics Committee Senior Lecturer in Psychology University of Sunderland David Goldman Informatics Centre St. Peter's Campus Sunderland, SR6 0DD Phone: ++44 (0)191 515 2624

238
Chapter 5
Test of Homogeneity of Variances
Drug release
Levene Statistic df1 df2 Sig.
.393 6 98 .882
ANOVA
Drug release
Sum of
Squares df Mean
Square F Sig.
Between Groups
1321.609 6 220.268 .237 .964
Within Groups 91242.124 98 931.042
Total 92563.733 104

239
Post Hoc Tests
For metformin HPC formulations’ compositions refer
to Table 2.3
Multiple Comparisons
Dependent Variable: drug release
Scheffe
(I) formula (J) formula
Mean Difference (I-
J) Std. Error Sig.
95% Confidence Interval
Lower Bound Upper Bound
HPC1 HPC2 1.82376 11.14177 1.000 -38.5874 42.2349
HPC3 .08757 11.14177 1.000 -40.3236 40.4987
HPC4 -5.22088 11.14177 1.000 -45.6320 35.1903
HPC5 -8.72320 11.14177 .996 -49.1343 31.6880
HPC6 -5.48649 11.14177 1.000 -45.8976 34.9247
conventional HPC
-4.61883 11.14177 1.000 -45.0300 35.7923
HPC2 HPC1 -1.82376 11.14177 1.000 -42.2349 38.5874
HPC3 -1.73619 11.14177 1.000 -42.1473 38.6750
HPC4 -7.04464 11.14177 .999 -47.4558 33.3665
HPC5 -10.54696 11.14177 .989 -50.9581 29.8642
HPC6 -7.31025 11.14177 .999 -47.7214 33.1009

240
conventional HPC
-6.44260 11.14177 .999 -46.8537 33.9686
HPC3 HPC1 -.08757 11.14177 1.000 -40.4987 40.3236
HPC2 1.73619 11.14177 1.000 -38.6750 42.1473
HPC4 -5.30844 11.14177 1.000 -45.7196 35.1027
HPC5 -8.81077 11.14177 .996 -49.2219 31.6004
HPC6 -5.57406 11.14177 1.000 -45.9852 34.8371
conventional HPC
-4.70640 11.14177 1.000 -45.1176 35.7047
HPC4 HPC1 5.22088 11.14177 1.000 -35.1903 45.6320
HPC2 7.04464 11.14177 .999 -33.3665 47.4558
HPC3 5.30844 11.14177 1.000 -35.1027 45.7196
HPC5 -3.50232 11.14177 1.000 -43.9135 36.9088
HPC6 -.26561 11.14177 1.000 -40.6768 40.1455
conventional HPC
.60204 11.14177 1.000 -39.8091 41.0132
HPC5 HPC1 8.72320 11.14177 .996 -31.6880 49.1343
HPC2 10.54696 11.14177 .989 -29.8642 50.9581
HPC3 8.81077 11.14177 .996 -31.6004 49.2219
HPC4 3.50232 11.14177 1.000 -36.9088 43.9135
HPC6 3.23671 11.14177 1.000 -37.1744 43.6479
conventional HPC
4.10436 11.14177 1.000 -36.3068 44.5155
HPC6 HPC1 5.48649 11.14177 1.000 -34.9247 45.8976
HPC2 7.31025 11.14177 .999 -33.1009 47.7214

241
HPC3 5.57406 11.14177 1.000 -34.8371 45.9852
HPC4 .26561 11.14177 1.000 -40.1455 40.6768
HPC5 -3.23671 11.14177 1.000 -43.6479 37.1744
conventional HPC
.86765 11.14177 1.000 -39.5435 41.2788
conventional HPC
HPC1 4.61883 11.14177 1.000 -35.7923 45.0300
HPC2 6.44260 11.14177 .999 -33.9686 46.8537
HPC3 4.70640 11.14177 1.000 -35.7047 45.1176
HPC4 -.60204 11.14177 1.000 -41.0132 39.8091
HPC5 -4.10436 11.14177 1.000 -44.5155 36.3068
HPC6 -.86765 11.14177 1.000 -41.2788 39.5435
Homogeneous Subsets
Drug release
Scheffea

242
formula N
Subset for alpha = 0.05
1
HPC2 15 34.9292
HPC3 15 36.6654
HPC1 15 36.7530
conventional HPC
15 41.3718
HPC4 15 41.9739
HPC6 15 42.2395
HPC5 15 45.4762
Sig. .989

243
Release Kinetics for HPC metformin liquisolid formulations

244

245

246

247

248