
jaer! - m neandc(j) 149/u - 90-025 - IAEA-NDS
425
JAER! - M NEANDC(J) 149/U INDC(JPN)136/L 90-025 PROCEED!NGS OF THE ! 989 SEMtNAR ON NUCLEAR DATA February 1990 (Eds.) Yutaka NAKAJiMA and Masayuki IGASHIRA* B*;5^379faiyr Japan Atomic Energy Research institute
-
Upload
khangminh22 -
Category
Documents
-
view
1 -
download
0
Transcript of jaer! - m neandc(j) 149/u - 90-025 - IAEA-NDS

JAER! - M NEANDC(J) 149/U INDC(JPN)136/L
90-025
PROCEED!NGS OF THE ! 989 SEMtNAR ON NUCLEAR DATA
February 1990
(Eds.) Yutaka NAKAJiMA and Masayuki IGASHIRA*
B * ; 5 ^ 3 7 9 f a i y r Japan Atomic Energy Research institute

K f-'-nf^ith^li. u 4;IS f-^W-fciOrfSMr'iffiSGffi&iS^ (=F319-11 ;Vc*$mi«;j»Ifin*:
Mth h-Z, Utyl z. I < / . ' ? t> , £i>\ ^ u a - U R t l f l j i - M S j'-tii'.ift&ii.ffl-t^ ? - -
T.'-i19 11 *JrfcW-«:J« * * T 1H £'S< )'• Wft"»i IS i -r HiV-I: <fc & '£ ft «i ft * ii ^ ^ - - T
an it.
JAERI-M reports are issued irregularly.
Inquiries about availability of the reports should be addressed to Information Division
Department of Technical Information, Japan Atomic Rnergy Research Institute, Tokai-
mura, Naka-gun, Ibaraki-ken 319-11, Japan.
©Japan Atomic Knergy Ki'srarrh Institute, 1990
I'u m >•> ix t> b I'fl w m

JAERI-M 90-025
Proceedings of the 1989 Seminar on Nuclear Data
(Eds.) Yutaka NAKAJIMA and Masayuki IGASHIRA*
Japanese Nuclear Data Comittee
Tokai Research Establishment
Japan Atomic Energy Research I n s t i t u t e
Tokai-mura, Naka-gun, Ibaraki-ken
(Received January 31 , 1990)
The 1989 Seminar no Nuclear Data was held at Tokai Research
Establishment of Japan Atomic Energy Research I n s t i t u t e , on November 16
and 17, 1989. This Seminar was organized by Japanese Nuclear Data
Comittee (JNDC) and Nuclear Data Center, JAERI. In an ora l s e s s ion ,
review and benchmark t e s t s of JENDL-3 were presented , which were followed
by l i v e l y d i scuss ion . Data need of other nuclear da ta than neutron i n
duced reac t ion data were a lso presented . In add i t ion , severa l t op i ca l
t a l k s were given. In a poster se s s ion , twenty papers on evaluat ion and
measurement was presented and f r u i t f u l d iscuss ions were made. In t h i s
proceedings, t h i r t y - f o u r papers given in the seminar are compiled.
Keywords: Nuclear Data, Benchmark Test , JENDL, Evaluat ion,
Measurement, Proceedings
* Tokyo I n s t i t u t e of Technology
i

JAERI-M 90-025
Program Comi t tee
Masayuki IGASHIRA (Chairman)
Kazuki HIDA
Yujiro IKEDA
Tomohiko IWASAKI
Norio KISHIDA
Tsuneo NAKAGAWA
Yutaka NAKAJIMA
Koji OISHI
Keiichi SHIBATA
Masayoshi SUGIMOTO
Junji YAMAMOTO
(Tokyo Institute of Technology)
(Toshiba Corporation)
(Japan Atomic Energy Research Institute)
(Tohoku University)
(Century Research Center Corporation)
(Japan Atomic Energy Research Institute)
(Japan Atomic Energy Research Institute)
(Shimizu Corporation)
(Japan Atomic Energy Research Institute)
(Japan Atomic Energy Research Institute)
(Osaka University)

JAERI-M 90-025
1989$8£f-*0f3££|8£H
(1990^1 ft 31 BSfi)
1989 %-1%-T-9 Officii, 1989^11^ 16 B i 17 Bfflj^B, B # 1 1 ? t}fflntfi^mffiftpfi
tzb<Dr-&&o J E N D L - 3 © | t ^ W ^ t ^ - i ^ y f - - 7 - ^ - f x h©SS^'Stf-£tl , Slgftf-t
Ira^ft)tl/;o tftt-f-A#tJi(^OSf- ^©S*(Co^TfefS/t-$tl/c0 £ &K, h fc°-y ? xft
tt»Stfctt3ftfc«, #*?- fg*T( ;£ , 9Fffi*iM3ElciR|t-5 20#OfB&*<*f3, £ f t £ t i t t £
7°D ?*v A $ M ^
# s l
E H
ft£ (1
M
^ffl^g-g|3
g i t
i^ffl
*JH
* 6
* E
mm fe* O J *
eg IU4
Sffit
SSI
j i -
1 S
Ste
ias) (<«o ms) (B*m=?timfim)
( * * £ » («c) )
m#SW5£BFf : T319-11 ^«!!S3i5Ii1i^iiSWa^?affi2-4

JAERI-M 90-025
Con ten t s
1. Program of the 1989 Seminar on Nuclear Data 1
2. Papers Presented in Oral Session 3
2.1 Review of JENDL-3 3
2.1.1 On Accomplishment of JENDL-3 3
Sin-iti IGARASI
2 . 1 . 2 Thermal R e a c t o r Benchmark Tes t of JENDL-3 5
Shungo IIJIMA
2 . 1 . 3 Review of JENDL-3 Data from Viewpoint f o r FBR
Benchmark T e s t s 29
Yasuyuki KIKUCHI
2 . 1 . 4 JENDL-3 FP Data F i l e 53
T. WATANABE, M. KAWAI, S. IIJIMA, H. MATSUNOBU,
T. NAKAGAWA, Y. NAKAJIMA, T. SUGI, M. SASAKI
and A. ZUKERAN
2 . 1 . 5 Benchmark T e s t f o r Fus ion Reac to r 69
Hiroshi MAEKAWA
2.1.6 Shielding Benchmark Test of JENDL-3 88
M. KAWAI, A. HASEGAWA, K. UEKI, N. YAMANO, K.SASAKI,
Y. MATSUMOTO, M. TAKEMURA, N. OHTANI, H. TSUNODA,
K. SAKURAI, Y. ITOH, M. UEMATSU and Y. OKA
2.1.7 Benchmark Test of JENDL-3 Dosimetry File 103
Masaharu NAKAZAWA and JNDC Dosimetry Subworking
Group
2.2 Topics (I) 115
2.2.1 The Optical Potential for Neutrons and Charged
Particles 115
Takaaki OSAWA
2.2.2 Current Topics in Nuclear Fission Research ,. 137
Akira IWAMOTO
2.2.3 Topics at the NEANDC Specialists' Meeting on Neutron
Activation Cross Sections for Fission and Fusion
Energy Applications 148
Yujiro IKEDA
2.2.4 Review of Nuclear Data Required for Nuclear
Transmutation Systems of Long-Lived Radioactive Waste
Utilizing Particle Accelerators 156
Norio KISHIDA
V

JAERI-M 90-025
2.3 Various Nuclear Data 167
2.3.1 Status of the Demand for Charged Particle Nuclear Data. 167
Hiroyuki MATSUNOBU
2.3.2 Compilation of Charged Particle Nuclear Reaction
Database and Database Conversion for International
Coordination 169
Masaki CHIBA
2.4 Topics (II) 179
2.4.1 Development Plan in JAERI for High Intensity Proton
Linear Accelerator 179
M. MIZUMOTO, M. SUGIMOTO, Y. OKUMURA, H. SHIRAKATA,
T. NISHIDA, H. TAKADA, I. KANNO, H. YASUDA,
Y. NAKAHARA, T. TAKIZUKA and Y. KANEKO
3. Papers Presented in Poster Session 189
3.1 Automation of Neutron Scattering Measurements at JAERI
TANDEM 189
Masayoshi SUGIMOTO
3.2 Nuclear Data of Charged-Particle Induced Reactions on
Light Nuclei 208
N. KOORI, Y. WATANABE, M. ERIGUCHI, M. HYAKUTAKE,
Y. WAKUTA and I. KUMABE
3.3 Nuclear Data of Charged-Particle Induced Reactions on
Medium-Heavy Nuclei 216
Yukinobu WATANABE, Norihiko KOORI, Mikio HYAKUTAKE
and Isao KUMABE
3.4 Measurement of Helium Production Cross Section of Aluminum
Irradiated by Proton 226
Y. TAKAO, Y. KANDA, S. ITADANI, T. TAKAHASHI,
H. EIFUKU, M. MORINAGA and A. IWASAKI
3.5 Technological Problem in Development of an Advanced
Support System for Nuclear Data Evaluation 233
Shin IWASAKI and Kazusuke SUGIYAMA
3.6 Estimation of Reaction Model Parameters by Experimental
Data and Statistical Technique 241
Toshihiko KAWANO, Yukinori KANDA and Yuji UENOHARA
3.7 Measurement of Formation Cross Sections for Short-Lived
Nuclei Produced by 14 MeV Neutrons (III) 251
T. YAMADA, A. OSA, M. SHIBATA, K. KAWADE,
H. YAMAMOTO, T. KATOH, T. IIDA and A. TAKAHASHI
vi
JAERI-M 90-025
3.8 Measurement of Production Cross Sections of Short-Lived
Nuclei by Cyclic Activation Using a Pulsed Neutron Source. 259
J. YAMAMOTO, J. DATEMICHI, T. KANAOKA,
T. TAKAYAMA, A. TAKAHASHI and K. SUMITA
3.9 Secondary Charged Particle Spectrometer Based on
Two-Dimensional E-TOF Analysis 268
Seiji OGINO and Akito TAKAHASHI
3.10 Average Cross Section Measurement for Several Dosimetry
Reactions in Thick Target Li(d,n) Neutron Field 277
J.R. DUMAIS, S. TANAKA, N. ODANO, S. IWASAKI
and K. SUGIYAMA
3.11 The Measurement of Leakage Neutron Sepctra from Various
Sphere Piles with 14 MeV Neutrons - Al, Mo and W - 284
C. ICHIHARA, S. A. HAYASHI, K. KOBAYASHI, I. KIMURA,
J. YAMAMOTO and A. TAKAHASHI
3.12 Comparison of Calculated Shielding Properties by
JENDL-3 with Those by ENDF/B-IV 295
Koichi MAKI, Kazuaki KOSAKO, Hiroshi MAEKAWA,
and Yasushi SEKI
3.13 Analysis of Neutron Benchmark Experiments to Evaluate
the JENDL-3 by the Continuous Energy Monte Carlo Code ... 313
Kotaro UEKI, Kiyoshi SAKURAI and Masayoshi KAWAI
3.14 Development of the JENDL Special Purpose Data File
for PKA Spectra, DPA Cross Sections and Kerma Factors ... 329
Shungo IIJIMA and Masayoshi KAWAI
3.15 TRU Transmutation with High Energy Proton Beam 343
T. NISHIDA, H. TAKADA, I. KANNO, T. TAKIZUKA,
M. MIZUMOTO, Y. NAKAHARA and Y. KANEKO
3.16 Proton Induced Spallation Reaction Calculation Considering
the Intranuclear High-Momentum Nucleons and the
Preequilibrium Effect 362
K. ISHIBASHI, Y. MIURA, T. SAKAE, Y. MATSUMOTO,
Y. WATANABE, A. KATASE, H. TAKADA, T. NISHIDA,
Y. NAKAHARA and Y. KANEKO
3.17 Measurement of the U-238 Capture Cross Section with
Neutron Filtered Beams 374
Katsuhei KOBAYASHI, Shuji YAMAMOTO and
Yoshiaki FUJITA
VII

JAER1-M 90-025
3 .18 A p p l i c a t i o n of Pos t A c c e l e r a t i o n Beam Chopper for
Neut ron Emiss ion Cross S e c t i o n Measurements 383
M. BABA, S. MATSUYAMA, M. FUJISAWA, T. IWASAKI,
S. IWASAKI and R. SAKAMOTO
3.19 Neutron Cross S e c t i o n C a l c u l a t i o n for 5 6 Fe and 2 3 5 U in
the up to 50 MeV Energy Range 393
Kazuki HIDA and Shungo IIJIMA
3.20 One Group A c t i n i d e Cross S e c t i o n Set Based on JENDL-3 and
C a l c u l a t i o n of 2U P r o d u c t i o n i n Light Water R e a c t o r s . . 403
F u j i h i r o MASUKAWA, Tsuneo NAKAGAWA and Shungo IIJIMA
VIII

JAER1-M 90-02:")
<k
1. 1989i|- ;H'-r- V<ii'-y u '/ v A
2. I l i / r t f t ^ *
2. 1 JKNDL- SoOifer'ii'l'J^ f .-L -
2. 1. i JENDL 3 '/L;iA<ft!;1,-
li. 1-i.hif,; •
2.1.2 JFA'DL :^'-'Mi|i'M. j'-ti'-^ > -f- v •• '' -;• x |
2.1.3 F B R - w - r ^ '' '• x | - o /'.iyA^', OJEXDL :j r - v . j L - t ,
2. 1.1 F l ' r v v , i- a
/MI M, Miff i m ffltfl ft?,",, &*£ 'ft'}'.
il'iii i,lf3L ipi;,', :!!!, f; ir.|U;. K : A ^ A.
2. l.f) B( rail! ,'Y *'"'-- > + - - ' - ' T x |
liuiil ,T-
2. I.fi JENDL 3 i£ iK^> f v - ' / f x l
HI ft w-ffi. i-Hfii! mi. tti.mjxW, iim v w . Vi'tWMft. & * .rt'JL 1W '-rii. A;tt « R ,
ffjin fl.fii. Kir- iv, (i'si & $ . i-.te * t^ .
2.1.7 JEXDL • 3 K y << I- 'I - v ,• •( i « - \ > + x - •? f x 1 1
'|l£'i iLtfi. ' > ' / " x ^ i i i K v : / M l " * 7 ' V - + > 7 ' / ) | , - 7
2 . 2 1- t ••/ ') x ( I l 1
2.2.1 i|if'|; flk'JtiWiVi. j ' W ) t ? - + ^ > •> i- <u 1
A; ft £"JI
2.2.2 H'vyy'UlDfflPftijVijiiW I- t ••, ? x 1
2. 2. 3 NEANDC'I't'l: j'W/fLlflnfiiMlcl&l-f 3 ^ H ' s i ^ t : < / J I- t v ? x 1
rtklilto '.Cli
2.2.4 i jN^^^i l J t ' / : I i / f 1 i i ' i lA^t ' l :^^^ j«^^^> x f / , i ; ^ f i - i
rm N'i'i-
2.3 ttf'T(«f£x- ? 1
IX

JAERI-M 90-025
2.3. i flr.iiM mr- 9\j;mo)mK &*£ IS $
2.3.2 f^.l i?' 'n'H'i>ii i:^"- J " ^ - - ^w f i ^ j Jc i l i i JB i t i ^ j f j ^ y^ j
x-- ? -< - x£$5
4 h t ••, 1 XlUl
2.4. l m\\0) k'&mVif 'J - r - y ^!!9«„hiiii
* * ;i:tf?. t ; £ . " ,$ . 'SH JStfll. I'Iff' 'JA*.
i«-illl l i r l " , •'.•;,|lI <JA, Wilt fj|iJ., v^m #.J:.,
' I • »iji tklU], ^ i'ifll. £ I' ^15
i i!;iiii|-y > f A i ; t i t ^ ' l ' t t : i'K,r;L)i{i|'*iiWf'l#fl:
2 'li'mwf^lif./: j'ffc-r - ^ wiiii)u:
m\ w$. •i&su w;, <\y\'\\ A, \'\K mt fiixin^'/.. J M in
mm in,;, *w fiiis. 1'iift #$ . PM; J4 4 PU )'(cJ;/,AIWHe'!-ij)i;Ir[fiifuii|il^
l(gid I 5 a . Win WW. fti?f 'TUt. rifS I*,
/Khii $ & . & * visivj. ftitos BHffi 5 H - r - ?rt'ia;,HMillii:^S-> ^•fA)){:j^ici;lt-5>ti"fW'JlM)g!
rtfcl f.f. fill 11 -!«!
r-JS-'f ffeig, Will fcH'J, M^lsi i i l ".
7 14 MeVif't'l; j ' - f -^S^^^^ ' l - i ^ i r r i f i iWwiSi i^ i ra)
ililil Rj, W 'Vji?, %lll FiUK i"J,'li iVi.
i l l* tf. W l SfcBli. Kill Wtt, rtffi v'iA
8 ^^Xi|i'|"i; j ' iS^JIIW: Cyclic activation IC J: Sfe/ #ffrJMML
iflflifn©ili'j£
illb mti. IfiilXi ?•?-, feltf ift.£. .:'iili '!* -.
.ftfiS i'tA. fl-illl fil " 9 E-TOF ".tfOi^HfricJ;?. • . W M l ' ^ n u / - ?
Hi'3f MMI, rt'fi§ -jiA
X

JAER5-M 90-025
3.10 Li + dRlfc4"Jtt?i#Kfctt-5£-T-ffl V's* MJJxlSOffcJ
M'NkifffiflffliJS 277
J.R.DUMAIS, BB+ B&, 'hfflffiDfc,
¥flli$ ft, fill! - f t
3.11 M M e V ' t ' t t f l c . t S ^ f f J ^ M ^ ^ b f f l J i r S ^ f t f ^ ^ ^ ^
©f f l l ^ -Al iMo, W- 284
miS m # « ¥ . 'M* » 4 S * t t iftfiH.
iJj^; •/¥?£, ffiffi ISA
3.12 JENDL-3<! :ENDF/B-IV*f f l^ fc l i^Ot t f t^*pJ te3 tWfemoJ t« 295
* * t t - 'jve ftm HUJII m, m m
3. 13 JENDL-3IFf f i©fcJ60 i i ^x^yu+" -*yxy7v i /D3- K
f t ^ M ' t t ^aiH3ii3l«©D¥#r 313
ffi*«£*aj, &# **, JUS t?a 3.14 P K A x ^ ? h;u£DPA$T[gft, KERMA7 y ? ? - f f l / ; J60
JENDL#f tFW7 y -f ;u©§il^ 329
it a #g. JH£ « 3.15 rSjX^;i/+*-|®-f(C«fc5TRUfe^g| 343
iTSFH tt/f, fliffl &. ?*If t&£, f t * ftftl,
* * JC^J, *»?; mm. # f * f
3. 16 i85J I i&*Rr t« i f& t f i i i f ^» r iSg£# l iL fcR§ ' f IC tSxsHf -
•> a >fcfc<DUW 362
£ffi «.r.. i£/S 4 e . % ft-, te* fig,
i82 3MI. fri5 S3, EBl ft. SB] Jgjf,
r is mm, &/- n/f 3.17 i f ' t t j '7 - r / i / * - t -A£f f l^ fcU-238©ff iSt fPW©ff lJ£ 374
'h# » # , iii* « - , M xsi 3.18 * x h-f-3 •y^°-©4it'tfSicdi»rifi«?Ri|S^©C5ffl 383
,1*1 m, teiii fiRH, B f t »»] , S « S i f .
S«S f t , « # K H ]
3.19 50MeV#-t r f f l 5 6 Fei 2 3 8 U©*tt f iTE«©,f t* 393
rm file, ®a «g 3.20 J E N D L - 3 ( t « o V / c T ? f - / -f KC-lffnSft-te •? h i
$l7K^T'©232U4l/Slt©am 403
tl'JII £ # . #il l « , £ 0 {££
XI

JAERI-M 90-025
1. Program of the 1989 Seminar on Nuctear Data
November 16(Thuirsday) Speaker
1. Opening Address 11:00 - 11:05 N.Shikazono(JAERI)
2. Review of JENDL-3 (1-1) Chairman:A. Zukeran(Hitachi)
11:05 - 11:15 On Accomplishment of JENDL-3 S.Igarasi(NEDAC) 11:15 - 12:00 Thermal Reactor Benchmark Test of JENDL-3
S.Iijina(Toshiba)
12:00 - 13:10 Lunch
3. Review of JENDL-3(I-2) Chairman:A. Zukeran(Hitachi)
13:10 - 13:55 Review of JENDL-3 Data from Viewpoint of FBR Benchmark Test Y.Kikuchi(JAERI)
13:55 - 14:25 JENDL-3 FP Pile T.Watanabe(KM)
14:25 - 14:40 Coffee Break
4. Review of JENDL-3(II) Chairman:Y. Kanda(Kyushu Univ.)
14:40 - 15:25 Benchmark Test for Fusion Reactor H.Maekawa(JAERI) 15:25 - 16:10 Shielding Benchmark Test of JENDL-3 M.Kawai(Ioshiba) 16:10 - 16:40 Benchmark Test of JENDL-3 Dosimetry File M.NakazawaHJniv. of Tokyo)
5. Topics(I) Chairman:H.Kitazawa(Tokyo Inst, of Technol.) 16:40 - 17:25 The Optical Potential for Neutrons and Charged Particles
T.0sawa(Kinki Univ.)
18:00 - 20:00 Reception(at Akogigaura club)
- 1 -

JAER!-M 90-025
November 17(Friday) Speaker
6. Poster Session 9:00 - 10:30 (20 papers were presented)
7. Topics(II) Chairnan:LKioura(Kycto Univ.) 10:30 - 11:15 Current Topics in Nuclear Fission Research A.Iwaaoto(JAERI) 11:15 - 12:00 Topics at the NEANDC Specialists' Meeting on Neutron Activation Cross
Sections for Fission and Fusion Energy Applications Y.Ikeda(JAERI)
12:00 - 13:10 Lunch
8. Other Nuclear Data than Neutron Induced Reaction Data Chairman:N.YanaHuro(Data Eng. Inc.)
13:10 - 13:55 Review of Nuclear Data Required for Nuclear Transmutation Systems of Long-Lived Radioactive Waste Utilizing Particle Accelerators
N.Kishida(CRC) 13:55 - 14:40 Status of the Demand for Charged Particle Nuclear Data
H.Matsunobu(SAEI) 14:40 - 15:20 Compilation of Charged Particle Nuclear Reaction Database and
Database Conversion for International Coordination H.Chiba(Hokkaido Univ.)
15:20 - 15:35 Coffee Break
9. Topics(III) Chairnan:M.Baba(Tohoku Univ.) 15:35 - 16:20 Development Plan in JAERI for High Intensity Proton Linear Accelerator
M.Mizu)Mto(JAERI)
10. Closing Address 16:20 - 16:25 T.Katoh(Nagoya Univ.)
- 2 -

JAERI-M 90-025
2. Papers Presented in Oral Session
2.1 Review of JENDL-3
2.1.1 On Accomplishment of JENDL-3
Sin-iti IGARASI
Nuclear Energy Data Center
Tokai-mura, Naka-gun, Ibaraki-ken
The third version of Japanese Evaluated Nuclear Data Library,
JENDL-3, was accomplished at the end of September, 1989, by the
compilation group of JENDL-3 in JAERI/Nuclear Data Center and tie
members of Japanese Nuclear Data Committee (JNDC). Working groups of
JNDC have been still doing some detailed benchmark tests of JENDL-3,
in order to comprehend its characteristics. This seminar is going to
focus its main subject on this matter, and a part of their results or
interim reports will be presented. Prior to proceeding to the main
session, a short review of JENDL-3 will be done.
An ad hoc planning committee for JENDL-3 was set up in 1980 to
discuss purpose, strategy and contents of JENDL-3. Its final report
mentioned, (i) addition of nuclides to those of JENDL-2 should be
limited to some important ones for nuclear engineering, (ii) photon
production data should be evaluated for several important nuclides,
and (iii) nuclear data for fast neutron, in particular, double
differential cross section (DDX) should be contained. Following this
guideline, evaluation work for JENDL-3 started in 1982.
A preliminary data set, JENDL-3PR1, was made in 1984, replying to
requests of the fusion neutronlcs study group in Japan. Some reports
related to JENDL-3PR1 were presented in Santa Fe Conference in 1985,
and won good reputation. In 1986, the compilation group of JENDL-3
made a test version of JENDL-3, JENDL-3T, for a preliminary study of
benchmark tests for FBR. Irterim results of this study were reported
in Mito Conference and Jacksonho!« Conference in 1988. Merits and
defects of the test-version were found out through these studies.
Reflecting on the results of the preliminary studies, JNDC
decided to make reevaluation of the data to correct the defects, in
- 3 -

JAERI-M 90-025
spite of approaching deadline of compilation work for JENDL-3.
Finally, compilation of JENDL-3 was attained, Including the data of
324 nuclides, 172 of which are fission products.
Through the work of JENDL-3, the compilation group felt that the
two preliminary test-version gave confusion to users, because of their
unlimited dissemination. Although test-version may be needed,
dissemination of the files as well as the results obtained by the
preliminary studies should be restricted. The test versions and the
preliminary results sometimes pretended to be the characteristics of
JENDL-3, and their own defects gave users some wrong impression that
JF.NDI.-3 would be worse than JENDL-2. Since it is not easy to relieve
such wrong information, preliminary version should be used more
carefully.
JNDC should have a review group for evaluated data. The
compilation group found in the data compilation work that in a few
evaluation some important data might be missed out to be investigated.
Such innocent incidents should be detected by the review group before
the data compilation work started. The compilation group performed
also the part of the data-review for JENDL-3, but a special group
should play it in future.
JENDL-3 will be released openly soon. JAERI/Nuclear Data Center
and JNDC will make efforts to increase its use, to collect information
from users about their use of JENDL-3, and to make future plans of
nuclear data evaluation in JNDC.
Recently, international cooperation of nuclear data activities
including nuclear data evaluation has been going on, in particular,
between JENDL, JEF and ENDF. Since JNDC has its own future plans for
nuclear data activities, achievement of the plans should be the first
priority in the work of JNDC. However, JNDC must coordinate the plans
by considering the international cooperation which will be more and
more important to attain the activities of JENDL. The author wishes
the international cooperation to bring JENDL to be a data file of
wider and higher quality, and JENDL to come to be able to provide the
other data files with its sophisticated evaluation.
- 4 -

JAERI-M 90-025
2.1.2 Thermal Reactor Benchmark Test of JENDL-3
Shungo Iijima Nuclear Engineering Laboratory, Toshiba Corporation
4-1 Ukishima-cho, Kawasaki-ku, Kawasaki, 210
Thermal reactor benchmark tests of JENDL were performed at
JAERI for past several years using two different analysis
methods, i.e., SRAC code system and MGCL+KENO-IV system. Tests
were made with criticals of highly compact assemblies, low-
enriched lattices and aqueous solutions of various concentra
tions fueled with 2 3 5 U , 2 3 9Pu and 2 3 3U. Results of tests are
summarized. Main results of tests are :
(1) For aqueous solutions of 2 3 5 U , 2 3 9Pu and 2 3 3 U , JENDL-3
gives a better trend of K .,- versus fuel concentrations
than JENDL-2, due to a harder fission spectrum adopted in
JENDL-3. This is a strong support to JENDL-3.
(2) Hovs-ever, SRAC results for 235U systems are systematically low
by about 1.5 % Ak while the results with MGCL+KENO-IV are in
excellent agreement with experimental data. The method dependence
must be clarified. For Pu systems of TCA lattices and nitrate
aqueous solutions, both methods give consistent results and in
good agreement with experimental data.
235
(3) Lattice parameters of U criticals are predicted well
with JENDL-3 except that 039 is overestimated by 5 X. For PROTEUS
compact Pu lattices, the lattice parameters are predicted within
5 % except for the F8/F9 of 50 % void case. For very compact
235U/Th, 233U/Th/D20 moderated ETA cores the lattice parameters
are not calculated well.
- 5 -

JAERI-M 90-025
1. Introduction
For past several years thermal reactor benchmark tests of
JENDL-2 and JENDL-3 have been performed by T. Takano and Y.
Komuro 1 1" 3' at JAERI with 2 3 5 U , 2 3 9 P u and 2 3 3 U systems. In some
cases ENDF/B-IV and ENDF/B '' were also used to compare with
JENDL. In the present paper their results are summarized and
discussed. Comparison was also made with the results of tests
( 4 ) of ENDF/B files performed in U.S. to draw as general conclusion as possible.
Reactor systems used for testing are the highly enriched
bare metal, the compact and loose low-enriched lattices, and
235 aqueous solutions of varying H/Fuel ratios fueled with U,
239 233
Pu and U. Some of them are of hard neutron spectra with
fissions occurring dominantly in epi-thermal or fast energies.
We shall discuss here mainly the testing results of well-
thermalized systems to draw observations concerning the thermal
and epi-thermal nuclear data of JENDL-3.
Takano made calculations with a lattice calculation code,
SRAC code; ' with ANISN in Pi~Sg approximation or 2-dimensional
diffusion theory code. Komuro used 137-group MGCL library and / 7 \
a Monte Carlo criticality code KENO-IV in JACS system . For
infinite cell model, SRAC calculation was confirmed to be in
good agreement with the calculation by VIM Monte Carlo code using
JENDL-2. (Takano, Tsuchihashi, priv. comm.)
It is to be mentioned that most of the benchmark test
results quoted here are not yet published. In fact, some
results are mutually inconsistent and some seem to be not
reasonable when compared with U.S benchmark results using ENDF/B-
IV and ENDF/B-V. Therefore, numerical results presented here may
not the final ones, pending reconfirmation.
- 6 -

JAERI-M 90-025
In Sec. 2 thermal cross sections of main fissile and fertile
nuclides and fission spectrum data are summarized. In Sec. 3,
thermal reactor data used for benchmark test are described.
Criticality calculations are presented in Sections 4. Calculated
lattice parameters are compared with experimental data in Sec. 5.
Comparison was made with the available test results in U.S.
Concluding remarks are stated in Sec. 6.
2. Nuclear Data
Table 1 gives the JENDL-2 values and JENDL-3/JENDL-2 ratios
of 2200m/s cross sections and infinite dilution resonance
integrals for main fissile and fertile nuclides. Yeta values of
JENDL-3 are larger than that of JENDL-2 by 0.3 % for U-235 and
Pu-239. The Pu-239 resonance integral of JENDL-3 is about 5 %
smaller than that of JENDL-2. Hence, the difference between
JENDL-2 and JENDL- 3 concerning cross sections for well-moderated
thermal reactor is not very significant.
Important difference between JENDL-2 and JENDL-3 for thermal
reactors is that of the fission spectrum. U-235 fission spectrum
of JENDL-2 and the JENDL-3/ JENDL-2 ratio are shown in Fig. 1.
For energies below 100 keV, JENDL-3 gives about 15 % lower
spectrum than JENDL-2, while for energies between 2 and 6 MeV
JENDL-3 gives about 5 % higher spectrum. This trend is the same
for Pu-239 and U-233 fission spectra. It is expected that JENDL-
3 will give a lower K ~r. than JENDL-2 for high leakage system
because of a harder fission spectrum. Both libraries will give
about the same results for low leakage systems.
- 7 -

JAERI-M 90-025
3. Thermal reactor benchmark data
References to thermal reactor data used as benchmark are
listed in Table 2 classified according to the authors. Tables 3,
4 and 5 give more details of reactor data categorized according
to 2 3 5 U , 2 3 9Pu and U/Th/DgO systems, respectively.
4. Criticalities
Tables 6, 7 and 8 give the summary of calculated eigenvalues o n e o 'j Q *? *3
for ' U, Pu and U systems, respectively. Figures 3, 4 and 235
5 show the eigenvalues of aqueous solutions versus H/ U, 2 39 233
H/ Pu and H/ U concentrations, respectively. Present calcu
lation was compared with the results of benchmark test performed
in U.S using ENDF/B-IV and B-V when available.
Before discussing the results of testing, the following
points are commented.
(a) There are no cases where SRAC system and MGCL+KENO-IV are
compared simultaneously. This makes the comparison of the
results of both methods somewhat indirect.
(b) The compact lattices and metal spheres are not appropriate
for test of thermal nuclear data. We shall not put stress on the
results for these assemblies. 235
(c) For U aqueous solutions, anomalous jumps are seen in the r 235
plot of KeffS versus H/ U concentrations, the jumps occurring
at the UOgFo solutions given in the report of McNeany & Jenkins
(surrounded by parethesis). Takano noted that the convergence of
eigenvalue calculation of these cases was extremely slow, the
reason being unknown. Hence, these cases were excluded from
comparison.
(d) For Pu aqueous solutions, Hardy* remarked that there are
uncertainties in the specification of Pu concentration. Care may
be necessary on the results of the Pu ^.queous solutions.
- 8 -

JAERI-M 90-025
(e) Figure 2 shows the coarse comparison of the experimental
data and the simple point model one-group calculation of
critical masses and critical radii of bare spheres of U-235
2 2
aqueous solutions. In the point model, M was taken as 33 cm
from neutron age data for U-water lattice, and the calculated
reflector savings of 3.0 cm for bare sphere and 6.5 cm for water
reflected sphere independent of H/U concentrations. Though
simple in theory, calculation reproduces the feature of experi
mental data very nicely. This indicates that the systems shown
here are well-thermalized ones. It is also understood from the
critical radius data that the system of H/U < 1000 has small
radius and hence is of high leakage core.
Keeping above points in mind we observe the following points
from the results of eigenvalue calculations.
4.1 Criticalities of U-235 assemblies
(1) SRAC (+ANISN or 2D diffusion theory) underestimates the K e f f
9 35 of all U systems systematically by about 1 - 1.5 % using
JENDL-3 compared with experiments and also with U.S calculation
using ENDF/B-V. Results for the early U and UO, lattices are
discussed in Appendix.
MGCL+KENO-IV gives Kef£s of TCA lattices and water-reflected
cylinders of 4.9 w/o enriched UO^F, aqueous solutions in
excellent agreement with experimental data. The MGCL results
using ENDF/B-V are consistent with U.S. benchmark calculation of
TRX lattices. For bare cylinders of U0 2F 2 aqueous solutions,
MGCL+KENO-IV underestimates the eigenvalues by nearly 2 % Ak with
JENDL-3 and ENDF/B-V. This may be because of an unpredictable
effect of the room scattering.
Systematic underprediction with SRAC is difficult to under
stand. A simultaneous comparison of SRAC and MGCL to clear the
- 9 -

JAERI-M 90-025
method dependence is the top priority cf the next work. 235 (2) For U aqueous solutions, JENDL-3 gives lower Keff'
s than
JENDL-2 because of a harder fission spectrum of JENDL-3. As
leakage becomes small, both files tend to give the same Keff'
s-
4.2 Criticalities of Pu-239 assemblies
(1) For Pu systems, both SRAC calculation for aqueous solutions
and MGCL+KENO-IV calculation for TCA lattices agree well with
experimental data. This is in contrast to the observations for
U system.
(2) In case of Pu aqueous solutions, all calculations show the
trend to give higher K's for lower H/Pu concentration and lower
K's for higher H/Pu concentration. Except for the case of H/Pu =
1200, JENDL-3 gives the best trend and values because of a
harder fission neutron spectrum.
However, the difference between the eigenvalues calculated with
JENDL-2 and JENDL-3 for dilute systems is not understandable.
As long as the thermal cross sections are concerned, both
libraries are expected to give about the same eigenvalues for
well-thermalized systems. The reason should be clarified. Compa
rison with MGCL+KENO-IV calculation is also recommended.
4,3 Criticalities of U-233 assemblies
For U-233 aqueous solutions, JENDL-3 gives better results
and trend than JENDL-2 and ENDF/B-IV, but the average value is
about K = 0.985. The K ~~ of bare metal is overestimated by 3 X
Ak.
- 10 -

JAERI-M 90-025
5. Lattice parameters
5.1 Lattice parameters of U-235 assemblies (TRX-1, TRX-2)
Table 9 shows the comparison of calculation and experiments
of lattice parameters of TRX-1 and TRX-2 assemblies.
( 4 ) Calculation was made by Takano with SRAC code. Hardy* gives the
corrected experimental data of &2Q a s listed in Table 9 instead
of the values given by 1974 CSEWG specification. With these
corrected values the C/E ratios were improved by about 4 % for
both TRX-1 and TRX-2.
5.2 Lattice parameters of Pu assemblies (PTOTEUS cores)
Table 10 and Fig. 6 give the measured and calculation-to
experiment ratios of Koo and lattice parameters of PROTEUS cores.
The variation of Koo to voidage represents the void reactivity.
This is predicted well with both JENDL-2 and JENDL-3.
Lattice parameters of 6 w/o Pu cores are also predicted
well within 5 % except for F8/F9 for 42.5 % void case. The
results for 8 w/o cores exhibit different C/E behaviors compared
to that for 6 w/o cores, making the judgement difficult. Since
PROTEUS cores are not well thermalized, epi-thermal and fast
cross sections are playing important roles. Takano made the cell
parameter calculation with VIM Monte Carlo code using JENDL-2.
The results were in agreement with SRAC within 1 X !. Our
general feeling is that both JENDL-2 and JENDL-3 give reasonable
results.
5.3 Lattice parameters of U/Th/DgO assemblies (ETA-1,-2)
Table 11 gives the measured and C/E ratios of lattice para
meters of ETA-1 and ETA-2 cores. These cores are of very hard
neutron spectra, more than 60 % of fissions occurring
epithermally and about 10 % of these above 1 MeV (74Ha).
- 11 -

JAERI -M 90-025
The agreement between experiment and calculation is not very
good, especially for f2/f5 and C2/F5 in ETA-1 and f2/f3 and
C2/F3 in ETA-2. In ETA-1, f2/f5 was measured at the center rod
of 9-rod cell. Other parameters are the cell-averaged values.
Hardy noted that the cell-averaged value of f2/f5 is 6.3 % less
than f2/f5 of central rod. This may be a part of the reason of
the disagreement between calculation and experiment.
Underestimation of conversion ratios is also seen for the
dosimetry data in CFRMF field of Th fission and capture cross
sections. The CFRMF experimental data and the C/E ratios are
Exp. JENDL-3T IRDF
232Th(n,f) 19.6 mb( 5%) 0.995 0.949
232Th(n,y) 290 mb( 3.7%) 0.863 0.907
6. Concluding remarks
The effort of integral testing of JENDL has been directed
hitherto mainly to fast reactors and fusion reactors, not to
thermal reactor systems. However, it must be stressed that the
the verification of the applicability of JENDL to thermal
reactors is very important in gaining its reliability and
reputation. This will be more true as the fuel cycle evaluation
becomes more important immediate problems.
Concerning criticality calculation, JENDL-3 is in a better
shape than JENDL-2, especially for MOX reactors and criticality
safety problems. For U-235 systems the most worrying problem is
that the criticality calculation depends significantly on the
analysis method.
Lattice parameters of TRX-1 and TRX-2 are predicted well
except that O2Q is overestimated by 3 - 5 %. Since the
conversion ratios are calculated very well (C/E=l.00-1.01), the
- 1 2 -

JAER1-M 90-025
overestimation of P28 is probably not important problem.
PROTEUS, ETA-1 and ETA-2 have hard neutron spectrum cores. They
pose interesting tests of epi-thermal cross sections. But, at
the same time, the benchmark testing with wel1-thermalized Pu
lattices is desirable.
Acknowldegement :
Author is thankful to H. Takano and Y. Komuro at JAERI for
communicating unpublished reports of benchmark analysis results.
He is indebted to K.Tsuchihasi of JAERI for valuable conments on
calculational method. He appreciates M. Yamamoto, M. Ueda and
K. Sakurada of Toshiba for discussions of experimental techniques
and thermal reactor analysis.
References :
(1) Takano, H., Kaneko, K. : Thermal and Fast Reactor Benchmark Tests of JENDL-3T, Proc. Nuclear Data for Science and Technology, 1988, Mito, p. 521
(2) Takano, H., Komuro, Y. : Benchmark Tests , Thermal and Fast Reactors. Japanese Evaluated Nuclear Data Library Version 3, JENDL-3 , JAES, 31,1190 (1989) (in Japanese)
(3) Komuro, Y. : Nuclear Data News No. 29, 1987 Takano, H. : Nuclear Data News No. 32, 1989
(4) Hardy. J. :ENDF/B data Testing Results for Thermal Reactor Benchmarks, Proc. Thermal Reactor Benchmark Calculations, Techniques, Results and Applications, 1983, BNL, NP-2855, Sec. 16.
(5) Tsuchihashi, K. et al. : JAERI-1285(1983), JAERI-1302(1986)
(6) Naito, Y., Tsuruta, S., Matsumura, T., Ohuchi. T. : MGCL-Processor, A Computer Code System for Processing Multigroup Constants Library MGCL, JAERI-M 9396(1981)
(7) Katakura, J., Naito, Y., Komuro, Y. : Development of the Computer Code System JACS for Criticality Safety, Trans. Am. Nucl. Soc.,41, 329 (1982)
- 13 -

JAERI-M 90-025
Appendix : On Criticality Calculation of Early U and UOg lattices
Early U and UO„ lattices specified by Strawbrvidge and
Barry have been the great sources of reactor physics data. The
calculated cell eigenvalues by SRAC code using JENDL-3 are on
the average 0.982{±1%) and 0.990(± 0.8%) for U0 2 and U lattices,
respectively, the standard deviation being the average of devia
tions from the average eigenvalue as shown in Fig. Al.
The averaged eigenvalue is much worse than that calculated by
Strawbridge and Barry in 1964. This is insulting.
The dispersion of eigenvalues is quite large particularly in
case of U0 2 lattices, reaching to about 5 % Ak at maximum. This
indicates that the specifications of these assemblies may not
have been proper, Strawbridge and Barry noted that the
experimental buckling data of BAW were doubtful in the sense that
asymptotic region was not attained. They made PDQ calculation
for BAW lattices and obtained K = 0.. 992 instead of the lattice
eigenvalues K = 0.986 for BAW lattices, resulting in a better
overall agreement. Hence, a proper selection of experimental data
is necessary.
Concerning the underestimation of eigenvalues by 1 - 2 X
with JENDL-3, Saji at MAPI noted that the effect of choice of
spatial meshes on eigenvalue in SRAC cell calculation is significant.
However, according to Tsuchihashi the example cell calculation
with Monte Carlo VIM code was in good agreement with SRAC
calculation.
Should we give up to consider more about the early criticals
as benchmark data because the reactor specifications may be
inaccurate for a number of cases, or should we continue the
analysis with more effort until we shall get reasonable results ?
We may expect the results of re-analysis being made by Saji.

Table 1 Thermal Cross Sections and Resonance Integrals of JENDL-2 and JENDL-3
U-233 J2
J3/J2
U-235 J2
J3/J2
Pu-239 J2
J3/J2
U-238 J2
J3/J2
v o^(b)
2.493 529.8
1.000 1.000
2.429 583.9
1.0029 1.000
2.881 741.7
1.001 1.007
o°(b) if(b)
45.3 771.4
1.000 1.001
96.0 278.7
1.000 0.987
270.2 301.5
1.000 0.992
2.70 2.05
0.993 1.000
Iy(b) r)
138.6 2.297
0.999 1.000
153.3 2.086
0.994 1.003
195.2 2.112
0.949 1.003
279.0
1.000

Table 2 References to Thermal Reactor Benchmark Data
I
Abbrev. Authors References and Contents
(65St) : L.E.Strawbridge & R.F.Barry Nucl.Sci.Eng. 23,58(1965). compilation. early U,UO„ lattices.
(78Ts) : H. Tsuruta et al. JAERI-1254(1978) U0 2, MOX lattice
(74Cs) : CSEWG Benchmarks EN'DF-202, 1974 TRX—1 — 2 BAPL-U02*lattice (*) £ U-235 aqueous solutions ts Pu aqueous solutions PKL MOX lattice)*)
(65Jo) : Johnson & Kronin ORNL-3714, Vol. 1(1964) 4.9 w/o enr. U aqueous solutions
(84Ch) : R.Chawla et al. Nucl.Tech 67,360(1984), 73,296(1984) PROTEUS 6, 8 w/o Pu compact lattice
(74Ha) : J.Hardy, Jr. et al. Nucl.Sci.Eng. 55,401 (1974) ETA-1,-2
(78Mc) : S.R. McNeany & J.D.Jenkins Nucl.Sci.Eng. 65,441 (1978). compilation, U-233 aqueous solution U-235 metal sphere
w
(*) Not used in the present benchmark test.

JAERI-M 90-025
Table 3 U-235 Benchmark Systems
(1) U and U0 2 lattices
a. 116 U & U0 2 lattices specified by Strawbrir1^ & Barry
Early 61 metallic U and 55 U0 2 lattices. Lattice specifications and experimental bucklings are given. U-metal lattices : 1.0-3.0 w/o enr. U metal rod of 0.5-2.3 cm
dia., Al clad., , H„0/U = 1 - 1 0 . U0 9 lattices : 1.3-4.0 w/o enr. U rod of 0.75-1.5 cm dia.,
clad with Al,SS-304. H20/U = 2.5-10. Some lattices are of H^O/DoO mixture, and/or contain 800-4000 ppm B-10.
b. Bettis TRX-1 and TRX-2 lattices specified by CSEWG(74Cs).
Eigenvalues and lattice parameters are given. 1.3w/o enr. U metal rod of 0.387" diameter clad with Al. Vw/Vp= 2.35 (TRX-1), = 4.02{TRX-2).
c. JAERI TCA U02-water lattices by Tsurura(78Ts).
2.6 w/o enr. U0 9/ rod of 1.25 cm dia. clad with Al. V /V = 1.5 - 3.Of Critical water heights for various configurations.
(2) Criticality safety problems
a. U-235 metal bare sphere cited by McNeany and Jenkins(78Nc)
99.99 w/o enr. U-235 metal of 16.4068 cm diameter. Experiment by Paxton, H.C. : LA-3067-MS, Rev.p.50 (1975)
b. UO^Fg aqueous solutions by Johnson & Kronin(64Jo).
4.9 w/o enr. U-235. Bare and reflected cylinders. H/U = 450-870.
c. UOgFg aqueous solutions by McNeany & Jenkins{78Mc).
High enr. U-235. Bare sphere and cylinder. H/U = 50,1400. Experiments by Fox, ORNL-2389(1958), ORNL-2609(1958).
d. Highly enriched U nitrate solutions. Bare sphere.(74Cs). H/U = 27 - 2052.
- 17 -

JAERI-M 90-025
Table 4 Pu Benchmark Systems
( 1 ) MOX l a t t i c e
a. JAERI TCA MOX-water lattices by Tsuruta et al.(78Ts)
3.0 w/o enriched Pu09-nat U09/water lattices. Pu239/Pu240/Pu241 = 68.2/22.0/7.3 Vtf/VF = 2.4-5.55. Critical water heights for various configurations including water gaps and liquid poison..
b. PROTEUS (!<«, = 1) zoned lattices by Chawla et al.(84Ch).
res Average 6 w/o and 8 w/o Pu09/(Pu09+depl.U09) co Pu239/Pu240/Pu241=80/18/2. 6 * Vp/VM = 2, highly compact lattice. Moderated by water or dowtherm{50% void) or 100% void. K and lattice parameters are given.
(2) Criticality Safety
Pu239 nitrate solutions specified by CSEWG(74CS).
High enr. Pu-239. Bare spheres. H/Pu-239 = 131 - 1204. Specified by CSEWG(7 4CSEWG).
Table 5 U/Th/D20 and U-233 Benchmark Systems
(1) U02/Th02/D20 lattice zone in TRX driver by Hardy(74Ha).
Zone diameter = 66 cm, VM/V,-, = 2. a. ETA-1 : 9-rod cell, 6.7*w/o 235UO„-Th09, 232Th/235U=15 b. ETA-2 : 4-rod cell, 3.0 w/o 233U02-ThO9, 232Th/233U=33 Lattice parameters are given.
(2) Criticality Safety
U-233 nitrate aqueous solutions by McNeany & Jenkins(78Mc). High enr. U-233. Bare spheres. H/U233 = 0 - 1986. By McNeany and Jenkins(78Mc).
- 18 -

JAERI-M 90-025
Table 6 'U Thermal R e a c t o r s . Summary of C a l c u l a t e d K e f f ' s
E N D F / B - I V ENDF/B-V J E N D L - 2 J E N D L - 3
U - l a t t i c e
TRX-1
TRX-2
TCA l a t t i c e
2 3 5
0 . 9 8 8 #
0 . 9 9 4 #
0 . 9 9 5 $
0 . 9 9 6 *
0 . 9 9 8 #
1 . 0 0 1 $
b a r e
2 3 5
0 . 9 8 9 *
0 . 9 8 2 *
0 . 9 8 6 *
U m e t a l s p h e r e 1 . 0 1 3 *
UOgF^ a q u e o u s s o l u t i o n s ( 4 . 9 w / o e n r . U - 2 3 5 )
r e f l e c t e d c y l . 0 . 9 8 8 $ 0 . 9 9 7 $
c y l . 0 . 9 7 3 $ 0 . 9 8 4 $
U n i t r a t e a q u e o u s s o l u t i o n s
b a r e s p h e r e 0 . 9 9 3 - 1 . 0 1 # 0 . 9 9 7 - 1 . 0 0 5 *
0 . 9 9 0 *
0 . 9 8 3 *
0 . 9 8 7 *
0 . 9 9 8 $
1 . 0 1 3 *
0 . 9 9 6 $
0 . 9 8 3 $
0 . 9 8 - 0 . 9 8 5 *
* ) T a k a n o : SRAC+ANISN o r 2D d i f f u s i o n , $ ) K o m u r o : MGCL+KENO-IV # ) H a r d y , J . : BNL c o n f . 1 9 8 3
Table 7 2 3 9 P u Thermal R e a c t o r s . Summary of C a l c u l a t e d K e f f ' s
E N D F / B - I V ENDF/B-V J E N D L - 2 J E N D L - 3
TCA MOX 0 . 9 9 3 $
N i t r a t e s o l u t i o n s , B a r e s p h e r e ,
0.996$
H/239Pu = 131
= 578
= 700
= 911
= 1204
1 .019*
1.015*
1.022*
1.009*
1.000*
1.011*
1.021*
1.007*
1.000*
0.998$
1.0185* 0.9975*
1.014* 0.9955*
1.021* 1.002*
1.0075* 0.993*
0.999* 0.985*
*) Takano : SRAC+ANISN or 2D diffusion, $) Komuro : MGCL+KENO-IV #) Hardy, J. : BNL conf. 1983
-19-

JAERI-M 90-025
Table 8 2 3 3 U, Th-related Thermal Reactors . Calculated K e f f ' s
ENDF/B-IV JENDL-2 JENDL-3
ETA-1 : "°U/Th/D 2
ETA-2 : 2 3 3U/Th/D 2
Aqueous solutions,
H/233U = 0
= 195
= 381
= 1535
= 1986
O+TRX driver
O+TRX driver
Bare sphere.
metal
nitrate
U 02 F2
nitrate
nitrate
0
1
1
0
0
.967*
028#
013#
996#
991#
0.996*
0.999*
1.006*
1.037*
1.019*
1.008#
0.986#
0
0
1
0
0
0
0
991*
992*
030*
987*
9745*
9915*
980*
*) Takano : SRAC+ANISN or 2D d i f f u s i o n . #) McNeany & J e n k i n s , (78Mc)
Table 9 La t t i ce Parameters of TRX-1 and TRX-2. Experimental Data and Calcu.lation-to-Experiment Rat ios .
TRX-1
K
P28
<S25
:
F28/F25
028/ 'F25
1
1
0
0
0
Exp.
.000
320 +0.021
0987+0.0010
0946+0.0041
797+0.008
ENDF/B-
0.988
1.05
1.01
1 .01
1.01
IV EBDF/B-V
0.996
1.03
1.02
1.05
1.00
JENDL-2
0.982
1.04
1.01
1.02
1.01
JENDL-3
0.983
1.05
1.00
1.06
1.01
TRX-2
K
P28
1 .00
0.387+0.016
625 0.0614+0.0008
F28/F25 0.0693+0.0035
C28/F25 0.647+0.006
0.994
1.03
0.99
0.98
1.00
0.998
1.01
1.00
1.01
0.99
0.986
1.02
0.99
0.99
1.00
0.987
1.03
0.99
1.03
1.00
SRAC+2D diffusion calculation. Note : (1) #)Hardy, J. : Ref.4, *)Takano, II. (2) pza = C28(epi-Cd)/C28(sub-Cd)
625 = F25(epi-Cd)/F25(sub-Cd) , • F25.F28 and C28 are the macroscopic fission and capture rates.
- 2 0 -

Table 10 La t t i ce Parameters of PROTEUS Cores Experimental Data and Calculat ion-to-Experiment Ratios
6 - w / o Pu Core 8 - w / o Pu c o r e
V o i d , % 0 % 4 2 . 5 % 1 0 0 % 0 % 4 2 . 5 % 100 %
Kco Exp 1 . 0 4 5 ( 1 . 1 ) 0 . 9 9 1 ( 1 . 5 ) 0 . 9 0 5 ( 0 . 8 ) - -
J - 2 0 . 9 9 9 0 . 9 9 0 0 . 9 8 9
J-3 1.002 0.995 1.009
C28/F49 Exp 0.0691(2.2) 0.0874(2.0) 0.148(1.5) 0.0748(3) 0.0939(2.8) 0.144(2)
J - 2 0 . 9 7 6 1 . 0 0 2 1 . 0 3 6 1 . 0 5 5 1 . 0 4 4 1 . 0 3 1
J - 3 0 . 9 8 0 1 . 0 0 8 1 . 0 2 3 1 . 0 6 0 1 . 0 5 0 1 . 0 1 7 > W
f28/f49 Exp 0.00987(2.5)0.0111(2.3) 0.0193(2.0) 0.0119(2.8) 0.0141(2.6) 0.0222(2.4)
J-2 1.006 1.072 1.027 1.064 1.055 1.008
J-3 1.043 1.109 1.074 1.104 1.094 1.058
f25/f49 Exp 0.988(2.0) 1.032(1.8) 1.091(1.5) 0.946(2.1) 1.050(1.8) 1.056(1.7)
J-2 0.996 1.055 1.043 1.055 1.063 1.066
J-3 0.993 1.051 1.011 1.051 1.059 1.037
f41/f49 Exp 1.78(4.5) 1.75(3.5) 1.46(2.5) 1.887(3.1) 1.959(2.7) 1.624(2.4)
(ftt/'Ul) J" 2 0.949 1.040 1.008 1.035 1.064 0.974
J-3 0.957 1.054 1.011 1.044 1.070 0.986
Note (1) Infinite cell model caluc.lation by SRAC. (Takano, H.) (2) Number in parenthesis is the experimental error in %. (3) f (small character) is the microscopic reaction rate (/atom).
F and C (capital letter) are the macroscopic reaction rate.
i
S
(4) For 8 w/o Pu core, f41/f49 means f23/f49 ratio.

JAERI-M 90-025
Table 11 La t t i ce Parameters of ETA-1 and ETA-2 Cores Experimental Data and the Calculat lon-to-Experiment Ratios
E T A - 1 :
P02
62 5
602
C02/F25
E T A - 2 :
Po.
62 3
602
C02/F23
(6
( 3 .
E x p e r i m e n t
7 w / o 2 3 5 U . )
1 0 . 5 4 + 0 . 1 5
1 . 7 4 + 0 . 0 2
0 . 0 1 6 6 + 0 . 0 0 0 9
0 . 8 6 7 + 0 . 0 0 9
Ow/o 2 3 3 U )
8 . 8 9 + 0 . 15
2 . 9 6 + 0 . 0 8
0 . 0 1 8 1 + 0 . 0 0 1 4
1 . 0 4 7 + 0 . 0 0 2
J E N D L - 2
0 . 9 6
1 . 0 5
0 . 8 1
0 . 9 2
•
0 . 9 4
1 . 0 4
0 . 9 4
0 . 8 9
J E N D L - 3
0 . 9 8
1 . 0 4
0 . 8 4
0 . 9 6
0 . 9 5
1 . 0 3
1 . 0 5
0 . 9 3
N o t e (1 ) C a l c u l a t i o n by SRAC+2D d i f f u s i o n t h e o r y w i t h TRX (2 ) P°2 : T h - 2 3 8 e p i - C d / s u b - C d c a p t u r e r a t e r a t i o .
S25 : U-235 e p i - C d / s u b - C d f i s s i o n r a t e r a t i o . 602 : m i c r o s c o p i c f i s s i o n r a t e r a t i o of T h - 2 3 2 t o <502 : m i c r o s c o p i c f i s s i o n r a t e r a t i o of T h - 2 3 2 t o C02/F25 : m a c r o s c o p i c r a t i o of Th-232 c a p t u r e t o U-235 f i s s i o n . C02/F23 : m a c r o s c o p i c r a t i o of Th-232 c a p t u r e t o U-233 f i s s i o n .
d r i v e r .
U - 2 3 5 . U - 2 3 3 .
- 2 2 -

10"
I
> 10 1 - 2
1 0 - 3
1.1
1.0
•3 0.9 3
JENDL-2 JENDL-3
T ^ - , , — i i i , , , 1 , , — ! .
-22.9 t o 8.46 % D i f f e r e n c e s
0.8
0.7 li L.
Maximum . R a t i o T I.
' I 1—I i I l l ITI
10~6
1
1 0 - 5 10" 10~3 10"2 10_1 10° 101
MEV 92-U -235
>
Fig. 1 U-235 fission spectrum of JENDL-2 and the JENDL-3/JENDL-2 ratio

JAERI-M 90-025
o
J U
10
r
i
^
"I 1 1 — 1 I I I I - — r •• i i
\ ^ ~ ^ _ B a r e
^ ^ ^ ^ _ _
H 20-ref lected
1 ' M l l
-
v —
/ metal *
T
10
0.1
H20 reflected
2000 1000 500
J 1 i I ' ' ' '
200 100
^
H/U
50 20
' ' i i i i i
10 100 1000
g/A
Fig. 2 Critical masses and critical radii of bare and water-reflected U-235 aqueous solutions. Solid line is the simple point model one-group calculation. Solid and white circles are experimental data.
- 24 -
JAERI-M 90-025
L.W
1.02
,
u 1.00 i
0.98
0 .96
1 !
-
D
L A
(•)
1 1
1 1 " I 1 '
A
O
o • •
J., -, 1. 1
I ' —r-
• JENDL-3
I
OJENDL-2
A ENDF/B-VAENDF/B-
1
1 } 0
0 • •
1 1
A
I
-
IV
_
T A /
9
1 0 2000
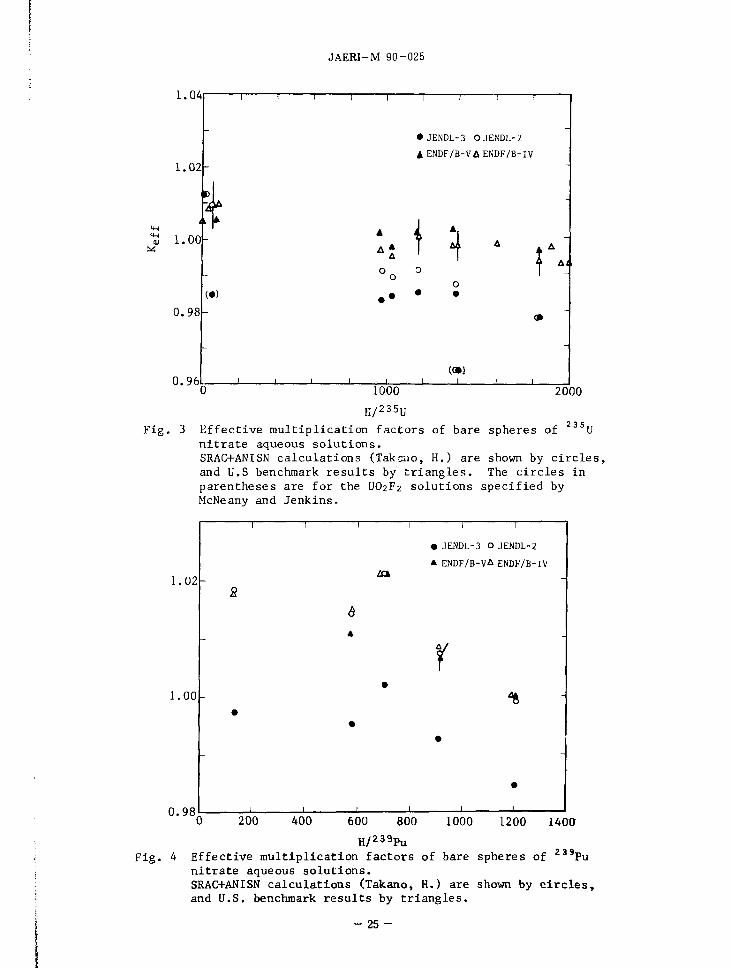
F i g . 2 3 5
U
1000
H/ 2 3 5 U
E f f e c t i v e m u l t i p l i c a t i o n f a c t o r s of b a r e s p h e r e s of n i t r a t e aqueous s o l u t i o n s . SRAC+ANISN c a l c u l a t i o n s (Tak-2110, H.) a r e shown by c i r c l e s , and U.S benchmark r e s u l t s by t r i a n g l e s . The c i r c l e s i n p a r e n t h e s e s a r e fo r t h e UO2F2 s o l u t i o n s s p e c i f i e d by McNeany and J e n k i n s .
1.02
1.00
0.98
-
-
-
1
8
•
1
1 1
6 A
•
1 .. , 1_
XX
•
1
• JENDL-3
A ENDF/B-V
f 1
•
1
1
O JENDL-2
A ENDF/B-IV
-
< 0
•
1
200 400 600 800
H/239Pu
1000 1200 1400
239 Pu Fig. 4 Effective multiplication factors of bare spheres of nitrate aqueous solutions. SRAC+ANISN calculations (Takano, H.) are shown by circles, and U.S. benchmark results by triangles.
- 25 -

JAERI-M 90-025
1.04
1.02
1.00
0 .98
0 .96
-1 r o
o
• JENDL-3 O JENDL-2
A ENDF/B-lV(McNeany-J<>nkins)
i
C
1000
H/235u
2000
Fig. 5 Effective multiplication .factors of brre spheres of 2 33 U
nitrate aqueous solutions. Calculation with SRAC+ANISN (Takano, H.) are shown by circles. Calculation by McNeany and Jenkins using ENDF/B-IV is given by triangle points.
26-

JAERI-M 90-025
H20 Dowtherm Air H20 Dowtherm Air
1.1
1.0
0.9
F j / F g
1 )
t
;
i
:
< i
i
H,0 Dowtherm Air H,0 Dowtherm Air
Fig. 6 The calculation-to-experiment ratios of lattice parameters of PROTEUS core. Calculation with SRAC code by Takano, H. 6w/o Pu core: A (JENDL-3), x (JENDL-2). 8w/o Pu core: o (JENDL-3)
- 27

JAERI-M 90-025
1 . 0 4 -
1.02
1.00
01
0.98
0 . 9 6 -
0 .94
-
1 1
•
* •
• • •
•-•
•
i i
•• - i i
• •: : : .
• ••
•
NH/Nu
1 1
1 - 1 1 I U02-H20 L a t t i c e
KAV = 0 .983 (±0 .011)"
• • •
•
KAV
• •
•
1 1 1 1 10 12 14 16
01
1.04
1 . 0 2 -
1.00
0 . 9 8 -
0 . 9 6 -
0.94
1
-
•
: • . • """•
• • * • ' • •
• •
f •
1
I
•
•
•
• •
•• •
'
• •
1 1
• • •
I I 1
U-H20 L a t t i c e
KAV = 0 .989 (±0 .010)
-
• •
•
KAV
1 1 1
10 12 14 16
F i g . Al D i spers ion of c a l c u l a t e d c e l l e i g e n v a l u e s of e a r l y UO2 and U l a t t i c e s . C a l c u l a t i o n with SRAC code us ing JENDL-2 by Takano, H.
- 2 8 -

JAERI-M 90-025
2.1.3 Review of JENDL-3 Data from Viewpoint for FBR Benchmark Tests
Yasuyuki KIKUCHT
Nuclear Data Center
Department of Physics
Japan Atomic Energy Research Institute
Abstract
Results of FBR benchmark tests are reviewed. JENDL-3 predicts
various FBR characteristics much better than JF.NDL-2. Particularly
C/E values of sodium void coefficients and Doppler coefficients are
much improved and space dependences observed with JENDL-2 for reaction
rates, sodium void coefficients and control rod worth nearly
disappear. On the other hand, it was pointed out that there exist a
slight core dependence for effective multiplication factors and
overestimation of threshod reaction rates.
Concerning these points, the JENDL-3 data were reviewed by
comparing the JENDL-2 data. Simultaneous evaluation was adopted for
principal actinide nuclides. As a results, fission cross sections of 235 239
U and Pu are lower than those of JENDL-2 below a few hundred keV. Lower capture cross section and higher inelastic scattering
238 cross section were adopted for U. A harder fission spectrum of
Madland-Nix type was assumed.
Considering the results of the benchmark tests and the
characteristics of the JENDL-3 data. The following can be concluded.
The balance of JENDL-3 is much better than that of JENDL-2. The low 235 239
fission cross sections of Tj and Pu and the low capture cross
section of U seem to be reasonable. On the other hand, further
study will be required for the inelastic scattering cross section of 238
U and the fission spectrum.
- 29 -

JAERI-M 90-025
1. Introduction
The compilation of JENDL-3 was completed in October 1989.
JENDL-3 is now open for use in all the world. Before the release of
JENDL-3, various benchmark tests have been performed. Some
modification of the evaluated data has been made by considering the
results of the benchmark tests. A global review of JENDL-3 was already
published
Benchmark tests on FBR characteristics was made by JNDC Working
Group on FBR Benchmark Tests. The detailed results will be soon 2)
published . Sensitivity analysis were also applied to understand the 3) results of benchmark testing .
In this brief report, I review the results of benchmark testing
and the characteristics of JENDL-3 evaluation, and discuss reliability
of JEiNDL-3 data from viewpoint of the FBR benchmark tests.
2. Review of FBR Benchmark Tests
The FBR benchmark tests were performed for 21 international
benchmark cores, FCA-IX series cores and ZPPR-9. The results are
briefly summarized in the following.
1) Effective multiplication factor: Table 1, Figs. 2 and 3
The C/E values are satisfactory. However there exist a tendency
to overestimate it in large Pu cores. For U cores JENDL-3
underestimatps it in cores with hard spectra.
2) Central reaction rate ratios: Table 2 239 235
A ratio of Pu fission to U fission is improved compared with JENDL-2. However threshold reactions such as U fission and 240
Pu fission seem to be a little overestimated in the 21 benchmark cores, but arp satisfactory in ZPPR-9. It should be noted that the
238 239 experimental data of U fission to Pu fission ratio are considerably discrepant between foil and micro fission counter
238 239
measurements in ZPPR-9. As to a U capture to Pu fission,
JENDL-3 gives satisfactory results in the 21 benchmark cores, but
overestimatps it about 4% in ZPPR-9.
3) Reaction rate distributions: Fig. 3
With JENDL-3, little space dependence is observed as shown in
Fig. 3 and the C/E values are predicted within 3% even at the outer
- 3 0 -

JAERI-M 90-025
core. On the other hand, considerable overestimation is observed with
JENDL-2 when leaving from the core center.
4) Sodium void coefficients: Fig. 4
With JENDL-3, the C/E values are independent on the void volume
and stay near unity within 7%. On the other hand, the coefficients
calculated with JENDL-2 are more than 20% overestimated and the
overestimation reaches 40% when the void volume becomes large.
5) Control rod worth
In ZPPR-9, the C/E values of control rod worth change more than
30% between core center and outer ring. This space dependence is
little seen with JENDL-3.
6) Doppler coefficients: Table 3
Underestimations of about 10% observed with JENDL-2 are much
improved to about 5% with JENDL-3.
3. Review of JENDL-3 evaluation
Characteristics of JENDL-3 data are summarized in the following
by comparing with data of JENDL-2. 4)
1) Simultaneous evaluation method was applied to principal „. ., . „. . 235,, 238IT 239„ 240D , 241n actinide isotopes, i.e., U, U, Pu, Pu and Pu. As a
235 239 result fission cross sections of U and Pu become considerably
lower than those of JENDL-2 below a few hunched keV as shown in Figs.
5 and 6. The values of JENDL-2 were artificially increased so as to
keep the k-eff values high enough. 23ft
2) The lower values were adopted for U capture cross section
below 200 keV on the basis of new experimental data of Kazakov et
al. as seen in Fig. 7. 238
3) Direct inelastic scattering effect was considered for U. Consequently the total inelastic scattering cross section becomes large than that of JENDL-2. Recently, however, Baba et al. measured
238 the inelastic scattering cross sections of U. Their data lies
between JENDL-2 and JENDL-3 as seen in Fig. 8.
4) The fission spectrum formula by Madland and Nix was adopted for
principle fission nuclides. Consequently the spectrum is harder than
that of JENDL-2 which is based on Watt formula as seen in Fig. 9.
5) New evaluation of structural material results in lower capture
-31 -

JAERI-M 90-025
cross section for Cr and Ni as seen in Figs. 10 and 11. 235
6) Number of prompt fission neutrons (v) of U has some structure
and becomes lower below 100 keV than JENDL-2 as seen in Fig. 12.
There are little difference between JENDL-2 and JENDL-3 for v-value of 239D Pu.
7) Direct and preequilibn'um effects were considered for many light
and structural materials, resulting in better reproduction of emitted
neutron spectra at high energy region. However this affects little
the FBR characteristics.
8) Gamma-ray production data were contained for important nuclides.
4. Discussion
Considering the results of the FBR benchmark tests and the
characteristics of JENDL-3 data, the following can be said.
1) Space dependence problems
The space dependences of reaction rates, sodium void coefficients
and control rod worths have bothered users of JENDL-2. The space
dependences nearly disappear with JENDL-3. This suggests that the
JENDL-3 data are well balanced particularly among neutron production,
absorption and leakage. This balance is partly a result of the
simultaneous evaluation for the main actinides. 235 235
The original fission cross sections of U and Pu in JENDL-2
evaluation were lower and not so different from those of JENDL-3.
After benchmark tests, however, they were artificially increased,
because original JENDL-2 data underestimated the effective
multiplication factors by about 2%. This artificial increase of the
fission cross sections might have disturbed the balance of JENDL-2
data.
2) Effective multiplication factor
From the discussion above mentioned, there occurs a question
how the low fission cross sections of JENDL-3 can be compensated in
the effective multiplication factors. Comparing the data between
JENDL-2 and JENDL-3, the lower fission cross sections might be
compensated with 238
(1) lower capture cross section of U,
(2) lower capture cross section of Cr and Ni,
and (3) harder fission spectrum.
- 32 -

JAERI-M 90-025
If this is the case for Pu-cores, then we can understand that the 235
lower v-value of U causes the underestimation of the effective
multiplication factor in U-cores. 238
The higher inelastic scattering cross section of U seems to
decrease the effective multiplication factor. But this effect is also
related with the slowing down matrix. This will be discussed next.
3) Inelastic scattering and slowing down matrix 238
Comparing the inelastic scattering cross section of U between
JENDL-2 and JENDL-3, most of the difference consists of direct
inelastic scattering to low-lying levels. On the other band, the
increase of the inelastic scattering cross section in JENDL-3 causes
decrease of the elastic scattering cross section, since there exist
little difference in the total cross section.
In neutron transport calculation with multi-group constants whose
group number is less than 100, the slowing down effects above a few
hundred keV region are analogous between the elastic scattering and
inelastic scattering to low-lying levels. Hence there may appear
little difference in the FBR characteristics between JENDL-2 and
JENDL-3.
In order to verify this argument, Takano made a trial 81
calculation for ZPPR-9 on the basis of JENDL-2 by replacing the 238
inelastic scattering cross section and the slowing down matrix of U
as follows.
Case 0: o\ = JENDL-2, M a t r i x = JENDL-2 i n
Case l:o. = JENDL-3, Matrix = JENDL-3 in
Case 2: o. = JENDL-2, Matrix = JENDL-3 in
Case 3: o_, = JENDL-3, Matrix = JENDL-2 in
The results are given in Table 4. Little change is observed, when
both the inelastic scattering cross section and the slowing down
matrix are replaced (Case 0 vs. Case 1). On the other hand, in Case 2
where only the slowing down matrix was replaced to that of JENDL-3, 238 235
the effective multiplication factor and U fission to U fission
ratio are much overestimated because of insufficient slowing down
effects and vice versa in Case 3. 9)
This problem was also pointed by Takeda from his experience on
sensitivity analysis. The effects of changing the fission and capture
cross sections are well predicted with the sensitivity coefficients.
However, the scattering components are not well predicted with the
- 3 3 -

JAERI-M 90-025
sensitivity coefficients of the scattering cross section.
4) Threshold reaction rate and fission spectrum
The threshold reaction rates seems to be overestimated in the 21 238 235
benchmark cores as given in Table 2, though the U fission to U
fission ratio is well*predicted in ZPPR-9. This suggests that the
spectrum Is too hard in MeV region with JENDL-3. This may be partly
caused by the fission spectrum of Madland-Nix type. Recent evaluation 252 10)
of Cf fission spectrum by Mannhart recommends softer spectrum
than that of Madland-Nix. Further study will be required for the
fission spectrum as well as the inelastic slowing down.
5) Sodium void coefficients
Sodium void coefficients were overestimated by more than 20% with
JENDL-2. This overestimation mainly comes from slowing down term,
because the increase of adjoint spectrum is too rapid from 10 keV to 1
MeV as shown in Fig. 13.
Sensitivity analyses showed that fission and capture cross 239
sections of Pu had large sensitivity coefficients below 1 keV. Here it is checked whether the improvement with JENDL-3 can be
239 explained with the change of Pu cross sections.
239 Figure 14 shows the sensitivity coefficients of Pu cross
239 sections, change of Pu cross sections from JENDL-2 to JENDL-3 and
239 the Pu contribution to improve the sodium void coefficients. It is
239 understood from figures that the change due to Pu fission cross
239 section is to the opposite direction and the change due to Pu
239 capture cross section to the right direction, and that Pu cross
sections contribute to decrease the sodium void coefficients only by
0.8%. Hence it is concluded that the significant improvement of
sodium void coefficients with JENDL-3 is not caused by a single 239
nuclide such as Pu but by the balance of all the nuclides.
5. Conclusion
The following can be concluded on the JENDL-3 data from the above
discussion.
1) The balance of the JENDL-3 data is much better than that of the
JENDL-2 data, resulting in disappearance of the space depences of
reaction rates, sodium void coefficients and control rod worths, and
- 3 4 -

JAERI-M 90-025
also resulting in significant improvement of the C/E values of sodium
void coefficients and Doppler coefficients.
2) The results of simultaneous evaluation for JENDL-3 are reliable 235 239
including the low fission cross sections of U and Pu. 238
3) The low capture cross section fo U seems reasonable.
4) The harder fission spectrum than JENDL-2 seems reasonable.
However, there remains some questions whether the JENDL-3 spectrum is
too hard. 23ft
5) The inelastic scattering cross section of U should be further
studied. This should be done by considering the partial inelastic
scattering and the fission spectrum above mentioned. This study will
be made as a task item of NEACRP/NEANDC international cooperation for
evaluation. 235
6) The v-value of U seems too small, resulting in the
underestimation of the effective multiplication factors in U cores.
It is also to be noted that the scattering problems cannot be
easily treated with sensitivity analysis. This should be carefully
considered, when the group cross sections are adjusted with the
integral data.
Acknowledgment
The author with to thank H. Takano and T. Takeda for informing
him of the results of various benchmark tests and sensitivity
analyses. He also acknowledge members of Working Group on FBR
Benchmark Test of JNDC and members of JENDL-3 compilation group for
their helpful discussion.
- 3 5 -

JAERI-M 90-025
References
1) Asami T. et al.: J. At. Energy Soc. Japan, 3_1, 1190 (1989) [in
Japanese]
2) Takano H. and Kaneko K.: Paper to be presented at PHYSOR'90,
Marseille, April 1990.
3) Aoyama T. et al.: JAERI-M 86-004 (1986).
4) Kanda Y. et al.: Proc. Int. Conf. Nuclear Data for Basic and
Applied Science, Santa Fe, 1985, p.1567 (1986), Gordon and Breach.
5) Kazakov T..E. et al.: Yad. Konst., 3, (1986).
6) Baba M. et al.: JAERI-M 98-143 (1989).
7) Madland D.G. and Nix J.R.: Nucl. Sci. Eng., 81., 213 (1982).
8) Takano H.: Private Communication, 1989.
9) Takeda T.: Private Communication, 1989.
10) Mannhart W.: IAEA-TECDOC-335 (1984).
- 36 -

JAERI-M 90-025
Table 1 C/E values of effective multiplication factor
2t Benchmark Cores
At) Cores
U Cores
Pu Cores
Z P P R - 9
J E N D L - 2
1.004
1.005
1.004
0.999
J E N D L - 3
1 0 0 2
0.997
1 .004
1.006
Table 2 C/E values of central reaction sate ratios
J E N D L - 2 J E N D L - 3
28F/25F Pu cores 1.05 1.12
U cores 0.98 1.04
At) cores 1.0 3 1.10
ZPPR-9 0.9 4 1.0 0
49F/25F Pu cores 0.9 7 0.9 9
U cores 0.99 0.99
A!) cores 0.9 7 0.9 9
ZPPR-9 0.9 8 1.0 0
40F/25F Pu cores 1.07 1.12
U cores 1.04 1.09
At) cores 1.0 6 1.11
ZPPR-9
28F/49F Pu cores 1.0 2 1.0 0
U cores 0.96 0.94
A)) cores 0.9 9 0.9 8
ZPPR-9 1.0 5 1.0 4
- 37 -

JAEM-M 90-025
Table 3 C/E values of Doppler coefficients in ZPPR-9
Temperature (K)
298 - 487.5
298 - 644.4
298 - 794.0
298 - 935.4
298 - 1087
J E N D L - 2
0.9 1
0.92
0.88
0.93
0.92
J E N D L - 3
0.94
0.96
0.92
0.97
0.96
Table 4 Effect of the inelastic scattering cross section and slowing down matrix of ^^' ratio for ZPPR-9
U on kefi and reaction
Case 0 Case 1 Case 2 Case 3
Oin = JENDL-2, slowing down matrix = JENDL-2 Oj_n = JENDL-3, slowing down matrix = JENDL-3 o^n = JENDL-2, slowing down matrix = JENDL-3 Cin = JENDL-3, slowing down matrix = JENDL-2
k.ff
F8/F5 F9/F5 C8/F9
Case 0
0.999!
1.07
0.97
0.99
Case 1
0.9995
1.06
0.97
0.99
Case 2
1.0158
1.19
0.98
0.97
Case 3
0.9807
0.93
0.96
1.00
- 3 8 -

JAERI-M 90-025
i n r~ -3* ^o r** »j- —t -~ co — vo - ^ - c n O N L O O N v O C O ^ O C M I — • —.
o C_>
o
— . C M m L O O \ C J N C n o \ a \ C M C O - — M M
r ON
r~ CO
en
i —
CM
m ON
en
r i —
ON ^3-
~
U3 O LO VO LO
CO 1 —
CO
_~ NO
. 1
VO
r~ r — •
r-~
O o CM CO
en CM
>3-
— O r— CO CM
_ —• OO U 3
en
«C U. «C CM — •«• ,—. 03 M3 en I— —t —• io
i
i i m •< it: -c -< i c: -< e e e a iu c c
o_ LU -zz a- o_
en 03 O oo ON
CM lO r-- LO -3" CM ST r I
c o c o c n L O c O i « £ e n c n n : < e u j a : o : o c a . u c - Z a . a . u j a .
> > N N t O N N N L L N £ / ) N N N N
VO - < LO r- \ o
I CM I I cn i \o vo . £=: c ,
< c a a . e o : CM • _ t~~i a_ a_ a_ s : rvi ZLt r-M I V I rvi
2 «
0) IV t l o o
J<S U CO
E o c m
XI
o CO
V fc= 3 ~^ o >
«J l_ O CJ
3 E a) > •H 4-1
cu I+-I
M-l 01
<4-l
o SO
OJ 3 rH
co > w u
60 •H
3/3
- 3 9 -

1.02
HI \ ( j
1.01
1 . 0 0 .
0 .99
0 . 9 8 -
0.97
1
1 I
T
i
-- f
i
/ i
/ /
i
i
A.
: I i
•
/ I
/ 2
/
|
1
V I
*
1
1 1
.A
\ !
- • - E X P . ------- JENDL-2 —+-1 JENDL-3
• i
>
I o
I at
CJ
u.
CM
i <. o li
en o\ i <
"<r Ot
FCA
-r-Ov
FCA
-
U ]
en
FCA
-
i o\
FCA-
Fig. 2 C/E values of e f f ec t ive m u l t i p l i c a t i o n fac tor for the FCA-IX se r i e s cores . Along the hor izon ta l l i ve from l e f t to r i g h t , the neutron spectrum becomes s o f t .

JAERI-M 90-025
O CN
•
o o v—t
o O CO
o
o vu
o o ->f
r A
> O v ^ x
en LL1 j — ^L LU O
LU £T CJ C )
21 O en LL
LU CJ 2 <C
a\ l
OS a, IX N
c
01 4-1
U
c 0
en
•H
3 en
CN
<M
o 01
c T3
c OJ p . HI
T3
HI CJ
a.
o CN
CO
Q M •H
O O o
3 /
41

*• ro
LU
\
U
1.5
1.4
1.3
1.2
1.1
1.0
i i i i i i i i i I i i i i i i i i i i i i i i i i i i i I i i i i i i i i i I i i i i i i i i i
0.9t^_i_ 0 .0
- * - JENDL-2 — JENDL-3
j i ' ' ' ' i I _ J i i i I _ J _ J i • ' ' ' i ' ' ' i i i i • i ' i • • • i i ' ' 100.0 200 .0 300.0
Void Region (L) 400.0 500.0
Fig. 4 Void volume dependence of sodium void coefficients (C/E value) in ZPPR-9
£t
Cross Section (barns)
00
O 3 n i t o m to
to (D O rr
O 3
O cn
CD
c ft-- J o
m
CQ
CD
—4
CM
tn
CO CO
- a
QZO-06 w-raavr

-i—r-r-r
23flPu F I S S I O N i 1 1 — i — i — i — i 1 1 T 1 1—i—i—r—r -n-
i
CO C C_ D
C
o
o CO
CO
CO CO
o c_
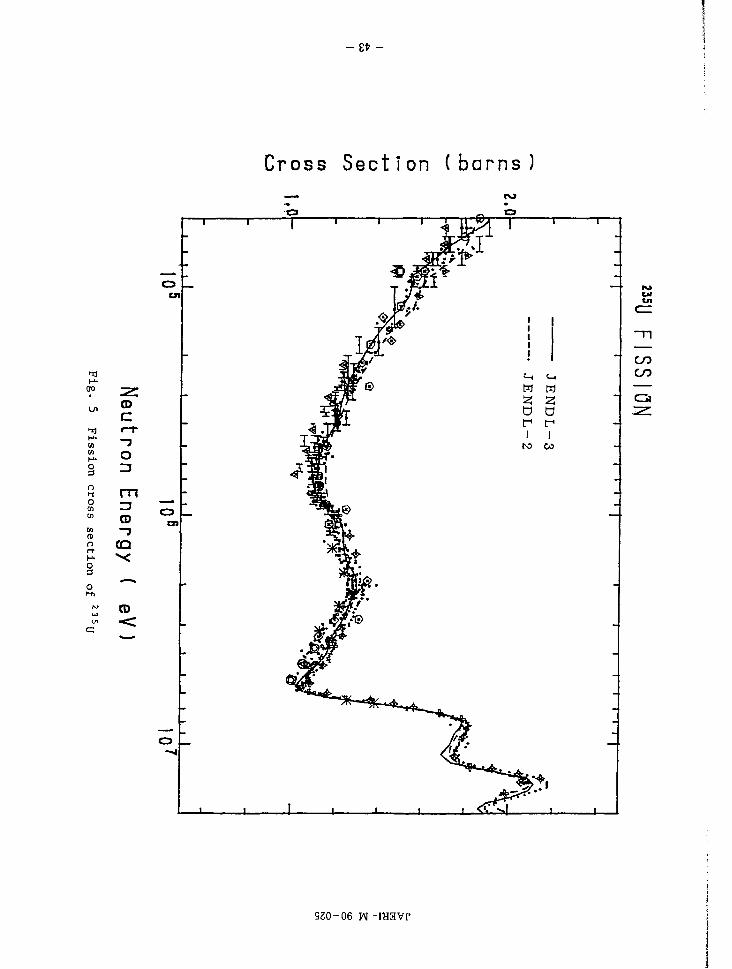
2.0
J E N D L - 3
J E N D L - 2
>
J • ' ' I J 1 I I I I I J I I I I I I
10 10D
Neut ron Energy ( eV )
2 3 9 . Fig. 6 Fission cross section of i J ,Pu

0° 9
8
7
6
5
U 2 3 8 CAPTURE CROSS S E C T I O N 1 1 1 1 — r — i — i — i — i — -r -r -r
10"' 9
8
9
® © O o
o
JY.V.ADAMCNUK+
K.DIETZE
B.L.QUAN+
V.P.VERTEBNYJ+
N.YAMAMUR0+
W.P.POENITZ+
L.E.KAZAK0V+
JENDL-2
JENDL-3
«*
•77
'77
'78
'80
'80
•81
'86
©
® @ ®
*
A.A.BERGMAN+
M.C.MOXON
J.S.BRZ0SK0+
M.P.FRICKE+
V.B.CHELN0K0V+
R.C.BL0CK+
G.DE SAUSSURE+
T.Y.BYOUN
T.B.RYVES+
K.RIMAWI+
W.P.POENITZ
R.R.SPENCER+
R.R.SPENCER+
JU.G.PANITKIN+
'70
'71
'71
'7!
'72
'72
'73
•73
•73
•75
•75
'75
'75
•75
- I I ,,, I L . -1 ' '
10' 10J
Neutron Energy ( eV)
Fig. 7 Capture cross section of 238,

&
I - 1
3.0
(0
c £_ •
o 2.0
o CO
to
o
0.0V
238U I N E L A S T I C CROSS SECTION -i 1 1—i—i—t—r -i 1 1 1—i—i i i -i 1 1 1—i—i i i
JENDL-3
JENDL-2
• Tohoku Univ
105 106
Neutron Energy ( eV )
> w so
Fig. 8 Total inelastic scattering cross section of U

JAERI-M 90-025
m i i i i—r- [11111 I I 1 (TTT
O I CD
o CD Q .
CO
C
o CO
en
3
>-CD
>•* o> l_ CD c
JJ
c o c_
3 CD
z
JE
ND
L-
3
1 A
tN 1
• J
Q
2 W • -3
1 1 1 1
3 PL,
m
U-l O
rum
u
spe
c
Fis
sio
so •H fa
josdej uo j ss j j
- 4 7 -

6
MAT 2240 IN.GRnMfl) CROSS SECTIONS
24 -CR-NflT
JENDL-2 JENDL-3
-75-8 TO 37-0 7. DIFFERENCES
JENDL-3 / JENDL-2 l l | t | M i l l U l l j •«• i
iMllnufl "t> M i l * I
10'
10u
ID"
- 2
10 r 8 10 -7 10" 10 - 5 10 -4
-L
10
i o - 3
I D " 4
1 .6
1 -2
0 .8
0.4
0 .0
10 -3 10
-2 10" 10u
MEV 24 10'
•CR-NflT
OS cr 03
<x
> w 2 i
2
tlflt Fig . 10 Capture cross sec t ion of Cr
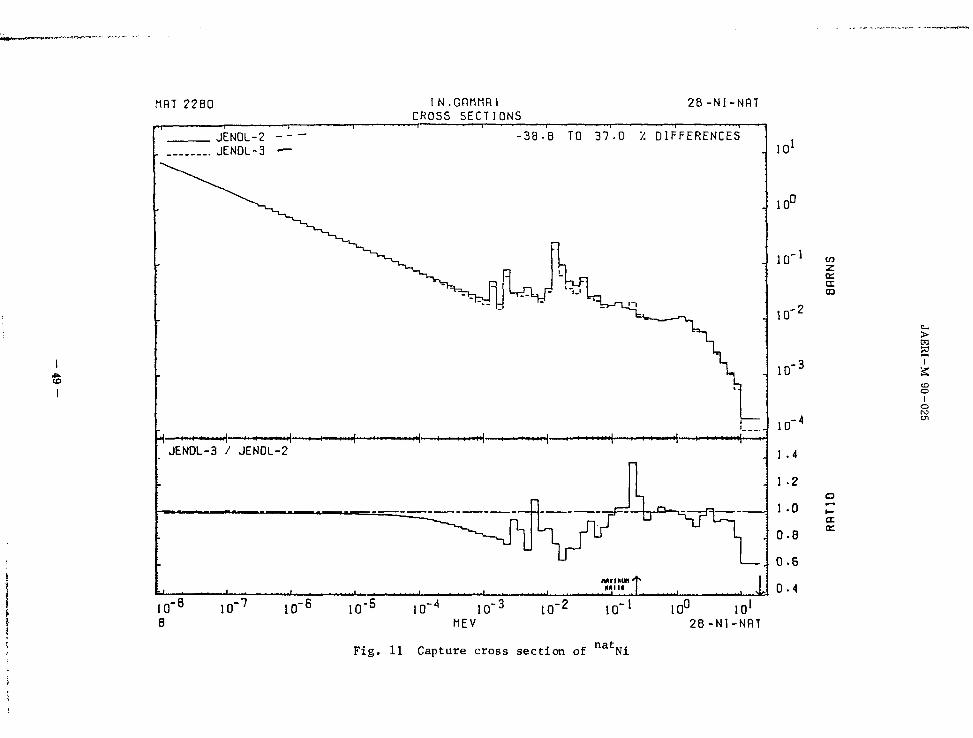
MAT 2280 I N.GFmMRl CROSS SECTIONS
2 8 - N i - N R T
JENOL-2 JENDL-3
- 3 8 - 8 TO 3 7 - 0 '/. DIFFERENCES
^hr "•-'
• ^ - < • ! > • * • • ****{ *'•'* » •'* 11 ( ( " • " • • < ' • • ! • ! I I H l ( I I ••< • ! I I l l l | i < • • ! I t n M J " . < — > . ^ » » * » < | j I I I > > * * j » • • [ • ! | i l i t ) • ••»• | - * > + « l ^ . . — -»•
JENOL-3 / JENDL-2
U b * * ^ = A S
10 -8 10 10" 10 -5
M I M i
101
10u
1 0 " 1 «"
<X CO
10
10
-2
10 ,-4
1 .4
i 1 -2
1 .0
4 0 .8
C 6
0.4
(X
10" 10 -3 10 -2 10
MEV I0U 10 l
28-NI -NRT
Fig. 11 Capture cross section of n a Ni
> 2 T
CD O I
O

MRT 2923 TOTAL NU-BRR 92-U.-23S
JENOL-2 JENOL-3
-2-27 TQ I -OS /. DIFFERENCES
H — I—' • ' " H — | — i — n JENDL-3 / JENDL-2
"S_
Km I
I 0 " 8 10"7
inuH't4 I no I 1 ' ^
nimnu» •am - • •
4 .5
4 .0
3-5
3 .0
2 .5
1 .01
1 .00
0 .99 a
0 .98
0 .97
10"6 10"5 10"4 10" MEV
1Q"2 10"1 10° 10l
92-U -235
> M 2 7 2
Fig . 12 Number of neutron emission per f i s s i o n of 2 3 5U

1 i n
*-• 1
2 =) >-< 01 h-»—< CQ
o; <
3.0
2.5
2.0
1.5
1.0
0.5
( * 1 0 - 2 )
o.o
- i — i — 1 1 1 1 1 1 1 — i — i — i — 1 1 1 1 1 1 — i — i — 1 1 1 M i [ H i r I I I 11 1 1—i I I I 111 1 1—I I I I 11
ru
u i . .
l>r*
-<— JENDL-2
•+•- JENDL-3
101
^** lk?*fc?=?33#2 i7
- i—i i 1 1 1 i i I _ _ J i i 111 n i i i i 111 u i • i i 1111 . i i i i 11111 i i i i
1 0 2 1 0 3 10A 10 5 10 6 10 7
ENERGY (EV)
>
o I
Fig . 13 Comparison of adjoint neutron spectrum at core center of ZPPR-9

JAERI-M 90-025
g 20 § (%)
1 to •o
* 0
«-io
o
| - 2 0
-i 1 1 1 r
5 - | 0 3
(%) 2 -
§ 0
•I -
o
5 -2
I"3
to'
(a)
. J"" 1 —
TP PJ TT
— Pu-239 fission
— Pu-239 capture
1
1
1
(c) — fission (Sum+0.3%)
— capture (Sum -1.1%)
- .
L_
-J " n - P 1
l l 1
102 I03 104 105 106
En (eV)
Fig. 14 Sensitivity analysis of Na void coefficients
a) Sensitivity coefficients of 39Pu cross sections
b) Relative change of 9Pu cross sections between JENDL-3 and JENDL-2: (JENDL-3 - JENDL-2)/JENDL-2
c) Contribution of 39Pu cross sections to change of Na void coefficients
- 5 2 -

2.1.4 JENDL-3 FP Data File
JAERI-M 90-025
JNDC FPKD Sub-Working Group
T. Watanabe (KHI), M. Kawai, S. Iijima (TOSHIBA),
H. Matsunobu (SAEI), T. Nakagawa, Y. Nakajima, T. Sugi (JAERI),
M. Sasaki (MAPI), A. Zukeran (HITACHI)
Abstract
Evaluation work for JENDL-3 FP data file has been
continued since 1985, and now evaluation work is on its final
stage.
In this presentation, current status, contents of the
file, evaluation methods, and discussion on evaluated data are
briefly given.
1. Introduction
JENDL-2 FP data file contains the evaluated data for 100
FP nuclides, important mainly for FBR calculation.
However, the number of FP nuclides is not enough to
general application, such as burnup calculation of various type 2 3 of reactors ' , neutron dosimetry, diagonostics, and nuclear
transmutation calculation in fission and fusion reactors.
Reaction types considered in the JENDL-2 FP data file are
insufficient for these applications, radiation damage and
activation analysis. So the number of nuclides and reaction
types has been extended for JENDL-3 as shown in Table 1 and
Fig. 1.
It was the main target of JENDL-2 FP data evaluation to
evaluate accurately capture cross section. However, accuracy of
the capture cross sections was not always enough to satisfy the
required accuracy of 10 - 30 %. It seems that the uncertainty
might come from the discrepancies in resolved resonance 4
parameters . In the integral test comparing with reactivity 5
measurements in STEK reactor , many nuclides with small
-53-

JAER1-M 90-025
absorption cross section showed large discrepancies between the
calculations and the measurements. From Fig. 2, it is seen that
these discrepancies depend on scattering component of the
reactivity, and particularly come from inelastic scattering
cross sections.
In order to overcome these discrepancies, evaluation of
resolved resonance parameters and cross sections based on
recent experimental data and more refined nuclear models is
necessary.
The integral test of JENDL-2 also suggested the necessity 152
of reevaluation of data for several isotopes such as Eu and Eu which have no experimental data .
2. Computer programs for evaluation
Programs shown in Fig. 3 were used to evaluate the data
and to compile JENDL-3 FP data file.
The multilevel Breit-Wigner formula was employed in the
resolved resonance region. Resonance parameters from EXFOR or
other literature were stored and handled with REPSTOR code.
Parameters of each level was determined by taking account of
recent experimental data and Mughabghab's evaluation as well as
JENDL-2. If values of orbital angular momentam l or spin J were
not given, PASSIGN and JCONV codes were used to determine them. 7
In PASSIGN code, the method of Bollinger and Thomas is
applied to assign i. value.
Using Bayesian theorem, the probability Pp(gTn) that the
level of resonance is excited by p wave neutron is expressed as
follows.
r. / r. v i. /<gi Tiii > r gTn , I 1 . ,. ' Pp (grn >-{l+a, v f < g r n o > c , p [ - r - ( _ _ _ _ T _ _ ) ] |
<gY n0 >-VTD„b. So
<gTn , >-7 . 3 x [ 0 " A 2 ' 3 E J 2 D „ t . S ,
- 54 -

JAERI-M 90-025
SQ, S. , Dobs are s and p wave strength functions and the
observed level spacing respectively. A is atomic mass and a is
a ratio of apriori probability of s and p wave resonance. If E
< 0 or P < 0.5, then I was assigned to be 0, and if P > 0.5, P P
J was assumed to be 1.
Spin J value is assigned with JCONV code to satisfy the
following probability distribution.
P(J)-(2j+l)exp[- R]/ (2J+l)expC- ]
where o2 is a spin cutoff factor.
Below 100 kev, unresolved resonance parameters were Q
determined with ASREP code . Nuclear radius R' is determined to
reproduce the total cross section at 100 kev, and level spacing
D to express the capture cross section under the assumption of
the fixed Vy value.
Above 100 kev, the spherical optical model and the
statistical theory were employed to estimate the capture,
elastic, compound inelastic scattering and total cross sections
with CASTHY code .
Direct inelastic cross section was calculated with DWBA
code DWUCKY for even mass FP nuclei around fission yield
peak.
Multistep evaporation and preequilibrium model code
PEGASUS calculation was applied to calculate threshold cross
sections for all nuclides. And these threshold cross sections
and direct inelastic cross sections were taken into account as
competing cross sections in statistical model calculation with
CASTHY code.
In Mev region direct/semidirect capture cross section 12
is also taken into account with following formula
- 55 -

JAERI-M 90-025
DSD ,i \ I M K L J J -' R4 En l x - ' Ey 10 - , 0 . a n y (fcn) - M b l A J • (2 + 0 5 E n i , 6 8 E n l / 2 / R ) 1
ri , 0. 7 5 E H Ey - 0. 6 I E R , 11 ( E y - E „ ) 2 * ( P R / 2 ) 2 J
R Nuclear Radius E„ 8«A,/B
TR 5. OMe? 0 Nuclear Deformation Ey En + Sn/2 Sn Neutron Separation Energy o( Daughter K Norma ligation Constant
Level density parameters at low excited energies were
evaluated on the basis of recommended level schemes in the 13 Evaluated Nuclear Structural Data File (ENSDF) . The program
ENSDFRET retrieves the level scheme data from ENSDF. LVLPLOT
makes a staircase plot of number of excited levels. LEVDENS
determines the parameters of Gilbert Cameron's level density
formulas so as to fit to the staircase plot of levels, and
observed level spacings. The optical r..odel parameters were 14 evaluated with the NDES so as to fit the experimental data of
total cross sections, neutron strength functions and nuclear
radius. The determined parameters were stored into a data base.
These parameters were used for calculations with CASTHY
and PEGASUS. The input and the job control data of CASTHY for
many nuclides were made one by one with the JOBSETTER code
using PARAMFL as a data base.
3. Important parameters for calculation
Resolved resonance parameters were adopted mostly from
JENDL-2 and Mughabghab et al . Status of the resonance
parameters is shown in Table 2.
For most nuclides, the spherical optical potentials used .
in JENDL-2 were also adopted basically ° in the CASTHY
calculation. However, some revision were made as shown in Table
3. These potentials are also adopted to evaluate direct
inelastic scattering cross sections with DWUCKY and threshold
reaction cross sections with PEGASUS. To calculate the inverse
reaction cross sections due to charged particles, grobal fit , -. ,_ 17-V20 , ^ , optical model parameters were adopted.
-56-

JAERI-M 90-025
Nuclides of which direct inelastic scattering cross
section was evaluated are shown in Table 4. Nuclear deformation
parameters to these nuclides were adopted from litera-21,22 tures
Level density parameters of the Gilbert - Cameron's 23 24 formula were newly determined ' from low-lying levels and
the observed resonance spacings. When these data were not
available, the systematics for 'a' shown in Table 5 and the
following T were used.
T = 65/A A < 100
= 0.65 - 0.00242 (A - 100) A > 100
where A is a nuclear mass number.
The gamma-ray strength functions were adjusted to fit the
capture cross sections. Its systematics was investigated by 25
using the ratio of radiation width to observed level spacing
From the local systematics, gamma-ray strength functions were
estimated for the nuclides which had no experimental capture
cross sections.
Systematics of ratio of capture cross section at 2200 m/s 2200 (a ) to a calculated with CASTHY and observed level
c c 2200
spacing were investigated and used to estimate a in the
case where no measured data were available as shown in Fig. 4.
The Kalbach's constant K, which represents the strength of
the pre-equilibrium transition rate, was estimated as K = 3
0.1/(g/A) (±50%), where g is the single particle level density of the composite nucleus. The estimation is based on the
expression of two-body interaction in nuclear matter by Kikuchi
and Kawai . The value of K and level density parameters of
some nuclides were adjusted to the measured (n,2n) cross
sections.
-57 -

JAEM-M 90-025
4. Results 2200 In Table 6, comparison of oc and resonance integrals
are shown for nuclides which have large discrepancies from
ENDF/B-V and for dominant nuclides for thermal reactors. Large
discrepancies are found for the nuclides which have no measured
thermal corss sections and resonance integrals. Summations 235 weighted by U thermal fission yields differ from ENDF/B-V
by 25.6% to oc and by 1.4% to resonance integrals,
respectively.
As for kev region, capture cross section comparison
between JENDL-3 and 2 is shown in Table 7 for strong absorbers
important for FBR burnup calculation. For most nuclides in this
Table, capture cross sections of JENDL-3 are almost the same as
that of JENDL-2, however, for Pd, Sm, Eu, modification
of capture cross sections from JENDL-2 are in the direction to
get better c/E of integral test. As in the resonance region,
the cross sections were improved largely, and oc, oin, eel are
evaluated with more refined method as shown Fig. 3, we expect
to have better C/E to the integral test than that of JENDL-2.
About 95% evaluation work finished and check of evaluated
results, graph check and production of comment file are now in
progress. It will be completed in early time of 1990.
-58 -

JAERI-M 90-025
References
1) T. Aoki et al.: Proc. Int. Conf. on Nuclear Data for Basic
and Applied Science, May 1985 Santa Fe vol. 2, p.1627
Gordon and Breach Sci. Pub. (1985)
2) S. Iijima et al.: J. Nucl. Sci. Technol., _^9, 96 (1982)
3) S. Iijima et al.: JAERI-M 87-025, p.230 (1987)
4) M. Kawai et al.: JAERI-M 88-065, p.57 (1988)
5) T. Watanabe et al.: JAERI-M 86-080, p.30 (1986)
6) T. Watanabe et al.: JAERI-M 88-065, p.148 (1988)
7) L.M. Bollinger and G.E. Thomas: Phys. Rev. 177, 1293
(1968)
8) Y. Kikuchi: private communication
9) S. Igarasi: J. Nucl. Sci. Technol. j 2, 67 (1975) and
private communication
10) S. Yamamuro: JAERI-M 88-140 (1988)
11) S. Iijima et al.: JAERI-M 87-025, p.337 (1987)
12) V. Benzi and G. Reffo: CCDN-NW/10, p.6 (1969)
13) J. K. Tuli: BNL-NCS-51655
T. Tamura: JAERI-M 85-035, p.330 (1986)
14) T. Nakagawa: J. At. Energy Soc. Japan 2^, 559 (1980)
15) S.F. Mughabghab et al.: Neutron Cross Sections vol.1 part
A & B Academic Press (1981, 1984)
16) S. Iijima and M. Kawai: J. Nucl. Sci. Technol. ^0_, 77
(1983)
17) F.G. Perey: Pnys Rev. 131, 745 (1963)
18) J.R. Huizenga and G. Igo: Nucl. Phys. 29, 462 (1962)
19) J.M. Lohr and W. Haeberli: Nucl. Phys. A232, 381 (1974).
20) F.D. Becchetti Jr. and G.W. Greenless: Polarization
Phenomena in ar Reactions (H.H. Barshall and W. Haeberli,
eds), p. 682 The university of Wisconsin Press. (1971)
21) S. Raman et al.: At. Data and Nucl. Data Table 42, 1
(1989)
22) R.H. Spear: At. Data and Nucl. Data Table ^ 2 , 55 (1989)
23) S. Iijima et al.: J. Nucl. Sci. Technol. 2JL, 10 (1984)
24) S. Iijima et al.: to be published
-59 -

JAERI-M 90-025
25) M. Kawai et al.: Proc. Int. Conf. on Nucl. Data for Sci.
and Technol. May 1988 Mito p.569 (1988)
26) K. Kikuchi and M. Kawai : Nuclear Matter and Nuclear
Reactions (1968)
60-
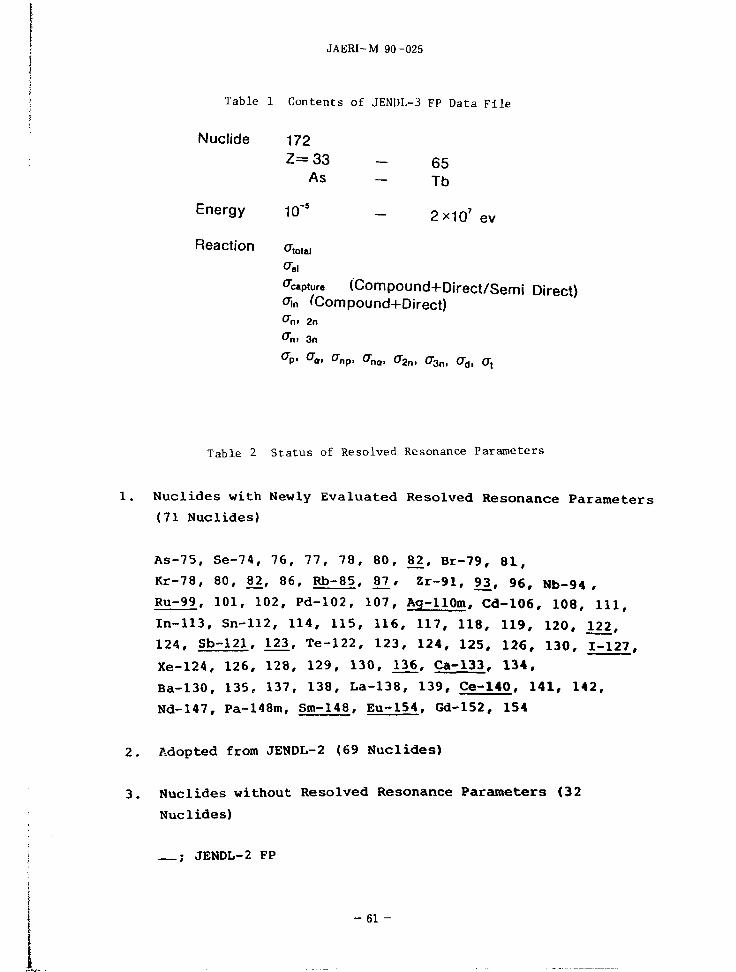
JAERI-M 90-025
Table 1 Con ten t s of JENDL-3 FP Data F i l e
Nuclide
Energy
Reaction
65 Tb
2xio 7 ev
172 Z = 3 3 -
As -
10-5
C'total
Capture (Compound+Direct/Semi Direct) oin (Compound+Direct) °ni 2n an> 3n
°P- a» Cnp. < W CT2n, <73ni ad , (7,
Table 2 S t a t u s of Resolved Resonance P a r a m e t e r s
1. N u c l i d e s wi th Newly E v a l u a t e d Resolved Resonance P a r a m e t e r s (71 Nucl ides)
A s - 7 5 , Se -74 , 76 , 7 7 , 7 8 , 8 0 , 82!, B r - 7 9 , 8 1 , Kr-78 , 80, 8_2, 86 , Rb-8S, 8 2 , Z r - 9 1 , 9_3, 96 , Nb-94 ,
Ru-99, 101 , 102, Pd -102 , 107 , Aq-llOm, Cd-106, 108 , 1 1 1 ,
I n - 1 1 3 , Sn-112, 114, 115 , 116, 117, 118, 119, 120, 122, 124, Sb -121 , 1_23, T e - 1 2 2 , 123 , 124, 125, 126, 130, 1 -127 , Xe-124, 126, 128, 129, 130, 1JJ6, Ca-133, 134 , Ba-130, 135, 137, 138, L a - 1 3 8 , 139, Ce-140 , 1 4 1 , 142, Nd-147, Pa-148m, Sm-148, Eu-154, Gd-152, 154
2 . Adopted from JENDL-2 (69 N u c l i d e s )
3 . N u c l i d e s wi thou t Resolved Resonance Parameters (32
Nucl ides )
; JENDL-2 FP
- 6 1 -

Table 3 Optical Model Parameters
Application range
As-Rb
Sr-Mo
Tc-Rh
Rd-Cd
In - Sb
Te - X e 1 3 3 C 5
,34Cs - l i 7Cs
B»
U - Ce
Pr
, 4 a Nd-» 4 3 Nd , 4 4 Nd- , 4 «Nd 1MNd
Pm
,44Sm.,4»Sm, ,50Sm, l i 4Sm ,47Sm, ,4»Sm
Eu
Gd
Tb
Vo
46-0.25E
46-0.25E
47.5
50.1-0.5528E
47.64-0.473E
4S.97-0.199E
46.0-0.25E
46.0-0.125E +0.0004E'
41.8
41.8
46
45.76
47.94
47.94
46
46.96-0.0172E
43.42-0.1879E
44.77-0.0164E
38.0
40.7-0.016E
R0
5.7
5.893
5.9723
5.972
6.2556
6.481
1.16Al/3
+0.6
1.16A1'3
+0.6
6.8886
1.327A,/3
1.16A,/5
+0.6
1.29A,/5
6.718
1.27 A"'
1.16A,/3
+0.6
1.19A'/'
l.lSSA'''
1.272A,/s
7.439
1.324A,/S
a0
0.62
0.62
0.62
0.56
0.62
0.62
0.62
0.62
0.62
0.62
0.S2
0.6
0.6
0.6
0.62
0.655
0.6
0.475
0.47
0.47
ws
7.0
7.0
9.74
8.165
9.744
6.502
7.0
7.0
2.931
2.95+0.789E
7
6.97
9.13
9.13
7.0
8.455
9.87S-0.0019E
6.878-0.1408E
8.0
11.3
Rs
6.2
6.393
6.5942
6.594
6.4687
6.9257
1.16A1'3
+1.1
1.16A'/J
+1.1
7.0986
1.367A,/3
1.16A"» +0.6
1.23A'/»
7.564
1.43A,/S
1.16A"3
+0.6
1.44A,/5
1334A""
1.44 A >"
7.439
1.338A1''
a,
0.35
0.35
0.35
0.44
0.35
0.35
0.35
0.35
0.35
0.35
1.0
0.45
0.45
0.45
1.0
0.448
0.45
0.45
0.52
0.47
Vso
7.0
7.0
7.0
5.261
7.0
7.0
7.0
7.0
7.0
7.0
7.0
7.0
7.0
7.0
7.0
7.0
7.0
7.0
7.0
7.0
Rso
5.7
5.893
5.97
5.97
6.241
6.49
1.16A"3
+0.6
1.16A1/3
+0.6
6.89
1.327A,/3
1.16A"3
+0.6
1.28A"3
6.771
1.28A"3
1.16A'/3
+0.6
1.28A"3
1.355A,/3
1.272A"3
7.439
1.324 A'"
aso
0.62
0.62
0.62
0.267
0.62
0.62
0.62
0.62
0.62
0.62
0.62
0.6
0.6
0.6
0.62
0.6
0.6
0.48
0.47
0.47
Chan|«from JENDL-2
Sr's OMP with R changed
Rso
New OMP
Rso
Ro, Rso
Igarasi's OMP
Rso
Moldouet
Moldouer
New OMP
New OMP
New OMP
New OMP

JAERI-M 90-025
Table A Nuclides List of DWBA Calculation
96Ru* 104 p d *
106Cd 130B a<™
140Ce 142Nd 144Sm
98Ru* 106 P d
108Cd 132Ba 142Ce 144Nd
1 0 0 R u
108 p < j
110Cd 134Ba
146Nd
102Ru no P c j
112Cd 136 B a *
148Nd
104Ru*
114Cd* 1 3 8 B a
i s o N d
116 Cd*
* ; & only (R) ; Rotational
Table 5 S y s t e m a t i c s of Level D e n s i t y P a r a m e t e r a
A C, (N-N,) + C2 (N2 -N) a = A iv^; + ° 3 (MeV_1>
A : Atomic Mass Number N : Neutron Number
N
N ^ 1 7 18 ^ N ^ 27 28 ^ N ^ 41 42 ^ N ^ 49 50 ^ N ^ 59 60 ^ N ^ 81 82 ^ N ^ 88 89 ^ N ^ 98 99 ^ N ^ 116
1 1 7 ^ N ^ 1 2 6 1 2 7 ^ N ^ 1 3 9 140 ^ N ^ 146
N £ 1 4 7
N,
1 18 28 42 50 60 82 89 99
117 127 140 147
N2
17 27 41 49 59 81 88 98
116 126 139 146 200
c,
0.0 0.15 0.193 0.155 0.185 0.114 0.166 0.124 0.123 0.041 0.154 0.124 0.120
c2
0.0 0.15 0.122 0.187 0.104 0.182 0.100 0.171 0.123 0.116 0.058 0.141 0.120
C3
4.0 0.0 0.0 0.0 0.0 0.0 0.0 0.0 0.0 0.0 0.0 0.0 0.0
- 6 3 -

Table 6 Comparison of Thermal Capture Cross Sections and Resonance Integrals between ENDF/B-V
Vatues of) R - - - — L -1 ) are given ' JENDL-3
NUUDE
Rh-105 Xe-135 Nd-143 Pm-147 Pm-149 Sm-149 Eu-151 Sn-114 Sb-124 )-131 Xe-131 Xe-133 Ba-135 Ce-141 Nd-147 Pm-148 Sm-147 Sm-153 Eu-156
Weighted SUM
oc(2200m/s)
0.0 0.0 0.015 0.085 0.0 0.041 0.0 7.835 0.626 0.991 0.059 0.0 0.004 0.004 0.886 0.0 0.123 0.214
119.5
0.256
Rt
1.89 0.003 0.012 0.032 0.489 0.071
0.081 0.353 0.927 0.898 0.129 2.956 0.233 0.952 0.027
14.926 3.440 2.994 4.738
0.014
Remarks
NO RRP
NO RRP
NO RRP NO RRP
NO RRP
NO RRP
Table 7 Comparison of o with JENDL-2
NUCUDE
"Mpd
'°3Rh
""Ru
MTC
"3CS
107 pd
""Sm
"?Mo
"'Mo
"Tm "SNd
' 'Sm
'^Cs
"'Xe
'MAg
"SNd
"*Ru 153gu
'MRu
15) Eu
<yc (JENDL-3)
Cc UENDL-2)
-1 «200KeV)
-1 -1 -1 (<500KeV)
-1 -0.95«100KeV)
-1.05
-1 «200KeV)
-1 «1MeV)
-1 «1MeV)
—1
-0.8
-1
-1
-1 «400KeV)
-1
-1 «3MeV)
-1
-1 «1MeV)
-1.1 «70KeV)
C/E of JENDL-2 iNTEGRAL TEST
STEK
0.98
1.06
1.01
0.9
0.8
0.97
1.0
1.04
1.03
0.91
0.88
0.99
0.88
1.05
0.83
0.91
2.09
0.94
1.25
0.86
EBR or CFRMF
1.23
0.91
0.88-0.97
1.1
0.81
0.67
0.85
1.02
0.88
0.95
0.68

> SO
Fig. 1 Nuclides in JENDL-3 FP data file

C/E
J A E R I - M 9 0 - 0 2 5
A04Pd
, 1 0 8 P d
104Ru
/ 102Pu
148Nd
ISOSm /
4 / ' / l 4 0 C e
/ / j . 4 2 C e
O.Ol o.x
SCATTERING COMPONENT (STEK)
F i g . 2 C/E of STEK i n t e g r a l t e s t f o r w e a k a b s o r b e r s
- 6 6 -

JAERI-M 90-025
(ENSDFY
X T 0 R E P
R E P S T O R
Work F i l e
R E P S T O R
P A S S I G N
* J C 0 N V
_£ R e s o l v e d
Res. Param.
* ENSDFRET
D E S
0 M P
D W U C K Y
O d i t .
Unreso lved .
Res. Param.
L e v e
JOBSETTER
C A S T H Y
L V L P L O T
L E V D E N S
I n v e r s e a
P E G A S U S
a thresh
A S R E P f a., a i. a c. < ? • „ /
C R E C T J 5 C O M M E N T
/ AD C OM
Fig . 3 Evaluation system
- 6 7 -

JAERI-M 90-025
10
10"
o° XO-'l
10"
10-*L
O Zr
\
10
\ \
\
9 3 * \
' > •
9 5 Z r (Example)
C - 1 . 5 x 10" ' , o c (CASTHY)-800 b a r n s
a c ( 2 2 0 0 ) - 1 . 2 b a m
, *
91
\ \
Evaluated
\ ^ 0 5 2
\
94 \ o\ \
90 O \ > 9 6
\ \
\ 10» 1 0 '
Dobs <eV)
10* 1 0 1
Fig. 4 a c2 2 0 0 evaluation using systematics
-68

JAERI-M 90-025
2.1.5 Benchmark Test for Fusion Reactor
Hiroshi MAEKAWA
Japan Atomic Energy Research Institute
Tokai-mura, Naka-gun, Ibaraki-ken, 319-11 Japan
Fusion Neutronics Integral Test Subworking Group*
in Japanese Nuclear Data Committee
ABSTRACT
The cross section set, as a standard set for fusion neutronics, was
prepared for the benchmark test of JENDL-3. The set named FUSION-J3
consists of 40-group gamma and kerma as well as 125-group neutron. This
report is based on the benchmark tests performed by four groups. The status
of nuclear data is discussed for 14 nuclei in JENDL-3. The Be and Pb data,
whose problems were pointed out for JENDL-3T, have improved remarkably. The
benchmark test for gamma-ray has been done for only Si, Ti and W. The
benchmark tests for the other gamma-ray data and nuclear heating will be
carried out soon.
* Members of Subworking Group : H. Maekawa (Leader), H. Handa, A. Hasegawa,
C. Ichihara, T. Iguchi, S. Iwasaki, K. Kobayashi, K. Kosako, M. Kawai,
K. Maki, S. Mori, M. Nakagawa, Y. Oyama, Y. Seki, H. Sekimoto, K. Sin,
A. Takahashi, K. Ueki, J. Yamamoto
(Members with underline are contributors of this report.)
- 69 -

JAER!-M 90-025
1. INTRODUCTION
The first activity of Fusion Neutronics Integral Test Subworking Group
was to perform the benchmark test of JENDL-3T. For this purpose, the 125-
group cross section set for ANISN and DOT3.5, named FSX125/J3T'', was
distributed to universities and institutes. The cross section library for
the Monte Carlo code MCNP was also distributed by the MCNP Library
Compilation Subworking Group in Research Committee on Reactor Physics.
Results of these benchmark tests were reported at the 24th and 25th
meetings of Subcommittee on Fusion Reactor in Research Committee on Reactor
Physics and at the 1987 Seminar on Nuclear Data^'. Discussions at the latter
meeting concentrated mainly upon the problem in the data of Be and Pb.
The following conclusion was drawn from the benchmark test:
Tritium production rates in a fusion blanket contained mainly LisO or Li
can be estimated by the use of JENDL-3T nuclear data within 5%. But the
accuracy of tritium production rate estimated is unsatisfactory for a
blanket with Be or Pb neutron multiplier. Re-evaluation was strongly
recommended for the nuclear data of Be and Pb.
The cross section set for ANISN and DOT3.5, as a standard cross
section set for fusion neatronics, was prepared for the benchmark test of
JENDL-3. The specifications of set are the same as those of the FSX125/J3T
except for the gamma data. The set named FUSION-J3 consists of 40-group
gamma and kerma as well as 125-group neutron. The feature of FUSION-J3 is
described separately in this proceedings.^'
Benchmark test plan of JENDL-3 for fusion neutronics is summarized in
Table 1. Most of experimental data used in the benchmark test were produced
in Japan. At the second meeting of Fusion Neutronics Integral Test
Subworking Group held on Nov. 9, 1989, some results of JENDL-3 benchmark
test were reported by FNS and OKTAVIAN/KUR groups. A calculational result
for the shielding benchmark problem^', which was one of ITER activities,
was also reported at the meeting. This report is based mainly on the
contents reported and discussed at the meeting, and on the benchmark test
done by Nakagawa using the MORSE-DD code"'.

JAEM-M 90-025
2. STATUS OF NUCLEAR DATA IN JENDL-3 RELEVANT TO FUSION NEUTRONICS
The following comments on JENDL-3 are pertinent from the present
benchmark tests.
IJd
As the data of ?Li were a little modified from JENDL-3T based on the
previous benchmark test?' , the status of Li data seams to be good enough
for fusion reactor design. A sample of benchmark test"' is shown in Fig. 1.
s Be
Measured and calculated angular neutron flux spectra on Be slab'' is
shown in Fig. 2. The calculated result based on JENDL-3 is improved largely
in the range of 4 ^ 10 MeV. While there still exists an overestimation in 1
- 2 MeV. The same result was observed in the analysis of leakage spectrum
from a Be sphere"' shown in Fig. 3. From these analyses of time-of-flight
experiments and of integral experiments on Be assembly and Be-sandwich Li?0
assembly, the status of Be data is fairly well.
:1C
Agreement is excellent on the whole for the angular flux spectra on
graphite slabs'' shown Fig. 4. As the data for the second inelastic level
in JENDL-3 was modified from those in JENDL-3PR2, the agreement improved
remarkably at the peak near 7 MeV. A sample of C/E distribution"' is shown
in Fig. 5 for 27Al(n,a)?"Na in a graphite assembly. The status of '?C data
is very good.
^ N
The data of (n,d), (n,t) etc. in JENDL-3 were modified from those in
JENDL-3T. Angular neutron flux spectrum on liquid nitrogen"' is shown in
Fig. 6. There is a large difference between calculated and measured
spectra. It is not clear right now the reason why such large deviation
exists. In order to check the nuclear data processing code, an analysis
using the Monte Carlo code MCNP is being carried out.
- 71 -

JAERt-M 90-025
' 6Q
Angular neutron flux spectrum on liquid oxygen"' is shown in Fig. 7.
As the difference between JENDL-3 and JENDL-3T data is a little, almost the
same results are observed between them. From this analysis and the results
of benchmark test using the integral experiment on the LisO assembly, the
data of '60 are reasonable.
Al
Neutron leakage spectrum from Al sphere*' is shown in Fig. 8. A fairly
well agreement is observed between calculated and measured spectra.
Si
Neutron and gamma-ray spectra from Si sphere'' are shown in Fig. 9.
From this benchmark test, the status of both neutron and gamma-ray data for
Si seam to be good enough for fusion neutronics analysis.
Ti
Neutron and gamma-ray spectra from Ti sphere'' are shown in Fig. 10.
There are some problems in both neutron and gamma-ray data.
Mn
From the analysis of TOF experiment on Mn sphere"', the status of Mn
data is good.
Cr
From the analysis of TOF experiment on Cr sphere*', the status of Cr
data is fairly well. But there is some deviation between the calculated and
measured spectra below 1 MeV shown in Fig. 11.
Cu
From the analysis of TOF experiment on Cu sphere*', the status of Cu
data is fairly well.
Mo
From the analysis of TOF experiment on Mo sphere'', there are some
problems in the Mo data.
i
- 7 2 -

JAERI-M 90-025
Neutron and gamma-ray spectra from w sphere'' are shown in Fig. 12.
From this analysis, there are some problems in both neutron and gamma-ray
data.
Pb
A sample of angular neutron flux spectra on Pb slabs'" is shown in Fig.
13. Excellent agreement is observed between calculated and measured spectra
except the region between 5 and 11 Mev. If the number of inelastic level
increases more than present limit in JENDL-3 or bunched levels are used, a
good agreement should be obtained.s*
3. CONCLUDING REMARKS
Using the nuclear data of JENDL-3, it is expected to estimate the
tritium production rate in a typical fusion blanket within about 5"-10%.
Most types of reaction rates in it can be estimated within about 10%. The
Be and Pb data, of which problems were pointed out for JENDL-3T, have
improved remarkably.
The benchmark test relevant to the gamma-ray data has been done for
only Si, Ti and W. The benchmark tests for the other gamma-ray data and
nuclear heating will be carried out soon. It is expected that these tests
give useful informations for the evaluation of JENDL-3.
REFERENCES
1) Kosako K., et al.: "Neutron Cross Section Libraries for Analysis of
Fusion Neutronics Experiments," JAERI-M 88-076 (1988) (In Japanese)
2) Maekawa H.: "Fusion Neutronics Integral Test for JENDL-3T," Proc. 1987
Seminar on Nuclear Data, JAERI-M 88-065, ppl98-211 (1988).
3) Maki K., et al.: "Comparison of Calculated Shielding Properties by
JENDL-3 with Those by ENDF/B-IV," In this proceedings.
4) Mori T., et al.:"One-, Two- and Three-Dimensional Transport Codes Using
Multi-Group Double-Differential Form Cross Sections," JAERI 1314 (1988)
5) Mizumoto M.: Private communication.
- 7 3 -

JAERI-M 90-025
Table 1 Benchmark t e s t plan of JENDL-3 for fusion neutronics
Organiztion
JAERI
University
Osaka Univ.
KURRI Osaka Univ.
Benchmark Problem
• Integral experiments on LisO, C, Li?0-C, Be, Fe, & Be-sansich Li?0 asemblies •TOF experiments on Li?0, C, Li, Be, Fe, Pb, LNs & L02 slabs • Pulsed Sphere Program (LLNL), 5Li, 7Li, C, 0, Fe, Pb, P.E., H20, Be • Experiment on SS316 assembly at ORNL
•Integral experiments on Li & Pb-Li spheres
•TOF experiments on Li, Pb, SS316 & concrete assemblies
• n & r spectra measurements on Nb, Li, CF2, Al, Si, Ti, Cr, Co, W, Pb, As, Se, LiF, Mn, Cu, Zr & Mo spheres
Personnel
H. K. a
K. Y. H.
M. T.
K.
T. K.
A. J.
C. J.
Maekawa Kosako Yamaguchi Oishi Oyama Maekawa
Nakagawa Mori
Sakurai
Iguchi Sugiyama
Takahashi Yamamoto
Ichihara Yamamoto
Standard analysis
DOT3.5a'
DOT3.5b >
ANISN
ANISN
ANISN<"
Additional analysis
MCNP
MCNPC' MORSE-DD
MORSE-DD"»
MORSE MCNP
MCNP
MCNP
MCNP' '
Kyoto Univ. •Backscattering experiments K. Shin on concrete & SS304 assemblies
TIT
ANISN
Spectra in LiF, C, H?0 & LiF-C assembles
H. Sekimpto MORSE
MCNP
Tohoku Univ. -TOF experiments on P.E. & S. Iwasaki Pb assemblies
MCNP
Toshiba -Pulsed Sphere Program M. Kawai ANISN (LLNL) M. Uematsu MORSE
MCNP
KHI Pulsed Sphere Program (LLNL), H?0, Fe Fe sphere (Illinois Univ.)
S. Mori ANISN D0T3.5
MCNP
- 74 -

I
JAERI-M 90-025
10°
3 O
ro i-J O
t—
\
c
I I I I I I M I I I I I I I M I I I I I I M I I I I I I I I I I I M I I I I I ] I I I I I I I I 1 I I I ( I M I I I M I I I I I
JENDL-3T JENDL-3PR1 JENDL-3
r l
Energy ( eV )
Fig. 1 Neutron leakage spectrum from Li--7 sphere (0.5 mfp), 30°
- 75 -

JAERI-M 90-025
E
CD
,—, >
<tt
z: '—'
> -0 DC LU 3?" UJ ~^ O DC 1— — 1
t 11 1 Li_l
z.
CO
0) pa
c 0
rum
•u 0 01
B)
3
C O
3 01 C t - i
to i -H
3 ex. 3
t N
M •H Px.
[9o.inos/XBjBm.a | / 2 w/Js/u]
xn~u bvinoNV
76 -
i

JAERI-M 90-025
4->
3 O
-t-J
c o
+-> 3 0!
! 0 1 1 1 1 1 1 1 1 1 1 i 111 i 1 1 1 1 1 1 1 1 1 1 i 111 i 1 1 1 1 1 1 1 1 1 1 1 1 1 1 i 1 1 1 1 1 1 1 1 1 1 1 1 1 1 1 1 1 1 1 1
0 . 0 0 . 2 0 . 4 0 . 6 0 . 8 1.0 1.2 1.4 1.6 1.8 Energy ( eV ) ( * 1 0 ? )
F i g . 3 Neutron l eakage spec t rum from Be sphe re ( 0 . 8 m f p ) ,
- 77

JAERI-M 90-025
CM
CD
C D
<D
> -CD CC LU ZZL LU
O CC
LU
C D
J3 CX n) V J
CO
g E 3 VJ •u o <u Q. tn X 3
3 00 c <
t>0 •H
( 9 0 J n o s / X 6 j B q ) . 9 \/zw/Is/u)
xnu avmoNV
78

Graphite Slab ( A| -27(n,a) )
1 . 2
1 . 1 -
1 . 0
I
-e- JENDL-3 ->- JENDL-3PR2 -*- ENDF/B-V
F=
0 . 9
0 . 8
;^=
^
^
.-^r
^
20 30 40 50 60 70 80 90
Disiance from the target (cm)
Fig. 5 C/E distribution of 2 Al(n,a)2 Na in graphite cylindrical assembly
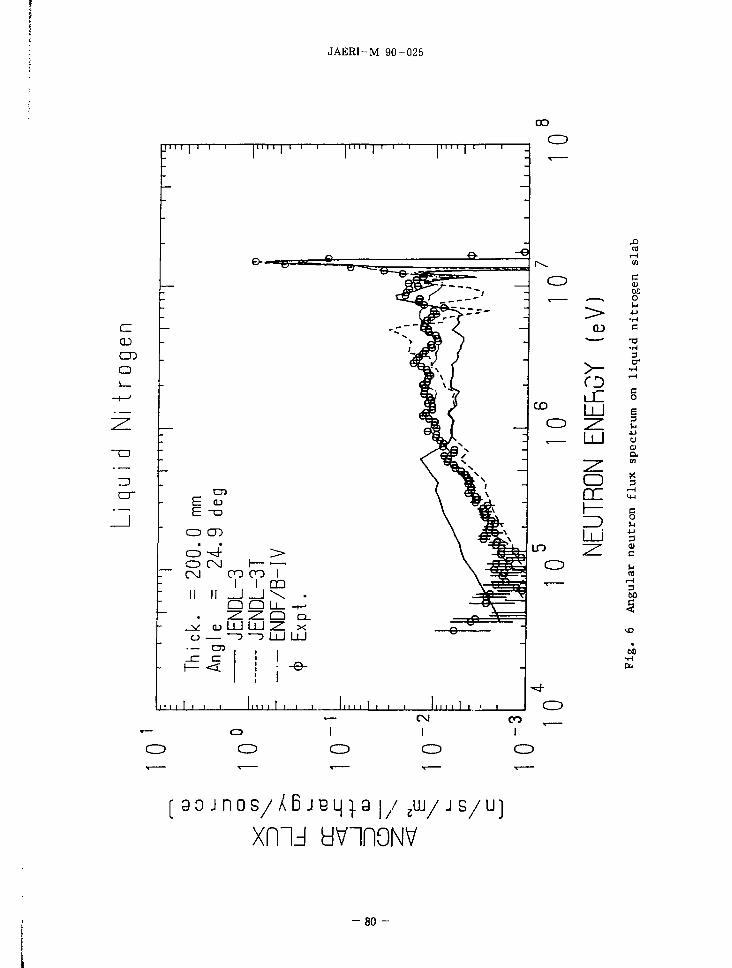
JAERI-M 90-025
oo
QJ
cn o
cr
J 1
1 1
1-1
1 ~l
;
— i riTi i | i
e - i ^ =
T 1
,» © -
TTTTT-p—1 1—
~fS ~~**~"e"§
> 1
i n n | n
e
Ki:::'
I 1 1 1 |
-e
CD
r-^
0 5 E u E - o
CD CD
CD CD CM
C\J
II II
OO CO I I I DO
o
t— <C
Q Q L_ - t -ZZ.-ZL Q a .
<u LU LiJ Z x - —3 - D L U LU
CD
CD
" I I I I 1 l_ ' I I ' ' ' I L. I l l I I I I I l _
LO
CD
CD
CD CD CD
CM
C D
CO
I
CD
CD
> -CD LU
CD ~z.
O DC
C
oo o u
c
•H 3 cr
C o s 3
o ai a
3
g
3 <U ei
M (B
rH 3 60
60 •H Eh
( 90jnos/X6jBiu.3 | / jiij/ J s/u]
xnid avinoNV
80

L i q u i d Oxygen
O i_
o X m
CO
DC <°
en
c
NEUTRON ENERGY (eV) Fig. 7 Angular neutron flux spectrum on liquid oxygen slab

JAERI-M 90-025
ENERGY(MeV) ~\ i i i i i i i n 1 — i — i — i i i i
0 Al 40cm Sphere Exp. M^ MCNP I JENDL-3 C a l c . h MCNP & ENDF/B-IV H
10
|L
J i i i i i ' i ' ' i i • • ' •
10
Fig. 8 Neutron leakage spectrum from Al sphere
- 82

10 p- ~J I — n i 1 II 11 1 1—I M i l l )
SI Sphere
-J\r '• Expsrimeirt
- O r = MCNP+JENDL-3
10 -1 ' 1 I i i i l l t 1 I I I 11 ll
10 10 NEUTRON ENERGY CMEV)
10 a
O CE J -ZD -i UJ 10
LLI CJ
cc o to
\ 10?
z LU CC CE 13 O
O 10 < < LLI
1 0
Si Sphere
t Exper iment
-TJ. :MCNP+JENDLE-3T(R1)
>
0 . 0 2 . 0 4 . 0 6 . 0 8 . 0
GAMMA-RAY ENERGY (MeV)
10 .0
Fig . 9 Neutron and gamma-ray leakage spectra from Si sphere

T—i i i i m i 1—i i i I I I I I 1—i i i m i l — r
Ti Sphere
-\r- Experiment
j j j - : MCNP + JENDL--3
i i i i i
JO"2 10"1 10° Neulron Energy [MeV]
10'
10
o
LU
z LU L) DC
O CO
10
10
U l
QC
O
W|0 ' < < LU
10
1 1 1 1
Ti Sphere
4 Experiment
- T J - I M C N P + J E N D L E - S K R I )
_L i _L 0.0 2.0 4 .0 6 .0 8 .0
GAMMA-RAY ENERGY (MeV)
10.0
Fig . 10 Neutron and gamma-ray leakage spec t ra from Ti sphere

"i i i i i i n 1 1—i i i n n
C r - s p h e r e
00 CJ1
> SO
o I
o
10 J—i M i n i , J l » M i l l .5 • 7 I 3 3
E n e r g y [KeVJ
10 IS 20
Fig. 11 Neutron leakage spectrum from Cr sphere

10
l
10
a J -u UJ Q. CO
>-O
< X \~ UJ _J
10
pTTT] 1 F I I II 111 1 r-TTTTTT]
W Sphere
-J\r- - Experiment
J l r : MCNP+JENDL-3
-2 10
-3 10 U l l l - . 1 1 I I I I 111_ 1 I I I i n i l
10" 10 NEUTRON ENERGY CMEV)
10'
10
o cc b-
ID z o cc z> o 10 ^ 10"
111 a:
o LU o < < UJ
10
10
i i 1 r W Sphere
^ Experiment •TJ- .-MCNP+JENDLE-3
> 2 T
0 .0 2.0 4 .0 S.0 8.0 10.0 GAMMA-RAY EMERGY (MeV)
F i g . 12 Neutron and gamma-ray l e a k a g e s p e c t r a from W sphe re

Lead (Pb)
10 u
rc
o
FLU
X
rgy
/s
DC £
<; -5
10
10
- 1 — I — I I I I 1 1 1—I—I I I I 1 — I — I I I I I
o
Thick. = 50.6 AnqIe = 66.8 deq
— JENDL-3 JENDL-3T ENDF/B-IV.
<J> Ex p t .
NEUTRON ENERGY (eV)
Fig. 13 Angular neutron flux spectrum on Pb slab

JAERI-M 90-025
2.1.6 Shielding Benchmark Test of JENDL-3
M. Kawai1), A. Hasegawa2), K. Ueki3), N. Yamano4), K. Sasaki^), Y. Matsumoto^), M. Takemura?), N. Ohtani^), H. Tsunoda9),
K. Sakurai2), Y. Itoh2>, M. Uematsu1) and Y. Oka10).
1) Toshiba. 2) JAERI, 3) SRI, 4) SAEI 5) MAPI, 6) MES,
7) KHI, 8) PNC, 9) MRI and 10) U. Tokyo
Abstract
The integral test of JENDL-3 for shielding application was made
on a cross sections of carbon, sodium and iron by analyzing the
various shielding benchmark experiments: Broomstick experiments at
ORNL for iron and sodium, neutron transmission experiments for sodium
at ORNL, iron and carbon, ASPIS deep penetration experiments for iron,
measurements of leakage spectrum from iron spheres at KfK, angular
neutron spectrum measurements in graphite block at RPI. Analyses were
made with radiation transport codes ANISN (ID, Sn), DIAC (ID, Sn),
DOT-3.5 (2D, Sn) and MCNP (3D, point Monte Carlo). It was observed
that revising JENDL-3T iron data resulted in an improvement in
reproducing the experimental data, particularly in the MeV neutron
energy region. For sodium, JENDL-3 gave better results than JENDL-2
and ENDF/B-IV. For carbon, JENDL-3 gave better agreement, compared to
ENDF/B-IV. The conclusion is that JENDL-3 is highly applicable to the
reactor shielding analyses.
1. INTRODUCTION
The JENDL-3 shielding benchmark test was made as an activity of JNDC Shielding benchmark testing Sub-working group for clarifying the JENDL-3 applicabilty to shielding analyses. The test scope was to analyze the shielding benchmark experiments for Li-6, Li~7, Be~9, carbon, oxygen, sodium, iron, chromium, nickel and niobium, mainly with the sources of nuclear reactors or the photo neutron. This paper is an interim report about the results for important elements of iron, sodium and carbon. The test has been made by analyzing the following shielding experiments:
1) Broomstick experiments1' made at ORNL to test total cross
- 8 8 -

JAERI-M 90-025
sections,
2) ORNL neutron transmission experiments of iron block2' (10 to 90
cm thick) and sodium cylinder^' (3.0 meters and 4.6 meters long),
using the collimated neutron beam from the TSF reactor,
3) ASPIS deep penetration experiments"' (140 cm thick iron) using
fission neutron source,
4) KfK leakage spectrum measurements?' from iron spheres (15 to 40
cm diameter) using the Cf-252 neutron source,
5) RPI angular neutron spectrum measurement"' (so called Profio's
experiment) in a 132x152x152 cm graphite block using a photo-
neutron source with the time of flight method,
6) ORNL experiments of neutron transmission through the graphite
block'' (10 to 60 cm thick) using the broad neutron beam source
from the TSF reactor.
Analyses were made with radiation tranport codes ANISN (ID Sn),
DIAC (ID, Sn), DOT-3.5 (2D, Sn) and MCNP (3D point Monte Carlo).
Group constants with P5 anisotropy for Sn calculations were generated
from JENDL-3 as well as JENDL-3T and ENDF/B-IV by cross section
processing system PR0F-GR0UCH-G2/B or RADHEAT-V4, which were developed
at JAERI. The pointwise cross section library for MCNP was prepared by
NJOY code system. In the previous integral tests on JENDL-3T, the
overall applicability of the iron, sodium and carbon data in JENDL-3T
to the shielding problems was confirmed, except for the total and
inelastic scattering cross sections of iron for which reevaluation was
required in the energy range above 0.8 MeV. ' Then, the iron cross
sections in the high energy region were modified for JENDL-3. Accord
ingly, reanalyses were made only for iron, and the reults for sodium
and carbon presented here are the same as those for JENDL-3T.
2. RESULTS
Major r e s u l t s of the present work are compared with those for JENDL-3T in Table 1. The following are descriptions about the resul ts for each material.
2.1 Iron For the Broomstick experiment, the uncollided neutron spectrum,
calculated from JENDL-3, agrees with the experiment above 5 MeV; as shown in Fig. 1. However, the discrepancy between the calculations ar\d the measurements remains below 5 MeV, as was observed in the JENDL-3T
-89-

JAERI-M 90-025
results.
The ORNL transmission experiments were reanalyzed with the DOT
S' 5 and MCNP codes, since DOT-3.5 underestimated the flux along the
center axis, because of the ray-effect in Sn approximation and group
collapsing effect. Table 2 shows that the MCNP results for the on-axis
data agree, within l8# errors. The values in parenthesis are
uncollided flux contribution to the detector response. Table 3 shows
the results for the off-center axis data. The calculated values, with
both MCNP and D0T-3-5. agree with each other within the Monte Carlo
statistical errors for the 12 inch thick sample. Therefore, the DOT-
3-5 results for the off-center data are considered to be reliable for
the integral test. As a whole, the JENDL-3 results are similar to
those for JENDL-3T, and agree with the experimental data for neutron
flux and the Bonner ball responses within 30# error.
For the ASPIS experiment, the neutron spectrum, calculated with
JENDL-3 is improved in the energy range above 1 MeV, as shown in Fig.
2. Agreement with the experiment results is remarkably good, near the
24-keV window, while the ENDF/B-IV shows an overprediction. Figures 3
and 4 show that MCNP gave a better neutron spectrum, at around 1 MeV,
than DOT-3-5- The spatial distribution for 32s(n>p) reaction became
nearly constant (i.e. -1.4) as observed in Fig. 5-
For the KfK experiment, slightly better agreement with the
experimental data is observed in the JENDL-3 results, than JENDL-3T,
as shown in Fig. 6. It is interesting to note that there is a large
difference between neutron spectra from JENDL-3 and ENDF/B-IV in a
neutron spectrum below 20 keV, where no experimental data is
available.
2.2 Sodium
The spectrum of neutrons transmitted through the 10-ft thick
sodium sample was calculated with D0T-3-5- The results agreed with the
measured spectrum at ORNL with the C/E values 1.0 - 1.3t although
there is a hydrogen impurity ambiguity in the sample. The results are
shown in Fig. 7- The calculated and measured Bonner ball responses are
compared in Fig. 8 in case of the 10-foot long sample. The C/E values
for the Bonner ball response ranged from 0.75 to 0.97 for the 10 ft
long sample, and from 0.7^ to 1.05 for the 15-ft long sample.. These
results are better than those of JENDL-2 and ENDF/B-IV, while the
Broomstick experiment showed that the sodium total cross section above
1 MeV may have been underevaluated by several percent at maximum.
2.3 Carbon
Profio's experiment was available. There are some differences between the measured neutron spectra in the high energy measurement
- 90 -

JAERI-M 90-025
above 800 keV and those in the lower energy measurement. The latter
were obviously discrepant from the calulations from various nuclear
data libraries"'. Therefore, the present integral test was made in the
energy range above 800 keV. The result is fairly good, as shown in
Fig. 9 (C/E = 0.8 - 1.3).
The ORNL neutron transmission experiments, with a fast neutron
spectrum simulating a blanket leakage spectrum, were analyzed with the
21-group S8 calculation. The C/E values, for the results obtained with
JENDL-3, JENDL-2 and ENDF/B-IV, are give in Table 4. The values of
JENDL-3 are moderate and nearest to unity among the three libraries.
Although some ambiguities remain in the few-group calculations, it can
be said that the carbon cross section of JENDL-3 is satisfactory for
shielding application.
3. Discussion and Concluding Remarks
Table 1 shows that the cross sections of carbon, sodium and iron
in JENDL-3 reproduce the shielding experimental data obtained in the
fast neutron field within an error of 30%. Besides, the discrepancy
between the calculations and the experiments does not come only from
the poorness of the nuclear data libraries. In Table 3i MCNP gives
slightly larger values than D0T-3-5- This tendency is more obvious in
the neutron spectrum in the energy region between 0.8 MeV and 2 MeV of
the ASPIS iron benchmark experiments, given in Figs. 2 and 4. This
tendency comes from the difference in cross section treatment in the
codes: groupwise cross section in D0T-3-5 and pointwise cross section
in MCNP. Accordingly, the difference in the calculated results becomes
larger in the deeper transmission in iron. On the other hand, some
experimental data have inconsistencies, as found in the results of the
Profio's experiments. Reliability of the spectra, measured with a
proton recoil counter, may decrease above 1 MeV. The inconsistency in
reproductiveness for the MeV neutron spectrum, in the overprediction
in the KfK experiments and the underprediction in the ASPIS
experiments, is possibly due to the poor reliabilty of measured data.
However, it must be pointed out that JENDL-3 seems to
underpredict the neutron spectrum in the energy range between 1 MeV
and 3 MeV, as shown in the analyses on the Broomstick experiments. If
the iron total cross sections of JENDL-3 and ENDF/B-IV are compared,
deeper dips and sharper peaks can be observed in the ENDF/B-IV. Such a
fine structure is not observed in the available experimental data. The
structure is, however, guessed to be obtained with some kinds of
unfolding techniques in ENDF/B-IV and it brings better agreement
between the calculated and the measured neutron spectra. The large
- 91 -

JAERI-M 90-025
discrepancy between JENDL-3 and ENDF/B-IV is also observed in the
calculated neutron spectra below 20 keV, particularly in the KfK
experiments. For 27 keV resonance cross sections of iron, JENDL-3
shows a better agreement with the recent experimental data, which give
a shallower valley in the 2k keV minimum than ENDF/B-IV evaluated on
the basis of the older data. Accordingly, JENDL-3 gave better results
in the resonance energy region above 10 keV in the ASPIS experiment.
However, it cannot entirely explain the difference in the KfK
experiment. It is generally said that the leakage spectrum is more
influenced by the scattering cross sections than the spectrum in the
medium. New integral experiments, similar to the KfK experiments, will
probably lead obtaining better iron cross sections.
For carbon and sodium, JENDL-3 gave the best results. However,
the number of the experiments analyzed is less than for the iron case.
Further test are desirable to confirm the JENDL-3 validity. The
integral tests for the other elements are now in progress. Results
will be reported in the near future. In conclusion, it can be said
that JENDL-3 is highly applicable to the reactor shielding analyses.
References
1) R.E. Maerker, ORNL-TM-3867 (revised) and ORNL-TM-387O (revised)
(1972).
2) R.E. Maerker and F.J. Muckenthaler, ORNL-4892 (197*4).
3) R.E. Maerker, et al., 0RNL-4880 (1974).
4) M.D. Carter and A. Packwood, Proc. Spec. Mtg. on Sensitivity
Studies and Shielding Benchmarks, October 1975. Paris, p. Ill,
OECD (1975).
5) H. Werle, et al.. NEACRP-U-73, p. 8 (1976).
6) A.E. Profio. ORNL-RSIC-25 (1969).
7) D.T. Ingersol and N. Ohtani, Proc. of ANS Topcal Conf. on Theory
and Practices in Radiation Protection and Shield, April 1988,
Knoxville, Vol. 2, p.3^6 (1988)
8) M. Kawai, et al., Proc. Int. Conf. on NUclear Data for Science
and Technology, May 1988, Mito, p. 509, (1988).
9) H. Kotegawa, et al., JAERI-M 87-OIO (1987).
- 9 2 -

JAERI-M 90-025
Table 1 Summary of r e s u l t s mainly for de tec tor responses
Material
Iron
Sodium
Carbon
Experiment
Broomstick
ORNL: Bonner
ditt.
ASPIS: S.In, Rh
Rh
KFK: Flux(>63keV)
Broomstick
ORNL: Bonner
RPI: FluxOl MeV)
ORNL: Bonner
Analysis
Analytic
DOT-3.5
MCNP
DOT-3.5
MCNP
DIAC
Analytic
DOT-3.5
ANISN
DOT-3.5
JENDL-3T
0.5 - 1.8
0.96 - 1.34
0.86 - 1.09
0.5 - 1.3
0.68 - 1.05
1.08 - 1.1
1.24 + 0.19
0.75 - 1.05
0.8 - 1.3
0.8 - 1.1
JEND1
0.5 -
0.90 -
0.82 -
0.4 -
0.77 -
0.95 -
Same as
Same as
Same as
Same as
.-3
1.2
1.12
1.07
1 .4
1.09
1.12
left
left
left
left
Table 2 C/E values for Bonner b a l l responses ca lcu la ted with MCNP for ORNL iron benchmark experiment
Sample
Thick.
12"
36"
Detector
Size
3"
6"
10"
3"
6"
10"
Exp.
2.32
18.5
9.89
0.243
1.08
0.368
Calc.
1.90
17.6
8.32
0.234
1.16
0.343
C/E Values
JENDL-3
0.82(67%)
0.95(73%)
0.84(77%)
0.96(17%)
1.07(27%)
0.93(33%)
JENDL-3T
0.87(67%)
0.99(72%)
0.86(67%)
0.95(20%)
1.09(29%)
0.95(35%)
ENDF/B-IV
0.88(69%)
1.03(74%)
0.95(78%)
0.98(17%)
1.07(25%)
1.00(29%)
- 9 3 -

JAERI-M 90-025
Table 3 C/E values of Bonner b a l l responses for ORNL iron benchmark experiments
Sample
Thick.
4"
12"
12"
2 4"
36"
Detector
posi tion
164" 15
45
141" 15
15
15
141" 45
45
45
156" 15
45
15" 50
128" 15
15
15
128" 45
45
45
115" 15
15
15
115" 45
45
45
Lietector
Type
NE213
NE213
3" BB
6" BB
10" BB
3" BB
6" BB
10" BB
NE213
NE213
NE213
3" BB
6" BB
10" BB
3" BB
6" BB
10" BB
3" BB
6" BB
10" BB
3" BB
6" BB
10" BB
Exp.
1.74
0.85
0.577
3.54
1.58
0.411
2.39
1.04
0.265
0.157
74.5
0.367
1.70
0.600
0.245
1.13
0.405
0.181
0.700
0.227
0.128
0.475
0.151
DOT
JENDL-3
1.24
1.32
1.00
1.26
.1.15
0.94
1.23
1.07
0.91
0.85
1.34
0.90
1.05
0.90
0.97
1.12
0.93
0.73
0.82
0.67
0.87
1.00
0.82
C/E Values
DOT
JENDL-3T
1.21
1.2?
0.98
1.32
1.23
1.07
1.30
1.13
0.88
0.83
1.44
0.96
1.25
1.11
1.05
1.34
1.16
0.94
1.17
0.98
1.11
1.43
1.22
MCNP
JENDL-3
-
-
1.08
1.34
1.21
1.12
1.41
1.25
-
-
-
-
-
-
-
-
-
-
-
-
-
-
-
Table 4 C/E values of Bonner b a l l responses ca lcu la ted with DOT-3.5 for ORNL graphi te benchmark experiment
Graphi te
Thickness
10.16 cm
30.48 cm
60.96 cm
Library
JENDL-3
JENDL-2
ENDF/B-IV
JENDL-3
JENDL-2
ENDF/B-IV
JENDL-3
JENDL-2
ENDF/B-IV
C/E Values for Detector of
Bare BF3/Cd 3"BB 6"BB 8"BB 10"BB
0.95
0.95
1.23
0.89
0.84
0.78
0.73
0.75
0.85
0.90
1.13
0.86
0.81
0.80
0.76
0.89
1.06
1.04
1.28
1.00
0.94
0.94
0.90
1.06
1.01
0.96
1.16
0.98
0.91
0.95
0.90
1.04
0.98
0.92
1.12
0.95
0.88
0.95
0.89
1.03
1.03
0.95
1.15
0.97
0.88
0.97
0.88
1.01
- 94 -

JAERI-M 90-025
c a> b »_ OJ
U J
0
o
ro
_ i a z LU —3
h
i— ro
_ J Q z LU • - 3
-r
1 Mill I • I I l l l l l I I I I l l l l l I I I " " ' I I I I i l l l l l I ' ' I " " ' ' ' I
«T_ aj - - o —
O O O O 'O
Mill I I I I C\J ro c-
'O 'O 'O
00 SI
a si c
%%
0J r-i x
D. I a O c/5
C Q >-< O CI, i-i >. m u J ] < 3 D -a c e o> -H
4-1
G *-< 4-) 3 ra
c o TJ o —i v: aj "3
•H 0) 0J i J >-, fl -C 3 c 4-J u: E ex ta O 0J O U "3 E
((6JDU.|9-| jmn Jad xn|j •H
<X>
§
*r-(
E
> CJi
CD c
,—1
0 o c 3
t -
o U-,
Cfi
l i 3
-, S
> u;
c o 1=
• H 1-1
0) u. x Si
_ic 01
• H 4-1 W
E o 0
co d c>
lurujoads pauiLusuDJj.) 3 / 3
- 95 -
r
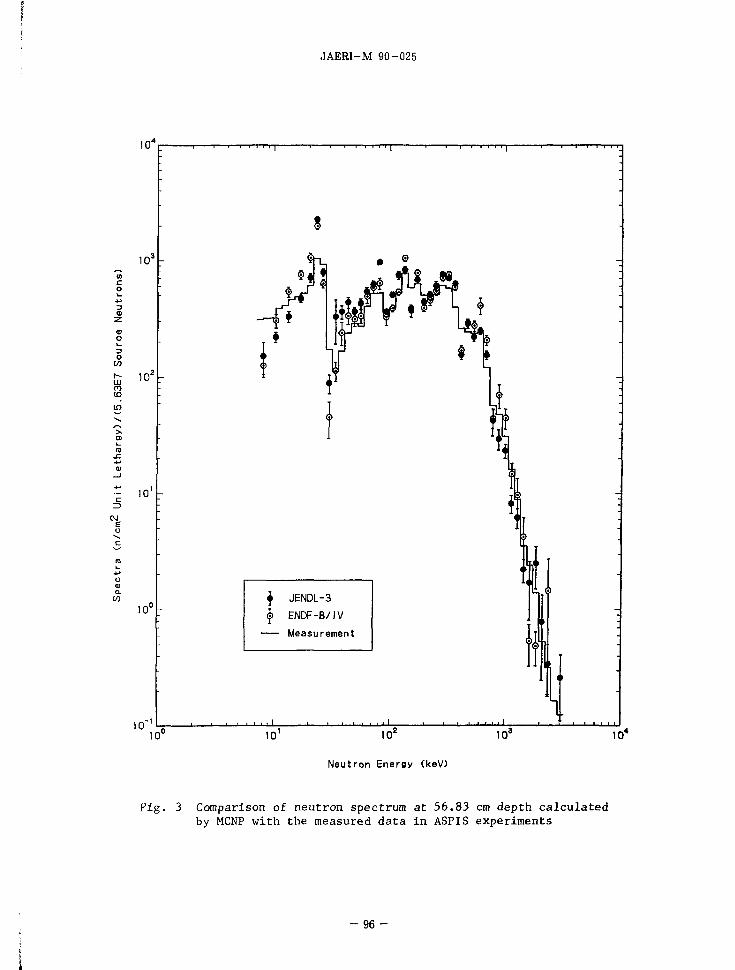
I
JAERI-M 90-025
10'
CO
"- 10:
CO CO
in
10'
CM e o
1 0 u -
10"
"T I 1 1 1 ) 1 1 r r T i i i f i i i
10u
if JENDL-3
|) ENDF-B/IV
Measurement
ffl 1
' • t • • • i - I 1 L-. I...
1CT 10'
Neu t ron Energy (keV)
,3 _ i —
10*
Fig. 3 Comparison of neutron spectrum at 56.83 cm depth calculated by MCNP with the measured data in ASPIS experiments
96 -

JAERI-M 90-025
10'
10'
o CO h -UJ
m ID
c
E
10" 10u
I I I I 1 I I I I • I • I I I T 1 T T ] •
$ JENDL-3 § ENDF-B/IV
Measurement
tJ
f 1 I - I 1 1 • » 1 !
10' 10' 10J 104
Neutron Energy (keV)
F i g . 4 Comparison of n e u t r o n spec t rum a t 8 5 . 4 1 cm d e p t h c a l c u l a t e d by MCNP wi th the measured d a t a i n ASPIS e x p e r i m e n t s
9 7 -

JAERI-M 90-025
CD
O • - 1 0 0,50 c r j •
LU
a:-10 , *
^ 1 0 , *
LU ]-t CC
l"±
0.50
«406 «407 S - 3 2 ( N . P ) »i o • ~
I . 5 0 , 2 - 5 0 , 3 -50 , 4 -50 , 5 -50
i-V DOSIMETRY 6,50 ,
y
2 . 5 0 3 .50 4 . 5 0 5 -50 « I 0 '
DEPTH IN IRON SHIELD (CM)
5 . 5 0
EXPERIM. R.RRTE S32NPB5
CRL-DRT. «406 J3T
EXfl.W
CRL-DRT. »407 J3T Rl EXR.W
F i g . 5 Comparison of DOT-3.5 c a l c u l a t e d and measured 3 2 S ( n , p ) r e a c t i o n r a t e s i n ASPIS e x p e r i m e n t s
- 9 8 -

» FAIRLINE8909181652 1 ; 1—;—i—i
....
. . . .
• +
J E N D L - 3 E N D F / B - I V J E N D L - 3 T K f KJWSMCPRC No. 1 & 2) K f KiM5£tt(PRC No. 3)
10 ' ' ' I I I I 1 _ I I 1 — I I I I
1
lO* 10' 10° 10'
N e u t r o n E n e r g y ( e V )
107
Fig. 6 Comparison of leakage neutron spectra calculated by DIAC with the measured data in KFK experiments

JAERI-M 90-025
*
5
x
LL
C
o
3
10
10
A I atm Benjamin Detector
O 3 atm Benjamin Detector
V 10 atm Benjamin Detector
| NE213 Detector
\ Ca lc .w i th H Impurity
— Calc. w i t h o u t H Impur i ty
101 102 103
Neutron Energy (keV)
104
Fig. 7 Comparison of neutron spectrum transmitted through 10 Ft sodium sample depth calculated by DOT-3.5 with measured data in ASPIS experiments
- 1 0 0 -

JAERI-M 90-025
10' T tia 15 f t
3"Bonner Ball O Exp. — Calc.with H
Calc.without H
^
10
s
4-Z io
> ^ 10*Bonnor Ball
< ^
Cd- covered SFi
30 60 Distance from Sodium ( inch )
Fig. 8 Comparison of Bonner ball responses behind the 10 Ft sodium sample between DOT-3.5 calculations and the experiments
- 101 -

JAERI-M 90-025
10
10 8 -
10?-
10
10
10
10" 10
radius = 20.3 cm
'- = 0 deg.
Calculation
Experiment
-A.
10° 10' 10
Neutron energy ( eV )
8 10
Fig. 9 Comparison of ANISN calculated and measured angle-dependent neutron spectra in the graphite block for Profio's experiment
- 102-

JAERI-M 90-025
2.1.7 Benchmark Test of JENDL-3 Dosimetry File
M. Nakazawa and Dosimetry Sub-WG,
University of Tokyo
7-3-1, Hongo, Bunkyo-ku, Tokyo
Present status of JENDL-3 Dosimetry-file has been
reviewed, and generally better agreements have been obtained
for the dosimetry reaction rates between calculation and ex
periment in several benchmark neutron fields such as Cf-252
fission spectrum. In this comparison, special attention has
been paid to the uncertainty estimations of each reaction
rate values. The covariance of reaction cross-section of
IRDF has been tentatively applied here and the covariance of
benchmark neutron spectrum has been assumed practically.
1 . I'ntroduct ion
JENDL-3 dosimetry file has been edited as a special
purpose file of the JENDL-3 general purpose file. In order
to check the accuracy of this JENDL-3 dosimetry file, a
series of benchmark test has been carried out by the
Dosimetry sub working group members.
The benchmark neutron fields in this dosimetry test
program are mainly selected from the date file of IRDF-82,
which are Cf-252 spontaneous fission spectrum, U-235 thermal
fission spectrum, CFRMF and YAYOI. In order to test the ap
plicability to fusion reactor neutronics, another benchmark
fields of 14MeV neutron are added, which are JAERI-FNS 14MeV
neutron source, and Li(d,n) neutron field in the Tohoku
- 103-

JAER1-M 90-025
Un i vers i ty.
This kind of dosimetry benchmark test has been already
carried out for the tentative version of JENDL-3 called as
JENDL-3T dosimetry file, the results of which have been al
ready reported in this previous seminar of 1988, (1).
2. JENDL-3 Dosimetry File
Table 1 shows the list of dosimetry reactions which are
expected to be included in the JENDL-3 Dosimetry file, and
presently 49 reaction cross-sections have been collected in
the first version of JENDL-3 dosimetry file.
In the production of JENDL-3 Dosimetry file, at first,
point-wise data are obtained using RESENDD code for
resonance parameter processing, then 620 group-wise cross
section data, which is the same as the SAND-11 code group
structure, are calculated using the CRECTJ5 code to average
the point-wise data with the weighting function of F(E)=1.0.
Unfortunately, there is no uncertainty data in the
present JENDL-3 library, so the covariance file of the IRDF-
82 has been adopted tentatively in the present testing of
JENDL-3 dosimetry file.
3. Results and Discussion
Table 2 and Fig.l show the typical results in the two
fission spectra, where it should be commented that neutron
spectra of cf-252 and U-235 have been adopted from Dr. Man-
hart evaluated result and JENDL-3 data respectively. !n this
calculation, the systematic uncertainty of neutron spectra
has been neglected because it dose not affect to the average
- 104-

JAER1-M 90-025
cross section. On the other hand, the random uncertainty of
neutron spectra has been assumed like
relative error (&X)= [20X --- U-235
[ 5X --- Cf-252
when the lethargy width(A.u) of spectrum is 0.1465 as the
group structure of SAND-11 library. One important comment on
this random error, the relative error is modified as to
keep the equation of e^-AU=const, when the lethargy width u
is changed in the calculational procedure.
From these comparisons, some clear discrepancies can be
pointed out for several reactions, such as Ni-60(n,p) in Cf-
252 spectrum, Ni-58(n,p), Cu-63(n,2n), I-127(n,2n) in U-235
spectrum. For these reactions, the uncertainty of experimen
tal data should be reviewed again.
Fig.2 shows the benchmark test results in the typical
fast reactor neutron fields, at present no any critical com
ment can not be found except the reaction of Fe-58(n, r ).
Fig.3 shows the comparison of cross section curves in
the 14MeV energy region the neutron spectrum of which is
typical one in the surface region of fusion reactor blanket,
as is given in Fig.4. Through the data evaluations of JENDL-
3 in this energy region, this JAERI-FNS benchmark data have
been already referenced, so this good agreements between the
JAERI-FNS data and the JENDL-3 are as expected. And when
compared with ENDF/B-Y results, JENDL-3 gives a little bet
ter agreements.
Fig.5 shows the benchmark test results in the Li(d,n)
neutron field, the spectrum of which is given in Fig.6. A
little discrepancy can be found for the reaction of Co-
- 105 -

JAERI-M 90-025
59(n,2n), then its experimental error are going to be
rechecked.
The Largest discrepancy through these comparisons has
been found in the reaction of Fe-58(n,r), which has been
compared with the IRDF-82 data in Fig.7. Main difference
has been observed in the resonance energy region, especially
in the base cross section values between the resonances.
4. Conclusion
Present status on the JENDL-3 dosimetry benchmark test
and its important results have been reviewed, and several
reactions for which re-check is requested, can be pointed
out. In order to improve this JENDL-3 dosimetry -file, addi
tional evaluation are necessary especially for (n.n') reac
tions of Nb-93, Rh-103, In-115 and Hg-199 nucleides which
can not be obtained from the present JENDL-3 library. And
covariance data are requested for more quantitative com
parison with experimental data, and for the neutron spectrum
unfolding and/or adjustment application.
Member of Dosimetry sub-working group;
A.Hasegawa, Y.Ikeda, K.Sakurai, T.Nakagawa (JAERI),
S.Iigima (Toshiba), K.Kobayashi (KURRI),
S.Iwasaki (Tohoku Univ.),
T.Iguchi, M.Nakazawa (Univ.of Tokyo)
-106-

JAERI-M 90-025
Table 1 Nuclear reac t ion l i s t of JENDL-3 dosimetry f i l e (Underlined reac t ions are not in the present f i l e . )
1. Li- 6(n,t)or
2. B-10(n, oc)
3. F-19(n,2n)
4. Na-23(n,2n)
Na-23(n. r)
5, «S-24(_nipL
6. Al-27(n,P)
Al-27(n, a)
7. P-31(n,P)
8. S-32(n,P)
a, Sc-i5(nt.rl
10. Ti-46(n,P)
11. Ti-47(n,P)
Ti-47(n,n'p)
12. .Ti-48(n,p)
Ti-48(n,n'p)
13. Mn-55(n,2n)
14. Fe-DPA(ASTM)
15. Fe-DPA(EUR)
16. Fe-54(n,P)
17. Fe-56(n,p)
J3
J3
J3
J3
J3
J3
J3
J3
J3
J3
J3
J3
J3
J3
J3
J3
J3
—
—
J3
J3
18.
19.
20.
21.
22.
23.
24.
25.
26.
27.
28.
29.
30.
31.
Fe-58(n, r)
Co-59(n.2nl
Co-59(n, r)
Co-59(n, oe)
Ni-58(n, 2n)
Ni-58(n,P)
Hi-60(n,p)
Cu-63(n,2n)
Cu-63(n, T)
Cu-63(n, cc)
Cu-65(n,2n)
Zn-64(n,p)
Zr-90(n,.2n)
Nb-93(n,n')-i
Rh-103(n,n')-
In-llSCn.n')-
In-115(n. r)
1-127 (n,2n)
Au-197(n. r)
Th-232(n,f)
Th-232(n, r)
J3
J3
J3
J3
J3
J3
J3
J3
J3
J3
J3
—
J3
—
• —
• —
J3
J3
—
J3
J3
32.
33.
34.
35.
36.
37.
38.
39.
40.
41-
42.
43
44.
45.
46.
47.
48.
49.
U-235(n,f) J3
U-238(n,f) J3
U-238(n, T ) J3
NP:237(n,f) J3
Pu-239(n,f) J3
Aw-241(n,f) J3
Mn-55(n, r) J3
Nb-93(n,2n) J3
Rh-103(n,2n) J3
Eu-151(n, j) J3
W-186(n._r) J3
Ag-109(n, T ) J3
?a-lSM*2..L> J3
Hg-199(n,n*) —
Li- 7(n,n'ar) J3
Al-27(n,t) —
Ti-49(n,n'p) J3
Fe-57(n,n'P) J3
Au (n,2n) —
Note: Reactions fron No.l through No.36 are those included in IRDF. Reactions
No.37 through No.49 are the new entr ie s .
- 107
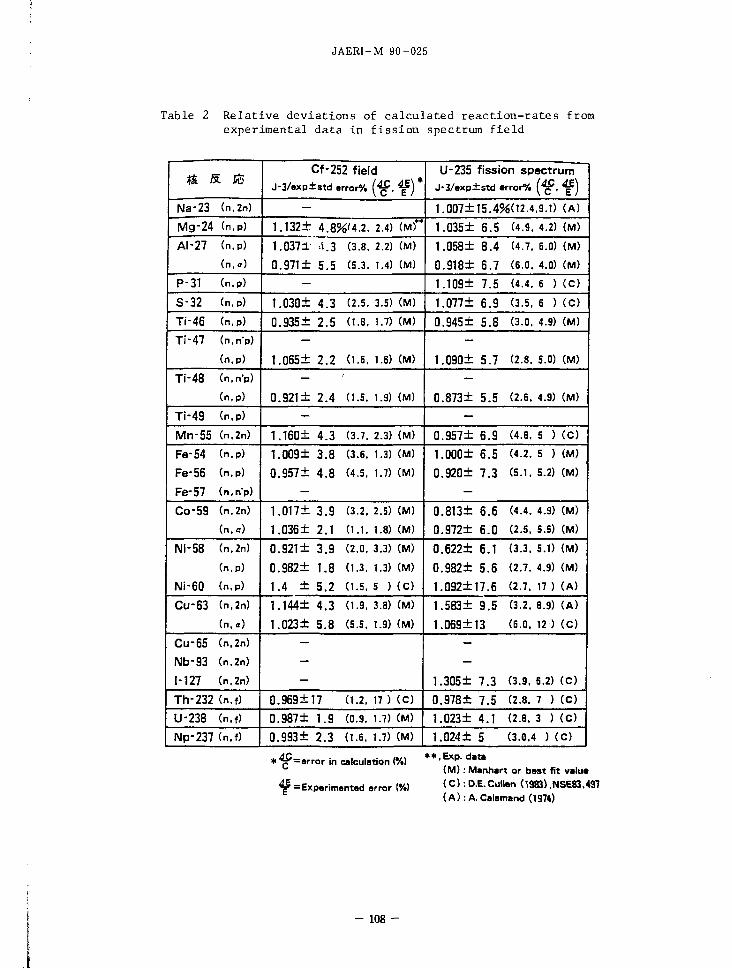
JAERI-M 90-025
Table 2 Rela t ive devia t ions of ca lcu la ted r e a c t i o n - r a t e s from experimental data in f i s s ion spectrum f i e ld
& S. JfS
Na-23 (n,2n)
Mg-24 (n.p)
AI-27 (n.p)
(n.«)
P-31 (n.p)
S-32 (n,p)
Ti-46 (n.p)
Ti-47 (n.n'p)
(n.p)
Ti-48 (n.n'p)
(n.p)
Ti-49 (n.p)
Mn-55 (n,2n)
Fe-54 (n.p)
Fe-56 (n.p)
Fe-57 (n.n'p)
Co-59 (n.2n)
(n.<r)
Ni-58 (n.2n)
(n.p)
IMi-60 (n.p)
Cu-63 (n.2n)
(n.«)
Cu-55 (n.2n)
Nb-93 (n,2n)
1-127 (n,2n)
Th-232 (n.f)
U-238 (n.f)
Np-237 (n.f)
Cf-252 field
J-3/exp±std error*/. ( ^ , ^ ) *
-
1.132± 4.8%<4.2. 2.4) (M)**
1.037i' 4.3 (3.8. 2.2) (M)
0.971± 5.5 (5.3. 1.4) CM)
-
1.030± 4.3 (2.5. 3.5) (M)
0.935± 2.5 (1.8. 1.7) (M)
1.065± 2.2 (1.6, 1.6) (M)
0.921± 2.4 (1.5. 1.9) (M)
-
1.160± 4.3 (3.7. 2.3) (M)
1.009± 3.8 (3.6, 1.3) (M)
0.957± 4.8 (4.5, 1.7) (M)
1.017± 3.9 (3.2. 2.5) CM)
1.036± 2.1 ( l . i . 1.8) (M)
0.921± 3.9 (2.0. 3.3) (M)
0.982± 1.8 (1.3. 1.3) (M)
1.4 ± 5.2 (1-5, 5 ) (c)
1.144± 4.3 (1.9, 3.8) (M)
1.023± 5.8 (5.5. 1.9) (M)
-
0.969±17 (1.2. 17) (c)
0.987± 1.9 (0.9. 1.7) (M)
0.993± 2.3 (1.6, 1.7) (M)
U-235 fission spectrum J-3/exp±std error-/, (fg, *p)
1.007±15.4%(12.4,9.1) (A)
1.035± 6.5 (4.9. 4.2) (M)
1.058± 8.4 (4.7. 6.0) (M)
0.918± 6.7 (6.0. 4.0) (M)
1.109± 7.5 (4.4. 6 ) (C)
1.077± 6.9 (3.5, 6 ) (c)
0.945± 5.8 (3.0. 4.9) (M)
1.090± 5.7 (2.8. 5.0) (M)
0.873± 5.5 (2.6. 4.9) (M)
-
0.957± 6.9 (4.8. 5 ) ( O
1.000± 6.5 (4.2. 5 ) (M)
0.920± 7.3 (5.1. 5.2) (M)
0.813± 6.6 (4.4. 4.9) (M)
0.972± 6.0 (2-5. 5.5) (M)
0.622± 6.1 (3.3. 5.1) (M)
0.982± 5.6 (2.7. 4.9) (M)
1.092±17.6 (2.7, 17 ) (A)
1.583± 9.5 (3.2. 8.9) (A)
1.069±13 (6.0. 12 ) (c)
1.305± 7.3 (3.9. 6.2) (C)
0.978± 7.5 (2.8. 7 ) (c)
1.023± 4.1 (2.8. 3 ) (c)
1.024± 5 (3.0,4 ) ( O
* 4 f = e r r o r in calculation (%) **•**": d a t * ( M ) : Manhart or best fit value
f =Experiment.d error (%) <C> : D.E. Culton (1983) .NSE83.497 (A):A.Calamand (1974)
- 108 -

JAERI-M 90-025
-30 i —
© Na-23 (n,2n)
© Mg-24 (n.p)
© AI-27 (n,P)
© AI-27 (n,*)
© P-31 (n,p)
© S-32 (n.p)
© Ti-46 (n,P)
® Ti-47 (nlP)
© Ti-48 (n,P)
© Mn-55 (n,2n)
© Fe-54 (n.p)
© Fe-56 (n.p)
© Co-59 (n.2n) © Co-59 (n.*) © E ? ? 5 ^
© Ni-58 (n.p)
© Ni-60 (n.p)
© Cu-63 (n.2n)
© Cu-53 (n.«)
© 1-127 (n.2n)
© Th-232(n.f)
© U-238 (n.f)
© Np-237(n.f>
Discrepancy (C/E —1.0)
-20 -10 -5 0 +5 10 20 30 (%)
Y//>///>///>///)//7%777A
i * , ,
WVfr
i
J i
Iff^M
/ U-238
i i
Y///////A. ^$m a
'//////////A
v///y/^^ XAf^JA
V/////////A i L 1
W7m±^
\W£\W
/ Cf-252
Ni-58 (n,2n)
v/?/;/?//;;///;/////;///////A "T I I
zfez \%i}<">"¥///szm
40±5
$ 58±10
yy///////A
Fig. 1 Benchmark t e s t r e s u l t s in Cf-252 and U-235 f i s s ion spect ra
- 109 -

JAERI-M 90-025
Discrepancy (C/E—1.0)
-30 -20 -10 -5 0 +5 10 20 30 (a
® 6Li (n,c)
® 10B (n.«)
(3) 27Al (n.p)
© 27Al (n.a)
(D 45Sc (n.r)
© 46Ti (n.p)
(7) 47Ti (n.p)
® 48Ti (n.p)
(D 54Fe (n. P)
© 58Fe (n.r)
© 59Co (n, r)
© 63Cu (n. y)
© 232Th (n.f)
© 232Th(n.f)
© 235U (n.f)
© 238U (n.f)
© 238U (n, r)
@ 237Np(n.f)
© 239Pu(n.f)
mfW/z/Jw > CFRMF
gjZZZZZZZi 2ZZ2-
ss 77±3
V///////////A /
22
VfUiJJ
r-CZZ
17777 P ^ ^
2ZZZ2ZZZZZZ
C f ^ P
-30 -20 -10 -5 0 +5 10 20 30
Fig. 2 Benchmark test results in fast reactor spectra of CFRMF and sigma-sigma
- 110-

(a) JENDL-3 ( N e u t r o n Field Phase- I I B a t 0 cm)
(b) ENDF/B-V ( N e u t r o n Field P h a s e - I I B at 0 cm)
Reaction —
1.
2.
3.
4.
5.
6.
7.
8.
9.
10.
11.
12.
13
14
15
16
17
AL7A
NI2N
NB2N
ZR2N
AU7G
NI8P
IN5IM
FE6X
FE4P
.AU2N
TI8X
TI7X
.TI6X
.ZN4P
. MN5G
.C02N
.CQ9A
-30 -20
Difference from measurement {%)
- 1 0 0 10 20 30 Reaction —30 —20
Difference f rom measurement (%)
- 1 0 0 10 20 30
> -,ra
SO O
I
I I before adjustment
after adjustment
J before adjustment
after adjustment
Fig. 3 Benchmark test results in 14 MeV spectrum (a) JENDL-3, (b) ENDF/B-V (Neutron spectrum is given in Fig. 4.)

to I
CD
CO
(D
CD O i
ZJ O en
x 3
c: o
(U
1 0 -3
Phase-IIB ai Ocm I n i i i i a i Guess D0T3.5 STAYSL
1 0 - 4
1 0 " D -
10 1 0 ' 10
Neuiron Energy (MeV)
> to
Fig. 4 Benchmark neutron spectrum in JAERI-FNS 14 MeV field

JAERI-M 90-025
© Al-27(n.a)
Discrepancy (C/E-1.0)
-30 -20 -10 0 10 20 30 (%) 1 1 1 1—17777? 1 1
© Ti-48 (n.P)
Fe-56 (n,p)
© Nj:58 (n.P)
© Ni-58 (n,2n)
© Co-59(n,2n)
© Co-59(n.a) C J
-Li+d
™
pma
-30 -20 -10 0 10 20 30
Fig. 5 Benchmark test results in Li(d,n) spectrum field
20 MeV
Fig. 6 Benchmark neutron spectrum of Li(d,n) field of Tohoku University
- 113 -

MRT 6432 (N.GHMMR) CROSS SECTIONS
26-FE-58
IRDF JENDL-3T
-99.8 TO 932 . '/| DIFFERENCES
'* ^
\AJ
101
10u
10"
ID"2
1 0 - 3
JO"4
10"5
173 z or en 03
JAE
RI-M
9
0-0
2!
MEV 26-FE-58
Fig. 7 Comparison of Fe(n,y) reaction between JENDL-3 and IRDF
a:

J'.ERI-M 90-025
2.2 Topics (!)
2.2.1 The Optical Potential for Neutrons and Charged Particles
Takaaki Ohsawa
Atomic Energy Research institute, Kinki University
3-4-1 Kowakae, Higashi-osaka, Osaka 577
Abstract: Problems and recent topics in the study on the nuclear opticai
mode) are described with particular reference to the application to nuclear
data evaluation. This includes the following items: (aJ Global optical
potentials and their validity; (A) Regional optical potentials; (c)
Nonlocal and equivalent local potentials; (d) Ambiguities in the optica!
potential parameters; (e) Application of dispersion relations; (f) Optical
potentials for the calculation of the inelastic scattering cross section.
1. Introduction: A Historical Overview
The study of the optical-model potential (OMP) has quite a long
history. For convenience of explanation, we divide the historical develop
ment into four stages (Fig.l). The first-generation OMP began with the
well-known work of Feshbach, Porter and Weisskopf'. They showed that the
overail features of the total and reaction cross sections, including the
size resonances, can be represented for nuclei over a wide range of masses
and energies even with a simple square-well potential,
V(r) = V + tW for r < R (1)
= 0 for r > #
with M = 42 MeV, V = 1.26 MeV and R = 1.45^' ^. This fact suggests that
the overall features of the Interaction of neutrons with the nucleus are
determined by average nuclear properties. This idea was congenial with
that of the shell model which had just been developed at that time. It is
worth noting that another theoretical investigation by Brueckner ef c!.?'
of nuclear matter provided a ground for future development of the
microscopic approach to the OMP determination.
The attempts to make a more realistic potential led to the second-
generation OMP. This included ameliorations in many respects: the poten
tial shape was assumed to have the Woods-Saxon form with the imaginary part
- 115 -

JAERI-M 90-025
changing from surface absorption to volume absorption as the incident
energy Increases; the spin-orbit coupling term was introduced in order to
analyze the polarization data; energy-dependence was Introduced so as to
take into account effectively the nonlocal nature of the nuclear field.
Application of this OMP extended into two disrections, one aiming at
obtaining the best fit parameter set to a specific measurement, another
looking for a set generally applicable to a large range of masses and
energies. In the process of parameter search it was found that there
existed two different kinds of ambiguities, i.e., continuous and discrete
ambigui ties.
Extensive analyses of data by means of this second-generation OM have
revealed that the spherical OM has deficiencies in several respects, mainly
because only one (entrance) channel is explicitly considered in this model.
The OM was thus generalized si as to take into consideration a few
strongly or moderately coupled channels with a great success. Computer
codes based on the coupled-channei theory have now become easily accecible
owing to the progress of high-speed computers. On the other hand,
microscopic approach of constructing the potential starting from the
nucleon-nucleon interactions has recently come into the phase of quantita
tive comparison with empirical data. Another recent topic is the finding
that the dispersion relation plays an important role in analyzing the
interdependence of the real and imaginary parts of the OMP. These findings
together with employment of 'sophisticated formalisms constitute a new
stage of the development of the OM, i.e. the third-generation OM.
Possible future development into the fourth-generation OM will hope
fully lead to happy marriage of empirical and microscopic approaches.
2. Limitations of the Spherical Optical Model
In spite of widespread use of the spherical optical model potential
(SOMP) in the analyses of experimental data and for evaluation purposes,
there are some problems encountered in its applications. These problems
are classified into two groups, i.e. those that can be solved or improved
within the framework of the SOKP, and those requiring advanced treatments.
A. Problems solvable within SOMP
Examples of this class include (a) the continuous ambiguitier and (6)
disagreement between SOMP-calculation and measurement of the j-wave
strength function and reaction cross section near the magic region around A
a 100 (Fig.2). The first of these can be solved by increasing the accuracy
- 116-

JAERI-M 90-025
and extending the energy region of the experimental data. The second
problem is a reflection of the fact that there does not exist a suitable
shell-model orbit for a s-wave neutron to transfer satisfying the parity
conservation rule.
A prescription to solve this discrepancy was proposed by Moldauer3> .
He showed that the agreement was able to be improved by adopting larger
nuclear radius for imaginary part than for the real part (see section 3
below).
Another possibility will be to look for a regional OMP, mentioned
later, that appropreately describes the behavior of the cross sections for
nuclei in each shell region.
B. Problems requiring advanced treatments
In Fig.2 we also observe that the SOM calculation overestimates the
strength function in the region around A s 160. This discrepancy cannot be
solved within the SOM formalism, while the coupled-channel(CC) formalism
predicts a splitting of the peak, in better agreement with the measure
ments. This is a manifestation of the effects of nuclear deformation.
The differential cross sections of even Sm-isotopes present another
good example of the effects of nuclear deformation41. As can be seen in
Fig.3, we can observe apparent trends in the elastic scattering cross
sections of 50 MeV-alpha particles, the diffraction pattern becoming less
pronounced and the slope of the envelope becoming steeper as mass number
increases. Different set of parameters for each isotope should be used to
obtain good representation of the data in the framework of the SOM, while
CC calculations using the same optical potential but different deformation
parameters for each isotope can reproduce the cross section very well.
The analysis of neutron inelastic scattering on actinides also
requires CC calculations. The inclusion of the direct process is one of
the reasons for the drastic change of the evaluations of inelastic
scattering cross sectios for actinides in JENDL-3. This problem will be
discussed later in a separate section.
3. Genealogy of the Global Optical Potentials
Efforts have been made to find out the best set of OMP parameters
based on a comprehensive experimental data. Historical development of the
global OMP (with emphasis on neutron OMP) is briefly reviewed below.

JAERI-M 90-025
(a)Perey-Buc^ (19621
The earliest giobai anaiysis of neutron scattering was made by Perey
and Bucks' using a noniocai potentiai with a Gaussian nonlocal function:
f(r,r') = C(p)#()r-r'[) (2)
M(lr-r'l) 1
^ ^ 0 3 exp[-(r-r')"/PN (3)
where p=(r+r')/2 and 0 is the range of noniocaiity. From anaiyses of
neutron scattering data in the range of 1-25 MeV, they obtained a set
f = 71 MeV, W = 18 MeV, r* = 1.22 fm, a = 0.65 fm, 0 = 0.85 fm, M^. = 7.2
MeV and a = 0.47 fm.
< b) Wi !..?M.f .e.7.Hpdgs p n (1964)
Wilmore and Hodgson^' tried to obtain a iocai potentiai equivaient to
that of Ferey and BuckS' as it is more convenient to use the ioca!
potentiai for practical calculations. They gave the following set (ener
gies in MeV, lengths in fm):
f<! =47.01-0.267F-0.0018F?
^ =9.52-0.053F M;<,=0 (4)
r* =1.322-0.00076A+(4xlO^)^-(SxlOM^
n =1.266-0.00037^+(2xl0n^-(4xl0M^
a/; =0.66
a) =0.48.
This potential is able to fit a wide range of neutron data. The
negative sign of the enegy-dependent term of the imaginary part is
unphysical, the reason for which is not clear.
(c) Mo jdauer. j
The Perey-Buck potential was was successful in reproducing overall
behavior of the s-wave strength function but failed to explain the lower
values around 4 2 100. Moldauer^' found that the problem can be solved by
making the imaginary part peak a bit outside the nuclear radius:
f* =46
% =14 (surface-peaked Gaussian form)
f;<?= 5
R* =0.6+1.164"3, a* =0.62 (5)
& =l.l+1.164"s, & =0.5
- 118-

JAER1-M 90-025
Ryo=0.6+1.16A"3, a <?=0.62.
It should however be noted that this set was devised so as to be used for
& < 1 MeV.
(d) Beech etti -Green (.196?)
One of the most extensively used global OMPs is that proposed by
Becchetti and Greenlees?'. This potential was first derived for protons
based on fits to extensive differential cross section and polarization data
for &* = 10-40 MeV and .A = 58-208. This potential was then converted into
a neutron potential using the following assumptions:
* Energy-dependence of f#, Wr and kp is the same as for proton potential
( : -0.32E, Wr: +0.22F, Wi<: -0.25E).
* The sign of the isospin-dependent term is inverted according to the
Lane model"' ( 24.0(#-2V/ -> -24.0(#-Z)/y! ).
- The geometry parameters for the real part (rw, an) and the depth and
geometry parameters for the spin-orbit term (^c, r^e, a <?) are the
same for neutron- and proton-OMFs.
The depth and geometry parameters of the volume imaginary part was changed
so as to fit the neutron data, resulting in a larger depth and a smaller
radius.
f* = 56.3-0.32F-24.Ot?
Mp = 13.0-0.25F-12.0t!
Mr = 0.22E-1.66
M^= 6.2 (6)
r* = 1.17 (fm), <M = 0.75
rn = 1.26 (fm), <M = 0.58
r, = 1.26 (fm), a? = 0.75
r-f<?= 1.01 (fm), (Rp= 0.75
where ?? = (#-2)/^. This OMP is applicable for & < 50 MeV and ^ > 40.
(e)Rapapor t(1979)
Haparorts' proposed an OMP that fitted neutron angular distributions
between 7-26 MeV ft,, singly or doubly closed-shell nuclei in the range A =
40-208:
y* = 54.19-0.33F-(22.7-0.19F)?7
Wp = 4.28+0.4F-12.8?? (FS15 MeV)
= 14.0-0.39F-10.4!? (F>15 MeV)
W, = 0 (FS16 MeV)
= -4.3+0.38F (FH5 MeV)
119

JAERI-M 90-025
Vso= 6.2 (7)
r* = 1.198, ait - 0 .663
m = 1.295, an = 0.59
rr = 1.295, ar = 0.59
r™= 1.01 , aje= 0.75
This s e t i s claimed to be a p p l i c a b l e for 7 < £„ < 30 MeV and for A > 16.
( f) Wa 11 e r-Guss (.1 ?.85)
One of the newest global OMPs is the one proposed by Walter and
GussIB>. On the basis of the scattering data collected at TUNL and other
institutes, they primarily concentrated on the data in the energy range 10
< En < 24 MeV, where the energy- and radial dependence of the absorptive
well was poorly defined. By leaning on the analyzing power data, new
constraints on the spin-orbit term was defined. A peculiar point of the
OMP is that it employed a logarithmic energy dependence:
V* = 52.56-0.31F-(16.5-0.081£-)J7 (E < 40 MeV)
= 52.56-12.4[l+Hn(Jf/40)]+(16.5-3.24[l+in(£/40)]>tf IE > 40 MeV)
We = 10.85-0.1575-14.94r? (E > 9.9 MeV)
Wr = -0.963+0.1535 (ff < 39.4 MeV)
= -0.963+0.153£[l-0.33iln(£/39.4)] (E > 39.4 MeV)
Vso=5.767-0.015E+2.0V (8)
Wso=0.791-0.018£
r* =1.219, a* =0.688
re =1.2t ae =0.512
rt =1.38- / A , ar =0.557-0.462/v/I
(•7^=1.103, arso=0.5S0
ri/s/>=l.364, avs<?=0.632
The range of applicability is 10 < En < 80 MeV and A >53.
4. Regional Optical Potential — "Shel1-by-shell" approach
There is a difference between fundamental requirements of the global
and particular OMPs. The global OMP aims at maximum generality, while the
particular OMP aims at maximum accuracy in reproducing the experimental
data. Actually, however, "off-the-shelf" global OMP are often not adequate
for detailed analysis, while increased accuracy of fitting by particular
OMP is paid for by reduced generality. It is not easy to reconcile the two
requirements. A possibilty is to find out an OMP that has been optimized
over a limited mass and energy range. Attempts toward this direction has
- 120-

JAERI-M 90-025
recently been started.
A . lp-shell region
Based on the neutron scattering data on 6Li, 7Li, 9Be, 1BBe, ' 2C, ' 3C, 14N, l 60 over the energy range 7 to 15 MeV, Dave and Gould (1983)'"
derived a OMP parameter set for ip-shell nuclei. Although the low level
density of the conpound nucleus makes it queationable to apply the OM to
scattering from light nuclei, it is empirically clear that OM analysis can
reproduce the data for ip-shell nuclei quite accurarely. Many of the lp-
shell nuclei are nonspherical, but it is known that deformation effects can
be masked by suitable choices of SOM parameters. They obtained the
following set:
VR = 45.14-0.020£-23.48r?
Wn =11.32+0.237F-16.08r7
Vso=5.5
m =1.508-0.01334, am =0.5 (9)
m =1.353, an =0.200
rso =1.15, as o=0.5
B. 2p-ld skelI region
In an effort to analyze the neutron scattering data for 2 7A1, 2 8Si, 3 2S over the energy range 14-40 MeV, Martin121 obtained the OMP parameters
for the 2p-ld shell nuclei.
VR =(52.6±2.6)-(0.26±0.03)f-(17.6±3.5)r?
Ws =(10.1±0.5)-(0.15±0.02)F-(15.7±2.7)7?
V, =(-2.9±0.3)+(0.2±0.02)E
Vso=5.7±0.7
m =1.18±0.08, cm =0.66+0.07 (10)
ri =i>=1.28±0.19, at =ar =0.65±0.07
rso=l. 00+0.01, a™=0.41±0.08
C. N=82 shell region
Phillip et cr/.,3) measured transmission data for ' 4 8Ce and transmis
sion ratios for ' 4 2Ce, 1 4 ,Pr, and , 3 9La over the extended enegy range 5-50
MeV. These nuclei (except , 4 2Ce) have a closed shell (tf=82). They
obtained an OMP parameter set in the primary fit to the ' 4 BCe total cross
section:
V* =49.4-0.32ff-(17.0-0.111£-)»7 (£ < 25 MeV)
=45.88-0.159ff-(15.58-0.054E)TJ (ff > 25 MeV)
- 121 -

JAERI-M 90-025
We =7.456+1.4£-26?? (F < 5 MeV)
=16.32[l-exp(-£/2.3)]-26?7 (E > 6 MeV) (11)
Vso=inot given in the paper)
m =rs=rs(?= 1.26, as=aso =0.7
6 =1.0
It should be noted that this OMP employed the Gaussian shape for the surface
imaginary term.
D. Actinide region
Madland and Young141 tried to derive a regional OMP on a shell-by-
shell basis for a narrow range of mass number in the actinide region for
the neutron energy range of 10 keV-10 MeV. Starting from the SOM, after
re-optimizations in three steps, they arrived at an approximate SOMP. A
method was proposed for determining a deformed OMP from the approximate
SOMP. This method utilized scaling transformations between the CC- and
SOM-values for the real depth VR and the product V/vav
V*{CC)/VR (SOM) * 1.025 (12a)
WDao (CC)/W»at (SOM) * 0.705 (12b)
obtained empirically from the iteration calculations for 2 3 8 U . Eq.(12b)
can be interpreted as follows. In the SOM-calculations for deformed
nuclei, the effects of coupling to the low-lying collective states are
effectively included in the imaginary part, while in the CC-calculatlons
the effects are separated out, since the the couplings are explicitly
treated, resulting in smaller imaginary depth.
5. Nonlocality and Equivalent Local Potential
Since the nuclear force is essentially nonlocal, so is the OMP too.
However, because of the complexity of calculations based on the nonlocal
potential, efforts have been devoted to finding an local potential
equivalent to nonlocal potential. It is now well recognized that the
nonlocal potential is equivalent to a momentum-dependent potential, which
appears as energy dependence in the depth parameters. The parameters of the
equivalent OMP are determined so that it should provide an equivalent
elastic scattering cross section, i.e. equivalent wave function outside the
nuclear radius.
- 122 -

JAERI-M 90-025
A. Trivially Equivalent local Potential (TELP)
The Schroedinger equation describing the wave function in the nonlocal
potential is written as
hs
2u
d? UH*1) + ft?
dr* X» (r) \Vi(r,r')xi (r')dr' (13)
If we take a potential for the 5-th partial wave
Ut TELP (r) Vi(r,r')xi(r')dr' / xi(r'), (14)
it is evident that this trivially equivalent local potential(TELP) will
provide exactly the same solution for all r as the nonlocal one. However
TELP is not useful since it has very complex and peculiar properties such
as,
i) The TELP does not have a smooth behavior; UtTCLI>(r) diverges when
X'(r) in the denominator approaches zero. UtTlLP becomes infinite
at r = 0 because the xi equals zero at the origin,
ii) The TELP is different for every partial wave,
iii) The TELP has a complicated enegy-dependence which is different for
different partial wave.
This odd potential is not the kind of local potential we want.
B. Approximately Equivalent Local Potential (AELP)
The equivalent local potential we want is something that has a simple
behavior yet generates approximately the same wave function. The wave
function x<L> in this local potential is related to the wave function x("L)
in the nonlocal potential by
X<«L)(r) = F(r)x(L>(r). (15)
The wave-function correction factor F(r) should approach unity when r —* •
for scattering waves. Perey and Buck51 have shown that, by factorizing the
nonlocal potential V(r,r') into two parts as shown in eqs.(2) and (3),
local potentials should be found, which were almost equivalent to the
nonlocal one at a particular energy, in the sense that they reproduced the
nonlocal angualr distribution. The following relation was found to hold:
U<H> (r)=Uf*iJ(r)exp W»f
2ft2 IE - t/"°(D] (16)
123

JAERI-M 90-025
Here it should be reminded that, by definition of the equivalence, the wave
functions generated with the AELP are not always identical to the nonlocal
ones inside the nucleus; the correction factor Fir) is given, in the local-
energy approximation, as
Fir) = 1 + dU<>
dE (17)
Actually, it is known that KeF(r) a 0.85 for r < R. Thus the use of the
AELP in DWBA calculation leads to overestimation of the cross section, when
there is a considerable contribution from internal wave function. This is
in fact the case for nucleons and light particles. Fig.4151 is an example
of manifestation of this effect. This may also be one of the reasons for
disagreement between experiment and DWBA calculation of direct inelastic
scattering cross sections normalized by transition probability data.
In conclusion, it should be kept in mind that a part of information
contained in the nonlocal potentials is lost in transforming to equivalent
local potentials.
6. Dispersion Relation A Farewell to the Woods-Saxon Form
One of the recent topics of the study of the OM is the application of
the dispersion relation in determining and tuning the OMP. It has long
been customary to determine the real and imaginary parts assuming
implicitly that the two parts are independent each other. However,
strikingly, the dispersion relation predicted that the nonlocal real part
V(r,r';E) and imaginary part V/(r,r';E) at energy E were interrelated
accoding to the following formula:
V(r,r';E)
W(r,r';E)
1
2TT
'*• W(r,r';E') -dE',
-. E' - E
'• V(r,r';E')
2n . E' -dE'.
These relations readily follow from the Cauchy's integral formula,
ing equivalent local potentials as
(18a)
(18b)
Defin-
V(r;E) Vir,r';E)d3r , (19a)
Wir;E) Wir,r';E)d3r , (19b)
- 124 -

JAERI-M 90-025
we have
1 V(r;E) =
W(r;E) = -
2?r
1
W(r;E') ~dE' , (20a)
2TT .
E' - E
'*• V(r;E')
E' -dE'. (20b)
From eq.(20a) we learn that, if the imaginary part is surface-peaked, as is
usually the case for low-energy reactions, we have a surface-peaked real
component. This results in a "wine-bottle shape" when there is an
additional constructive component at the surface.
Some examples of application of the dispersion relations follow below.
(a)Ahmad and Ha. ider (. 1976)
Armad and Haider16' used the dispersion relation to calculate the
surface-peaked component of the real potential from the surface-peaked
component of the imaginary potential. They used the OMP obtained by Van
Oers 1 7' for elastic scattering of 10-60 MeV protons on 4 8Ca. The depth
WS°(E) of the surface-peaked imaginary potential of the derivative Woods-
Saxon form is shown in the inset of Fig.5 and described as
Ws°(E) = 0.38exp<-[(£-13.84)/25.58]2>. (21)
The real surface term can now be computed using eqs.(20a) and (21). The
calculated VS(E,R) IR = ri/A''3], which is a measure of Vs(E,r), is shown in
Fig.5 for two different values of the diffuseness ay of the imaginary part.
It is seen that the contribution of the term Ws"(£) to the real potential
is significant in some energy regions, particularly around 10 MeV.
(b) Su Zo ng D i .....aM..M .S.?.9J[!...IlM?..?..
The addition of the real surface component has also the effect of
increasing the effective radius and surface diffuseness of the real
potential. Su Zong Di and Hodgson18' investigated the effect on the total
cross section of increasing the radius of the real potential. They found
that the total cross section increased with increasing radius for energies
above 3 MeV, as expected, whereas at lower energies the cross section
decreased as the radius increased (Fig.6). The total cross section was
calculated for 4 8Ca including the dispersion term. It was found that the
cross section became less than that given by the global OMP of Wilmore and
- 125 -

JAER1-M 90-025
HodgsonS' in the low energy region, and in general accord with the
experimental data (Fig.7). The authors concluded that the total cross
section at low energies was governed by Ramsauer-like interference effects
that made it rather sensitive to quite small changes in the real potential,
such as those introduced by including the dispersion term.
(c)K'tazawa, j ar ima and Mukai (1989)
In an effort to evaluate the ^ A H n . a ) reaction cross section,
Kitazawa, Harima and Mukai'S' determined an alpha-particle OMP that was
consistent with the dispersion formula and physical invariants of the OMP.
The OMP also conformed to the information obtained from the nuclear rainbaw
scattering at intermediate enegies. Using this OMP, they were able to
reproduce successfully the observed ^ A H n . a ^ N a reaction cross sections
for incident neutron energies below 20 MeV (Fig.8).
As we have seen above, the dispersion relation throws light on the
problems that have been difficult to solve hitherto. It introduces a new
degree of freedom to the OMP by relaxing the constraint of the traditional
Woods-Saxon form on one hand, introducing at the same time a new constraint
on the relation between the real and imaginary parts of the OMP on the
other hand. What the dispersion relation tells us is that the OMP should
satisfy the two equations (19a,b) concurrently in order to be consistent.
In the above examples, the dispersion relation (19a) was used to derive the
real surface component from the imaginary surface potential. Does the
resultant potential satisfies another equation (20b)? — Here is the next
question to be answered.
7. Optical Potentials for the Calculation of Inelastic Scattering
There are two processes in inelastic scattering of particles on a
nucleus, i.e., direct interaction (DI) and compound-nuclear (CN) processes.
Inclusion of Dl process is essential in the analysis of inelastic
scattering on deformed nuclei, such as actinides.
The present author^"' proposed a unified method of calculating the
inelastic scattering cross section, taking into consideration both the DI
and CN processes. As is shown schematically in Fig.9, the inelastic
channels are divided into three classes according to the strength of
coupling to the ground state (g.s.). The strongly coupled channnels (g.s.-
rotational-band states, for instance) are treated by means of the CC theory
combined with the Hauser-Feshbach (HF) formalism through Satchler's general-
- 126-

JAERI-M 90-025
ized transmission coefficients21'(we call this CC/HF method as contrasted
to the conventional SOM/HF method). Inelastic scattering to the moderately
coupled channels ( e.g., vibrational states) are calculated by applying the
DWBA formalism. The effects of the weakly coupled channels are included in
the imaginary part of the OMP.
Two comments are made below in regard to the ONP to be used in these
calculations.
A. Entrance- and Exit-Channel Optical Potentials for the CC/HF Method
The CC/HF calculation requires two OMPs; one for the entrance-channel
calculation by a CC code, such as JUPITOR-128' , another for the exit-
channel calculation with a HF code, such as ELIESE-323'. The first should
be the CC-OMP with appropriate deformation parameters j5« and fit that have
been determined so as to reproduce the experimental data. As the latter
was chosen the spherical OMP without deformation parameters.
It should be emphasized that the differences between the CC/HF method
and the customary SOM/HF method lie not only in the fact that the DI
process is accounted for, but also the CN process suffers a considerable
change owing to a change in the generalized transmission coefficients, as
is shown in Fig.10 for the case of 2 3 2Th + n. Thus for example,
i)The p-wave contribution is increased in the several-hundred-keV
region, resulting in better agreement of the total cross section over
the region.
ii)The inelastic scattering to the continuum is higher than that from
SOM/HF method by up to 15B, resulting in a greater energy loss of
incident neutrons.
iii)The CN formation cross section is increased up to 255* over the
entire energy range up to 20 MeV, resulting in enhanced cross
sections for the reactions proceeding by way of the CN.
In this repect, one can say that simple combination of HF and DWBA methods
for this purpose risks neglecting these effects.
The point ii) is important from reactor physics' point of view, since
this results in enhanced moderation of MeV-neutrons in fast reactors.
B. Asymmeric Distorted Wave Approximation
Inelastic scattering to moderately coupled states can be calculated
using the DWBA code, such as DWUCK241. Since the coupling is not supposed
to be so strong, the effect of loss of probability flux by way of DI is not
reflected in the transmission coefficients; instead, generalized trans-
- 1 2 7 -

JAERI-M 90-025
mission coefficients fron CC/HF method was used to calculate the CN
component of the inelastic scattering cross section.
An asymmetric form of the distorted-wave approximation for ineiastic
scattering has been proposed by Satchler^^' and Asquitto, Petersen and
Segiiess' and studied further by Kubo and Hodgson^?'. It has been found
that the transition amplitudes calculated with the exit-channei wave
function generated by a 'bare' OMP reproduce the exact resuits a little
more accurately than the conventional DWBA CDW method', according to the
terminology of Satchier^s'). That is to say, in this method, a SOMP that
reproduce the elastic scattering is used for the entrance channel, while a
bare OMP (i.e., CC-OMP) Is employed as the exit-channel distorting
potential in the calculation of the transition amplitude:
7*,4 = <p*[H'tp<> (22)
where #. is the wave function generated with the SOMP that reproduce the
elastic scattering, #A the wave function generated with the bare OMP. This
method is reasonable because the effects of channel coupling is explicitly
taken into consideration by the transition amplitude itself.
8. Concluding Remarks
Some remarks regarding the use of OM are summarized below:
(a) In reference to the use of the OM, most of the JENDL-2 evaluations
were based on the spherical OMP, whereas in the JENDL-3 evaluations the CC
and DWBA codes have been extensively used to consider the direct processes;
this means that we have advanced from the second-generation to the third-
generation OMP. The next step will be to proceed to a detailed study of
the OMP, such as deviations from the Woods-Saxon form, relativistic OMP at
higher energies, e(c.
(b) Systematic approach to the regional OMPs on the "shell-by-shell"
basis will possibly provide OMPs with adequate range of applicability as
well as reasonable accuracy.
(c) The equiuaienf iocal OWP is equivalent to the nonlocal OMP only in
the sense that it generates approximately the same wave function to the
original one outside the nucleus, and does not garantee full equivalence of
the wave function inside the nucleus.
(d) Application of the dispersion relation has revealed that there Is *
deviation from the Woods-Saxon form in the real part of the OMP. tt also
leads effectively to Introduction of energy-dependence to the nuclear
- 128 -

JAER1-M 90-025
radius.
(e) In the use of the CC/HF method, one shouid be aware of the fact that
not only the direct component is considereed but also the CN component is
changed from the SOM/HF method. The ADWA is known to give slightly better
results than the conventional DWBA for moderately coupled channnels.
Acknowledgments
The author is very indebted to Dr. P.E.Hodgson of the Oxford
University and to Drs. H.Kitazawa and Y.Harima of Tokyo Institute of
Technology for providing manuscripts of their works to the author prior to
publication.
References
1) H. Feshbach, C. E. Porter and V. F. Weisskopf, Phys. Rev. 94. 448(1954)
2) K. A. Brueckner and J. L. Gammei, Phys. Rev. 109,1023 (1958)
3) P. A. Moldauer, Nucl. Phys. 47, 65 (1963)
4) N. K. Glendenning, D. L. Hendrie and 0. N. Jarvis, Phys. Lett. 26B,
131 (1968)
5) F. G. Perey and B. Buck, Nucl. Phys. 32, 353 (1962)
6) D. Wilmore and P. E. Hodgson, Nucl. Phys. 55, 673 (1964)
7) F. D. Becchetti.Jr., and G. W. Greenlees, Phys. Rev. 182, 1190 (1969)
8) A. M. Lane, Phys. Rev. Lett. 8,171 (1962); Nuc). Phys. 35,676 (1962)
9) J. Rapaport, V. Kulkarni and R. W. Finlay, Nucl. Phys. A330, 15(1979);
J. Rapaport, Phys. Rep., 87, 25 (1982)
10) R. L. Walter and P. P. Guss, Proc. /ni. Conf. on #Hc!ear Data for Basic
and ^ppiied Science, Santa Fe, 1985, p.1079
11) J. H. Dave and C. R. Gould, Phys. Rev. C28, 2212 (1983)
12) Ph. Martin, Nucl. Phys. A466. 119 (1987)
13) T. W. Philip, H. S. Camarda and R. M. White. Proc. Symp. on WeMtron
Cross Sections from JO io 50 #ef, (1980) p.769
14) D. G. Madland and P. G. Young, Proc. /nf. Conf. on Neutron PAysics and
ifciear Dafa, Harwell, 1979 p.349
15) K. K. Seth, J. Picard and G. R. Satchler, Nucl. Phys. A140. 577 (1970)
16) 1. Ahmad and W. Haider, J. Phys. G ^, L157 (1976)
17) W. T. H. Van Oers, Phys. Rev. C3, 1580 (1971)
18) Su Zong Di and P. E. Hodgson, to be published. (1989)
19) H. Kitazawa, Y. Harima and N. Mukai, unpublished.
20) T. Ohsawa ef ai., Proc. /nf. Conf. on Afuciear Data for Basic and
-129-

JAERI-M 90-025
Applied Science, Santa Fe, 1985 p.1193;
T. Ohsawa, Proc. 1986 Seminar on Nuclear Data, p.320 (1987)
T. Ohsawa et al.t Research on Thorium Fuel, SPEY 21, Reports of Special
Project Research on Energy under Grand-in-Aid of Scientific Research of
the Ministry of Education, Science and Culture, Japan, p.35 (1987)
21) G. R. Satchler, Phys. Lett. 7, 55 (1963)
22) T. Tamura, Rev. Mod. Phys. 37, 679 (1965)
23) S. lgarasi, JAERI-1224 (1972)
24) P. D. Kunz, COO-535-606 and -613 (1969)
25) G. R. Satchler, Lectures in Theoretical Physics, Vol.VIII, p.73 (1965)
G. R. Satchler, Direct Nuclear Reactions, Oxford (1982)
26) R. J. Asquitto, J. F. Petersen and E. A. Seglie, Phys. Rev. Lett. 41,
1159 (1978)
27) K. I. Kubo and P. E. Hodgson, Phys. Lett. 100B, 453 (1981)
- 130-

JAERI-M 90-025
T H E O P T I C A L M O D E L : A H I S T O R I C A L O V E R V I E W
First-Generation OMP
Characteristics
S Q U A R E - W E L L OM Feshbach - Por ter - Meisskopf (1954)
Associated Nuclear Models
Compound Nucleus Shell Model Brueckner Theory
"Realistic Potential"
Second-Gener'n OMP
"Refinement"
Third-Generation OMP
"Sophistication"
Fourth-Gener'n OMP
O N E - C H A N N E L OM • Ret Woods-Saxon form • la'. Gassian/Der.W-S form
Surface—»- Volume type ( E t )
• Spin-Orbit coupling • Nonlocality—»-E-dependence
==> in search of PARTICULAR OMP = * in search of GLOBAL OMP
(isospin dep.) • Continuous/Discrete ambiguities
F E W - C H A N N E L OM • Explicit treatment of strongly/ moderately coupled channels
M I C R O S C O P I C O M P • N-N —> N-Nucleus interaction
Hauser-Feshbach Moldauer Theory
Generalized OMP • CC Separation of
deform, param. • DWBA Perturbation
D I S P E R S I O N R E L A T I O N • Interdependence of Re and In parts • Deviation from foods-Saxon form • Energy dependence of nuclear radius
and diffuseness (if V-S form assumed)
"Marriage" of Phenomenological and Hicroscopic Approaches
Fig . 1 H i s to r i ca l development of the op t ica l model
- 131 -
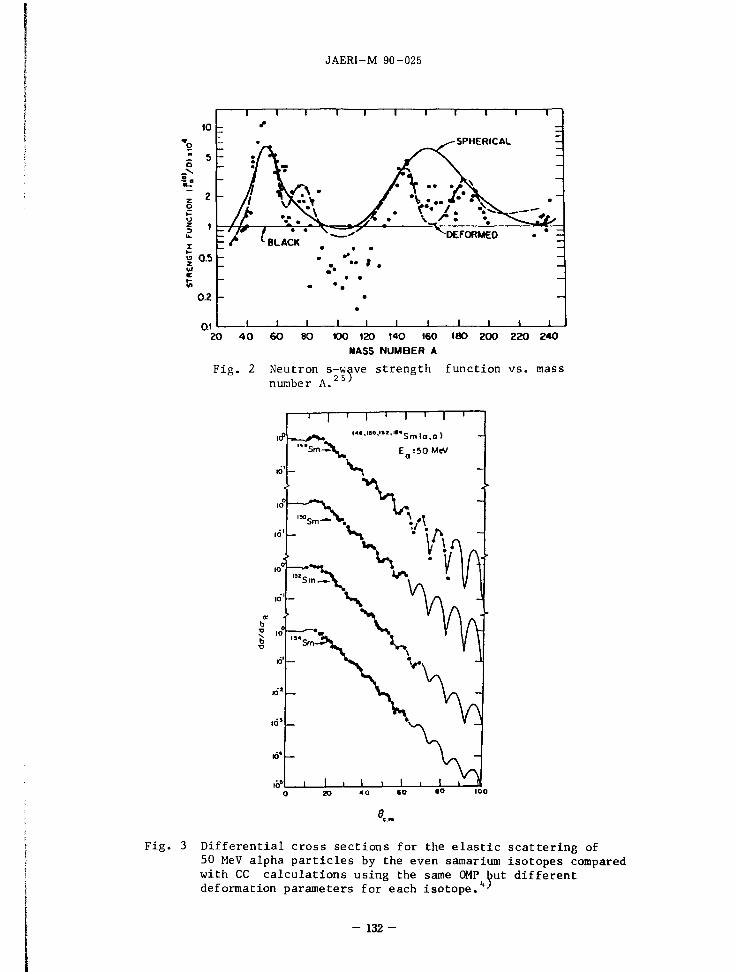
JAERI-M 90 -025
Ql
"i i i i i i 1 1 r
-I 1 1 1 1 i i I I i_ 20 40 60 80 100 120 140 160 180 200 220 240
MASS NUMBER A
Fig. 2 Neutron s-wave strength function vs. mass number A.
- i — i — > — i — ' — i — i — r
>•%. "••'"•'•'SnMa.ol
"Sm-A. E :50M«SV
e
Fig. 3 Differential cross sections for the elastic scattering of 50 MeV alpha particles by the even samarium isotopes compared with CC calculations using the same OMP but different deformation parameters for each isotope. '
- 132 -

JAERI-M 90-025
Fig. 4 Comparison of *4°Ca(d,p) cross sections calculated with and without corrections for nonlocality of the distoring potential (labeled as NL and L, respectively) Also shown are the results of making the zero-range approximation (ZR) instead of treating the finite-range (FR) correctly.15-* (d„l
Fig. 5 The rea l surface par t of the op t i ca l p o t e n t i a l i s shown as a function of energy for aw = 0.549 ( fu l l curve) and aw = 0.732 (broken curve) . The inse t shows the imaginary surface depth as a function of e n e r g y . 1 6 '
- 133 -

JAER1-M 90-025
S.0
V5
(..0
t 35 5
I 3.9
2.5
2.0
1.5
1
\ . » \ » \> * >> \ " . \»» \ x \
• x x H
--> ^C
*- 5^-^^T^JJ^5^'^ ^ * ~ \ V - e ^ * ^ - - B
^ — - " " " ^ \ xx lS>^ ' ^ - — " ^ * x * ^ ^ - > ^ .•••"^^ ^ v_ .— , * ' f ^
^ - ^ ^ x * x j fM ^ ^ ^ X X *
^ - X V >_«—" - ^ » . — x ^ V _ _ * < \ .
~__ * < ; ; xOJ
~~
1 1 1 1 L—1 L—J L _ J •
3 ^ ^ " " ^X*1^ rf
-£*^~ *
* _ - » • • * • +^^^
*%\w^~-
- — - - * * +
-"** •. — ..-*' •asHtv
1.5 120 125 130 Rtri radius porantttr (fm)
Fig. 6 Total cross section for Ca + n as a function of 18]
radius of the real potential for several energies. '
w
7
= 5
1 3
.s i
07
0.5
T-^r4-&r.db iP^ l i t ? !*»'l»
03 0.7 1.0 IS 2.0 10
Nculronfntrjy IH*V)
.0 SO 7.0
Fig. 7 to-Total cross section for "*"Ca+n compared with OM calculations using the Wilraore-Hodgson OMP (dashed curve) and an OMP including the dispersion term (full curve).18)
- 134-

JAERI-M 90-025
2501—r
200
-O
E •z. 150 O H O HI
<n
en
O 1 0 0 o
50
present work, AV(E) = 0
7AI (n,a) 24Na
Huizenga and Igo
\,MacFadden and ,'' *s . Satchler
/ / > " \ \ \
/ / /
present work, \ V \ AV(E) ^ 0 "^
/ _L
10 15 20
NEUTRON ENERGY (MeV)
Fig. 8 Calculated and experimental Al(n,a) Na reac t ion cross s e c t i o n s . Calculated values with d i f f e ren t 0MP s e t s are
19) shown. '
Weakly • coupled
s t a t e s
Modera te ly ' coup led v^
s t a t e s
Strongly coup led sta tes
HFIwith T,tj from CO
Asymmetr ic DMA
H F ( w l t h T^jErom CO
CC/HF
TARGET RESIDUAL
Fig. 9 Schematic representation of three classes of processes of neutron i n e l a s t i c scattering.
2 0 )
- 135-

JAERI-M 90-025
1.0
. GENERALIZED TRANSMISSION COEFF.
t 0 1 1 2 2 3 i 4
4 5 5
« 6 7 7 S
8
J 1/2
3/2 1/2 5/2 S/2 7/2 S/2 9/2 7/2
11/2 9/2 IS/2 M/2 15/2 13/2 17/2
IS/2
(a) • i • • •
100
r-1-
(b) 1 1 1 • !
100 En (MeV)
Fig. 10 Comparison of the neutron transmission coefficients calculated with CC and SOM.20)
- 136

JAER1-M 90-025
2.2.2 Current Topics in Nuclear Fission Research
Akira Iwamoto
Japan Atomic Energy Research Institute
Tokai—mura, Ibaraki—ken, J A P A N
This year is the 50th anniversary of the discovery of nuclear fission by Otto Hahn
and Fritz Strassmann [1]. From the point of view of the fundamental physics research,
nuclear fission was one of the oldest motivation of the nuclear physics. In this 50
years, many aspects of nuclear fission phenomena have been investigated. Owing to
the nature that the nuclear fission involves a dynamical treatment of
finite—many—body systems, there have been always some challenging new topics in
nuclear fission research in these 50 years. By solving these problems one by one, we
have come closer to the understanding of the nuclear fission dynamics. As examples of
current topics in nuclear fission research, I will choose and discuss the following three:
1) Cold fission phenomena. 2) Heavy—particle radioactivity phenomena. 3) Transient
effect phenomena.
1. Cold fission
The asymmetric mass distribution for the spontaneous fission of the actinide nuclei
is one of the most well known feature of the nuclear fission. For the very heavy
members of the actinide nuclei a remarkable deviation were found rather recently from
this feature. This phenomena is called as cold fission, because the intrinsic excitations
of two fragments are quite low compared with those of the neighboring systems.
Although there were some precursor phenomena which were observed earlier, the
typical cold fission was discovered at the end of 1970's for M S F m and zsapm in
Berkeley [2]. After this Erst discovery, the same phenomena were observed for 259Md,
MOMd, 25SNo and 2"2No [3] ^ Fig.l the mass distributions for the heavy actinide
nuclei are shown schematically. The F m isotopes are most typical examples where as
the neutron number increases from 156 to 157, the symmetric component increases and
partially fills the dip for the symmetric mass distribution. This is a precursor
phenomena which proceeds the drastic change which happens when the neutron
number increases from 157 to 158. The mass distribution changes suddenly to
- 137 -

JAERI-M 90-025
symmetric one and at the same time, the width of the mass distribution becomes quite
narrower. It's a surprise that only one difference of neutron number causes such a big
change!
Another characteristic of the cold fission phenomena is seen in the mean value of
the relative kinetic energy between two fragments which is shown in Fig.2. It is seen
that the typical cold fission phenomena is occurring in MSFm, asapm and M"Md.
Their kinetic energies are higher by 30 to 40 M e V compared to those coming from the
normal fissioning nuclei. Again, the drastic change between M ? F m and 3S"Fm is
impressible. If we compare Figs.l. and 2, we can say that the typical cold fission is
characterized by the symmetric and very narrow mass distribution, and exceptionally
low intrinsic excitation energy of fragments.
This phenomena caused strong interests among theoreticians for the explanation.
From theoretical point of view, the explanation is difficult because we have no reliable
theory to calculate the mass distribution for the spontaneous fission in general. What
we can have at most is some qualitative model to understand it. One of such model is
proposed by Moller—Nix—Swiatecki [4]. What they pointed out is the existence of two
discrete fission paths which have configurations quite different near their scission
points. They calculated the potential energy surfaces in two-dimensional shape
parameterization (energy is minimized with respect to other parameters). They found
that for the cold fissioning nuclei, two fission paths exist which bifurcate at some
deformation on the way to scission and end up at quite distinct deformations at the
scission points. One of the scission configuration has rather compact shape compared
to the other which has a typical scission shape of the normal actinide nuclei. Thus if
the fission proceeds along the former path, it leads to the high relative kinetic energy
as were shown in Fig.2., because the compact scission shape means the high relative
Coulomb potential. Thus the model might be able to explain the kinetic energy
characteristics but the feature of the mass distribution is not understood well. Another
remaining problem is that the explanation uses only the collective potential energy
property and neglects the effect of mass tensors. To obtain the reliable fission path in
the multi-dimensional parameter space, we need to develop a model in which the effect
of the kinetic term in addition to the potential term should be treated correctly. In
this respect, the model we proposed in [5] seems to be a promising starting point.
2.Heavy—particle radioactivity
Most of the stable nuclei which have proton numbers larger than 40 are unstable
- 138 -

JAERt-M 90-025
with respect to the two—body decay from the Q—value estimation. Alpha decay and
fission are known as popular two—body decays. Sandulescu et al. pointed out the
possibility of very asymmetric mass division in the fission process in 1980 [6]. Four
years later, Rose and Jones [7] discovered the decay process M3U -* !°9Pb+**C , the
partial half-4ife of which is about 10 sec and the branching ratio to alpha decay,
about 10*0. After the discovery of " C radioactivity, many kinds of heavy—particle
radioactivity have been confirmed [8]. They are the emissions of MF, MNe, 2'Ne, 3'Mg,
3°Mg, 3!Si and 3*Si from variety of compound nuclei as is seen in Table 1. It is clear
from this table that the phenomena are rather popular for the heavy nuclei. There are
two alternative models to understand the phenomena, one is an extension of the theory
of alpha decay and the other is an extension of the fission theory.
As a typical example of the alpha—decay school, I will introduce the method of
Blendowske and WaUiser [9]. In their treatment, the decay width for the heavy
particle is expressed as
r = n^.p.s
where v is the velocity of the heavy particle inside the potential well which is obtained
by the decay Q—value and Ri is the potential radius. P stands for the normal W K B
penetration factot for the barrier of the heavy particle and S is the spectroscopic factor.
This S represents the probability to observe the heavy particle in the ground state
wave function of the parent nucleus. Spectroscopic factor S is expressed in the form
S(a) = [ S(a) ] (""*)/3
where a is the mass number of the heavy particle and S(a) stands for the spectroscopic
factor of alpha particle. This expression assumes that the spectroscopic factor should
scale proportional to the power of the number of intrinsic freedom of heavy particle .
The S(a) value, however, is thought to be an effective value and it depends on whether
the heavy particle has even or odd mass number
S"""(a) = 3.2 * 10-3.
- 139 -

JAERI-M 90-025
Using this model and assuming the simple barrier shape, they obtained values shown in
the column specified by B W in Table 1.
Another way to calculate the half lives is to use the similar method to fission and
we call it as fission school. There are several groups in this school and I will introduce
two typical ones. Shi and Swiatecki [10] assumed that th^ ootential between the heavy
particle and the residual nucleus is given by the Coulomb and the proximity potential.
W h e n the heavy particle is overlapping with the residual nucleus, they assumed
intermediate shapes which smoothly connect the spherical parent nucleus and two
spherical nuclei of heavy particle and the daugh' x nucleus. In this respect, their
potential is essentially different from that of Blendowske and Walliser where the heavy
particle is treated like a point object. The results of Shi and Swiatecki is shown in the
column specified by SS in Table 1. As a second example, I will introduce the method
of Poenaru et al. [11]. The essential difference of their method from that of
Shi—Swiatecki is that the former used the Strutinsky prescription to calculate the
potential energy for the decay process. Thus the barrier is calculated as a sum of the
macroscopic liquid-drop part and the shell correction part. Their results is given in
the column specified by Poe. in Table 1.
The agreement between the calculations and the data seen in Table 1 is
unexpectedly good if we remember the fact that to reproduce the alpha-decay half—life
is quite hard even now. W e should keep in mind, however, that theories of
heavy—particle decay include some fitting parameters.
3. Transient effect
The expression for the fission decay—width from the excited compound nucleus was
given in the famous paper of Bohr and Wheeler [12] and is used even now. W e should
also pay attention, however, to the fact that Kramers proposed a generalization of it
[13] one year after the paper of Bohr and Wheeler. The idea of Kramers is that there
exists a frictional force acting to the motion of fission. This friction modifies the
stationary current to the fission direction at the saddle point and as a result, the fission
width turns out to be smaller than the value of Bohr and Wheeler. This was probably
the first paper which pointed out the importance of dissipation in the collective nuclear
motion. From the end of 1960's, the heavy-ion reaction became popular and
heavy-ion fusion—fission process has been investigated quite extensively. The
characteristic of the fusion—fission process is that it involves a high excitation energy
and high angular momentum. The rotating-liquid-drop mode! teUs us that as the
- 140 -

JAERI-M 90-025
angular momentum increases, the fission barrier height decreases due to the centrifugal
potential. This, in addition to the high excitation energy, increases the fission width
considerable compared with the light—ion induced fission. Thus the fission life—time
becomes quite short, to the order of 10'*" sec or even shorter. In such situation, a new
phenomena is expected to occur, which is called as transient phenomena.
To explain this phenomena, I will start from the experimental data for the
pre—scission neutron multiplicity. This quantity is defined as the number of neutrons
emitted in coincidence with the fission fragments but omitting the neutrons emitted
from the fragments. Thus it is the multiplicity of the neutrons emitted from the
compound nucleus which proceed the fission process. Experimentally, the separation
between the pre-scission and post-scission neutrons is carried out by observing the
velocity spectra of neutrons in coincidence with those of the fission fragment. The
pre—scission neutron multiplicity defined in this way is shown in Fig.3 [14] as a
function of the excitation energy of the compound system for various heavy-ion
fusion—fission process. Various curves are the calculated results by assuming the
standard statistical model with different level density parameters. As is seen clearly
from this figure, the data points deviate more and more from these lines as the
excitation energy increases. A possible origin of this effect is the following.
The Bohr—Wheeler expression for the fission width involves the calculation of the
flux at the saddle point deformation. Because the saddle deformation is displaced from
the ground—state deformation which is near spherical, it might be possible to attach a
time which the system needs to reach the saddle deformation starting from the
ground—state deformation. W e call this time as transient time. This is the time
during which the system cannot fission. The rough estimate of the pre-scission
neutron multiplicity is give by (rn/rf) where Tn is the neutron emission width and Tf
is the fission width from the compound nucleus. During the transient time, the fission
width is effectively hindered and therefore, the fission life—time h/rf is elongated. In
other word, the fission width is no longer a constant and we have to treat the
time—dependent fission width. This causes the increase of the pre—scission neutron
multiplicity. This situation is shown schematically in Fig.4.
In order to calculate the time—dependent fission width, we have to settle some
models. Most popular one is the classical statistical model which makes use of solving
a Fokker—Planck equation or Langevin equation. I will not give the detail of the
method and explain only the final results. In this method, by solving one of above
mentioned equations, the probability distribution d(p,q,t) is obtained. Here p is
momentum and q is position of the fission coordinate and t is the time. The quantity
- 141 -

JAERt-M 90-025
d stands for the probability that the fissioning motion has p and q at time t. Defining
the quantity
<-qo r+n n(q.,t) = dq dp d(p,q,t)
where qo stands for the saddle—point configuration, we see that n stands for the
probability that the system has not fissioned at time t. Then the fission width is given
by
rf = -h{ntnn(qo,t)
the meaning of which is easily understood from the definition of the decay width. A n
example of the fission width calculation according to this expression is given in Fig.5
[15]. In this case, the transient time of about 10*3° sec is obtained. T o explain the
recent experimental data, the transient time longer than this time seems to be required
[16]. In this respect, a refinement of the theory will be necessary to reproduce the
experimental data quantitatively.
References
[I] 0. Hahn and F. Strassmann, Naturwiss., 27,11 (1939).
[2] D C . Hoffman, Proc. I A E A Symp. on Phys. and Chem. of Fission, Julich
1979 (IAEA,Vienna, 1980), vol II p275.
[3] D C . Hoffman, Nucl.Phys. A502, 21c (1989).
[4] P. Moller, J R . Nix and W.J. Swiatecki, Nucle.Phys., A469,1 (1987).
[5] T. Kindo and A. Iwamoto, Phys.Lett. B225, 203 (1989).
[6] A. Sandulescu, D.N. Poenaru and W . Greiner, Sov.J.Part.Nucl., 11, 528 (1980).
[7] H.J. Rose and G.A. Jones, Nature 307, 245 (1984).
[8] P.B. Price, Nucl.Phys. A502, 41c (1989).
[9] R. BlendowsM and H. Walliser, Phy.Rev.Lett. 61,1930 (1988).
[10] Y.J. Shi and W.J. Swiatecki, Nucl.Phys. A438, 450 (1985).
[II] D.N. Poenaru et al., publ.NP-54-86, Inst.Central de Fizica (Bucharest, Romania,
1986).
[12] N. Bohr and J.A. Wheeler, Phys.Rev. 56, 426 (1939).
- 142-

JAERI-M 90-025
[13] H.A. Kramers, Physica 7, 284 (1940).
[14] D.J. Hinde et al., Nucl.Phys. A452, 550 (1986)
[15] P. Grange et al., Phys.Rev. C34, 209 (1986).
[16] W.U. Hinde, D. Hilscher andd H. Rossner, Nucl.Phys. A502, 497c (1989).
- 143-

Table 1 A summary of the p a r t i a l h a l f - l i v e s of heavy-par t i c l e r a d i o a c t i v i t y taken from[8] together with the measured branching r a t i o .
Theoretical Predictions of log T (refs.) Dftcay:
22iFr (1«C)
221Ra('4C)
222Ra(14C) 223Ra 0*C)
22'Ra ( , 4C)
225AC (14C) 226Ra (14C)
231pa(23F)
230Th { 2 4 N e )
232Th (26Ne)
23ipa(24Ne) 232U (24 Ne) 233|J (24 N e )
233U (25Ne) 234(J ( 2 4 N e )
234u (26N e )
23<U (28Mg) 237Np (30Mg) 238pu (30Mg)
238pu (28(v1g)
238pu (32Si) 241 Am (34Si)
C | 0 0 T
(MeV) 29.28 30.34
30.97
29.85
28.63
28.57 26.46
46.68
51.75
49.70 54.14
55.86
54.27 54.32 52.81 52.87
65.26
65.52
67.00
67.32
78.95 BJLSQ
Poe.
14.4
14.3
11.2
15.2
15.9
17.8 21.0
25.9
25.3
28.8 23.4
20.8
J24.8 •25.0 (26.3 '26.5
25.8
27.5 (25.7
>26.0
25.1 24.5
0.45
P-P
(35) 16.5
14.7
13.3
15.6
18.0
19.0 22.9
>23.4
26.1
29.6 23.4
21.8 24.4 >24.4 26.4 >26.4
>26.4
27.7
>26.4
>26.4
26.4
2JL5
1.33
SqW (13) 15.2
14.1
11.2
15.0
16.0
18.7 21.0
26.0
24.8
29.1 23.7
20.7
24.9 25.1 25.8 26.2
25.4
28.3
25.9
25.5
25.7
2SJi
0.28
SS
(27) 16.0
14.8
11.6 15.7
16.8
19.7 22.2
25.5
24.9
28.4
23.5
20.0
24.8 24.4 25.7 25.0
25.7
27.7
24.6
—
2L2
0.67
BM (35) 14.0 >12.4
11.2
15.3
16.1
18.8 21.2
....
24.4
28.7
21.6 20.2
23.7
25.5
25.9
25.7
>27.3
25.6
25.7
26.0
25J1
0.71
BW (28) 15.5
14.2
11.8
15.1
16.2
18.6 21.1
....
24.8 27.9
23.4
20.8 25.4
25.6 26.4
25.4
29.9
25.8
26.9
25.7
2&B
0.35
SK
(37) 14.5
13.3
11.8
14.2
17.0
18.3 22.5
....
25.2 29.4
22.3
20.6 23.6 23.6 26.4 26.5
25.8
26.8
25.7
25.4
25.5
2JLfi
0.82
IS (55)
....
.... 10.5 14.9
15.3
21.7
....
—
23.9
19.8 24.41 .... 1 .... |
1
25.7
....
—" 1 ....I
—
22LB
0.6
Measured log T <sec) -log B
>15.77
>14.35
11.02+0.06
15.2±0.05
15.910.12 >18.34 21.33+0.2
>24.61
24.64+0.07 >27.94
23.38+0.08
21.06±0.1
24.82±0.15
25.25i0.05
25.75+0.06
>27.27
25.710.25
25.3+0.16
>13.3
>12.9
9.43+0.06
9.21+0.05
10.37+0.12 >12.4 10.6+0.2
>12.74
12.2510.07
>10.3
11.37+0.08
11.7+0.1
12.1210.15
12.3610.05
12.8610.06
>13.4
16.25+0.25
15.8610.16
ref, 13;14
13;14
13;16
10;9;15;13;17
13
14 1 6 ; H
30
29
12
30 31
24;32
21;25
21;25
29
11
11 >25.3;>24.2 >15.1;>14.1 29;22;34

JAERI-M 90-025
110 130 ISO 1101» 150 110 t301SOHOI30t50110130lSO
Mass y*d cwvn lof SF
110130 ISO HO 130ISO
Fig. 1 Systematic of mass-yield distributions taken from [3]
I
<f3U
240
230
220
210
200
190
180
170
160
=¥01
1
" " F m - — " -
"<"'" -?,6Fm ^Mm y s^ -
^ " ^ • • • i X * "
• J*C '"Cm
-V'^ !* )Pu Un* et al. ^ > " ^ Viola
"
1300 1400 1500 1600
Z^A"3 1700 1800
Fig. 2 Average relative kinetic energy of fragments taken from[3]. Solid and dashed curves are the systematic of Viola and Unik.
- 145 -

JAERI-M 90-025
MNe.'soNd-"DYb
u pre 2 I
K>0 120 wo
« . 0 70
"Pb "S . ' ^E r - ^Pb
. ». o ro
"0 .«Os- M Po
. « i 0 71 1
"SL- 'Er -^Pb
« • 0 7 2
'/*
. • © • " ' A i l - " ! *
• •
F .»»Th - " "Es
i • 0 6 3 1
80 60 80
Ex (CM) (MeV)
JfS
-a A
" 10 .- A
F
6 0 80
Fig. 3 Pre-scission neutron multiplicity nv as a function of the excitation energy of the compound nucleus taken from[14]. Curves are the statistical model calculation with changing level density parameters.
Fig. 4 Schematic picture of the effect of the transient time in fission width. Upper figure (a) corresponds to the standard case where the neutron multiplicity is about 2. Lower (b) corresponds to the time-dependent fission width and neutron multiplicity becomes larger than 2.
- 1 4 6 -

JAERI-M 90-025
U.U3
0.04
> 2 0.03
I a o.02
5 O.OI
n
i
_
/ 1
1 1 1 1
/ p . 0 . 5 ( 1 0 2 V )
1 1 1 I
_
-
O 3 6 9 12 15 18
TIME (10-2's)
Fig. 5 Time dependence of the fission width calculated in[15], The angular momentum is 65 unit and 3 is the reduced dissipation coefficient.
- 147

JAEM-M 90-025
2.2.3 Topics at the NEANDC Specialists' Meeting on Neutron Activation Cross Sections for Fission and Fusion Energy Apptications
Y. Ikeda
Japan Atomic Energy Research Institute
Tokai-mura, Ibaraki-ken 319-11 Japan
Following three international meetings concerning the neutron
cross section data were held last September, 1989:
1) IAEA-CRP Consultants' Meeting on Measurements of Long-Lived
Activation Cross Sections (Sep. 11-12) at ANL.
2) NEANDC Specialists' Meeting on Neutron Activation Cross
Sections for Fission and Fusion Energy Applications
(Sep. 13-15) at ANL.
3) Sixth Coordination Meeting for the Program to Meet Nuclear
Data Needs for Fusion Energy (Sep. 19-21) at Ohio University.
Though the organizer of each meeting were different, the topics
treated were closely related each other and many of participants
attended at all of three meetings. Since the author participated on
the second and third meetings, this report decribes mainly topics of
the NEANDC meeting and the Sixth Coordination Meeting. A brief
summary of the IAEA-CRP Meeting is also given.
1. NEANDC Specialists' Meeting
The purpose of this meeting were to review the current progress
in the neutron activation cross section research, to examine data
requirement and status of important applicatoion areas, to survey the
method and resources available in the OECD/NEA family to address these
needs, and to organize a working group to foment continued progress in
this field.
Thirty five international specialists including seven Japanese
participated in this meeting and discussed throughly current problems
concerning experiment, evaluation and theory. A total number of 24
papers were presented. The titles and talkers are shown as follows ;
- 1 4 8 -

JAERI-M 90-025
Technical Papers, Session I : Data Needs/Status
Session Leader : B. Patrick
1) S. Cierjacks and Y. Hino
The Role of Sequential (x,n) Reactions on Element Activation of
Fusion Reactor Materials and Related Nuclear Data Needs
2) E. Cheng
Activation Cross Sections for Safety and Environmental
Assessments of Fusion Reactors
3) J. Kopecky and H. Gruppelaar
European Activation Library for Fusion Reactor Technology
4) J. C. Sublet, F. M. Mann and A. J. H. Goddard
A One-Group Averaged Cross-Section Benchmark Comparison for
Fusion Activation Studies
Technical Papers, Session II : Experimental Work
Session Leader : T. Katoh
5) Y. Ikeda and C. Konno
A Program on Neutron Activation Cross Section Measurements at
FNS for Fusion Applications
6) L. R. Greenwood and D. L. Bowers
The Production of *"*V, "^Mo, 9 3 ^ ^ ^ other Long-Lived
Isotopes in Fusion Materials with 14 MeV Neutrons
7) R. C. Haight
Activation with an Intense Source of Monoenergetic Neutrons in
the Range 8-14 MeV
8) T. Katoh, K. Kawade, H. Yamamoto, T. Iida and A. Takahashi
Measurement of Formation Cross Sections of Short-Lived Nuclei
by 13.4-14.9 MeV Neutrons
9) H. Liskien
Improved Neutron Fluence Accuracies in Activation Experiments
10) W. Mannhart, D. L. Smith and J. W. Meadows
Mesurement of the ^ T K n . p ^ S c Reaction Cross Section Between
1.2 and 8 MeV
11) S. M. Qaim
Neutron Activation Cross Section Measurements on Zr, Nb and Mo
Using Radiochemical Techiques
12) T. B. Ryves, P. Kolkowski and A. C. Hooley
Ho, Pb and Bi Cross sections for 14.3 MeV Neutrons
- 149 -

JAERI-M 90-025
13) J. W. Meadows, D. L. Smith, G. Winkler, H. Vonach and M. Wagner
Intercomparison of ^"U Deposits Employed for Neutron Fluence
Determination in Neutron Activation Cross Section Measurements
14) H. Vonach, M. Wagner and R. C. Haight
Neutron Activation Cross Sections of s"Ni and "°Ni for 8-12
MeV Neutrons
15) R. Zorro
Neutron Capture Cross Section Measurements in the Energy
Region 2.0-7.7 MeV Using Activation Technigues
Technical Papers, Session III : Theoretical Work
Session Leader : D. Gardner
16) J. Kopecky and M. Uhl
Testing New Approaches to Calculate Radiative Capture Cross-
Sections
17) D. G. Gardner and M. A. Gardner
Some Neutron and Photon Reactions on the Ground and Isomeric
States of 2s°Np, ^ N p .
18) N. Yamamuro
Calculation of Isomer States Production with a Simplified-
Input Cross Section Calculation System
19) M. B. Chadwick and P.G. Young
Calculation of the Production Cross Sections of High-Spin
Isomeric States in Hafnium
Technical Papers, Session IV : Evaluation Work
Session Leader : P. Young
20) Y. Kanda, Y. Uenohara, T. Kawano and Y. Tsuji
Estimation of Neutron Reaction Parameters in Reaction Model
Formulae for Medium Nuclei Taking Accounts of Proton Induced
Reaction Experiments
21) C. Y. Fu
A Review of Activation Cross Sections in the ENDF/B-VI General
Purpose Files of Cr, Fe, Ni, Cu and Pb
22) Y. Nakajima et al.
Present Status of the 1ENDL Activation File
23) T. B. Ryves
A Simultaneous Evaluation of Some Important Cross Sections at
- 150-

JAERI-M 90-025
14.70 MeV
24) M. Wagner, A. Pavlik, B. Strohmaier, S. Tagesen and H. Vonach
Evaluation of Cross Sections for Important Neutron Dosimetry
Reactions
Topical discussion sessions on 20 particular subjects were taken
place in order to enhance the discussions. The items of topics and
session leaders are listed below.
1
2
3
4
5
6
7
8
9
10
11
12
13
14
15
18
17
18
19
20
Standards and Dosimetry Cross Sections : H. Vonach
Material Damage : L. Greenwood
Waste Disposal : E. Cheng
14-MeV Measurement : Y. Ikeda
Differential Studies : H. Liskien
Integral Studies : W. Mannhart
Activity Measurements : S. Qaim
Data Corrections : D. L. Smith
Data Uncertainties : W. Mannhart
Exotic Reactions : S. Qaim
New Mesurement Methods for 8-15 MeV : R. Haight
Developments in Basic Nuclear Theory : C. Y. Fu
Model Parameter Status and Prospects : M. Gardner
Nuclear Model Code Intercomparisons : P. Young
Merging of Theory and Experiment by Means of
Statistical Methods : Y. Kanda
Uncertainties in Nuclear Model Results : H. Vonach
Evaluation Methodology : J. Kopecky
14-MeV Evaluations : T. B. Ryves
Differential Evaluation : H. Vonach
Activation Cross Section Libraries : F. Mann
The first meeting of the NEANDC activation workL^g Group (WG)
took place. Twenty three individuals attended the meeting. The purpose
was to organize WG and to define some technical projects to be
investigated during the next couple of years. The summary were as
follows :
1) A list of WG participants was established to facilitate good
communication between the participants.
2) It was agreed that the WG meeting takes place periodically.
- 151-

JAERt-M 90-025
3) The WG participants are encouraged to contribute the NEA Fast
Neutron Cross Section Newsletter.
4) Two initial WG projects have been launched ;
- Experimental project : leader, Prof. Vonach
"Inter comparison of correction procedures for neutron
spectrum using s"Ni(n,p) &§ a test case."
- Theory project : leader, Dr. Cierjaks
"Compntation of ^°Co(n,p) reaction cross section."
2. Sixth Coordination Meeting for the Program to Meet Nuclear Data
Needs for Fusion Energy
After the NEANDC meeting, the coordination meeting was held at
Ohio university during Sep. 19-21, 1989. This meeting has been
organized by the Office of Nuclear Physics (ONP) of the US Department
of Energy (DOE) in correspondance with a data need from the Office of
Fusion Energy (OFE) of DOE. Representatives from ten principal
facilities met together and discussed recent progresses and next
actions to meet data request summarized by Dr. E. Cheng (GA),
representative of OFE. The original members of this meeting are ANL,
BNL, Colorado School of Mines, LLNL, LANL, Univ. of Michigan, NIST,
ORNL, Ohio Univ. and TUNL of Duke Univ. In addition, nine
international foreigners were attended. Considarable time was
assigned to Task Forse Sessions to futher the discussion for the data
request list (DRL).
General session
Dr. Whetstone (DOE) gave an overview talk concerning the recent
US Fusion Energy Research environment. He stressed the importance in
the activation nuclear data. Dr. Cheng talked the historical
background of the meeting and mentioned severe situation on the badget
of the US Fusion Program in 1990. Dr. D. Smith (ANL) sammarize the
last NEANDC specialists' meeting. In successive sessions, papers,
concerning progresses in the nuclear data for fusion energy research
were presented by representatives from European countories, PRC and
Japan as well as US principal perticipants. They reported the progress
during three years since the last meeting in 1986 and the plans of
research to be done in coming two years.
- 152 -

JAERi-M 90-025
Task Force Session
The session was divided into two specific session ;
A "Experiment". : chairman Dr. D. Larson (ORNL),
B "Theory and Modeling" : chairman Dr. P. Young (LANL).
Items discussed in Task Force A are as follows :
1) Review of Task Force Efforts,
2) International Cooperation in Measurement,
3) Review of Experimental Capabilities,
4) Review of Current Request List,
5) Data Needs Observed During ENDF/B-VI Evaluation,
6) Review of Data Status from Last Meeting,
7) Charged Particle Data Needs.
The first item discussed was to review the activities of three
working groups (WG) organized at the last meeting. Concerning the data
base for ^Li(n,n't) reactions a remarkable accomplishment was declared
; the uncertainty in the cross section at 14 MeV in ENDF/B-VI is less
than 3%, which meets the data requirement from the view point of
Fusion Energy. The second and third ones were to review 137 activation
cross sections and to set priority among them.
The next business was No.6. Here following 6 important subjects
were treated ;
1) Fuel Cycle Reaction (Charged Particle Reaction),
2) Neutron Multiplication, and Tritium Breeding in the
Blanket, where *'Li(n,n't), Pb(n,2n) and Be(n,2n) were
included,
3) Neutron and Gamma-ray Emission Data,
4) High Priority Dosimetry Reactions,
5) High Priority Activation Cross Sections,
6) Radiation Damage Reactions.
The status of the Be(n,2n) was treated in a joint session of A
and B. There, it was stated that the results of the new evaluation
based on the current data base is almost acceptable and program are in
the integral data testing.
One of topics of the session was to indentify the capability of
the experimental facility to provide data to meet requirement in the
DRL.
- 153 -

JAERI-M 90-025
The meeting was expected large contribution by interlaboratory
cooperation in the future.
The Task Forse Sesson B, discusse following items :
1) Status of the DWBA Calculation for the d+d Reactions and
the Question of Suppression by Polarization,
2) Model Code Availability,
3) Code Comparison Activities,
4) Use of Dispersion Relations in Optical Model Calculations,
5) Status of the IAEA-CRP on level Densities.
3. IAEA Consultants' Meeting on Measurements of Long-Lived Activation
Cross Sections
This meeting was held just befor the NEANDC meeting at ANL (Sep.
11-12, 1989). Almost all nembers of the meeting were overlapped with
the NEANDC meeting members. Althoug I didn't attend the meeting, here
the summary of the meeting is given by Table 1.
- 154-

JAERI-M 90-025
Table 1 Data status of activation cross sections related to the CRP of long-lived radionuclides for fusion technology
1) 2)
3) 4)
5)
6) 7)
8)
9)
10) ID 12) 13) 14) 15) 16)
Reaction
27Al(n,2n)2BAl 63Cu(n,p)B3Ni
94Mo(n,p)S4Nb 104Ag(n,2n)109Ag
179Hf(n,2n)178»2Hf
18aW(n,na)178m2Hf 151Eu(n,2n)150|"Eu
153Eu(n,2n)1S2«Eu
159Tb(n.2n)l5B«Tb
158Dy(n,p)158«Tb 1,3Ir(n,2n),,8-2lr 187Re(n,2n)186l»Re 62Ni(n,r)B3Ni 98Mo(n,r)"Mo 165Ho(n,r)186mHo 191Ir(n,r)192,"Ir
Status
data needs 2 2 1 1 1 1 3 2 3 2 4 2 2 1 3 1 2 2 1 3 2 1 2 3
3 3
Laboratory
satisfied Jiielich ANL/LANL/JAERI ANL ANL IAEB Debrecen IRK ANL/LANL/JAERI Harwell IAEB Oxford/LANL ANL/LANL/JAERI Harwell IAEB IRK Jiielich ANL/LANL/JAERI ANL/LANL/JAERI IAEB IRK Jiielich IAEB ANL/LANL/JAERI IRK No work done IRK IRK No work done (Chengdu, PRC) (Chengdu, PRC) No work done
1. Mesurement performed for CRP
2. Measurement in progress for CRP
3. Evaluation of existing data performed for CRP
4. Calculation in progress for CRP
- 155-

JAERI-M 90-025
2.2.4 Review of Nuclear Data Required for Nuclear Transmutation Systems of Long-Lived Radioactive Waste Utilizing Particle Accelerators
NORIO KlSHIDA
Century Research Center Corporation 3-6-2, Nihonbashi-Honcho, Chuo-ku, Tokyo 103, Japan
In order to reduce the period for management of long-lived radioactive waste pro
duced from nuclear fuel cycle facilities, waste disposal procedures based on nuclear trans
mutation have been proposed by several groups. Two of the proposed procedures are to
utilize particle accelerators; one utilizes a high energy proton linac and the other a high
energy electron linac. The former procedure intends to use the nuclear transmutation
by proton-induced spallation reactions and the later one by photonuclear reactions with
bremsstrahlung photon beams. If there are no evaluated nuclear data concerning the
iibove two reactions, neutronic characteristics of transmutation facilities will not become
clear. Cross-sections of both reactions are not included in currently existing neutron data
files such as JENDL-3. Moreover these cross-sections reveal quite different behavior in
comparison with those of low-energy neutron-induced reactions. In the present paper,
reviewed are the current status and problems of experimental and evaluated nuclear data
of the two reactions; because these data highly important to calculation on the neutronics
of the transmutation facilities.
1. Introduction
It has well understood that the management of long-lived radioactive waste is a
long-pending and the most important problem for further development of nuclear energy;
the safe and economic method to manage the waste must be inevitably established if we
hope to obtain stable public acceptance of nuclear energy. Recently detailed studies of
the waste disposal management^^_(17) based on nuclear transmutation are in progress in
order to diminish general feelings of unrest about the management of radio-activity over
several million years from now. The nuclear transmutation means a transmutation of
long-lived radio-active nuclides to short-lived and/or stable nuclides by means of a certain
- 1 5 6 -

JAERI-M 90-025
kind of nuclear reactions. If the waste management system can be realized technically
and economically, a vast reduction will be expected for the period necessary for not only
management and control not of transuranic nuclides(TRU) but also of decay heat from
fission products(FP).
The following nuclear reactions are proposed and studied for the nuclear transmu
tation:
1. nuclear spallation reactions'1 ' - '6 ' induced by intense proton beams accelerated up
to the energy of a few GeV,
2. photonuclear reactions'7 ' - '1 5 ' induced by bremsstrahlung gamma-rays having the
end-point energy near 30 MeV, which is correspond to the upper limit of the giant
El(electric dipole) resonance(GDR),
3. fission reactions'17 ' induced by fast neutrons in a conventional FBR or an Actinide
Burning Fast Reactor.
It seems to be evident that the nuclear data which will be necessary for the design of the
facilities quite differ from the first two reactions to the third ones. This is because the first
two reactions are very different from the third ones in reaction types and mechanisms.
Whereas there are several nuclear data files of the third reactions, there are no files of the
first, and second reactions at all. Therefore, the author will survey both the present status
of the nuclear data and some problems with evaluation of the spaUation and photonuclear
reactions.
2. Nuclear data for transmutation system with pho
tonuclear reactions
In this section the author will review the present status of the nuclear data that will
be required for designing a nuclear transmutation system'7 ' - '1 5 ' to utilize the photonuclear
reactions. The author of Ref. 7 is planning to use the photonuclear reactions induced by
brerisstrahlung gamma-rays which are generated by irradiating a certain converter target
with an intense electron beam from a linear accelerator. The maximum energy of the
gamma-rays is selected as such a manner that it covers the excitation energy of GDR.
Therefore the author will review the photonuclear data of only GDR region.
Main nuclides considered as targets of the nuclear transmutation are 90Sr, 137Cs, 93Zr, " T c , 129I and 135Cs belonging to FP nuclides, and 237Np, 24 ,Am, 243Am, 2 «Cm and 244Cm belonging to TRU nuclides. No measurement of photoneutron cross-sections using
monochromatic photon beams has been reported. The only available cross-sections is for 237 N p.'18 ' The photonuclear cross-sections were reported for a few isotopes of the above FP
- 1 5 7 -

JAERI-M 90-025
nucleiP8) Consequently it is still difficult to perform a precise estimate of time necessary
for the nuclear transmutation. The photoneutron cross-sections^18*' ^19* of Na tSr are shown
in Fig. 1. As shown in this figure, one can say generally that if a nucleus has an atomic
number larger than about fifty, the excitation curves of photoneutron cross-sections have
only one or two resonance peaks whose width is approximately a few MeV(see Ref. 20, for
detailed description of photonuclear reactions). This resonance feature is quite different
from that of low energy neutron capture cross-sections in resonance width and peak
numbers. To see systematics of the photoneutron cross-sections, an example^19* of isotope
dependence of the cross-sections is shown in Fig. 2. This figure shows that the position,
width and strength of each GDR does not sharply depend on the mass number of each
isotopes. In fact, it is well known^19' that systematics between photoneutron cross-sections
and mass numbers exist. Therefore the photonuclear cross-sections of the FP nuclei may
be predicted to an accuracy of ±10%.
The secondary reactions caused by neutrons which are produced from the primary
photonuclear reactions will occur in the targets of the nuclear transmutation facilities; this
secondary reactions are very important for the realistic estimation of the transmutation
time. Measurement of DDX for photoneutrons with monochromatic photon beams has
not been reported at all as far as the nuclides concerned here. However, this DDX can be
calculated using several nuclear theoretical models. As an example, an energy spectrum of
neutrons emitted from 133Cs(7, xn) reaction at 20 MeV is shown in Fig. 3; this spectrum
was calculated using the MCPNC code^21* that is being developed by the author and
others. This figure shows that the spectrum can be considered as evaporated neutrons
from a nucleus being in an equilibrium state and energy of the neutrons is less than 20
MeV. JENDL-3 is a general purpose file which was compiled so that it can cover reactions
concerned with neutrons below 20 MeV. Hence build-up and decay calculation about the
secondary reactions can be carried out using JENDL-3. However, the nuclear data of some
yttrium isotopes, namely, 86.87>88Y which will be produced by the secondary reactions,
must be added to it.
Not only neutrons but also protons are emitted from photonuclear reactions of FP
nuclei. But it is well known from many experiments and calculations that the ratio of the
former to the later is larger than about 10 : 1. Consequently the nuclear data for proton
reactions is unessential as far as one does not try to perform detailed burn-up calculation.
If the data are inevitably essential, theoretical evaluation will be necessary owing to lack
of experimental data.
The group to study on the nuclear transmutation^"^11* to utilize the photonuclear
reactions expects that the transmutation for TRU is realized through photofission reac
tions. The photofission and the neutron-induced fission cross-sections of 237Np are shown
in Figs. 4 and 5, respectively. These two figures show that the former is comparable
- 1 5 8 -

i JAERI-M 90-025
j
I to the later. Hence the photonuclear transmutation for TRU is worth while examining
| the possibility. Photofission cross-sections of concerned TRU except 237Np have not been
measured using monochromatic photon beams. As far as the author examined the ex
perimental cross-sections of some TRU nuclei, it is not clear whether those cross-sections
have a certain sort of systematics or not. Consequently it is unclear to what precision
the unmeasured cross-sections can be evaluated. Although each amount of FP yielded
through the photofission is quite important to the burn-up calculation considering the
secondary reactions, no one has reported on the measurement for (A, Z) distributions of
FP with monochromatic photon beams. On the contrary a number of those measurement
with bremsstrahlung beams have been reported, so there may be no other way to guess the
(A, Z) distributions using monochromatic beams from those using bremsstrahlung ones.
As an example the FP distributions for 238U are shown in Fig. 6. They are not fairly
different from those using fast neutrons; it appears that nuclides that are not produced
through (n, / ) reactions are not produced also through (7, / ) ones. The FP distributions
can therefore be conjectured.
The author summarizes the current status of the nuclear data related to the nuclear
transmutation utilizing the photonuclear reactions as follows. Direct measurement of the
photonuclear cross-sections for the nuclei discussed in this section has not been reported
except for 237Np. Accordingly it is desirable to measure their cross-sections. However,
the measurement is very difficult because it is rather dangerous to use a large amount
of radioactive nucleus as experimental targets. Therefore those experimental data will
not be obtained in the near future. Thus we must evaluate the photonuclear data by
employing systematics among experimental data and certain theoretical models. Current
neutron data files such as JENDL-3 include sufficiently species of nuclides and classes of
nuclear reactions except for some yttrium isotopes noted above.
3. Nuclear data for transmutation system with pro
ton-induced spallation reactions
Nakahara and Nishida^ have completely specified the nuclear data that are neces
sary for the neutronic calculation of the nuclear transmutation to utilize proton-induced
spallation reactions. Thus the author will merely repeat their conclusions.
The nuclear data newly required are as follows:
1. target nucleus : TRU and spallation products(SP),
2. incident particle energy : threshold energy to 1.5 GeV,
3. a type of incident particles : p, n, d, t, 3He, a and ir,
I - 159-

JAERI-M 90-025
4. a class of cross-sections : total cross-sections,
elastic cross-sections,
particle yield cross-sections,
energy and angular distributions and
nuclear structure and decay data.
The spallation reactions produce neutron-poor nuclei which are not generated in
nuclear fission reactors; the mass number of these nuclei range from one to a target mass
number. In fact none of current nuclear data files dose satisfy the above requirements.
It is however questionable whether such files are really necessary to carry out burn-up
calculations or not. Further the author conjectures that evaluation for a greater part of
SP nuclides will not be probably finished until the nuclear transmutation facility will start
to run; for this evaluation task is extremely time consuming one. It is therefore desirable
that the group concerning the nuclear transmutation makes clear what kind of nuclear
data are really necessary.
4. Concluding remarks
As far as the nuclear transmutation of FP utilizing the photonuclear reactions is
performed with incident 7-ray energy below 30 MeV, no intrinsically difficult problem
exists in evaluation of both photon and neutron cross-sections. On the other, as for that
with the spallation reactions, most of the required data has not been evaluated.
- 160 -

JAERI-M 90-025
References
NISHIDA, T. AND NAKAHARA, Y. : Analysis of transmutation of transuranic wastes
by nuclear spallation reactions, Proc. of the 1988 Seminar on Nuclear Data, JAERI-
M 88-065, p. 246(1988).
NAKAHARA, Y. AND NISHIDA, T. : A study on TRU waste disposal and the current
status of nuclear data, JNDC News 63, 755^0385-4876, (in Japanese), p. 15(1987).
KANNO, I., et al. : A study on TRU incineration system with proton accelerator,
Preprint 1989 Annual Mtg. of AESJ, (in Japanese), L59.
TAKADA, H., et al. : A study of incinerator by proton accelerator, ibid., (in Japanese),
L60.
TAKADA, H., et al. : Conceptual study of TRU incineration system driven by proton
accelerator, Preprint 1989 Fall Mtg. oj AESJ, (in Japanese), H39.
NISHIDA, T., et al. : TRU transmutation with high energy proton beam, presented
in this seminar.
KONASHI, K., et al. : Transmutation of radioactive wastes by 7-rays (I), Preprint
1987 Fail Mtg. of AESJ, (in Japanese), M58.
SENDA, M , et al. : Transmutation of radioactive wastes by 7-rays (II), ibid., (in
Japanese), M59.
MATSUMOTO, T., et al. : Feasibility of 7 ray incineration of glass solidified wastes,
ibid., (in Japanese), M60.
YAMADA, A., et al. : Incineration study of nuclear wastes by using the photodisin-
tegration, ibid., (in Japanese), M61.
KASE, T., et al. : Incineration study of nuclear wastes by using the photodisinte-
gration, ibid., (in Japanese), M62.
KONASHI, K., et al. : Transmutation of radioactive wastes by 7-rays (I) — Prelim
inary system design —, Preprint 1988 Fall Mtg. of AESJ, (in Japanese), J48.
KONASHI, K., et al. : Transmutation of radioactive wastes by 7-rays (II) — Model
analysis —, ibid., (in Japanese), J49.
KASE, T., et al. : Incineration study of nuclear wastes by using the photodisinie-
gration, ibid., (in Japanese), J50.
TAKASHITA, H., et al. : Study of transmutation for F.P. — Transmutation by
hybrid system —, Preprint 1989 Annual Mtg. of AESJ, (in Japanese), L57.
HARADA, H., et al.: Study of transmutation for F.P. (II) — Nuclear transmutation
by Coulomb excitation —, ibid., (in Japanese), L58.
- 161 -

JAERI-M 90-025
(17) TAKANO, H. : T R U disposal by nuclear transmutation and the current status of nu
clear data — Case of fission reactors — , (in Japanese), JNDC News 67, 7^N0385-
4876, (in Japanese), p. 30(19&8)(see references there in, for nuclear transmutation
by nuclear fission reactors).
(18) Fuurz, F. AND BERMAN, B. : -4;om. Da^a M;,c/. Da%a 7a6/<?s, 38. 199(1988).
(19) BERMAN, B. AND FuLTZ, F. : Rev. Mod*, f/n/3., 47, 713(1975).
(20) BERGERE, R. : Features of the giant El resonance, Lec%Mre nofes :n FAyg:cs 61,
p. 1(1977), Springer-Verlag, New York.
(21) KiSH!DA, N., e a/. : Development of M C P N C code for evaluation of photonuclear
reactions, Preprm^ 1989 Fa// Mf<7. o/,4F^7, (in Japanese), BIS.
(22) GARBER, D. AND KiNSEY, R. : Neutron Cross Sections, Vol. II, Curves, #JVZ^325,
3rd ed. (1976).
(23) JACOBS, E., e a/. : FAyg. Feu., C19, 422(1979).
- 162 -
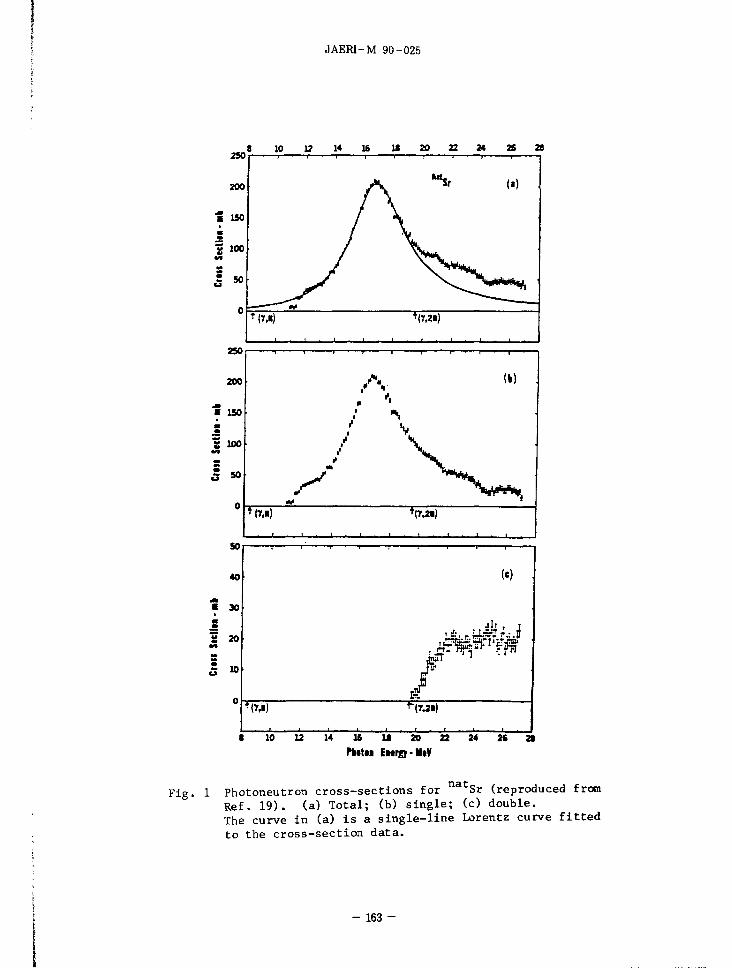
JAERI-M 90-025
250 8 10 12 14 16 1 8 2 0 2 2 2 4 2 6 2 8
250
200
"5 150
S loo «A «*
5 » 0
50
40
S 20
M
5 io
i ' i i
<h)
\
X 'v
Tfti ^ S )
/ '
(e)
*to) • ( « • )
• 10 12 14 16 18 20 22 24 26 2t
PMn EMIR-HIV
nat c Fig . 1 Photoneutron c ross - sec t ions for Sr (reproduced from Ref. 19) . (a) Tota l ; (b) s i n g l e ; (c) double. The curve in (a) i s a s i n g l e - l i n e Lorentz curve f i t t e d to the c ross - sec t ion da t a .
- 163 -

200 t t < < i i 1 r
8 10 12 14 16 18 20 22 24 26 28 30 32
Pkito« fieri;-MeV
Fig. 2 Total photoneutron c ross - sec t ions for the zirconium isotope:! (reproduced from Ref. 19)
10 E„(MeV)
Fig. 3 Calculated neutron energy spectrum for photoneutrons from the ""'" reaction at 20 MeV
Cs(Y,xn)

JAEM-M 90-025
17 E,fMtV)
Fig. 4 Partial and total photonuclear cross-sections for ^^Np (reproduced from Ref. 20)
"b
1.0
En(fleV)
Fig. 5 Evaluated neutron-induced fission cross-section for ^^Np (reproduced from Ref. 22)
- 165 -

f
JAERI-M 90-025
80 90 )00 m HO BO !40 )50 160 MASS NUMBER
Fig. 6 Relative mass yield distributions for the photofission of ^ U (reproduced from Ref. 23)
- 166

JAERI-M 90-025
2.3 Various Nuclear Data
2.3.1 Status of the Demand for Charged Particle Nuclear Data
Hiroyuki MATSUNOBU
Sumitomo Atomic Energy Industries, Ltd.
The Working Group on Charged Particle Nuclear Data was organized this year
to prepare the data files on nuclear reactions induced by the charged particles.
In advance of start of the activity, it is necessary to know the denand from the
users of charged particle nuclear data in the various fields. This information
was collected through the lectures in the special meeting of sigma and reactor
physics committees and in working group meeting, and private communication. The
outline of the status is as follows.
I . Accelerator Shielding
The demand for charged particle nuclear data is most urgent in this field.
Especially, the activation cross sections are most important, because the
kind of nuclear reactions increases rapidly with increase of the incident
particle energy. In addition, the importance of the decay data and total
neutron yields in thick targets are also emphasized.
1. Incident particles .' p, d, a. He, C, Ne, Ar, Kr, Xe
2. Targets: H, Li, C, N, 0, Na, Mg, Al, Si, P, S, K, Ca, Ti, Fe, Cu, Ga,
In, Au
General target materials : Ta, ff, Pt, Au, Hg, Pb
3. Important reactions : (p,n), (d,n), ( a , n ) , ( n , r ) , ( r , n )
4. Nuclear data :
activation cross sections, thick target neutron yields decay data
(half-life time, branching ratio of decay mode, abundance)
II. TRU Incineration with Spallation Reaction
Studies on TRU incineration by high energy accelerator have been carried out
by using computation codes based on the Monte Carlo method (NMTC, HETC).
Accordingly, the nuclear data of charged particles are not directly required.
However, the experimental and evaluated data on double differential cross
sections, production cross sections, neutron yields and so on are necessary
in order to compare with the calculations.
HI. Fusion Plasma Applications
The charged particle nuclear data are important to four aspects of fusion
studies : Plasma energetics, beam stopping in inertial confinement targets,
first wall erosion, and radiation interactions in blanket materials.
- 167-

JAERI-M 90-025
Required Data
1. Fusion cross sections
reactivities(Maxweltian) <crv>m, beam-target(Maxwellian) <av>b,
specialized reactivities <crv>j
2. High-energy scattering
Coutombic Co!, nuctear eiastic cr.i, nuclear ineiastic C],,
3. Charge-exchange Cox
4. Ionization a ,
incident particies : p. d. t. ^He
Target nuclides : 0, T, 'He. 'Li. 'Li, 'Be, 'Be. '°B, " B
Energy range : < 20 MeV
IV. Medica! Use
1. Radioactive isotopes for medica! use and nuciear data required to their
production
54 nuciides ( H, 'Be.— *^Zn), maximum : — 150 nuclides
decay data, reaction data, range energy reiationships
2. Charged particie data required to high energy accelerator for medicat
use
i) Subjet materiais
air, soil, water, plastic, oi!, paint, duraimine, steel, stainless
stee], cabie, heavy shieiding materiais, concrete, wood
ii) Eiements included in the above materiais
H, C. N, 0. Na. Ai, Si, P, Ci. Ar, K, Cr. Fe. Ni. Cu. Zn. Pb
iii) Incident particles and energy
p, a , C, N, 0, Ne. Ar : — 800 MeV/amu
iv) Necessary data
activation cross section, neutron production cross section, neutron
spectrum, fragmentation particle spectrum, totai cross section
V . Nuclear Fuel Cycle
The neutron yields and neutron energy spectra from the (a.n) reaction in
thick targets are urgently required in the fietd of nuclear fuet cycte. The
targets are TRU and their daughter nuciides produced via a - and ^-decay.
These data are essentia] in the design anaiyses of radiation shieiding and
criticaiity safety reiating to the storage, transportation, and reprocessing
of the spent fue) and high level waste,
a-emitter : 80 nuciides C'°Pb — ="'Cm)
n-emitter : — 4 0 eiements and severai compounds (UO2. UC,...)
energy of a-particte : 3.7 — 11.2 MeV
- 168-

JAERI-M 90-025
2.3.2 Compilation of Charged Particie Nuciear Reaction Database and Database Conversion for Internationa! Coordination
Masaki CHIBA
Hokkaido University Computing Center
Kita-11 Nishi-5. Kita-ku. 060
Sapporo JAPAN
Abstract:
Practice for the past more than fifteen years of NRDF
activity in compilation and international exchange of
charged particle nuclear reaction data and their current
status is reported. The way of the practice comprises major
two parts; the one is to have its own data compiling format
and data storage and retrieval system named NRDF for the
need of regional users; the other is to have database
translator from NRDF into EXFOR for the international data
exchange. The attainment of NRDF is discussed against the
conditions issued for a database used from outside.
- 169-

JAEM-M 90-025
1. Introduction
It is essential for constructing a database of charged
particle nuclear reaction data (CPND) to get cooperation and
support from researchers in the field of this country. We
could see many cases that a database would become effective
when a certain amount or more data had been accumulated.
Data compilation of a database is also an elaborate and
manpower consumming task. Especially in a scientific
database, it requires some general and specific knowledge in
the field. It is also necessary to fully utilize the
advanced environment of computer facilities of this country.
For these reasons. a new data compiling format and its data
storage and retrieval system called NRDF(Nuclear Reaction
Data File) is originally devised for CPND(l).
The other hand. if we wish a certain database to cover
a given field in the world-wide extent. it is desirable for
all the countries having activities in the field to share
some efforts of compiling the data. at least produced from
their own countries. and to exchange the data among these
countries. In such a case, the participating countries must
obey the agreed common data compiling scheme. Actually,
there is an international data exchange format for nuclear
reaction data called EXFORC2]. NRDF data has a different
scheme from EXFOR. Therefore NRDF as it is cannot have
compatibility with EXFOR.
We must override these conflictions between the common
format ( i. e. EXFOR) and the way of having their own one (
i. e. NRDF). The way we have adopted for the international
coordination is to translate the data in NRDF into those of
EXFOR (3).
We have been continuing the research and development of
CPND database compiling with the original NRDF system for
the past fifteen years(5. 6). And also by having developed
the database translator from NRDF to EXFOR. we have been
participating internationally in the field. Followings will
be reported of these practices. Finally the attainment of
- 170-

JAERI-M 90-025
NRDF will be summarized with respect to the conditions
issued for a database used from outside[7].
2. Outline of NRDF
A research project of data compilation of charged
particle nuclear reactions began in 1974 with approval of
the experimental and the theoretical nuclear research
communities in Japan. This research project was conducted
by Professor H.Tanaka of Hokkaido University. The members
of the project comprised several researchers in the fields
of experimental and theoretical nuclear physics. and of
information science. The project has bred a data storage
and retrieval system called NRDF for charged particle
nuclear reaction data. This system has several distinctive
features such as free format description. set-structures of
information blocks and data lunguage. and so ontl).
Data compilation with NRDF has been continued for the
past 10 years. At the end of March 1989. total amount of
compiled data is about 46 MB record. and 691 entries are
stored on the NRDF system and they are available for
retrieval.
This research project had been supported temporarily
until 1986 with various research grants of the Ministry of
Education. Research and Culture. Thf project was approved
as a standing work in 1987. From this year. it has been
given regular financial support. The project is now in more
stable state in respect to data compiling activity.
3. Translation of NRDF into EXFOR
NRDF was originally designed mainly to satisfy regional
needs and interests of nuclear physics research communities
in this country. It has its own data compiling format and
structure in order to include newly coming data types and to
- 171 -

JAERI-M 90-025
have sufficient information to understand the data compiled.
Therefore NRDF as it is could neither circulate itself nor
contribute in compiling nuclear reaction data
internationally. Nevertheless it may be clear that NRDF
should share some responsibility in world-wide data
compiling of CPND. The way we adopted to meet these demands
is to translate the data of NRDF format into those of EXFOR
format. We have developed a database translator called NTX.
which is made up from "NRDF To EXFOR".
The first version of NTX was completed in 1982 and
TRANS E001 was submitted. In 1983, TRANS E002 was submitted
and the author visited IAEA and discussed about the result
of the translation. It was found that the NTX should be
revised to eliminate the defficiency.
The second version of NTX was completed in 1988. The
main points of improvement are to utilize DBMS in storing
and in retrieving NRDF data and dictionaries. and to
incorporate some EXFOR programs delivered from NDS of IAEA
to handle the translated EXFOR entries.
TRANS E003 and E004 were submitted in 1988. Entries in
E004 are all revised ones of E003. E004 is the first TRANS
accepted into EXFOR Master File. In 1989. TRANS E005 and
TRANS E006 were submitted and the author attended the 10th
IAEA Consultants' Meeting of the Nuclear Reaction Data
Centers held at IAEA headquarters in Vienna.
NRDF is located at one of the centers and groupes which
have been represented at meetings and have expressed
interest in cooperation. and is now entered as SG(Study
Group) in the EXFOR Systems Manual(6). SG might be changed
by a name more appropriate reflecting the current NRDF
status in the EXFOR system.
4. Computer facility and NRDF distribution
The data storage and retrieval system of NRDF and the
NTX database translation system are installed on the HITAC
- 172 -

JAERI-M 90-025
M682 Computer system of Hokkaido University Computing
Center. The M682 system is also connected to the National
Science Information Network. so every researchers in the
universities or colleges of the country can reach to NRDF
through the Network.
The retrieval system of NRDF is also installed on the
Center for Information Processing Education. Hokkaido
University. the Institute for Nuclear Study. Tokyo
University and the Research Center for Nuclear Physics.
Osaka University.
5. Current NRDF organization and policy
5. 1 Organization
With the change of the project status in 1987 as a
turning point. the organization of NRDF project has been
renewed. Current NRDF project comprises two committees and
working staff.
(1) Advisory Committee
Various problems concerning the project such as policy
of data compiling are inquired to the Advisory Committee for
deliberation. This committee comprises 11 members of 10
different institutes. These members are assigned to the
researchers of related fields of various institutes in order
to get nation-wide cooperation and supports.
The committee members are as follows.
Yasuhisa ABE (Research Institute for Fundamental Physics.
Kyoto Univ. )
Hidetugu IKEGAMI (Research Center for Nuclear Physics.
Osaka Univ. )
Hajime OHNUMA (Tokyo Institute of Technology)
Hikonojo ORIHARA (Cyclotron and Radioisotope Center.
- 173 -

JAER)-M 90-025
Tohoku Univ. )
Mitsuji KAWAI (Kyushu Univ.)
Teijiro SAITO (Tohoku Univ.)
Fumihiko SAKATA (Institute for Nuclear Study.Tokyo Univ.)
Naomoto SHIKAZONO (Japan Atomic Energy Research Institute)
Kozi NAKAI (National Institute for High Energy Physics)
Akira HASHIZUME (Institute of Physical and Chemical
Research)
Hiroshi YOSHIDA(Tokyo Institute of Technology)
(2) NRDF Executive Committee
The Executive Committee is responsible for the project.
This committee compri 8 members of 3 different
institutes.
Hajime TANAKA (Representative of NRDF. Sapporo-Gakuin
Univ. )
Yoshinori AKAISHI(Executive Chairman. Hokkaido Univ.)
Shigeto OKABE (Hokkaido Univ.)
Toshiyuki KATAYAMA (Hokusei Univ.)
Kiyoshi KATO (Hokkaido Univ.)
Masaki CHIBA (Hokkaido Univ. )
Hiroyasu NAGATA (Hokkaido Univ.)
Hiroshi NOTO (Hokusei Univ. )
(3) Working staff
For data compilftion. computer input and system
maintenance, the project now has a staff of 4 part-timers.
Data compilation
Yoichi TEZUKA (Institute for Nuclear Study. Tokyo Univ.)
Tamaki NOJIRI (Research Center for Nuclear Physics. Osaka
Univ. )
Computer input
- 174-

JAER!-M 90-02S
Hitomi YOSHIDA
NRDF system maintenance
Toru HARADA (Hokkaido Univ.)
5.2 Policy for NRDF activity
The data compiled for the past years were proton
incident nuclear reaction data in Nuclear Data Sheets from
Vol.29(1979) to Vol.45(1985) and a part of charged particle
nuclear data produced in Japan. In the new stage of our
activity, we have reconfirmed the following policy.
(1) The amount of data to be compiled per year will be
about 3. 5 MB.
(2) The scope of data to be compiled is to be proton
incident nuclear reaction data and charged particle
nuclear reaction data produced in Japan.
(3) Distribution of NRDF data is supposed to be delivered
through the National Center for Science Information
System in the future. And also NRDF data with
retrieval system is to be delivered and updated to the
Institute for Nuclear Study. Tokyo University and the
Research Center for Nuclear Physics. Osaka University.
(4) The charged particle data produced in Japan are to be
translated into EXFOR.
(5) The NRDF activities are to be reported with "NRDF
Annual Report".
The NRDF project is now running under this policy.
6. Summary
NRDF is a database being compiled by the NRDF groups;
that is produced in the country not imported. There are
- 175 -

JAERI-M 90-025
four conditions raised in (7) for a database to be used from
outside users. relating discussion of establishing the
Database Center in JAERI.
We will conclude giving some summaries of our
attainment against to these four items.
(1) Data completeness
If a certain research field is given. it may be seldom
the research activities will be found at only one country of
the world. especially in natural science. There would be
many activities over many countries. Supposed to make a
database covering over the given field completely, it seemes
that international cooperation is essential. it is
necessary for a certain country to share some responsibility
in compiling the data. at least produced in the country.
The data completeness might be achieved by exchanging the
data compiled in such a way. This is the reason why we have
been constructing NRDF of our own effort and translating the
data in it into EXFOR.
(2) High-grade and user-friendly DBMS
The data storage and retrieval system of NRDF we are
now using was wholly developed utilizing VSAM facility. At
that time when the system was developed. there were not any
ready-made commercial DBMS' s available for numerical
databases. The NRDF system was developed with its own
original idea. It has newly devised storage structure for
the numerical tables[1]. However the data retrieval feature
is such one that a document retrieval system has. Namely as
a document retrieval system selects fewer documents for
specified selection criteria step by step. The NRDF system
can do also for the numerical tables.
Nowadays total amount of data accumulated in MRDF would
have reached upto 50MB. some more facilities. f ' example,
by which we can see the whole database with several aspects
- 176-

JAEM-M 90-025
are eagerly hoped to be installed. To realize these
facilities that the current NRDF system does not have. it
might be the best way to select a commercial DBMS of
relational type and to develop revised NRDF system as an
application of DBMS.
(3) User manual provision
User manual "GUIDE to NUCLEAR REACTION DATA FILE(NRDF)"
has already been prepared in both Japanese and English(8).
They are stored in the computer file, so they can also be
seen from computer terminals or put into print.
(4) Announcement of development status to users
As stated in the policy of NRDF. "NRDF ANNUAL REPORT"
has been published every year since 1987. and distributed to
the persons or the institutes of related fields and the
authorities concerned.
Acknowledgement
Author owes to Professor H.Tanaka and other NRDF
members of their everlasting efforts in developing the NRDF
system. He is especially thankful to Professor Y.Akaishi
and Dr. K. Kato for their helps and disscussions in
preparing this material.
- 177 -

JAERI-M 90-025
References
(1) Togashi.M. and Tanaka. H. = An information management
system for charged particle nuclear reaction data,
journal of information science principles & practice.
Vol. 4. No. S. (1982). pp. 213-224.
(2] Calamand. A. and Lemmel. H. D. : Short guide to
EXFOR. IAEA-NDS-1. (1974).
[3) Chiba. M. . Katayama. T. and Tanaka. H. = A database
translator of nuclear reaction data for international
data exchange, journal of information science
principles & practice. Vol. 12. No. 4. (1986). pp. 153-165.
(4] NRDF annual report 87(in Japanese).(1988-3).
(5) NRDF annual report 88(in Japanese). (1989-3).
(6] McLane. V. (ed): EXFOR Systems Manual. (1989-9).
(7) Kikuchi.Y. = Current Status of Database Development in
JAERI. PROCEEDINGS OF THE 1989 SEMINAR ON NUCLEAR DATA.
March 1989. JAERI-M 89-026.
(8) GUIDE to NUCLEAR REACTION DATA FILE(NRDF). Hokkaido
University Computing Center. (1983-3).
- 178 -

2.4 Topics (H)
JAERI-M 90-025
2.4! Development Pian in JAER! for High Intensity Proton Linear Accelerator
M. Mizumoto, M. Sugimoto, Y. Okumura, H. Shirakata
T. Nishida, H. Takada, 1. Kanno, H. Yasuda, Y. Nakahara,
T. Takizuka and Y. Kaneko
Japan Atomic Energy Research Institute
Tokai-mura, Naka-gun, Ibaraki-ken
A high intensity proton linear accelerator has been recently holding
an considerable attention for the future developments in nuclear
technology. A proposal to incinerate radio active nuclear wastes (in
particular, transuranium TRU nuclides) has been made by using spallation
reaction with high energy proton beam. This spallation reaction will also
produce intense secondary neutron, muon and pion beams. Various applied
researches including nuclear data measurements will be carried out using
these secondary beams. An accelerator, which the Japan Atomic Energy
Research Institute (JAERI) has been proposing to construct as a long term
research project, will be described in this report
1. Introduction
Studies of basic technologies for the transmutation of nuclear wastes
and nuclide partitioning have been continued for last several years,
although the geological disposal techniques are widely supported in the
community. The Japanese Atomic Energy Commission has concluded in June
1987 that R&D efforts for these technologies should be substantially
strengthened as the national research project, where the possible use of
valuable resources in the wastes and improvements of safety assurance in
management processes have to be evaluated. This national program called
OMEGA (Option Making Extra Gains from Actinides and Fission Froducts) has
started aiming at promoting research and development of the new
technologies on nuclear waste partitioning and transmutation. As a part
of the program, JAERI has set out several R&D plans for advanced
partitioning technology, actinide burner fast reactor and spallation based
- 179 -

JAERI-M 90-025
actinide transmutation.
In this proposal, nuclear spallation reaction with high energy (say
above 1 Gev) proton beam is considered as one of the effective
transmutation processes. The need for the development of high energy
intensive proton linear accelerator (linac) is stressed for that purpose.
Such a high intensity proton linac is also expected to contribute to
the developments in other various nuclear research fields. Nuclear
spallation reaction with high energy proton beam will produce intense
neutrons, which can be used for production of nuclear fuels in addition to
the nuclear waste incineration. Applied researches such as nuclear data
measurements, material sciences, radio isotope productions and muon
catalyzed fusion will be carried out using these neutron, muon and pion
beams.
2. A study of transmutation system
The basic concept of the incineration system with the proton
spallation reaction has been studied in JAERI for last several years* ' ' .
The main goal of the system is to process the TRU of which yearly
production rate is about 30 kg typical for a 1000 MWe LWR. The detailed
description about transmutation target, neutronics calculation and power
dissipation calculation is given in the separate paper in this meeting1 .
Only essential part of the scheme will be briefly described in this paper.
Figure 1 shows a model of an accelerator driven target system in
combination with a subcritical reactor. The proton energy is initially
taken to be 1.5 GeV which was estimated most efficient from the
preliminary calculations. The target and fuel assembly in the reactor are
proposed similar to that used for common fast breeder reactor as shown in
Fig. 2. Two kinds of coolant materials, Na and Pb-Bi are used for
calculations. Harder neutron spectrum is preferable to make the
transmutation effective, because the fission reaction rate become higher
than the capture rate as the neutron energy increases.
Primary nuclear spallation reaction and following particle transport
process were simulated by NMTC/JAERI code*4' in the neutron energy above
the initially defined cutoff energy of 15 Mev. Below this energy, three
dimensional Monte Carlo transport code was used. The keff value was taken
- 180-

JAERt-M 90-025
in the range of 0.9 to 0.95 for the calculation.
Two-dimensional power distribution calculations were made for Na and
Pb-Bi cooled targets. The maximum achievable thermal powers were limited
by the allowable temperature which was set 900 *C in the fuel and cladding.
The calculated maximum thermal output powers were 769 MW and 236 MW for
the Na and the Pb-Bi cooling, respectively. Accordingly the averaged
power densities were 472 W/cc and 145 W/cc with the required incident
proton beam current of 20 mA and 7.8 mA for those targets. The power
output for Na was found to be considerably higher than that of Pb-Bi due
to the effective cooling capability.
From these calculations, the spallation neutron and the following
induced fission neutrons can transmute TRU produced by nearly ten LWR in a
subcritical assembly cooled by Na. As a by-product, this system can
produce excess electric power of about 200-300 MW, a part of which can be
used to operate the proton accelerator.
3. Framework of the accelerator development
The conceptual design of the engineering test accelerator with the
beam energy of 1.5 GeV and the current of 10 mA proposed by JAERI is shown
in Fig. 3. It is considered to require an marked technological
developments. This engineering test accelerator will become a large scale
accelerator compared to the presently operated proton accelerators which
have been used mainly for basic nuclear physics experiments. In
particular, the average proton beam current of 10 mA is nearly 10 - 50
times larger than that for existing accelerators. The comparison of the
beam current of the operating and proposed proton accelerators is shown in
Fig. 4. In order to obtain such high current beam, only linac can meet
the requirement. Other circular accelerators such as cyclotron and
synchrotron can accelerate a small amount of beam with a maximum current
of about 1 mA. The beam spill can not be controlled efficiently in the
case of circular accelerators, which will cause serious problems of high
level activities in accelerator structures.
3.1 Conceptual design study of the accelerator system.
- 181-

JAERI-M 90-025
As the first step of the development, the low energy part of the
accelerator structure in Fig. 3 will be studied, because the beam quality
is mainly determined at the low energy part. They will consist of the
following components; ion source, radio frequency quadruple (RFQ) and
drift tube linac (DTL). High energy part of the accelerator (high ft
structure) will be partly considered in advanced of the 2nd step
development. The various tests of the characteristics of the accelerator
structures have to be carried out so that the experiences about the design
and operation of the accelerator can be accumulated. The beam energy may
be chosen below 10 MeV because in this energy region the proton induced
reaction can be substantially avoided in the accelerator structural
materials due to the Coulomb barrier.
3.2 Ion source
Duoplasmatrons and duoPIGatron^ ' have been used in proton linac as
an intense ion source. Multi-cusp type ion source has been recently
developed for neutral beam injectors (NBI) as fusion reactor heating
device. Development of new type of intense ion source will be still
needed for high intensity operation. In the case of the accelerator, beam
qualities such as emittance and beam size may be more severe than other
ion sources in order to meet the requirement from the acceptance of
following accelerator structures.
3.3 RFQ
Among the recent improvements of new accelerator structures for low
velocity ion beams, the RFQ is the most significant development. It was
first proposed by Kapchinskii and Teplyakov*6' and has been intensively
developed at Los Alamos National Laboratory*''. A continuous mode (CW)
prototype version of the RFQ with 80 MHz was operated with 2 Mev and 50 mA
as the initial accelerator structure for the FMIT* '. As the low energy
continuous operation, the RFQ1 has been recently tested at Chalk River
with the 50 mA and 650 keV(5).
The RFQ is the only choice of the accelerator structure which can
accelerate the average 10 mA proton beam up to 2 MeV with a good quality
- 182 -
i.

JAEM-M 90-025
of beam being accepted by next DTL structure. The selection of the RF
frequency for the RFQ is very important because it will determine the
various accelerator parameters such as the size of the structure, the beam
quality and the required electric power. The frequency range between 100
and 300 MHz would be chosen with the injection voltage of 50 keV and the
output energy of 2 Mev.
3.4 DTL
High electric field and high frequency for DTL tend to be chosen
recently, because the higher effective shunt impedance and efficient
longitudinal focusing result in short accelerator length. Our
accelerator, however, needs the extremely small beam spill for the high
energy part. The relatively lower frequency may be necessary in order to
have large beam radius, probably say at least 200 - 400 MHz.
At the initial part of the DTL with the beam energy of 2 MeV,
electromagnetic quadruples have to be used for the beam focusing.
Permanent magnets now started to be used for the DTL structure to relax
the heat removal problem. They are already in use for some of the DTL for
low current operation, but their application to high current accelerators
will have to be more carefully studied.
The heat deposition due to RF loss in the drift tube is expected to
reach total heat release of several hundreds of kW. This heat loss will
induce a large resonance frequency drift unless a suitable cooling is
applied. The heat removal would be the main source of technical
difficulty for the DTL development as well as for RFQ.
3.5 High /9 linac
The detailed development works of high 9linac will be started after
the first step accelerator development will be completed, because their
R&D is still presently in progress. For example, there may be several
possible candidates for the structures in either single cavity or coupled
cavity structure. In particular, as to the coupled cavity structures,
many candidates are now being investigated in various laboratories; side
coupled structure (SCS), alternating periodic structure (APS), disk and
- 183 -

JAEM-M 90-025
washer structure (DAW) and annular coupled structure (ACS). The choice
will be dependent on many aspects such as the space of the accelerator
building, the capacity of power supplies and availability of RF sources.
4. The time schedule of the developments
The research plan for developing the proton linac is now proposed by
JAERI with the following time-schedule shown in Fig. 5.
In the 1st development step till 1995, the basic technologies will be
investigated to develop the proton accelerator. The research building
will be built at the Tokai Establishment of JAERI. The feasibility study
of the accelerator plant will be carried out in this period. The various
activities in the accelerator research field will be organized to provide
technologies and staffs which are required to built such intensive
accelerator. A low energy linac with a current of 10 mA and an energy of
10 MeV will be constructed and operated for those purposes.
In the 2nd step from 1996 to 2000, a proton accelerator for the
research purposes (engineering test accelerator) with a 10 mA current and
1.5 GeV energy will be designed and constructed. The various engineering
tests of incineration process including medium and large scale integral
test, mock-up test and prototype experiments will be made with this
accelerator. Some other accelerator applications such as nuclear data
measurements, material researches, radio-isotope production, meson physics
and radiation therapy will be carried out.
Finally as the 3rd step, a commercial incineration plant with an
intensive proton linac will be constructed after the 2nd step research
will be completed.
5. Summary
The survey activities and preparatory design studies will be
continued through 1989 and 1990. The studies for optimization of
accelerator system and conceptual design of accelerator structures will be
started in 1990 followed by various R&D activities. The works for the
design of a research building and utilities for the accelerator are
planned in 1991.
- 184-

JAERI-M 90-025
References
(1) T. Nishida et al., "Research of TRU Transmutation System with
Proton Accelerator" NEA/CRP 1989.
(2) T. Takizuka et al., "A Study of Incineration Target System", Proc.
5th Int. Conf. Emerging Nuclear Energy Systems, Karlsruhe, 1989
(3) T. Nishida et al., "TRU Transmutation with High Energy Proton Beam"
presented in this 1989 Nuclear Data Seminar 1989.
(4) Y. Nakahara et al., "NMTC/JAERI A Simulation Code System for High
Energy Nuclear Reactions and Nucleon -Meson Transport Processes",
JAERI-M 82-198 (1982)
(5) R.M. Hutcheon and G.E. McMichael, "Low Power RF Tuning of The RFQ1
Accelerator", the 1984 Linear Accelerator Conference, Darmstadt,
FRG, 1984
(6) I.M. Kapchinskii and V.A. Teplyakov, "Linear Ion Accelerator with
Spatially Homogenous Strong Focusing", Prib. Tekh. Eksp. 119
No.2 (1970) 19
(7) J.E. Stovall, K.R. Crandall and R.W. Hamm, "Performance
Characteristics of a 425 MHz RFQ Linac", 6th Conf. on Application
of Accelerators in Research and Industry, Denton, Texas, November,
IEEE NS-28 (1981) 1508
(8) D.D. Armstrong, "Status Report on FMIT", the 1984 Linear
Accelerator Conference, Darmstadt, FRG, 1984
- 185

JAERI-M 90-025
196/56 MW
Heat 769/236 MW
60/23 MW
Proton LINAC
1.5 GeV 20/7.8 mA
Electricity 256/79 MW
L=€H L©J
Primary Cooling Circuit
Na/Ph-Bi
Fig. 1 Accelerator driven incineration target system
Acfinide Fuel/Coolant Gad
Ha Band
Fuel Slug
Fig. 2 Incineration target design and proposed fuel pins
i
- 186-

JAERI-M 90-025
Engineering Test Accelerator
Development for Basic Accelerator Technology
JION SOURCE RFQ m s [HIGH 0 LINAC
MOO KeV IMeV
fig fig m m fig fig fig mmmw\
*>
/lOMeV /\i 50MeV MOO MeV /l.5GeV 10 mA
Medium Scale Integra Eip, Target Mock-up Tesi Irradiation Tesr
ftwotype E»p, Irradiation Test Large Scale Integral lest. Material Study Target Technology. Nuclear Data
Fig. 3 Conceptual design of the JAERI Engineering Test Accelerator (ETA)
10"
\(?
5 ,0 I-
O .o2
10'
I0U
Present Status of High Intensity
Proton Linac
o
° ( E U R A C ) O(SNQ) ( J f l E R I ) n
O(ASPUN)
O SINQ
O LAMPF
OWHP)
O ISIS
O TRIUMP
O IPNS O KENS-I
J L J L 0 0.2 0.4 0.6 0.8 1.0 1.2 1.4 1.6 1.8
Energy ( GeV)
Fig . 4 Present s t a tu s of high i n t e n s i t y proton acce le ra to r
- 187-

Schedule of Basic technology accelerator construction (!0MeV.!0mA)
Year
[Accelerator] Concept survey and study Technology development
System design Conceptual design
Basic technology preliminary test Ion source RFQ DTL RF power supply
Accelerator fabrication ton source, RFQ DTL Power supply, Control, Fabrication and assembly
Rash: trrtutoloRy test Test operation Maintenance
High /3 Linac preparatory study
Construction of engineering test accel.
[Research Bui tding] Survey * study Execution design Construction of building
1989 1990
!
199! 1992 1993 !994 !995 1996
Fig. 5 Tentative schedule for high energy proton accelerator development

JAERI-M 90-025
3. Papers Presented in Poster Session
3.1 Automation of Neutron Scattering Measurements at JAERI TANDEM
Masayoshi SUGIMOTO
Japan Atomic Eenergy Research Institute
Tokai-mura, Ibaraki-ken 319-11
The automation control system to set up the experimental apparatus and to
manage acquisition and processing of the measured data is under development.
The heart of this system consists of two personal computers dedicated to the
equipment control and the data acquisition, respectively. The design concept is
overviewed and the proposed user interface is described. The possibility for other
applications is also discussed.
1. Introduction
We have carried out the neutron scattering measurements at JAERT
TANDEM using the High Energy Neutron time-of-41ight Spectrometer ' with the
data acquisition system used by many users commonly. This data acquisition
system has been graded up (now, DEC VAX 11/780 and in near future, DEC
VAXstation 3200), but the operator console software is basically same as that
developed for the oldest hardware (DEC PDP 11/55) to maintain the
compatibility of the user interface. The recent enormous evolution of microchip
technology results in the personal systems (personal computers and workstations)
with high cost performance, and we can construct the new system which
performance is comparable to the super minicomputers in the past (such as DEC
VAX 11/750). And moreover, such personal systems have a plenty of
development tools, e.g. compilers for various kind of computer languages, database
applications, Computer Aided Designing applications and some Artificial
Intelligence tools, in a low cost. The essential point is that we can not only
employ these applications but also develop them (or even the extension to the
operating system) by ourselves. This is possible due to the simplicity of the
personal systems hardware and the easiness of its use relative to the bigger
sophisticated computer systems. The main drawback may come from the small
capacity of the computing resources, such as memory, disk space and I /O
- 1 8 9 -

JAERI-M 90-025
channels. So the up—to—date systems are generally configured as the multi
processor or multi computer network systems to overcome this insufficiency.
A new system to control the experimental apparatus and the data taking of
the neutron scattering measurements carried out at JAERI TANDEM, is now
under development. The system can do the following tasks automatically:
(1) setting of the experimental conditions, such as the angle of the collimator
shield, the position of the shadow bar, the sample position, etc.,
(2) setting of the data acquisition configuration, such as the preset counts,
on-line data processing parameters, etc., and
(3) monitoring of current status of the experimental conditions, and responding
to the malfunctions of the system.
In the following sections, we describe the hardware configuration of the
proposed automation system, and the necessary operator console software. And
the newly developed spreadsheet program to do many things including the physics
calculations and the machine controls is introduced as the desirable user interface
of the expected automation system.
2. Hardware configuration
2.1 General
The heart of this system consists of two personal computers, one is used for
equipment controls and the other is used for data acquisition and processing,
respectively. Fig. 1 illustrates the schematic diagram of the hardware
configuration proposed currently. The control computer is NEC PC—9801RA with
16 MHz Intel 80386 cpu and the data acquisition computer is Hewlett—Packard
HP Vectra RS/20 with 20 MHz Intel 80386 cpu. These two computers and a
stand-alone CAMAC d a t e system are linked by the GPIB interface, which is
used as the communication channel among these subsystems. The CAMAC crate
system has, at least, a crate controller with GPIB interface and a 100 MHz scaler
module to monitor the counting rates for the beam current, neutron monitor, and
the loss events due to the dead time of the electronics system. In the future
upgrade, the CAMAC system may become a gate to access the outer world by
adding more CAMAC modules. This system has no magnetic tape device which
is only the practical media to access the supercomputer at the computing center
used for the theoretical calculations. Basically, we can almost do every work in
the new system, even the laborious nuclear physics calculations. However, as the
pathway to the supercomputers, we can use the existing data analysis computer
- 190 -
il

JAER1-M 90-025
(DEC VAX 8550) installed at JAER1 TANDEM. The obtained data are
transferred through the serial communication line after each run in the
experiments is completed. This process may be also used to store a large number
of measured or processed data for saving the precious hard disk space and the
pile of the floppy diskettes.
The equipment control computei Was a bus extension box for controlling the
experimental apparatus described in the next subsection. This bus extension box
contains many digital I/O boards which communicate with the actual devices.
The cables are connected through the junction box of the control panel, which is
currently used for manual control. The data acquisition computer has an ADC
interface bus box (CANBERRA MPA/PC) which accepts up to 8 ADCs and is
configured either for single parameter, dual parameter or list mode. Each
computer is equipped with a graphics display terminal, a mouse, and a Floppy
Disk Drive. The printer and the plotter are occupied by both computers.
2.2 Equipment control
The items to be controlled during the experiments are (a) the rotating angle
of the collimator shield of neutron detectors, (b) the relative position of the
shadow bar to the target-sample-collimator geometry, and (c) the position of the
scattering samples. Currently, these are controlled manually on the control panel,
however, they are already modified to control by using the digital I /O signals.
And a computer program to use them has been developed on the existing NEC
PC-9801RA.
One possibility to enhance the equipment control is to tie up with the
accelerator beam line control/monitor system. The most sensitive monitor for the
accelerated ion beam is a neutron spectrum measured by neutron monitors. They
have sub-iianosec timing resolutions, so their peak widths of the tof spectra are
almost the unique monitor for the bunch width of the beam. And the counting
rates of the generated neutron are the true monitor for the intensity of the beam
current entered into the target and the effective thickness of the target materials.
These quantities can be calculated by the on-line processing program on the data
acquisition computer described in the section 2.3 And the results are monitored
during the experiments and some warnings are issued when the beam condition is
deteriorated. This system is so flexible that we can implement such a task in
various ways, i.e. it can be done on either computer and sometimes done by both,
cooperatively. The interface to the outer world, the accelerator control system
here, can be easily done using another CAMAC module as the gateway.
- 191 -

JAEm-M 90-025
2.3 Data acquisition control
2.3.1 Backgrounds
The data acquisition computer system is not yet obtained but we expect to
start the development on December, 1989. At present we are considering the
conversion of the various processing codes developed for the previous data
acquisition system ( V A X 11/780). Fig. 2 shows the block diagram for the
previous data acquisition system, where the D E C P D P 11/55 is removed now and
the signals from the M B D - 1 1 is directly connected to D E C V A X 11/780. And
within one or a couple of years, it will be replaced by the new D E C VAXstation
3200 system, which may support only the list mode data taking. There was an
argument about which is better to employ such new system or develop our own
system as the next data acquisition system, in our group. As a conclusion, we
need the dedicated acquisitions system because of our special requirement for the
multiple mode data acquisition (single parameter, dual parameter and list mode
with at least 8 ADCs). Of course, there is another solution to use a hard-wired
but somewhat intelligent Multi Channel Analyzer. This possibility is excluded
since our demand is the flexible computer-controlled automation system.
2.3.2 Neutron detector system 1 2^
W e are using four large volume neutron detectors ' as the main tof
detectors shown in fig. 3. One detector has a dimension, 20cm ^ x 35cm, and
contains about 10 f liquid scintiHator (NE213). The glass container is viewed by
the two 5 in. photomultiplier(PM)s (RCA8854) at the front and rear sides with
attaching the face plate adapters. The four detectors are stacked in a shield
collimator as scattered neutrons enter from the front side of the glass container
(from the left hand side to the right hand side in fig. 3). The electronics
diagram for this detector is shown in fig. 4. The anode signals from the both
P M s are fed into constant fraction discriminator(CFD)s, respectively, and the
resulting timing pulses are A N D e d with 20 nsec coincidence time. This excludes
the P M noise signals and supplies a reference time signal used for the neutrc
g a m m a pulse shape discrimination. Each timing signal passes through the 50 nsec
gate corresponds to the coincidence event, and is fed to O R logic(FAN IN), which
gathers all events from the four detectors and supplies a start signal to the
time-to-^amplitude converter(TAC). The stop signals for T A C s come from the
beam pick off. After all, the time signals from the two P M s are converted to
two tof linear signals^ and T^), respectively. These signals are
- 192-

JAEM-M 90-025
amplified/attenuated using biased ampiifiers(and one output pulse is inverted when
neutron energy is not too high: this process depends on a, the time compensation
factor described below). The two outputs are summed and forms a time
compensated tof linear signal(T^-oT^). From the nature of the sum of two
linear signals, this method becomes to fail when the counting rate is high. So we
need to pay much attention to the counting loss in this electronics. The other
four linear signals(T,, t,-t< , P H and PS) are used in the list mode data
acquisition and for the software time compensation method, which are described in
section 3.3.
2.3.3 Data acquisition and processing
In addition to those signals shown in fig. 4, there are duplicated neutron
monitors, each of which consists of a small (5cm x 1.25cm) liquid scintillator
(NE213) as the tof detector. All these output signals must be fed into the data
acquisition system. So the capacity to accept up to 8 A D C s is the necessary
condition for our acquisition computer system. At least, the resulting spectra are
displayed on the graphics display in real time ( the main body of such displaying
program will be supplied by the maker of the acquisition system with its source
code with some restrictions ). And we need to add more features to do on-line
data processing which will be highly specific to our measurements (e.g. processing
the monitor spectra and obtaining the neutron source intensity or beam pulse
width in real time, and in the case of list mode, processing the software time
compensation as described in the section 3.3).
The usefulness of the computer based data acquisition system is that we can
control the acquisition from the other computer system using a communication
channel. In our case, the equipment control computer becomes a master and
mainly controls the start and stop of the measurements according to the table
describing the experimental conditions, and also controls the data acquisition
computer, which should be synchronized to the equipment control computer.
3. Operator console software
3.1 Task of the master computer
Since the system has two computers linked with the GPI B interface, one of
them must become a master of the GPI B interface. At present, we assign the
equipment computer as a master, since its computing load is less than the other's
- 193-

JAERI-M 90-025
during the data taking period. The master computer memorizes a experimental
table planned each for the scattering measurement. The experimental table
defines (1) the setting values of the experimental apparatus, e.g. scattering angle
and sample in/out, and (2) the condition of the data acquisition, e.g. preset
time/counts and the options for the on-line data processing. The operator console
software consists of three major parts:
(A) user interface to assign and change setting parameters in the experimental
table, which is described separately in section 4,
(B) control of actual equipment through digital I/O boards and reading back their
status values if possible, and
(C) communication with the data acquisition computer and the stand-alone
CAMAC system, which monitors the beam current and counting loss informations.
The flow of the automatic acquisition is explained in fig. 5. Firstly, a series of
the experimental conditions are prepared using the task A), and secondary, the
setting values are sent to the actual devices using the task B) and also to the
data acquisition computer and the CAMAC crate controller using the task C).
After this initial set up is finished, and when no mistake is found, then console
program issues the start command to all slave systems. The data taking will
stop if the preset timer/count is satisfied or some alarm monitors interrupt to
quit the acquisition. The former is issued by the data acquisition computer which
has internal preset timer/counter for this purpose. The latter may come from
both of computers depending on the kind of alarms. The stop signal is sent to
the all subsystems through GPIB and the completion process starts to check the
cause of the stop. If some intolerable malfunctions are found, the automatic
control is quitted and the experimenter is called to remedy them. Finally, it
checks the rest of the experimental table to be carried out, and if there are more
experiments in the table, the next one is done from the beginning of the above
steps.
If the cpu power is remaining enough for other works, it can perform some
calculations, e.g. reaction kinematics to identify observed levels, Monte Carlo
calculation for multiple scattering correction, or Legendre fitting to the obtained
angular distribution, which are usually done by off-line processing.
3.2 Tasks of the data acquisition computer
The other computer is dedicated to the data acquisition, but its cpu time is
consumed only by displaying the data when the data acquisition mode is in the
single or dual parameter mode, because the data acquisition itself is carried out
- 1 9 4 -

JAERI-M 90-025
on the single add-on board only for these modes. If the update rate of the
spectrum display is allowed to be slow, lots of cpu time remain to do the on-line
data processing at the data acquisition computer, too, such as the background
subtraction, peak fitting, and conversion to the cross sections. However, in the
case of list mode acquisition, the buffered data must be dumped into the hard
disk so frequently to avoid buffer overflow, which becomes the additional load to
the data acquisition computer. If that load is too heavy for the personal
computer's cpu and the disk memory size, we must proceed to use the common
data acquisition system based on the VAXstation 3200, which would have a better
performance in that case.
3.3 On-line processing of the software time compensation
3.3.1 Monte Carlo simulation results
As the on-line processing of the list mode data, we can expect to perform
the software time compensation ' ' . Usually, the two timing signals from the
same detector are processed as shown in the electronics block diagram in fig. 4,
to give the best time resolution for the incident neutrons. This method works
well for the narrow energy range of neutrons because the time compensation
factor, a , in the formula T , - a T 2 depends on the incident neutron energy ' .
To distinct with the software time compensation, we call the usual time
compensation method as the hardware time compensation. We performed the
extensive Monte Carlo calculations to certifying the expected time resolution of
our detector. The nominal processes taking into account are :
a) the production of the scintillations in the scintillator due to the specific energy
loss at each small volume in the detector,
b) the propagation of the light through the scintillator medium including the
attenuation, the reflection and the refraction at boundaries, and also the
production of the photoelectrons at the photocathode,
c) the electrons multiplication in the PM and
d) the CR integrated anode pulse to be fed into the constant fraction
discriminator(CFD).
All these processes are incorporated into one simulation program. Fig. 6 depicts
the typical result of such a simulation. The scintillation photons are generated
according to the theoretical model and decaying parameter obtained for NE213
liquid scintillator. The resulting time distribution is given in fig. 6 (a) with
arbitrary vertical unit and horizontal unit in nsec. Due to the difference of the
- 1 9 5 -

JAERI-M 90-025
distance to two PMs, PM1 and PM2, from the source point S, the time
distributions of the photoelectrons at these PMs are so different as shown in fig.
6(b). That difference is preserved in the processes of the electron multiplication
(fig. 6(c)) and CR integration (fig. 6(d)). Finally, the obtained output pulse is
fed into the CFD and the timing signal is produced. The timing walk arises from
the minor difference of the pulse shapes of the photoelectrons given in fig. 6(b)
and their statistical fluctuations '. So it strongly depends on the efficiency of
the light collection of produced scintillation by the PMs. The calculated light
collection efficiency is given in fig. 7. The figure shows only the half plane of
the detector cross section due to its symmetrical property. It can be seen that
the large part of the detector has around 12-15 % efficiency but very high
efficiency is expected to the events near the PM face. Fig. 8 shows the results
about the timing resolution property. The figures in the upper half plane indicate
the calculated standard deviations observed at the left side PM. It assumes that
only 500 scintillation photons are produced at each source point. The time
resolution deteriorates near the glass boundary of the detector volume. From
these calculations, we can expect the sub—nanosec resolution to our detector at
best. The lower half plane of the fig. 8 shows the relative delay time produced
at the output of CFD. In the ideal case, the resulting lines corresponding to the
same delay times should be parallel to the PM face and equally spaced. The
calculated result shows fairly good property compared with such criterion. So our
neutron detector would be used as the tof detectors for high energy neutrons.
3.3.2 Implementation of the software time compensation
From the above discussion, the detector has a good property enough to
make a measurement for the monoenergetic neutrons by using the hardware time
compensation method. However, there is a demand to measure the wide energy
range of neutrons at once with the same detector set up. For this purpose, we
must change the time compensation factor according to the incoming neutron
energy. It is impossible to achieve by using the electronics modules, so we
developed the new method to gain the best time resolution over all neutron
energy ' ' . In the on-line processing of such method, the four parameters are
needed to get the resulting tof spectrum: (1) tof signal of the PM at the far side
from the scattering sample, T , , (2) time difference of two timing signals from two
PMs, t . - tQ, (3) pulse height to give the released energy, PH, and (4) pulse
shape information to discriminate the gamma-ray events, PS. The schematic
- 1 9 6 -

JAERI-M 90-025
process is described in fig. 9 and an example of such a process performed by the-
off—line processing is shown in fig. 10. Fig. 11 shows the results of the software
time compensation lines(actually curves) for a detector. They are obtained from
the measurements of the monoenergetic neutrons with the various energies from
4.9 to 13 MeV. These lines are the guidelines to do the software time
compensation in the on—line processing. First, the list events are checked by the
gates, which may be applied for each parameter independently or for the mapped
data of two of four list parameters, as shown in fig. 9 (solid thick frames in the
upper two maps). The gated events are supplied to the "software time
compensator", which calculates the corrected T, values from the events T, and
t-. —tp parameters according to the method described above and in the figure
captions.
This process needs a lot of preparatory works before the actual
measurements, i.e. the preparation of the software time compensation lines
supplied to the software time compensator. It is desirable to produce such guide
lines automatically, by taking the source neutron spectra at selected angles, and it
may be done on the data acquisition computer, too.
4. Spreadsheet style user interface
As the user interface of the proposed automation system, we present the
newly developed spreadsheet style program, called LSSolver ver.2 ' . The
spreadsheet itself is a table and each cell defined by its column and row position
may contain the value or text strings, so it can be used as the experimental table
directly. As a possible implementation of the experimental table in the
spreadsheet, one row defines the one measurement and each column in that row
specifies a parameter value of the experimental conditions. Fig. 12 is a layout of
such a example. The rows 1 through 3 are text strings to represent the titles of
the items. Below the row 4, each row represent one measurement. The column
A indicates the setting value to the rotating angle of the collimator shield in
degrees. The actual setting value may have the different unit and be biased, so
the reading values in the column B may be different from its setting value. The
control of the shield collimator is done at column C, which has a macro strings
to do a series of operations for the spreadsheet automatically. In this example,
the cell C4 is a macro that means (1) go to the cell A4, G(A4), (2) save it as
file "angle", US(angle), (3) execute a program "SET_IT.EXE" with an option
- 1 9 7 -
\

JAERI-M 90-025
"/A", UE(SET_IT.EXE /A), (4) go to the cell B4, G(B4), and finally, (5) load
the reading value returned in the file "angle", UL(angle). The program
"SET_IT.EXE" is developed outside of the LSSolver. So it works without
LSSolver program and can be modified independently. The option " /A" tells the
program to set up the angle of the shield collimator, and the setting value is
saved as the file "angle". The valu.' to be sent to the device is converted from
the setting value given in degrees, and the program controls the equipment and
reads back its status value, which is returned to the file "angle". This method
can be applied any other parameter settings of the equipment and the conditions
of the data acquisitions. The row 5 has not been executed yet, so that the cell
B5 is empty. If the cell C5 is executed, the new status value of the angle of the
shield collimator is appeared at the cell B5.
The truly useful feature of LSSolver is the capability to calculate a vector
or matrix using the various kinds of internal functions, and display the results on
graphics screen instantly. By using this feature, we can fit the observed angular
distributions with Legendre polynomials on the fly. Any other data analyses can
be done with a minimal programming (i.e. defining some formula to manipulate
the vector/matrix in the cells). And it can calculate some physics calculations
also( e.g. reaction kinematics ). Unfortunately, it has no nonlinear least squares
fitting procedure, however, we can call such" a program inside from the LSSolver
using the similar method as described above, and compare the results graphically.
The LSSolver is originally developed for the nuclear data evaluation with the
data and parameter covariance, especially for the small data set. So it includes
the feature about least squares fitting with the covariances and most suitable to
the data processing and analysis of the nuclear data measurements as we would
like to use for the neutron scattering measurements. We are now seeking for its
applications, and it is already used in the other field ' .
5. Summary
The automation system to control the expeirmental apparatus and the data
acquisition for the neutron measurements at JAERI TANDEM is truly necessary
one due to the insufficient manpower of the neutron group. We expect this
system advances the efficient data taking and guarantees the good quality of the
results. After the some further developments discussed above, this system will
start to work in early 1990.
- 198 -

JAER]-M 90-025
References
1) M.Sugimoto and Y.Yamanouti, "JAERI Tandem Neutron TOF Spectrometer"
(in Japanese), Proc. of the 1983 Seminar on Nuclear Data, JAERI-M 84-010
(1984), p.312.
2) M.Sugimoto, Y.Yamanouti, S.Tanaka,Y.Furuta,M.Mizumoto and M.Hyakutake,
"Fast Nuetron t-o-4 Spectrometer for the scattering measurements", JAERI
TANDEM Annual Report 1983, JAERI-M 84-129 (1984), p.89.
3) M.Sugimoto, Y.Yamanouti, Y.Furuta, M.Mizumoto, SNishihara and
M.Hyakutake, "MEASUREMENTS OF FAST NEUTRON SACTTERING CROSS
SECTIONS OF ALUMINUM", JAERI TANDEM, LINAC & V.D.G. Annual
Report 1984, JAERI-M 85-104 (1985), p.185.
4) M.Sugimoto and Y.Yamanouti, "EFFECTS OF THE TIMING W A L K ON
THE TIME RESOLUTION OF THE LARGE VOLUME NEUTRON
DETECTOR", JAERI TANDEM, LINAC & V.D.G. Annual Report 1985,
JAERI-M 86-112 (1986), p.181.
5) J.D.Carlson, R.W. Finlay and D.E. Bainum, Nucl. Instr. and Methods 147
(1977) 353.
6) M.Sugimoto, "Data Oriented Programming using LSSolver", JAERI TANDEM,
LINAC & V.D.G. Annual Report 1988, JAERI-M 89-119 (1989), p.60.
-199-

JAERI-M 90-025
CRT/KBD/MODSE/FDD
NEC PC-9801RA 16MHz i80386 2MB menory 40MB HDD
X
Printer
Plotter
CRT/KBD/MUUSE/FDD
HP Vectra RS/20 20MHz i80386 4MB memory 103MB HDD
X
serial line
DEC VAX 8550
equipment control bus extension box
monitor
collimator shield shadow bar pos. sample changer
CONTROL PANEL
ADC interface bus extension box
CAMAC crate CC/GPIB,Scalers
neutron detectors electronics (TOP, PH,PS,Position)
NIM BIN
beam current neutron monit. dead time loss
Fig. 1 Schematic diagram of hardware configuration of the automation system for the neutron scattering measurements
gate
yv 1 NIM ADC bank
currently directly connected
ADC-CAMAC ^ MBD interfaces ^ - 1 1 ft—^ and
11/55
CAMAC scalers N-
PDP H 11/04
MT VAX
11/780
XT
MT Disk
E & S MPS
DATA ACQUISITION - 1 L DATA PROCESS-1
Fig . 2 Block diagram of the data acqu i s i t ion system cur ren t ly used at JAERI TANDEM
- 2 0 0 -

JAERI-M 90-025
reservoir magnetic shield
Al - housing face plate adapter
Fig. 3 Schematic view of the large volume neutron detector used as the time-of-flight spectrometer
pre amp.| •\CFD\—j FAN OUT "'(scalers
scalers
Fig. 4 Block diagram of the electronics for the neutron tof spectrometer at JAERI TANDEM
-201 -

JAERI-M 90-025
No
I B E 0 I N 1 -IT
prepare all exp. table k start from the 1st
T set up exp. conditions according to exp.table
T
= User Interface Program based on spreadsheet (see section 4.)
calculation of actual control parameters from the setting values
control equipment k data acquisition
T
No
check for mistakes
1
=* digital I/O => GPIB (to GAMAC k
data acq. computer)
= invalid shadow bar position = data acq. board mulfunction = CAMAC module malfunction etc.
OK ?
1 Yes
S T A R T => GPIB(CAMAC & d a t a a c q . computer )
JL
No
do experiment display spectra on screen on—line data processing monitor alarm status
STOP issued ?
i Yes
Is data acq. completed ? Yes
| No
No
complete data acq.
5 Is alarm monitor ON ?
1 Yes
prepare next exp. table
finished all experiments or any critical errors in system ?
[ Yes
E N D
Fig . 5 Flow diagram of the automatic measurement of neutron s c a t t e r i n g
- 202 -

JAERI-M 90-025
VI PM
nxi c o
(3) I LS c
'a
PM2 V2
(b) c I O O _£
(c) „
o t C 3 tO U
(d) 3
a
o 0 2 4 t ime (nse c )
Fig. 6 Typical time distributions of photons or electron currents simulated by Monte Carlo method for the large volume neutron detector. The point "S" indicates the source point of the scintillations. PM1 and PM2 are two photomultipliers viewing the detector, and VI and V2 are the voltage pulses output from PM1 and PM2, respectively. The (a) shows the time distribution produced at the source point "S", (b) is photo-electrons time distribution produced at each photomultiplier, (c) is the anode current pu]se after electrons multiplication and (d) shows the final output, VI and V2.
- 203 -

JAERI-M 90-025
l ight co l l ec t i on .e f f ic iency (*/.)
40 30 20
Fig. 7 The calculated light collection efficiency of a quadrant of the neutron detector. The indicated figures are sum of the contributions from the two photomultiplier (PM)s.
delay of timing output (ns)
Fig. 8 The calculated timing resolution due to the statistical fluctuation of the photoelectrons time distributions given at the left hand side photomultiplier. The figures in the upper half give the standard deviations obtained from a bunch of calculations assumed that only 500 scintillation photons are generated at the source point. And the figures in the lower half show the resulting delay times produced at constant fraction discriminator, which give the information about the time compensation factor a in the time compensation formula T1-01T2. If these lines are parallel to each other and equally spaced, the time compensation using the time compensation formula becomes complete one.
- 204-

JAERI-M 90-025
PS
monoenergeti neutron peaks
reference channel
time compensation
I ine
Fig. 9 Schematic view of the on-line processing of the software time compensation using four list mode parameters: (1) tof signal, Ti, from the photomultiplier at the far side from the scattering sample, (2) time difference, ti-t2, between the timing signals from two photomultipliers, respectively, for the same detector, (3) pulse height, PH, which represents the energy release in the detector, and (4) pulse shape information, PS, to discriminate the gamma events. The upper two figures define the desired neutron events to give the best result compromising of the resolution and efficiency. The bottom right figure shows the line (labelled by time compensation line), where all the neutrons events with the same energy are placed. The enlarged view of a part of the map is shown at the left side. The dashed line corresponds to the reference channel, where all other events with the same energy should be gathered using the compensation line (the up and down arrows inside the view area mean that the events in these peaks are given by the single energy neutrons and each Ti (horizontal axis) spectrum is shifted to match its peak position to the reference's.
- 205

JAERI-M 90-025
— PS
de tec to r -1
de tec to r -2
de tec to r -3
de tec to r -4
— T, (=T0-t,>
, | *Pf
* & * " *
• • & * ' '
.m**
13MeV neutron
— r, { = r0-t,)
Fig. 10 An example of the event maps for the D(d,n) neutron source measured at En=13 MeV, obtained by using the off-line processing. The map for PS vs. PH (top left) shows the neutron-gamma discrimination works well in this case. The top right map, Ti vs. PH, indicates the tof spectrum without any time compensation, which time resolution is out of use. The bottom right map, Ti vs. ti-t2, shows the data which can produce a time compensation line at 13 M '-' or each detector. The actually obtained line is shown .-""• w 11.
- 2 0 6 -

JAERI-M 90-025
c o> o >• "sr i ; ? o n o 3 * "*. <". **. 9 t n . ' " . ' ^ 0 1 ( : " . - t v i o i a, c «" ^ UJ f~ r- co <D a>cr> . — C 0)
£.SMeV neutron
hardware compensation
Tl( t, )
Fig. 11 The time compensation lines for a neutron detector obtained from the Ti vs. ti-t2 maps for the monoenergetic neutrons with various energies from 5.4 to 13 MeV. The map shown at the right hand side is the data for 4.9 MeV neutrons. As the reference, the line corresponds to the "T1-01T2" compensation method is labelled by "hardware compensation".
row /column
A B
1 scattering angle
2 setting reading
4
5
6
50 105.88 [:G(A4)US(angle)UE(SET_IT.EXE /A)G(B4)UL(angle)]
70 [:G(A5)US(angle)UE(SET__IT.EXE /A)G(B5)UL(angle)]
Fig. 12 A layout of the spreadsheet for controlling the equipment and data acquisition. The A4 and A5 cells are the setting values of the scattering angles, and B4 and B5 are their read backed values, respectively. Now the experiment defined in row 4 has already done and experiment in row 5 is about to be carried out.
-207 -

JAERI-M 90-025
3.2 Nuclear Data of Charged-Particie Induced Reactions on Light Nuclei
N. Koori^ , Y. Watanabe, M . Eriguchi, M . Hyakutake*, Y. Wakuta, and 1. Kumabe Department of Nuclear Engineering, Kyushu University, Fukuoka, 812
A^/*ac/.' Theoretica) interpretation of the - Li(p,p') scattering data, especially their analyzing powers, are described. Cross sections and analyzing powers of proton scattering are compared with those of neutron scattering. Furthermore,
new data are given for the Li(p,2p)na and '^C(p,p')3a reactions, which are
mirror ones of Li(n,2n)pa and '-C(n,n')3a reactions, respectively.
Introduction
Our program of measurement and analyses of charged-particle induced reactions is
based on accuracy of measured data on charged-particle reactions in comparison with neutron-
induced reactions. In order to extract accurately interesting quantities from neutron data, w e
should assume reliable theoretical backgrounds for the extraction. Since nuclear reactions,
however, are complex, further precise studies will be necessary to obtain solid theoretical
backgrounds for interpretation of reaction mechanisms.
In this report, w e describe advances in our measurement and theoretical interpretation of
charged-particle induced reactions on h .tt nuclei.
1. Analysis of 6-?Li(p,p') scattering.
W e have reported measurement of the polarized proton scattering on the 6'?Li around
14 M e V ) 1 ]. In the analysis of the data on the basis of the spherical optical model ( S O M ) and
coupled channel (CC) method, it has been clarified that the analysis cannot reproduce the
inelastic scattering data, especiatly their analyzing powers, in spite of the fact that both
differential cross sections and analyzing powers of the elastic scattering were fitted very well.
Since the excited states of 6Li (2.185 M e V , 3+) and ?Li (4.63 M e V , 7/2) can decay into the
channels d+a and t+ot, respectively, the optical potential for these exit channels should be
different from those of the entrance channels. Changing mainly the parameters of the spin-orbit
term, w e tried to search the potential for the exit channel. Then, appreciable improvement in the
fit was obtained for the analyzing powers, as shown for Li and ?Li in Fig.l and 2. The
derived exit channel optical potential parameters are summarized in Table 1 and 2.
* Present address: CoHege of Genera) Education, The University ot Tokushtma, Tokushima.
Present address: Sasebo Technicat Coltege, Sasebo.
- 208 -

JAERt-M 90-025
2. Comparison of proton scattering with neutron scattering.
It is meaningful to compare the proton scattering with neutron scattering on the lithium
isotopes. W e calculated the differential cross sections and analyzing powers of the neutron
scattering at 14 M e V , using the optical potentials obtained from the analysis of proton
scattering. The calculated results for Li+n and ^Li+n scattering are compared with the
experimental data in Fig. 3. The differential cross sections of the . :ic scattering of Li are
reproduced well but those of the inelastic scattering are different in die angular distribution at
forward and backward angles. O n the other hand, the differential cross sections of the elastic
scattering on ?Li, which include those of the inelastic scattering leading to the 1st excited state,
are also reproduced well, if the Coulomb barrier of about 2 M e V is taken into account. The
neutron inelastic scattering indicates similar difference at forward and backward angles as the
proton inelastic scattering. The analyzing powers for the Li+n elastic scattering measured at
TUNL[2] are reproduced very well by the calculation based on the present optica! potential. As
a result, the study on the proton scattering is valuable for modelling of nuclear reactions
inclusive of neutron scattering, because much precise analyses are possible for proton
scattering.
3. Measurement of Li(p,2p)na reaction at 14 M e V .
In the measured energy spectra of the Li(p,p') scattering, it is seen the contribution
from the Li(p,2p)na four-body breakup reaction is important in the low energy region. Since
the reaction is the mirror reaction of the Li(n,2n)pa reaction, detailed study of the Li(p,2p)na
reaction may provide valuable information for understanding of its reaction mechanism. W e
have measured 2-proton correlation spectra of the reaction at 14 M e V , by means of the Tandem
van de Graaff accelerator in Kyushu University. Some of the measured spectra are shown in
Fig.4. Theoretical analysis is in progress.
4. Measurement of *^C(p,p')3a reaction at 16 M e V .
The importance of '-C(n,n')3a reaction is known for radiation damage effects in
biology and material science{3). In order to estimate accurate Kerma factor for the reaction, it is
needed the modelling of the four-body breakup reaction. Instead of measuring the *2C(n,n')3a
reaction, w e have precisely measured the '^C(p,p')3a reaction at 16 M e V . Double differential
proton emission cross sections measured at 20°, 60° and 120° are shown in Fig.5. Continuum
region was observed in proton energies less than those corresponding to the 3' peak. This
region is affected by a contribution of proton emissions followed by 3a breakup process. As a
preliminary analysis, the following two processes are considered using kinematica! phase space
distributions.
'2C + p -> p' + on + SBe( -> 03 + 03) 3 body simultaneous breakup (3BSB) followed by a sequential decay
- 209 -

JAER[-M 90-025
12C + p -> p' + ot] + (X2 + 0(3 4 body simultaneous breakup (4BSB).
The calculated results are shown in the figure. The dashed-dotted curve represents proton
spectra for the 4BSB process. The dashed curve shows the 3BSB component including both
the sequential decays of Be(g.s) and Be(2.9MeV) states; the dotted curve is for the 3BSB
process only with the decay of Be(g.s.). As shown in the figure, the 4BSB is in better
agreement with the measured continuum spectra, especially in proton energy below 2 M e V and
above 4 MeV. This indicates that the 4BSB process may be more dominant than the 3BSB
process in the 3a breakup reaction on '^C.
To ensure the importance of the 4 B S B process, we are planning to measure double
differential a emission cross section at the same energy.
References [1] N. Kooh et al., JAERi-M 89-167 (1989);
N. Kooh et aL, Proc. Int. Conf. on Nuclear Data for Science and Technology, Mito (t988) p.! 165. [2] H.H. Hogue et al., Nucl. Sci. Eng. 68 (1979) 22. [3] For example, D.J. Brenner et al., Nucl. Sci. Eng. 95 (1987) 311.
- 2 1 0 -

JAERI-M 90-025
Table 1 Optical po t en t i a l parameters for 6Li
SOM
Present work Bray et al. Dave et al. Chiba et al.
vo 57.20 41.3 41.3 49.73
T) 1.227 1.050 1.507 1.183
aO 0.706 0.745 0.663 0.686
ws 19.85 2.38
18.08 7.168
«"i 1.386 1.923 1.616 1.519
»i 0.285 0.654 0.196 0.479
Vso 12.511 2.85 5.5 5.5
rso 0.608 1.020 1.15 1.15
aso X a 2 / N 0.715 0.62 0.2 0.5 0.5 1.33
X A 2 / N
0.79
* Exit channel potential for the 1st excited state (2.185 MeV. 3+). Present work 25 5 3 12 1 2 22
cc Vo ro ao Ws r, a, V ^ r s o a s o 02
Xa2™ XA2 'N Present work 67.25 0.947 0.526 2.865 1.089 0.925 12.81 0.442 1.492 1.26 16.3 24.8 Chiba etal. 47.06 1.243 0.594 9.8111.286 0.240 5.5 1.15 0.5 1.099 3.52
Table 2 O p t i c a l p o t e n t i a l p a r a m e t e r s f o r 7 L i
SOM
Present work Dave et al. Chiba et al.
* Exit channel Present work * Exit channel Present work
CC
Present work Chiba et al.
Vo iQ «0 W s r{ 50.30 1.288 0.640 9.463 1.186 37.73 1.504 0.565 13.80 1.512 61.26 1.048 0.751 7.666 1.638
potential for the 1st excited state (0.478 MeV 40 1.0 0.7 8 1.5
potential for the 2nd excited state (4.63 MeV, 35 3.5 2.0 8 2
Vo ro ao W s ri »{ 52.23 1.127 0.583 2.529 1.571 0.732 52.01 1.187 0.636 11.14 1.434 0.133
»i 0.513 0.185 0.294
, 1/2"). 0.5
7/2"). 1.5
Vso 6.565 5.5
Vso «so 9.249 1.188 5.5 1.15 5.5 1.15
0
10
rso 1.141 1.15
-
4.0
•so 0.432 0.5
»so X C T / N ! 0.507 1.76
0.5 0.5 1.73
-
2.0
02 X a 2 / N 0.961 26.96 0.956 3.9
X A 2 / N
14.70
XA2/N
2.81
- 2 1 1 -

JAERI-M 90-025
a
i | i i | " i | i i | i i | i i
*Li(P.P -)
Ep=14MeV
10
., I • • I i • I i i I i i I i • I • •
0 90 180
CM ANGLE (deg)
2. 0 <
1 • I • • I • • I • • I ' ' I
' L i<p .pT Ep = 14 MeV
ground
2.185 MeV 3 *
*o * & *
' • • ' ' • ' ' •
0 90 CM ANGLE (deg)
180
Fig. 1 Effect of changing the optical potential for the exit channel of the Li(p,p') scattering at 14 MeV. Solid curves indicate the results for the SOM (for the elastic scattering) and DWBA (for the inelastic scattering) calculations. Dashed curve for the inelastic scattering indicates DWBA calculation with a different optical potential for the exit channel. The potential parameters for the 1st excited state of 6Li are given in Table 1.
90
CM ANGLE (deg)
LHpj,-) E , = 14MeV
ground
4.63 MeV 7/2* »#o -1 L^. • • • • •
90 CM ANGLE (deg)
1W
Fig. 2 Effect of changing the optical potential for the exit channel of the Li(p,p') scattering at 1A MeV. Solid and dashed curves are similar as in Fig. 1. The potential parameters for the 1st and 2nd excited states of 7Li are given in Table 2.
- 2 1 2 -

JAERI-M 90-025
i ,n«
• r\ \ \ - \ \
\ \ \ \
-. -•
« . '. ---. —
i i | i
\ > \ \ \ T
\ \ \ \ \\
CHIBA-JENDL-3
ENDF/8 -PRESENT
i < 1 i i
' '
~ _ < CAL
. i
1 . . . |
' L K n . n j )
U 2 M«V
. , , 1
i i i i :
• . • -
: . • "
. 1
S V - 7 ^
K'A
i i i i
I0 3
\
V.
-
S
•
i i | • i I i
CHIBA- ^~~
- JENOL-3 S
- PRESENT CAL — •• e i i ' mod.
I i 1 i . . I
1 ' '
»Li (n
\ \ \ \
1 I I 1
1
", )
T
-
1
\
I
1 '
J
1
1
r—
-
[ii I rn
-
[;
•I ' ' ' ' I ' ' ' ' I
' iKn.rvj.n,)
U.J M»V
• CHIBA' JENDL-3
-- -ENOF/B-V PRESENT CAL
1 0 ^ 1—' ' I I ' ' ' ' > I <—j * •—1 l _ l <—t-
'
o
. ?U(n,n,)
• CHIBA' ^ ^ * * . JENOL-3 — j .
PRESENT CAL I s
txlt mod.
— I . I l l . . i _ l _ l . 1 l 1 1 l l l 1 l l i i 0,5 0 -0,5
COSINE (8tm ) 0.5 0 -0.S
* COSINE <ecm)
7* V)
E
" •o
h •o
103
10J
101
-•
I. "
i
i i i
6Li(n,n.) UMeV
*** v \ \ \
\ \
\ \ \ | \ . jf—"
I t 1
1 1
•
« TUtfLdata -
•
--•
1.0
0.5 -
CD
< 0.0
1 l - l 1 . sLi(n.n.J UMeV
- 1 TUNL data
7 ^V /•'
r i i i i
i
A . h\-
\
•
•
i H 90
CM ANGLE (deg)
1BO 0 90 CM ANGLE (deg}
180
Fig. 3 Comparisons of the calculation, based on the potential parameters from the proton scattering, with the (n,n') scattering experimental data.
- 213 -

JAERI-M 90-025
CM L . CO > o s • • * -
n b
fci- •*
c o
cti
o 00 w CO o L-
o
8
6
4
2
o 2
0
2
0
^
0
-2
bLi(p,2p)na E p=14MeV
g1 = 50deg Q2= 45 deg
\
*& 02=60deg />'
02=70deg
3*
Q2= 120deg
i.
; '
* '
2 4 6 8
Energy [MeV]
10
Fig. 4 Angular dependence of correlation spectra for the Li(p,2p)na reaction at 14 MeV. Four-body breakup process is evident in the low energy region.
- 214 -

JAERI-M 90-025
1 1 -
0 2 4 6 8 10 12 14 16 PROTON ENERGY (MeV)
18 20
10 - i — i — i — i — i — i — i — i — i -
2C(p,p') 60deg.
XI I Ll L
0 2 4 6 8 10 12 14 16 PROTON ENERGY (MeV)
18
10 - i 1 1 1 1 1 1 1 1 1 1 r
12C(p,p') 120deg.
' 0 2 4 6 8 10 12 14 16 PROTON ENERGY (MeV)
18 20
Fig. 5 Double differential proton emission cross sections measured at 20°, 60°, and 120° for 16 MeV proton induced reaction on carbon. Dashed-dotted curve is for the four-body simultaneous breakup (4BSB) process, dashed curve for the three-body simultaneous breakup (3BSB) process with the sequential decays of Be(g.s.) and 8Be(2.9MeV) states, and dotted curve for 3BSB process only with the decay of 8Be(g.s.).
- 215
i i

JAERI-M 90-025
3.3 Nuclear Data of Charged-Particle Induced Reactions on Medium-Heavy Nuclei
Y. Watanabe. N. Koori* . M. Hyakutake*, and 1. Kumabe
Department of Nuclear Engineering, Kyushu University; Fukuoka 8J2, Japan
Measurements of douMe differential charged-particle emission cross sections are
reported for proton-induced reactions on several medium-heavy nuclei in the bombarding proton
energy range from 10 to 20 MeV. Some results of analyses based on preequilibrium models are
summarized.
1. Introduction
Recently, the needs of charged-particle nuclear reaction data have been increasing in
several applied fields: (1) Shielding for particle accelerators (2) Biomedical applications such as
production of radio isotopes and cancer therapy (3) Material irradiation experiments concerning
R & D for fusion technology (4) Space development, e.g. nuclear data for estimation of
irradiation damage of LSI by cosmic ray.
We have performed experiments of proton induced reactions using the tandem Van de
Graaff accelerator at Kyushu University for several years| 1-4). In these experiments, double
differential charged-particle emission cross sections have been measured for proton-induced
reactions on medium-heavy nuclei in the incident energy range from 10 to 20 MeV. The
reactions measured are listed in Table 1.
The , ' Durpose of these experiments was to understand the reaction mechanism of
neutron-indui. actions through the study of proton-induced reactions and to apply the
obtained information to evaluation of neutron nuclear data. In general, it is possible to obtain
more precise and systematic data in proton experiments, by making use of some superiorities to
neutron experiments, such as better counting statistics due to higher beam intensity and more
easily variable incident energy. Therefore, the study of proton-induced reactions can become
one of approaches for investigation of the common reaction mechanism related to both reactions.
In present work, our interest was focused on continuum spectra with forward-peaked angular
distribution of particles emitted via preequilibrium or precompound process.
The following studies have so far been done or are now in progress.
1. Shell and odd-even effects in the preequilibrium (p,p') and (p,a) reactions) 1-4).
2. Incident energy dependence of preequilibrium (p,p') spectra)5).
+ Present Address: College of General Education, The University of Tokushima, Tokiishiraa. Present Address: Sasebo Technical College, Sasebo.
- 216 -

JAERt-M 90-025
3. Systematics and parameterization of continuum angular distributions^].
4. Simultaneous analysis of preequilibrium (p.p')and(p.n) spectra in terms of the two
component exciton model.
5. Sub-coulomb barrier proton emission in (p,np) and (p,2p) reactions.
6. Isotope effect of (p.d) and (p,t) reactions on near-magic nuclei[7].
Some of the above-mentioned studies have already been published. In the present report,
w e describe the experimental procedure and the results for three subjects (1.2. and 4) selected
from among those studies.
2. Experimental Procedure
2.1 Experimental Set-up
The experiment was performed using the tandem Van de Graaff accelerator at Kyushu
University}8). The proton beam after passing through an analyzing magnet was focused on a
target placed at the center of a scattering chamber. The beam current on the target varied from
about 20nA to 300nA depending on the beam energy and the detection angle. The smaller beam
current was used at forward angles in order to reduce dead time for a detector system. The beam
was collected in a Faraday-cup connected to a current integrator. The scattering chamber had a
diameter of 1 m. A particle detector was mounted on a tumarm inside the chamber.
As the detecting system for emitted charged-particles, a AE-E counter telescope
consisting of two or three silicon detectors( 15um, 75um , and about 2000um, respectively) was
employed; a counter telescope consisting of two detectors for (p,p') and (p,a) reactions and that
consisting of three detectors for (p.np), (p,2p), (p.d), and (p,t) reactions. T w o A E detectors
were surface barrier silicon detectors. A lithium-drifted silicon detector or a surface-barrier
silicon detector was used as the E-detector. The schematic view is illustrated in Fig. 1. A circular
diaphragm of 6 m m diameter was used as a defining aperture for the (p.p') experiments and was
located 178 m m from the target, while a defining aperture 2 m m wide and 5 m m high was
placed just in front of the A E detector and situated 102 m m from the target for the (p.a)
experiments. To reject electrons emitted from the target, a small permanent magnet was set in
front of the defining aperture.
A block diagram of the electric circuit used for the (p,p') experiments is shown in Fig.2.
The particle identification was made using an Osaka Denpa MPS-1230 particle identifier. Figure
3 shows a mass spectrum from the particle identifier obtained in the (p,p') experiment using
AE(75um)-E(2000jnm) counter telescope. By selecting the corresponding part of the mass
spectrum, the signals corresponding to each charged particle spectrum were fed to a
multichannel analyzer Canberra Series 80 or E G & G MCA7800.
- 217-

JAERI-M 90-025
Measurements were performed between 20° and 160°. in steps of 20° for the (p.ot)
experiments and i0° for the (p.p') experiments, respectively. The beam intensity was
determined with the current integrator connected to the Faraday cup. and was monitored by a
detector located at a fixed backward angle to the incident beam direction in some cases where
there is a possibility of sublimation of the target due to the heat generated by proton beam
irradiation.
Targets used were self-supporting metallic foils, except for <28.t30rg which have 0.2
mg/cm- gold backings, and their characteristics is listed in Table 2.
2.2 Data processing
The measured pulse height spectra were converted to energy spectra and angular
distributions in the c m . system. There are two kinds of backgrounds to be considered in the
data processing. One is the background that consists of discrete peaks due to light-element
impurities on the targets, such as hydrogen, carbon, and oxygen. After these background peaks
were identified using reaction kinematics calculations, they were subtracted by a peak fitting
method or drawing a curve under the peak on the assumption that the spectrum must be smooth
in the continuum region.
The other background is the continuous background due to the slit scattering of elastic
protons by the detector aperture. This background becomes a serious problem in measurements
of protons emitted from proton induced reactions. It was estimated under the assumption that the
30° spectrum measured using a thin gold target could be attributed to the degrated elastic
protons, because emissions of charged particles with low energies are restricted essentially by a
targe coulomb barrier of the gold nucleus. The estimated background spectrum was subtracted
from each measured proton spectrum after normalizing elastic peak counts. The background
correction was rather large for data at forward angles (30° and 40°) and decreases rapidly with
increasing angle and became negligible at backward angles. Note that the fraction of the
correction was different among each experiment because the effect of slit-scattering depends on
detector alignment and beam adjustment.
Absolute cross sections were determined by normalizing the experimental elastic cross
sections to the optical model predictions at forward angles, because the errors arise from the
nonuniformity of target thickness. The uncertainty associated with the normalization was
estimated to be within 1 0 % for each target. However, the relative uncertainty was better than the
above value, and was estimated to be less than about 4 % .
Finally, the experimental angular distributions for each 0.1 or 0.2 M e V energy bin were
fitted with a series of Legendre polynomials up to /=4. and the polynomials were integrated to
obtain an angle-integrated spectrum.
t

JAERt-M 90-025
3. Experimental results and theoretical analyses
As two examples of the measured data, double differential cross sections are shown m
Figs. 4 and 5 for Nb(p,p')]3.4) and "Ssn(p,ct)[2]. respectiveiy. The angular distributions
are peaked forward in the continuum between 6 and 14 M e V as shown in Fig.4. and similar
forward peaked angular distributions are observed for the (p.ot) reactions in Fig.5. These
experimental results suggest that preequilibrium process or direct process is dominant in a high
energy tail of the continuum spectra.
In a series of our studies on the continuum spectra, theoretical analyses for the measured
energy spectra were performed in terms of the preequilibrium exciton model. Since several
results have been described elsewhere in details) 1-7). w e will summarize only the essences
here, selecting three subjects from among the studies mentioned in Introduction.
3.! Shell and odd-even effects in the preequilibrium (p,p) and (p,ot) reactions
From investigation of shell and odd-even effects in preequilibrium (p.p') and (p.a)
spectra, it was found that there were no appreciable shell and odd-even effects of the target
nuclei in the continuum spectra corresponding to excitations higher than 4 M e V of the residual
nucleus] 1-4). A satisfactory interpretation for the result was given on the basis of microscopic
state densities calculated from a modified uniform spacing model proposed by us. The measured
energy spectra were in good agreement with those calculated in terms of the exciton mode! using
a shell independent single-particle level density.
3.2 tncident energy dependence of preequiiihrium (p,p) spectra
Incident energy dependence of preequilibrium (p.p') process was also investigated for
12-18 M e V (p,p') spectra for 9SMo and *06pd[5]. In particular, the incident energy dependence
of the K-value used in an empirical expression(M-=KA*3E'') for average matrix element was
inspected. As a result, the spectra calculated using a constant K-value(430MeV3) showed good
agreement with all measured spectra. An important role of isospin conservation in
preequilibrium (p,p') process was also addressed in this analysis.
3.3 Simuitaneous analysis of preequilihrium (p,p) and (p,n) spectra in term:
of the two-component exciton model
To check the validity of some proposed preequilibrium models, it is of great interest to
analyze simultaneously two dominant preequilibrium decay channels] (p,p') and (p,n) reactions]
using the same model assumptions and mode) parameters. Since experimental data on 18 M e V
(p,n) spectra for 90,9),92.94zr and *06,)08j tupd &s medium-heavy nuclei have been reported in
Refs.[9,10], w e measured (p,p') spectra for the same nuclei at the same bombarding proton
A
- 219 -

JAERI-M 90-025
energy of 18 M e V . Both (p,p') and (p,n) spectra were analyzed in terms of the one- or two-
component model} 11 ] and a dependence of the K-value on the nature of emitted nucleon was
examined.
From the analysis using the one-component exciton model, it was found that both (p,p')
and (p,n) spectra were reproduced well by the calculation using the same K-value)463MeV3)
when Q-factor[12] was employed as the correction factor for the distinguishablity of proton and
neutron degrees of freedom and effective Q values} 13) was used. The result of the two-
component exciton model calculation indicated that relative yield for proton and neutron
emissions depends strongly on relative probability of exciting proton and neutron in a nucleus in
the transition process from one-particle (lp) states to two-particle and one-hole (2p-lh) states.
The calculated (p,p') and (p,n) spectra showed good agreement with the experimental ones
when it was assumed that the relative probability was equal. Comparisons between the
experimental and calculated spectra for 90Zr and 94Zr are shown in Fig.6. in the calculation
using the two-component model, isospin conservation was not treated rigorously. That is, only
T< component was treated by this model but T> component was calculated using the one-
component model mentioned above. Therefore, more rigorous two-component model
calculation including isospin conservation will be required for further studies on the
preequilibrium (p,p') and (p,n) spectra.
4. S u m m a r y
Systematic measurements of double differential charged particle emission cross sections
have been performed for proton-induced reactions on several medium-heavy nuclei, and those
charged-particle nuclear reaction data were gathered in a data-form of double differential cross
sections and angle-integrated spectra. From comparisons between the measured (p,p') and (p,a)
spectra and those calculated using the preequilibrium exciton model, the preequilibrium process
related to these reactions was intensively studied.
As a next step for the present works, we are now planning an extension of measurement
of the continuum spectra for proton-induced reactions to the bombarding proton energy range
from 20 to 40 M e V using a J AER1 tandem Van de Graaff accelerator and theoretical analyses
based on sophisticated models, such as the statistical multistep direct and compound
theories} 14]. ,
Acknowledgments
W e would like to thank members of the Nuclear Physics Laboratory of the Department
of Physics, Kyushu University, for their assistance in operating the accelerator. W e also wish to
thank several students who worked together in our laboratory and graduated from the
Department of Nuclear Engineering, Kyushu University, for their cooperation.
- 220 -

JAEM-M 90-025
References
[I] 1. Kumabe et al., Phys. Rev. C 35. 467 (1987).
[2] t. Kumabe et al., Phys. Rev. C 38. 2531 (1988).
[3] Y. Watanabe et al., Phys. Rev. C 36, 1325 (1987).
[4] Y. Watanabe, Doctor thesis. Kyushu University (1988).
[5] Y. Watanabe et al., to be published in Z. Phys. A.
)6J 1. Kumabe et al., to be published in Nucl. Scie. and Eng.
]7] 1. Kumabe, Proceedings of the 1987 Seminar on Nuclear Data (JAER1 M 88-065),
p.212.
[8] Kyushu University Tandem Accelerator Laboratory Report (1980-1984).
[9) W . Scobel et al., Lawrence Livermore National laboratory Report No. UC1D-20101,
1984 (unpublished).
[ 10) S.M. Grimes et al., Phys. Rev. C 13, 2224 (1976).
[II] C. Kalbach, Phys. Rev. C 33, 816 (i986): S.K. Gupta. Z. Phys. A 303, 329 (1983):
J. Dobes and E. Betak, Z. Phys. A 310, 329 (1983).
[12] C. kalbach, Z. Phys. A 283, 401 (1977).
] 13] i. Kumabe and Y. Watanabe, Phys. Rev. C 36, 543 (1987): %/</. 40, 535 (1989).
[ 14] See, for example, P.E. Hodgson. Pwcwt/M?^ qf fAf VwcrwoMMM/ Cof{/prfHCf <;w
NMc/<w DaM/or .ScK'MtY' aw/ 76*cA/?o/ gy, M/w, 1988, edited by S. Igarashi (Saikon
Publishing 1988), p.655.
^ .
- 221 -

JAERl-M 90-025
Table 1 A l i s t of measured reac t ions
Reactions
(p.ot)
(p.a)
(P-P')
(P.P') (p.np). (p,d).
(p.2p) (p.t)
Target Nuclei 90Z r i 92.94,96.98.100Mo> 93Nb_ I06pd- A g
H2Cd, ll8.I20Sti, Sb. !28.130Te
90.91.92,947r< 93Nb, 92,94.96.98,100\4o>
106.108.1 lOpd, Ag, 60js|i 98M o < 106pd 90Zr, q 2 M o, 9 4Mo, 54Fe, 60Ni 92.94.96.98, lOO^o
Incident Energy
15. 18 MeV
18 MeV 18 MeV
12.14.16 MeV 13.6-16.3 MeV 19 MeV
Table 2 Target thickness and i so top ic enrichment
Target Nucleus
**Fe 60Ni 90Zr 9 'Zr 92Zr 94Zr
« N b 92Mo 94Mo 96Mo 98Mo
100Mo
106Pd
I08pd n o P d
Ag " 2 C d "»Sn l20Sn
Sb '28Te no je
Target thickness (ugA:iii2)
455 850 492 431 495 432
2576 506 588 473 450 744
1020 1480 977
1089 1040 900 610
1110 1920 2080
isotopic enrichment'
97.61 98.0 97.65 88.50 95.13 96.93
100 98.27 93.90 96.80 97.10 97.27 98.48 98.11 97.73
natural 97.05 97.79 98.39
natural 99.19 99.49
- 222 -

JAERI-M 90-025
1
e
0 1 2 3 I I I t_
5 cm
J
Fig. 1 A schematic view of a counter telescope used in ( p , p ' ) experiments. (a) c i r c u l a r diaphragm of 7 mm in diameter , (b) permanent magnet, (c) c i r c u l a r d i a phragm of 6 mm in diameter for a d e f i n ing ape r tu r e , (d) dE d e t e c t o r , (e) E de tec to r Fig. 2
A block diagram of the electric circuit used for (p,p') experiments
io;
i<r
10'
10'
P . ) . OUTPUT
1 p
1 \
f
¥ ii *
* expanded view
d
i 1 n_
i
n ,
-
-
-
-
ILL
°He or a
100 200 300
CHANNEL NUMBER
U00 500
Fig. 3 A mass spectrum from the particle identifier
- 223 -

JAERI-M 90-025
10
10
10
10
F 10
1 0 ' t
i d 1
X10
10-21
X10
160"
0 2 4 6 8 10 12 U IB IB PROTON ENERGT (MeV)
Fig. 4 Double differential cross sections for the Nb(p,xp) reactions at 18 MeV
' i d \?~ 14 I E ' 1 8 " ' 2 0 22 24 26 ALPHA ENERCT IMeVl
J1Q" 12 U 16 18 20 22 24 26 ALPHA tNfRGT ir leVl
(g)
6L « W0"
m-1 1 ' 1 0 12 14 16 18 20 22 24 26
ALPHA ENERGT llteVI
Fig. 5 Double differential cross sections of alpha particles from the 118Sn(p,a) reaction for 18 MeV protons
- 224 -

JAERI-M 90-025
10"
18 MeV u Z r ( p , x p )
/ ;/ * ••.. . ( p . p ' ) e q . >W j v p r e , , . - . ^
i0°i (/•:,'\ li i i i , y
1 0 F—'—'—'—'—lf 1—•""
2 4 6 8 10 12 14 16 PROTON ENERGY (MeV)
10
10 r
10
18 HeV 9 4 Z r ( p , x p )
'1M t » '
2 4 6 8 10 12 14 16 PROTON ENERGY (MeV)
'4 6 8 10 12 14 16 18 NEUTRON ENERGY (MeV)
" T — i — i 1 1 1 — i — r
' 4 6 8 10 12 14 16 18 NEUTRON ENERGY (MeV)
Fig . 6 Comparisons between experimental energy spec t ra and those ca lcula ted using the two-component exci ton model for 18 MeV ( p , p ' ) and (p,n) reac t ions
- 225 -

JAEm-M 90-025
3.4 Measurement of Helium Production Cross Section of Aiuminum Irradiated by Proton
Yoshiyuki Takao, Yukinori Kanda, Sigeki Itadani,
Tuyoshi Takahashi, Hideki Eifuku, Muneaki Morinaga
and Akio Iwasaki
Department of Energy Conversion Engineering,
Kyushu University, Kasuga, Fukuoka 816, Japan
Abstract
The proton-induced helium production cross sections of aluminum have
been measured using the Helium Atoms Measurement System. Eleven pieces of
aluminum foil (chemical purity 99.999%, size lOxlOxO.lmm^) are prepared
for samples. The samples are stacked and irradiated by 14MeV protons
generated by a tandem accelerator. Helium production cross sections at
several kinds of proton energy can be measured by using stacked samples
at a time, because the proton energy is changed in the samples.
1.Introduction
In development of fusion reactor materials, helium production caused
by irradiation of fast neutrons is one of the most important problems,
which leads to swelling or brittle fracture. The experimental data of the
helium production are useful for the selection of the first wall
materials, but they are scarce. Because there are few facilities which can
generate enough fluence of high energy neutrons (above 14MeV). Therefore,
this subject, measuring helium production cross section for protons
instead of neutrons, has been studied. This simulation will make it
possible to measure helium production cross sections at several incident
energy, because there are a number of accelerators which can generate
enough fluence of high energy protons.
2.Experimental procedures
The experiments include three consecutive stages, which are sample
preparation, irradiation of protons on the samples and measurements of the
number of helium atoms using the Helium Atoms Measurement System.
- 226-

JAERI-M 90-025
2.1 Sample preparation
Eleven pieces of aluminum foil (chemical purity 99.999X, size
lOxloxo.lmmS) are prepared for samples. The samples are stacked and set
on a sample holder and are installed in a Faraday cup. They are set in a
vacuum chamber so as to coincide a perpendicular so the aluminum foil and
one of proton beam(fig.l). The samples are held below a temperature of
50°C by liquid nitrogen during irradiation. It prevents the release of
created helium atoms due to the diffusion above a certain temperature of
100 °C.
2.2 Irradiation of protons
The samples are irradiated by 14MeV protons at Kyushu University
Tandem Accelerator Laboratory. The number of protons is measured by using
a current integrator and the samples were irradiated at a proton current
of 0.5//A to reach a positive charge of 5000//C. Helium production cross
sections at several kinds of proton energy can be measured by using
stacked samples at a time. They are calculated from the energy loss in the
samples(l). Figure 2 shows the schematic diagram of a vacuum chamber. The
vacuum chamber with a diameter of 100cm and a depth of 50cm has a moving
arm which can move around the center of the vacuum chamber. By setting the
sample holder which is an arc in figure on the moving arm, the changing of
samples are easily achieved.
2.3 Measurement of the number of helium atoms
After irradiation, the number of helium atoms produced in the
aluminum samples are measured by using the Helium Atoms Measurement System
which was developed in our laboratory. This instrument consists of 5 main
parts, which are a standard gas supply, a furnace, a trap, a mass
spectrometer and a vacuum system. Three turbo molecular pumps (T.M.P.) are
used for the vacuum system. The vacuum system keeps the instrument at an
ultrahigh vacuum of 5xlO*8Torr. In the furnace, the samples are
evaporated on a tungsten boat heated electrically and release the helium
gas. Molecular sieves cooled by liquid nitrogen are used for the trap to
remove the undesirable gas from the released gas of the samples. Helium
contained in the released gas is analyzed by a quadrupole mass
spectrometer. The number of helium atoms are determined by comparing the
analyzed result of sample gas with that of standard helium gas. The number
- 227-

JAERJ-M 90-025
of atoms of the standard helium gas is measured by using the standard gas
supply. The standard gas supply consists of volume known vessels, an
absolute pressure gauge and a thermometer.
3. Results
Though the helium production cross sections are determined by the
number of protons and helium atoms, the number of helium atoms must be
corrected for the loss and the gain of helium atoms from surfaces of
individual samples. The loss is caused by the emission of helium atoms
from the sample due to the kinetic energy of the (p, <x ) reaction. The gain
is caused by the entrance of the emitted helium atoms from other samples
into the sample.
The determination of helium production cross section including the
correction is achieved through calculation and it is as in the following.
Figure 3 shows the principle of the correction of helium atoms. A certain
excitation function of the (p,xa) reaction is assumed and the number of
helium atoms produced at a certain point in the samples is calculated from
it. The proton energy at the point was determined by a helium stopping
power(l). The energy distribution of the helium atoms are determined from
the <x particle spectrum at the given proton energy and the emitted
angle. The ranges of the <x particles are determined by this energy(2).
Figure 4 shows the ranges of the ground state <x particles against emitted
angles and proton energy. The angular distribution of at particles is
determined on the assumption that the emission of <z particles are
isotropic in center-of-mass system. The place where the produced ar
particles are trapped and the number of trapped a; particles in the place
are determined by these assumptions and calculations. When the results of
this calculation agrees with the number of helium atoms measured
experimentally, the assumed excitation function is the objective
excitation function. When they are not agree, the calculation described
above is repeated on another excitation function until both results agree.
Figure 5 shows the results of this study. The plots as the helium
production cross sections of aluminum are the average cross sections for
an energy interval at the sample position. The errors were estimated from
statistical and systematic uncertainties.
-228 -

JAERI-M 90-025
References:
(1) Andersen, H.H., Ziegler, J.F.: "Hydrogen Stopping Powers and Ranges
in all Elements", (1977), Pergamon Press, New York.
(2) Ziegler, J.F.: "Helium Stopping Powers and Ranges in all Elemental
Matter", (1977), Pergamon Press, New York.
S
- 229 -

JAEM-M 90-025
FARADAY (UP
PROTON BEAM
THERMOCOUPLE
X-Y PLOTTER
CURRENT INTEGRATOR
COOLED BY LIQUID NITROGEN
Fig. 1 Schematic diagram of the sample holder
RESERVOIR OF LIQUID NITROGEN
SLIT
PROTON BEAM TANDEM ACCELERATOR
SAMPLE HOLDER (Al)
Fig. 2 Schematic diagram of the vacuum chamber
230

JAERI-M 90-025
SAMPLE NUMBER
PROTON BEAM
1 2 3 A 5 6 7 8 9 10 11
dx
500 Samp!e Depth (//m)
1000
Fig. 3 The principle of the correction of helium atoms
-231

JAERI-M 90-025
©:ANGLE IN LABORATORY SYSTEM
150 100 50 0 50 100 150
Sample Depth(/im)
Fig. 4 The ranges of the ground state a particles in Al at several proton energy
2£>U
^ 200 J, g 150
•J0 a
en m 100 CO
o J .
50
r\
z—'—•—
-
~~
• 1 1
1 1
*
1 . . . .1
—1 1—1 1 1—1 1 1 — 1 — 1 — -
i { * { V j ---
_ ^
-i i i i i i i i i i
5 10 Proton Energy (MeV)
15
Fig. 5 Helium production cross sections of aluminum for proton
- 232

JAERI-M 90-025
3.5 Technological Problem in Development of an Advanced Support System for Nuclear Data Evaluation
S. Iwasaki and K. Sugiyama Department of Nuclear Engineering, Tohoku University
Aramaki-Aza-Aoba, Aobaku, Sendai 980, Japan
1. Introduction
We have been developing a support system for nuclear data evaluation on a 32-bit workstation for one and a half year using the knowledge engineering technology /1/. In this system, model codes for nuclear cross section calculation is systematized and handling process of each code using a set of parameters for a typical nuclear data evaluation is supported. This system have been considered to be a middle level among three kinds of the system; low level, middle level and high level system /1 /. The low level is just a cross section calculation system using a set of default model parameters. The high level one means a practical support system for neutron nuclear data evaluation as done in the evaluation for JENDL-3. The middle level system is a prototype of the high level one a.nd for establishment of fundamental technologies for the latter system.
There may be a wide gap between the low level and high level system, and there are many technical problems to be solved in order to approach the high level system. In this paper, we discuss the new technologies of the high level system from the point of view of the experience of development of the middle level one and their feasibility.
2. Outline of the Present Middle Level System
In this chapter, we briefly describe the feature of the present system in order to make the point of the lat^r discussion clear. As stated above, the present system is a basic and experimental system to develop the support system for the nuclear data evaluation. The primary function of the system is considered to guide the user to perform the nuclear data calculation using several nuclear codes because this process was main part of the evaluation for JENDL-3 /2/. In the first version of the system the following tasks are supported; for each code calculation,
•preparation of an input parameter file to specific nuclear cross section code, .check of input parameters, •storage of input parameter sets to a data base for tracing of the previous evaluation later, .handling of output data files, and for the whole model calculation process, .control of task flow related to the all code running In the evaluation.
Choice of initial parameter set and judgment of fitting should be done by user.
-233-

JAERI-M 90-025
The knowledge of the task flow have been compiled in a collection of production rules and inferred by a backward chaining mechanism. Development environment was provided by an expert construction shell, Nexpert Object/3/ under UNIX operating system.
In the second version of the system, enhancement of the system was done by adding a function for the adjustment of the model parameters used in each nuclear code Ikl using the fuzzy logical inferenc e; i.e.,
.judgment of fitting which is a kind of pattern recognition, •estimation of parameters which are sensitive to improvement of the fitting to the experimental cross sections, .estimation of amount of variance of the selected parameters
from the previous values employing the sensitivity coefficients of the parameters to the cross sections.
This method is considered to be a alternative method of the generalized least square fitting. Adaptation of the fuzzy logic inference enabled to save number of rules comparing with the case by set of the usual crisp logic rules, and give a sort of the mechanism of compromise of some contradicting rules as usually done by human to make decision.
3. Technological Problems for High Level Support Systea
Because a vast number of works, from primitive but time consumptive tasks to highly comprehensive ones, are repeatedly performed in the evaluation process, it is inevitable for evaluator to be supported to a high level in order to complete his work within a limited time. The process is consisted of many correlated tasks, and correspondingly, variety of knowledge and many levels of knowledge are connected with each other Thus, it is necessary to analyze tasks during the evaluation in order to design the knowledge base of the support system. The flow of tasks in the evaluation process is being analyzed in the sub-working group of data base for nuclear data evaluation.
Through the authors study of the middle level system and discussion with other evaluators, we listed up the major tasks which would be more or less done by an average evaluator during the process of the nuclear data evaluation. They are totally as much as 33 items, as shown in Table 1, and are categorized into 5 groups which approximately correspond to modules discussed later.
From the point of view of the present state of the art of the knowledge engineering, it is reasonable to expect that the system support the tasks which are performed under relatively shallow knowledge*) and/or shallower part of deep knowledge*) of the evaluators can be developed.
Considering the effectiveness of the support to user and easiness to develop, the following seven terms which would be supposed to be supported by the advanced system can be picked up.
*) deep knowledge is on the understanding of the object/structure by model; in contrast, shallow knowledge is on the experience, a kind of know-how.
- 234 -

JAERI-M 90-025
(1)collection of experimental data from data review of quality of each set of data, grouping of the experimental data set in
'2)review of theoretical models and codes. grouping of the experimental data oci, ±1
(2)review of theoretical models and codes, selection of suitable combination of codes,
3)parameter selection from parameter data base review of parameter systematic.
i)handline of codes system.
(
U)
(5).
the
The item (6) is necessary as the future support system of Japan. In the previous middle level system, we focussed on the item no.3, 4-, and 5.
comments on each item: (1)-collection of experimental data from data bases,
-review of quality of each data set, -grouping of the experimental data set in grade.
The practical resource of the experimental data for nuclear cross section is the EXFOR data file. Format of the EXFOR file /5/ was designed for the storage of descriptive and numerical data of the cross sections, and not suitable to access the data. Therefore it is unpractical to draw a set of necessary data directly from the file, and desirable to convert the EXFOR file into the other type of data which are fitted to modern data base management system. The relational type may be the most preferable. At least, the original EXFOR file should be broken down to some small sized and structured data file and an index file of the files to access should be formed.
In the EXFOR file, there exist many kinds of data from old to new ones, from ones with small errors to large errors, from reliable to unreliable ones. etc. If we plot all available data for a reaction, we may observe that there are some data points separated from the average value, or there are two or three cross section groups which deviate systematically from each other. It is unreasonable to treat the all data with equally weight. Therefore, the assessment of each cross section data and grade them by some criteria is inevitably important. In some cases, elimination of the lowest grade group from the object set of the data for the evaluation is necessary.
Designing of the knowledge base for the review and grouping of the experimental data set is most important but difficult issues. The first step to the system is to consider following factors; the year, experimental method(detector, neutron source, calibration, etc.), correction method, error analysis and amount of the systematic discrepancy of the data set from others. This is not the absolute standard, and final judgment should be done by evaluator.
- 235

JAERI-M 90-025
(2)-review of theoretical models and codes, -selection of suitable combination of codes,
Main part of this term is inherently related to the deep knowledge of the evaluator and difficult to develop. If we confine our aspect, however, to the use of the previous examples i.e., shallower part of the deep knowledge, it is not impossible to develop a system to suggest a method or a set of methods referring to the data base for methods adopted in the previous evaluation.
(3)-parameter selection from parameter data base -review of parameter systematic.
This is closely connected to the item 3. Again, we confine to the nuclear model into the previously used ones, the data base of the parameter set can be developed and some set of initial parameters can be recommended. Actually, a data base for the parameter which had been used for the JENDL-3 evaluation is being compiled by JNDC nuclear evaluation data base sub-working group. There is no important technological problem in the term except for the design of the data base management.
(4)-handling of codes system, -calculation of cross section by the code system.
This item is also related to the items 2 and 3. Basically the methods of the code handling have been done in the medium system. Refinement of the rules in the system, and structuring of the rule base should be done in order to make maintain the rule base and modification of the rule base easer. Extension of the code system is also desirable in order to calculate cross sections by different model codes for comparison.
(5)-comparison of calculated results with experimental data, -model parameter adjustment.
Basic technology for judgment of fitting and parameter adjustment have already been developed in the medium level system using the fuzzy theory as described before. Improvement of the rule base system should be done. Further it is important to compile the rules based on the recent knowledge on determining or restriction of the parameters because the input parameters are not free, e.g., the dispersion relation of the optical potential which connect the real and imaginary part of it.
In parallel, the conventional generalized (Baysian) least squares method/6/ should be taken into account.
(6)-estimation of error and covariance. The error and covariance of the cross section were complete
ly neglected in the course of the evaluation of the JENDL-3 file except for the simultaneous evaluation for the actinide nuclei /6/. Fundamentally, the error estimation should be done in the evaluation similarly to the measurement. At present, the standard methodology for the estimation of the error of the cross sections evaluated using cooperatively the experimental data and theoretical model calculations have not been established. Study on this subject have been started in the sub-working group and it can expected to get a preliminary method in a few years.
- 236 -

JAERI-M 90-025
( 7 ) .
resu that phys nece the some sect shou
Th sect comp JEND
overall assessment of evaluation results, check and review of the results from integral aspect. Conventionally the overall syntactic check of the evaluated
Its have been done by the compilation group member and after assessed from the integral test point of view by reactor
icist or end user group. However, except for the items which ssitate the very specific domain knowledge in the analysis, syntactic check and cross section check by comparison with simple integral experiments using a standard group cross
ions should be done in the evaluator side and the results Id be returned to the reevaluation process quickly, e rules of the knowledge base for the assessment of the cross ion can be derived by analyze the activities of the file ilation group and integral checks by several group for the L-3 file in the period about 2years until release the file.
4.. Integration of the Modules and User Interface
Previously discussed items correspond to knowledge base modules in the practical support system one by one. Each module may consist of several sub-modules, for example, a knowledge base for control of the module, a data base, a sub-module for data base access and a sub-module for display. In the whole system, there must be a key module (knowledge base) to integrate the modules and systematically control each module, scheduling the tasks, make a module to work or idle according to the user's intention. The presently proposed high level support system does not mean the automated evaluation system, but ideally a support system which assists the user to do whatever the user wants at any moment during the evaluation. Therefore, the role of the key module is very important. This module must have high flexibility in the case of lack or modification of some modules. Such kind of flexibility is essential to develop the high level system module by module in the term of several years.
High grade human interface is one of the most important feature of the proposed system. Extremely speaking, the conventional evaluation system did not consider or neglected the user interface , and forced the users to fit themselves to the computer system conversely. In order to develop a highly efficient computer system, it is necessary to provide an user friendly system which use the high level graphics technique.
Using multi-task and multi-window system, the following quantities and functions are presented in various types of graphics in a bitmap display concurrently; the important cross section curves, spectra, comparison with experiment and other evaluation, graphs showing variation from the previous calculation before parameter change; monitoring displays for key input parameter values, for performance of the evaluation, for the current tasks which are performed presently: e.g., accessing the experimental data base, code running, etc.; these help the user to acknowledge the progressing of the system.
In this system, the user can input the numerical values to the system by moving bar graphs through the mouse interface which minimizes the input error.
-237 -

JAERI-M 90-025
In the multitasking environment, the s for several nuclei become feasible. This the user want to evaluate the nuclei of wh connected with each other through common p the evaluation for the stable isotopes in the user wants, he can do some works not tion work (e.g, mail by LAN easily.
Usually development of would take a considerable commercial tools if they want to implemen system in a short period. In figure 1, an proposed advanced support system is shown.
or programing
such high time, and
lev it
imultaneous evaluation is very convenient if
ich daughter nuclei are arameters (for example, a single element). If related to the evalua-development, etc.) very
el graphic interface is recommended to use t the interface to the image of display of the
5. Summary
We have been discussed the important issues of the technologies which are essential to develop the upgraded (high level) support system for the neutron nuclear data evaluation.
However, if we focus to systematized knowledge of the evalua-tors, which is shallow or deep, and intend to build a cooperative problem solving system between user and machine, the system would be in the extension of the presently developed technologies. An experimental system which can be practically used for the evaluation process would be developed within several years.
In order to make the system work efficiently, several data bases and management systems should be prepared; the cross section request data base, the data base for experimental cross sections from the EXFOR file, nuclear model/method/code data bases, and model parameter data base.
Development of knowledge acquisition mechanism and natural language interface are very interesting themes in the application of the knowledge engineering technology to the data evaluation, but may be future problems.
It is expected that present discussion would provide a useful guidance on the project for the practical system using artificial intelligence technology at JAERI nuclear data center.
The authors are indebted to valuable comments of the members of nuclear data evaluation sub-working group and appreciated to their thanks to Dr. Narita of Nuclear Data center for his helps.
References
/ *\ / S. Iwasaki et al., Proc M89-026, p313 (JAERI 1989).
/2/ T. Asami et al., Journal of Vol.31, No.11, p1190 (1989).
/3/ Manual of Nexpert Object (Neuron Data Inc., 1988). IUI S. Iwasaki et al, Proc. of Fall meeting of Japan
Energy Society, B16 (1989). /5/ EXFOR MANUAL, BNL(1977). /6/ F.H. Froener, Proc. Workshop on Applied Nuclear Theory and
Nuclear Model Calculations for Nuclear Technology Applications, p170, Trieste, Italy, (World Scientific, 1989).
1988 Seminar on Nucl. Data, JAERI-
Atomic Energy Society of Japan,
Atomic
- 238 -

JAERI-M 90-025
Table 1 List of major tasks during the process of nuclear data evaluation
(1) <on the experimental data> 1 o -survey of nuclear data requests related to the objective
nucleus/nuclei. 2 o -comprehension of importance reactions of the nuclei in the
applications. 3 o -collection and survey of experimental data in EXFOR file. 4. -collection and survey of recent experimental data in Japan
and overseas. 5 -making numerical data set from the recent experiments 6 o -inspection and assessment of each experimental data set. 7 o -grading and grouping the experimental data sets after 6.
(2) <on the theoretical model and calculation> 8 o -survey of the previous evaluations or theoretical analysis. 9 * -survey of the recent progress of theoretical models or
method. 10 -check of availability of the codes of the modern
theory/models. 11 * -development of new codes if necessary. 12 * -implementation of the new codes to the code system. 13 * -understanding of each code and codes system. 1 4 o -becoming familiar with each code and codes system.
(3) <on the initial model parameters) 15 o -collection and survey of parameter data for the
model/codes in the system. 16 o -collection and survey of basic data for determine the
input parameter values for the codes. 17 o -deduction of parameters using new basic data. 18 o -survey of systematic of the parameters related to neigh
bor nuclei. 19 o -selection of the candidate sets of the initial input
parameters. 20 o -estimation of the variational range of each parameter.
(4-) Calculation and parameter adjustment) 21 o -test calculation by using above parameter sets. 22 o -comparison of the calculation with the experimental data
set. 23 o -select the most reasonable and prospective combination of
parameter set and experimental data set. 24. o -detail calculation and comparison. 25 o -estimation of high sensitive parameters for improving the
fitting. 26 o -estimation of amount of variation for above parameters. 27 o -parameter adjustment by repeating the varying the parame
ters, calculation and comparison. 28 o -trial calculation by changing the initial parameter set if
necessary. 29 o -trial calculation by changing the calculation model if
necessary. 30 o -trial comparison by changing the experimental data set if
necessary.
(continue)
-239-

JAERI-M 90-025
Table 1 (continued)
(5) <compromise and final judgment> 31 * -compromise between the limit of performance of the
model calculation due to the incompleteness of the adopted model/parameters.
32 * -replacement of some calculation data by other cross section curves based on the experimental data, if necessary.
33 * -final judgment of degree of satisfaction on the results compared with the data requests.
ortasks which are totally proposed high level system.
*:tasks which are considered
or partially supported by
to be difficult to support.
t h e
- V ^ HI' X TEKM TER»
HELP
KENUE
' " S E 1ST D A I '" Support SjstM for Fi l iat ion of Mucleir DaU usioi M ttchnolofj
El • : . . " . . • . „ • . • . . » * • . ;*7^
7 •lit neulron eneriy
Qtis iy cr"s"c"
Fl
//'
j - U - i . —
• &
, - 0 - 0
on
^ S^V. .
PERFORMS CHART
Data Bases 1 ' " " '
E»for
EXSDF
Paraielen
|KB um
C . = D C S
] Suctear Codes •
tilPrac D I G
cram 1 Q C
IDD GMSH D B Q
Fig. 1 An image of CRT display of the proposed advanced support system. Center and left hand side show various types of graphs for cross sections. Right lowermost corresponds to the variation of selected input parameters; the lowest bar graph of each parameter presents the most recent input parameters using sliding bar by the mouse. Right middle shows monitoring of the current processes, and the right uppermost is the radar chart for the achievement of the current evaluation compared with predetermined target.
- 240-

JAERI-M 90-025
3.6 Estimation of Reaction Model Parameters by Experimental Data and Statistical Technique
T.Kawano, Y.Kanda and Y.Uenohara*'
Department of Energy Conversion Engineering,
Kyushu Univ. Kasuga, Fukuoka 816, Japan
ABSTRACT : O p t i c a l m o d e l p a r a m e t e r s a n d l e v e l d e n s i t y
p a r a m e t e r s f o r H a u s e r - F e s h b a c h m o d e l c a l c u l a t i o n s a r e
e s t i m a t e d s y s t e m a t i c a l l y f o r s s ' " N i a n d S 9 C o by u s i n g
B a y e s i a n me thod . The e x p e r i m e n t a l d a t a f o r e s t i m a t i o n a r e
n e u t r o n induced r e a c t i o n s { t o t a l , ( n , p ) , (n,a), and (n ,2n )
c r o s s s e c t i o n s , and p r o t o n , a - p a r t i c l e emi s s ion s p e c t r a by
14 .8 MeV n e u t r o n } and p r o t o n i n d u c e d r e a c t i o n s { ( p , n ) and
( p , a ) } • The c r o s s s e c t i o n s c a l c u l a t e d w i t h p o s t e r i o r
p a r a m e t e r s a r e improved compared wi th t h o s e c a l c u l a t e d wi th
p r i o r o n e s .
1. INTRODUCTION
Evaluation of nuclear reaction cross sections needs model
parameters when it is performed by means of model
calculations. And evaluated values that are calculated by
these parameters, should be consistent with experimental data.
The calculations of optical model and Hauser-Feshbach model
are utilized for evaluations, and they call for optical model
parameters and level density parameters.
There are available parameter sets given by different
experiments or methods as prior information. When it needs
to improve these parameters in order to reproduce experimental
data, it takes some trouble to determine these parameters
individually, because some of these parameters correlate each
other. Then Bayesian method is applied in this work.
*'Present address : Reactor Engineering Group,
Nuclear Engineering Laboratory, Toshiba Co.
4-1 Ukishima, Kawasaki 210, Japan
-241 -

JAERI-M 90-025
The experimental data that are usable in this estimation,
are mainly the neutron induced reactions {total, (n,p),
(n,a), and (n,2n)}, in addition, proton induced reactions
are available as a reverse process of neutron reaction. As a
result, the parameters relating to proton emission reactions
can be estimated accurately.
2. CALCULATION
The methodological description and formulae for the
parameter estimation are as follows.
Pi = Po + XoAol(Ao Xo Ao* + V)-i (Y - f(Po)) (1)
Xi = Xo - XoAoMAo Xo Ao1 + V)-i Ao Xo (2)
P,X : Parameter Vector and Covariance Matrix
Y, V : Experimental Data and Covariance Matrix
A : Sensitivity Matrix
0,1 : prior and posterior values
The computer code ELIESE-3[1] is used for an optical
model calculation, and GNASH[2] is used for a Hauser-Feshbach
model calculation. The prior parameters of the optical model
for n, p and a are taken from Becchetti-Greenlees[3] , Menet
et al.[4] and Lemos[5], respectively. The prior level density
parameters are taken from Gilbert-Cameron[6 ] . The target
nuclides are S 0N_, 58Ni and S9Co.
The diagonal elements of the prior covariance matrix Xo
is obtained by assuming fractional standard deviation of 30 %
for level density parameters and that of 5 X for optical model
parameters. The non-diagonal elements are assumed to be zero.
In this study, residual nuclei of (p,p> and (p,2p)
reactions are also parameterized, because proton emission
cross sections are larger than other competitive reactions
for this mass range.
The used experimental data are shown in Table 1
- 242-

JAERI-M 90-025
3. RESULTS AND DISCUSSIONS
The prior and the posterior optical model parameters
(OMP) are shown in Table 2. The level density parameters are
shown in Fig. 1. Examples of the posterior cross sections
calculated with the posterior parameters are compared with the
prior cross sections in Fig. 2 to 5. In these figures, the
solid lines indicate the prior cross sections, the dotted
lines and dot-dashed lines are the posterior cross sections
estimated by only neutron induced reactions, and by both
neutron and proton induced reactions, respectively.
The OMP for neutron reaction is affected by an
experimental total cross section. In this work, the measured
cross sections are smaller than the calculated values using
Becchetti-Greenlees's OMP. Hence, there are several ways of
modification of OMP to reduce the total cross section, and,
individual reaction cross sections must be consistent with
experimental data. The Bayesian method reduces the total cross
section by the most reasonable way of OMP modification.
As seen in Figs. 4, a emission reaction cross sections
are smaller than the experimental data when Lemos's OMP is
employed. A degree of modification of real part radius
parameter (ro), is large relative to that of the neutron and
proton OMPs. The posterior cross sections of 5 8Ni(n,a)
agrees with the measured cross sections. The posterior cc-
spectra of 58•6°Ni(n,a ) » however, are somewhat different from
measured data by Grimes et al.[7]. So, there is still room for
discussion whether Lemos's OMP suits the prior one.
A little modification of the proton OMP is found when
experimental data of neutron induced reactions are only used
for estimation. When proton induced reaction data are taken
into account, the radius parameters of both real and imaginary
part tend to change largely. Hence, it may show that proton
induced experimental data are usable for estimation of proton
OMP. However, a number of available data is small, and it is
difficult to make sure of these experimental data.
The level density parameters, a, almost become larger
than the prior values, as seen in Fig. 1.
- 243-

JAERI-M 90-025
In Fig. 2, the prior cross section of 60Ni(n,p) is larger
than the measured cross sections. In order to reduce this
calculated cross section, the a of 60Co (a residual nucleus of 60Ni(n,p) reaction) should be decreased and/or that of 60Ni (a
residual nucleus of S0Ni(n,n'), which is competition reaction
of (n,p)) should be increased. On the other hand, the a of 60Co is affected by neutron induced reactions of s»Co, because 60Co is a compound nucleus of this reaction. Then the a of 60Co is not decided by 60Ni(n,p) data only.
In this estimation, valid experimental data are neutron
and proton induced reaction of sa,6 0Ni and 59Co. If some a is
influential in a number of different reactions, the a may be
estimated reasonably, because these parameters are estimated
by many grounds. On the contrary, if the a is used at a few
stage, it is not decisive. For example, the a of S6Fe is a
residual nucleus of 60Ni(n,nor), and it is influential in a
cross section of 60Ni(n,or) . But this a is not modified,
because this cross section is not used in this estimation.
Copper is a compound nucleus of proton induced reaction
of Ni and its residual nuclei of neutron emission reactions.
Then the level density parameters of Cu are estimated by
proton reactions only, and they change flexibly relative to
the other parameters.
4. CONCLUSION
The optical model parameters and the level density
parameters for Mn to Cu are estimated systematically by
applying Bayesian method. The optical model parameters are
estimated within the several percent of prior ones when
neutron experimental data are only used, and they are changed
relatively large when proton experimental data are included.
The overestimations are observed in the level density
parameters for Ni and Co.
The estimated parameters improved the calculated cross
sections. However, it is still difficult to state that the
proton data are valid for the parameter estimation.
- 244 -

JAERI-M 90-025
REFERENCES
[1] Igarashi.S. : JAERI-1224(1972).
[2] Young,P.G., Arthur,E.D. : LA-6947(1977)
[3] Becchetti,Jr.,F.F., Greenlees,G.W. :
Phys. Rev., 182,1190(1969).
[4] Menet,J.J.H. et al. : Phys. Rev., C4_,ill4(1971).
[5] Lemos.O.F. : Orsay Report, Series A, No.136(1972).
[6] Gilbert,A., Cameron, A.G.M. :
Canad. J. of Phys., 4_3_, 1446(1965).
[7] Grimes,S.M. et al. : Phys. Rev., C17,508(1978).
- 245 -

JAKR1-M 90-025
Table 1 Target nuc l e i , reac t ions (neutron or proton induced), and the i r res idual n u c l e i . Underlined reac t ions are used in the present work.
Target Residual
61 Cu 6BCu 59Cu 58Cu 67Cu
61Ni 68Hi 59Ni 5 8 N i
B7Ni
6aCo 59Co 58Co 57Co 58 Co 55 Co 5 "Co
S9Fe 5 8 F e
57Fe 5 8 F e
6 5 F e
5<Fe
58Mn 65Mn
Total
6 8 N i
(p,y) (P.n) (P.2n)
(n.y) (n,n')(p,p') (n,2n)(p,np)
(n.p) -PSP
(n.np)
(P.a) (p.no )
(n, a ) * a sp (n,na )
(n.total)
58Ni
(p.y) (P.n) (P,2n)
(n.y) (n.n')(p,p') (n.2n)(p.np)
(n.p) "Psp (n.np)(p.2p)
(P,«) (P.na )
(n.a) 'asp (n.na )
(n.total)
S9Co
(p.y) (P.n) (P.2n)
(n.y) (n.n,)(P.p') (n.2n)(p,np)
(n.p) (n.np)
(P. a) (p.na )
(n,a) (n.na)
(n,total)
•Psp,•a sp Proton, a -Particle Eiission Spectrin
at 14.8MeV Neutron Energy
246 -

Table 2 Optical model parameters for neutron, proton, and a-particle. The upper n w of posterior parameter: estimated by neutron-induced experimental data and the lower row: pro!jn-induced experimental data are included.
Parameter
Real Potential V a
Imaginary Potential W s "
Real Radius r o
Ioaginary Radius r , "
Neutron
Prior
56.3 [MeV]
13.0 [MeV]
1.17 [fl
1.26 [f-1
Posterior
51.65
53.27
11.05
10.54
1.206
1.177
1.118
1.161
Proton
Prior
49.9
4.20
1.16
1.37
Posterior
47.03
48.20
4.080
4.172
1.161
1.337
1.437
1.149
a -Particle
Prior
193.0
21.0
1.37
1.37
Posterior
189.07
189.01
20.85
20.88
1.489
1.438
1.274
1.302
Volume absorption type for a;-Potential.

JAERI-M 90-025
2 . 0
0 A
• © A
Cu Ni Co Fe MIL
i r - Prior
1 / v
/ v
Posterior 1 Neutron Data Only
Posterior 2 '' GS> \ ^ with Proton Data
- i
52 53 54 55 56 57 58 59 60 61 62 MASS NUMBER
Fig. 1 Level density parameters for Mn, Fe, Co, and Ni. Prior parameters Posterior parameters
(used neutron induced reactions) Posterior parameters
(used neutron and proton induced reactions)
- 248 -

JAER!-M 90-025
0 10 Energy [MeV!
Fig. 2 Comparison of calculated ^°Ni(n,p) reaction cross sections with the experiments data
10 Energy [MeV)
Fig. 3 Comparison of calculated ^Ni(n,a) reaction cross sections with the experimental data
20
- 249 -

JAERI-M 90-025
12 16 Energy [MeVl
Fig. 4 Comparison of calculated ^Co(n,2n) reaction cross sections with the experimental data
10 15 Energy [MeVl
20 25
Fig. 5 Comparison of calculated ^°Ni(p,n) reaction cross sections with the experimental data
- 250-

JAERI-M 90-025
3.7 Measurement of Formation Cross Sections for Short-Lived Nuclei Produced by 14 MeV Neutrons (III)
T. Yamada, A. Osa, M. Shibata, K. Kawade, H. Yamamoto,
T. Katoh, T. Iida* and A. Takahashi*
Department of Nuclear Engineering, Nagoya University
*Department of Nuclear Engineering, Osaka University
Neutron activation cross sections of short-lived nuclei with
half-lives between 0.5 and 20 m have been measured at neutron energy of
13.4 to 14.9 MeV by the activation method for 14 reactions;
26Mg(n,a),(n,n,p), 28Si(n,p), 30Si(n,a),(n,n'p), 37Cl(n,p), 52Cr(n,p),
53Cr(n,p),(n,n'p), 66Zn(n,p), 67Zn(n,n,p), 68Zn(n,p)ln) and
113In(n,2n)m,g.
1. Introduction
Neutron activation cross section data around 14 MeV have become
important from the viewpoint of fusion reactor technology, especially for
calculation on radiation damage, nuclear transmutation, induced activity
and so on.
Cross sections for the reactions leading to short-lived nuclei with
half-lives between 0.5 and 20 m were measured by the activation method.
2. Experiment and results
Experiments were performed at the Intense 14-MeV-Neutron Source
Facility (OKTAVIAN) of Osaka University. For the activation of samples,
pneumatic tubes were set at 6 directions (between 0° and 155°) for the
incident deuteron beam direction. The distances between the T-target and
the irradiation points were 15 cm. The induced activities were measured
with two Ge detectors (12 %, 16 %) at an equivalent distance of 5 cm. The
amount of activities of some positron emitting nuclei which emitted nearly
no gamma-rays was obtained from the intensities of the annihilation
gamma-rays of 511 keV. The annihilation radiations were measured by
-251 -

JAERI-M 90-025
setting the irradiated samples between two 10 mm thick acrylic plates. An
effect due to 6 broadening in the absorber was examined by using the 514 85
keV gamma-ray from Sr. The effect of broadening can be neglected for the
positron energies less than 3 MeV, within the experimental errors of about
1 X. The effective reaction energy of incident neutrons were determined by
the Zr/Nb method. The errors are estimated to be less than 50 keV. The
neutron flux at the sample points was monitored by using two aluminum foils
(purity: 99.2 %, 1 cm x 1 cm x 0.2 mm). The reference reaction for the 27 27
flux measurement was the Al(n,p) Mg(9.46 min) reaction, which was
determined referring to the standard Al(n,a) Na reaction (ENDF/B-V).
Separated isotopes or natural samples were used for irradiation. The
samples were between 30 and 100 mg in weight (size: 1 cm x 1 cm). 2)
In Table 1, measured reactions and associated data of the half-life
(T.,„), the y-ray energy (E ), the absolute intensity in photons per
disintegration (I ) are listed together with the Q values and the
fractional contribution of low energy neutrons (FC) discussed later.
Corrections were made for time fluctuation of the neutron flux,
thickness of samples, self absorption of y~ray, sum-peak effect of y-ray,
interfering reaction and contribution of low energy neutrons below 10 MeV
(FC). The FC was calculated by E E c c FC= I <)>(E.)«a(E.) /{ I <KE.).a(E.)+<|> -O }
„ n i i ». i i x x E.=0 E. l l
where <()(E.) and <h are neutron flux at E. and E , respectively, and a(E.)
and a are cross sections at E. and E . A cut-off energy (E ) was set on
10 MeV. Here we assumed that neutrons above E are nearly monoenergetic
with an energy E . A correction factor (f ) for the FC is given by
f ={l-FC(n,x)}/{l-FC(n,a)}, where FC(n,x) and FC(n,a) are the FCs for the
(n,x) reaction of interest and the standard Al(n,a) Na reaction, 3)
respectively. The details of the corrections are described elsewhere. The total errors (6 ) were derived by combining the experimental error
(6 ) and the error of nuclear data (6 ) in quadratic:
62 = <52 + 62 . t e r
Estimated major sources of the errors are listed in Table 2. When good
counting statistics were achieved, accuracies of the obtained cross
sections were around 5 %. The results are listed in Table 3 and some of
the results are shown in Fig. 1.
- 252 -
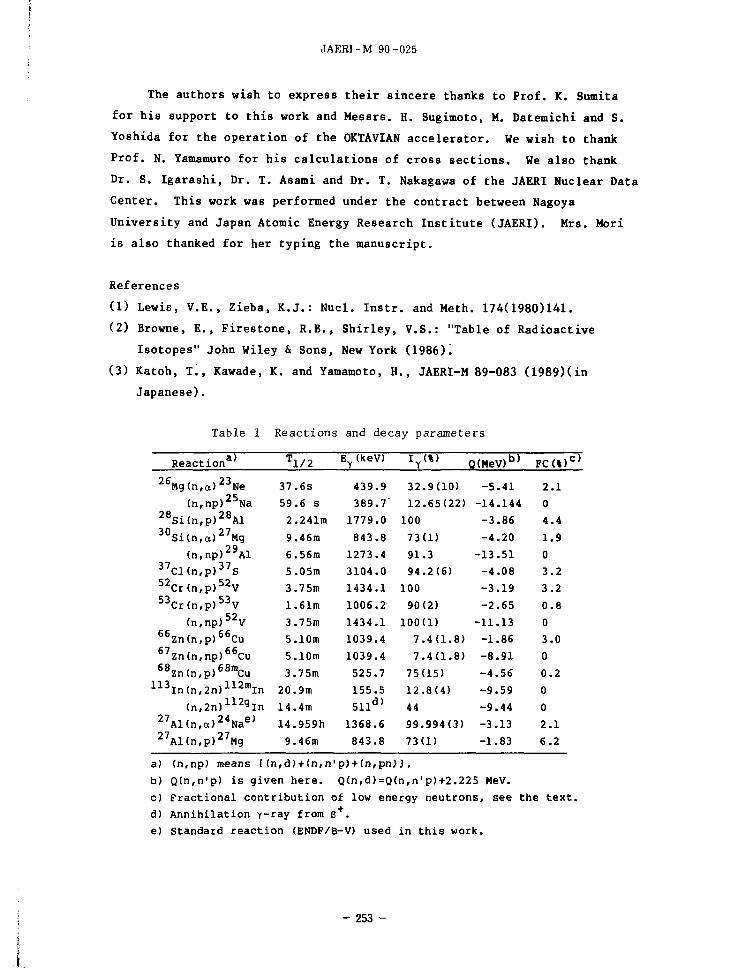
JAERI-M 90-025
The authors wish to express their sincere thanks to Prof. K. Sumita
for his support to this work and Messrs. H. Sugimoto, M. Datemichi and S.
Yoshida for the operation of the OKTAVIAN accelerator. We wish to thank
Prof. N. Yamamuro for his calculations of cross sections. We also thank
Dr. S. Igarashi, Dr. T. Asami and Dr. T. Nakagawa of the JAERI Nuclear Data
Center. This work was performed under the contract between Nagoya
University and Japan Atomic Energy Research Institute (JAERI). Mrs. Mori
is also thanked for her typing the manuscript.
References
(1) Lewis, V.E., Zieba, K.J.: Nucl. Instr. and Meth. 174(1980)141.
(2) Browne, E., Firestone, R.B., Shirley, V.S.: "Table of Radioactive
Isotopes" John Wiley & Sons, New York (1986)'.
(3) Katoh, T., Kawade, K. and Yamamoto, H., JAERI-M 89-083 (1989)(in
Japanese).
Table 1 Reactions and decay parameters
Reaction3
26Mg(n,o)23Ne
(n,np)25Na 28Si(n,p)28Al 30Si(n,a)27Mg
(n,np)29Al 37Cl(n,p)37S 52Cr(n,p)52V 53Cr(n,p)53V
(n,np)52V 66Zn(n,p)66Cu 67Zn(n,np)66Cu 68Zn(n,p)68n,Cu
113In(n,2n)112mIn
(n,2n)112^ln 27.,- \24M,e) Al(n,a) Na 27Al(n,p)27Mg
Tl/2
37.6s
59.6 s
2.241m
9.46m
6.56m
5.05m
3.75m
1.61m
3.75m
5.10m
5.10m
3.75m
20.9m
14.4m
14.959h
9.46m
E (keV)
439.9
389.7"
1779.0
843.8
1273.4
3104.0
1434.1
1006.2
1434.1
1039.4
1039.4
525.7
155.5
511d>
1368.6
843.8
Iy<%)
32.9(10)
12.65(22)
100
73(1)
91.3
94.2(6)
100
90(2)
100(1)
7.4(1.8)
7.4(1.8)
75(15)
12.8(4)
44
99.994(3)
73(1)
Q(MeV)b)
-5.41
-14.144
-3.86
-4.20
-13.51
-4.08
-3.19
-2.65
-11.13
-1.86
-8.91
-4.56
-9.59
-9.44
-3.13
-1.83
FC(%)C)
2.1
0
4.4
1.9
0
3.2
3.2
0.8
0
3.0
0
0.2
0
0
2.1
6.2
a) (n,np) means [(n,d)+(n,n'p)+(n,pn)].
b) Q(n,n'p) is given here. Q(n,d)=Q(n,n'p)+2.225 MeV.
c) Fractional contribution of low energy neutrons, see the text.
d) Annihilation y-ray from B .
e) Standard reaction (ENDF/B-V) used in this work.
- 253-

JAERI-M 90-025
Table 2 Principal sources of uncertainty in the measured cross sections
Experimental error ( e)
Source of error Uncertainty (%)
Counting statistics
Sample mass including purity
Neutron flux fluctuation
Gamma-peak area evaluation
Detector efficiency
Efficiency calibration at 0.5 and 5 cm
Correction for true coincidence sum
Correction for random coincidence sum
Correction for sample thickness
Correction for self-absorption of y-rays
Correction for low energy neutrons
Secondary reference cross section for 27Al(n,p)27Mg
0.5 ~ 40
0.1
<0.1
0.5
1.5(EY2300 keV), 3(300
~ 80 keV), 5(EY<80 keV)
1.0
<0.5
<0.5
0.5
0 ~ 1.0
30% of corrected amount
0.5 (only statistics)
Error of nuclear data (°r)
Source of error Uncertainty (%)
Reference cross section for 27Al(n,a)24Na(ENDF/B-V)
Absolute Y-ray intensity
Half-life
3.0
0-24
0-5
- 254-

JAERt-M 90-025
Table 3 Activation cross-sections
Energy
14.87 MeV 14.64 14.35 14.02 13.70 13.40
Energy
14.87 MeV 14.64 14.35 14.02 13.70 13.40
Energy
14.87 MeV 14.64 14.35 14.02 13.70 13.40
Energy
14.87 MeV 14.64 14.35 14.02 13.70 13.40
^^Mg(n,a)^^Ne
29.7 + 2.3 mb 32.6 i 3.4 32.2 + 3.2 29.2 ± 2.2 26.7 ± 3.4 32.7 ± 2.7
3°Si(n,a)27Mg
63.6 ± 2.6 mb 68.4 ± 3.3 64.3 ± 3.0 60.2 ± 3.1 60.0 + 2.9 66.4 ± 2.7
52cr(n,p)52v
74.4 ± 3.6 mb 73.6 ± 3.5 79.1 ± 3.6 80.4 ± 3.6 78.3 ± 3.7 85.6 ± 3.8
^^Zn(n,p)^^Cu
74 ± 19 mb 70 ± 18 67 ± 17 72 ± 18 62 ± 19 74 ± 18
Energy ^ I n t n ^ n ^ ^ I n
14.87 MeV 14.64 14.35 14.02 13.70 13.40
1.32 ± 0.12 b 1.31 ± 0.09 1.25 ± 0.10 1.19 ± 0.09 1.24 ± 0.10 1.00 ± 0.08
^^Mg(n,n'p)^^Na
3.9 + 1.1 mb 4.2 ± 1.7 3.0 ± 1.5 2.5 ± 1.8
^°Si(n,n'p)^^Al
6.1 + 0.4 mb 5.8 ± 0.7 4.9 ± 0.5 3.8 + 0.5 0.8 + 0.3 0.4 ± 0.2
^^Cr(n,p)^^V
42.8 ± 2.5 mb 45.6 ± 3.2 44.4 ± 3.3 41.2 ± 3.2 44.9 ± 3.6 39.4 ± 2.1
^Zn(n,n'p)^^Cu
35.9 ± 9.1 mb 30.9 ± 8.5 24.9 ± 6.8 19.0 ± 5.0 12.9 ± 4.2 11.5 ± 3.3
^^in(n,2n)^^ln
279 ± 38 mb 293 + 34 275 + 26 297 ± 34 286 ± 29 293 + 31
^^Si(n,p)^^Al
219 ± 12 mb 229 ± 12 229 ± 12 254 ± 13 265 ± 14 254 ± 12
3?Cl(n,p)37s
24.8 + 2.3 mb 22.3 i 2.0 22.4 + 1.9 24.9 ± 3.0 25.9 + 2.8 25.6 + 2.2
33cr(n,n'p)52v
13.2 ± 1.0 mb 9.5 ± 1.2 6.8 ± 1.0 4.9 ± 1.0 3.7 ± 0.9 2.7 ± 0.4
6Szn(n,p)68Mcu
5.5 ± 1.3 mb 4.6 ± 1.0 4.9 ± 1.1 4.2 ± 0.9 4.2 ± 0.9 3.0 ± 0.7
- 255 -
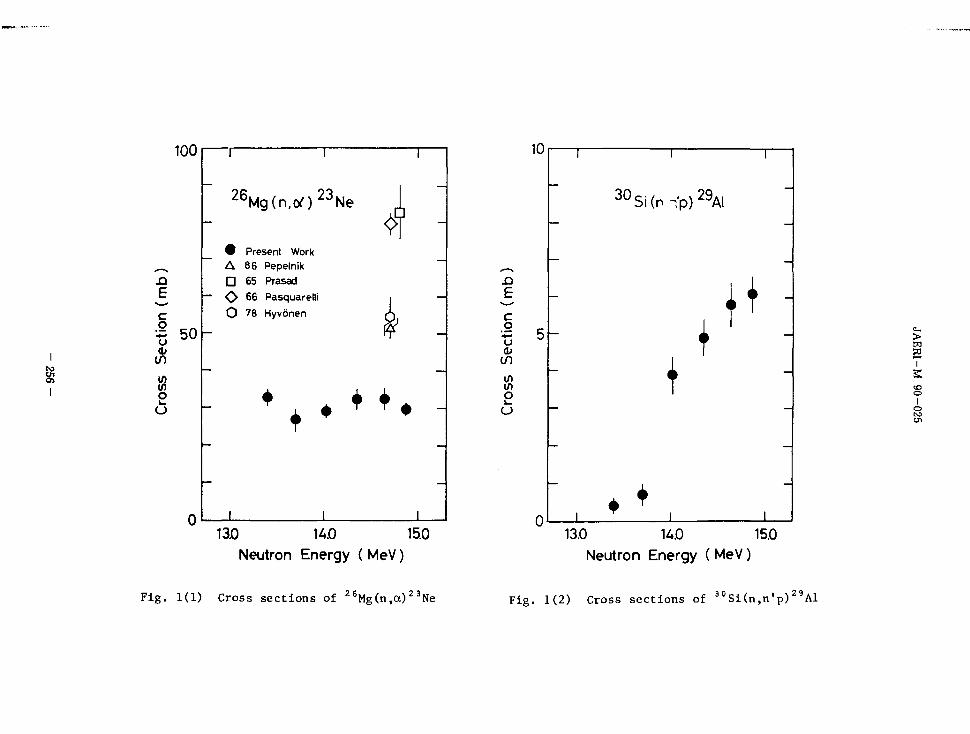
100
5^ en
I 50 h (/)
(/) (/) O
u
0
2 6Mg(n.o02 3Ne
• Present Work A 86 Pepelnik Q 65 Prasad ^ 66 Pasquarelti O ?8 Hyvonen
t + +•
13.0 140 15.0
Neutron Energy ( MeV)
Fig. 1(1) Cross sec t ions of ^6Mg(n,a)z3Ne
10
.a E c
• ! =
</) en o k_
u
1
3 0Si( ,
-
", • •
1 1
•> - 'p) 2 9 Al
1 l
>
s T S
13.0 140 15.0
Neutron Energy ( MeV)
Fig. 1(2) Cross sec t ions of 3 0 Si (n ,n ' p ) 2 9 A1

- J
20
15 h
E
c o
in o u
5h
53Cr(n,n'p)52V
9 Present Work O 68 Webber A 67 Husain D 77 Molla V 84 Ribansky
+ I _L
0 {
_L 130 140 15.0
Neutron Energy ( MeV)
Fig. 1(3) Cross sec t ions of 5 3Cr(n,n*p) V
-O E
c .o u 0; (/) U) (/) O
60
40
u 20
0
67Zn(n.n'p)66Cu
• Present Work • 82 Claim
Yamamuro
_L. _L
> W 2 T S
13.0 140 15.0
Neutron Energy (MeV)
Fig . 1(4) Cross sec t ions of 6 7 Zn(n,n 'p) 6 6 Cu

to C/l oo
10
C
•B 5 u <D
I/) </) «/» O u. U
6 8Zn(n,p)6 8 mCu
• Present Work D 86 Pepelnik A 87 Ghorai
Yamamur
" ^
130 140 15.0
Neutron Energy ( MeV)
Fig . 1(5) Cross sec t ions of 6 8Zn(n,p)6 8 mCu
400
300
.0 E
I 200 <L>
IT)
U)
O
U
100
• Present Work
V 67 Rotzer A 75 Holub O 83 Ryves n 84 Reggoug
Yamamuro
>
ID o I o
to
13.0 14.0 15.0
Neutron Energy ( MeV)
Fig . 1(6) Cross sec t ions of 1l3In(n,2n)l12&In

JAERI-M 90-025
3.8 Measurement of Production Cross Sections of Short-Lived Nuclei by Cyclic Activation Using a Pulsed Neutron Source
Junji Yamamoto, Jun Datemichi, Takeshi Kanaoka
Takuzo Takayama, Akito Takahashi and Kenji Sumita
Department of Nuclear Engineering, Osaka University
2-1 Yamada-oka, Suita 565
Cyclic activation using a pulsed neutron source is a very efficient
technique to measure short-lived radioactivities. The technique has
been utilized for the purpose of elemental analysis. In the present
paper, the potentiality was discussed for application of this technique
to the cross section measurements concerning the production of short
lived radioisotopes by neutron-induced reactions. An advanced system to
measure energy spectra of emission y -rays simultaneously with decays of
the y -rays was tested for the radioisotopes with half lives up to a few
seconds. Some experimental results are presented with respect to the
induced activities with half lives from 20.2 ms to 7.1 s.
1. Introduction
In the measurements of short-lived radioactivities by neutron-
induced reactions, a currently used technique is to detect the activities
after the transfer of samples using such a mechanical system as pneumatic
tubes between a neutron source and a radiation detector. The induced
activities by D-T fusion neutrons are one of the recent interests.<x'>(l'
By means of the current technique, high accuracies have been attained for
the measurements of activities with half lives more than a few seconds.
As for the shorter half lives, fast pneumatic systems have been developed
and cyclic activation has been carried out to compensate low counting
statistics.<3>•t4) In the technique of mechanical sample transfer,
however, the intense neutron sources for the irradiation with high
- 259 -

..'AERI-M 90-025
neutron fluxes are naturally required due to fast decays of radioisotopes
during the sample transfer.
A technique of cyclic activation using a pulsed neutron source*5>
was tested in order to apply to the measurements of production cross
sections for the radioisotopes with half lives up to a few seconds. In
the technique the radiation detector started counting immediately without
the sample transfer after the neutron irradiation. Both of energy
spectra and decays of the y -rays emitted from the sample were measured.
It was necessary to repeat the irradiation and the measurement with short
period of times, since the radioactivity by one neutron burst was not
sufficient in the counting statistics of the detector. At present the
technique is available to only the isotopes that are emitting y -rays.
The outline of the experimental procedure and some of the results are
mentioned in the following sections.
2. Experimental procedure and apparatus
The neutron source was an accelerator which generated 14 MeV
neutrons at a TiT target bombarded with a D* beam. The duration of a
neutron burst(Ti) and the period between the bursts(T) were controlled by
making the D* beam pulsed. Taking account of the induced activities
with the half lives from 1 is to 10 s, we designed a beam controller so
as to change continuously Ti and T from 0.3 ms to 54.3 m and 0.6 ms to
108.6 m, respectively. The controller was interlocked with the system
of counting the induced activities, so that Ti and T as well as counting
period(Tm) could be precisely determined and repeated. In Fig.2 that
shows the electronics block diagram, a unit of "Timer for pulsed beam"
corresponds to the controller.
Figure 1 illustrates the experimental arrangement. The induced
activities were measured with a Ge detector, which was located at a
distance of 75 cm from th» sample. The detector was fairly well
shielded against the direct neutrons from the source by making use of
iron, concrete, polyethylene, lead and so on. A distance between the
source and the sample was 15 cm. The samples were either disks or
hollow cylinders; the size was 45 mm in diameter and 2 mm in thickness
for the disk and 30 mm in outer diameter, 1 mm in thickness and 70 mm in
length for the hollow cylinder. As shown in Fig.2 Tm was divided into
\
- 260 -

JAERI-M 90-025
several sub-periods for the decay measurements and pulse height
spectra(PHS's) were recorded in the respective segments. The counting
duration for one segment could be chosen within the range from 1 ms to
900 s. Irradiating the sample and counting the activity were repeated
in the same way and the PHS data were added in each segment to the
previous ones until the statistical accuracies of the observed y -rays
became sufficient.
3. Results and discussion
Figure 3 shows the PHS's of y -rays produced in l6N by lsO(n,p)
reaction. The 6.13 and 7.12 MeV y -rays, the emission probabilities of
which are 68.8 and 5.0 %, respectively, decayed with the half life of
7.13 s. Due to the low counting statistics, only the 6.13 MeV y -rays
were sharply observable in the PHS's measured with the interval of 1 s.
Ti and T were respectively 20 and 93 s, and the number of cyclic
activation was 330. The decay curve of the 6.13 MeV y -rays is shown in
Fig.4, where the experimental data are fitted with a solid line by the
least squares method. With the y -ray energy and the half life we could
confirm the radioisotope to be measured. The result for the shorter
half life can be seen in Figs.5 and 6. The 472 keV y -rays with the
half life of 20.2 ms are the transition in the isomer of 24Na by 27Al(n,a
) reaction. Ti, T and the number of repetition were 80, 285 ms and
100,000, respectively.
Table 1 lists the production cross sections of 207"Pb. The
probable reactions are 208Pb(n,2n) and 207Pb(n,n') due to the use of
natural lead as the sample. The half life is 0.81 s and the energies of
emission y -rays are 1.064 and 0.57 MeV which are the transitions from
1.633 MeV excitation to ground state via 0.57 MeV excitation. The two
values, that were obtained from two measurements using the different
samples and the different modes of pulsed neutrons, were compared with
the previous results'6>,(7). Since natural lead was also used for the y
-ray shielding around the detector, a large source of error resulted from
the background y -rays with the same energies as those of y -rays from
the lead sample. In the case I the cyclic rate was extremely low, so
that the large error was attributed to the poor counting statistics.
The advantages of the present method are:
-261 -

JAERI-M 90-025
(l)High accuracies can he attained with regard to the periods of the
irradiation and the measurement because the cyclic activation is
made electrically rather than mechanically.
(2}A low-output source of pulsed neutrons is available.
(3(Due to a long distance between the sample and the detector, the
uncertainty of solid angle is small in estimating a detector
efficiency and it is expected at the detector to reduce pileup signals
of the y -rays from the sample.
(4)Neutron energy spectrum of the irradiating source can be analyzed by
means of a TOF technique using the pulsed neutrons.
The shortcomings are as follows.
(1IBackground level is high due to the activation of the detector and
the shield.
(2IBackground run is necessary without the samples. The same condition
of neutron source as that in the foreground run is required, so that
the conditioning is important with respect to the stability and the
reproduct-lvity of the pulsed neutrons.
(3)The background y-rays, that are induced by the neutrons scattered at
the sample, cannot be eliminated.
(4)The massive samples are necessary.
4. Concluding remarks
The potentiality of cyclic activation using a pulsed neutron source
was investigated for the application to the cross section measurements of
short-lived radioisotopes. The present technique was confirmed to be
applicable to the half lives from 20.2 ms to 7.1 s. In the calculations
of detector responses for counting the activities, it was estimated that
the responses of the cyclic activation for the half lives up to 5 s were
greater than those of the conventional technique using the intense
neutron sources.
- 262 -

JAERI-M 90-025
References:
(1) Katoh.T., Kawade,K. and Yamamoto,H.:"Measurement of Activation
Cross Sections", JAERI-M 89-083 (1989).
(2) Ikeda,Y., Konno.C, Nakamura,T., Oishi,K., Kawade,K., Yamamoto,H.
and Katoh,T.:"Systematic Measurement of Neutron Activation Cross
Section at Energy Range from 13.3 to 15.0 MeV Using FNS Facility".
Proc. the Int'l Conf. on Nuclear Data for Science and Technology,
JAERI, 257(1989).
(3) Pepelnik.R., Anders,B. and Banal,B.M.:"Measurements of 14 MeV
Neutron Activation Cross Sections", Proc. the Int'l Conf. on
Nuclear Data for Basic and Applied Science, vol.1, 221(Santa Fe,
New Mexico, 1985).
(4) Amemiya,S., Itoh,M., Kawade,K., Yamamoto,H. and Katoh,T.: J. Nucl.
Sci. Technol., 11(9), 395(1974).
(5) Givens.W.W., Mills,Jr.W.R. and Caldwell,R.L.:"Activation Analysis
Using a Pulsed Neutron Source and Cyclic counting", Pacific Conf.
Chemistry and Spectroscopy(ACS, Anaheim, California, 1967).
(6) Amemiya,S., Bhoraskar,V.N., Katoh,K. andKatoh,T.: J. Nucl. Sci.
Technol., 18(5), 323(1981).
(7) Janczyszyn,L. and Gorski.L.: J. Radioanal. Chem., 14, 201(1973).
- 263 -

JAERI-M 90-025
Table 1 P r o d u c t i o n c r o s s s e c t i o n s of 2 0 7 m P b
T Ti Tw Tin
s a m p l e
cross section
1 3 . 2 s 3 . 0 0 . 2 0 . 8
45-jnra ^ 2-mm t h i c k
1 0 1 0 ± 520 rab
500ns 3
400 68
O.D- 30-mm, L. 70-mm 1.D- 28-mm 8 6 0 ± 55 mb
previous results 9 3 0 ± 80 m b ( 6 )
4 8 0 ± 70 mb (7 )
Paraffin Concrete
X M
~GpZJ2 &
fron m t m K
« w *
www^ ^MTTT. m * a K X V
* * r * * * v x v v r if
k 75cm
Neutron source
y USE
15cm
Sample
beam
a ^ Monitor "* (NE213)
Fig. 1 Experimental arrangement
- 264
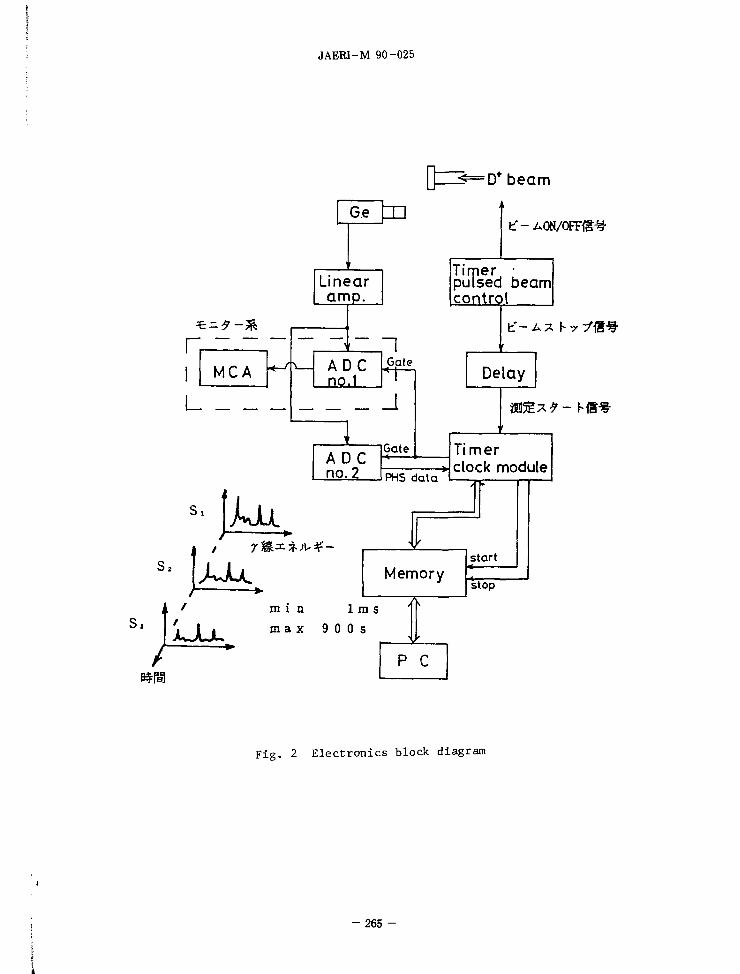
JAERI-M 90-025
* - * - 3 %
M C A
L
S i klL
\t G.e X !
D* beam
Linear amp.
Timer • pulsed beam control
ADC no.1
Gale
J
ADC no. 2
Gate
£-j>a hv/fe^
Delay
PHS data
a c e * * - hfi-sg-
Timer clock module
I
s, xJUu m i n 1 m s m a x 9 0 0 s
Memory
— f t
start
stop
B$ISI
LL P C
Fig. 2 Electronics block diagram
-265 -

JAERI-M 90-025
L
d
I
• - • " • - -
v J I V I
-J
< •S
.E.
>-
f
.""" ." . _ l ~ " * . " \ .
6.13
MeV
I " " "
-U. 256 512
Channel number
nn
10
r i
xnl
d'
/
i / . . . _
i
S,(7~8s)
t " *
• ' •6
.13
MeV
. 1 •
— » - * . 256 512
Channel number 768
768
Fig . 3 Pulse height spec t ra of Y-rays from sample of water
2.0 4.0 6.0 Time (sec)
1 6 . Fig . 4 Decay of 6.13 MeV Y-rays emitted from ioN
- 266 -

JAERI-M 90-025
SINT( 0 - 8 O m s )
IT • < • — • - . — • • » - . - » v * * . .
* t
u5 in 00
co en o
m 15 CURSOR CHANNEL 271 < 472. 81kaV) COUNT 2215 526
F i g . 5 P u l s e h e i g h t spec t rum of y - r a y s from aluminum sample
7x10'
c <u E 0) I/)
o u
a OL
1 1 1 1 1
^ \ f^N.. ^M
S s /'v r
I T , / i = 2 0 . 3 m s C 2 4%)
1 1 1 1 1
1
4 ^ v ^ i
1
1 -
-
-
__ i ™
^ \ :
i 20 £0 60
T i m e ( m s )
F i g . 6 Decay of 472 keV y - r a y s i n Z 7 A l ( n , a r Na a c t i v i t y
267 -
J

JAERI-M 90-025
3.9 Secondary Charged Particle Spectrometer Based on Two-Dimensional E-TOF Analysis
Seiji Ogino and Akito Takahashi
Department of Nuclear Engineering, Osaka University
This paper shows a spectrometer technique to measure
energy spectral data for neutron-induced secondary
charged particles -i-e, proton and alpha-particle, e t c -
by analyzing energy (E) and time-of-f1ight(TOF) of
charged particles in the two-dimensional E-TOF domain-
Major problem in the measurement is how to decrease the
backgrounds caused by neutron-induced charged particles
and gamma-rays produced in the detector itself and from
surrounding structural materials of the spectroieter.
By reducing these backgrounds, energy spectra of neutron-
induced secondary charged particles could be measured.
INTRODUCTION
Energy spectral data for neutron-induced secondary charged
particles are basic nuclear data for the estimation of the damage and
nuclear heating in materials under high fluence fast neutron fields-
In general, the measurement of secondary charged particle spectrum is
difficult, and experimental data are therefore scarce. lost of the
available data have been measured with a quadrupole spectroieter
based on the E - A E analysis 1'- With this spectrometer intense neutron-
source and complicated technique are required to attain sufficient
energy resolution and particle separation - New spectrometer
techniques based on other principles are therefore expected.
The spectrometer based on two-dimensional E-TOF analysis is one of the
- 2 6 8 -

JAERI-M 90-025
expected techniques to measure neutron-induced secondary charged
part icles-
EXPERIMENT
Between the secondary charged particle energy(E) and the time-of-
flight(TOF), we have the following relation
T=L M/2E
where H and E are the mass and the energy of secondary charged
particle, and T and L are the time-of-flight and the length between
a sample and a detector. Two-dimensional E-TOF distribution of charged
particles are shown in Fig. 1- If the spectrometer has sufficient
energy resolution, good time resolution, enough counting rate and no
backgrounds, we can detect the charged particles on the curved lines
in Fig-1. Actually, the separation of charged particles becomes
difficult due to insufficiencies of energy resolution, time
resolution, and counting rate-
Some of backgrounds may pile up on the curved lines. In other
words, one of merits of the two-dimensional analysis is due to the
fact that the background counts out of" the curved lines can be
automatically rejected.
After the separation of charged particles , we can obtain the
energy spectrum data by integrating proper counts along the TOF-axis
or the E(pulse height)-axis.
The block diagram of the measuring system is shown in Fig.2-
The system measures energy(E) and time-of-f1ight(TOF) gated with two
parallel pulse shape discrimination circuits-
Schematic view of the E-TOF experiment is shown in Fig.3.
Shielding materials and a charged particle detector are arranged in a
l m 0 X lm long vacuum vessel. An aluminum sample with 15 ft m thick X
7cm diam- was used- A CsI(Tl) scintillator with 2mm thick X 5cm diam.
was used for the charged particle detector. An NE102 plastic
scintillator was used for test runs; in this case the pulse shape
discrimination was impossible, so that the NE102 plastic scintillator
was unsuitablefor charged particle detector in the field of relatively
high level gamma-rays field.
The flight path between the sample and the detector was 5 3 C B -
- 269-

JAERI-M 90-025
Major problem in the measurement is how to decrease the back
grounds caused by neutron-induced charged particles and gamma-rays
produced in the detector itself and from surrounding structural
materials of the spectrometer-
Reduction of the gamma-ray background was successfully achieved
by the pulse shape discrimination technique by analyzing rise-time(RT)
distributions of signals induced by charged particles and gamma-rays-
The results for two-dimensional energy<E)-rise time(RT) distributions
before and after separating gamma-rays are shown in Fig- 4 and Fig- 5-
These results show drastic reduction of gamma-rays-origined
backgrounds.
Reduction of the charged particle background can be achieved by
setting the detector as far from the neutron-source as possible and
by using the shadow bar shield between the neutron source and the
detector; however. • J arrangement also reduces the solid angle for
detecting charged particles from the sample- In order to seek an
optimum set of mixed materials and their arrengement. many background
runs have been tried. The two-dimensional RT-TOF analyses have been
also used for the optimization.
These results show that the reduction of backgrounds with the
iron + lead shielding set was optimum-
RESULT AND DISCUSSION
An example of measured results of two-dimensional E-TOF
distribution is shown in Fig- 6. where ® . a straight line, shows
signals induced by direct 14MeV neutrons. ® shows a curve of signals
induced by protons and ® shows a curve of signals induced by alpha
particles- Further reduction of back grounds is required to measure
clearly the alpha p^.ticle trajectory curve-
Rejecting proton-signals by the pulse shape discrimination, the
measurement for a -particles was made, and the measured result (fore
ground) is shown in Fig- 7-
Signals induced by direct 14MeV neutrons ® , a curve of signals
by the 27Al(n, « ) alpha-particles ® and a curve of signals by
neutron-induced alpha-particles at the vacuum wall (D are shown in
Fig- 7- These results show that the rejection of proton signals is
- 270-

JAERI-M 90-025
necessary to measure clearly the alpha-particle trajectory curve-
Proton energy spectrum from the Al(n.xp) reaction deduced froi
the TOF channel (integrated along the pulse height axis) is shown in
Fig. 8 compared with the Grimes' experiment21; the present result gives
a harder spectrum-
Proton energy spectrum from the Al(n,xp) reaction obtained fron
the pulse height channel (integrated along the TOF axis) is shown in
Fig. 9 compared with the Grimes' experiment ; the present result gives
a relatively good agreement, though slight difference exist- Maybe,
short flight path and insufficient energy resolution caused the
difference between the two spectra- We can say that the energy
spectrum data obtained from the pulse height channel was better than
that deduced from the TOF channel.
Alpha-particle energy spectrum( fore-grounds) from the AKn.xtf )
reaction deduced from the TOF channel is shown in Fig- 10 compared with
the Grimes'experiment. The present a -spectrum is harder than that of
Grimes-
CONCLUSION
In order to measure energy spectrum data for neutron-induced
secondary charged particles • a new type spectrometer based on the
two-dimensional E-TOF analysis has been tested- Major problem of
reducing backgrounds was almost solved by the pulse shape
discrimination technique after many background test runs- The present
system can be applied to measure cross sections and spectra of
secondary charged particles, calibrating with the recoil proton peaks
in the E-TOF domain by the elastic scatterings of hydrogen in a thin
polyethylene sample at various angles between the incident and the
particle-out-going directions-
Reference
1) Grimes. S-M-, et al.;Phys- Rev-. Cl_7 508 (1978)
2) Grimes.S-M-,et al.:NSE:62.187-194(1977)
- 271 -
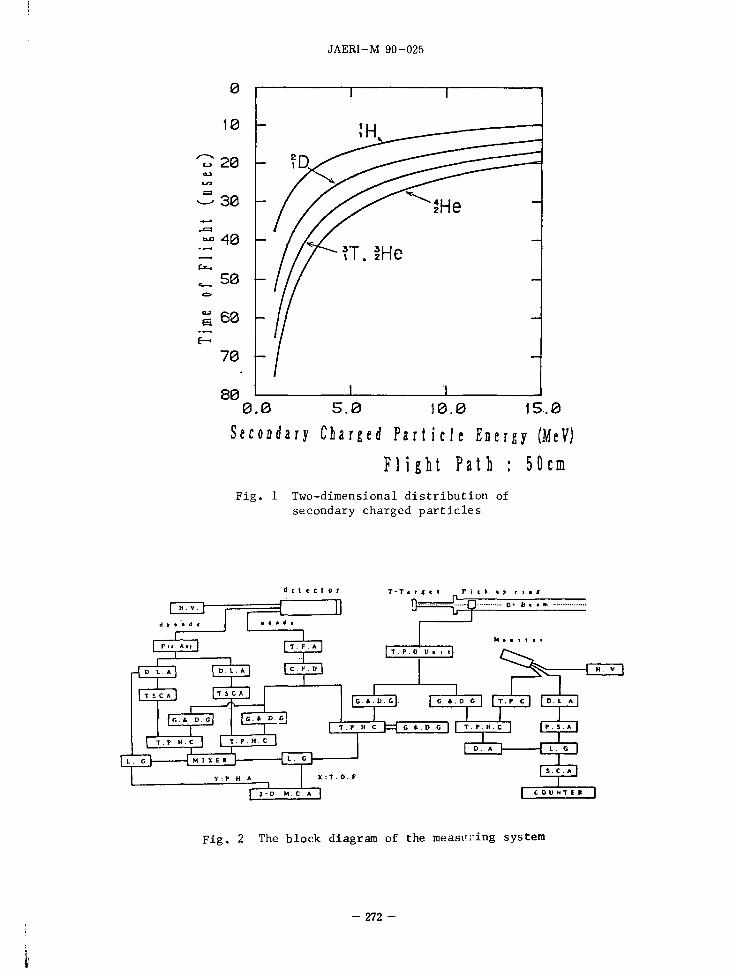
JAERI-M 90-025
0.0 5.0 10.0 15,0
S e c o n d a r y Charged P a r t i c l e E n e r g y (MeV)
F l i g h t P a t h : 5 0 c m
Fig. 1 Two-dimensional distribution of secondary charged particles
d e t e c t o r T - T i r | t I P i c k « ? r i • f
? rmri
M i • i I i
T . P. 0 U » i i
I - ] | c . r . D |
T S C A | I T S C * |
| C * D C | | c . * p - c |
^ = •CEJ3
| C 1 D. c"|. |~C I H C | | T , r C I I D I A
T . P M. C I I T . P. H . C
I T, T H C £ ^ ~ C t D C I I T P H. C
-E~D D l~y)
2 - D M C A , ^1 , | C O U N T E R |
Fig. 2 The block diagram of the measuring system
272

v a c u u m v e s s e l
® n e u t r o n s o u r c
X shi e l d : P b Fe p o l y e t h y l e n e
£ s h i e 1 d ; P b
Fig . 3 Schematic view of E-TOF experiment
C o u n t s ( i n a r b i t r a r y u n i t )
< 1 . D - 1 . 0 - 2 . 0 - 3 . 0 - 4 . 0 - 5 . 0 * > 5 . 0
<D
Q
• • •
"\ :::. ) ...
.'.'.
. . .
. ; . .
. . . . .
llii
: : . . • : : : . ; : :
",!£&'•' :: :;?!::::• (3) .. l...m.i. v a /
.*:!::*:.
:. ; : :::::::!••;:: : : . : • :
fe=!i!!!!!!!!!!!ilililil •^l!!!!!!!!! : : : : : : : : : :
0 30 6 0 1 2 0
> H 2 7 2 ID
o I o
t\3
Fig. 4 Two-dimensional energy (E) - rise time (RT) distribution for charged particles and gamma rays: (T) shows alpha-particles, (2) protons, and (3) gamma rays

I
JAERI-M 90-025
o to
o IT)
9" ^r o <-o o+ -rOjE
en
o x C\J
d ) to . -3
oQ-
o
> OJ 8 Q) dj 41 "
rH S rH 3
for
samp
t 14
artic
27A1(
. H O P . 3 < OI 1 «
•H (J -H X ! 4J
3 U-. H H •H - JS X I P tn 4-i "O 3 4_j oi 3 to tn i—I «] to
•H o 3 <n T3 -H O M 3
f i C o tu U tn O 4J O tfl 4-> O
i a x i ^ ^ P"
,-H 00 • • X I P . 18 VJ > 01 « e cd o> O 3 o x: 2 3 ^
• H O X I r j tn < t s < 3 t ^ i - i • ' " l r -1) h II I N B (0 3
•H 13 W O OI X I 3 *-" - B
i o x: y *-" O O 4-1 3 ^ - x 3 a) -H a j M
H tn 3 3 ^ - ^
tn 01
i- i u
•H u
o. I
tO X !
alp
O O O O O o < CD tO <0- rO CVJ -^
[ iauuou.0 / 09su2i/9'o ] IBUUOLJO j o i 60 •H
::;:•:
I fSRSff**:
• >•» • • » • « • • • » • • * • • • • • • • • « • • " * * " * * * *iV*a * *
s ot o e 02 o i a D D t n o i q 8 J 3H 3 s [ n J
H -H « M
^ CI 01
41 -H B x i
• H 4-> 01
1J-I
o 3 o • H
a 4J ai to tn x l
• r l 01 M
OI 1 tn
T-t / - v 3
O 3
X ) 01 M
4-1 to
w a x : N—'
OI > s X l 60 4-> iJ OI M 3 0) 01 4J
<w CO (0 3 O 3
•H O 01 -H 3 4-> OI 3 B .a
•H - H X I U
1 4J O 0) 3 - H
H X )
4-1
tn 3 O
x: 0)
0] •H
x: 4-1
• •
3 O
• H 4J <d 3
f - l
e
• X ! OI
> 01 •H X I
o « OI
X I
X I i-H 3 o o tn
>•. to )-i
to H i 50
60 • H
2 7 4 -
i

JAERI-M 90-025
<S rrrr 1 ' ' I 1 1 i i i i I I | M I I I I I — I | l l l l l I I i -\ (£)
m i l i. -i—i—i Inn i i i—i Ini i i i ' i l un i i i i
Q
( 1 i nn l i i M ! ! " D ! ) ii
'<S
0 I 1 3 3 S S S O J 3 | M ] B3 J 3 J J ! (J i S I J I J
i v
<3
(3
X I 4J
a x c '—' <
T3 *J G C « o> o E ^ i n
•rt tn r-» J-i U «) H U o. o 0)
o
to
> oi
2 <u a) t o
0) O II I - w C a. w 01 01 xi c <-> a
to XI
. . r j
60 U 0)
a Ol
C o
4-1
o OH
O • c * Pi,
•u d to •
> 0) C
r - l 0) II CO
C CO W X I
c Ol e
•rt U 01 (X /—\ X CO 01 01
rH - 60
CO C 0 1 CO S - H
• H w ^ 4-1
60 •H I n
lauuoLio / oasu2t79"0 ] lauuoijo j o i
o OJ
o u>
n r
o rO
< > CM
o
o
Ol M o
*w^
c o •H 4J 3
X I •rt U U CO
•rt -0
U. O
E-T
i-H CO
c o
•H cn C 01 3
•H
1 0
s H
60 •rt
CM f j 3
cn -a 01 01
• - i >-i u 'H QJ 4J «3 1-1 4J CO C M 1 <u
CO 4 J X I 14-| a. co
i-H cO > •
u rt < •
cond
E
n=
l
01 cn x l
4J
o a •4-1 *
01 ^ i H w o. "2 s s « 3 cn o H i-H 60 <J
X
cn > i CO M
C
o
CO CO 60 C
•rt •o a C -rt CO H
CJ co co C -H O TJ 4J O 0)
a co X!
u-i en o
01 C co O rH
•rt 3 4-i a.
- 275 -

to -J en
0.0 4.0 8.0 12.0
P r o t o a E D e r g y ( M e V )
16.0
Fig. 9 Proton energy spectra from 27Al(n,xp) with E„«14 MeV at 90°: the present experiment based on pulse height channel (open circles) and Grimes' experiment for En-15 MeV at 75° (triangles)
0
~ 10'
10
10
-?
10
A 1 ( ii , x fl ) 1 A A A
A * ' J ,
- t
i
<&* it
A +
JL
> w 2 T 3 CO
o I
0.0 4.0 8.0 32.0 16.0
AlpSa Particle Energy ( M e V )
Fig. 10 Alpha-particle energy spectra from 27Al(n,xa) with En-14 MeV at 90°: the present experiment (fore grounds) based on T.O.F. channel (open circles) and Grimes' experiment for En*=15 MeV (triangles)

JAERI-M 90-025
3.10 Average Cross Section Measurement for Several Dosimetry Reactions in Thick Target Li(d,n) Neutron Field
J.R. Duiais, S. Tanaka, N. Odano, S. Iwasaki and
K. Sugiyaaa
Department of Nuclear Engineering Tohoku University
Aramaki-Aoba, Aoba-Ku, Sendai 980 Japan
Abstract: Average cross sections have been measured for several dosimetry reactions by means of activation method in thick target Li(d,n) neutron field which had continuous energy spectrum ranging from a few hundred KeV to 18 MeV. The aim of this study is to verify cross section data of the recently evaluated JENDL-3 and the IRDF-82 dosimetry files by comparison of the calculated average cross sections with the experimental ones. Standard deviations in both values were estimated on the basis of the variance-covariance analysis. Absolute value of the neutron flux was normalized at 14 MeV by measurement of the reaction rate of the 2'Al(n,a) ^Na standard reaction in the T+d neutron field with the same arrangement. The results sh"ow that the calculated average cross sections using the above evaluated values are consistent with the experimental values, except for * Ni (n, 2n) ' Ni reaction.
(Average Cross Section, Thick Lithium Target, Integral Measurement, 'Al(n,a) Na, Activation)
Introduction
Verification for cross section data of neutron nuclear reactions can be done by two types of method of experiment, those are the differential and integral measurements. The differential measurement using neutrons of a monochromatic energy in order to check the cross section at the specific energy point. By this method, many times of experiments are required for comparing with an evaluated cross section data over the wide range of neutron energy. An alternative of this method is the integral measurement, where average cross section is obtained for a certain range of the neutron energy.
As well known, the fission neutrons from reactor and Cf-252 are often used for the integral measurement, but for these neutron energy spectra, the neutron fluence in high energy is rather weak. Such integral experiments are not suitable for reliable verification of cross section data on reactions with high threshold energies. Requirement for the reliable nuclear
-277-

JAERI-M 90-025
reaction cross section is increasing in the fields of application of activation de.tector dosimetry on fast reactors and proposed fusion reactor' '. Some integral measurements were done by utilizing acc.e le T& t o r neutrons, which produced rather high energy neutrons'2'' ' ' .
In the present experiment, a U. 5 MV Dynamitron accelerator of Tohoku University had been used for cross section measurements with the activation technique.
Experimental Procedures
Intense neutrons with were produced of the tar
2 MeV. The by bombardin
energy f g thick
deuteron beam curren lithium target was 1 mm, which
get was fabricated from a copper disk for
the
the presen The proce
following
in the vacuum t experiment
lithium
'rom few hund lithium targ t was 10 uA. was meti
environmer; is shown in
(dure of present irradiat two items:
called a.1 melted
red K. et wi The thick and
;. Experimental Fig.1. ion exper iment
eV to 18 MeV th deuterons thickness target.
flattened
of The on
arrangement
consists of
1. Irradiation with the Li+d neutron source. Five kinds of samples, Al, Ti, Fe, Ni and Co, were placed at 50 mm from neutron source. Irradiation of two runs, 10 and 24 hours were performed according to the half lives of residual nuclei of the reactions.
2. Irradiation with the T+d neutron source. This irradiation was used for normalization of the Li + d neutron fluence, and was done with the same experimental arrangement to the above. The samples of Al, Zr and Nb were irradiated for 15 hours.
Each of the irradiated samples has 19 mm in diameter and 0.1 - 0.3 mm in thickness. Energy spectra of the neutron sources were determined with a technique using time of flight. Two kinds of NE-213 scintillation counters (2"x2" and 1"x1") were used as the main detector and the monitor, respectively.
Activities of the irradiated samples were measured using gamma ray counting method with a 80 cc HP- Germanium detector
Neutron Spectrum Determination
To obtain the neutron spectrum, it is important to know the efficiency of NE-213 scintillation, counter. The spontaneous fission neutrons from.a Cf-252 source^' and a Monte Carlo calcu-lational code, 05S**' were utilized to determine the relative neutron detection efficiency. By using Cf-252, the neutron spectrum with energy range from few hundred KeV to 6 MeV was measured using T0F technique for detected neutrons and fission gamma rays. The neutron energy from 6 MeV to 18 MeV, the 05S code was utilized with the Compton edge of 1.275 MeV gamma ray from Na-22 used as basic standard of pulse height output. The relative efficiency curve from the calculation code was normalized in the energy range from 4- to 6 MeV with the efficiency curve from the
- 278 -

JAERI-M 90-025
>lute efficiency was obtained ection of the 27Al(n,a)2'iNa
Cf-252 neutron measurement. The abso] from measured value of the cross sec reaction, which is the standard cross section with high reliabil-
15 M e V ^ ' . rphe c r o s s section data of •as taken from INDC-NSF'80 (Vonach et. 'gy spectrum is shown in Fig.2.
ity in energy range 1U -* 'Al (n.a) *Na reaction WE al.)*''. The neutron enere
Error Analysis
Average cross section values can be determined using the following equations:
Calculated value (C-value):
< O > c = X <p i o i A Ej 2 * i A Ei
Experimental value (E-value):
< a > E = R
where. < o > = average cross section 4> = neutron fluence a = cross section (taken from JENDL-3/IRDF-82)
A E = energy interval R = measured reaction rate i = number of group.
( 1 )
( 2 )
Propagation of error on the average cross section were done using variance-covariance analysis which is based on reference (8). Error on the calculated average cross section is derived from Eq.1, and can be written as
V a r < o > = (S
where,
C4
T
0 ) T
) T 0 ( S, '• E*) +
( s 0 • r 0 ) ( 3 )
S 0 and S 0
E« a n d Eo and CL
sensitivity of average cross section on neutron fluence and cross section, respectively error of neutron fluence and cross section
correlation matrix of neutron fluence and cross section, respectively transposed matrix.
Error on the experimental value can be derived from Eq.2, which depends on error of reaction rate and neutron fluence. Covariance data for .cross sections were taken from dosimetry files, e.g. JENDL-3*9' and IRDF-82. Error of reaction rate was derived from the activity measurement of the sample. Error on the neutron fluence was derived from:
- Statistical error - neutron energy on the TOF measurement
- 279-

JAERI-M 90 -095
efficiency of neutron detector error on normalizing by 'Al(n,oti :) ^Na reaction rate
In this experiment, the neutron fluence was calculated as
• ( E ) = N ( E ) / ( E ) ( 4 )
Covariance determined as
groups
no correlation
and j u" group of the neutron fluence was
M * i j =
where.
5 + +
M 0 <t> 8 N N M e E
M E i. j
u * i * i ( 6 N / N ) !• ( 5 N / N ) j < / > i # j - M C i j / ( E i • E j )
(0 <!> / d ! • ) • • (<?<*>/ 0 li) j • Mlii ( 5 )
covariance matrix of the neutron fluence the neutron fluence error of neutron counting on TOF spectrum neutron counting on TOF spectrum covariance matrix of efficiency efficiency of iimtron detector covariance matrix of neutron energy
= I group and j " group S i j if i = .)
if i * j
Experimental Results
The ratios of calculation to experiment result for average cross section and its uncertainties are given in table 1 and table 2, according to the result on JENDL-3 and IRDF-82 dosimetry files, respectively. Fig.3 shows the C/E values based on table 1 and table 2.
The result of this study can be summarized as follows: - W i t h respect to the low threshold energy reaction, i.e., •* Ni (n, p) -* Co, the experimental average cross section consistent with the calculated ones. The discrepancies are 4% and 1X for JENDL-3 and IRDF-82, respectively. - Middle threshold energy (around 5 MelA) reaction group, 27Al(n,a)2/iNa, i8Ti ( n,p)'i8Sc and 56Fe ( n , p ) 56Mn show consistent results with small discrepancies from 3 to 9%.
As for two (n,2n) reactions with high threshold energies, the result for •,'Co(n,2n)-' Co reaction is satisfactory with the dis-
.of 2% for IRDF-82 and 3% for JENDL-3, while for the reaction the calculated shows lower value relative
to the experimental value by 12% for JENDL-3 and by 22Z for
crepancies of 58Ni(n,2n)57Ni
-280-

JAERt-M 90-025
IRDF-82. These large discrepancies comparing to those of other reactions ranging from 1 to 9%, are suggested that the cross section data of this reaction from the new JENDL-3 file is still lower than the expected vnltte.
Reference:
1) G. Winkler et.nl.: Pruc. International Conf. on Nuclear Data for Sci. and Tech., Antwerp, p.AOO, ECSC, EEC, EAEC (Brussel and Luxemburg 1983).
2) L.R. Greenwood et.nl.: Nuclear Technology, ^j_ p.109 (1978). 3) Y. Uwamino et.al.: Fall Meeting of The Atomic Energy Society
of Japan, p.199-201 (1986). 4) W. Mannhart, IAEA-TECDOC-^tO, p.158 (1987). 5) R.E. Textor and V.V. Vcrb1nnkj:"05S Monte Carlo Code", ORNL-
4160, OakRidge National Laboratory (1968). 6) Y. Ikeda et.al.: Fall Meeting of The Atomic Energy Society of
Japan, p.258 (1987). 7) H. Vonach et.al., INDC-36/LN, Nuclear Standards File, Ver
sion '80 (1981). 8) D. L. Smith : Report ANL-NDM/62 (19S1).
9) JAERI Nuclear Data Center : "JENDL-3", Private Communication (1989).
10) A. Crametz et.al.: Proc. International Conf. on Nuclear Data for Sci. and Tech., Antwerp, p.902, ECSC, EEC, EAEC (Brussel and Luxemburg 1983).
- 281 -

JAERI-M 90-025
Table 1 Results for average cross sec t ions from the measured and the ca lcu la ted values using JENDL-3
REACTION
2 7 A 1 (n. a ) '"Na 4 8 T i (n.p ) 4 8Sc 5 6 F e (n.p ) 6 6Mn 5 8Ni (n.p ) 5 8Co 5 8Ni (n.2n) 5 7Ni 5 9 C o ( n . 2 n ) 5 8 C o
CALC. (JENDL-3)
< a > c (barn)
2.24x10"' 1.07x10"' 2.05x10"' 1.55x10" l
2 . 9 5 x 1 0 "3
8.99x10"'
ERROR ( % )
6. 3 13. 1 5. 0 6. 5
19. 0 11.0
E X P E R I M E N T
< a > E (barn)
2. 1 1 x 1 0 " ' 1 . 0 4 x 1 0 " ' 2. 1 4 x 1 0 " ' 1 . 6 2 x 1 0 " ' 3 . 3 7 x l 0 " 3
9 . 3 0 x 1 0 " '
ERROR
( % )
7.2 6. 5 7.4 7. 1 7. 9 7.8
C / E and
(% ERROR)
1.06 (9.6) 1. 03(14.6) 0.96 (8.9) 0.96 (9.6) 0.88 (20.6) 0.97 (13.5)
Table 2 Results for average cross sections from the measured and the calculated values using IRDF-82
REACTION
? 7A1 (n, a ) ' 4Na 4 8 T i (n.p ) 4 8Sc 5 6 F e (n,p ) 5 6Mn 5 8Ni (n.p ) 5 8Co 5 8Ni (n.2n) 5 7Ni 5 9Co(n.2n) 5 8Co
CALC. (IRDF-82)
< a > c (barn)
2.29x10"' 1.07x10"' 2.00x10"' 1.60x10"' 2.62xl0" 3
9. 1 1 x 1 0 " '
ERROR
( % )
5. 2 13. 1 5. 0 6. 9
18. 3 11. 0
E X P E R I M E N T
< a > E
(barn)
2.1lxlO- 2
1.04x10"' 2.14x10"' 1.62x10" ' 3.37xl0" 3
9.30x10"'
ERROR ( * )
7.2 6.5 7.4 7. 1 7.9 7.8
C / E and
{% ERROR)
1.09 (8.9) 1.03(14.6) 0.93 (8.9) 0.99 (9.9) 0.78 (19.9) 0. 98(13.5)
Fig. 1 Arrangement for the present experiment
- 282 -
f

JAERI-M 90-025
~ r
3
•p
CD
u
o a a> 3
Pn
C
o U -P CD
10* F
h ''"Ililn.pM'Co " ' ' W ^ o - ] l-J
o CO
V)
. J W CD
c+
•3 g
a" P>
•4 4 3
0 10 20
Neutron Energy (MeV)
Fig. 2 Neutron energy spectrum of the Li(d,n) neutron source with six reaction cross section curves (taken from the JENDL-3) that used in the present experiment
5 8 N i ( n . 2 n ) 5 7 N i
5 9 C o f n , 2 n ) 5 8 C o
' 8 T i ( n , p ) ' 8 S c
2 7 A l ( n , a ) J ' N a 5 6 F e ( n , p ) 5 6 Hn
5 8 N i ( n , p ) 5 8 C o
J . 5 C/E
Fig . 3 Schematic comparisons for the average cross sec t ions of JENDL-3 and IRDF-82
283

JAERI-M 90-025
3.11 The Measurement of Leakage Neutron Spectra from Various Sphere Piles with 14 MeV Neutrons — Al, Mo and W —
Chihiro ICHIHARA. Shu A. HAYASHI, Katsuhei KOBAYASHI.
Research Reactor Institute, Kyoto University, Osaka, Japan
Itsuro Kimura
Faculty of Engineering, Kyoto University, Kyoto, Japan
Junji YAMAMOTO, Akito TAKAHASH1
Faculty of Engineering, Osaka University, Suita, Japan
In order to perform the bench mark test of the newly
compiled JENDL-3 nuclear data file, neutron leakage spectra
from three kinds of materials were measured. The results were
compared with the calculations using MCNP Monte Carlo code and
pointwise cross section library processed from JENDL-3T and
other data files, ENDF/B-IV, ENDL-85. Measured samples were
aluminum, molybdenum and tungsten. The experiments were per
formed by using an intense 14 MeV pulsed neutrons and a
time-of-fligbt (TOF) technique in the energy range between 100
keV and 15 MeV.
1 . Introduct ion
An integral experiment plays an important role for the
verification of the nuclear data files and the calculation
methods. The compilation of JENDL-3 has been conducted and was
published1^. Prior to the publication, the test version of the
JENDL-3, named JENDL-3T(Revision-0 and -1). was supplied for a
bench mark test. We have measured leakage neutron spectra
from sphere piles of various kinds of the fusion reactor candi
date material by using a time-of-flight(TOF) technique with 14
MeV neutrons at the intense neutron source OKTAVIAN2'. The
results were compared with theoretical calculations using
- 284 -
i

JAERt-M 90-025
JENDL-3T and other data files3)'4).
In the present paper, the leakage neutron spectra from
sphere piles of aluminum, molybdenum and tungsten which are
the possible candidate materials for the fusion reactor are
studied.
2. Experiment
2.1 Sample piles
a) Aluminum pile
Aluminum sample pile consists of 32.8 kg of atomized
aluminum powder whose grain size was between 0.2 and 1.0 mm and
the purity of >99.7K. The sample was packed with stainless
steel spherical shell 39.9 cm in outer diameter and 2 mm thick.
This shell has a void 20 cm in outer diameter at its center and
the beam hole of 11.1 cm in diameter. The thickness of the
aluminum is therefore about 9.5 cm along the radial axis. Fig.l
shows the geometry of aluminum sample pile.
b) Molybdenum pile
Molybdenum sample pile consists of about 236 kg of molyb
denum powder with natural abundance. The purity of molybdenum
was greater than 99.9K. The spherical shell with 60.9 cm outer
diameter and 4.5 mm thickness is made of mild steel . This shell
is equipped with a beam hole 5 cm in diameter and no center
void. Fig.2 gives the dimension of this shell.
c) Tungsten pile
About 118.6 kg of tungsten powder with natural abundance
was packed in the same shell as the aluminum one. The purity of
tungsten was >99.9%. Table 1 shows the list of the measured
sample piles; pile diameter, packing density and sample
thickness (in unit of cm and mean free paths for 14 MeV
neutrons, respectively).
2.2 Experimental arrangement
The experiment was performed using an intense pulse beam
line of OKTAVIAN. with a time-of -flight (TOF) technique at
OKTAVIAN at Osaka University. The experimental arrangement is
shown in Fig.3. The energy of the incident deuterons was about
285

JAERI-M 90-025
250 keV. A tritium neutron production target was set at the
center of the pile.
A pre-collimator system made of polyethylene-iron multi
layers was set between the pile and the detector to reduce the
neutron background. The aperture size of this collimator was
determined so that the whole surface of the piles facing to the
detector could be viewed.
An NE-218 cylindrical liquid scintillation counter (12.7 cm
in diameter- and 5.08 cm long) was used as a neutron detector.
This detector was located 10.5 m from the center of the pile
and at the angle of 55c with respect to the incident deuteron
beam. The detector efficiency was determined by combining the
theoretical calculation by using a Monte Carlo code and the
relative efficiency derived from the TOF measurements of iJiCf
spontaneous fission spectrum and the neutron leakage spectrum
from a graphite sphere.
Niobium foils were attached to the target and were
irradiated during each run. By counting the radioactivity of 2mNb induced through Nb(n,2n) reaction, neutron fluence
during the experiment was determined. The absolute neutron flux
was derived from the measured TOF data in the manner stated 5 i elsewhere. ;
3.Calculations
The calculation of the leakage neutron spectra was
performed by using a 3-dimensional Monte Carlo neutron trans
port code, MCNP ' . The continuous energy cross section li
braries for this code were prepared from JENDL-3T (Revision-0
for molybdenum, and -1 for aluminum and tungsten) with NJOY '
processing code. For the reference, the calculation using the
libraries from ENDF/B-IV and ENDL-85 was also performed.
4.Results and concluding remarks
The measured leakage spectra from three sample piles are
shown in Figs.4 to 6 in comparison with the calculated spectra.
a) Aluminum sample
Fig.3 shows the experimental and calculated leakage spec-
- 286 -
\

JAERI-M 30-025
trum from the aluminum pile. Both data file predict the meas
ured spectrum pretty well. However, both of them underestimate
the measured one in the energy range between 3 MeV and 13 MeV.
Taking into account that inelastically scattered neutrons arc
dominant in this energy region Tf the leakage spectrum, inelas
tic level scattering cross sections have to be improved. As the
broad peak below 8 MeV is mainly consists of secondary neutrons
produced with (n,2n) reactions, the discrepancy in the energy
range between 3 MeV and 8 MeV is possibly caused by the ambi
guities of this reaction cross sections.
b) Molybdenum sample
In the Fig.5, the leakage spectra from molybdenum 60 cm
pile are shown. Though the calculation using JENDL-3T and
ENDL-85 are very similar, both calculation can not predict the
measured spectrum. This shows that the inelastic scattering
cross section and/or (n,2n) cross sections of both JENDL-3T and
ENDL-85 data fiie have common problems.
c) Tungsten sample
The leakage spectra from tungsten pile are shown in Fig.6.
The calculation with JENDL-3T differs considerably from the
measured one below the elastic scattering peak. Since tungsten
is expected for shielding material, this discrepancy is seri
ous. Furthermore, disagreement in the energy range between 2
MeV and 5 MeV is observed. This is possibly caused by the
insufficient evaluation of (n,2n) reaction cross section near
threshold energy. The threshold energy itself might be inaccu
rate.
Of the three elements stated above, aluminum with only one
isotope is pretty well evaluated by both JENDL-3T and ENDF/b-IV
data file except for slight problem possibly in the non-elastic
scattering cross sections. However, for the other two materials
with numbers of isotopes, not only ENDL-85 data file but new
JENDL-3T are still not free from severe problem.
Acknowledgement
Part of this study has been supported by the Scientific
Promotion for Fusion Research from the Ministry of Education,
- 287-
f

JAER!-M 90-025
Science and Culture, Japan. This work was undertaken with the
framework of the co-operative research program of OKTAVIAN
facility.
References
1) ASAMI.T. et al.:"Japanese Evaluated Nuclear Data Library
Version 3, JENDL-3", J.Atomic Enrgy Soc. Japan, 31[11]
2) SUMITA, K. et al.:"Osaka University Intense 14 MeV Neutron
Sourece and its Utilization for Fusion Studies", Proc. 12th
Symp. Fusion Technology, B-24, KFA Juelich, Sept. 1982
3) ICHIHARA.C et al.:"Measurement of Leakage Neutron Spectra
from Various Sphere Piles with 14 MeV Neutrons", Proc. the
1987 Seminar on Nuclea Data, JAERI-M 88-065, 263(1987)
4) ICHIHARA.C et al.:"The Measurement of Leakage Neutron
Spectra from Various Sphere Piles with 14 MeV Neutrons",
Proc. 1988 Seminar on Nuclea Data, JAERI-M 89-026, 222(1989)
5) TAKAHASHI.A. et al.:"Measurement of Neutron Multiplication
by Lead Shells and Leakage Spectra from Lithium, Graphite
and Stainless Steel Slabs", OKTAVIAN Report. C-83-02(1983)
6) BRIESMEISTER.J.F. ed.:"MCNP - A General Monte Carlo Code for
Neutron and Photon Transport". LA-7396-M, Rev.2. 1986
7) MACFARLANE.R.E. et al.:"The NJOY Nuclear Data Processing
System, vol.1: User's Manual", LA-9303-M, vol.l(ENDF324)
(1982)
-288-

JAERI-M 90-025
Table 1 List of the sample piles; pile diameter, packing density, sample thickness
P i l e D i a . (cm)
D e n s i t y Samp I e-Th i c k. ( g / c m 3 ) (cm) (MFPs)
A 1 40 1 .22
M o 61 2 . 1 5
W 40 4 . 1 8
9. 8 0. 5
27 . 5 1. 5
9. 8 0. 8
Fig. 1 The geometries of the 40 cm diameter spherical shell for use with aluminum and tungsten sample piles
I.
- 2 8 9 -

200
> so
CO
o I
Fig . 2 The geometries of the 60 cm diameter spher ica l she l l for use with molybdenum p i l e

H°H°H°.I°
K'K'K'K
R^55^^^?^^?3^5^
Fig. 3 Experimental arrangement in OKTAVIMJ facility

JAERI-M 90-025
ENERGY(MeV)
10"
CD
LU
10
or en CJ
CD <c \ ^
UJ I
10
l I 1 T T T 1 1—I I I I
10
Al 40cm Sphere Exp. M-| MCNP & JENDL-3 C a l c . h MCNP & ENDF/B-IV
Fig. 4 Experimental and calculated leakage spectra from aluminum pile
292-

JAERI-M 90-025
10
CD on
i
LU ^ n en l u
en
o
C_J
l_LJ
10
ENERGY(MeV) 1 i i i 1 1 1 1 1 i 1 1 — i — r i i i
Mo 60cm Sphere Exp. •+, MCNP I JENDL-3TR0 Ca lc . H MCNP & ENDL-85 Ca lc .
^
J i i i i i 11 J i — i i i i 11
10
Fig. 5 Experimental and calculated leakage spectra from molybdenum pile
293 -

JAERI-M 90-025
ENERGY(MeV) "1 1 1 1 — I I I ! "I 1 1 1—I I I I
W 40cm Sphere Exp. *+, MCNP & JENDL-3TR1 Calc. ^-MCNP 8c ENnL-85 Calc. L--;
i i i i i 1 1 J L I I I I 11 0
6 Experimental and calculated spectra from tungsten pile
294

JAER1-M 90-025
3.12 Comparison of Calculated Shielding Properties by JENDL-3 with Those by ENDF/B-IV
KOICHI MAKI, K A Z U A K I K O S A K O , HJROSHI M A E K A W A , YASUSHI SEKI
Fusion Experimental Reactor Team Naka Fusion Research Establishment, Department of Reactor Engineering
Tokai Research Establishment Japan Atomic Energy Research Institute
Tokai-mura, Ibaraki-ken, Japan
A B S T R A C T
Fusion nuclear group constant set "FUSION-J3" has been constructed
from JENDL-3, Japanese evaluated nuclear data file, published in
September 1989. Using FUSION-J3, shielding properties were calculated
in fusion reactor inboard shield to guard for superconductive toroidal
magnets against neutron and gamma ray. The results were compared
with those by the nuclear group constant set VITAMIN-C based on
ENDF/B-IV. From the comparison, both neutron spectra in the first wall
with FUSION-J3 and VITAMIN-C are in approximately agreement with
each other. The former in winding pack is less than the latter by 3 0 % in
the energy region below 1 keV. G a m m a ray spectra with FUSION-J3 are
larger than 1.5-3 times of those by VITAMIN-C in the first wall and this
discrepancy becomes larger in the winding pack region far from the first
wall.
I. INTRODUCTION
Guard for superconductive toroidal magnets against radiation,
neutron and gamma ray, is one of the most important subjects for
shielding design in fusion reactors. Up to now, the nuclear group constant
set GICX40I) has been used in fusion reactor neutronic calculations. The
set was constructed more than ten years ago. Therefore, a new nuclear
group constant set for fusion reactor neutronic calculation has been
required to be constructed on the basis of a new Japanese evaluated
nuclear data file, JENDL-32). Since JENDL-3 was published in September
- 295-

JAER)-M 90-025
1989, the fusion nuclear group constant set "FUSION-J3" has been
constructed from the file.
Using FUSION-J3, shielding properties were calculated in fusion
reactor inboard shield. The thickness of inboard shield makes a large
effect on the reactor major radius. Therefore, the thickness should be
designed as thin as possible. The differences between shielding
properties by used nuclear group constant sets must be understood.
Purposes of the present report are to compare the shielding
properties calculated by FUSION-J3 with those by the nuclear group
constant set VITAMIN-C3) based on ENDF/B-IV, and to understand and
find out problems in FUSION-J3 and further JENDL-3.
One dimensional calculation model and inboard shield configurations
of problems la to Id in ITER concept are explained in Chapter II. In
inboard shield calculation, differences between shielding properties by
FUSION-J3 and those by VITAMIN-C are discussed in Chapter III.
II. CALCULATIONAL M O D E L
One dimensional transport code 'ANISN' is adapted to shielding
calculations with P5-S8. A torus model, one dimensional cylinder model,
is applied to ITER (International Thermonuclear Fusion Reactor as
represented in Fig.l) mid-plane. ITER has major radius of 5.8m, minor
radius of 2.2m and neutron first wall loading of lMW/m2, etc. as shown
in Table 1. Shielding properties in inboard shield are surveyed for
various shielding configurations, problems la to Id. Representing Fig.2,
the problem la is composed of SS (stainless steel) and water, the problem
lb of SS and borated water, the problem lc of SS-water and lead, and the
problem Id of SS-water and B 4 C Purpose of shielding calculation on the
problem la is to understand differences between shielding characteristics
calculated by FUSION-3 and by VITAMIN-C as basic shield configurations.
Purpose of problems lb, lc and Id are to understand differences between
calculated shielding property improvement with borated water, lead and
B 4 C zones, respectively, by applying FUSION-J3 and those by VITAMIN
C
- 296 -
i

JAER1-M 90-025
The nuclear group constant set FUSION-J3 is the coupled constant set
composed of neutron 125 groups and gamma ray 40 groups. The energy
group structures of neutron and gamma ray are represented in Table 2,
and 40 nuclides including in FUSION-J3 are listed in Table 3. On the other
hand, VITAMIN-C consists of neutron 46 groups and gamma ray 21
groups.
m . RESULTS A N D DISCUSSION
Neutron and gamma ray fluxes, and nuclear heating rates in the first
wall and winding pack in TFC were estimated. From these results, we
discussed as follows;
[1] Fast and total neutron, and gamma ray fluxes
Fast and total neutron, and gamma ray fluxes are calculated by
FUSION-J3 and VITAMIN-C as shown in Tables 4 to 7. Fast and total
neutron fluxes by FUSION-J3 in the first wall are approximately in agreement
with those by VITAMIN-C. In the winding pack, the fluxes with FUSION-
J3 are larger than those with VITAMIN-C by about 2 0 % except problem
lc. In problem lc the shield has 3cm thickness lead zone near the
toroidal magnets and the fluxes with FUSION-J3 are less than the those
with VITAMIN-C by about 2 0 % in the winding pack. Total neutron fluxes
with FUSION-J3 become further larger in the winding pack.
On the other hand, gamma ray flux in the first wall with FUSION-J3 is
less than that with VITAMIN-C by 20%. The former in the winding pack
is further less than the latter by 30-40%.
From these results, it can be seen that the gamma ray production cross
sections in JENDL-3 are probably less than those in ENDF/B-IV.
[2] Nuclear heating rates
Neutron heating rates with FUSION-J3 are larger than those with
VITAMIN-C by 1 5 % and 5 0 % in the first wall and winding pack,
respectively, as shown in Tables 4 to 7. While neutron heating rates in
carbon tile with FUSION-J3 are estimated approximately 6 0 % of those
i
- 2 9 7 -

JAER]-M 90-025
with VITAMIN-C in spite of agreement in neutron fluxes with both. This
fact implies that carbon heating constant, K E R M A factor, is probably
underestimated by more than 40%.
On the other hand, gamma ray heating rates with FUSION-J3 in the
first wall and in the winding pack are less than those with VITAMIN-C by
2 5 % and 40-50%, respectively.
These results also suggest that the gamma ray production cross
sections in JENDL-3 are possible to be smaller than those in ENDF/B-IV.
[3] Neutron and g a m m a ray spectra
Both neutron spectra in the first wall with FUSION-J3 and VITAMIN-C
are approximately in agreement with each other. The spectra with
FUSION-J3 in winding pack is larger than the latter by 3 0 % in the energy
range below 1 keV to 1 eV as in Figs.3-6. The neutron spectra with
JENDL-3 have a tendency to be softened more than those of ENDF/B-IV in
the region far from the first wall such as the superconductive magnet
region.
Gamma ray spectra with FUSION-J3 are larger than 1.5 times partially
3 times of those by VITAMIN-C in the first wall and these discrepancies
become larger up to 3 times in the winding pack in the energy range, from
3 M e V to 200 keV as shown in Figs.7-10. The discrepancy in the gamma
ray spectra in the energy range suggests that capture gamma cross
sections are probably underestimated in JENDL-3.
[4] Comparison with experiments in gamma ray heating rates
G a m m a ray heating rates calculated with 2-dimensional slab model
with both group constant sets, GICX40 and GICXFNS are represented in
Fig. 11 together with the experimental values by FNS. From this figure,
the values with VITAMIN-C are in approximately agreement with the
experimental ones in the region 50 to 70cm from the surface. The values
by FUSION-J3 are underestimated in comparison with the experimental
values. This fact implies also that capture gamma cross sections are
probably underestimated.
- 298 -
.?

JAERI-M 90-025
IV. CONCLUSION
Shielding properties for superconductive magnets calculated by
FUSION-J3 based on JENDL-3 were compared with those by VITAMIN-C
based on ENDF/B-IV. Discrepancies between them were discussed. From
these results, following concluding remarks are obtained.
1) Fast and total neutron fluxes by FUSION-J3 are approximately in
agreement with those by VITAMIN-C in the first wall region, but in the
winding pack region those by FUSION-J3 are larger than by VITAMIN-C.
2) Neutron spectra by FUSION-J3 approximately agree with those by
VITAMIN-C and differences between them appear in the energy range
below several keV in the winding pack.
3) Neutron spectra with JENDL-3 have a tendency to be softened more
than those of ENFD/B-IV in the region far from the first wall such as
superconductive magnet region.
4) Total gamma ray fluxes by FUSION-J3 are smaller than those by
VITAMIN-C in all regions and this discrepancy becomes larger in
accordance with far from the first wall.
5) Differences between gamma ray spectra by FUSION-J3 and those by
VITAMIN-C appear in the energy range from 3MeV to 200 keV in the
first wall and in the winding pack.
6) Neutron heating constant of carbon in FUSION-J3 is probably
underestimated, since neutron heating rate in carbon tile is less than that
with VITAMIN-C by 40%.
7) G a m m a production cross sections of JENDL-3 are probably
underestimated, since gamma ray fluxes with FUSION-J3 are smaller than
those with VITAMIN-C by 2 0 % and 4 0 % in the first wall and in the
winding pack, respectively.
REFERENCE
1) Y. SEKI and H. IIDA, JAERI-M8818, (1980).
2) T. ASAMI, etal. "Japanese Evaluated Nuclear Data Library Version 3,
JENDL-3" J. Atomic Energy Society of Japan Vol.31, 1190(Nov. 1989).
3) R. W . ROUSSIN etal., ORNL-RSIC-37.
- 299-

JAERI-M 90-025
Table 1 ITER basic design parameters
Major r a d i u s
Minor r a d i u s
Aspect r a t i o
Plasma c u r r e n t
Elongat ion K
T r i a n g u l a r i t y 5
(">)
(m)
[nominal) , (MA.)
(95%)
(95%)
Toro ida l f i e l d on a x i s (T)
Plasma voluem
Wall l o a d i n g
Fusion power
Neutron f l u e n c e (MW
(m3)
(MW/m2)
(GW)
a /m 2 )
6
2
2
22
~ 2
~ 0
4
1079
- 1
~ 1
1
0
15
78
.0
.38
85
0
0
0
- 3 0 0
*

<
S - .
l i c u
o
XI
c
3 >J CO u —) cn I
O. O
5 CO
>. c 00 -H So 01 0) C l-i U 3
m CJ CM 3
C in O M D. 4-> 3 3 O 0) t-i
Z 00
-O CO
H
D . P O
in CN
c o b 3 U
a. 3 o t-c 0 0
m CN
c o b 3 U
ENER
GY (EV)
|
ENER
GY
(EV)
5. 7 0 E +
0 6 1
6. 0 7 E +
0 6
•^T
1. 6 2 E +
0 7 I
1. 6 5 E +
0 7
-
5. 3 5 E+ 0 6
5. 7 0 E +
0 6
CM
. 1. 6 0 E +
0 7
1 . 6 2 E +
0 7
CM
5. 0 3 E +
0 6
5. 3 5 E +
0 6
CO
1. 5 7 E +
0 7
1. 6 0 E+ 0 7
CO
4. 7 2 E +
0 6
5. 0 3 E +
0 6
-1.
5 5 E +
0 7
1. 5 7 E+ 0 7
-&
4.
4 4
E + 0 6
4. 7 2
E + 0 6
in
1. 5 3
E + 0 7
1 .
5 5 E+0 7
in
4.
1 7
E + 0 6
4.
4 4 E+ 0 6
CO •"31
1. 5 0
E +
0 7
1. 5 3 E +
0 7
CO
9 0 +
3 2 6 '£
4.
1 7 E+ 0 6
r—
1. 4 9
E + 0 7
1. 5 0 E +
0 7
t—
1
90 + 389 'C
9 0 +
326 'S
CO
1.
4 6
E + 0 7
1. 4 8 E+ 0 7
CO
3.
4 6
E + Q 6
3.
6 8 E+ 0 6
cn 1.
4
3 E + 0 7
1. 4 6 E +
0 7
O)
3. 2 5
E +
0 6 !
3.
4 6 E+ 0 6
CD in
1. 4 1
E + 0 7
1. 4 3 E+0 7
CD
3. 0 5
E +
0 6
3. 2 5 E+ 0 6
in
1. 3 9
E + 0 7
1. 4 1 E+ 0 7
-
2.
8 7
E + 0 6
3.
0 5 E+ C 6
CM in
1.
3 7
E + 0 7
1. 3 9 E+ 0 7
CM 9
0 + 369
'I
2.
8 7 E +
0 6
CO in
1. 3 5
E + 0 7
1. 3 7 E +
0 7
CO
2.
5 3
E + 0 6
9 0 + 369 '2
in
1. 3 3
E + 0 7
1 . 3 5 E+0 7
*
2. 3 8
E + 0 6
2.
5 3 E +
0 6
in in
1.
3 0
E + 0 7
1. 3 3 E+ 0 7
m
2.
2 3 E +
0 6
2. 3 8
E + 0 6
CO in
1.
2 8 E+0 7
1. 3 0 E +
0 7
CO
9 0 +
3 0 1 "2
2.
2 3 E+0 6
r— in
1.
2 6
E + 0 7
1.
2 8 E +
0 7
t—
1.
9 7
E + 0 6
9 0+301 "2
oo in
1.
2 5
E + 0
7 1
1. 2 6 E +
0 7
CO
! 9 0 +
3 9 8
"I
1 .
9 7 E +
0 6
en in
1.
2 3
E + 0 7
1. 2 5
E + 0 7
en
1.
7 4
E + 0 6
9 0+398 "I
o CD
1. 2 1
E + 0 7
1. 2 3
E +
0 7
CD CO
1.
5 3
E + 0 6
1. 7 4
E + 0 6
r-1
CO
1.
1 9
E + 0
7 1
1. 2 1
E + 0 7
CM
1. 3 5 E +
0 6 |
1.
5 3 E +
0 6
CM
1.
1 7
E + 0
7 1
1. 8 9 E +
0 7
CM CM
|
9 0 + 3
6 I '1
1.
3 5 E +
0 6
CO CD
1.
1 5
E + 0 7
1.
1 7 E +
0 7
CO CM
9 0 +
390'!
9 0 + 361
"1
CO
1.
1 3 E+0 7
1.
1 5 E+ 0 7
CM
9. 3 0
E + 0 5
9 0 +
3 9 0
"I
in CO
1.
1 2
E + 0 7 1
1.
1 3 E+0 7
in CM
8. 2 1
E + 0 5
9. 3 0
E +
0 5
CO CD
1.
1 0
E + 0 7 i
1.
1 2 E+0 7
CO CM
7. 2 4
E +
0 5
9 0 + 3
12 "8
CO
1.
0 8
E + 0 7
1.
1 0
E + 0 7
£ 6.
3 9
E + 0 5
7. 2 4 E +
0 5
CO CO
1.
0 7
E + 0 7
1. 0 8 E+ 0 7
CO CM
5. 6 4
E + 0 5
6. 3 9 E+ 0 5
en CO
1.
0 5 E+0 7
1.
0 7
E + 0 7
cn CM
4. 9 8
E +
0 5
5. 6 4
E + 0 5
CO c —
1.
0 3
E + 0 7
1. 0 5
E +
0 7
CO CO
4. 3 9
E + 0 5
9 0 +
3 8
€ "f
c—
1.
0 2
E + 0 7
1 .
0 3 E +
0 7
CO
3.
8 8 E+ 0 5
4.
3 9
E + 0 5
CM t—
1.
0 0
E + 0 7
1. 0 2 E+ 0 7
CM OO
3.
4 2
E + 0 5
9 0 +
3 8 8 "£
CO
9.
3 9
E + 0 6
1. 0 0 E+ 0 7
CO CO
3.
0 2
E + 0 5
3.
4 2 E +
0 5
r-
8. 8 3
E +
0 6
9. 3 4 E+ 0 6
"3* CO
2.
6 7
E + 0 5
9 0+320 "£
in c—
9 0 + 3
6 2 "8
8.
8 3 E+ 0 6
in CO
2.
3 5
E + 0 5
2.
6 7
E + 0 5
CD I—
7. 7 9
E +
0 6
9 0+362 "8
CD CO
9 0 + 3
8 0 "2
2.
3 5
E + 0 5
r=
7. 3 2
E +
0 6
7. 7 9 E+ 0 6
r-CO
1.
8 3
E + 0 5
9 0 +
3 8 0 "
2
oo
6.
8 7
E + 0 6
7. 3 2 E +
0 6
CO CO
9 0 +
3 2 9
"1 i
1.
8 3
1 + 0 5
en t—
6.
4 6
E + 0 6
6. 8 7
E +
0 6
en CO
1.
4 3
E + 0 5 J
9 0 + 3
3 9 "1
CD CO
6. 0 7
E + 0 6
6. 4 6
E + 0 6
o -3*

JAERI-M 90-025
Table 2 Neutron 125 energy group structure and gamma-ray 40 energy group structure in FUSI0N-J3 (continued)
Neutron 125 groups Gamma ray 40 groups
81 82 83 84 85 88 87 88 89 90 31 92 93 94 95 96 97 98 99 100 101 102 103 104 105 108 107 108 109 110 111 112 113
114 115 116 117 118 119 120 121 122 123 124 125
ENERGY (EV)
1. 4 3 E + 0 5 1. 2 6 E + 0 5 1. 1 1 E + 0 5 9. 8 0 E + 0 4 8 . 6 5 E + 0 -4 7. 8 4 E + 0 4 6. 7 4 E + 0 4 5. 9 5 E + 0 4 5. 2 5 E + 0 4 4. 6 3 E + 0 4 4. 0 9 E + 0 4 3. 6 1 E + 0 4 3. 1 8 E + 0 4 2. 8 1 E + 0 4 2. 4 8 E + 0 4 2. 1 9 E + 0 4 1. 9 3 E + 0 4 1. 5 0 E + 0 4 1. 1 7 E + 0 4 9. 1 2 E + 0 3 7. 1 0 E + 0 3 5. 5 3 E + 0 3 4. 3 1 E + 0 3 3. 3 6 E + 0 3 2. 6 1 E + 0 3 2. 0 4 E + 0 3 1. 5 9 E + 0 3 1. 2 3 E + 0 3 9. 6 1 E + 0 2 5. 8 3 E + 0 2 3. 5 4 E + 0 2 2. 1 5 E + 0 2 1. 3 0 E + 0 2 7. 8 9 E + 0 1 4 . 7 9 E + 0 i
1. 2 6 E + 0 5 1. 1 1 E + 0 5 9. 8 0 E + 0 4 8. 6 5 E + 0 4 7. 6 4 E + 0 4 6. 7 4 E + 0 4 5. 9 5 E + 0 ^ 5. 2 5 E + 0 4 4. 6 3 E+ 4
4. 0 9 E + 0 4 3. 6 1 E + 0 4 3. 1 8 E + 0 4 2. 8 1 E + 0 4 2. 4 8 E + 0 4 2. 1 9 E + 0 4 1. 9 3 E + 0 4 1. 5 0 E + 0 4 1. 1 7 E + 0 4 9. 1 2 E + 0 3 1 7. 1 0 E + 0 3 5. 5 3 E + 0 3 4. 3 1 E + 0 3 3. 3 6 E + 0 3 2. 6 1 E + 0 3 2. 0 4 E + 0 3 1. 5 9 E + 0 3 1. 2 3 E + 0 3 9. 6 1 E + 0 2 5. 8 3 E + 0 2 3. 5 4 E + 0 2 2. 1 5 E + 0 2 1. 3 0 E + 0 2 7. 8 9 E + 0 1 4. 7 9 E + 0 1
^2.90 E + 0 i 2 . 9 0 E + 0 i. ! i. 7 6 E + 0 i i. 7 6 E + 0 1 !.. b 7E + 0 1 1. 0 7 E+0 1 6. 4 8 E + 0 0 3. 9 3 E + 0 0 2. 3 8 E + 0 0 1. 4 5 E + 0 0 8. 7 6 E - 0 1 5. 3 2 E-0 1 3. 2 2 E-0 1
6. 4 8 E + 0 0 3. 9 3 E + 0 0 2. 3 8 E + 0 0 1. 4 5E + 0 0 8. 7 6 E-0 1 5. 3 2 E-0 1 3. 2 2E-0 1 1. 0 0 E-0 1
1 2
" "*3"' 4 5 6 7 8 9 10 11 12 13 14 15 16 17 18 19 20 21 22 23 24 25 26 27 28 29 30 31 32 33 34 35 36 37 38 39 40
ENERGY (EV) 1. 4 0 E + 0 7 1. 2 0 E + 0 7 1. 0 0 E + 0 7 9. 0 0E + b 6 8. 0 0 E + 0 6 7. 5 0 E + 0 6 7. 0 0 E + 0 6 6. 5 0 E + 0 6 6. 0 0 E + 0 6 5. 5 0 E + 0 6 5. 0 0 E + 0 6
4. 5 0 E + 0 6 4 . 0 0 E + 0 6 3. 5 0 E + 0 6 3. 0 0 E + 0 6 2.5 0 E + 0 6 2. 2 5 E + 0 6 2. 0 0 E + 0 8 1. 7 5 E + 0 6 1. 5 0 E + 0 6 1.3 8 E + 0 6 1. 2 5 E+0 6 1. 1 3 E + 0 6 i. b b E + b 6 9 . 0 0 E + 0 5 8. 0 0 E + 0 5 7. 0 0 E + b 5 6. b b E + b 5 5. 2 0 E + 0 5 5. 0 0 E + 0 5 4. 0 0 E + 0 5 3. 0 0 E + 0 5 2. 0 0 E + 0 5 1. 5 0 E + 0 5 1. 0 0 E + 0 5 8 . 0 0 E + 0 4 6. 0 0E + 0 4 4. 5 0 E + 0 4 3. 0 0 E + 0 4 2. 0 0 E + 0 4
1. 2 0 E + 0 7 1. 0 0 E + 0 7 9. 0 0 E + 0 6 8. 0 0 E + 0 6 7. 5 0 E + 0 6 7. 0 0 E + 0 6 6. 5 0 E + 0 6 6. 0 0 E + 0 6 5. 5 0 E + 0 6 5. 0 0 E + 0 6 4. 5 0 E + 0 6 4. 0 0 E + 0 6 3. 5 0 E + 0 6 3. 0 0 E + 0 6 2. 5 0 E + 0 6 2. 2 5 E + 0 6 2. 0 0 E + 0 6 1. 7 5 E + 0 6 1. 5 0 E + 0 6 1. 3 8 E + 0 6 1. 2 5 E + 0 6 1. 1 3 E + 0 6 1. 0 0 E + 0 6 9. 0 0 E + 0 5 8. 0 0 E + 0 5 7. 0 0 E + 0 5 6. 0 0 E + 0 5 5.2 0 E + 0 5
[5. 0 0 E + 0 5 4. 0 0 E + 0 5 3. 0 0 E + 0 5 2. 0 0 E + 0 5 1. 5 0 E + 0 5 1. 0 0E + 0 5 8. 0 0E + 0 4 6. 0 0 E + 0 4
^ 4 . 5 0 E + 0 4 3. 0 0E + 0 4 2. 0 0 E + 0 4
^ i. b b E + b 4
- 302 -

o &o
4
O tOCO-JCJ5 CntO* tOMI—'OtOOO-JCOCn(P».COC-O I—'
co ro ro — • - « - > • - » - » - i — -3 W I D O ) ^ I \ ) - ' E l ( 0 - ) 0 ) t i « l \ ) - '
>-. i—oq (a rt> M.K-.ro o>
V—• CDC3 t o CO CO—J —3CT> CTJCn >&->£». CO CO tvSV—»>—' c n t o c o —o I—' c n c o co—3 1—' e n t o c o — 3 1 — ' t n c o c o - ~ l t
I I
M M O O C O C O O O — 3 — 3 CT>CT5Cn*>»1C».COCOtSM—'I—* O*»-C0ts30->C3>e»-00C'0 0">C3iP>*Cot>OCT>C3i£»»OoC-0 CTS
>P-COCO CO CO COCO COCO COCOfOC-OCOC-OroC-OC-OlNa IS3 OtOCO—30>cn>C» .COt>0 t—'CatOCO—3CT>CntPkCOCO I—«
ro ro ro ro ro co to co to ts cn cn co oo cn ro co co en —
C •—CT* C L O •-'•'-J C »•—O CD 3 "-1 ' - ' .co
rot-oc-ococ-ofo>—»i *i -i •) •) -i •) •) *i 'i -i 'i • y—* CO t O t O l — 1 1 — O t o t O C O OO-OCTJCTSCn CJIitb. CO COINS Cv3 c n t o c o — J i — ' c n t o c o — 3 1 — > c n t o c o - o v — c n t o c o — J i — '
I I I I c-Jtsscsatsscssroc-op—^i—•• i—«i—»> -•»• -i—'i—»t -i -i -i • t—» * » • c o ^ 5 ^ ^ l - • l - • o t o t o o ^ o o • J O l 0 1 C ^ c n l ^ > . c o w ^ o O * » 0 0 t v S C r > C D > f > » C 0 t 0 OTCDiC*.OOtN3CT>0>l=>»COCN5 CT>
2S C o
—3
—3
H o* t-' (D
Co
"0 O
a c o I — •
a ro cn
c CO M o z i
CH Co
CO (0
O l-f
CO
z 3 •o c
I h3
> ts 7 S

JAERI-M 90-025
Table 4 Neutron and gamma ray f l u x e s , and n u c l e a r h e a t i n g r a t e s e s t i m a t e d by (-ICX40, FUSI0N-J3 and VITAMIN-C i n ITER benchmark Problem l a
Transport x'sec Data base
Items Reaction x' sec & Posilions
Neutron & t flux (/cm2 • s) First wall (R:815-816cm)
fast neutron (En>0.lMeV) total neutron (En<14.lMeV) gamma ray flux(total)
Carbon tile (R:344-345cm) fast neutron (En>0.lMeV) total neutron (En<14.IMeV) gamma ray flux(total)
Winding pack (R:257-259cm) fast neutron (En>0.lMeV) total neutron (En<14.lMeV) gamma ray flux(total)
Nuclear heating rates (w/cm3) First wall (R:815-816cm) n
t , total
Carbon tile (R:344-345cm) n 7 ,
total
Winding pack(R:257-259cm) n
r, total
GICX40 ENDF/B-111.IV
GICX40
2.377E+14 3.822E+14 1.572E+14
1.959E+14 3.364E+14 1.364E+14
8. 320E+09 2.014E+10 4.0162+09
5. 976E+0 7.246E+0 1.322E+1
3.688E+0 1.253E+0 4.941E+0
2. 800E-5 2.868E-4 3. 148E-4.
FUS10N-J3 JENDL-3 JENDL-3
2.477E+14 3.923E+14 2.029E+14
2.062E+14 3.451E+14 1.737E+14
1.237E+10 3.208E+10 6.217E+09
7.447E+0. 7.573E+0 1.502E+1
3.133E+0 1.232E+0 4.365E+0
7.226E-5 3.652E-4 4.374E-4
VITAMIN-C ENDF/B-IV
MACKLIB-IV
2. 485E+14 3. 851E+14 2. 615E+14
2.063E+14 3.377E+14 2. 264E + 14
1.083E+10 2.545E+10 1.099E+10
6. 482E+0 9.918E+0 1.640E+1
4. 975E+0 1.687E+0 6. 662E+0
4.373E-5 5. 924E-4 6. 361E-4
Table 5 Neutron and gamma r a y f l u x e s , and n u c l e a r h e a t i n g r a t e s e s t i m a t e d by GICX40, FUSION-J3 and VITAMIN-C i n ITER benchmark Problem lb
Transport x'sec Data base
I terns Reaction x' sec & Positions
Neutron & r flux (/cm2 • s) First wall (R:815-816cm>
fast neutron (En>0.lMeV) total neutron (En<14.lMeV) gamma ray flux (total)
Carbon tile (R:344-345cn) fast neutron (En>0.lMeV) total neutron (En<14.lMeV) gamma ray flux(total)
Winding pack (R:257-259cm) fast neutron (En>0.lMeV) total neutron (En<14.lMeV) gamma ray fluxUotal)
Nuclear heating rates (w/cm3) First wall (R:815-816c«) n
r total
Carbon tile (R:344-345cm) n 7
total Winding pack(R:257-259cm) n
7 total
G1CX40 ENDF/B-I11.1V
GICX40
2. 380E+14 3. 823E+14 1.573E+14
1.966E+14 3. 347E+14 1.365E+14
8.313E+09 2. 013E+10 4.067E+09
5. 986E+0 7. 236E+0 1.322E+1 3.709E+0 1.248E+0 4.957E+0 2.760E-5 2. 789E-4 3.065E-4
FUS10N-J3 JENDL-3 JENDL-3
2.477E+14 ' 3. 921E+14 1.998E+14
2.062E+14 3.445E+14 1.724E+14
1.232E+10 3.190E+10 5.981E+09
7.439E+0 7.537E+0 1.498E+1 3.133E+0 1.213E+0 4.346E+0 7.156E-5 3.470E-4 4.185E-4
VITAMIN-C ENDF/B-IV
MACKLIB-IV
2. 485E+14 3. 848E+14 2.607E+14
2. 063E+14 3. 371E+14 2. 246E+14
1.078E+10 2. 531E+10 1.041E+10
6.482E+0 9. 869E+0 1. 635E-H 4.975E+0 1.664E+0 6.639E+0 4. 345E-5 5. 585E-4 6.020E-4
- 304 -

JAERI-M 90-025
Table 6 Neut ron and gamma r a y f l u x e s , and n u c l e a r h e a t i n g r a t e s e s t i m a t e d by GICX40, FUSION-J3 and VITAMIN-C i n ITER benchmark Problem l c
Transport x'sec Data base
I terns React ion x'sec & Positions
Neutron & t flux (/cm8 • s) First wall (R:815-816cm)
fast neutron (En>0.lMeV) total neutron (En<14.lMeV) gamma ray flux(total)
Carbon tile (R:344-345cm) fast neutron (En>0.lMeV) total neutron (En<14.lMeV) gamma ray flux(total)
Winding pack (R:257-259cm) fast neutron (En>0.lMeV) total neutron (En<14. lMeV) gamma ray flux(total)
Nuclear heating rates (w/cm3) First wall (R:815-816cm) n
7, total
Carbon tile (R:344-345cm) n 7,
total Winding pack(R:Z57-259cm) n
7, total
GICX40 ENDF/B-III. IV
GICX40
2.380E+14 3.826E+14 1.574E+14
1.966E+14 3.354E+14 1.367E+14
1.150E+10 2. 853E+10 4. 587E+09
5. 986E+0 7.254E+0 1.324E+1 3. 709E+0 1.256E+0 4.964E+0 3. 445E-5 3. 186E-4 3.530E-4
FUS10N-J3 JENDL-3 JENDL-3
2.477E+14 3.923E+14 2.004E+14
2.062E+14 3.451E+14 1.738E+14
1.232E+10 4.457E+10 7.177E+09
7.447E+0 7.573E+0 1. 502E+1 3.133E+0 1.232E+0 4.365E+0 9.354E-5 3. 995E-4 4.930E-4
VITAMIN-C ENDF/B-IV
MACKLIB-IV
2.485E+14 3.851E+14 2.615E+14
2.063E+14 3. 377E+14 2. 264E+14
1.470E+10 3.541E+10 1.042E+10
6. 482E+0 9.918E+0 1.640E+1 4.975E+0 1.687E+0 6. 662E+0 S.502E-5 5.777E-4 6.327E-4
Table 7 Neut ron and gamma r a y f l u x e s , and n u c l e a r h e a t i n g r a t e s e s t i m a t e d by GICX40, FUSION-J3 and VITAMIN-C i n ITER benchmark Problem Id
Transport x' sec Data base
I terns React ion x' sec & Positions
Neutron & 7 flux (/cm2 • s) First wall (R:815-816cm)
fast neutron (E„>0.lMeV) total neutron (E„<14. lMeV) gamma ray flux(total)
Carbon tile (R:344-345cm) fast neutron (En>0.lMeV) total neutron (En<14. lMeV) gamma ray flux(total)
Winding pack (R:257-259cn) fast neutron (En>0.lMeV) total neutron (En<14.IMeV) gamna ray flux(total)
Nuclear heatipe rates fw/r.»3) First wall (R:815-816cm) n
7 total
Carbon tile (R:344-345cn) n 7
total Winding pack(R:257~259ca) n
total J
GICX40 ENDF/B-III,IV
G1CX40
2. 380E+14 3.826E+14 1.574E+14
1.966E+14 3.354E+14 1.367E+14
7. 523E+0 9 1.542E+I0 3.392E+09
5.986E+0 7.254E+0 1.324E+1 3. 709E+0 1.256E+0 4.965E+0 2. 542E-5 2. 130E-4 2. 384E-4
FUSI0N-J3 JENDL-3 JENDL-3
2.477E+14 3.923E+14 2.004E+14
2.062E+14 3.451E+14 1.738E+14
1.1I2E+10 2.456E+10 4.071E+09
7.447E+0 7.573B+0 1.502E+1 3.133E+0 1.232E+0 4.365E+0 5.048E-5 2.022E-4 2.807E-4
VITAMIN-C ENDF/B-IV
MACKLIB-IV
2. 485E+14 3.851E+14 2. 615E+14
2.083E+I4 3.377E+14 2.264E+14
9.434E+9 1.977E+10 9.168E+09
6. 482E+0 9. 91BE+0 1.640E+1 4. 975E+0 1. 887E+0 6. S62E+0 3. 662E-5 4. 604E-4 4. 970E-4
- 305 -

JAERI-M 90-025
Fig. 1 Poloidal cross section of ITER physics phase
306

JAERI-M 90-025
*—f
<
' SI
XE
!
VJ
D
H
CU
U
>\
ScsJ Q- ' * - '
31 * w - ^
.
i
t o OO
CD
n(S
S
rtJ
X o
r
—« -^r
r^
o Ct-f—
1 ~
poxy
.2
3:0
.
tta C D
W U < T 5
nd
in
3:0
.
— 3 CO
• * CD Z E C O II O C O CO
0 » " O * • — U ? J*9 t O t O r*a eg CM
X
o D.
t o
ao
o
CO CO
c (13
0 )
~
*—* O ^ O
e— a CO CO
a . CtJ
C 3
\.
1 „
*
C*J
o
OO
CD II
O CY
C O
t o s"-*
CM
C D
CO
CD II
o cv
CO CO
C C ' - ' W ^ - ' i r t _ - . a
eo
o \ c;
CD
II CO CO
1—
O
^> <-«• N ^ t o
•
<D
u. O u. O 1_
* C
•
>> cd
tl-4
o 1 aj a .
o CO
op
CO
a .
* 0 « • >
ao - ^ e
ca
o
Scr
ape-
• o
O J = - Q C O
ra
o
CNJ
CD*
OO
CD* II
O
<VJ
C O
^ 3 CO
E
Problem 1a
. —* . r-J
O \ .£> CO
Probem 1 b
o \ j2 t o
o o
Q .
o
Problem 1c
CO
•a
o \ - O C O
problem 1d
Fig. 2 One dimensional torus model for ITER miu plane
307 -

10 '
CO CM E 10' .o c
2 l Q tr < x \-1X1
1 CO
© 00
1
CC 1U Q. X Z> _ i u_ 2 O cr h-3 HI
10 ;
IIIII^ I I I IU^ iiimn ii..ui| DJIIIIJ nimn iii.iin .niiin i.imn iimm " " " i
JENDL-3 ENDF/B-IV
1 0 '
10 ' .tui i .J t 'miJ J ,,,„^ j , J J •'imiJ i J i • miinf I'ura
1 0 ' * 1 0 " ' 1 0 " ' 10"' 1 0 ' 1 0 ' 1 0 ' 1 0 ' 10* 1 0 ' 10* 1 0 ' 1 0 '
NEUTRON ENERGY (eV)
Fig. 3 Comparison of neutron spectra in the first wall and in the winding pack by JENDL-3 with those by ENDF/B-IV (problem, la)
i o " * i o - ' i o _ ! i o _ 1 io* i o ' i o ' i o ] 10* io s i o c n 7 n 3
NEUTRON ENERGY (eV)
Fig. A Comparison of neutron spectra in the first wall and in the winding pack by JENDL-3 with those by ENDF/B-IV (problem, lb)
>

CO o t£>
i o _ t 10"' 10"* io _ 1 io ' i t 1 I O 1 io J io4 io ' io' ioT io
NEUTRON ENERGY (eV)
Fig. 5 Comparison of neutron spec t ra in the f i r s t wall and in the winding pack by JENDL-3 with those by ENDF/B-IV (problem, lc)
10 '
OJ
E _o
> (3 < I h-LU _ l
CC Hi a. x 3 _J LL
z O DC I -r>
10
' " 1 1 ' 1 • • " • H I ' l ' i ' H I i l i n n . ) . , ! ! ) | | n i i i | | i H u m ' " " " ' I I I l l ! l TITS
in the first wall
JENDL-3 ENDF/B-IV
in the winding pack
t . . i .
M..,J
- ' i o - ' to - 2 I O - ' io ' io ' io J i « ' I O * i » ! i o 6 i o ' u 3
NEUTRON ENERGY (eV)
> 2 T
Fig. 6 Comparison cf neutron spectra in the first wall and in the winding pack by JENDL-3 with those by ENDF/B-IV (problem. Id)

I CO I—» o I
CC LU QL i o !
X =) _ l
DC
3»' 10'
10'
1 ^ ^ ! ^ W"""*** 8*^ = E 9 ^ -
in the winding pack
i — i
JENDL-3 ENDF/B-IV
IX i o (
GAMMA-RAY ENERGY (eV)
_ i • ' • ' ' '
Fig. 7 Comparison of gamma-ray spectra in the first wall and in the winding pack by JENDL-3 with those by ENDF/B-IV (problem, la)
E o >• 10 " _
> O CC 10" <
L i J l O 1 1
t § i o 1 0
cc LU
x 1 0
_J LL
10 ' _ . > < a:
i
< 1 0
< .
10 '
! ' ' "
t_,
: *
f — — —
:
yf^^^j. i
rJ ; in the first wall
i i 1
i
* in the winding pack «
i—i—r : J J J .
E
1*
If—
i i_
i in
n
i ,
.. _| __ -e* | I -
1 -A-
r^ 1
: :
i r M n i o JLlNUL-o FMnF/R l\/
•a
" ! : i
\ r ""i i 1 1 1 <-
10' 10 s 10 * 10 '
GAMMA-RAY ENERGY (eV)
> 2 i
10*
Fig. 8 Comparison of gamma-ray spectra in the first wall and in the winding pack by JENDL-3 with those by ENDF/B-IV (problem, lb)

I CO
GAMMA-RAY ENERGY (eV)
Fig. 9 Comparison of gamma-ray spectra in the first wall and in the winding pack by JENDL-3 with those by ENDF/B-1V (problem, lc)
> m
10s 10' 10'
GAMMA-RAY ENERGY (eV)
Fig. 10 Comparison of gamma-ray spectra in the first wall and in the winding pack by JENDL-3 with those by ENDF/B-IV (problem Id)

I CO
»-» I
10
FE SLAB. - <C-AMMA HEATING-RRTES> .10 R E A C T I O N T Y P E t F E O K l ) : P O S I T I O N 0 - 0 CM
10"
i— G:
•Zi
1 0 " " -
10"
10"
10 - is
-i 1 1 r T "
GICXFNS
F5XJ3T2 - - V jTSi - l IN-C - - C-iCXiO --- C - ! C X r N S a if n e NE :2:3
A..
2 0 - 0 J L
i 2 Q • C
flXIRL OISTRNCE (CM)
>
SO
o I o
Fig. 11 Comparison of calculated gamma-ray heating rate by various nuclear group constant sets with experimental values

JAERI-M 90-025
3.13 Analysis of Neutron Benchmark Experiments to Evaluate the JENDL-3 by the Continuous Energy Monte Cario Code
K. Uekil. K. Sakurai^, and M.Kawai^
1) Ship Research Institute
2) Japan Atomic Energy Institute
3) Nuclear Engineering Laboratory.
Toshiba Corporation.
Abstract
The pointwise cross sections on which the JENDL-3 nuclear
data library was based were prepared by using the NJOY-83 and
the MACROS code system to analyze neutron shielding experiment
by the continuous energy Monte Carlo Code MCNP. To evaluate the
iron cross sections in the JENDL-3, the ORNL and the WINFRITH
iron neutron shielding benchmark experiments were selected to
the present purpose. Those two benchmark experiments have not
only the reaction rates or the detector responses but also the
neutron energy spectra covering a wide energy region. The Monte
Carlo MCNP calculations were carried out with the pointwise
cross sections from the ENDF/B-IV as well as the JENDL-3. The
reliability of the iron cross sections in the JENDL-3 were
evaluated through the comparisons and the discussions of the
calculated results with experiments.
1. Introduction
Recently, the evaluated nuclear data library JENDL-3 was
completed and the library was released from the Nuclear Data
Center of the JAERI. Taking this situation, the evaluation work
of the cross sections in the LENDL-3 library was started at some
organizations. In this study, the pointwise cross sections on
which the JENDL-3 library was based were prepared by using a
nuclear data processing code system to analyze the neutron
shielding experiments by the continuous energy Monte Carlo code
MCNpl).
At first, the pointwise neutron cross sections were com
piled from the JENDL-3 for the twenty four nuclides by using the
- 313 -

JAEM-M 90-025
nuclear date processing code system NJOY-83^^, which is a
modified version of the NJOY, and with the library compilation
code MACROS. However, those processed nuclides were limited up
to zirconium, and the more heavy nuclides like lead and uranium
are under planning to compile, yet.
In the next place, the ORNL and the WINFRITH iron neutron
shielding experiments^'^) were selected as suitable objects for
the evaluation of iron cross sections. Those two benchmark ex
periments have not only the reaction rates or the detector
responses but also the neutron energy spectra covering a wide
energy area. The Monte Carlo calculations were carried out by
the MCNP code with the pointwise cross sections from the ENDF-B/
IV 5) as well as the JENDL-3 to compare the calculations with the
two libraries.
At the last, the iron cross sections in the JENDL-3 were
evaluated by the comparison of the energy spectrum between the
Monte Carlo calculations with the JENDL-3 and the ENDF-B/IV and
the experiments.
Even though the Monte Carlo calculations can not get rid
of the statistical error completely in the results, the calcula
tions by the continuous energy Monte Carlo code with the
pointwize cross sections, like the MCNP code, is to be free from
the computational error due to the group collapsing process, the
taking process of the self-shielding factor, and the energy
group, structures in the groupwized cross sections. This is the
reason why the MCNP code was employed to evaluate the nuclear
data of the JENDL-3 in the present study.
To reduce the statistical error in the Monte Carlo cal
culations, the next event surface crossing(NESX) estimator was
newly prepared for the MCNP code and used intensively. Also,
the weight window importance parameter were given differently
for four energy groups in each divided cell. The computer was
the HITAC 680 of the Tokyo University.
2. Analysis of ORNL Iron Neutron Transmission Experiment
A series of deep-penetration neutron transmission measure
ments through thick iron slabs have been performed at the ORNL
Tower Shielding Facility(TSF) using a collimated beam of reactor
- 314 -

JAERI-M 90-025
neutrons as a source^). The measurements were carried out be
hind various combinations of 5-ft-square slabs and the source
neutron beam was tightly collimated. Therefore, the effect of
side leakage, even for the thick sample of iron, did not need to
take into account in the calculations. Figure 1 shows a
schematic arrangement of the experimental configurations for the
iron slabs. The neutron source intensity at outlet of the iron
collar was 6.8207 x 10 6 n/min/watt in Fig. 1. Also, experimen
tal configurations for the iron slab measurements are summarized
in Table 1.
The MCNP calculations for the ORNL iron neutron shielding
problem were carried out with the JENDL-3 and the ENDF/B-IV
libraries to the three cases ; the first was on the count rates
of the Bonner ball as shown in Fig's 2,3, and 4, the second was
on the neutron energy spectrum between —40 KeV and 1.5 MeV, as
shown in Fig.5, and the third was on the spectrum above 0.8 MeV,
as shown in Fig. 6. The objected iron thicknesses were 12- and
36-in.
Except a little underestimation to the 12-in, iron calcu
lated results for the 3-in. Bonner Ball response, fairly good
values of the C/E (Calculation/ Experiment) were obtained from
the MCNP calculations for the 12- and 36-in. iron thickness with
both the JENDL-3 and the ENDF/B-JV libraries to the other Bonner
ball responses. However, the results with the JENDL-3 were a
little less than those of the ENDF/B-IV. in all the calcula
tions.
Figure 5 shows the comparison of neutron energy spectra
between the MCNP calculated with the JENDL-3 and the ENDF/B-IV
and the measurements. The FSD's (fractional standard
deviation) are excellent of 0.033 —0.089 in each energy bin.
The MCNP calculated neutron energy fluxes overestimate the
measured fluxes significantly between —40 KeV and —100 KeV.
However, fairly good agreement with the experiment was obtained
between -100 KeV and —1 MeV.
Comparison of the continuous energy Monte Carlo code MCNP
calculated with the JENDL-3 and the ENDF-3/IV libraries and the
measured spectra above 0.8 MeV on the center-line behind 12 in.
of iron in Fig.l is Indicated in Fig.6. The FSD's are good
- 315 -

JAEm-M 90-025
within 0.022^0.135 at each energy bin. On the while, the Monte
Carlo calculated energy spectra indicates fairly good agreement
with the measured values. However, the calculated spectrum with
the JENDL-3 is underestimated the measurement significantly be
tween --1 MeV and -3 MeV. Meanwhile, the spectrum with the
ENDF-B/W shows good agreement with the experiment in the same
energy region. Above 3 MeV, the agreement between the monte
Carlo calculated spectra and the measured spectrum is excellent.
3. Analysis of WINFRITH Iron Neutron Penetration Experiment
The iron neutron penetration experiment was carried out in
the ASPIS shielding facility at AEE WINFRITH^). A low-power
natural uranium converter plate, driven by the source reactor
NESTOR, provided a large thin disc source of fission neutrons at
the interface of the graphite moderator and the extensive iron
shield. The neutron energy spectra were measured at four
selected positions using the proportional counters and the NE213
spectrometers. The reaction rates were also obtained using
three threshold detectors and one activation detector.
The MCNP calculated reaction rates of the Rh(n.n')
threshold detector which has effective reaction cross sections
above 0.1 MeV neutrons are summarized in Table 2. The calcu
lated results indicate fairly good values of the C/E at all the
detector locations. The magnitudes of the C/E are between 1.09
and 0.77 for the JENDL-3 and between 1.29 and 0.99 for the
ENDF/B-W.
Comparison of the calculated iron neutron spectra with the
JENDL-3 and the ENDF/B-IV and the measurements at 56.83- and
85.41-cm-depth in Fig.7 are shown in Fig's 8 and 9, respec
tively. The MCNP calculated energy spectra with both the
libraries indicate fairly good agreement with the measured
spectra at both the 56.83- and 85.41-cm-depth detector locations
in the range from *-10 KeV to —1 MeV, on the whole. However,
making detailed comparison between Fig.8 and Fig.9, the calcu
lated spectra with the JENDL-3 under estimate s above 0.5 MeV
neutrons with thicknes, and unfortunately the FSD's above 1 MeV
are not enough to evaluate the iron cross sections in the
libraries.
- 316 -

JAEM-M 90-025
4. Summary and Discussions
The MCNP calculations with the JENDL-3 and the ENDF/B-IV
iron cross sections obtained the following remarks
1) The calculated leakage energy fluxes of the ORNL iron
neutron shielding problem shows almost same tendency to the
WINFRITH problem in the same neutron energy area of it. The
overestimation of the calculated energy fluxes is significant
between —20 Kev and —100 Kev for both the ORNL and the
WINFRITH iron experiment, so that the iron cross sections in the
JENDL-3 are to be small in such a energy region.
2) The calculated energy fluxes between —100 KeV and —1
MeV agreed fairly well with the measurements, furthermore, there
was no significant difference of the calculated spectra between
the JENDL-3 and the ENDF/B-IV, so that the iron cross sections
are to be reliable in such a energy region.
3) The calculated fast neutron energy fluxes between 0.8
MeV and 3 MeV indicate underestimation, but the calculated
energy fluxes show fairly good agreement between 3MeV and 9MeV
with the ORNL iron benchmark experiment. The magnitude of the
underestimation of the calculated energy fluxes is fairly sig
nificant between —0.8 MeV and 3 MeV, so that the iron cross
sections in the JENDL-3 are to be large in such a energy region.
However, the iron cross sections in the both libraries are to be
reliable between —3 MeV and —9 MeV.
References
1) MCNP-A General Purpose Monte Carlo Code for Neutron and
Photon Transport, LA-7396-M (Rev.) Version 2B, Los Alamos
Monte Carlo Group. Los Alamos National Laboratory (1981).
2) R.E. MacFarlane, et al. "The NJOY Nuclear Date Processing
System", LA-9303-M (1982).
3) R.E. Maeker and F.J. Muckenthaler, Nucl. Sci. Eng., 52 227
(1973).
4) M.D. Carter, M.M. Chestnutt, and A.K.McCracken., "The ASPIS
Iron Benchmark Experiment-Results and Calculational Model",
Proc. of Specialists' Meeting on Nuclear Date and Bench
Marks for Reactor Shielding, Paris, 297 (Oct. 1980).
- 317 -

JAER1-M 90-025
5) "ENDF/B Summary D o c u m e n t a t i o n " , BNLNCS-17541 (ENDF-201) , 2nd
e d . (ENDF/B-IV), D. G a r b e r , E d . , a v a i l a b l e f rom t h e N a t i o n a l
N u c l e a r D a t e C e n t e r , B r o o k h a v e n N a t i o n a l L a b o r a t o r y , U p t o n ,
New York ( O c t . 1 9 7 5 ) .
Table 1 Experimental conf igurat ions for the iron transmission measurements
Iron Slab Thickness
(In.)
0.52
1.55
4.05
6.06
12.13
12.25
24.41
36.56
Detector Locations
Centerline Distance behind Slab
(In.)
127 123 90
152 146 107
126 122 89
158 116
162
141 136 100
156 150 110
10 10
128 124
90.5
115 111 81.5
Radial Distance from Centerllne
(In.)
0 33 90
0 39
107
0 32.5 89
42.5 116
0
0 36.5
100
0 40.5
110
0 12
0 33 90.5
0 30 81.5
Observation Angle* with Respect to Centerline
(deg)
0 15 45
0 15 45
0 15 45
15 45
0
0 15 45
0 16 45
0 50
0 15 45
0 15 45
Detector Type
"B Spectrometer
Bonner Balls
" B Spectrometer
NE-213 Spectrometer
NE-213 Spectrometer
Bonner Balls
NE-213 Spectrometer
Benjamin Spectrometer
Bonner Balls
Bonner Balls
'The observation angle is defined as the angle between the centerline and a line connecting the detector and the midpoint of the emergent face of the Blab. The vertex of this angle is the pivot point for the angular traverses.
- 318 -
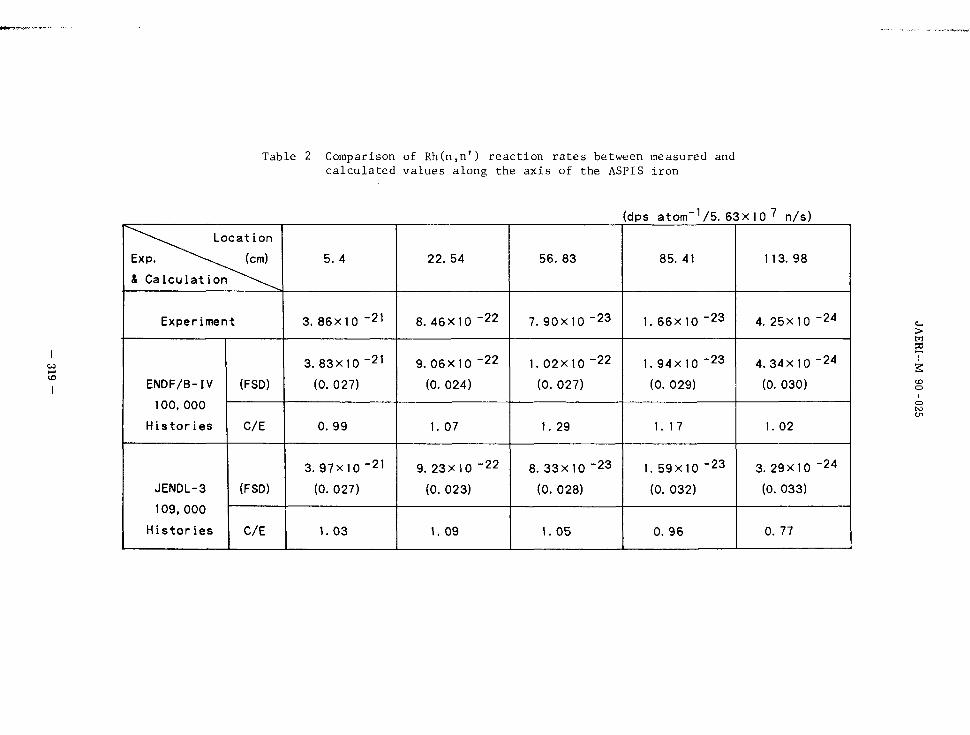
Table 2 Comparison of Rh(n,n') reaction rates between measured and calculated values along the axis of the ASPIS iron
(dps atom_1/5. 63x 10 7 n/s)
I
^ " " \ ^ ^ L o c a t i o n
Exp. ^~"~-\^^ (cm)
A C a l c u l a t i o n ^ ~ \ ^ ^
Exper iment
ENDF/B-IV
100, 000 H i s t o r i e s
JENDL-3
109,000
H i s t o r i e s
(FSD)
C/E
(FSD)
C/E
5. 4
3. 86X10 " 2 1
3. 83x10 "21
(0. 027)
0. 99
3 .97X10 _ 2 '
(0. 027)
1. 03
22. 54
8. 46X10 "22
9. 06X10 "22
(0. 024)
1. 07
9. 23X10 " 2 2
(0. 023)
1. 09
56. 83
7. 90X10 " 2 3
1. 02X10 "22
(0. 027)
1. 29
8. 3 3 x 1 0 " 2 3
(0. 028)
1. 05
85. 41
1. 66X10 "23
1. 9 4 x 1 0 "23
(0. 029)
1. 17
1. 59X10 " 2 3
(0. 032)
0. 96
113. 98
4. 25X10 " 2 4
4. 34X10 "24
(0. 030)
1. 02
3. 29X10 " 2 4
(0. 033)
0. 77
>

JAERI-M 90-025
NOTE: DIMENSIONS IN INCHES
Fig, 1 Experimental configuration for the 4 1/4 -in, -diam collimator with the 3-ft-thick iron slab in place. This collimator was used for all of the measurements except those -made behind 18 in. of stainless steel. Source intensity: 3.186xlo"x7T(3.25x2.54) 2=6.8207*106 n/min/Watt
- 320

counts/mi n/watt
O) • O "o c
b c/>
to
s
, THICKNESS(in.) MEASUREDlu CALCULATED CALC/MEAS UNCOLLIDED/TOTAL CALC
5
2
in 0 IU
5
2
tri' IU
5
2
n2
— 12Fe 2.32 2.29 0.99 76 X Ref. (1)
—
—
12Fe 2.32 1.90 0.82 67 X JENDL-3
12Fe 2.32 2.04 0.88 69 X ENDF/B-IV
36Fe 0.243 0.228 0.94 19 X Ref. (1)
3 3
1 1 / IV
i
I JL T T
I
6Fe
BFe
0.2
0.2
43
43
| ^J '•
I
0
0 23 23(
» 3
I , 1
M
1
J
L ~*
_i
0.96
0.98
V
1
» _
17 X
17 X
III
n
" * > * ,
-444-1
j l Lai. tit
ill
N \
JENDL-3
ENDF/B-
III "TO ^ Tit
1 m -AQ -TO "TO -TO
I V \ \
IV
\
\
I
t T T
T T T T
1
S{ 10" 10° 101 102 103 104
ENERGY (eV) 10= 10" 10'
Fig, 2 Results for 3-in, Bonner ball on the centerline. Comparison of calculated and measured counting rates and its response function

icr
c CO
X I
10'
£ 5
2 -
102
— T HI
1 1
I 1
/I i
III CKN 12F 12F 12F
i 1
T i H ! i L> 1 , > " ! r i i
ESS e e e
1
1 1 1
in .
1 • ^ : | T ^ ! <;!
l! [1 I'll |
Jit
ill i l l — l.Ir
ll
"II 1 1
~ ^ r , » r - " •!'• 1 . .•:• i ( ! I l 1 1 1 ' 1 ' " • » ' ' ' i l l i ! • •::, : ! " i .
I I . Nl
i i f ! (HH i I I I i
1 1.1
1! il
j l
il
II
II 1
i " i iii i ' M I III! film 1 h II
MEASURED(') CALCULATED 18.5 16.0 18.5 17.6 18.5 19.1
i ! i [ l i
III III
JUL r-tmb—i
1 > : i 1 l
1
in 1 .il lllli
!!!i I ||||
J i il mi m
Hill till llll count s/m i n/wa 11
CALC/MEAS UNCOLLIDED/TOTAL 0.86 77 X 0. 95 73 X 1.03 74 X
\ V \
III --"ffl
Tf w 1 11 llll
CALC Ref. (1) JENDL-3 ENDF/B-IV
k \
36Fe 1.08 0.985 0.91 25 X Ref. (1) ~
36Fe 1.08 1.16 1.07 27 X JENDL-3 —
36Fe 1.08 1.16 1.07 25 X ENDF/B-IV !UI!I!I l SHIM! ! | l l ! ! l ! i ! i ! l | l | | | : M|||||| | | | | i ! ) i ! i ! | | | | | | | ( | | | | | | | |
10" IOL 10' \Q< 10° ENERGY (eV)
10" 10= 10b 10'
> PS
Fig. 3 Results for 6-in, Bonner ball on the centerline. Comparison of calculated and measured counting rates and its response function

10
counts/min/watt
— THICKNESS(in.) MEASURED ( , ) CALCULATED CALC/MEAS UNCOLLIDED/TOTAL CALC
I 12Fe 9.89 8.20 0.83 77 X Ref. (1)
-12Fe 9.89 8.32 0.84 77 X JENDL-3
12Fe 9.89 9.41 0.95 78 X ENDF/B-IV
- •
36he 0. BOB 0 .3 )8 0.8b 29 X Ret. U)
_ 36Fe 0. 368 0.343 0.93 33 X JENDL-3 36 Fe
'
0. 368
-
.
0.36 7 1.0 0
llll II
l l l l
l l l l
JJjl
1
29 X
1 | X 1 T T
1 1j
1 T T J T
ENDF/B-IV
1 " T
1
1
10" 10u to' 102 to3
ENERGY (eV) lC I03 I06 10'
Fig. 4 Results for 10-in. Bonner ball on the centerline. Comparison of calculated and measured counting rates and its response function

JAEM-M 90-025
5 tO"' 5 Neutron Energy (MeV)
Fig. 5 Comparison of MCNP calculated and measured spectra^ between 60 keV and 1-5 MeV on the centerline behind 12 in. of iron
- 324 -

JAERI-M 90-025
L
/
J I
0
', Tl 1
II 1
1 l
to 1
MCNP Calculation • JENDL-3 (FSD; 0.026- 0.135) -o ENDF-B/TV(FSD;0.022-0.131)~
\o
1 i
i
Q
I |
1 i
1 1
I 1
\ /v — -p^ , i -
\ i
oX.
-MEASURE
\ V 1
o X i
- A L H
D
.
V '
o
0 3 4 5 6 ENERGY (MeV)
8 9
Fig. 6 Comparison of MCNP calculated and measured spectra above 0.8 MeV on the centerline behind 12 in. of ircn
- 325 -

40.75 1371.6 101.6
6.5 309.0 6.9 *i 1* *1
/ t-4
O ro m
CO CD
I
/ / / /
/
/
Fig . 7 Schematic arrangement of the i ron neutron sh ie ld ing experiment at the WINFRITH

JAERI-M 90-025
o W
>~ 10s
HI ' w
m in
- 10'
CM E
•r i " I ' l l i i i r i " i ^ " i '
10"
$ JENDL-3
| ENDF-B/IV
Measurement
> - t i i i _ i — i ' * i • • » 1 1
10' 10*
Neutron Eneroy CkeV)
10*
F i g . 8 Comparison of measured and MCNP c a l c u l a t e d n e u t r o n s p e c t r a a t 5 6 . 8 3 cm-depth
327 -

I
JAERI-M 90-025
1CT
10'
w
m ID
a io'
c
<M E o
10"
$ JENDL-3
§ ENDF-B/IV
Measurement
f _J I 1—I 1 I i
10' • • i i i i • • I
10' 10J • - I . , . , I , I.J. J.,1J
10*
Neutron Energy (keV)
F i g . 9 Comparison of measured and MCNP c a l c u l a t e d n e u t r o n s p e c t r a a t 85 .41 cm-depth
328

JAERI-M 90-025
3.14 Development of the JENDL Special Purpose Data File for PKA Spectra, DPA Cross Sections and Kerma Factors
Shungo IIJIMA, Masayoshi KAWAI
Nuclear Engineering Laboratory, Toshiba Corporation
Method of calculation of the neutron-induced primary knock-
on atom spectra, atom displacement cross sections and kerma
factors is presented based on the nuclear data from the evaluated
data file of ENDF/B-5 format, supplementing the emitted charged
particle spectra from nuclear cross section calculation code.
Approximate and compact formulas of DPA cross section and kerma
factor were derived for the reaction sum involving multi-particle
emissions. The formulas are valid for medium and heavy mass
nuclei. Examples of calculation on iron are given for neutron
energies up to 40 MeV. Comparison was made with the kerma factor
caluclated by Howerton and Caswell et al. below 20 MeV and the
DPA cross section with RADHEAT-V4 and TENJIN-2 code below 15 MeV.
It is shown that the high energy kerma factor is governed by the
charged particle emission, while the high energy DPA cross
section is mainly determined from neutron optical potential.
- 329 -

JAERI-M 90-025
1. Introduction
There is an increasing demand for the data of PKA (primary
knock-on atom ) spectra, DPA (displacement per atom) cross sec
tions and kerma (kinetic energy release in matter) factors
induced by neutron reactions with materials. These data,
abbreviated as PKA/Kerma data hereafter, are applied to the
calculation of heat generation in fusion reactor, study of
radiation damage, neutron therapy, radiological biology, and the
calculation of detector responses.
At the subworking group of PKA/Kerma data, JNDC, the compi
lation of PKA/Kerma data file in in progress as a part of JENDL
( i ) - 5
special purpose data file for neutron energy range from 10
eV to 20 MeV. It should be also borne in mind that the kerma
factors of light elements are required up to 100 MeV for neutron
therapy and DPA cross sections up to 50 MeV for damage study.
It has been rather customary in calculation of PKA/Kerma data
to use rather crude approximations for particle emission spectra.
However, PKA/Kerma data are derivable mostly from the recent
evalulated neutron data file of ENDF/B-5 format, if the data
above 20MeV and the data for the emitted charged particle
spectra are supplemented by cross section calculation codes.
In the present paper, the method of calculation of the PKA
/Kerma data is described to be consistent with JENDL-3.
Especially an approximate and compact expression is given of the
kerma factor and DPA cross section for reaction sum involving
multi-particle emission processes. Examples of calculation are
given for iron for neutron energies below 40 MeV. The results
are compared with the calculation of kerma factor by Howerton*
and Caswell et al. ( 3 > and that of DPA cross section by RADHEAT-
V4 code { 4 ).
- 330 -

JAERI-M 90-025
2. Reaction Kinematics and PKA Spectrum
Kerma factor (per atom) and DPA cross section in the
(5) standard NRT model are written by
KF (EN) = I / (Ep+Ek)an>x(ER,Ee,ec)deccmc (1)
°DPA(EN) 0.8
N} = 2^ I I l + kg(ED) an,x(EN.Ep)dEp (2)
Here,
E.. : incident neutron energy
ER : relative incident energy
E : recoil atom energy in laboratory system
E. : emitted charged particle energy in laboratory system
£4 : displacement energy of atom from crystal lattice
kg(E ): correction factor for elctronic energy loss by
Lindhard and Robinson
a(ER,ec,6c) : double differential cross section in CM. system
O(EN,E ) : angle-integrated PKA spectrum
In Eq.(l), suffix K is for charged particle emission reaction.
PKA spectrum is obtained by converting the cross section
given in C M system to the laboratory frame. The double differen
tial and the angle-integrated PKA spectra for the first stage
reaction are
° ( E N>VV = (iT} M 3 / 2 / E n
(3)
. ( 2 )
a(EN,Ep) TTM / d£ .
^mitn2 £ ( i ) v £ ^ a(E R , £ c , e c ) (4)
- 331 -

JAERI-M 90-025
Here, E R and E Q are respectively the relative incident energy and
the energy of the center-of-gravity.
ER = (mo2/M)EN,
EG = \ MV2 = (m01/M)EN ,
where, M = ro01 + mn„ = m1 + m9.
Reaction kinematics and the symbols moi mo2 •—»-~
are illustrated in Fig. 1 right.
Suffix c is for the quantities in
C M . system.
(Ep, 9 ) and (6C> 9C) are the energies
and the angles of recoil atom in laboratory
system and of emitted particle in C M .
system, respectively.
Kinematics relation gives
m2 EP = I T EG M
/m,m
' V M Ec " 2 ^ - 4 - E G e o U c ,
v c i , c c n i i j E k
m 2 ,Ep
F i g . 1 Kinematics of nuc lear r e a c t i o n
(5)
Up = cosfctp = (i-ncuc)/ V1 + nZ _ 2 r i c u c
v r , / V = / i " i e c
m2EG
(6)
The energy and angle of the emitted particle in laboratory
system are obtained by interchanging m1 and m„ , and replacing
Uc by - uc in Eqs. (5) and (6).
E K • M m2
"M" L C EG + — Er + 2
m j m2
— — EGECVC M'
(7)
Naturally, Ep + Ek = EG + ec
It is noted that the Eqs.O) through (7) are independent of
- 332 -

JAERI-M 90-025
the incident particle and the target nucleus, and hence these
equations can be applied as they are for the case of natural
decay and the successive emission of particles if Ep is replaced
by the kinetic energy of moving compound nucleus.
In case of the second stage reaction, the PKA spctrum is
expressed by applying twice the Jacobians in Eqs.(3) and (4). To
this calculation, the spectra of both the 1st and 2nd particles
in C.M. system are necessary. For emissions of more than 3
particles, not only the analytical calculation becomes very
tedious but also we must keep all the informations of particle
spectra at every stage of emission. A Monte Carlo type approach
may then be prefered.
3. Calculation of Kerma Factor
Kerma factor defined by Eq.(l) is written as
KF(EN) = Z (^p+^k)an,x(EN) (8)
Here, E and E. are the average values of E and E^ over the
double differential spectrum in the C.M. system. For the 1st
stage reaction these are obtained from Eqs.(5) and (7).
For the second stage reaction, new E ' and E^' are
E'p = (i^/M')Ep + (mJ/M )e'c , (9)
E£ = (m;/M')E"p + (mJ/M»)F' , (10)
where m, ' and m2' are the masses of the 2nd p'article and the 2nd
recoil atom, and M' = m.' + Mg'• Similar procedure can be used
for emission of 3 or more particles.
Thus all we have to know are the average energies and the
cosine of the angles of emitted particles in the C.M. system.
These are either extracted from the evaluated data file or calcu
lated by GNASH(7), TNG*?', PEGASUS(9* etc.
- 333 -

JAERI-M 90-025
The average recoil energy from neutron capture gamma-rays
may be written as
Ep = EG + (c^/2MC2)Yy (11)
where Yy is the multiplicity of gamma-rays .
It is easily seen that the recoil from gamma-ray emission is
important only for low energy neutron capture. For other
reaction gamma-rays the recoil is negligibly small compared with
the first recoil due to particle emission. This is an essential
point in simplifying the calculation of kerma factor and DPA
cross section. s
Kerma factors due to the elastic and the dicrete inelastic
scatterings are calculated from an evaluated data file without
ambiguities. For other reactions the calculation of reaction-
wise kerma factor is rather complicated. However, by taking the
sum over reactions using the above expressions of average
energies of recoil atom and particles, we obtain an approximate
but a compo,ct formula : KF(EN) '-' (m2/M)EGCJR + (m
n /M)e'nOn_prod
+ P ' v ' a - a _ A " ^ -(i)-(i)a(i) (12) + L exax-prod ZW M2 G S n un,nx
x * Here, superfix (1) denotes the 1st stage quantities, and
aR = reaction cross section
ax-prod= particle production cross section,
ex = average energy of emitted particle in C M . system.
In deriving Eq.(12) it was assumed that the mass of compound
nucleus is much greater than that of the emitted particle, and
that the emissions of second (and more) particles are isotropic.
- 334-

JAER1-M 90-025
The angular distributions of particles emitted from the first
stage are of the preequilibrium nature. These are calculated
from the systematics of Kalbach-Mann or Kumabe et al.' ,
or from the theory of Mantzouranis et al.1 with refraction / 9 )
effect at incident nuclear surface. '
On the Energy Balance Method
Kerma factor is often calculated by using the energy balance
KF(EN)= Z (EN + Qn>x)on)X - (EnOn_prod + EyaY_prod) . (13)
However, the result is very senitive to the slight violation of
energy balance in the data file. Kerma factor for neutron energy
below a few MeV is of the order of magnitude of (Ej./A) while
each term on the r.h.s of Eq.(13) is of the magnitude of E N
Thus, for medium-weight nucleus the energy balance must be
assured better than 2 % to calculate kerma factor within 100 X
error. When charged particle emissions become prominent then the
energy balance method can be reliable.
4. Calcualtion of DPA Cross Section
DPA cross sections for elastic and the discrete inelastic
scatterings are better calculated directly from PKA spectra.
For other reactions involving multi-particle emissions the calcu
lation of PKA spectra is not easy. However, summing over the
reactions and making use that the Lindhard correction factor is
a relatively slowly varying function of E (as shown in Fig. 2),
DPA cross section may be expressed approximately
°DPA(EN) = l+kg(ip) £ EP°n>x(EN) • (14)
EpaR = Z Epan,x - (m2/M)EGaR + ' Z ' (mfx)/H)Fxax_prod . (15)
Numerical estimation for iron shows that Eq. (14) holds
- 335 -

JAERI-M 90-025
within a few percent accuracy for summed reaction other than
elastic and the discrete inelastic scattterings at E N = 15 MeV.
This may be because the PKA spectra for (n,n'x) and (n,px) are
spread rather narrowly around Ep = E Q. This is not true for
(n, a ) reaction, but the cross section is small compared with
that of other reactions. On the other hand, Eq. (14) is in
overestimation by about 30 % for elastic and the discrete inelas
tic scatterings, reflecting broad PKA spectra for these reactions
spanning E values from 0 to 4EQ. The validity of the approxi
mation depends on the target elements (worse for lighter element)
5. Examples of Calculation
Calculation was performed for iron for neutron energies
below 50 MeV. JENDL-3 data was used below 20 MeV. GNASH code
was used to calculate cross sections above 20 MeV as well as the
average energies of emitted protons, alphas and deuterons in all
energy range. The values of parameters used in GNASH calculation
above 20 MeV are somewhat different from the ones used in iron
cross section evaluation for JENDL-3 below 20 MeV.
Figure 3 shows the normalized PKA spectrum for elastic
scattering at 15 MeV. The normalized angular distribution in C M .
system is also depicted to show the correspondence with PKA
spectrum structure. Fig. 4 shows the normalized PKA spectra for
the inelastic scatterings to Q=-825 keV and -2.11 MeV discrete
levels (mixed levels for natural iron) at 15 MeV. The coupled
channel calculation was used to these levels in JENDL-3 giving
strongly anisotropic angular distributions, which are reflected
on PKA spectra. Figure 5 gives the average energy of emitted
particles in C M . system versus incident neutron energy.
In Fig. 6, the present calculation is compared with the
- 336-

JAERI-M 90-025
calculations by Howerton and Caswell et al. '. All results
agree within 10 %, though above 16 MeV Howerton's value is about
20 % lower than the present and Caswell's values.
Calculated kerma factor and its components of Fe-56 below
50 MeV are shown in Fig. 7. At high energy, the terms due to
charged particle emissions are dominant. Therefore, the accuracy
of calculation of high energy kerma factor depends on the nuclear
model for charged particle emission.
Figure 8 shows the DPA cross section of natural iron. The
displacement energy was taken as 40 eV. Present calculation was
compared with that by RADHEAT V-4V ' code using ENDF/B-IV cross
section and by TENJIN-2 code * ' using JENDL-2 data. Present
result is in good agreement with RADHEAT V-4(ENDF/B-IV) calcula
tion. Discrepancy between TENJIN-2 result for neutron energy
above 6 MeV seems to be due to the difference in the neutron
spectra from inelastic scattering to continuum levels in JENDL-2,
since TENJI.M-2 (JENDL-3) calculation agrees well with the present
calculation (Aruga,T.: priv.commy.
Natural iron DPA cross section and its components for
neutron energy below 50 MeV are shown in Fig. 9. High energy DPA
cross section is governed mostly by the EQOR and the elastic
scattering terms. These are determined mostly by neutron optical
potential, not depending on the reaction mechanism.
Acknowledgement :
Author is thankful to the members of PKA Sectrum/ Kerma
Factor Data subworking group of Japanese Nuclear Data Committee
for discussions. He is indebted to Dr. K. Shibata at Nuclear
Data Center, JAERI for preparing multi-group JENDL-3 data of
structural materials.
- 337 -

JAERI-M 90-025
References :
(1) Iljima, S. : JENDL Special Purpose Data files and Related Nuclear Data, Proc. 1988 Nuclear Data Seminar, March, 1989, JAERI-M 89-026, . p.148
(2) Howerton,R.J. : Calculated Neutron Kerma Fetors based on the LLNL ENDL Data File, UCRL-50400, Vol 27, Jan. 1986
(3) Caswell, R.S., Coyne.J.J., Rndolph, M.L. : Kerma Factors of Elements and Compounds for Neutron Energies bewlow 30 MeV, Int. J. Appl. Radiat . Isot., 23, 1227 (1982),
(4) Yamano, N.,Koyama, K.,Minami, K.: Proc. 6-th Int. Conf. on Radiation shielding, May, 1983, Tokyo, Vol. 1, p.331, (1983)
(5) Robinson, M.T.,Torrens, I.M.: Recommendation for Displacement Calculation for Reactor/Accelerator Studies in Austeni-tic Steels, Nucl. Eng. & Design, 33, 91 (1975)
(6) Lindhard, J. et al. : Kgl. Danske Vidensk Selsk. mat-fys. Medd., 33 (1963) Np.10 Robinson, M.T. : Proc. B.N.E.S. Conf. on Nuclear Fission Reactors, Culham 1969 (BNES, London), p.364
(7) Young.P.G., Arthur.A.D. : GNASH code, LA-6947(1977)
(8) Shibata.K. Fu.C.Y. : TNG code, ORNL/TM-10381(1987)
(9) Iijima.S. et al. : PEGASUS code, JAERI-M 87-025 p.337 (1987)
(10) Kumabe,I. et al. : Systematics 'and Parametrization of Continuum Angular distributions, Proc. 1988 Nuclear Data Seminar, JAERI-M 89-026, p.243
(11) Mantzouranis, G.,et al.: Phys.Lett. 578, 220 (1978)
(13) Aruga, T., Shiraishi, K. : Comparison of Neutron Radiation Damage Parameters obtined by using JENDL-3T and ENDF-B-IV Libraries, Poc. 1988 Nuclear Data Seminar, JAERI-M 89-026, p.342
-338 -

CO CO 10
0.8
0.6
a
S 0.4
0.2
0.0
" 1
-
-
1
1 1 1 1 1 I I I 1
1 I 1 1 1 I I I 1
1 1 1 1 1 I I I
I 1 M l l l l
1 1 1 1 1
0 \ F e
v NCcN
\ s i
\ c
r I I I
l l l |
i 1 1 11
1
-
-
1 10-3 io-z io-'
PKA Energy (HeV)
Fig. 2 Correction factor by Lindhard and Robins
10-2 _
>
2 T 2
PKA Energy (HeV)
Fig. 3 Normalized PKA spectrum and angular distributions for natural iron from elastic scattering at En = 15 MeV

10 T 1 I r -i 1 1 r
EN=15MeV
>
CO
o
Q=-825KeV
-2. HMeV
0.1 _1 I I L . I I I 1_ ' i 1 U
0.5 1.0
PKA Enerty (MeV)
1.5
Fig. 4 Normalized PKA spectra for natural iron. Inelastic scattering to 825 keV and 2.11 MeV levels at En = 15 MeV. Dashed lines are those calculated by assuming isotropic angular distributions.
X IIO
4 -
2 -
-
-
-
1 1"
/ h
/ £n
1 I
i
—
-
1
> m
5 10
Neutron Energy (MeV)
15
Fig. 5 Average energies of emitted particles as a function of incident neutron energy

JAERI-M 90-025
10 •11 p — I 1 1 r
not. Fe
10-iz_
-i 1 1 r i—i—i—i—f
10 • T 3 l I i • i
Direct Method
Energy Balance Method
• Howerton (1986)
o Caswell (1980)
_ J i i I i ' ' ' I
10
Neutron Energy (MeV)
15
Fig. 6 Kerma factor of natural iron below 20 MeV. Comparison of the present calculation with those by Howerton and Caswell et al.
I
> <D
10
1
0.1
ll11
1 1
1
-
11 1
1 1 1
1 1
1
w 1
..
si s 1 / f
1 ' 1 ' ' 1 •
S u m ^
jf y^ P-emiss
/ / c t - e m l s s ^
/ ^ ^ ~ ~ EG,<TR
f s ^ \ Elastic
n - e m i s s
i , 1 , 1
1
*"
:
iiii
•
I 10 20 30
Neutron Energy (MeV)
U0
Fig. 7 Kerma factor and its components of natural iron for neutron energy up to 50 MeV
-341 -

JAER1-M 90-025
6000
4000
2000
n
I I i i I i i i i | I I 1 i | i i i i |
TENJIN-2/JENDL-2
rrJ ^^-^
i ^ — Present ^ \
& * ^ RADHEAT-W j - ^ T ^ E N D F / B - I V
i i i i 1 i i i i 1 i i i i 1 i i i t 1
10 15 20
Neutron Enerav (MPV*
Fig . 8 DPA cross sect ion of na tu ra l i r on . Comparison of the present ca l cu la t ion with tha t by RADHEAT V-4 code using ENDF/B-IV and by TENJIN-2 code using JENDL-2
10 20 30
Neutron Energy (MeV)
HO
Fig . 9 DPA crosti sec t ion and i t s components of na tu ra l i ron for neutron energies beJow 50 MeV
- 342 -

JAEM-M 90-025
3.15 T R U Transmutation with High Energy Proton Beam
Takahiko Nishida, Hiroshi Takada, Ikuo Kanno, Takakazu Takizuka.
Motoharu Mizumoto, Yasuaki Nakahara, Yoshihiko Kaneku
Departments of Reactor Engineering, Physics and
High Temperature Engineering
Japan Atomic Energy Research Institute
Tokai-mura, Naka-gun, Ibp.raiu-ken
3i9-Il, Japan
Nuclear spallation reaction with high energy proton beam has been
studied to be efficiency used for nuclear transmutation of the long-
lived nuclides generated in the spent fuel in the power reactor. In
particular effective incineration of the transurainum nuclides (TRU) is
ahle to be performed by this reaction. A national program called, "'WiA
, has started aiming at promoting research and development of new
technologies on nuclear waste partitioning and transmutation. JAERI has
proposed the R&D plan for TRU transmutation by proton accelerators with
the following items ; 1) basic analysis of nuclear spallation and
development of simulation code system, 2) design study of TRU
transmutation plant, 3) spallation integral experiment and 4)
development of an intensive high energy proton accelerator. In this
paper we report the proceeding status of these research items, mainly
about 1) and 2 ) . ^
-343 -

JAEM-M 90-025
1. introduction
The higher actinides and fission products in the high-level waste
are hazardous due to their nuctear activities. Of particuiar concern
are the nuclides with very long ha)f-life whose hazard potentiality
remains high for mi))ions of years. Although the vitrification and
geotogical disposal techniques have been widely accepted in many
countries, it is worthwhile that partitioning long-lived nuctides from
high-level wastes and their transmutation are re-examined at present.
The possible use of valuable resources in the wastes and the upgrade of
safety assurance in waste managnent can be performed by estabtishing the
se technologies.
Nuclear spallation reactions with high energy proton beam (above i
GeV) and the subsequent high energy neutron reaction (be)ow 15 MeV) can
be efficiently applied for the transmutation nrocess. in particular,
the transmutation of transuranium nuclides (TRtj) is feasible.
In Japan, a national program, called ONEGA, has started aiming at
promoting research and development of the new technoiogies on nuclear
waste partitioning and transmutation as the long term program. As a
part of the program, Japan Atomic Energy Research Institute set out the
R&D plan for TRU transmutation with proton accelerators. Owing to the
remarkable progress in recent accelerator technology, high energy proton
-induced spallation and subsequent fast neutron reactions become more
attractive as a means of nuctear transmutation. Desirable features of
proton accelerator-driven transmutation plants are pointed out as
fo)lows,
(!) High efficeincy of neutron production
40 -*- 60 neutrons are emitted per one incident proton of 1.5 GeV
in the spallation reaction of a TRU nuclide.
(2) Less hazardous radioactive products than transmutation through
fission
Most of radioactive products from spallation reaction have hatf-
lives shorter than those of long-lived fission products.
(3) Simple and Safe operation of plant
The plant can be immediately shut down by terminating proton
beam because the reactor core (target) is always kept
suhcritical.
- 344 -

JAEM-M 90-025
(4) Fiexibility of design of reactor core
The rector core does not require the criticaiity. Then, the
core design can be done under the retaxed neutronic conditions.
The positive reactivity coefficients are acceptabie.
(5) Energy batance
The reactor core containing the spa)tat ion target can suppiy
sufficient etectricity to operate the acceterator.
(6) Application to other various fietds
* An intensive high energy proton source.
* An intensive neutron source.
X Usefui nuciide productions inciuding tritium and tte and short
-iife Ri .
X Breeding of fissite nuciides
X Materia) researches
X Radiation therapy using proton, neutron and meson.
However there are many technological items requiring researches and
developments as given below,
(a) High-energy and high-current proton acceierator of 1.5 GeV and
severai tens of mA),
(h) Subcriticai reactor containing the neutron producing target
bombarded with intensive proton beams,
(c) Transuranium reprocessing and fue) fabrication technology.
In the present paper the present status of research at JAERI is
described for the following items :
1) basic research of nuclear spailation and devetopmenl of its code
system,
2) basic design study of TRU transmutation system,
3) spatlation integra) experiment,
4) development of an intensive high energy proton acceterator.
2. Acceterator transmutation research at JAER!
Since TRU nuclides, genera)ty, have targer cross sections for high
energy particle than fission products, the feasibitity of TRU
transmutation seems mote promising. Our basic idea is to transoute the*
in a target directty by the high energy proton-induced spat tat ion and
subsequentty by the fission due to neutrons transported into the energy
- 345 -

JAER!-M 90-025
range lower than !5 MeV. A hybrid system, subcritica) reactor with TRU
fuets drived by an intensive proton linear accelerator, is investigated.
2.1 improvement of simulation codes and calculation) oodets
A computing study has been carried out at JAERI to develop our idea
to a realistic engineering concept since 1980. Me have been upgrading
the nuclear spallation codes NUCLEUS" and NMTC/JAER!?'.
There are some discrepancies between calculated and experimental
resutts for both the spallation neutron spectrum and the mass yield
distribution of residual nuclei.3' " We have made some modifications
in the intranuclear cascade mode) to eliminate the discrepancies by
taking intoacount the nucleon-ctuster collision and correcting the
angular distribution of A - particle. Nuclear reactions in the
intranuclear cascade process are treated as a sequence of nucleon-
nucleon two body collision.^' However in the energy range of nucleons
below 200 MeV, the two body collision is not a good approximation. In
addition the mean free path evaluated from the imaginary part of the
potential in the optical model is several times longer^' than that given
by the intranuclear cascade model. The nucleon-cluster collision term
is considered to be effective to modify the intranuclear cascade mode!.
The cluster is assumed to be composed of two or four nucleons. The
probabilities of the nucleon-cluster collision are parametrically given
as a function of the energy. When a collision occurs, the Pauti's
exclusion effect is checked with respect to each nucieon. Since the
forbidden events occur more frequently in the nucleon-cluster collision
than in the nucteon-nucleon one, the inclusion of the nucleon-cluster
collision resutts in prolonging effectivety the mean free path of the
particle injected on a nucleus. The inelastic collision plays an
important role in the high energy region above 600 MeV because of its
large cross section and is treated via the formation of A particle*"
which is heavier by about 300 MeV than the nucleons. If the incident
energy is as high as 800 MeV, a nucteon which produced A - particle can
be recoiled with suffieciently high energy. As the behavier of the
particle, however, is not studied in detail, we calculated its effect by
assuming that the A - particle is recoiled only in the backward
direction of !35*^!80 ° in the center of mass system. Figure ! shows
- 346 -

JAERI-M 90-025
the results of mass yields for 1 GeV proton incidence on gold and
Figure 2 shows those of spallation neutron spectra for 800 MeV proton in
cidence on uranium. As seen from these figures our modification has
improved the current calculation method well and better agreements with
the experimental data have been obtained.
It is also important to obtain the basic and exact knowledge
concerning the transmutation of radioactive waste with long lifetime to
the ones with short lifetime or stable ones, using high energy protons
generated by a linear accelerator. The time evolution calculation of
buildup and decay of all the nuclides produced in the target irradiated
continuously by proton beams is necessary. However there are no code
which make the exact calculation possible because of the enormous
consumption of computing time and computer memory, and the insufficient
compilation of nuclear data in the energy range higher than 20 MeV for
nuclides. Therefore we adopt a calculative model based on the one point
approximation for these processes. The one point depletion code
"CHAIN"' andits supplemental nuclear data library had been developed at
JAERI on thebasis of the Bateman method for the calculations of decay
and build-up of fission products in a nuclear reactor. This code is
being improved to be able to calculate the build-up and decay schemes of
all products including spallation products (SP) and nuclide production
due to proton and neutron fluxes. The nuclear data in the energy range
higher than 20 MeV, as shown in Fig.3, are being compiled also. After
proton-induced nuclear spallation reactions, a variety of nuclei,
especially many neutron-deficient nuclide with mass numbers greater than
180, are produced.'' Figure 4 shows the ( N, Z ) dttribution of the
nuclides which are generated in the spallation reaction and whose decay
constants are unknown yet. The j3 decay constants of some products of
those have been computed by using the gross theory code of /3 decay.^'
The yields of SP were calculated for target nuclei such as ^ ^ N P , 23ap^
, 239p^ 2<apu, ai'Am, 2 ^ ^ 2120, and ^'Cm in the incident proton
energy range, 0.1 GeV to 1.5 GeV.using NUCLEUS.
2.2 Basic Design study of TRU transmutation plant
For the incineration of transuranium waste(TRUV),""'"'^' we
have been making studies on the concept of spallation target systext
- 347 -

JAERI-M 90-025
driven by an accelerated proton beam. The foliowing conditions are
assumed for the design of the target system :
(1) It can transmute the TRUW produced by several commercial 1000 MWe
LVR with 33 GWd/t burnup. The spent fuel is reprocessed after 90 days
cooling, where 99.5 X of U and Pu are recovered. Fission products and
residual U are removed from waste actinides by partitioning process.
(2) It can incinerate about 10 % of TRU fuels a year, (i.e., almost 3
tons of TRU fuel).
(3) It must have the passive safety feature.
(4) It employs the proton accelerator with 1.5 GeV and —10 mA.
(5) It can generate enough electricity to operate the accelerator with
a generation factor and an accelerator efficiency factor to be 0.3
and 0.5, respectively,
Figure 5 (a) shows a model of accelerator-driven TRU target system
with high power proton beams. Thermal energy from the target is rewoved
and converted to electricity by a conventional steam cycle. A part of
the electric power is supplied to the proton accelerator. This target
system is included in a TRU-fueled reactor operated at subcritical (t^ff
: 0.9— 0.95). The target is 2 m long in the beam direction, 1 m high
and 0.85 m wide (Fig. 5(b)). It is surrounded by stainless steel
reflector of 0.2 m thickness. Beam window is located at a depth of 0.7
m from the front face and has a rectangular cross section with
dimensions of 1 m high and 0.1 m wide.
The heat produced in the TRU fuel is removed by forced circulation
of liquid metal coolant. Heat removal performance is a crucial factor
to determine the rate of TRU transformation in the target. Here two
liquid metal coolants, Na and Pb-Bi, are compared. Na is an excellent
heat transfer medium and commonly used for LMFBRs, and Pb-Bi is a
coolant favorable for spallation neutron source.
The target employs metallic alloy fuel of TRUs. A Metallic fueled
core provides considerably harder neutron spectrum than one with oxide
fuel. Harder neutron spectrum will make the transmutation more
effective because of the higher ratio of fission cross section to
capture one for TRU nuclides witn increasing neutron energy. The fuel
consists of two types of alloys, Np-22Pu-20Zr and AmCw-35Pu-5Y. These
alloys are expected to have a sufficiently high phase stability and are
- 348 -

JAERt-M 90-025
proposed for an actinide burner fast reactor'^'. Here Pu is initiatty
added to the fuet in order to tower the reactivity swing. Because of
tow metting point of actinides, e.g. 640 °C for Np, actinides shoutd be
at toyed to achieve a high tinear power rating. With addition of 20 wt%
of Zr, metting point of Np is supposed to increase up to about 900 °C.
One of the disadvantages of actinide at toy fuet is tow thumat
conductivity at high temperature. The fuel assembty in the target is
simitar to that commonty employed in LMFBR design. The fuet pin has a
diameter of 4mm and ctadded with HT-9 steet. To keep the effective
muttiplication factor around 0.95, the pin pitches are chosen 8 mm and
10 mm for Na and Pb-Bi cooted targets, respectivety.
For neutronic catcutations the target-core system is simptified as
an axiat symmetric cyiinder with a length of 2 m and a diameter of 1.04
m surrounded by an annutar reftector of 0.2 m thickness. A circutar
beam window tocated at the center!ine has a diameter of 0.36 m, and the
maximum beam diameter is 0.2 m. The nuctear spattation reaction and
particte transport process above the cutoff energy of 15 MeV are
catculated by NMTC/JAERt code '. Betow 15 MeV the three-dtmensionai
Monte Carto neutron transport code M0RSE-0D"" is used with 52 neutron
group cross section tibrary derived from JENDL-2 and ENDF-B4, where
neutrons stowing down through spattation process are treated as the
source. The resutts of the neutronic catcutations for the target-core m
ode) are summarized in Table !. In the present system, the number of TR
U nuctei transmuted by fast fission is much targer than that by
spaltation reaction. Two-dimensionat power distributions fo the Na and
Pb-Bi cooled target-cores are shown in Figs. 6 (a) and (b), respectivety
. The Pb-Bi cooted target has targer power peaking, and the maximum
power density occurs in the region ctose to the beam window. Thermat
hydrautic calcutations for the target are done to determinethe Maximum
achievabte thermat power within the maximum attowabte temperature ttmits
of fuet and cladding. Maximum temperature in the TRU fue! must remain
betow its metttng point (900 *C). Maximum temperature of the ctadding
tube woutd be timited to 650 °C. and cootant temperature at the target-
core intet is set to 300 °C. Upper timits of coolant vetocity are taken
as 8 m/s and 2.35 m/s for Na and Pb-Bt cootants, respectvety. The
temperature distributions atong the hottest fuet pins, cooted by Na and
-349 -

JAERI-M 90-025
Pb-Bi, are shown in Figs. 7 (a) and (b). in both cases, the maximum
therttta) power is timited by the maximum attowable fue! temperature of
900 °C. tn the case of Na cooting, the maximum thermal power is 769 MM
with the target-averaged power density of 472 wVcc and then the beam
current of 20 mA required. For Pb-Bt cooting, the maximum thermai power
is 236 MM with the target- averaged power density of t45 M/cc, requiring
7.8 mA beam current. The maximum power of Pb-Bi cooied target is
considerably tower than that of Na cooled one. This is mainty
attributed to tower thermat conductivity of the cootant , wider fue) pin
pitch and higher powe peaking factor than in the case of Na cooling.
2.3 Spaitation intergat experiment
For examining the actua! efficiency of TRU transmutation,
spattation experiments on a target irradiated by high energy protons
have to be carried out, .'5'-'6'.'?>.'-a; ,,. search group is preparing
a seris of integra) experiments for some heavy targets, which consist of
a)lead , b)depteted uranium imbedded in lead and c)dep)eted uranium
respectivety, using high energy proton beams with energy of more than
0.5 GeV.
The neutron transport code MORSE-OD was combined with the
spattation code NMTC/JAERt for making the anatysis of a target system
used in the experiment as shown in Fig. 8. Pretiminary anatyses have
been made mainty for the experimentat target of depieted uranium which
is a cytider(60 cm 0 x 100 cm) with a beam injecting hote(7 cm % x 20
cm) at the front face. Figure 9 (a) shows the axial distribution of
proton and neutron ftuxes above 15 MeV and total neutron flux in the ene
rgy range tess than 500 MeV. As seen in the figure, most of neutrons in
the target except near the proton-injected region are likely produced in
the fast fission reaction betow 15 MeV. Totat neutron flux decreases by
two orders from its maximum value at the bottom face but only by a
factor of 1.5 at the side surface in Fig. 9 (b). The energy spectrum of
neutrons escaped from a depleted uranium target has a peak around 100
keV, white that in the case of tead target is ftat in the energy range
tess than 1 MeV because of no fast fissions as shown in Figs. 9 (c) and
(d).
At first the spatlation products and emitted particles in a lead
-350 -

JAEM-M 90-025
target are measured in the experiment to ascertain the spa)tat ion
transmutation of TRU and to verify the overal! feasibility of predicting
spattation performance by the simulation codes. Figure 10 shows the
illustration of a lead cylider target contained in SUS container with
!00 cm tength and 60 cm diameter. The target has several e\perimentat
holes para)tel to the centra) axis of rytinder, which are ptuged by
specimen wires (Ni, At, Au, Nb, Cu, Fe) to measure high energy reaction
products and the neutron energy at each position with yactivation
method by a Ge(Li) detector. Proton beams with energy of 500 MeV. the
intensity of which can he control ted by the switching magnet newly
equipped on the beam tine, goes to the target from the teft direction.
For many cases specimen in the target are irradiated with the beam
current of tOO—10 nA in an hour andcooted in about five hours to obtain
their activities suitabte to measurement.
For the next step, a uranium target is used to simutate the TRU
target spaltation experiment before the direct irradiation of TK(j
nuctides, we are ptanning a series of proton-induced spattatton
integrat experiments on depleted uranium targets to examine the
characteristics of a spaltation target.
2.4 Devetopment of intensive proton acceterator
The devetopment of proton accelerator proposed for spallation
transmutation is considered to be an extraordinary technoiogical
challenge. The proton beam current to mA is nearty tO-^-tOO times larger
than that for exisiting machines for basic nuctear physics experiment.
The intensive proton acceterator is positioned far beyond the experiment
area. Onty tinear acceterator can passivety satisfy the requirements of
high beam current with higher efficiency of beam extraction than other
circutar machines such as cyctotrons and synchrotron. High beam quatity
is required to reduce beam spitts as smalt as possibte because of the
severe problem for the high energy radiation protection.
The research plan for devetoping the high-energy proton tinac (1.5
GeV, tO mA) is now proposed at JAER). Figure H shows a schematic
it lustration of the proposat arragement of engineering test proton
linac in totat tength -- 700 m, which consists of (a)ion source, (b)
Radio Frequency Quadrupole tinac, (c) Drift Tube Linacs and (d) DTL &
- 351 -

JAERI-M 90-025
high /3 linac with the output beam energies of 100 keV, 2 MeV. 10 MeV
and 1.5 GeV respectivety.
As the first step of the devetopment, the low energy part of the
accelerator structure included in the solid iine square as shown in Fig.
H wit! be carefully studied through the construction of the smaller
linac with current of 10 mA and energy of 10 MeV, because the beam
quality is mainly determined at the low energy part. The accelerator
structure will consist of these components as follows ; the ion source,
RFQ and OTL. High /3 structure wilt be considered seriously as the 2nd
step of the d^/elopment.
3. Summary
Improvements of spallation reaction simulation codes have been made
aiming at predicting the transmutation ability with high precisions.
The upgrade of the simulation codes and development of code system for
design sutdies of transmutation plant would be begun in the near future
. Preliminary design studies were made for the accelerator-driven TRU
transmutation target system. When the ha cooled target-core is operated
at the thermal power of 769 MV and the beam current of 20 mA. this
system can transmute about 250 kg TRU annually. Improvement and
optimization of target-core system design will also be required for more
efficient transmutation.
A series of spallation integral experiments for a lead target is
prepared and a uranium target will be used for the second step of
experiment. The investigations of basic technologies have started in
order to develop the high-energy and high-current proton accelerator
for spallation transmutation. At first the smaller size tinac with
current of 10 mA and energy of 10 MeV will be constructed.
Fhis Research & Development should he actively performed as the
part of national program.
Acknowledgeoent
The authors would like to express thanks to Dr. K. Ishibashi for
his valuable advice and discussions.
- 352 -

JAEM-M 90-025
References
1) T. Nishida, Y. Nakahara, T. Tsutsui: JAERI-M 86-H6 (198H)
(in Japanese)
2) Y. Nakahara, T. Tsutsui: JAERI-M 82-198 (1982) (in Japanese)
3) S.D. Ho^e et al.: " Neutron Spectra from 800 MeV (p, xn) react tons
on target of A!, Cu, In. Pb and U," ).A-UR-85-33(iO (1985)
4) S.B. Kaufman. E.P. Steinberg : Phys. Rev. C. 22. Ki7 O980)
5) R. Serber: Phys. Rev.. 72, !1)4(1947)
H) tt.Q. Meyer, P. Sch^andt : Phys. Lett., 107B, 353 (1981)
7) R.M. Sternheimer, S.J. Lindenbattm: Phys. Rev. J05. !874 (1957) ;
109. !723 0958) ; j_23, 333 (1961).
8) K. Tasaka : JAERI-M 8727 (1980)
9) T. Yoshida : JAERI-M 63t3 (1975)(in Japanese)
!0) P. Bounnaure, et a!., " Actinide Transmutation by Spattation in the
Light, of Recent Cyclotron Development." NEACRP-A-910 0988).
tl) T. Mukaiyama, et al..:" Conceptual Study of Artimde Burner Rea< tor
s." Proc. t988 Int. Reactor Physics Conf. (Jackson Note, 1988)
)2) T. Taktzuka, et at.,:" A Study of Incineration Target System."
Pioc. 5th Int. Conf. Emerg. Nucl. Energ. Sys. (Kartsruhe. !989)
(to be pubt ished)
t3) It. Takano, T. Mukaiyama :" Nuclear Characteristic Anatysis of TRU
Burner Rreactors", JAERI-M 89-072 (t989)(in Japanese)
t4) M. Nakagawa, et at.. " MORSE-DD A Monte Carto Code Using Mutti-
Group Double Differentia! Form Cross Sections," JAERt-M 84-12H
(1984)
!5) S.S. Cierjacks, et at.:"High Energy Particle Spectra froa SpaXation
Target," ICANS-V, 098!)
)6) H. Takahashi :"Anatysis of Neutron Yield from High-energy Proton
Bombardment of Uranium Targets", Nucl. Sci. Eng. 87 432-443 (t984)
17) SJ. Amian, N.F. Peek, D.J. Shaddan, G. Sterzenbach : " Production
Rates of Spattation and Fission Products in Depieted Uranium and
Natural Lead Targets Bombarded by 600 MeV and 1100 MeV Protons",
Proc. of tCANS-Vtt, 0983)
18) J.S. Gitmore, G.J. Russell, H. Robinson, R.E. Praet : " FertHe-
to-Fissite and Fission Measurements for Depteted Uranium and Thoriuo
Bombarded by 800 MeV Protons", Nucl. Sci. Eng. 99, 44 0988)
- 353 -

JAERI-M 90-025
Table 1 Nuclear c h a r a c t e r i s t i c s of the r eac to r core of inc ine ra t ion p lant
Coolant Na Pb-Bi
Effective Multiplication Factor Spallations/Proton total
actinide Emitted Neutrons/Proton Fissions/Proton' ( > 15 MeV )
( < 15 MeV ) Average Neutron Energy ["keV]
0 . 9 5
6 . 8 2
1 . 6 6
3 7 . 9
0 . 9 6 3
94
6 9
0 . 9 6
7 . 2 1
0 . 5 3
5 3 . 9
0 . 3 9 5
1 5 1
3 0 6
l O f m n r - r
10'
UJ
en CO O
10
10
• x Ex ra i «n r (WUFW.X) a KSTC 2STEP o p resent ca l
~m
•
• " I f X
i r..... i., — i _ . _ t
culati
2Z>o
*
.
on
g :
T ° O J o o
1° :
s •
I 1" I I . 1 1 . 1 1 1 t I I I . ;
x EXPEaittEHT 'a-t. — HETC 2STEP
ii' \~ —Present ca l .
30" j —
10
1" io' zz. O
5 io" t o t o t o
§ io"
120 HO 150 180 200 10
MASS NUMBER
Fig. 1 Mass yield distribution for 1 GeV proton incidence on a gold nucleus
10 10 10' 10 NEUTRON ENERGY (HsV)
Fig. 2 Spallation neutron spectra for 800 MeV proton incidence on a uranium nucleus
- 354

JAERI-M 90 -025
INELASTIC SCATTERING CROSS SECTION
1 .5 1
Fig. 3 Inelastic scattering cross section of heavy metals such as U, Bi, Pb and Sn in the energy range of 0.2 to 1.8 GeV
o.o
0.6
o X
0.4
0.2
0.6 0.8 N ( X10 !)
I .6
Fig. 4 Distribution of nuclides which are generated in the nuclear spallation reaction with unknown half life times on the plane of neutron number and atomic number
- 355 -

JAERI-M 90-025
196/56MW
Electricity 256/79 HW
1.5 GeV 20/7.8 mA
Primary
Cooling Circuit
Na/Pb-Bi
(a) System diagram
Acfinide Fuel/Coolanf
Dimensions in m
(b) Reactor core
Fig. 5 Concept of accelerator-driven incineration reactor
356-

JAERI-M 90-025
Fig. 6 Power distributions in (a) Na cooled and (b) Pb-Bi cooled cores
FWI Surface Clod Oultidi
rod Cfnlrr
Clod Inside
Csotant
f<M Surfoct
Clod Outside
000
500
n
I ' i r - T i —
' (b)
1 M 0.5 y [ml
Fig. 7 Temperature distributions in (a) Na cooled and (b) Pb-Bi cooled cores
-357 -

JAERI-M 90-025
NHTC/JAERI
Hisfory file
SPEC
Neurron Source
file
NMTA Fission Spectra
MORSE-DD
ENDF or
JENDL
Selected ENOF
or JENDL
DDX library
HCFILEF
"^T
RESENDO
SPINPTF
PROF-DOX
DDXLIBHK
Control fRe
PROF-DDX] Input file
Masher file
Fig. 8 Code system developed for spallation & transport calculation
358 -

JAERI-M 90-025
1° r
5 10" .. o DC Q_ Csl y v
x 3
2 O
I -
20 40 60 BO DEPTH (CH)
(a) axial distribution of proton and neutron fluxes O '• total neutron flux A : neutron flux above 15 MeV + : proton flux above 15 MeV
100 10 20 30 RRDIU'S (CH)
(b) total neutron flux distribution in the radial direction
10- .10"' lO" 10" 10' 10' 10' "NEUTflON'-ENERGY (MEV) 10"'
10" 10 •' 10"' 10" 10' 10* . 10" NEUTRON ENERGY (riEV)
(c) energy spectrum of neutrons from (d) enersy spectruB of neutrons fro* a depleted uranium target a lead target
Fig. 9 Preliminary neutronic calculations for experimental bulk system to validate prediction accuracy of NMTC/JAERI
- 359 -

to o
beam injection hole
t a r g e t plug t a rge t lead SUS conta iner
experimental holes 30»Sx3 91X9
7 -ur SUS thin p la t e s
500 500
> 2 7 to o I o C\3 en
U n i t : mm
Fig. 10 Design of a lead cylindrical bulk system used for the spallation integral experiment

Engineering Test Accelerator
Development f o r B a s i c A c c e l e r a t o r Techno logy
ION S O U R C E RFQ DTL
(ft Ulffii D O
IQrjKeV /?MeV l\M
DTL
H3E] ¥
(±)dD\\C±D I a. L
HIGH 0 LINAC
[RH fRFi IR3 m Mm miB
p>
5Msl. /innMev ZL 5GeV I OmA
Ififiii Scilt l(il!)/il Ei), Tiffil ftd-Uf T«l lm/iilin Ttil
PriUIIH [if, IdWii l in Tnl Lirji Still l i i ijril Inl.Kiiiriil SlWr f iDd Tttboelm,Huthir Dili
>
f < - 5 i» -*-f« • 5 n »]•* l 5 m *•[< B 5 m *\<- 550 m
000 m
Fig, 11 Layout of intensive proton accelerator for engineering test

JAER1-M 90-025
3.16 Proton Induced Spallation Reaction Calculation Considering the Intranuclear High-Momentum Nucleons and the Preequilibrium Effect
K. Ishibashi, Y. Hiura, T. Sakae, Y. Matsumoto, Y. Watanabe,
A. Katase,* H. Takada,** T. Nishida,*^ Y. Nakahara** and Y. Kaneko**
Department of Nuclear Engineering, Kyushu University
Hakozaki, Higashi-ku, Fukuoka-shi
Abstract
The double differential cross section of neutron production is
calculated for the spallation reaction that is induced by incident
protons of several hundred MeV. The intranuclear nucleons with high-
momentum component are introduced into the High Energy Transport Code
(HETC). The consideration of such nucleons is useful in the reproduction
of the yield of the high-energy neutrons in the backward direction. The
intranuclear cascade process calculation is terminated taking the pre
equilibrium effect into account in a local manner. The use of this
method successfully represents the shape of the neutron spectra of an
intermediate energy.
1. Introduction
The spallation reaction is caused by bombarding targets with
particles having an energy above a few hundred HeV. The reaction
produces a number of neutrons and the plan is apply it to such
facilities as the intense spallation neutron source and the
transmutation of long-lived radioactive wastes. Some computer codes have
been developed for designing these spallation facilities. Nucleon Meson
Transport Code (NHTC)'-"' and High Energy Transport Code (HETC)^"" are
famous as Monte-Carlo particle-transport codes in the energy region of
the spallation reaction. These codes basically consist of two types of
calculations, which are on the intra-nuclear spallation reaction and the
inter-nuclear particle transport. This paper deals with only the foraer
calculation, and concerns itself with the experimental data taken by the
use of thin targets.
These codes employ the intranuclear-cascade evaporation (INCE)*'*'
* Faculty of Engineering, Tohwa University
** Japan Atomic Energy Research Institute
- 362 -

JAERI-M 90-025
model for calculation of the spallation reaction. This model consists of
two processes of intranuclear-cascade and evaporation, and is coded with
the Monte Carlo algorithm. The programs reproduce the overall character
istics of the spallation reaction fairly well. Nevertheless, the
calculation results have some systematic discrepancy from experimental
data. For example, the yield of the high-energy neutrons emitted in the
backward direction are underestimated by an order of magnitude. Although
the experimental energy spectra of neutrons have a shoulder in the
region of 20 to 50 MeV, the computation results do not possess this
shoulder at all. We will attempt to clarify the reason for the
disagreement, and to modify the HETC to improve its characteristics. In
the present paper, the intranuclear nucleons with high momentum are
introduced into the intranuclear cascade calculation, and the
preequilibrium effects are considered at the end of this cascade process.
2. Improvement of the HETC
The experimental neutron spectra are shown in Fig. 1 by the use of
cross marks. The experiment"' was made at SIN, where protons of 585 HeV
were incident on a thin lead target. The dashed lines represent the
results of the HETC that is based on the INCE model. The program used
was the version that was modified by F. Atchison*' to incorporate the
high-energy fission. The level density parameter was chosen as A/8 MeV *,
and was slightly corrected^' depending on the atomic mass A and number Z
of the nucleus according to LeCouteur. The differences between results
of the calculation and the experiment are as follows:
1) In the backward direction, the dashed lines underpredict the yield
of the experimental high-energy neutrons above 100 MeV.
2) The shoulders in the experimental 'pectra in the region of 20 to 50
MeV do not appear in the calculation results.
2.1 Intranuclear nucleons with higher momentum
In the HETC, the Fermi gas model was assumed for the momentum
distribution of the intranuclear nucleons. This code presumed the
degenerated Fermi distribution of the zero temperature. It is suggested,
however,that there may exist some nucleons that have a higher momentum*'
than that of the degenerated Fermi distribution. For momentum
distribution, reference 6 gave the following probability W(p) per unit
volume in the momentum space:
W(p)= W. (exp(-(p/p<,)") + €,,exp(-(p/q.)3) + t,exp(-(p/qj') } , (1)
- 363-

JAERI-M 90-025
vhere p is the momentum, p0 = v^(2/5)kf , £o=0.03, q0 = v^(6/5)kr , «i =
0.003, qi = 0.5 GeV/c, kf is the Fermi aoaentua, and Wo is a normal
ization factor. The third term in Eq.(l) was derived froa a correlated
two-nucleon-cluster model. This tera represents the effective aoaentua
component which is useful for representing the collision phenoaena.
Equation (1) is coaposed of three teras that have a function type of
exp(-x2). Since the surface area of the sphere of the aoaentua space is
proportional to p2, the probability density function is given by the sua
of functions with the type of x2 exp(-x2). We saaple the nucleon
nonentum by the Monte Carlo algorithm in accordance with the calculation
method of the HETC.
The solid lines in Fig. 1 show the calculated results using the
momentum distribution given by Eq. (1). At an angle of 150 degrees, the
dashed lines produced by the standard HETC appreciably underpredicted
the neutron spectra for an energy above 100 HeV. This discrepancy is
removed by the calculation that assumes the distribution of Eq. (1).
However, the neutrons of 15 to 50 MeV are overestimated in the solid
lines. Adoption of nucleons with the higher momentum thus leads to the
emission of neutrons of higher energy.
2.2 Termination of the intranuclear cascade process
The cascade process assumes that incident nucleons collide with the
intranuclear nucleons in a manner of the quasifree collision and Pauli's
exclusion law is applied to this collision. In the standard HETC, a
cutoff energy Ec is used2' for terminating the calculation of the
cascade process: When no particles in the nucleus go over the potential
barrier Ec for particle emission, the cascade process is terainated.
From the results in section 2.1, it is important to reduce the number of
emitted neutrons in the energy region of 15 to 50 NeV.
From the view point of the cascade model, the aean free path of
particles moving in a nucleus increases rapidly as the kinetic energy is
reduced below 80 HeV. This is because Pauli's exclusion law inhibits the
particle collision to a great extent at the low energy.7' The prob
ability of the particle emission increases with the Bean free path.
Hence, the above behavior of the aean free path is considered to be the
reasons for the overestiaation in the range of 15 to 50 NeV in section
2.1. In the low energy region, thus, the cascade model represents the
neutron spectra that are different from the actual phenomena.
To iaprove the spectra in this region, we utilize a probability
- 364 -

JAEM-M 90-025
density function f(E<J for terminating the cascade process in a
reasonable way. By using a parameter Eo* the function is written by
f(Ej = 2 E. ' (l-E./E.) . (2)
The value of E. is thus chosen from 0 to Eo with an energy dependent
probability. The usual evaporation calculation of the HETC is made after
the termination with this method. The calculation results are shown in
Figs. 2 to 7 where Eo = 40 MeV. Whereas the experiments for uranium and
lead were made at LANL at an incident proton energy of 800 MeV,*'^' that
for uranium, lead, indium and iron were done at SIN at 585 MeV.^ In
Figs. 2 and 3, the data of 30° were taken from reference 9 and that of
45 and 110" from reference 8. The solid and dashed lines indicate the
results of the present calculation and the standard HETC, respectively.
The target nucleus and the incident proton energy for Fig. 5 are both
the same as Fig. 1. The overestimation of neutron yield appeared for the
solid lines in the region of 15 to 50 MeV in Fig. 1. This tendency is
greatly improved in the solid lines in Fig. 5, and the shape of the
shoulder in this energy range is reproduced to a considerable extent.
Such an improvement is seen for all solid lines in Figs. 2 to 7.
3. Discussion on the cutoff energy
The use of the probability density function f(Ec) led to the suc
cessful reproduction of the shoulder in the neutron spectra. To clarify
the reasons for this improvement, we first calculate the particle
emission probability on the basis of the cascade model. The emission
probability of a particle moving in a nucleus is averaged for all
location and orientation as follows:
r - /f exp(-d(r. D)/A)drdO ,.,1
1 <-s - F drdQ ' t**'
where r and Q are the location and orientation vectors of the
particle considered in a nucleus, respectively. The function d(r,Q)
shows the distance between the particle location and the nuclear
boundary along the vector Q . The mean free path A is determined^' by
both the binary collision cross section and the nucleon density in the
nucleus, taking Pauli's exclusion law into account. The value of 1
then is dependent on the kinetic energy of the moving particle. The
average emission probability of neutron T..- is shown in Fig. 8 for
nuclei of aluminum to lead. The excitation energy scaled in the abscissa
indicates the kinetic energy that is subtracted by the Fermi energy.
The emission probability of particle r„,-c is also obtained by
- 3 6 5 -

-JAERI-M 90-025
the exciton model with a few exciton state. The probability T p r e is
calculated for a nucleus having an excitation energy E and containing p
particles and h holes (n=p+h excitons):
i / E" BX c( P,h,E,T)dT r p r e = -J * 7^-^ :— . <4>
p X. + X0 + X, + / A.c(p,h,E,T)dT
Vhere Xc is the probability of particle emission per unit time and
energy. For the interaction of particles and holes, X* is the
probability for creation of a particle-hole pair per unit tiae, while
X- is that for recombination of the pair. The symbol X0 shows the
probability of the interaction that leads to no change of number of
particles and holes. In the integral of Xc , T is the kinetic energy of
the particle after emission, B the binding energy, and v the potential
barrier. The value of v is taken to be zero for neutron emission for
simplicity. A two-particle (p=2) and one-hole (h=l) state is chosen for
computation. The Kalbj onstant l 0 , l l ) used for the transition matrix
element is k = 100 to 600 MeV 3 . The ratio of r p re/r caa is plotted
for neutron emission in Fig. 9 for lead nucleus. While the abscissa
shows the excitation energy per exciton E/(p+h) for r Pre » it does the
kinetic energy subtracted by the Fermi energy for Tea. . The ratio
increases linearly up to about 60 MeV, and then becomes constant. As
seen in the figure, T p r e is nearly equal to Teas at about 50 MeV for
K=400 to 600 MeV3 for lead. The energy for r Pr« ~ r c a « increases
slowly with decreasing the mass number, and for instance becomes 10 %
larger for indium than for lead.
Let us suppose that a nucleus is near the end of the cascade
process and contains a particle which would have a kinetic energy T
outside the nucleus. The value of T is expressed by the excitation
energy of the particle subtracted by the binding energy B. In such a
case, this paper treated the particle as follows: The cascade
calculation was terminated with the probability proportional to f(T)
given by Eq.(2), w^ Teas it was continued with that proportional to
Eo/2 (2/E0-f(T)) =T/E0. In other words, the probability of the particle
to stay in this process decreases linearly with kinetic energy T. When
the shape of the results at about K=500 MeV"1 is taken into account,
therefore, the probability proportional to T/Eo is a good correction of
the cascade model with regard to the preequilibrium effect. The
three-exciton state was chosen in Fig. 9, and it seems to be reasonably
consistent to the cutoff parameter of Eo=40 MeV below which the pre-
- 366 -

JAEM-M 90-025
equilibrium effect becomes appreciable.
On the other hand, when particles are emitted from the pre
equilibrium state, their average kinetic energy after emission is close
to the excitation energy per exciton. The average nutber of excitons
produced in the cascade process is actually about 15 in the case of 585
MeV proton incidence on lead. The use of the whole number of excitons
into Eq. (4), however, leads to a lower excitation energy per exciton,
and fails to explain the empirical magnitude of Eo. Hence, the pre-
equilibrium state of a few excitons is plausible near the end of each
history of cascade. We considers that the kinetic energy of particles in
such state may be much higher than in the usual preequilibrium state
widely accepted in the intermediate energy region. In fact, if the
intranuclear particle has a kinetic energy of 80 MeV, for instance, its
de Broglie wave length is 3.1 fm and is fairly short in comparison with
a size of nucleus. The usefulness of considering a few excitons suggests
to us that the preequilibrium effect does not extend over the entire
nucleus, but works in a local manner.
4. Monte Carlo calculation based on the exciton model
Between the intranuclear-cascade and the evaporation processes, the
exciton model'"' is adopted for the calculation of the preequilibrium
process in the whole region of the nucleus. The Monte Carlo algorithm*^'
is again used for the computation. The exciton model calculation is
started by the use of exact numbers of both particles and holes that
have been produced in the intranuclear cascade calculation. The angular
distribution of neutrons that are emitted from this process is
determined by the systematics given by Kalbach-Mann.*^' Even J's are
utilized in this study, since it is considered to correspond to the
multistep compound process.^' This preequilibrium calculation is fol
lowed by the usual evaporation process of HETC.
The computation results are shown in Fig. 10, where 585 MeV protons
were incident on lead. While the dashed lines indicate the results of
the standard HETC, the solid ones show that of the present calculation.
The shoulders at the energy of 15 to 50 MeV are reproduced well in
almost the same manner as in Fig. 5 In the backward direction, the
solid lines at 10 to 15 MeV are closer to the experimental data in Fig.
10 than that do in Fig. 5. The present calculation of the exciton model
produces neutrons having an almost isotropic angular distribution. In
contrast, the cascade process gives the neutrons emitted with a
- 367 -

JAERI-M 90-025
forward-peaked angular distribution. In the forward direction, thus, the
cascade process yields the intermediate-energy neutrons of which number
is a few times as large as that of the exciton model. The effect of the
exciton model on the intermediate-energy neutron spectra is not
appreciable in this direction. Therefore, the introduction of the
exciton model into the HETC was useful only to represent the backward
neutrons of the intermediate energy.
5. Conclusion
We considered the intranuclear nucleons with higher momentum, and
successfully reproduce the experimental high-energy neutrons in the
backward direction. The preequilibrium effect was considered in a local
manner, and this was introduced as a simple probability density function
for terminating the intranuclear cascade process. The resultant neutron
spectra reproduced the shoulders of the experimental data in the region
of 20 to 50 MeV. The exciton model was coded with a Monte Carlo
algorithm. The effect of the exciton model calculation was not so
appreciable except for the intermediate energy neutron in the backward
direction.
Acknowledgment
The authors gratefully acknowledge F. Atchison of PSI for his
supplying his version of the HETC.
References
(1) COLEMAN, W.A., ARMSTRONG, T.W.: Nucl. Sci. Eng. 43, 353 (1971).
(2) NAKAHARA, Y., TSUTSUI, T.: JAERI-M 82-198 (1982).
(3) ARMSTRONG, T.W., et al.: N'icl. Sci. Eng., 49, 82 (1972).
(4) ATCHISON, F.: RL-81-006 (1981).
(5) CIERJACKS, S., et al.: Phys. Rev. C36, 1976 (1987).
(6) HANEISHI, Y., FUJITA, T.: Phys. Rev. C33, 260 (1986).
(7) RIKUCHI, R., KAWAI, M.: "Nuclear Matter and Nuclear Reactions" p.33
(1968), North-Holland, Amsterdam.
(8) Howe, S.D., et al.: LANL-85-3660 (1985).
(9) MEIER, M.M., et al.: Radiation Effects, 96, 1415 (1986).
(10) Gidima, R.K.: Nucl. Phys. A401, 329 (1983).
(11) RALBACH, C.C.: Nucl. Phys. A210, 590 (1973).
(12) NAKAHARA, Y., NISHIDA, T.: JAERI-M 86-074 (1986).
(13) KALBACH, C , MANN, F.M.: Phys. Rev. C23, 112 (1961).
- 368 -

CO
to
10° 101 102
NEUTRON ENERGY (HeV) 10*
Fig. 1 Double differential cross section for lead at laboratory angles of 30, 90 and 150°. The incident proton energy is 585 MeV. Cross marks indicate the experimental data.5) Dashed lines show the cal culation results of the standard HETC, and solid ones that of the present method with the high momentum component and the cutoff energy of Ec=0.
] \j ETTTmr 1—i 1 nui | 1—nr \ nrq 1—i—r
10° 101 102 103
NEUTRON ENERGY (MeV)
Fig. 2 Double differential cross section for uranium at laboratory angles of 30, 45 and 110°. The incident proton energy is 800 MeV. Cross marks indicate experimental data.8'9' Dashed lines show the calculation results of the standard HETC, and solid ones that of the present method which considers the high momentum component and the cutoff probability f(Ec) with Eo=40 MeV.

\Q M I MM; 1 i i •••'•! • • ' m m 1 i 1
• • •*»* * i .t.ujul .
10° 101 102 102
NEUTRON ENERGY (HeV)
Fig. 3 Double differential cross section for lead at laboratory angles of 30, 45 and 110°. The incident proton energy is 800 MeV. The other explanation is the same as in Fig. 2.
NEUTRON ENERGY (MeV)
Fig. 4 Double differential cross section for uranium at laboratory angles of 30, 90 and 150°. The incident proton energy is 585 MeV. Cross marks indicate experimental data. ' Dashed lines show the calculation results of the standard HETC, and solid ones that of the present method which considers the high momentum component and the cutoff probability f(Ec) with Eo=40 MeV.

10° 101 102 103
NEUTRON ENERGY (MeV)
Fig. 5 Double differential cross section for lead at laboratory angles of 30, 90 and 150°. The incident proton energy is 585 MeV. The other explanation is the same as in Fig. 4.
ioV
10" 1 '••••' •'
10° 101 102
NEUTRON ENERGY (MeV)
>
o I o to
Fig. 6 Double differential cross section for indium at laboratory angles of 30, 90 and 150°. The incident proton energy is J85 MeV. The other explanation is the same as in Fig. 4.

NEUTRON ENERGY (NeV)
F i g . 7 Double d i f f e r e n t i a l c r o s s s e c t i o n fo r i r o n a t l a b o r a t o r y a n g l e s of 3 0 , 90 and 150° . The i n c i d e n t p r o t o n ene rgy i s 585 MeV. The o t h e r e x p l a n a t i o n i s the same as i n F i g . 4 .
20 40 60 60 100 120 U0 Excitation Energy [MeV]
> m 2 7 2
Fig. 8 The particle emission probability calculated from the intranuclear cascade model. The abscissa indicates the kinetic energy of neutron subtracted by the Fermi energy.

I CO -J CO
I
2.5
2
[_ 1.5
_K=100 .
; .K=300
*^"\=500;
Pb (2p,1h) 'K=600
. r
20 40 60 SO 100 120 Excitation Energy [HeV]
140
Fig. 9 The ratio of the particle emission probability based on the exciton model to that on the intranuclear-cascade model. A two-particle and one-hole state was assumed for the exciton model calculation.
NEUTRON ENERGY (MeV)
Fig. 10 Double differential cross section for lead taking the exciton model into account. The incident proton energy is 585 MeV. Cross marks indicate experimental data. ' Dashed lines show the calculation results of the standard HETC, and solid ones that of the present method which utilizes the Monte Carlo exciton model in addition to the high momentum component and the cutoff probability f(E c) with E o=50 MeV.

JAERI-M 90-025
3.17 Measurement of the U-238 Capture Cross Section with Neutron Filtered Beams
Katsuhei Kobayashl, Shujl Yamamoto and Yoshiaki Fuj1ta
Research Reactor Institute, Kyoto University
Kumatori-cho, Sennan-gun, Osaka 590-04 Japan
By using the linac time-of-fllght method and Fe and/or SI
filtered neutrons of 24, 55 and 146 keV, the 2^°\J neutron capture
cross sections were measured relative to the standard cross sec
tion for the 10B(n,a 7 ) reaction with a pair of CgDg scintilla
tor placed at the 12.4 m station. The measured value at 24 keV
was normalized to 0.47 b appeared in the ENDF/B-VI file. The
present data agree with the recent evaluations in ENDF/B-VI and
JENDL-3 released very recently, and moreover with the recent
measurement by Kazakov et al. The experimental uncertainties
are 6 to 8 %, which are mainly derived from the counting statis
tics in the filtered neutrons. More careful works may be re
quired in the data correction and uncertainty analysis for the
present preliminary measurement.
1. Introduction
The new evaluated data for the ^38U(n, 7 ) reaction cross
section appeared in the recent papers* ^ have been revised to be
smaller by more than 5 to 10 % than old evaluated data and/or
most of the experimental data in the energy region from 10 to 300
keV. The revised data, however, show a good agreement with the
experimental data which have recently measured by Kazakov et
-374-

JAERI-M 90-025
al.4). The evaluated data also gave better agreement with the
integral measurements in effective multiplication constants and
spectral indices of 2 3 8 u capture related data such as
a C(238)/<T f(235) or a c(238)/<r f (239)2) . Moreover, the evalu
ated data file JENDL-3 has been released very recently5'. In
such a situation for the 2 3 8u data, much interest has been paid
to the capture cross section, especially in the ten to hundreds
keV energy region.
Neutron total cross section minima are observed at 24 keV
for iron and 55 and 146 keV for silicon, respectively6-9'.
Then, the thick layer of Fe and/or Si materials can produce
semi-monoenergetic neutrons from the white neutron beam as fil
tered beams of 24 keV, 55 and 146 keV, respectively. The thick
filter materials can reduce backgrounds from the intense source
to give a good signal-to-background ratio, and are useful for the
determination of background level and for the precise measurement
of neutron capture cross sections9,10'. Especially, the fil
tered beam techniques are adequate to the capture cross section
measurement with high gamma-ray background like an uranium sam
ple.
In the present measurement, capture cross section for 2 3 8u
has been obtained by the iron and silicon filtered beams and the
time-of-flight method using a linear accelerator (linac). The
obtained results were normalized to the reference value of 0.47 b
at 24 keV and compared with the recent measurement and evaluation
at energies of 55 and 146 keV.
2. Experimental Method
The capture cross section measurement was made by the time-
of-flight (TOF) method using the 46 MeV electron linear accelera-
- 375 -

JAERI-M 90-025
tor at the Research Reactor Institute, Kyoto University (KURRI.).
The experimental arrangement is shown in Fig. 1.
Bursts of fast neutrons were produced from the water-cooled
photoneutron target, which was made of 12 sheets of Ta plates 4.8
cm in diameter with an effective thickness of 3 cm'] '. This
target was set at the center of an octagonal water tank, 30 cm
diameter and 8 cm thick, to moderate the neutron energies.
Experimental parameters and conditions for the Fe- and Si-
filtered beams are summarized in Table 1. The ^3°u capture
sample used was in the form of natural uranium metallic plate, 3
x 3 cm square and 1.5 mm thick. The energy dependent cross
section for the 10B(n,a r ) reaction was taken as a standard12^
for the 2 3 8 u capture measurement at 24, 55 and 146 keV.
Background measurement for the filtered beam experiment was made
to experimentally investigate the effect of scattered neutrons
with a Pb plate, 5 x 5 cm square and 3 mm thick. A 0.5 mm thick
Cd filter was applied to suppress overlap of thermal neutrons
from previous pulses. Energies of the TOF neutrons from source
to detector were checked by the resonance structures from the Fe
filters. Total thickness of each Fe and Si material is 20 cm
and 92 cm, respectively, and the typical filtered beams obtained
are shown in Figs. 2 and 3.
A pair of C6D6 scintillators (NE-230) 11 cm in diameter and
5 cm thick was mounted on an RCA-4525 photomultiplier and used as
a capture gamma-ray detector located at 12.4 m distant from the
photoneutron Ta target. Capture signals from the scintillators
were fed into a fast amplifier and discriminator. A coincidence
circuit was employed between the scintillators to improve the
signal-to-noise ratio for the 2 3 8u capture measurement. A time
digitizer was initiated by the KURRI linac burst and the TOF data
were stored in a data acquisition system, Canberra's Series 88
multi-parameter analyzer which was linked to a PDP-11/34 comput-
-376 -

JAER1-M 90-025
er.
In order to normalize the neutron intensity between the
experimental runs, a BFg counter was inserted in the neutron beam
to measure the TOF spectrum.
3. Data-Taking and Reduction
Capture events were observed by integrating the data in the
TOF channel region of the full width at half maximum (FWHM) of
the filtered neutrons, as seen In Figs. 2 and 3. The background
levels were determined from the time spectrum data in the front
and rear channel regions of the relevant filtered neutrons.
Moreover, background counts for the filtered neutrons were de
duced with a lead sample equivalent to the thickness of the
scattering cross section for the uranium capture sample. It was
found that the background contribution to the 2 3 8U capture counts
was almost 40 % at 55 and 146 keV.
Capture events for *-®B and 238(j s a m p i e s a r e counted with the
following procedures:
For 24 keV,
C24(B) = r, 24(B) Y24(B) F 2 4 , Y24(B) = NB tB a 24(B)
C24(U) = 7, 24(U) Y24(U) F 2 4 , Y24(U) = Ny tv a 2 4(U).
For x keV(146 and/or 55 keV),
CX(B) = V X(B) YX(B) Fx , YX(B) = NB tg a X(B)
CX(U) = v X(U) YX(U) Fx , YX(U) = Ny ty a X(U) .
C, 7] , Y, F, N, and t show count, efficiency, yield, flux, atomic
density and sample thickness, and the subscripts 24 and x mean
the relevant filter energy, and B and U indicate 10B and 2 3 8u
samples, respectively. Since the cross section values for the 10B(n,a 7 ) reaction are well known, we referred it as a stand
ard12', for the present measurement. By assuming the relation
-377-

JAERI-M 90-025
n 24'^' = "l x'^' t n e capture cross section can be easily ob
tained as
C24(D) C„(U) (TX(B) 0"(U) = — £ Z * 2 x(T24(U) x C24(U) CX(B) 0"24 (B) ^4
where a 24^E^ ^s a reference value of the 2 3 8U capture cross sec
tion at 24 keV.
4. Results and Discussion
Preliminary results for the 238U(n,7 ) reaction are given in
Figs. 4 and 5, whose original drawings were taken from the Froh-
ner s paper0', comparing with other measurements and the evaluat
ed data JENDL-3. When we normalize our data to 0.47 b at 24 keV
in ENDF/B-VI appeared in the cited figure, the cross sections at
55 and 146 keV are 0.291 b and 0.147 b, respectively, with the
experimental uncertainties of 6 to 8 *. We have assumed the
detection efficiencies of CgDg scintillators at 24 keV are equiv
alent to those at 55 and 146 keV. Contribution by the 235U(n,f)
reaction for the natural uranium sample was also corrected as the
cross section ratio to the 23°U(n,7 ) reaction.
Not only recent evaluation data appeared in the Frohner's
paper but also JENDL-3 data are in reasonably agreement with the
present measurements in general. Previous measurements are
rather higher, especially in the energy region above 100 keV,
than the present data and the above new evaluations. However,
the experimental data by Kazakov et al.4' are in tendency to be
lower than old measurements and show a good agreement with the
recent evaluations and the presently measured values.
More careful works may be required to complete the data
correction and uncertainty analysis for the present preliminary
378 -

JAERI-M 90-025
measurements, Including absolute measurement of the cross section
with filtered neutrons.
References:
1) Frohner, F. H., Proc. Int. Reactor Physics Conf., Jackson
Hole, p.III-171 (1988) .
2) Hasegawa, A., JAERI-M 89-026, p.90 (1989).
3) Frohner, F. H., Nucl. Sci. Eng., 103, 119 (1989).
4) Kazakov, L. E., et al., Yad. Const., 3, 37 (1986).
5) JAERI Nuclear Data Center, JENDL-3 (1989).
6) Block, R. C., et al., J. Nucl. Sci. Technol., 12, 1 (1975).
7) Kobayashl, K., et al., Ann. Nucl. Energy, 4, 449 (1977).
8) Fujlta, Y., et al., J. Nucl. Sci. Techno]., 21, 879 (1984).
9) Cierjacks, S.(Ed.), "Neutron Sources for Basic Physics and
Application", An OECD/NEA Report, Pergamon Press, pp.177-196
(1983).
10) Kobayashi, K.. J. Nucl. Sci. Technol., 18, 823 (1981).
11) Kobayashi, K., Ann. Rep. Res. Reactor Inst. Kyoto Univ.,
Vol.22, 142 (1989).
12) IAEA Technical Reports Series No.277, "Nuclear Data Standards
for Nuclear Measurements", IAEA, Vienna (1983).
- 379 -

JAERi-M 90-025
Table 1 Experimental parameters and conditions
P a r a m e t e r s Fe f i l t e r e d beam Si f i l t e r d beam
Samples
Filters
Filtered neutron
Linac operation:
pulse repetition
pulse width
average current
Detectors
Monitor
Time analyzer:
channel width
No. of channel
10 f iUB: 0.369 g/cm" 2 3 8U: natural U
1.5 mm thick plate
15" + 5 cm
24 keV
250 pps
0.22 usee
140 uA
C,D, scinti. (> 6 il'3
counter #
20 nsec(Capture)
125 nsec(Monitor)
1024
1 0B: 0.369 g/cm2
238., ,_ i ,r
U: natural U
1.5 mm thick plate
30" + 4 6 + 1 6 cm
146 keV
55 keV
250 pps
0.22 usee
140 jiA
C^Dg scinti.
BFo counter #
20 nsec(Capture)
125 nsec(Monitor)
1024
Placed in front of the TOF tube in the target room.
# Placed in the TOF beam (at about 10 m).
To target1
Concrete wall
' Pb '/''''/ Paraffin-U2CO3 B«C
Fig. 1 Experimental arrangement for the capture measurement
i
- 380 -

JAERI -M 90-025
Channel number ( TOF )
F i g . 2 Fe f i l t e r e d beam measured by the TOF method
Q> 3000
—1 1 1—
146 keV
- i — i — i i i I — r
Si F i l te red Beam
55 keV
Channel number ( TOF )
Fig. 3 Si filtered beam measured by the TOF method
- 381 -
i

JAER1-M 90-025
JENDL-3 Kazakov
10
Fig.
— JEF-2 '87 — ENDF/B-VI '87 • • '88
l i t '0 " I tt
i u
20 30 40 50 Energy (keV)
70 100
4 Comparison oftthe present capture cross sections and the previous measurements and recent evaluations (10 to 100 keV)
JENDL-3 23BU(n,y)
Kazakov J E F - 2 '87
ENOF/B-VI '87 • • '88
—• , , • P r e s e n t
— n>o t r o e» T I o D H i i * L*L I I * 1*4. 1 | * IH II " l«l II - •<* I I Y a*L i» M w l 1) * rrl ra
*n i t K i i t
I I I I I M l 10 rci • )
200 Energy IkeV)
500
Fig. 5 Comparison of the present capture cross sections and the previous measurements and recent evaluations (100 to 500 keV)
382

•IAER1-M 90-025
3.18 Application of Post Acceleration Beam Chopper for Neutron Emission Cross Section Measurements
M.Baba, S.Matsuyama, M.Fuj isawa, T . I w a s a k i , S.Iwasaki and R.Sakamoto
Department of Nuclear E n g i n e e r i n g . Tohoku U n i v e r s i t y , 980 Sendai
A post a c c e l e r a t i o n beam chopping system was newly i n s t a l l e d for Tohoku
U n i v e r s i t y 4.5MV Dynamitron a c c e l e r a t o r t o reduce t he pulsed beam d u r a t i o n and
has been a p p l i e d s u c c e s s f u l l y for improvement of energy r e s o l u t i o n in f a s t
n e u t r o n t i m e - o f - f l i g h t e x p e r i m e n t s . Using t h e chopper , new measurements were
ca 6, carried out for double-differential neutron emission cross sections of C and
Li for 14 MeV incident energy.
1 . Introduction
We have been carrying out the measurements of neutron scattering and
neutron emission cross sections with the time-of-flight (TOF) technique using
the pulsed neutron beam provided by Tohoku University 4.5 HV Dynamitron ac-1-3)
celerator . In these experiments, the "wing" which is the tail component
in the pulsed beam disturbed clear separation c ' inelastically-scattered
neutrons from nearby large peaks due to elastic scattering or discrete inelas
tic scattering, while 1.5 to 2 ns resolution was obtained in FWHM.
The "wing" was traced to be due to strongly asymmetric geometry of the
lens-pulser system in the high-voltage terminal, but was expected to be 4.5)
eliminated by chopping again the acceleiated beam . Therefore, we have
designed and installed a post-acceleration-chopping system (PACS) to remove ,, 4,5)
the wing and even to shorten the pulsed-beam duration
PACS proved to be very effective for improvement of energy resolution of
the TOF spectrometer and has been applied for various experiments, by using
PACS, new measurements of DDXs were carried out with improved resolution for 12„ J 6, . C and Li.
2. Post Acceleration Chopping System
PACS sweeps the accelerated pulsed beam across a chopping slit with a 4 5)
pair of deflector plates and eliminates the "wing in primary beam ' . It is
also effective for reduction of spurious components and dark current, and use
ful as a stand-alone beam pulser or sweeper.
- 383 -

JAERI-M 90-025
The design parameters of PACS were found out using Monte-Carlo calcula
tions considering the optics and space-time correlation of ion beam and inter-4 5)
ference with existii.g accelerator devices ' . The beam optics was traced
using the code "TRANSPORT" and taken into Monte-Carlo calculations.
The layout of P. CS is shown in Fig.1. The deflector plates, 50 cm long
with 2.5 cm spacing, are placed upstream of the switching magnet to enable
common use of PACS in all the beam lines following the switching magnet. (In
Fig.l, only one beam port is shown.) Figure 2 illustrates the electronics
block diagram of PACS. The deflector plates are fed with 8 MHz RF synchronized
with the accelerated beam. High voltage RF, variable from 0 to 10 kVp-p, is
furnished by a tank circuit driven by a commercial wide-band linear-amplifier;
this scheme is advantageous because of fewer high-voltage items necessary and
of simpler fabrication, tuning and maintenance. Synchronization of RF with the
beam is realized by triggering the amplifier with the frequency-multiplied and
phase-adjusted beam pick-off signal obtained with the capacitive pick-up tube
just before the deflector. The chopping slit is located about 2.5 m downstream
of the deflector plates with opening around 5 mm; the slit is placed verti
cally to avoid interference with the beam-energy stabilizing system based on
the slit-feedback method. The tank elements and the deflector electrodes are
electrically shielded with aluminum plates for reduction of RF noise disturb
ing the experimental apparatuses.
The performance of PACS was tested by observing time spectra of gamma-
rays and neutrons emitted from neutron targets and scattering samples. PACS
operated fairly reliably while it required occasional phase adjustment to com
pensate the drifting of phase delay and/or beam path.
Figures 3(a) and 3(b) illustrate the examples of test measurements; they
are the emission spectra for 14 MeV incident energy from samples of
polyethylene, 1 cm in dia. and 5 cm long, and elemental nickel, 2.5 cm in dia.
and 4 cm long, measured at flight path length rl 6.5 m using a NE2L3 scintil
lator, 5" in dia. and 2" thick. As shown in Fig.3(a), PACS makes much clear
Lhe separation between the peaks of scattered neutrons by removing the "wing"
of pulsed beam. In Fig.3(b), the first levels of Ni & Ni are separated
satisfactorily from the ground state even at the path length of 6.5 m. Thus,
PACS proved to be very effective for neutron TOF experiments, especially for
scattering experiments which require clear separation between the neutrons
originating from different reaction processes.
- 384 -

JAERI-M 90-025
1 7 ft 3. DDX Measurements of C and Li
12 fi DDXs of C and Li were measured with improved energy resolution apply
ing PACS. The experimental and data reduction procedures are identical with 1-3)
those described previously . The neutron detector was a NE213 scintillator, 14 cm in dia. and 10 cm thick, and the flight path was 6 m long.
12 C: In Figs.A and 5(a)-(c), shown are the results of DDX and partial cross
sections derived from the DDXs, together with previous data by Kikuchi et al. 3) in our laboratory and the evaluations. The present data show very good
agreement with previous ones for the ground state, the 1-st (Q=-4.44 MeV) and
3-rd (Q=-9.63 MeV) levels, and for low energy continuum region. For the 2-nd
(Q=-7.76MeV) level, however, new data are much lower than previous ones and
close to the experimental values at OKIAVIAN measured with 9 m long flight
path , and ENDF/B-V evaluation probably based on the experiment using
double-scintillator technique . The present lower values for the 2-nd level
are due to greatly reduced pulse "wing" by PACS.
The summary of the present partial cross section results is presented in
Table 1 together with the evaluated data. The total cross section obtained by
summing up the presently derived partial cross sections agree with those by
ENDF/B-V and JENDL-3 which were based on high-precision direct measurements.
Therefore, the present experiments eliminated the inconsistency between the 2)
partial cross sections and the total cross section owing to the improved
peak separation by PACS.
Li: Typical results of Li DDX are shown in Fig.6, together with our pre
vious data by Chiba et al., and JENDL-3. The present results reproduce very
well the previous ones; this result implies previous data were not distorted
seriously by pulse "wing" existing in previous experiment.
The experimental data show higher values than JENDL-3 in the region be
tween 6 MeV and 12 MeV of emission energy. This trend seems consistent with
the fact that the analyses using the JENDL-3 data underpredict the several MeV 6 9)
region of LLNL pulsed sphere experiments for Li
Therefore, we attempted to derive a partial cross sections from the DDX
data. Figure 7 shows the least-squares analysis of emission spectrum for
derivation of partial contributions where the spectrum is assumed to consist
of discrete components due to five discrete states indicated in the Fig.7, and
of continuum parts due to the (n.n'd) and the (n,2n) reactions . The ex
perimental spectrum is described very well by the superposition of these com-
- 385

JAERI-M 90-025
ponents provided that the neutrons from the (n.n'd) and the (n,2n) reactions
are described, respectively, by the three-body phase space and the evaporation
spectra
The results of partial cross sections obtained through the fits are shown
in Fig.8. The partial cross sections are generally higher than JENDL-3 for the
first (Q=-2.18MeV), second (Q=-3.56 MeV) and the third (Q=-4.31 MeV) levels as
suggested from the comparison of DDXs.
4. Summary
A post acceleration beam chopping system has been developed and applied
for double-differential neutron cross section measurements. The chopper im
proved effectively the pulsed beam quality and energy resolution in time-of-
flight experiments. New experimental data are presented for double-
differential neutron emission spectra and partial scattering cross sections of ] ? fi C and Li obtained by use of the chopper.
Acknowledgment
The authors wish to thank Dr.H.Shibata of University of Tokyo for valu
able suggestions. They also indebted to Messrs. T.Takahashi, K.Komatsu and
T.Nagaya for their support in fabrication of PACS.
References:
l.S.Chiba et al.; J.Nucl.Sci .Technol.,22 771(1985)
2.M.Baba et al.; Radiation Effects 92-96 223(1986)
3.M.Baba et al.; Proc.Int .Conf., "Nuclear Data for Science & Technology."
(1988 Mito) p.209, 294
4.S.Matsuyama et al.; NETU 50 p.6, NETU 51 p.6
(Department Nuclear Engineering, Tohoku University)
5.M.Fujisawa et al.; Proc. 2-nd Symp. "Tandem Accelerator Technology"
(1989 Tokyo Institute of Technology) p.108 (in Japanese)
6.K.L.Brawn; SLAC Report No.91(1974)
7.A.Takahashi et al.; J .Nucl.Sci .Technol. ,25 215(1988)
8.G.A.Grin et al.; Helv.Phys.Acta.,4 990(1969)
9.H.Maekawa et al.;JAERI-M 88-065 p.198
-386-

JAERI-M 90-025
Table 1 Summary of the C p a r t i a l sca t te r ing cross sections
G.S.
Q=-4 .44MeV
Q=-7 .65MeV
Q=-9 . S4MeV i
Cont inuum
A b s o r p t i o n 1
T o t a l i
En=14. LMeV 1 .
P r e s e n t
7 8 4 , 2 + 4 5 . 0
2 0 3 . 8 + 1 1 . 5
10. 5+ 1 . 0
6 2 . 5 + 4 . 3
130 . 1+ 8 . 5
8 1 . 4 *
1 2 7 2 . 5 + 4 7 , 4
E.VDF/B-V
7 9 7 , 0
1 8 6 . 8
1 3 . 0 :
6 3 , 6 !
1 6 1 . 7
8 1 . 4
1 3 0 3 . 4
JENDL3
7 9 3 . 8
1 8 3 . 0
9,8
7 7 . 9
1 6 1 . 2
7 3 . 3
1 2 9 9 . 7
(n, n ' ] 3 J
*EN'DF/B-Y
2 0 2 . 0 + 1 3 . 0 ! 2 3 8 . 2 4 8 . 9
r _1)
2
i
O o u D l a t
fliaa frofllt
Monitor
3t t»rLnt
B l fn t t
t v i r t u r i
—
I 4
0«fl»ctor PLat i i
Chop*Lnc
S l i t l V i r t l c a l )
Pick Uo Kinc
1.5?.
/
Fig. 1 Layout of post-acceleration chopping system for Dynamitron Accelerator
387

JAERI-M 90-025
Deflector Plttes Chopping Slit
Pulees Q 2njee FWHM 0.S-2HHZ C
-=»- B i n Llna
.i. CONTROL SOON
Freq. Selector
0.5MHz _J1_ I 1WHZ _T1_
I I I X ! I I X
U XL
M L hi CONTROLLER 0 - 2 " Control Power(0-tV>
UjUprriLuJ _. C i r c u i t
U
2 H H Z
O S C .
MIL
/W.
T
- C o n t r o l P o w g r i O - I 0 v RF AKP. -*-
Power
Controller
ACCELERATOR ROOK
Fig. 2 Electronics schematic diagram of post accelera t ion chopping system
. P o l y e t h y l e n e 2 7 . 5 - d e g . iu -
—
1 t -I « 10 -i — i <
-»
. , , , , , . , , , , H ( n , n ) C:G.S
En=14.1MeV j l |
C;Q*-4.44Me\
n i ?1
— r r
n«m ^
1 J
Jl
if h 1 1
>\\ \
u
1
/ c
f /
J
r
i n ^ r J
f.
|
f
j
u
-•>
! s v
M
10' Ni 30-DEG.
E n = 1 4 . l M e V G.s
4 8 12 16 Secondary Neutron Energy (MeV)
(a) polyethylene
4 8 13 IS Secondary Neutron Energy (MeV)
(b) nickel
Fig. 3 Neutron emission spectra for 14.1 MeV incident neutrons, measured using chopper; dash-line shows the results without operating chopper.
-388

JAERI-M 90-025
C-12 60-DEG C-12
4 8 12 16 Secondary Neutron Energy (MeV)
Fig. A Neutron emission spectra of " C , compared with our previous data (Kikuchi) and evaluated data
60 120 180 CM Angle (deg.)
Fig. 5(a) Differential scattering cross sections of 12C for 14.1 MeV neutrons
- 389 -

JAERI-M 90-025
C-12 10'
T En-U.lMeV
I ° PRESENT —JENDL3 AKIKUCHI —ENDF/B-V DOKTAVIAN —Legeadre Fit
* " ' fe-SiS Q--9.64MeV
u ID
CO
« » i n '
10 ' - -
u
o-\4 a Q=-7.65KeV
60 120 180 CM Angle ( d e g . )
10° c-i;
•• En=14.1MeV
oPRESENT —JENDL3 AKIKUCHI —ENDF/B-V DOKTAVIAN—Legendre Fit
(n ,n '3a)
M ~gOi Continuum
10" 0 60 120 180
LAB Angle (deg . )
Fig. 5(b) Differential scattering cross sections of 12C for 14.1 MeV neutrons
Fig. 5(c)
Differential scattering cross sections of 12C for 14.1 MeV neutrons
-390-

Li-6 60-DEG. 10J-r
En=14.lMeV o PRESENT aCHIBA
—JENDL3
o 4 a 1 2 le Secondary Neutron Energy (MeV)
Fig. 6 Neutron emission spectrum of 6Li
10--r L i - 6 20-DEG.
--Gaussian —Evaporation —3-body Phase-Space
10°
10
10
1 ( n , n ' d ) a r. ; \ Continual/ ')
(n,2n)\
> m 2 7 2
4 8 12 16 Secondary Neutron Energy (MeV)
Fig. 7 Least-squares analysis of Li neutron emission spectrum

- Z 6 £ -
Cross Sect ion (mb/s t r )
co —•
Cross Section (mb/s t r )
Cross Sect ion (mb/st r )
3 . O — Q
, , , 1 1 1 1 1 1 1 1 |
•
- - 0 '
-
,
o o c
° 1 1 ° -v 0 ' u, / "<>• g
^ / i a o ^ / 0 ^ 3 - < / -»- *
/ " i / •? g 0 _ / ° .-0- ^
" / ° iff - — iiti I — . — ^ ~ — — J _ ^ — ^ _
r-I
SZO-06 W-IH3VI'

JAERI-M 90-025
3.19 r Jtron Cross Section Calculation for Fe and U in the up to SO MeV Energy Range
K. Hida and S. Iijima
Nuclear Engineering Laboratory,
Toshiba Corporation
4-1, Ukishima-cho, Kawasaki-ku, Kawasaki-shi, 210
Neutron cross sections are calculated for ' Fe and ^V in the up to 50
MeV energy range. For ->°Fe, a comparison is made between ALICE and GNASH
using the same calculational parameters. It was found that the difference
becomes appreciable when many particle emissions dominate in the high
energy region. Calculations are made for -"U only with ALICE, because of
its fission cross section calculation capability. Comparisons with
experimental data are also given.
1. Introduction
Current evaluated nuclear data libraries include the data induced by
neutrons up to 20 MeV incident energy. However, the needs for higher
energy data become increased in many fields: astronomy, space
technologies, radiation therapy, isotope productions, application of the
spallation reactions (accelerator breeding, transmutation of TRU and FP,
intense neutron sources, and other nuclear fields), and accelerator
shielding. To fulfill their requirements completely, nuclear data should
be prepared for protons as well as neutrons in MeV to GeV region.
In this paper, neutron induced data are calculated up to 50 MeV
incident energy as the first step for the forthcoming evaluation. We
employ two computer codes for calculating these data, namely, ALICEv ' '
and GNASH.'3' While both codes are based on the statistical and
preequilibrium processes, GNASH is more sophisticated whereas ALICE is more
versatile. One of our aims is a comparison between the two computer codes.
The other aim is to examine the ALICE applicability to calculating the
actinide cross sections with fission competition.
2. Brief Computer Codes Description
Table 1 summarizes the principal differences between GNASH and ALICE.
GNASH is based on the multistep Hauser-Feshbach theory'4' and the
-393 -

JAERl-M 90-025
Gilbert-Cameron composite level density formula1-1) with low lying discrete
levels. The transmission coefficients must be calculated with an external
optical model code and provided as input data. In his nuclear cross
section calculation system SINCROS,' ' Yamamuro has directly joined the
optical model code ELIESE-31 ' to GNASH in which the dimensions for the
relevant arrays are extended for the up to 50 MeV incident energy.
ALICE calculates the equilibrium processes with the Weisskopf-Ewing
evaporation model1 ' or an s-wave approximation.'"' The level density is
represented by the Fermi gas model with no discrete level. The
transmission coefficients for the entrance channel are provided as input
data, or are calculated with parabolic model or in an internal optical
model subroutine. The inverse reaction cross sections are provided as
input data or calculated with a classical sharp cutoff algorithm or the
optical model subroutine. Once the particle widths are calculated for the
compound nucleus using the relevant level densities, the same widths are
used for the daughter nuclei in subsequent reactions. ALICE accounts for
the fission competition, based on the Bohr-Wheeler transition state
approach' ' with the single barrier but no tunneling effect.
The preequilibrium modeling is different between the two codes. GNASH
is based on the exciton model, ' while ALICE is based on the geometry-
dependent hybrid model.* ' The difference in the underlying physical
concept lies in the approximation on the mixing among configurations of the
same exciton number; strong mixing in the exciton model versus no mixing in
the hybrid model.1 ' In the geometry-dependent hybrid model option for
ALICE, the nuclear surface diffuseness was introduced to take into account
the enhanced particle emissions from the nuclear surface. The Kalbach
constant is important to calculate the intranuclear collision probabilities
in the exciton model in GNASH, while calculation of those probabilities in
ALICE is parameter free. The angular distribution cannot be calculated in
the original GNASH. Thus, the Kalbach-Mann systematics1 -" are implemented
in the SINCROS system. It can be calculated in ALICE, based on nucleon-llk) nucleon scattering kinematics for an incident nucleon on a Fermi gas.1 '
3. Cross Section Calculations
Fe-56
A code comparison is the principal object for ° Fe calculations. To 56F
- 394-

JAERI-M 90-025
carry out a reasonable comparison, ALICE was modified so that the Fermi gas
level density parameters common to GNASH can be provided as input data.
The default parameters in the SINCROS system are used. The transmission
coefficients and the inverse reaction cross sections are calculated with
ELIESE-5, using the default optical potentials in the SINCROS system given
in Table 2. The Kalbach constant used in GNASH is 130 MeV^, and the
equilibrium process is calculated with the evaporation model in ALICE.
The results are given for particle production cross sections in Fig. 1
and isotope production cross sections in Figs. 2 through k. The agreement
between the two codes is fairly good in the low energy region below 15 MeV,
but becomes poorer in the higher energy region where many particle
emissions occur. The particle emission spectra, bombarded by 15 MeV
neutrons, are shown in Figs. 5 and 6 along with the experimental spectra.
The calculated angle-integrated spectra agree with each other, but do not
agree with the measurements; the agreement could be improved by adjusting,
e.g., the level density parameters. The angle-dependent particle spectra
are calculated only with ALICE. The agreement is poor, not only with the
experiments but also with the Kalbach-Mann systematics.
U-235
For -"U, only ALICE is used because GNASH cannot calculate the
fission cross sections. The fission barrier heights defaulted in ALICE are
Sierk's rotating finite range model and Cohen's rotating liquid drop model.
The transition state level density is represented by the Fermi gas model
with a different parameter from the ground state deformation. The ratio
aj-/an is provided as input data, which is used for all nuclei appearing in
the calculation. In the following calculations, photon, neutron, and
fission channels are taken into account; an=A/9 is used for the ground
state deformation with the mass number A; and the entrance channel
transmission coefficients and the inverse reaction cross sections are
internally calculated using the default optical potential.
The fission cross sections, calculated by using the default barrier
heights, are compared with the experimental data in Fig. 7- Since the
agreement is poor, the barrier heights and the transition state level
density parameter are adjusted so as to reproduce the measured data. The
resulting level density parameter, af/an=0.98, however, is physically
unacceptable, because the degree of freedom is higher at the saddle point
- 395 -

JAERI-M 90-025
than at the ground state deformation and hence a<-/a should be greater than
1.0. In contrast to the acceptable agreement of the fission cross sections
with experiments as shown in Fig. 8, the agreement between the neutron
emitting cross sections shown in Fig. 9 is very poor. This is mainly
because the spherical optical potential is not appropriate for calculating
the reaction cross sections for the deformed actinide nuclei.
4. Conclusions
56c The neutron cross sections are calculated up to 50 MeV for -> Fe and
->JM. For -> Fe, a code comparison was made between GNASH and ALICE by
using the same calculational parameters. Although the cross sections agree
fairly well with each other in the lower energies, the difference becomes
significant vhen many particle emissions dominate in the higher energies.
Accumulated experience in the use of GNASH has confirmed its applicability
below 20 MeV. Hence, GNASH is recommended to use in evaluating non-
fissionable nuclei in the higher energy region. The fission and neutron
emitting cross sections for -'-'V, calculated with ALICE, do not agree
satisfactorily with the experimental data. The main cause may be
attributed to the reaction cross sections calculated with the spherical
optical potential. Since, however, ALICE is capable of calculating the
fission cross sections, its refinement would be useful for future work.
Refe
(1
(2
(3
(4
(5
(6
(7
(8
(9
(10
(U
(12
(13
(14
rences
Blann, M. and Vonach, H.K., Phys. Rev., C28, 1475 (1983).
Blann, M. and Komoto, T.T., Phys. Rev., C29, 1678 (1983).
Young, P.G. and Arthur, E.D., LA-6947 (1977).
Hauser, W. and Feshbach, H., Phys. Rev., 87, 336 (1952).
Gilbert, A. and Cameron, A.G.W., Can. J. Phys., 43, 1446 (1965).
Yamamuro, N., JAERI-H 88-140 (1988).
Igarasi, S.. JAERI 1224 (1972).
Weisskopf, V.F. and Ewing, D.H., Phys. Rev., 57, 472 (1940).
Blann, M. and Beckerman, M., Nucleonika, 23, 1 (1978).
Bohr, N., and Wheeler, J.A.W., Phys. Rev., 56, 426 (1939).
Griffin, J.J., Phys. Rev. Lett.. 17. 478 (1966).
Bisplinghoff, J., Phys. Rev., C33, 1569 (1986).
Kalbach, C. and Mann, F.M., Phys. Rev., C23, 112 (1981).
Blann, M., Scobel, W., and Plechaty, E., Phys. Rev., C30, 1^93 (1984),
- 396
1

JAERI-M 90-025
Table 1 Br ie f computer ..odes d e s c r i p t i o n
Code
Ver s ion
GNASH
EGNASH (SINCROS-I)
ALICE
ALICE/LIVERMORE 8S W
No. of p a r e n t s 10 9(Z) X 22(A)
Particles photon, n, p, alpha, d, photon, n, p, alpha, d.
t, % e fission
Max. En (MeV) 50 300
Eq. process multistep Hauser-Feshbach evaporation
or s-wave approximation
Level density Gilbert-Cameron Fermi gas
discrete levels no discrete level
exciton model geometr. -dependent
hybr'M model
Kalbach-Mann systematics nucleon-nucleon scattering
Preeq. model
Ang. dist.
Table 2 Default op t ica l po ten t i a l s
Particle
n
P
alpha
d
t, 3He
GNASH<6)
Walter—Guss
Perey
Lemos
Lohr-Haebaeli
Bechetti-Greenlees
ALICE'1'
modified Wilmore-Hodgson
modified Perey
unknown
unknown
not included
I
- 397 -

MFE PARTICLE PRODUCTKDN CROSS SECTION
10
1
m-'
m-2
m-3
"5EEJE
... . ,
^
' r - t
•
•• 4
.|. , . . ; _ i _
-. -
H--H
... — #
[4 I __ —f:
I •
• ' -V-rr
. ^ _ -- ; r : ^
_£.. F . ^ .pj-pfj-
— . i i i i ,«• - i -
• \ * J i.iii-^H^ • u ' i .J - i . .
j J < 4 ( n. x n)
' . " 1 l J : !
-...] L ! L. | - J - ~?
J . ! " 1 . J^ -? - ! . -
j r - r ^ r " - • - t -
^ U Z ^ I - L L L , ^ ! • • • • i f f ' .' .1
..... ^ . . . r ^ ^ n g
.! ^ ...... r ... .L.
/l";t-^$
TT' i : .7 i : .T EErxr-j-rnEEE
• - I " / " : : : 1 * <• ••
^ i - j - r ; ^ , - ! ^ , . '
J SX^LL J ^ ^ i ; ; ^
~~A:"fi-:v~ • /-•: ! :?; ;:: .::... / j . : : .,.|.:;-::::,;;::;::;:;:
"-i.l 4 - —
j i . i i"i "i !•!-Ii~i.imz.-1 GNASH '•
- : - ALICE t — • - -
- L { i -i ! ! iir-fcc^.----i-f.4 . _ _
.J^J-^- - ~ ^ _ ^ - ^ . _
• • ! :
: ; : ' _j 1 __^=£_,i
^ E^ 1 ^ r _ j _ "
- = - • : : : . . ^ " r ' - 1
. J - : • . . . .
j ( n . x a )
• ' • • - • • _ * _ ! —
i ^~- ; i : ; * 5 " "T ' " ' '
• • ; > - ( n . x d ) ^ '•'•! i
1 . ' • " : . - : - - . : "
- i ^ ' . ' . : , i , ,•;• '-Ej=EjE-r=j-:±:E;
. . . :• • •
. . • : • : . . - . - . .
•4,..,. ,11.,].. .^ A . ., .. '. !, ,', ,. J.
^S.^^4^-^^ i-L— -L
^ f * f ^ T ^ - f ^ ^ T f
-zt^-yj-- ^^-i
•
JLT:. ;
_:rr.. _,?
. ... -. .. , ' : • i
~ ==-,
. - r c - i -r -
fi — T T
• • • _ ^
_ —*— - ^ " — | — • - ! ' •
1 J . „ _
! , .^P|.. i . .
-..!: ™ . .. T1
. _ . , . . . .
" : -: '• , : • ; . . :
- • : i
- • ;
-;
_L
r i ^ •i .
.X
::.:
—-• i
-, ,. i
4 5-!-
1L
20 30 Neutron Energy (MeV)
Fig. 1 Fe (n,x) particle production cross section
56FE ISOTOPE PRODUCTION CROSS SECTION
^ii-l?M£r!=.r?nE~rT
jS^—rEr?^ --XT--':".- :. '^ '-—"G"NASH~|i5^'Fir!': •':-•': !---:--•= • - •;--• - : - - ' ALICE : i - r : : : - i : . •' :: - ••
20 30 40 Neutron Energy ( MeV)
Fig. 2 Fe isotope production cross section
from 6Fe (n,x) reaction

MFE ISOTOPE PRODUCTION CROSS SECTION
GNASH ALICE
!103
20 30 40 Neutron Energy (MeV )
Fig. 3 Mn isotope production cross section from 6Fe (n,x) reaction
56FE ISOTOPE PRODUCTION CROSS SECTION
it^rE^s^-zzr^rsyj:^::: j- GNASH ••^z-HtS] —• ALICE -nr.
ao 30 40 Neutron Energy { MeV )
Fig. 4 Cr isotope production cross section from 56Fe (n,x) reaction

5*FE PARTICLE SPECTRA (En = 15MeV)
r
(n, xn)
° Hermsdorf (En = 14.6 MeV)
• Vonach (En = 14.1 MeV)
,cfff™°
(n, xp) v i • Grimes (En = 14.8 MeV)
J — I I 1_
5 10 15
Emitted Particle Energy (MeV)
Fig. 5 Fe neutron and proton emission spectra
"FE ANGLE DEPENDENT PARTICLE SPECTRA (En = 15 MeV)
10'
10
10
1
10"
I I 0 I
^o Neutron Spectra ~ \ \ ALICE vs. Takahashi et al.
•.V — ° °= 30' V V l • 0 = 150*
.••V° - \ ° o
• \ \ °o°
.-> * / \ ° *•
\ * \
1 # \ \ o x
- . /' • \ ^ \ • . \ o \
\ ° Proton Spectra . v
ALICE vs. Grimes et al. * \ o 0 ° o 0= 30" \ a
. \ . 0 = 135- . • °
. , i i , 1 i i , > 1 i , , , 1
•
5 10 15
Emitted Particle Energy (MeV)
> 70
Fig. 6 Fe angle-dependent neutron and protc emission spectra

JAERI-M 90-025
n
i
<;,
'•11
«>
• !
\
%
O :
,f
»"U i
1 :
7 V 7
1 _J
^ 4
^
i : v
A; //*
/i ijT ;!
: !
F I S S I O N CROSS
1-
_^
r>
^ ; '(
i
•
! 1
J j "X
K «
1
'
i
' D
-^ **v
% •
; !
> i
I
i
£ m > _^
«'J
!
, 9i • i - 1
£
• !
j
o
SECTION
j _ » i. i
? \ 4
* « • !
; : i , A
! •
i
r ;
J
i-: i
w y
•.
.!,'
I' ^ • i
I - •
«•<»•
' > •
- • -
i
;
J-:i,
•^i--
: I
! •
h
If j|
' • i l
- -
'
;
i
1
—
•i-
i
— ... •--
, :
;
•-.-
1
i
i
--
•
""
I
: ; i
! Bl - rotating Unite range model [ 4.94 4.89 4.84 4.78 4.72 4.64 4.5B ( MeV ) )
Bl - rotating liquid drop model [ 5.79 5.70 5.61 5.52 5.43 5.33 5.23 ( MeV ) ]
, ... i ' i at /an
p • i
- 1 . 0 • 1 ' 1
— -.1
it / an . .10 . . . 1 • i • i t .: i
i i
!
1
| ! I-
I
'
10.0 20.0 30.0 40.0 50.0
Neutron Energy ( MBV )
Fig. 7 235U fission cross sections calculated with default barrier heights
1 f
[ ]
; t
'?
ti
. i .:l
i • i
• • j
i
• : " !
^
; > i
/ r - j
»'U 1 . 1 •
i
]•-
! 1
i . ! • '
.; LL
i
**
! • •
4 . . . j : ; .
'i-T =
.1
if
Jl .
fc"1
K A
• 1
F I S S I O N CROSS
- :
: . • . : .
i . .: i-
i -
t i j . T
... ..
•; i
,: ...j [ • • ;
' I'd
V \
:a
... i
-I-!
$
!
\ , IB
"i
~r
*f" g "&<
i
t<
I
[ ;
Q
p°, fPa
#
S E C T I O N
; ,
M 1 i r
\
•
• «
»i
^-
•»"
-^ •'
! 1,
• ! • •
: -
• i
\
\
_;' ' •••I
'..
\
• ~~~-
r
, . j .
•! -i--'r
•
~< • t -
'! >
• > •
,j: • ~>
1
...,. I-1
• ! •
i
> .1... i
^ 4. •1.-j .
: • ! • • :
-!• i-
---^ - . -
.... • \
•i-
1-.... .-..
4-
-i
... x •• ...
Uranium - 236 235 234 233 232 231 230 Bf(MeV) 5.20 5.10 4.80 4.78 4.72 4.65 4.58 a l / an - 0 . 9 8 Exp. 5.9 5.e 6.0 5.7 (Vandenbosch - Huizenga)
• - ,'._
.1..
.,.. , rL-
~r -;-
. , j .
A,
.... ..... ^
> b .
— J_ ' -.... ? ! -
-i-
— ^
••{•
- • - •
\ ..... J-i
-4-.
...::
..,
i — ..;..: -4-..;....
x
U-
10.0 20.0 30.0 40.0 50.0
Neutron Energy IMeV )
Fig. 8 235U fission cross sections calculated with adjusted barrier heights and the transition state level densities
- 401 -

JAERI-M 90-025
2 . 0 -
1 . 0 -
i
r(
1 •I' 1
1 (
i h '
t
i
m
1: :
i '
li\ *
i
(n, n'J + compound
elastic
._K
5M~ <M
-; i- -i i'-e
J I N E L A S T I C
1
'•
L 1 •.
|
> '
\- '' K \-4 \J i r i-
75 r.\-
•
• :
.
-i , '
f 'a-
r.
!. Hi ^
; i
i
• ! . -
!
- N
r • !
s; (n.
^
!' ! : ' •
1" !'
! •
i
\N
V'. ;\
2n).
^
SCATTERING
1' 1
h - i '
•1-
i N J_j
i
! •
! L
& t
!
;' -:..
• ' • •
• : [ •
! \.
1.
% -k 3=
! • H
.... ,
-
• •
.' ; • •
%'••
-J--\j
'i-3l
!•
• i ' l
•1 4
. • !
i
I
•=
%v
%
\ '•/.
f
!:-
! •
, i , .
i£ ^ a n ,
m
•i
1 i
• !»
' I ! ; i
: r i
. : : j ; 4
I n
•|
:| .1.
4 ,1 ;
! i'
•j
: & • •
2n
'!
•I ?\
•j-
i
; i !
! •1
4j km
+\K • • ! • - _ i —
) , i
i-
(
i
i' I
• • ! '
(n, 4n)
- j -
n
! !
! '. \
••
,.
3n
i
! !
]
1
! I
1
:
i
I
; !'
( n
1
• •1
! !
(
:|. : 1
4
1
i i
1 i
1
''I
n )
1
1 1-
• i
T
1
1
; -l-
•i
i i
;
1
1
a.i.. .1 ;
cross section j -
-M-^ ==L-
4-1-—L 1
•tLU-44i- . 1 .
10.0 20.0 10.0 40.0 50.0
Neutron Energy tMeV )
Fig. 9 235U (n,n'), (n,2n), (n,3n), and (n,4n) cross sections
402 -

JAERI-M 90-025
3.20 One Group Actinide Cross Section Set Based on JENDL-3 and Calculation of aiV Production in Light Water Reactors
F u m i h i r o Masukawa and Tsuneo Nakagawa
Japan Atomic Energy Research I n s t i t u t e
T o k a i - m u r a , Naka-gun, I b a r a k i - k e n , Japan
and
Shungo I i j i m a
Tosh i ba Co rpora11on
4-1, Uk i sh i ma-cho, Kawasaki-ku, Kawasaki, Japan
An extensive one-group cross section set was generated based on JENDL-3
with typical 0RIGEN2 spectra of LWRs and FBR, and was compared with 0RIGEN2/82
poo
and ENDF/B-V data. Using this cross section set, U inventory in LWR was
calculated under a clean burnup condition. The effect of lead time before
reactor operation is shown as important for a quantitative calculation of '•""•U
inventory. Sensitivity study was made to identify the dominant nuclide
transmutation paths and the effect of cross section differences relative to
OR1GEN2/82 Iibrary.
1 . I ntroduct i on pop p o K
U is formed in U/Pu fueled reactor by about 1 ppb at discharge and 208
decays with half-life of 69 y giving rise to a descendant Tl which emits pop
strong 2.6 MeV gamma-rays Hence, accurate prediction of "*-U in spent fuel
within 10 - 20 % accuracy is required from the aspects of the utilization of
reprocessed uranium and assessment of the environmental effect of radioactive
waste. 232
There have been number of calculations concerning U production in LWRs
and FBRs. Yet it seems not clear that the required accuracy of prediction
was attained or not. The reason is probably that (1) the adopted cross
section data base is not always well documented, (2) the complexity of nuclide pop
transmutation paths of " ' U production prevents the pe rspec t i veness of the
calculated results, and (3) the data of nuclide analysis of spent fuel are not
we I I benchmarked. ORIGEN2 code is frequently used for calculation of actinide inventories
2) 3) using ORIGEN2/82 library . However, in a past decade, there has been
significant progress in the knowledge of nuclear data for minor actinides.
- 4 0 3 -

J A E R I - M 90-025
H e n c e , O R I G E N 2 / 8 2 library should be revised in the light of recent data.
A l s o , q u e s t i o n s are often raised from users about the a c c u r a c y of 0 R I G E N 2
resuIts.
As an application of actinide cross section data in JENDL-3 to fuel cycle
2 3 2
e v a l u a t i o n , the U inventory in LWRs was c a l c u l a t e d in the present w o r k .
C o m p a r i s o n was made with the c a l c u l a t i o n using 0 R I G E N 2 / 8 2 library t h r o u g h
direct calculation and the sensitivity analysis.
In S e c . 2, o n e - g r o u p a c t i n i d e cross s e c t i o n s of J E N D L - 3 are given in
tabular form for typical PWR, BWR, and FBR in comparison with 0RIGEN2/82 and
E N D F / B - V data. S i g n i f i c a n t d i s c r e p a n c i e s among the e v a l u a t e d data are
pointed out and discussed. In Sec. 3, the nuclide transmutation paths are
studied carefully including the effect of the lead time before fuel loading as
a parameter. The U inventories in typical PWR and BWR were calculated
under an ideal clean burnup c o n d i t i o n using the o n e - g r o u p c r o s s s e c t i o n s . 2 32
In S e c . 4, the s e n s i t i v i t i e s of c r o s s s e c t i o n s to U i n v e n t o r y are
c a l c u l a t e d . T h e s e n s i t i v i t y s t u d y w a s m a d e to i d e n t i f y the d o m i n a n t
2 3 2 t r a n s m u t a t i o n paths and the effect of cross section d i f f e r e n c e s to U
product i on.
2. One Group Cross Section Sets
230 248
The actinide cross sections of JENDL-3 ranging from Th to Cm were
a v e r a g e d by typical reactor s p e c t r a . The s e I f - s h i e I d i n g effect was not
included in the calculation. Besides JENDL-3, ENDF/B-V was also processed
and used for comparison with O R I G E N 2 / 8 2 library.
The typical reactor s p e c t r a used for this w e i g h t i n g are the O R I G E N 2
spectra of PWRU (for P W R - U O g ) , BWRU (for B W R - U O g ) , and EMOPU/U/U/C (for the
early F B R - M O X core ) . T h e s e s p e c t r a are shown in Fig. 1. The O R I G E N 2
s p e c t r a for L W R s are g i v e n o n l y b e l o w 10 M e V . In the c a l c u l a t i o n of
spectrum-weighted (n,2n) and (n,3n) cross sections, the neutron spectrum above
10 MeV was s u p p l e m e n t e d with the M a d l a n d - N i x type " & U fission s p e c t r u m
adopted in JENDL-3. This gives a lower spectrum than the Maxwellian spectrum
in the high energy region.
Table 1 lists the spectrum-weighted fission and capture cross sections.
S i n c e the s e I f - s h i e I d i n g effect was not included, the fission and c a p t u r e
cross sections for Z 3 S U and Pu, and the capture cross sections for " 8 U and
Pu are not given. Among the average values, discrepancies exceeding 20 %
are observed for reactions as follows;
- 404

JAER1-M 90-025
for LWRs. 2 3 0 T h ( n . 7 > , 2 3 , P a ( n , f ) , 2 3 6 P u ( n , f ) , 2 4 2 m A m ( n , f ) , 2 4 2 mAm<n, 1) -
2 4 Z C m ( n , f ) , 2 4 2 C m < n , 7 > , 2 4 3 C m ( n , f > , 2 4 3 C m ( n , 7 ) ,
and for FBR, 2 3 0 T h < n , 7 ) . 2 3 , P a ( n , f ) , 2 3 , P a ( n , 7 ) , 2 3 2U(n,7>. 2 3 6U(n.7>.
2 3 8Pu(n,f), 2 3 6Pu(n,7). 2 4 2 mAm(n,7>, 2 4 3Am(n,7), 2 4 2Cm(n,f),
2 4 2Cm(n,7). 2 4 3Cm(n,7), Z 4 4Cm(n,7>, 2 4 6Cm(n,7). 2 4 7Cm(n,7). n o c p o 7
The cross section profiles of U(n»7). Np(n,7), and absorption cross
section of Pu are shown in Figs. 2 through 4.
Table 2 shows the same comparison for (n.2n) and (n,3n) cross sections.
For these reaction cross sections/ the discrepancies are considerable, often
exceeding a factor of 2. This is partly because of the ambiguity of cross
section data near reaction thresholds. Another problem is that the
spectrum-weighted (n.2n) and (n,3n) cross sections are very sensitive to the
fraction of neutron spectrum abo'e their threshould energy to the whole
spectrum. The fraction contributing to this reaction is about only 2 %. ?37 238 234
The (n/2n) cross sections of Np and U. and (n,3n) cross section of U are shown in Figs. 5 through 7. Thase reactions are important to estimate 232 U formation.
3. CaIcuI at i on of 232 U Inventory
To estimate U production analytically, the method of Bateman is
used. The following paths are considered for its formation ;
a.
b.
c .
d.
e.
f.
g .
h.
235, 236, 237 NP 236m NP 236 Pu 232,
238y _^ 237
2 3 4U
23 5 u
2 3 4 U
2 3 4 U
235u
238,,
230
231
232u
233L
236,
N P
Th
236m Np
Pa
231
232,
232,
Pa
„ 236,
232,,
Pu 232,
232 T h ^ 233 u ^ 232u ,
239, Pu 240 Pu 241
236m NP 236 Pu
Pu -
232,
241 Am 237 NP
The paths c and d are due to the natural decay of the initial " ^ U and
U followed bv strong neutron captures. The importance of these paths
depends on the irradiation time and the lead time. The latter is the time
elapsed from the production of yellow cake to the reactor operation. The
lead time for commercial LWRs is considered about one year. In the present
- 405 -

JAERI-M 90-025
s t u d y , the lead t ime and the i r r a d i a t i o n c o n d i t i o n were taken as p a r a m e t e r s . pop
T h e U p r o d u c t i o n in L W R s w a s c a l c u l a t e d by a s s u m i n g an i r r a d i a t i o n
w i t h t h e t o t a l n e u t r o n f l u x of 3 . 4 x 1 0 1 4 n / c m 2 / s for P W R and 2 . 2 x l O i 4 n / c m 2 / s
f o r B W R , a n d by u s i n g t h e J E N D L - 3 b a s e d o n e grou.i c r o s s s e c t i o n s a n d
O R I G E N 2 / 8 2 l i b r a r y . H o w e v e r , the c r o s s s e c t i o n s o f ( n , H and ( n , f ) of 2 3 5 U , 2 3 8
and < n , T ) o f U were t a k e n f r o m t h e ORIGEN2/82 because o f t h e r e a s o n ment ioned above. The pa ths f , g , h were found to g i v e very sma l l c o n t r i b u t i o n s
O'iO
to the U pro d u c t i o n . Hence we considered only the paths a through e 2 3 2 F i g u r e 8 s h o w s U p r o d u c t i o n for each f o r m a t i o n path, using J E N D L - 3
and/or O R I G E N 2 / 8 2 library with no lead time. Note that 2 3 6 P u , whose half 232 life is relatively short (2.85 years) , is added to U production so as to
ob t a i n m a x i m u m e s t i m a t i o n . The path of a is found to be most i m p o r t a n t .
Its c o n t r i b u t i o n exceeds 50 % at 1-year irradiation and runs up to 60 - 70 %
after 2 year irradiation. The dif f e r e n c e between results with JENDL-3 and
O R I G E N 2 / 8 2 is not so large as expected from d i f f e r e n c e s between the two cross
section sets and less than 20 % after 1 year irradiation. As described in
Sec. 4, this is because of the can c e l l a t i o n of cross section d i f f e r e n c e s .
F r o m only this r e s u l t , it se e m s that the paths of c and d are not so
important. But taking account of the effect of the lead time, these paths
232
become more important. Table 3 shows the lead time effect on U formation
as c o m p a r e d w i t h the c a s e of z e r o lead t i m e . F r o m t h i s t a b l e , it is
o b s e r v e d that o n l y 1 - y e a r lead time m a k e s 12 % i n c r e m e n t a f t e r 2 - y e a r
irradiation. And the longer the lead time, and/or the shorter the irradiation
time- the effect becomes more significant.
4. Sens i t i v i ty Study
To identify the key reactions and the effect of the unc e r t a i n t i e s of the 23? c r o s s s e c t i o n s to the U f o r m a t i o n , the s e n s i t i v i t y study w a s p e r f o r m e d .
232 The sensitivity c o e f f i c i e n t s of the cross sections to the U production were
calculated analytically using Bateman's expression for nuclide d e n s i t i e s .
Figure 9 shows the relative s e n s i t i v i t i e s of the various cross s e c t i o n s
to the U + Pu density. The lead time was assumed to be 1 year. The 237 * asterisk of Np (n,2n ) means the reaction leading to the short time isomer.
2 3 7 sfc
F r o m t h i s f i g u r e , it is s e e n t h a t N p ( n , 2 n ) is t h e m o s t i m p o r t a n t
r e a c t i o n . T h e ( n , 1 ) c r o s s s e c t i o n s o f 2 3 j 3 U a n d " U a r e t h e s e c o n d
i m p o r t a n t , a n d h a v e a l m o s t t h e s a m e s e n s i t i v i t i e s , f o r t h e y a r e a d j a c e n t in
t h e s a m e m a j o r p a t h . A t s h o r t i r r a d i a t i o n , 2 3 8 U ( n , 2 n ) in p a t h b, P a ( n , f )
406 -

JAERI-M 90-025
p q n p q A
and T h ( n , 7 ) in p a t h c, and U ( n , 3 n ) in p a t h e h a v e c o m p a r a b l e
sensitivities to those of the (n,T) cross sections of 2 3 5 U and " ° U in path
a. As irradiation time increases, the effects of the reactions become less
important to the 2 3 2 U formation, and 2 3 5 U ( n , f ) , absorptions by 2 3 6 P u and 2 3 7 N P
become significant.
F i g u r e 10 s h o w s the c h a n g e s of the U + c Pu p r o d u c t i o n caused by
cha n g e of each reaction cross s e c t i o n from 0 R I G E N 2 / 8 2 to J E N D L - 3 . It is
observed that the effects of the cross section changes in the same path are p-je Q O "7 ^
negated each other, for example , U ( n , ? ) and Np(n,2n ) . absorptions of
2 3 6 P u and 2 3 7 N P .
5. Summary
An infinite dilution one-group cross-section sets for actinides ranging
from 2 3 0 T h to 2 4 8 C m was generated from JENDL-3 and ENDF/B-V for typical LWRs
and FBR s p e c t r a in O R I G E N 2 . M o d i f i c a t i o n to include the s e I f - s h i e I d i n g
effect and extension to other neutron spectral fields are planned to provide a
reliable cross section data base for fuel cycle evaluation. poo
By using the one-group cross section sets as well as O R I G E N 2 / 8 2 , the "*-U 23?
inventory in LWR was calculated and the dominant path of the U production
was studied. It was found that the path of a mentioned in Sec. 3 was the
237 ^ most important, and the Np(n,2n ) cross section was the most sensitive to
232
the results. It was also shown that for a quantitative calculation of " f c U
inventory the lead time before fuel loading should be taken into a c c o u n t .
The calculations of 2 3 2 U production for LWR using JENDL-3 and 0RIGEN2/82 are
in r e a s o n a b l e a g r e e m e n t in spite of the c o n s i d e r a b l e d i s c r e p a n c i e s in the
c r o s s s e c t i o n s . T h e s e n s i t i v i t y a n a l y s i s , h o w e v e r , s h o w e d that the
agreement of both results was largely due to the cancellation of effects of
individual cross section differences.
A l t h o u g h there has been s i g n i f i c a n t p r o g r e s s in the a c t i n i d e nuclear
d a t a , c r o s s s e c t i o n s of m a n y m i n o r a c t i n i d e s a r e s t i l l n o t k n o w n
experimentally or not evaluated with sufficient accuracies. The integral
data on n u c l i d e i n v e n t o r i e s of spent fuel will be helpful to improve the
present status of the minor actinide cross sections, as shown in this work.
- 4 0 7 -

f I
JAERI-M 90-025
References
1. Croff, A. 6., " 0RIGEN2 - A Revised and Updated Version of the Oak Ridge
Isotope Generation and Depletion Code, " ORNL-5621 (1980)
2. Croff, A. G., et al., " Revised Uranium-Plutonium Cycle PWR and BWR Models
for the ORIGEN Computer Code, " ORNL/TM-6051 (1978)
3. Croff, A. G., et al., " LMFBR Models for the 0RIGEN2 Computer Code, "
ORNL/TM-7176 (1981)
4. Madland, D. G., and J. R. Nix, " New Calculation of Prompt Fission Neutron
Spectra and Average Prompt Neutron Multiplicities, " Nucl. Sci . Eng., 81,
213 (1982)
5. Vondy, D. R., " Development of a General Method of Explicit Solution to the
Nuclide Chain Equations for Digital Machine Calculations, " ORNL/TM-361
(1962)
I
- 408 -

Table 1 The spectrum-weighted f i ss ion and capture cross sect ions (BARN)
NUCLIDE
TH-230
TH-232
PA-231
PA-233
u -232
U -233
U -234
u -235
U -236
U -238
NP-237
PU-236
PU-238
Pu-239
JENDL-3 ENDF/B5 0RIGEN2
JENOL-3 ENDF/B5 0R1GEN2
JENOL-3 ENDf8/5 0RIGEN2
JENDL-3 ENDF/B5 0RIGEN2
JENDL-3 ENOF/BS 0F.IGEN2
JErOL-3 ENJF/BS 0RIGEN2
JENDL-3 ENDF/BS 0R1GEN2
JENDL-3 ENDF/B5 0RIGEN2
JENOL-3 EN0F/B5 0RIGEN2
JENDL-3 ENDF/B5 0RIGEN2
JENOL-3 EN0F/S5 0RIGEN2
JENOL-3 ENDF/BS 0RIGEN2
JENDL-3 ENDF/B5 0RIGEN2
JENDL-3 EII0F/B5 0R1GEN2
P U <N,F)
0.0520 0.0576 0.0578
0.0239
0.0222
0.292 0.355 0.368
0.107
0.146
16.2 18.2 16.8
65.8
62.3
0.461 0.497 0.450
46.7
0.297 0.295 0.198
0.0939
0. 100
0.478 0.488 0.524
14.6 22.3 20.6
2.73 2.63 2.47
106.
R (N,G>
28.0 23.3 23.S
3.07
3.05
59.9 S6.5 67.4
25.2
24.7
9.69 12.9 11.3
7.91
7.5B
22.6 23.6 19.2
10.5
8.53 8.59 7.54
0.902
37.9 35.2 32.1
21.1 21.4 20.4
40.8 42.3 34.7
58.6
B u CN/F;
0.0448 0.0486 0.0489
0.O192
0.0179
0.2S7 0.317 0.330
0.0916
0.119
16.7 18.8 17.3
67.6
64.5
0.415 0.452 0.397
50.0
0.273 0.27? 0.165
0.0763
0.0808
0.426 0.436 0.462
14.8 22.8 21.4
2.73 2.63 2.49
114 .
R <N.G>
29.1 24.2 24.4
3.21
3.20
61.9 58.4 69. B
26.1
25.6
10.0 13.4 11.7
8.14
7.84
23.6 24.6 20.9
11.2
8.98 9.05 8.25
0.919
39.1 36.3 34.1
21.9 22.0 21.1
41.9 43.4 37.3
63.1
F B (N/F)
0.0304 0.0322 0.0344
0.0119
0.0119
0.197 0.257 0.275
0.0643
0.0768
1.99 2.19 2.30
2.67
2.73
0.338 0.347 0.371
1.92
0.110 0.112 0.119
0.0477
0.0499
0.343 0.352 0.377
0.675 1.47 1.53
1.13 1.13 1.19
1.85
R (N.G)
0.360 0.168 0.197
0.349
0.383
1.74 2.96 2.94
1.37
1.06
0.281 0.650 0.653
0.242
0.268
0.496 0.579 0.611
0.558
0.42S 0.535 0.551
0.288
1.58 1.62 1.52
0.914 0.368 0.392
0.649 0.708 0.731
0.502
NUCLIDE
PU-240
PU-241
PU-242
AH-241
AH-242H
AM-243
CM-242
CM-243
CK-244
CM-245
CM-246
CM-247
CM-248
JENOL-3 ENDF/B5 0RIGEN2
JENDL-3 ENDF/B5 0R1GEN2
JENDL-3 ENDF/B5 0R1GEN2
JENOL-3 ENDF/BS 0RIGEN2
JENOL-3 EN0F/B5 0RIGEN2
JENOL-3 ENDF/B5 0RIGEN2
JENDL-3 EN0F/B5 0RIGEN2
JENDL-3 EM0F/B5 0RIGEN2
JENDL-3 ENDF/BS 0RIGEN2
JIN0L-3 ENOf/BS 0R1GEN2
JENOL-3 ENOF/BS 0RIGEN2
JENOL-3 ENOF/BS 0R1GEN2
JENOL-3 ENOF/BS 0RIGEN2
P U (»,F>
0.547 • •* 0.584
139.
118.
0.398 0.398 0.415
1.14 1.12 1.12
780. 814. 466.
0.417 0.393 0.396
1.46 0.576 0.559
94.9 111. 71.7
0.800 0.876 0.875
150. 184. 171.
0.527 0.572 0.576
22.2 25.3 25.5
0.728 0.694 0.756
R (N,G>
11 •
104.
46.3
38.7
30.2 33.8 31.7
120. 121. 119.
153-165-98.0
SI.4 50.8 49.8
4.51 5.91 5.80
15.4 11.5 8.39
15.9 14.1 13.8
24.1 31.4 29.1
3.18 2.92 2.91
17.5 16.4 16.5
6.70 6.45 6.32
B U <»,F>
0.497 *** 0.S27
142.
126.
0.353 0.354 0.404
1.10 1.08 1.13
796. 831. 476.
0.371 0.339 0.385
1.42 0.530 0.555
97.6 114. 74.1
0.750 0.831 0.871
154. 189. 175.
0.479 0.516 0.568
22.9 26.2 26.2
0.698 0.649 0.756
R («/G>
• t *
111.
47.5
41.5
31.2 34.8 33.1
124. 124. 122.
156. 168. 100.
53.3 52.7 51.6
4.68 6.14 6.03
IS.8 11.8 8.70
16.9 1S.0 14.4
24.7 32.2 29.7
3.30 3.02 3.03
18.1 17.1 17.0
7.10 6.82 6.60
F B IN,F>
0.391
0.411
2.48 • *• 2.51
0.275 0.276 0.296
0.290 0.311 0.333
3.03 3.89 4.04
0.213 0.245 0.261
0.739 0.179 0.191
2.94 2.57 2.68
0.442 0.442 0.472
2.60 2.61 2.65
0.289 0.286 0.307
2.26 1.93 1.93
0.3O7 0.321 0.343
R (N,G>
0.513
0.465 • * •
0.462
0.467 0.425 0.427
1.68 1.69 1.73
0.528 0.380 0.393
1.51 1.02 1.08
0.490 0.300 0.337
0.361 0.234 0.244
0.665 0.816 0.834
0.336 0.313 0.311
0.327 0.222 0.235
0.462 0.305 0.305
0.250 0.232 0.248

JAERI-M 90-025
Table 2 The spec t rum-weigh ted (n ,2u) and (n ,3n ) c r o s s s e c t i o n s
( M I L L l - B A R N )
NUCLIDE
T H - 2 3 2
U - 2 3 3
U - 2 3 4 ( N , 2 N >
U - 2 3 4 CN,3N>
U - 2 3 8
N P - 2 3 7
P U - 2 3 9
J E N O L - 3 E N D F / B 5 ORIGEN2
J E N D L - 3 E N D F / B 5 0 R I G E N 2
J E N D L - 3 E N D F / B 5 ORIGEN2
J E N O L - 3 E N D F / B 5 • R 1 G E N 2
J E N D L - 3 E N D F / B S ORJGEN2
J E N D L - 3 E N D F / B 5 0 R I G E N 2
J E N D L - 3 E N D F / B 5 ORIGEN2
P W R
4 . 4 4 x x x 5 . 0 9
0 . 5 4 2 x x x 2 . 8 6
1 . 4 6 0 . 4 6 1 2 . 8 6
4 . 0 3 - 3 4 . 4 7 - 3 1 . 3 5 - 2
3 . 7 4 x x x 5 . 5 3
0 . 9 4 7 0 . 4 3 2 1 . 0 6
1 . 0 9 i * s
1 . 1 2
B U R
3 . 2 2 x x x 3 . 7 4
0 . 4 0 8
* * * 2 . 1 0
1 . 0 6 0 . 3 3 6 2 . 1 0
2 . 9 4 - 3 3 . 2 6 - 3 1 . 0 3 - 2
2 . 7 1 x x » 4 . 0 4
0 . 6 8 8 0 . 3 1 4 0 . 8 1 3
0 . 7 9 3
* « * 0 . 8 1 8
F B R
2 . 0 5 X X X
1 . 7 9
0 . 2 5 0 X X X
0 . 6 4 1
0 . 6 9 4 0 . 2 3 4 0 . 6 4 1
3 . 7 5 - 3 4 . 1 0 - 3 2 . 0 1 - 3
1 . 6 9 X X X
1 . 7 8
0 . 4 5 7 0 . 2 0 9 0 . 5 0 1
0 . 4 6 8 X X X
0 . 3 8 2
Table 3 The lead time effect on 232U production [%] (Relative to the case of the zero lead time)
I r r a d i a t i o n Time (Years)
Lead Time (Years ) 0 .5
1
2
0 .5
+ 23
+ 45
+ 91
1
+ 12
+ 25
+ 49
2
+ 5 . 9
+ 12
+ 24
3
+ 3 .8
+ 7.5
+ 15
A
+ 2 .8
+ 5 .3
+ 1 1
; - 410 -
1

,0'
1<T; lO"1 lO-' 10° 10' 10 ! I0J 10' 10s I0 6 107
Seulfon Energy IcV)
Fig. 1 Typical neutron energy spectra
Np (n, y)
10'
Fig. 3 Np(n,y) cross section
TH( 1 r-TTtTTn; ' ' l l l l l l | 1 "1
236 U (n, r )
JENDL-3 ENDF/B-V
o"1 i o" ' io" ' io° IO 1 i o ' i o J i o ' id1 IO
N e u t r o n E n e r g y ( eV 1
Fig . 2 236U (n,7) cross section
•
x 1
J t N I J L o t N U r / D ~ V "*
™l f f - r»™i .
k>
».J J .
1
P u absorption -
i~.
j J •» '
I O ' ' io _ l IO* IO 1 i o ' i o J Tp io" To*
N e u t r o n E n e r g y 1 eV1
Fig. A 236Pu absorption cross section

-z\v -
Cros s Sec t i on M o r n s ) C r o s s 5 e c t
o
i on \borns 1
o o " 00
" 1
3 o
, • - t - | i
\ " m c_ \ \ - z m \ '; a z \ ; • " n o V \ i - \
- co /\ 1 CO
< *4
/
1 ' 1 • 1
C O
c
3 ,3n
v ^
-
-
\
. 1 \ l
Cross Sect ion I b o r n s )
Z K y + 2 3 8 p u / U | N T U v L ( p p b )
3 <r.
U C *•»
9Z0-06 W-IH3Vr

JAERI-M 90-025
1 .0
0 . 5 -
0.0
- 0 . 5
^ h t a . ) 22_U(n.abs)
Irradiation Time (Years)
Fig. 9 Sensitivities of important cross sections to the 232U production
X 1 0
5 1 • 00
>
«j 0 . 5 0
O
£" o.oo
?T - 0 . 50
00
. 50.
P u ( n . a b s )
s) .
/ 238
_L
U(n.2n)
JL
Np(n.2n-)
J_ 1 2 3 4
I r r a d i a t i o n Time (Years)
Fig. 10 Effect of disrepancies of important cross sections
- 4 1 3 -