Engraved ochres from the Middle Stone Age levels at Blombos Cave, South Africa

Journal of Human Evolution 51 (2006) 255e273
Extending the chronology of deposits at Blombos Cave,South Africa, back to 140 ka using optical dating
of single and multiple grains of quartz
Zenobia Jacobs a,b,*, Geoffrey A.T. Duller b, Ann G. Wintle b, Christopher S. Henshilwood c,d
a School of Earth and Environmental Sciences, University of Wollongong, Northfields Avenue, Wollongong, NSW 2522, Australiab Institute of Geography and Earth Sciences, University of Wales, Aberystwyth, SY23 3DB, UK
c African Heritage Research Institute, 167 Buitenkant Street, Cape Town 8001, South Africad Centre for Development Studies, University of Bergen, N-5007, Norway
Received 12 January 2005; accepted 31 March 2006
Abstract
Optically stimulated luminescence (OSL) measurements are reported for both single aliquots (of two different sizes) and single grains ofquartz from deposits within Blombos Cave. Ages have been obtained for six sediments from the Middle Stone Age (MSA) occupation levelsand for two sterile sands, one underlying the archaeological sediment and one overlying the Later Stone Age occupation levels. The ages for thearchaeological sediments were obtained from single-grain measurements that enabled unrepresentative grains to be rejected. The MSA occupa-tion levels have ages that, within error limits, are in stratigraphic order and fall between the OSL age for the oldest dune sand (143.2� 5.5 ka)and a previously published OSL age for the sterile sand (w70 ka) that separates the Middle and Later Stone Age deposits. The earliestMSA archaeological phase, M3, from where fragments of ochre were found as well as human teeth, is dated to 98.9� 4.5 ka, coincidingwith the sea-level high of oxygen isotope substage 5c. The cave then appears to be unoccupied until oxygen isotope substage 5a on the basisof four OSL ages for archaeological phase M2, ranging from 84.6� 5.8 to 76.8� 3.1 ka; these levels contained large hearths and bone tools. Anage of 72.7� 3.1 ka was obtained for the final MSA archaeological phase, M1, from which deliberately engraved ochre and shell beads wererecovered along with bifacial stone points. We conclude that the periods of occupation were determined by changes in sea level, with abundantsources of seafood available in times of high sea level and with the cave being closed by the accumulation of large dunes during periods of lowsea level, such as during oxygen isotope stages 4 and 6.� 2006 Elsevier Ltd. All rights reserved.
Keywords: Middle Stone Age; Luminescence dating; Modern human behavior
Introduction
Obtaining accurate ages is fundamental to most aspects ofMiddle Stone Age (MSA) archaeological research, particu-larly when time-laden concepts such as ‘‘origins,’’ ‘‘evolu-tion,’’ and ‘‘earliest’’ are used to describe the archaeological
* Corresponding author. School of Earth and Environmental Sciences,
University of Wollongong, Northfields Avenue, Wollongong, NSW 2522,
Australia. Tel.: þ61 2 4221 3817; fax: þ61 2 4221 4250.
E-mail address: [email protected] (Z. Jacobs).
0047-2484/$ - see front matter � 2006 Elsevier Ltd. All rights reserved.
doi:10.1016/j.jhevol.2006.03.007
finds from a site. It has long been known that the majorityof the MSA in South Africa dates to beyond the range ofradiocarbon dating (w40 ka) (Vogel and Beaumont, 1972)and that alternative dating methods are therefore required.One such method is optical dating, which provides a meansof determining burial ages for sediments that have beenexposed to sunlight (Duller, 2004). In optical dating, the opti-cally stimulated luminescence (OSL) of mineral grains, partic-ularly quartz, is used to determine the time that has passedsince the grains were last exposed to light. The age of the sed-imentary units in which artifacts or hominid remains have

256 Z. Jacobs et al. / Journal of Human Evolution 51 (2006) 255e273
been buried can therefore be determined and, by association,the age of the material can be inferred.
An OSL age for the sterile dune sand inside Blombos Cavehas been published previously (Henshilwood et al., 2002a;Jacobs et al., 2003a,b). The dune sand separates the underlyingMSA deposits from those of the overlying Later Stone Age(LSA). This dune layer was selected for initial studies becauseof its aeolian mode of deposition, which would increase thelikelihood that all grains will have the same apparent lumines-cence age because they would all have been sufficientlyexposed to sunlight before deposition. The age obtainedfrom this dune sand (w70 ka), and for equivalent remnantdune sands outside the cave, provided a minimum age estimatefor the MSA-artifact-bearing layers found beneath the dunesand in the cave. These layers contain evidence for early sym-bolic behavior (e.g., engraved ochre and modified shell beads;Henshilwood et al., 2002a, 2004).
The aim of this paper is to extend the chronology forBlombos Cave using OSL to date samples taken from belowthe previously dated sterile dune. Previous OSL measurementsindicate that this sand has not been disturbed (Jacobs et al.,2003b). This finding supported the stratigraphic integrity ofthe underlying MSA layers, refuting any suggestions (e.g.,Klein, 2000) that the ochre, beads, or other artifacts may beintrusive from the overlying and much younger LSA levels.In this paper we study samples from the MSA archaeologicaloccupation layers and an older dune sand. For archaeologicallevels, there is the possibility of partial or heterogeneousbleaching of the constituent grains and the likelihood ofmixing between adjacent stratigraphic layers or units. Forcave sites, there may be additional problems due to the incorpo-ration of grains derived from weathered roof rock or the in situdisintegration of roof material liberating unbleached grains intothe otherwise well-bleached deposit.
If an aeolian sediment consists of mineral grains that wereall exposed to daylight at the time of deposition, then the samevalue of De should be obtained for each grain (with some scat-ter due to statistical error), regardless of how many grainsmake up an aliquot and how many replicate measurementsone makes on different aliquots. In contrast, sediment froman archaeological occupation layer inside a cave will consistof some grains that are representative of the depositional eventof that layer, but it could contain some grains that may derivefrom an underlying or overlying occupation layer with a differ-ent age. In large aliquots consisting of many hundreds ofgrains, it is likely that a result averaged across all grainswill be obtained, but when aliquot sizes are reduced, a randomselection is made from this mixed population. The result isthat some aliquots, by chance, will contain a high proportionof grains that represent the depositional event of interest andwill provide the appropriate De value, whereas other aliquotsmay contain a high proportion of grains that were derivedfrom younger or older layers and will produce an under- or over-estimate of the De. This situation is similar to that faced whendating heterogeneously bleached fluvial sediments, where theexistence of incompletely bleached grains on some aliquotswill result in De overestimates (Olley et al., 1999, 2004b).
In this paper, we present both multiple-grain single-aliquotand single-grain optical dating results from the MSA occupa-tion layers at Blombos Cave. These sediments accumulatedmore slowly than the dune sand and are nonhomogeneous.From the single-grain measurements, evidence is found insome samples for more than one population of grains. Ourability to statistically distinguish such populations is testedby an experiment using laboratory-irradiated grains. Thearchaeological and environmental significance of the OSLages is discussed.
Blombos Cave geological and stratigraphic information
Blombos Cave (BBC) is situated on the southern Capecoast of South Africa (34 �250S, 21 �130E), approximately300 km east of Cape Town and just west of the village of StillBay (Fig. 1). It is one of a number of locations along the south-ern Cape coast, including Die Kelders, Klasies River, andPinnacle Point (Fig. 1), where sites were found that containedevidence of MSA occupation. The geology and types of sedi-ments at BBC are similar to those found in other MSA sitesalong the southern Cape coast, particularly DK1 at Die Kelders(Marean et al., 2000) and a number of cave sites at PinnaclePoint (Marean et al., 2004).
At Blombos, Table Mountain Sandstone (TMS) of the CapeSupergroup (Paleozoic deposits) forms the basal layer ofthe cave w4e6 m below the surface deposits. Outcrops of thefolded and faulted quartzitic sandstone can be seen along thecoast for 3 km to the west and for w20 km to the east ofBBC. Table Mountain Sandstone is overlain by a suite ofmarine and aeolian Cenozoic sediments of the BredasdorpGroup, which also overlies the marine peneplain and extendsfor approximately 15 km inland. Five formations within theBredasdorp Group record a number of marine events (Malanet al., 1994). At BBC, the TMS is overlain by shelly con-glomerate and low-angle marine sands from the De HoopvleiFormation, which is conformably overlain by the well-calcifiedaeolian sands of the Pliocene-aged Wankoe Formation thatrepresent the volumetric bulk of the Bredasdorp Group.Blombos Cave was formed in the Wankoe Formation as aresult of ancient wave-cutting of the cliff. Vegetated andsemiconsolidated dune sands of the Waenhuiskrans Forma-tion are of late Pleistocene age and form most of the coastalforelands near BBC, obscuring all of the De Hoopvlei andmuch of the Wankoe Formation. Remnants of this oncemuch larger dune system are visible both outside and insideBBC, where it is preserved as a thick, sterile dune sand thatseparates the MSA from the LSA. The youngest of theformations that form the Bredasdorp Group is the StrandveldFormation of partially vegetated, unconsolidated dunes thatdate to the Holocene (Malan et al., 1994).
Blombos Cave is currently about 100 m from the IndianOcean shore and 34.5 m above present sea level (Henshilwoodet al., 2001). Blombos Cave is small compared to other knownMSA cave sites, such as Die Kelders. The present surface areaof the cave floor behind the drip line is about 55 m2, but

257Z. Jacobs et al. / Journal of Human Evolution 51 (2006) 255e273
Fig. 1. Map showing Blombos Cave, Die Kelders, Klasies River, Pinnacle Point, and Bredasdorp. The bathymetry is from Van Andel (1989).
further forward of the drip line, another w18 m2 of depositsare retained by fallen calcarenite boulders.
The BBC stratigraphic sequence consists of six phases ofLSA and MSA occupation, the assignation being based ontheir content and stratigraphy, not their age (Fig. 2). Threephases of nonanthropogenic sediment deposition have alsobeen identified.
The LSA phases were named BBC L1, BBC L2, and BBCL3. The LSA was dated by radiocarbon to between 290 14Cyears BP (BBC L1) and 2000 14C years BP (BBC L3) (Henshil-wood, 2002b; both ages are uncalibrated). The LSA does notform part of the present study (for more detailed informationon the LSA at BBC, see Henshilwood, 1995, 1996).
A thick, sterile aeolian sand (BBC Hiatus) clearly separatesthe LSA phases from the MSA phases and does not containany anthropogenically derived deposits. A sterile aeoliansand overlying the LSA occupation layers almost blockedthe cave entrance prior to commencement of the excavation(Henshilwood et al., 2001). As excavation proceeded, a sterilesand was found beneath the MSA occupation levels.
The MSA layers were allocated to three phases, BBC M1,BBC M2, and BBC M3, which are referred to in this paper asM1, M2, and M3, respectively. The four uppermost MSAlayers below BBC Hiatus, are assigned to the M1 phase(Fig. 2). This phase contains more than 400 bifacially workedlanceolate points, the fossile directeurs of the Still Bay Indus-try (Goodwin and Van Riet Lowe, 1929; Henshilwood et al.,2001). Two pieces of deliberately engraved ochre witha cross-hatched pattern (Henshilwood et al., 2002a) wererecovered from this phase, as well as w39 shell beads; theseare regarded as unequivocal evidence for modern humanbehavior (Henshilwood et al., 2004; d’Errico et al., 2005). Inaddition, an engraved bone fragment (Henshilwood and Sealy,1997; d’Errico et al., 2001) and three human teeth, two ofwhich are deciduous (Grine et al., 2000; Henshilwood et al.,2001; Grine and Henshilwood, 2002), came from this phase.
The underlying four layers, typified by carbonized deposits,large hearths, and shellfish, represent the M2 phase. The upperpart of this phase contains most of the bone tools (Henshil-wood et al., 2002b), probably used as awls and projectilepoints, as well as a human premolar crown (Grine et al.,2000; Henshilwood et al., 2001). The remaining excavatedlayers below make up the M3 phase; these layers are domi-nated by shellfish remains and contain high densities of ochre.One human deciduous tooth and four adult teeth come fromthis phase (Grine et al., 2000; Henshilwood et al., 2001; Grineand Henshilwood, 2002).
Much has been written about the symbolic significance ofthe artifacts recovered from BBC, as well as the MSA peoples’broad subsistence base and likely ability to fish (Henshilwoodet al., 2001). These lines of evidence have been used to sug-gest levels of cognitively modern behavior that are not conven-tionally associated with MSA people (Henshilwood andMarean, 2003). The human teeth recovered from the BBCdeposits fall within the range for modern human variation(Grine et al., 2000; Grine and Henshilwood, 2002) and contrib-ute to the archive of early modern human remains in Africa.
Dating samples
The samples for optical dating from within BBC, both ster-ile dune sands and archaeological sediments, are discussedhere in stratigraphic order. A recently deposited sand (ZB9)found overlying the LSA deposits was collected as a modernanalogue sample. Information on two samples of cementeddune sand (ZB13 and ZB20) found outside the cave was givenin a previous publication (Jacobs et al., 2003a). These, togetherwith the dune sand (ZB15) inside the cave, are thought tobelong to the Pleistocene-aged Waenhuiskrans Formation(Rogers, 1988; Malan et al., 1994). In addition, a sample(ZBroofB) of rock that was typical of the Pliocene-aged calcar-enite from the Wankoe Formation was collected.

258 Z. Jacobs et al. / Journal of Human Evolution 51 (2006) 255e273
M1
M2
M3
ZB4
ZB7
ZB7
ZB4
ZB8
ZB6
ZB5
HIATUS
a b
c
ZB42
Fig. 2. (a) General view of the south and east sections showing the position of some, but not all, samples for dating. Sample ZBroofB was taken from the block
visible below ZB6. (b) Layout of cave showing excavation grid, with red indicating area from which samples were taken. (c) Close-up photo of the south section
(square G6), with the M1, M2, and M3 phases indicated alongside photos of some of the more significant finds.
Sampling was undertaken with three aims in mind: (1) theneed to assess stratigraphic integrity, i.e., that no LSA artifactscould have moved down through the sterile dune sand (ZB15);(2) to provide a chronology for all three MSA archaeologicalphases (M1, M2, and M3); and (3) to determine times whenthe cave mouth was closed by dune formation by dating thesterile sands within the cave.
The layers from which ZB15 and ZB9 were collected wereof sufficient thickness to permit large sample tubes (5 cm di-ameter, 30 cm long) to be inserted and a field gamma spec-trometer with a crystal diameter of 5 cm to be used. Foreach of the samples from the MSA archaeological levels,two duplicate samples were taken a few cm apart, using tubesthat were 2.5 cm in diameter and 10 cm long. This enabledsampling from a single observable stratigraphic layer.
Dune sands
A sample (ZB9) was taken from the base of a sterile dunesand overlying the LSA occupation layers inside the cave. This
sand does not contain any archaeological materialdonly somemicrofaunadand is cream-colored and well-sorted. It wasdeposited inside the cave after the most recent LSA occupa-tion, approximated 290 years ago (Henshilwood et al.,2002b). Sample ZB15 was taken from the sterile dune sand(BBC Hiatus) that separates the LSA from the MSA. Thissand is bright orange, well-sorted, and also contains no archae-ological evidence.
One sample (ZB5) was taken from a sandy matrix (layerCJ) at the base of the excavation. It contains no archaeologicalremains, only some microfauna, and it predates the large roof-fall evident in the cave today.
Phase M1
One sample (ZB4) was taken from the M1 phase in layerCC. At the sampling position, this layer was very sandywith some artifacts, bone, and shell visible, but the archaeo-logical material was not abundant.

259Z. Jacobs et al. / Journal of Human Evolution 51 (2006) 255e273
Phase M2
Four samples (ZB10, ZB7, ZB8, ZB6) were taken from theM2 phase. Sample ZB10 (layer CFD) was taken from withina thick white ash layer. Sample ZB7 (layer CGAA) wasfrom a very sandy layer with scattered bone, shell, and veryfew stone artifacts. Sample ZB8 (CGAB/CGAC) was alsotaken from a hearth in a unit that contained few stone artifacts,bones, and shells, but many hearths. Sample ZB6 (CGAC) wastaken from a sandy sedimentary layer at the base of the M2phase.
Phase M3
One sample (ZB42) was taken from layer CH/CI, a shellmidden found below a layer of roof spall (Fig. 3). This layerrepresents the thickest, densest midden with shell, bone, andstone that has been excavated at BBC, and it contains exten-sive compact in situ hearths and ash deposits. This currentlyrepresents the earliest archaeological evidence at BBC.
Optical dating
Optical dating is now quite widely used for providing agesfor sediments up to 150 kyr old. Optically stimulated lumines-cence ages on quartz have been obtained for wind-transportedgrains and for water-lain grains. The reliability of OSL agesover the last 40 kyr has been demonstrated by comparisons
Fig. 3. Photos of (a) layer with small pieces of roof spall, which provide an
unconformity that separates phases M2 and M3 (square H5d), and (b) after
excavation that reveals layer CH/CI of phase M3, containing archaeological
material, including shells.
with radiocarbon dating; some of the earlier comparisons forsingle aliquot OSL ages were summarized by Murray andOlley (2002). A more recent comparison over the full radiocar-bon timescale was carried out for sand-sized grains extractedfrom a deep-sea core off the coast of northwestern Australia(Olley et al., 2004a). The single-grain OSL ages were consis-tent with the AMS radiocarbon ages obtained for planktonicforaminifera from the same core. Stokes et al. (2003) obtainedOSL ages on multiple-grain aliquots of silt-sized quartz fortwo independently dated marine cores from the western Ara-bian Sea; the chronologies were provided by both radiocarbondating and by identification of a dated ash horizon (Toba Ashat 74� 2 ka) and a biostratigraphic marker fossil (120 ka) inthose cores. An additional test of quartz OSL ages reachingback to the last interglacial high sea level (oxygen isotopestage 5e: 132e128 ka) was provided by a study of coastalmarine sands from the east coast of Denmark (Murray andFunder, 2003). From the 22 OSL ages obtained by samplingthe sands, now exposed in a cliff, an age of 121� 4 ka was ob-tained for the marine transgression, though individual ages forthe most pertinent unit ranged from 109� 6 ka to 129� 4 ka.These studies provide the background to accepting OSL agesfor otherwise undated sediments (e.g., the sterile dune sandsand archaeological sediments at BBC).
Dating of single aliquots
Central to the significance of the BBC MSA artifacts andhuman remains is the reliability of the dating of the MSA de-posits and the stratigraphic integrity of the layers in whichthese artifacts are found. Both of these aspects are addressedby applying OSL measurements to large numbers of singlealiquots, each made up of several hundred grains, and tothousands of individual quartz grains. For the multiple-grainaliquots, two sizes were studied, each prepared by spreadinggrains on a disc that had been sprayed with silicone oil, througheither a 5-mm- or 2-mm-diameter mask. The 5-mm-diametercircle provided about 1000 grains and the 2-mm-diametercircle provided about 100 grains. For dating the sands andthe archaeological layers, both aliquot sizes were measured.
The OSL instrumentation used in this study, a Risø TL/OSLreader, is described elsewhere (Jacobs et al., 2003a). For thisstudy, the optical stimulation for single aliquots was providedby blue (470 nm) light-emitting diodes (LEDs). For measure-ment of the equivalent dose (De), the single-aliquot regenera-tive dose (SAR) protocol developed by Murray and Wintle(2000) was applied. For the measurements described in thissection (on sterile sands, rather than material for archaeologi-cal occupation layers) the SAR protocol used a range of pre-heat temperatures before measurement of the main OSLsignal and a temperature of 160 �C for the heating (cut-heat)prior to measurement of the response to the test dose.
The sterile dune sand (BBC Hiatus)
Dating of the archaeologically sterile sand (ZB15) was car-ried out using 5-mm-diameter aliquots. Since the sands were
260 Z. Jacobs et al. / Journal of Human Evolution 51 (2006) 255e273
assumed to be homogeneous with regard to bleaching andenvironmental dose rate, no 2-mm aliquots were measured.Using multiple-grain aliquots, an OSL age of 69.2� 3.9 kawas obtained and this agreed well with the OSL ages of69.6� 3.5 ka (ZB13) and 70.9� 2.8 ka (ZB20) obtained forthe remnant sands outside the cave (Jacobs et al., 2003a).These ages were used to provide a minimum age for the under-lying MSA deposits. Several internal checks were built intothe laboratory measurement procedure, and criteria wereestablished to ensure that only reliable estimates of the equiva-lent dose (De) were used in the final age calculation. In addition,the appropriateness of this procedure, using a ten-secondpreheat for 220 �C and a cut-heat at 160 �C within each mea-surement cycle (Murray and Wintle, 2000) for these dune sands,was demonstrated by carrying out a dose recovery test. Fulldetails of these measurements and the results for these samplesare given in Jacobs et al. (2003a).
The recent sands overlying the LSA deposit
Twenty-four small (2 mm in diameter) aliquots of therecent sand (ZB9) were measured using the conventionalSAR protocol (Murray and Wintle, 2000). Signal levels werelow and Fig. 4a shows the natural OSL signal and responseto a 0.16 Gy dose. Regeneration doses of 0.08, 0.16, 0.32,0.48, 0.64, 0.96, and 1.28 Gy were used and the test dosewas 0.48 Gy. Figure 4b shows the standardized dose-responsecurve (Roberts and Duller, 2004). A range of preheat tempera-tures from 160 to 300 �C was used. Values of De were obtainedfor all 24 aliquots and the results are given in Figure 4c. Theexperimental uncertainty associated with each De value waslarge, and this resulted in zero overdispersion. The meanDe value was 0.07� 0.01 Gy. A value of w0.2 Gy wasobtained for one aliquot, though this was an imprecise value.Each De value has a calculated uncertainty of between 10%and 50%, much higher than for the measurements for theolder sample (ZB15). The mean value gave rise to an ageof 100� 10 years, demonstrating that sand grains blowninto the cave had been zeroed before deposition.
Even lower doses have been reported for single-aliquotmeasurements made on quartz grains from recently depositedsamples in other studies. Olley et al. (1998) obtained a meanburial dose of 0.020� 0.006 Gy for an active dune in south-eastern Queensland, consistent with the knowledge that thegrains would have been deposited in the last five years.Although 93% of the individual dose estimates were consistentwith zero, one value was 0.43� 0.04 Gy. This outlier couldnot be related unequivocally to the incorporation of an incom-pletely bleached grain, since similar outliers with values up to0.68 Gy were obtained for deliberately bleached sediments(Roberts et al., 2000). This was attributed to recuperation ofthe signal following light exposure. To investigate whethera similar recuperation phenomenon occurred for the recentsand (ZB9), another 24 aliquots were prepared and bleachedusing the blue LED light from the Risø TL/OSL reader andthe conventional SAR protocol was used with the same range
of preheat temperatures. All except six aliquots gave valuesclose to zero, with a mean of 0.01� 0.02 Gy equivalent toan age of about 10 years. The outliers gave values between0.1 and 0.2 Gy; there was no dependence of these valueson preheat temperature, and it was concluded that thermaltransfer was not occurring as a result of the preheat (Jacobs,2004). This suggests that the sample was already very wellbleached. It can therefore be assumed that the aeolian sandstrapped inside the cave are well bleached. In addition, lowlevels of recuperation (<0.2 Gy) will have a negligible effecton the De values obtained for the sand from the archaeolog-ical levels.
Stimulation time (s)0 10 20 30 40
OSL
cou
nts/
0.16
s
0
20
40
60
80
100
120
Natural0.16 Gy
ZB9
a
b
Dose (Gy)0 0.4 0.8 1.2
0
0.4
0.8
1.2
L x/T
x * T
D
ZB9
De = 0.08 ± 0.03 Gy
Precision (1/Std.Error)0 4 8
-202
Stan
dard
ized
Est
imat
e
0.1
0.2
0.3ZB9
N = 24 De = 0.07 ± 0.01 Gy
c
25 12.5Relative error (%)
De
(Gy)
Fig. 4. Data for single aliquots (2 mm in diameter) of sand (ZB9) overlying the
LSA deposits: (a) OSL decay curves for the natural dose (LN) and a laboratory
dose (LX) of 0.16 Gy; (b) standardized dose-response curve showing deriva-
tion of De; and (c) radial plot giving De values for 24 aliquots.
261Z. Jacobs et al. / Journal of Human Evolution 51 (2006) 255e273
Single-aliquot measurement of quartz grains fromcave-roof spall
The possibility of contamination of the sedimentarydeposits by roof spall needs consideration. It has been de-monstrated at Jinmium, northern Australia, that luminescenceages can be severely overestimated if unbleached or partiallybleached roof-spall grains contaminate the archaeological sed-iments (Fullagar et al., 1996; Roberts et al., 1998a, 1999).Roof-spall contamination can result when (a) individual grainsfall down as a shower from the roof into the sedimentary de-posits; (b) decomposing roof spall liberates unbleached grainsin situ into the sedimentary deposits. The former may result ingrains with different bleaching histories and the latter willresult in grains that will not have been bleached by sunlight.
Blombos Cave was formed in the calcified sediments of thePliocene-aged Wankoe Formation as a result of ancient wavecutting of the cliff. The Wankoe Formation is a prominent topo-graphic feature visible from Bredasdorp to the Gourits River, tothe west and east of BBC, respectively (Malan et al., 1994)(Fig. 1). It is cream-colored and consists of fine-to-mediumsand-sized, well-rounded quartz grains with some glauconite(a heavy mineral) grains and shelly shingle (Malan et al., 1994).
At BBC, rock-fall of the Wankoe Formation is mostlyconfined to large rocks at the base of the excavation (Fig. 2).However, there are also many smaller blocks of roof spallthroughout the BBC deposits, such as the layer that forms theboundary between M2 and M3 (Fig. 3). There are, however,clear macroscopic variations in roof-fall content from layerto layer and from place to place within the cave. The majorityof the smaller roof-spall blocks that are mixed with artifacts inoccupation horizons are found in the M1 phase. The sample ofroof material for OSL analysis (ZBroofB) was taken from oneof the very large fallen rocks (Fig. 2). It was dry and compact,but not friable. However, these blocks of roof spall can disinte-grate in situ over a prolonged period of time.
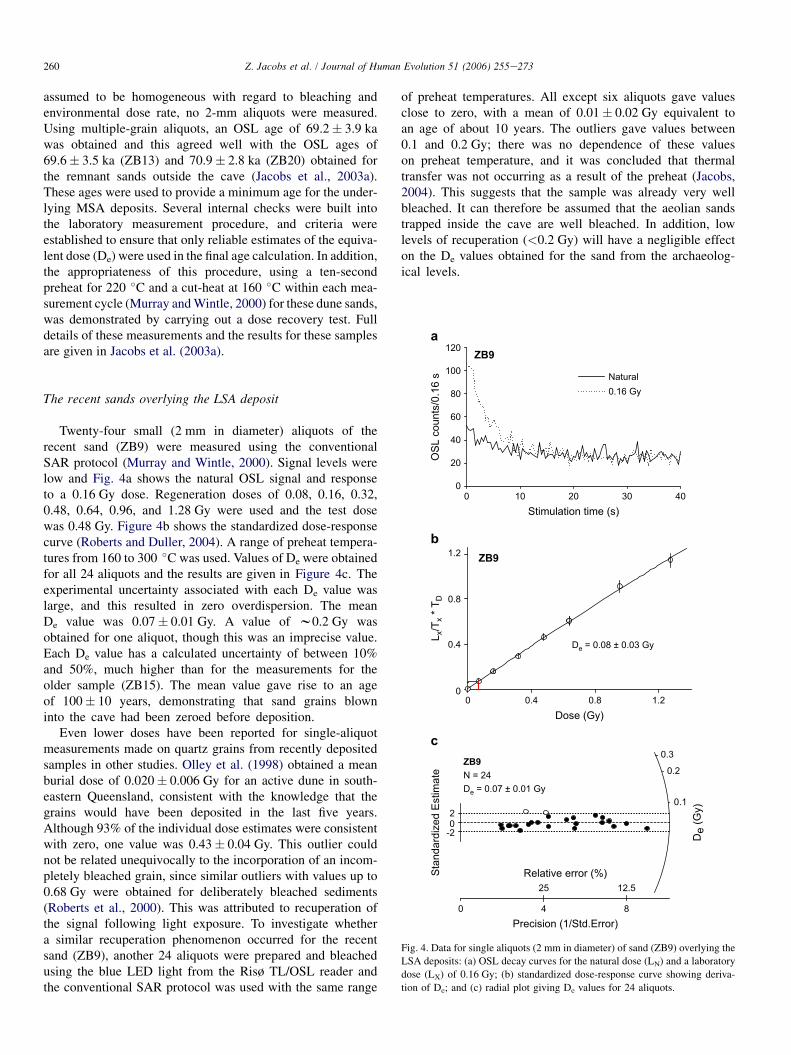
The OSL measurements were made on small aliquots of theroof material using the conventional SAR measurement proce-dure of Murray and Wintle (2000) to construct dose-responsecurves using a range of regenerative doses going up to1200 Gy, and in some cases up to 2400 Gy. A test dose ofw50 Gy was applied. A single preheat temperature of260 �C for 10 s was used and a cut-heat of 160 �C for 0 s.Each small aliquot was made up of grains that covered a circle2 mm in diameter on an aluminium disc and would have con-tained approximately 100 grains. A typical decay curve forthe natural signal and the corresponding standardized dose-re-sponse curve are shown in Figure 5a, b.
The characteristics of quartz from the roof material can besummarized as follows. It is weakly luminescent; the signal in-tensity integrated over the first 0.8 s is <2000 counts for thenatural OSL measurement and this precluded the study of sin-gle grains. A value of De could be obtained for at least twothirds of the aliquots. However, these aliquots either failedthe recycling ratio test (a criterion set out by Murray and Win-tle, 2000) or the OSL IR depletion ratio test (a criterion set outby Duller, 2003). For the remaining aliquots, the sensitivity-
corrected natural OSL signals were fully saturated (as shownin Fig. 5b), as would be expected of a sample that is of Plio-cene age.
The weak luminescence response from these multiple-grainaliquots would mean that a very large proportion of grainswould have to be derived from the in situ break up of roof spallin order to have a significant impact on De values for multiple-grain aliquots from the archaeological levels.
Single-grain studies
Single grains were measured, and ages obtained, for thesterile sands (ZB15) assigned to the Waenhuiskrans Formationand to six samples from the archaeological levels (ZB4, ZB10,ZB7, ZB8, ZB6, and ZB42). The single-grain laser lumines-cence unit attached to the Risø TL/OSL reader has beendescribed elsewhere (Jacobs et al., 2003b). Grains were stim-ulated individually using a focused laser, with 100 grainsbeing held in individual holes drilled into a 10� 10 array ona single aluminium disc (Duller et al., 1999; Bøtter-Jensenet al., 2000). For the sterile sands, the same prepared samples
Stimulation time (s)0 10 20 30 40
OSL
cou
nts/
0.16
s
0
200
400
600
800
1000a
ZBroofB
Dose (Gy) 0 1000 2000 3000
0
40
80
120
160
L x/T
x * T
D
ZBroofB
b
Fig. 5. Data for a single aliquot (2 mm in diameter) of quartz grains from
the block of roof spall (ZBroofB): (a) OSL decay curve for natural dose
(note low count rate); and (b) standardized dose-response curve showing
the natural signal to be at the saturation level, as determined using very
high regenerative doses.

262 Z. Jacobs et al. / Journal of Human Evolution 51 (2006) 255e273
as in the single-aliquot study were used along with the sameSAR procedure (220 �C for ten-second preheat and a 160 �Ccut-heat). For the MSA occupation levels, the SAR procedurewas modified, as discussed later for the additional single-aliquot measurements.
The sterile sand separating the LSA and MSA deposits
Several thousand quartz grains from the sterile sand (ZB15)have been measured (Jacobs et al., 2003b). For these samples,30% (or less) of grains gave natural OSL signals that were dis-tinguishable from the background signal of the light detectionsystem (Jacobs et al., 2003b). Indeed, it was shown that 10%of the grains of ZB15 gave rise to 90e95% of the signal, im-plying that 90e95% of the signal from a multiple-grain aliquotof 5 mg of 212e250 mm grains would come from between 25and 80 grains out of the 500e800 being stimulated.
For dating single grains, it was necessary to develop criteriain order to reject De values that did not make up part of thedistribution that could be used to calculate the age (Jacobs,2004). The rejected grains included those with very low signalintensities and those that could be demonstrated not to respondappropriately when the SAR protocol was applied (Jacobset al., 2003b). The criteria included those put forward byMurray and Wintle (2000), as well as a method for detectionof feldspar contamination proposed by Duller (2003). Theyhave been extensively tested for sample ZB4 from BBC, andsample SIB2 from another archaeological site (Jacobs et al.,2006a).
The resulting dose distributions for the sterile sand wereshown in Jacobs et al. (2003b). Analysis of this distribution us-ing the central age model (Galbraith et al., 1999) gave a valueof 49.2� 2.1 Gy for 34 grains from ZB15. This value is withina few percent of the value (50.3� 1.7 Gy) for multiple-grainsingle aliquots given in the previous section. The overdisper-sion observed was 13.5% for ZB15. This value is similar tothose for other single-grain measurements of natural quartz(Roberts et al., 1999). The interpretation of overdispersionvalues for samples from this and another archaeological sitein South Africa is discussed elsewhere (Jacobs et al., 2006a).Galbraith et al. (2005) and Olley et al. (2004a) concludedthat overdispersion of <20% is indicative of single dosepopulations, thus allowing the central age model to be usedto calculate the De value for age determination.
Olley et al. (2004a) also recommended routine checking ofsamples using single grains in order to check for heterogeneousbleaching. Roberts et al. (1998a) proposed single-grain studiesas a means of determining whether fragments of weatheredsandstone may have been incorporated in the deposit and sub-sequently disintegrated in situ. In addition, movement of grainsdown through a sediment profile may have occurred, and thiscould be identified by single-grain analysis (Roberts et al.,1999; Heimsath et al., 2002). The single-grain data for ZB15(the sterile dune sand) did not show any evidence of De valuesthat did not form part of a single population (Jacobs et al.,2003b).
Deliberately mixed populations of De values
The single-grain data set for ZB15 exhibited no evidence ofcontamination by younger grains (Jacobs et al., 2003b). How-ever, to confirm that single-grain OSL measurements are ableto detect such contamination at BBC, a laboratory experimentwas undertaken to look at a sample that had been deliberatelymixed.
Roberts et al. (2000) have investigated artificial mixtures ofDe values for grains that have been given different laboratorydoses. This follows their dating study of single-quartz grainsfrom the rock-shelter sites of Jinmium (Roberts et al.,1998a, 1999) and Malakunanja II (Roberts et al., 1998b),both in Australia. Roberts et al. (2000) presented data setsfor grains that had been given 5, 10, and 20 Gy doses, witheach grain being irradiated on an individual disc. They con-firmed that, for the two higher doses, the mean doses couldbe recovered using the central age model (Galbraith et al.,1999). They then constructed synthetic mixtures from thesedata sets; this approach, rather than physical mixing of thegrains before measurement, ensured that the applied andcalculated doses for each grain were known. They then devel-oped, and applied, a finite mixture model for calculation ofcomponent doses from the mixed data set.
This experimental approach has been applied to 212e250-mm-diameter quartz grains from the sterile dune sand (ZB15).However, in our study, the grains were measured using thesingle-grain reader with grains presented in 10� 10 arrays.The OSL signals from these grains were individually zeroedby exposure to the focused laser (532 nm at w50W/cm2) for1 s. A total of 2400 grains were then irradiated using the90Sr/90Y beta source; half were given a 4.8 Gy dose and halfa 52 Gy dose. The latter dose was chosen as a value close tothe De value determined for single grains from the dunesand ZB15; the 4.8 Gy dose was chosen as being an order ofmagnitude smaller than the larger dose and will be representa-tive of a sample with an age of 7 ka. This is higher than whatwould be expected for the oldest LSA deposits in BBC, whichwere radiocarbon dated to w2 ka (Henshilwood et al., 2002b).As in the case of the single-grain dating study for ZB15(Jacobs et al., 2003b), only about 10% of the grains wereusable. The rejection criteria first used by Jacobs et al.(2003b) and subsequently developed further by Jacobs et al.(2006a) were applied to these two data sets.
About 150 grains were left in each data set, and they arepresented as radial plots in Fig. 6a,b for the 52 Gy and4.8 Gy doses, respectively. Using the central age model ofGalbraith et al. (1999), De values of 51.7� 0.6 Gy and4.8� 0.04 Gy were obtained for 159 and 157 grains, respec-tively. In Fig. 6a,b, De values that fall outside the �2s bandcentered at the applied dose are shown as open circles. Forthe 52 Gy data set, 94.3% of the values fall inside this rangeand for the 4.8 Gy dose, 93%. The overdispersion is 6.0%and 4.4%, respectively, smaller than the values of 9% and14% obtained by Roberts et al. (2000) for their 10 Gy and20 Gy doses, for which they had 25 and 35 De values,respectively.

263Z. Jacobs et al. / Journal of Human Evolution 51 (2006) 255e273
We then combined our two data sets and fitted a two-component mixture using a value of 10% as the value of sfor each population; this is comparable with the value of 11%used by Roberts et al. (2000) when they combined the datafor 10 and 20 Gy irradiated grains.
Precision (1/Std.Error)0 10 20 30 40
-202
Stan
dard
ized
Est
imat
e
40
50
60
7052 Gy
Relative error (%)10 5 3.3 2.5
Precision (1/Std.Error)0 10 20
0 2010
12 6 4 3
30 40
30 40
-202
Stan
dard
ized
Est
imat
e
De
(Gy)
De
(Gy)
De
(Gy)
4
5
6
b
a
c
10 5 3.3 2.5
Relative error (%)
Mixture
Stan
dard
ized
Est
imat
e
Precision (1/Std.Error)
Relative Error (%)
6852
3628
2016
12
8
4
4.8 Gy
Fig. 6. Radial plots for single grains of ZB15 that had been bleached and then
given doses of (a) 52 Gy and (b) 4.8 Gy and (c) for the combined data sets. The
open symbols relate to De values outside the �2s range.
The two data sets are shown in Fig. 6c, and they are clearlydistinguishable. The centered values of De obtained for thesetwo data sets using the finite mixture model were 51.9� 0.01and 4.8� 0.01 Gy, with mixing proportions of 50.2% and49.8%, respectively. This experiment demonstrates that it ispossible to separately evaluate values of De obtained for mixedpopulations of grains, provided that the dispersion parameterfor each component is small. This approach is appropriate forthree samples (ZB7, ZB8, and ZB42) from the MSA occupa-tion levels and will be applied to them later in this paper.
Dating of MSA occupation layers at BBC
For the measurements of quartz extracted from the archae-ological levels, the SAR procedures used a single preheattemperature of 260 �C and a higher cut-heat temperature of220 �C. In addition, an extra optical stimulation (280 �C for40 s), suggested by Murray and Wintle (2003) to be givenbetween each measurement cycle, was adopted. These changesare supported by experimental studies reported elsewhere(Jacobs, 2004; Jacobs et al., 2006b).
De distributions from the MSA occupation layers
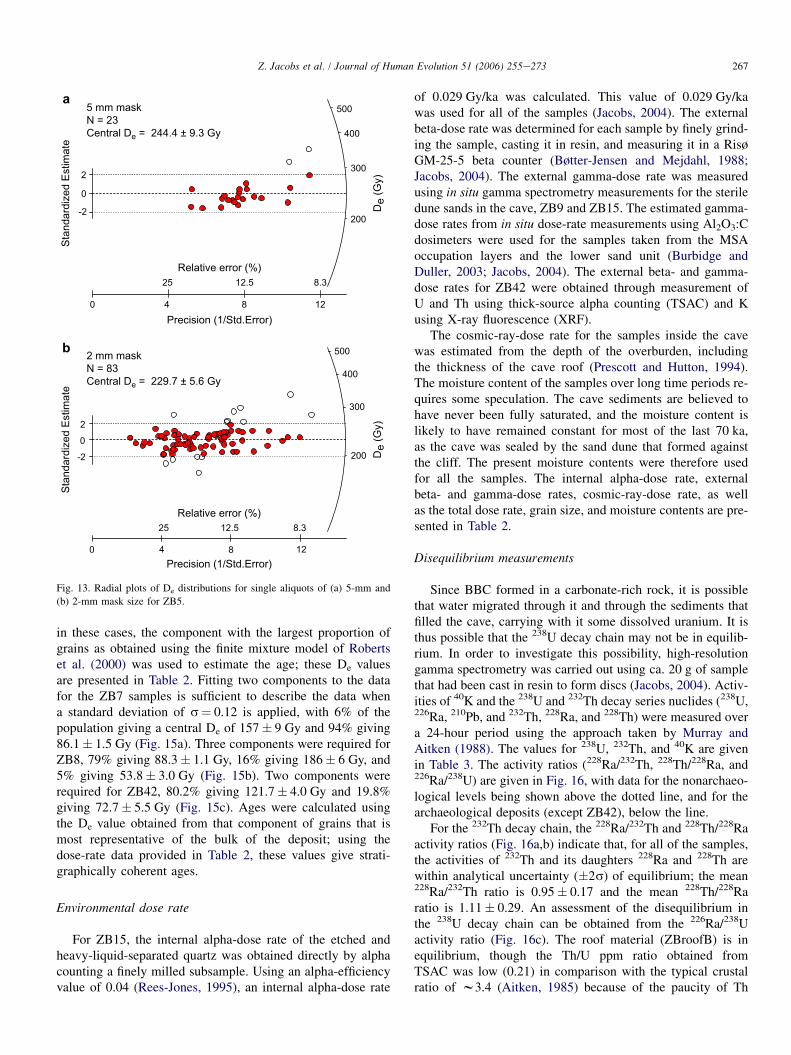
The De distributions obtained for the samples taken fromthe more complex MSA occupation layers are presented inFigures 7e13 in stratigraphic order. In each figure, three radialplots are presented for the 5-mm-mask single aliquots, the2-mm-mask single aliquots, and the single grains (for ZB5,only the single-aliquot data are given in Fig. 13). The De
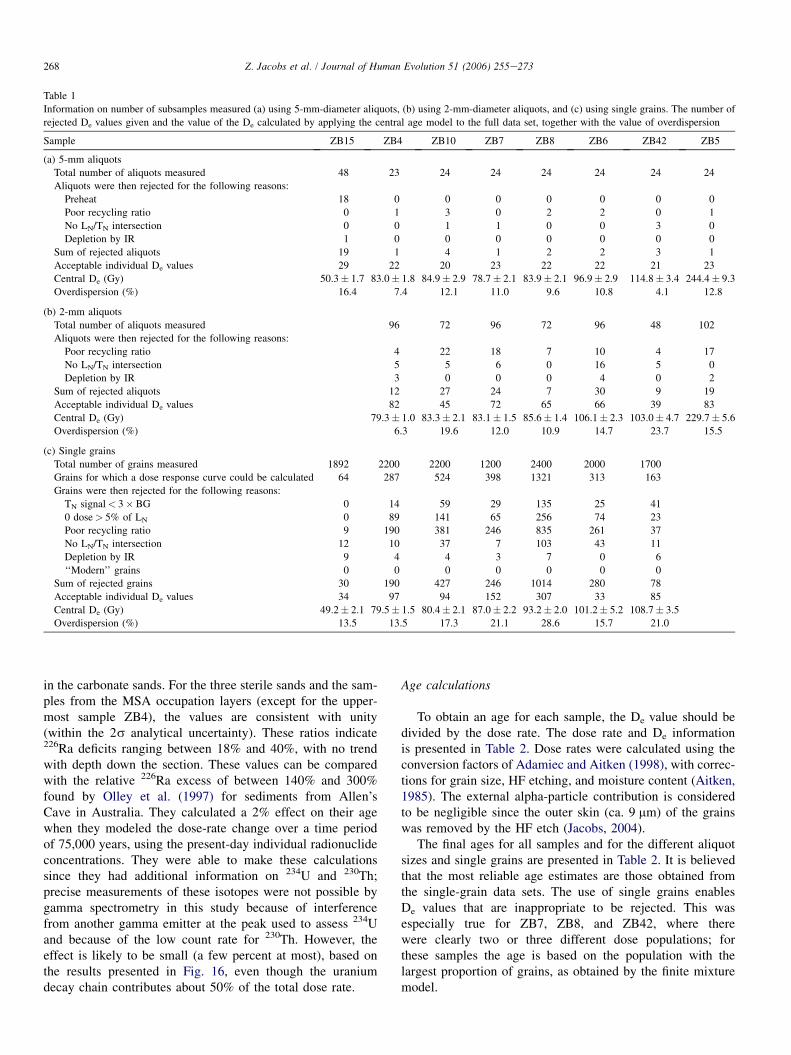
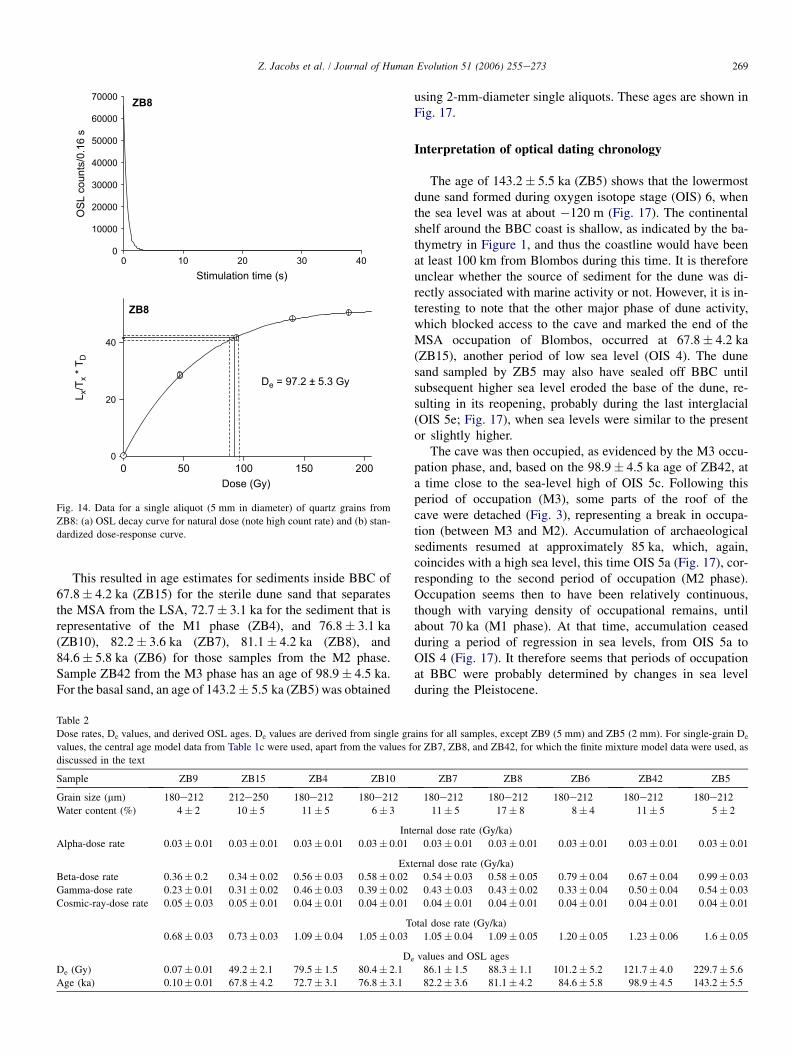
values presented here are those remaining after rejection of al-iquots or grains that failed the rejection criteria (Jacobs et al.,2003b, 2006a); thus the overdispersion, or lack thereof, inthese De distributions can be interpreted with regard to depo-sitional and postdepositional processes. The central valueshown in each figure was derived using the central age calcu-lation. This value will be appropriate if the sample consists ofa single population, but inappropriate if it contains a mixture(e.g., Figs. 9c, 10c, 12c). Information on the number of ali-quots measured and rejected, and reasons for rejection, is pro-vided in Table 1 (a,b) for the 5- and 2-mm-sized singlealiquots, respectively, from each sample, together with thevalues for the sterile sand (ZB15). The same information isprovided in Table 1c for the single-grain measurements. Ex-amples of an OSL decay curve and a standardized growthcurve for a 2-mm aliquot of ZB8 are shown in Figure 14; thesecurves are also illustrated for the young dune sand (ZB9 inFig. 4) and the quartz from the roof spall (ZBroofB in Fig. 5).
For samples from the MSA levels, the De distributions forthe 5-mm-mask aliquots have overdispersion values thatrange between 12.8% and 4.0% (Table 1a). These valuesare similar to, but generally lower than, that observed forthe single-aliquot De distribution from the sterile dune sand(ZB15). The fact that the overdispersion value is significantlygreater than zero suggests that a range of De values is pres-ent. The De distributions for the 2-mm-mask aliquots have

264 Z. Jacobs et al. / Journal of Human Evolution 51 (2006) 255e273
overdispersion values with a slightly larger range, between23.7% and 6.3% (Table 1b). The greater range in overdisper-sion value is to be expected since a much smaller number ofgrains in an aliquot reduces the likelihood of averaging outthe De across all aliquots. The De distributions from the sin-gle-grain measurements have overdispersion values thatrange between 28.6% and 13.5% (Table 1c). This further
Precision (1/Std.Error)0 10 20 30
-202
0
2
60
80
100
1202 mm maskN = 82Central De = 79.3 ± 1.0 Gy
10 5 3.3
Relative error (%)
Stan
dard
ized
Est
imat
e
Precision (1/Std.Error)0 10 20 30
-2
Stan
dard
ized
Est
imat
e
60
80
100
1205 mm maskN = 22Central De = 83.0 ± 1.8 Gy
10 5 3.3
Relative error (%)
De
(Gy)
De
(Gy)
De
(Gy)
Precision (1/Std.Error)0 5 10 15 20
-2
0
2
60
80
100
120Single grainsN = 97Central De = 79.5 ± 1.5 Gy
20 10 6.7 5
Relative error (%)
Stan
dard
ized
Est
imat
e
a
b
c
Fig. 7. Radial plots of De distributions for single aliquots of (a) 5-mm and
(b) 2-mm mask size, and (c) for single grains for ZB4.
increase in overdispersion of the De values confirms thatthere may be a mixture of grains with different apparentages in some of the samples.
The single-grain dose distributions can best be investigatedby looking at the overdispersion values (Table 1c). If the De
distribution from the sterile dune layer is taken as the bench-mark for interpretation of a single dose population, then we
Precision (1/Std.Error)0 4 8 12 16
-2
0
2
De
(Gy)
De
(Gy)
De
(Gy)
80
120
1605 mm maskN = 20Central De = 84.9 ± 2.9 Gy
25 12.5 8.3 6.25
Relative error (%)
Stan
dard
ized
Est
imat
e
0 5 10 15 20
-20
2
60
80
100
120
1402 mm maskN = 45Central De = 83.3 ± 2.1 Gy
20 10 6.7 5
Precision (1/Std.Error)
Relative error (%)
Stan
dard
ized
Est
imat
e
Precision (1/Std.Error)0 4 8 12 16
-202
80
120
160
Single grainsN = 94Central De = 80.4 ± 2.1 Gy
25 12.5 8.3 6.25
Relative error (%)
Stan
dard
ized
Est
imat
e
a
b
c
Fig. 8. Radial plots of De distributions for single aliquots of (a) 5-mm and
(b) 2-mm mask size, and (c) for single grains for ZB10.

265Z. Jacobs et al. / Journal of Human Evolution 51 (2006) 255e273
can use the overdispersion value for this sample (ZB15) as thetypical value for a single population in BBC. This would takeinto consideration the minimum dispersion as a result of betamicrodosimetry and therefore, natural variations in the De. Theoverdispersion value for ZB15 was 13.5%. The reason for
Precision (1/Std.Error)0 5 10 15 20
-202
Stan
dard
ized
Est
imat
e
De
(Gy)
De
(Gy)
De
(Gy)
60
80
100
120
1405 mm maskN = 23Central De = 78.7 ± 2.1 Gy
20 10 6.7 5Relative error (%)
Precision (1/Std.Error)0 5 10 15 20
-2
0
2
60
80
100
120
1402 mm maskN = 72Central De = 83.1 ± 1.5 Gy
20 10 6.7 5Relative error (%)
Stan
dard
ized
Est
imat
e
Precision (1/Std.Error)0 5 10 15 20
-2
0
2
60
80
100
120
140Single grainsN = 152
20 10 6.7 5
Relative error (%)
Stan
dard
ized
Est
imat
e
a
b
c
Fig. 9. Radial plots of De distributions for single aliquots of (a) 5-mm and
(b) 2-mm mask size, and (c) for single grains for ZB7.
thinking that this is representative of a single dose populationis discussed in Jacobs et al. (2003a,b).
From the single-grain dose distributions for the samplesfrom the MSA occupation layers, it is the distributions fromZB7 (s¼ 21.1%; Fig. 9c), ZB8 (s¼ 28.6%; Fig. 10c), andZB42 (s¼ 21.0%; Fig. 12c) that appear to consist of morethan one dose population. Sample ZB10 (s¼ 17.3%) hassome outliers, but there is no clear trend in the scatter(Fig. 8c). Sample ZB4 [s¼ 13.5%, the same as that of the
Precision (1/Std.Error)0 10 20
-202
De
(Gy)
De
(Gy)
De
(Gy)
60
80
100
120
1405 mm maskN = 22Central De = 83.9 ± 2.1 Gy
10 5
Relative error (%)
Stan
dard
ized
Est
imat
e
Precision (1/Std.Error)0 10 20
-202
60
80
100
120
1402 mm maskN = 65Central De = 85.6 ± 1.4 Gy
10 5
Relative error (%)Stan
dard
ized
Est
imat
e
Precision (1/Std.Error)0 5 10 15 20
-202
80
120
160
200
56.71020Relative error (%)
Single grainsN = 307
Stan
dard
ized
Est
imat
e
a
b
c
Fig. 10. Radial plots of De distributions for single aliquots of (a) 5-mm and
(b) 2-mm mask size, and (c) for single grains for ZB8.
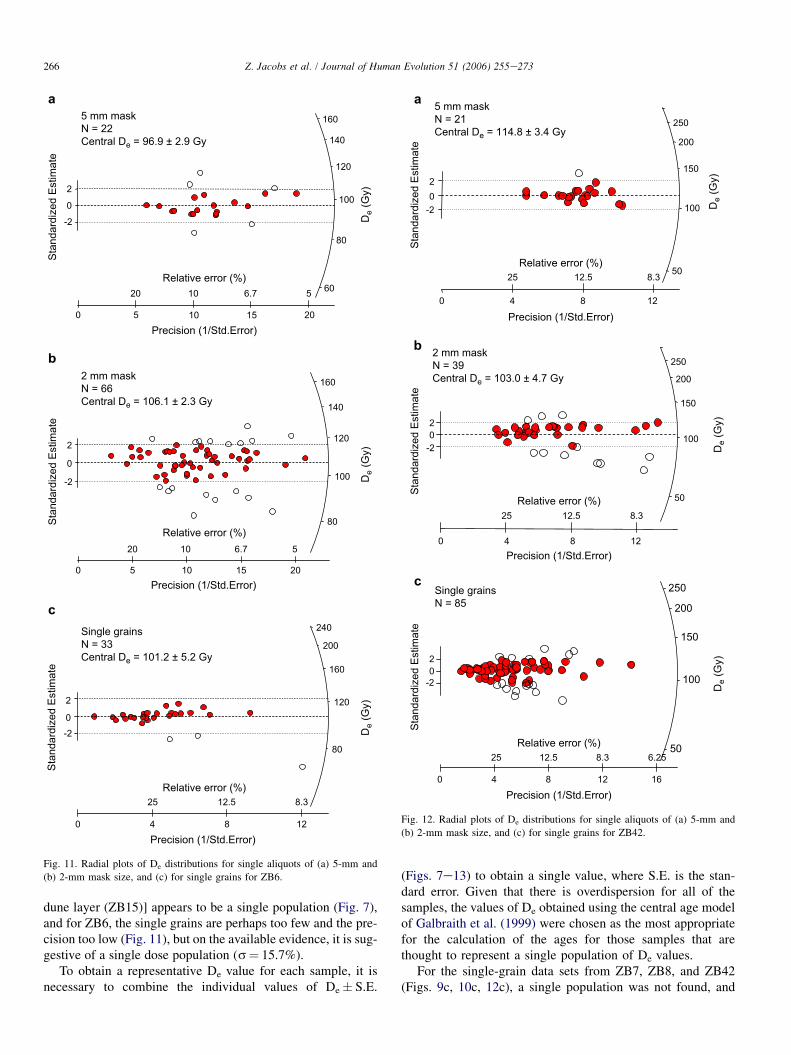
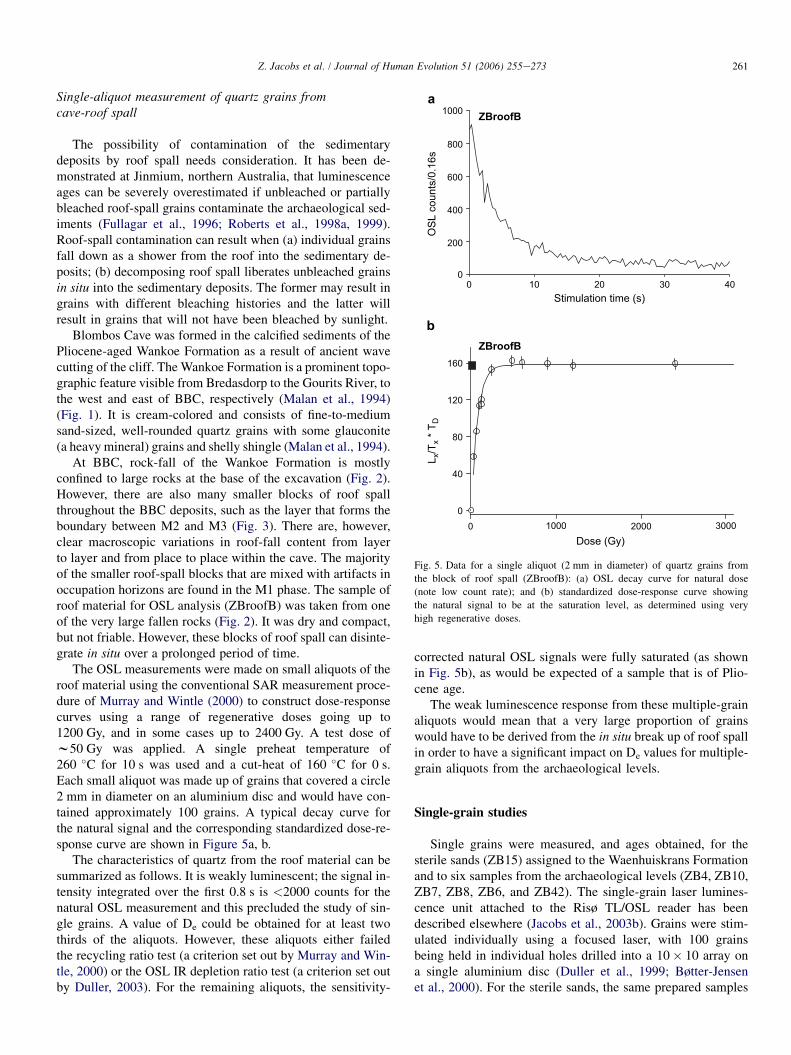
266 Z. Jacobs et al. / Journal of Human Evolution 51 (2006) 255e273
dune layer (ZB15)] appears to be a single population (Fig. 7),and for ZB6, the single grains are perhaps too few and the pre-cision too low (Fig. 11), but on the available evidence, it is sug-gestive of a single dose population (s¼ 15.7%).
To obtain a representative De value for each sample, it isnecessary to combine the individual values of De� S.E.
Precision (1/Std.Error)0 5 10 15 20
-2
0
2
Stan
dard
ized
Est
imat
e
De
(Gy)
De
(Gy)
De
(Gy)
60
80
100
120
140
1605 mm maskN = 22Central De = 96.9 ± 2.9 Gy
20 10 6.7 5Relative error (%)
Precision (1/Std.Error)0 5 10 15 20
-2
0
2
80
100
120
140
1602 mm maskN = 66Central De = 106.1 ± 2.3 Gy
20 10 6.7 5
Relative error (%)
Stan
dard
ized
Est
imat
e
Precision (1/Std.Error)0 4 8 12
-20
2
80
120
160
200
240
25 12.5 8.3Relative error (%)
Single grainsN = 33Central De = 101.2 ± 5.2 Gy
Stan
dard
ized
Est
imat
e
a
b
c
Fig. 11. Radial plots of De distributions for single aliquots of (a) 5-mm and
(b) 2-mm mask size, and (c) for single grains for ZB6.
(Figs. 7e13) to obtain a single value, where S.E. is the stan-dard error. Given that there is overdispersion for all of thesamples, the values of De obtained using the central age modelof Galbraith et al. (1999) were chosen as the most appropriatefor the calculation of the ages for those samples that arethought to represent a single population of De values.For the single-grain data sets from ZB7, ZB8, and ZB42(Figs. 9c, 10c, 12c), a single population was not found, and
Precision (1/Std.Error)0 4 8 12
-202
Stan
dard
ized
Est
imat
e
De
(Gy)
De
(Gy)
De
(Gy)
50
100
150
200
250
25 12.5 8.3
5 mm maskN = 21Central De = 114.8 ± 3.4 Gy
Relative error (%)
Precision (1/Std.Error)0 4 8 12
-202
Stan
dard
ized
Est
imat
e
50
100
150
200
250
25 12.5 8.3Relative error (%)
2 mm maskN = 39Central De = 103.0 ± 4.7 Gy
Precision (1/Std.Error)0 4 8 12 16
-202
Stan
dard
ized
Est
imat
e
50
100
150
200
250
25 12.5 8.3 6.25
Single grainsN = 85
Relative error (%)
a
b
c
Fig. 12. Radial plots of De distributions for single aliquots of (a) 5-mm and
(b) 2-mm mask size, and (c) for single grains for ZB42.
267Z. Jacobs et al. / Journal of Human Evolution 51 (2006) 255e273
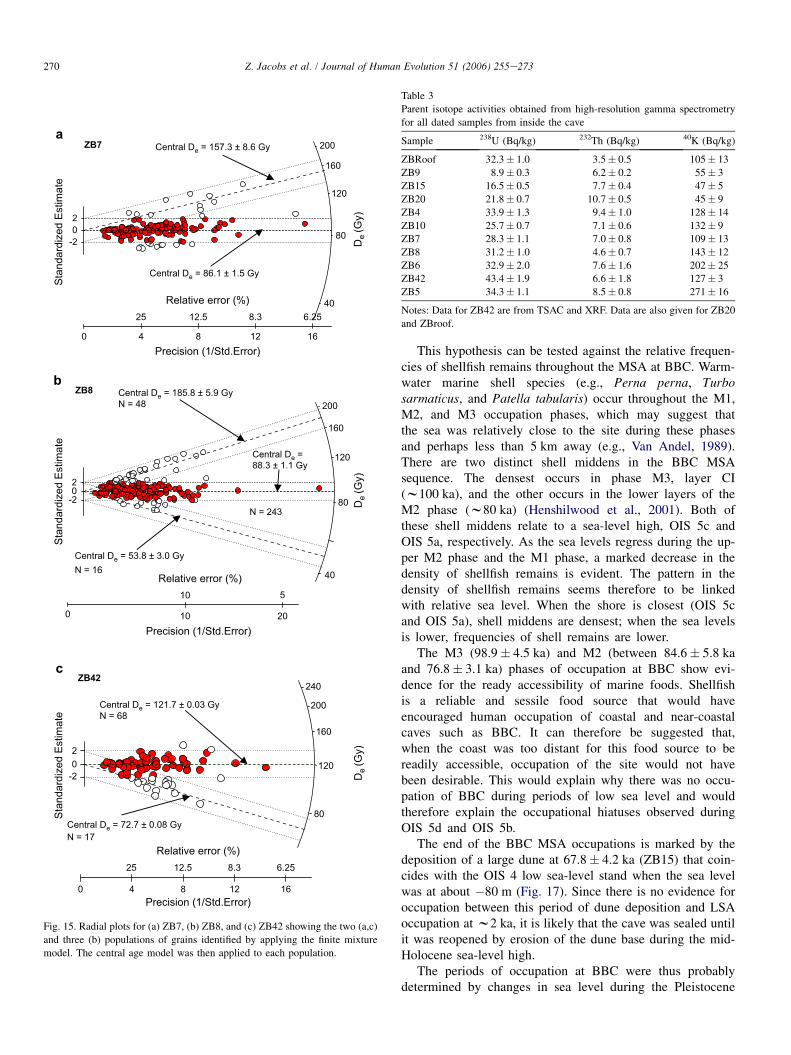
in these cases, the component with the largest proportion ofgrains as obtained using the finite mixture model of Robertset al. (2000) was used to estimate the age; these De valuesare presented in Table 2. Fitting two components to the datafor the ZB7 samples is sufficient to describe the data whena standard deviation of s¼ 0.12 is applied, with 6% of thepopulation giving a central De of 157� 9 Gy and 94% giving86.1� 1.5 Gy (Fig. 15a). Three components were required forZB8, 79% giving 88.3� 1.1 Gy, 16% giving 186� 6 Gy, and5% giving 53.8� 3.0 Gy (Fig. 15b). Two components wererequired for ZB42, 80.2% giving 121.7� 4.0 Gy and 19.8%giving 72.7� 5.5 Gy (Fig. 15c). Ages were calculated usingthe De value obtained from that component of grains that ismost representative of the bulk of the deposit; using thedose-rate data provided in Table 2, these values give strati-graphically coherent ages.
Environmental dose rate
For ZB15, the internal alpha-dose rate of the etched andheavy-liquid-separated quartz was obtained directly by alphacounting a finely milled subsample. Using an alpha-efficiencyvalue of 0.04 (Rees-Jones, 1995), an internal alpha-dose rate
Precision (1/Std.Error)0 4 8 12
-2
0
2
De
(Gy)
De
(Gy)
200
300
400
5005 mm maskN = 23Central De = 244.4 ± 9.3 Gy
Stan
dard
ized
Est
imat
e
25 12.5 8.3Relative error (%)
Precision (1/Std.Error)0 4 8 12
-2
0
2
200
300
400
5002 mm maskN = 83Central De = 229.7 ± 5.6 Gy
25 12.5 8.3Relative error (%)
Stan
dard
ized
Est
imat
e
b
a
Fig. 13. Radial plots of De distributions for single aliquots of (a) 5-mm and
(b) 2-mm mask size for ZB5.
of 0.029 Gy/ka was calculated. This value of 0.029 Gy/kawas used for all of the samples (Jacobs, 2004). The externalbeta-dose rate was determined for each sample by finely grind-ing the sample, casting it in resin, and measuring it in a RisøGM-25-5 beta counter (Bøtter-Jensen and Mejdahl, 1988;Jacobs, 2004). The external gamma-dose rate was measuredusing in situ gamma spectrometry measurements for the steriledune sands in the cave, ZB9 and ZB15. The estimated gamma-dose rates from in situ dose-rate measurements using Al2O3:Cdosimeters were used for the samples taken from the MSAoccupation layers and the lower sand unit (Burbidge andDuller, 2003; Jacobs, 2004). The external beta- and gamma-dose rates for ZB42 were obtained through measurement ofU and Th using thick-source alpha counting (TSAC) and Kusing X-ray fluorescence (XRF).
The cosmic-ray-dose rate for the samples inside the cavewas estimated from the depth of the overburden, includingthe thickness of the cave roof (Prescott and Hutton, 1994).The moisture content of the samples over long time periods re-quires some speculation. The cave sediments are believed tohave never been fully saturated, and the moisture content islikely to have remained constant for most of the last 70 ka,as the cave was sealed by the sand dune that formed againstthe cliff. The present moisture contents were therefore usedfor all the samples. The internal alpha-dose rate, externalbeta- and gamma-dose rates, cosmic-ray-dose rate, as wellas the total dose rate, grain size, and moisture contents are pre-sented in Table 2.
Disequilibrium measurements
Since BBC formed in a carbonate-rich rock, it is possiblethat water migrated through it and through the sediments thatfilled the cave, carrying with it some dissolved uranium. It isthus possible that the 238U decay chain may not be in equilib-rium. In order to investigate this possibility, high-resolutiongamma spectrometry was carried out using ca. 20 g of samplethat had been cast in resin to form discs (Jacobs, 2004). Activ-ities of 40K and the 238U and 232Th decay series nuclides (238U,226Ra, 210Pb, and 232Th, 228Ra, and 228Th) were measured overa 24-hour period using the approach taken by Murray andAitken (1988). The values for 238U, 232Th, and 40K are givenin Table 3. The activity ratios (228Ra/232Th, 228Th/228Ra, and226Ra/238U) are given in Fig. 16, with data for the nonarchaeo-logical levels being shown above the dotted line, and for thearchaeological deposits (except ZB42), below the line.
For the 232Th decay chain, the 228Ra/232Th and 228Th/228Raactivity ratios (Fig. 16a,b) indicate that, for all of the samples,the activities of 232Th and its daughters 228Ra and 228Th arewithin analytical uncertainty (�2s) of equilibrium; the mean228Ra/232Th ratio is 0.95� 0.17 and the mean 228Th/228Raratio is 1.11� 0.29. An assessment of the disequilibrium inthe 238U decay chain can be obtained from the 226Ra/238Uactivity ratio (Fig. 16c). The roof material (ZBroofB) is inequilibrium, though the Th/U ppm ratio obtained fromTSAC was low (0.21) in comparison with the typical crustalratio of w3.4 (Aitken, 1985) because of the paucity of Th
268 Z. Jacobs et al. / Journal of Human Evolution 51 (2006) 255e273
Table 1
Information on number of subsamples measured (a) using 5-mm-diameter aliquots, (b) using 2-mm-diameter aliquots, and (c) using single grains. The number of
rejected De values given and the value of the De calculated by applying the central age model to the full data set, together with the value of overdispersion
Sample ZB15 ZB4 ZB10 ZB7 ZB8 ZB6 ZB42 ZB5
(a) 5-mm aliquots
Total number of aliquots measured 48 23 24 24 24 24 24 24
Aliquots were then rejected for the following reasons:
Preheat 18 0 0 0 0 0 0 0
Poor recycling ratio 0 1 3 0 2 2 0 1
No LN/TN intersection 0 0 1 1 0 0 3 0
Depletion by IR 1 0 0 0 0 0 0 0
Sum of rejected aliquots 19 1 4 1 2 2 3 1
Acceptable individual De values 29 22 20 23 22 22 21 23
Central De (Gy) 50.3� 1.7 83.0� 1.8 84.9� 2.9 78.7� 2.1 83.9� 2.1 96.9� 2.9 114.8� 3.4 244.4� 9.3
Overdispersion (%) 16.4 7.4 12.1 11.0 9.6 10.8 4.1 12.8
(b) 2-mm aliquots
Total number of aliquots measured 96 72 96 72 96 48 102
Aliquots were then rejected for the following reasons:
Poor recycling ratio 4 22 18 7 10 4 17
No LN/TN intersection 5 5 6 0 16 5 0
Depletion by IR 3 0 0 0 4 0 2
Sum of rejected aliquots 12 27 24 7 30 9 19
Acceptable individual De values 82 45 72 65 66 39 83
Central De (Gy) 79.3� 1.0 83.3� 2.1 83.1� 1.5 85.6� 1.4 106.1� 2.3 103.0� 4.7 229.7� 5.6
Overdispersion (%) 6.3 19.6 12.0 10.9 14.7 23.7 15.5
(c) Single grains
Total number of grains measured 1892 2200 2200 1200 2400 2000 1700
Grains for which a dose response curve could be calculated 64 287 524 398 1321 313 163
Grains were then rejected for the following reasons:
TN signal< 3�BG 0 14 59 29 135 25 41
0 dose> 5% of LN 0 89 141 65 256 74 23
Poor recycling ratio 9 190 381 246 835 261 37
No LN/TN intersection 12 10 37 7 103 43 11
Depletion by IR 9 4 4 3 7 0 6
‘‘Modern’’ grains 0 0 0 0 0 0 0
Sum of rejected grains 30 190 427 246 1014 280 78
Acceptable individual De values 34 97 94 152 307 33 85
Central De (Gy) 49.2� 2.1 79.5� 1.5 80.4� 2.1 87.0� 2.2 93.2� 2.0 101.2� 5.2 108.7� 3.5
Overdispersion (%) 13.5 13.5 17.3 21.1 28.6 15.7 21.0
in the carbonate sands. For the three sterile sands and the sam-ples from the MSA occupation layers (except for the upper-most sample ZB4), the values are consistent with unity(within the 2s analytical uncertainty). These ratios indicate226Ra deficits ranging between 18% and 40%, with no trendwith depth down the section. These values can be comparedwith the relative 226Ra excess of between 140% and 300%found by Olley et al. (1997) for sediments from Allen’sCave in Australia. They calculated a 2% effect on their agewhen they modeled the dose-rate change over a time periodof 75,000 years, using the present-day individual radionuclideconcentrations. They were able to make these calculationssince they had additional information on 234U and 230Th;precise measurements of these isotopes were not possible bygamma spectrometry in this study because of interferencefrom another gamma emitter at the peak used to assess 234Uand because of the low count rate for 230Th. However, theeffect is likely to be small (a few percent at most), based onthe results presented in Fig. 16, even though the uraniumdecay chain contributes about 50% of the total dose rate.
Age calculations
To obtain an age for each sample, the De value should bedivided by the dose rate. The dose rate and De informationis presented in Table 2. Dose rates were calculated using theconversion factors of Adamiec and Aitken (1998), with correc-tions for grain size, HF etching, and moisture content (Aitken,1985). The external alpha-particle contribution is consideredto be negligible since the outer skin (ca. 9 mm) of the grainswas removed by the HF etch (Jacobs, 2004).
The final ages for all samples and for the different aliquotsizes and single grains are presented in Table 2. It is believedthat the most reliable age estimates are those obtained fromthe single-grain data sets. The use of single grains enablesDe values that are inappropriate to be rejected. This wasespecially true for ZB7, ZB8, and ZB42, where therewere clearly two or three different dose populations; forthese samples the age is based on the population with thelargest proportion of grains, as obtained by the finite mixturemodel.
269Z. Jacobs et al. / Journal of Human Evolution 51 (2006) 255e273
This resulted in age estimates for sediments inside BBC of67.8� 4.2 ka (ZB15) for the sterile dune sand that separatesthe MSA from the LSA, 72.7� 3.1 ka for the sediment that isrepresentative of the M1 phase (ZB4), and 76.8� 3.1 ka(ZB10), 82.2� 3.6 ka (ZB7), 81.1� 4.2 ka (ZB8), and84.6� 5.8 ka (ZB6) for those samples from the M2 phase.Sample ZB42 from the M3 phase has an age of 98.9� 4.5 ka.For the basal sand, an age of 143.2� 5.5 ka (ZB5) was obtained
Stimulation time (s)0 10 20 30 40
OSL
cou
nts/
0.16
s
0
10000
20000
30000
40000
50000
60000
70000ZB8
Dose (Gy) 0 50 100 150 200
0
20
40
L x/T
x * T
D
ZB8
De = 97.2 ± 5.3 Gy
Fig. 14. Data for a single aliquot (5 mm in diameter) of quartz grains from
ZB8: (a) OSL decay curve for natural dose (note high count rate) and (b) stan-
dardized dose-response curve.
using 2-mm-diameter single aliquots. These ages are shown inFig. 17.
Interpretation of optical dating chronology
The age of 143.2� 5.5 ka (ZB5) shows that the lowermostdune sand formed during oxygen isotope stage (OIS) 6, whenthe sea level was at about �120 m (Fig. 17). The continentalshelf around the BBC coast is shallow, as indicated by the ba-thymetry in Figure 1, and thus the coastline would have beenat least 100 km from Blombos during this time. It is thereforeunclear whether the source of sediment for the dune was di-rectly associated with marine activity or not. However, it is in-teresting to note that the other major phase of dune activity,which blocked access to the cave and marked the end of theMSA occupation of Blombos, occurred at 67.8� 4.2 ka(ZB15), another period of low sea level (OIS 4). The dunesand sampled by ZB5 may also have sealed off BBC untilsubsequent higher sea level eroded the base of the dune, re-sulting in its reopening, probably during the last interglacial(OIS 5e; Fig. 17), when sea levels were similar to the presentor slightly higher.
The cave was then occupied, as evidenced by the M3 occu-pation phase, and, based on the 98.9� 4.5 ka age of ZB42, ata time close to the sea-level high of OIS 5c. Following thisperiod of occupation (M3), some parts of the roof of thecave were detached (Fig. 3), representing a break in occupa-tion (between M3 and M2). Accumulation of archaeologicalsediments resumed at approximately 85 ka, which, again,coincides with a high sea level, this time OIS 5a (Fig. 17), cor-responding to the second period of occupation (M2 phase).Occupation seems then to have been relatively continuous,though with varying density of occupational remains, untilabout 70 ka (M1 phase). At that time, accumulation ceasedduring a period of regression in sea levels, from OIS 5a toOIS 4 (Fig. 17). It therefore seems that periods of occupationat BBC were probably determined by changes in sea levelduring the Pleistocene.
Table 2
Dose rates, De values, and derived OSL ages. De values are derived from single grains for all samples, except ZB9 (5 mm) and ZB5 (2 mm). For single-grain De
values, the central age model data from Table 1c were used, apart from the values for ZB7, ZB8, and ZB42, for which the finite mixture model data were used, as
discussed in the text
Sample ZB9 ZB15 ZB4 ZB10 ZB7 ZB8 ZB6 ZB42 ZB5
Grain size (mm) 180e212 212e250 180e212 180e212 180e212 180e212 180e212 180e212 180e212
Water content (%) 4� 2 10� 5 11� 5 6� 3 11� 5 17� 8 8� 4 11� 5 5� 2
Internal dose rate (Gy/ka)
Alpha-dose rate 0.03� 0.01 0.03� 0.01 0.03� 0.01 0.03� 0.01 0.03� 0.01 0.03� 0.01 0.03� 0.01 0.03� 0.01 0.03� 0.01
External dose rate (Gy/ka)
Beta-dose rate 0.36� 0.2 0.34� 0.02 0.56� 0.03 0.58� 0.02 0.54� 0.03 0.58� 0.05 0.79� 0.04 0.67� 0.04 0.99� 0.03
Gamma-dose rate 0.23� 0.01 0.31� 0.02 0.46� 0.03 0.39� 0.02 0.43� 0.03 0.43� 0.02 0.33� 0.04 0.50� 0.04 0.54� 0.03
Cosmic-ray-dose rate 0.05� 0.03 0.05� 0.01 0.04� 0.01 0.04� 0.01 0.04� 0.01 0.04� 0.01 0.04� 0.01 0.04� 0.01 0.04� 0.01
Total dose rate (Gy/ka)
0.68� 0.03 0.73� 0.03 1.09� 0.04 1.05� 0.03 1.05� 0.04 1.09� 0.05 1.20� 0.05 1.23� 0.06 1.6� 0.05
De values and OSL ages
De (Gy) 0.07� 0.01 49.2� 2.1 79.5� 1.5 80.4� 2.1 86.1� 1.5 88.3� 1.1 101.2� 5.2 121.7� 4.0 229.7� 5.6
Age (ka) 0.10� 0.01 67.8� 4.2 72.7� 3.1 76.8� 3.1 82.2� 3.6 81.1� 4.2 84.6� 5.8 98.9� 4.5 143.2� 5.5
270 Z. Jacobs et al. / Journal of Human Evolution 51 (2006) 255e273
Precision (1/Std.Error)0 4 8
Relative error (%)
12 16
-202
Stan
dard
ized
Est
imat
e
40
80
120
160
200
Central De = 86.1 ± 1.5 Gy
Central De = 157.3 ± 8.6 GyZB7
-202
De
(Gy)
De
(Gy)
De
(Gy)
40
80
120
160
200
Stan
dard
ized
Est
imat
e
10
Precision (1/Std.Error) 0 10 20
5
Relative error (%)
Central De = 185.8 ± 5.9 GyN = 48
Central De = 53.8 ± 3.0 Gy N = 16
Central De =88.3 ± 1.1 Gy
N = 243
ZB8
b
-202
Stan
dard
ized
Est
imat
e
80
120
160
200
240
Precision (1/Std.Error) 0 4 8 12 16
25 12.5 8.3 6.25
Relative error (%)
Central De = 121.7 ± 0.03 GyN = 68
Central De = 72.7 ± 0.08 GyN = 17
ZB42
25 12.5 8.3 6.25
a
c
Fig. 15. Radial plots for (a) ZB7, (b) ZB8, and (c) ZB42 showing the two (a,c)
and three (b) populations of grains identified by applying the finite mixture
model. The central age model was then applied to each population.
This hypothesis can be tested against the relative frequen-cies of shellfish remains throughout the MSA at BBC. Warm-water marine shell species (e.g., Perna perna, Turbosarmaticus, and Patella tabularis) occur throughout the M1,M2, and M3 occupation phases, which may suggest thatthe sea was relatively close to the site during these phasesand perhaps less than 5 km away (e.g., Van Andel, 1989).There are two distinct shell middens in the BBC MSAsequence. The densest occurs in phase M3, layer CI(w100 ka), and the other occurs in the lower layers of theM2 phase (w80 ka) (Henshilwood et al., 2001). Both ofthese shell middens relate to a sea-level high, OIS 5c andOIS 5a, respectively. As the sea levels regress during the up-per M2 phase and the M1 phase, a marked decrease in thedensity of shellfish remains is evident. The pattern in thedensity of shellfish remains seems therefore to be linkedwith relative sea level. When the shore is closest (OIS 5cand OIS 5a), shell middens are densest; when the sea levelsis lower, frequencies of shell remains are lower.
The M3 (98.9� 4.5 ka) and M2 (between 84.6� 5.8 kaand 76.8� 3.1 ka) phases of occupation at BBC show evi-dence for the ready accessibility of marine foods. Shellfishis a reliable and sessile food source that would haveencouraged human occupation of coastal and near-coastalcaves such as BBC. It can therefore be suggested that,when the coast was too distant for this food source to bereadily accessible, occupation of the site would not havebeen desirable. This would explain why there was no occu-pation of BBC during periods of low sea level and wouldtherefore explain the occupational hiatuses observed duringOIS 5d and OIS 5b.
The end of the BBC MSA occupations is marked by thedeposition of a large dune at 67.8� 4.2 ka (ZB15) that coin-cides with the OIS 4 low sea-level stand when the sea levelwas at about �80 m (Fig. 17). Since there is no evidence foroccupation between this period of dune deposition and LSAoccupation at w2 ka, it is likely that the cave was sealed untilit was reopened by erosion of the dune base during the mid-Holocene sea-level high.
The periods of occupation at BBC were thus probablydetermined by changes in sea level during the Pleistocene
Table 3
Parent isotope activities obtained from high-resolution gamma spectrometry
for all dated samples from inside the cave
Sample 238U (Bq/kg) 232Th (Bq/kg) 40K (Bq/kg)
ZBRoof 32.3� 1.0 3.5� 0.5 105� 13
ZB9 8.9� 0.3 6.2� 0.2 55� 3
ZB15 16.5� 0.5 7.7� 0.4 47� 5
ZB20 21.8� 0.7 10.7� 0.5 45� 9
ZB4 33.9� 1.3 9.4� 1.0 128� 14
ZB10 25.7� 0.7 7.1� 0.6 132� 9
ZB7 28.3� 1.1 7.0� 0.8 109� 13
ZB8 31.2� 1.0 4.6� 0.7 143� 12
ZB6 32.9� 2.0 7.6� 1.6 202� 25
ZB42 43.4� 1.9 6.6� 1.8 127� 3
ZB5 34.3� 1.1 8.5� 0.8 271� 16
Notes: Data for ZB42 are from TSAC and XRF. Data are also given for ZB20
and ZBroof.

271Z. Jacobs et al. / Journal of Human Evolution 51 (2006) 255e273
0.0 0.5 1.0 1.5 2.0 2.5
228Ra/232Th 228Th/228Ra0.0 0.5 1.0 1.5 2.0 2.5
226Ra/238U
ZBroofB
ZB9
ZB15
ZB20
ZB4
ZB10
ZB7
ZB8
ZB6
ZB5
a b c
0.0 0.5 1.0 1.5 2.0 2.5
Fig. 16. Daughter/parent radionuclide-activity ratios for geological samples (above dotted line) and MSA samples (below dotted line). Data for ZB42 are not
shown, as this sample was not measured using high-resolution gamma spectrometry.
and Holocene that would also have controlled the accumula-tion of dunes against the entrance to the cave.
Discussion
The BBC occupation sequence during the MSA does notconform to that at Klasies River and Border Cave. The StillBay industry, characteristic of the M1 phase at BBC, is absentat both of the other sites, yet, it is the main phase containingevidence for innovative behaviors such as bifacially workedfoliate points, bone tools, engraved ochre, and shell beads.The OSL age of 72.7� 3.1 ka (ZB4) for the M1 phase is con-firmed by other dating techniques. Five thermoluminescence(TL) ages were obtained on burnt stones from the M1 phase,
and these gave a mean age of 74� 5 ka (Henshilwood et al.,2002a; Tribolo et al., 2006). In addition, seven ESR ageswere obtained on teeth (Jones, 2001) derived from the M1phase; assuming a linear uptake of uranium, Jones (2001) cal-culated a mean age of 80� 6 ka; assuming an early uptake ofuranium, a mean age of 62� 6 ka was calculated. The OSLage of 72.7� 3.1 ka for the Still Bay levels is important be-cause it provides an age for the occurrence of the Still Bayin the culture-stratigraphy of the MSA in South Africa, anddemonstrates that the Still Bay precedes the Howiesons Poort.
Another important issue addressed by OSL dating at BBCis the antiquity of the two engraved ochres (Henshilwoodet al., 2002a) and 39 shell beads recovered from the M1 phase(Henshilwood et al., 2004; d’Errico et al., 2005). Both types of
Fig. 17. Sea level curve (after Pillans et al., 1998) showing oxygen isotope stages and stage 5 substages, with OSL ages and schematic section. The OSL ages were
calculated using single-grain results for all samples except ZB9 (5-mm aliquots) and ZB5 (2-mm aliquots).

272 Z. Jacobs et al. / Journal of Human Evolution 51 (2006) 255e273
artifact are cited as evidence for an early occurrence of mod-ern human behavior in the MSA in South Africa. These arti-facts were made before 70 ka.
Although some bone tools have been found in the M1phase, most of the bone tools are in the upper part of theM2 phase (Henshilwood et al., 2002b). The four ages for theM2 phase confirm that bone tools occur at BBC from at least84.6� 5.8 ka (ZB6) to 76.8� 3.1 ka (from ZB10).
The single age of 98.9� 4.5 ka (ZB42) provides an age forthe M3-phase human teeth, which are considered robust, fall-ing just inside the limits for anatomical modernity. Futurefinds of human material in the dated levels at BBC may wellcontribute to the debate not only on the behavioral originsof modern humans, but also their anatomical beginnings.The age of 143.2� 5.5 ka for the underlying sand (ZB5) pro-vides a younger limiting age for the underlying a undatedMSA deposits that are yet to be fully excavated.
Conclusions
By using grains for which the OSL signals have been indi-vidually bleached and given two different laboratory doses, wehave demonstrated that it is possible to detect mixing of grainswith different values of De and to accurately evaluate the dosesgiven. Our results support our previous claims (Jacobs et al.,2003b) that mixing would be seen in single-grain measure-ments and that no mixing can be seen for sand ZB15, which sep-arates the LSA and MSA levels. This further strengthens ourclaim of stratigraphic integrity for BBC (Jacobs et al., 2003b).
Ages in stratigraphic order have been obtained for samplesfrom the three MSA phases. They provide a more detailedchronology for the artifacts from BBC M1 than was previouslypublished. In addition, the new ages demonstrate that BBCphases M1, M2, and M3 cover the period from 99 ka to73 ka, with an occupation hiatus between w98 ka and 85 ka.These events are bracketed by ages of 140 ka and 70 ka forthe sterile sands, enabling us to determine the times whenthe cave mouth was closed by a large dune, thus preventinghuman habitation.
Acknowledgements
ZJ thanks the Sir Henry Strakosch Memorial Trust forfinancial support during the tenure of a Ph.D. studentship atthe University of Wales, Aberystwyth. She also thanks Dr. An-drew Murray of the Risø National Laboratory, Denmark, forproviding access to additional single-grain readers and labora-tory gamma spectrometry, and Professor Rex Galbraith ofUniversity College, London, for providing software and advicein regard to the use of models for De calculations. The authorsthank the two referees for their helpful comments, which haveimproved the manuscript. GATD acknowledges support fromNERC grant NER/T/S/2002/00677. CSH acknowledges finan-cial support from the Centre for Development Studies, Univer-sity of Bergen, the European Science Foundation, and PAST.
References
Adamiec, G., Aitken, M.J., 1998. Dose-rate conversion factors: update. Anc.
TL 16, 37e49.
Aitken, M.J., 1985. Thermoluminescence Dating. Academic Press, London.
Bøtter-Jensen, L., Bulur, E., Duller, G.A.T., Murray, A.S., 2000. Advances in
luminescence instrument systems. Radiat. Meas. 32, 523e528.
Bøtter-Jensen, L., Mejdahl, V., 1988. Assessment of beta dose-rate using a GM
multicounter system. Nucl. Tracks Radiat. Meas. 14, 187e191.
Burbidge, C.I., Duller, G.A.T., 2003. Combined gamma and beta dosimetry,
using Al2O3:C, for in situ measurements on a sequence of archaeological
deposits. Radiat. Meas. 37, 285e291.
d’Errico, F., Henshilwood, C.S., Nilssen, P., 2001. An engraved bone fragment
from ca. 70 ka year old Middle Stone Age levels at Blombos Cave, South
Africa: implications for the origin of symbolism and language. Antiquity
75, 309e318.
d’Errico, F., Henshilwood, C.S., Vanhaeren, M., Van Niekerk, K., 2005. Nas-
sarius kraussianus shell beads from Blombos Cave: evidence for symbolic
behaviour in the Middle Stone Age. J. Hum. Evol. 48, 3e24.
Duller, G.A.T., 2003. Distinguishing quartz and feldspar in single grain lumi-
nescence measurements. Radiat. Meas. 37, 161e165.
Duller, G.A.T., 2004. Luminescence dating of Quaternary sediments: recent
advances. J. Quat. Sci. 19, 183e192.
Duller, G.A.T., Bøtter-Jensen, L., Murray, A.S., Truscott, A.J., 1999. Single
grain laser luminescence (SGLL) measurements using a novel automated
reader. Nucl. Instrum. Methods Phys. Res. Sect. B 155, 506e514.
Fullagar, R.L.K., Price, D.M., Head, L.M., 1996. Early human occupation of
northern Australia: archaeology and thermoluminescence dating of Jin-
mium rock-shelter, Northern Territory. Antiquity 70, 751e773.
Galbraith, R.F., Roberts, R.G., Yoshida, H., 2005. Error variation in OSL pa-
laeodose estimates from single aliquots of quartz: a factorial experiment.
Radiat. Meas. 39, 289e307.
Galbraith, R.F., Roberts, R.G., Laslett, G.M., Yoshida, H., Olley, J.M., 1999.
Optical dating of single and multiple grains of quartz from Jinmium
rock shelter, northern Australia: part I, experimental design and statistical
models. Archaeometry 41, 339e364.
Goodwin, A.J.H., Van Riet Lowe, C., 1929. The Stone Age culture of South
Africa. Ann. S. Afr. Mus. 27, 1e289.
Grine, F.E., Henshilwood, C.S., 2002. Additional human remains from
Blombos Cave, South Africa: (1999e2000 excavations). J. Hum. Evol.
42, 293e302.
Grine, F.E., Henshilwood, C.S., Sealy, J.C., 2000. Human remains from
Blombos Cave, South Africa: (1997e1998 excavations). J. Hum. Evol. 38,
755e765.
Heimsath, A.M., Chappell, J., Spooner, N.A., Questiaux, D.G., 2002. Creeping
soil. Geology 30, 111e114.
Henshilwood, C.S., 1995. Holocene archaeology of the coastal Garcia State
Forest, southern Cape, South Africa. Unpublished Ph.D. thesis, University
of Cambridge.
Henshilwood, C.S., 1996. A revised chronology for the arrival of pastoralism
in southernmost Africa: new evidence of sheep at ca. 2000 B.P. from BBC,
South Africa. Antiquity 70, 945e949.
Henshilwood, C.S., d’Errico, F., Yates, R., Jacobs, Z., Tribolo, C.,
Duller, G.A.T., Mercier, N., Sealy, J.C., Valladas, H., Watts, I.,
Wintle, A.G., 2002a. Emergence of modern human behaviour: Middle
Stone Age engravings from South Africa. Science 295, 1278e1280.
Henshilwood, C.S., d’Errico, F., Marean, C.W., Milo, R.G., Yates, R., 2002b.
An early bone tool industry from the Middle Stone Age at Blombos Cave,
South Africa: implications for the origins of modern human behaviour,
symbolism and language. J. Hum. Evol. 41, 631e678.
Henshilwood, C.S., d’Errico, F., Vanhaeren, M., Van Niekerk, K., Jacobs, Z.,
2004. Middle Stone Age shell beads from South Africa. Science 304, 404.
Henshilwood, C.S., Sealy, J.C., Yates, R., Cruz-Uribe, K., Goldberg, P.,
Grine, F.E., Klein, R.G., Poggenpoel, C., Van Niekerk, K., Watts, I.,
2001. Blombos Cave, southern Cape, South Africa: preliminary report on
the 1992e1999 excavations of the Middle Stone Age levels. J. Archaeol.
Sci. 28, 421e448.
273Z. Jacobs et al. / Journal of Human Evolution 51 (2006) 255e273
Henshilwood, C.S., Marean, C.W., 2003. The origin of modern human
behaviourdcritique of the models and their test implications. Curr.
Anthropol. 44, 627e651.
Henshilwood, C.S., Sealy, J., 1997. Bone artefacts from the Middle Stone Age
at Blombos Cave, southern Cape, South Africa. Curr. Anthropol. 38, 890e895.
Jacobs, Z., 2004. Development of luminescence techniques for dating Middle
Stone Age sites in South Africa. Unpublished Ph.D. thesis, University of
Wales, Aberystwyth.
Jacobs, Z., Wintle, A.G., Duller, G.A.T., 2003a. Optical dating of dune sand
from Blombos Cave, South Africa: Idmultiple grain data. J. Hum. Evol.
44, 599e612.
Jacobs, Z., Duller, G.A.T., Wintle, A.G., 2003b. Optical dating of dune sand
from Blombos Cave, South Africa: IIdsingle grain data. J. Hum. Evol.
44, 613e625.
Jacobs, Z., Duller, G.A.T., Wintle, A.G., 2006a. Interpretation of single grain
De distributions and calculation of De. Radiat. Meas. 41, 264e277.
Jacobs, Z., Wintle, A.G., Duller, G.A.T., 2006b. Evaluation of SAR procedures
for De determination using single aliquots of quartz from two archaeolog-
ical sites in South Africa. Radiat. Meas.
Jones, H.L., 2001. Electron spin resonance (ESR) dating of tooth enamel at
three Palaeolithic archaeological sites. Unpublished M.Sc. thesis, McMas-
ter University, Canada.
Klein, R.G., 2000. Archaeology and the evolution of human behavior. Evol.
Anthropol. 9, 17e36.
Malan, J.A., Viljoen, J.H.A., Siegfried, H.P., Wickens, H. de V., 1994. Die geo-
logie van die gebied Riversdale. Council for Geoscience, Pretoria.
Marean, C.W., Goldberg, P., Avery, G., Grine, F.E., Klein, R.G., 2000. Middle
Stone Age stratigraphy and excavations at Die Kelders Cave 1 (Western
Cape Province, South Africa): the 1992, 1993 and 1994 field seasons.
J. Hum. Evol. 38, 7e42.
Marean, C.W., Nilssen, P.J., Brown, K., Jerardino, A., Stynder, D., 2004. Pa-
leoanthropological investigations of Middle Stone Age sites at Pinnacle
Point, Mossel Bay (South Africa): archaeology and hominid remains
from the 2000 field season. Paleoanthropology 2, 14e83.
Murray, A.S., Aitken, M.J., 1988. Analysis of low-level naturally occurring ra-
dioactivity in small samples for use in thermoluminescence dating using
high-resolution gamma spectrometry. Int. J. Appl. Radiat. Isot. 39, 145e158.
Murray, A.S., Funder, S., 2003. Optically stimulated luminescence dating of
a Danish Eemian coastal marine deposit: a test of accuracy. Quat. Sci.
Rev. 22, 1177e1183.
Murray, A.S., Olley, J.M., 2002. Precision and accuracy in the optically stim-
ulated luminescence dating of sedimentary quartz: a status review. Geo-
chronometria 21, 1e16.
Murray, A.S., Wintle, A.G., 2000. Luminescence dating of quartz using an im-
proved single-aliquot regenerative-dose protocol. Radiat. Meas. 32, 57e73.
Murray, A.S., Wintle, A.G., 2003. The single-aliquot regenerative-dose
protocol: potential for improvements in reliability. Radiat. Meas. 37,
377e381.
Olley, J., Caitcheon, G., Murray, A.S., 1998. The distribution of apparent dose
as determined by optically stimulated luminescence in small aliquots of
fluvial quartz: implications for dating young sediments. Quaternary Geo-
chronology (QSR) 17, 1033e1040.
Olley, J.M., Caitcheon, G.G., Roberts, R.G., 1999. The origin of dose distribu-
tions in fluvial sediments, and the prospect of dating single grains from
fluvial deposits using optically stimulated luminescence. Radiat. Meas.
30, 207e217.
Olley, J.M., De Deckker, P., Roberts, R.G., Fifield, L.K., Yoshida, H.,
Hancock, G., 2004a. Optical dating of deep-sea sediments using single
grains of quartzda comparison with radiocarbon. Sediment. Geol. 169,
175e189.
Olley, J.M., Pietsch, T., Roberts, R.G., 2004b. Optical dating of Holocene sed-
iments from a variety of geomorphic setting using single grains of quartz.
Geomorphology 60, 337e358.
Olley, J.M., Roberts, R.G., Murray, A.S., 1997. Disequilibria in the uranium
decay series in sedimentary deposits at Allen’s Cave, Nullarbor Plain, Aus-
tralia: implications for dose rate determinations. Radiat. Meas. 27, 433e443.
Pillans, B.P., Chapell, J., Naish, T.C., 1998. A review of the Milankovich cli-
matic beat: template for Plio-Pleistocene sea-level changes and sequence
stratigraphy. Sediment. Geol. 211, 5e12.
Prescott, J.R., Hutton, J.T., 1994. Cosmic ray contributions to dose rates for
luminescence and ESR dating: large depths and long-term time variations.
Radiat. Meas. 23, 497e500.
Rees-Jones, J., 1995. Optical dating of young sediments using fine-grain
quartz. Anc. TL 13, 9e14.
Roberts, H.M., Duller, G.A.T., 2004. Standardised growth curves for optical
dating of sediment using multiple-grain aliquots. Radiat. Meas. 38,
241e252.
Roberts, R.G., Bird, M., Olley, J., Galbraith, R., Lawson, E., Laslett, G.,
Yoshida, H., Jones, R., Fullagar, R., Jacobsen, G., Hua, Q., 1998a. Optical
and radiocarbon dating at Jinmium rock shelter in northern Australia.
Nature 393, 358e362.
Roberts, R., Yoshida, H., Galbraith, R., Laslett, G., Jones, R., Smith, M.,
1998b. Single-aliquot and single-grain optical dating confirm thermolumi-
nescence age estimates at Malakunanja II rock shelter in northern Aus-
tralia. Anc. TL 16, 19e24.
Roberts, R.G., Galbraith, R.F., Olley, J.M., Yoshida, H., Laslett, G.M., 1999.
Optical dating of single and multiple grains of quartz from Jinmium
rock shelter, northern Australia: part II, results and implications. Archaeo-
metry 41, 365e395.
Roberts, R.G., Galbraith, R.F., Yoshida, H., Laslett, G.M., Olley, J.M., 2000.
Distinguishing dose populations in sediment mixtures: a test of single-
grain optical dating procedures using mixtures of laboratory-dosed quartz.
Radiat. Meas. 32, 459e465.
Rogers, J., 1988. Stratigraphy and geomorphology of three generations of
regressive sequences in the Bredasdorp group, southern Cape Province,
South Africa. In: Dardis, G.F., Moon, B.P. (Eds.), Geomorphological
Studies in Southern Africa. A.A. Balkema, Rotterdam, pp. 407e433.
Stokes, S., Ingram, S., Aitken, M.J., Sirocko, F., Anderson, R., Leuschner, D.,
2003. Alternative chronologies for late Quaternary (Last InterglacialeHolocene) deep sea sediments via optical dating of silt-sized quartz.
Quat. Sci. Rev. 22, 925e941.
Tribolo, C., Mercier, N., Selo, M., Valladas, H., Joron, J.-L., Reyss, J.-L.,
Henshilwood, C.S., Sealy, J., Yates, R., 2006. TL dating of burnt lithics
from Blombos Cave (South Africa): further evidence for the antiquity of
modern human behaviour. Archaeometry 48, 341e357.
Van Andel, T.H., 1989. Late Pleistocene sea levels and the human exploitation
of the shore and shelf of southern South Africa. J. Field Archaeol. 16,
133e155.
Vogel, J.C., Beaumont, P.B., 1972. Revised radiocarbon chronology for the
Stone Age in South Africa. Nature 237, 50e51.
Copyright © 2022 FDOKUMEN