Effects of Shade on the Persistence of Cool Season Grasses to Form Turfgrass
Upload
leidenunivCategory
view
2download
0
Faculty of Archaeology, University, Centre for Anthropological Research, Johannesburg, South Africa
Centre for Anthropological Research, University of Johannesburg, Johannesburg, South Africa
Karen van Niekerk Department of Archaeology, History, Cultural Studies University of Norway
s. Institute for Human Evolution, University of Johannesburg, South Africa Department of Archaeology, History, Cultural University of Norway
ABSTRACT: Major behavioural changes during the Late Pleistocene in Africa are often linked to climate change; specifically so the beginning of Marine Isotope Stage 4 and the appearance of the Still Bay Industry. However, little is known about the local environmental settings of Middle Stone Age sites and recent research shows that global climatic trends, recorded in ice and deep sea cores, cannot simply be juxtaposed on local situations. Here we explore the influence of local climate change on human subsistence strategies during Marine 5 and 4 at Blombos Cave (South Africa). We examine the changes in small shellfish and large mammal prey to determine respectively a) the local climatic situation and b) how the climat(~ may have influenced subsistence. In terms of climatic indicators, the shellfish spectra suggest that phases M3 (Marine Isotope Stage 5c) and Ml (approximate onset of Marine Isotope 4) fall within the present day species and Sea Surface Temperature range of the Agulhas marine province; l:llombos is currently located in this warmer province. The M3 is somewhat cooler than the M2 Uppcr/Ml; the latter are associated with the Still Industry. In terms of heterogeneity and evenness, the mammal assemblages reflect no major in hunting strategies. Other local climate proxies indicate relatively warm and wet conditions for the M2 Upper/Ml; when appraised against climate models this suggest that the of the Still
20 Geeske H.J Langejans et al.
Bay was not as dramatic as has been supposed. In this light it is unlikely that the Still Bay Industry was an adaptation to a harsh and resource depleted environment.
2.1 INTRODUCTION
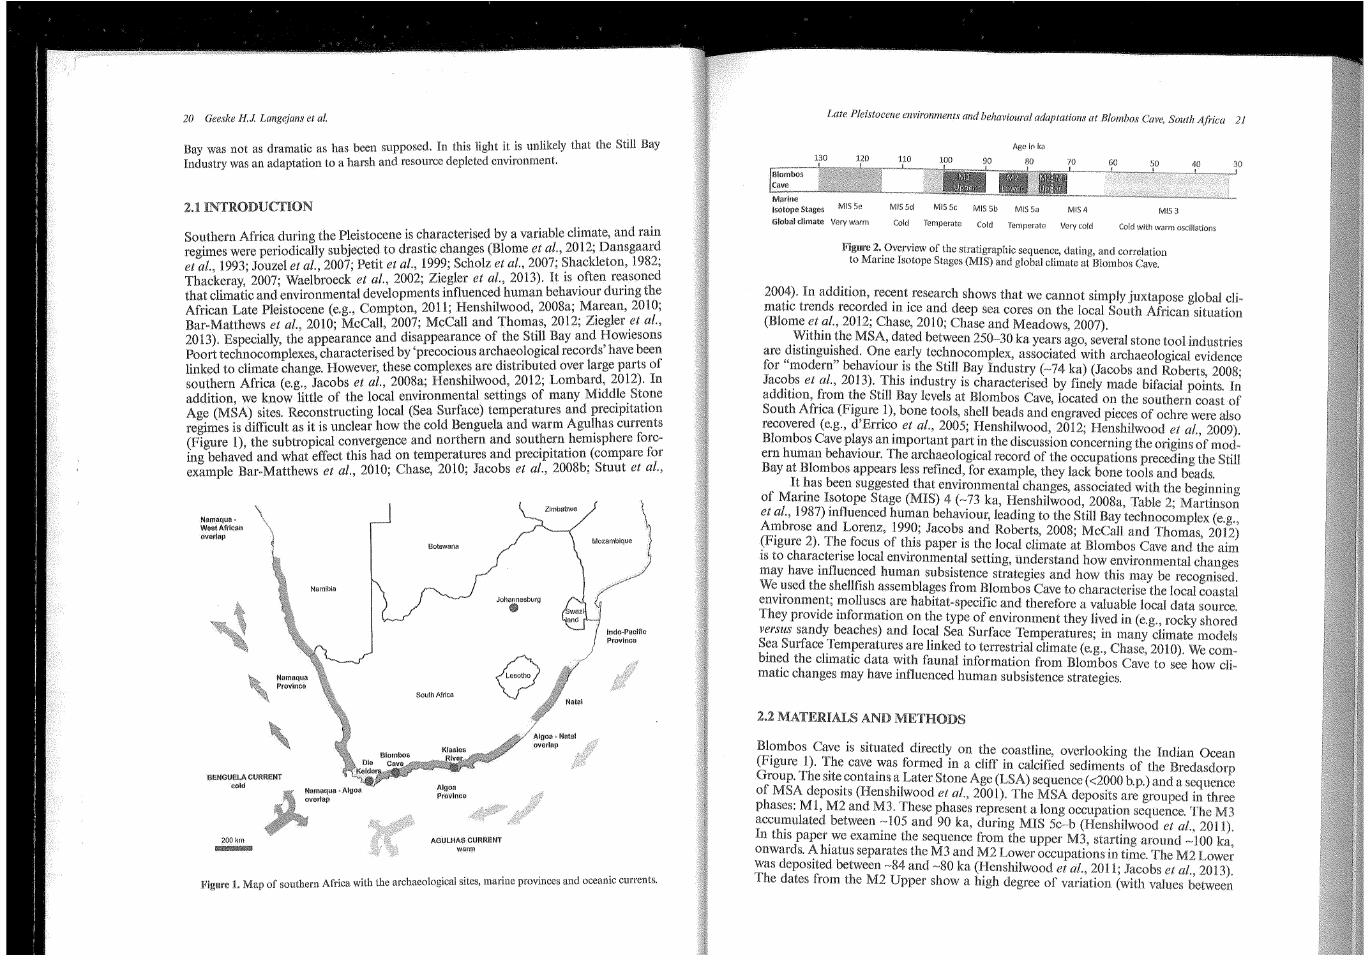
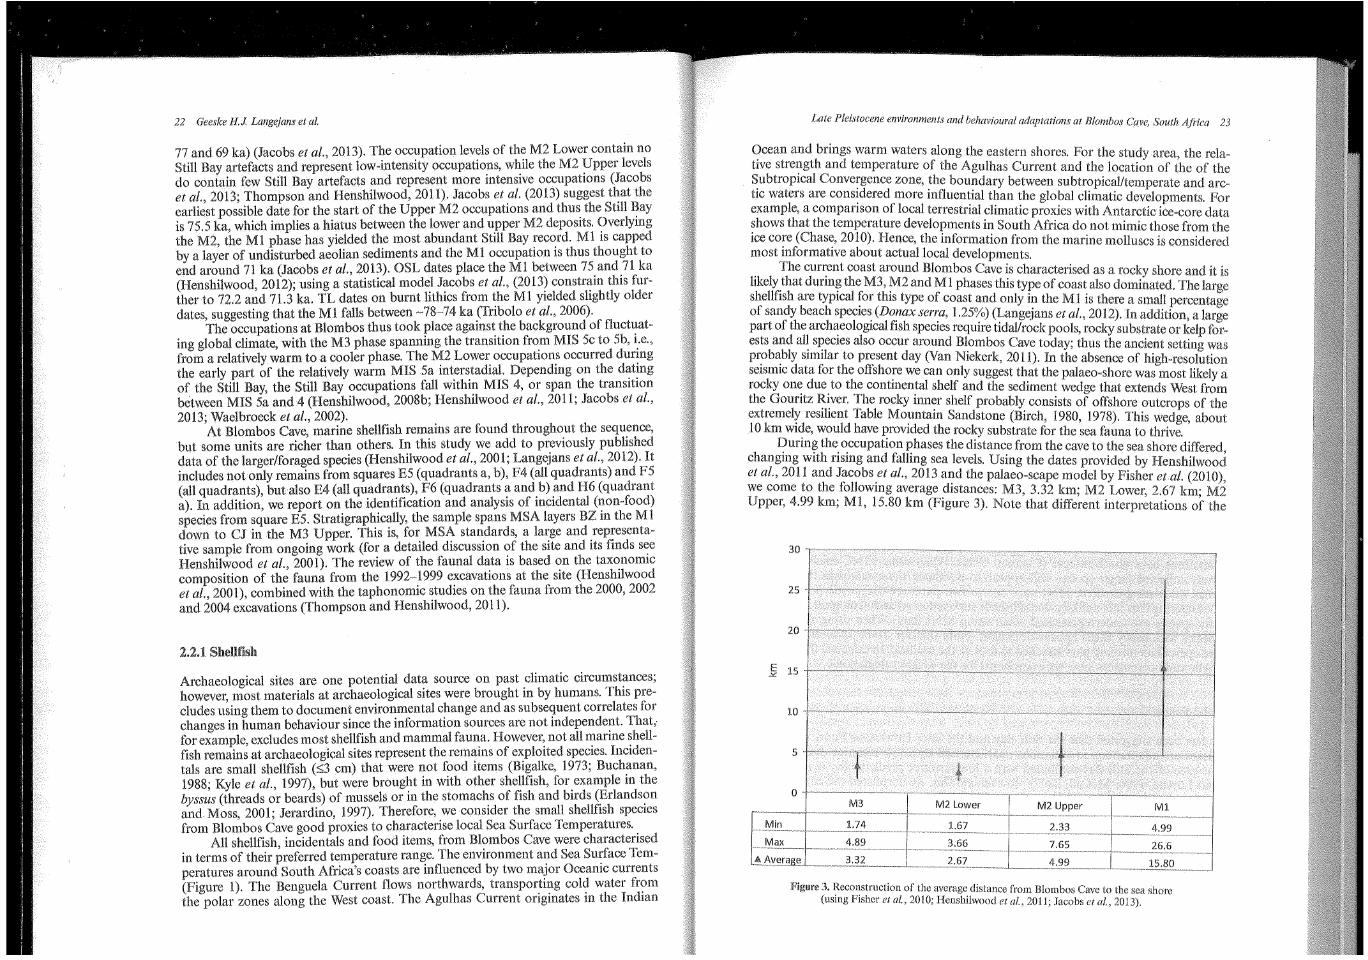
Southern Africa during the Pleistocene is characterised by a variable climate, and rain regimes were periodically subjected to drastic changes (Blome et al., 2012; Dansgaard eta!., 1993; Jouzel et al., 2007; Petit et al., 1999; Scholz et at., 2007; ~hackleton, 1982; Thackeray, 2007; Waelbroeck et a!., 2002; Ziegler et al., 2013). It 1s ?ften re~soned that climatic and environmental developments int1uenced human behavwur dunng the African Late Pleistocene (e.g., Compton, 2011; Henshilw,ood, 2008a; l';l~rean, 2010; Bar-Matthews et at., 2010; McCall, 2007; McCall and 1homas, 2012; Zwgler .eta!., 2013). Especially the appearance and disappearance of the Still Bay and llowtesons Poort technocon{plexes, characterised by 'precocious arch~eo.logical records' have been linked to climate change. However, these complexe~ are d1stnbuted over large parts of southern Africa (e.g., Jacobs et al., 2008a; Henshtlwood, 2012; Lombar~, 2012). In addition, we know little of the local environmental settings of many M1dd~e. St~ne Age (MSA) sites. Reconstructing local (Sea Surface) temperatures and prec1p1tatwn regimes is difficult as it is unclear how the cold Benguela and warm Agul.has currents (Figure 1), the subtropical convergence and northern and sout~~rn ~1em1sphere forcing behaved and what effect this had on temperatures and prec1p1tatwn (compare for example Bar-Matthews et a!., 2010; Chase, 2010; Jacobs et al., 2008b; Stuut et al.,
Namaqua W(lSt African overlap
Namaqua Province
I'IENGUE~A CURRENT cold
200 km
Botswana
South Africa
Klasloo
Algoa Province
AGULHAS CURRENT warm
\_,_ Zimbabwe
Algoa Natal overlap
Indo-Pacific Province
J<'igu1·e 1. Map of southem Africa with the archaeological sites, marine provinces and oceanic currents.
Late Pleistocene environments and behavioural adaptations at Blombos Cave, South Ajril:a 21
Age ir ka
Isotope Stages MIS 5b MIS Sa Ml$4 MIS3 Global climate Very warm Cold Temperate Cold Temperate Very cold Cold with warrn oscillations
Figure 2 •. 0verview of the stratigraphic sequence, dating, and correlation to Manne Isotope Stages (MIS) and global climate at B!ombos Cave.
200~). In addition, rec~nt. research shows that we cannot simply juxtapose global elimatte trends recorded 1111ce and deep sea cores on the local South African situation (Blome .et ~!., 20 12; Chase, 201 0; Chase and Meadows, 2007).
:VV~thm. the MSA, dated between 250--30 ka years ago, several stone tool are ,?tstmgm~hed. o.ne e~rly tech.nocomplex, associated with archaeological evidence for modern behaviour rs the Still Bay Industry (~74 ka) (Jacobs and Roberts 2008· Jac~~s et al., 2013). . industry is characterised by finely made bifacial poi~ts. It~ add1t10n, ~rom ~.he Strll Bay levels at Blombos Cave, located on the southern coast of South Afnca (figure .1), bone tools, shell beads and engraved pieces of ochre were also recovered ~e.g., d'Emc? eta!., 200.5; Henshilwood, 2012; Henshilwood et al., 2009). Blombos Cave pl~ys an Important part in the discussion concerning the origins of mod .. em human behavwur. The arch~eological record of the occupations preceding the Still
at Blombos appears less refmed, for example, they lack bone tools and beads. It ~as been suggested that environmental changes, associated with the oe
1gmmtlg
of Mann: I~otope Stage (MIS) 4 ( ~ 73 ka, Henshilwood, 2008a, Table 2; Martinson et al., 198 7) mt1uenced human behaviour, leading to the Still Bay technocomplex (e.g. A~brose an? . 199?; Jacobs and Roberts, 2008; McCall and Thomas, 2012) ~F1gure 2). 1 h~ focus of t~1s paper is the local climate at Blombos Cave and the aim ts to chara~tense local environmental setting, understand how environmental may have mfluenced human subsistence strategies and how this be ~ ....... ov"
We .used the shellfish assemblages from Blombos Cave to local coastal ~?v1ronme:nt; ~olluscs. are habitat-specific and therefore a valuable local data source. I hey provtde mformat10n on the type of environment they lived in (e.g., rocky shored versu,1' sand~ }:>eaches) and loc~ Sea Surface Temperatures; in many climate models S~a Surface .Iemperatures.are hnked to terrestrial climate (e.g., 2010). We combm~d the clnnatlc data ':1'1th faunal information from Blombos Cave to see how climatiC changes may have mf1uenced human subsistence strategies.
2.2
Bl?mbos C~~e is situated directly on the coastline, overlooking (Ftgure 1). lhe cave was formed in a cliff in calcified sediments of the Group. The sit~ contains~ Later Stone Age (LSA) sequence ( <2000 b.p.) and a sequence of MSA deposits (Henshllwood eta!., 2001). The MSA deposits are grouped in three phases: Ml, M2 and M3. These phases represent a long occupation sequence. The M3 accm~:mlated between ~·105 and 90 ka, during MIS 5c-b (Henshilwood et al., 2011). In th1s paper.we examme the sequence from the upper M3, around ~100 onwards. ~ hmtus separates the M3 and M2 Lower occupations in M2 Lower :':as depostted between -~84 and ~80 ka (I::Ienshilwood et at., 2011; Jacobs et al., 2013). I he dates from the M2 Upper show a htgh of variation (with
22 Geeske H.J. Langejans et al.
77 and 69 ka) (Jacobs et al., 2013). The occupation levels of the M2 Lower contain no Still Bay artefacts and represent low-intensity occupatio.ns, wi:ne the M2 ~Jpper levels do contain few Still Bay artefacts and represent more mtens1ve occupat10ns (Jacobs et al., 2013; Thompson and Henshilwood, 2011). Jacobs et .al. (2013) suggest t~at the earliest possible date for the start of the Upper M2 occupatiOns and thu~ the Still ~ay is 75.5 ka, which implies a hiatus between the lower and upper M2 depostts. <?verlymg the M2, the Ml phase has yielded the most abundant Still Bay record. Ml1s capped by a layer of undisturbed aeolian sediments and the Ml occupation is thus thought to end around 71 ka (Jacobs et at., 2013). OSL dates place the Ml between 75. and ,71 ka (Henshilwood, 2012); using a statistical model Jacobs et at., (2013! constr~m th1s further to 72.2 and 71.3 ka. TL dates on burnt lithics from the Ml y1elded shghtly older dates suggesting that the Ml falls between -78-74 ka (Tribolo et al., 2006).
;fhe occupations at Blombos thus took place agains~ t.he backgrou~d of fluct':lating global climate, with the M3 phase spanmng the transttwn fro.m MIS 5c to Sb, t:e., from a relatively warm to a cooler phase. The ~2 Lower. occ~patwn~ occurred dur~ng the early part of the relatively warm MIS Sa mterstad1al. Dependmg on the d~t~ng of the Still Bay, the Still Bay occupations fall withi~1 MIS 4, or span the tranSltwn between MIS 5a and 4 (Henshilwood, 2008b; Henshdwood eta!., 2011; Jacobs et at., 2013; Waelbroeck et al., 2002).
At Blombos Cave marine shellfish remains are found throughout the sequence, but some units are richer than others. In this study we add to previously published data of the larger/foraged species (Henshilwood et at., 2001; Langejans et al., 2012). It includes not only remains from squares E5 (quadrants a, b), F4 (all quadrants) and F5 (all quadrants), but also E4 (all qu.adra~~s), ~-i'6 (quadrants~· and.b) .and H6 (quadrant a). In addition, we report on the tdentlftcatwn and analys1s of mc1dental (l!on-food) species from square ES. Stratigraphically, the sample spans MSA layers BZ m the Ml down to CJ in the M3 Upper. This is, for MSA standards, a large and representative sample from ongoing work (for a detailed discussion of the site and its finds s~e Henshilwood et al., 2001). The review of the faunal d~ta is based ~n the tax~nomtc composition of the fauna from the 1992-.1999 e~cavatwns at the s1te (Henshdwood et al., 2001), combined with the taphonomic stud1es on the fauna from the 2000,2002 and 2004 excavations (Thompson and Henshilwood, 2011).
2.2.1 Shellfish
Archaeological sites are one potential data source on past climatic circumst~nces; however, most materials at archaeological sites were brought in by humans. Th1s precludes using them to document enviro~m~ntal c~ange and as subse9uent correlate~ for changes in human behaviour since the mfonnatwn sources are not mdepende!lt. 1. hat, for example, excludes most shellfish and mammal fam~a. However: not all n:anne ~hellfish remains at archaeological sites represent the remams of explmted species. Incidentals are small shellfish (sJ em) that were not food items (Bigalke, 1973; Buch~uan, 1988; Kyle et al., 1997), but were brought in with other s~e~lfish, for.example m the byssus (threads or beards) of mussels or in the stomac~s of f1sh and birds (~rlands?n and Moss, 2001; Jerardino, 1997). Therefore, we constder the small shellfish specws from Blombos Cave good proxies to characterise local Sea Surface Temperatures ..
All shellfish incidentals and food items, from Blombos Cave were charactensed in terms of their preferred temperature range. The environment and Sea Surface Temperatures around South Africa's coasts are influenced by two maJor Oceanic currents (Figure 1). The Benguela Current flows northwards, transpor~1~g col~l water fr?m the polar zones along the West coast. The Agulhas Current ongmates m the Indian
Late Pleistocene environments and behavioural adaptations at Blombos Cave, South Aji'ica 23
c:>cean and brings warm waters along the eastern shores. l"or the study area, the t1ve strength and temperature of the Agulhas Current and the location of the of the ~ubtropical Conve:gence zone, ~he boundary between subtropical/temperate and arcHe waters are cons~dered more mfluential than the global climatic developments. For example, a companson of local terrestrial climatic proxies with Antarctic ice-core data shows that the temperature developments in South Africa do not mimic those from the ice core (Chase, 2010). the information from the marine molluscs is considered most informative about actual local developments. . The cun:ent coast around Blombos Cave is characterised as a rocky shore and it is
hkely that dunng the M3, M2 and M 1 phases this type of coast also dominated. shellfish are typical ~or this type of coast and only in the Ml is there a small percentage of san?y beach spec1e~ (Do~ax ser~a, 1.25%) (Lang~jans et al., 2012). In addition, a part of the arch~eologtcal f1sh specws require tidal/rock pools, rocky or kelp for·· ests and al~ sl?ectes also occur around Blombos Cave today; thus the setting was ptyb~bly s1m~lar to present day (Van Niekerlc, 2011). In the absence of high-resolution setsmtc data for the offsho~e we can only suggest that the palaeo-shore was most likely a rocky one due to the contmental shelf and the sediment wedge that extends West from the Gouritz ~~ver. 1:he rocky inn~r shelf probably consists of offshore outcrops of extremel~ resthent Table Mo~ntam Sandstone (Birch, 1980, 1978). This wedge, about 10 km w1de, would have provtded the rocky substrate for the sea fauna to thrive.
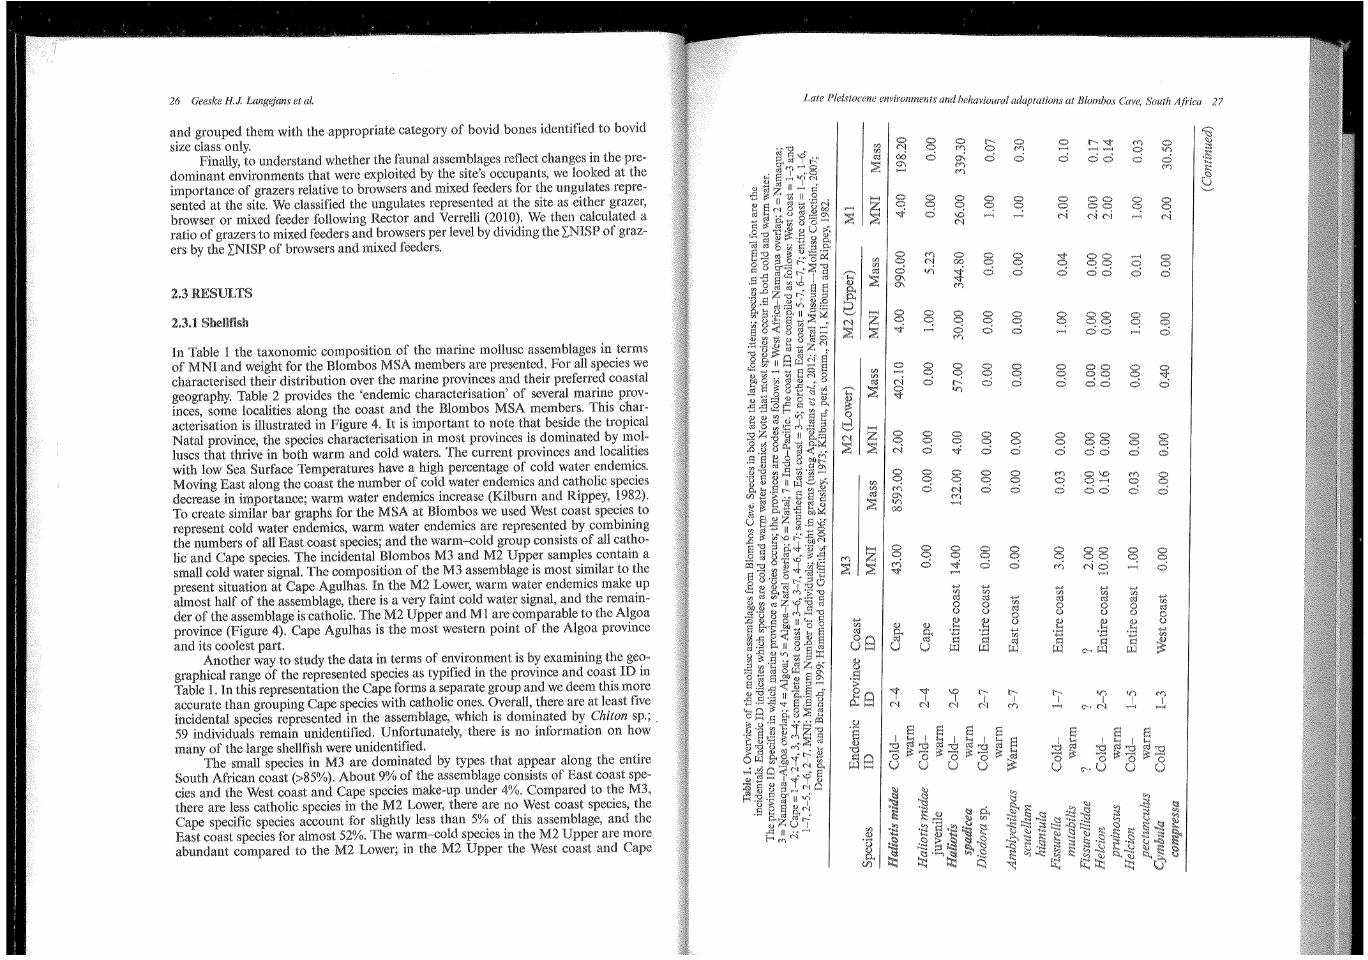
During the occupation phases the distance from the cave to the sea shore differed changing with rising and falling sea levels. Using the dates provided by Henshilwootl et al., 2011 and Jacobs .et al., 2013 al!d the palaeo-scape model et al. (2010), we come to the followmg average d1stances: M3, 3.32 km; M2 2.67 km; M2 Upper, 4.99 km; Ml, 15.80 km (Figure 3). Note that different of the
30 r-
2"' ,::J ~~-···
E .;,:;
10
5
f 0
IVI3 IVI2 Lower M2 Upper Ml
Min 1.74 1.67 2.33 4.99
.11/iax 4.89 3.66 7.65 26.6
lAt. Average 3.32 2.67 4.99 15.80
Figure 3, Reconstruction of th~ average distance from Blombos Cave to the sea shore (using Fisher et al., 2010; Hcnshilwood et al., 2011; Jacobs et al., 2013).
·~·
...
24 Geeske H.J. Lang~jans eta!.
dating will lead to different reconstructed distances. Although the increase in distance over time is a persistent trend, the high value for the Ml hinges on a date of 72.5 ka. If the Ml were to be dated earlier (cf. Tribolo eta/., 2006), the sea would have been closer to the cave; if the Ml is younger than assumed here (ct: Guerin et al., 2013), the sea would be further away. . .
South Africa has semi-diurnal tides and the cycle of low and h1gh t1de occurs about twice per day. The two low tides are of equal magnitude, but the high tides generally do not have the same magnitude (SADCO, 2008). The timing and extent of the tidal peaks depend on the lunar and solar cycles. The ~outh African .coast has .a general tidal range of about 1 m and at Mossel Bay the maxnnum annual tldal range 1s
about 2.4 m (Hydrographic Office, 2011; SADCO, 2008). The different Sea Surface Temperatures on the eastern and western coasts result
in a taxonomic differentiation of shellfish communities. The shellfish communities can be divided into so-called marine provinces (Figure 1); currently, Blombos Cave is located in the Algoa province (Kilburn and Ripp.ey, 1982). marin~ provin~es are characterised by the percentages of three categon~s: warm to cold spec1es (~pec1es that occur along the entire coast), warm water endem1cs and cold water endem1cs. W,e fitted the Pleistocene assemblages of incidental and large shellfish from Blombos m these categories and compared them to present-day composition of the marine provinces (Kilburn and Rippey, 1982). In an attempt to .further unt~ngle. the en~ironmental data, we used the geographical occurrence of speCies, as descnbed 111 the hterature, to characterised them as West Coast, Cape, or East Coast typicals (Appeltans eta/., 2012; Natal Museum--Mollusc Collection, 2007; Dempster and Branch, 1999; Hammond and Griffiths, 2006; Kensley, 1973; Kilburn pers. comm. 2011; Kilburn and Rippey, 1982; Turton, 1932). Where possible we made the distinction between the more tropical northern and the more temperate southern East coast.
:For this analysis we used the Minimum Number of Individuals (MNI) and grams of shell and we calculated the percentage MNI per member; unfortunately, all representations have disadvantages (Claasen, 1998). When using MNI, small and intensively collected larger species will appear to dominate the a~sembl~ge. In add~tion, when calculating shellfish MNI only one to two parts are d1agnost1c per spec1men. Considering that it is unlikely that all shells .survived in an archaeolo~ical assemb~age, rare species are underrepresented when usmg MNI data. When usmg shell wetght, species with heavy shells appear dominant. Note that for Turbo sarmaticus we used the operculum (closing part attached to foot of the mollusc) to calculate the MNI; the shells and opercula weights were combined for the weight calculations.
2.2,2 "Fauna
It has been suggested that the Still Bay and t~1e later Howiesons Poort te.chnocm~plexes are adaptations to situations charactensed by a low resource demnty, and m the case of the Still Bay combined with a low resource predictability (e.g., Ambrose and Lorenz 1990· McCall 2007). To evaluate this, we correlated the environmental data to the Blomb~s faunal assemblages. From a behavioural ecological point of view, a decrease in the availability of highly ranked resources should result in a broadening of the exploited resource base (Dusseldorp, 2012a; Nagaoka, 2002). This in turn would lead to more diverse archaeological faunal assemblages, and a more even rep·· resentation of the taxa in the assemblages (e.g., Clark, 2011; Jones, 2004; Lupo and Schmitt 2005· Lyman 2008; Stiner and Munro, 2002). Moreover, the representation of anirn'al siz; classes ls expected to change in situations of resource stress. Foragers
Late Pleistocene environments and behavioural adaptations at JJ!ombos Cave, South Aji·ica 25
generall1 prefer ~arge-sized prey (Dusseldorp, 2012a, 2010; 1987, 2001). U~less mtervenmg ~actors, such. ~s technological innovations that make the exploitatwn. of small.specws more eff1c1ent (e.g., Wadley, 2010), an in the representat~on of ammals of smaller body size is expected to be associated with resource depletwn.
If the resource base broadened, the number of (NTAXA) ~n the-~till Ba~ faunal !lssemblages is expected to increase. simply compar-mg N I:AXA for the ~Ifier~n.t levels does not provide a good test diversity of fa~nal a.ssemblages, smce 1t ts related to sample size (Lyman, 2008). The Shannon~ :V1ener mde~ (If) allows an evaluation of the diversity of takmg sample stze ~n~o ~ccount. H is therefore often used when trying to the level of spe~tahsatton of faunal exploitation strategies in archaeological assemblages (Cruz-Unbe, 1988; Neeley and Clark, 1993). The index is cakulated as follows (Equation (1)).
~(ln~)
In Equation (1), is the proportion of taxon i in the .::w''"u .• uutgc.
a number between 1.5 and 3.5. The higher the number the blage heterogeneity (Cruz-Uribe, 1988; Lyman, 2008):
From the Shannon index of evenness (e) can be calculated,~.~~---.~· .. (2)).
e HiluS
. In Equation (2), His the index of heterogeneity and Sis the NTAXA
(l)
(2)
~n t~e assemblage. The Shannon evenness index e falls between 0 and 1. md1eate even assemblages, a value of Ont) an assemblage which taxa are equally abundant,. and lower values indicate more uneven assemblages, dominated by one or a few of the represented taxa (Lyman, 2008).
We calc_ulated Hand e based on the published taxonomic of the 1992"" 1_999 excavations at Blombos Cave (Henshilwood eta!., 2001). We our calcula· tlons ?n the ~umber of Identified Specimens (NISP) per taxon, instead of using MNI. MN~ 1s a der~v~d measu:e, and its use is controversial (e.g., Plug and Plug, 1990). MNI prov1des a mn;.1mun~ esttmate; the actual number of represented individuals may b~en substa~tmlly h1gher., Moreover, the use of MNI tends to importance of r~~e spec1es (L~man, 2008; Plug and Plug, 1990). To calculate proportion a spectflC taxon h~s m the assemblage, we considered only the NISI~ Specimens nated by Henshdwood et r:t. (200 1) to bovid size class only were omitted calc~lat10ns. Some exceptions were made, if bones or individuals were ~amlly level (e.g. Hyaenidae) and no bones were assigned to a~""'''"'""""'""'"''""" lly was counted as one represented taxon. . Add~tiona!ly, since there is a relation between animal body size and popula-
tion denstty. (Silva et a!., 2001, .1997), it is exp~cted that the abundance of large mammals wtll decrease more raptdly than that ot small mammals if resource abun~ ~ance decreases. lienee, we evaluated the representation of the dltfer,ent stze cl~sses per archaeological level. We calculated the representation of body s;ze classes based ~n the published taxonomic identifications (Henshilwood ~t al., 2001! and also rev1ew~d the results of the taphonomic analysis (Thompson and Henshllwoo?, 2011 ). With regard to the taxonomic we classified all represented species according to animal size as used by et al. (2000)
26 Geeske H. J. Langqjans et at.
and grouped them with the appropriate category of bovid bones identified to bovid size class only.
Finally, to understand whether the faunal assemblages reflect changes in the predominant environments that were exploited by the site's occupants, we looked at the importance of grazers relative to browsers and mixed feeders for the ungulates represented at the site. We classified the ungulates represented at the site as either grazer, browser or mixed feeder following Rector and Verrelli (2010). We then calculated a ratio of grazers to mixed feeders and browsers per level by dividing the LNISP of grazers by the INISP of browsers and mixed feeders.
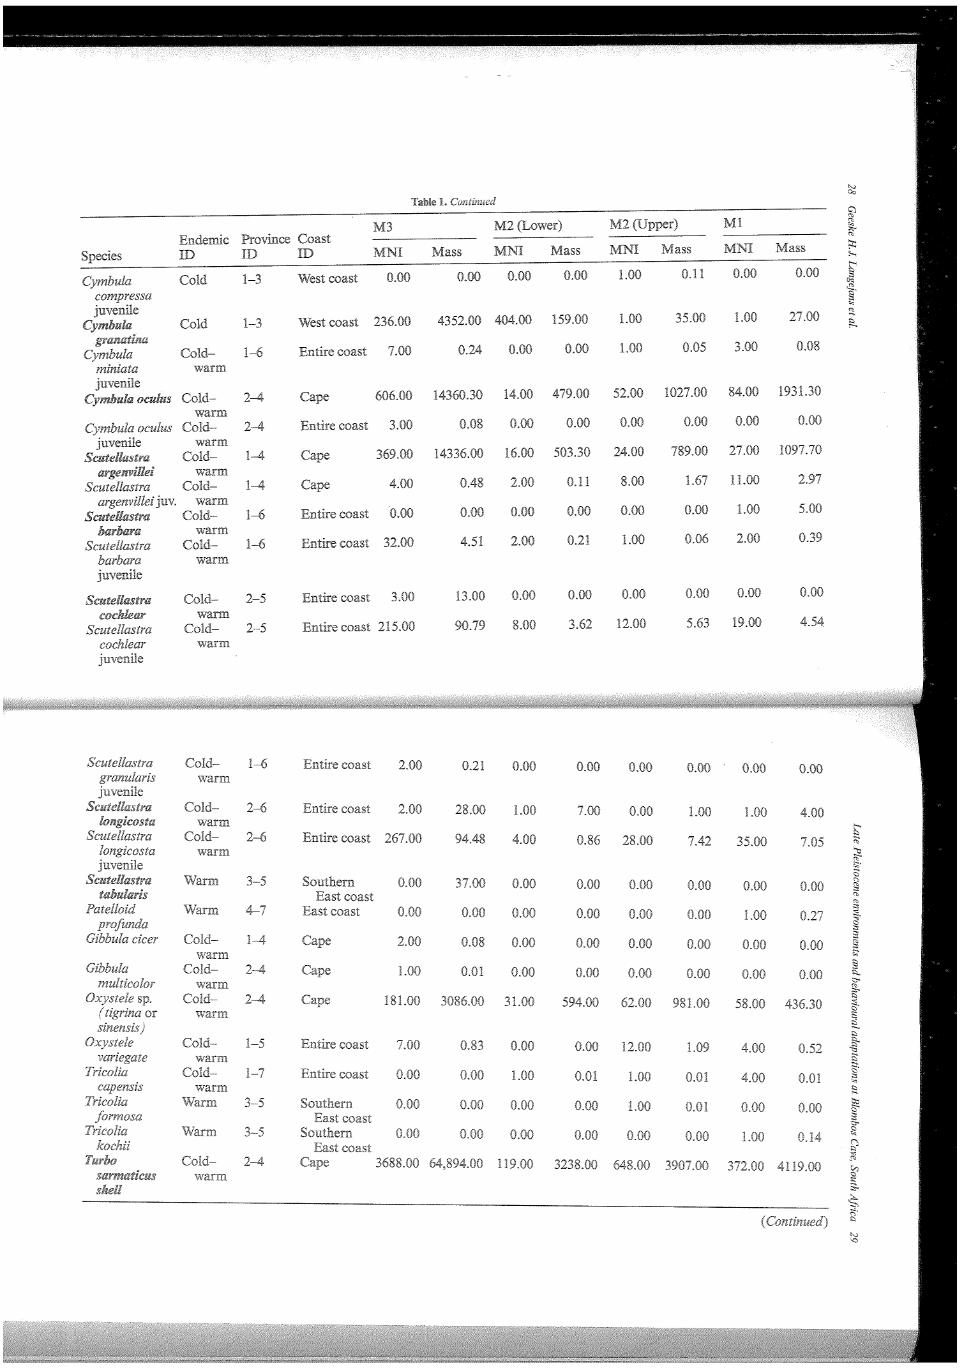
2.3RESULTS
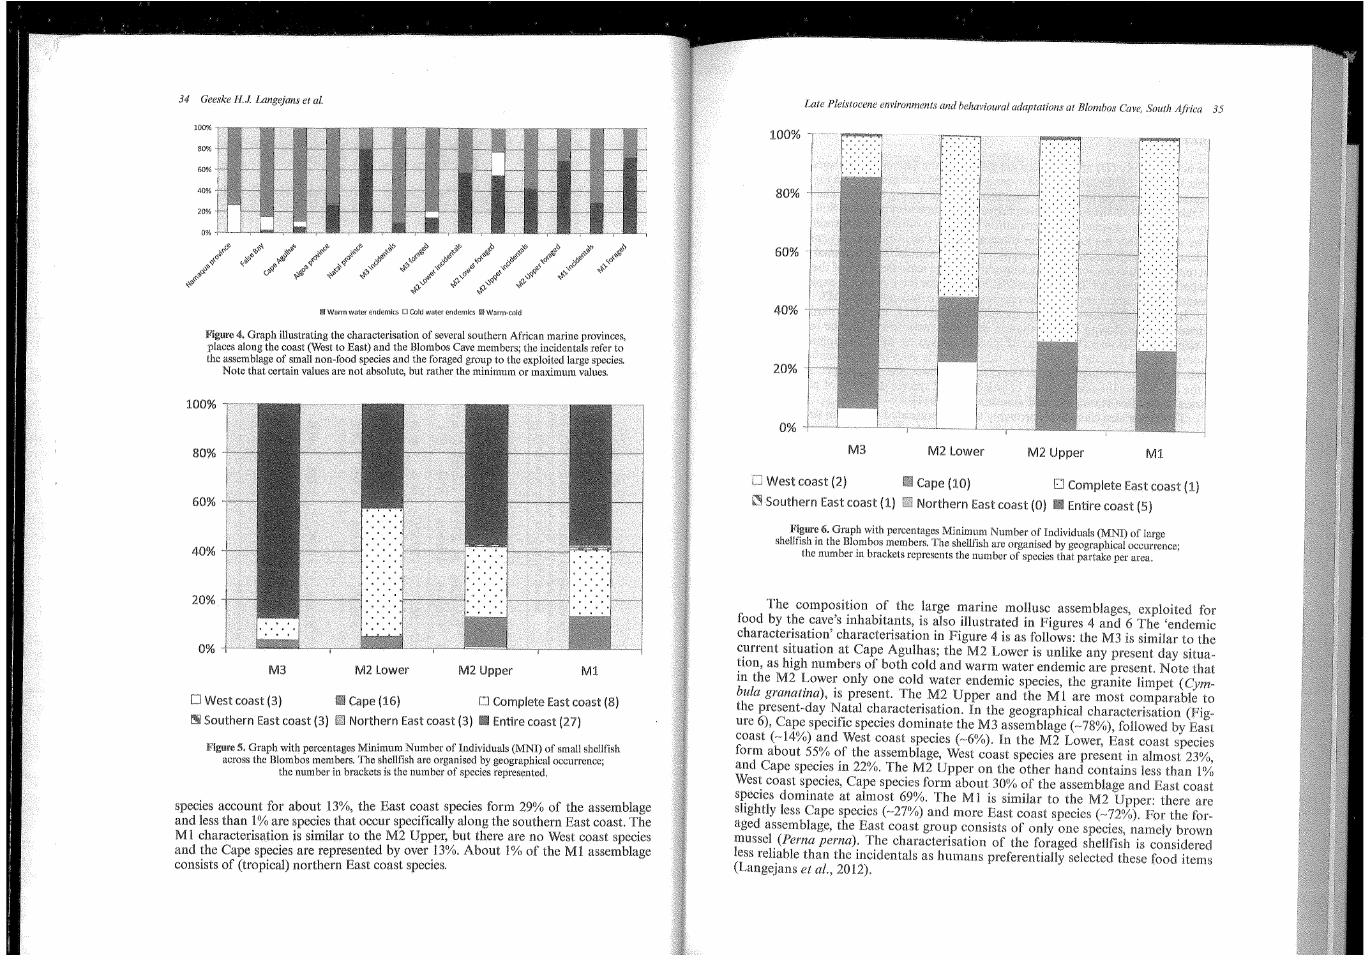
In Table 1 the taxonomic composition of the marine mollusc assemblages in terms of MNI and weight for the Blombos MSA members are presented. For all species we characterised their distribution over the marine provinces and their preferred coastal geography. Table 2 provides the 'endemic characterisation' of several marine provinces, some localities along the coast and the Blombos MSA members. This characterisation is illustrated in Figure 4. It is important to note that beside the tropical Natal province, the species characterisation in most provinces is dominated by molluscs that thrive in both warm and cold waters. The current provinces and localities with low Sea Surface Temperatures have a high percentage of cold water endemics. Moving East along the coast the number of cold water endemics and catholic species decrease in importance; warm water endemics increase (Kilburn and Rippey, 1982). To create similar bar graphs for the MSA at Blombos we used West coast species to represent cold water endemics, warm water endemics are represented by combining the numbers of all East coast species; and the warm-.cold group consists of all catholic and Cape species. The incidental Blombos M3 and M2 Upper samples contain a small cold water signal. The composition of the M3 assemblage is most similar to the present situation at Cape Agulhas. In the M2 Lower, warm water endemics make up almost half of the assemblage, there is a very faint cold water signal, and the remainder of the assemblage is catholic. The M2 Upper and Ml are comparable to the Algoa province (Figure 4). Cape Agulhas is the most western point of the Algoa province and its coolest part.
Another way to study the data in terms of environment is by examining the geographical range of the represented species as typified in the province and coast ID in Table 1. In this representation the Cape forms a separate group and we deem this more accurate than grouping Cape species with catholic ones. Overall, there are at least five incidental species represented in the assemblage, which is dominated by Chiton sp.; . 59 individuals remain unidentified. Unfortunately, there is no information on how many of the large shellfish were unidentified.
The small species in M3 are dominated by types that appear along the entire South African coast (>85%). About 9% of the assemblage consists of East coast species and the West coast and Cape species make-up under 4%. Compared to the M3, there are less catholic species in the M2 Lower, there are no West coast species, the Cape specific species account for slightly less than 5% of this assemblage, and the East coast species for almost 52%. The warm~cold species in the M2 Upper are more abundant compared to the M2 Lower; in the M2 Upper the West coast and Cape
Late Pleistocene environments and behavioural adaptations at Blomhos Cave, South Africa 27
0 0 <"i M
0 0 0
0 0 0
0 0 0
"<f• 0 0
0 0 0
00 00 00
Species
miniata
Scutellastra
Scutellastra barbara
Scutellastra barbara
Scutellastra cochlear
Scutellastra cochlear
Scutellastra
Scutellastra tahularis
Patelloid
Gibbula multicolor
Tricolia
Tricolia
Table 1. Conti!'lUCd
M3 M2 M2 Ml Enderoic Province Coast
MNI Mass MNI Mass ID ID ID MNI Mass MNI Mass
Cold
Cold
Coldwarm
1-3
1-3
1-6
Cold- 2-4 warm
Cold- 2-4 warm
Cold- 1-4 warm
Cold- 1-4 warm
Cold- 1-6 warm
Cold- 1-6 warm
Cold- 2-5 warm
Cold- 2-5 warm
Cold- 1-6 warm
Cold- 2-6 warm
Cold- 2-6 warm
Warm 3-5
Warm 4-7
Cold- 1-4 warm
Cold- 2-4 warm
Cold- 2-4 warm
Cold- 1-5 warm
Cold- 1-7 warm
Warm 3-5
3-5
Cold- 2-4
West coast 0.00 0.00 0.00 0.00 1.00 0.11 0.00 0.00
West coast 236.00 4352.00 404.00 159.00 1.00 35.00 1.00 27.00
Entire coast 7.00 0.24 0.00 0.00 1.00 0.05 3.00 0.08
Cape 606.00 14360.30 14.00 479.00 52.00 1027.00 84.00 1931.30
Entire coast 3.00 0.08 0.00 0.00 0.00 0.00 0.00 0.00
369.00 14336.00 16.00 503.30 24.00 789.00 27.00 1097.70
4.00 0.48 2.00
Entire coast 0.00 0.00 0.00
Entire coast 32.00 4.51 2.00
Entire coast 3.00 13.00 0.00
Entire coast 215.00 90.79 8.00
Entire coast 2.00 0.21 0.00
Entire coast 2.00 28.00 1.00
Entire coast 267.00 94.48 4.00
Southern 37.00 0.00 East coast
East coast 0.00 0.00 0.00
Entire coast
Entire coast
2.00 0.08 0.00
0.01
181.00 3086.00 31.00
0.83
0.00 0.00
0.00
0.11 8.00 1.67 1.00 2.97
0.00 0.00 0.00 1.00 5.00
0.21 1.00 0.06 2.00 0.39
0.00 0.00 0.00 0.00 0.00
3.62 12.00 5.63 19.00 4.54
0.00 0.00 0.00 0.00 0.00
7~ QOO I~ 1~ 4.00
0.86 28.00 7.42 35.00 7.05
0.00 0.00 0.00 0 00 0.00
0.00 0.00 0.00 1.00 0.27
0.00 0.00 0.00 0.00
0.00 0.00 0.00 0.00 0.00
594.00 62.00 981.00 58.00 436.30
12.00 1.09 4.00 0.52
0.01 .00 0.01 4.00
3238.00 648.00 3907 372.00
~
~
"' ~ "'" "" ~ ;_
£;' ;:>
Oq .n,
§• "' ~ ;:, ,_
~ "' '"'i:l ~ t;;· <:; " § ., "' ;:> :=. § ::! ~ "" ~ ~ ;:,
"' c:;· "' ~ !:;
~ g_ ~ ~ ~ ~ ~ ~ "' -"' ~ "' ;;;. .A. ~
2" "' '0
Table 1. Continued
M3 M2 Endemic Province Coast
Species ID ID ID MN1 Mass MN1
Ml
Mass MJ\TI Mass MNI Mass
v., c
G)
"' ~ ,.. "' Turbo sannaticus Cold- 2-4 272.00 3592.00 698.00 8421.00 970.00 12502.00 ;::::
Turbo cidaris
Turritella
2-4 warm
Cold- 1-6 warm
Warm 3-7
Cold 1-3
Cold- 2-7 warm
Cold- 2-6 warm
Cold- 1-6 warm
Cold- 2-5 scrobianlata warm
Nucella dubia Cold- 1-5
sp.
denseliriata Anachis
kraussii Bulia diluta Bullia sp. Nassarius
kraussianus
Nassarius
N assarius sp. Nassarius
warm ') ') . . Cold- 3
warm Cold- 2-6
warm Warm 4-7 ? ? Cold- 2-7
warm
Warm 4-6
')
Coldwarm
Cold-warm
Warm
Cold-
? 3-4
2-5
7
1-4 sinuata warm
Clionella striolata Cold 2
Clionella sp. ? Turbonilla sp. ?
? ')
concinna
costatus
Neocardia
Coldwarm
Cold-warm
2-6
2-6
Cold- 2-4 warm
Cold- 3-4 warm
Cold- 3-4 warm
Cold- 1-5
')
Cold-
3-4
Entire coast
East coast
West coast
Entire coast
Entire coast
Entire coast
Entire coast
Entire coast
? Cape
Entire coast
East coast ')
Entire coast
East coast
2.00
5.00
59.00
1.00
4.00
0.00
0.00
0.00
1.00
3.00 0.00
0.00
0.00 0.00 1.00
1.00
? 0.00 0.00
Entire coast 0.00
Northern 1.00 East
1.00
West coast 2.00
? 1.00 ? Entire coast 81.00
Entire coast
4.00
441.00
Entire coast 3.00
? Entire coast
0.30 0.00
0.17 1.00
1.51 31.00
0.03
0.45
0.00
0.00
0.00
0.09
0.00
2.001
0.00
0.00
0.00
0.00
0.51 1.00 0.00 0.00
0.00 0.00
0.00 0.00 0.00 0.00 0.01 0.00
0.00 0.00
0.00
0.01
18
0.02
0.00 5.64
0.00
0.04
4.04
0.53
0.00
1.00 0.00
1.00
0.00
0.00
0.00
0.00 0.00 8.00
0.00
55.00
4.58 2.00
0.00 2.00
0.04 3.00
0.95 39.00
0.00 0.00
0.04 10.00
0.001 1.00
0.00 1.00
0.00 2.00
0.00
0.03 0.00
0.00
0.00 0.00 0.00
0.00
0.00 0.00
0.01
0.00
0.00
0.00
0.00 0.00 0.30
0.00
0.00
0.01
0.00
1.00
7.00 2.00
0.00
0.00 0.00 0.00
0.00
1.00 0.00
0.00
0.00
0.00 5.00
0.00
3.00
0.47
0.15
1.15
0.00
0.32
0.08
0.01
0.01
0.15
0.20 0.32
0.00
0.00 0.00 0.00
0.00
0.02 0.00
0.00
0.00
0.00
0.00
0.00 0.00 0.33
7.00
9.00
49.00
0.00
21.00
6.00
1.00
4.00
0.00
5.00 0.00
1.00
1.00 0.00
0.00
0.00 3.00
0.00
0.00
0.00 8.00
0.00 0.00
0.00 1.00
168.00
2.93
0.08
0.41
2.16
0.00
1.23
0.96
0.12
0.17
0.00
0.30 0.00
0.07 0.05 0.00
0.00
0.00 0.08
0.00
0.00
0.00
0.00 0.00 0.66
0.04
0.00
0.02
5.20
:-.. t-> § ~
"'" "' '"' ~
~
t--< ~ "' ~ ~. s " ~ "' ;I "" ~· "' 21 § ~ § "'-"'"' "' if ~. g .., 12.. :::, .,. :::, ';:; ~. "' ;::,
'"' ~ 0,:;
~ "'"' i:; g '~ ~
~ ;;:;-
~ 2
'"'
Barbatia
sp.
M3 Endemic Province Coast ID ID ID MNI
Warm 5-7
Cold- 2--4 warm
Cold- 1--4 warm
Cold- 1--4 warm
Warm Warm
Warm
3-7 4-7
3-5
Cold- 2--4 warm
Warm 6--7
Northern East coast
Cape
East coast East coast
Southern East coast
0.00
1.00
6.00
3.00
502.00 1.00
0.00
Northern 0.00 East coast
Northern 0.00 East coast
Mactra Cold- 1-7 Entire coast 0.00
Donax serra
Venus verrucosa
Hiatella arctica
warm Cold- 1--4
warm Cold- 3--4
warm ? ?
Cold- 1-7 warm
Cold- 2--4 warm
2.00
0.00
? 0.00
Entire coast 1.00
1.00
Table
M2
Mass MN1
0.00 0.00
0.02 0.00
7.82 0.00
1.31 0.00
1804.30 969.00 0.20 0.00
0.00 0.00
0.00 0.00
0.00 0.00
0.00 0.00
2.00 0.00
0.00 0.00
0.00 0.00
0.00 0.00
0.00 0.00
Mass
0.00
0.00
0.00
0.36
3117.00 0.00
0.00
0.00
0.00
0.00
4.00
0.00
0.00
0.00
MNI Mass
0.00 0.00
0.00
0.00 0.00
3.00 3.70
2205.00 7202.00 1.00 0.14
0.00 0.00
4.00 0.11
0.00 0.00
0.00 0.00
0.00 2.00
0.00 0.00
0.00 0.00
0.00 0.00
0.00 0.00
Ml
MNI Mass
1.00 0.01
1.00 0.02
0.00 0.00
0.00 0.00
3625.00 14731.00 0.00 0.00
.00 0.
1.00 0.02
1.00 0.48
1.00 0.38
68.00 570.00
1.00 0.18
1.00 0.03
0.00 0.00
0.00
Table 2. Overview of the mollusc characterisation of several southern African marine provinces, locations along tclJ.e coast (West to East) (Kilburn and Rippey, 1982) and theMembers from Blombos Cave. For the average Sea Surface Temperatures for both False Bay and Cape Agulhas, Hermanus data was used.
For the first the temperatures should be somewhat lower the latter somewhat 2013; Seatemperature.o:rg, 2013). Note that some values are not absolute, but larger or values.
Port Nolloth- False Sunset Her-
ID Beach manus
SST 17.7°C- 19.9°C 18.5°C
SST 13.4°C- 15.6°C 15.2°C
Warm 0.0% 2.4% water endemics
Cold 25.0% 12.0% water endemics
>70.0% >80.0%
manus London
19.9°C 20.7°C-24.50C
15.6°C l6°C-2l.30C
5.0% >26.0%
5.0% ::;1.0%
>70.0%
Natal
Port St. John'sDurban
25.9°C-25.90C
21.8°C-21.90C
80.0%
0.0%
<20. 0%
M3 inci- M3
M2 Lower M2 inci- Lower
"-'-"HCa.J.i> toraged dentals
X X X X
X X X X
9.0 14.1 57.4 54.8
0.4 6.6 0.0 22.8
90.6 79.3 42.6 22.4
M2 M2 Ml
_ _ inci-dentals foraged dentals .i.V«<.",<Ou
X X X X
X X X X
42.0 68.9 29.1 71.9
0.7 0.0
57.3 70.9 28.1
<A,
"" G'l " t.;
"'"' " ;:t:1 :-.. t-<
~ ·"' ]• '"' ~ l:l ,_
t-< ~ "' ::::: "' t:;· 0 (")
"' ::: <C
~ ~§ ~ ~ ~ § 1:).
"" " "'"" l:l ~c
~ l:l ~
'"B 0 g. ~ ~ s:;: c :;;; s. ~ Q -= "' c.:, c
"' ::;.. _;:,...
"f :s· l:l
'--' '""'
34 Geeske H.J. Langejans et al.
If Warm water endemics CJ Cold water endemics II Warm~co!d
I<'igul'e 4. Graph illustrating the characterisation of several southern African marine provinces, places along the coast (West to East) and the Blombos Cave members; the in.cidentals refer. to the assemblage of small non-food species and the foraged group to the explmted large specws.
Note that certain values are not absolute, but rather the minimum or maximum values.
M3 M2 Lower M2 Upper Ml
[J West coast (3) (16) []Complete East coast (8)
r'!ii Southern East coast (3) Northern East coast (3) • Entire coast (27)
Figure 5. Graph with percentages Minimum Number of Individuals (MNI) of small shellfish across the Blombos members. The shellfish are organised by geographical occurrence;
the number in brackets is the number of species represented.
species account for about 13%, the East coast species form 29% of the assemblage and less than 1% are species that occur specifically along the southern East coast. The M 1 characterisation is similar to the M2 Upper, but there are no West coast species and the Cape species are represented by over 13%. About 1% of the Ml assemblage consists of (tropical) northern East coast species.
Late Pleistocene environments and behavioural adaptations at Blombos Cave, South Aji·ica 35
100%
80%
60%
40% I
20%
M3
[] West coast (2)
~Southern East coast (1)
M2 Lower M2 Upper Ml
Cape (10} East coast (1)
Northern East coast (O) • Entire coast
l<igure 6. Graph with percentages Minimum Number of Individuals (MNI) of largiJ shellfish in the Blombos members. The shellf1sh are organised by geographical occurrence;
the number in brackets represents the number of species that partake per area.
The composition of the large marine mollusc assemblages, food by the cave's inhabitants, is also illustrated in Figures 4 and 6 characterisation' characterisation in Figure 4 is as follows: the M3 is similar to the current situation at Cape Agulhas; the M2 Lower is unlike any day situa-tion, as high numbers of both cold and warm water endemic are Note in the M2 Lower only one cold water endemic species, the limpet ( Cym~ hula granatina), is present. The M2 Opper and the Ml are most comparable to the present-day Natal characterisation. In the geographical characterisation ure 6), Cape specific species dominate the M3 assemblage ( ~ 78%), followed by coast (~14%) and West coast species (~6%). In the M2 Lower, East coast form about 55% of the assemblage, West coast species are present in almost and Cape species in 22%. The M2 Upper on the other hand contains less 1% West coast species, Cape species form about 30% of the assemblage and East coast species dominate at almost 69%. Ml is similar to the M2 Upper: there are slightly less Cape species (~27%) and more East coast species (~72%). For for-aged assemblage, the East coast group consists of only one species, brown mussel (Perna perna). The characterisation of the foraged shellfish is ""'""u"'' less reliable than the incidentals as humans preferentially selected food (Langejans et al., 2012).
36 Geeske 11.1 Langejans et al.
Fauna
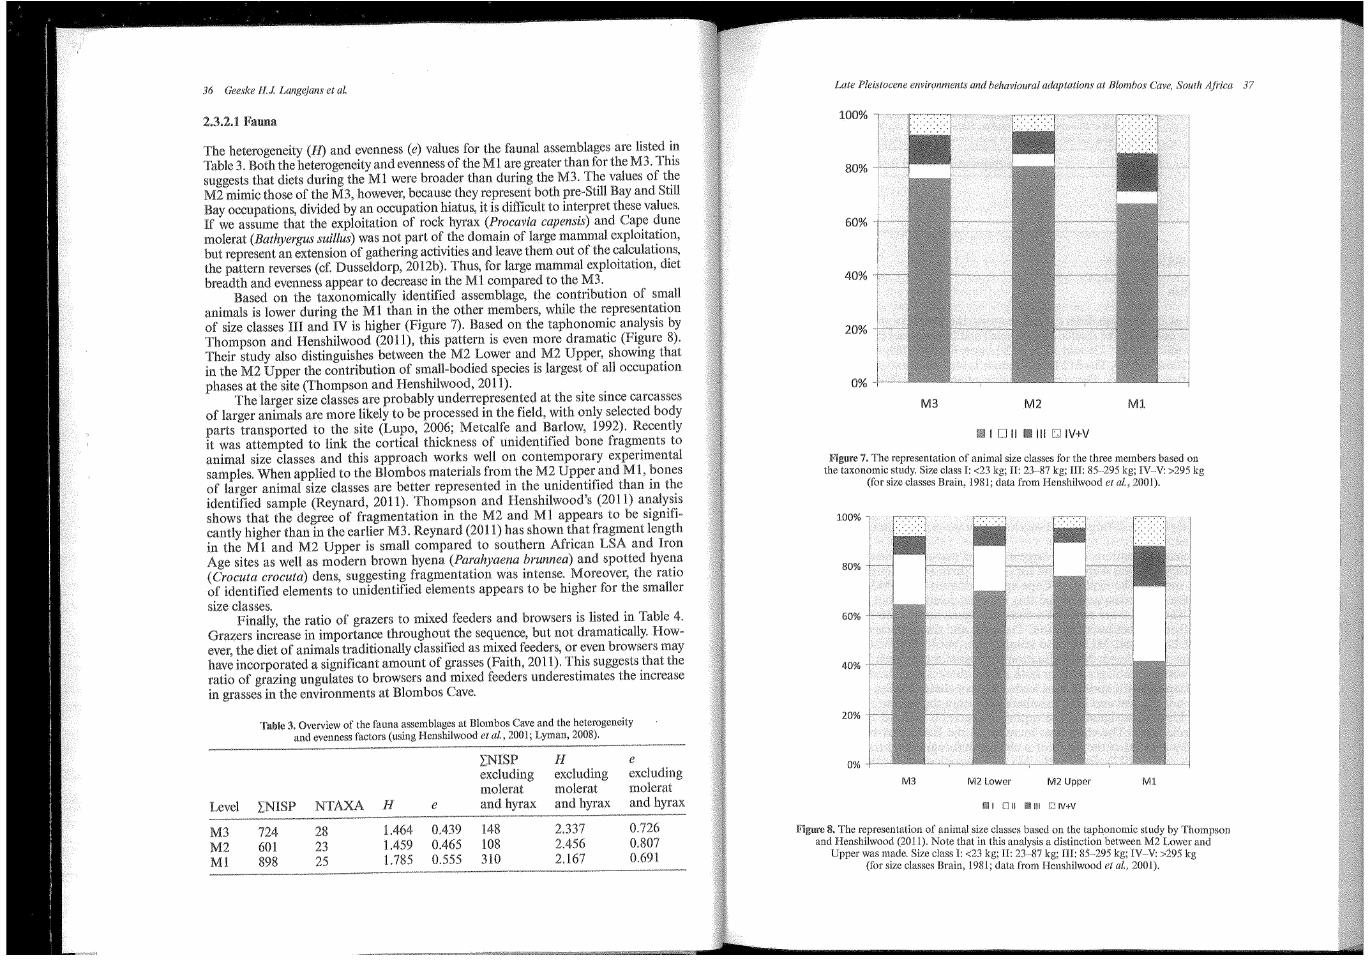
The heterogeneity (ll) and evenness (e) values for the faunal assemblages are listed in Table 3. Both the heterogeneity and evenness of the Ml are greater than for the M3. This suggests that diets during the Ml were broader than during the M3. The values of the M2 mimic those of the M3, however, because they represent both pre-Still Bay and Still Bay occupations, divided by an occupation hiatus, it is difficult to interpret these values. If we assume that the exploitation of rock hyrax (Procavia capensis) and Cape dune molerat (Bathyergus suillus) was not part of the domain of large :mammal exploitation, but represent an extension of gathering activities and leave them out of the calculations, the pattern reverses (cf. Dusseldorp, 2012b). Thus, for large :mammal exploitation, diet breadth and evenness appear to decrease in the Ml compared to the M3.
Based on the taxonomically identified assemblage, the contribution of small animals is lower during the Ml than in the other :members, while the representation of size classes III and IV is higher (Figure 7). Based on the taphonomic analysis by Thompson and Henshilwood (2011), this pattern is even :more dramatic (Figure 8). Their study also distinguishes between the M2 Lower and M2 Upper, showing that in the M2 Upper the contribution of small-bodied species is largest of all occupation phases at the site (Thompson and Henshilwood, 2011).
The larger size classes are probably underrepresented at the site since carcasses of larger animals are more likely to be processed in the field, with only selected body parts transported to the site (Lupo, 2006; Metcalfe and Barlow, 1992). Recently it was attempted to link the cortical thickness of unidentified bone fragments to animal size classes and this approach works well on contemporary experimental samples. When applied to the Blombos :materials from the M2 Upper and Ml, bones of larger animal size classes are better represented in the unidentified than in the identified sample (Reynard, 2011). Thompson and Henshilwood's (2011) analysis shows that the degree of fragmentation in the M2 and Ml appears to be significantly higher than in the earlier M3. Reynard (2011) has shown that fragment length in the Ml and M2 Upper is small compared to southern African LSA and Iron Age sites as well as :modern brown hyena (Parahyaena brunnea) and spotted hyena ( Crocuta crocuta) dens, suggesting fragmentation was intense. Moreover, the ratio of identified elements to unidentified elements appears to be higher for the smaller size classes.
Finally, the ratio of grazers to :mixed feeders and browsers is listed in Table 4. Grazers increase in importance throughout the sequence, but not dramatically. However, the diet of animals traditionally classified as mixed feeders, or even browsers :may have incorporated a significant amount of grasses (Faith, 2011). This suggests that the ratio of grazing ungulates to browsers and :mixed feeders underestimates the increase in grasses in the environments at Blo:mbos Cave.
Table 3. Overview of the fauna assemblages at Blombos Cave and the heterogeneity and evenness factors (using Henshilwood et al., 2001; Lyman, 2008).
2:NISP H e excluding excluding excluding molerat molerat molerat
Level NTAXA H e and hyrax and hyrax and hyrax
M3 724 28 1.464 0.439 148 2.337 0.726
M2 601 23 1.459 0.465 108 2.456 0.807
Ml 898 25 1.785 0.555 310 2.167 0.691
Late Pleistocene environments and behavioural adaptations at Blomhos Cave, South Afi'ica 37
100%
80%
60%
40%
20%
0%
M3 M2 Ml
I []II • Ill IV+V
Figure 7. The representation of animal size classes for the three members based on the taxonomic ~tudy. Size cla~s I: <23 kg; II: 23~·87 kg; III: 85~·295 kg; IV-V: >295 kg
(for s1ze classes Bram, 1981; data from Henshilwood et al., 2001).
100%
80%
60%
40%
20%
0%
M3 M2 Lower M2 Upper Ml.
I llll Ill IV+V
8. The r~presentation of animal size classes based on the taphonomic study by Thompson and Hcnsh!lwood (2011). Note that in this analysis a distinction between M2 Lower and
Upper was made. Size class I: <23 kg; II: 23·-87 kg; III: 85-295 kg; IV~V: >295 (for size classes Brain, 1981; data from Henshilwood et al., 2001).
38 Oeeske H.J. Langqjans et al.
Table 4. Ratio of grazers to browsers and mixed feeders for the bovid assemblages at B!ombos Cave (based on Henshilwood et al., 2001);
a high value implies more grazers than browsers/mixed feeders.
Level
M3 M2 Ml
Grazers/(browsers +mixed feeders)
0.13 0.16 0.17
2.4 DISCUSSION
2.4.1 "''"'""'"'
The 1MNI of the shellfish differs greatly between the members and this has repercussiom; for the quality of the results. For the small and large species respectively th~ numbers are as follows: M3: 726 and 3571, M2 Lower: 61 and 1769, M2 Upper: 138 and 3200, Ml: 206 and 5044. The M2 Lower sample is very small and therefore less reliable than the other members. The characterisation of incidental shellfish species in ures 4 and 5 demonstrates that during the M3 at Blombos, Sea Surface Temperatures were somewhat lower than the present day. Of all the locations of which current situation is represented in Figure 4, the classification of the M3 is most similar to Cape Agulhas, the coolest part of the Algoa province. Due to its small sample siz~ w~ wi~l not attempt to interpret the M2 Lower assemblage. The M2 Upper charactensat10n1s similar to the Ml and both members fall in the modem Algoa range. The M2 Upper may have been cooler as there is a small cold water signal and the Ml contains a fai~t tropical signal. Interestingly, the Cape specific species are much better represented m the M2 Upper and Ml compared to the M3 (and M2 Lower). It appears.th~t the Sea Surface Temperature during the M3 was lowest; however, all phases fall w1thm present
Algoa values. The characterisations of the large exploited marine molluscs present a partly
different story (Figures 4 and 6), but for the M3 ther~ are similarities w~th the Sf!lall incidental species. The exploited Cape species dommate the M3 and m combma· tion with the West coast/cold signal this indicates relatively cool Sea Surface Temperatures. The M2 Lower provides a complex signal, and due to the sample.siz~ we exclude it from further interpretation. The large and small species charactensatwns of the M2 Upper and Ml are also c?mparabl~, but in Figure 4 these phases ~re most similar to the warm Natal situatwn. In F1gure 6 the warm East coast spec1es dominate both assemblages and for both phases there is a relatively high percentage of cooler Cape specific species; this leads us to conclude that Sea Surface Temperatures were not tropical and both members fall within the current Algoa range. Also, the warm East coast signal of the exploited species is inflated because it consists of one species only. The enormous increase o~' the E~st coast brown mussel ?uring the M2 s and M 1 is the result of a change 111 foragmg and transport b~havwur (Langejans et al., 2012). During the Ml, the shoreline was further ~way from the cave (Figure 3), leading people at Blombos to select and preferentmlly transport brown mussel over other species because they are easy to transport and because they preserve well (Langejans et a!., 2012). Due to changes in foraging behavi~ur the interpretation of the large species is more complex than for the small species. However, the assemblage composition of the larger molluscs does support our contention that Sea Surface Temperatures during the M3 were lower than during the
M2 Upper and the M 1.
Late Pleistocene environments and behavioural adaptations at Blombos Cave, South Afi'ica 39
The dataset of the small species is limited and hopefully it will be increased in the future. using different ways to characterise the assemblage confirms trends. The M3 was comparable to the present situation at thus somewhat cooler than the current situation at Blombos The M2 com-parable to current Blombos Sea Surface Temperatures; the Ml might have featured slightly higher temperatures.
Climate reconstructions for the Late Pleistocene are complex and at times contradictory. Also, traits, such as 'cold', 'warm', 'wet', 'dry', cannot changes in the bio-productivity of the landscape on their own.
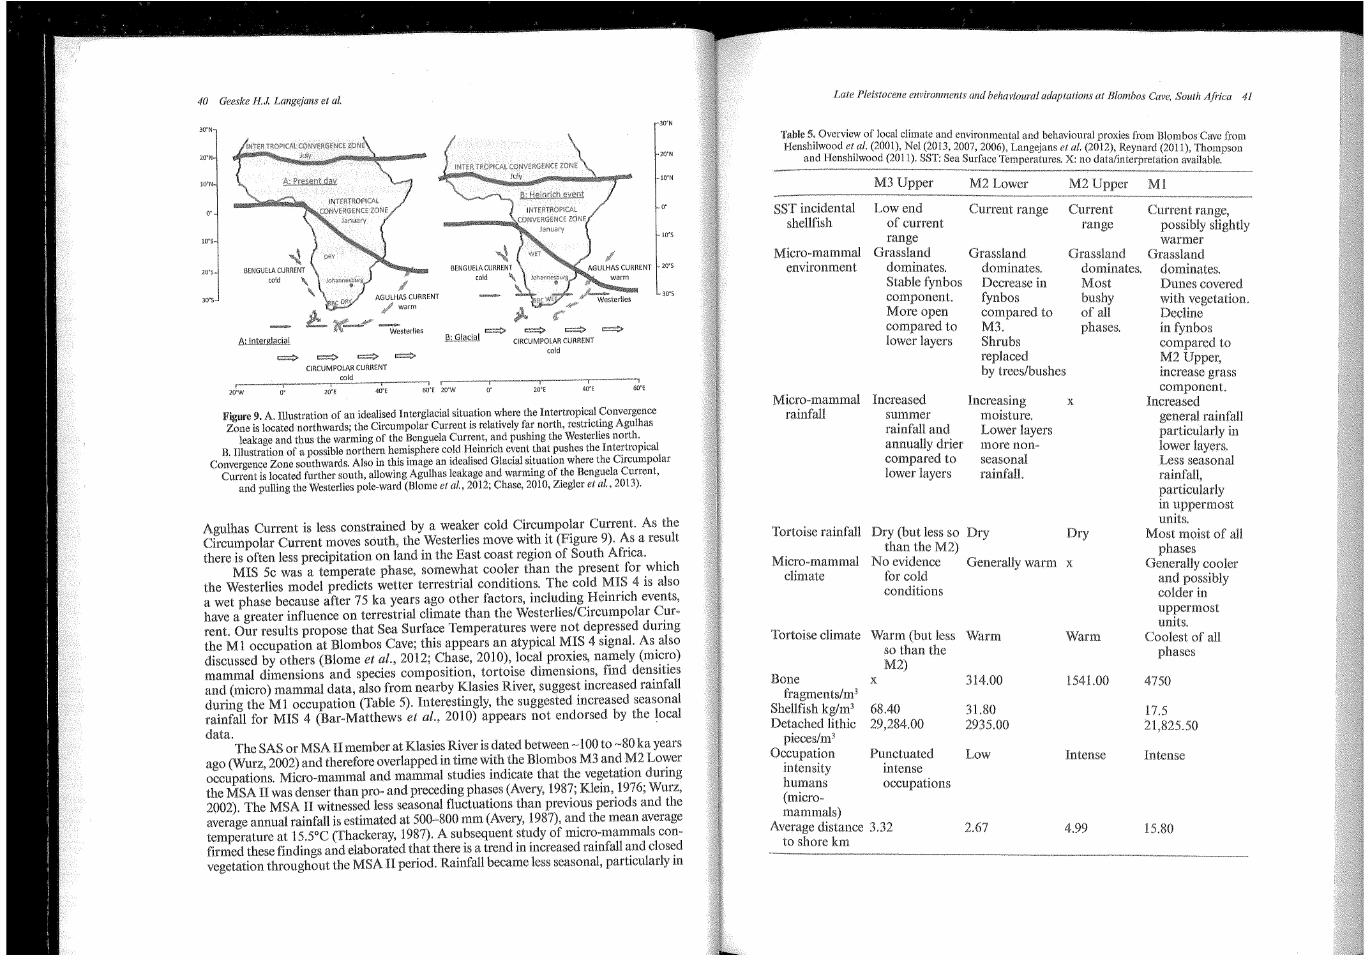
Correlating the beginning of the Still Bay to global curves based on oxygen isotope ratios in polar ice cores is complex as the dating of Still Bay rpn1>Jn·1~ debated (compare Guerin et al., 2013; Jacobs eta!., 2013, 2008b; Tribolo et at., 2006). Some models, relying on oxygen isotope data, propose that the Still Bay aulu~;a.t~;u a cold andarid phase, when the landscape was open (Ambrose and Lorenz, Deacon, 1989; McCall, 2007). During these conditions humans were required to innovate resulting in the Still Bay Industry (Ambrose and Lorenz, 1990; McCall, 2007). More ;ecently, models relying on the interaction of the Circumpolar Current and Westerlies (winds) suggest that MIS 4 was a cool and humid phase (Blome et at., 20 12; Chase, 201 0). With higher precipitation, vegetation bioproductivity would increase and edible biomass would be more abundant coml?are~ to the situation envisaged by previous models. It appears that the cold/we~ model f1ts w1th, although sparse, local data, such as (micro) fauna analysis. However, alter 75 ka, local data no longer support this model (which indicate warm/wet instead of modelled warm/dry); due to less insolation variability in the Intertropical Zone (Ziegler et al., 2013), and local Sea ""·-•n.M tures, ocean evaporation and water vapour transport to land et al., 2012) become more important climatic drivers than the Westerlies. Punctuated northern he1m1~;pbere cold Heinrich events may have pushed the Intertropical Convergenc,e Zone southwards le~ding to increased. rainfall in southern Africa (Figure 9). Recently the appearance of th~ Still Bay has been lmked such a wet event (Ziegler et at., 2013). Of to the dating of the Still Bay Industry may greatly atiect proposed between global climate and the appearance of the Still Bay Industry.
.'~'hile Blo.me et a_l. (2012), Ziegler et al. (2013) and Chase (2010) argue for hum1d1ty assoc1ated w1th MIS 4 and the onset of the Still Bar-Matthews et al. col-leagues (20 1 0) use speleothem isotope data to argue that the period not have characterised by an increase in overall humidity, but by changing seasonality of the fall pattern. They propose that the cooling associated with MIS 4 resulted in summer rainfall, instead of all-year or predominantly winter rainfall. would lead to an increased importance of C4 grasses and a concomitant increase in It may be that, if terrestrial temperatures cooled, in addition to rainfall, a decrease in the amount of evaporation resulted in
Our observations imply that during the M2 Upper and Ml oc,:u"(.J,ations ~urface Temperatures were comparable to present day values. Dur-. mg the M3 Sea Surface Temperatures at Blombos Cave were somewhat lower than at present, but fit within the general Algoa range. High Sea Surface mean that the Circumpolar Current was positioned more towards Antarctica compared to times of lower Sea Surface Temperatures. Because its position was more southerly, there was more space for Agulhas leakage; this is warm water that 'leaks' from the Algulhas Current to the cold Benguela Current. ln other words, leakage occurs when the warm
40 Geeske H.J. Langejans et al.
-30'N 30'N
20"N~
!O'N
o·
!O'S
20'S~
30'S··
i).;_G!.\l_Q.<ll o:::::::::> o:::::::::> CIRCUMPOLAR CURRENT
cold
o· lO'E GO'E
l<'igure 9. A. Illustration of an idealised Interglacial situation where the Intertropical Convergence Zone is located northwards; the Circumpolar Current is relatively far north, restricting Agulhas
leakage and thus the warming of the Benguela Current, and pushing the Westerlies north. B. Illustration of a possible northern hemisphere cold Heinrich event that pushes the Intertropical
Convergence Zone southwards. Also in this image an idealised Glacial situation where the Circumpolar Current is located further south, allowing Agulhas leakage and warming of the Benguela Current,
and pulling the Westerlies pole-ward (Blome et al., 2012; Chase, 2010, Ziegler et al., 2013).
Agulhas Current is less constrained by a weaker cold Circumpolar Current. As the Circumpolar Current moves south, the Westerlies move with it (Figure 9). As a result there is often less precipitation on land in the East coast region of South Africa.
MIS Sc was a temperate phase, somewhat cooler than the present for which the Westerlies model predicts wetter terrestrial conditions. The cold MIS 4 is also a wet phase because after 75 ka years ago other factors, including Heinrich events, have a greater influence on terrestrial climate than the Westerlies/Circumpolar Current. Our results propose that Sea Surface Temperatures were not depressed during the Ml occupation at Blombos Cave; this appears an atypical MIS 4 signaL As also discussed by others (Blome eta!., 2012; Chase, 2010), local proxies, namely (micro) mammal dimensions and species composition, tortoise dimensions, find densities and (micro) mammal data, also from nearby Klasies River, suggest increased rainfall during the Ml occupation (Table 5). Interestingly, the suggested increased seasonal rainfall for MIS 4 (Bar-Matthews et al., 2010) appears not endorsed the loeal data.
The SAS or MSA II member at Klasies River is dated between ·-1 00 to ~80 ka years ago (Wurz, 2002) and therefore overlapped in time with the Blombos M3 and M2 Lower occupations. Micro-mammal and mammal studies indicate that the vegetation during the MSA II was denser than pro- and preceding phases (Avery, 1987; Klein, 1976; Wurz, 2002). The MSA II witnessed less seasonal fluctuations than previous periods and the average annual rainfall is estimated at 500-800 mm (Avery, 1987), and the mean average temperature at 15.SOC (fhackeray, 1987). A subsequent study of micro-mammals confirmed these findings and elaborated that there is a trend in increased rainfall and closed vegetation throughout the MSA II period. Rainfall became less seasonal, particularly in
Late Pleistocene environrnents and behavioural adaptations at JJlombos Cave, South Afi'ica 41
Table 5: Overvi:w of local climate and environmental and behavioural proxies from B!ornbos Cave from Hensh!lwood et al. (2001), Nel (2013, 2007, 2006), Langejans eta!. (2012) Reynard (2011) Th .
and Henshilwood (2011). SST: Sea Surface Temperatures. X: no dataiinterpretation a~aila~:~.pson
M3 Upper M2Lower M2
SST incidental Low end Current range Current shellfish of current range
range Micro-mammal Grassland Grassland Grassland
environment dominates. dominates. Stable fynbos Decrease in Most component. fynbos bushy More open compared to of all compared to M3. phases. lower layers Shrubs
replaced by trees/bushes
Micro-mammal rainfall
Tortoise rainfall
Increased summer rainfall and annually drier compared to lower layers
Dry (but less so than the M2)
Increasing X
moisture. Lower layers more non-seasonal rainfall.
Micro-mammal climate
No evidence Generally warm x for cold conditions
Tortoise climate Warm (but less Warm so than the M2)
Bone X
fragments/m3
Shellfish kg/m3 68.40 Detached lithic 29,284.00
pieces/m3
Occupation intensity humans (micromammals)
Punctuated intense occupations
Average distance 3.32 to shore km
314.00
31.80 2935.00
Low
2.67
Warm
1541.00
Intense
4.99
Ml
Current range, possibly slightly warmer
Grassland
Dunes covered with vegetation.
in fynbos compared to M2 Upper, increase grass component.
Increased rainfall
particularly in lower Less seasonal rainfall, particularly in
Most moist of all phases
cooler
in uppermost units.
Coolest of all phases
4750
17.5
Intense
15.80

42 Oeeske !1.1 Lange,jans et al.
later stages of the MSA this would have been contemporaneous with the M2 Lower (Nel, 2013). It is, however, unclear if the vegetation consisted of afromontane forest or fynbos as both do well in non-seasonal rainfall regimes (Nel, 2013).
Our analysis suggests that Sea Surface Temperatures fell within current v~lues and imply that the differences between phases were not vast. The Blomb~s mtcro·· mammal signal is also consistent over time and changes in climate and envmmment were subtle; grassland dominates the vegetation throughout the. sequence, followed by trees/bushes (Nel, 2013). Only during the deposition of the M3 were Sea Surface Temperatures on the low end of the current range. The environment. during the M3 contained a stable fynbos component and was open. There was less ramfall compared to the preceding M3 Lower layers (>100 ka), but summer rainfall increased. The temperature was relatively high and there are no indications for a cold environment. The site was intensely, but intermittently occupied. . .
Although the signal is complex, the Sea Surface Temperatures dunng the M2 appear to fall within the current range. There is less fynbos compared t? the IYI3 and shrubs are replaced by trees and bushes. Annual temperatures were rela~1Vely htgh and the M2 Lower appears to have been a wet phase w1th less seasonal ~am~all than the M3. The tortoise data indicate dry circumstances for the M2, but comndenng the other proxies also from Klasies River it is unclear how this should be interpreted. During the M2 Lower the occupation density of the site was low. Sea Surface Temperatures during the M2 Upper were again comparable to present day values. There ~as open bu~hy grassland with relatively high annual temperatures and rainfall. The s1te occupatwn was medium to intense.
It is possible that the M 1 Sea Surface Temperatures were slightly higher than today, but they at least ranged within current values. It is likely that further from the cave the landscape was more open, with an increasing grass component. There was a decline in fynbos, and around the cave the vegetation became dense on nearby sand dunes. Dunes generally stabilise when there is enough precipitation to grow vegetation; however, they also stabilise when there is little sediment available when the dunes are close to the shore (Bateman et al., 2011; Carr et al., 2007, 2006). The latter does not concur with the distances to the sea shore as presented in Figure 3, but the first appears plausible. This phase received the highest annual rainfall of all phases. The micro-mammals indicate more non-seasonal rainfall, contradicting other interpretations (Bar-Matthews et al., 2010). Although still warm, the Still Bay ~1 was also the coolest of all members and its very last stages were cooler than the earhest ones (Nell, 2013). site was occupied intensely during this time.
It is complex to interpret the entirety of local data and place them in global and regional climatic models. The local data ~u~ge~ts that Sea Surface Temperatures, !he annual terrestrial temperatures and prec1p1tatlon were never extremely low or h1gh during the occupation phases; moreover, they may well fall within current ranges. Like the terrestrial signal and quite unpredicted, the reconstructed Sea Surface Tempera-tures for the Ml do not follow global MIS 4 climate trends. .
The obvious question arises what exactly is meant by "cool/warm" and "wet/ dry". Presently, at nearby Still Bay the mean annual precipitation is 419 mm and ~he mean annual temperature range is 15~·21 oc, and Blombos Cave lies in the all-year ramfall zone (Department of Environmental Affairs and Tourism, 2000; Weather Reports. com). The current precipitation is less than the reconstructed 500--800 mm for the MSA II at Klasies River (Avery, 1987); the current temperature range may be higher than the reconstructed mean average of 15.5"C for the MSA II ('Ihackeray, 1987). In addition today's vegetation is characterised as De Hoop li~esto~e fyt~bos, here the grass-comp~nent is largely absent. Although, currently the dnest of the limestone fynbos types, tlus area may have held other limestone fynbos or renosteveld communities (Rebelo eta!.,
Late Pleistocene environments and behavioural adaptations at Blombos Cc1ve, South Aji·ica 43
2011). On the whole, it appears that, from a hunter-gatherer perspective, the Pleistor,ene environment was more productive than during the Holocene (Faith, 2011).
The MSA II at Klasies River and therefore M3 and M2 Lower were wetter and cooler than today and for precipitation this was so. Mean-ing that the M2 Lower was wetter than the M3; Table 5 this. non-seasonal rainfall it is likely that the resource depleted fynbos component was not dominant; the micro-mammals and mammals confirm a major · for all Blombos phases. As most proxy values are compared to this implies that.final M I was probably much cooler and wetter than the """'"'"' 1
·
Mammalli'auna
The heterogeneity and evenness indices of the faunal assemblages that animal exploitation during the M 1 was less focussed than during the M3 phase. However, if we exclude Cape dune molerat and rock hyrax calculations, it appears that large mammal exploitation was more focussed compared to the M3 (Dusseldorp, 2012b). The importance of large-bodied animals is highest in the Ml. This is interesting in view of the relationship between body size and population density. During the M 1, exploitation of large-bodied animals, living in lower population densities than smaller-bodied animals, not only increases, but becomes more focused. This suggests that the encounter rates with high-ranked prey herbivore population sizes were probably higher than in previous phases.
Moreover, grazers appear to be slightly more important in the Ml than the M3. The increased presence of grazers has been used to suggest that the during .the occupation of the Ml was characterised by wetter conditions than the pre~ cedmg phases and than currently (Henshilwood et a!., 2001 ); this increase '"'"""'"''""" inferences from the other local proxies.
The relative importance of molerat and rock hyrax in the faunal decreased in the Ml (Henshilwood eta!., 2001). The amount of volume of excavated sediment also decreased. The in the importance shellfish is related to lower sea levels and hence an increased transport distance from the seashore to the site (Henshilwood et at., 2001; Langejans et al., 2012). This that the role of the site in the subsistence and mobility strategies of its occupants changed. the increased importance of large animal exploitation may reflect a changing of the site, or changing seasonality of the site's occupation. A in function to a site more specifically geared to large mammal hunting may also have to a de?rease in the repr~sentation of molerat and rock hyrax. The importance of Still Bay pomt manufacture 111 the Ml compared to the M2 Upper (Villa eta!., 2009) probably supports a change in function.
The connection between exploited fauna and environment is not straightforward, as the faunal representation not only tracks changes in availability due to mental changes, but is also influenced by human preference and vll<<H!')IU!') '"""uuv•v
However, even if changes in the representation of resources may be by changing site function, we argue that some general conclusions can be from the faunal data. The increased importance of large-· bodied animals in the M 1 is a notable change and combined with the decreased heterogeneity and evenness tor tht) assemblages (excluding molerat and rock hyrax) this suggests that prey availability and/or hunting success rate increased substantially.
During the Ml resources were neither scarce nor unpredictable as some (Ambrose and 1990; McCall, 2007). A recent explanation for ance of the Still Industry is that the period was characterised
44 Geeske H.J. Langejans et al.
productivity, to which groups responded by adopting a larger focus on large mammal hunting with frequent residential moves (McCall and Thomas, 2012). The bifacial toolkit, with Still Bay points functioning as reliable weapons, is consistent with this hypothesis. However, the Ml level represents the remains of high-intensity occupations by larger groups, and shows that resources, such as shellfish, were transported to the site over considerable distances. This contradicts the proposed frequent residential moves. Instead the site may have functioned as a central place occupied in a system geared to logistical mobility, with expeditions bringing resources (e.g., shellfish) from disparate locations to the site.
Unfortunately, the data from the M2 phase are difficult to evaluate. During the pre-Still Bay M2 Lower, large-bodied animals were less important than during the preceding M3. Their importance was lowest in the earliest M2 Upper Still Bay occupation (Thompson and Henshilwood, 2011). However, both M2 phases are characterised by small sample sizes. Since taxonomically identif1ed specimens were published for the complete M2 and not the M2 Lower and Upper separately, we cannot evaluate how the heterogeneity and evenness developed for these phases. Including rock hyrax and molerat, the indices from the M2 show an evenness and heterogeneity similar to that of the M3. Excluding these small mammals, the evenness and heterogeneity are higher than both the Ml and M3. This suggests that large mammal exploitation may have been less successf\1l during the M2 than during both preceding and subsequent phases.
Thus, the Still Bay appeared during a phase with the lowest representation of large-bodied animals. It may be that environmental circumstances precipitated a decrease in herbivore biomass during M2 Upper times. The decreasing prey availability may then have given rise to specialised hunting weapons (Still Bay points), in order to maximise hunting success. This explanation foregrounds environmental change in the origin of the Still Bay. However, the shellfish and micro-mammal data do not support it and other explanations for the changes in the composition of faunal assemblages cannot be excluded. The importance of Still Bay points is lower during the M2 (N = 6) than during the Ml (N = 269) (Henshilwood, 2008a). The relative importance of bone points to the bifadal Still Bay points shows that bone points are more important in the M2 (21 vs. 6 repectively) than in the Ml (32 vs. 269 repectively) (Henshilwood 2008a, 2008b ). This suggests that the relative importance of different hunting weapons used by the site's occupants shifted to the use of Still Bay points in the Ml, while bone points appear to have been the weapon of choice in the M2. Similarly, other hallmarks of the Still Bay archaeological record, such as beads, are present in much lower quantities in the M2 (N = 10) compared to the Ml (N = 107) (d'Errico et al., 2005; Henshilwood, 2008a). This suggests that increased emphasis on social networks to buffer risks of resource scarcity (cf. McCall and Thomas, 2012) does not fully explain their role in the Still Bay archaeological record.
2.5
The data on Blombos Cave reviewed here highlight that many environmental and behavioural proxies do not yield corresponding results. What is more, the local prox-
do not match with all current climate models. We suggest that, on the basis of the available evidence, it is not possible to correlate the advent of behavioural changes to uniform climate and environmental changes. Moreover, some of the differences between the results from local proxies suggest that the relationship between global environmental change and local changes in Sea Surface Temperatures, terrestrial temperature and precipitation may not be as straightforward as often assumed.
Late Pleistocene environments and behavioural adaptations at Blombos Cave, ,S'outh Aji·ica 45
The composition of the incidental shellfish assemblages suggests that Sea Surface Temperatures during the M3 were lower than during the M2 Upper and Ml. Since no definitive consensus has been reached on the dating of the Still Bay Industry, we cannot correlate the M 1 wit~ certainty to either MIS 5a or MIS 4. most recently published dates suggest the Stlll Bay must be dated to early MIS 4 (Jacobs et at., 2013). Never-theless, the higher Sea Surface Temperature as indicated by the might a MIS 5a date. An earlier date for the M 1 would flt the reconstruction nw"'"'·""'n Blome et al. (2012, Figure 14) or Ziegler et al. (2013), where Sur-face Temperatures co-occur with wetter terrestrial conditions. In addition, the dune vegetation in the Ml may be the result of increased precipitation, but if the Ml is older, the sea may also have been closer. The decrease in sediment availability in nation with increased non-seasonal rainfall would consolidate movement and allow vegetation growth ( cf. Carr et al., 2006). Since changes in local sea currents need not be exactly correlated to the dating of global climatic in polar cores a date in early MIS 4 remains a possibility. However, a later date (associated with a cool MIS 4 signal) as suggested by Guerin et al. (2013) seems unlikely at this
The mammal assemblages suggest that the terrestrial M 1 was more productive than during the pre-Still Bay M3. It certainly was not d~ctive. On the whole th~ Blombos phases are relatively similar and considering ramfall may ~ave been htgher than today, ~he associated environments was probably more productive than today. Based on the mwro-mammals, only the very of theM 1 presents a different environmental scenario (Nel, 2013). The increased importance of small bodied prey during the M2 Upper suggests that encounter rates with large prey were depressed. However, it is unlikely that this is the result of herbivore biomass, as the cl.imate ~roxies do not indicate decreased productivity. Rather, a change 111 huntmg strategy may have been the result of changing oc<:upation seasons or a change in site function. The possible hiatus the M2 Lower and
complicate the exact circumstances triggering the origins of Still tech-nocomplex. Although we cannot conclusively prove that the Still n?t a response to low resource abundance, its greatest flowering during the h1ghest apparent resource abundance at Blombos suggests that alternative may be more probable.
This researchwas sponsored by the National Research (South and by The Netherlands Organisation for Scientific Research with a Veni Netherlands). We want to thank Richard Kilburn (Kwa-Zulu-Natal Museum Africa),.Adam Yates (Museum and Art Gallery of the Northern Territory, A~stralia) and J?a~.Her~e~t q(wa-Zulu··Natal Museum, South Africa) for their help with the shellf1sh 1dent1f1catwn. We also thank the Iziko Museum 1bwn (South Africa) for access to the material and our for their useful comments.
Ambrose, S.H. and 1990, Social and ecological models for Stone in southern In The Emergence of Modern Humans: An Archaeo·· logical Perspective, edited by Mellm·s, P. (Edinburgh: University pp.
46 Geeske ll.J. Langejans eta/.
Appeltans, W., Bouchet, Boxshall, De Broyer, De Voogd, N.J., Gordon, Hoeksema, B.W., Horton, Kennedy, M., Read, G., Stohr, S., Walter, T.C. and Costello, M.J., 2012, World Register of Marine Species, http://www.marinespecies.org, access date: 4-7-2011.
Avery, D.M., 1987, Late Pleistocene coastal environment of the Southern Cape Prov·· ince of South Africa: Micromammals from klasies river mouth. Journal of Archaeo-logical Science, pp. 405-A21.
Bar-Matthews, M., Marean, C.W.,Jacobs, Karkanas, Fisher, Brown, K., Williams, H.M., Bernatchez, J., Ayalon, A. and Nilssen, 2010, A high resolution and continuous isotopic speleothem record of paleoclimate and paleoenvironment from 90 to 53 ka from Pinnacle Point on the South coast of South Africa. Quaternary Science Reviews, 29, pp. 2131-2145.
Bateman, M.D., Carr, A.S., Dunajko, A. C., Holmes, P.J., Roberts, McLaren, S.J., Bryant, Marker, M.E. and Murray-":'allace, C.V., ~011, The .evolution of coastal barrier systems: A case study of the Mtddle-Late Pletstocene Wllderness bar-riers, South Africa. Quaternary Science Reviews, 30, pp. 63-81. . .
Bigalke, 1973, The exploitation of shellflsh by coastal tribesmen of the Transke1. Annals of the Cape Provincial Museums (Natur~l Hist(~ry ), 9, pp. 159·-175.
Birch, G.F., 1980, Nearshore Quaternary sed1mentat10n of the South coast of South Africa (Cape Town to Port Elizabeth). Bulletin of the Geological Survey of South Africa, 67, p. 20.
Birch, 1978, The bathymetry and geomorphology of the inner shelf between Cape Seal and Cape Recife. Joint Geological Survey/University of Cape Town Technical Report, U, pp. 118--121.
Blome, M.W., Cohen, A.S., Tryon, C.A., Brooks, A.S. and Russell, J., 2012, The environmental context for the origins of modern human diversity: A synthesis of regional variability in African climate 150,000--30,000 years ago. Journal of Human Evolution, 62, pp. 563-592.
Brain, C.K., 1981, The Hunters or the Hunted? An Introduction to African Cave Taphonomy, (Chicago: University of Chicago Press).
Buchanan, W.F., 1988, Shellfish in Prehistoric Diet, (Oxford: Archeopress). Carr, A.S., Bateman, M.D. and Holmes, P.J., 2007, Developing a 150 ka luminescence
chronology for the barrier dunes of the southern Cape, South Africa. Quaternary Geochronology, 2, pp. 110-116.
Carr, A.S., Thomas, D.S.G. and Bateman, M.D., 2006, Climatic and sea level controls ·on Late Quaternary eolian activity on the Agulhas Plain, South Africa. Quaternary Research, 65, pp. 252-263.
Chase, B.M., 2010, South African palaeoenvironments during marine Oxygen Isotope Stage 4: A context for the Howiesons Poort and Still Bay industries. Journal of Archaeological Science, 37, pp. 1359-1366.
Chase, B.M., Meadows and M.E., 2007, Late Quaternary dynamics of southern Africa's winter rainfall zone. Earth-Science Reviews, pp.103--138.
Claasen 1998, Shells, (Cambridge: Cambridge University Press). . Clark, /L., 2011, The evolution of human culture during the later Pleistocene: Using
fauna to test models on the emergence and nature of "modern" human behavior. Journal of Anthropological Archaeology, 30, pp. 273-291.
Compton, J.S., 2011, Pleistocene sea-level fluctuations and human evolution on the southern coastal plain of South Africa. Quaternary Science Reviews, 30, pp. 506-527. . . . . . .
Cruz-Uribe, K., 1988, The use and meanmg of spec1es d1vers1ty and nchness m archae-ological faunas. Journal of Archaeological Science, pp. 179--196.
Late Pleistocene environments and behavioural adaptations at Blombos Cave, South A.fl·ica 47
d'Errico, F., Henshilwood, C., Vanhaeren, M. and van kraussianus shell beads from Blombos Cave: Evidence for Middle Stone Age. Journal of Human Evolution,
Dansgaard, W., Johnsen, S.J., Clausen, Hammer, C.U., Hvidberg, C.S., Steffensen, Sveinbjornsdottir,
2005, Nassarius behaviour in the
and Bond, G., 1993, Evidence for general instability of past climate from a ice-core record. Nature, 364, pp. 218--220.
Deacon, 1989, Late Pleistocene palaeoecology and archaeology in the solltnern Cape, South Africa. In The Human Revolution. Behavioural and Biological Perspectives on the Origins o,[Modern Humans, edited by Mellars, P. and C. (Edinburgh: Edinburgh University Press), pp. 547-·.S64.
Dempster, Y and Branch, G.M., 1999, A review of the genus Burnupena Iredale, 1918 (Gastropoda: Buccinidae), with descriptions of two new Annals 4 the Natal Museum, 40, pp. 173-·204.
Department of Environmental Affairs and Tourism, University of Pretoria and GIS Business Solutions, 2000, Mean annual precipitation, Environmental Potential Atlas for the Western Cape.
Dusseldorp, 2012a, Studying prehistoric hunting proficiency: Applying v•"·""'" .. foraging theory to the Middle Palaeolithic and Middle Stone Age. Quaternary International, 252, pp. 3-15.
Dusseldorp, 2012b, the influence of technological on Middle Stone Age hunting strategies South Africa. Quaternary International, pp. 70·-79.
Dusseldorp, 2010, Avoiding dangerous pp. 107-133.
choice during the South African Middle Stone or maximising returns? African Archaeological Review,
Erlandson, J.M. and Moss, 2001, Shellfish feeders, carrion and the archaeology of aquatic adaptations. American Antiquity,
Faith, 2011, Ungulate community richness, grazer subsistence behavior in southern Africa's Cape Floral Palaeoclimatology, Palaeoecology, pp. 219-227.
Fisher, E.C., Bar-Matthews, M., Jerardino, A. and Marean, 2010, Middle and Late Pleistocene paleoscape modeling along the southern coast of South Quaternary Science Reviews, pp. 1382-1398.
Guerin, Murray, Jain, M., Thomsen, K.J. and "' ... ..,,...,._,,, confident are we in the chronology of the transition between Still Bay? Journal of Human Evolution.
2013, How Poort and
Hammond, W. and Griffiths, 2006, Biogeographical patterns in the fauna associ-ated with southern African mussel beds. African Zoology, pp. 123--130.
Henshilwood, 2008a, Winds of change: Palaeoenvironments, and human behaviour in the Late Pleistocene ( -77 ka-48 ka ago) in the Western Cape Province, South Africa. Goodwin Series, 10, pp. 35--51.
Henshilwood, 2008b, Holocene prehistory of the southern South Excavations at Blombos Cave and the Blombosfontein Nature (Oxford: Archaepress).
Henshilwood, C.S., 2012, Late Pleistocene techno-traditions in Southern A review of Still Bay and Howiesons Poort, c. 7S.--59 ka. Journal of World Prehistory pp. 205-237.
Henshilwood, C.S., d'Errico, F. and Watts, 2009, Engraved ochres from the Middle Stone Age levels at Blombos Cave, South Africa. Journal of Human Evolution, pp. 27-A7.
48 Geeske H.J. Langejans eta!.
Henshilwood, C.S., d'Errico, van Niekerk, K.L., Coquinot, Jacobs, Lauritzen, S.-E., Menu, M. and Garcia-Moreno, R., 2011, A 100,000-year-·old ochreprocessing workshop at Blombos Cave, South Africa. Science, 334, pp. 219--222.
Henshilwood, Sealy, J.C., Yates, Cruz-Uribe, Goldberg, P., Klein, Poggenpoel, van Niekerk, K. and Watts, 2001, Blombos Cave, southern Cape, South Africa: Preliminary report on tht~ 1992--1999 excavations of the Middle Stone Age levels. Journal of Archaeological Science, pp. 421-448.
Hydrographic Office and South African Navy, 2011, Tide Information, (http://www. sanho.co.za/tides/tide_index.htm, access date: 23-8-2011.
Jacobs, Z. and Roberts, 2008, Testing times: Old and new chronologies for the Howieson's Poort and Still Bay industries in environmental context. Goodwin Series, 10, pp. 9-34.
Jacobs, Z., Hayes, Roberts, Galbraith, R.F. and Henshilwood, C.S., 2013, An improved OSL chronology for the Still Bay layers at Blombos Cave, South Africa: further tests of single-grain dating procedures and a re-evaluation of the timing of the Still Bay Industry across southern Africa . .Journal of Archaeological Science, 40, pp. 579-594.
Jacobs, Roberts, Galbraith, Deacon, R., Mackay, A., Mitchell, Vogelsang, R. and Wadley, L., 2008a, Ages for the Middle Stone Age of southern Africa: Implications for human behavior and dispersal. Science, pp. 733--735.
Jacobs, Wintle, A.G., Duller, G.A. Roberts, R.G. and Wadley, L., 2008b, New ages for the post-Howiesons Poort, late and final Middle Stone Age at Sibudu, South Africa. Journal of Archaeological Science, pp. 1790--1807.
Jerardino, A., 1997, Changes in shellfish species composition and mean shell size from a Late-Holocene record of the West coast of southern Africa. Journal of Archaeological Science, 24, pp. 1031-1044.
Jones, 2004, Dietary evenness, prey choice, and human--environment interactions. Journal of Archaeological Science, 31, pp. 307--317.
Jouzel, Masson-Delmotte, V., Cattani, 0., Dreyfus, Falourd, Minster, Nouet, J., Barnola, J.M., Chappdlaz, J., Fischer, Johnsen, S., Leuenberger, M., Loulergue, Luethi, Oerter, Raisbeck, Raynaud, Schilt, A., Schwander, J., Selmo, Souchez, Spahni, R., Stauffer, Steffensen, J.P., Stenni, Stocker, Tison, Werner, M. and Wolff, E.W., 2007, Orbital and millennial Antarctic climate variability over the past 800,000 years. Science, 317, pp. 793-796.
Kensley, 1973, Sea Shells of Southern Africa. Gastropods, (Cape Town: Maskew Miller).
Kilburn, R. and Rippey, E., 1982, Sea Shells of Southern Africa, (Johannesburg: Macmillan South Africa).
Klein, 1976, The mammalian fauna of the Klasies River Mouth sites, southern Cape Province, South Africa. The South African Archaeological Bulletin, pp.75-98. .
Kyle, R., Pearson, Fielding, Robertson, W.D. and Birnie, S.L., 1997, Subsistence shellfish harvesting in the Maputaland Marine Reserve in northern KwaZulu-Natal, South Africa: Rocky shore organisms. Biological Conservation, pp. 183--192.
Langejans, G.H.J., van Niekerk, K.L., Dusseldorp, G.l,. and Thackeray, 2012, Middle Stone shellfish exploitation: Potential indications for mass collecting and resource intensification at Blombos Cave and Klasies River, South Africa. Quaternary International, 270, pp. 80--94.
Lombard, M., 2012, Thinking through the Middle Stone Age of sub-Saharan Africa. Quaternary International, 270, pp. 140--155.
Late Pleistocene environments and behavioural adaptations at Blombos Cave, South Africa 49
Lupo, 2006, What explains the carcass field processing and of contemporary hunter-gatherers? Measures of economic and zooarchaeo·· logical skeletal part representation. Journal r~f Archaeological Method and Theory, 13, 19-66.
Lupo, and Schmitt, 2005, Small prey hunting technology and zooar-chaeological measures of taxonomic diversity and abundance: Ethnoarchaeo" logical evidence from Central African forest fbragers. Journal of Anthropological Archaeology, 24, pp. 335-353.
Lyman, R.L., 2008, Quantitative Paleozoology, (Cambridge: Press).
Marean, C.W., 2010, Pinnacle Point Cave 13B (Western in context: The Cape Floral kingdom, shellfish, and modern of Human Evolution, 425--443.
Marean, C.W., Abe, Y, C.J. and Randall, 2000, taphonomic analysis of the Kelders Cave I Layers 10 and J 1 Middle larger mammal f~mna. Journal of Human Evolution, pp.
Martinson, Pisias, N.G., Hays, Imbrie, Moore T.C. and N.J., 1987, Age dating and the orbital theory of the ice ages: of a high-resolution 0 to 300,000-year chronostratigraphy. Quaternary Research, pp. 1---29.
McCall, G.S., 2007, Behavioral ecological models of lithic technological change the later Middle Stone Age of South Africa . .Journal of Archaeological Science, pp. 1738-1751.
McCall, G. and Thomas, J., 2012, Still Bay andHowiesons Poort research and models of culture change. African Archaeological Review,
Metcalfe, D. and Barlow, 1992, A model for exploring the between field processing and transport. American Anthropologist, pp.
Nagaoka, 2002, effects of resource depression on foraging efficiency, diet breadth, and patch use in southern New Zealand. Journal (~l Anthropological Archaeology, 21, pp. 419-442.
Natal Museum----Mollusc Collection, 2007, Biodiversity Occurrence Data ( AfrOBIS), accessed through GBIF data portal, http://data.gbif.org/datasets/resource/401, access date: 5-7-2011.
Neeley, M.P. and Clark, 1993, The human food niche in the Levant over the 150,000 Years. Archeological Papers of the American Anthropological n'""''Au' 4, pp. 221--240.
Nel, TH., 2006, Palaeoenvironmental reconstruction based on jc1unal analysis: A case study of the Middle Stone Age levels at Blombos Cave, South Africa, MA (Bergen: University of Bergen).
Nel, T.H., 2007, Middle Stone Age palaeoenvironments: A study of faunal material from Blombos southern Cape, South Nyame pp. 52--61.
Nel, 2013, Micromammals; climate change and human behaviour in the Middle Stone Age, southern Cape, South Africa. Examining the possible links between palaeoenvironments and the cognitive evolution of Homo sapiens, PhD University of Bergen).
NOAA, 2013, Monthly Mean SST Charts (1984-1998), (http://www.ospo.noaa.gov/ Products/ocean/sst/monthly_mean.html, access date: 12-3-2013.
Jouzel, J., Raynaud, Barkov, Barnola, J.M., Chappellaz, J., Davis, M., Delaygue, Delrnotte, M., M., Lipenkov, Lorius, Pepin, Saltzman, 1999, Climate and atmospheric history of the past 420,000 years from the Vostok ice core, Antarctica. Nature, 399, pp. 429-436.
50 Geeske H.J. Langejans et al.
Plug, C. and Plug, I., 1990, MNI counts as estimates of species abundance. The South African Archaeological Bulletin, pp. 53--57.
Rebelo, Boucher, C., N., Mucina, L. and Rutherford, M.C., 2011. Fynbos Biome. In The Vegetation of South Aji'ica, Lesotho and Swaziland, edited by Mucina, L. and Rutherford, M.C. (Stralitzia 19, South African National Biodiversity Institute), pp. 53--219.
Rector, A.L. and Verrelli, B.C., 2010, Glacial cycling, large mammal community composition, and trophic adaptations in the Western Cape, South Africa. Journal of Human Evolution, 58, pp. 90-102.
Reynard, J.P., 2011, The Unidentified Long Bone Fragments from the Middle Stone Age Still Bay Layers at Blombos Cave, Southern Cape, South Africa, MSc Thesis, (Johannesburg: University of the Witwatersrand).
SADCO, 2008, Tidal information, (Council for Scientific and Industrial Research South Africa), http://sadco.csir.co.za/, access date: 28-6-2011.
Scholz, C.A., Johnson, T.C., Cohen, A.S., King, J.W., Peck, J.A., Overpeck, J.T., Talbot, M.R., Brown, E. Kalindekafe, L., Amoako, Lyons, Shanahan, T.M., Castaneda, I.S., Heil, C.W., Forman, S.L., McHargue, Beuning, K.R., Gomez, J. and Pierson, J., 2007, East African mega droughts betweenl35 and 75 thousand years ago and bearing on early-modern human origins. Proceedings of the National Academy of Sciences, 104, pp. 16416--16421.
Seatemperature.org, 2013, South African Sea Temperatures, (http://www. seatemperature.org/africa/south-afriea/, access date: 12-3-2012.
Shackleton, N.J., 1982, Stratigraphy and chronology of the Klasies River Mouth deposits: Oxygen isotope evidence. In The Middle Stone Age at Klasies River Mouth in South Africa, edited by Singer, R. and Wymer, J. (Chicago: Chicago University Press), pp. 194--199.
Silva, M., Brimaeombe, M. and Downing, J.A., 2001, Effects of body mass, climate, geography, and census area on population density of terrestrial mammals. Global Ecology and Biogeography, 10, pp. 469-485.
Silva, M., Brown, J.H. and Downing, J.A., 1997, Differences in population density and energy use between birds and mammals: A macroecological perspective. Journal of Animal Ecology, 66, pp. 327-340.
Stiner, M.C. and Munro, N.D., 2002, Approaches to prehistoric diet breadth, demography, and prey ranking systems in time and space . .Journal of Archaeological Method and Theory, 9, pp. 181--214.
Stuut, J.-B.W., Crosta, X., van der Borg, K. and Schneider, 2004, Relationship between Antarctic sea ice and southwest African climate during the late Quaternary. Geology, pp. 909-912.
Thackeray, J.F., 2007, Sea levels and chronology of Late Pleistocene coastal cave deposits at Klasies River in South Africa. Annals of the Transvaal Museum, pp. 219-220.
Thackeray, 1987, Late Quaternary environmental changes inferred from small mammalian fauna, southern Africa. Climatic Change, 10, pp. 285-305. .
Thompson, J.C. and Henshilwood, C.S., 2011, Taphonomic analysis of the Middle Stone Age larger mammal faunal assemblage from Blombos Cave, southern Cape, South Africa. Journal of Human Evolution, 60, pp. 746--767.
Tribolo, C., Mercier, N., Selo, M., Valladas, Joron, J.L., Reyss, Henshilwood, C., Sealy, J. and Yates, R., 2006, TL dating of burnt flint lithics from Blombos Cave (South Africa): Further evidence for the antiquity of modern human behaviour. Archaeometry, 48, pp. 341-357.
Late Pleistocene environments and behavioural adaptations at Blomhos Cave, South Africa 51
Turton, W., 1932, The Marine Shells of Port A(fred, S. Africa. Univesity Press).
Van Nicked::, 2011, Marine Fish Exploitation during the Middle and Later ,','tone Age of South Africa, PhD Thesis, (Cape Town: University of
Villa, P., M., Henshilwood, C.S. and Mourre, 2009, The Blombos Cave (South Africa). Journal of Archaeological Science,
Wadley, 2010, Were snares and traps used in the Middle Stone and does it matter? A review and a case study from Sibudu, South Africa. Journal of Human Evolution, pp. 179-192.
Waelbroeck, C., Labcyrie, Michel, Duplessy, McManus, K., Balbon, E. and Labracherie, M., 2002, Sea-level and changes derived from benthic foraminifera isotopic records. Reviews, pp. 295--305.
WeatherReports.com, Weather report for Still Bay, South Africa, (http://www. weatherreports.com/South_Africa/Stilbaai, access date: 18-8-2011.
Winterhalder, 2001, The behavioural ecology of Hunter .. Oatherers; An Interdisciplinary Perspective, edited by Layton, R.H. and Rowley-Conwy, (Cambridge: Cambridge University pp. 12---38.
Winterhalder, 1987, The analysis of hunter-gatherer diets: Stalking an optimal foraging model. In Food and Evolution, Toward a edited by M. and Ross, E.B. (Philadt)lphia: pp. 311-341.
Wurz, 2002, Variability in the Middle Stone lithic seqmmce, 115,000-60,000 years ago at Klasies River, South Africa. Journal of Archaeological Science, pp. 1001-1015.
Ziegler, M., Simon, Barker, Development of Middle Stone Age Nature Communications 4: 1905.
Stringer, C. linked to
Copyright © 2022 FDOKUMEN