J Inskip MSc thesis April 13
200
CARDIOVASCULAR AND METABOLIC FUNCTION AFTER THORACIC SPINAL CORD INJURY by Jessica Ann Inskip B.Sc., The University of British Columbia, 2006 A THESIS SUBMITTED IN PARTIAL FULFILLMENT OF THE REQUIREMENTS FOR THE DEGREE OF MASTER OF SCIENCE in The Faculty of Graduate Studies (Zoology) THE UNIVERSITY OF BRITISH COLUMBIA (Vancouver) April 2010 © Jessica Ann Inskip, 2010
-
Upload
khangminh22 -
Category
Documents
-
view
3 -
download
0
Transcript of J Inskip MSc thesis April 13

CARDIOVASCULAR AND METABOLIC FUNCTION AFTER THORACIC SPINAL CORD INJURY
by
Jessica Ann Inskip
B.Sc., The University of British Columbia, 2006
A THESIS SUBMITTED IN PARTIAL FULFILLMENT OF THE REQUIREMENTS FOR THE DEGREE OF
MASTER OF SCIENCE
in
The Faculty of Graduate Studies
(Zoology)
THE UNIVERSITY OF BRITISH COLUMBIA (Vancouver)
April 2010
© Jessica Ann Inskip, 2010

ii
ABSTRACT
Spinal cord injury (SCI) has the potential to disrupt autonomic pathways in the spinal
cord leading to a range of autonomic dysfunctions. The cardiovascular (CV) and
metabolic sequelae can restrict the lives of individuals with SCI and contribute to the
deterioration of their cardiometabolic health.
Here I investigated the whole-body CV and metabolic ramifications of experimental SCI
in rats. Complete thoracic SCI was performed at two different levels in order to
determine whether these outcomes demonstrated a level dependence. High-(T3) and low-
(T10) thoracic SCI both result in flaccid hindlimb paralysis, but have different effects on
the level of supraspinal autonomic control. CV and metabolic function were assessed at
several times post-injury to investigate changes over time.
Animals with acute high-thoracic SCI displayed resting hypotension that resolved with
time post-injury. However, their capacity to control blood pressure (BP) in response to
physiological stimuli remained deficient; animals with high-thoracic SCI displayed
pronounced orthostatic hypotension (OH) and severe episodes of sensory stimulation-
induced hypertension known as autonomic dysreflexia (AD). The resting BP and heart
rate of animals with low-thoracic SCI, and their ability to respond to orthostatic stress,
was indistinguishable from sham controls.
Lipid metabolism was also disordered by SCI in a level-dependent pattern. Animals with
high-thoracic SCI carried increased white adipose tissue and had higher circulating
triacylglycerol levels compared to animals with low-thoracic SCI and sham controls.
However, there was no difference in the distribution of cholesterol-carrying lipoproteins.

iii
Carbohydrate metabolism in animals with SCI did not support the diabetic profile
suggested by the lipid results. Overall, animals with SCI were more sensitive to glucose
and insulin than sham-injured animals. The pronounced ketone response to fasting in
animals with high-thoracic SCI suggests that there are diverse effects on substrate
metabolism.
This work introduces simple tests that can be performed to investigate several important
and understudied autonomic outcomes of SCI. The results reveal the importance of the
intact autonomic nervous system in regulating CV and metabolic function. The disparity
between motor and autonomic function encourages modifying our current conventions so
that we stratify subjects by their autonomic injury level and their motor deficits.

iv
TABLE OF CONTENTS Abstract .........................................................................................................................ii Table of Contents ......................................................................................................... iv List of Tables ................................................................................................................vi List of Figures..............................................................................................................vii List of Abbreviations..................................................................................................viii Acknowledgements....................................................................................................... ix Dedication...................................................................................................................... x Co-Authorship Statement ............................................................................................xi 1 Introduction............................................................................................................. 1
1.1 Introduction................................................................................................... 1 1.2 General anatomy of the autonomic nervous system ....................................... 2 1.3 The autonomic nervous system and baroreflex cardiovascular control ........... 4 1.4 Cardiovascular sequelae of SCI..................................................................... 6
1.4.1 Neurogenic shock.............................................................................. 8 1.4.2 Orthostatic hypotension..................................................................... 9 1.4.3 Autonomic dysreflexia .................................................................... 11 1.4.4 Cardiovascular circadian rhythms.................................................... 14
1.5 Energy metabolism...................................................................................... 15 1.5.1 Glucose metabolism and the autonomic nervous system.................. 15 1.5.2 Lipid metabolism and the autonomic nervous system ...................... 16 1.5.3 Circadian metabolic rhythms........................................................... 18
1.6 Metabolic sequelae of SCI........................................................................... 19 1.6.1 Body composition ........................................................................... 20 1.6.2 Energy balance................................................................................ 21 1.6.3 Substrate metabolism ...................................................................... 22 1.6.4 Circadian metabolic rhythms following SCI.................................... 23
1.7 Blood sugar control following SCI .............................................................. 24 1.8 Experimental objectives .............................................................................. 26 1.9 References .................................................................................................. 28
2 Cardiovascular responses to orthostatic stress, colorectal distension and sexual stimulation in rats with spinal cord injury................................................................. 44
2.1 Introduction................................................................................................. 44 2.2 Materials and methods................................................................................. 48
2.2.1 Surgeries......................................................................................... 48 2.2.2 Physiological testing ....................................................................... 50 2.2.3 Statistical analysis ........................................................................... 52
2.3 Results ........................................................................................................ 53 2.4 Discussion................................................................................................... 72 2.5 References .................................................................................................. 79
3 Cardiometabolic risk factors in experimental spinal cord injury ....................... 84 3.1 Introduction................................................................................................. 84 3.2 Materials and methods................................................................................. 87
3.2.1 Surgery and animal care.................................................................. 87

v
3.2.2 Magnetic resonance imaging ........................................................... 90 3.2.3 MRI post-processing and image analysis......................................... 91 3.2.4 Visceral white adipose tissue dissection .......................................... 91 3.2.5 Blood lipid profiling........................................................................ 92 3.2.6 Statistical analysis ........................................................................... 94
3.3 Results ........................................................................................................ 95 3.4 Discussion................................................................................................. 109 3.5 References ................................................................................................ 116
4 Energy expenditure, circadian rhythms, and carbohydrate metabolism after thoracic Spinal cord injury....................................................................................... 123
4.1 Introduction............................................................................................... 123 4.2 Materials and methods............................................................................... 125
4.2.1 Surgery and animal care................................................................ 126 4.2.2 Telemetry...................................................................................... 127 4.2.3 Housing ........................................................................................ 129 4.2.4 Calorie consumption ..................................................................... 129 4.2.5 Blood sampling ............................................................................. 130 4.2.6 Glucose tolerance test.................................................................... 130 4.2.7 Insulin tolerance test ..................................................................... 131 4.2.8 Circadian glucose.......................................................................... 131 4.2.9 Data analysis................................................................................. 131
4.3 Results ...................................................................................................... 132 4.3.1 Calorie consumption and body weight........................................... 132 4.3.2 Core temperature and circadian temperature rhythms .................... 132 4.3.3 Circadian activity patterns............................................................. 137 4.3.4 Total daily activity ........................................................................ 140 4.3.5 Circadian blood glucose ................................................................ 143 4.3.6 Glucose sensitivity ........................................................................ 143 4.3.7 Insulin-induced hypoglycemia....................................................... 148 4.3.8 Fasting and non-fasting blood glucose........................................... 151 4.3.9 Fasting and non-fasting blood ketones........................................... 154
4.4 Discussion................................................................................................. 154 4.5 References ................................................................................................ 163
5 Discussion ............................................................................................................ 167 5.1 Cardiovascular function after experimental SCI ........................................ 168 5.2 Recommendations for future cardiovascular research in experimental SCI 170 5.3 Metabolic function after experimental SCI ................................................ 171 5.4 Recommendations for future metabolic research using this model ............. 175 5.5 Metabolic implications for future experimental SCI research..................... 177 5.6 Insights and limitations of experimental SCI research................................ 178 5.7 Concluding remarks .................................................................................. 182 5.8 References ................................................................................................ 184
Appendix: Animal care certificate............................................................................ 189

vi
LIST OF TABLES Table 2.1 Resting cardiovascular variables were similar across injury levels and time
post-injury. ............................................................................................................ 55 Table 2.2 Blood pressure and heart rate responses to colorectal distension were equally
pronounced at one month and three months following T3 SCI. .............................. 65 Table 2.3 Sexual stimulation elicited hypertension and tachycardia in animals with T3
SCI........................................................................................................................ 71 Table 3.1 Non-fasting serum lipid concentrations in high-thoracic, low-thoracic and
sham-injured rats reveal that rats with high-thoracic SCI have elevated triglyceride levels one month post-injury................................................................................ 105
Table 3.2 Non-fasting blood lipids measured using a home cholesterol test system showed similar results to laboratory quantification. ............................................. 108
Table 4.1 Animals with SCI experienced mild hypoglycemia in response to a 12-hour fast at one month post-injury, but not at three months post-injury............................... 153

vii
LIST OF FIGURES Figure 2.1 Orthostatic hypotension was present after high- but not low-thoracic
transection, and was more severe acutely after injury............................................. 57 Figure 2.2 Animals exhibited tachycardia in response to an acute orthostatic stress. ...... 60 Figure 2.3 Colorectal distension elicited hypertension and bradycardia in animals with
high-thoracic SCI, while animals with low-thoracic SCI experienced milder hypertension accompanied by tachycardia ............................................................. 62
Figure 2.4 Colorectal distension elicited pronounced hypertension and bradycardia in animals with T3 SCI at one and three months post-injury. ..................................... 67
Figure 2.5 Representative arterial blood pressure recording of an animal with T3 SCI undergoing penile sheath retraction one month post-injury. ................................... 69
Figure 3.1 Rats with high-thoracic SCI and those with low-thoracic SCI recover to their pre-operative weights shortly after injury............................................................... 97
Figure 3.2 Rats with high-thoracic SCI carried increased visceral and subcutaneous fat one month post-injury............................................................................................ 99
Figure 3.3 Visceral white adipose tissue dissection and wet weight measurement was sensitive to changes after SCI. ............................................................................. 102
Figure 4.1 Calorie consumption and body weight throughout the 12-week experiment.134 Figure 4.2 Core temperature was decreased by T3 SCI but was normalized by two weeks
post-injury. .......................................................................................................... 136 Figure 4.3 Nocturnal activity patterns were not disrupted by high- or low-thoracic SCI.
............................................................................................................................ 139 Figure 4.4 Average daily activity was reduced by both high- and low-thoracic SCI
acutely after injury............................................................................................... 142 Figure 4.5 Circadian blood glucose variations were not disrupted by high- or low-thoracic
SCI...................................................................................................................... 145 Figure 4.6 Animals with high- and low-thoracic SCI displayed improved glucose
tolerance compared to sham-injured animals........................................................ 147 Figure 4.7 Animals with T3 SCI and animals with T10 SCI displayed rapid insulin-
induced hypoglycemia at one and three months post-injury, respectively............. 150 Figure 4.8 Animals with high-thoracic SCI exhibit a greater ketone response to fasting.
............................................................................................................................ 156

viii
LIST OF ABBREVIATIONS
AD, autonomic dysreflexia ATP, adenosine triphosphate ANS, autonomic nervous system AUC, area under the curve BP, blood pressure BMI, body mass index bpm, beats per minute CHOL, cholesterol CT, computed tomography CRD, colorectal distension CV, cardiovascular CVLM, caudal ventrolateral medulla CVD, cardiovascular disease DAP, diastolic arterial pressure DEXA, dual energy X-ray absorptiometry E, epinephrine GTT, glucose tolerance test HDL-C, high-density lipoprotein cholesterol HR, heart rate HSL, hormone sensitive lipase HUT, head-up tilt IML, intermediolateral ITT, insulin tolerance test KITT, rate constant for the disappearance of glucose LDL-C, low-density lipoprotein cholesterol LPL, lipoprotein lipase MAP, mean arterial pressure MRI, magnetic resonance imaging NE, norepinephrine NEFA, non-esterified fatty acid NTS, nucleus of the solitary tract OH, orthostatic hypotension PNS, parasympathetic nervous system SAP, systolic arterial pressure SCI, spinal cord injury SCN, suprachiasmatic nucleus scWAT, subcutaneous white adipose tissue SEM, standard error of the mean SNS, sympathetic nervous system SPN, sympathetic preganglionic neuron T3, third thoracic level of the spinal cord T10, tenth thoracic level of the spinal cord vWAT, visceral white adipose tissue WAT, white adipose tissue

ix
ACKNOWLEDGEMENTS
I am much obliged to all of the people that helped make this thesis possible. First and
foremost to my supervisors, Dr. Matt Ramer and Dr. Andrei Krassioukov for
demonstrating the curiosity and tenacity necessary of good scientists, for providing
guidance where appropriate and for giving me the freedom to flounder a bit on my own.
I would also like to thank Dr. Bill Milsom for serving on my committee and for providing
helpful comments on my thesis.
Thanks also to all the members of the Ramer and Krassioukov labs: especially to Leanne
for sharing her brain with me over the past few years, for demonstrating such high
standards in writing, teaching and presenting, and driving me to hockey games; to Lesley
for leading by example and prodding me along when needed; to Andrew for keeping
morale high and sharing his excitement about teaching; to Ward for encouraging
experiments and sharing his fascination in science and human nature; and to Byron and
Nima for their many hours of thankless animal care and technical assistance.
Finally, thanks to Chad for putting up with the inevitable self-doubt and other
unbecoming attributes that emerge in stressful times.

x
DEDICATION
To my family

xi
CO-AUTHORSHIP STATEMENT
The work presented in Chapters 2, 3 and 4 were prepared with contributions from
members of Dr. Andrei Krassioukov’s laboratory, Dr. Matt Ramer and Dr. Ward Plunet.
In Chapter 2, I contributed to the identification and development of the experimental
question and design. Leanne M. Ramer and I performed the surgical procedures and
animal care; together we collected the data. I performed the data analysis and manuscript
preparation. I am grateful to Leanne Ramer, Dr. Krassioukov and Dr. Ramer, who all
provided helpful suggestions on the manuscript.
The design and development of the work in Chapter 3 was a collaborative effort between
Leanne Ramer, Dr. Plunet and I. Technical assistance in data acquisition using the MRI
was provided by Andrew Yung and Dr. Piotr Kozlowski. Post-processing was also
performed by Andrew Yung and Dr. Kozlowski. Image analysis was performed by John
Byron Ramsey, Leanne Ramer and myself. Dr. Plunet and Leanne Ramer assisted me
with data collection. I performed the data analysis and manuscript preparation in
collaboration with Leanne Ramer, Dr. Plunet, Dr. Ramer and Dr. Krassioukov.
I designed the experiments presented in Chapter 4 with support and collaboration from
Dr. Plunet and Leanne Ramer. Leanne Ramer and I performed all of the surgical
procedures. I performed the data collection with assistance from Dr. Plunet and John
Byron Ramsey. I was responsible for the data analysis and manuscript preparation, with
helpful suggestions from both Dr. Plunet and Leanne Ramer.

1
1 INTRODUCTION
1.1 Introduction
Spinal cord injury (SCI) carries a significant social cost in health care and a tremendous
impact on individual quality of life. The incidence of traumatic SCI in Canada, which
accounts for approximately 81% of all SCIs (Hitzig et al., 2008), is between 42.4 and
52.5 per million (Dryden et al., 2003; Pickett et al., 2006). While the majority of injuries
occur in those under 35 years old, our aging population has created a bimodal
distribution, with peaks at both 30 and 60 years old (Dryden et al., 2003; Eng and Miller,
2008; Kattail et al., 2009).
Individuals injured today can expect significantly improved acute care and management
of secondary complications compared to the past three decades (Strauss et al., 2006).
But, while there are far fewer deaths in the acute setting, lifelong health remains a clinical
concern; cardiovascular disease (CVD) is common and cardiovascular (CV) mortality is
high (Garshick et al., 2005). CVD strikes earlier in this population and life expectancy is
decreased compared to the general population (Strauss et al., 2006).
The past few decades have seen a greater appreciation for the diverse range of
dysfunctions that can accompany SCI in addition to paralysis (Anderson, 2004;
Anderson, 2006; Alexander et al., 2009a; Alexander et al., 2009b). SCI can disrupt
motor, sensory, and autonomic pathways traveling rostrally and caudally within the
spinal cord. Autonomic dysfunctions have a significant impact on quality of life and
functional independence and they have been identified as a research priority by
individuals with SCI (Anderson, 2004). However, in general, our animal models are
overwhelmingly focused on motor outcomes after SCI (Inskip et al., 2009). Despite the

2
clinical significance of abnormal CV and metabolic function following SCI, the
characteristics and pathophysiology are poorly understood.
1.2 General anatomy of the autonomic nervous system
In order to understand the autonomic sequelae of SCI it is important to appreciate the
structure and function of the intact autonomic nervous system (ANS). The ANS
maintains the body’s internal homeostasis; a task that it carries out via the regulation of
visceral reflexes, cardiac and smooth muscle activity and glandular secretions.
Anatomically, with the exception of the adrenal medulla, information is relayed to
effector organs via ganglia, resulting in diffuse action compared to the somatic system.
The ANS is composed of three branches: the two main branches are the sympathetic
nervous system (SNS) and parasympathetic nervous system (PNS), and the third is the
enteric nervous system (Langley, 1921). For the most part, the PNS and SNS innervate
the same targets, but the functions that they regulate are often opposite in nature; a stable
internal environment is maintained by a balance of activity in both systems.
Both the SNS and PNS reach their effector targets by first synapsing in a peripheral
ganglion; the first neuron in this chain is termed preganglionic, the second ganglionic.
Sympathetic preganglionic neurons (SPNs) reside in the thoracolumbar spinal cord and
the majority are found in small clusters in the lateral horn of the grey matter in the
intermediolateral (IML) cell column (Henry and Calaresu, 1972; Pyner and Coote, 1994).
SPN axons exit the spinal cord via the ventral roots and travel via the white ramus and
synapse in sympathetic paravertebral ganglia, which lie close to the cord, or travel
further, through paravertebral ganglia, to synapse in prevertebral ganglia (Jänig, 2006).
Parasympathetic preganglionic neurons (PPNs) reside in the nucleus ambiguus of the

3
brainstem and in the sacral cord, in the sacral parasympathetic nucleus in the lateral horn
(Banrezes et al., 2002). Unlike SPNs, PPNs synapse in local ganglia, usually in close
proximity to their final target (reviewed in Brading, 1999).
The autonomic control of the CV system is carried out through its innervation of the heart
and blood vessels. The heart is innervated by sympathetic ganglionic neurons in the
upper thoracic paravertebral sympathetic ganglia, whose SPNs originate in the upper
thoracic cord (T1-T4) (Strack et al, 1988; reviewed in Jänig, 2006). Sympathetic
ganglionic nerves terminate in both the atria and ventricles of the heart (reviewed in
Levick, 2003). Vagal parasympathetic preganglionic neurons exit the brainstem and
innervate local cardiac ganglia in the atrial nodes and atria itself (reviewed in Levick,
2003). Increased sympathetic activity results in tachycardia, while increased
parasympathetic activity results in bradycardia (reviewed in Levick, 2003).
Peripheral vasomotor pathways control vascular tone and ultimately total peripheral
resistance. This role is carried out primarily via sympathetic vasoconstrictor pathways
and adrenergic innervation. With the exception of erectile tissue and intracranial vessels,
for the most part, the PNS does not innervate blood vessels (reviewed in Jänig, 2006).
The dense sympathetic adrenergic innervation of the splanchnic vascular bed is
particularly important for BP control (Cowen et al., 1982; Rowell, 1990). The spinal
outflow to this vasculature bed originates in T5-L2 (reviewed in Jänig, 2006); injuries
above this level often result in disordered CV control.
The majority of the abdominal visceral organs are innervated by both branches of the
ANS (Yamaguchi, 1992). The sympathetic ganglionic neurons that innervate the visceral
organs originate primarily in the prevertebral celiac ganglion and superior mesenteric

4
ganglion, their preganglionic inputs originating in the lower thoracic cord (T5-T12)
(Kiba, 2004; Uyama et al., 2004). Vagal parasympathetic neurons innervate local ganglia
in visceral organs, to the level of the transverse colon, and sacral parasympathetic
neurons innervate the distal colon and pelvic organs (reviewed in Jänig, 2006). The liver
and pancreas are both richly innervated by the PNS and SNS (Yamaguchi, 1992). Unlike
most visceral organs, adipose tissue only receives sympathetic innervation (Youngstrom
and Bartness, 1995; Giordano et al., 2006). There, nerve endings are found both in the
vasculature and in the parenchyma (Youngstrom and Bartness, 1995).
1.3 The autonomic nervous system and baroreflex cardiovascular control
The regulation of BP is arguably one of the most critical functions of the ANS. It must
be able to detect deviations in BP and respond to maintain stable BP (Cowley, 1992).
One of the ways that this is achieved is by the reflex regulation of SNS and PNS activity,
resulting in altered vasomotor tone and cardiac output (Fisher et al., 2006; Guyenet,
2006). The arterial baroreceptor-mediated reflex (baroreflex) is one of the most important
and well-studied means of short-term BP regulation (Dampney et al., 2002). The
successful execution of this reflex requires the coordination of afferent, central and
efferent components.
The afferent arm of the baroreflex begins with the baroreceptors, stretch-sensitive
mechanoreceptors located in the arterial wall of the aortic arch and carotid sinus (Bock
and Gorgas, 1976). Baroreceptors respond to both the degree and speed of arterial
pressure change between 50 and 150 mmHg (reviewed in Kirchheim, 1976). The sensory
afferents that contain baroreceptors in the aortic arch have their cell bodies in the nodose
ganglion and those from the carotid sinus lie in the petrosal ganglion (Kirchheim, 1976).

5
Their central axons join the vagus or glossopharyngeal nerve, enter the brainstem, and
project bilaterally to the nucleus of the solitary tract (NTS) (reviewed in Jänig, 2006).
In the brainstem, second-order neurons travel from the NTS to the ipsilateral caudal
ventrolateral medulla (CVLM) (Chalmers et al., 1991). The rostral ventrolateral medulla
then integrates signals from both the NTS and the CVLM (Ross et al., 1984) and sends
descending projections to vasomotor and cardiomotor SPNs in the IML cell column of
the thoracolumbar cord (Amendt et al., 1979). Parasympathetic cardiomotor information
is relayed from the NTS to preganglionic vagal neurons in the ipsilateral nucleus
ambiguus (reviewed in Jänig, 2006).
The vasomotor effects of the baroreflex are carried out by the sympathetic innervation
and control of resistance arteries, while the cardiac component of the baroreflex is
effected by the reciprocal actions of both branches of the ANS. The bradycardic
response to hypertension is predominated by the increase in vagal activity (Leon et al.,
1970; Pickering et al., 1972). The tachycardic response to hypotension is effected by a
combination of withdrawal of vagal tone and increase in sympathetic activity, with the
former acting rapidly and the latter more slowly (Chen et al., 1982; Parlow et al., 1995).
The rapid vagal baroreflex response is also seen in its reflex effects on stroke volume
(Casadei et al., 1992). Together, the baroreflex mediated autonomic effects on vasomotor
tone, HR, and stroke volume effectively regulate short-term changes in BP.
The renin-angiotensin-aldosterone system participates in BP maintenance on a longer-
term basis, on the order of hours. In response to reductions in effective circulating blood
volume, caused by a reduction in pressure or volume, juxtaglomerular cells of the kidney
release renin (Gomez and Lopez, 2009). Renin increases angiotensin II levels, which

6
causes potent vasoconstriction, facilitates sympathetic transmission and stimulates
aldosterone release from the adrenal cortex (He and MacGregor, 2003; Nelson and Cox,
2005). Circulating aldosterone ultimately results in blood volume expansion (MacGregor
et al., 1981). Together, these effects buffer changes in effective circulating blood volume
and maintain BP. The relationship between the blood volume stimulus and renin
response is modulated by the SNS and circulating catecholamines (Kirchheim et al.,
1988).
1.4 Cardiovascular sequelae of SCI
The profound CV dysfunctions associated with high-level injuries can be among the most
frustrating and debilitating sequelae of SCI; from the very beginning, these complications
can interfere with functional independence and community reintegration by impeding
participation in rehabilitation programs.
SNS function is most strongly affected by SCI level due to the location of the SPNs
throughout the thoracolumbar cord (Jänig, 2006). Sympathetic fibers exit the spinal cord
throughout the thoracolumbar cord therefore higher injuries leave a greater number of
sympathetic nerves without supraspinal control. The spinal outflow to the splanchnic
vasculature is located in spinal cord segments T5-L2 (Strack et al., 1988; Hsieh et al.,
2000). This vasculature bed holds between 20-25% of total blood volume (Rowell, 1990)
and is critical for BP control due to its ability to mobilize a large amount of blood volume
(Brunner et al., 1988). The loss of this major element of BP control has consequences on
resting BP, maintenance of BP during orthostatic challenge, and control of the reflex
vasomotor circuits.

7
The drastic changes in sympathetic vasomotor activity after injury highlight the
importance of descending BP regulatory mechanisms. The loss of this descending
control results in low sympathetic vasoconstrictor activity below the injury and thus low
resting BP (Stjernberg and Wallin, 1983). This low, as opposed to absent, sympathetic
activity reveals that the local spinal reflex arc remains intact and capable of generating
sympathetic tone (reviewed in Guyenet, 2006). Indeed, in individuals with SCI,
stimulation of peripheral somatic sensory afferents below the lesion still initiates some
degree of sympathetic activation (Stjernberg and Wallin, 1983; Wallin, 1986; Karlsson et
al, 1998). This can be problematic, as these circuits can be pathologically activated
without the important modulation from brainstem (see 1.4.3 Autonomic dysreflexia
below).
Resting HR is also dependent on the autonomic level of injury. As vagal HR control is
almost always intact following SCI, it is the level of sympathetic cardiac control and
resultant balance between that and vagal control that determines HR.
Complete cervical SCI typically results in resting bradycardia due to the total loss of
sympathetic cardiomotor control (Claydon and Krassioukov, 2006). On the other hand,
mid and low-thoracic SCIs tend to result in resting tachycardia, as the body attempts to
compensate for low resting BP, and lower stroke volume (Hjeltnes, 1977; Jacobs et al.,
2002), by increasing HR (Claydon and Krassioukov, 2006). High-thoracic injuries (T1-
T4) are hard to characterize as they can disrupt a portion of cardiac sympathetic control,
resulting in an atypical HR response (Claydon and Krassioukov, 2008).
The location of injury within the cord is another important determinant of CV
dysfunction, as most SCIs are anatomically incomplete (Fawcett, 2002). The descending

8
vasomotor pathways in the human spinal cord lie in the lateral funiculus; damage to this
area causes significant CV pathology (Furlan et al., 2003; Krassioukov, 2006).
Ultimately, both level and completeness of injury have consequences on resultant CV
dysfunction.
1.4.1 Neurogenic shock
Acutely after injury, the primary CV concern is supporting patients through the period of
neurogenic shock. Neurogenic shock typically presents as severe hypotension
accompanied by reflex bradycardia (Atkinson and Atkinson, 1996; Krassioukov and
Claydon, 2006; McMahon et al., 2009). It is thought to primarily be due to the recent
loss of descending medullary basal sympathetic tone to the sympathetic preganglionic
vasomotor neurons in the thoracolumbar cord (Calaresu and Yardley, 1988). This results
in reduced systemic vascular resistance, decreased venous return and decreased systemic
BP. Bradycardia is also common during neurogenic shock, especially following high-
SCI that disrupts the brainstem control of cardiac sympathetic neurons (Lehmann et al.,
1987). The most common form of medical intervention for neurogenic shock in in the
form of fluid resuscitation to induce volume expansion, but it can also include
pharmacological pressor therapy (McMahon et al., 2009). The goal of this therapy is
generally to maintain MAP above 85 mmHg (Vale et al., 1997).
Neurogenic shock is distinct from spinal shock, the period following SCI when somatic
reflexes are absent. While they can both be present in the acute period, spinal shock
tends to resolve earlier than neurogenic shock (Atkinson and Atkinson, 1996; Silver,
2000). Neurogenic shock has also been documented in experimental animal models
(Mayorov et al., 2001), although it is generally less severe and resolves more quickly

9
than in humans (Krassioukov and Claydon, 2006). Even after the resolution of
neurogenic shock, CV function rarely returns to normal; orthostatic hypotension (OH),
autonomic dysreflexia (AD) and altered circadian rhythms can persist throughout a
person’s lifetime.
1.4.2 Orthostatic hypotension
The ability to modulate CV activity to maintain BP when changing body position is
crucial to provide adequate blood to the brain. This is one of the most important goals of
the ANS (Goadsby, 2004). The disruption of the ANS by SCI can compromise this task,
manifesting in hypotension in response to a postural change. Orthostatic hypotension
(OH) is defined as a decrease in systolic arterial pressure (SAP) of ≥ 20 mmHg or in
diastolic arterial pressure (DAP) of ≥ 10 mmHg within three minutes of an orthostatic
challenge (Consensus Committee of the American Autonomic Society and the American
Academy of Neurology, 1996). Clinical symptoms often accompany the BP changes, but
they are not necessary for the diagnosis of OH. When they do occur, common symptoms
result from poor perfusion of the brain, including light headedness, dizziness, visual
disturbances (blurred, tunnel, scotoma, graying/blacking out, colour deficits), and loss of
consciousness (Mathias, 1995). Non-specific symptoms include weakness and fatigue,
and muscle aches localized to the neck, shoulders, and lower back (Mathias, 1995).
Like most aspects of CV dysfunction, OH is most prevalent in individuals with high-level
SCI and most severe in those with complete injuries (Sidorov et al., 2008). The incidence
of OH is particularly high in the acute post-injury period (Sidorov et al., 2008). At this
time, OH associated with sitting is the most common barrier to individuals’ participation
in rehabilitation and early wheelchair use (Illman et al., 2000; Tederko et al., 2006). For

10
some, the severity of OH decreases with time post-injury; for others, the management of
OH is a lifelong consideration (Claydon and Krassioukov, 2006; Sidorov et al., 2008).
Clinically, orthostatic tolerance is quantified using CV recording during a postural
challenge, most commonly in the form of a tilt table, but can also be assessed using a
stand-up test or lower body negative pressure. In neurologically intact subjects, a 45
degree head-up tilt triggers an increase in plasma noradrenaline and renin activity and
results in little change in BP (Mathias et al., 1980). Recently, a modified orthostatic
stress test has been developed called the “sit-up test” (Claydon and Krassioukov, 2006).
The main advantages of this test are that it is simple and less severe than a tilt-test, which
trigger a more modest fall in BP. As a result, it can be used in the acute phase of SCI and
performed using standard hospital beds (Claydon and Krassioukov, 2006).
Clinical testing has revealed some of the compensatory responses of the body as it
attempts to mitigate the severity of hypotension. Muscle spasms have been recorded
during tilting, whose mechanical effects increase the venous return to the heart and
transiently increase BP (Mathias, 1987; Tschakovsky and Sheriff, 2004). In the partial or
total absence of sympathetic vasomotor control, the renin-angiotensin-aldosterone
pathway also assumes a more important role in BP control (Mathias and Frankel, 1999).
This axis has a number of effects on the CV system that can reduce the severity of OH,
including vasoconstriction and increasing plasma volume. The reliance on this system
can be observed during prolonged head-up tilt, where both plasma renin activity and
aldosterone increase more rapidly and to a higher degree in tetraplegic subjects than in
controls, who increase plasma noradrenaline concurrently (Mathias et al., 1975; Mathias
et al., 1980). Resting plasma renin activity is also higher than normal in individuals with

11
tetraplegia (Mathias et al., 1975), suggesting that mild chronic hypotension can continue
to activate this axis over prolonged periods. All of these studies have informed and
improved the monitoring and management of clinical OH. To date, I have not found any
evidence OH being studied in animal models of SCI.
1.4.3 Autonomic dysreflexia
SCI perturbs the ability of the ANS to maintain CV homeostasis by disrupting central
control of cardiac function and peripheral vasomotor pathways. It also leaves local spinal
sympathetic circuitry distal to the injury to operate independently from supraspinal
control. When the injury is severe, and at a high-thoracic or cervical level, these two
changes can combine to produce dangerous, uncontrolled, elevations in BP. Autonomic
dysreflexia (AD), defined as an increase in systolic BP of ≥ 20 mmHg from baseline, is
essentially an exaggerated sympathetic reflex of sympathetic vasomotor neurons distal to
the injury (Krassioukov et al., 2007). It is triggered by afferent input below the level of
SCI, which reflexively activates peripheral vasoconstriction, culminating in the profound
elevation of whole-body BP.
The symptoms associated with AD range widely, from mild sweating to severe headaches
(Mathias and Frankel, 1999). Like OH, AD can occur asymptomatically, even when
significant changes in BP are experienced (Ekland et al., 2008). A number of the
symptoms, including flushing, sweating, and pounding heart, result from the reflex
autonomic responses of the upper body attempting to compensate for the massive
sympathetic discharge below the injury level (Guttmann and Whitteridge, 1947; Mathias
and Frankel, 1999). The HR compensation during an episode of AD is often bradycardic.
This baroreflex-triggered response, primarily effected by an increase in vagal activity

12
(Gao et al., 2002), is generally insufficient to completely compensate for the sympathetic
vasomotor tone, therefore BP remains high (Schmitt et al., 2001b). On the other hand, no
HR change or tachycardia can be observed in severe cervical injuries, whose sympathetic
cardiac reflex activity opposes the baroreflex-mediated vagal HR effects (Kewalramani,
1980).
AD is tested clinically by monitoring BP during procedures such as routine urethral
catheterization (Fagius and Karhuvaara, 1989), cystometric bladder filling (Giannantoni
et al., 1998; Igawa et al., 2003), or vibrostimulation for sperm retrieval (Claydon et al.,
2006; Ekland et al., 2008). Each of these activities are potent AD-inducing stimuli for
individuals who suffer from AD. To model these visceral stimuli in animals with SCI,
bladder filling or colorectal distension (CRD) is used to trigger AD (Osborn et al., 1990;
Krassioukov and Weaver, 1995). Rodents with severe high-level SCI also experience
AD, which is manifested in a CV response similar to the human condition (Krassioukov
and Weaver, 1995). CRD has proven to be a robust trigger of AD. Since its inception, it
has been used to characterize the development of AD over time, identify spinal elements
of its pathophysiology and assess severity of damage to autonomic pathways
(Krassioukov and Weaver, 1996; Maiorov et al., 1997b; Maiorov et al., 1998; Krenz et
al., 1999; Cameron et al., 2006; Hou et al., 2008). In uninjured rats and humans, visceral
distension elicits a small increase in BP, but this is effectively counteracted by the
baroreceptor reflex, which returns whole-body BP to resting values (Krassioukov and
Weaver, 1995).
Like OH, AD generally occurs in individuals with injury at or above the sixth thoracic
segment (T6) as these injuries disrupt the supraspinal control of the splanchnic

13
vasculature. In this population of individuals with cervical or high-thoracic SCI the
prevalence of AD is between 50% to 90% (Lindan et al., 1980; Mathias and Frankel,
1983; Mathias and Frankel, 1999). While AD is most common in individuals with
neurologically complete SCI, it can also occur in those with incomplete injuries
(Helkowski et al., 2003). Indeed, neither the presence of AD nor the level of sympathetic
dysfunction can be inferred from the degree of motor dysfunction (Curt et al., 1996;
Claydon and Krassioukov, 2006). The association between the presence of AD and loss
of sympathetic skin responses (SSR) suggests that the disruption of supraspinal
sympathetic control is necessary for the development of AD (Curt et al., 1996).
However, the loss of descending control is not sufficient for AD, as AD is not ubiquitous
in individuals with sympathetically complete tetraplegia (Curt et al., 1996; Claydon and
Krassioukov, 2006). Additional aberrant changes, such as the expansion of sensory
afferent terminals in the spinal cord (Krenz et al., 1999; Cameron et al., 2006) and
supersensitivity of the vascular smooth muscle (Teasell et al., 2000; Yeoh et al., 2004)
both contribute to the profound sympathetic reflex response to sensory input.
AD is typically described and reported in the chronic post-injury period. However, there
have also been cases of “early” AD, occurring in the acute post-injury period in both rats
and humans (Osborn et al., 1990; Maiorov et al., 1998; Silver, 2000; Krassioukov et al.,
2003). Early AD is thought to be a result of the acute loss of descending inhibition from
supraspinal centres - a distinct etiology from the subacute development of the syndrome.
Whatever the etiology, dealing with extreme hypertensive episodes becomes a life-long
concern for individuals who develop AD. Despite this, we know very little about

14
whether the severity of AD changes over time or what long-term effects these episodes of
extremely high BP have on resting CV variables.
1.4.4 Cardiovascular circadian rhythms
Circadian patterns in autonomic activity correlate with circadian patterns in BP and HR,
and are considered to be responsible for these rhythms (Furlan et al., 1990). A reduction
in sympathetic activity and plasma catecholamines during the night are associated with
the nocturnal fall in BP, while elevated BP during the day coincides with a rise in
sympathetic activity (Linsell et al., 1985; Furlan et al., 1990). HR follows a similar
diurnal rhythm, beginning to rise a few hours prior to waking, and peaking midmorning –
a pattern that seems to be driven primarily by the modulation of vagal parasympathetic
cardiac activity (Burgess et al., 1997; Scheer et al., 2004). This rhythm is considered a
true endogenous circadian rhythm, driven by the biological clock in the suprachiasmatic
nucleus (SCN), as it persists even in unmasking conditions, where light, sleep, physical
activity, and feeding are constant and controlled (Kerkhof et al., 1998; Scheer et al.,
2001). BP, on the other hand, does not vary when measured in unmasking conditions,
suggesting it is normally entrained by environmental and behavioral cues (Van Dongen et
al., 2001).
Not surprisingly, circadian BP variation is abolished following complete cervical SCI
(Krum et al., 1991; Nitsche et al., 1996; Munakata et al., 1997). Specifically, there is a
failure to increase BP during the day. However, the HR rhythm is maintained, supporting
the principle role of vagal activity in this rhythm generation. Individuals with mid- and
low-thoracic SCI display normal nocturnal dipping of both BP and HR (Nitsche et al.,
1996; Munakata et al., 1997). Circadian CV rhythms are often preserved in incomplete

15
cervical injuries (Nitsche et al., 1996) – though, of course, it is the integrity of the
autonomic pathways that is the most important factor in this regard. These rhythms have
also been examined in animal models of SCI. High-thoracic SCI abolished circadian
rhythmicity in BP and HR acutely, but these rhythms were restored by seven days post-
injury (Mayorov et al., 2001). Together, these trends begin to illustrate the level- and
time-dependence of CV function following SCI.
1.5 Energy metabolism
Energy metabolism is regulated by a combination of hormonal and neural cues. The
ANS plays an important role in controlling the storage and release of both major fuel
substrates – glucose and free fatty acids. Following meals, these substrates are quickly
cleared from the circulation and their endogenous release is suppressed (Ahima, 2006).
Excess substrates are stored as triglycerides or as glycogen for retrieval during times of
need. This balance is partly mediated by the reciprocal sympathetic and parasympathetic
control of the visceral organs.
1.5.1 Glucose metabolism and the autonomic nervous system
The ANS plays an important role in modulating glucose levels. Blood glucose levels are
tightly regulated, as both hypo- and hyperglycemia can be damaging to tissues in the
body. Generally speaking, increases in sympathetic activity elevate blood glucose, while
increases in vagal activity reduce it. These effects are carried out by the direct neural
control to both the pancreas and liver (Nonogaki, 2000). In the pancreas, the ANS
modulates the release of insulin and glucagon. Sympathetic activity reduces insulin
secretion from pancreatic β-cells and increases glucagon secretion from the α-cells (Kiba,
2004). Conversely, parasympathetic activity stimulates insulin secretion from β-cells

16
(Yamaguchi, 1992). Pancreatic hormones are released into the portal vein and travel to
the liver, where they modulate glucose release. There, insulin inhibits glycogenolysis,
promotes glycogen synthesis, and suppresses gluconeogenesis (Petersen et al., 1998;
Edgerton et al., 2009), while glucagon stimulates glycogenolysis and gluconeogenesis
(Chiasson et al., 1975; Magnusson et al., 1995). Sympathetic activity in the liver
promotes glycogen breakdown by increasing the activity of rate limiting enzymes
involved in glycogenolysis, thus increasing hepatic glucose output; vagal activity
promotes glycogen synthesis by increasing the activity of glycogen synthesis, decreasing
plasma glucose in the process (Nonogaki, 2000)
Plasma glucose concentrations display a circadian rhythmicity in both rodents and
humans – peaking shortly before the beginning of the waking hours (Carroll and Nestel,
1973; Bellinger et al., 1975; La Fleur et al., 1999). This endogenous rhythm is controlled
by the SCN and effected primarily by the level of sympathetic activity to the liver (La
Fleur et al., 1999; Kalsbeek et al., 2004; Cailotto et al., 2005). However, the vagal input
must also provide important control, as either sympathectomy or vagotomy abolish this
rhythm (Cailotto et al., 2008). These results reinforce the concept of the requirement for
balanced ANS activity and lead to predictions regarding how SCI might affect circadian
blood glucose (see 1.8 Experimental objectives below). Circadian glucose patterns have
not been reported in the literature after clinical or experimental SCI.
1.5.2 Lipid metabolism and the autonomic nervous system
Adipose tissue exists in both brown and white form, but only the latter is involved in lipid
storage (Cinti, 2001). White adipose tissue (WAT) constitutes the main energy storage
depot for the body, in which energy is stored as triacylglycerides (triglycerides) (Cinti,

17
2001). Unlike glycogen, triglycerides are stored anhydrously and have high energy
density, making them well suited to provide large energy reserves (Olsson and Saltin,
1970; Gurr and James, 1971). Despite these differences, in many ways WAT plays a
similar role to the liver; both act as buffers for the daily fluctuations in plasma substrates
(Frayn, 2002). In addition to modulating short-term changes in plasma substrates, WAT
is also the long-term repository for energy – excess energy collected over long periods is
reflected in the size of WAT depots (Frayn et al., 2003). During acute and long-term
periods of calorie deficit, stored triglycerides can be retrieved from these depots – a task
which is primarily achieved by the ANS.
The role of the ANS in lipid metabolism is exclusively mediated by the SNS. The SNS
has a direct role in adipocyte metabolism, via its innervation of the parenchyma, and an
indirect role by its control of adipose tissue blood flow (Youngstrom and Bartness, 1995;
Frayn et al., 2003). The effects of SNS activity on adipocyte metabolism can be
mediated by both α- and β-adrenergic receptors (Klein et al., 1994; Holm, 2003; Collins
et al., 2004). Both norepinephrine (NE) and epinephrine (E) promote lipolysis by
activating intracellular hormone-sensitive lipase (HSL) via G-protein signaling, which
increases non-esterified fatty acid (NEFA) efflux from adipocytes (Frayn et al., 2003;
Holm, 2003). Conversely, catecholamines reduce lipogenesis by inhibiting the catalytic
activity of lipoprotein lipase (LPL) in WAT capillaries (Ramsay, 1996). LPL’s role is to
hydrolyse lipoproteins, converting them into NEFAs and promoting fatty acid storage
(Ramsay, 1996). Lipid metabolism is also modulated indirectly by the catecholaminergic
regulation of adipose tissue blood flow (Samra et al., 1996). Both NE and E increase
blood flow, which effects plasma fatty acid levels by providing triglyceride substrate for

18
LPL and promoting NEFA efflux by clearing NEFAs from the local circulation (Kurpad
et al., 1995; Samra et al., 1996).
As well as regulating the balance between lipolysis and lipogenesis, the SNS is partly
responsible for the regulation of the size of WAT depots. With age, these depots
typically grow by a combination of hypertrophy and hyperplasia (Nestel et al., 1969).
Sympathetic innervation partly regulates the proliferation of adipocytes and when the
sympathetic innervation is interrupted to individual depots adipocytes undergo
hyperplasia (Youngstrom and Bartness, 1998). Despite these roles of the SNS in
adipocyte metabolism, we do not know how WAT depots are affected by SCI.
1.5.3 Circadian metabolic rhythms
Similar to the CV system, metabolic activity varies significantly throughout the sleep-
wake cycle. Daily fluctuations in energy consumption and expenditure are reflected
prominently in animals’ body temperature, physical activity levels and food consumption.
These metabolic rhythms are driven predominantly by the circadian clock in the SCN,
which is synchronized by light exposure (Meijer and Schwartz, 2003). On the other
hand, modifications in metabolism, such as hypo- or hypercaloric intake, can feed-back
and influence the circadian clock and perturb the synchronization between light and
metabolism (Challet et al., 1997; Mendoza et al., 2007, 2008). These interactions
severely complicate the ability to establish causal relationships and between circadian
rhythmicity and metabolic activity. Nonetheless, several clinical metabolic disorders,
including obesity and diabetes, have been associated with the disruption of daily
physiological rhythms such as altered sleep-wake cycles and lipolysis (Aronson, 2001;
Bray and Young, 2007; Ruger and Scheer, 2009). Light-dark shifts repeated at twice-

19
weekly intervals demonstrate that acute circadian disruption can be a powerful
obesogenic stimulus in rodents as well (Tsai et al., 2005). The specific mechanisms for
these interactions have yet to be fully resolved; however, it is clear that there is some
interaction between circadian disruption and metabolic abnormalities.
1.6 Metabolic sequelae of SCI
Individuals with SCI share many of the same concerns about their health and body as
those without SCI. They are interested in attaining and maintaining a healthy weight,
developing muscle, improving exercise performance and preventing the development of
metabolic disorders. While on-line SCI forums are replete with informal discussions
about strategies to address these concerns, evidence-based information is minimal (Wilt
et al., 2008). Research is needed to clarify how metabolism is altered by SCI injury and
ultimately to provide viable options for maintaining long-term health.
Broadly speaking, we know that SCI results in altered body composition, energy balance,
and substrate metabolism (each discussed in detail below). These changes combine to
produce an unfavourable metabolic profile; muscle stores are decreased and adipose
tissue is easily gained and not easily accessed. The profound lifestyle changes typically
associated with SCI can make it difficult to determine whether metabolic sequelae are the
direct result of SCI or secondary to lifestyle changes. The study of elite athletes with
SCI, compared to both non-athletic individuals with SCI and able-bodied controls,
provides one strategy to partly dissociate these two factors.
Unlike CV dysfunction, for which we have a good idea of the association between injury
level and dysfunction (Mathias and Frankel, 1999; Claydon and Krassioukov, 2006), the
metabolic sequelae of SCI have not been rigorously documented in relation to SCI level

20
(Wilt et al., 2008); it is unclear whether they are level dependent. Animal models provide
one approach to study this relationship.
1.6.1 Body composition
SCI alters body composition by precipitating changes in muscle and fat tissue. In both
humans and rodents, there is a decrease in muscle mass due to disuse atrophy and a shift
in myofiber type to predominantly fast-twitch (type II) fibers (Grimby et al., 1976; Lieber
et al., 1986; Round et al., 1993; Castro et al., 1999; Gregory et al., 2003; Biering-
Sorensen et al., 2009). A reduction in muscle mass leads to decreased glucose uptake,
and this is compounded by decreased insulin mediated glucose uptake in the unused
muscle (Seider et al., 1982). Furthermore, intramuscular adipose tissue, a pathogenic
feature that is inversely correlated with insulin sensitivity (Goodpaster et al., 2000), is
increased after SCI (Elder et al., 2004). Finally, the shift to fast-glycolytic muscle fibers
results in a muscle type that is more easily fatigued and has reduced adenosine
triphosphate (ATP) yield (Biering-Sorensen et al., 2009). All of these changes likely
contribute to the problems in carbohydrate metabolism after SCI (Bauman and Spungen,
1994; Bauman et al., 1999a).
Lipid metabolism is also changed as a consequence of SCI. Grossly, this can be observed
in the increased prevalence of overweight (body mass index (BMI) between 25 kg/m2 and
29.9 kg/m2) and obese (BMI≥30 kg/m2) individuals in the SCI population (Gater, 2007;
Weaver et al., 2007; Rajan et al., 2008). However, due to the decreased lean mass
described above, individuals with SCI do not necessarily appear overweight, and yet they
can still possess a pathological accumulation of adipose tissue (Jones et al., 1998; Gater,
2007). Despite similar waist circumferences and total adipose tissue, men with SCI carry

21
increased adipose tissue in their abdomen compared to able-bodied controls (Edwards et
al., 2008; Maruyama et al., 2008).
At the plasma level, some unfavorable cholesterol level changes have been reported,
including increased LDL-C, decreased HDL-C and high post-prandial triglyceride levels
(Brenes et al., 1986; Bauman et al., 1992; Krum et al., 1992; Bauman et al., 1999b; Nash
et al., 2005; Nash and Mendez, 2009). However, when the literature in the field is
considered as a whole, there is inconsistent evidence regarding the direction and degree
of all of these changes (Wilt et al., 2008). Furthermore, the study of active compared to
sedentary individuals with SCI reveals that some of these differences, including the
decrease in HDL-C, can be reversed with physical activity (Dearwater et al., 1986). This
suggests that the decrease in HDL-C can be attributed to the sedentary life-style often
associated with SCI rather than SCI per se. More research is needed to determine if and
how SCI affects the plasma lipid profile directly.
1.6.2 Energy balance
One likely contributor to the prevalence of obesity after SCI is a positive energy balance
created by a reduction in total energy expenditure that is not offset by energy intake.
Total daily energy expenditure is made up of three components: resting energy
expenditure (65%), physical activity (25-30%), and the thermic effect of food (5-10%)
(Buchholz and Pencharz, 2004). While the thermic effect of food is similar between
those with SCI and able-bodied subjects, both resting energy expenditure and physical
activity are lower after SCI (Buchholz et al., 2003a, b). The decrease in resting energy
expenditure can be attributed to the sheer decrease in fat free mass (see 1.6.1 Body
composition above) (Buchholz et al., 2003a). The energy expenditure associated with

22
physical activity is decreased due to the reduced quantity of muscle able to be recruited
during activity.
Energy intake, on the other hand, does not seem to be altered significantly by SCI.
Macronutrient intake in individuals with SCI remains within the acceptable distribution
ranges for the able-bodied (Walters et al., 2009); however, the proportion of fat and
refined carbohydrates remain high in North Americans with SCI compared to
recommended intake (Groah et al., 2009). This suggests that there is a role for nutritional
education and counseling following SCI (Groah et al., 2009). Overall, a positive energy
balance likely represents a notable contributor to metabolic complications following SCI.
1.6.3 Substrate metabolism
Substrate metabolism is another aspect of global metabolism that is perturbed by SCI.
Fat and carbohydrate are the major substrates that are metabolised to produce ATP
(Spriet and Hargreaves, 2006). The ratio of fuel use can vary widely depending on the
activity, intensity, and length of exertion (Bülow, 2004). At rest, both individuals with
SCI and those without use approximately equal fat and carbohydrate for oxidative
metabolism (Bülow, 2004; Astorino and Harness, 2009). During calorie deficits, for
example during fasting or sustained physical exercise, able-bodied individuals rely on fat
oxidation more than carbohydrate oxidation. During exercise, the respiratory exchange
ratio of SCI individuals reveals a reliance on carbohydrate oxidation – even when
exercise intensity is progressively increased (Astorino and Harness, 2009). Unlike able-
bodied individuals, those with SCI seem to depend almost entirely on their glycogen
stores (Horowitz, 2006; Astorino and Harness, 2009). Even endurance trained athletes
with SCI are unable to increase their fat oxidation levels during strenuous wheelchair

23
cycling exercise (75% VO2 peak) (Knechtle et al., 2004). This reduced capacity to
mobilize lipids during time of need likely contributes to the increased adipose stores in
this population (Edwards et al., 2008). Furthermore, the reliance on glycogen stores,
already depleted due to muscle atrophy, places individuals at risk of hypoglycemic events
(Schmitt et al., 2001a).
1.6.4 Circadian metabolic rhythms following SCI
Most circadian metabolic rhythms are strongly influenced by the sleep-wake cycle. Sleep
patterns are often disrupted as a result of SCI; people with SCI report difficulty falling
asleep, are awakened more often throughout the night, and describe their sleep quality as
poor (Biering-Sorensen and Biering-Sorensen, 2001; Norrbrink Budh et al., 2005).
Common nighttime complaints, and likely causes for disordered sleep patterns, include
obstructive sleep apnea, pain, difficulty voiding, and muscle spasms (Biering-Sorensen
and Biering-Sorensen, 2001; Norrbrink Budh et al., 2005). Rodents with low-thoracic
SCI also experience altered sleep patterns compared to sham-injured controls, which
manifests as increased wakefulness during the light cycle and more frequent sleep during
the dark cycle (Esteves et al., 2007). The alteration of the sleep-wake cycle likely affects
metabolism in both humans and rodents.
The disruption of typical melatonin secretion may contribute to disordered sleep-wake
cycles. Melatonin release from the pineal gland is governed by the SCN (Perreau-Lenz et
al., 2003) and is synchronized by light (Benstaali et al., 2001). This circuit is vulnerable
to disruption by cervical and high-thoracic SCI as it travels from the hypothalamus via
the cervical cord, before exiting the spinal cord at the upper thoracic levels and traveling
to the pineal gland via the superior cervical ganglion (Larsen et al., 1998). Cervical SCI

24
results in abnormally low melatonin levels with no nocturnal increase (Kneisley et al.,
1978; Li et al., 1989; Zeitzer et al., 2000). Given the importance of the sleep-wake cycle
and rhythmic release of hormones in the modulation of metabolism, it is possible that
altered circadian rhythmicity contributes to the metabolic pathologies that are prevalent
in the SCI population (Bauman and Spungen, 1994; Bauman et al., 1999a; Lee et al.,
2005; Gater, 2007; Edwards et al., 2008).
1.7 Blood sugar control following SCI
Paradoxically, both hypoglycemia and hyperglycemia occur with increased frequently in
individuals with SCI (Schmitt et al., 2001a). The most concerning aspect of impaired
blood sugar control is hyperglycemia, due to its association with glucose intolerance,
insulin resistance and diabetes (DeFronzo et al., 1989; Fery, 1994). Fasting
hyperglycemia has been documented in up to 23% of individuals with SCI (Duckworth et
al., 1983). Hyperglycemia, triggered by a high-glucose drink, is also more severe in
individuals with SCI, and takes longer to restore resting glucose levels (Bauman and
Spungen, 1994; Bauman et al., 1999a). Together these results suggest that people with
SCI have some difficulty maintaining glucose homeostasis. Indeed, the mean insulin
increase in response to glucose administration is also higher after SCI, which suggests
that insulin resistance is likely present in this population (Duckworth et al., 1980;
Bauman and Spungen, 1994). The development of insulin resistance after SCI has been
attributed to altered body composition (Duckworth et al., 1980) and prolonged inactivity
(Bauman and Spungen, 1994). There has not been any research into whether the
autonomic control of visceral organs plays an important role in this response.

25
The typical response to acute hypoglycemia involves a number of counter regulatory
changes that are partly effected by the SNS and thus could be affected by SCI. The acute
stage of insulin-induced hypoglycemia is counteracted primarily by an increase in adrenal
catecholamine and pancreatic glucagon secretions (Yamaguchi, 1992). Complete SCI
disrupts the descending autonomic control to both of these organs, and there is some
evidence that SNS dysfunction may contribute to hypoglycemia (Mathias et al., 1979).
Individuals with tetraplegia fail to increase plasma adrenaline and noradrenaline during
hypoglycemia (Mathias et al., 1979; Corrall and Frier, 1981). However, normoglycemia
is restored notwithstanding, which supports the redundancy between the adrenal and
pancreatic counter regulatory responses to acute hypoglycemia. Indeed, the glucagon
response is preserved after high-level SCI, which suggests that the local pancreatic
response is sufficient to increase glucagon secretion (Marliss et al., 1973; Palmer et al.,
1976; Corrall and Frier, 1981; Havel et al., 1994). Many of the symptoms typically
associated with hypoglycemia, such as sweating, anxiety, hunger, and tachycardia, are
triggered by the centrally-mediated catecholamine increase and therefore do not occur
after complete high SCI (Mathias and Frankel, 1999; Schmitt et al., 2001a). It is likely
that in the absence of symptoms, mild hypoglycemia is more frequently left to develop
into full-blown hypoglycemic events, contributing to the increased incidence in the SCI
population.
It is not known whether experimental SCI results in resting hyperglycemia, exaggerated
response to a glucose load, if insulin-induced hypoglycemia resolves normally, or
whether any of these responses are associated with level of SCI.

26
1.8 Experimental objectives
The overarching objective of the series of studies included in this thesis was to determine
whether thoracic SCI level, and resultant sympathetic dysfunction, contributes to altered
whole-body CV and metabolic function.
The aim of the first series of experiments (Chapter 2) was to describing the deficits in BP
control in relation to SCI level and time post-injury. While AD has been well described,
the hypotension associated with orthostatic challenge has never been assessed after
experimental SCI. Therefore, this work completes the CV profile after experimental SCI.
Based on the clinical manifestations of OH, I hypothesized that OH would be most severe
in high-level thoracic SCI acutely after injury. I further posited that both OH and AD
would remain stable after one month post-injury.
The next series of experiments were conducted to determine whether lipid metabolism is
altered by SCI (Chapter 3). This is another system where central SNS activity plays a
major role in controlling short- and long-term function. Here I employed gross measures
of adiposity and serum measures of cardiometabolic risk to determine whether these were
related to injury level – and consequently to the severity of sympathetic dysfunction.
Given the importance of sympathetic activity in mobilizing lipids from adipose tissue, I
hypothesized that adipose tissue accumulation would be titrated by injury level - with the
greatest accumulation following high-thoracic SCI. I expected that this increase in
adipose tissue would be reflected similarly in serum cholesterol and triglyceride levels.
In my final series of experiments (Chapter 4), I wanted to assess whether there were gross
differences in energy consumption and expenditure between sham, T3 and T10 SCI
animals that could potentially explain the increased energy storage observed in the

27
previous experiments (Chapter 3). My second aim was to determine whether circadian
rhythms in energy expenditure and blood glucose were maintained after SCI. Lastly, I
wanted to assess whether carbohydrate metabolism was disordered as a result of SCI.
Given the importance of autonomic balance in the regulation of circadian blood glucose I
hypothesized that circadian glucose patterns would be abolished by SCI. The acute
response to blood glucose changes is partly effected by the neural control of the adrenals,
pancreas and liver; therefore, I hypothesized that the response to hypo- and
hyperglycemic challenge would be slower in high-thoracic SCI animals than either low-
thoracic or sham-injured animals.

28
1.9 References Ahima RS (2006) Adipose tissue as an endocrine organ. Obesity (Silver Spring) 14 Suppl
5:242S-249S.
Alexander MS et al. (2009a) International standards to document remaining autonomic function after spinal cord injury. Spinal Cord 47:36-43.
Alexander MS et al. (2009b) Outcome measures in spinal cord injury: recent assessments and recommendations for future directions. Spinal Cord 47:582-591.
Amendt K, Czachurski J, Dembowsky K, Seller H (1979) Bulbospinal projections to the intermediolateral cell column: a neuroanatomical study. J Auton Nerv Syst 1:103-107.
Anderson K (2006) Foreword. Prog Brain Res 152:xi-xii.
Anderson KD (2004) Targeting recovery: priorities of the spinal cord-injured population. J Neurotrauma 21:1371-1383.
Aronson D (2001) Impaired modulation of circadian rhythms in patients with diabetes mellitus: a risk factor for cardiac thrombotic events? Chronobiol Int 18:109-121.
Astorino TA, Harness ET (2009) Substrate metabolism during exercise in the spinal cord injured. Eur J Appl Physiol 106:187-193.
Atkinson PP, Atkinson JL (1996) Spinal shock. Mayo Clin Proc 71:384-389.
Banrezes B, Andrey P, Maschino E, Schirar A, Peytevin J, Rampin O, Maurin Y (2002) Spatial segregation within the sacral parasympathetic nucleus of neurons innervating the bladder or the penis of the rat as revealed by three-dimensional reconstruction. Neuroscience 115:97-109.
Bauman WA, Spungen AM (1994) Disorders of carbohydrate and lipid metabolism in veterans with paraplegia or quadriplegia: a model of premature aging. Metabolism 43:749-756.
Bauman WA, Adkins RH, Spungen AM, Waters RL (1999a) The effect of residual neurological deficit on oral glucose tolerance in persons with chronic spinal cord injury. Spinal Cord 37:765-771.
Bauman WA, Spungen AM, Zhong YG, Rothstein JL, Petry C, Gordon SK (1992) Depressed serum high density lipoprotein cholesterol levels in veterans with spinal cord injury. Paraplegia 30:697-703.
Bauman WA, Adkins RH, Spungen AM, Herbert R, Schechter C, Smith D, Kemp BJ, Gambino R, Maloney P, Waters RL (1999b) Is immobilization associated with an

29
abnormal lipoprotein profile? Observations from a diverse cohort. Spinal Cord 37:485-493.
Bellinger L, Mendel V, Moberg G (1975) Circadian insulin, GH, prolactin, corticosterone and glucose rhythms in fed and fasted rats. Hormones and Metabolic Research 7:132-135.
Benstaali C, Mailloux A, Bogdan A, Auzeby A, Touitou Y (2001) Circadian rhythms of body temperature and motor activity in rodents their relationships with the light-dark cycle. Life Sci 68:2645-2656.
Biering-Sorensen B, Kristensen IB, Kjaer M, Biering-Sorensen F (2009) Muscle after spinal cord injury. Muscle Nerve 40:499-519.
Biering-Sorensen F, Biering-Sorensen M (2001) Sleep disturbances in the spinal cord injured: an epidemiological questionnaire investigation, including a normal population. Spinal Cord 39:505-513.
Bock P, Gorgas K (1976) Fine structure of baroreceptor terminals in the carotid sinus of guinea pigs and mice. Cell Tissue Res 170:95-112.
Brading A (1999) The autonomic nervous system and its effectors. Oxford, UK: Blackwell Science Ltd.
Bray MS, Young ME (2007) Circadian rhythms in the development of obesity: potential role for the circadian clock within the adipocyte. Obes Rev 8:169-181.
Brenes G, Dearwater S, Shapera R, LaPorte RE, Collins E (1986) High density lipoprotein cholesterol concentrations in physically active and sedentary spinal cord injured patients. Arch Phys Med Rehabil 67:445-450.
Brunner MJ, Greene AS, Frankle AE, Shoukas AA (1988) Carotid sinus baroreceptor control of splanchnic resistance and capacity. Am J Physiol 255:H1305-1310.
Buchholz AC, Pencharz PB (2004) Energy expenditure in chronic spinal cord injury. Curr Opin Clin Nutr Metab Care 7:635-639.
Buchholz AC, McGillivray CF, Pencharz PB (2003a) Differences in resting metabolic rate between paraplegic and able-bodied subjects are explained by differences in body composition. Am J Clin Nutr 77:371-378.
Buchholz AC, McGillivray CF, Pencharz PB (2003b) Physical activity levels are low in free-living adults with chronic paraplegia. Obes Res 11:563-570.
Bülow J (2004) Lipid mobilization and utilization. In: Principles of exercise biochemistry, 3rd Edition (Poortmans J, ed), pp 197-226. Basel: Karger.

30
Burgess HJ, Trinder J, Kim Y, Luke D (1997) Sleep and circadian influences on cardiac autonomic nervous system activity. Am J Physiol 273:H1761-1768.
Cailotto C, La Fleur SE, Van Heijningen C, Wortel J, Kalsbeek A, Feenstra M, Pevet P, Buijs RM (2005) The suprachiasmatic nucleus controls the daily variation of plasma glucose via the autonomic output to the liver: are the clock genes involved? Eur J Neurosci 22:2531-2540.
Cailotto C, van Heijningen C, van der Vliet J, van der Plasse G, Habold C, Kalsbeek A, Pevet P, Buijs RM (2008) Daily rhythms in metabolic liver enzymes and plasma glucose require a balance in the autonomic output to the liver. Endocrinology 149:1914-1925.
Calaresu FR, Yardley CP (1988) Medullary basal sympathetic tone. Annu Rev Physiol 50:511-524.
Cameron AA, Smith GM, Randall DC, Brown DR, Rabchevsky AG (2006) Genetic manipulation of intraspinal plasticity after spinal cord injury alters the severity of autonomic dysreflexia. J Neurosci 26:2923-2932.
Carroll KF, Nestel PJ (1973) Diurnal variation in glucose tolerance and in insulin secretion in man. Diabetes 22:333-348.
Casadei B, Meyer TE, Coats AJ, Conway J, Sleight P (1992) Baroreflex control of stroke volume in man: an effect mediated by the vagus. J Physiol 448:539-550.
Castro MJ, Apple DF, Jr., Hillegass EA, Dudley GA (1999) Influence of complete spinal cord injury on skeletal muscle cross-sectional area within the first 6 months of injury. Eur J Appl Physiol Occup Physiol 80:373-378.
Challet E, Pevet P, Vivien-Roels B, Malan A (1997) Phase-advanced daily rhythms of melatonin, body temperature, and locomotor activity in food-restricted rats fed during daytime. J Biol Rhythms 12:65-79.
Chalmers J, Badoer E, Morilak D, Drolet G, Minson JB, Llewellyn-Smith IJ, Somogyu P, Kapoor V, Pilowsky P (1991) Afferent inputs to ventrolateral medulla. In: Central neural mechanisms in cardiovascular regulation (Kunuos G, Cirielly J, eds). Cambridge, MA: Birkhauser Boston Ltd.
Chen RY, Fan FC, Schuessler GB, Chien S (1982) Baroreflex control of heart rate in humans during nitroprusside-induced hypotension. Am J Physiol 243:R18-24.
Chiasson JL, Liljenquist JE, Sinclair-Smith BC, Lacy WW (1975) Gluconeogenesis from alanine in normal postabsorptive man. Intrahepatic stimulatory effect of glucagon. Diabetes 24:574-584.
Cinti S (2001) The adipose organ. Milano, Italy: Editrice Kurtis.

31
Claydon VE, Krassioukov AV (2006) Orthostatic hypotension and autonomic pathways after spinal cord injury. J Neurotrauma 23:1713-1725.
Claydon VE, Krassioukov AV (2008) Clinical correlates of frequency analyses of cardiovascular control after spinal cord injury. Am J Physiol Heart Circ Physiol 294:H668-678.
Claydon VE, Elliott SL, Sheel AW, Krassioukov A (2006) Cardiovascular responses to vibrostimulation for sperm retrieval in men with spinal cord injury. J Spinal Cord Med 29:207-216.
Collins S, Cao W, Robidoux J (2004) Learning new tricks from old dogs: beta-adrenergic receptors teach new lessons on firing up adipose tissue metabolism. Mol Endocrinol 18:2123-2131.
Consensus Committee of the American Autonomic Society and the American Academy of Neurology (1996) Consensus statement on the definition of orthostatic hypotension, pure autonomic failure, and multiple system atrophy. Neurology 46:1470.
Corrall RJ, Frier BM (1981) Acute hypoglycemia in man: neural control of pancreatic islet cell function. Metabolism 30:160-164.
Cowen T, MacCormick DE, Toff WD, Burnstock G, Lumley JS (1982) The effect of surgical procedures on blood vessel innervation. A fluorescence histochemical study of degeneration and regrowth of perivascular adrenergic nerves. Blood Vessels 19:65-78.
Cowley AW, Jr. (1992) Long-term control of arterial blood pressure. Physiol Rev 72:231-300.
Curt A, Weinhardt C, Dietz V (1996) Significance of sympathetic skin response in the assessment of autonomic failure in patients with spinal cord injury. J Auton Nerv Syst 61:175-180.
Dampney RAL, Colean MJ, Fontes MAP, Hirooka Y, Horiuchi J, Li YW, Polson JW, Potts PD, Tagawa T (2002) Central mechanisms underlying short- and long-term regulation of the cardiovascular system. Clin Exper Pharm Phys 29:261-268.
Dearwater SR, LaPorte RE, Robertson RJ, Brenes G, Adams LL, Becker D (1986) Activity in the spinal cord-injured patient: an epidemiologic analysis of metabolic parameters. Med Sci Sports Exerc 18:541-544.
DeFronzo RA, Ferrannini E, Simonson DC (1989) Fasting hyperglycemia in non-insulin-dependent diabetes mellitus: contributions of excessive hepatic glucose production and impaired tissue glucose uptake. Metabolism 38:387-395.

32
Dryden DM, Saunders LD, Rowe BH, May LA, Yiannakoulias N, Svenson LW, Schopflocher DP, Voaklander DC (2003) The epidemiology of traumatic spinal cord injury in Alberta, Canada. Can J Neurol Sci 30:113-121.
Duckworth WC, Jallepalli P, Solomon SS (1983) Glucose intolerance in spinal cord injury. Arch Phys Med Rehabil 64:107-110.
Duckworth WC, Solomon SS, Jallepalli P, Heckemeyer C, Finnern J, Powers A (1980) Glucose intolerance due to insulin resistance in patients with spinal cord injuries. Diabetes 29:906-910.
Edgerton DS, Ramnanan CJ, Grueter CA, Johnson KM, Lautz M, Neal DW, Williams PE, Cherrington AD (2009) Effects of insulin on the metabolic control of hepatic gluconeogenesis in vivo. Diabetes 58:2766-2775.
Edwards LA, Bugaresti JM, Buchholz AC (2008) Visceral adipose tissue and the ratio of visceral to subcutaneous adipose tissue are greater in adults with than in those without spinal cord injury, despite matching waist circumferences. Am J Clin Nutr 87:600-607.
Ekland MB, Krassioukov AV, McBride KE, Elliott SL (2008) Incidence of autonomic dysreflexia and silent autonomic dysreflexia in men with spinal cord injury undergoing sperm retrieval: implications for clinical practice. J Spinal Cord Med 31:33-39.
Elder CP, Apple DF, Bickel CS, Meyer RA, Dudley GA (2004) Intramuscular fat and glucose tolerance after spinal cord injury--a cross-sectional study. Spinal Cord 42:711-716.
Eng J, Miller W (2008) Rehabilitation: From bedside to community following spinal cord injury. In: Eng JJ, Teasell RW, Miller WC, Wolfe DL, Townson AF, Hsieh JTC, Konnyu KJ, Connolly SJ, Foulon BL, Aubut JL, editors. Spinal Cord Injury Rehabilitation Evidence. Version 2.0. Vancouver: p1.1-1.11.
Esteves AM, Mello MT, Squarcini CF, Lancellotti CL, Comparoni A, Tufik S (2007) Sleep patterns over 15-day period in rats with spinal cord injury. Spinal Cord 45:360-366.
Fagius J, Karhuvaara S (1989) Sympathetic activity and blood pressure increases with bladder distension in humans. Hypertension 14:511-517.
Fawcett J (2002) Repair of spinal cord injuries: where are we, where are we going? Spinal Cord 40:615-623.
Fery F (1994) Role of hepatic glucose production and glucose uptake in the pathogenesis of fasting hyperglycemia in type 2 diabetes: normalization of glucose kinetics by short-term fasting. J Clin Endocrinol Metab 78:536-542.

33
Fisher JP, Ogoh S, Dawson EA, Fadel PJ, Secher NH, Raven PB, White MJ (2006) Cardiac and vasomotor components of the carotid baroreflex control of arterial blood pressure during isometric exercise in humans. J Physiol 572:869-880.
Frayn KN (2002) Adipose tissue as a buffer for daily lipid flux. Diabetologia 45:1201-1210.
Frayn KN, Karpe F, Fielding BA, Macdonald IA, Coppack SW (2003) Integrative physiology of human adipose tissue. Int J Obes Relat Metab Disord 27:875-888.
Furlan JC, Fehlings MG, Shannon P, Norenberg MD, Krassioukov AV (2003) Descending vasomotor pathways in humans: correlation between axonal preservation and cardiovascular dysfunction after spinal cord injury. J Neurotrauma 20:1351-1363.
Furlan R, Guzzetti S, Crivellaro W, Dassi S, Tinelli M, Baselli G, Cerutti S, Lombardi F, Pagani M, Malliani A (1990) Continuous 24-hour assessment of the neural regulation of systemic arterial pressure and RR variabilities in ambulant subjects. Circulation 81:537-547.
Gao SA, Ambring A, Lambert G, Karlsson AK (2002) Autonomic control of the heart and renal vascular bed during autonomic dysreflexia in high spinal cord injury. Clin Auton Res 12:457-464.
Garshick E, Kelley A, Cohen SA, Garrison A, Tun CG, Gagnon D, Brown R (2005) A prospective assessment of mortality in chronic spinal cord injury. Spinal Cord 43:408-416.
Gater DR, Jr. (2007) Obesity after spinal cord injury. Phys Med Rehabil Clin N Am 18:333-351.
Giannantoni A, Di Stasi SM, Scivoletto G, Mollo A, Silecchia A, Fuoco U, Vespasiani G (1998) Autonomic dysreflexia during urodynamics. Spinal Cord 36:756-760.
Giordano A, Song CK, Bowers RR, Ehlen JC, Frontini A, Cinti S, Bartness TJ (2006) White adipose tissue lacks significant vagal innervation and immunohistochemical evidence of parasympathetic innervation. Am J Physiol Regul Integr Comp Physiol 291:R1243-1255.
Goadsby PJ (2004) Cerebral Circulation: Autonomic Influences, 2nd Edition. San Diego: Elsevier Academic Press.
Gomez RA, Sequira Lopez MLS (2009) Who and where is the renal baroreceptor?: the connexin hypothesis. Kidney Int 75:460-462.
Goodpaster BH, Thaete FL, Kelley DE (2000) Thigh adipose tissue distribution is associated with insulin resistance in obesity and in type 2 diabetes mellitus. Am J Clin Nutr 71:885-892.

34
Gregory CM, Vandenborne K, Castro MJ, Dudley GA (2003) Human and rat skeletal muscle adaptations to spinal cord injury. Can J Appl Physiol 28:491-500.
Grimby G, Broberg C, Krotkiewska I, Krotkiewski M (1976) Muscle fiber composition in patients with traumatic cord lesion. Scand J Rehabil Med 8:37-42.
Groah SL, Nash MS, Ljungberg IH, Libin A, Hamm LF, Ward E, Burns PA, Enfield G (2009) Nutrient intake and body habitus after spinal cord injury: an analysis by sex and level of injury. J Spinal Cord Med 32:25-33.
Gurr M, James A (1971) Lipid biochemistry: an introduction. Ithaca, NY: Cornell University Press.
Guttmann L, Whitteridge D (1947) Effects of bladder distension on autonomic mechanisms after spinal cord injuries. Brain 70:361-404.
Guyenet PG (2006) The sympathetic control of blood pressure. Nat Rev Neurosci 7:335-346.
Havel PJ, Parry SJ, Stern JS, Akpan JO, Gingerich RL, Taborsky GJ, Jr., Curry DL (1994) Redundant parasympathetic and sympathoadrenal mediation of increased glucagon secretion during insulin-induced hypoglycemia in conscious rats. Metabolism 43:860-866.
He FJ, MacGregor GA (2003) Salt, blood pressure and the renin-angiotensin system. J Renin Angiotensin Altersterone Syst 4:11-16.
Helkowski WM, Ditunno JF, Jr., Boninger M (2003) Autonomic dysreflexia: incidence in persons with neurologically complete and incomplete tetraplegia. J Spinal Cord Med 26:244-247.
Henry JL, Calaresu FR (1972) Topography and numerical distribution of neurons of the thoraco-lumbar intermediolateral nucleus in the cat. J Comp Neurol 144:205-214.
Hitzig SL, Tonack M, Campbell KA, McGillivray CF, Boschen KA, Richards K, Craven BC (2008) Secondary health complications in an aging Canadian spinal cord injury sample. Am J Phys Med Rehabil 87:545-555.
Hjeltnes N (1977) Oxygen uptake and cardiac output in graded arm exercise in paraplegics with low level spinal lesions. Scand J Rehabil Med 9:107-113.
Holm C (2003) Molecular mechanisms regulating hormone-sensitive lipase and lipolysis. Biochem Soc Trans 31:1120-1124.
Horowitz JF (2006) Adipose Tissue Lipid Mobilization During Exercise, 2nd Edition. Champaign: Human Kinetics.

35
Hou S, Duale H, Cameron AA, Abshire SM, Lyttle TS, Rabchevsky AG (2008) Plasticity of lumbosacral propriospinal neurons is associated with the development of autonomic dysreflexia after thoracic spinal cord transection. J Comp Neurol 509:382-399.
Hsieh NK, Liu JC, Chen HI (2000) Localization of sympathetic postganglionic neurons innervating mesenteric artery and vein in rats. J Auton Nerv Syst 80:1-7.
Igawa Y, Satoh T, Mizusawa H, Seki S, Kato H, Ishizuka O, Nishizawa O (2003) The role of capsaicin-sensitive afferents in autonomic dysreflexia in patients with spinal cord injury. BJU Int 91:637-641.
Illman A, Stiller K, Williams M (2000) The prevalence of orthostatic hypotension during physiotherapy treatment in patients with an acute spinal cord injury. Spinal Cord 38:741-747.
Inskip JA, Ramer LM, Ramer MS, Krassioukov AV (2009) Autonomic assessment of animals with spinal cord injury: tools, techniques and translation. Spinal Cord 47:2-35.
Jacobs PL, Mahoney ET, Robbins A, Nash M (2002) Hypokinetic circulation in persons with paraplegia. Med Sci Sports Exerc 34:1401-1407.
Jänig W (2006) The integrative action of the autonomic nervous system, 1st Edition. Cambridge, UK Cambridge University Press.
Jones LM, Goulding A, Gerrard DF (1998) DEXA: a practical and accurate tool to demonstrate total and regional bone loss, lean tissue loss and fat mass gain in paraplegia. Spinal Cord 36:637-640.
Kalsbeek A, La Fleur S, Van Heijningen C, Buijs RM (2004) Suprachiasmatic GABAergic inputs to the paraventricular nucleus control plasma glucose concentrations in the rat via sympathetic innervation of the liver. J Neurosci 24:7604-7613.
Karlsson AK, Friberg P, Lonnroth P, Sullivan L, Elam M (1998) Regional sympathetic function in high spinal cord injury during mental stress and autonomic dysreflexia. Brain 121:1711-1719.
Kattail D, Furlan JC, Fehlings MG (2009) Epidemiology and clinical outcomes of acute spine trauma and spinal cord injury: experience from a specialized spine trauma center in Canada in comparison with a large national registry. J Trauma 67:936-943.
Kerkhof GA, Van Dongen HP, Bobbert AC (1998) Absence of endogenous circadian rhythmicity in blood pressure? Am J Hypertens 11:373-377.

36
Kewalramani LS (1980) Autonomic dysreflexia in traumatic myelopathy. Am J Phys Med 59:1-21.
Kiba T (2004) Relationships between the autonomic nervous system and the pancreas including regulation of regeneration and apoptosis: recent developments. Pancreas 29:e51-58.
Kirchheim HR (1976) Systemic arterial baroreceptor reflexes. Physiol Rev 56:100-177.
Kirchheim H, Ehmke H, Persson P (1988) Physiology of the renal baroreceptor mechanism of renin release and its role in congestive heart failure. Am J Cardiol 62:68E-71E.
Klein CE, Nies A, Gerber J (1994) The effect of age on the beta-adrenergic lipolytic response in healthy humans. Clin Pharmacol Ther 56:210-216.
Knechtle B, Muller G, Willmann F, Eser P, Knecht H (2004) Fat oxidation at different intensities in wheelchair racing. Spinal Cord 42:24-28.
Kneisley LW, Moskowitz MA, Lynch HG (1978) Cervical spinal cord lesions disrupt the rhythm in human melatonin excretion. J Neural Transm Suppl:311-323.
Krassioukov A (2006) Which pathways must be spared in the injured human spinal cord to retain cardiovascular control? Prog Brain Res 152:39-47.
Krassioukov A, Claydon VE (2006) The clinical problems in cardiovascular control following spinal cord injury: an overview. Prog Brain Res 152:223-229.
Krassioukov AV, Weaver LC (1995) Episodic hypertension due to autonomic dysreflexia in acute and chronic spinal cord-injured rats. Am J Physiol 268:H2077-2083.
Krassioukov AV, Weaver LC (1996) Morphological changes in sympathetic preganglionic neurons after spinal cord injury in rats. Neuroscience 70:211-225.
Krassioukov AV, Furlan JC, Fehlings MG (2003) Autonomic dysreflexia in acute spinal cord injury: an under-recognized clinical entity. J Neurotrauma 20:707-716.
Krassioukov AV, Karlsson AK, Wecht JM, Wuermser LA, Mathias CJ, Marino RJ (2007) Assessment of autonomic dysfunction following spinal cord injury: rationale for additions to International Standards for Neurological Assessment. J Rehabil Res Dev 44:103-112.
Krenz NR, Meakin SO, Krassioukov AV, Weaver LC (1999) Neutralizing intraspinal nerve growth factor blocks autonomic dysreflexia caused by spinal cord injury. J Neurosci 19:7405-7414.

37
Krum H, Louis WJ, Brown DJ, Jackman GP, Howes LG (1991) Diurnal blood pressure variation in quadriplegic chronic spinal cord injury patients. Clin Sci (Lond) 80:271-276.
Krum H, Howes LG, Brown DJ, Ungar G, Moore P, McNeil JJ, Louis WJ (1992) Risk factors for cardiovascular disease in chronic spinal cord injury patients. Paraplegia 30:381-388.
Kurpad A, Khan K, Macdonald I, Elia M (1995) Haemodynamic responses in muscle and adipose tissue and whole body metabolic responses during norepinephrine infusions in man. J Auton Nerv Syst 54:163-170.
La Fleur SE, Kalsbeek A, Wortel J, Buijs RM (1999) A suprachiasmatic nucleus generated rhythm in basal glucose concentrations. J Neuroendocrinol 11:643-652.
Langley JN (1921) The Autonomic Nervous System. Part I. Cambridge, UK: W. Heffer.
Larsen PJ, Enquist LW, Card JP (1998) Characterization of the multisynaptic neuronal control of the rat pineal gland using viral transneuronal tracing. Eur J Neurosci 10:128-145.
Lee MY, Myers J, Hayes A, Madan S, Froelicher VF, Perkash I, Kiratli BJ (2005) C-reactive protein, metabolic syndrome, and insulin resistance in individuals with spinal cord injury. J Spinal Cord Med 28:20-25.
Lehmann KG, Lane JG, Piepmeier JM, Batsford WP (1987) Cardiovascular abnormalities accompanying acute spinal cord injury in humans: incidence, time course and severity. J Am Coll Cardiol 10:46-52.
Leon DF, Shaver JA, Leonard JJ (1970) Reflex heart rate control in man. Am Heart J 80:729-739.
Levick JR (2003) An introduction to cardiovascular physiology, 4th Edition. London, UK: Arnold.
Li Y, Jiang DH, Wang ML, Jiao DR, Pang SF (1989) Rhythms of serum melatonin in patients with spinal lesions at the cervical, thoracic or lumbar region. Clin Endocrinol (Oxf) 30:47-56.
Lieber RL, Friden JO, Hargens AR, Feringa ER (1986) Long-term effects of spinal cord transection on fast and slow rat skeletal muscle. II. Morphometric properties. Exp Neurol 91:435-448.
Lindan R, Joiner E, Freehafer AA, Hazel C (1980) Incidence and clinical features of autonomic dysreflexia in patients with spinal cord injury. Paraplegia 18:285-292.

38
Linsell CR, Lightman SL, Mullen PE, Brown MJ, Causon RC (1985) Circadian rhythms of epinephrine and norepinephrine in man. J Clin Endocrinol Metab 60:1210-1215.
MacGregor GA, Markandu ND, Roulston JE, Jones JC, Morton JJ (1981) Maintenance of blood pressure by the renin-angiotensin system in normal man. Nature 291:329-331.
Magnusson I, Rothman DL, Gerard DP, Katz LD, Shulman GI (1995) Contribution of hepatic glycogenolysis to glucose production in humans in response to a physiological increase in plasma glucagon concentration. Diabetes 44:185-189.
Maiorov DN, Fehlings MG, Krassioukov AV (1998) Relationship between severity of spinal cord injury and abnormalities in neurogenic cardiovascular control in conscious rats. J Neurotrauma 15:365-374.
Maiorov DN, Krenz NR, Krassioukov AV, Weaver LC (1997) Role of spinal NMDA and AMPA receptors in episodic hypertension in conscious spinal rats. Am J Physiol 273:H1266-1274.
Marliss EB, Wollheim CB, Blondel B, Orci L, Lambert AE, Stauffacher W, Like AA, Renold AE (1973) Insulin and glucagon release from monolayer cell cultures of pancreas from newborn rats. Eur J Clin Invest 3:16-26.
Maruyama Y, Mizuguchi M, Yaginuma T, Kusaka M, Yoshida H, Yokoyama K, Kasahara Y, Hosoya T (2008) Serum leptin, abdominal obesity and the metabolic syndrome in individuals with chronic spinal cord injury. Spinal Cord 46:494-499.
Mathias CJ (1987) Autonomic dysfunction. Br J Hosp Med 38:238-243.
Mathias CJ (1995) Orthostatic hypotension: causes, mechanisms, and influencing factors. Neurology 45:S6-11.
Mathias CJ, Frankel HL (1983) Clinical manifestations of malfunctioning sympathetic mechanisms in tetraplegia. J Auton Nerv Syst 7:303-312.
Mathias CJ, Frankel HL (1999) Autonomic disturbances in spinal cord lesions, 4th Edition. Oxford: Oxford University Press.
Mathias CJ, Frankel HL, Turner RC, Christensen NJ (1979) Physiological responses to insulin hypoglycaemia in spinal man. Paraplegia 17:319-326.
Mathias CJ, Christensen NJ, Frankel HL, Peart WS (1980) Renin release during head-up tilt occurs independently of sympathetic nervous activity in tetraplegic man. Clin Sci (Lond) 59:251-256.

39
Mathias CJ, Christensen NJ, Corbett JL, Frankel HL, Goodwin TJ, Peart WS (1975) Plasma catecholamines, plasma renin activity and plasma aldosterone in tetraplegic man, horizontal and tilted. Clin Sci Mol Med 49:291-299.
Mayorov DN, Adams MA, Krassioukov AV (2001) Telemetric blood pressure monitoring in conscious rats before and after compression injury of spinal cord. J Neurotrauma 18:727-736.
McMahon D, Tutt M, Cook AM (2009) Pharmacological management of hemodynamic complications following spinal cord injury. Orthopedics 32:331.
Meijer JH, Schwartz WJ (2003) In search of the pathways for light-induced pacemaker resetting in the suprachiasmatic nucleus. J Biol Rhythms 18:235-249.
Mendoza J, Pevet P, Challet E (2007) Circadian and photic regulation of clock and clock-controlled proteins in the suprachiasmatic nuclei of calorie-restricted mice. Eur J Neurosci 25:3691-3701.
Mendoza J, Pevet P, Challet E (2008) High-fat feeding alters the clock synchronization to light. J Physiol 586:5901-5910.
Munakata M, Kameyama J, Kanazawa M, Nunokawa T, Moriai N, Yoshinaga K (1997) Circadian blood pressure rhythm in patients with higher and lower spinal cord injury: simultaneous evaluation of autonomic nervous activity and physical activity. J Hypertens 15:1745-1749.
Nash MS, Mendez AJ (2009) Nonfasting lipemia and inflammation as cardiovascular disease risks after SCI. Topics in Spinal Cord Injury Rehabilitation 14:15-31.
Nash MS, DeGroot J, Martinez-Arizala A, Mendez AJ (2005) Evidence for an exaggerated postprandial lipemia in chronic paraplegia. J Spinal Cord Med 28:320-325.
Nelson DL, Cox MM (2005) Principles of Biochemistry, 4th Edition. New York: W.H. Freeman and Company.
Nestel PJ, Austin W, Foxman C (1969) Lipoprotein lipase content and triglyceride fatty acid uptake in adipose tissue of rats of differing body weights. J Lipid Res 10:383-387.
Nitsche B, Perschak H, Curt A, Dietz V (1996) Loss of circadian blood pressure variability in complete tetraplegia. J Hum Hypertens 10:311-317.
Nonogaki K (2000) New insights into sympathetic regulation of glucose and fat metabolism. Diabetologia 43:533-549.

40
Norrbrink Budh C, Hultling C, Lundeberg T (2005) Quality of sleep in individuals with spinal cord injury: a comparison between patients with and without pain. Spinal Cord 43:85-95.
Olsson KE, Saltin B (1970) Variation in total body water with muscle glycogen changes in man. Acta Physiol Scand 80:11-18.
Osborn JW, Taylor RF, Schramm LP (1990) Chronic cervical spinal cord injury and autonomic hyperreflexia in rats. Am J Physiol 258:R169-174.
Palmer JP, Henry DP, Benson JW, Johnson DG, Ensinck JW (1976) Glucagon response to hypoglycemia in sympathectomized man. J Clin Invest 57:522-525.
Parlow J, Viale JP, Annat G, Hughson R, Quintin L (1995) Spontaneous cardiac baroreflex in humans. Comparison with drug-induced responses. Hypertension 25:1058-1068.
Perreau-Lenz S, Kalsbeek A, Garidou ML, Wortel J, van der Vliet J, van Heijningen C, Simonneaux V, Pevet P, Buijs RM (2003) Suprachiasmatic control of melatonin synthesis in rats: inhibitory and stimulatory mechanisms. Eur J Neurosci 17:221-228.
Petersen KF, Laurent D, Rothman DL, Cline GW, Shulman GI (1998) Mechanism by which glucose and insulin inhibit net hepatic glycogenolysis in humans. J Clin Invest 101:1203-1209.
Pickering TG, Gribbin B, Petersen ES, Cunningham DJ, Sleight P (1972) Effects of autonomic blockade on the baroreflex in man at rest and during exercise. Circ Res 30:177-185.
Pickett GE, Campos-Benitez M, Keller JL, Duggal N (2006) Epidemiology of traumatic spinal cord injury in Canada. Spine (Phila Pa 1976) 31:799-805.
Pyner S, Coote JH (1994) Evidence that sympathetic preganglionic neurones are arranged in target-specific columns in the thoracic spinal cord of the rat. J Comp Neurol 342:15-22.
Rajan S, McNeely MJ, Warms C, Goldstein B (2008) Clinical assessment and management of obesity in individuals with spinal cord injury: a review. J Spinal Cord Med 31:361-372.
Ramsay TG (1996) Fat cells. Endocrinol Metab Clin North Am 25:847-870.
Ross CA, Ruggiero DA, Park DH, Joh TH, Sved AF, Fernandez-Pardal J, Saavedra JM, Reis DJ (1984) Tonic vasomotor control by the rostral ventrolateral medulla: effect of electrical or chemical stimulation of the area containing C1 adrenaline neurons on arterial pressure, heart rate, and plasma catecholamines and vasopressin. J Neurosci 4:474-494.

41
Round JM, Barr FM, Moffat B, Jones DA (1993) Fibre areas and histochemical fibre types in the quadriceps muscle of paraplegic subjects. J Neurol Sci 116:207-211.
Rowell LB (1990) Importance of scintigraphic measurements of human splanchnic blood volume. J Nucl Med 31:160-162.
Rüger M, Scheer FA (2009) Effects of circadian disruption on the cardiometabolic system. Rev Endocr Metab Disord 10: 245-60.
Samra JS, Simpson EJ, Clark ML, Forster CD, Humphreys SM, Macdonald IA, Frayn KN (1996) Effects of epinephrine infusion on adipose tissue: interactions between blood flow and lipid metabolism. Am J Physiol 271:E834-839.
Scheer FA, Van Doornen LJ, Buijs RM (2004) Light and diurnal cycle affect autonomic cardiac balance in human; possible role for the biological clock. Auton Neurosci 110:44-48.
Scheer FA, Ter Horst GJ, van Der Vliet J, Buijs RM (2001) Physiological and anatomic evidence for regulation of the heart by suprachiasmatic nucleus in rats. Am J Physiol Heart Circ Physiol 280:H1391-1399.
Schmitt J, Midba M, McKenzie N (2001a) Hyperglycemic and Hypoglycemic Emergencies in Patients with SCI, 2nd Edition. New York: Demos Medical Publishing.
Schmitt J, Midba M, McKenzie N, Narla S (2001b) Autonomic Dysreflexia, 2nd Edition. New York: Demos Medical Publishing.
Seider MJ, Nicholson WF, Booth FW (1982) Insulin resistance for glucose metabolism in disused soleus muscle of mice. Am J Physiol 242:E12-18.
Sidorov EV, Townson AF, Dvorak MF, Kwon BK, Steeves J, Krassioukov A (2008) Orthostatic hypotension in the first month following acute spinal cord injury. Spinal Cord 46:65-69.
Silver JR (2000) Early autonomic dysreflexia. Spinal Cord 38:229-233.
Spriet L, Hargreaves M (2006) Overview of exercise metabolism. In: Exercise metabolism, 2nd Edition (Spriet L, Hargreaves M, eds), pp 1-6. Champaign: Human Kinetics.
Stjernberg L, Wallin BG (1983) Sympathetic neural outflow in spinal man. A preliminary report. J Auton Nerv Syst 7:313-318.
Strack AM, Sawyer WB, Marubio LM, Loewy AD (1988) Spinal origin of sympathetic preganglionic neurons in the rat. Brain Res 455:187-191.

42
Strauss DJ, Devivo MJ, Paculdo DR, Shavelle RM (2006) Trends in life expectancy after spinal cord injury. Arch Phys Med Rehabil 87:1079-1085.
Teasell RW, Arnold JM, Krassioukov A, Delaney GA (2000) Cardiovascular consequences of loss of supraspinal control of the sympathetic nervous system after spinal cord injury. Arch Phys Med Rehabil 81:506-516.
Tederko P, Limanowska H, Krasuski M, Kiwerski J (2006) Problems of adaptation to wheelchair in early stage rehabilitation after spinal cord trauma. Ortop Traumatol Rehabil 8:672-679.
Tsai LL, Tsai YC, Hwang K, Huang YW, Tzeng JE (2005) Repeated light-dark shifts speed up body weight gain in male F344 rats. Am J Physiol Endocrinol Metab 289:E212-217.
Tschakovsky ME, Sheriff DD (2004) Immediate exercise hyperemia: contributions of the muscle pump vs. rapid vasodilation. J Appl Physiol 97:739-747.
Uyama N, Geerts A, Reynaert H (2004) Neural connections between the hypothalamus and the liver. Anat Rec A Discov Mol Cell Evol Biol 280:808-820.
Vale FL, Burns J, Jackson AB, Hadley MN (1997) Combined medical and surgical treatment after acute spinal cord injury: results of a prospective pilot study to assess the merits of aggressive medical resuscitation and blood pressure management. J Neurosurg 87:239-246.
Van Dongen HP, Maislin G, Kerkhof GA (2001) Repeated assessment of the endogenous 24-hour profile of blood pressure under constant routine. Chronobiol Int 18:85-98.
Wallin G (1986) Abnormalities of sympathetic regulation after cervical cord lesions. Acta Neurochir Suppl (Wien) 36:123-124.
Walters JL, Buchholz AC, Martin Ginis KA (2009) Evidence of dietary inadequacy in adults with chronic spinal cord injury. Spinal Cord 47:318-322.
Weaver FM, Collins EG, Kurichi J, Miskevics S, Smith B, Rajan S, Gater D (2007) Prevalence of obesity and high blood pressure in veterans with spinal cord injuries and disorders: a retrospective review. Am J Phys Med Rehabil 86:22-29.
Wilt T, Carlson F, Goldish G, MacDonald R, Niewoehner C, Rutkus I, Shamliyan T, Tacklind J, Taylor B, Kane R (2008) Carbohydrate & lipid disorders & relevant considerations in persons with spinal cord injury. Evidence report/Technology assessment No. 163. In. Rockville, MD.: Agency for Healthcare Research and Quality.
Yamaguchi N (1992) Sympathoadrenal system in neuroendocrine control of glucose: mechanisms involved in the liver, pancreas, and adrenal gland under hemorrhagic and hypoglycemic stress. Can J Physiol Pharmacol 70:167-206.

43
Yeoh M, McLachlan EM, Brock JA (2004) Tail arteries from chronically spinalized rats have potentiated responses to nerve stimulation in vitro. J Physiol 556:545-555.
Youngstrom TG, Bartness TJ (1995) Catecholaminergic innervation of white adipose tissue in Siberian hamsters. Am J Physiol 268:R744-751.
Youngstrom TG, Bartness TJ (1998) White adipose tissue sympathetic nervous system denervation increases fat pad mass and fat cell number. Am J Physiol 275:R1488-1493.
Zeitzer JM, Ayas NT, Shea SA, Brown R, Czeisler CA (2000) Absence of detectable melatonin and preservation of cortisol and thyrotropin rhythms in tetraplegia. J Clin Endocrinol Metab 85:2189-2196.

44
2 CARDIOVASCULAR RESPONSES TO ORTHOSTATIC STRESS,
COLORECTAL DISTENSION AND SEXUAL STIMULATION IN RATS WITH
SPINAL CORD INJURY1
2.1 Introduction
Animals with spinal cord injury (SCI) exhibit cardiovascular (CV) abnormalities and
dysfunctions similar to those observed clinically. In the first week post-injury, animals
with high-thoracic SCI experience low resting blood pressure (BP) due to neurogenic
shock and loss of circadian rhythms (Mayorov et al., 2001); in the longer term, these
animals are prone to autonomic dysreflexia (AD), characterized by episodes of
hypertension, which is typically induced experimentally by colon distension
(Krassioukov and Weaver, 1995; Leman et al., 2000; Mayorov et al., 2001). However,
there are many other stimuli activities of daily living that can lead to debilitating hypo- or
hypertension that have never been tested in experimental animal research.
Orthostatic hypotension (OH) is one aspect of CV dysfunction that has received little
attention in experimental SCI. OH is a clinical concern and a frustrating reality that can
restrict the activities and functional independence of individuals with SCI throughout
their lives (Illman et al., 2000; Claydon and Krassioukov, 2006; Chelvarajah et al., 2009;
Jegede et al., 2009). It is typically defined by a decrease in systolic arterial pressure
(SAP) of greater or equal to 20mmHg, or decrease in diastolic arterial pressure (DAP) of
10mmHg or more, within three minutes of being subjected to an orthostatic challenge
1 A version of this chapter will be submitted for publication. Inskip, J.A., Ramer, L.M., Ramer, M.S. and Krassioukov, A.V. (2010) Cardiovascular responses to orthostatic stress, colorectal distension and sexual stimulation in rats with spinal cord injury.

45
(Consensus Committee of the American Autonomic Society and the American Academy
of Neurology, 1996).
OH is one of the most common barriers to beginning early rehabilitation (Illman et al.,
2000; Tederko et al., 2006); as many as 73.6% of individuals are unable to participate in
physiotherapy because their BP falls dramatically with the assumption of a seated posture
or transfer to a wheelchair (Illman et al., 2000). There is some reduction in the frequency
and severity of OH over time. The incidence decreases dramatically from 7 days to 30
days post-injury; however, 74% of those with motor complete cervical SCI, and 20% of
individuals with upper thoracic motor complete SCI continue to suffer from OH one
month post-injury (Sidorov et al., 2008). For a large portion of individuals with high-
thoracic or cervical injuries, OH persists in the chronic period following injury and limits
the use of standing wheelchairs or frames (Chelvarajah et al., 2009). More than a year
post-injury, 50% of individuals with cervical SCI experienced marked SAP decreases
during a “sit-up” test (average decrease -15 mmHg), a passive maneuver in which the
subject is moved from a supine to seated position by the raising of the torso and flexion
of the knees to a 90 degree angle (Claydon and Krassioukov, 2006). While there are
several pharmacological methods (Freeman, 2008; Krassioukov et al., 2009b), non-
pharmacological methods (Elokda et al., 2000; Sampson et al., 2000; Faghri and Yount,
2002; Gillis et al., 2008), and several promising novel targets (Wecht et al., 2005; Wecht
et al., 2007; Wecht et al., 2009) to mitigate the symptoms and incidence of OH, OH
continues to restrict the daily activities of individuals with SCI.
One of the unique features of managing OH in this population is that a majority also
alternately deal with crippling bouts of hypertension. These sudden episodes of high BP

46
triggered by noxious or non-noxious sensory input below the injury level, known as
autonomic dysreflexia (AD), add another challenge to the daily lives of many with
injuries above T6 (Mathias and Frankel, 1999; Teasell et al., 2000). The symptoms of
AD can cause mild to severe discomfort but untreated episodes have the potential to
develop into life-threatening crises, which can culminate in seizures, pulmonary edema,
retinal or intracerebral hemorrhage, or even death (Yarkony et al., 1986; Colachis and
Fugate, 2002; Pan et al., 2005; Valles et al., 2005; Dolinak and Balraj, 2007; Calder et al.,
2009). While the initiating stimulus may vary between individuals, common triggers
include a distended bladder, routine bowel activity, or a tight wheelchair strap. Acute
management involves the removal of the precipitating stimulus, movement into a seated
position, and if hypertension is sustained then antihypertensive medications are initiated
(Krassioukov et al., 2009a).
Sexual activity-induced AD has recently emerged as an important topic in CV
management after SCI. The CV abnormalities associated with sexual stimulation have
typically been studied in men undergoing vibrostimulation for sperm retrieval; however,
their presence has implications for sexual activity more generally after SCI. Research
conducted during vibrostimulation has informed us about silent and malignant AD
(Elliott and Krassioukov, 2006; Ekland et al., 2008). Like most episodes of AD, those
induced by vibrostimulation are typically alleviated by the removal of the triggering
stimulus; however, several cases have been described where persistent periods of
dysreflexia occurred following sexual activity, which worsened over a one-week period
(Elliott and Krassioukov, 2006). These episodes, termed malignant AD, are troubling
because they do not resolve with stimulus removal. Also of grave concern is silent AD,

47
in which individuals are asymptomatic despite pronounced increases in SAP
(Linsenmeyer et al., 1996; Kirshblum et al., 2002; Ekland et al., 2008). This discrepancy
between symptoms and measured BP can make it impossible for individuals to detect
when they are experiencing a dysreflexic episode, and so they might fail to initiate
treatment. The potential dangers associated with these episodes makes education and
counseling an integral aspect of sexual health and CV management after SCI. Despite
being a critical issue in the clinical management of individuals with SCI, CV responses to
sexual stimulation have scarcely been reported in SCI animals (Sansone et al., 1997), and
never in male SCI rats.
The main goal of this study was to characterize the CV responses to three clinically
relevant stimuli known to elicit profound CV changes during routine activities of
individuals with SCI. Orthostatic tolerance, which has not been examined before in
experimental SCI, was assessed at one week (acute), one month (subacute) and three
months (chronic) after T3 or T10 SCI. In order to examine the effect of time post-injury
on the severity of AD, colorectal distension (CRD)-evoked AD was examined in animals
with T3 SCI at one and three months post-injury. Finally, sexual stimulation was tested
as an additional trigger of AD in animals with T3 SCI at one month post-injury.
Together these experiments demonstrate the feasibility of adapting novel stimuli to the
battery of autonomic assessments currently performed in experimental SCI laboratories.
Given that the recovery of autonomic function, particularly bladder, bowel and sexual
function, is a priority for individuals with SCI (Anderson, 2004), we propose that the
autonomic assessments detailed herein be added to the arsenal of motor, sensory and
autonomic tests currently in use after experimental SCI.

48
2.2 Materials and methods
All animal procedures were performed in accordance with the guidelines of the Canadian
Council for Animal Care and approved by the University of British Columbia Animal
Care Committee. All animals used were male Wistar rats (n=55; 300-400g)
2.2.1 Surgeries
Prophylactic antibiotics were administered for three days pre-operatively (enrofloxacin,
Baytril; 10 mg/kg, subcutaneous (s.c.), Associated Veterinary Purchasing (AVP),
Langley, Canada). On the day of surgery, rats were anesthetized with ketamine
hydrochloride (Vetalar; 70 mg/kg, intraperitoneal (i.p.), University of McGill Animal
Resources Centre, Montreal, Canada) and medetomidine hydrochloride (Domitor; 0.5
mg/kg, i.p., AVP). Buprenorphine (Temgesic; 0.02 mg/kg, s.c., University of McGill
Animal Resources Centre, Montreal, Canada) and ketoprofen (Anafen; 5 mg/kg, s.c.,
AVP) were administered prior to surgery.
A complete transection was performed at T3 (n=23) or T10 (n=22), or a sham surgery
was performed at T3 (n=10). The surgical protocols used in our laboratory have recently
been described in detail elsewhere (Inskip et al., 2010). For T3 SCI, a midline incision
was made over the T2 process and the overlying muscles were blunt dissected. The T2
spinous process was removed and the intervertebral gap at T2/3 was cleared of
connective tissue. The dura was opened with microscissors and the spinal cord was cut
using small scissors. Complete transection was confirmed under the surgical microscope,
haemostasis was achieved and gelfoam was inserted at the transection gap. The muscle
layer and skin layer were closed with sutures. The anesthetic was reversed with

49
atipamezole hydrochloride (Antisedan; 50 µL, 5mg/mL, s.c., AVP). Lactated Ringer’s
solution was administered (5mL, s.c.) and animals were kept in a temperature-controlled
environment for one hour post-operatively. The T10 SCI was performed as above,
except the incision was performed at the lower thoracic level, a laminectomy was
perfomed at T8, and the spinal cord was cut at T10.
Animals were closely monitored acutely after injury. Antibiotics (enrofloxacin; 10
mg/kg, s.c.) and analgesics (Temgesic; 0.02 mg/kg, s.c. and Anafen; 5 mg/kg, s.c.) were
continued for three days post-injury. Urinary bladders were emptied by manual
compression four times daily for the first week post-injury, and three times daily after
that, until the return of reflex micturition, about 10 days post-injury. All animals
received a high-calorie diet, including fruit, Ensure (Meal replacement, Shopper’s Drug
Mart) and TransGel liquid supplement (Charles River Laboratories Inc., Pointe-Claire,
Canada). Rat kibble (Lab Diet 2001, PMI Nutrition International, Jamieson’s Pet Food
Dist., Delta, Canada) was provided ad libitum and water was provided using modified
low-reaching water bottles. Animals were housed in modified cages, with a rubber mat
on top of the regular bedding, to facilitate locomotion. Rats were weighed and monitored
using other objective criteria every day for the first two weeks after SCI, and every
second day thereafter.
Carotid artery cannulation was performed at one week, one month or three months after
injury. Animals received ketoprofen (5 mg/kg, s.c.) pre-operatively, and surgery was
carried out under isoflurane anesthetic (Aerrane; 5% induction, 1-2% maintenance in
100% O2, AVP). The left common carotid artery was cannulated with an intra-arterial
polyurethane catheter (3 Fr; Instech Laboratories Inc., Plymouth Meeting, PA) and filled

50
with a lock solution (1:10 heparin in 5% dextrose, AVP). The cannula was tunneled
subcutaneously and surfaced from a small incision between the scapulae.
2.2.2 Physiological testing
Not all groups of animals were subjected to all aspects of physiological testing at all
timepoints. Sham animals were only subjected to an orthostatic stress at one month post-
injury, as we did not expect any changes in their BP control over time. CRD and sexual
stimulation were not performed in sham-injured animals; these stimuli are difficult to
perform in these animals because these animals are sensate. Furthermore, we have
shown that they do not experience AD when subjected to CRD (Krassioukov and
Weaver, 1995). The response of animals with T10 SCI to CRD was tested, though sexual
stimulation was not.
In preparation for physiological recording, rats were handled daily by the same
researchers throughout the experiment. In addition, all rats were habituated to the testing
movements and physical environment several times before testing. Animals were
acclimated to the testing room for at least one hour prior to testing. At the time of testing,
cannulae were flushed with a small amount of heparin (0.01 mL; 1:10 heparin in 5%
dextrose) and attached via a 30 cm length of polyethylene tubing (PE-50) to a fluid filled
dome mounted on a pressure transducer (SP844, MEMScAP, Norway). Data was
recorded using PowerLab (AD Instuments, Australia) and saved for off-line analysis.
Heart rate (HR) was calculated from the interbeat interval.
Before any physiological manipulations began, baseline beat-to-beat BP was collected
from animals in their home cage for 5 minutes. Following baseline recording, an acute

51
orthostatic stress was applied by a weight supported 90° head-up tilt for 10 seconds. This
maneuver was performed using a tea towel to provide loose restraint: rats were held on
the experimenter’s forearm until baseline BP was achieved at which point the
experimenter tilted her forearm, and the rat, to 90 degrees, keeping the abdomen of the rat
in the same location during the tilt; this position was held for 10 seconds and then the
forearm was returned to a horizontal position, again pivoting around the abdomen of the
rat. Three tilts were performed in each recording session, with a rest period between each
tilt to allow BP to return to baseline values.
Colorectal distension (CRD) was performed similarly to methods described previously
(Krassioukov and Weaver, 1995). Briefly, the distal tip of a Swan-Ganz catheter
(Edwards Lifesciences, Mississauga, Canada) was generously covered in lubricant and
inserted 5 cm into the rectum. The catheter was secured to the proximal tail using tape,
being careful not to constrict the tail in the process. A five-minute rest period was
allowed before any further testing to allow BP to return to baseline if it was altered
during the process of inserting the rectal catheter. To begin the period of CRD, the
balloon tip of the catheter was slowly filled with 2 mL of air over a period of 10 seconds,
using a 3 cc syringe connected to the balloon inflation port. The balloon distends to the
approximate size of several fecal boli, and exerts a pressure of about 35 mmHg
(unpublished observations). The pressure was maintained for a period of 60 seconds at
which time the syringe was removed and the pressure alleviated. A 10-minute recovery
period was recorded following CRD.
Sexual stimulation was performed by loose restraint of the rat and retraction of the
preputial sheath for 30 seconds. This well-described method was first developed as a
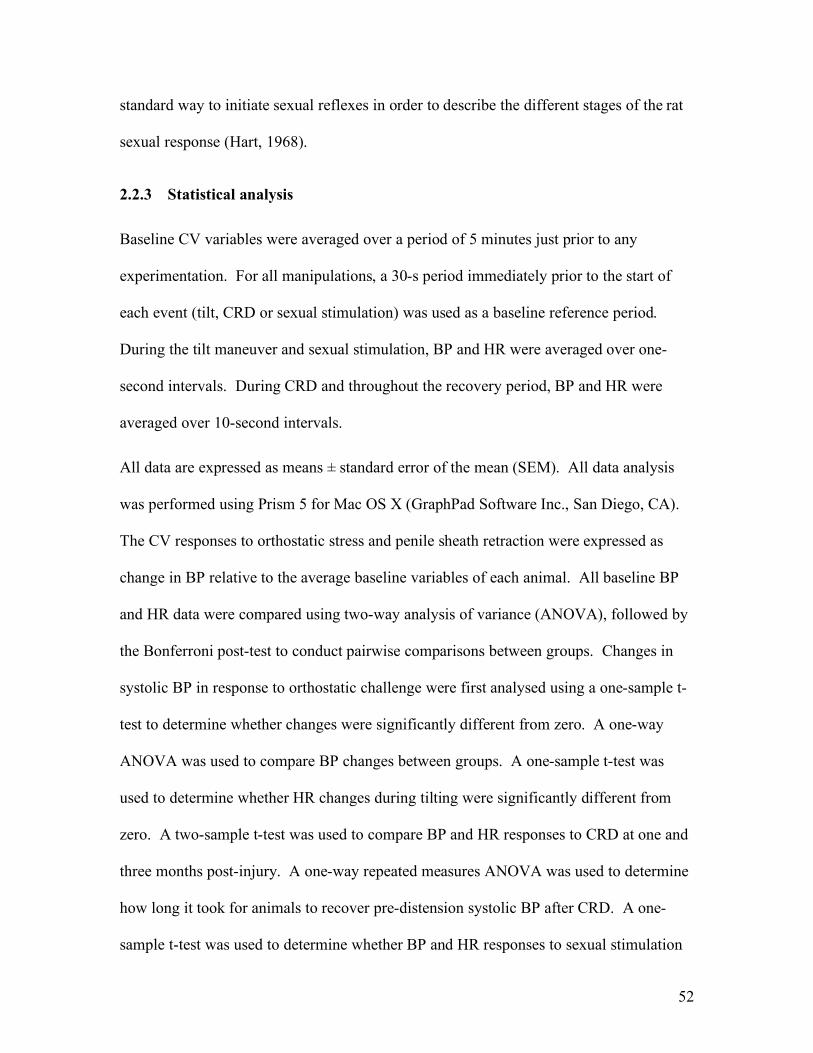
52
standard way to initiate sexual reflexes in order to describe the different stages of the rat
sexual response (Hart, 1968).
2.2.3 Statistical analysis
Baseline CV variables were averaged over a period of 5 minutes just prior to any
experimentation. For all manipulations, a 30-s period immediately prior to the start of
each event (tilt, CRD or sexual stimulation) was used as a baseline reference period.
During the tilt maneuver and sexual stimulation, BP and HR were averaged over one-
second intervals. During CRD and throughout the recovery period, BP and HR were
averaged over 10-second intervals.
All data are expressed as means ± standard error of the mean (SEM). All data analysis
was performed using Prism 5 for Mac OS X (GraphPad Software Inc., San Diego, CA).
The CV responses to orthostatic stress and penile sheath retraction were expressed as
change in BP relative to the average baseline variables of each animal. All baseline BP
and HR data were compared using two-way analysis of variance (ANOVA), followed by
the Bonferroni post-test to conduct pairwise comparisons between groups. Changes in
systolic BP in response to orthostatic challenge were first analysed using a one-sample t-
test to determine whether changes were significantly different from zero. A one-way
ANOVA was used to compare BP changes between groups. A one-sample t-test was
used to determine whether HR changes during tilting were significantly different from
zero. A two-sample t-test was used to compare BP and HR responses to CRD at one and
three months post-injury. A one-way repeated measures ANOVA was used to determine
how long it took for animals to recover pre-distension systolic BP after CRD. A one-
sample t-test was used to determine whether BP and HR responses to sexual stimulation

53
were significantly different from zero. Paired t-tests were used to compare baseline CV
variables and those during sexual stimulation.
2.3 Results
Resting BP and HR values are presented in Table 2.1. Each variable was compared for
the same injury level at different times post-injury, as well as for different injury levels at
the same time post-injury. There was a significant difference in systolic BP between
groups (p<0.0001). Pairwise comparisons revealed that systolic arterial pressure (SAP)
was significantly lower in animals with T3 SCI one week, but not one month, after injury
compared to sham-injured controls (p<0.05). SAP was higher in animals with T10 SCI
one month post-injury compared to animals with T3 SCI one month post-injury
(p<0.0001), T10 SCI one week post-injury (p<0.01) and T10 SCI three months post-
injury (p<0.05).
The average SAP responses to the acute orthostatic stress (Figure 2.1) are shown at one
week (a), one month (b) and three months (c) post-injury. Animals with T3 SCI
responded to tilting with a profound decrease in SAP, while the T10 and sham groups
responded with an increase in SAP. To quantify the hypotension in animals with T3 SCI,
BP change was expressed as the maximum decrease in SAP during tilting (Figure 2.1d).
The maximum decrease in SAP during the tilt was significantly different from zero in all
high-thoracic SCI groups; at one week post-injury (p=0.0011), one month post-injury
(p=0.0039) and three months post-injury (p=0.0088). This decline in BP was more
severe at one week than at one month or three months after injury (both p<0.0001). The

54
Table 2.1 Resting cardiovascular variables were similar across injury levels and
time post-injury.
Baseline beat-to-beat blood pressure (BP) recording from intra-carotid cannulae averaged
over a period of 5 minutes, revealed that there was little difference in resting BP or heart
rate (HR) between groups. Only systolic arterial pressure (SAP) differed between
groups: animals with T3 SCI at one week post-injury experienced resting hypotension; at
one month post-injury, animals with T10 SCI demonstrated higher SAP than sham
controls and animals with T10 SCI at one week or three months. Generally speaking, the
resting cardiovascular variables were similar between groups.
Symbols: * denotes significantly different from T3 SCI one month post-injury
(p<0.0001); § denotes significantly different from sham-injured animals one month post-
injury; † denotes significantly different from T10 SCI one week (p<0.01); ‡ denotes
significantly different from T10 SCI three months (p<0.05).
Abbreviations: bpm, beats per minute; DAP, diastolic arterial pressure; HR, heart rate;
MAP, mean arterial pressure;. SAP, systolic arterial pressure.

55
SAP (mmHg) DAP (mmHg) MAP (mmHg) HR (bpm) 1 month (n=5) 140.0 ± 3.8 118.4 ± 4.0 125.6 ± 3.9 445.6 ± 16.2 Sham
3 months (n=5) 142.0 ± 3.3 113.4 ± 5.7 122.9 ± 4.4 494.9 ± 15.9
1 week (n=5) 115.1 ± 6.3*§ 99.4 ± 5.1 104.7 ± 5.4 502.9 ± 6.6
1 month (n=7) 127.2 ± 4.9 105.2 ± 5.0 112.5 ± 4.9 493.7 ± 11.1
T3 SCI
3 months (n=8) 132.5 ± 3.7 111.61 ± 5.3 118.6 ± 4.6 471.0 ± 9.7
1 week (n=6) 133.3 ± 6.2 110.9 ± 3.1 118.4 ± 3.9 503.8 ± 11.7
1 month (n=5) 159.8 ± 1.8* † ‡ 119.8 ± 1.2 133.1 ± 1.2 494.9 ± 15.9
T10 SCI
3 months (n=7) 137.0 ± 3.9 115.1 ± 4.3 122.4 ± 3.4 442.0 ± 9.4

56
Figure 2.1 Orthostatic hypotension was present after high- but not low-thoracic
transection, and was more severe acutely after injury.
One week post-injury (a) animals with T3 SCI (n=5) showed a pronounced decline in
systolic BP in response to a 90-degree tilt, while those with T10 SCI (n=6) showed little
BP change during the same maneuver. One month post-injury (b) animals with T3 SCI
(n=5) experienced a modest decline in BP in response to an orthostatic stress, while
sham-injured animals (n=5) and animals with T10 SCI (n=5) showed a slight increase in
BP. Three months post-injury (c) animals with T3 SCI (n=5) also experienced a modest
decrease in BP and animals with T10 SCI (n=6) again showed a moderate increase in BP
over this time. The maximum decrease in systolic BP (d) was significantly different from
zero only in animals with T3 SCI. This decline in BP was more severe at one week than
at one month (p<0.0001) or three months after injury (p<0.0001).
Symbols: * denotes significantly different from one week post-injury, p<0.0001.

57

58
maximum decrease in SAP was not statistically different from zero in the sham-injured
animals (p=0.15) or in the low-thoracic SCI groups, one week (p=0.83), one month
(p=0.068) or three months post-injury (p=0.086).
Average HR responses to tilting are shown in Figure 2.2. One week post-injury, animals
with T10 SCI showed an increase in HR beginning shortly after the start of tilting (Figure
2.2a). Animals with T3 SCI, on the other hand, exhibited bradycardia in the early part of
the tilt and only increased their HR in the second half of the tilt (Figure 2.2a). At one
month post-injury, sham-injured animals showed a rapid increase in HR in response to
tilting (Figure 2.2b). In animals with T3 SCI, tilting also triggered tachycardia, but this
response was slower and less pronounced than sham-injured animals (p=0.0498, Figure
2.2b).
The maximum HR change during tilting from pre-tilting baseline (Figure 2.2d) was
significantly different from zero in sham-injured animals (p=0.023), animals with T3 SCI
at one (p=0.026) and three months post-injury (p=0.047), and animals with T10 SCI one
week (p=0.015) and three months post-injury (p=0.043). The peak HR response was
quite variable in animals with T3 SCI at one week post-injury and in animals with T10
SCI at one month post-injury; neither of these groups had a maximum HR different from
zero (p=0.063, p=0.073).
Colorectal distension (CRD) triggered hypertension in animals with high-thoracic SCI
(Figure 2.3a,b). Animals with low-thoracic SCI also exhibited some hypertension during
CRD; however, this was significantly less than animals with high thoracic SCI
(p=0.0015). The hypertension in animals with high-thoracic SCI was accompanied by

59
Figure 2.2 Animals exhibited tachycardia in response to an acute orthostatic stress.
One week post-injury (a) Animals with T10 SCI (n=6) exhibited modest tachycardia
during tilting that resolved shortly after the return to a horizontal position. Animals with
T3 SCI (n=5) did not exhibit tachycardia until the second half of the tilt. One month
post-injury (b) sham-injured animals (n=5) showed a rapid increase in heart rate (HR).
Animals with T10 SCI (n=4) exhibited a modest increase in HR, but the rate of increase
appeared slower than sham-injured animals. Animals with T3 SCI (n=5) showed a slight
increase in HR during tilting. Three months post-injury (c), both animals with T3 SCI
(n=5) and those with T10 SCI (n=6) showed an increased HR during tilting. The
maximum increase in HR (d) was significantly greater than zero in all animals except for
T3 SCI animals one week post-injury (p=0.063) and animals with T10 SCI one month
post-injury (p=0.073). For the most part, there were no differences in the degree of
tachycardia; however, at one month post-injury, the increase in HR was more pronounced
in sham-injured animals than in animals with T3 SCI (p=0.0498).
Symbols: * denotes significantly different from sham-injured group (p<0.05).

60

61
Figure 2.3 Colorectal distension elicited hypertension and bradycardia in animals
with high-thoracic SCI, while animals with low-thoracic SCI experienced milder
hypertension accompanied by tachycardia
At one month post-injury, animals with high-thoracic SCI exhibited pronounced
increases in blood pressure (BP) in response to colorectal distension (CRD)
(representative beat-to-beat BP trace (a),b). Animals with low-thoracic SCI, on the other
hand, displayed small and transient changes in blood pressure in response to CRD
(representative beat-to-beat BP trace (c),b). The maximum change in systolic BP was
significantly higher in animals with high-thoracic SCI compared to those with low-
thoracic SCI (b). The heart rate (HR) response to CRD was bradycardia in animals with
high-thoracic SCI, while animals with low-thoracic SCI exhibited tachycardia.
Symbols: * denotes significant difference from animals with T10 SCI (p<0.05); grey bar
indicates duration of colorectal distension (CRD).

62

63
bradycardia, while animals with low-thoracic SCI exhibited tachycardia during CRD
(Figure 2.3d). These responses were significantly different from each other (p=0.015).
CRD elicited pronounced hypertension and bradycardia at both one and three months
following T3 SCI. The peak hypertension and bradycardia were quantitatively
indistinguishable at one and three months after T3 SCI (Table 2.2). There was no
difference in peak SAP, DAP, MAP, HR or mean change in these variables between the
two groups (p>0.05 for all comparisons). While peak changes were indistinguishable,
animals with T3 SCI recovered pre-distension SAP more quickly at one month than at
three months post-injury (Figure 2.4a, b). At one month post-injury the SAP returned to
baseline levels within 30 seconds following the deflation of the distension stimulus (black
arrow, Figure 2.4a). In contrast, at three months after injury, animals did not recover pre-
distension SAP until 110 seconds after the alleviation of distension (grey arrow, Figure
2.4a). Examination of representative beat-to-beat traces during CRD (Figure 2.4c,d)
revealed one factor that likely contributed to the slow recovery three months post-injury,
namely BP increases in this group in response to deflation of the balloon catheter.
One month after T3 SCI, penile sheath retraction induced BP changes characteristic of
AD. A representative BP trace (Figure 2.5) shows the increase in both SAP and DAP in
response to this stimulation. The maximum SAP during stimulation ranged from 144.8
mmHg to 180.2 mmHg (Table 2.3). Tachycardia was present at the time of peak SAP.
Peak SAP during penile sheath retraction was significantly higher than pre-stimulation
(p=0.0042); that is to say, the peak change in SAP was significantly greater than zero.
Peak DAP (p<0.0024) and MAP (p=0.003) were both higher than pre-stimulation values.
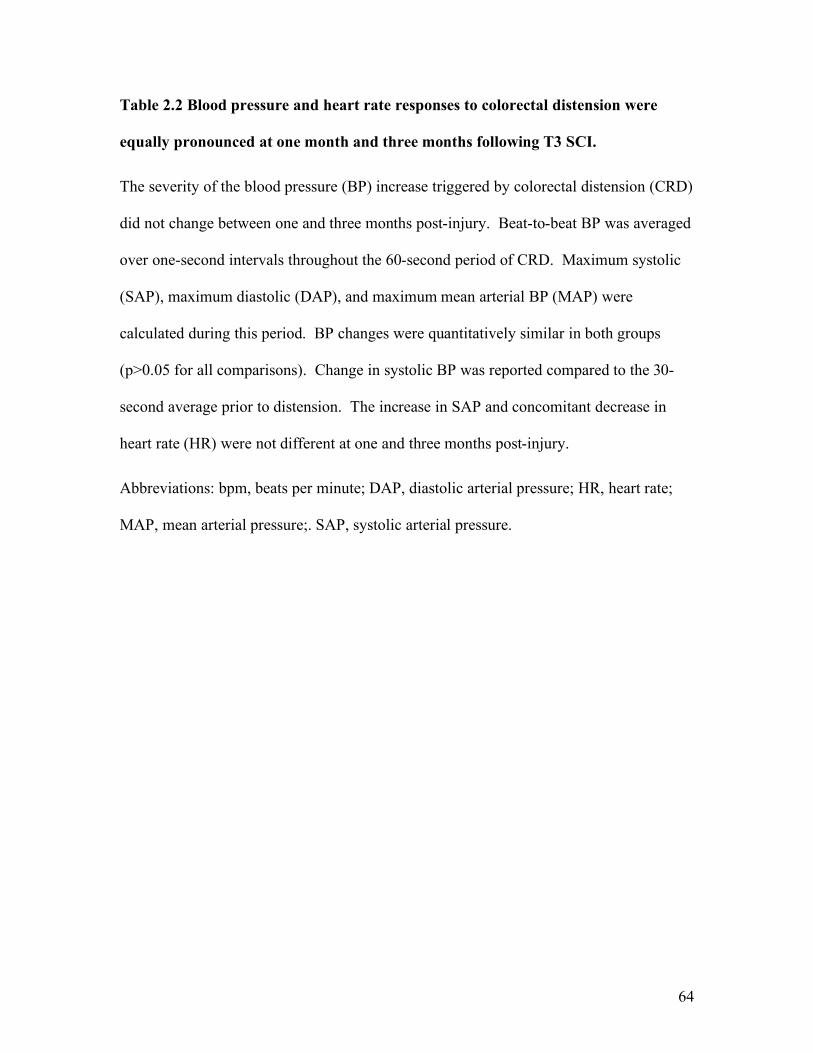
64
Table 2.2 Blood pressure and heart rate responses to colorectal distension were
equally pronounced at one month and three months following T3 SCI.
The severity of the blood pressure (BP) increase triggered by colorectal distension (CRD)
did not change between one and three months post-injury. Beat-to-beat BP was averaged
over one-second intervals throughout the 60-second period of CRD. Maximum systolic
(SAP), maximum diastolic (DAP), and maximum mean arterial BP (MAP) were
calculated during this period. BP changes were quantitatively similar in both groups
(p>0.05 for all comparisons). Change in systolic BP was reported compared to the 30-
second average prior to distension. The increase in SAP and concomitant decrease in
heart rate (HR) were not different at one and three months post-injury.
Abbreviations: bpm, beats per minute; DAP, diastolic arterial pressure; HR, heart rate;
MAP, mean arterial pressure;. SAP, systolic arterial pressure.

65
T3 SCI HR (bpm) SAP (mmHg) DAP (mmHg) MAP (mmHg)
Maximum 439.7 ±12.15 166.3 ± 4.15 133.6 ± 3.92 144.5 ± 3.79 1 month (n=5) Change -60.41 ± 18.86 45.34 ± 4.43 32.34 ± 2.60 36.48 ± 3.00
Maximum 429.0 ± 16.23 180.8 ± 4.52 144.5 ± 5.75 156.5 ± 4.70 3 months (n=6) Change -59.68 ± 15.00 52.88 ± 8.12 40.16 ± 6.70 44.35 ± 7.06

66
Figure 2.4 Colorectal distension elicited pronounced hypertension and bradycardia
in animals with T3 SCI at one and three months post-injury.
At one and three months post-injury, systolic arterial pressure (SAP) (a) increased with
CRD and began to return to baseline when distension was alleviated. One month after
injury, SAP returned to pre-distension levels more rapidly than at three months post-
injury (arrow indicates SAP is no longer elevated compared to pre-distension levels).
The HR (b) in both groups showed reflex bradycardia during the period of distension,
which slowly returned to pre-distension levels after the balloon was deflated.
Representative blood pressure (BP) recordings of animals with T3 SCI that were
subjected to CRD at one or three months post-injury are shown in c and d. At one month
post-injury (c) BP typically began to return steadily to baseline levels after CRD was
alleviated. At three months post-injury we often observed a second rise in BP when the
balloon catheter was deflated (d).
Symbols: arrow indicates SAP is no longer elevated compared to pre-distension levels.

67

68
Figure 2.5 Representative arterial blood pressure recording of an animal with T3
SCI undergoing penile sheath retraction one month post-injury.
Both systolic and diastolic blood pressure were elevated during sexual stimulus (penile
sheath retraction).
Symbols: grey bar indicates duration of sexual stimulus.

69

70
Table 2.3 Sexual stimulation elicited hypertension and tachycardia in animals with
T3 SCI.
Penile sheath retraction was performed for a period of 60 seconds. Beat-to-beat blood
pressure (BP) was averaged over one-second intervals, and maximum systolic (SAP),
diastolic (DAP), and mean arterial BP (MAP) were calculated during this period. Change
in SAP was reported compared to the 30-second average prior to stimulation. Heart rate
(HR) was reported at the time of peak SAP.
Abbreviations: bpm, beats per minute; DAP, diastolic arterial pressure; HR, heart rate;
MAP, mean arterial pressure; SAP, systolic arterial pressure.

71
T3 SCI HR (bpm) SAP (mmHg) DAP (mmHg) MAP (mmHg)
Baseline 522.7 ± 13.2 132.5 ± 5.2 106.7 ± 4.8 115.3 ± 4.8
Maximum 554.5 ± 10.5 160.1 ± 5.6 131.6 ± 4.5 140.9 ± 4.6 1 month
(n=7) Change 31.8 ± 5.1 27.5 ± 6.1 24.84 ± 4.96 25.62 ± 5.34

72
2.4 Discussion
Here we present the first comprehensive assessment of baseline CV variables and CV
responses in SCI animals over a range of time post-injury. We employed a variety of
clinically relevant stimuli that are known to elicit CV dysfunction during activities of
daily living of individuals with SCI. Resting BP and HR were similar across time and
level post-injury, except for a decreased SAP one week post-injury in animals with T3
SCI and an increased SAP at one month following T10 SCI. OH was present in high, but
not low, thoracic SCI and was most severe in the acute period (one week) post-injury.
The hypertension and bradycardia characteristic of AD was present in animals with high-
thoracic SCI but not those with low-thoracic SCI. AD was similar at one and three
months post-injury, but the hypertensive episode resolved more quickly in the one month
group.
To date, OH has only been investigated in animals with intact nervous systems. The
majority of these studies have focused on the mechanisms associated with CV
deconditioning and orthostatic intolerance after spaceflight (Hawkey, 2003; Williams et
al., 2009). Aerospace research has established the head-up tilt is as a robust model of
orthostatic stress. This model has been shown to reliably induce hypotension in rats
exposed to simulated microgravity (Sun et al., 2004; Tarasova et al., 2007). It has also
been a useful tool to investigate the physiological changes involved in the typical
response to orthostasis (Raffai et al., 2005; Ramsey et al., 2007). These studies,
involving conscious rats, have typically been performed using a plastic restraint cylinder
combined with a protractor to determine the angle of elevation (Martel et al., 1996;
Ramsey et al., 2007; Bedette et al., 2008). Due to the significant amount of handling that

73
our animals received throughout their recovery, we chose to perform the tilt on our arms
with a simple loose restraint. We found this to be less stressful for the animals as they
were less likely to slip and experience muscle spasms during tilting. The profound and
repeatable decreases in BP that we observed lead us to believe that this maneuver is
robust and reproducible. Orthostatic instability has never, to our knowledge, been
described in animals with SCI.
OH was most severe in high-thoracic SCI animals acutely after injury. This agrees well
with what has been documented clinically (Sidorov et al., 2008). The diminished
response to orthostatic stress at one and three months after injury suggests that there
could be some form of compensation, so that the BP fall is reduced even in the continued
absence of functional descending sympathetic pathways. Plasma volume expansion, for
example could improve orthostatic tolerance (Groomes and Huang, 1991). Conversely,
the dramatic fall in BP one week after T3 SCI is unlikely to be due to hypovolemia or
other surgery-associated complications, as we did not see an effect one week after T10
SCI.
Another possibility is that animals sustained an increase in muscle spasms associated
with tilting, which would increase venous return to the heart. We did not notice a major
increase in tilt-induced muscle spasms over time following SCI, however, we did not
formally measure them. Sham and T10 SCI groups both showed an increase in BP
during tilting. This is similar to that observed in individuals with low level injuries and
those without neurological injury undergoing the “sit-up test” (Claydon and Krassioukov,
2006).

74
During the “sit-up test”, we observed an increased HR in individuals with cervical SCI,
thoracic SCI, and in able-bodied controls (Claydon and Krassioukov, 2006). Similarly,
here we observed tachycardia in all groups undergoing an acute orthostatic stress. Reflex
tachycardia was equally pronounced in sham-injured animals and those with T3 SCI at
one week post-injury, despite the more pronounced hypotensive stimulus in the latter.
Furthermore, the baroreflex-mediated effects on HR appeared to be delayed in the latter.
We have recently shown that individuals with cervical SCI show a larger reflex delay in
response to a “sit-up maneuver” (Claydon and Krassioukov, 2008), possibly due to a
delay in the cardiac baroreflex response (Claydon et al., 2005). Although our animals
have a T3 SCI, this injury can disrupt some cardiac sympathetic innervation, which could
disrupt the sympathetic portion of the cardiac baroreflex response. More research is
clearly warranted in this area, especially with regards to the effects of SCI in the high-
thoracic region, where cardiac sympathetic control is partially preserved.
Since its inception, CRD has proven to be a robust stimulus for producing AD
(Krassioukov and Weaver, 1995). This clinically relevant maneuver is reproducible and
fairly simple to perform, and remains the most widely-used procedure for studying AD
worldwide. Here we have shown that CRD does not induce AD in animals with low-
thoracic SCI; the mild hypotension and tachycardia was significantly different from the
hypertension and bradycardia exhibited by animals with high-thoracic SCI. Other
visceral stimuli, such as a distended bladder, have also been shown to be potent inducers
of AD in animals with high- but not low- thoracic SCI (Rivas et al., 1995). Together
these results suggest that the investigation of AD after SCI or after therapeutic
intervention may be a useful tool for determining the level of autonomic lesion

75
To date, the majority of studies using CRD to examine AD have observed the CV
response in animals up to one month post-injury (Krassioukov and Weaver, 1995; Leman
et al., 2000; Mayorov et al., 2001; Krassioukov et al., 2002; Landrum et al., 2002; Marsh
and Weaver, 2004; Hou et al., 2008), while some have observed animals to 6 to 8 weeks
post-injury (Mayorov et al., 2001; Collins and Dicarlo, 2002; Marsh and Weaver, 2004;
Laird et al., 2006; Kalincik et al., in press; Laird et al., 2009). Many SCI research groups
are starting to follow SCI animals out to more chronic time periods after injury; therefore,
we thought that it was important to determine whether AD is changed quantitatively or
qualitatively with time post-injury. In many ways, the response to CRD was similar at
one and three months post-injury; peak BP and HR changes were indistinguishable.
However, the average BP and HR responses over time show that the normalization of
SAP and HR occurs much more quickly at one month than three months post-injury. The
alleviation of AD, typically achieved shortly after the removal of the offending stimulus,
is clinically important because it means that the blood vessel endothelium is no longer
exposed to acute mechanical stress.
Sexual activity has recently emerged as a salient trigger for AD clinically. In humans,
self-stimulation and vibratory penile stimulation have been documented to increase SAP
by as much as 107 mmHg, and similar increases are likely present during sexual activity
at home (Sheel et al., 2005; Claydon et al., 2006; Courtois et al., 2008). Sexual
stimulation can also elicit malignant AD which is characterized by significant and
prolonged elevations in arterial BP that are difficult to manage (Elliott and Krassioukov,
2006). These examples demonstrate the need for documentation and research in this
area. There is currently only one study of animal evidence describing CV responses to

76
sexual stimulation in female rats following SCI (Sansone et al., 1997). This study found
that vaginocervical stimulation elicited hypertension and bradycardia in rats with mid-
thoracic, but not lumbar, SCI (Sansone et al., 1997). In our study, we utilized penile
sheath retraction as a sexual stimulus in male rats. Unlike CRD and vaginocervical
stimulation, during sexual stimulation we observed modest tachycardia.
Despite the technical challenges associated with autonomic assessment in animals, AD is
beginning to be included as an outcome measure following interventions for SCI
(Kalincik et al., in press). Our current work elucidates two important aspects of CV
autonomic testing after SCI: the addition of an orthostatic stress test and the importance
of multimodal testing. While CRD has already been well characterized as a model, an
acute orthostatic stress has never been applied to spinal cord injured animals. The
inclusion of OH assessment provides a second physiological measure to strengthen
conclusions made regarding the degree of autonomic dysfunction after SCI. The head-up
tilt provides a simple and complementary assessment of CV function. As there are a
multitude of possible triggers of AD present in activities of daily living, it is also
important to have multiple modes of afferent stimulation available to test this condition
experimentally. If a treatment is put forward to prevent or alleviate AD, it must be
robust, and therefore must reduce the severity of BP changes, regardless of the stimulus.
A variety of clinically relevant stimuli must be ready to test these potential treatments in
animal models of SCI.
We acknowledge that there are limitations to physiological testing performed in animals.
The behavioural responses of rodents are shaped by their nature as a prey species and we
are conscious of the element of stress during testing. In our baseline evaluation of BP

77
and HR, we observed an increased SAP in animals with T10 SCI at one month compared
one week post-injury. This elevation could be the result of increased stress in the one
week group compared to the one month group, as the latter would have been handled a
greater number of times before physiological testing; however, the fact that the DAP and
MAP were not different between groups suggests that, overall, BP was not profoundly
different. Secondly, during sexual stimulation, the HR response was unlike the
bradycardia most often seen clinically. While this response during AD can be variable,
with some individuals experiencing tachycardia, there are several reasons that our
animals might be more likely to experience tachycardia. The injury level in our
experiment (T3) partially preserves sympathetic cardiac innervation; therefore
tachycardia could have been manifested as part of the normal response to stress.
Furthermore, after testing a number of different ways to expose the perineal area, we
found that the most effective was to hold the animals vertically; however, this also
presented an orthostatic stress which could be responsible for eliciting tachycardia
induced by baroreflex withdrawal. These examples highlight the inherent complexities
in animal physiological research and speak to the importance of minimizing stress in
experimental protocols.
There have been exciting and constructive developments in autonomic spinal cord injury
research over the past few years. First, in collaboration with ASIA and ISCOS,
comprehensive autonomic evaluation standards have been established to be used in
clinical diagnosis and research studies after SCI (Alexander et al., 2009b). Secondly, an
international panel, The Spinal Cord Outcomes Partnership Endeavor (SCOPE), has
recently evaluated the methodology and validity of some of the most common general

78
autonomic function outcome measures (Alexander et al., 2009a). While no one tool has
emerged as a clear forerunner, this evaluation provides a sense of the reliability and
prevalence of the tools currently in use. It also provides evidence of a concerted
movement towards a more rigorous approach to autonomic testing.
We believe that it is critical for our animal models keep pace with what is important
clinically and medically after SCI. Here we have described the CV response to
orthostatic stress and sexual stimulation, both of which are novel and clinically relevant
models for assessment of autonomic dysfunctions following SCI. Sexual stimulation,
similar to CRD, incited a persistent elevation of arterial BP, consistent with the presence
of AD. A head-up tilt demonstrated CV changes consistent with OH. Both of these
could be used as outcome measures to test therapeutic interventions after SCI. The use of
these analogous assessments in our clinical and experimental subjects should facilitate
the translation of our understanding of CV changes after SCI between the bench and the
bedside.

79
2.5 References Alexander MS et al. (2009a) Outcome measures in spinal cord injury: recent assessments
and recommendations for future directions. Spinal Cord 47:582-591.
Alexander MS et al. (2009b) International standards to document remaining autonomic function after spinal cord injury. Spinal Cord 47:36-43.
Anderson KD (2004) Targeting recovery: priorities of the spinal cord-injured population. J Neurotrauma 21:1371-1383.
Bedette D, Santos RA, Fontes MA (2008) Cardiovascular reactivity after blockade of angiotensin AT1 receptors in the experimental model of tilting test in conscious rats. Br J Pharmacol 153:966-971.
Calder KB, Estores IM, Krassioukov A (2009) Autonomic dysreflexia and associated acute neurogenic pulmonary edema in a patient with spinal cord injury: a case report and review of the literature. Spinal Cord 47:423-425.
Chelvarajah R, Knight SL, Craggs MD, Middleton FR (2009) Orthostatic hypotension following spinal cord injury: impact on the use of standing apparatus. NeuroRehabilitation 24:237-242.
Claydon VE, Krassioukov AV (2006) Orthostatic hypotension and autonomic pathways after spinal cord injury. J Neurotrauma 23:1713-1725.
Claydon VE, Krassioukov AV (2008) Clinical correlates of frequency analyses of cardiovascular control after spinal cord injury. Am J Physiol Heart Circ Physiol 294:H668-678.
Claydon VE, Elliott S, Krassioukov A (2005) Increased delay of the arterial baroreflex in individuals with cervical spinal cord injury. Clin Auton Res 15:335.
Claydon VE, Elliott SL, Sheel AW, Krassioukov A (2006) Cardiovascular responses to vibrostimulation for sperm retrieval in men with spinal cord injury. J Spinal Cord Med 29:207-216.
Colachis SC, Fugate LP (2002) Autonomic dysreflexia associated with transient aphasia. Spinal Cord 40:142-144.
Collins HL, Dicarlo SE (2002) Acute exercise reduces the response to colon distension in T(5) spinal rats. Am J Physiol Heart Circ Physiol 282:H1566-1570.
Consensus Committee of the American Autonomic Society and the American Academy of Neurology (1996) Consensus statement on the definition of orthostatic hypotension, pure autonomic failure, and multiple system atrophy. Neurology 46:1470.

80
Courtois FJ, Charvier KF, Leriche A, Vezina JG, Cote M, Belanger M (2008) Blood pressure changes during sexual stimulation, ejaculation and midodrine treatment in men with spinal cord injury. BJU Int 101:331-337.
Dolinak D, Balraj E (2007) Autonomic dysreflexia and sudden death in people with traumatic spinal cord injury. Am J Forensic Med Pathol 28:95-98.
Ekland MB, Krassioukov AV, McBride KE, Elliott SL (2008) Incidence of autonomic dysreflexia and silent autonomic dysreflexia in men with spinal cord injury undergoing sperm retrieval: implications for clinical practice. J Spinal Cord Med 31:33-39.
Elliott S, Krassioukov A (2006) Malignant autonomic dysreflexia in spinal cord injured men. Spinal Cord 44:386-392.
Elokda AS, Nielsen DH, Shields RK (2000) Effect of functional neuromuscular stimulation on postural related orthostatic stress in individuals with acute spinal cord injury. J Rehabil Res Dev 37:535-542.
Faghri PD, Yount J (2002) Electrically induced and voluntary activation of physiologic muscle pump: a comparison between spinal cord-injured and able-bodied individuals. Clin Rehabil 16:878-885.
Freeman, R (2003) Treatment of orthostatic hypotension. Semin Neurol 23:435-442.
Freeman R (2008) Current pharmacologic treatment for orthostatic hypotension. Clin Auton Res 18 Suppl 1:14-18.
Gillis DJ, Wouda M, Hjeltnes N (2008) Non-pharmacological management of orthostatic hypotension after spinal cord injury: a critical review of the literature. Spinal Cord 46:652-659.
Groomes TE, Huang CT (1991) Orthostatic hypotension after spinal cord injury: treatment with fludrocortisone and ergotamine. Arch Phys Med Rehabil 72:56-58.
Hart BL (1968) Sexual reflexes and mating behavior in the male rat. J Comp Physiol Psychol 65:453-460.
Hawkey A (2003) The physical price of a ticket into space. J Br Interplanet Soc 56:152-159.
Hou S, Duale H, Cameron AA, Abshire SM, Lyttle TS, Rabchevsky AG (2008) Plasticity of lumbosacral propriospinal neurons is associated with the development of autonomic dysreflexia after thoracic spinal cord transection. J Comp Neurol 509:382-399.

81
Illman A, Stiller K, Williams M (2000) The prevalence of orthostatic hypotension during physiotherapy treatment in patients with an acute spinal cord injury. Spinal Cord 38:741-747.
Inskip JA, Plunet W, Ramer LM, Ramsey JB, Yung A, Kozlowski P, Ramer MS, Krassioukov AV (2010) Cardiometabolic risk factors in experimental spinal cord injury. J Neurotrauma 27:275-285.
Jegede AB, Rosado-Rivera D, Bauman WA, Cardozo CP, Sano M, Moyer JM, Brooks M, Wecht JM (2010) Cognitive performance in hypotensive persons with spinal cord injury. Clin Auton Res 20:3-9.
Kalincik T, Choi EA, Feron F, Bianco J, Sutharsan R, Hayward I, Mackay-Sim A, Carrive P, Waite PM (in press) Olfactory ensheathing cells reduce duration of autonomic dysreflexia in rats with high spinal cord injury. Auton Neurosci.
Kirshblum SC, House JG, O'Connor K C (2002) Silent autonomic dysreflexia during a routine bowel program in persons with traumatic spinal cord injury: a preliminary study. Arch Phys Med Rehabil 83:1774-1776.
Krassioukov A, Eng JJ, Warburton DE, Teasell R (2009a) A systematic review of the management of orthostatic hypotension after spinal cord injury. Arch Phys Med Rehabil 90:876-885.
Krassioukov A, Warburton DE, Teasell R, Eng JJ (2009b) A systematic review of the management of autonomic dysreflexia after spinal cord injury. Arch Phys Med Rehabil 90:682-695.
Krassioukov AV, Weaver LC (1995) Episodic hypertension due to autonomic dysreflexia in acute and chronic spinal cord-injured rats. Am J Physiol 268:H2077-2083.
Krassioukov AV, Johns DG, Schramm LP (2002) Sensitivity of sympathetically correlated spinal interneurons, renal sympathetic nerve activity, and arterial pressure to somatic and visceral stimuli after chronic spinal injury. J Neurotrauma 19:1521-1529.
Laird AS, Carrive P, Waite PM (2006) Cardiovascular and temperature changes in spinal cord injured rats at rest and during autonomic dysreflexia. J Physiol 577:539-548.
Laird AS, Carrive P, Waite PM (2009) Effect of Treadmill Training on Autonomic Dysreflexia in Spinal Cord-Injured Rats. Neurorehabil Neural Repair 23:910-920.
Landrum LM, Jones SL, Blair RW (2002) The expression of Fos-labeled spinal neurons in response to colorectal distension is enhanced after chronic spinal cord transection in the rat. Neuroscience 110:569-578.
Leman S, Bernet F, Sequeira H (2000) Autonomic dysreflexia increases plasma adrenaline level in the chronic spinal cord-injured rat. Neurosci Lett 286:159-162.

82
Linsenmeyer TA, Campagnolo DI, Chou IH (1996) Silent autonomic dysreflexia during voiding in men with spinal cord injuries. J Urol 155:519-522.
Marsh DR, Weaver LC (2004) Autonomic dysreflexia, induced by noxious or innocuous stimulation, does not depend on changes in dorsal horn substance p. J Neurotrauma 21:817-828.
Martel E, Champeroux P, Lacolley P, Richard S, Safar M, Cuche JL (1996) Central hypervolemia in the conscious rat: a model of cardiovascular deconditioning. J Appl Physiol 80:1390-1396.
Mathias CJ, Frankel HL (1999) Autonomic disturbances in spinal cord lesions, 4th Edition. Oxford: Oxford University Press.
Mayorov DN, Adams MA, Krassioukov AV (2001) Telemetric blood pressure monitoring in conscious rats before and after compression injury of spinal cord. J Neurotrauma 18:727-736.
Pan SL, Wang YH, Lin HL, Chang CW, Wu TY, Hsieh ET (2005) Intracerebral hemorrhage secondary to autonomic dysreflexia in a young person with incomplete C8 tetraplegia: A case report. Arch Phys Med Rehabil 86:591-593.
Raffai G, Meszaros M, Kollai M, Monos E, Dezsi L (2005) Experimental orthostasis elicits sustained hypertension, which can be prevented by sympathetic blockade in the rat. J Cardiovasc Pharmacol 45:354-361.
Ramsey MW, Behnke BJ, Prisby RD, Delp MD (2007) Effects of aging on adipose resistance artery vasoconstriction: possible implications for orthostatic blood pressure regulation. J Appl Physiol 103:1636-1643.
Rivas D, Chancellor M, Huang B, Salzman S (1995) Autonomic dysreflexia in a rat model of spinal cord injury and the effect of pharmacological agents. Neurourology and Urodynamics 14:141-152.
Sampson EE, Burnham RS, Andrews BJ (2000) Functional electrical stimulation effect on orthostatic hypotension after spinal cord injury. Arch Phys Med Rehabil 81:139-143.
Sansone GR, Bianca R, Cueva-Rolon R, Gomez LE, Komisaruk BR (1997) Cardiovascular responses to vaginocervical stimulation in the spinal cord-transected rat. Am J Physiol 273:R1361-1366.
Sheel AW, Krassioukov AV, Inglis JT, Elliott SL (2005) Autonomic dysreflexia during sperm retrieval in spinal cord injury: influence of lesion level and sildenafil citrate. J Appl Physiol 99:53-58.

83
Sidorov EV, Townson AF, Dvorak MF, Kwon BK, Steeves J, Krassioukov A (2008) Orthostatic hypotension in the first month following acute spinal cord injury. Spinal Cord 46:65-69.
Sun XQ, Sun HP, Yao YJ, Wang B (2004) Counteracting effect of head-up tilt on increased femoral venous compliance after simulated weightlessness in rabbits. J Gravit Physiol 11:P105-106.
Tarasova O, Borovik A, Tsvirkoun D, Lebedev V, Steeves J, Krassioukov A (2007) Orthostatic response in rats after hindlimb unloading: effect of transcranial electrical stimulation. Aviat Space Environ Med 78:1023-1028.
Teasell RW, Arnold JM, Krassioukov A, Delaney GA (2000) Cardiovascular consequences of loss of supraspinal control of the sympathetic nervous system after spinal cord injury. Arch Phys Med Rehabil 81:506-516.
Tederko P, Limanowska H, Krasuski M, Kiwerski J (2006) Problems of adaptation to wheelchair in early stage rehabilitation after spinal cord trauma. Ortop Traumatol Rehabil 8:672-679.
Valles M, Benito J, Portell E, Vidal J (2005) Cerebral hemorrhage due to autonomic dysreflexia in a spinal cord injury patient. Spinal Cord 43:738-740.
Wecht JM, Weir JP, Krothe AH, Spungen AM, Bauman WA (2007) Normalization of supine blood pressure after nitric oxide synthase inhibition in persons with tetraplegia. J Spinal Cord Med 30:5-9.
Wecht JM, Radulovic M, Weir JP, Lessey J, Spungen AM, Bauman WA (2005) Partial angiotensin-converting enzyme inhibition during acute orthostatic stress in persons with tetraplegia. J Spinal Cord Med 28:103-108.
Wecht JM, Radulovic M, Lafountaine MF, Rosado-Rivera D, Zhang RL, Bauman WA (2009) Orthostatic responses to nitric oxide synthase inhibition in persons with tetraplegia. Arch Phys Med Rehabil 90:1428-1434.
Williams D, Kuipers A, Mukai C, Thirsk R (2009) Acclimation during space flight: effects on human physiology. CMAJ 180:1317-1323.
Yarkony GM, Katz RT, Wu YC (1986) Seizures secondary to autonomic dysreflexia. Arch Phys Med Rehabil 67:834-835.

84
3 CARDIOMETABOLIC RISK FACTORS IN EXPERIMENTAL SPINAL
CORD INJURY1
3.1 Introduction
During the last three decades, significant improvements in critical care after spinal cord
injury (SCI) have dramatically reduced mortality in the acute period (Strauss et al., 2006).
However, mortality rates in the chronic period (>2 years following injury) have changed
very little, and people with SCI have a significantly reduced life expectancy (Garshick et
al., 2005; Strauss et al., 2006). The cardiovascular (CV) sequelae of SCI play an
important role, since cardiovascular disease (CVD) or dysfunction accounts for a
significant proportion of morbidity and mortality in chronic SCI (Garshick et al., 2005;
Strauss et al., 2006). Importantly, the spinal cord-injured population is afflicted with
CVD both at a higher prevalence and earlier than the able-bodied population (reviewed
by Myers et al., 2007).
Spinal cord injury alters body composition by precipitating changes in both lean and fat
mass. It is well-accepted that people with SCI have decreased lean mass, due to a
number of factors including disuse atrophy of paralyzed skeletal muscles (Grimby et al.,
1976; Castro et al., 1999), decreased bone density (Wilmet et al., 1995), and a reduction
in total body water (Nuhlicek et al., 1988). Recent evidence shows that people with SCI
carry increased visceral adipose tissue in the abdomen compared to able-bodied controls,
despite matching waist circumference (Edwards et al., 2008; Maruyama et al., 2008).
This is particularly salient because visceral adipose tissue is associated with increased CV 1 A version of this chapter has been published. Inskip JA, Plunet W, Ramer LM, Ramsey JB, Yung A, Kozlowski P, Ramer MS, Krassioukov AV (2010) Cardiometabolic risk factors in experimental spinal cord injury. J Neurotrauma 27:275-85.

85
risk and incidence of metabolic syndrome, and is an independent predictor of all-cause
mortality in the able bodied population (Kuk et al., 2006; Gater, 2007). There is also
evidence that visceral adipose tissue is pathological in rodents: surgical removal of
visceral adipose tissue increases longevity (Muzumdar et al., 2008). Therefore, the
increased visceral fat observed in the SCI population could conceivably be a contributor
to their reduction in lifespan.
Despite the high proportion of CVD, metabolic syndrome, and increased adiposity after
SCI, body composition is rarely reported in this population. Part of this can be attributed
to the fact that there are problems with body composition analysis after SCI; commonly-
used tools such as body mass index (BMI) and waist circumference are based on
assumptions about body composition that do not hold after SCI (Jones et al., 2003;
Buchholz and Bugaresti, 2005; Edwards et al., 2008; Wilt et al., 2008). These traditional
measurements underestimate the level of body fat in this population and, as a result, CVD
and cardiometabolic risk are likely under-recognized clinically (Gater, 2007).
Health care providers and the SCI community are increasingly cognizant of the high
incidence of CVD (Garshick et al., 2005) metabolic dysfunction (Lee et al., 2005) and
dyslipidemia in this population (Nash and Mendez, 2007). A number of comprehensive
reviews have been published on these subjects (Gater, 2007; Myers et al., 2007; Bauman
and Spungen, 2008). However, cholesterol and blood lipid levels remain underreported
more generally in the SCI field. This shortage of systematic documentation combined
with the lack of large cohort studies makes it difficult to conclude whether cholesterol
and lipoprotein levels vary predictably with level or completeness of injury (Wilt et al.,
2008). The limited evidence that we do have precludes decisions about the most

86
appropriate predictors of cardiometabolic risk following SCI, and leaves us with no
choice but to rely on the measures established for the able-bodied population. Of the so-
called atherogenic triad, including increased low-density lipoprotein cholesterol (LDL-
C), decreased high-density lipoprotein cholesterol (HDL-C) and increased triglycerides,
some clinical SCI research reports a small decrease in HDL-C (Brenes et al., 1986;
Bauman et al., 1992; Krum et al., 1992; Bauman et al., 1999b). However, in some of
these studies LDL-C is also lowered (Bauman et al., 1992; Bauman et al., 1999b),
making the total cholesterol/HDL-C ratio unchanged, or even improved. This provides
another indication that the traditional cardiometabolic markers might not be the most
appropriate for determining risk in the SCI population.
Weight management and nutrition are lifelong challenges for individuals with SCI.
Acutely after injury, nutritional deficits are common (Rodriguez et al., 1997; Dvorak et
al., 2004); in the chronic setting, on the other hand, it is the positive energy balance that
appears to be most problematic for the majority of individuals with SCI (Gater, 2007;
Weaver et al., 2007; Rajan et al., 2008). While rodents are widely used in research to
model motor and sensory function after SCI as well as test repair strategies, it is not
known whether these experimental animals exhibit the same metabolic problems as
humans in the chronic setting.
If we are to begin to understand the etiology of obesity and metabolic dysfunctions after
SCI, discover appropriate markers for cardiometabolic risk, and begin to address
interventions, it is imperative to have a rat model in which to do so. There has been very
little animal research done in this regard (Primeaux et al., 2007; Rouleau and Guertin,
2007). The aim of these experiments was to determine if rats with SCI develop features

87
of global cardiometabolic risk. We chose to incorporate two of the most common
diagnostic assessments used clinically: serum lipid profiling and body composition
analysis. Each of these outcomes was assessed using two methods, one that demands
significant technological investment and one that can be done fairly inexpensively and
readily adopted by other laboratories. In order to determine whether these risk factors
vary by injury level, we examined lipid profile and body composition in rats with T3 or
T10 complete SCI. Both lipid profiling and body composition were quantified in the
acute (one week) and subacute (one month) periods post-injury to observe the effects of
time on these variables.
3.2 Materials and methods
All animal procedures were performed in accordance with the guidelines of the Canadian
Council for Animal Care and approved by the University of British Columbia Animal
Care Committee. Sixty-two male Wistar rats (250-350g) were used in these experiments.
3.2.1 Surgery and animal care
Prophylactic enrofloxacin (Baytril; 10 mg/kg, subcutaneous (s.c.), Associated Veterinary
Purchasing (AVP), Langley, BC) was administered for three days prior to surgery. Rats
were anesthetized with ketamine hydrochloride (Vetalar; 70 mg/kg, intraperitoneal (i.p.),
AVP) and medetomidine hydrochloride (Domitor; 0.5 mg/kg, i.p., AVP). Both
buprenorphine (Temgesic; 0.02 mg/kg, s.c., AVP) and ketoprofen (Anafen; 5 mg/kg, s.c.,
AVP) were also administered immediately prior to surgery. A complete transection was
performed at T3 (n=30) or T10 (n=8) or sham surgery was performed at T3 (n=24).

88
For complete spinal cord transection at the third thoracic segment (T3), a dorsal midline
incision was made in the skin and superficial muscles overlying the C8-T2 vertebrae.
Muscles over the T2 vertebra were blunt dissected to isolate the T2 dorsal process, which
was removed with rongeurs. At the T2-T3 intervertebral gap, the dura was opened with
microscissors and the spinal cord was cut using extra fine scissors. Complete transection
was confirmed under the dissecting microscope by clear division of the rostral and caudal
stumps of the cord, and Gelfoam (Pharmacia & Upjohn Company, Pfizer, New York,
NY) was placed in this space to minimize bleeding. The muscle layer was sutured
continuously (Vicryl; 4-0) and the skin was closed with interrupted sutures (Prolene; 4-
0). Sham surgery included the both the partial laminectomy of the T2 vertebra and
durotomy at T3, but the spinal cord was not damaged. For complete spinal cord
transection at T10, a midline incision was made in skin and superficial muscles over the
lower thoracic spine. Muscles overlying the T9 vertebrae were separated by blunt
dissection, and a partial laminectomy was performed to expose the spinal cord prior to
transection.
After surgery, anesthesia was reversed with atipamezole hydrochloride (Antisedan; 1
mg/kg, s.c., Novartis, Mississauga, ON). Animals were given warmed Lactated Ringer’s
solution (5 mL, s.c.) and were placed in a temperature-controlled chamber (Animal
Intensive Care Unit, HotSpot for Birds, Los Angeles, CA). Both buprenorphine
(Temgesic; 0.02 mg/kg, s.c.) and ketoprofen (Anafen; 5 mg/kg, s.c.) were administered
once daily for three days to manage post-operative pain. Antibiotic treatment
(enrofloxacin, Baytril; 10 mg/kg, s.c.) was also continued for three days to reduce the
incidence of bladder infection.

89
During the first week post-injury, manual bladder expression was performed three times
daily. After one week, this was reduced to twice daily until spontaneous bladder function
returned (about 10 days post-injury). Skin sutures (Prolene; 4-0) were removed one week
after surgery to minimize skin irritation. Rats were monitored daily for the first two
weeks after surgery, and once every two days thereafter. This included assessment of
body weight, activity level, social behaviour, lesion state and clinical signs of morbidity.
When bladder infections developed, animals received a three day course of enrofloxacin
(10 mg/kg, s.c.). A combination of topical antibiotics (Triple Antibiotic Ointment,
including polymixin B sulfate, bacitracin zinc and gramicidin; twice daily) and
hydrocortisone cream (Cortate; 0.5% hydrocortisone, twice daily) were used to treat signs
of dermatitis; this was occasionally necessary in sham-injured animals scratching at their
lesion site or in SCI-animals with small pressure sores on the ventral aspect of their
hindlimbs.
Rats were caged in stable groups of four animals to avoid the potential effects of isolation
on food consumption and allow for the benefits of social housing (Patterson-Kane, 2002;
Conour et al., 2006). Cages were fitted with rubber matting to facilitate mobilization of
animals with SCI (Multy Tile, Multy Industries, Atlanta, GA). The fenestrated matting
was layered between standard cedar chips to allow for both cushioning and moisture
absorption. Modified low-reaching bottles ensured easy access to water.
All animals received an enriched standardized diet that was initiated three days pre-
operatively to allow for acclimation. As gastrointestinal stasis is common acutely after
SCI (Tong and Holmes, 2009); we like to provide soft, palatable, nutrient-rich food
throughout this period to encourage the return of gastrointestinal motility and maintain

90
energy and protein levels. Three times daily, each cage received 60 mL complete meal
replacement shake (strawberry), 40 g nutritive transport gel (Charles River Laboratories
International Inc., Wilmington, MA), 60 g fruit (orange and apple), 12 g cereal (Cheerios)
or 24 g commercially available rat treats (alternating), and 40 g kibble (LabDiet, Rodent
Diet 5001), all three times daily. Rat kibble was also available ad libitum on the cagetop
hopper. In the first post-operative week there was often some leftover transport gel and
always some kibble in the cage after feedings: any remaining food was removed from the
bottom of the cage at the next feeding. At two weeks post-injury, animals could easily
move about their cage and were able to eat the regular rat kibble. At this time, we
continued to provide a varied diet of fruits and cereals, but removed the transport gel, and
meal replacement milkshake.
3.2.2 Magnetic resonance imaging
Magnetic resonance imaging (MRI) was performed at the UBC MRI Research Centre
using a 7 Tesla (T) preclinical MRI system (BioSpec 70/30 USR, Bruker BioSpin,
Ettlingen, Germany) one month after T3 SCI (n=6) or sham surgery (n=6). Animals were
killed with an overdose of isoflurane (5% in 100% O2, 1L/min) immediately prior to
imaging. Coronal images were captured using a 2 mm slice thickness (no gap) with an
in-plane resolution of 391x 391 µm. A total of 20-25 slices were acquired for each
animal, spanning the depth of the body. MR images were acquired using spin-echo
technique with the repetition time TR of one second and the echo time of 14 miliseconds.
Two sets of images were acquired; in the first set signals from water and fat were in
phase. In the second set of images, the refocusing pulse was shifted by 368 microseconds,

91
which resulted in the fat signal being at 135 degrees in phase with relation to the water
signal. Total imaging time for each animal was approximately 20 minutes.
3.2.3 MRI post-processing and image analysis
A series of water-fat images were generated from the spin-echo images for each animal
using a modified asymmetric Dixon method (Xiang, 2006). Dorsal-most and ventral-
most images were removed from analysis as the anatomy was often difficult to discern.
Images were subjected to a threshold and the number of positive pixels per image was
automatically counted (SigmaScan Pro, Version 5.0). The total amount of fat per image
was subdivided into subcutaneous or visceral using anatomical landmarks; visceral fat
was defined in each image as the fat bordered laterally by the abdominal muscle, rostrally
by the rib cage, and caudally by the top of the testes; subcutaneous fat was calculated by
subtracting the total number of visceral fat pixels from the total number of fat pixels per
image. Total fat mass was calculated by volume reconstruction: slice thickness was used
to calculate the volume of fat per slice, and slices were combined to obtain a volume of
fat per animal. The volume of adipose tissue was converted into weight using a standard
densitometric conversion for white fat (0.901 g/cm3) (Fidanza et al., 1953; de Souza et
al., 2001).
3.2.4 Visceral white adipose tissue dissection
Visceral white adipose tissue (vWAT) was dissected from animals at one (n=5 T3 SCI;
n=4 sham) or four weeks (n=6 T3 SCI; n=7 sham; n=8 T10 SCI) post-injury. Brown
adipose tissue was not included in this analysis as it is sparse in adult humans and serves
primarily a thermogenic and energy dissipation role rather than lipid storage in rodents
(Krief et al., 1993; Lowell and Flier, 1997). Visceral WAT included both retroperitoneal

92
and perigonadal fat depots. The retroperitoneal fat depot included all of the fat
surrounding the kidney and adrenal gland; extending rostrally to encircle the adrenal
gland, caudally to the vas deferens, and dorsally to the posterior abdominal wall. The
perigonadal fat depot was dissected from around the vas deferens and testes, and often
included folds that extended rostrally into the peritoneum. Fat depots were weighed
immediately following dissection. Subcutaneous adipose tissue was not quantified by
dissection due to the technical difficulties associated with separating it from the overlying
dermal layer.
As a significant number of laboratories studying spinal cord injury are interested in
neural morphology, and need to preserve tissue by fixation, it was necessary for us to
replicate our results using perfusion-fixed animals. A second group of rats with T3 SCI
(n=4) was euthanized at four weeks post-SCI with an overdose of chloral hydrate
(trichloroacetaldehyde hydrate; 1 g/kg, i.p) and perfused prior to visceral fat dissection
(with PBS, followed by 4% paraformaldehyde in 0.1 M phosphate buffer).
3.2.5 Blood lipid profiling
Blood samples were examined via standard clinical laboratory blood lipid analysis or a
home cholesterol test system – both tests (described below) use colorimetric methods to
assess lipid concentrations. Samples for laboratory lipid analysis were collected from the
abdominal aorta after overdose of isoflurane. Samples were refrigerated for 40 minutes
at 4°C, centrifuged at 3000 rpm for 10 min, and serum was removed by pipette for
storage at -80°C. Samples for use with the home cholesterol test system were collected
from the tail vein, and whole blood was used for testing, as per manufacturer’s

93
instructions. All samples were collected when rats were in a non-fasting state, near the
start of the light cycle.
Laboratory blood lipid analysis was conducted on serum samples using standard
enzymatic colorimetric tests for cholesterol, triglycerides and HDL-C with a Dade
Behring RxL Max Analyzer (Dade Behring, Newark, DE) by the Department of
Pathology and Laboratory Medicine at Vancouver General Hospital. Blood was collected
one week (n=6 T3 SCI; n=6 sham) or four weeks (n=6 T3 SCI; n=6 sham; n=5 T10 SCI)
after injury. Results were reported in mmol/L: due to the range limitations of the
equipment used, which is designed for human samples, cholesterol results less than 1.30
mmol/L were reported as < 1.30, triglyceride results less than 0.17 mmol/L were reported
as < 0.17, HDL-C results less than 0.26 mmol/L were reported as < 0.26. LDL levels
were calculated, where possible, using the Friedewald method (Friedewald et al., 1972).
In a separate group of animals, one month post-injury (n=6 T3 SCI; n=7 sham), blood
lipids were assessed using a home cholesterol test system (CardioChek Analyzer,
Indianapolis, IN) with Lipid Panel Test Strips (PTS, Indianapolis). Total cholesterol,
HDL cholesterol and triglyceride levels were reported in mg/dL, and converted to
mmol/L using standard conversion factors: again, due to the range limitations of the
equipment, total cholesterol less than 100 mg/dL was reported as < 100 mg/dL,
triglyceride results less than 50 mg/dL were reported as < 50 mg/dL, HDL-C results less
than 15 were reported as < 15 mg/dL. LDL-C levels were calculated, where possible,
using the Friedewald method (Friedewald et al., 1972).

94
3.2.6 Statistical analysis
Statistical analysis was performed using SigmaStat (Version 3.0). All data are expressed
as means ± standard error of the mean (SEM). For all statistical outcomes, results were
considered significant if p<0.05.
One-way repeated measures ANOVA (RM ANOVA) was used to calculate group mean
body weight changes from baseline for each group, and the Holm-Sidak method was used
to conduct pairwise comparisons against baseline. The nonparametric Friedman RM
ANOVA was used to analyse groups that were not normally distributed. Rank-based
ANOVA was used to compare mean group body weights at the end of the experiment (30
days post-injury).
The amount of WAT in sham and T3 SCI rats, quantified using MRI, was compared
using Student’s t test (two-tailed). One-way analysis of variance (ANOVA) was used to
compare the amount of fat obtained by dissection, and pairwise comparisons were made
using the Holm-Sidak method. A bivariate correlation was used to demonstrate the
relationship between MRI and dissection results, using the Pearson product-moment
correlation coefficient. Regression analysis was performed on a Bland-Altman plot of
the difference in % vWAT dissection (% vWAT dissection - % vWAT MRI) against the
average % vWAT by the two methods (Bland and Altman, 1986). The difference
between the MRI and dissection results were analysed using a one-sample t-test (two-
tailed).
All blood lipid statistics were performed using data expressed in molar concentration
(mmol/L). Lipid data obtained from the Department of Pathology were normally
distributed and were compared using one-way ANOVA combined with the Holm-Sidak

95
test to detect pairwise differences at relevant time points (one week and one month post-
injury). Data obtained using the home cholesterol test were compared using Student’s t
test if they were normally distributed; otherwise, the nonparametric Mann-Whitney Rank
Sum Test was used.
3.3 Results
Animals with T3 SCI showed significant changes in weight over time (F(16,22)=157.03,
p<0.001): at three days following T3 SCI, rats had a reduction weight compared to pre-
injury baseline (p=0.007, Figure 3.1); however, their weights returned to pre-operative
values by 7 days post-injury. T10 injured rats also showed changes in weight over time
(F(7, 22)=40.46, p<0.001) including early signs of weight loss (p=0.025 two days after
SCI compared to baseline weight); however, they returned to their pre-operative weights
6 days after injury. Sham surgery did not result in any significant loss of body weight. At
the end of the experiment (30 days post-injury) there were significant differences
between groups (H=8.308, df=2, p=0.016): the mean weight of the T3 SCI group was not
significantly different from the sham-injured group (p>0.05). In contrast, mean weight of
the T10 SCI group was significantly less than sham-injured group (p<0.05).
At one month after injury MRI was performed to quantify white adipose tissue (WAT) in
sham and T3 SCI rats (representative fat images are shown in Figure 3.2). Rats with
complete T3 SCI had significantly more visceral WAT as a percentage of body weight
compared to sham-injured pair-fed animals (p=0.02, Figure 3.2c). High-thoracic-injured
rats also had more subcutaneous WAT than sham-injured controls (p=0.03, Figure 3.2c).
Both groups in this experiment started at the same weight (sham 300.17 ± 4.00; T3 SCI
312.00 ± 7.39, p=0.19) and at one month post-injury there was still no difference in body

96
Figure 3.1 Rats with high-thoracic SCI and those with low-thoracic SCI recover to
their pre-operative weights shortly after injury.
Rats with high-thoracic SCI lost a significant amount of weight immediately after injury
(n=30). By 8 days post-injury, this group returned to their pre-operative weight. Rats
with low-thoracic SCI also showed a significant weight loss after injury; however, they
resolved to pre-operative weight by only 6 days post-injury (n=8). Sham-injured animals
did not lose any weight post-operatively (n=24).
Symbols: black bar denotes significant difference of T3 SCI rats from pre-operative
weight (p<0.05); grey bar denotes significant difference of T10 SCI rats from pre-
operative weight (p<0.05).

97

98
Figure 3.2 Rats with high-thoracic SCI carried increased visceral and subcutaneous
fat one month post-injury.
Representative abdominal MRI images of water (a,c) and fat (b,d) in a sham-injured rat
(a,b) and a rat with T3 SCI (c,d). Fat images were generated using an asymmetric Dixon
method: in these images, visceral and subcutaneous fat depots are clearly divided by the
abdominal wall. Volumetric fat measurements were made from a series of images
spanning the depth of each animal (20-25 slices; slice thickness = 2mm). While there
was no difference in body weight between sham- and spinal cord-injured rats at one
month post-injury (e), both visceral and subcutaneous fat accounted for a greater
percentage of body weight in rats with T3 SCI. * denotes significant difference from
time-matched sham-injured animals.

99

100
weight between sham-injured and T3 SCI animals (Figure 3.1c). These data are
reminiscent of clinical findings using computed tomography, which document increased
visceral fat in individuals with chronic SCI (Edwards et al., 2008).
Visceral adipose tissue, including both retroperitoneal and perigonadal fat depots, was
also measured by dissection and wet weight. Significant differences were found in the
amount of visceral fat accumulated with time after injury (F(5,28)=7.61, p<0.001).
While there was no difference between sham and T3 SCI rats in the amount of visceral
fat as a percentage of body weight one week after injury (p=0.315), one month after
injury, T3 SCI rats had significantly more visceral fat than sham-injured controls
(p=0.005, Figure 3.3a). Rats with low-thoracic SCI (T10) did not show increased visceral
fat compared to sham-injured controls (p=0.924).
A separate group of animals was used to determine whether perfusion with fixative prior
to dissection would alter adipose tissue weight. Visceral fat weighed after perfusion made
up 4.06 ± 0.32 % of body weight in T3-injured animals. This was indistinguishable from
the results obtained by fresh dissection in T3-injured animals (p>0.05).
Analysis of visceral fat using preclinical MRI may not be feasible for the majority of
laboratories. To ascertain whether the dissection of visceral fat was a good approximation
of the amount of visceral fat as quantified by MRI, we examined the relationship between
the amount of visceral fat quantified by MRI and by dissection. In this data set, both
measurements of visceral fat were performed in the same group of animals; animals were
euthanized, MRI images were acquired, and then the dissection was performed. There
was a good correlation between the amount of visceral adipose tissue measured by MRI
and that measured by dissection (r=0.92, p<0.0001, Figure 3.3b). However, the mean

101
Figure 3.3 Visceral white adipose tissue dissection and wet weight measurement was
sensitive to changes after SCI.
Visceral white adipose tissue (vWAT), obtained by fresh dissection and measured by wet
weight, was increased at one month following T3 SCI compared to sham-injured rats (a).
Similar results were obtained in a second group of rats one month after T3 SCI (b);
however, there was no change in visceral fat of animals with low-thoracic (T10) SCI.
The amount of vWAT obtained by MRI correlated well with the amount obtained by
dissection in the same group of animals (c).
Symbols: * denotes significant difference from time-matched sham-injured animals and
animals with low-thoracic SCI (both p<0.05).

102

103
difference between the two measurements was significantly more than zero (2.63 ± 0.22
%, t=11, df=10, p<0.0001). The Bland-Altman analysis indicated that MRI
quantification tended to underestimate visceral adipose tissue compared to dissection and
that there was some discrepancy between MRI and dissection measurements of vWAT:
9% of points fell beyond two standard deviations away from the mean difference in %
vWAT dissection (% vWAT dissection - % vWAT MRI) (Figure 3.3c). Therefore, while
both dissection and MRI provide sensitive measures of visceral adipose tissue, they
should not be used interchangeably as there is some discrepancy between them.
Blood lipid profiling is a standard component of clinical assessment of CV health and a
well-accepted indicator of risk of CVD. To date, clinical data on blood lipid profiles
following SCI are limited (Brenes et al., 1986; Bauman et al., 1992; Krum et al., 1992;
Bauman et al., 1999b), precluding a consensus on appropriate lipid profile indicators of
CV risk for individuals with SCI. Blood lipid profiles are rarely reported in experimental
SCI (Rouleau and Guertin, 2007); although rats are the most commonly used animal
model, there are no available data on the blood lipid profile of rats after SCI.
Blood lipids were first analysed using standard colorimetric hospital laboratory
techniques. Blood samples were collected from non-fasted rats, and serum was separated
for analysis. At one week post-injury, T3 SCI and sham-injured rats had similar levels of
non-fasting serum triglycerides, HDL-C and LDL-C (Table 3.1). However, at one month
after surgery, the T3 SCI group had significantly higher triglycerides than both sham-
injured (p=0.004) and T10 SCI (p<0.001) (Table 3.1). This is particularly interesting,
given that non-fasting triglycerides have emerged as important independent predictors of

104
Table 3.1 Non-fasting serum lipid concentrations in high-thoracic, low-thoracic and
sham-injured rats reveal that rats with high-thoracic SCI have elevated triglyceride
levels one month post-injury.
No differences were observed between sham-injured rats and those with T3 SCI at one
week post-injury. At one month post-injury, animals with T3 SCI had increased serum
triglyceride levels compared to both sham-injured rats and those with T10 SCI. Animals
with T10 SCI had significantly less HDL-C compared to sham-injured animals.
Symbols: * indicates significant difference from time-matched sham-injured group; †
indicates significant difference from T3 SCI group. Note that LDL-C could not be
calculated for this group using the Friedewald equation.
Abbreviations: CHOL, cholesterol; HDL-C, high-density lipoprotein cholesterol; LDL-C,
low-density lipoprotein cholesterol.

105
1 week 1 month Sham
(n=6) T3 SCI (n=6)
Sham (n=6)
T3 SCI (n=6)
T10 SCI (n=5)
Total CHOL (mmol/L) (mg/dL)
1.63 ± 0.09 (62.67 ± 3.61)
1.69 ± 0.16 (65.30 ± 6.31)
1.54 ± 0.12 (59.26 ± 4.65)
1.49 ± 0.07 (57.46 ± 2.88)
1.41 ± 0.08 (54.53 ± 3.06)
HDL-C (mmol/L) (mg/dL)
0.62 ± 0.04
(23.97 ± 1.69) 0.67 ± 0.04
(25.84 ± 1.45) 0.59 ± 0.03
(22.75 ± 1.15) 0.55 ± 0.03
(21.28 ± 1.23) 0.47 ± 0.04*
(18.20 ± 1.57)
Calc. LDL-C (mmol/L) (mg/dL)
0.48 ± 0.17 (18.59 ± 6.66)
0.57 ± 0.22 (22.14 ± 8.58)
0.47 ± 0.11 (18.22 ± 4.36) x 0.55 ± 0.10
(21.34 ± 3.89)
Triglycerides (mmol/L) (mg/dL)
1.39 ± 0.30
(123.11 ± 26.57)
1.34 ± 0.29
(118.54 ± 25.79)
1.17 ± 0.14
(103.92 ± 12.13)
2.45 ± 0.42*
(216.85 ± 37.48)
0.78 ± 0.13† (69.44 ± 11.79)

106
CV events in several recent prospective clinical trials (Bansal et al., 2007; Nordestgaard
et al., 2007). Animals with T10 SCI, exhibited similar triglyceride levels to sham-
controls (p>0.05), but lower levels than animals with T3 SCI (p<0.05), possibly
suggesting a healthier cardiovascular profile. On the other hand, their HDL-C levels
were less than sham-controls, which confers reduced atheroprotective effects (Brewer,
2004). The LDL-C levels in T3-injured rats at one month following SCI could not be
calculated using the Friedewald formula because total cholesterol levels were
undetectable with the eqipment used. This highlights some of the limitations of applying
clinical measurements to rodents.
We next wanted to determine whether these results were reproducible using a home
cholesterol test system (CardioChek). These systems are relatively inexpensive and
commercially available in the United States. Their main advantage is that they provide
immediate data from very small amounts of whole blood (such as the drop obtained from
a tail vein): this permits repeated testing in the same animals without risk of morbidity
due to blood loss. CardioChek lipid profile analysis was performed on separate groups of
T3 SCI and sham-injured pair-fed rats. There was no difference in body weight between
these two groups (p>0.05). Using the CardioChek meter, triglyceride levels were
significantly higher in T3 SCI rats than in sham-injured pair-fed control rats (Table 3.2;
p=0.045). There was no difference in HDL-C levels between sham- and T3-injured rats
(p>0.05). Total cholesterol levels in both groups fell below the detection range of the
CardioCheck system; as a result, we were unable to calculate LDL-C levels.

107
Table 3.2 Non-fasting blood lipids measured using a home cholesterol test system
showed similar results to laboratory quantification.
Using a freely available home cholesterol test system (CardioChek Analyzer,
Indianapolis, IN), rats with T3 SCI had significantly more triglycerides than sham-injured
pair-fed controls. There was no difference in HDL cholesterol between the two groups.
Total cholesterol in both groups fell below the detection threshold of this system (<2.57
mmol/L). As a result, we were unable to obtain the LDL cholesterol using this method,
which is normally calculated using the Friedewald equation.
Symbols: * indicates significant difference from time-matched sham-injured group. x
indicates LDL-C could not be calculated for this group using the Friedewald equation.
Abbreviations: calc., calculated; CHOL, cholesterol; HDL-C, high-density lipoprotein
cholesterol; LDL-C, low-density lipoprotein cholesterol.

108
Sham 1 month
(n=7)
T3 SCI 1 month
(n=6) Total CHOL
mmol/L (mg/dL)
< 2.57 (<100)
< 2.57 (<100)
HDL-C mmol/L (mg/dL)
0.66 ± 0.13 (25.57 ± 4.82)
0.77 ± 0.10 (29.83 ± 4.03)
Calc. LDL-C mmol/L (mg/dL)
x x
Triglycerides mmol/L (mg/dL)
1.31 ± 0.26 (115.57 ± 22.91)
2.72 ± 0.61 (241.33 ± 54.13)

109
3.4 Discussion
Obesity is a common and worrisome secondary complication of SCI (Gater, 2007). The
accumulation of visceral adipose tissue, a known determinant of CV risk, has the
potential to contribute to the early onset of CVD and shortened lifespan in this population
(Myers et al., 2007; Garshick et al., 2005; Strauss et al., 2006). In order to understand the
etiology of increased adipose tissue and metabolic dysfunctions after SCI, and begin to
address interventions, it is essential to have animal models of these aspects. While
rodents’ motor function has been well characterized after SCI, their autonomic function,
including CV function, has been comparatively understudied (Maiorov et al., 1997a;
Maiorov et al., 1998; Cameron et al., 2006; Lujan and DiCarlo, 2007; Inskip et al., 2009).
Research addressing CV risk and metabolic changes after rodent SCI has been even more
scant (Rodenbaugh et al., 2003; Primeaux et al., 2007; Rouleau and Guertin, 2007). Here
we show that, like humans, rats have increased visceral fat deposition one month after
complete high-thoracic SCI. We also demonstrate that rats with T3 SCI exhibit non-
fasting hypertriglyceridemia. These hallmarks of cardiometabolic risk are absent acutely
after injury, but develop in the subacute period one month after SCI. Over the same time
period, rats with a complete low-thoracic injury do not accumulate visceral fat. On the
whole, their lipid profiles are not distinctly improved or worsened by their injury: their
triglyceride levels are less than animals with T3 SCI, suggesting a healthier
cardiovascular profile, yet their HDL-C levels are less than sham-injured animals, which
confers less protection against atherosclerosis.
The question of sheer energy imbalance after SCI is an important one that warrants
further investigation. It is tempting to conclude that the reduced energy expenditure

110
without compensatory change in nutrient intake is at the root of the pathophysiology of
obesity after SCI. Indeed, energy expenditure is reduced after SCI due to the reduction in
activity and basal metabolic rate – both related in part to a reduced muscle mass
(Buchholz et al., 2003a). However, clinical findings in individuals with SCI indicate that
total body fat is high even in young elite athletes, and visceral adiposity is increased in
highly active members of the community (Edwards et al., 2008; Mojtahedi et al., 2009).
The fact that these individuals have increased adiposity even with increased energy
expenditure suggests there may be additional metabolic alterations beyond the raw
changes in input-output balance. Interruption of descending autonomic pathways and
resultant loss of sympathetic regulation of fat tissue could be among the major factors
precipitating altered lipolysis and redistribution of fat tissue after SCI. Recent evidence
has shown that sympathetic nerve activity, recorded from nerve endings in WAT, is
partly responsible for mediating central glucagon-like peptide’s effects on lipid storage
(Nogueiras et al., 2009). The disruption of central neural control as a result of SCI could
also alter lipid storage. It is clear that more research is needed to untangle the effects of
altered energy expenditure and of injury itself on metabolism after SCI. Rats with high-
thoracic SCI provide an appropriate model in which to do this, as energy expenditure can
be modulated by many different exercise regimes and diets that are routinely used in the
laboratory. These types of experiments could inform our nutrition recommendations and
exercise prescriptions for people with SCI.
Our results with low- and high-thoracic SCI rats suggest that there might be metabolic
changes associated with SCI beyond the raw changes in the input-output energy balance.
Both T3 and T10 SCI animals were fed the same enriched diet throughout the

111
experiment. All animals exhibited flaccid hindlimb paralysis and mobilized with their
forelimbs only. Nonetheless, rats with low-thoracic SCI did not exhibit either feature of
cardiometabolic risk that we tested for; they did not develop visceral obesity, nor did they
show any evidence of hypertriglyceridemia. It is possible that rats with T10 SCI have a
slightly higher basal metabolic rate and increased energy expenditure than rats with high-
thoracic SCI due to their increased trunk muscle innervation and activity. However, we
would expect that the difference between sham and T10-injured animals would be greater
than the difference between T3- and T10-injured animals, given that both hind limbs are
denervated by thoracic SCI.
One possibility is that the loss of descending autonomic neural control over visceral
adipose tissue, with spinal outflow exiting from the thoraco-lumbar cord, perturbs fat
storage and release in T3 SCI rats. It follows that low-thoracic SCI preserves descending
neural control to a portion of the visceral adipose tissue rostral to the lesion, and thus
does not disrupt fat storage and release in this area. Given that T10 complete transection
still eliminates descending neural control over caudal vWAT (gonadal/epidydimal WAT)
(Youngstrom and Bartness, 1995), it is possible that rats with T10 SCI do experience
cardiometabolic changes, but that these develop more slowly than in high-thoracic SCI
due to the difference in descending sympathetic control. It would be interesting to follow
T10 SCI rats over a more chronic time period to see if they simply develop
cardiometabolic changes more slowly; here we have only observed a very short time
frame relative to the decades that many people live with SCI. Taken together, our results
suggest that there is a level-dependence associated with the development of visceral
obesity and non-fasting hypertriglyceridemia following SCI – at least in the subacute

112
period after injury. The lower thoracic cord may represent a critical spinal locus for
regulated lipid metabolism. Alternatively, there may be a threshold number of thoracic
spinal segments receiving descending autonomic neural control that are critical to
regulate lipid metabolism. An intermediate thoracic injury model would be needed to
differentiate between these possibilities.
While descending control of adipose tissue is lost caudal to complete SCI, innervation
(by both sensory and sympathetic axons (Fishman and Dark, 1987; Youngstrom and
Bartness, 1995)) is likely preserved. Normally, sympathetic nerve endings are found in
both adipose tissue parenchyma and vasculature (Slavin and Ballard, 1978; Giordano et
al., 2005; Giordano et al., 2006), and sympathetic nerve activity is an important trigger
for lipid mobilization in both rats and humans (Gross and Migliorini, 1977; Arner et al.,
1990). After autonomically complete SCI, resting muscle (Wallin and Stjernberg, 1984)
and visceral (Osborn et al., 1987; Maiorov et al., 1997a) sympathetic nerve activity are
low below the lesion, as are plasma catecholamines (Mathias et al., 1976; Mizushima et
al., 2003; Claydon and Krassioukov, 2006; Wecht et al., 2008). It is likely that there is
increased storage and reduced lipid mobilization as a result. Indeed, after sympathetic
denervation we know that white adipose depots increase in size (Youngstrom and
Bartness, 1998). Reflex bursts of sympathetic activity that often accompany high SCI
likely subserve some lipid mobilization (Karlsson et al., 1997; Niijima, 1998, 1999);
however, the overall level of sympathetic activity will still be quite low.
Previous work documenting body composition and adiposity after rodent spinal cord
injury reported that T3 SCI results in significant weight loss, with animals not returning
to pre-operative weights until 5 weeks post-injury (Primeaux et al., 2007). These animals

113
maintained chronically low weights, and even 16 weeks post-injury were not heavier than
their pre-operative weights (Primeaux et al., 2007). In contrast with the current findings,
SCI rats had significantly less visceral adipose tissue than sham-injured controls
(Primeaux et al., 2007). Although the injury was the same, the pattern of post-operative
weight gain we observed was much different: rats with T3 SCI regained their pre-
operative weight by one week post-injury, and their weights were statistically
indistinguishable from sham controls one month after injury. While it is unlikely to
explain all of the discrepancies between our results, there are important diet differences
between the two studies. Rats in the study by Primeaux and colleagues were fed a strictly
chow-based diet; in our experiments, all rats were fed a diet more reminiscent of the
unrestricted human “cafeteria-style” diet. In the presence of this enriched diet, rats with
complete T3 SCI showed significantly more visceral fat than pair fed sham control rats.
An intriguing possibility is that, following SCI, if the system is challenged by a large
caloric load, there are more triglycerides stored than can be mobilized by reflex
sympathetic activity: the system can no longer cope, such that triglyceride storage vastly
outweighs mobilization.
In addition to increased visceral fat, complete T3 SCI rats also displayed increased non-
fasting triglyceride levels – a finding which could suggest that lipid clearance is
perturbed. Indeed, postprandial hypertriglyceridemia has been reported previously in
humans with SCI after a high caloric milkshake (Nash et al., 2005), also suggesting that
lipid metabolism can be disrupted by SCI. This is a clinical concern, as postprandial
lipemia is associated with endothelial dysfunction and the development of atherosclerosis
(Groot et al., 1991; Patsch et al., 1992). As elevated triglycerides are rarely elevated in

114
the absence of other atherogenic features (Grundy, 1998; Despres, 2007), the increased
non-fasting triglyceride levels that we have observed at one month after T3 SCI could
represent the onset of cardiometabolic changes after SCI. Interestingly, as in the case of
visceral fat, rats with T10 SCI did not show increased non-fasting triglycerides compared
to age-matched pair-fed controls. Again, we cannot rule out the possibility that this
group is simply slower to develop metabolic changes after SCI. However, the established
relationship between poor postprandial triglyceride clearance and visceral obesity
(Couillard et al., 1998; Blackburn et al., 2003) suggests that visceral obesity itself could
drive the poor triglyceride clearance after T3 SCI – a feature absent after low-thoracic
SCI.
The results from our animal experiments strongly suggest that in clinical studies we
should stratify our subjects based on their neurological injury level, and not simply their
limb function. The division of clinical subjects as paraplegic or quadriplegic results in
heterogeneous groups, with a range of injury levels. This division does not give us any
information regarding the true neurological injury level. In our results, while both high-
and low-thoracic SCI affect lower limb function and result in paraplegia, these injuries
have very different effects on fat accumulation and triglyceride levels. Therefore, at the
very least, neurological injury level must be reported in studies of lipid metabolism –
ideally in combination with level of sympathetic dysfunction. With the use of a complete
SCI used in this experimental study, we knew the level of injury and that the injury was
sympathetically complete; we cannot make these same assumptions in clinical research,
necessitating sympathetic testing.

115
Despite the prevalence of CVD in people with SCI and the overwhelming impact on
lifespan, cardiometabolic outcomes are rarely documented in experimental animal models
of SCI. Here we have shown that specialised equipment is not always necessary for the
assessment of cardiometabolic health in animals; fairly simple and affordable techniques
exist that are sensitive to the changes that occur after SCI. Serum HDL-C and
triglycerides can be quantified in a minimally invasive way using standard human home
testing kits. Increased visceral adiposity can be detected by gross fat pad dissection and
wet weight either before or after fixation (depending on existing protocols). In fact, we
found that this method provides even more sensitive measurements than MRI
quantification, which was still able to detect differences after SCI, but underestimated
visceral adipose tissue. Therefore, as long as these methods are not used interchangeably,
either could be used to document changes in adiposity after SCI depending on the
equipment and expertise unique to each laboratory.

116
3.5 References Arner P, Kriegholm E, Engfeldt P, Bolinder J (1990) Adrenergic regulation of lipolysis in
situ at rest and during exercise. J Clin Invest 85:893-898. Bansal S, Buring JE, Rifai N, Mora S, Sacks FM, Ridker PM (2007) Fasting compared
with nonfasting triglycerides and risk of cardiovascular events in women. JAMA 298:309-316.
Bauman WA, Spungen AM (2008) Coronary heart disease in individuals with spinal cord
injury: assessment of risk factors. Spinal Cord 46:466-476. Bauman WA, Spungen AM, Zhong YG, Rothstein JL, Petry C, Gordon SK (1992)
Depressed serum high density lipoprotein cholesterol levels in veterans with spinal cord injury. Paraplegia 30:697-703.
Bauman WA, Adkins RH, Spungen AM, Herbert R, Schechter C, Smith D, Kemp BJ,
Gambino R, Maloney P, Waters RL (1999) Is immobilization associated with an abnormal lipoprotein profile? Observations from a diverse cohort. Spinal Cord 37:485-493.
Blackburn P, Lamarche B, Couillard C, Pascot A, Bergeron N, Prud'homme D, Tremblay
A, Bergeron J, Lemieux I, Despres JP (2003) Postprandial hyperlipidemia: another correlate of the "hypertriglyceridemic waist" phenotype in men. Atherosclerosis 171:327-336.
Bland JM, Altman DG (1986) Statistical methods for assessing agreement between two
methods of clinical measurement. Lancet 1:307-310. Brenes G, Dearwater S, Shapera R, LaPorte RE, Collins E (1986) High density
lipoprotein cholesterol concentrations in physically active and sedentary spinal cord injured patients. Arch Phys Med Rehabil 67:445-450.
Brewer, H.B. Jr (2004) Increasing HDL cholesterol levels. N Engl J Med 350:1491-1494. Buchholz AC, Bugaresti JM (2005) A review of body mass index and waist
circumference as markers of obesity and coronary heart disease risk in persons with chronic spinal cord injury. Spinal Cord 43:513-518.
Buchholz AC, McGillivray CF, Pencharz PB (2003) Differences in resting metabolic rate
between paraplegic and able-bodied subjects are explained by differences in body composition. Am J Clin Nutr 77:371-378.
Cameron AA, Smith GM, Randall DC, Brown DR, Rabchevsky AG (2006) Genetic
manipulation of intraspinal plasticity after spinal cord injury alters the severity of autonomic dysreflexia. J Neurosci 26:2923-2932.

117
Castro MJ, Apple DF, Jr., Hillegass EA, Dudley GA (1999) Influence of complete spinal
cord injury on skeletal muscle cross-sectional area within the first 6 months of injury. Eur J Appl Physiol Occup Physiol 80:373-378.
Claydon VE, Krassioukov AV (2006) Orthostatic hypotension and autonomic pathways
after spinal cord injury. J Neurotrauma 23:1713-1725. Conour LA, Murray KA, Brown MJ (2006) Preparation of animals for research--issues to
consider for rodents and rabbits. ILAR J 47:283-293. Couillard C, Bergeron N, Prud'homme D, Bergeron J, Tremblay A, Bouchard C,
Mauriege P, Despres JP (1998) Postprandial triglyceride response in visceral obesity in men. Diabetes 47:953-960.
de Souza CJ, Eckhardt M, Gagen K, Dong M, Chen W, Laurent D, Burkey BF (2001)
Effects of pioglitazone on adipose tissue remodeling within the setting of obesity and insulin resistance. Diabetes 50:1863-1871.
Despres JP (2007) Cardiovascular disease under the influence of excess visceral fat. Crit
Pathw Cardiol 6:51-59. Dvorak MF, Noonan VK, Belanger L, Bruun B, Wing PC, Boyd MC, Fisher C (2004)
Early versus late enteral feeding in patients with acute cervical spinal cord injury: a pilot study. Spine 29:E175-180.
Edwards LA, Bugaresti JM, Buchholz AC (2008) Visceral adipose tissue and the ratio of
visceral to subcutaneous adipose tissue are greater in adults with than in those without spinal cord injury, despite matching waist circumferences. Am J Clin Nutr 87:600-607.
Fidanza F, Keys A, Anderson JT (1953) Density of body fat in man and other mammals.
J Appl Physiol 6:252-256. Fishman RB, Dark J (1987) Sensory innervation of white adipose tissue. Am J Physiol
253:R942-944. Friedewald WT, Levy RI, Fredrickson DS (1972) Estimation of the concentration of low-
density lipoprotein cholesterol in plasma, without use of the preparative ultracentrifuge. Clin Chem 18:499-502.
Garshick E, Kelley A, Cohen SA, Garrison A, Tun CG, Gagnon D, Brown R (2005) A
prospective assessment of mortality in chronic spinal cord injury. Spinal Cord 43:408-416.

118
Gater DR, Jr. (2007) Obesity after spinal cord injury. Phys Med Rehabil Clin N Am 18:333-351.
Giordano A, Song CK, Bowers RR, Ehlen JC, Frontini A, Cinti S, Bartness TJ (2006)
White adipose tissue lacks significant vagal innervation and immunohistochemical evidence of parasympathetic innervation. Am J Physiol Regul Integr Comp Physiol 291:R1243-1255.
Giordano A, Frontini A, Murano I, Tonello C, Marino MA, Carruba MO, Nisoli E, Cinti
S (2005) Regional-dependent increase of sympathetic innervation in rat white adipose tissue during prolonged fasting. J Histochem Cytochem 53:679-687.
Grimby G, Broberg C, Krotkiewska I, Krotkiewski M (1976) Muscle fiber composition
in patients with traumatic cord lesion. Scand J Rehabil Med 8:37-42. Groot PH, van Stiphout WA, Krauss XH, Jansen H, van Tol A, van Ramshorst E, Chin-
On S, Hofman A, Cresswell SR, Havekes L (1991) Postprandial lipoprotein metabolism in normolipidemic men with and without coronary artery disease. Arterioscler Thromb 11:653-662.
Gross JL, Migliorini RH (1977) Further evidence for a central regulation of free fatty
acid mobilization in the rat. Am J Physiol 232:E165-171. Grundy SM (1998) Hypertriglyceridemia, atherogenic dyslipidemia, and the metabolic
syndrome. Am J Cardiol 81:18B-25B. Inskip JA, Ramer LM, Ramer MS, Krassioukov AV (2009) Autonomic assessment of
animals with spinal cord injury: tools, techniques and translation. Spinal Cord 47:2-35.
Jones LM, Legge M, Goulding A (2003) Healthy body mass index values often
underestimate body fat in men with spinal cord injury. Arch Phys Med Rehabil 84:1068-1071.
Karlsson AK, Elam M, Friberg P, Sullivan L, Attvall S, Lonnroth P (1997) Peripheral
afferent stimulation of decentralized sympathetic neurons activates lipolysis in spinal cord-injured subjects. Metabolism 46:1465-1469.
Krief S, Lonnqvist F, Raimbault S, Baude B, Van Spronsen A, Arner P, Strosberg AD,
Ricquier D, Emorine LJ (1993) Tissue distribution of beta 3-adrenergic receptor mRNA in man. J Clin Invest 91:344-349.
Krum H, Howes LG, Brown DJ, Ungar G, Moore P, McNeil JJ, Louis WJ (1992) Risk
factors for cardiovascular disease in chronic spinal cord injury patients. Paraplegia 30:381-388.

119
Kuk JL, Katzmarzyk PT, Nichaman MZ, Church TS, Blair SN, Ross R (2006) Visceral fat is an independent predictor of all-cause mortality in men. Obesity (Silver Spring) 14:336-341.
Lee MY, Myers J, Hayes A, Madan S, Froelicher VF, Perkash I, Kiratli BJ (2005) C-
reactive protein, metabolic syndrome, and insulin resistance in individuals with spinal cord injury. J Spinal Cord Med 28:20-25.
Lowell BB, Flier JS (1997) Brown adipose tissue, beta 3-adrenergic receptors, and
obesity. Annu Rev Med 48:307-316. Lujan HL, DiCarlo SE (2007) T5 spinal cord transection increases susceptibility to
reperfusion-induced ventricular tachycardia by enhancing sympathetic activity in conscious rats. Am J Physiol Heart Circ Physiol 293:H3333-3339.
Maiorov DN, Weaver LC, Krassioukov AV (1997) Relationship between sympathetic
activity and arterial pressure in conscious spinal rats. Am J Physiol 272:H625-631.
Maiorov DN, Fehlings MG, Krassioukov AV (1998) Relationship between severity of
spinal cord injury and abnormalities in neurogenic cardiovascular control in conscious rats. J Neurotrauma 15:365-374.
Maruyama Y, Mizuguchi M, Yaginuma T, Kusaka M, Yoshida H, Yokoyama K,
Kasahara Y, Hosoya T (2008) Serum leptin, abdominal obesity and the metabolic syndrome in individuals with chronic spinal cord injury. Spinal Cord 46:494-499.
Mathias CJ, Frankel HL, Christensen NJ, Spalding JM (1976) Enhanced pressor response
to noradrenaline in patients with cervical spinal cord transection. Brain 99:757-770.
Mizushima T, Tajima F, Okawa H, Umezu Y, Furusawa K, Ogata H (2003)
Cardiovascular and endocrine responses during the cold pressor test in subjects with cervical spinal cord injuries. Arch Phys Med Rehabil 84:112-118.
Mojtahedi MC, Valentine RJ, Evans EM (2009) Body composition assessment in athletes
with spinal cord injury: comparison of field methods with dual-energy X-ray absorptiometry. Spinal Cord 47:698-704.
Muzumdar R, Allison DB, Huffman DM, Ma X, Atzmon G, Einstein FH, Fishman S,
Poduval AD, McVei T, Keith SW, Barzilai N (2008) Visceral adipose tissue modulates mammalian longevity. Aging Cell 7:438-440.
Myers J, Lee M, Kiratli J (2007) Cardiovascular disease in spinal cord injury: an
overview of prevalence, risk, evaluation, and management. Am J Phys Med Rehabil 86:142-152.

120
Nash MS, Mendez AJ (2007) A guideline-driven assessment of need for cardiovascular
disease risk intervention in persons with chronic paraplegia. Arch Phys Med Rehabil 88:751-757.
Nash MS, DeGroot J, Martinez-Arizala A, Mendez AJ (2005) Evidence for an
exaggerated postprandial lipemia in chronic paraplegia. J Spinal Cord Med 28:320-325.
Niijima A (1998) Afferent signals from leptin sensors in the white adipose tissue of the
epididymis, and their reflex effect in the rat. J Auton Nerv Syst 73:19-25. Niijima A (1999) Reflex effects from leptin sensors in the white adipose tissue of the
epididymis to the efferent activity of the sympathetic and vagus nerve in the rat. Neurosci Lett 262:125-128.
Nogueiras R, Perez-Tilve D, Veyrat-Durebex C, Morgan DA, Varela L, Haynes WG,
Patterson JT, Disse E, Pfluger PT, Lopez M, Woods SC, DiMarchi R, Dieguez C, Rahmouni K, Rohner-Jeanrenaud F, Tschop MH (2009) Direct control of peripheral lipid deposition by CNS GLP-1 receptor signaling is mediated by the sympathetic nervous system and blunted in diet-induced obesity. J Neurosci 29:5916-5925.
Nordestgaard BG, Benn M, Schnohr P, Tybjaerg-Hansen A (2007) Nonfasting
triglycerides and risk of myocardial infarction, ischemic heart disease, and death in men and women. JAMA 298:299-308.
Nuhlicek DN, Spurr GB, Barboriak JJ, Rooney CB, el Ghatit AZ, Bongard RD (1988)
Body composition of patients with spinal cord injury. Eur J Clin Nutr 42:765-773. Osborn JW, Jr., Livingstone RH, Schramm LP (1987) Elevated renal nerve activity after
spinal transection: effects on renal function. Am J Physiol 253:R619-625. Patsch JR, Miesenbock G, Hopferwieser T, Muhlberger V, Knapp E, Dunn JK, Gotto
AM, Jr., Patsch W (1992) Relation of triglyceride metabolism and coronary artery disease. Studies in the postprandial state. Arterioscler Thromb 12:1336-1345.
Patterson-Kane EGH, M.; Harper, D. (2002) Rats demand social contact. Animal Welfare
11:327-332. Primeaux SD, Tong M, Holmes GM (2007) Effects of chronic spinal cord injury on body
weight and body composition in rats fed a standard chow diet. Am J Physiol Regul Integr Comp Physiol 293:R1102-1109.

121
Rajan S, McNeely MJ, Warms C, Goldstein B (2008) Clinical assessment and management of obesity in individuals with spinal cord injury: a review. J Spinal Cord Med 31:361-372.
Rodenbaugh DW, Collins HL, DiCarlo SE (2003) Paraplegia differentially increases
arterial blood pressure related cardiovascular disease risk factors in normotensive and hypertensive rats. Brain Res 980:242-248.
Rodriguez DJ, Benzel EC, Clevenger FW (1997) The metabolic response to spinal cord
injury. Spinal Cord 35:599-604. Rouleau P, Guertin PA (2007) Early changes in deep vein diameter and biochemical
markers associated with thrombi formation after spinal cord injury in mice. J Neurotrauma 24:1406-1414.
Slavin BG, Ballard KW (1978) Morphological studies on the adrenergic innervation of
white adipose tissue. Anat Rec 191:377-389. Strauss DJ, Devivo MJ, Paculdo DR, Shavelle RM (2006) Trends in life expectancy after
spinal cord injury. Arch Phys Med Rehabil 87:1079-1085. Tong M, Holmes GM (2009) Gastric dysreflexia after acute experimental spinal cord
injury in rats. Neurogastroenterol Motil 21:197-206. Wallin BG, Stjernberg L (1984) Sympathetic activity in man after spinal cord injury.
Outflow to skin below the lesion. Brain 107:183-198. Weaver FM, Collins EG, Kurichi J, Miskevics S, Smith B, Rajan S, Gater D (2007)
Prevalence of obesity and high blood pressure in veterans with spinal cord injuries and disorders: a retrospective review. Am J Phys Med Rehabil 86:22-29.
Wecht JM, Weir JP, Goldstein DS, Krothe-Petroff A, Spungen AM, Holmes C, Bauman
WA (2008) Direct and reflexive effects of nitric oxide synthase inhibition on blood pressure. Am J Physiol Heart Circ Physiol 294:H190-197.
Wilmet E, Ismail AA, Heilporn A, Welraeds D, Bergmann P (1995) Longitudinal study
of the bone mineral content and of soft tissue composition after spinal cord section. Paraplegia 33:674-677.
Wilt T, Carlson F, Goldish G, MacDonald R, Niewoehner C, Rutkus I, Shamliyan T,
Tacklind J, Taylor B, Kane R (2008) Carbohydrate & lipid disorders & relevant considerations in persons with spinal cord injury. Evidence report/Technology assessment No. 163. In. Rockville, MD.: Agency for Healthcare Research and Quality.

122
Xiang QS (2006) Two-point water-fat imaging with partially-opposed-phase (POP) acquisition: an asymmetric Dixon method. Magn Reson Med 56:572-584.
Youngstrom TG, Bartness TJ (1995) Catecholaminergic innervation of white adipose
tissue in Siberian hamsters. Am J Physiol 268:R744-751. Youngstrom TG, Bartness TJ (1998) White adipose tissue sympathetic nervous system
denervation increases fat pad mass and fat cell number. Am J Physiol 275:R1488-1493.

123
4 ENERGY EXPENDITURE, CIRCADIAN RHYTHMS, AND
CARBOHYDRATE METABOLISM AFTER THORACIC SPINAL CORD
INJURY2
4.1 Introduction
Our intermittent eating patterns require our bodies to have means to cope with both
surges and slumps in nutritional levels associated with alternating periods of feeding and
fasting. We are exquisitely sensitive to changes in carbohydrate levels and are well
equipped to store and retrieve energy based on demand. These physiological
compensations are modulated by a combination of endocrine and neural signals. Spinal
cord injury (SCI) can mechanically interrupt the neural pathways between the brain and
the peripheral organs but it spares the humoral lines of communication. We have a
limited understanding of the way that the body regulates energy metabolism in the
absence, or with the partial disruption, of descending neural control.
It is important to appreciate the unique anatomy of the autonomic nervous system in
order to understand how it can be affected by SCI at different levels. Parasympathetic
outflow to the visceral organs exits the central nervous system at the level of the
brainstem; as a result, it is generally spared by SCI. Sympathetic outflow exits the cord
between T1 and L2 levels (Strack et al., 1988); therefore, high- and low-thoracic spinal
cord injuries can have profoundly different effects on the sympathetic nervous system
(SNS). High-thoracic injuries can disrupt most descending control from the brain to the
2 A version of this chapter will be submitted for publication. Inskip, J.A., Plunet, W., Ramer, L.M., Krassioukov, A.V. and Ramer, M.S. (2010) Energy expenditure, circadian rhythms, and carbohydrate metabolism after thoracic spinal cord injury.

124
preganglionic sympathetic neurons residing in the spinal cord, while low-thoracic injuries
leave the bulk of the SNS under descending neural control from the brain. Most organs
are innervated by both parasympathetic and sympathetic nerves, and require the
coordinated activity of these two branches in order to function normally. Following SCI,
there is typically a loss of balance between these two branches; immune function in the
spleen for example, is impaired by high-, but not mid-, thoracic SCI – likely an effect of
sympathetic dysregulation (Lucin et al., 2007). We do not know whether the level of
SCI, and resultant SNS dysfunction, affects whole body carbohydrate metabolism.
The intact autonomic nervous system also plays an essential effector role in a number of
daily rhythms governed by the biological clock in the suprachiasmatic nucleus (SCN)
(Chan et al., 1991; Warren et al., 1994; Makino et al., 1997; Cailotto et al., 2005). The
circadian rise in blood glucose, for example, which occurs just before the start of the
active period in both rats and humans, is the result of increased hepatic glucose
production mediated by an increase in sympathetic activity to the liver (Kalsbeek et al.,
2004; Cailotto et al., 2005). The liver requires a balance of autonomic activity; if either
the sympathetic or parasympathetic innervation is disrupted the circadian glucose rhythm
is abolished (Cailotto et al., 2008). It is possible that after high-level SCI, which
effectively separates the distal SNS from the brain, the endogenous rise in blood glucose
could be abolished.
The maintenance of circadian rhythms is important for many aspects of health. Chronic
disruption, phase-shift, or total loss of these biological patterns has been correlated with a
number of health complications, including obesity, diabetes, metabolic syndrome and
cardiovascular disease (CVD) (Aronson, 2001; Ruger and Scheer, 2009). Given the high

125
incidence of these pathologies among the SCI population (Bauman and Spungen, 1994;
Bauman et al., 1999a; Lee et al., 2005; Gater, 2007), and evidence that several hormonal
and hematogenous circadian rhythms are disrupted or absent after SCI (Krum et al.,
1991; Munakata et al., 1997; Iversen et al., 2002; Hjeltnes et al., 2005), we hypothesized
that other circadian rhythms, including blood glucose, activity and core temperature
might also be disrupted by SCI.
We have recently shown that T3 SCI in rats results in increased adipose tissue and
hypertriglyceridemia as early as one month post-injury (Inskip et al., 2010). The purpose
of our current study was three-fold: 1) to quantify some of the major components of
energy expenditure and energy consumption by animals with high-thoracic (T3) SCI,
low-thoracic (T10) SCI and sham-injured controls; 2) determine whether major circadian
rhythms are maintained following T3 and T10 SCI; 3) examine carbohydrate metabolism
after T3 and T10 SCI.
Given that the liver and pancreas receive the bulk of their sympathetic innervation from
mid-thoracic cord (T6-T12), the essential role of these organs in glucose metabolism, and
the high prevalence of carbohydrate and metabolic complications in clinical SCI, we
hypothesized that carbohydrate metabolism would be compromised by high-thoracic SCI,
resulting in greater latency to clear glucose from the blood, and poorer responsiveness to
insulin.
4.2 Materials and methods
All animal procedures were performed in accordance with the guidelines of the Canadian
Council for Animal Care and approved by the University of British Columbia Animal

126
Care Committee. Male Wistar rats (250-350g, n=36) were obtained from Charles River
Laboratories, Montreal, QC.
4.2.1 Surgery and animal care
Prophylactic enrofloxacin (Baytril; 10 mg/kg, subcutaneous (s.c.), Associated Veterinary
Purchasing (AVP), Langley, BC) was administered for three days prior to surgery. Rats
were anesthetized with ketamine hydrochloride (Vetalar; 70 mg/kg, intraperitoneal (i.p.),
AVP) and medetomidine hydrochloride (Domitor; 0.5 mg/kg, i.p., AVP). Both
buprenorphine (Temgesic; 0.02 mg/kg, s.c., AVP) and ketoprofen (Anafen; 5 mg/kg, s.c.,
AVP) were also administered immediately prior to surgery. A complete transection was
performed at T3 (n=12) or T10 (n=12) or sham surgery was performed at T3 (n=12).
A complete spinal cord transection was performed at the third (T3) or tenth (T10)
thoracic segment. In both surgeries, a dorsal midline incision was made in the skin and
superficial muscles overlying vertebrae were separated by blunt dissection. For T3
transection, the T2 dorsal spinous process was removed, and the durotomy and
transection was performed in the T2-T3 intervertebral gap. For T10 transection, a partial
laminectomy of the T9 vertebrae was performed, followed by durotomy and transection.
Complete transection was confirmed under the dissecting microscope by the clear
division of the rostral and caudal stumps of the cord, and gelfoam (Pharmacia & Upjohn
Company, Pfizer, New York, NY) was inserted in this space. The muscle and skin layers
were closed with sutures. Sham surgery included both the partial laminectomy of the T2
vertebra and durotomy at T3.

127
After surgery, anesthesia was reversed with atipamezole hydrochloride (Antisedan; 1
mg/kg, s.c., Novartis, Mississauga, ON). Animals were given warmed Lactated Ringer’s
solution (5 mL, s.c.) and were placed in a temperature-controlled chamber (Animal
Intensive Care Unit, HotSpot for Birds, Los Angeles, CA). Both buprenorphine (0.02
mg/kg, s.c.) and ketoprofen (5 mg/kg, s.c.) were administered once daily for three days to
manage post-operative pain. Antibiotic treatment (enrofloxacin, 10 mg/kg, s.c.) was also
continued for three days to reduce the incidence of bladder infection.
During the first week post-injury, manual bladder expression was performed three times
daily. After one week, this was reduced to twice daily until spontaneous bladder function
returned (about 10 days post-injury). Skin sutures were removed one week after surgery
to minimize skin irritation. Rats were monitored daily for the first two weeks after
surgery, and every second day thereafter. This included assessment of body weight,
activity level, social behaviour, lesion site and clinical signs of morbidity. A three-day
course of systemic antibiotics (enrofloxacin, 10 mg/kg, s.c.) was administered to animals
showing signs of bladder infection. If necessary, topical antibiotics (Triple Antibiotic
Ointment; polymixin B sulfate, bacitracin zinc and gramicidin) and hydrocortisone cream
(Cortate; 0.5% hydrocortisone) were used daily to treat dermatitis.
4.2.2 Telemetry
A subset of animals (n=5 per group, one animal per cage) had a telemetric capsule (ER-
4000 E-Mitter, Mini Mitter, OR) implanted into the abdominal cavity, for collection of
core temperature and activity data. Capsules were implanted one week prior to SCI to
obtain preoperative recording and minimize infection from the incision site being

128
dragged through bedding. Animals were given prophylactic antibiotics (enrofloxacin, 10
mg/kg s.c.) for three days prior to surgery.
Animals were anesthetized using isoflurane (Aerrane; 5% induction, 1-2% maintenance
in 100% O2, AVP) and administered buprenorphine (0.02 mg/kg, s.c.) prior to surgery. A
small midline incision was made and the abdominal muscle was opened with an incision
along the linea abla fascia. The sterilized telemetric probe, a sealed bio-inert capsule
made of laboratory grade glass with biocompatible silastic coating (total volume=1.2mL,
total weight <2g), was inserted into the abdominal cavity and placed dorsal to the small
intestine just off the midline. The small intestine was deflected back into place and the
abdominal muscles and skin were sutured closed.
Cages were kept on the telemetry base (ER-4000 receiver), which acquires data from the
implanted capsule and emits radiowaves to power the E-Mitter. Activity was recorded in
counts, which provide a qualitative measure of movement: each count is the result of a
change in signal strength between the transponder and receiver (Harkin et al., 2002).
Therefore, there is no unit of magnitude or direction associated with these units.
Temperature and activity data were collected every minute using the VitalView™ data
acquisition system. Minute data was averaged over each hour to get a sense of daily
patterns. In order to look at gross changes over time, but maintain daily rhythm
information, hourly data were averaged weekly. Total daily activity was also calculated
by combining the average hourly activity throughout each day and averaged weekly.

129
4.2.3 Housing
All rats were pair-housed, as single housing is stressful for rodents, and they neither
behave normally nor display normal eating habits when stressed. Cages (38x20x59 cm)
were kept on top of telemetric recorders in a room maintained at 22°, with a 12h:12h
light-dark cycle (lights on at 07:00h). Cages were fitted with a fenestrated rubber matting
to facilitate mobilization of animals with SCI (Multy Tile, Multy Industries, Atlanta,
GA). Modified low-reaching water bottles ensured easy access for all animals.
All animals received a standardized diet that was initiated three days pre-operatively to
let them acclimate to the novel food. Three times daily, each cage received 30 mL
complete meal replacement shake (strawberry), 20 g nutritive transport gel (Charles River
Laboratories International Inc., Wilmington, MA), 30 g fruit (orange and apple), 6 g
cereal (Cheerios) or 12 g commercially available rat treats (alternating), and rodent kibble
ad libitum (LabDiet, Rodent Diet 5001). Two weeks post-injury, the meal replacement
shake and nutritive transport gel were removed from the diet. Rodent kibble and water
were provided ad libitum for the duration of the experiment.
4.2.4 Calorie consumption
Twenty-four hour calorie consumption was measured once a week. To maintain as many
features as possible consistent with normal behaviour, consumption was measured in
pairs. On the day of testing, animals were transferred into clean cages, with a standard
amount of food present. Food was administered throughout the day as above. At the end
of the 24-hour period, animals were transferred to clean cages, all remaining food was
weighed, and calories were calculated as per nutrition information provided by the
manufacturers.

130
4.2.5 Blood sampling
All blood samples were taken from the distal third of the lateral tail. The surface of the
tail was prepared using a cotton swab with 70% ethanol, and venipuncture was performed
using a 25G needle, inserted at a shallow angle. Non-fasting blood biomarkers were
tested near the beginning of the light cycle pre-injury, at one month and three months
after injury. Animals were briefly anesthetized (4% Isoflurane in 95% O2 at 1L/min) and
loosely restrained using a clean tea towel. Glucose testing was performed using human
handheld monitors. Blood was collected using the disposable strips that accompany the
glucose monitor (which requires <0.01mL). Fasting blood biomarkers (12-hour
overnight fast) were tested using the same protocol and equipment.
4.2.6 Glucose tolerance test
A glucose tolerance test (GTT) was performed preoperatively, at one month and three
months post-injury. A glucose solution (40% D-(+)-Glucose (G8270, Sigma-Aldrich,
Oakville, ON) in sterile dH20) was prepared the day before each test and left at room
temperature overnight. This ensured that the glucose was predominantly in its β-form,
which is more readily transported than its α-isomer (Nelson and Cox, 2005). Following a
12-hour overnight fast, rats were administered an i.p. glucose load (2g/kg body weight in
distilled water) (Nakhooda et al., 1983; Zisman et al., 2000; Diehl et al., 2001). Blood
glucose was measured immediately before, and 30, 60, 90 and 120 minutes after the i.p.
glucose injection using a human glucose meter (Accu-chek Aviva, Roche, Mannheim,
Germany). A rapid return to baseline glucose levels indicates higher glucose sensitivity;
this is measured by the raw glucose levels at each time point or by the overall area under
the glucose curve (AUC) during the two-hour test.

131
4.2.7 Insulin tolerance test
An insulin tolerance test (ITT) was performed preoperatively, at one month and three
months post-injury. Following a 12-hour overnight fast, rats were administered a bolus
i.p. insulin injection (0.75 IU/kg in 0.1% NaCl at room temperature) (Zisman et al., 2000;
Ai et al., 2005; Zhang et al., 2008). Blood glucose was measured immediately before,
and 30, 60 and 120 minutes after the i.p. insulin injection using a human glucose meter
(Accu-chek Aviva). The ITT provides an index of the effects of insulin on both the liver
and the peripheral tissues. The rate constant for the disappearance of glucose (KITT) was
calculated as the slope of the reduction in log transformed blood glucose values over the
linear portion of the decline in glucose, multiplied by 100. Therefore, a larger rate
constant indicates greater insulin mediated glucose disposal.
4.2.8 Circadian glucose
At three months post-injury blood samples were taken via tail venipuncture every two
hours for 24 hours and measured using a glucometer (Accu-chek Aviva).
4.2.9 Data analysis
All data are presented as means ± standard error of the mean (SEM). Data analysis was
performed using Prism 5 for Mac OS X (GraphPad Software Inc., San Diego, CA). Two-
way repeated measures analysis of variance (RM-ANOVA) was used to compare calorie
intake, temperature, activity, and blood glucose data between groups. When a main
difference between groups was found, the Bonferroni post-test was used for pairwise
comparisons between groups. Where time effects were noted, one-way RM-ANOVA

132
was used to identify circadian rhythms within groups, with the Bonferroni post-test to
compare baseline light-period values (07:00h) and dark-period (19:00h-06:00h) values.
4.3 Results
4.3.1 Calorie consumption and body weight
All groups of animals consumed a similar amount of calories throughout the experiment;
there was no effect of SCI on total food consumption (Figure 4.1a, p>0.05). More
calories were consumed in the early weeks compared to the later weeks post-injury
(Figure 4.1a, all p<0.0001).
Following surgery, animals with T3 SCI and those with T10 SCI both lost a moderate
amount of weight (Figure 4.1b); it took 11 and 12 days, respectively, for these groups of
animals to return to their pre-operative weights. Sham animals did not lose any weight
subsequent to surgery (Figure 4.1b). This weight divergence lasted throughout the
experiment to three months post-injury, when sham-injured animals weighed more than
both animals with T3 SCI (p<0.01) and those with T10 SCI (p<0.001).
4.3.2 Core temperature and circadian temperature rhythms
Core temperature was depressed during a part of the light phase in the first week
following high-thoracic SCI compared to pre-injury temperature at the same time
(p=0.0284, Figure 4.2a,b). However, there was no significant effect of SCI on core
temperature (p>0.05). During the first week post-injury, circadian temperature changes
were maintained in T3 SCI (p<0.05 between 07:00h and 19:00h) and T10 SCI animals
(p<0.001), but these patterns were abolished in sham animals (p>0.05, Figure 4.2b). By
two weeks post-injury, all groups displayed nocturnal increases in core temperature and

133
this pattern was maintained for the duration of the experiment. Throughout the 12-week
experiment, there was a slight rise in temperature just around 09:00h (Figure 4.2b-e).
Figure 4.1 Calorie consumption and body weight throughout the 12-week
experiment.
Calorie consumption (a) was measured once a week over a 24-hour period. Calories
were obtained from an enriched diet including complete meal replacement shake,
nutritive transport gel, fruit, cereal, commercially available rat treats and rodent kibble.
There was no overall effect of SCI on calorie consumption.
Body weight (b) was recorded daily for the first two weeks post-injury, every two days
for the next two weeks, and every four days for the duration of the experiment. Both T3-
and T10-injured animals showed some weight loss following injury; however,
preoperative body weights were recovered by 11 and 12 days post-operatively,
respectively. For the majority of the experiment, sham-injured animals remained heavier
than animals with T3 SCI but not T10 SCI. At 12 weeks post-injury, sham-injured
animals were heavier than both animals with T3 SCI and those with T10 SCI.

134

135
Figure 4.2 Core temperature was decreased by T3 SCI but was normalized by two
weeks post-injury.
Core body temperature was recorded using a telemetric transponder implanted into the
abdominal cavity. Preoperative temperatures (a) were indistinguishable between groups.
The nocturnal increase in body temperature was evident in preoperative temperatures. At
one-week post-injury (b) the core temperature of animals with T3 SCI was significantly
lower than preoperative values. The nocturnal increase in temperature was present in
animals with T3 SCI and those with T10 SCI, but was absent in sham-injured animals.
At two-weeks post-injury (c) preoperative temperatures were restored and the nocturnal
rise in temperature was present in all groups. These patterns were maintained to six-
weeks post-injury (d). At this time, the thermic effect of food can also be seen, with a
peak in body temperature occurring just after the morning feeding (between 09:00 and
10:00h). Similar temperature patterns were maintained through to the end of the
experiment (12 weeks post-injury, e).

136

137
This peak in temperature, coincident with a peak in activity (see Figure 4.3), was likely
an effect of the disruption associated with the first daily dose of food and cage changing.
4.3.3 Circadian activity patterns
The circadian rhythm in locomotive activity was evident in data collected preoperatively
(Figure 4.3a). There was a significant main effect of time on activity levels (p<0.0001)
and one way RM-ANOVA post-tests revealed an increase in activity in the dark period
compared to light period in all groups (sham, p<0.0001; T3, p<0.0001; T10, p<0.0001).
RM-ANOVAs were conducted for each group individually to determine whether activity
levels demonstrated nocturnal rhythmicity. The nocturnal increase in activity level was
abolished in the first week following T3 SCI (p>0.05; Figure 4.3b). However, this
rhythm was restored by two weeks post-injury (p<0.001) and was maintained for the rest
of the experiment (Figure 4.3c-e). Nocturnal activity rhythms were preserved in animals
with T10 SCI in the first week after injury (p=0.0012) and throughout the experiment,
except for at three weeks post-injury, when there was no difference in activity levels
between dark and light periods. Nocturnal activity was increased in sham-injured
animals at one week post-injury (p<0.0001) and this pattern was maintained throughout
the experiment (all p<0.05; Figure 4.3).
The effects of enriched food (first given each day at 09:00h) were seen reflected in the
activity levels, which showed a coincident rise at this time (Figure 4.3). The resultant
overall pattern was biphasic, with peak activity levels at approximately 09:00h and
23:00h daily.

138
Figure 4.3 Nocturnal activity patterns were not disrupted by high- or low-thoracic
SCI.
Activity levels were recorded as a surrogate measure of energy expenditure using
telemetry. Activity counts were averaged every minute, and the average counts per
minute were graphed for each hour during the day. Preoperative activity levels were not
different between groups (a). All groups displayed greater activity levels during the dark
cycle (a). One week post-injury (b) the nocturnal increase in activity level was abolished
in animals with T3 SCI, but was present in animals with T10 SCI and sham controls.
All groups demonstrated a rise in activity levels during the dark cycle at two weeks post-
injury (c). Similar trends were maintained through six (d) and 12 weeks post-injury (e).
In all weeks post-injury (b-e), a rise in activity levels was observed just after the morning
feeding, which occurred between 09:00 and 10:00h. This is likely an effect of excitement
and physical activity in response to the enriched food that was given at this time.

139

140
4.3.4 Total daily activity
Preoperative total daily activity was equal between sham, T3 and T10 SCI groups (all
p>0.05, Figure 4.4). As expected, average total daily activity levels were significantly
decreased in the first week after both T3 and T10 SCI compared to sham-control activity
during this time (T3, p<0.001; T10, p<0.001, Figure 4.4). Total activity remained low in
T3 SCI animals compared to sham, at two (p<0.01), three (p<0.05) and six weeks post-
injury (p<0.05; Figure 4.4). At all other weeks (4,5,7-12), there was no difference in
average daily activity levels between animals with T3 SCI and those with sham injury (all
p>0.05). The total activity of animals with T10 SCI was quite variable in the early weeks
post-injury (Figure 4.4). After the first week post-injury, the average daily activity was
indistinguishable from sham activity levels at weeks 2-6, 8, and 10-12 post-injury (all
p>0.05); activity levels were lower in animals with T10 SCI at 7 and 9 weeks post-injury
(both p<0.05). Total activity levels were indistinguishable between animals with T3 SCI
and those with and T10 SCI throughout the 12-week experiment (p>0.05 every week
post-injury).
The comparison of post-operative activity levels for each group relative to their pre-
injury levels was also informative, and perhaps more appropriate given the variability in
activity levels between animals (Refinetti, 1989). One-way RM-ANOVA revealed that
T3 activity was reduced at all weeks compared to pre-injury (p<0.01 at all time points),
while T10 activity was reduced for the majority of time post-injury (at one week post-
injury, and weeks 5-12 (all p<0.05). Sham activity levels were not different between pre-
and post-operative periods (all p>0.05).

141
Figure 4.4 Average daily activity was reduced by both high- and low-thoracic SCI
acutely after injury.
Preoperative average daily activity was not different between groups. Total activity
levels of animals with T3 SCI and animals with T10 SCI were significantly reduced in
the first week post-injury. Total activity in both of these groups gradually returned to
levels that were not statistically different from sham-injured animals. There was no
difference between the activity levels of animals with T3 SCI and those with T10 SCI
throughout the experiment.
Symbols: grey bar indicates significant difference between animals with T3 SCI and
sham controls (p<0.05); black bar indicates significant difference between animals with
T10 SCI and sham controls (p<0.05).

142

143
4.3.5 Circadian blood glucose
Blood glucose in all three animal groups displayed the classic diurnal pattern, peaking
just before the start of the dark cycle and the onset of the activity period (Sham n=11; T3
n=10; T10 n=9; Figure 4.5). There was a significant effect of time on blood glucose
(p<0.001); one-way RM-ANOVAs and pair-wise comparisons between 07:00 and 19:00h
confirmed significant circadian blood glucose rhythms in sham (p<0.0001), T3 SCI
(p<0.0001), and T10 SCI (p<0.001). Qualitatively, animals with T10 SCI did not show a
gradual increase in glucose throughout the afternoon, however, quantitative analysis
revealed no significant effect of SCI on blood glucose patterns (p>0.05).
4.3.6 Glucose sensitivity
Preoperative intraperitoneal (i.p.) glucose injection resulted in a rapid rise in blood
glucose, followed by a gradual return towards baseline glucose levels over 90 minutes.
There was no effect of SCI on blood glucose levels during the test (p>0.05, Figure 4.6a).
Similarly, the total area under the curve (AUC), which provides a single measurement of
the overall glucose response, was not different between groups (p>0.05, Figure 4.6d). A
smaller AUC suggests more rapid clearing from blood, and therefore a greater sensitivity
to glucose administration, which is likely, but not definitively, due to greater insulin
sensitivity.
At one month post-injury, there was a difference in blood glucose levels between groups
(p<0.0001). Animals with T3 SCI had reduced glucose levels compared to sham-injured
animals at 30, 60 and 90 minutes post-injection (all p<0.001). Blood glucose was
normalized by 120 minutes post-injection (p>0.05). Animals with T10 SCI showed a
similar trend: they had reduced glucose levels compared to sham-injured animals at 30

144
Figure 4.5 Circadian blood glucose variations were not disrupted by high- or low-
thoracic SCI.
At three months post-injury, circadian blood glucose was recorded every two hours using
a human glucometer. All animals displayed the classic peak in blood glucose just prior to
the beginning of the active period. There was no effect of SCI on blood glucose
concentrations.
Symbols: white bar denotes significant difference in blood glucose levels of sham
controls from baseline morning levels (07:00h) (p<0.05); black bar denotes significant
difference in blood glucose levels of animals with T3 SCI from baseline levels (07:00h)
(p<0.05); grey bar denotes significant difference in blood glucose levels of animals with
T10 SCI from baseline levels (07:00h) (p<0.05).

145

146
Figure 4.6 Animals with high- and low-thoracic SCI displayed improved glucose
tolerance compared to sham-injured animals.
An intraperitoneal (i.p.) glucose injection was used to assess glucose tolerance (glucose
tolerance test, GTT. When conducted preoperatively, the GTT resulted in a rise in blood
glucose followed by a gradual return to baseline levels (a). There was no difference in
baseline blood glucose levels between groups. One month post-injury (b), animals with
T3 SCI exhibited smaller rise in glucose levels compared to both sham-injured animals
and animals with T10 SCI, suggesting improved glucose tolerance. Animals with T10
SCI exhibited a smaller increase in glucose levels compared to sham controls.
At three months post-injury (c), animals with T3 SCI had lower glucose levels than sham
controls throughout the majority of the GTT, while animals with T10 SCI had lower
glucose levels compared to sham controls in the later half of the test.
The total area under the curve (AUC) of the glucose response was also calculated (d).
This measure provides an overall assessment of glucose sensitivity, with a lower AUC
indicating greater glucose sensitivity. Animals with T3 SCI and those with T10 SCI had
lower AUCs than sham-injured animals at one and three months post-injury. Animals
with T3 SCI were more sensitive than those with T10 SCI at one month post-injury.
Symbols: ** denotes difference between both sham-injured animals and animals with T3
SCI and sham-injured animals and those with T10 SCI (p<0.05); x denotes difference
between sham-injured animals and those with T3 SCI (p<0.01); # denotes difference
between sham-injured animals and those with T10 SCI (p<0.01); * denotes difference
between the two indicated groups (p<0.05).
Abbrevations: Pre-op, preoperative; AUC, area under the curve.

147

148
(p<0.001), 60 (p<0.01) and 90 minutes post-injection (p<0.05), but there was no
difference by the end of the test (120 minutes; p>0.05). There was an early difference
between animals with T3 SCI and those with T10 SCI; the former had lower fasting
glucose levels at the beginning of the test (p<0.05), and lower glucose levels at 30
minutes post-injection (p<0.001, Figure 4.6b). The total AUC reflected these differences;
one month post-injury, animals with T3 SCI were more sensitive to glucose than animals
with T10 SCI (p<0.05) and sham controls (p<0.001, Figure 4.6d). Animals with T10 SCI
were more glucose sensitive than sham-injured animals (p<0.01).
Similar trends persisted at three months post-injury (Figure 4.6c). Animals with T3 SCI
had reduced blood glucose compared to sham-injured animals at 30 (p<0.01), 60
(p<0.001), and 90 minutes post-injection (p<0.001, Figure 4.6c). Animals with T10 SCI
also had reduced glucose levels compared to sham controls; however, this occurred later
in the test, at 60 (p<0.01), 90 (p<0.05) and 120 minutes post-injection (p<0.01, Figure
4.6c). Total AUCs also revealed that animals with T3 SCI and those with T10 SCI were
both more sensitive to glucose administration than sham controls (p<0.01, p<0.05).
There was no difference between the two groups with SCI (p>0.05).
4.3.7 Insulin-induced hypoglycemia
Preoperative insulin injection did not reveal differences between groups in raw glucose
response (p>0.05, Figure 4.7a) or rates of glucose disposal (slope, KITT) (p>0.05, Figure
4.7d). At one month post-injury, there was a significant effect of SCI on the glucose
response to insulin administration (p<0.0001, Figure 4.7b). Blood glucose levels of T3
SCI animals were significantly lower than sham-injured animals at all times following
insulin injection (all p<0.001), and those with T10 SCI (p<0.05 at 30 min, p<0.01 at 60

149
Figure 4.7 Animals with T3 SCI and animals with T10 SCI displayed rapid insulin-
induced hypoglycemia at one and three months post-injury, respectively.
An intraperitoneal (i.p.) insulin tolerance test (ITT) was used to assess the insulin
sensitivity following SCI. The glucose response to insulin was measured using a human
glucometer. The preoperative response to i.p.insulin was indistinguishable between
groups (a). At one month post-injury (b), animals with T3 SCI demonstrated a greater
sensitivity to insulin, as seen by their larger drop in blood glucose levels throughout the
test. By three months post-injury (c), there were no differences in blood glucose levels
between groups. The rate of glucose disposal (slope, KITT, d) provides a single measure
of insulin sensitivity, with a higher KITT indicating a more rapid glucose disappearance
rate. One month post-injury, animals with T3 SCI had a larger KITT than animals with
T10 SCI and sham controls. At three months following SCI this trend was altered and
animals with T10 SCI showed the greatest sensitivity to insulin.
Symbols: x denotes significant difference between animals with T3 SCI and sham
controls (p<0.05); * denotes significant difference between the two indicated groups
(p<0.05).
Abbrevations: Pre-op, preoperatively; KITT, rate of glucose disposal.
150

151
min and 120 min). There was no difference between glucose levels in sham-injured
animals and those with T10 SCI (all p>0.05). These relationships were also reflected by
the overall rate of glucose disposal (KITT, Figure 4.7d).
The pattern of insulin sensitivity that emerged at one month post-injury was abolished by
three months post-injury, at which time there was no overall effect of SCI on blood
glucose levels during the insulin tolerance test (p>0.05, Figure 4.7c). However, animals
with T10 SCI experienced a more rapid decline in blood glucose in response to insulin
compared to sham controls (p<0.05).
4.3.8 Fasting and non-fasting blood glucose
To determine whether the insulin-induced hypoglycemia results were applicable to
endogenously-triggered hypoglycemia, we measured blood glucose levels in a fed state
and following a 12-hour fast. Preoperative fasting glucose was not different between
groups (sham 6.04 ± 0.27, T3 6.02 ± 0.25, T10 5.87 ± 0.15, p=0.872).
At one month post-injury, there was no difference between groups in fasting or non-
fasting glucose levels (p>0.05, Table 4.1). All groups experienced a decrease in blood
glucose in response to fasting (sham p<0.0001, T3 SCI p<0.0001, T10 SCI p=0.0011).
Animals with T3 SCI did not show an accentuated hypoglycemic response, as was seen
in the acute insulin tolerance test, which was also performed at one month post-injury.
At three months post-injury, non-fasting glucose levels were significantly lower in
animals with T10 SCI than in sham-injured animals (p<0.001, Table 4.1). Again, sham-
injured animals suffered mild hypoglycemia when fasting (p=0.03). Animals with T3

152
Table 4.1 Animals with SCI experienced mild hypoglycemia in response to a 12-
hour fast at one month post-injury, but not at three months post-injury.
Blood glucose levels were assessed in a non-fasting situation and following a 12-hour
fast. All animals exhibited mild hypoglycemia in response to a 12-hour fast at one month
post-injury. At three months post-injury, sham-injured animals again exhibited mild
hypoglycemia in response to fasting. At this time, animals with T3 SCI and those with
T10 SCI did not experience any change in blood glucose.
Symbols: * denotes significantly different from non-fasting values at the same time post-
injury (p<0.05); † denotes significantly different from sham control group (p<0.05).

153
Time post-injury
Blood glucose (mmol/L)
Sham (n=11)
T3 SCI (n=10)
T10 SCI (n=9)
Non-fasting 7.82 ± 0.29 7.57 ± 0.25 7.09 ± 0.19 1 month
12-hour fast 5.68 ± 0.17* 5.33 ± 0.11* 6.24 ± 0.143*
Non-fasting 6.64 ± 0.14 6.21 ± 0.11 5.91 ± 0.06† 3 months
12-hour fast 6.34 ± 0.13* 5.97 ± 0.20 6.14 ± 0.14

154
SCI and T10 SCI, on the other hand, did not show decreases in blood glucose (T3 SCI
p=0.29 and T10 SCI p=0.16).
4.3.9 Fasting and non-fasting blood ketones
Circulating ketones are typically low in fed humans and rodents (Robinson and
Williamson, 1980). During prolonged fasting, ketone body production by the liver is
increased and ketones are used by some tissues as an alternative energy source to glucose
(Olpin, 2004). Consistent with the general role of ketones, all groups showed low ketone
levels under non-fasting conditions at one month post-injury (Figure 4.8a). There was no
difference in ketone levels between groups (p>0.05). Compared to non-fasting values, all
groups showed an increase in ketones following a 12-hour fast (all p<0.001, Figure 4.8b).
At this time, animals with T3 SCI had significantly higher blood ketones compared to
both sham-injured animals and those with T10 SCI (both p<0.001). Animals with T10
SCI, on the other hand, had lower blood ketones than sham-injured animals (p<0.05). At
three months post-injury, animals with T3 SCI also showed significantly higher blood
ketones compared to sham-injured animals (p<0.05, Figure 4.8c).
4.4 Discussion
Here we present novel data about metabolic function after SCI, an understudied topic,
especially in experimental SCI. We demonstrate that calorie consumption is similar in
animals with complete T3 SCI, animals with complete T10 SCI and those with sham
injury. We also show that activity levels are equally depressed in animals with T3 SCI
and those with T10 SCI. Interestingly, the normal circadian patterns in core body
temperature, activity levels and blood glucose were generally unaffected by high- and

155
Figure 4.8 Animals with high-thoracic SCI exhibit a greater ketone response to
fasting.
At one month post-injury, non-fasting ketone levels were equally low in all groups (a).
A 12-hour fast triggered a ketone response in all groups (b). Animals with T3 SCI
showed a significantly greater rise in blood ketones compared to animals with T10 SCI
(p<0.05) and sham-injured animals (p<0.0001). At three months following post-injury
(c), fasting ketones were again elevated compared to sham-injured animals (p<0.05), but
there was no difference between T3 and T10 injured animals.
Symbols: * denotes significant difference between the two indicated groups (p<0.05).

156

157
low-thoracic SCI. Finally, unlike the pathological carbohydrate metabolism associated
with diabetes that has been documented clinically, glucose tolerance and insulin
sensitivity were both increased in animals with SCI. This work contributes to the
development of animal models and translational research in the area of metabolism after
SCI.
Energy intake is an important component of any discussion regarding energy balance.
We recently showed that animals with T3 SCI accumulate more adipose tissue than
animals with T10 SCI and sham-injured animals. One goal of our current study was to
determine whether this excess energy might have been partly due to an increase in energy
intake. One previous report found that, when provided with rodent kibble ad libitum,
calorie consumption was consistently higher in rats with complete T3 SCI compared to
sham controls (Primeaux et al., 2007). However, with our enriched food diet in addition
to kibble ad libitum, we did not find any difference in calorie consumption between
groups. Body weight was decreased by SCI, but preoperative weights were recovered, in
both groups with SCI, within two weeks post-injury (Figure 4.1) consistent with our
previous work (Inskip et al., 2010). Sham-injured animals gained more weight in the
experiment than animals with T3 SCI (Figure 4.1b).
In the current experiment, activity levels provided a surrogate measurement of energy
expenditure from physical activity. Acutely after SCI, both animals with T3 SCI and
those with T10 SCI displayed reduced daily activity. Activity levels were equally
suppressed by T3 and T10 SCI; therefore, an extreme imbalance in energy expenditure
due to reduced activity is unlikely to explain the increased adiposity that we have recently
observed in the former, but not the latter, at one month post-injury (Inskip et al., 2010).

158
Of course, activity units are not the ideal measurement of activity-related energy
expenditure. Even with the same level of activity, it is likely that animals with SCI have
altered costs of physical activities. Recent research in energy expenditure after SCI has
revealed that the standard non-invasive equipment used to estimate energy expenditure,
which is calibrated to able-bodied controls, underestimates the energy demands of some
tasks and overestimates the energy expenditure associated with other tasks (Collins et al.,
in press; Hiremath and Ding, 2009). We expect that there are also differences in energy
expenditure associated with physical activity in animals after SCI. On the one hand, they
may have a higher cost of movement in some respects due to the fact that they mobilize
with their forelimbs only; however, it is conceivable that their energy expenditure is
reduced in other respects, due to the fact that only small muscles are recruited to perform
the task compared to sham-injured animals, who recruit the large hindlimb muscles as
well. The use of indirect calorimetry would allow us to determine the overall calorie
consumption associated with movement. This analysis might also allow us to determine
whether there are differences in calorie consumption between animals with high- and
low-thoracic SCI. From our current results, we can only conclude that there are no
differences between animals with T3 SCI and those with T10 SCI at the whole body
activity level.
The activity data also revealed that there were no major changes in the timing of activity
periods and resting periods throughout the experiment: rats with SCI displayed the typical
increase in nocturnal activity. The nocturnal increase in core body temperature also
remained present after high- and low-thoracic SCI, even during the first week post-injury,
when acute hypothermia is present (Laird et al., 2006). Taken together, the patterns in

159
activity levels and body temperatures indicate that the circadian rhythm is not grossly
abolished or phase-shifted by SCI.
We were surprised to observe the classic circadian rhythm in blood glucose in all groups
of animals, given the imbalance between the parasympathetic and sympathetic neural
control of the liver that is present after high-thoracic SCI. A recent study investigating
the effects of liver denervation found that when either sympathetic or parasympathetic
innervation to the liver was disrupted, so too was the typical circadian glucose pattern
(Cailotto et al., 2008). There are several possible reasons for this discrepancy. In the
former study, the sympathetic nerves were cut at the level of the hepatic artery. This
injury severs the axons of the sympathetic ganglionic neurons leading to the degeneration
of the distal tip of the neurons within the liver, accompanied by increased fibroblast
proliferation (Albino-Teixeira et al., 1990), changes in microcirculation (Colle et al.,
2004) and major decreases in norepinephrine content (Berg et al., 1990). Therefore, the
hepatic environment is quite different from that after SCI, where the peripheral
sympathetic circuitry, and likely the local hepatic environment, is preserved. This
difference could contribute to the circadian glucose rhythm after SCI and not after
hepatic sympathetic denervation. With the hepatic microenvironment intact, it is possible
that the rhythm could be maintained by hormonal rather than neural cues.
Systemic glucose levels are actively maintained, with basal levels of glucose mobilization
and uptake occurring even at rest (Woerle et al., 2003). The balance between
mobilization and uptake is modulated by hormonal and neural cues and can be rapidly
altered to respond to changes in internal energy states (Nonogaki, 2000). The uptake role
becomes particularly important after meals, when there is an surge of glucose absorbed

160
into the blood (Jenkins et al., 1982). Glucose uptake occurs predominantly in the muscle,
liver and adipose tissue. Given the muscle atrophy that exists below the level of the SCI
(Dupont-Versteegden et al., 1998; Gregory et al., 2003; Biering-Sorensen et al., 2009),
and resultant decrease in metabolically active tissue, there should be reduced demand for
glucose in the periphery, resulting in slower clearance of glucose from the blood. On this
basis, we expected that glucose clearance would be slower after SCI, especially given the
high prevalence of insulin resistance and obesity seen clinically. However, we, like one
other study conducted in a similar model (Primeaux et al., 2007), found opposite results
in an animal model of SCI. One possible explanation is that we did not observe our
animals for a sufficient length of time post-injury; the human equivalent of three rat
months is approximately 7.5 years (Ruth, 1935). The studies that have documented
insulin resistance in SCI (and reported time post-injury) have been conducted on
individuals that were, on average, 12-18 years post-injury (Duckworth et al., 1980;
Bauman and Spungen, 1994; Bauman et al., 1999a). Furthermore, when individuals are
grouped on the basis of glucose tolerance and insulin resistance, there is a significant
difference in years post-injury (but not average age) between the insulin-resistant diabetic
subjects and those with normal glucose tolerance (Duckworth et al., 1980). These
examples highlight the possibility that the typical timelines of experimental SCI are
simply not long enough to mimic the chronic pathological changes in glucose
homeostasis seen clinically. More research will be needed to determine if this is the case.
During periods of energy deficit, such as insulin-induced hypoglycemia, glucose is
mobilized primarily from hepatic glycogen stores. The pancreas also plays an important
role in the response to hypoglycemia, by increasing glucagon secretion and reducing

161
insulin secretion. As the liver and the pancreas receive the bulk of their sympathetic
innervation from the celiac ganglia and superior mesenteric ganglion, we hypothesized
that this response might have been perturbed in animals with T3 SCI but not those with
T10 SCI or sham controls. However, this was not the case. Insulin-induced
hypoglycemia was pronounced in high-thoracic SCI animals one month after injury. This
was observed quantitatively in the rapid rate of blood glucose decline and qualitatively in
the abnormal behaviour during the latter half of the test. While all animals were lethargic
during testing, animals with T3 SCI were almost completely inactive and, at the end of
the test, few responded normally when fruit and treats were provided. These animals
clearly showed a deficit in their ability to respond to acute hypoglycemia. However, the
same animals did not display any abnormalities in their glucose response to overnight
fasting (Table 4.1) suggesting that physiological, endogenous, longer-term responses are
not perturbed by SCI.
The ketone response (Figure 4.8) suggests that there could be a change in substrate
metabolism following SCI. Ketones, which provide an alternate fuel to glucose for
peripheral tissues, are produced by the liver when carbohydrate levels are low. The
increased ketone response observed in animals with T3 SCI, suggest increased hepatic
production of ketones (or decreased peripheral uptake of ketones). Whether this
production represents a normal compensation for low carbohydrate levels or a
fundamental alteration in substrate metabolism post-injury, such as an increased reliance
on ketones for metabolism, remains to be elucidated.
Taken together, our results suggest that the loss of descending sympathetic control of the
liver and pancreas does not directly contribute to the typical pathological changes that are

162
associated with SCI, such as impaired glucose tolerance and reduced insulin sensitivity
after spinal cord injury. This points to the role of other energetic changes, such as
reduced physical activity levels (van den Berg-Emons et al., 2008), high fat intake (Groah
et al., 2009) and increase in adipose tissue (Edwards et al., 2008; Maruyama et al., 2008),
and supports the role of activity and lifestyle interventions in maintaining healthy
metabolic profiles following SCI.
The variation in injury level, completeness, and degree of autonomic nervous system
injury can add some level of uncertainty into clinical metabolic research. Animal models
provide another valuable way to investigate the effects of SCI on metabolism. They
provide a medium where both injury level and severity can be determined conclusively.
The combined efforts of clinical and experimental researchers should clarify the
metabolic sequelae of SCI, their etiologies, and the most effective means to maintain
good health despite these changes.

163
4.5 References Ai J, Wang N, Yang M, Du ZM, Zhang YC, Yang BF (2005) Development of Wistar rat
model of insulin resistance. World J Gastroenterol 11:3675-3679. Albino-Teixeira A, Matias A, Soares-da-Silva P, Sarmento A, Azevedo I (1990) Effects
of sympathetic denervation on liver fibroblasts: prevention by adenosine. J Auton Pharmacol 10:181-189.
Aronson D (2001) Impaired modulation of circadian rhythms in patients with diabetes
mellitus: a risk factor for cardiac thrombotic events? Chronobiol Int 18:109-121. Bauman WA, Spungen AM (1994) Disorders of carbohydrate and lipid metabolism in
veterans with paraplegia or quadriplegia: a model of premature aging. Metabolism 43:749-756.
Bauman WA, Adkins RH, Spungen AM, Waters RL (1999a) The effect of residual
neurological deficit on oral glucose tolerance in persons with chronic spinal cord injury. Spinal Cord 37:765-771.
Berg AL, Hammarstrom LE, Hansson P, Holmin T, Nilsson-Ehle P (1990) Hepatic lipase
activity after liver denervation in hypothyroid rats. Acta Endocrinol (Copenh) 123:90-94.
Biering-Sorensen B, Kristensen IB, Kjaer M, Biering-Sorensen F (2009) Muscle after
spinal cord injury. Muscle Nerve 40:499-519. Cailotto C, La Fleur SE, Van Heijningen C, Wortel J, Kalsbeek A, Feenstra M, Pevet P,
Buijs RM (2005) The suprachiasmatic nucleus controls the daily variation of plasma glucose via the autonomic output to the liver: are the clock genes involved? Eur J Neurosci 22:2531-2540.
Cailotto C, van Heijningen C, van der Vliet J, van der Plasse G, Habold C, Kalsbeek A,
Pevet P, Buijs RM (2008) Daily rhythms in metabolic liver enzymes and plasma glucose require a balance in the autonomic output to the liver. Endocrinology 149:1914-1925.
Chan YS, Cheung YM, Pang SF (1991) Rhythmic release pattern of pineal melatonin in
rodents. Neuroendocrinology 53:60-67. Colle I, Van Vlierberghe H, Troisi R, De Hemptinne B (2004) Transplanted liver:
consequences of denervation for liver functions. Anat Rec A Discov Mol Cell Evol Biol 280:924-931.
Collins EG, Gater D, Kiratli J, Butler J, Hanson K, Langbein WE (in press) Energy Cost
of Physical Activities in Persons with Spinal Cord Injury. Med Sci Sports Exerc.

164
Diehl KH, Hull R, Morton D, Pfister R, Rabemampianina Y, Smith D, Vidal JM, van de
Vorstenbosch C (2001) A good practice guide to the administration of substances and removal of blood, including routes and volumes. J Appl Toxicol 21:15-23.
Duckworth WC, Solomon SS, Jallepalli P, Heckemeyer C, Finnern J, Powers A (1980)
Glucose intolerance due to insulin resistance in patients with spinal cord injuries. Diabetes 29:906-910.
Dupont-Versteegden EE, Houle JD, Gurley CM, Peterson CA (1998) Early changes in
muscle fiber size and gene expression in response to spinal cord transection and exercise. Am J Physiol 275:C1124-1133.
Edwards LA, Bugaresti JM, Buchholz AC (2008) Visceral adipose tissue and the ratio of visceral to subcutaneous adipose tissue are greater in adults with than in those without spinal cord injury, despite matching waist circumferences. Am J Clin Nutr 87:600-607.
Gater DR, Jr. (2007) Obesity after spinal cord injury. Phys Med Rehabil Clin N Am 18:333-351.
Gregory CM, Vandenborne K, Castro MJ, Dudley GA (2003) Human and rat skeletal muscle adaptations to spinal cord injury. Can J Appl Physiol 28:491-500.
Groah SL, Nash MS, Ljungberg IH, Libin A, Hamm LF, Ward E, Burns PA, Enfield G (2009) Nutrient intake and body habitus after spinal cord injury: an analysis by sex and level of injury. J Spinal Cord Med 32:25-33.
Harkin A, O'Donnell JM, Kelly JP (2002) A study of VitalView for behavioural and physiological monitoring in laboratory rats. Physiol Behav 77:65-77.
Hiremath SV, Ding D (2009) Evaluation of activity monitors to estimate energy expenditure in manual wheelchair users. Conf Proc IEEE Eng Med Biol Soc 1:835-838.
Hjeltnes N, De Groot P, Birkeland KI, Falch JA, Iversen PO (2005) Tetraplegic subjects have hyperleptinaemia with marked circadian variation. Clin Endocrinol (Oxf) 62:223-227.
Inskip JA, Plunet W, Ramer LM, Ramsey JB, Yung A, Kozlowski P, Ramer MS, Krassioukov AV (2010) Cardiometabolic risk factors in experimental spinal cord injury. J Neurotrauma 27:275-285.
Iversen PO, Groot PD, Hjeltnes N, Andersen TO, Mowinckel MC, Sandset PM (2002) Impaired circadian variations of haemostatic and fibrinolytic parameters in tetraplegia. Br J Haematol 119:1011-1016.

165
Jenkins DJ, Ghafari H, Wolever TM, Taylor RH, Jenkins AL, Barker HM, Fielden H, Bowling AC (1982) Relationship between rate of digestion of foods and post-prandial glycaemia. Diabetologia 22:450-455.
Kalsbeek A, La Fleur S, Van Heijningen C, Buijs RM (2004) Suprachiasmatic GABAergic inputs to the paraventricular nucleus control plasma glucose concentrations in the rat via sympathetic innervation of the liver. J Neurosci 24:7604-7613.
Krum H, Howes LG, Brown DJ, Ungar G, Moore P, McNeil JJ, Louis WJ (1992) Risk factors for cardiovascular disease in chronic spinal cord injury patients. Paraplegia 30:381-388.
Laird AS, Carrive P, Waite PM (2006) Cardiovascular and temperature changes in spinal cord injured rats at rest and during autonomic dysreflexia. J Physiol 577:539-548.
Lee MY, Myers J, Hayes A, Madan S, Froelicher VF, Perkash I, Kiratli BJ (2005) C-reactive protein, metabolic syndrome, and insulin resistance in individuals with spinal cord injury. J Spinal Cord Med 28:20-25.
Lucin KM, Sanders VM, Jones TB, Malarkey WB, Popovich PG (2007) Impaired antibody synthesis after spinal cord injury is level dependent and is due to sympathetic nervous system dysregulation. Exp Neurol 207:75-84.
Makino M, Hayashi H, Takezawa H, Hirai M, Saito H, Ebihara S (1997) Circadian rhythms of cardiovascular functions are modulated by the baroreflex and the autonomic nervous system in the rat. Circulation 96:1667-1674.
Maruyama Y, Mizuguchi M, Yaginuma T, Kusaka M, Yoshida H, Yokoyama K, Kasahara Y, Hosoya T (2008) Serum leptin, abdominal obesity and the metabolic syndrome in individuals with chronic spinal cord injury. Spinal Cord 46:494-499.
Munakata M, Kameyama J, Kanazawa M, Nunokawa T, Moriai N, Yoshinaga K (1997) Circadian blood pressure rhythm in patients with higher and lower spinal cord injury: simultaneous evaluation of autonomic nervous activity and physical activity. J Hypertens 15:1745-1749.
Nakhooda AF, Poussier P, Marliss EB (1983) Insulin and glucagon secretion in BB wistar rats with impaired glucose tolerance. Diabetologia 24:58-62.
Nelson DL, Cox MM (2005) Principles of Biochemistry, 4th Edition. New York: W.H.
Freeman and Company. Nonogaki K (2000) New insights into sympathetic regulation of glucose and fat
metabolism. Diabetologia 43:533-549. Olpin S (2004) Implications of impaired ketogenesis in fatty acid oxidation disorders.
Prostaglandins Leukot Essent Fatty Acids 70:293-308.

166
Primeaux SD, Tong M, Holmes GM (2007) Effects of chronic spinal cord injury on body
weight and body composition in rats fed a standard chow diet. Am J Physiol Regul Integr Comp Physiol 293:R1102-1109.
Robinson AM, Williamson DH (1980) Physiological roles of ketone bodies as substrates
and signals in mammalian tissues. Physiol Rev 60:143-187. Rüger M, Scheer FA (2009) Effects of circadian disruption on the cardiometabolic
system. Rev Endocr Metab Disord 10: 245-60.
Ruth E (1935) Metamorphosis of the pubic symphysis. I. The white rat (Mus norvegicus albinus). Anat Rec 64:7.
Strack AM, Sawyer WB, Marubio LM, Loewy AD (1988) Spinal origin of sympathetic preganglionic neurons in the rat. Brain Res 455:187-191.
van den Berg-Emons RJ, Bussmann JB, Haisma JA, Sluis TA, van der Woude LH, Bergen MP, Stam HJ (2008) A prospective study on physical activity levels after spinal cord injury during inpatient rehabilitation and the year after discharge. Arch Phys Med Rehabil 89:2094-2101.
Warren WS, Champney TH, Cassone VM (1994) The suprachiasmatic nucleus controls the circadian rhythm of heart rate via the sympathetic nervous system. Physiol Behav 55:1091-1099.
Woerle HJ, Meyer C, Dostou JM, Gosmanov NR, Islam N, Popa E, Wittlin SD, Welle SL, Gerich JE (2003) Pathways for glucose disposal after meal ingestion in humans. Am J Physiol Endocrinol Metab 284:E716-725.
Zhang M, Lv XY, Li J, Xu ZG, Chen L (2008) The characterization of high-fat diet and multiple low-dose streptozotocin induced type 2 diabetes rat model. Exp Diabetes Res 2008:704045.
Zisman A, Peroni OD, Abel ED, Michael MD, Mauvais-Jarvis F, Lowell BB,
Wojtaszewski JF, Hirshman MF, Virkamaki A, Goodyear LJ, Kahn CR, Kahn BB (2000) Targeted disruption of the glucose transporter 4 selectively in muscle causes insulin resistance and glucose intolerance. Nat Med 6:924-928.

167
5 DISCUSSION
The results presented in this thesis demonstrate the wide range of cardiovascular (CV)
and metabolic changes that can be elicited by spinal cord injury (SCI). The effects of
SCI on CV physiology are not always readily apparent. Both resting blood pressure (BP)
and heart rate (HR) can be remarkably similar between animals with SCI and
neurologically-intact controls. It is in the minute-to-minute CV control, normally
effected by a combination of central control and reflex pathways, that the SCI-associated
dysfunctions emerge more clearly. Indeed, the capacity of the CV system to respond to
physiological perturbations can be severely compromised by SCI. Here I have shown
that the BP response to either an orthostatic stress or a visceral stimulus reveals a
pronounced divergence between CV control in animals with high- and low-thoracic SCI.
Furthermore, time was found to play an important role in the degree of these
dysfunctions.
The metabolic system also has an important role in the short-term maintenance of
homeostasis. The body must respond to changes in endogenous energy levels by altering
the balance of energy storage and retrieval. These actions are carried out by a
combination of neuronal and hormonal pathways, mediating a wide variety of roles in
carbohydrate and lipid metabolism. Many of these anatomical pathways travel via the
spinal cord and are therefore vulnerable to injury. Here I have shown that lipid
metabolism is altered by SCI, and that visceral white adipose tissue (vWAT)
accumulation and blood triglyceride levels are related to the level of thoracic SCI. In the
time frame that I observed, this relationship was not as clearly defined in carbohydrate
metabolism, despite the differential disruption of neural pathways to visceral organs
168
involved in glucose metabolism. Differences in the efficiency of carbohydrate
metabolism over time post-injury suggest that the body continues to respond to the
changing body composition beyond the acute post-injury period.
The following discussion outlines the CV and metabolic outcomes of experimental SCI
and how they relate to their clinical counterparts. Both sections discuss the implications
of the current research, their relevance to future studies and to experimental SCI research
more broadly, including recommendations for refining specific methodologies. Finally,
some general insights and limitations of experimental SCI research are presented.
5.1 Cardiovascular function after experimental SCI
Cardiovascular function is abnormal after SCI. This is manifested clinically in acute
episodes of hypertension or hypotension in response to specific stimuli. The fact that rats
with SCI exhibit some CV dysfunctions similar to those seen clinically has been
appreciated for some time; however, orthostatic hypotension (OH) has never been
modeled experimentally, despite its restrictive effects on the lives of individuals with
SCI. The results of Chapter 2 demonstrate the feasibility of incorporating novel
physiological stimuli, such as an orthostatic stress, in our autonomic testing in animals.
A reliable and reproducible orthostatic stressor is an important addition to our autonomic
testing toolkit in animals, as many individuals who suffer from AD must also suffer from
OH (Mathias and Frankel, 1999). We now have a way to reproduce these conditions and
model human SCI more closely. With this model, we can also address questions
regarding whether the pronounced range of BPs experienced by individuals with SCI
affects the anatomical structure and function of the CV system. Furthermore, this model

169
could potentially be used to evaluate the recovery of CV function following therapeutic
interventions for SCI.
Alternative sensory stimuli for eliciting AD are also important additions for experimental
SCI research because there are myriad triggers present in the daily lives of individuals
with this condition. Therefore, a range of stimuli will be necessary if we are to test
preclinical therapeutic interventions in the future. It is important to establish the typical
response to these novel stimuli before we test these therapies because not all noxious or
non-noxious stimuli reliably trigger AD (Burton et al., 2008). As mentioned in Chapter
2, the sexual stimulus utilized was complicated by the necessity of restraint and upright
position. However, the results provide proof of principle for using novel stimuli in
experimental research. The use of analogous assessments in the clinical setting and with
our experimental animals will facilitate the translation of our understanding of CV
dysfunction after SCI between the bench and the bedside.
Further experiments will be necessary to determine whether the severity of OH in
experimental SCI correlates with the degree of damage of sympathetic pathways, and
therefore whether it could be an appropriate test to assess autonomic function, for
example after a contusion injury or following therapeutic intervention. Severity of injury
is important because a large proportion of SCI researchers use incomplete injuries,
including contusion or clip-compression injury. Therefore, it would be important to
validate the interaction between the severity of injury and the degree of OH. Previous
work from our lab has shown that the severity of AD correlated with the severity of clip
compression injury acutely after T5 SCI (Maiorov et al., 1998). Therefore, I would
predict similar effects on OH, as both of these disorders occur, most commonly, when the

170
injury disrupts the descending sympathetic pathways to the splanchnic vascular bed.
However, it is important to determine the natural course of CV dysfunction for each
specific type and severity of injury in question, as animals with mild (20 g) or moderate
(35 g) clip-compression injuries did not exhibit any signs of AD at one week post-injury,
despite the same animals clearly showing signs one day after injury (Maiorov et al.,
1998).
In the current work, I evaluated only two discrete injury levels. Further experiments will
also be necessary if there is interest in fine-tuning the relationship between BP control
and level of SCI. Based on the results in Chapter 2, and the general understanding of the
primacy of the splanchnic vasculature in BP control, the relationship between BP control
and level of injury is unlikely to be a linear one.
5.2 Recommendations for future cardiovascular research in experimental SCI
One of the disadvantages of using fluid-filled cannulae connected to an external
transducer to record CV variables is that the results obtained provide only a brief
snapshot of CV function. This is especially relevant after SCI, when we know the CV
system undergoes changes over time (Mathias and Frankel, 1999; Mayorov et al., 2001).
Practically speaking, the recording protocol also creates several unavoidable stressors,
including the fact that it must be performed shortly after surgery, demands animal
handling, and restricts natural behaviour and movement. In the future, I would prefer to
use a telemetric system with an implantable fluid-filled cannula and radiotelemetric
transponder. This transponder could be implanted prior to SCI, which would reduce the
confounding effects of surgery and stress, and allow me to obtain preoperative CV data.
Furthermore, the use of telemetry would give me the capacity to ask a range of clinically-

171
relevant questions otherwise limited by the short-term nature of the external transducer
set-up. In my mind, the questions with highest priority are: does the severity of AD and
OH change over time for individual animals; what is the incidence of AD during
rehabilitation; in individual animals, is the severity of AD comparable when elicited by
different kinds of sensory stimuli.
The research herein also has implications for experimental SCI research more broadly.
With CV autonomic function recently highlighted as a priority for individuals with SCI
(Anderson, 2004), several research groups are beginning to include CV function as an
outcome measure following a therapeutic intervention, either in its own right or as part of
a battery of motor, sensory, and autonomic assessments (Kalincik et al., in press). The
current results, together with the clinical incidence and level dependence of CV
dysfunction, support the use of a high-thoracic or cervical injury model in order to
establish reliable, quantifiable abnormalities in BP. This is necessary so that we can then
focus on ameliorating these abnormalities.
5.3 Metabolic function after experimental SCI
With new tools, greater awareness, and more widespread and frequent testing, the clinical
community is beginning to appreciate the wide variety of metabolic changes in
individuals with SCI. On the other hand, the experimental research is lacking in this area.
The overall objective of the experiments in Chapters 3 and 4 was to determine whether
there were detectable changes in whole body metabolism after experimental SCI and, if
so, whether these changes varied with thoracic injury level.
The results of Chapter 3 reveal that the overall adiposity and blood triglyceride levels of
animals with high- and low-thoracic SCI were distinctly different. The results of

172
carbohydrate metabolism were not so discrete; overall, animals with SCI demonstrated
more efficient glucose metabolism than sham-injured controls, but this effect was not
clearly affected by the level of SCI.
At first look, the discrepancy in carbohydrate metabolism between the results of Chapter
4, showing efficient carbohydrate metabolism after SCI, and the high clinical prevalence
of diabetes reported elsewhere (Bauman and Spungen, 1994) appears pronounced and,
more importantly, divergent. However, a review of the literature suggests that there may
be two distinct phenotypes of carbohydrate metabolism after SCI.
Many of the widely cited studies that demonstrate an abnormally high prevalence of
diabetes in individuals with SCI compared to neurologically intact individuals have been
criticized for their sample selection and lack of appropriate controls. One of the major
problems with existing studies is that many were conducted in veterans with SCI
(Bauman et al., 1996; Bauman and Spungen, 2000; Wilt et al., 2008). On average,
veterans have a higher prevalence of diabetes compared to the civilian population
(Prakash et al., 2002; Lavela et al., 2006), which makes it difficult to dissociate the effect
of SCI from general lifestyle effects. However, other more rigorous studies have shown
similar trends (Imai et al., 1996; Bauman et al., 1999a)
On the other hand, several recent carbohydrate metabolism studies show efficient
carbohydrate metabolism following SCI (Raymond et al., in press). Typically, following
a standard oral glucose load, blood glucose increases rapidly followed by a gradual return
to baseline (Chernecky and Berger, 2004). In individuals without any carbohydrate
metabolic abnormalities baseline glucose levels are typically restored by two hours after
loading (Chernecky and Berger, 2004). In a recent SCI study, a significant proportion of

173
individuals with paraplegia exhibited very low blood sugar levels (2-5 mmol/L) by the
two-hour mark (Raymond et al., in press). While these specific individuals were more
active than other subjects with SCI, a review of glucose tolerance tests performed in
endurance and sprint athletes reveal that even these elite athletes do not drop to such low
glucose levels, and rarely overshoot their resting glucose levels at the end of this test
(Dela et al., 1991; Niakaris et al., 2005; Fontana et al., in press). Therefore, some aspect
of homeostatic regulation appears to be abnormal in a subset of individuals with SCI and
in the animals tested in Chapter 4. We can also see this demonstrated during exercise,
where healthy controls can maintain their blood glucose, while individuals with SCI
display moderate hypoglycemia (Kjaer et al., 2001). Finally, anecdotes of frequent
episodes of hypoglycemia suggest that the lack of glucose control can also be a common
reality for some individuals with SCI (K. Anderson-Ennis, unpublished observations).
Ultimately, there appear to be two divergent phenotypes of glucose metabolism after SCI.
Whether these outcomes are a product of time (with one invariably leading to the other),
or represent discrete populations with fundamental differences in neurological injury
level, or are secondary to differences in activity levels, remains unclear. These last two
possibilities are especially difficult to dissociate, as the former tends to negatively
influence the latter (Carlson et al., 2009; Raymond et al., in press). Curiously, the
increased insulin sensitivity of animals with T3 SCI at one month post-injury wanes by
three months post-injury. This could support the idea that pathological alterations in
carbohydrate metabolism occur with time after injury. Of course, longitudinal studies
will be essential to support or refute this conclusion. Longer-term studies are also
recommended based on the disparity between the relative duration of injury between our

174
rodent and human research in this area (see 5.6 Insights and limitations of experimental
SCI research, below).
The glucose, insulin and, ketone results raise interesting questions about general substrate
metabolism after SCI. Ketone body production is inversely correlated to the availability
of carbohydrates (Robinson and Williamson, 1980). During prolonged fasting, the liver
increases the production of ketone bodies, which can be used as oxidative fuels in
peripheral tissues (Robinson and Williamson, 1980). Ketones are especially important in
the nervous system, which is restricted in the range of fuels that it can utilize (Robinson
and Williamson, 1980). The increased ketone levels observed in animals with high-
thoracic SCI suggest increased hepatic production or decreased peripheral use. These
changes may be the result of animals with SCI having a heightened sensitivity to glucose
changes, so that a similar decrease in glucose elicits a greater ketogenic response.
Irrespective of the mechanism, the pronounced ketone response together with recent
clinical evidence of other alterations in substrate metabolism, such as the reduced ability
to mobilize fats (Kjaer et al., 2001; Knechtle et al., 2004) and the failure of carbohydrate
ingestion to improve performance (Temesi et al., 2009), suggests that there may be
fundamental alterations in substrate metabolism post-injury.
There was no evidence of global disturbances in circadian metabolic function in animals
with SCI. With respect to the sleep-wake cycle, measured by physical activity levels, this
is perhaps not surprising, given that the neural circuit between the principal circadian
oscillator in the suprachiasmatic nucleus and the pineal gland was not disrupted (Larsen
et al., 1998). However, I expected that the core body temperature would be disrupted by
SCI, given the role of the ANS in mediating body temperature through its control of the

175
superficial vasculature and the high prevalence of hypothermia in patients with SCI
(Khan et al., 2007). The results of Chapter 4 suggest that the core body temperature
rhythms were not disrupted by SCI. However, I cannot say conclusively that the
endogenous temperature rhythm was not affected because the sleep-wake cycle can
indirectly regulate body temperature (Hastings et al., 2003), which could effectively mask
any alterations in temperature patterns.
The blood glucose rhythm also persisted after SCI. I was surprised by this given the
necessary role of balanced autonomic activity in glucose rhythmicity that has been
reported elsewhere (Cailotto et al., 2008). However, it is possible that the presence of
this rhythm could be driven by the feeding protocol (see 5.4 Recommendations for future
metabolic research using this model, below). It would be interesting to use similar
outcome measures in a higher-level injury that disrupts central control of the pineal
gland. I suspect we would observe altered sleep-wake cycles in these animals and
corresponding dysregulation of core body temperature patterns. Based on the results of
Chapter 4, I would not predict any differences in glucose patterns.
5.4 Recommendations for future metabolic research using this model
For future studies of metabolism after SCI, the existing experimental protocols could be
modified in a number of ways. These simple modifications would minimize potential
confounds and make the results more robust. Feeding and fasting have consequences on
metabolism, alertness and activity (Murphy et al., 2003). Rodents typically consume the
majority of their daily calories during the dark period when they are most active (Sidlo et
al., 1995). Feeding rodents during their light period when they are typically sleeping can
disrupt typical activity patterns and induce internal desynchrony (Salgado-Delgado et al.,

176
2010). Therefore, presenting palatable foods during the light cycle, as was done in the
experiments in this thesis, was a poor choice in terms of maintaining the natural rhythms
of the laboratory rat, and introduced some abnormalities in physiological rhythms. The
effect of feeding was observed in the rise in core temperature and activity levels
coincident with the first feeding of the day (Figure 4.1, 4.2). Ideally, we should keep the
feeding schedule consistent with the natural setting and, wherever possible, analogous to
clinical situation. This would mean providing the enriched food during the dark cycle,
when rodents are typically consuming the bulk of their daily calories. One way to
facilitate this would be to reverse the light/dark cycle in the animal unit so that rodents
and researchers are awake and active at the same time.
Reversing the light/dark cycle would also make it possible to fast the animals during the
light cycle ahead of blood tests. This would make the physiological state of the rats
during fasting similar to humans, who are asked to fast overnight prior to testing.
Furthermore, this would ensure that animals were fasted for a true period of 12 hours. In
my existing fasting regimen, animals were fasted during the dark period when they
normally consume their food. Therefore, it is possible that animals were fasted for longer
than 12-hours, if they had not yet eaten much of their daily calories when their food was
removed at the end of the light cycle. The reversal of the light/dark cycle would have a
number of positive effects on maintaining more normal chronology of nutrient intake and
would make the experimental protocol more robust.
Ideally, circadian rhythms would have been tested in the absence of other entrainment
features (Cailotto et al., 2005; Cailotto et al., 2008). As a result of not controlling the
light so that it was constant throughout the 24-hour period, or providing food at regular

177
intervals throughout the 24-hour period, I cannot say definitively that the circadian
glucose rhythm was truly endogenous, i.e. that there were not other external entrainment
factors that were responsible for generating it. One of the most obvious possibilities for
driving the glucose rhythm is the feeding schedule. To conclusively determine whether
the endogenous glucose rhythm is still present after SCI, it would be wise to conduct two
further experiments: one where the animals are still given their enriched food, but in their
typical eating (dark) period; in the second experiment, animals should be housed in dim
lighting (24-h per day) and given their diet at equal intervals throughout the 24-h period
(so-called “unmasking” conditions). The first experiment would inform us about whether
the rhythm is present in the typical eating schedule (similar to the clinical setting), while
the second would reveal whether the rhythm is truly driven endogenously.
5.5 Metabolic implications for future experimental SCI research
The altered fat and carbohydrate metabolism demonstrated by the results herein raise
several issues germane to treatments and protocols currently being used in experimental
SCI research. In the past few years there has been an emergence of metabolic
interventions as therapeutic targets for neuroprotection and neurological recovery
following neurological damage, including SCI. These interventions include dietary
restriction (Plunet et al., 2008; Maalouf et al., 2009), nutritional composition changes
(Streijger et al., 2009), administration of omega-3 polyunsaturated fatty acids (King et al.,
2006; Huang et al., 2007; Michael-Titus, 2007) and cholesterol-lowering statin therapies
(Holmberg et al., 2008; Mann et al., 2009). The results of Chapters 3 and 4 demonstrate
that rats with high-thoracic SCI can exhibit an altered metabolic state, most evident in
their increased adipose tissue, hypertriglyceridemia and altered responses to exogenous

178
insulin and glucose administration. As a result of their altered physiology, standard
therapies might not have the same effects on rodents with high-thoracic SCI as they do in
neurologically intact animals. Similarly, normally routine protocols, such as insulin
administration (Yang et al., 2009) or every-other-day-fasting (Plunet et al., 2008) likely
have altered effects in this system. It is important to keep these issues in mind when
selecting treatments for animals with SCI and interpreting the results of experimental
trials.
5.6 Insights and limitations of experimental SCI research
Large-scale clinical metabolic and CV SCI research studies are complicated and
expensive to execute. An additional complication specific to clinical SCI research is the
difficulty in recruiting a sufficient number of subjects with similar injury levels. In
attempt to enroll a sufficient number of subjects and obtain adequate statistical power,
researchers often widen the inclusion criteria, introducing significant variability in the
level, completeness, and time after injury. Pooling these variables can make it practically
impossible to conclude whether effects are injury dependent, especially if the specific
injury details are not reported for the reader. It is particularly difficult to get a clear
picture of the effect of autonomic injury on CV and metabolic function from current
clinical research. Even fewer studies report the level and completeness of ANS injury –
even when testing autonomic outcomes (Handrakis et al., 2009). Perhaps this can partly
be attributed to the fact that there is still some debate as to which ANS assessments
provide accurate, sensitive, and valid measures in the SCI population (Alexander et al.,
2009a).

179
Experimental research provides an important, controlled way to characterize CV and
metabolic function after SCI. Complete transection injuries, in particular, provide certain
and consistent damage to autonomic pathways. These studies can be used to inform
clinical research about salient biomarkers and level-dependent features of injury. For
example, the results of this thesis suggest that level of injury is not trivial – aspects of CV
control, lipid and glucose metabolism can be quite different between high- and low-
thoracic SCI. However, to date, a significant proportion of clinical research has been
muddied by the combination of widely different injury levels (Wilt et al., 2008). In the
future, the careful documentation and systematic reporting of our clinical subjects, ideally
with the inclusion of an assessment of the integrity of autonomic pathways, may allow us
to make more meaningful and robust conclusions about the associations between injury
level, CV dysfunction and metabolic changes.
Of course, the use of animal models has its own limitations. In the context of this thesis,
some of these limitations are inherent in the use of an animal model, while others could
be improved by modifying experimental protocols to reduce the presence of confounding
variables, for example, or to more closely follow the timeline of clinical SCI.
The anatomical differences between rodents and humans are unavoidable, but important
to acknowledge. In terms of BP control, the tail is a unique appendage with a
considerable degree of capacitance (Smith et al., 1998) and therefore potential to affect
systemic BP. However, the spinal outflow to the tail vasculature is located in segments
(T11-L2), making it equally affected by both the high- and low-thoracic transection used
in this series of experiments. Therefore, the tail is unlikely to have affected the inter-
group differences in orthostatic tolerance. A second important consideration is that

180
rodent physiological testing can easily be confounded by the introduction of stimuli apart
from the direct variable being tested. Stimuli common to the research setting, such as
noise (Baldwin et al., 2007), handling (Balcombe et al., 2004), and restraint (Irvine et al.,
1997; Sharp et al., 2002), can all affect BP and HR quite significantly. Therefore, in the
current experiments every attempt was made to minimize these stimuli. One of the key
features of colorectal distension (CRD) is that the initiation of stimulation (once the
catheter is inserted) does not require any manipulation of the animal. This minimizes the
animals’ stress and its confounding effects on BP. Sexual stimulation, on the other hand,
was complicated by the necessity of restraint and orthostasis. If alternative stimuli to
CRD are needed in the future, I would propose the use of more simple stimuli such as
superficial somatic stimulation; in my opinion, the benefits of minimizing artifacts
outweighs the clinical significance of sexual stimulation as a trigger for AD. Finally, the
use of telemetry (as discussed above) would provide a way to determine whether the CV
variables during testing are different from baseline values. This could inform us about
how stressful our procedures are, and provide feedback so that we can modify them to
minimize stress.
Experimental SCI researchers are not typically asked to justify the age of animals used in
their experiments or the duration of injury. However, these specifications can be
important to the clinical relevance and ultimately to the translatability of the research. In
this thesis, like most experimental SCI research, the animals that were studied were still
growing at the time of injury (“Wistar rat datasheet”, 2010). This is problematic because
it is possible that SCI could disrupt normal growth in addition to precipitating its direct
effects on the body; therefore, some of the differences I have observed could be due to

181
altered growth patterns rather than SCI per se. Secondly, at the time of injury, my
animals were approximately 12-13 weeks; the typical lifespan of a male Wistar rat is
approximately 2 years (Goodrick et al., 1983). Given that the population that we are
trying to model is primarily between 20 and 40 years old (Pickett et al., 2006), there is a
significant disparity between our animal model and the clinical reality in the age at injury
relative to total lifespan. Ideally, we should begin experimental studies when rodents are
fully developed and have started their adult life (around 6 months) (Maeda et al., 1985;
Yu et al., 1985).
Finally, reproducing the duration of injury is another important consideration for
experimental SCI research. SCI is a lifelong condition, yet a brief look at articles that
employ a rat model of “chronic spinal cord injury” suggest that majority of studies
consider three to eight weeks to be chronic. Indeed, this may be an appropriate timeline
for the motor, sensory and urological changes that occur following experimental SCI,
however some of the metabolic changes likely only develop in the months post-injury
and could be altered beyond that. Therefore, asking questions about metabolism after
experimental SCI demands a re-evaluation of current experimental timelines and
endpoints. Possibly related to metabolism after injury, there is also impetus to examine
longevity after experimental SCI because individuals with SCI live an average of 13-25
years less than able-bodied people, depending on their injury level and severity (Strauss
et al., 2006). Ultimately, it would be ideal to include longevity as an outcome measure in
these experiments, using survival as a final end-point. Arguably, the costs and personnel
associated with this type of longitudinal research quickly become prohibitive, especially
in our short-term “publish-or-perish” academic environment.

182
5.7 Concluding remarks
Translational biomedical research demands well-defined animal models that are faithful
to the human condition. We can use these models to characterize dysfunction, test
preclinical therapies, guide clinical research, and ultimately to inform patient
management. Animal models of motor function after SCI have been well-studied and
characterized; research in this area vastly outnumbers the research on autonomic
outcomes of SCI (Inskip et al., 2009). CV and metabolic dysfunctions both have
significant effects on quality of life and functional independence after SCI. Experimental
models of these systems have the potential to provide a wealth of information regarding
the nature of these dysfunctions and possible strategies to mitigate their effects.
The results herein reveal that rodents with high-thoracic SCI experience deficits in BP
control as a result of their injury. Animals with low-thoracic SCI, on the other hand, do
not display significant alterations in CV control. Experimental SCI can also perturb
metabolic homeostasis in a level-dependent fashion. In animals with complete high-
thoracic SCI this manifests as a gross increase in adipose tissue and higher blood
triglycerides. These changes are not present after complete low-thoracic SCI, suggesting
that changes in lipid metabolism may be level-dependent. Carbohydrate metabolism does
not appear to be pathologically altered by SCI in the three-month period employed here.
Given the results of this thesis, I encourage researchers, both clinical and experimental, to
clearly report injury levels when assessing CV or metabolic function. I also advocate that
more metabolic and CV outcomes be incorporated into preclinical SCI research, given
the critical relationships between metabolic function, CV disease, and longevity. The
insights gained from clinical and experimental SCI research should help to improve the

183
management of CV and metabolic complications after SCI. Part of this management may
include the development of SCI-specific guidelines for CV and metabolic health. There
are more and more examples of dietary modifications, exercise regimes, and drugs that
elicit altered responses in individuals with SCI. These examples suggest that we may not
be able to generalize the evidence obtained using able-bodied subjects to individuals with
SCI.
The results of this thesis serve as a reminder to be prudent when comparing studies
conducted in animals or humans with different injury levels, or combining groups of
subjects with distinctly different injuries. They provide further impetus to not be so
enthralled with our motor outcomes that we forget about the important roles of the
autonomic nervous system, and the differences that may arise from autonomic injury
despite similar motor dysfunction.

184
5.8 References
Alexander MS et al. (2009) International standards to document remaining autonomic function after spinal cord injury. Spinal Cord 47:36-43.
Anderson KD (2004) Targeting recovery: priorities of the spinal cord-injured population. J Neurotrauma 21:1371-1383.
Balcombe JP, Barnard ND, Sandusky C (2004) Laboratory routines cause animal stress. Contemp Top Lab Anim Sci 43:42-51.
Baldwin AL, Schwartz GE, Hopp DH (2007) Are investigators aware of environmental noise in animal facilities and that this noise may affect experimental data? J Am Assoc Lab Anim Sci 46:45-51.
Bauman WA, Spungen AM (1994) Disorders of carbohydrate and lipid metabolism in veterans with paraplegia or quadriplegia: a model of premature aging. Metabolism 43:749-756.
Bauman WA, Spungen AM (2000) Metabolic changes in persons after spinal cord injury. Phys Med Rehabil Clin N Am 11:109-140.
Bauman WA, Spungen AM, Zhong YG, Mobbs CV (1996) Plasma leptin is directly related to body adiposity in subjects with spinal cord injury. Horm Metab Res 28:732-736.
Bauman WA, Adkins RH, Spungen AM, Waters RL (1999a) The effect of residual neurological deficit on oral glucose tolerance in persons with chronic spinal cord injury. Spinal Cord 37:765-771.
Burton AR, Brown R, Macefield VG (2008) Selective activation of muscle and skin nociceptors does not trigger exaggerated sympathetic responses in spinal-injured subjects. Spinal Cord 46:660-665.
Cailotto C, La Fleur SE, Van Heijningen C, Wortel J, Kalsbeek A, Feenstra M, Pevet P, Buijs RM (2005) The suprachiasmatic nucleus controls the daily variation of plasma glucose via the autonomic output to the liver: are the clock genes involved? Eur J Neurosci 22:2531-2540.
Cailotto C, van Heijningen C, van der Vliet J, van der Plasse G, Habold C, Kalsbeek A, Pevet P, Buijs RM (2008) Daily rhythms in metabolic liver enzymes and plasma glucose require a balance in the autonomic output to the liver. Endocrinology 149:1914-1925.
Carlson KF, Wilt TJ, Taylor BC, Goldish GD, Niewoehner CB, Shamliyan TA, Kane RL (2009) Effect of exercise on disorders of carbohydrate and lipid metabolism in

185
adults with traumatic spinal cord injury: systematic review of the evidence. J Spinal Cord Med 32:361-378.
Chernecky CC, Berger BJ (2004) Laboratory tests & diagnostic procedures, 4th Edition. Philadelphia, PA: Saunders.
Dela F, Mikines KJ, Von Linstow M, Galbo H (1991) Effect of training on response to a glucose load adjusted for daily carbohydrate intake. Am J Physiol 260:E14-20.
Fontana L, Klein S, Holloszy JO (in press) Effects of long-term calorie restriction and endurance exercise on glucose tolerance, insulin action, and adipokine production. Age (Dordr).
Goodrick CL, Ingram DK, Reynolds MA, Freeman JR, Cider NL (1983) Effects of intermittent feeding upon growth, activity, and lifespan in rats allowed voluntary exercise. Exp Aging Res 9:203-209.
Handrakis JP, DeMeersman RE, Rosado-Rivera D, LaFountaine MF, Spungen AM, Bauman WA, Wecht JM (2009) Effect of hypotensive challenge on systemic hemodynamics and cerebral blood flow in persons with tetraplegia. Clin Auton Res 19:39-45.
Hastings MH, Reddy AB, Maywood ES (2003) A clockwork web: circadian timing in brain and periphery, in health and disease. Nat Rev Neurosci 4:649-661.
Holmberg E, Zhang SX, Sarmiere PD, Kluge BR, White JT, Doolen S (2008) Statins decrease chondroitin sulfate proteoglycan expression and acute astrocyte activation in central nervous system injury. Exp Neurol 5:5.
Huang WL, King VR, Curran OE, Dyall SC, Ward RE, Lal N, Priestley JV, Michael-Titus AT (2007) A combination of intravenous and dietary docosahexaenoic acid significantly improves outcome after spinal cord injury. Brain 130:3004-3019.
Imai K, Kadowaki T, Aizawa Y, Fukutomi K (1996) Problems in the health management of persons with spinal cord injury. J Clin Epidemiol 49:505-510.
Inskip JA, Ramer LM, Ramer MS, Krassioukov AV (2009) Autonomic assessment of animals with spinal cord injury: tools, techniques and translation. Spinal Cord 47:2-35.
Irvine RJ, White J, Chan R (1997) The influence of restraint on blood pressure in the rat. J Pharmacol Toxicol Methods 38:157-162.
Kalincik T, Choi EA, Feron F, Bianco J, Sutharsan R, Hayward I, Mackay-Sim A, Carrive P, Waite PM (in press) Olfactory ensheathing cells reduce duration of autonomic dysreflexia in rats with high spinal cord injury. Auton Neurosci.
186
Khan S, Plummer M, Martinez-Arizala A, Banovac K (2007) Hypothermia in patients with chronic spinal cord injury. J Spinal Cord Med 30:27-30.
King VR, Huang WL, Dyall SC, Curran OE, Priestley JV, Michael-Titus AT (2006) Omega-3 fatty acids improve recovery, whereas omega-6 fatty acids worsen outcome, after spinal cord injury in the adult rat. J Neurosci 26:4672-4680.
Kjaer M, Dela F, Sorensen FB, Secher NH, Bangsbo J, Mohr T, Galbo H (2001) Fatty acid kinetics and carbohydrate metabolism during electrical exercise in spinal cord-injured humans. Am J Physiol Regul Integr Comp Physiol 281:R1492-1498.
Knechtle B, Muller G, Willmann F, Eser P, Knecht H (2004) Fat oxidation at different intensities in wheelchair racing. Spinal Cord 42:24-28.
Larsen PJ, Enquist LW, Card JP (1998) Characterization of the multisynaptic neuronal control of the rat pineal gland using viral transneuronal tracing. Eur J Neurosci 10:128-145.
Lavela SL, Weaver FM, Goldstein B, Chen K, Miskevics S, Rajan S, Gater DR, Jr. (2006) Diabetes mellitus in individuals with spinal cord injury or disorder. J Spinal Cord Med 29:387-395.
Maalouf M, Rho JM, Mattson MP (2009) The neuroprotective properties of calorie restriction, the ketogenic diet, and ketone bodies. Brain Res Rev 59:293-315.
Maeda H, Gleiser CA, Masoro EJ, Murata I, McMahan CA, Yu BP (1985) Nutritional influences on aging of Fischer 344 rats: II. Pathology. J Gerontol 40:671-688.
Maiorov DN, Fehlings MG, Krassioukov AV (1998) Relationship between severity of spinal cord injury and abnormalities in neurogenic cardiovascular control in conscious rats. J Neurotrauma 15:365-374.
Mann CM, Lee JH, Hillyer J, Stammers AM, Tetzlaff W, Kwon BK (2010) Lack of robust neurologic benefits with simvastatin or atorvastatin treatment after acute thoracic spinal cord contusion injury. Exp Neurol 285-295.
Mathias CJ, Frankel HL (1999) Autonomic disturbances in spinal cord lesions, 4th Edition. Oxford: Oxford University Press.
Mayorov DN, Adams MA, Krassioukov AV (2001) Telemetric blood pressure monitoring in conscious rats before and after compression injury of spinal cord. J Neurotrauma 18:727-736.
Michael-Titus AT (2007) Omega-3 fatty acids and neurological injury. Prostaglandins Leukot Essent Fatty Acids 77:295-300.
Murphy HM, Wideman CH, Nadzam GR (2003) A laboratory animal model of human shift work. Integr Physiol Behav Sci 38:316-328.

187
Niakaris K, Magkos F, Geladas N, Sidossis LS (2005) Insulin sensitivity derived from oral glucose tolerance testing in athletes: disagreement between available indices. J Sports Sci 23:1065-1073.
Pickett GE, Campos-Benitez M, Keller JL, Duggal N (2006) Epidemiology of traumatic spinal cord injury in Canada. Spine (Phila Pa 1976) 31:799-805.
Plunet WT, Streijger F, Lam CK, Lee JH, Liu J, Tetzlaff W (2008) Dietary restriction started after spinal cord injury improves functional recovery. Exp Neurol 213:28-35.
Prakash M, Raxwal V, Froelicher VF, Kalisetti D, Vieira A, O'Mara G, Marcus R, Myers J, Kiratli J, Perkash I (2002) Electrocardiographic findings in patients with chronic spinal cord injury. Am J Phys Med Rehabil 81:601-608.
Raymond J, Harmer AR, Temesi J, van Kemenade C (in press) Glucose tolerance and physical activity level in people with spinal cord injury. Spinal Cord.
Robinson AM, Williamson DH (1980) Physiological roles of ketone bodies as substrates and signals in mammalian tissues. Physiol Rev 60:143-187.
Salgado-Delgado R., Angeles-Castallanos M, Saderi N, Buijs RM, Escobar C (2010) Food intake during the normal activity phase prevents obesity and circadian desynchrony in a rat model of night work. Endocrinology 151:1019-1029.
Sharp JL, Zammit TG, Azar TA, Lawson DM (2002) Stress-like responses to common procedures in male rats housed alone or with other rats. Contemp Top Lab Anim Sci 41:8-14.
Sidlo J, Zaviacic M, Kvasnicka P (1995) Night and day differences in the food-intake of laboratory rats Wistar and Koletsky strains. Bratisl Lek Listy 96:655-657.
Smith JE, Jansen AS, Gilbey MP, Loewy AD (1998) CNS cell groups projecting to sympathetic outflow of tail artery: neural circuits involved in heat loss in the rat. Brain Res 786:153-164.
Strauss DJ, Devivo MJ, Paculdo DR, Shavelle RM (2006) Trends in life expectancy after spinal cord injury. Arch Phys Med Rehabil 87:1079-1085.
Streijger F, Plunet WT, Liu J, Lee JHT, Lam CK, Park S, Yuan CM, Lu J, Tetzlaff W (2009) Ketogenic diet initiated after SCI improves functional recovery in rats. In: Society for Neuroscience Annual Meeting, October 17-21. Chicago, IL.
Temesi J, Rooney K, Raymond J, O'Connor H (2010) Effect of carbohydrate ingestion on exercise performance and carbohydrate metabolism in persons with spinal cord injury. Eur J Appl Physiol 108:131-140.

188
Wilt T, Carlson F, Goldish G, MacDonald R, Niewoehner C, Rutkus I, Shamliyan T, Tacklind J, Taylor B, Kane R (2008) Carbohydrate & lipid disorders & relevant considerations in persons with spinal cord injury. Evidence report/Technology assessment No. 163. In. Rockville, MD.: Agency for Healthcare Research and Quality.
Wistar rat data sheet (2010) Retrieved February 1st, 2010 from http://www.criver.com/SiteCollectionDocuments/Wistar%20WU%20Rat.pdf
Yang YG, Jiang DM, Quan ZX, Ou YS (2009) Insulin with chondroitinase ABC treats the rat model of acute spinal cord injury. J Int Med Res 37:1097-1107.
Yu BP, Masoro EJ, McMahan CA (1985) Nutritional influences on aging of Fischer 344 rats: I. Physical, metabolic, and longevity characteristics. J Gerontol 40:657-670.

189
APPENDIX: ANIMAL CARE CERTIFICATE