The metastatic microenvironment of breast cancer: Clinical implications

iTRAQ Identification of Candidate Serum BiomarkersAssociated with Metastatic Progression of HumanProstate CancerIshtiaq Rehman1*., Caroline A. Evans1,2., Adam Glen1, Simon S. Cross3, Colby L. Eaton1, Jenny Down1,
Giancarlo Pesce1, Joshua T. Phillips4, Ow Saw Yen2, George N. Thalmann5, Phillip C. Wright2, Freddie C.
Hamdy6
1 Department of Human Metabolism, The Medical School, The Mellanby Centre for Bone Research, University of Sheffield, Sheffield, United Kingdom, 2 Biological and
Environmental Systems Group, Department of Chemical and Biological Engineering, ChELSI Institute, University of Sheffield, Sheffield, United Kingdom, 3 Academic Unit
of Pathology, Department of Neuroscience, Faculty of Medicine, Dentistry and Health, University of Sheffield, Sheffield, United Kingdom, 4 Department of Urology, City
Hospital, Birmingham, United Kingdom, 5 Department of Urology, Anna-Seiler-Haus, University of Bern, InselspitalInselspital, Bern, Switzerland, 6 Nuffield Department of
Surgical Sciences, University of Oxford, John Radcliffe Hospital, Oxford, United Kingdom
Abstract
A major challenge in the management of patients with prostate cancer is identifying those individuals at risk of developingmetastatic disease, as in most cases the disease will remain indolent. We analyzed pooled serum samples from 4 groups ofpatients (n = 5 samples/group), collected prospectively and actively monitored for a minimum of 5 yrs. Patients groups were(i) histological diagnosis of benign prostatic hyperplasia with no evidence of cancer ‘BPH’, (ii) localised cancer with noevidence of progression, ‘non-progressing’ (iii) localised cancer with evidence of biochemical progression, ‘progressing’, and(iv) bone metastasis at presentation ‘metastatic’. Pooled samples were immuno-depleted of the 14 most highly abundantproteins and analysed using a 4-plex iTRAQ approach. Overall 122 proteins were identified and relatively quantified.Comparisons of progressing versus non-progressing groups identified the significant differential expression of 25 proteins(p,0.001). Comparisons of metastatic versus progressing groups identified the significant differential expression of 23proteins. Mapping the differentially expressed proteins onto the prostate cancer progression pathway revealed thedysregulated expression of individual proteins, pairs of proteins and ‘panels’ of proteins to be associated with particularstages of disease development and progression. The median immunostaining intensity of eukaryotic translation elongationfactor 1 alpha 1 (eEF1A1), one of the candidates identified, was significantly higher in osteoblasts in close proximity tometastatic tumour cells compared with osteoblasts in control bone (p = 0.0353, Mann Whitney U). Our proteomic approachhas identified leads for potentially useful serum biomarkers associated with the metastatic progression of prostate cancer.The panels identified, including eEF1A1 warrant further investigation and validation.
Citation: Rehman I, Evans CA, Glen A, Cross SS, Eaton CL, et al. (2012) iTRAQ Identification of Candidate Serum Biomarkers Associated with Metastatic Progressionof Human Prostate Cancer. PLoS ONE 7(2): e30885. doi:10.1371/journal.pone.0030885
Editor: Karl X. Chai, University of Central Florida, United States of America
Received August 26, 2011; Accepted December 27, 2011; Published February 15, 2012
Copyright: � 2012 Rehman et al. This is an open-access article distributed under the terms of the Creative Commons Attribution License, which permitsunrestricted use, distribution, and reproduction in any medium, provided the original author and source are credited.
Funding: This work was supported by grants from PROMET (project no. FP6-LSH-5-2004-018858), and P-MARK (contract no. LSHC-CT-2004-503011), under thesixth EU Framework programme and the NCRI ProMPT (Prostate cancer Mechanisms of progression and Treatment) collaborative grant to Dr. Hamdy, and grantsfrom Engineering and Physical Sciences Research (EPSRC) to Dr. Wright: EP/E036252/1 and GR/S84347/01. We are grateful to Dr. Nicholas Hoyle at RocheDiagnostics, Penzberg, Germany for his support towards consumables and reagents for the project. The funders had no role in study design, data collection andanalysis, decision to publish or preparation of the manuscript.
Competing Interests: We are grateful to Dr. Nicholas Hoyle at Roche Diagnostics, Penzberg, Germany for his support towards consumables and reagents forthe project. This does not alter the authors’ adherence to all the PLoS ONE policies on sharing data and materials.
* E-mail: [email protected]
. These authors contributed equally to this work.
Introduction
In Europe and the US, prostate cancer is the second most
common cancer diagnosis and the third most common cause of
cancer-related deaths in men [1,2]. Moreover, the incidence has
increased since the widespread introduction of prostate specific
antigen (PSA) testing [3]. Most patients with prostate cancer are
diagnosed at an early stage, but even with screening over 7% of
cases develop metastatic disease [4]. In men with distant metastasis
the prognosis is poor, with an average survival of 24 to 48 months.
Bone is the most common site for prostate cancer metastasis and is
associated with bone pain, spinal cord compression and marrow
failure [4]. Currently, bone metastatic lesions are determined by
imaging such as isotope bone scanning, however, the identification
of a serum based biomarker(s) for predicting the susceptibility of
patients to develop bone metastasis could enable a more accurate
clinical assessment of the disease and help guide therapy.
The diagnosis of prostate cancer is most commonly made by a
triad of serum prostate specific antigen (PSA) measurements,
digital rectal examination (DRE), and histological assessment of
transrectal ultrasound (TRUS) guided biopsy material [5].
Although PSA is a FDA approved biomarker for prostate cancer
detection, its usefulness is controversial as it has been shown to be
unreliable for disease diagnosis, and in particular for distinguishing
PLoS ONE | www.plosone.org 1 February 2012 | Volume 7 | Issue 2 | e30885
indolent from aggressive forms of the disease [6,7]. Additionally,
PSA is associated with a high degree of false-positive and false-
negative test results, as levels may be elevated in non-cancer
conditions of the prostate, including benign prostatic hyperplasia
(BPH). Thus, additional biomarkers are urgently needed which
could improve the diagnostic specificity of PSA and predict the
likelihood of disease progression.
Blood and its products, such as plasma and serum are ideal fluids
for the identification of cancer biomarkers since they contain
proteins both secreted and shed from cancer cells, combined with the
ease of sampling. However, the variable composition and large
dynamic range of proteins present in plasma (estimated to be 1010
orders of magnitude or more), pose formidable challenges in
identifying clinically relevant biomarkers amongst the background
of abundant proteins such as albumin, immunoglobulin and
transferrin [8]. Of the 22 or so most abundant proteins in plasma,
these constitute more than 99% of the mass of the total plasma
proteins, while the remaining 1% are thought to be composed of the
medium/low abundance proteins and include the biomarker pool
[9]. The large orders of magnitude in protein concentration have
hampered previous mass spectrometry based efforts aimed at
identifying clinically relevant biomarkers, mainly due to a suppres-
sion of ionization of the low abundance proteins by the higher
abundance proteins [10]. However, prior removal of some of the
most highly abundant proteins has been shown to improve the
detection of relatively lower abundant proteins [11,12]. Although
there are many different protein fractionation methodologies based
on differences in molecular weight, shape, charge, pI, hydrophobic-
ity and affinity through specific biomolecular interactions, it has been
reported that high abundance protein separation using the antibody
based IgY-12 immunodepletion system is highly reproducible [13].
Amongst the proteomic technologies used for biomarker
identification, ‘isobaric Tags for Relative and Absolute Quantita-
tion’ (iTRAQ) has the advantages of being relatively high
throughput, and can simultaneously provide information on peptide
quantitation and identification, as previously reported by us and
others [14–16]. Briefly, in a typical workflow samples are reduced,
alkylated and proteolytically digested to generate peptides. The
peptides are labeled with a set of iTRAQ reagents (in a 4 or 8-plex
format), pooled and fractionated by strong cation exchange (SCX).
The fractions are then analyzed by liquid chromatography tandem
mass spectrometry (LC-MS/MS), with the resultant mass spectra
providing sequence information (from the peptide fragments), and
relative quantification (from the reporter group ions).
In an effort to identify novel proteins associated with the metastatic
progression of human prostate cancer, we have performed a 4-plex
iTRAQ analysis using pooled serum samples collected prospectively
from 4 well defined groups of patients who were actively monitored
for at least 5 years, and selected to represent the spectrum of prostatic
disease. Following data analysis, a number of candidates were found
to be significantly differentially expressed in cancer samples
compared with benign samples. One of the candidates identified as
being significantly up-regulated in cancer groups was eukaryotic
translation elongation factor 1 alpha 1 (eEF1A1), and was further
investigated by immunohistochemistry using prostate tissue samples
from localized and metastatic cases. The biomarker leads identified in
our ‘discovery’ phase study, including eEF1A1 are discussed in
relation to their significance to prostate cancer progression.
Materials and Methods
Patients and serum collectionPeripheral blood was collected prospectively from patients
attending the Urology clinic at the Royal Hallamshire Hospital at
the time of their initial visit, following written informed consent.
Blood sample collection was approved by the Ethics Committee of
the University of Sheffield. Serum was collected by allowing the
blood to coagulate for 30 min, centrifuged at 1,2006g for 10 min
at 4uC and then stored at 280uC in 100 ml aliquots. All blood
samples were collected prior to the administration of any
treatment. Twenty serum samples were carefully selected to
represent the various stages and grades of prostate disease and
pooled (n = 5 patients/group), to form 4 patient groups. All
patients were actively monitored for at least 5 years from the time
of their initial blood sampling. The 4 patient groups were: Group
1: histological diagnosis of benign prostatic hyperplasia ‘BPH’,
with no evidence of cancer by at least 2 independent sets of
prostatic biopsies, and a PSA level below 10 ng/ml (mean age of
61 yrs). Group 2: histological diagnosis of prostate cancer with a
PSA level below 10 ng/ml, and no evidence of a rising PSA
following 5 yrs active monitoring - ‘non-progressing’ group, (mean
age of 67 yrs); Group 3: histological diagnosis of clinically localised
cancer with an initial PSA level below 13 ng/ml, followed by 3
consecutive rises in PSA levels during 5 yrs of active monitoring -
‘progressing’ group, (mean age of 69 yrs); Group 4: patients with a
PSA.19 ng/ml and evidence of bone metastasis from a positive
radionucleotide bone scan - ‘metastatic’ group, (mean age of
73 yrs). The differences in the median ages of the patients were
found not to be statistically significant between the 4 groups
(p = 0.146, Kruskal-Wallis test). The disease characteristics of the
20 patients comprising the 4 groups are shown in Table S1.
Patient tissue materialTissue microarrays (TMAs), comprised of 56 cases of prostatic
adenocarcinoma ranging in single Gleason grades (i.e. grade 2,
n = 5; grade 3, n = 32; grade 4, n = 9; grade 5, n = 10), and 40
cases of adjacent non-malignant tissue, and were constructed as
previously described [17,18]. An additional 23 cases of bone
biopsies from patients both with and without prostate cancer
skeletal metastasis were obtained by 8 mm trephine biopsy
performed under general anesthesia. Informed patient consent
and Ethics Committee approval was obtained prior to the study
(South Sheffield Research Ethics Committee, SSREC/02/155
and 00/172).
Cell linesHuman prostate cancer cell lines LNCaP, PC-3, DU145 and
VCaP were purchased from the American Type Culture
Collection (ATCC), (http://www.lgcstandards-atcc.org/). DuCaP
cells were obtained via the PRIMA project consortium (http://
www.primaproject.org/participants.php). The LNCaP-Pro5,
LNCaP-LN3, PC-3M and PC-3M-LN4 cells were a kind gift
from Dr. Curtis Pettaway (University of Texas, M.D. Anderson
Cancer Centre), [19]. The LNCaP-C4-2 and LNCaP-C4-2B cell
lines were obtained from Prof. George Thalmann [20]. The TE-
85 osteosarcoma cells were a kind gift from Prof. J.A. Gallagher,
University of Liverpool. All prostate cancer cell lines were cultured
as previously described and confirmed to be free from Mycoplas-
ma [15].
IgY-14 affinity depletion of serum samplesPooled serum samples were depleted of the 14 most common
plasma proteins using the Seppro IgY-14 depletion system [21].
Previous studies have shown that serum pooling followed by
depletion of the most highly abundant proteins is an effective
strategy to reduce the dynamic range of proteins, and thus
enhance the identification of serum biomarkers, as demonstrated
using the quantitative proteomic method of iTRAQ(R) [22].
Serum Biomarkers for Prostate Cancer Metastasis
PLoS ONE | www.plosone.org 2 February 2012 | Volume 7 | Issue 2 | e30885

Serum samples from 5 patients representing each of the 4 patient
groups were pooled in equal volumes to give a total volume of
200 ml for each group (40 ml of each sample). The pooled serum
samples were shipped on dry ice to Genway (Digilabs Biovision,
Germany), for immuno-depletion using the Seppro Ig-Y14 system.
The flow-through fraction (depleted of albumin, immunoglobulin
IgG, fibrinogen, transferrin, IgA, IgM, haptoglobin, alpha2-
macroglobin, alpha1-acid glycoprotein, alpha1-antitrypsin, Apo
A-I HDL, Apo A-II HDL, complement C3 and LDL (ApoB)), was
used for subsequent iTRAQ analysis.
iTRAQ sample labelling and SCX fractionationPrior to iTRAQ analysis, samples were concentrated and buffer
exchanged using 5 kDa molecular weight cut-off spin concentra-
tors (Millipore). The samples were buffer exchanged three times
against 500 ml of 1 M triethylammoniumbicarbonate (TEAB)
buffer and concentrated to a volume of approximately 80 ml.
Samples were labelled with the iTRAQ reagents according to the
manufacturers instructions, and as previously described [14,15].
Each sample was labelled with one of the four iTRAQ reagents
(iTRAQ reporter ions of 114.1, 115.1, 116.1, 117.1 mass/charge
ratio). The tag labelling order was BPH- 117; localised non-
progressing cancer-116; progressing cancer-115; metastatic dis-
ease-114). Labelled samples were pooled and fractionated by
strong cation exchange (SCX), using a BioLC HPLC column
(Dionex, Surrey, UK), and analyzed by LC-MS/MS as previously
described [14,15].
Tandem mass spectrometry analysisMass spectrometry (MS) was performed using a QStar XL
Hybrid ESI Quadrupole time-of-flight tandem mass spectrometer,
ESI-qQ-TOF-MS/MS (Applied Biosystems, Framingham, MA;
MDS-Sciex, Concord, Ontario, Canada), coupled with an online
capillary liquid chromatography system (Famos, Switchos and
Ultimate from Dionex/LC Packings, Amsterdam, The Nether-
lands). The dried samples were resuspended in 60 l of 3%
acetonitrile and 0.1% formic acid ready for the MS, and 10–15 l
(depending on the peptide concentration as seen in the peak
intensity of the SCX chromatogram) were injected to the nano-
LC-ESI-MS/MS system for each analysis. Initial separation took
place on a PepMap C18 RP capillary column (LC Packings) with a
constant flow rate of 0.3 l/min. LC buffers A and B were made up
as 3% acetonitrile, 0.1% formic acid and 97% acetonitrile, 0.1%
formic acid, respectively. The gradient was started as 97% buffer
A and 3% buffer B for 3 minutes, followed by 3 to 25% buffer B
for 120 minutes, 90% buffer B for 7 minutes and finally 97%
buffer A for 7 minutes. Data acquisition in the mass spectrometer
was set to the positive ion mode, with a selected mass range of
350–1800 m/z. Tandem mass spectrometry was performed on
peptides with +2, +3, +4 charge states across a scan range of 65–
2000 m/z.
Protein identification and relative quantificationProtein identification and relative quantification was carried out
as previously described [23,24]. Identification of peptide precursor
and fragments was performed by database searching against the
Swiss-Prot and Trembl Homo sapiens protein database (41070,
71449 ORFs respectively, downloaded from UniProt, May 2010).
Parameters for searching were set up as follows: MS tolerance was
0.4 and MS/MS tolerance were set at: peptide tolerance 0.4 Da,
charge +2, +3 and +4, min peptide length, z-score, max p-value
and AC score were 6, 6, 1026 and 6 respectively. Phenyx default
‘turbo’ scoring was enabled with mass tolerance restriction of
0.1 Da for MS and MS/MS and the minimum percentage of the
peptide sequence coverage by b+ (b), b2+ (b++), y+ (y) or y2+ (y++)
fragment series was set to the default value of 20%. Target
database search space was restricted to tryptic peptides with a
maximal of 1 miscleavage. Modifications were set as: 4-plex
iTRAQ mass shifts (+144 Da, K and N-term), methylthiol
(+46 Da) and oxidation of methionine (+16 Da). False discovery
rates (FDR) were estimated using a concatenated target-decoy
database as described by Elias and Gygi [25]. Protein changes
were qualified using a t- test algorithm developed in house [23].
Immunohistochemistry for eEF1A1Immunohistochemistry was performed essentially as previously
described [18]. Sections of bone and prostatic tissues were cut
(4 m) and mounted on superfrost slides (VWR International,
Germany). Slides were incubated with mouse monoclonal anti-
eEF1A1 antibody (Santa-Cruz Biotechnology, CA, USA Cat. No
sc21758), at 0.4 mg/ml in 2% horse serum overnight at 4uC.
Sections were washed twice in PBS-Tween 20 (PBST), and
incubated for 30 min with anti-mouse IgG ImmPRESS HRP
(Vector Laboratories, Cat. No MP-7402). After further washing in
PBST, localisation of antibody/antigen complex was visualized
using the ImmPACT DAB system (Vector Laboratories, Cat. No
SK-4105). Control sections were incubated with anti-mouse IgG
isotype control (Vector laboratories I-2000), diluted to 0.4 mg/ml
in 2% normal horse serum. eEF1A1 immunostaining was assessed
for both intensity and cellular localization by an experienced
histopathologist (Dr. Simon Cross), who was blinded to the study.
Each case was assigned a staining intensity, ranging from 0–3,
where 0 = absent; 1 = weak; 2 = moderate and 3 = Intense staining
as previously described [18].
Western blottingWestern blotting was performed essentially as previously
described [26]. Anti-EF-Tu goat polyclonal IgG primary antibody
was used at a concentration of 1:1000 (Santa Cruz, Cat.
No. sc12990). Secondary antibody was HRP-conjugated rabbit
anti-goat (Abcam), and was used at a concentration of 1:1400
(Abcam). Dual color precision plus molecular weight markers were
used for size estimation (Bio-Rad, Hertfordshire, UK).
Reverse-Transcription PCR and SequencingTotal RNA was extracted from prostate cancer cell lines using TRI
reagent (Sigma-Aldrich, UK), according to the manufacturer’s
instructions. The RNA was quantified spectrophotometrically and
2 mg was reverse transcribed into cDNA using the SuperScript III
Reverse Transcriptase kit with 250 ng of random primers, according
to the manufacturer’s instructions (Invitrogen, UK). PCR primers
specific to the eEF1A1 isoform were designed manually, using the
Ensembl cDNA sequence: ENST00000316292 (http://www.
ensembl.org/index.html). The eEF1A1-forward primer sequence
was (59-39): TCCTTCAAGTATGCCTGGGTCT (eEF1A1-F1),
corresponding to nucleotide positions 157–178. The eEF1A1-reverse
primer sequence was: TGGCACAAATGCTACTGTGTCG
(eEF1A2-R1), corresponding to nucleotide positions 555–576, to
give an expected PCR product size of 420 bp. Similarly PCR primers
specific for the eEF1A2 isoform were designed using the Ensembl
cDNA sequence: ENST00000298049. The eEF1A2-forward primer
sequence was: AGGAGGCTGCTCAGTTCACCT (eEF1A2-F3),
corresponding to nucleotide positions 1004–1024; and the eEF1A2-
reverse primer sequence was: CCGCTCTTCTTCTCCACGTTC
(eEF1A2-R3), corresponding to nucleotide positions 1317–1336, with
an expected PCR product size of 334 bp. Primers were synthesized
using the commercial facility at Eurofins MWG Operon (http://
www.eurofinsdna.com/products-services/oligonucleotides0.html).
Serum Biomarkers for Prostate Cancer Metastasis
PLoS ONE | www.plosone.org 3 February 2012 | Volume 7 | Issue 2 | e30885
Reverse transcription PCR was performed by using 1 ml of
cDNA from each of the cell lines, 10 pmol of each forward/
reverse primer, and 0.5 ml of AccuPrime Taq DNA polymerase
(Invitrogen, UK), in 20 ml volumes. Thermocycling was performed
under the following conditions: Initial denaturation at 94uC for
5 minutes; 30 PCR cycles of 94uC for 1 min, 58uC for 1 min, and
72uC for 1 min, and a final extension of 72uC for 7 minutes.
Amplified PCR products (10 ml) were separated on a 2.5% agarose
gel containing ethidium bromide and imaged using the GelDoc
XR+ Molecular Imager (Bio-Rad). Band intensities were measured
using the Quantity One software (Bio-Rad).
PCR products were sequenced at the Genetics core facility,
University of Sheffield (http://www.shef.ac.uk/medicine/research/
corefacilities/genetics.html). DNA sequences were visualised using
the Chromas Lite version 2.01 software, freely downloaded from
http://www.technelysium.com.au/chromas_lite.html.
Results
Hierarchical cluster analysis of protein profilesAnalysis of the 4 pooled groups of patients identified 122
proteins with associated information on their relative expression
levels (Table S2). The false discovery rate was 1.4% which is
within the acceptable limit of 5% [25]. For the iTRAQ dataset, 75
unique proteins were identified and relatively quantified with $2
unique peptides, and these data were used for statistical analyses to
determine alterations in protein levels between groups. Hierarchi-
cal clustering was performed to group the data based on the
degree of similarity between the BPH and cancer groups.
Agglomerative clustering using the squared Euclidean distance
between log10 value of iTRAQ ratios and smallest intercluster
dissimilarity linkage procedure was performed (Mathematica 7.0.0
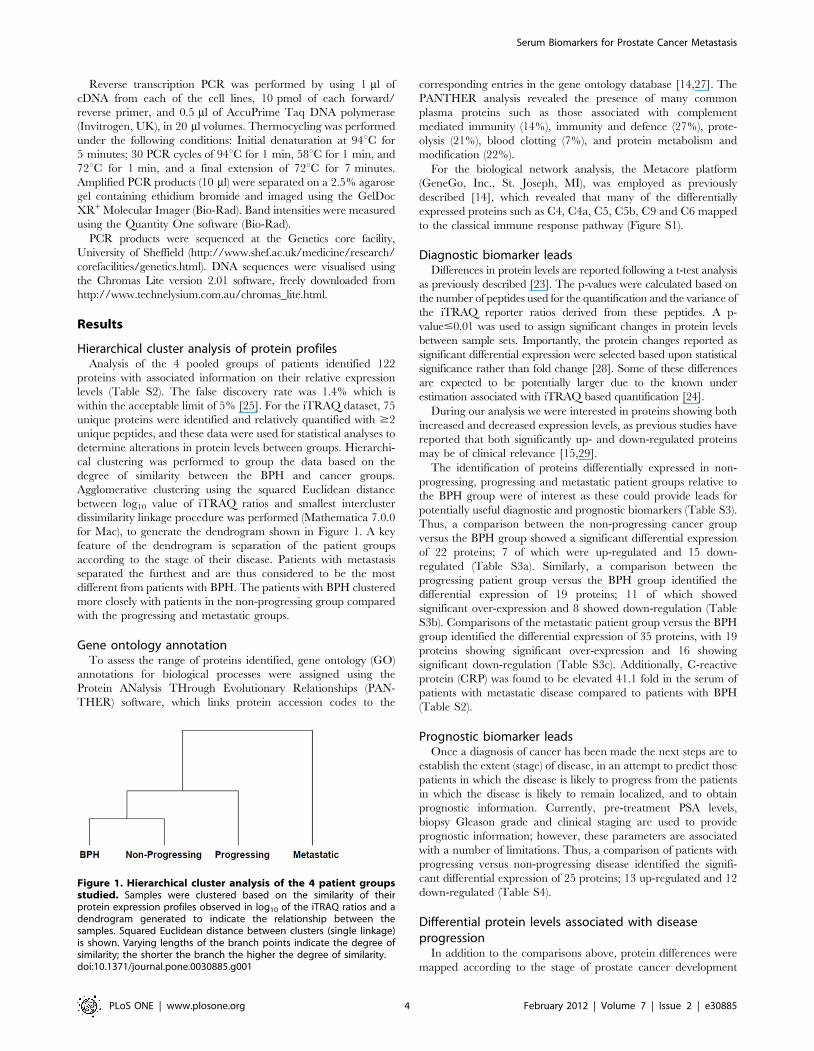
for Mac), to generate the dendrogram shown in Figure 1. A key
feature of the dendrogram is separation of the patient groups
according to the stage of their disease. Patients with metastasis
separated the furthest and are thus considered to be the most
different from patients with BPH. The patients with BPH clustered
more closely with patients in the non-progressing group compared
with the progressing and metastatic groups.
Gene ontology annotationTo assess the range of proteins identified, gene ontology (GO)
annotations for biological processes were assigned using the
Protein ANalysis THrough Evolutionary Relationships (PAN-
THER) software, which links protein accession codes to the
corresponding entries in the gene ontology database [14,27]. The
PANTHER analysis revealed the presence of many common
plasma proteins such as those associated with complement
mediated immunity (14%), immunity and defence (27%), prote-
olysis (21%), blood clotting (7%), and protein metabolism and
modification (22%).
For the biological network analysis, the Metacore platform
(GeneGo, Inc., St. Joseph, MI), was employed as previously
described [14], which revealed that many of the differentially
expressed proteins such as C4, C4a, C5, C5b, C9 and C6 mapped
to the classical immune response pathway (Figure S1).
Diagnostic biomarker leadsDifferences in protein levels are reported following a t-test analysis
as previously described [23]. The p-values were calculated based on
the number of peptides used for the quantification and the variance of
the iTRAQ reporter ratios derived from these peptides. A p-
value#0.01 was used to assign significant changes in protein levels
between sample sets. Importantly, the protein changes reported as
significant differential expression were selected based upon statistical
significance rather than fold change [28]. Some of these differences
are expected to be potentially larger due to the known under
estimation associated with iTRAQ based quantification [24].
During our analysis we were interested in proteins showing both
increased and decreased expression levels, as previous studies have
reported that both significantly up- and down-regulated proteins
may be of clinical relevance [15,29].
The identification of proteins differentially expressed in non-
progressing, progressing and metastatic patient groups relative to
the BPH group were of interest as these could provide leads for
potentially useful diagnostic and prognostic biomarkers (Table S3).
Thus, a comparison between the non-progressing cancer group
versus the BPH group showed a significant differential expression
of 22 proteins; 7 of which were up-regulated and 15 down-
regulated (Table S3a). Similarly, a comparison between the
progressing patient group versus the BPH group identified the
differential expression of 19 proteins; 11 of which showed
significant over-expression and 8 showed down-regulation (Table
S3b). Comparisons of the metastatic patient group versus the BPH
group identified the differential expression of 35 proteins, with 19
proteins showing significant over-expression and 16 showing
significant down-regulation (Table S3c). Additionally, C-reactive
protein (CRP) was found to be elevated 41.1 fold in the serum of
patients with metastatic disease compared to patients with BPH
(Table S2).
Prognostic biomarker leadsOnce a diagnosis of cancer has been made the next steps are to
establish the extent (stage) of disease, in an attempt to predict those
patients in which the disease is likely to progress from the patients
in which the disease is likely to remain localized, and to obtain
prognostic information. Currently, pre-treatment PSA levels,
biopsy Gleason grade and clinical staging are used to provide
prognostic information; however, these parameters are associated
with a number of limitations. Thus, a comparison of patients with
progressing versus non-progressing disease identified the signifi-
cant differential expression of 25 proteins; 13 up-regulated and 12
down-regulated (Table S4).
Differential protein levels associated with diseaseprogression
In addition to the comparisons above, protein differences were
mapped according to the stage of prostate cancer development
Figure 1. Hierarchical cluster analysis of the 4 patient groupsstudied. Samples were clustered based on the similarity of theirprotein expression profiles observed in log10 of the iTRAQ ratios and adendrogram generated to indicate the relationship between thesamples. Squared Euclidean distance between clusters (single linkage)is shown. Varying lengths of the branch points indicate the degree ofsimilarity; the shorter the branch the higher the degree of similarity.doi:10.1371/journal.pone.0030885.g001
Serum Biomarkers for Prostate Cancer Metastasis
PLoS ONE | www.plosone.org 4 February 2012 | Volume 7 | Issue 2 | e30885
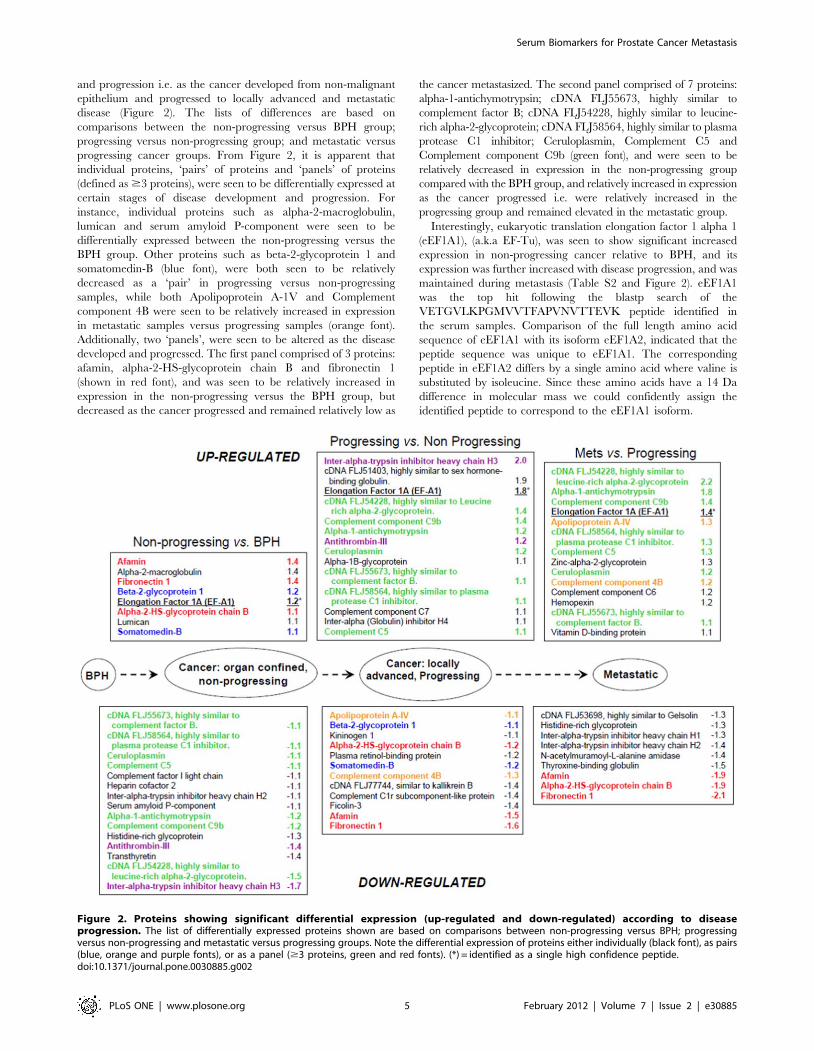
and progression i.e. as the cancer developed from non-malignant
epithelium and progressed to locally advanced and metastatic
disease (Figure 2). The lists of differences are based on
comparisons between the non-progressing versus BPH group;
progressing versus non-progressing group; and metastatic versus
progressing cancer groups. From Figure 2, it is apparent that
individual proteins, ‘pairs’ of proteins and ‘panels’ of proteins
(defined as $3 proteins), were seen to be differentially expressed at
certain stages of disease development and progression. For
instance, individual proteins such as alpha-2-macroglobulin,
lumican and serum amyloid P-component were seen to be
differentially expressed between the non-progressing versus the
BPH group. Other proteins such as beta-2-glycoprotein 1 and
somatomedin-B (blue font), were both seen to be relatively
decreased as a ‘pair’ in progressing versus non-progressing
samples, while both Apolipoprotein A-1V and Complement
component 4B were seen to be relatively increased in expression
in metastatic samples versus progressing samples (orange font).
Additionally, two ‘panels’, were seen to be altered as the disease
developed and progressed. The first panel comprised of 3 proteins:
afamin, alpha-2-HS-glycoprotein chain B and fibronectin 1
(shown in red font), and was seen to be relatively increased in
expression in the non-progressing versus the BPH group, but
decreased as the cancer progressed and remained relatively low as
the cancer metastasized. The second panel comprised of 7 proteins:
alpha-1-antichymotrypsin; cDNA FLJ55673, highly similar to
complement factor B; cDNA FLJ54228, highly similar to leucine-
rich alpha-2-glycoprotein; cDNA FLJ58564, highly similar to plasma
protease C1 inhibitor; Ceruloplasmin, Complement C5 and
Complement component C9b (green font), and were seen to be
relatively decreased in expression in the non-progressing group
compared with the BPH group, and relatively increased in expression
as the cancer progressed i.e. were relatively increased in the
progressing group and remained elevated in the metastatic group.
Interestingly, eukaryotic translation elongation factor 1 alpha 1
(eEF1A1), (a.k.a EF-Tu), was seen to show significant increased
expression in non-progressing cancer relative to BPH, and its
expression was further increased with disease progression, and was
maintained during metastasis (Table S2 and Figure 2). eEF1A1
was the top hit following the blastp search of the
VETGVLKPGMVVTFAPVNVTTEVK peptide identified in
the serum samples. Comparison of the full length amino acid
sequence of eEF1A1 with its isoform eEF1A2, indicated that the
peptide sequence was unique to eEF1A1. The corresponding
peptide in eEF1A2 differs by a single amino acid where valine is
substituted by isoleucine. Since these amino acids have a 14 Da
difference in molecular mass we could confidently assign the
identified peptide to correspond to the eEF1A1 isoform.
Figure 2. Proteins showing significant differential expression (up-regulated and down-regulated) according to diseaseprogression. The list of differentially expressed proteins shown are based on comparisons between non-progressing versus BPH; progressingversus non-progressing and metastatic versus progressing groups. Note the differential expression of proteins either individually (black font), as pairs(blue, orange and purple fonts), or as a panel ($3 proteins, green and red fonts). (*) = identified as a single high confidence peptide.doi:10.1371/journal.pone.0030885.g002
Serum Biomarkers for Prostate Cancer Metastasis
PLoS ONE | www.plosone.org 5 February 2012 | Volume 7 | Issue 2 | e30885

Confirmation of candidates identified by iTRAQTo confirm the differential expression of candidate proteins
identified by iTRAQ, we subsequently performed a 1D-gel
electrophoresis using pooled serum from the 4 patient groups.
Following staining with Coomassie blue, a faint band was visually
seen to be present at a slightly higher intensity in the samples from
patients with metastatic disease relative to the other 3 groups of
patients (data not shown). This band was excised from the gel,
digested with trypsin and the resultant peptides analysed by LC-
MS/MS. The mass spectrometry data identified 7 peptides
matching to CRP with a sequence coverage of 27.6%, and
confirmed the iTRAQ data. The mass spectrum of a represen-
tative iTRAQ labelled peptide from CRP protein following MS/
MS is shown in Figure S2.
eEF1A1 immuno-expression in prostatic tissueDuring our iTRAQ analysis, we identified eEF1A1 to be
increased in expression in all of the cancer groups relative to BPH,
with relatively higher levels seen in the progressing (+1.8 fold), and
metastatic groups (+1.4 fold), (Table S2, and Figure 2). eEF1A1
was of particular interest to us for a number of reasons. Our
previously published iTRAQ study had shown its levels to be
increased in higher metastatic variant prostate cancer cells [14].
Furthermore, a previous study had shown that down-regulation of
eEF1A1 by RNA interference (RNAi), in Du145 cells reduced cell
proliferation, and inhibited cell migration and invasion [30].
Thus, immunohistochemical (IHC) staining for eEF1A1 was
performed using clinical tissue material from patients with BPH,
organ confined cancer, and bone from patients both with and
without metastatic prostate cancer. Representative immunostain-
ing images are shown in Figures 3A–C. Although eEF1A1
immunoexpression was seen in cancer cells, there was no
significant difference in the staining intensity between organ
confined disease and metastatic disease (p = 0.1720, Mann
Whitney U). Interestingly, intense immunoexpression of eEF1A1
was seen in osteoblasts and in particular those osteoblasts in the
vicinity of metastatic prostate tumour cells (Figure 3C). Assessment
of the immunostaining intensity in bone metastatic lesions showed
that there was a statistically significant higher median immuno-
staining intensity in the osteoblasts adjacent to metastatic prostate
cancer cells (n = 6 cases, median = 2.0), compared to osteoblasts in
normal control bone samples (n = 15 cases, median = 0),
(p = 0.0353, Mann Whitney U).
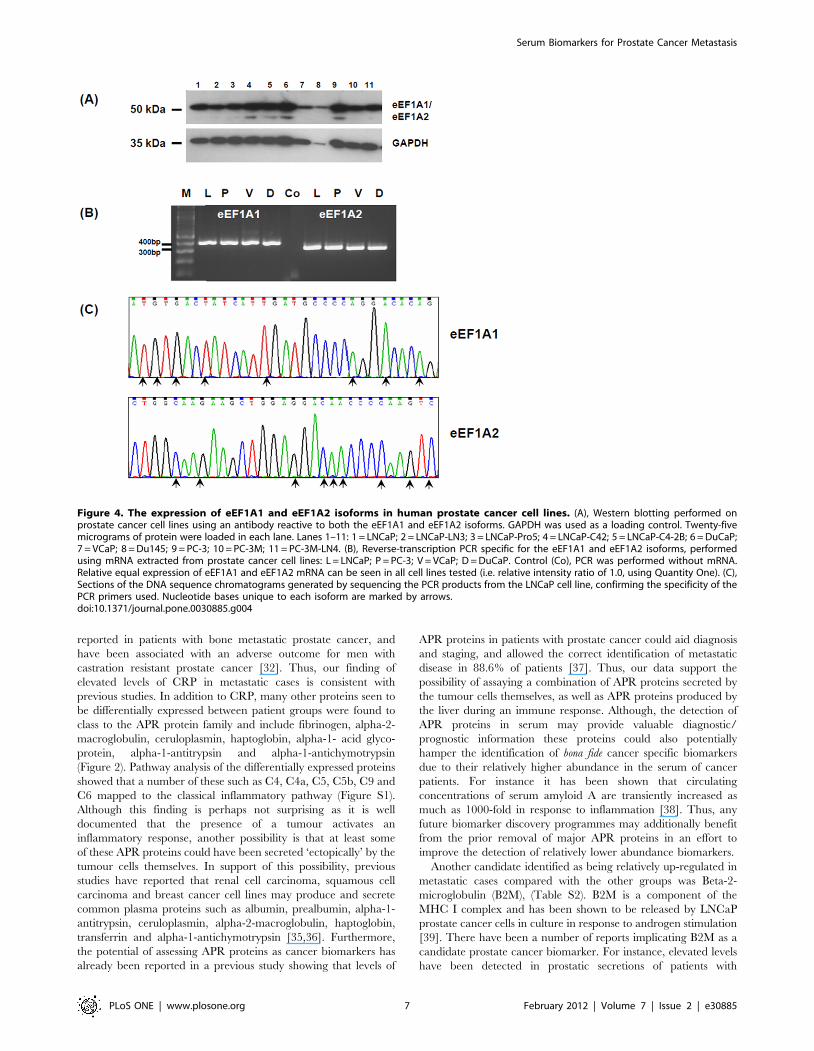
Prostate cancer cell lines express both the eEF1A1 andeEF1A2 isoforms
eEF1A occurs as two isoforms i.e. eEF1A1 and eEF1A2 with the
proteins sharing 92% sequence identity (http://omim.org/entry/
602959). In order to investigate the expression of both isoforms we
performed Western blotting using 11 human prostate cancer cell
lines and an osteosarcoma cell line (TE-85), with an antibody
directed against the N-terminus of both isoforms. As expected a
single immunoreactive band was detected at ,50 kDa in all cell
lines tested (Figure 4A), and in the osteosarcoma cell line (data not
shown). To investigate further the relative expression of the two
isoforms, we performed semi-quantitative reverse transcription
PCR using mRNA extracted from LNCaP, PC-3, VCaP and
DuCaP prostate cancer cell lines with isoform specific primers.
The expression of both the eEF1A1 and eEF1A2 isoforms was
detected in all 3 cell lines tested with a relative equal intensity i.e.
an expression ratio of 1.0 (Quantity One software, Bio-Rad),
(Figure 4B) . The specificity of the PCR primers was confirmed by
sequencing the PCR products (Figure 4C).
Discussion
In an effort to identify leads for potentially useful serum
biomarkers for prostate cancer diagnosis and progression, we
profiled pooled serum samples from 4 carefully selected groups of
patients representing the various stages of prostate cancer
development and progression using a 4-plex iTRAQ approach.
Following the GO annotations of the 75 proteins identified and
quantified ($2 peptides), the majority of these were found to class
to diverse biological pathways such as protein metabolism and
modification; blood clotting; proteolysis; immunity and defence;
complement mediated immunity; blood circulation and gas
exchange. Regarding the differentially expressed proteins, some
of these have previously been reported as candidate prostate
cancer biomarkers such as CRP, alpha-2-macroglobulin, cerulo-
plasmin, zinc-alpha-2-glycoprotein, beta-2-microglobulin and
fibronectin, which provides confidence to our dataset and provides
an independent confirmation of these candidates [31–34].
Of the proteins previously associated with prostate cancer; CRP
is an acute phase reactant (APR) protein produced by the liver in
response to inflammation. Elevated levels of CRP have been
Figure 3. Representative images showing the immunoexpres-sion of eEF1A1 in prostatic tissue, bone metastatic lesions andcontrol bone. (A), eEF1A1 immunoexpression can be seen in themalignant cells of the primary cancer (staining intensity = 2), and in thematched bone metastatic lesion from Patient 1 (staining intensity = 3).(B), eEF1A1 immunoexpression in the malignant cells of the primarycancer (staining intensity = 1), and in the matched bone metastaticlesion from Patient 2 (staining intensity = 3). (C), Intense eEF1A1immunoexpression can be seen in the osteoblasts lining bone (stainingintensity = 3, arrowheads), which are in close proximity to tumour cells,whereas osteoblasts lining normal bone show weak expression(staining intensity = 1, arrow heads).doi:10.1371/journal.pone.0030885.g003
Serum Biomarkers for Prostate Cancer Metastasis
PLoS ONE | www.plosone.org 6 February 2012 | Volume 7 | Issue 2 | e30885
reported in patients with bone metastatic prostate cancer, and
have been associated with an adverse outcome for men with
castration resistant prostate cancer [32]. Thus, our finding of
elevated levels of CRP in metastatic cases is consistent with
previous studies. In addition to CRP, many other proteins seen to
be differentially expressed between patient groups were found to
class to the APR protein family and include fibrinogen, alpha-2-
macroglobulin, ceruloplasmin, haptoglobin, alpha-1- acid glyco-
protein, alpha-1-antitrypsin and alpha-1-antichymotrypsin
(Figure 2). Pathway analysis of the differentially expressed proteins
showed that a number of these such as C4, C4a, C5, C5b, C9 and
C6 mapped to the classical inflammatory pathway (Figure S1).
Although this finding is perhaps not surprising as it is well
documented that the presence of a tumour activates an
inflammatory response, another possibility is that at least some
of these APR proteins could have been secreted ‘ectopically’ by the
tumour cells themselves. In support of this possibility, previous
studies have reported that renal cell carcinoma, squamous cell
carcinoma and breast cancer cell lines may produce and secrete
common plasma proteins such as albumin, prealbumin, alpha-1-
antitrypsin, ceruloplasmin, alpha-2-macroglobulin, haptoglobin,
transferrin and alpha-1-antichymotrypsin [35,36]. Furthermore,
the potential of assessing APR proteins as cancer biomarkers has
already been reported in a previous study showing that levels of
APR proteins in patients with prostate cancer could aid diagnosis
and staging, and allowed the correct identification of metastatic
disease in 88.6% of patients [37]. Thus, our data support the
possibility of assaying a combination of APR proteins secreted by
the tumour cells themselves, as well as APR proteins produced by
the liver during an immune response. Although, the detection of
APR proteins in serum may provide valuable diagnostic/
prognostic information these proteins could also potentially
hamper the identification of bona fide cancer specific biomarkers
due to their relatively higher abundance in the serum of cancer
patients. For instance it has been shown that circulating
concentrations of serum amyloid A are transiently increased as
much as 1000-fold in response to inflammation [38]. Thus, any
future biomarker discovery programmes may additionally benefit
from the prior removal of major APR proteins in an effort to
improve the detection of relatively lower abundance biomarkers.
Another candidate identified as being relatively up-regulated in
metastatic cases compared with the other groups was Beta-2-
microglobulin (B2M), (Table S2). B2M is a component of the
MHC I complex and has been shown to be released by LNCaP
prostate cancer cells in culture in response to androgen stimulation
[39]. There have been a number of reports implicating B2M as a
candidate prostate cancer biomarker. For instance, elevated levels
have been detected in prostatic secretions of patients with
Figure 4. The expression of eEF1A1 and eEF1A2 isoforms in human prostate cancer cell lines. (A), Western blotting performed onprostate cancer cell lines using an antibody reactive to both the eEF1A1 and eEF1A2 isoforms. GAPDH was used as a loading control. Twenty-fivemicrograms of protein were loaded in each lane. Lanes 1–11: 1 = LNCaP; 2 = LNCaP-LN3; 3 = LNCaP-Pro5; 4 = LNCaP-C42; 5 = LNCaP-C4-2B; 6 = DuCaP;7 = VCaP; 8 = Du145; 9 = PC-3; 10 = PC-3M; 11 = PC-3M-LN4. (B), Reverse-transcription PCR specific for the eEF1A1 and eEF1A2 isoforms, performedusing mRNA extracted from prostate cancer cell lines: L = LNCaP; P = PC-3; V = VCaP; D = DuCaP. Control (Co), PCR was performed without mRNA.Relative equal expression of eEF1A1 and eEF1A2 mRNA can be seen in all cell lines tested (i.e. relative intensity ratio of 1.0, using Quantity One). (C),Sections of the DNA sequence chromatograms generated by sequencing the PCR products from the LNCaP cell line, confirming the specificity of thePCR primers used. Nucleotide bases unique to each isoform are marked by arrows.doi:10.1371/journal.pone.0030885.g004
Serum Biomarkers for Prostate Cancer Metastasis
PLoS ONE | www.plosone.org 7 February 2012 | Volume 7 | Issue 2 | e30885

metastatic prostate cancer [40]. Serum B2M levels have been
shown to be elevated in patients with metastatic, androgen-
independent prostate cancer [31]. Additionally, B2M has
functionally been implicated in prostate cancer as its over-
expression in cancer cells induced rapid tumour growth in bone,
while disrupting B2M signaling by specific small interfering RNA
produced a regression of previously established prostate tumours
[41]. Thus, B2M may potentially serve as a biomarker for prostate
cancer progression and a novel drug target for the treatment of
bone metastasis which requires further study.
Other candidates up-regulated in one or more of the cancer
groups compared with the BPH group were fibronectin 1, afamin,
alpha-2-HS-glycoprotein chain B, ceruloplasmin and beta-2-
glycoprotein 1 (Figure 2). Interestingly, fibronectin was very
recently shown to be amongst the five-protein signature panel with
potential for Gleason score prediction [34]. Furthermore, in a
recent study fibronectin has been shown to be involved in initiating
lung cancer metastasis [42], thus making fibronectin an attractive
candidate biomarker and therapeutic target.
Another promising candidate identified in our study was
Afamin, which was found to be up-regulated in the non-
progressing group compared with BPH group, but was down-
regulated in the progressing and metastatic disease (Figure 2).
Afamin is a member of the albumin gene family expressed by the
liver and kidneys, and has been shown to be a specific binding
protein for vitamin E. Interestingly, our data is consistent with a
previous study which showed a decrease in afamin levels in
ovarian cancer where it has been proposed as a candidate
biomarker [43]. Thus, the potential of afamin as a candidate
prostate cancer biomarker requires further study.
eEF1A1, is a member of the elongation factor proteins that
normally functions to mediate the selection and binding of the
aminoacyl-tRNA to the ribosome during protein synthesis, and
ensures translational accuracy. eEF1A1 was of particular interest
to us as we had previously shown its levels to be increased in
higher metastatic variant prostate cancer cells [14], and another
study had reported that down-regulation of eEF1A1 by RNA
interference (RNAi) in Du145 cells led to an inhibition of cell
proliferation, invasion and migration [30]. Interestingly a
truncated form of eEF1A1 known as prostate tumour inducing
gene 1 (PTI-1) has been shown to be expressed in prostate
carcinoma patient-derived blood samples and proposed to be a
sensitive biomarker for prostate cancer [44]. Additionally, PTI-1
was shown to be expressed in prostate cancer tissues but not in
BPH or normal prostate tissues [45]. Our finding of increased
eEF1A1 expression in osteoblasts in the vicinity of metastatic
prostate cells, is in line with previous reports indicating a cross-talk
between prostate cancer cells and osteoblasts during bone
metastasis [46]. Prostate cancer bone metastasis are typically
osteoblastic (i.e. involve excessive bone formation), and it is well
known that tumour cells can stimulate osteoblasts to proliferate
and differentiate. Thus, eEF1A1 over-expression seen in osteo-
blasts may occur as a response to the presence of tumour cells. The
increased expression of eEF1A1 in the serum of patients with
cancer compared with BPH is an important finding as is suggests
that the search for novel cancer biomarkers should encompass not
only those factors secreted directly by the cancer cells but also
‘surrogate markers’ produced indirectly as a reaction to the
presence of tumour cells.
During our analysis we identified and quantified 122 unique
proteins (of which 75 were qualified by $2 unique peptides). This is
in line with a previous iTRAQ study analysing serum samples with
similar MS instrumentation [47]. Although depletion strategies can
improve sensitivity for detection of less abundant proteins, this
approach itself is associated with limitations as the higher abundant
proteins are known to act as a ‘sponge’ by complexing with lower
molecular weight proteins. For instance, a targeted analysis of
alpha-2-macroglobulin binding partners indicated that this highly
abundant plasma glycoprotein can bind various cytokines, growth
factors and heat shock proteins [48]. Consistent with this, we were
unable to detect PSA during our iTRAQ analysis despite it being
known to be present at relatively high concentrations in the cancer
and metastatic patient groups. PSA is known to complex with alpha-
1-antitrypsin and alpha-2-macroglobulin, both of which were
targets for removal by the IgY-14 affinity column [49]. Thus, it is
important that future biomarker studies analyze both the bound and
flow-through fractions in order to increase the repertoire of disease
candidates identified.
Although our study identified the differential expression of a
number of proteins, it is becoming apparent that a single biomarker is
unlikely to provide the required sensitivity and specificity, due to the
heterogeneity and dynamic nature of prostate cancer [50]. Thus, it
has been proposed that accurate disease diagnosis and prognosis are
likely to depend on the measurement of a panel of biomarkers,
perhaps utilising emerging multiplex technologies which could fast
forward these panels into the clinic. In support of this, our data has
shown that levels of certain combinations of proteins could be seen to
fluctuate as the disease developed and progressed. Certain proteins
were seen to be differentially expressed either individually, as pairs or
as panels (Figure 2). Interestingly, a previous study has reported that
by using a combination of proteins (complement component 4a (C4a)
and protein C inhibitor), a statistically significant value for predicting
prostate cancer recurrence was demonstrated in men who underwent
prostatectomy [51]. Thus, our study adds weight to other published
studies demonstrating the importance of evaluating pairs or panels of
carefully selected proteins to increase the diagnostic and prognostic
accuracy of cancer.
To our knowledge, our study appears to be the first iTRAQ based
approach aimed at identifying leads for potentially useful biomark-
ers of progression and metastasis in prostate cancer, using patient
serum. If the findings are validated in a larger cohort of patients,
then the detection of eEF1A1 in the serum of patients with prostate
cancer at the time of their initial diagnosis, may be able to predict
the likelihood of disease progression and those patients be offered
radical treatment options at an early stage of their disease.
With a number of biomarker studies already conducted over the
years and others in the pipeline, what is becoming evident is that
in order for a biomarker (or panel of biomarkers) to reach routine
clinical use it must pass through five phases of development
[52,53]. Thus, our study represents one of the initial steps
(‘exploratory phase’) along this process. Many of the candidates
identified in our and other studies await rigorous clinical validation
using large cohorts of patient samples, together with robust long-
term clinical and pathological information in subsequent phase 2–
5 studies, as proposed by Pepe et al., [52,53]. In addition to the
leads identified, what has emerged is that due to the sizable
inflammatory response to the presence of a tumour, future
biomarker identification strategies could benefit by the pre-
fractionation of APR proteins from the sera of cancer patients in
addition to the removal of common highly abundant serum
proteins, so that the cancer proteome can be mined even more
deeply. The panel of proteins identified, including eEF1A1
warrant further investigation and validation.
Supporting Information
Figure S1 Metacore pathway analysis of proteins dif-ferentially expressed between metastatic and progress-
Serum Biomarkers for Prostate Cancer Metastasis
PLoS ONE | www.plosone.org 8 February 2012 | Volume 7 | Issue 2 | e30885

ing patient groups, showing proteins mapping to theclassical immune response pathway. Proteins shown with a
red thermometer symbol represent increased expression levels.
(TIF)
Figure S2 Representative tandem mass spectra for C-reactive protein and insert showing the peak area at thelow mass/charge (m/z) region with the iTRAQ reporterions.(TIF)
Table S1 Disease characteristics of the 20 patientscomprising the 4 groups of patients analysed by iTRAQ.(DOC)
Table S2 Full list of the 122 proteins identified byiTRAQ.(RTF)
Table S3 Proteins differentially expressed betweenvarious cancer groups and BPH. (S3a) Proteins differentially
expressed between the non-progressing and BPH group. (S3b),
proteins differentially expressed between the progressing and BPH
group. (S3c), proteins differentially expressed between the
metastasis and BPH group.
(RTF)
Table S4 Proteins differentially expressed between theprogressing versus non-progressing group.
(RTF)
Acknowledgments
Ms Louise Goodwin and Ms Laura Proctor are acknowledged for their
assistance with serum collection.
Author Contributions
Conceived and designed the experiments: IR AG CLE JTP FCH PCW.
Performed the experiments: CAE AG SSC JD GP OSY. Analyzed the
data: IR CAE CLE GP OSY PCW FCH. Contributed reagents/materials/
analysis tools: SSC CLE JTP GNT PCW. Wrote the paper: IR CLE FCH
GNT PCW.
References
1. Damber JE, Aus G (2008) Prostate cancer. Lancet 371: 1710–1721.
2. Gronberg H (2003) Prostate cancer epidemiology. Lancet 361: 859–864.
3. Freedland SJ, Humphreys EB, Mangold LA, Eisenberger M, Dorey FJ, et al.(2005) Risk of prostate cancer-specific mortality following biochemical
recurrence after radical prostatectomy. JAMA 294: 433–439.
4. Zhu X, van Leeuwen PJ, Bul M, Bangma CH, Roobol MJ, et al. (2011)
Identifying and characterizing ‘‘escapes’’- men who develop metastases or diefrom prostate cancer despite screening (ERSPC, section Rotterdam). Int J Cancer
129: 2847–2854.
5. LaSpina M, Haas GP (2008) Update on the diagnosis and management of
prostate cancer. Can J Urol 15 Suppl 1: 3–13; discussion 13.
6. Lilja H, Ulmert D, Vickers AJ (2008) Prostate-specific antigen and prostate
cancer: prediction, detection and monitoring. Nat Rev Cancer 8: 268–278.
7. van Gils MP, Stenman UH, Schalken JA, Schroder FH, Luider TM, et al. (2005)Innovations in serum and urine markers in prostate cancer current European
research in the P-Mark project. Eur Urol 48: 1031–1041.
8. Anderson NL, Anderson NG (2002) The human plasma proteome: history,
character, and diagnostic prospects. Mol Cell Proteomics 1: 845–867.
9. Qian WJ, Kaleta DT, Petritis BO, Jiang H, Liu T, et al. (2008) Enhanced
detection of low abundance human plasma proteins using a tandem IgY12-SuperMix immunoaffinity separation strategy. Mol Cell Proteomics 7:
1963–1973.
10. Sun W, Wu S, Wang X, Zheng D, Gao Y (2005) An analysis of protein
abundance suppression in data dependent liquid chromatography and tandemmass spectrometry with tryptic peptide mixtures of five known proteins.
Eur J Mass Spectrom (Chichester, Eng) 11: 575–580.
11. Byrne JC, Downes MR, O’Donoghue N, O’Keane C, O’Neill A, et al. (2009)
2D-DIGE as a strategy to identify serum markers for the progression of prostatecancer. J Proteome Res 8: 942–957.
12. Pieper R, Su Q, Gatlin CL, Huang ST, Anderson NL, et al. (2003) Multi-component immunoaffinity subtraction chromatography: an innovative step
towards a comprehensive survey of the human plasma proteome. Proteomics 3:422–432.
13. Liu T, Qian WJ, Mottaz HM, Gritsenko MA, Norbeck AD, et al. (2006)Evaluation of multiprotein immunoaffinity subtraction for plasma proteomics
and candidate biomarker discovery using mass spectrometry. Mol Cell
Proteomics 5: 2167–2174.
14. Glen A, Evans CA, Gan CS, Cross SS, Hamdy FC, et al. (2010) Eight-plexiTRAQ analysis of variant metastatic human prostate cancer cells identifies
candidate biomarkers of progression: An exploratory study. Prostate 70:
1313–1332.
15. Glen A, Gan CS, Hamdy FC, Eaton CL, Cross SS, et al. (2008) iTRAQ-facilitated proteomic analysis of human prostate cancer cells identifies proteins
associated with progression. J Proteome Res 7: 897–907.
16. Keshamouni VG, Michailidis G, Grasso CS, Anthwal S, Strahler JR, et al.
(2006) Differential protein expression profiling by iTRAQ-2DLC-MS/MS oflung cancer cells undergoing epithelial-mesenchymal transition reveals a
migratory/invasive phenotype. J Proteome Res 5: 1143–1154.
17. Cross SS, Hamdy FC, Deloulme JC, Rehman I (2005) Expression of S100
proteins in normal human tissues and common cancers using tissue microarrays:
S100A6, S100A8, S100A9 and S100A11 are all overexpressed in commoncancers. Histopathology 46: 256–269.
18. Rehman I, Azzouzi AR, Cross SS, Deloulme JC, Catto JW, et al. (2004)
Dysregulated expression of S100A11 (calgizzarin) in prostate cancer and
precursor lesions. Hum Pathol 35: 1385–1391.
19. Pettaway CA, Pathak S, Greene G, Ramirez E, Wilson MR, et al. (1996)
Selection of highly metastatic variants of different human prostatic carcinomas
using orthotopic implantation in nude mice. Clin Cancer Res 2: 1627–1636.
20. Thalmann GN, Anezinis PE, Chang SM, Zhau HE, Kim EE, et al. (1994)
Androgen-independent cancer progression and bone metastasis in the LNCaP
model of human prostate cancer. Cancer Res 54: 2577–2581.
21. Bandow JE (2010) Comparison of protein enrichment strategies for proteome
analysis of plasma. Proteomics 10: 1416–1425.
22. Boylan KL, Andersen JD, Anderson LB, Higgins L, Skubitz AP (2010)
Quantitative proteomic analysis by iTRAQ(R) for the identification of candidate
biomarkers in ovarian cancer serum. Proteome Sci 8: 31.
23. Pham TK, Roy S, Noirel J, Douglas I, Wright PC, et al. (2010) A quantitative
proteomic analysis of biofilm adaptation by the periodontal pathogen Tannerella
forsythia. Proteomics 10: 3130–3141.
24. Ow SY, Salim M, Noirel J, Evans C, Rehman I, et al. (2009) iTRAQ
underestimation in simple and complex mixtures: The good, the bad and the
ugly. J Proteome Res.
25. Elias JE, Gygi SP (2007) Target-decoy search strategy for increased confidence
in large-scale protein identifications by mass spectrometry. Nat Methods 4:
207–214.
26. Rehman I, Cross SS, Azzouzi AR, Catto JW, Deloulme JC, et al. (2004) S100A6
(Calcyclin) is a prostate basal cell marker absent in prostate cancer and its
precursors. Br J Cancer 91: 739–744.
27. Thomas PD, Kejariwal A, Campbell MJ, Mi H, Diemer K, et al. (2003)
PANTHER: a browsable database of gene products organized by biological
function, using curated protein family and subfamily classification. Nucleic Acids
Res 31: 334–341.
28. Noirel J, Evans C, Salim M, Mukherjee J, Ow SY, et al. (2011) Methods in
Quantitative Proteomics: Setting iTRAQ on the Right Track. Current
Proteomics 8: 17–30.
29. Qingyi Z, Lin Y, Junhong W, Jian S, Weizhou H, et al. (2009) Unfavorable
prognostic value of human PEDF decreased in high-grade prostatic intraepi-
thelial neoplasia: a differential proteomics approach. Cancer Invest 27: 794–801.
30. Zhu G, Yan W, He HC, Bi XC, Han ZD, et al. (2009) Inhibition of
proliferation, invasion, and migration of prostate cancer cells by downregulating
elongation factor-1 alpha expression. Mol Med 15: 363–370.
31. Gross M, Top I, Laux I, Katz J, Curran J, et al. (2007) Beta-2-microglobulin is
an androgen-regulated secreted protein elevated in serum of patients with
advanced prostate cancer. Clin Cancer Res 13: 1979–1986.
32. Prins RC, Rademacher BL, Mongoue-Tchokote S, Alumkal JJ, Graff JN, et al.
(2010) C-reactive protein as an adverse prognostic marker for men with
castration-resistant prostate cancer (CRPC): Confirmatory results. Urol Oncol.
33. Zhang WM, Finne P, Leinonen J, Salo J, Stenman UH (2000) Determination of
prostate-specific antigen complexed to alpha(2)-macroglobulin in serum
increases the specificity of free to total PSA for prostate cancer. Urology 56:
267–272.
34. Cima I, Schiess R, Wild P, Kaelin M, Schuffler P, et al. (2011) Cancer genetics-
guided discovery of serum biomarker signatures for diagnosis and prognosis of
prostate cancer. Proc Natl Acad Sci U S A.
35. Yoshimura S, Tamaoki N, Ueyama Y, Hata J (1978) Plasma protein production
by human tumors xenotransplanted in nude mice. Cancer Res 38: 3474–3478.
36. Mbeunkui F, Metge BJ, Shevde LA, Pannell LK (2007) Identification of
differentially secreted biomarkers using LC-MS/MS in isogenic cell lines
representing a progression of breast cancer. J Proteome Res 6: 2993–3002.
Serum Biomarkers for Prostate Cancer Metastasis
PLoS ONE | www.plosone.org 9 February 2012 | Volume 7 | Issue 2 | e30885
37. Ward AM, Cooper EH, Houghton AL (1977) Acute phase reactant proteins in
prostatic cancer. Br J Urol 49: 411–418.38. Le L, Chi K, Tyldesley S, Flibotte S, Diamond DL, et al. (2005) Identification of
serum amyloid A as a biomarker to distinguish prostate cancer patients with
bone lesions. Clin Chem 51: 695–707.39. Martin DB, Gifford DR, Wright ME, Keller A, Yi E, et al. (2004) Quantitative
proteomic analysis of proteins released by neoplastic prostate epithelium. CancerRes 64: 347–355.
40. Drake RR, White KY, Fuller TW, Igwe E, Clements MA, et al. (2009) Clinical
collection and protein properties of expressed prostatic secretions as a source forbiomarkers of prostatic disease. J Proteomics 72: 907–917.
41. Huang WC, Wu D, Xie Z, Zhau HE, Nomura T, et al. (2006) beta2-microglobulin is a signaling and growth-promoting factor for human prostate
cancer bone metastasis. Cancer Res 66: 9108–9116.42. Malik G, Knowles LM, Dhir R, Xu S, Yang S, et al. (2010) Plasma fibronectin
promotes lung metastasis by contributions to fibrin clots and tumor cell invasion.
Cancer Res 70: 4327–4334.43. Jackson D, Craven RA, Hutson RC, Graze I, Lueth P, et al. (2007) Proteomic
profiling identifies afamin as a potential biomarker for ovarian cancer. ClinCancer Res 13: 7370–7379.
44. Sun Y, Lin J, Katz AE, Fisher PB (1997) Human prostatic carcinoma oncogene
PTI-1 is expressed in human tumor cell lines and prostate carcinoma patientblood samples. Cancer Res 57: 18–23.
45. Shen R, Su ZZ, Olsson CA, Fisher PB (1995) Identification of the humanprostatic carcinoma oncogene PTI-1 by rapid expression cloning and differential
RNA display. Proc Natl Acad Sci U S A 92: 6778–6782.
46. Lu Y, Zhang J, Dai J, Dehne LA, Mizokami A, et al. (2004) Osteoblasts induce
prostate cancer proliferation and PSA expression through interleukin-6-
mediated activation of the androgen receptor. Clin Exp Metastasis 21: 399–408.
47. Tonack S, Aspinall-O’Dea M, Jenkins RE, Elliot V, Murray S, et al. (2009) A
technically detailed and pragmatic protocol for quantitative serum proteomics
using iTRAQ. J Proteomics 73: 352–356.
48. Burgess EF, Ham AJ, Tabb DL, Billheimer D, Roth BJ, et al. (2008) Prostate
cancer serum biomarker discovery through proteomic analysis of alpha-2
macroglobulin protein complexes. Proteomics Clin Appl 2: 1223.
49. Zhang WM, Finne P, Leinonen J, Stenman UH (2000) Characterization and
determination of the complex between prostate-specific antigen and alpha 1-
protease inhibitor in benign and malignant prostatic diseases. Scand J Clin Lab
Invest Suppl 233: 51–58.
50. Mikolajczyk SD, Song Y, Wong JR, Matson RS, Rittenhouse HG (2004) Are
multiple markers the future of prostate cancer diagnostics? Clin Biochem 37:
519–528.
51. Rosenzweig CN, Zhang Z, Sun X, Sokoll LJ, Osborne K, et al. (2009) Predicting
prostate cancer biochemical recurrence using a panel of serum proteomic
biomarkers. J Urol 181: 1407–1414.
52. Pepe MS, Etzioni R, Feng Z, Potter JD, Thompson ML, et al. (2001) Phases of
biomarker development for early detection of cancer. J Natl Cancer Inst 93:
1054–1061.
53. Pepe MS, Feng Z, Janes H, Bossuyt PM, Potter JD (2008) Pivotal evaluation of
the accuracy of a biomarker used for classification or prediction: standards for
study design. J Natl Cancer Inst 100: 1432–1438.
Serum Biomarkers for Prostate Cancer Metastasis
PLoS ONE | www.plosone.org 10 February 2012 | Volume 7 | Issue 2 | e30885
Copyright © 2022 FDOKUMEN