A novel nucleic acid extraction method from aromatic herbs ...
Upload
khangminh22Category
view
3download
0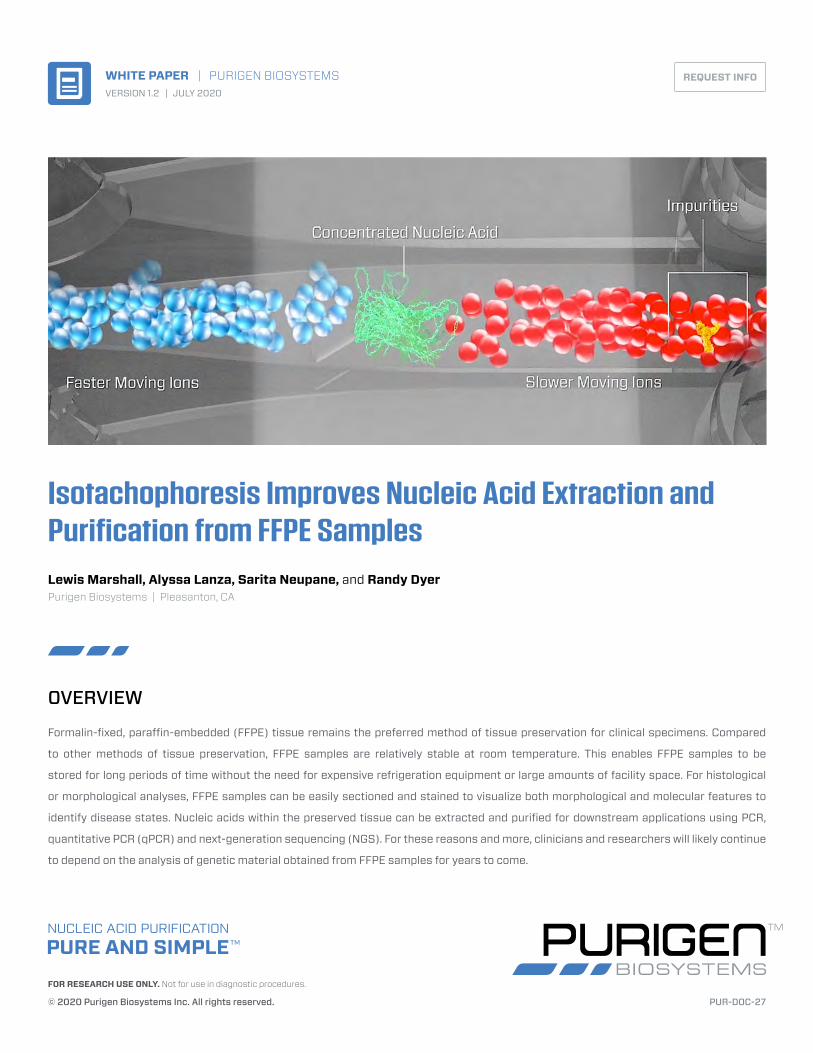
FOR RESEARCH USE ONLY. Not for use in diagnostic procedures.
© 2020 Purigen Biosystems Inc. All rights reserved. PUR-DOC-27
Isotachophoresis Improves Nucleic Acid Extraction and Purification from FFPE SamplesLewis Marshall, Alyssa Lanza, Sarita Neupane, and Randy Dyer Purigen Biosystems | Pleasanton, CA
OVERVIEW
Formalin-fixed, paraffin-embedded (FFPE) tissue remains the preferred method of tissue preservation for clinical specimens. Compared
to other methods of tissue preservation, FFPE samples are relatively stable at room temperature. This enables FFPE samples to be
stored for long periods of time without the need for expensive refrigeration equipment or large amounts of facility space. For histological
or morphological analyses, FFPE samples can be easily sectioned and stained to visualize both morphological and molecular features to
identify disease states. Nucleic acids within the preserved tissue can be extracted and purified for downstream applications using PCR,
quantitative PCR (qPCR) and next-generation sequencing (NGS). For these reasons and more, clinicians and researchers will likely continue
to depend on the analysis of genetic material obtained from FFPE samples for years to come.
WHITE PAPER | PURIGEN BIOSYSTEMSVERSION 1.2 | JULY 2020
REQUEST INFO

2
Formalin-Fixed,Para�n-Embedded
Tissue Block
1 6Lysate containing
nucleic acid,ready for purification
2Sectioned into
5 or 10 µm slices
3Macro-dissected andde-para�nized withXylene (or similar)
4Digested withproteinase K
to free nucleic acid
5Heated to reverse
formaldehydecross-linking
WHITE PAPER | Isotachophoresis Improves Nucleic Acid Extraction and Purification from FFPE Samples
To use FFPE samples for molecular analysis, researchers are faced with several challenges. Formalin fixation, the process used to generate FFPE samples,
is not standardized and can introduce greater variation across samples prepared by different clinicians or at different times. Studies conducted more than
20 years ago found that the condition of the tissue sample, mode of formalin use, and time of fixation can all affect the integrity of nucleic acids, which can
compromise downstream analysis1. Furthermore, the buffers used during the fixation process can lead to the deamination of cytosine bases and single
nucleotide modifications2. Fixation also induces cross-linking of nucleic acids with proteins as well as to other nucleic acids. To address cross-linking
and deamination, samples must be treated in various ways to remove paraffin and reverse cross-linking while avoiding additional damage prior to nucleic
acid extraction. These treatments, while necessary to obtain high-quality nucleic acid for molecular analysis, are time-consuming and do not address any
fragmentation that may have occurred.
With an increasingly diverse set of genomic tools at their disposal, researchers and clinicians benefit from extracting as much nucleic acid as possible
from each FFPE sample while still meeting the quality required for a more sensitive analysis method, such as NGS. While some nucleic acid extraction and
purification technologies claim to be optimized for use with FFPE samples, they can further compromise the quality of the nucleic acids extracted and fail
to extract all the nucleic acid available. These technologies also employ multi-step workflows that require optimal conditions at each step for successful
extraction.
In recent years, most researchers have replaced liquid-liquid extraction techniques, such as phenol-chloroform extraction, with technologies that rely on a
“catch-and-release” approach based on the principle of solid phase extraction. Two common examples of this approach are column-based and bead-based
extractions. Both methods require that the FFPE sample is first chemically de-paraffinized and de-crosslinked, after which the nucleic acid is bound to a
solid surface — silica in the case of columns and carboxyl or silica paramagnetic coatings in the case of beads. The solid surface is then washed with a
buffer to remove any unbound molecules. Finally, the bound nucleic acid is released from the solid surface into a solution using a solvent. This final step,
referred to as an elution, generates an eluate composed of nucleic acid and buffer that can be used as an input for downstream analyses.
The typical workflow used by column- and bead-based purification technologies is tedious and time-intensive. Each methodology requires careful
optimization of several steps to achieve the desired yield and quality of the nucleic acid extracted. Before binding the nucleic acid to a solid surface, the
sample must be fully deparaffinized, de-crosslinked and lysed. Chaotropic salts are added during lysis to destabilize proteins (including nucleases) and
dissociate nucleic acids. This enables nucleic acid to bind to the solid surface. The entire solution is then centrifuged and drawn through a silica column
or thoroughly mixed with coated beads. In the case of columns, free nucleic acid binds to the silica as the solution passes through the column. In the case
of beads, nucleic acids precipitate onto the surface of the beads where salt facilitates the interaction with the surface during mixing. Following the mixing
Challenges with Existing Purification Technologies
FIGURE 1: Overview of traditional workflow of preparing lysate from FFPE samples for purification.

3
Purigen Biosystems
Solid phase extraction technologies frequently used to purify nucleic acids from FFPE can add to the inherent sample variability and produce eluates that
are not of high enough quality and/or yield for downstream applications. Though some newer NGS technologies can cope with lower concentrations to
overcome suboptimal purification conditions, the samples purified by column- or bead-based methods may still have different impacts on downstream
sequencing due to damage or bias that occurs to nucleic acids during purification4. This can contribute to non-uniform coverage of sequencing targets
and lowered NGS efficiency. In addition, the entire workflow is laborious and can take anywhere from several hours to an entire working day to complete.
Attempts to address this with automation have shown in recent studies to yield lower concentrations of nucleic acids when compared to manual methods
for extraction from FFPE samples5-7.
FIGURE 2: Examples of the typical workflows for column- and bead-based extraction technologies.
Column-based Kit WorkflowColumn-based Kit WORKFLOW
Bead-based Kit WORKFLOW
Purigen WORKFLOW
1LyseSample*
No need to trim wax or remove
paraffi n
Ready-to-use
DNA
2De-
crosslink
3Purify
Ionic™ Purifi cation
SystemSimple hands-off thermo-mixer protocol provided
< 3 minutes of hands-on time per sample
PUR-DOC-24
Purification
1Sample
No need to trim wax or remove
paraffin
4Purify
Purigen Ionic™ Purification
System
5Ready-to-use Nucleic
Acid
2Lyse
3Heat
Simple hands-off thermo-mixer protocol
provided
Lysis
1Sample
No need to trim wax or remove
paraffin
4Purify
Purigen Ionic™ Purification
System
2Lyse
3Heat
Simple hands-off thermo-mixer protocol
provided
Lysis
6Ready-to-use Nucleic
Acid
5Elute
From elution wells on Ionic™
FFPE Chip
Sample
No need to trim wax or remove
paraffin
3Purify
Purigen Ionic™ Purification
System
Ready-to-use Nucleic
Acid
1Lyse
2Heat
Simple hands-off thermo-mixer protocol
provided
1Sample
4Heat
2Remove Para�n
3Lyse
6AW1
Wash
5Binding
9Elute
7AW2Wash
8EtOHWash
11Ready-to-Use
DNA
10SpinDry
Sample
3Heat
1Remove Para�n
2Lyse
5AW1
Wash
4Binding
8Elute
6AW2Wash
7EtOHWash
Ready-to-Use
DNA
9SpinDry
Sample
3Heat
1Remove Para�n
2Lyse
5Apply
Magnet
4Add Beads
to Bind
8Elute
6Wash
7Wash Ready-
to-UseDNA
Bead-based Kit Workflow
Column-based Kit WORKFLOW
Bead-based Kit WORKFLOW
Purigen WORKFLOW
1LyseSample*
No need to trim wax or remove
paraffi n
Ready-to-use
DNA
2De-
crosslink
3Purify
Ionic™ Purifi cation
SystemSimple hands-off thermo-mixer protocol provided
< 3 minutes of hands-on time per sample
PUR-DOC-24
Purification
1Sample
No need to trim wax or remove
paraffin
4Purify
Purigen Ionic™ Purification
System
5Ready-to-use Nucleic
Acid
2Lyse
3Heat
Simple hands-off thermo-mixer protocol
provided
Lysis
1Sample
No need to trim wax or remove
paraffin
4Purify
Purigen Ionic™ Purification
System
2Lyse
3Heat
Simple hands-off thermo-mixer protocol
provided
Lysis
6Ready-to-use Nucleic
Acid
5Elute
From elution wells on Ionic™
FFPE Chip
Sample
No need to trim wax or remove
paraffin
3Purify
Purigen Ionic™ Purification
System
Ready-to-use Nucleic
Acid
1Lyse
2Heat
Simple hands-off thermo-mixer protocol
provided
1Sample
4Heat
2Remove Para�n
3Lyse
6AW1
Wash
5Binding
9Elute
7AW2Wash
8EtOHWash
11Ready-to-Use
DNA
10SpinDry
Sample
3Heat
1Remove Para�n
2Lyse
5AW1
Wash
4Binding
8Elute
6AW2Wash
7EtOHWash
Ready-to-Use
DNA
9SpinDry
Sample
3Heat
1Remove Para�n
2Lyse
5Apply
Magnet
4Add Beads
to Bind
8Elute
6Wash
7Wash Ready-
to-UseDNA
Purification
1Sample
No need to trim wax or remove
paraffin
4Purify
Purigen Ionic™ Purification
System
5Ready-to-use Nucleic
Acid
2Lyse
3Heat
Simple hands-off thermo-mixer protocol
provided
Lysis
1Sample
No need to trim wax or remove
paraffin
4Purify
Purigen Ionic™ Purification
System
2Lyse
3Heat
Simple hands-off thermo-mixer protocol
provided
Lysis
6Ready-to-use Nucleic
Acid
5Elute
From elution wells on Ionic™
FFPE Chip
Sample
No need to trim wax or remove
paraffin
3Purify
Purigen Ionic™ Purification
System
Ready-to-use Nucleic
Acid
1Lyse
2Heat
Simple hands-off thermo-mixer protocol
provided
1Sample
4Heat
2Remove Para�n
3Lyse
6AW1
Wash
5Binding
9Elute
7AW2Wash
8EtOHWash
11Ready-to-Use
DNA
10SpinDry
Sample
3Heat
1Remove Para�n
2Lyse
5AW1
Wash
4Binding
8Elute
6AW2Wash
7EtOHWash
Ready-to-Use
DNA
9SpinDry
Sample
3Heat
1Remove Para�n
2Lyse
5Apply
Magnet
4Add Beads
to Bind
8Elute
6Wash
7Wash Ready-
to-UseDNA
step, a magnet is used to pull beads to one location in a container while the binding solution is aspirated and discarded. The effectiveness of binding in
either case depends on access of the nucleic acid to the solid surface during this stage. Recent studies have shown that recovery of DNA using silica-
based solid phases depends on the saturation level of the binding surface and that when the amount of DNA in the sample is lower than 1 µg of DNA, the
percentage of DNA recovered is reduced3
After the binding step, the columns or beads are thoroughly and repeatedly washed with chaotropic salts and ethanol to remove residual impurities.
Typically, a wash cycle consists of the addition of a wash buffer containing a low concentration of chaotropic salt to the column or bead solution, followed
by centrifugation or mixing and aspiration, respectively. This is followed by one or more cycles with ethanol used in place of salt to remove residual salt.
As with the binding step, the wash step requires optimization as well. Failure to remove residual salt, which can impede the elution of nucleic acids, can
lower recovery.
In the final elution step, solvent, or water, is added to the column or bead solution to dissociate the DNA from the solid surface. Prior to the addition of
a solvent, the beads or column must be free of ethanol. Ethanol contamination in columns is avoided by dry centrifugation. For beads, the process after
aspiration typically involves placing the bead solution container into an oven or incubator to dry off any remaining ethanol. Failure to remove the ethanol
can inhibit downstream assays. Over-drying at this stage can damage the beads and reduce the amount of nucleic acid recovered.

4
Isotachophoresis separates and concentrates charged molecules in solution, solely based on their electrophoretic mobility or the speed at which the
molecules move within the applied electric field11. As such, isotachophoresis offers a compelling approach for separating negatively charged nucleic acids
from impurities that are positively charged, non-charged, or that are negatively charged with lower electrophoretic mobility.
Isotachophoresis Offers a Better Approach
Throughout this process, nucleic acids are never bound to a solid phase, exposed to wash reagents or stripped from a solid phase for collection. As such,
the risk of introducing contaminants from the solid phase or chemicals is avoided. Since nucleic acids do not have to be physically bound and stripped
from a solid phase, there is no risk of unbound material washing away or bound material failing to elute. The result is a higher yield of pure nucleic acid that
is less fragmented, more representative of the native nucleic acids in the sample and free from bead or wash buffer contamination.
FIGURE 3: Conceptual representation of isotachophoresis in the following steps: 1) Lysate containing nucleic acids is loaded into the microfluidic channel between a leading electrolyte containing ions with a faster electrophoretic mobility than nucleic acids and a trailing electrolyte containing ions with a slightly slower electrophoretic mobility. 2) Electrical current is applied to the channel, causing nucleic acids to move through the solution toward the positive electrode. As this happens, the leading and trailing ions form a sharp electric field gradient, and nucleic acids focus toward the gradient. This is the ITP zone. Impurities are not collected into the zone because their mobilities are not bracketed by the leading and trailing ions. 3) The band moves into an extraction well. The field gradient is detected by a sensor, and the system shuts down the electric current. The result is purified nucleic acid in a well accessible by a pipette tip.
1 Sample loaded
CathodicBu�er
SeparationBu�er
ExtractionBu�er
AnodicBu�er
2 Current applied nucleic acid moves and concentrates
CathodicBu�er
SeparationBu�er
ExtractionBu�er
AnodicBu�er
NucleicAcid
3 Purified sample collected NucleicAcid
Nucleic Acid
Impurity Trailing Ions(slow)
Nucleic Acid Leading Ions (fast)
Nucleic AcidImpurities
WHITE PAPER | Isotachophoresis Improves Nucleic Acid Extraction and Purification from FFPE Samples
5
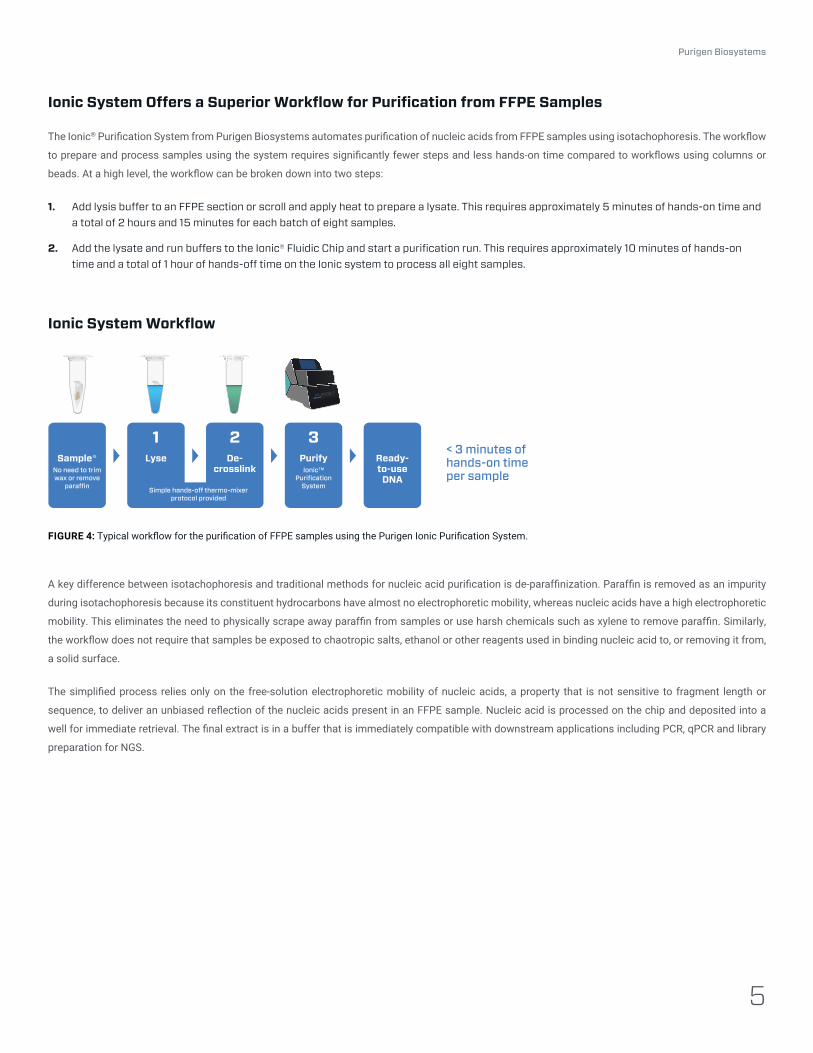
The Ionic® Purification System from Purigen Biosystems automates purification of nucleic acids from FFPE samples using isotachophoresis. The workflow
to prepare and process samples using the system requires significantly fewer steps and less hands-on time compared to workflows using columns or
beads. At a high level, the workflow can be broken down into two steps:
Ionic System Offers a Superior Workflow for Purification from FFPE Samples
A key difference between isotachophoresis and traditional methods for nucleic acid purification is de-paraffinization. Paraffin is removed as an impurity
during isotachophoresis because its constituent hydrocarbons have almost no electrophoretic mobility, whereas nucleic acids have a high electrophoretic
mobility. This eliminates the need to physically scrape away paraffin from samples or use harsh chemicals such as xylene to remove paraffin. Similarly,
the workflow does not require that samples be exposed to chaotropic salts, ethanol or other reagents used in binding nucleic acid to, or removing it from,
a solid surface.
The simplified process relies only on the free-solution electrophoretic mobility of nucleic acids, a property that is not sensitive to fragment length or
sequence, to deliver an unbiased reflection of the nucleic acids present in an FFPE sample. Nucleic acid is processed on the chip and deposited into a
well for immediate retrieval. The final extract is in a buffer that is immediately compatible with downstream applications including PCR, qPCR and library
preparation for NGS.
Ionic System Workflow
Column-based Kit WORKFLOW
Bead-based Kit WORKFLOW
Purigen WORKFLOW
1LyseSample*
No need to trim wax or remove
paraffi n
Ready-to-use
DNA
2De-
crosslink
3Purify
Ionic™ Purifi cation
SystemSimple hands-off thermo-mixer protocol provided
< 3 minutes of hands-on time per sample
PUR-DOC-24
Purification
1Sample
No need to trim wax or remove
paraffin
4Purify
Purigen Ionic™ Purification
System
5Ready-to-use Nucleic
Acid
2Lyse
3Heat
Simple hands-off thermo-mixer protocol
provided
Lysis
1Sample
No need to trim wax or remove
paraffin
4Purify
Purigen Ionic™ Purification
System
2Lyse
3Heat
Simple hands-off thermo-mixer protocol
provided
Lysis
6Ready-to-use Nucleic
Acid
5Elute
From elution wells on Ionic™
FFPE Chip
Sample
No need to trim wax or remove
paraffin
3Purify
Purigen Ionic™ Purification
System
Ready-to-use Nucleic
Acid
1Lyse
2Heat
Simple hands-off thermo-mixer protocol
provided
1Sample
4Heat
2Remove Para�n
3Lyse
6AW1
Wash
5Binding
9Elute
7AW2Wash
8EtOHWash
11Ready-to-Use
DNA
10SpinDry
Sample
3Heat
1Remove Para�n
2Lyse
5AW1
Wash
4Binding
8Elute
6AW2Wash
7EtOHWash
Ready-to-Use
DNA
9SpinDry
Sample
3Heat
1Remove Para�n
2Lyse
5Apply
Magnet
4Add Beads
to Bind
8Elute
6Wash
7Wash Ready-
to-UseDNA
Purification
1Sample
No need to trim wax or remove
paraffin
4Purify
Purigen Ionic™ Purification
System
5Ready-to-use Nucleic
Acid
2Lyse
3Heat
Simple hands-off thermo-mixer protocol
provided
Lysis
1Sample
No need to trim wax or remove
paraffin
4Purify
Purigen Ionic™ Purification
System
2Lyse
3Heat
Simple hands-off thermo-mixer protocol
provided
Lysis
6Ready-to-use Nucleic
Acid
5Elute
From elution wells on Ionic™
FFPE Chip
Sample
No need to trim wax or remove
paraffin
3Purify
Purigen Ionic™ Purification
System
Ready-to-use Nucleic
Acid
1Lyse
2Heat
Simple hands-off thermo-mixer protocol
provided
1Sample
4Heat
2Remove Para�n
3Lyse
6AW1
Wash
5Binding
9Elute
7AW2Wash
8EtOHWash
11Ready-to-Use
DNA
10SpinDry
Sample
3Heat
1Remove Para�n
2Lyse
5AW1
Wash
4Binding
8Elute
6AW2Wash
7EtOHWash
Ready-to-Use
DNA
9SpinDry
Sample
3Heat
1Remove Para�n
2Lyse
5Apply
Magnet
4Add Beads
to Bind
8Elute
6Wash
7Wash Ready-
to-UseDNA
FIGURE 4: Typical workflow for the purification of FFPE samples using the Purigen Ionic Purification System.
1. Add lysis buffer to an FFPE section or scroll and apply heat to prepare a lysate. This requires approximately 5 minutes of hands-on time and a total of 2 hours and 15 minutes for each batch of eight samples.
2. Add the lysate and run buffers to the Ionic® Fluidic Chip and start a purification run. This requires approximately 10 minutes of hands-on time and a total of 1 hour of hands-off time on the Ionic system to process all eight samples.
Purigen Biosystems

6
Con
cent
rati
on (n
g/μL
)
10
20
BREAST COLON LUNG
IONIC SYSTEM COLUMN-BASED
Among the advantages of using the Ionic system to purify DNA from FFPE samples are an increased amplifiable yield and improved coverage uniformity
in amplicon-based NGS workflows. Amplicon-based sequencing allows researchers to detect variation in genomic regions of interest in complex samples
such as tumors. The sequencing process requires NGS libraries with a specific range of fragment lengths. The range of supported fragment lengths can
vary by kit, but typically falls between 100 and 1,000 base pairs. Since nucleic acids within an FFPE block can be denatured and fragmented during the
fixation process itself, it is critical to prevent fragmentation in the purification process. It is also important to purify fragments within the target range
without any bias to fragments of a specific length or sequence. Underrepresentation of certain fragment lengths or types for any reason can require higher
levels of sequencing coverage, resulting in higher sequencing costs.
Overview
There are three commonly used techniques to determine the yield of nucleic acids produced from the purification of an FFPE sample: UV absorbance,
fluorescence and qPCR. While UV absorbance is widely used because of its comparatively lower cost and simple workflow, it is less sensitive and can be
biased by the presence of single-stranded DNA, RNA and free nucleotides. The use of fluorescence requires labeling with a fluorescent dye, which can be
less successful when nucleic acids are fragmented. In comparison to the previously mentioned techniques, qPCR is more sensitive and can detect trace
amounts of nucleic acids8-9. qPCR also detects inhibitors present in the sample and can be used to estimate the level of fragmentation present10.
In the following example, a comparison of qPCR results based on replicate DNA samples from 32 FFPE blocks show that the amplifiable yield is greater for
most samples when purified using the Ionic system. Amplification of an 80 base-pair amplicon was measured (QIAGEN MRef multicopy reference assay),
showing that the amplifiable yield obtained from the Ionic system exceeded the yield from samples prepared using a commercial column-based extraction
kit for 31 of 32 blocks. For these comparisons, the quantity of DNA recovered using the Ionic system averaged 3.5 times the amount of the DNA recovered
using a column-based kit.
Assessment of Amplifiable Yield
Improved Purification of FFPE Samples for Amplification-based Analyses
FIGURE 5: Comparison of nucleic acid yields from replicate sections of 32 FFPE samples purified by either the Ionic system or a commercially available column-based kit (32 sections per extraction method). For optimal performance from the columns, sections purified by this method were mounted onto slides prior to lysis. Sections purified by Ionic system were processed as unmounted scrolls to demonstrate improved performance using a simpler workflow. The Ionic system yield exceeds that of column-based extraction kit for 31 of 32 samples. Error bars indicate the 95% confidence interval for each data point.
WHITE PAPER | Isotachophoresis Improves Nucleic Acid Extraction and Purification from FFPE Samples

7
Amplicon-based sequencing requires regions of interest within a sample to be enriched through targeted amplification prior to sequencing. This is
accomplished by performing PCR with sequence-specific oligonucleotide primers prior to sequencing. Samples purified with a technique that provides
less uniform recovery — and therefore less coverage uniformity — may require additional cycles of sequencing to build enough coverage across the sample
to confidently call variants. This “over-sequencing” to accommodate non-uniform sample coverage can increase overall sequencing costs.
Improved Coverage Uniformity for Amplicon-based Sequencing of FFPE Samples
To determine the suitability of DNA from an FFPE sample for amplicon-based
sequencing, a qPCR assay with multiple primer sets that yield a range of amplicon
sizes (such as the QC Plex assay from Agilent Technologies) is used. The success
of amplifying longer fragments as opposed to shorter fragments is assessed with
a fragment analyzer, such as the Agilent Technologies TapeStation. This approach
produces a quality score (DQC value) that is used to QC extracts from sample
purification experiments prior to preparing NGS libraries. A higher quality score
correlates to a higher relative abundance of the longer amplicons, indicating that the
sample is suitable for amplicon-based sequencing. The table to the right describes
the correlation between DQC score and DNA quality for the Agilent QC Plex assay.
FIGURE 6: Replicate sections from 32 FFPE samples processed by either the Ionic system or a column-based kit (32 each) were assessed with the Agilent QC Plex assay and the resulting amplicons were analyzed on the Agilent Technologies 4200 TapeStation. The resulting traces were scored using the DQC algorithm. Error bars indicate the 95% confidence interval for each data point.
TABLE 1: Correlation between DQC score and DNA quality for Agilent QC Plex assay.
DQC Value DNA Quality
> 5 Excellent DNA quality
1.1 – 5.0 Good DNA quality
0.1 – 1.0 Acceptable DNA quality
< 0.1 Poor DNA quality
IONIC SYSTEM COLUMN-BASED No Amplifi cation Observed
DQ
C
BREAST COLON LUNG
Purigen Biosystems
A comparison of QC Plex assay scores (DQC score) from the samples described above indicates that higher-quality nucleic acid was obtained from 27 of
the 32 FFPE samples when using the Ionic system. Furthermore, the score of “No Amp” reported for 14 of the samples purified using columns indicates
that no DNA amplification was observed. By comparison, all samples purified by the Ionic system resulted in observable amplification levels.

8
IONIC SYSTEM COLUMN-BASED
Cov
erag
e R
atio
Amplicon Size (bp) Amplicon Size (bp)
A comparison of sequencing results from three FFPE blocks (BM, CP and LO), where the QC Plex assay scores for samples purified by the Ionic system
and by a column-based kit were both “Acceptable,” demonstrates more uniform coverage for samples purified by the Ionic system. To demonstrate this,
a sequencing library was prepared from each sample using the Agilent SureMASTR amplicon-based sequencing method. Results from each sample were
then compared to a coverage profile generated from a high-quality reference sample, Coriell Institute NA12878 DNA (GM12878 cell line). A coverage ratio
equal to 1 indicates that the DNA quality recovered from the FFPE sample is equivalent to the reference sample. The resulting ratio of reference coverage
to sample coverage for each purification method clearly shows that libraries generated using DNA purified by columns have less uniform coverage than
the reference when compared to libraries generated using the DNA from consecutive slices purified using the Ionic system. These libraries would require
20x to 50x greater sequencing depth to achieve equal sequencing coverage of the least-covered targets compared to the libraries prepared from samples
purified using the Ionic system.
By replotting the data in the graph above, a correlation between coverage ratio and amplicon length can be shown. The graphs below illustrate this
correlation and show that as amplicon length increases, the coverage from samples purified by a column-based approach is lower than the reference. A
similar correlation is not observed in the data from the samples purified by the Ionic system. This indicates that the column-based extraction technology
may inherently bind and release amplicons of a certain length better than others. The amount of bias shown here for column-based extraction is significant,
with some targets represented at only 1% of the expected fraction of the population. This could severely limit the ability to call variants on low-coverage
targets and would require substantially greater sequencing depth to confidently identify clinically relevant variants.
FIGURE 7: Libraries were prepared and enriched for the SureMASTR Tumor Hotspot Panel (Agilent) and sequenced on the Illumina MiSeq sequencer. Coverage was assessed against control libraries constructed from a high-quality reference sample, Coriell Institute NA12878 DNA (GM12878 cell line). Coverage was compared to the reference as a fraction of total hits. The log ratio of the coverage fraction by target is plotted.
IONIC SYSTEM COLUMN-BASED
Cov
erag
e R
atio
BREAST COLON LUNG
FIGURE 8: Data from the sequencing of the SureMASTR Tumor Hotspot libraries is plotted here as a coverage ratio versus the amplicon size. The higher intensity of color at each data point indicates overlapping data points. The underrepresented targets in the libraries made from column-purified DNA occur most often in the longer targets.
WHITE PAPER | Isotachophoresis Improves Nucleic Acid Extraction and Purification from FFPE Samples

9
Purigen Biosystems
FIGURE 9: Sequencing libraries were prepared from DNA extracted using either the Ionic system or a column-based kit. Each set contained samples composed of 1, 2, or 4 FFPE tissue sections of 5 µm thickness. Each set also contained replicate 2-section and 4-section samples. Libraries were prepared using the SureMASTR Tumor Hotspot Panel (Agilent) and sequenced on the Illumina MiSeq sequencer. Library coverage was normalized to the lowest number of reads after sequencing. Coverage was assessed against control libraries constructed from a high-quality reference sample, Coriell Institute NA12878 DNA (GM12878 cell line). Coverage was compared to the reference as a fraction of total hits. The log ratio of the coverage fraction by target is plotted. After sequencing, 26 variants were detected in samples prepared by both the Ionic system and using a column-based kit. 100% of the 26 expected variants were detected in 4 out of 5 samples purified on the Ionic system with no difference between replicates.
Coverage Bias
Portion of 26 Expected
Variants Identifi ed
1 2 2 4 4
IONIC SYSTEM COLUMN-BASED
Number of 5 µm Sections per Extraction
Higher variability in calls made
Poor coverage uniformity> 1000x bias
1
21/2625/26
2 2 4 4
25/26 23/26
26
10-3
10-2
10-1
10-0
24
22
20
To further illustrate the impact of coverage uniformity on variant calling, Figure 9 depicts a comparison of sequencing results from replicate sections from
the same FFPE block (CT) purified using both the Ionic system and a column-based kit. Each cluster of points in the upper section of the figure represents
the log ratio of the target coverage obtained from each sample in comparison to the coverage of a high quality reference sample. Each set of samples
was composed of 1, 2 or 4 sections of FFPE tissue with a 5 µm thickness. As described earlier, the samples purified using the Ionic system provide
more uniform coverage of target amplicons when compared to samples purified using a column-based kit. In the lower section of the figure, the bars
below each cluster indicate the portion of variants that were commonly detected in all sample types identified after sequencing. 100% of the 26 variants
expected were detected in four out of five samples purified on the Ionic system. 100% of the variants were detected in both replicates of the 2-section
and 4-section samples purified on the Ionic system. By comparison, only two out of the five samples purified using a column-based kit provided a similar
result. Furthermore, fewer variants were identified in both the 2-section and 4-section replicates. The coverage from the two samples where 100% of the
variants were detected is also more uniform by comparison to the other samples also purified using a column-based kit. This implies that less uniform
coverage from an under-representation of certain targeted amplicons can potentially result in variability across replicate sections and failure to detect
variants. This effect is demonstrated here at 100% allele frequency. The effect would be even more pronounced at a lower frequency, which can be the
case for real tumor tissue samples.

10
The creation of FFPE samples will remain a go-to
method to preserve and archive tissue samples for
molecular analyses. While samples are subject to
variability from preparation techniques, they are
stable at room temperature, can be stained for
histological purposes, and preserve nucleic acids
and proteins for downstream molecular analyses that
may occur several years after they have been made.
Since the process of creating FFPE samples
introduces the risk of nucleic acid degradation,
purification technologies that offer maximum
recovery of nucleic acids without adding damage
or bias offer significant advantages over the current
technologies available. With a simplified workflow
and separation based solely on the electrophoretic
mobility of the molecules in a sample, Purigen’s
Ionic Purification System offers an alternative for
FFPE sample purification for NGS that has less risk
of further damage to nucleic acids or bias toward
specific fragment length or GC content.
Summary
WHITE PAPER | Isotachophoresis Improves Nucleic Acid Extraction and Purification from FFPE Samples
REQUEST INFO

11
Purigen Biosystems
1 Srinivasan M, Sedmak D, Jewell S. Effect of fixatives and tissue processing on the content and integrity of nucleic acids. The American Journal of Pathology. 2002;161(6):1961–71. pmid:12466110; PubMed Central PMCID: PMC1850907
2 McDonough SJ, Bhagwate A, Sun Z, et al. Use of FFPE-derived DNA in next generation sequencing: DNA extraction methods. PLoS One. 2019 Apr 11;14(4):e0211400. doi: 10.1371/journal.pone.0211400. eCollection 2019.
3 Katevatis C, Fan A, Klapperich CM. Low concentration DNA extraction and recovery using a silica solid phase. PLoS One. 2017 May 5;12(5):e0176848. doi: 10.1371/journal.pone.0176848.
4 Kresse SH, Namløs HM, Lorenz S, et al. Evaluation of commercial DNA and RNA extraction methods for high-throughput sequencing of FFPE samples. PLoS One. 2018; 13(5): e0197456. doi: 10.1371/journal.pone.0197456
5 Kovacs Z, Jung I, Csernak E, et al. DNA extraction from paraffin embedded colorectal carcinoma samples: A comparison study of manual vs automated methods, using four commercially kits. World J Clin Oncol. 2019 Sep 24;10(9):307-317. doi: 10.5306/wjco.v10.i9.307.
6 Riemann K, Adamzik M, Frauenrath S, et al. Comparison of manual and automated nucleic acid extraction from whole-blood samples. J Clin Lab Anal. 2007;21(4):244-8.
7 Kalmár A, Péterfia B, Wichmann B, et al. Comparison of Automated and Manual DNA Isolation Methods for DNA Methylation Analysis of Biopsy, Fresh Frozen, and Formalin-Fixed, Paraffin-Embedded Colorectal Cancer Samples. J Lab Autom. 2015 Dec;20(6):642-51. doi: 10.1177/2211068214565903.
8 Nakayama Y, Yamaguchi H, Einaga N, Esumi M. Pitfalls of DNA Quantification Using DNA-Binding Fluorescent Dyes and Suggested Solutions. PLoS One. 2016 Mar 3;11(3):e0150528. doi: 10.1371/journal.pone.0150528.
9 Dang J, Mendez P, Lee S, et al. Development of a robust DNA quality and quantity assessment qPCR assay for targeted next-generation sequencing library preparation. Int J Oncol. 2016 Oct;49(4):1755-65. doi: 10.3892/ijo.2016.3654.
10 King C, Debruyne R, Kuch M, et al. A quantitative approach to detect and overcome PCR inhibition in ancient DNA extracts. Biotechniques. 2009 Nov;47(5):941-9. doi: 10.2144/000113244.
11 Rogacs A., Marshall L.A. & Santiago J.G. Purification of nucleic acids using isotachophoresis. Journal of Chromatography A. 2014; 1335: 105-120, p.108.
References

FOR RESEARCH USE ONLY. Not for use in diagnostic procedures.
PURIGEN BIOSYSTEMS, INC.5700 Stoneridge Drive, Suite 100Pleasanton, CA 94588
TEL: +1 877 PURIGEN (787-4436)
SALESEMAIL: [email protected]
SUPPORTEMAIL: [email protected]: +1 877 PURIGEN (787-4436)
© 2020 Purigen Biosystems Inc. All rights reserved.The Purigen logo and “Nucleic Acid Purification – Pure and Simple” are trademarks, and Ionic® is a registered trademark of Purigen Biosystems, Inc., in the U.S. PUR-DOC-27
WHITE PAPER | Isotachophoresis Improves Nucleic Acid Extraction and Purification from FFPE Samples
Copyright © 2022 FDOKUMEN