nucleic acid regulation in sequence Kasper WJ Derks
144
The DNA damage response: nucleic acid regulation in sequence Kasper W.J. Derks
-
Upload
khangminh22 -
Category
Documents
-
view
0 -
download
0
Transcript of nucleic acid regulation in sequence Kasper WJ Derks

The DNA damage response:
nucleic acid regulation in sequence
Kasper W.J. Derks

ISBN: 978-94-6259-318-3 Cover design: Kasper W.J. Derks Lay-out: Kasper W.J. Derks Printed by: Ipskamp Drukkers BV Published by: Ipskamp Drukkers BV Copyright © 2014 by Kasper W.J. Derks. All rights reserved. No part of this book may be reproduced, stored in a retrieval system, or transmitted in any form or by any means, without prior permission of the author, or when appropriate, of the publisher of the presented published articles.

The DNA damage response: nucleic acid regulation in sequence
De DNA schade response: nucleïnezuur regulatie op een rijtje
Proefschrift
ter verkrijging van de graad van doctor aan de Erasmus Universiteit Rotterdam
op gezag van de rector magnificus
Prof. dr. H.A.P. Pols
en volgens besluit van het College voor Promoties.
De openbare verdediging zal plaatsvinden op woensdag 22 oktober 2014 om 11.30 uur
door
Kasper Willem Jacob Derks
geboren te Terneuzen

Promotiecommisie
Promotoren: Prof. dr. J.H.J. Hoeijmakers Prof. dr. G.T.J. van der Horst Copromotor: Dr. J. Pothof Overige leden: Prof. dr. J.N.J. Philipsen Prof. dr. R. Agami Dr. H. Vrieling

Contents
Chapter 1 General introduction 7
Aim of the thesis 19
Chapter 2 In vivo predictive mRNA and 21 microRNA expression signatures
Chapter 3 In vitro predictive microRNA 41 expression signatures
Chapter 4 Sequencing the RNA landscape 53 in response to DNA damage
Chapter 5 Deciphering the RNA landscape 79 by RNAome sequencing
Chapter 6 General discussion 111
Future perspectives 115
Chapter 7 Summary 129
Samenvatting 132
Chapter 8 Dankwoord 135
Curriculum Vitae 140
List of publications 141
PhD portfolio 142


Chapter 1
General introduction Adapted from:
The DNA damage response: the omics era and its impact Kasper WJ Derks, Joris Pothof, Jan HJ Hoeijmakers
DNA Repair (Amst). 2014 Jul;19:214-20.

Chapter 1
8
Introduction
‘-omics’ technologies Novel technologies and their applications fuel new insights and discoveries in any field of molecular life sciences, medicine, molecular epidemiology and biotechnology. One of those revolutions represents technologies that monitor a (nearly) complete class of biomolecules in a process of interest. These data-dense technologies have been designated omics technologies, in which the suffix -omics refers to the respective technologies monitoring (I) DNA in the context of complete genomes (genomics), (II) genome-wide RNA transcript expression levels representing the transcriptome (transcriptomics), (III) global protein and/or post-translational modifications (PTMs), designated the proteome (proteomics), or (IV) nearly all cellular metabolites, named the metabolome (metabolomics). The principle of both proteomics and metabolomics relies on mass differences measured with great accuracy by mass spectrometry due to protein/metabolite levels or the presence of PTMs. Sophisticated and stringent isolation methods of PTMs and stable isotope labelling of amino acids allowing quantitative analysis of protein samples have further propelled proteomics technology. The genome and transcriptome have been extensively investigated by microarray technology over the past decade. Microarrays are based on comparative hybridization of fluorescently labeled DNA or cDNA (in case of RNA expression) under stringent conditions to capture probes (complementary oligonucleotides) printed on a solid surface. This allows the analysis of (tens of) thousands of molecules simultaneously, revolutionizing the scale and depth in which DNA and RNA could be investigated. The recent emergence of next generation sequencing (NGS) has further changed the landscape of genome and transcriptome analysis. NGS, also named massive parallel sequencing, can sequence hundreds of millions DNA molecules simultaneously. A single NGS run can sequence the human genome ∼37 times in 27h, thereby tremendously facilitating whole genome (re)sequencing projects and genome analyses such as single nucleotide polymorphisms (SNP), mutation, insertion/deletion and DNA methylation detection. In addition, NGS can map protein–DNA and DNA–DNA interactions at nucleotide resolution. Transcriptomics of large and small RNAs can be performed by simultaneously sequencing millions of cDNA molecules. Since NGS does not rely on capture probe design and their presence on arrays, novel non-coding RNAs, splice variants, post-transcriptional modifications and nascent RNA synthesis can be quantitatively analysed. In this review, we will discuss the contribution of omics technologies to understanding the DNA damage response (DDR), with the emphasis on genomics and transcriptomics

General introduction
9
in particular by NGS technologies, and the future prospective of omics research in the DDR research field.
The DNA damage response
It has been estimated that DNA acquires 10,000 of lesions every day already from endogenous sources alone such as reactive oxygen species and metabolic products. In addition, several exogenous sources also produce DNA lesions, e.g. ultraviolet (UV) light from the sun, ionizing radiation and numerous environmental and manmade chemicals. DNA lesions can interfere with vital the DNA metabolic processes replication and transcription as well as with associated chromatin reorganization. In contrast to RNA, proteins and metabolites, DNA is the only cellular component that cannot be replaced upon damage and therefore solely relies on repair. It is also the largest molecule in the cell, and when paternal and maternal alleles are considered separate, it is unique in most cells. Moreover, since DNA is at the top of the informational hierarchy, unrepaired DNA lesions or incorrectly repaired DNA damage can have lasting consequences (1). Indeed, unfaithful DNA repair results in mutations, insertions, deletions or chromosomal aberrations, which may lead eventually to cancer development. Many spontaneously tumours as well as hereditary cancer syndromes have defects in DNA repair and response genes, hence illustrating the importance of maintaining genome integrity. On the other hand, studies in human progeroid syndromes and corresponding transgenic mouse models indicate that accumulation of unrepaired DNA damage contributes significantly to aging and numerous age-related pathologies, again pointing toward the significant role of DNA damage in health and disease. To deal with the adverse effects of DNA damage, cells have an arsenal of DNA repair mechanisms, each recognizing and repairing its own spectrum of lesions. In addition to DNA repair systems, cell cycle checkpoints are activated that halt cell proliferation to provide a time window to repair. When damage is beyond repair, cell death or cellular senescence, a permanent cell cycle arrest, is induced to remove the damaged cell from the tissue or to prevent it from replicating, with enhanced risk of mutations and cancer. All DNA repair systems, cell cycle checkpoints and additional pathways whose activity changes upon DNA damage are collectively known as the DDR. It is of utmost importance that the DDR is tightly controlled, since there is a delicate balance between incorrect repair driving carcinogenesis and hyper-activation, inducing apoptosis or senescence that leads to loss of tissue homeostasis, a contributing factor to aging and age-related pathologies (1-4). Moreover, the amount and type of DNA lesions, but also context (e.g. cell type, proliferation vs. post-mitotic), determine the cellular outcome of DNA damage signalling. It is therefore not surprising that cells have an ingenious DDR that maximizes survival and decides on cell fate. Studies in the last two decades have
Chapter 1
10
presented a schematic overview of DDR signalling layers that coordinate the cellular response to DNA damage (Figure 1). The first step involves detecting DNA lesions by a class of sensor proteins. These sensors are required for recruiting various factors to the site of damage such as DNA repair factors, but also transmit a signal to so-called transducer proteins, of which ATM and ATR checkpoint kinases are the most prominent examples. These transducers in turn diversify and amplify the damage signal to the third layer, which are so-called effectors, which control the activity of several cellular processes and pathways, such as cell cycle arrest and apoptosis. Sensor and transducer signalling primarily relies on protein interactions and alterations in protein activity by PTMs such as phosphorylation, ubiquitination, etc. Several effectors however, are transcription factors, e.g. p53, or microRNAs, which demonstrates that the RNA component within the DDR is also essential. While the basic DDR as drawn in Figure 1 already consists of >100 genes, transcriptomics and proteomics have discovered that hundreds of additional proteins are targets of checkpoint kinases and more than a thousand genes are differentially expressed upon DNA damage as a result of transcription factor/microRNA regulation. Thus, transcriptomics and proteomics have tremendously expanded our view of the DDR.
Proteomics
Mass spectrometry after protein complex isolation has been instrumental to identify novel protein–protein interactions and modifications and boosted various branches of the molecular life sciences, including DDR research. In addition, specialized proteomics screens dramatically expanded the components and repertoire of PTM events in the DDR. PTMs are an integral step in signal transduction and within the DDR, including phosphorylation, acetylation, (poly)ADP-ribosylation, ubiquitination, sumoylation and neddylation (5, 6). Since checkpoint kinases ATM and ATR are central nodes in the DDR, one of the first proteomics screening approaches aimed at identifying target proteins. ATM and ATR phosphorylate S and T residues in target proteins at a conserved SQ or TQ motif. Antibodies specifically raised against these phosphorylated motifs were used to isolate ATM/ATR target proteins phosphorylated after DNA damage, which was followed by mass spectrometry analysis (7). Interestingly, more than 500 ATM/ATR target proteins were identified, which were not only known targets involved in DNA repair and checkpoint function, but also many proteins from processes previously not linked to the DDR such as RNA processing factors. Additional proteomics screens identified numerous proteins phosphorylated after DNA damage independent from ATM/ATR (8-10). These screens together disclose an extensive network of phosphorylation events, crosstalk between ATM/ATR and several other signal transduction pathways (e.g. insulin/IGF1 receptor signalling) and identified additional effectors that control RNA expression programs.

General introduction
11
Figure 1: Schematic overview of DNA damage response (DDR). Components of the DDR have been classified into three steps: sensors, transducers and effectors. Sensors and transducers consist of proteins and their post-translational modifications. Effectors also include microRNAs and gene expression changes by transcription factors. Both protein and RNA responses are required for cell fate determination after DNA damage, i.e. repair & checkpoint recovery, cell death, cellular senescence or differentiation. Other PTMs in the context of DNA damage have also been analysed by proteomics, e.g. ubiquitination (11, 12), sumoylation (13-15), parylation (16) and acetylation (17). These screens identified known DNA repair and checkpoint proteins, but also chromatin remodelling factors and many proteins previously unknown to participate in the DDR, indicating the complexity of signalling networks in the DDR at the PTM level. It is highly conceivable that PTMs in the DDR exhibit crosstalk to fine-tune the cellular response or outcome of DNA damage signalling. The effector protein p53 is among the best-studied examples. p53 is not only phosphorylated at several amino acids, but is also acetylated, ubiquitinated, sumoylated, methylated, neddylated, ADP-ribosylated and glycosylated at several residues (18). Therefore, proteomics screens that quantify multiple PTMs in parallel could unravel such intricate networks. A multilevel proteomics approach was designed to quantify protein phosphorylation,

Chapter 1
12
acetylation and abundance in parallel. This study found that the ubiquitination cascade itself is targeted by several phosphorylation events in the DDR (17). In summary, proteomics contributed enormously to our understanding of the complex signalling events in the DDR and the prospect of multilevel PTM proteomics studies will further unravel these elaborate networks (19, 20).
Transcriptomics
The cellular outcome of DNA damage signalling is for a large part determined by transcriptional programs controlled by key effector proteins, including the transcription factor p53 (Figure 1). Transcriptional reprogramming is essential for the execution and outcome of DDR signalling, e.g. transient cell cycle arrest, senescence or apoptosis. Microarray technology has significantly enhanced our understanding of the transcriptional response associated with DNA damage. Many microarray-based transcriptomics studies have been published to date in which cells/organisms were exposed to DNA damage. It is very difficult to compare results between studies and extract common transcriptional changes, because most of these studies were performed under completely different conditions, e.g. cell type/tissue, dose and time after treatment. Moreover, technical variation is induced by choice of microarray platform, normalization procedure and statistics. Based on all these microarray studies, we estimate that the expression of up to a few thousand genes is altered after DNA damage, depending on dose, agent, cell type, etc. Overall conclusions could be that besides p53 several additional transcription factors control gene expression after DNA damage and numerous cellular processes and pathways are controlled by the DDR at the transcriptional level (21, 22). Global gene expression profiling has been very informative to interpret the role of DNA damage in the complex processes of aging (23-25). Human accelerated aging syndromes and corresponding transgenic mouse models with specific DNA repair defects indicated a causal role of DNA damage in aging, which was based on age-related pathology and aging phenotypes at the cellular and tissue level (24, 26). Microarray analysis revealed that a large part of the transcriptome of naturally aged wild type mice was significantly overlapping with global gene expression profiles from accelerated aging mouse models with defects in transcription-coupled DNA repair. This indicates that transcription-blocking lesions are involved in establishing the aging transcriptional landscape. Moreover, these transcriptomics analyses revealed the presence of a DNA damage-triggered survival response, which includes suppression of the somato- (growth hormone and IGF1), lacto- and thyrotrophic hormonal axes and induction of e.g. the antioxidant defence. This response resembles the longevity-promoting response by dietary restriction as seen in transcriptomics, which is constitutive active in long-lived dwarf mutants. Subsequently, microarrays generated from cell cultures exposed to UV, which
General introduction
13
induces transcription-blocking lesions, mimicked these age-related gene expression profiles including the survival response, providing further molecular evidence that DNA damage contributes to aging. Although mRNAs are the most studied RNA molecules to date, it is becoming apparent that not-for-protein coding (non-coding) RNAs are abundantly present in cells, even more plentiful than mRNAs (27, 28). One of the best-studied classes of non-coding RNAs are microRNAs, which are small (∼22 nucleotides) endogenous non-coding RNAs that repress target gene expression by binding to complementary target sites mainly residing in 3′ UTRs, thereby predominantly inducing mRNA degradation (29). MicroRNA microarray technology identified several differentially regulated microRNAs in response to DNA-damaging agents (30-36). Based on microRNA array time series a hypothesis was postulated that in the DDR microRNAs act in between the fast PTM response and the relative slower gene transcriptional responses via promoter regulation (31, 37). Since a single microRNA can target hundreds of different mRNAs simultaneously, this observation could provide a mechanism to rapidly alter a complete gene expression program followed by more stable changes at the promoter. Subsequent evidence by microRNA arrays demonstrated that a significant part of all microRNA expression after DNA damage was controlled by ATM and its target KHSRP (38). Upon DNA damage, ATM phosphorylates KHSRP, which then binds specific primary microRNAs from the nuclear pool of primary microRNAs and accelerates their biogenesis into mature microRNAs. Thus, microRNAs in the DDR are likely effectors that quickly adapt gene expression programs. The transcription-independent mechanism of microRNA regulation provides a manner to transiently and rapidly alter gene expression upon DNA damage. Importantly, DNA damage responsive microRNAs are frequently misexpressed in human cancer, thereby modulating resistance to genotoxic chemotherapy (35, 36, 39, 40). Transcriptomics by NGS, also designated RNA sequencing, has identified an enormous amount of non-coding RNAs, both small and long originating from exonic, intronic and intergenic regions (41-47). The overt majority has unknown functions. Standard mRNA sequencing relies on enrichment of poly-adenylated transcripts followed by sequencing (Panel I, Box 1). Next to known mature and partially processed RNA species, sequence information also includes low abundant mRNAs, poly-adenylated long non-coding RNAs and the correct representation of splice variants originating from over 95% of the multi-exonic genes (48). Paired-end sequencing in which sequencing is performed from both ends of the cDNA fragments also detects gene fusion events (49) important for tumorigenesis (50-53). Small RNA sequencing relies on the enrichment of all RNA species smaller than ∼30 nucleotides (Panel II, Box 1). Sequence information not only detects microRNAs, but also their isoforms (isomiRs), not detectable by array technology. IsomiRs are sequence length modifications of the mature microRNA due to

Chapter 1
14
imprecise precursor cropping or dicing (54) or post-transcriptional addition of nucleotides to the 3′ end by specialized enzymes (55). Besides microRNAs, small RNA sequencing also detects thousands additional small RNAs of which most have unknown functions. Furthermore, specific protocols have been developed to sequence long non-coding RNAs (28), isolate chromatin-bound non-coding RNAs (47), strand-specific sequencing to identify antisense transcripts (56) or nascent RNA (57, 58) (Figure 2). Currently, only few mRNA or small RNA transcriptomics studies by NGS in relation to the DDR have been published (59-64) in which the data analysis was mainly focussed on mRNAs or mature microRNAs. RNA sequencing identified several long non-coding RNAs that participate in the p53 response by regulating cell cycle arrest and apoptosis (65-68). In another study nascent RNA isolation followed by NGS was performed to monitor the global effect on RNA synthesis by camptothecin treatment, which inhibits topoisomerase I thereby blocking replication and transcription (69). Camptothecin primarily affected transcription elongation and withdrawal led to transcription resumption starting from the 5′-end of genes, while stalled RNA polymerases in gene bodies did not recover. Recovery of RNA synthesis was independent of CSB, an essential component of transcription-coupled repair (TCR), indicating that TCR is not involved in the repair of or RNA synthesis recovery from transcription-blocking Top1 lesions. One of the key advantages of NGS-based transcriptomics is direct sequence information. It was shown that DICER and DROSHA, components of the microRNA biogenesis pathway, are essential for the activation of the DDR at the transducer level. RNA products generated by DICER and DROSHA are required to restore DDR activation. NGS demonstrated that DDR activation requires DICER- and DROSHA-dependent small RNAs originating from the site of the double strand DNA break (70). Taken together, transcriptomics technologies have been extremely powerful in deciphering alterations in the transcriptome after DNA damage and provided several new insights in the DDR.
Genomics
NGS especially impacted DNA research in relation to the DDR. Although DNA microarrays have provided valuable information, NGS with the capacity to sequence the genome ∼37 times in 27 h data at nucleotide resolution (compared to hybridization-based microarray results) dramatically accelerated and quantitatively improved genome research associated with DNA damage (Figure 2, overview NGS technologies). One of the most frequently used applications of whole genome sequencing or exome sequencing, which only sequences known coding areas (71), is the identification of SNP/mutations associated with specific genetic traits or genetic diseases, which have been performed for numerous human diseases. Importantly, SNPs or defects in human DDR genes have been linked by these

General introduction
15
studies to e.g. accelerated ovarian aging (72), karyomegalic interstitial nephritis (73) and UV sensitivity syndrome, the last unresolved genetic disorder due to deficiency in nucleotide excision repair (74), linking defects in DDR factors to human age-related pathology.
Figure 2: Overview of next generation sequencing (NGS) methods. NGS protocols depicted above the dashed line have been developed to investigate DNA. Detection of DNA-protein (ChIP), DNA-DNA interactions or chromatin conformational changes (3C-sequencing or its derivatives). Nucleotide resolution-mapping of double strand breaks (BLESS). Whole genome sequencing (DNA-seq) or only protein-coding regions of the genome (exome sequencing). NGS protocols below the dashed line have been developed to investigate RNA. RNA-protein interactions by immunoprecipitation of proteins followed by RNA-sequencing (RIP). Protocols that sequence RNA enriched for poly-adenylated transcripts or small RNAs. Protocols for nascent RNA sequencing (GRO/NET/TIF). Ribosomal RNA-depleted total RNA sequencing (RNAome).
Evidently, somatic genomic aberrations due to DNA damage, e.g. mutations and chromosomal rearrangements, can be resolved by NGS at nucleotide resolution. Although this appears logical, this approach is met with technical limitations due to the random and infrequent nature of somatic mutations that cannot be separated from sequencing errors. These complications were overcome by performing a sophisticated single cell sequencing approach that rules out these errors and correctly calls somatic mutations by ENU in the Drosophila genome (75). One potential complication of single cell and single DNA sequencing may be the fact that

Chapter 1
16
damages may be present in the original DNA molecule, which cause de novo mutations in the sequencing protocol. In addition to mutations, DNA rearrangements are also often masked. This was improved by Strand-seq (76), a single-cell sequencing technique that sequences the original parental DNA template strands in daughter cells following cell division. Both single-cell-sequencing techniques will be very useful in determining mutation frequencies of genotoxic compounds, in cancer samples and during aging. Next to monitoring genetic aberrations, genomics protocols are valuable tools to study basic DDR biology. Specialized NGS methods, chromosome conformation capture sequencing (or its derivatives), analyse nuclear architecture, nucleosome positioning or the 3D chromosomal interaction landscape (77). This sequencing technique has been used to examine whether chromosomal translocations in human cancer originate from selection of random translocations, targeted DNA damage or frequent interactions between translocation partners (78). While location and frequency of recurrent translocations, including those driving B-cell malignancies, is due to targeted DNA break formation, nuclear organization was identified as the main driver in non-targeted rearrangements (78). Another application of chromosome conformation capture sequencing examined distant enhancer elements of the central DDR transcription factor p53, which drives transcriptional programs triggering cell cycle arrest and in a later stage apoptosis or cellular senescence. Genome-wide p53-binding sites were found located far from any known p53 target gene. Chromosome conformation capture sequencing discovered that these p53-bound enhancer regions interact intra-chromosomally with multiple neighbouring genes to convey long-distance p53-dependent transcription regulation. Moreover, these regions produced p53-dependent enhancer RNAs that are short RNAs (200–1000 nucleotide long) required for efficient transcription of target genes (79). These results illustrate the complexity of the DDR in the context of genomic DNA. Chromatin immunoprecipitation coupled to NGS, ChIPSeq in short, maps DNA–protein interactions at nucleotide resolution. Using an inducible double strand DNA break (DSB) system, the chromatin landscape of γH2AX around the DSB was mapped and its spreading properties along the damaged chromosome (80, 81). Since chromatin remodelling is essential for a proper DDR, this technology could provide complete chromatin maps from the sites of DNA damage. ChIPSeq is often used to map transcription factor binding sites. ChIPSeq provided a genome-wide profile of p53-binding sites, which revealed stimulus-specific functions of p53 during differentiation and DNA damage (82). ChIPSeq was also used to map single strand DNA by targeting Rad52 in fission yeast, which binds to single strand DNA formed at DNA lesions (83). This method was applied to identify DNA damage sites in the genome.

General introduction
17
Direct detection of DNA damage and mapping its genomic location could be applied to identify hotspots for DNA damage and analyse at which locations DNA repair is most (in)effective. These approaches in ChipSeq are often hampered or limited by the choice of protein and quality of the antibody. Recently, a method has been developed that directly labels DSBs in situ with a linker followed by isolation and NGS (84). This approach named BLESS (direct in situ breaks labelling, enrichment on streptavidin and next-generation sequencing) maps DSBs at nucleotide resolution. Replication stress-induced DSBs by aphidicolin in human cells identified more than 2000 fragile regions that were overrepresented with genes, satellite repeats and frequently rearranged regions found in human cancer. In toto, genomics approaches by NGS constitute important tools to monitor DDR processes at unprecedented nucleotide resolution.

Chapter 1
18
19
Aims of the thesis
For-protein-coding RNA molecules, mRNAs, are the best-studied RNA species to date. Gene expression profiles after DNA damage using microarray technology have been frequently documented in literature. It is becoming clear however, that non-coding RNAs are more abundantly present in cells than mRNAs (27, 28). Among all non-coding RNAs, microRNAs are one of the best-studied classes of non-coding RNAs. MicroRNAs are small (~22 nucleotides), endogenous non-coding RNAs that repress mRNA expression by inducing mRNA degradation and to a lesser extent via translation inhibition (29). MicroRNA microarray technology identified several differentially regulated microRNAs in response to genotoxic stress (30-36). DNA damage responsive microRNAs are frequently misexpressed in human cancer thereby, e.g. dysregulating cell cycle checkpoints or modulating resistance to genotoxic chemotherapy, indicating their importance in disease (35, 36, 39, 40). Based on microRNA array time series a hypothesis was postulated that in the DNA damage response microRNAs act in between the fast response by post-translational modifications of proteins and the relatively slower gene transcriptional response via promoter regulation (31, 37). Since a single microRNA can target hundreds of different mRNAs simultaneously, this observation could provide a mechanism to rapidly alter a complete gene expression program followed by more stable changes at the promoter. Genotoxic agents are an important class of carcinogenic compounds. In order to reduce rodent assays for carcinogenic properties of compounds, which are also laborious, expensive and imply animal use, we aimed to employ microarray technology to investigate whether mRNA and/or microRNA expression profiles could identify classifiers that predict genotoxic and/or carcinogenic potential of compounds. Chemicals, before entering the market, need to be thoroughly screened for carcinogenic (and other hazardous) properties to protect society and the environment. In chapter 2 we performed a short-term mouse exposure study followed by gene and microRNA expression profiling to test the predictive potential of both microRNA and mRNA expression alterations in vivo. In chapter 3, a large-scale time-resolved in vitro exposure study using genotoxic carcinogens, non-genotoxic carcinogens and oxidative compounds was performed to determine the predictive potential of microRNA expression in carcinogenic hazard prediction. The emergence of next generation sequencing applied to transcriptomics, also designated RNA sequencing, has identified an enormous amount of previously unknown non-coding RNAs (41-47). Currently, only few mRNA or small RNA transcriptomics studies by NGS in relation to the DDR have been published (59-64).

20
These studies were mainly focussed on a single time point or treatment, and either sequenced mRNAs or mature microRNAs. In chapter 4 we performed an elaborate RNA sequencing study in which mES cells exposed to equitoxic doses of UVC, IR and cisplatin were used. We analysed both mRNA and microRNA expression in time (4, 8 and 12h) after exposure and focussed on RNA expression kinetics. Standard mRNA and small RNA sequencing protocols rely on enrichment of specific RNA classes, poly-adenylated transcripts in mRNA sequencing and size selection in small RNA sequencing. In chapter 5 we designed a sequencing method that does not rely on class selection for RNA sequencing. This method monitors all RNA species, large and small, coding and non-coding, in a single sequence run thereby quantitatively preserving all RNA classes, allowing cross-class comparisons. Chapter 6 discusses the findings of these studies and provides directions for future research.

Chapter 2
In vivo murine hepatic microRNA and mRNA expression signatures predicting the (non-)genotoxic carcinogenic
potential of chemicals
Joost P. M. Melis*, Kasper W. J. Derks*, Tessa E. Pronk, Paul Wackers, Mirjam M. Schaap, Edwin Zwart,
Wilfred F. J. van IJcken, Martijs J. Jonker, Timo M. Breit, Joris Pothof, Harry van Steeg, Mirjam Luijten
Arch Toxicol. 2014 Apr;88(4):1023-34.
* contributed equally to this work.

Chapter 2
22
Abstract
There is a high need to improve the assessment of, especially non-genotoxic, carcinogenic features of chemicals. We therefore explored a toxicogenomics-based approach using genome-wide microRNA and mRNA expression profiles upon short-term exposure in mice. For this, wild-type mice were exposed for seven days to three different classes of chemicals, i.e., four genotoxic carcinogens (GTXC), seven non-genotoxic carcinogens (NGTXC), and five toxic non-carcinogens. Hepatic expression patterns of mRNA and microRNA transcripts were determined after exposure and used to assess the discriminative power of the in vivo transcriptome for GTXC and NGTXC. A final classifier set, discriminative for GTXC and NGTXC, was generated from the transcriptomic data using a tiered approach. This appeared to be a valid approach, since the predictive power of the final classifier set in three different classifier algorithms was very high for the original training set of chemicals. Subsequent validation in an additional set of chemicals revealed that the predictive power for GTXC remained high, in contrast to NGTXC, which appeared to be more troublesome. Our study demonstrated that the in vivo microRNA-ome has less discriminative power to correctly identify (non-)genotoxic carcinogen classes. The results generally indicate that single mRNA transcripts do have the potential to be applied in risk assessment, but that additional (genomic) strategies are necessary to correctly predict the non-genotoxic carcinogenic potential of a chemical.
MicroRNA and mRNA signatures for in vivo carcinogen classification
23
Introduction
Cancer is currently the leading cause of death in the Western world. Reasons for this high frequency in Western countries can mainly be attributed to lifestyle and environmental factors, which are thought to enhance abnormalities in the (epi)genetic material of cells and thereby facilitating the cancer process (85). Genotoxic carcinogens are a class of cancer-facilitating substances that share the commonality of causing DNA damage and, hence, interfere with DNA replication, transcription of genes, or the functionality of proteins. These genotoxic effects are considered part of the tumour initiation process and increase the risk of carcinogenesis. Other chemicals that are able to induce cancer, but do not directly interact with DNA, are non-genotoxic carcinogens (86). These compounds are generally not directly involved in tumour initiation, but may induce tumour-promoting effects (86-88). To protect society and the environment from carcinogen exposure, chemicals are thoroughly screened before being marketed. Generally, each substance is initially subjected to several tests exploring its genotoxic potential. When a substance is considered to be genotoxic, based on the results from both in vitro and in vivo genotoxicity tests, plus if human exposure risk and/or production levels are high, the substance is subjected to long-term carcinogenicity rodent bioassays (89, 90). These long-term bioassays have various disadvantages, including being time-consuming, expensive, and requiring large numbers of animals. Furthermore, the use of chronic exposures to high doses may result in a high rate of false-positive results (91). Another pitfall of this testing strategy is a bias toward genotoxic carcinogen identification. The initial short-term in vitro and in vivo genotoxicity assays are designed to detect genotoxic potential, possibly leaving non-genotoxic carcinogens unidentified. This can result in a substantial risk for society and the environment (88). Alternative approaches are therefore needed to identify the carcinogenic potential of substances. To circumvent the aforementioned disadvantages in carcinogenicity testing, we set out to test the potential of microRNA and mRNA expression data, as a means for correct identification of (non-)genotoxic carcinogens, thereby providing a more ethical approach in terms of animal use and welfare in terms of reduction and refinement. Transcriptomics analyses have been shown to be a useful and informative contribution to the current carcinogenicity testing methods (87, 92-100). These studies have indicated that discriminative mRNA signatures after short-term exposure can, to a certain extent, be indicative for carcinogenic modes of action or predictive for the tumour endpoints after chronic exposure. Most of the large-scale in
Chapter 2
24
vivo studies have been performed in rats and often focussed on carcinogens with one target tissue, e.g., hepatocarcinogens. In the present study, we searched for molecular classifiers in expression profiles of murine liver generated upon a 7-day exposure to a genotoxic carcinogen (GTXC), non-genotoxic carcinogen (NGTXC), or a non-carcinogen (NC). We considered direct-acting chemicals or their reactive xenobiotic metabolites as GTXC. Indirect-acting genotoxic modes of action (e.g., induction of oxidative stress) were considered as NGTX modes of action. Four GTXC, seven NGTXC, and five NC were used for classifier selection. In addition to mRNA profiles, we also examined microRNA profiles to address the question whether microRNAs are a useful addition to such a set of classifiers. MicroRNAs can post-transcriptionally regulate up to 65% of the transcriptome and have a clear influence on cellular processes. To date, several specific microRNAs are overrepresented in cancerous tissues or specific tumour types or are responsive to DNA damage (101-105). However, the potential of microRNA transcripts as classifiers for carcinogen identification has not been investigated thoroughly. Our study generated a classifier set (set of transcripts that collectively can be used as classifier) that discriminated between GTXC, NGTXC, and NC toxicants with high accuracy upon verification in the original chemical set in a 7-day in vivo experimental setup. Validation of the classifier set in an additional chemical set demonstrated that predictive potential for GTXC remained high, but also showed that prediction of NGTXC potential requires additional (genomic) strategies. Moreover, in this short-term in vivo setup, microRNA appeared to be less discriminative than mRNA.
Materials and methods
Animals
Six-week-old male wild-type mice (C57BL/6J, n = 4 per group) were acclimated for two weeks and subsequently treated for seven days with a GTXC, NGTXC, or NC through feed, gavage, or i.p. injection. From the day of weaning, the health status of the mice was monitored daily and mice were weighed weekly starting at acclimation. Animals were kept in the same stringently controlled (specific pathogen-free, spf) environment, fed ad libitum, and kept under a normal day/night rhythm. After seven days of exposure, mice were killed at a fixed time of the day. During autopsy, several organs (including the liver) were isolated and stored according to protocol using RNAlater (Qiagen, Valencia, CA, USA).
In vivo short-term exposure studies
Details for all chemicals used in the short-term exposure studies are shown in Table

MicroRNA and mRNA signatures for in vivo carcinogen classification
25
1. For some of these chemicals, appropriate doses were based on previously performed 28-day dose-range finding (DRF) and mid-term studies [2-AAF, BaP, CSA, DEHP, DES, E2, PBB, res, Wy, D-man, DMBA, MMC (106-109). For new compounds, not tested by us before, we performed 28-day DRF studies prior to the toxicogenomic studies using an identical setup as previous performed studies mentioned above. In short for these DRF studies, six- to nine-week-old male C57BL/6J mice (n = 10 per group) were exposed to one of the selected chemicals, using multiple doses based on the literature or expert advice. Substances were administered through the feed (continuously), gavage (every other day), or i.p. injection (every third day). See Table 1 for the applied route of administration for each chemical. Body weights were monitored daily for the first 10 days and semi-weekly thereafter. If body weight changes were not conclusive to identify a suitable dose, the liver was studied macroscopically to determine a suitable sub-toxic dose that can be used for the short-term 7-day exposures (data not shown). An exposure time of 7 days was selected, based on previous results (96) in which full genome responses upon 3, 7, and 14 days of exposure to several GTXC, NGTXC, and NC were examined. Herein, 7-day exposures appeared to be a suitable time point to trigger exposure-related gene expression changes. In the subsequent 7-day exposure studies, dietary exposure was continuous during the experiment, application using i.p. injection occurred at day 0, 3, and 6 (autopsy on day 7), and exposure using gavage at day 0, 2, 4, and 6 (autopsy on day 7) (Table 1). Body weights were recorded during this 7-day exposure period. Comparison of different control groups (gavage, i.p. injection or feed) showed no significant differential effect at the transcriptional level (Luijten et al. in preparation). Hence, only food-administrated control samples were implemented in this study.
RNA isolation, mRNA, and microRNA expression profiling
Hepatic total RNA was isolated using the miRNeasy kit (Qiagen, Valencia, CA, USA) and the QIAcube (Qiagen, Valencia, CA, USA) according to the manufacturer’s instructions. All samples passed RNA quality control using capillary gel electrophoresis (RIN >7.6) (Bioanalyzer 2100; Agilent Technologies, Amstelveen, The Netherlands). Amplification, labelling, and hybridization protocols details were performed according to manufacturer’s protocols, using the Affymetrix Mouse Genome 430 2.0 Array platform (Affymetrix, Santa Clara, CA, USA). The same total RNA isolates as used for mRNA were used for isolation of microRNAs. MicroRNA profiling was performed as previously described (31).

Chapter 2
26
Table 1. Overview of chemicals and their details used for short-term exposures
Detailed information overview of chemicals used for exposure studies (column 1-6) and the number of differentially expressed transcripts (FDR<0.05) for mRNA (column 7) and microRNA (column 8) compared to controls. A. Chemicals used for classifier identification. B. Additional chemicals used in in the extended validation set. Solvent: * = sunflower oil, # = PBS, † = 1% v/v ethanol/0.5% methyl cellulose.
Arc
h T
ox
ico
l
1 3
28-d
ay
dose
-ran
ge
findin
g
(DR
F)
and
mid
-ter
m
stud-
ies
[2-A
AF,
BaP
, C
sA,
DE
HP,
DE
S,
E2,
PB
B,
Res
, W
Y,
D-m
an,
DM
BA
, M
MC
(v
an K
reij
l et
al
. 2001;
de
Vri
es
et a
l. 1
997;
Mel
is e
t al
. 2013a,
b)]
. F
or
new
com
pounds,
not
test
ed b
y u
s bef
ore
, w
e per
form
ed 2
8-d
ay D
RF
stu
die
s pri
or
to t
he
toxic
ogen
om
ic s
tudie
s usi
ng a
n i
den
tica
l se
tup
as p
revio
us
per
form
ed s
tudie
s m
enti
oned
above
(see
Sup-
ple
men
tal
Info
rmat
ion 1
for
DR
F s
tudie
s of
AF
B1,
CP
PD
, B
PA
, D
IDP,
SD
, T
BT
O,
AD
, C
CL
4,
DM
N,
TC
DD
, T
BA
, V
PA
). I
n s
hort
for
thes
e D
RF
stu
die
s, s
ix-
to n
ine-
wee
k-o
ld
mal
e C
57B
L/6
J m
ice
(n =
10 p
er g
roup)
wer
e ex
pose
d t
o
one
of
the
sele
cted
chem
ical
s, u
sing m
ult
iple
dose
s bas
ed
on t
he
lite
ratu
re o
r ex
per
t ad
vic
e. S
ubst
ance
s w
ere
adm
in-
iste
red
thro
ugh
the
feed
(c
onti
nuousl
y),
gav
age
(ever
y
oth
er d
ay),
or
i.p.
inje
ctio
n (
ever
y t
hir
d d
ay).
See
Tab
le 1
fo
r th
e ap
pli
ed r
oute
of
adm
inis
trat
ion f
or
each
chem
ical
.
Body w
eights
wer
e m
onit
ore
d d
aily
for
the
firs
t 10 d
ays
and s
emi-
wee
kly
ther
eaft
er (
see
Supple
men
tal
Info
rmat
ion
1).
If
body w
eight
chan
ges
wer
e not
concl
usi
ve
to i
den
-ti
fy a
suit
able
dose
, th
e li
ver
was
stu
die
d m
acro
scopic
ally
to
det
erm
ine
a su
itab
le s
ub-t
oxic
dose
that
can
be
use
d f
or
the
short
-ter
m 7
-day
exposu
res
(dat
a not
show
n).
An e
xpo
-su
re t
ime
of
7 d
ays
was
sel
ecte
d,
bas
ed o
n p
revio
us
resu
lts
(Jonker
et
al.
2009)
in w
hic
h f
ull
gen
om
e re
sponse
s upon
3,
7,
and 1
4 d
ays
of
exposu
re t
o s
ever
al G
TX
C,
NG
TX
C,
and N
C w
ere
exam
ined
. H
erei
n,
7-d
ay e
xposu
res
appea
red
to b
e a
suit
able
tim
e poin
t to
tri
gger
exposu
re-r
elat
ed g
ene
expre
ssio
n c
han
ges
. I
n t
he
subse
quen
t 7-d
ay e
xposu
re s
tudie
s, d
ieta
ry e
xpo-
sure
w
as
conti
nuous
duri
ng
the
exper
imen
t,
appli
cati
on
usi
ng i
.p.
inje
ctio
n o
ccurr
ed a
t day
0,
3,
and 6
(au
topsy
on d
ay 7
), a
nd e
xposu
re u
sing g
avag
e at
day
0,
2,
4,
and 6
Ta
ble
1
Over
vie
w o
f ch
emic
als
and
th
eir
det
ails
use
d f
or
sho
rt-t
erm
ex
po
sure
s
Det
aile
d i
nfo
rmat
ion
over
vie
w o
f ch
emic
als
use
d f
or
exp
osu
re s
tud
ies
(co
lum
n 1
–6
) an
d t
he
nu
mb
er o
f d
iffe
ren
tial
ly e
xp
ress
ed t
ran
scri
pts
(F
DR
<
0.0
5,
AN
OV
A)
for
mR
NA
(co
lum
n 7
) an
d m
icro
RN
A (
FD
R <
0.0
5,
t te
st w
ith
Ben
jam
ini–
Ho
chb
erg
co
rrec
tio
n)
(co
lum
n 8
) co
mp
ared
to
co
n-
tro
ls.
A.
Ch
emic
als
use
d f
or
clas
sifi
er i
den
tifi
cati
on
. B
. A
dd
itio
nal
ch
emic
als
use
d i
n t
he
exte
nd
ed v
alid
atio
n s
et.
So
lven
t: a
sun
flow
er o
il,
b P
BS
, c
1 %
v/v
eth
ano
l/0
.5 %
met
hy
l ce
llu
lose
Ch
emic
alC
AS
no
.A
bb
rev
iati
on
Cla
ssS
elec
ted
do
seR
ou
teD
EG
sD
Em
iRs
A 2-A
cety
lam
ino
flu
ore
ne
53
-96
-32
-AA
FG
TX
C3
00
pp
mF
eed
50
28
2
Afl
ato
xin
B1
11
62
-65
-8A
FB
1G
TX
C1
pp
mF
eed
23
82
1
Ben
zo[a
]py
ren
e5
0-3
2-8
BaP
GT
XC
13
mg
/kg
bw
Gav
age
a4
93
5
Cis
pla
tin
15
66
3-2
7-1
CP
PD
GT
XC
0.6
mg
/kg
bw
i.p
. in
ject
ion
b5
11
15
7
17
β-
Est
rad
iol
50
-28
-2E
2N
GT
XC
5 m
g/k
g b
wG
avag
ec
13
95
0
Cy
clo
spo
rin
A5
98
65
-13
-3C
sAN
GT
XC
50
0 p
pm
Fee
d2
,04
34
8
Di(
2-e
thy
lhex
yl)
ph
thal
ate
11
7-8
1-7
DE
HP
NG
TX
C6
,00
0 p
pm
Fee
d2
,63
97
4
Die
thy
lsti
lbes
tro
l5
6-5
3-1
DE
SN
GT
XC
1.5
pp
mF
eed
65
14
0
Ph
eno
bar
bit
al5
7-3
0-7
PB
BN
GT
XC
1,5
00
pp
mF
eed
3,5
26
12
Res
erp
ine
50
-55
-5R
esN
GT
XC
5 p
pm
Fee
d8
52
8
Wy
eth
-14
,64
35
08
92
-23
-4W
YN
GT
XC
25
0 p
pm
Fee
d8
,43
61
24
Bis
ph
eno
l A
80
-05
-7B
PA
NC
5,0
00
pp
mF
eed
26
5
Dii
sod
ecy
l p
hth
alat
e2
67
61
-40
-0D
IDP
NC
2,5
00
pp
mF
eed
19
47
9
D-M
ann
ito
l6
9-6
5-8
D-m
anN
C5
0,0
00
pp
mF
eed
04
8
So
diu
m d
iclo
fen
ac1
53
07
-79
-6S
DN
C2
5 p
pm
Fee
d3
56
2
Tri
bu
tyl-
tin
-ox
ide
56
-35
-9T
BT
ON
C2
00
pp
mF
eed
2,4
97
23
Ch
emic
alC
AS
no
.A
bb
rev
iati
on
Cla
ssS
elec
ted
do
seR
ou
te
B 7,1
2-D
imet
hy
lben
z[α
]an
thra
cen
e5
7-9
7-6
DM
BA
GT
XC
10
0 u
gG
avag
ea
Dim
ethy
lnit
rosa
min
e6
2-7
5-9
DM
NG
TX
C0
.17
mg
/kg
bw
Gav
ageb
Mit
om
yci
n C
50
-07
-7M
MC
GT
XC
0.0
01
mg
/kg
bw
i.p
. in
ject
ion
c
Car
bo
n t
etra
chlo
rid
e5
6-2
3-5
CC
L4
NG
TX
C5
00
mg
/kg
bw
Gav
agea
2,3
,7,8
-Tet
rach
loro
dib
enzo
dio
xin
17
46
-01
-6T
CD
DN
GT
XC
0.7
5 m
g/k
g b
wG
avag
ea
Am
iod
aro
ne
19
51
-25
-3A
DN
C5
00
pp
mF
eed
To
lbu
tam
ide
64
-77
-7T
BA
NC
6,2
50
pp
mF
eed
Val
pro
ic a
cid
99
-66
-1V
PA
NC
10
0 m
g/k
g b
wG
avag
eb

MicroRNA and mRNA signatures for in vivo carcinogen classification
27
Transcriptomics analyses
Quality control and correction of significant hybridization and experimental blocking effects, normalization, annotation, and subsequent data analysis were performed as previously described (110). In short, all raw data passed the quality criteria, but relevant effects of labelling batches were detected. The raw data were annotated [according to (111)] and normalized using the robust multi-array average (RMA) algorithm [Affy package, version 1.22.0 (112), available from the Bioconductor project (http://www.bioconductor.org) for the R statistical language (http://cran.r-project.org)]. The data were corrected for labelling batch effects using a linear model with group-means parameterization and labelling batch (random). The normalized data were statistically analysed for differential gene expression using a mixed linear model with coefficients for block (random) and each experimental group (fixed) (113, 114). False discovery rate (FDR) correction was performed globally across all contrasts [according to (115)]. Only annotated Entrez genes were used for further analysis. Functional genomics analyses, using the top 1000 FDR-ranked genes, were performed using Metacore GeneGO pathway analyses (version 6.11 build 41105, GeneGo Inc. St. Joseph, MI, USA), to assess the biological response upon each chemical exposure. Results were clustered by hand into more general functionalities for representation purposes (Table 2). The raw microRNA data were normalized using quantile normalization. For the CSA-, Wy-, and CPPD- exposed groups, quality control discarded one outlier per group. Normalized values were analysed for differentially expressed microRNAs using a linear model [bioconductor package Limma; (113)] and corrected for multiple testing (116). The transcriptomic results are deposited at the NCBI Gene expression Omnibus: GSe43847 (microRNA) and GSe43977 (mRNA).
Classification analyses
A tiered approach was used to derive a final classifier set (Figure 1). Software-based algorithms K-nearest neighbour (KNN), prediction analysis for microarrays (PAM-r), and random forest (RF) were applied using the mRNA and microRNA transcriptome separately as input (Figure 1). The R implementation used for these methods can be found in R-packages ‘class,’ ‘pamr,’ and ‘randomForest,’ respectively. We used a 2-step approach to generate classifiers to discriminate between genotoxic (GTXC), non-genotoxic (NGTXC), and non-carcinogens (NC). In the first step, classifiers are generated to discriminate the GTXC from the other two classes, and in the second step, classifiers for identification of NGTXC are retrieved. Since the number of chemicals within each class was unbalanced and it is well-known that the KNN and PAM-r algorithms tend to create a bias toward classification of unknown compounds to the larger group, we adapted the scripts for the cross-validations in such a way that the group sizes within the training set were as large as possible but balanced.

Chapter 2
28
This resulted in group sizes that comprised all but one of the compounds of the smaller group, and one additional compound to that number for the larger group. For example, a classifier set to identify 2-AAF (as a genotoxicant) is generated by training on the three other GTXC and four compounds from the rest class (a combination of NGTXC and NC). To select biomarkers for KNN and PAM-r, we performed a 100-fold cross-validation, each time with such a balanced training set (Figure 1). For RF, this was not necessary, as the difference in class probabilities can be accounted for by setting the cut-off parameter. For RF, we used a simple leave-one-compound-out fold scheme. For each fold of the cross- validation, the classifiers were ranked according to the algorithm’s features selection (e.g., shrunken centroid distance for PAM-r, calculated importance for RF and p value based on a t statistics for KNN). Different lengths of lists of ranked features were tested, and only those genes from the list that gave the lowest error on classification of the unseen compounds in the fold were selected as potential classifier. As some folds used up to the whole array for the best result, we limited those lists to the top 100 highest ranked genes. Each algorithm therefore yielded per fold top 100 (or less) lists for the GTXC versus the rest analysis and top 100 (or less) lists for the NGTXC versus NC analysis. For classifier selection (Figure 1), we first analysed per algorithm how many times a transcript was present within those generated top 100 lists. To prevent inclusion of false positives, transcripts were only considered for further selection into the classifier if they were present in more than 10% of the top 100 cross-validation lists and a top-ranked (TR) classifier set was generated consisting of transcripts that were yielded most often within the cross-validations per algorithm (ranked from most abundant to minimally >10%). The three (KNN, PAM-r, and RF) generated TR-classifier sets were subsequently screened for overlap. This overlapping top-ranked (OTR) classifier set was then ranked based on an OTR score (the sum of percentages that a transcript was present in the cross-validations in each algorithm, e.g., KNN 25%, PAM-r 50%, RF 15% yields an OTR score of 90). As a final step in the classifier selection, we subsequently checked the generated OTR classifier set for usability implementing a class average fold-change threshold of −1.5 < Fc > 1.5 (Figure 1). This final classifier set was firstly verified using the same three algorithms RF, KNN, and PAM-r and previous settings to measure predictive potential in the total training set and subsequently validated in an additional validation set of chemicals (Figure 1). In these verification and validation steps, a chemical was assigned to a certain class, when the majority of the algorithms (two out of three) predicted this class.

MicroRNA and mRNA signatures for in vivo carcinogen classification
29
Table 2. Clustered and categorized Metacore GeneGO pathway responses upon 7-day exposure.
Arc
h T
oxic
ol
1 3
As
som
e fo
lds
used
up
to t
he w
hole
arr
ay f
or t
he b
est
resu
lt,
we
lim
ited
tho
se l
ists
to
the
top
100
high
est
rank
ed
gene
s. E
ach
algo
rith
m t
here
fore
yie
lded
per
fol
d to
p 10
0 (o
r le
ss)
list
s fo
r th
e G
TX
C v
ersu
s th
e R
est
anal
ysis
and
to
p 10
0 (o
r le
ss)
list
s fo
r th
e N
GT
XC
ver
sus
NC
ana
lysi
s.
For
cla
ssifi
er s
elec
tion
(F
ig.
1),
we
firs
t an
alyz
ed p
er a
lgo-
rith
m h
ow m
any
tim
es a
tra
nscr
ipt
was
pre
sent
wit
hin
thos
e ge
nera
ted
top
100
list
s. T
o pr
even
t in
clus
ion
of f
alse
pos
i-ti
ves,
tra
nscr
ipts
wer
e on
ly c
onsi
dere
d fo
r fu
rthe
r se
lec-
tion
int
o th
e cl
assi
fier
if
they
wer
e pr
esen
t in
mor
e th
an
10 %
of
the
top
100
cros
s-va
lida
tion
lis
ts a
nd a
top
-ran
ked
(TR
) cl
assi
fier
set
was
gen
erat
ed c
onsi
stin
g of
tra
nscr
ipts
th
at w
ere
yiel
ded
mos
t of
ten
wit
hin
the
cros
s-va
lida
tion
s pe
r al
gori
thm
(ra
nked
fro
m m
ost
abun
dant
to
min
imal
ly
>10
%)
(Sup
plem
enta
l In
form
atio
n 5,
Tab
les
1 an
d 2)
. T
he t
hree
(K
NN
, PA
M-R
, an
d R
F)
gene
rate
d T
R-c
lass
ifier
se
ts w
ere
subs
eque
ntly
scr
eene
d fo
r ov
erla
p. T
his
over
lap-
ping
top
-ran
ked
(OT
R,
see
Sup
plem
enta
l In
form
atio
n 5,
T
able
s 3
and
4 fo
r th
e co
mpl
ete
list
) cl
assi
fier
set
was
the
n ra
nked
bas
ed o
n an
OT
R s
core
(th
e su
m o
f pe
rcen
tage
s th
at
a tr
ansc
ript
was
pre
sent
in
the
cros
s-va
lida
tion
s in
eac
h al
gori
thm
, e.
g.,
KN
N 2
5 %
, PA
M-R
50
%,
RF
15
% y
ield
s
an O
TR
sco
re o
f 90
). A
s a
fina
l st
ep i
n th
e cl
assi
fier
sel
ec-
tion
, we
subs
eque
ntly
che
cked
the
gen
erat
ed O
TR
cla
ssifi
er
set
for
usab
ilit
y im
plem
enti
ng a
cla
ss a
vera
ge f
old-
chan
ge
thre
shol
d of
−1.
5 <
FC
> 1
.5 (
Fig
. 1)
. T
his
fina
l cl
assi
fier
se
t w
as fi
rstl
y ve
rifi
ed u
sing
the
sam
e th
ree
algo
rith
ms
RF,
K
NN
, and
PA
M-R
and
pre
viou
s se
ttin
gs t
o m
easu
re p
redi
c-ti
ve p
oten
tial
in
the
tota
l tr
aini
ng s
et a
nd s
ubse
quen
tly
vali
-da
ted
in a
n ad
diti
onal
val
idat
ion
set
of c
hem
ical
s (F
ig.
1).
In t
hese
ver
ifica
tion
and
val
idat
ion
step
s, a
che
mic
al w
as
assi
gned
to
a ce
rtai
n cl
ass,
whe
n th
e m
ajor
ity
of t
he a
lgo-
rith
ms
(tw
o ou
t of
thr
ee)
pred
icte
d th
is c
lass
.
Res
ult
s
Sho
rt-t
erm
in
vivo
exp
osur
e st
udie
s
The
goa
l of
thi
s st
udy
was
to
expl
ore
the
pote
ntia
l of
bot
h m
icro
RN
A a
nd m
RN
A t
rans
crip
ts a
s m
olec
ular
dis
crim
i-na
tors
fo
r cl
assi
fica
tion
of
(n
on-)
geno
toxi
c ca
rcin
ogen
s.
Tra
nscr
ipts
, al
one
or p
art
of a
cla
ssifi
er s
et,
shou
ld i
deal
ly
be a
ble
to c
orre
ctly
dis
crim
inat
e be
twee
n th
ree
diff
eren
t
Tab
le 2
C
lust
ered
and
cat
egor
ized
Met
acor
e G
eneG
O p
athw
ay r
espo
nses
upo
n 7-
day
expo
sure
Che
mic
alC
lass
Clu
ster
ed c
ateg
oriz
ed M
etac
ore
Gen
eGO
pat
hway
res
pons
es
2-A
AF
GT
XC
Apo
ptos
isD
NA
dam
age/
P53
Imm
une
resp
onse
AF
B1
GT
XC
Apo
ptos
isD
NA
dam
age/
P53
Imm
une
resp
onse
Dev
elop
men
t
BaP
GT
XC
Apo
ptos
isC
ytos
kele
ton
rem
odel
ing
CP
PD
GT
XC
Apo
ptos
isP
TE
N r
espo
nse
E2
NG
TX
CIm
mun
e re
spon
seR
OS
res
pons
e
CsA
NG
TX
CL
ipid
/fat
ty a
cid
met
abol
ism
Cho
lest
erol
bi
osyn
thes
is
DE
HP
NG
TX
CIm
mun
e re
spon
seL
ipid
/fat
ty a
cid
met
abol
ism
Mit
ocho
dria
l be
ta-o
xida
tion
DE
SN
GT
XC
Imm
une
resp
onse
Lip
id/f
atty
aci
d m
etab
olis
mO
xida
tive
pho
s-ph
oryl
atio
n
PB
BN
GT
XC
Cel
l cy
cle
DN
A d
amag
eIm
mun
e re
spon
seL
ipid
/fat
ty a
cid
met
abol
ism
Res
NG
TX
CA
popt
osis
Lip
id/f
atty
aci
d m
etab
olis
m
WY
NG
TX
CC
ell
cycl
eIm
mun
e re
spon
seL
ipid
/fat
ty a
cid
met
abol
ism
BPA
NC
Lip
id/f
atty
aci
d m
etab
olis
mC
ytos
kele
ton
rem
odel
ing
DID
PN
CL
ipid
/fat
ty a
cid
met
abol
ism
Oxi
dati
ve p
hos-
phor
ylat
ion
D-m
anN
CIm
mun
e re
spon
seC
ytos
kele
ton
rem
odel
ing
SD
NC
Imm
une
resp
onse
Cel
l ad
hesi
on
TB
TO
NC
Imm
une
resp
onse
Lip
id/f
atty
aci
d m
etab
olis
mG
luta
thio
ne
met
abol
ism
Chapter 2
30
Results
Short-term in vivo exposure studies
The goal of this study was to explore the potential of both microRNA and mRNA transcripts as molecular discriminators for classification of (non-)genotoxic carcinogens. Transcripts, alone or part of a classifier set, should ideally be able to correctly discriminate between three different chemical classes (GTXC, NGTXC, and NC). Wild-type male mice were therefore exposed to one of the sixteen tested chemicals, as depicted in Table 1a (four GTXC, seven NGTXC, and five NC). Concurrently, a control (untreated) study was performed. We included various GTXC and NGTXC with different carcinogenic potencies and/or carcinogenic modes of actions. To possibly extract more robustly performing classifier transcripts, we also included NC which mimic a mode of action of one of the included NGTXC: DIDP and DEHP are both phthalates, BPA, E2, and DES are ER-α ligands, and TBTO and CSA are immune suppressive substances. During the 7-day exposure period, body weights were monitored. Control groups exhibited, on average, a 3% increase in body weight (calculated for the actual exposure period from day 0 to day 7). Exposure to TBTO, CSA, and E2 resulted in a slight decrease (>1%) in body weight compared to the start of the exposure of, respectively, 5, 4, and 3%. The remainder of the exposures led to an increased or steady (increase or decrease <1%) body weight during the treatment. no gross macroscopic injurious lesions were found at necropsy in exposed livers, apart from all Wy-exposed mice, which exhibited yellow-spotted livers. This was possibly caused by fat deposits, a common finding upon Wyeth-14.643 exposure (NTP, http://ntp.niehs.nih.gov/ntp/htdocs/ST_rpts/tox062.pdf).
Functional genomics analyses confirm modes of action of chemical exposures
From an identical patch of the liver, mRNA and microRNA profiles were generated for each of the sixteen exposed groups as well as the control group. To assess whether the transcriptional response to each exposure was comparable to the described chemical modes of actions and properties in the literature, functional genomics analyses were performed using Metacore software (see “Materials and method”). For this, the top 1,000 of most significantly regulated genes (ranked on FDR, compared to the untreated samples) for each chemical were used as input. Clustered categorized functional responses for all exposures are shown in Table 2 (Metacore GeneGO overrepresentation pathway map analysis, FDR <0.05). For
MicroRNA and mRNA signatures for in vivo carcinogen classification
31
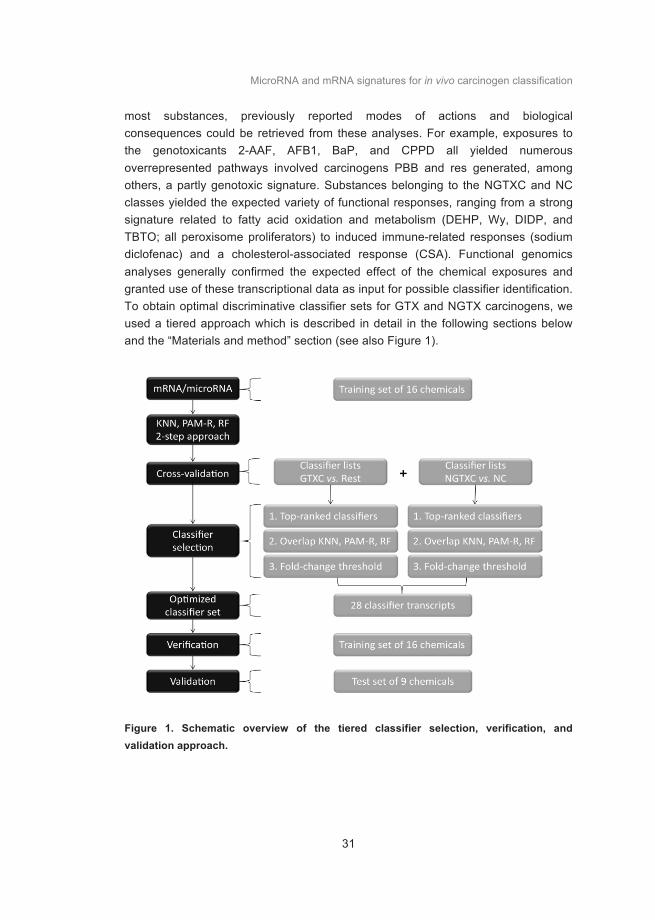
most substances, previously reported modes of actions and biological consequences could be retrieved from these analyses. For example, exposures to the genotoxicants 2-AAF, AFB1, BaP, and CPPD all yielded numerous overrepresented pathways involved carcinogens PBB and res generated, among others, a partly genotoxic signature. Substances belonging to the NGTXC and NC classes yielded the expected variety of functional responses, ranging from a strong signature related to fatty acid oxidation and metabolism (DEHP, Wy, DIDP, and TBTO; all peroxisome proliferators) to induced immune-related responses (sodium diclofenac) and a cholesterol-associated response (CSA). Functional genomics analyses generally confirmed the expected effect of the chemical exposures and granted use of these transcriptional data as input for possible classifier identification. To obtain optimal discriminative classifier sets for GTX and NGTX carcinogens, we used a tiered approach which is described in detail in the following sections below and the “Materials and method” section (see also Figure 1).
Figure 1. Schematic overview of the tiered classifier selection, verification, and validation approach.
Chapter 2
32
Discriminative classifier selection for GTX and NGTX carcinogens
To obtain predictive classifier sets from the combined mRNA and microRNA transcriptome, we employed different software-based classification algorithms (Figure 1). We used three different algorithms to avoid favouring a certain feature selection: K-nearest neighbour (KNN), predictive analysis of microarray (PAM-r), and random forest (RF). KNN is a non-parametric method for classifying objects based on closest training examples in the feature space, whereas PAM-r performs sample classification from gene expression data using the nearest shrunken centroid method. RF selects features randomly in order to construct a collection of decision trees with controlled variation. Based on the results of previous classification studies (96), we selected a 2-step classification approach for our current study. In the first step, a classifier set is generated to separate GTXC from the other two classes (rest = NGTXC and NC); the second step yields a classifier set to discriminate between NGTXC and NC. This 2-step approach was performed for each of the three algorithms (Figure 1) using a 100-fold cross-validation and subsequent classifier selection (see “Materials and method” for details). Herein, each ‘fold’ yields a classifier set for a selected test compound. The cross-validation for both the GTXC versus rest and NGTXC versus NC steps resulted in classifier lists that were subsequently ranked according to the feature selection of the particular algorithm. The top 100 of transcripts was selected per list. These transcript lists were then used for further classifier selection (Figure 1). Within the GTXC versus rest and the NGTXC versus NC steps, for each algorithm, we analysed and ranked the transcripts according to how many times a transcript was present within the 100-fold generated top 100 lists. For each algorithm, top-ranked (TR) classifier sets were created, consisting of transcripts that were present most abundantly over the 100 lists (with a minimum of 10% of the lists to avoid false-positive classifiers) (Figure 1). The TR-classifier sets for KNN, PAM-r, and RF were subsequently screened for overlap, yielding an overlapping top-ranked (OTR) classifier set [Figure 1]. The OTR-classifier sets contain the most abundantly yielded transcripts for all the generated TR-classifier sets over the three algorithms and thereby include the transcripts that most strongly influence classification. We subsequently increased the robustness of the generated OTR-classifier set by implementing an additional class average fold-change threshold of −1.5 < Fc > 1.5 (Figure 1). The class average fold change is the average fold change of a transcript of all chemical exposures of a certain class (GTXC, NGTXC, NC) (columns 1–3, Figure 2). One of the GTXC-specific classifiers following these requirements was Cyp1a2, which is well-known to be involved in the metabolism of several groups of xenobiotics and not only GTXC.

MicroRNA and mRNA signatures for in vivo carcinogen classification
33
Figure 2. Heatmap of fold-change values of the 27 (mRNA) transcripts of the final optimized classifier set distinguishing GTXC, NGTXC, and NC upon 7-day in vivo exposure. column numbers are depicted below. The heatmap, and row numbers at the left side. columns 1–3 represent average fold-change values per class. columns 4–19 represent fold-change values per chemical indicated at the top of the column. Upon classifier selection,
transcripts 1–20 are considered GTXC-specific classifiers (1–13 upregulated, 14–20 downregulated) and transcripts 21–28 are NGTXC classifiers (21–24 upregulated, 25–28 downregulated).
Arch Toxicol
1 3
partly) discriminate the classes from each other, microRNA transcripts in this short-term in vivo setup appear to be less suitable for carcinogen discrimination. We therefore pursued validation only using the strongest (mRNA) transcripts we generated upon initial analyses (Fig. 2).
Verification and validation of classifier set in original and additional chemical set
The final classifier set, consisting of nineteen GTXC-specific and eight NGTXC-specific mRNA transcripts,
was selected based on the combined outcome of three dif-ferent software-based classification tools (Supplemental Information 6). As such, the performance of this ultimate set was yet unknown. Although the classification will tend to be overoptimistic because the total training set itself was used to determine the final classifier set, classifying the training set with the selected classifier set will give an indication of the maximal possible classification accuracy of this set of chemicals (we will later validate this accu-racy). We calculated the overall predictive accuracy by again applying a 2-step approach using the KNN, PAM-R,
Fig. 2 Heatmap of fold-change values of the 27 (mRNA) transcripts of the final optimized classifier set distinguishing GTXC, NGTXC, and NC upon 7-day in vivo exposure. Column numbers are depicted below the heatmap, and row numbers at the left side. Columns 1–3 represent average fold-change values per class. Columns 4–19 represent fold-change values per chemical indicated at the top of the column. Upon classifier selection, transcripts 1–20 are considered GTXC-specific clas-sifiers (1–13 upregulated, 14–20 downregulated) and transcripts 21–28 are NGTXC classifiers (21–24 upregulated, 25–28 downregulated)
GTX
C
NG
TXC
NC
2-AA
F
AFB1
BaP
CPP
D
E2 CsA
DEH
P
DES
PBB
Res
WY
BPA
DID
P
DM
an
SD TBTO
4931408D14Rik
Tiam2
Nr4a1
Cyp1a2
9630026M06Rik
Gys2
LOC75771
Id2
Nr1d2
Phf17
Grp146
Il1a
4930406D14Rik
Creld2
Nedd4l
Ihpk2
2310076L09Rik
Zbtb16
Slc45a3
9030619P08Rik
Cyp17a1
Krt79
Keg1
Mcm10
C730036D15Rik
LOC668215
Serpina4-ps1
Il1b
GTXC NGTXC NCAverage
1
2
3
5
6
7
8
9
10
11
12
13
14
15
16
17
18
19
20
21
22
24
25
26
23
27
28
4
1 2 3 4 5 6 7 8 9 10 11 12 13 14 15 16 17 18 19
2Fold Change-2

Chapter 2
34
Based on this knowledge, we excluded this transcript from the final classifier set. The final set now includes nineteen classifiers that should be able to discriminate GTXC from the rest and an additional eight classifiers to further identify NGTXC (Figures 1 and 2).
MicroRNA as potential transcriptomic carcinogen classifiers
No microRNAs were identified as OTR-classifiers for GTXC and NGTXC when using the combined mRNA and microRNA transcriptome as input. Messenger RNA therefore proved to contain more discriminative power in this short-term in vivo approach. To be conclusive whether or not microRNA can be used for classification of carcinogens in a short-term in vivo setup, we additionally performed a similar analysis strategy (Figure 1) using only the microRNA data as input. Without application of a fold-change threshold, this approach yielded several possible classifier microRNAs. However, when applying the same thresholds as previously (−1.5 < Fc > 1.5), no distinctive classifier candidates for GTXC and NGTXC classification could be identified. Implementing a less-stringent threshold of −1.3 < Fc > 1.3 yielded twelve microRNAs, but their discriminative potential is low or absent (Figure 3). In contrast to the mRNA expression levels in Figure 2, the heatmap in Figure 3 indicated that a fold-change threshold for microRNA classifiers was only marginally distinct for a certain class on average (column 1–3). Additionally, on individual exposure level, this threshold was mostly not suitable to correctly assign a chemical to its correct class (column 4–19). Due to the fact that a lower fold-change threshold had to be implemented to (only partly) discriminate the classes from each other, microRNA transcripts in this short-term in vivo setup appear to be less suitable for carcinogen discrimination. We therefore pursued validation only using the strongest (mRNA) transcripts we generated upon initial analyses (Figure 2).
Verification and validation of classifier set in original and additional chemical set
The final classifier set, consisting of nineteen GTXC-specific and eight NGTXC-specific mRNA transcripts, was selected based on the combined outcome of three different software-based classification tools. As such, the performance of this ultimate set was yet unknown. Although the classification will tend to be overoptimistic because the total training set itself was used to determine the final classifier set, classifying the training set with the selected classifier set will give an indication of the maximal possible classification accuracy of this set of chemicals (we will later validate this accuracy). We calculated the overall predictive accuracy by again applying a 2-step approach using the KNN, PAM-r, and RF algorithms and

MicroRNA and mRNA signatures for in vivo carcinogen classification
35
use the same cross-validation fold scheme for training and test as with the gene selection, now with the fixed classifier set as input. A chemical is assigned to a certain class, when the majority of the three algorithms predicted this class. Summarized results are shown in Table 3. The predictive value seemed to be very good as concordance (94%), sensitivity (100%), and specificity (80%) were all very high.
Figure 3. Heatmap of fold-change values of the best-performing microRNA transcripts generated by only using microRNA as data input. Column numbers are depicted below the heatmap, and row numbers at the left side. Columns 1–3 represent average fold-change values per class. Columns 4–19 represent fold-change values per chemical indicated at the top of the column. Upon classifier selection (using −1.3 < Fc > 1.3), transcripts 1–2 are considered
GTXC classifiers, transcripts 3–8 NGTXC classifiers, and transcripts 9–12 NC classifiers. We subsequently validated the possible biomarkers using an additional set of eight chemicals. Transcriptional profiles upon 7-day exposures in C57BL/6J male mice were generated for three genotoxic carcinogens [7,12-dimethylbenz(α)anthracene (DMBA), dimethylnitrosamine (DMN), mitomycin c(MMC)], two non-genotoxic carcinogens [carbon tetrachloride (CCL4), 2,3,7,8-Tetrachlorodibenzodioxin (TCDD)], and three non-carcinogenic but potentially toxic chemicals [amiodarone (AD), tolbutamide (TBA), valproic acid (VPA)]. Use of this validation set revealed that the predictive value of the possible biomarkers was in fact lower. The specificity for genotoxic compounds was very high (100%), but the specificity for NGTXC, and
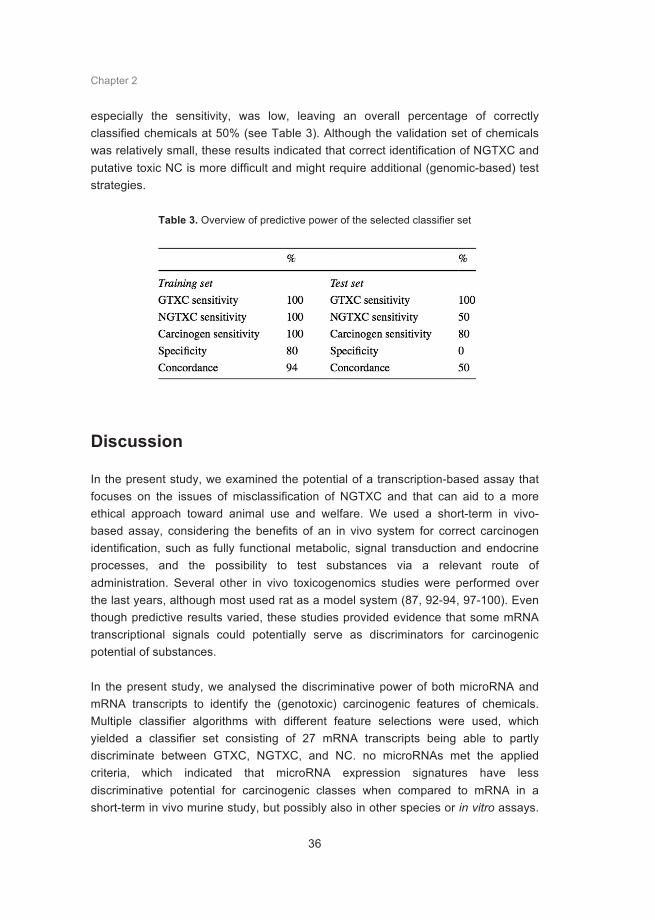
Chapter 2
36
especially the sensitivity, was low, leaving an overall percentage of correctly classified chemicals at 50% (see Table 3). Although the validation set of chemicals was relatively small, these results indicated that correct identification of NGTXC and putative toxic NC is more difficult and might require additional (genomic-based) test strategies.
Table 3. Overview of predictive power of the selected classifier set
Discussion
In the present study, we examined the potential of a transcription-based assay that focuses on the issues of misclassification of NGTXC and that can aid to a more ethical approach toward animal use and welfare. We used a short-term in vivo-based assay, considering the benefits of an in vivo system for correct carcinogen identification, such as fully functional metabolic, signal transduction and endocrine processes, and the possibility to test substances via a relevant route of administration. Several other in vivo toxicogenomics studies were performed over the last years, although most used rat as a model system (87, 92-94, 97-100). Even though predictive results varied, these studies provided evidence that some mRNA transcriptional signals could potentially serve as discriminators for carcinogenic potential of substances. In the present study, we analysed the discriminative power of both microRNA and mRNA transcripts to identify the (genotoxic) carcinogenic features of chemicals. Multiple classifier algorithms with different feature selections were used, which yielded a classifier set consisting of 27 mRNA transcripts being able to partly discriminate between GTXC, NGTXC, and NC. no microRNAs met the applied criteria, which indicated that microRNA expression signatures have less discriminative potential for carcinogenic classes when compared to mRNA in a short-term in vivo murine study, but possibly also in other species or in vitro assays.

MicroRNA and mRNA signatures for in vivo carcinogen classification
37
The fact that the number of microRNAs present in our dataset was smaller than the number of mRNA transcripts is not the reason for the underrepresentation, since any transcript with a strong discriminative signature would be selected from the analyses. MicroRNAs are considered major regulators of the genome, and expression is therefore possibly very tightly controlled, resulting in a less pronounced or class-specific regulation. Nowadays, only one microRNA (mir34-a) has been associated with a genotoxic p53-dependent response in numerous cell types and exposures (117) and is generally considered a genotoxic microRNA biomarker. However, this microRNA was not significantly regulated in vivo upon short-term GTXC exposures in our study, even though some of the GTXC exposures in our study did exhibit a significant p53-dependent DNA damage response based on the mRNA pathway analyses (Table 2, SI4, 2-AAF, and AFB1). In line with these findings, recent publications indicated that mir34-knockout mice and cell lines do not diverge from the wild-type situation concerning p53 response and tumour development (both spontaneous and upon genotoxic stress) (118, 119) This indicates that not all experimental circumstances and cellular conditions result in a default upregulation of mir-34 upon genotoxic stress. Possibly, the use of different exposures times or higher dosing might result in a more pronounced microRNA regulation. The final classifiers in our set were not expected to undisputedly represent a well-known or anticipated class-specific biological response because of the experimental setup, i.e., using carcinogens with different potencies and modes of action, including potentially toxicity inducing NC. Nevertheless, a biological or functional relationship to cancer for several classifier transcripts has been reported by other studies. This is most obvious for the large majority of the GTXC classifiers, which have been previously linked to carcinogenesis [Tiam2 (120) Id2 (121, 122), Il1b (123), Nedd4 l (124), Slc45a3 (125), Zbtb16 (126)], tumour suppressive effects [Phf17 (127), Nr4a1 (128), Ihpk2 (129), or have been shown to be regulated upon DNA damage [Il1a (130)]. The NGTXC classifiers in our set might not represent every possible NGTXC mode of action, but are apparently at least representative for several of them since we used NGTXC exposures with a variety of modes of action (e.g., immune suppressants, peroxisome proliferators, and hormonal carcinogens). Additionally, several of the transcripts in both classifier groups (e.g., LOC75771, 4931408D14Rik, and 9030619P08Rik) have no known function yet and might therefore be interesting candidates for further research concerning genotoxicity or carcinogenic responses. None of the included mRNA transcripts were part of any of the classifier sets generated in previously mentioned in vivo studies (87, 92-94, 97, 99), most likely because these studies used rat as a model system, performed mostly NGTXC versus NC exposures and occasionally different target tissues or cell types were used in those studies. Therefore, the current classifier set and the results of the functional pathway analyses (SI4) could shed some new light on transcriptional
Chapter 2
38
responses toward GTXC, NGTXC, and NC exposure in mice and, more importantly, help elucidate processes that are mostly regulated upon (certain types of) NGTXC exposure. The final set of 27 transcripts was generated to discriminate between GTXC, NGTXC, and NC. The predictive outcome for the original set of chemicals was very high: concordance (94%), specificity (100%), and sensitivity (80%). This indicated that the applied strategy for classifier selection was a valid approach. We additionally made an initial attempt to validate this classifier set using an extra set of chemical exposures. Predictive potential for GTXC remained a 100% correct when tested in the small validation set, although more chemicals need to be tested to validate the true potential of this classifier set. In contrast to GTXC, the classifier set performed less well in correctly identifying NGTXC and NC. TCDD, a NGTXC, was misclassified in the validation, possibly due to its specific mode of action through the aryl hydrocarbon receptor (of which no NGTXC was present in the training set) and/or due to collateral DNA damage, which could potentially induce a ‘genotoxic’-like profile (131, 132). Misclassification of NC in the validation set might also be due to their toxic nature, inducing cellular stress and indirect (oxidative) DNA damage upon exposure. Also, in vivo-derived classifier sets from Fielden et al. and Nie et al. showed high predictive potential based on training results, but upon extensive validation, the predictive power decreased substantially (87, 97). Concordance levels dropped to 64 and 55%, respectively, (100), accentuating the need for novel genomic-based approaches. Obviously, to create a more realistic view of the potential of our (and other) classifier sets, more elaborated validation studies are needed. So far, however, our results and those of others indicated that a set of single classifier transcripts might not be sufficient to obtain high predictive power for these three classes of chemicals. Therefore, additional genomic strategies, inclusion of multiple tissues, and also re-evaluation of the chemical classes are necessary. Results of our and previous studies showed that the many possible modes of actions and indirect effects of NGTXC and NC make it difficult to distinguish between these classes and should therefore be extended into more suitable groups of chemicals to evaluate carcinogenic features. Several NGTXC and NC, for example, do induce some form of genomic instability (pointed out by mutagen or chromosomal aberration assays) or result into collateral (DNA) damage, but were considered NGTXC or NC due to lack of a chronic bioassay and other supportive evidence. Regarding future prospects, it might be necessary to screen a multitude of the NGTXC-related (often tumour-promoting) processes or modes of action in order to assess whether a chemical has non-genotoxic carcinogenic potential. Additionally, non-carcinogenic, but toxic, responses should be inventoried to create an improved filter for distinction between toxic and carcinogenic modes of actions. For this approach, however, an elaborate database of NGTXC and NC exposure
MicroRNA and mRNA signatures for in vivo carcinogen classification
39
data is a prerequisite. Together with previous large-scale in vivo studies focusing on NGTXC, our results contribute to mapping these cellular responses and processes. In conclusion, our results show that microRNAs have less potential as a classifier when compared to mRNA transcripts in a short-term in vivo setup and might require longer exposure times or higher doses for a more pronounced response. In our study, the classifier set as presented above was able to predict genotoxic characteristics with very high accuracy, but indicated that discrimination of non-genotoxic carcinogenic and toxic features of a chemical requires additional or different (genomic-based) strategies. We believe that our results create a realistic view of possibilities, drawbacks, and future necessities in the field of toxicogenomics and are a meaningful contribution to the development of alternative testing strategies for carcinogen identification.


Chapter 3
A microRNA expression signature predicts the (non-)genotoxic carcinogenic potential of compounds in
mouse embryonic stem cells
Kasper W.J. Derks, Joost P.M. Melis, Tessa Pronk, Giel Hendriks, Harry Vrieling,
Jan H.J. Hoeijmakers, Mirjam Luijten, Wilfred F. van IJcken, Joris Pothof
In preparation
Chapter 3
42
Abstract
The human body is continuously exposed to various compounds that could initiate or accelerate cancer development. Such carcinogenic compounds can be classified into a genotoxic and non-genotoxic group. Especially carcinogenicity of non-genotoxic compounds is difficult to determine with current in vitro assessments and therefore has to be improved urgently. Here, we used a toxicogenomics-based approach by genome-wide microRNA expression profiling of mouse embryonic stem (mES) cells to identify microRNA classifiers for genotoxic carcinogens (GTXC), non-genotoxic carcinogens (NGTXC) and oxidative (Ox) compounds. We exposed mES cells to four NGTXC, four GTXC and four Ox compounds. Differential microRNA expression was determined 4, 8 and 12 hours after exposure and was used to assess its discriminative power for NGTXC, GTXC and Ox. We generated an accurate classifier set, which was discriminative for NGTXC using a tiered approach. In conclusion, our initial study indicates that microRNA expression profiles can potentially discriminate between NGTXC, GTXC and Ox compounds with high accuracy.
MicroRNA signatures for in vitro carcinogen classification
43
Introduction
Compounds that interfere with DNA metabolism can induce DNA damage. When not properly repaired, DNA damage can be fixed in the genome as mutations, insertions, deletions or chromosomal rearrangements. Mutation accumulation is considered to be an important driver of the tumour initiation process and increases the risk of cancer development. Therefore, these types of compounds are classified as genotoxic carcinogens (GTXC). Carcinogenesis, however, can also arise from compounds that do not damage DNA, which are designated non-genotoxic carcinogens (NGTXC) (86). Currently, long-term rodent bioassays are mostly used to monitor carcinogenic potential of compounds (89, 90). Almost all currently present in vitro and in vivo short-term carcinogenicity assays are designed to detect genotoxic potential. This will likely not identify NGTXC and could result in a substantial risk for society and the environment (88). In addition, animal testing has the disadvantage of being expensive, time-consuming and ethically aggravating with respect to animal welfare. Moreover, application of high doses in rodent carcinogenicity assays, which irrelevant to human exposure, can lead to false positive results when used in chronic exposures (91). Therefore, in vitro models have an enormous appeal in regard to carcinogenicity risk assessment of compounds. The use of mouse embryonic stem (mES) cells in risk assessment of compounds is emerging due to several experimental advantages, such as pluripotency and wild type DNA damage response (DDR) (133-135). In general, genome-wide gene expression profiling is the most frequently used technology for generating classifiers in vivo as well as in vitro, including in mES cells (136, 137). It is becoming apparent that several thousands of small and long non-coding RNAs are present in a cell, which are hardly inspected for toxicological classifier potential. The best-studied class of non-coding RNAs are microRNAs, which are endogenous small (~23 nucleotides) non-coding RNA molecules that predominantly induce mRNA degradation via complementary binding. A single microRNA can potentially target hundreds of genes (29). Expression profiling demonstrated differentially expressed microRNAs in response to DNA damaging agents (30-32), NGTXC treatment (136, 138) and in cancer (30, 35, 36, 40, 139). MicroRNA expression is regulated at the transcriptional and post-transcriptional level (38, 117). It has been shown that microRNAs respond within hours after DNA damage and are restored back to basal level within 24 hours (31, 40). This led to the hypothesis that microRNAs are early response factors, which should be taken into account in exposure studies. A recent short-term study in mice exposed to GTXC, NGTXC or non-carcinogenic compounds implemented microRNA expression profiles to predict discriminative power in vivo (136). The heterogeneity within the cell population in

Chapter 3
44
organs and the seven-day exposure time frame instead of hours, could explain the lack of discriminative power. MicroRNA expression data obtained from an in vitro-based system could circumvent the aforementioned problems and might be able to correctly identify carcinogens. In this study, we have investigated the discriminative power of microRNAs to correctly predict exposure to NGTXC, GTXC and oxidative (Ox) compounds in mES cells by microRNA arrays. Cells were chronically exposed for 4, 8, and 12 hours to identify the optimal early response for microRNA classifier detection. Our study indicates that microRNA expression profiles can discriminate between NGTXC, GTXC and Ox compounds with high accuracy.
Materials and Methods
Mouse embryonic stem (mES) cells (HM1) were cultured as described (21). One vial of mES cells was thawed and cultured for two passages on primary mouse embryonic fibroblast-derived feeder-coated plates followed by one passage on gelatin-coated plates before exposure. The mES cells in experiment were treated with compounds (Table 1) or mock-treated with equal volume dimethylsulfoxide (DMSO) or phosphate buffered saline (PBS), depending on dissolvent used for the compound. The treatments were equitoxic, resulting in a 30% survival based on clonogenic survival. After 4h, 8h and 12h continuous exposure, total RNA was isolated using Qiazol Lysis Reagent (Qiagen) and total RNA was purified with the miRNeasy kit (Qiagen), according to manufacturer's instructions. RNA integrity (scores >9.0) was determined on the Agilent 2100 Bioanalyzer (Agilent) according to manufacturer’s instructions. This procedure was repeated four times to obtain four independent biological replicates.
MicroRNA expression profiling
MicroRNA profiling was performed as previously described.(37) In short, Total RNA was labelled (Cy3) using the ULS aRNA labelling kit (Kreatech). The labelled total RNA was hybridized to the LNA-based microRNA capture probe set (Exiqon) in a Tecan HS4800 pro hybridization station and scanned in a Tecan LS Reloaded scanner. Data extraction was carried out by Imagene software. Quality control of the intensity distribution after background subtraction identified related samples. The three (or four) most related (out of four) samples were used to maximize the number of microRNAs to be included for analysis. For Wy (4h) two biological replicates were discarded as outliers. Quantile normalized data were analysed for differentially expressed microRNAs (Table 1) using the correct vehicle as control by LIMMA (bioconductor package Limma; (113) and corrected for multiple testing (116).

MicroRNA signatures for in vitro carcinogen classification
45
Heatmaps were generated using TM4 microarray software suite (140). The Pearson’s product moment correlation coefficients were calculated in R (stat package) for the whole array expression values. The transcriptomic results are deposited at the NCBI Gene Expression Omnibus: GSE57839.
Classification analyses
A tiered approach was used to derive a final classifier set as described in (136). In short, we applied the Prediction Analysis for Microarrays (PAM-R) in a 2-step approach to generate classifiers to discriminate between non-genotoxic (NGTXC), genotoxic (GTXC) and oxidative (Ox) compounds. The R-package ‘pamr’ used for these methods can be found in the bioconductor repository. Training for compound classification within the PAM-R algorithm was performed using a 100-fold cross-validation with a balanced training set as described in (136). We have chosen NGTXC versus the Rest (GTXC and Ox) as a first step in the analysis procedure, due to the high overlap between GTXC and Ox classes in mode of action (both genotoxic) and their high overlap in a Pearson correlation analysis. The algorithm yielded 100 top-50 lists for the NGTXC versus the Rest analyses and 100 top-50 lists for the GTXC versus Ox analyses. To prevent inclusion of false positives we first analysed how many times a transcript was detected within those 100-fold generated top-50 lists. Transcripts were only considered for further classifier selection if they were present in at least 50% of the top-50 cross-validation lists. A Top-ranked (TR) classifier set was generated consisting of transcripts yielding most often within the 100-fold cross-validation. To increase the robustness of the classifier sets we applied a fold-change threshold of FC ±1.3 on average in one of the classes.
Results
The aim of this study was to explore whether microRNA expression profiles can classify carcinogenic compounds and discriminate between NGTXC and GTXC. In theory, the complete array or part of it should ideally be able to correctly classify samples in all three chemical classes (NGTXC, GTXC and Ox). First, samples were prepared by thawing a vial of mES cells that were grown for two passages on feeder layers and subsequently transferred to gelatin-coated plates. Then, these mES cells were exposed to one of the twelve compounds as depicted in Table 1 or mock-treated (DMSO or PBS). Total RNA was isolated 4, 8 or 12 hours after continuous exposure. The complete procedure was repeated four times to obtain biological replicates (Figure 1A).

Chapter 3
46

MicroRNA signatures for in vitro carcinogen classification
47
Figure 1. The experimental set-up and whole array clustering. A) Schematic overview of the sample preparation. B) Spearman-correlation clustering using the whole array expression values, I-V depicting the cluster groups.

Chapter 3
48
After microRNA profiling and data extraction, we averaged expression values of the biological replicates to calculate fold changes between treated groups and their respective controls. Based on these fold changes, we determined whether microRNA expression changes in the complete array, irrespective of significance, were able to generate a meaningful classification using Pearson correlation clustering. Classification of 12 treatments divided in 3 classes and 3 time points resulted in 5 groups (Figure 1B). 3 groups referred to GTXC and Ox clustered per time point, i.e. cluster-groups I, IV and V, corresponding respectively to the 8, 4 and 12 hour time point (Figure 1B). The cluster groups II and III referred to 3 of the 4 NGTXC in a time independent manner (Figure 1B). NGTXC Cyclosporin A (CSA) was consistently clustering together with the GTXC and Ox classes, indicating a putative misclassification of CSA or CSA being a false-positive genotoxic agent (141, 142). The observation that most NGTXC are clustering apart from the GTXC and Ox classes indicates the presence of specific microRNA classifiers for the NGTXC class. Based on complete array classification, we selected a two-step classification approach, Predictive Analysis of Microarray (PAM-R), to identify a microRNA signature that can accurately predict NGTXC, GTXC and Ox (Figure 2A, see M&M for details). The PAM-R classification algorithm utilizes the nearest shrunken centroid method from microRNA expression datasets to classify samples (96, 136). In the first step, we determined the predictive power of microRNAs specific for NGTXC by comparing the NGTXC class to the other two classes combined (Rest = GTXC and Ox) for each time point (4h, 8h or 12h). The second step was aimed at discriminating between the GTXC class and the Ox class to predict GTXC microRNAs at each time point. To obtain classifier sets with sufficient predictive power for the selected test compound a training set was used. Such a training set consisted of compounds from the same group as the selected compound together with a balanced number of compounds from other groups. For example, to identify DES as a non-genotoxicant, training on the three other non-genotoxicants and four compounds from the Rest was performed. First, we evaluated the predictive power of whole array expression values to identify the time point that discriminates best for each step. As seen by Pearson correlation clustering, PAM-R classified CSA to the Rest (GTXC and Ox) throughout all time points in the first step. MicroRNA expression profiles from the 4h and 12h time point resulted in the highest predictive power in step 1 and 2, respectively. Therefore, we proceeded with the 4h time point to identify a set of microRNAs specific for NGTXC and the 12h time point for the GTXC. In each step (NGTXC vs. Rest, and for GTXC vs. Ox) cross-validation of the tested groups to the training set resulted in a total of 100 classifier microRNA lists per time point. By applying 100 training sets and limiting the list to the top-50 we increased the robustness of the classifiers, preventing false positives. In order to even further avoid false positive classifier microRNAs we selected only those

MicroRNA signatures for in vitro carcinogen classification
49
microRNAs that were present in at least 50% of all top-50 lists with a fold change threshold of ±1.3 on average in at least one of the classes. These criteria generated Top-Ranked (TR) classifier sets for each step. The final classifier set consisted of 31 microRNAs being able to discriminate between NGTXC, GTXC and Ox (Figure 2 and 3; and Table 2). The NGTXC classifier from step 1 included 26 microRNAs (Figure 2A) and showed a clear separation between the NGTXC and the Rest (Figure 2B, column 1-3). Again, CSA mapped to the GTXC and Ox classes rather than NGTXC (Figure 2B). The predictive power of this 26 microRNA classifier set in our training set was high (Figure 3). The classifier set obtained in the second step could discriminate the GTXC and Ox classes, although less pronounced than the classifier set from step 1 (Figure 2 and 3). Thus, microRNA expression profiling can possibly identify classifiers that could discriminate between NGTXC, GTXC and Ox compounds.
Table 2. Overview of the predictive power per step
Discussion
In this study we aimed to design an in vitro-based assay that can aid in non-genotoxic carcinogen identification. Our experimental approach focussed on microRNA expression profiling in mES cells to address the issue of misclassification of NGTXC compounds as well as investigating the optimal time after exposure. The kinetics for both mRNA and microRNA in cellular responses is largely unknown, but likely very important (21, 31). Therefore, we applied microRNA expression kinetics in the present study to find the optimal time of exposure by including multiple time points (4, 8 and 12 hour). We composed the classifier steps between NGTXC, GTXC and Ox with the best performing time points to maximize the discriminative power of our microRNA expression profiles. The final classifier set of 31 transcripts comprised 5% (26 for step 1 and 5 for step 2) of the complete array. This final set had high predictive values, concordance (92%) and sensitivity (75% for NGTXC and 100% for GTXC and Ox).

Chapter 3
50
The drawbacks of an in vitro system are the lack of fully functional metabolic, signal transduction and endocrine processes or the possibility to test substances via a relevant route of administration. Several in vivo toxicogenomics studies were performed over the last years (87, 92-94, 97-100, 136, 143) with varying predictive results. These studies provided evidence that some mRNA transcriptional signals could serve as discriminators for carcinogenic potential but were less predictive for non-genotoxic potential of substances. Therefore, in vitro microRNA expression profiling will contribute to carcinogenic risk assessment. MicroRNA expression classifier sets at 4h and 8h revealed low predictive potential in discriminating between the GTXC and Ox classes in our training set. This can be explained by the fact that oxidative stress can also transiently induce DNA damage, which is quickly repaired within minutes to hours after exposure. Oxidative stress is able to provoke DNA damage signalling, which explains the overlapping response with the GTXC. Since oxidative stress is very transient and quickly repaired and therefore not long-lasting as compared with many genotoxic treatments, exposure time should likely be extended to better discriminate between GTXC and Ox. Indeed, we found a higher predictive potential for microRNAs at the 12h time point discriminating between GTXC and Ox. While the microRNA classifier sets showed a high predictive power in detecting all three classes, further validation is needed with additional chemicals from each of the tested groups. In conclusion, we show that microRNAs have classifier potential in short-term in vitro exposure assays in mES cells. The microRNA classifier set was able to predict NGTXC with very high accuracy, but indicated that discrimination between GTXC and Ox needs to be validated in additional datasets and likely requires additional optimal exposure time points or different strategies, such as combinations with mRNA biomarkers. Thus, microRNA expression profiling is a promising tool and might contribute to the development of alternative testing strategies towards carcinogen classification in risk assessment.

MicroRNA signatures for in vitro carcinogen classification
51

Chapter 3
52
Figure 3. Predictive power of the classifier sets, step 1 and 2 combined. Step 1, NGTXC
versus Rest (GTXC and Ox combined) and step 2 GTXC versus Ox. A class (NGTXC, GTXC or Ox) was assigned when the majority of predictions (75% or more) were correct.

Chapter 4
The RNA landscape kinetics of the DNA damage response in mouse embryonic stem cells
Kasper W.J. Derks, Christel E.M. Kockx, Wilfred F.J. van IJcken, Jan H.J. Hoeijmakers,
Joris Pothof
In preparation
Chapter 4
54
Abstract
To maintain genome integrity, cells have evolved an elaborate response to DNA damage. Gene expression regulation is important to execute the various steps and final cellular outcome of DNA damage signalling. Each class of DNA lesions is repaired by different DNA repair systems and can activate different cellular responses that may result in different cellular outcomes after DNA damage signalling. Specific and overlapping responses at the gene and microRNA level induced by several types of DNA lesions are not well described in a single time-resolved experiment. Therefore, wild type mouse embryonic stem cells were exposed to equitoxic doses of ultraviolet C radiation (UVC), cisplatin and ionizing radiation (IR), each inducing different DNA lesions, i.e. helix distorting-lesions (UVC), intra- and interstrand crosslinks (cisplatin) and single- and double-strand breaks (IR). Total RNA was isolated 4, 8 and 12 hours after the start of treatment and used for Next Generation Sequencing of the poly-adenylated RNA and small RNA fraction. Besides genotoxic stress-specific responses, we isolated a common gene and microRNA expression response across all genotoxic stresses in which gene and microRNA expression patterns were markedly different. Gene expression was highly similar across all time points, while microRNAs were expressed in short waves in which the expression pattern altered each 4 hours. Our data point towards different roles for genes and microRNAs in executing specific steps in the DNA damage response.

The RNA landscape kinetics of the DNA damage response
55
Introduction
The sole cellular component that cannot be replaced when damaged and therefore completely relies on repair is DNA. Besides a daily damage load of ten thousand DNA lesions from endogenous sources, exogenous sources such as ultraviolet (UV) light, ionizing radiation (IR) and various chemicals also damage DNA. Unrepaired DNA lesions are thought to contribute to the aging process and age-related diseases, while incorrectly repaired DNA damage lead to mutations or chromosomal aberrations that may drive carcinogenesis (1). To deal with these adverse effects of DNA damage, cells have an arsenal of DNA repair mechanisms, each recognizing and repairing own spectra of lesions, but also DNA damage checkpoint pathways that arrest proliferation to enable the cell to repair the damage, or, when damage is beyond repair, trigger apoptosis or cellular senescence. All processes whose activity changes upon DNA damage including DNA repair systems and cell cycle checkpoints are collectively known as the DNA Damage Response (DDR). The cellular outcome of DNA damage signalling is determined by the amount and type of DNA lesions, but also cellular context (e.g. cell-type, proliferation versus a post-mitotic state). The tight regulation of the DDR is of utmost importance, since there is a delicate balance: defects in repair drives carcinogenesis whereas hyper-activation can prematurely induce apoptosis or cellular senescence that negatively affect tissue homeostasis, a contributing factor to aging and age-related pathologies (1-4). To maintain this balance in the DDR and induce the correct outcome of DDR signalling gene expression level alterations are important. These are predominantly established by the inactivation or activation of specific transcription factors and microRNAs. The best-studied example is the transcription factor p53, which controls cell cycle arrest and apoptosis genes, but also in undifferentiated cells terminal differentiation (144-147). MicroRNAs are small (~22 nucleotides) endogenous non-coding RNAs that repress target gene expression by binding to complementary target sites that mainly reside in 3’UTRs, thereby predominantly inducing mRNA degradation (29). A single microRNA can target hundreds of different mRNAs simultaneously, providing a mechanism to rapidly alter a complete gene expression program. Based on microRNA array time series after DNA damage, it was hypothesized that microRNAs act during the DDR in time between the fast post-translation modification (PTM) response and the relatively slower gene transcriptional response via promotor regulation (31, 37). Most knowledge about gene and microRNA expression changes has been generated by microarray-based transcriptomic analysis of cells or organisms exposed to DNA damage. RNA sequencing of poly-adenylated RNAs or small RNAs

Chapter 4
56
has distinct advantages, including quantitative detection of RNAs. Moreover, post-transcriptional modifications of RNAs as well as novel (and known) RNAs can be detected by RNA sequencing. These novel RNAs consist of transcripts or fragments of transcripts originating from annotated as well as non-annotated regions in the genome. To date, only few mRNA or small RNA transcriptomics studies by RNA sequencing in relation to the DDR have been published (59-64). Currently, it is obscure whether different types of DNA lesions trigger similar or lesion-specific gene and microRNA expression responses. This is due to the fact that comparison of results between studies is very difficult since often very different conditions were used, e.g. cell type/tissue, dose and time after treatment. Based on current transcriptomic studies, it is estimated that the expression of up to a few thousand genes and a few hundred of microRNAs are altered after DNA damage, depending on dose, agent, cell type, etc. Overall conclusions could be that besides the well-studied p53 transcription factor, several additional transcription factors and microRNAs control gene expression after DNA damage that together regulates numerous cellular processes (21, 22, 30-36, 39, 40). We took advantage of the Next Generation Sequencing (NGS) technology to map differentially expressed poly-adenylated RNAs (including mRNAs) and small RNAs (including microRNAs) in mouse embryonic stem (mES) cells throughout time following DNA damage. We exposed mES cells to the DNA-damaging agents UVC, IR and cisplatin. Each genotoxic agent induces its specific spectrum of DNA lesions, which was used to map both lesions specific and general RNA expression responses.
Materials and Methods
Total RNA isolation
MES cells (HM1) were cultured as described (21). One vial of mES cells was thawed and grown for two passages on feeder-coated plates followed by one passage on gelatin-coated plates before taken into experiment. The mES cells in experiment were treated with 5µM cisplatin (Platosin), exposed to 4J/m2 UVC or, 4 Gy IR or mock-treated. Treatments with cisplatin, UVC and IR were equitoxic, resulting in a 40% survival-based on clonogenic assays (of ‘colony-forming ability’) (148, 149). After 4, 8 and 12h exposure total RNA was isolated using Qiazol Lysis Reagent (Qiagen) and total RNA was purified with the miRNeasy kit (Qiagen), according to manufacturer's protocols. The integrity of the RNA was determined on the Agilent 2100 Bioanalyzer (Agilent) according to manufacturer’s protocol. All scores were >9.0. This procedure was repeated three times to obtain independent biological replicates. Subsequent sequencing protocols were performed on the total RNA from the same biological samples.
The RNA landscape kinetics of the DNA damage response
57
Sample preparation and sequencing
Total RNA enrichment for sequencing poly(A) RNAs was performed with the TruSeq mRNA sample preparation kit (Illumina) according to the manufacturer’s protocols (mRNASeq). In short, 1 µg of total RNA for each sample was used for poly(A) RNA selection using magnetic beads coated with poly-dT, followed by thermal fragmentation. The fragmented poly(A) RNA enriched samples were subjected to cDNA synthesis using Illumina TruSeq preparation kit according to the manufacturer’s protocol. Then, cDNA was synthesized by reverse transcriptase (Super-Script II) using poly-dT and random hexamer primers. These cDNA fragments were subsequently blunt-ended by end-repair reaction, followed by dA-tailing. Finally, specific double-stranded bar-coded adapters were ligated and library amplification for 15 cycles was performed. CDNA libraries for small RNA sequencing were generated by Illumina TruSeq smallRNA kit v1.5 (smallRNASeq), according to the manufacturer’s instructions. In short, specific bar-coded adapters were ligated to 1 µg of total RNA followed by reverse transcriptase and amplification for 11 cycles. Small RNAs were enriched by fractionation on a 15% Tris-borate-EDTA gel, excising the RNAs of 15-30 nucleotide of length. Pooled cDNA libraries all consisted of equal concentrations of bar-coded samples. The mRNASeq and smallRNASeq pooled libraries were sequenced, all 36bp single read on the HiSeq2000 (Illumina).
Sequencing data analysis
The analysis of the sequencing datasets was performed with TRAP (Chapter 5). In short, the smallRNASeq reads were, prior to the analysis with TRAP, trimmed for adapter sequences with a custom script. Reads from mRNASeq were aligned to the mouse mm9 reference genome using NARWHAL automation software (150). TRAP extracted the reads that aligned within and between RefSeq transcripts from the resulting BAM files. Exonic reads were summed per transcript and a specific transcript or region was referred to as expressed, when a predefined threshold was reached (5 reads per million). The threshold was defined as a minimum number of reads that could be aligned to a transcript or non-exonic region across all biological replicates in at least one of the experimental groups. The expressed transcripts were divided using the RefSeq identifiers into coding and non-coding transcripts and, the non-exonic regions were divided by location into intronic or intergenic regions. Statistical analysis of the transcripts and regions was performed with EdgeR (151). Next, we used TRAP to analyse reads smaller than 36 nucleotides from smallRNASeq. Trimmed sequence reads were discarded if smaller than 14 nucleotides of length. Reads were referred to as expressed when the threshold was reached, which was defined as a minimal of 5 reads being present in all biological

Chapter 4
58
replicates in at least one experimental group. The expressed reads were subsequently aligned to rRNA sequences (5s and 5.8s), tRNA sequences, the miRBase (152) database (v19) or genome (using NARWHAL) (150). Statistical analysis of the tRNA aligned reads and miRBase (152) aligned reads (microRNAs) was performed with EdgeR (151). The reads aligned to the genome (small RNAs) were further processed as long RNAs in TRAP, described above..
Statistics and pathway analysis
Differentially expressed (DE) transcripts were identified with EdgeR (151), assuming a negative binomial distribution of the reads, with a detection cut-off of fold change > 1.5 and FDR < 0.05. The Pearson’s product moment correlation coefficients were calculated in R (stat package) for the expression and fold changes of all RNA classes. Pathway analysis was performed with Ingenuity Pathway Analysis Software (IPAtm) and/or DAVID (153, 154).
Enrichment RNA species
The enrichment of RNA species was defined by the proportion, the number of reads that primary aligned to the genome, of RNA classes. Only reads used to align to the genome were 36 nucleotides of length in the mRNASeq data or did not align to miRBase (152), tRNA or rRNA sequences in the smallRNASeq data. The proportion of small RNA reads (<36 nucleotides) was defined by being uniquely aligned to miRBase (152), genome or tRNA.
Results
The aim of this study was to construct the RNA landscape of the DNA damage response. Mouse ES (mES) cells were exposed to three genotoxic agents, each with their specific DNA lesion spectrum, i.e. intra- and interstrand crosslinks by cisplatin, photo-products by UVC and single- and double strand DNA breaks as well as oxidative damage by IR, together covering a wide range of DNA lesions. Total RNA for mRNA sequencing (mRNASeq) and small RNA sequencing (smallRNASeq) was obtained by thawing one vial of mES cells that were grown for two passages on feeder-coated plates followed by one passage on gelatin-coated plates and subsequently treated with cisplatin, UVC, IR or mock-treated. Genotoxic stress was applied in equitoxic doses correlating with 50% survival in a colony formation assay. Total RNA was isolated 4, 8 and 12 hours after treatment. This complete procedure was repeated three times to obtain biological replicates for statistical analysis. Each RNA sample was used for both mRNASeq and smallRNASeq (Figure 1A).
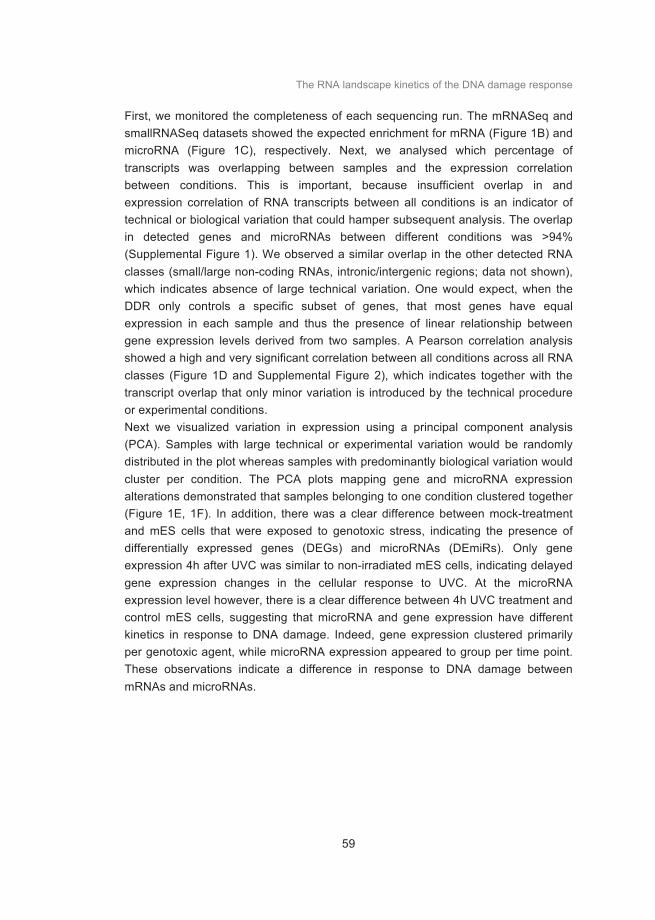
The RNA landscape kinetics of the DNA damage response
59
First, we monitored the completeness of each sequencing run. The mRNASeq and smallRNASeq datasets showed the expected enrichment for mRNA (Figure 1B) and microRNA (Figure 1C), respectively. Next, we analysed which percentage of transcripts was overlapping between samples and the expression correlation between conditions. This is important, because insufficient overlap in and expression correlation of RNA transcripts between all conditions is an indicator of technical or biological variation that could hamper subsequent analysis. The overlap in detected genes and microRNAs between different conditions was >94% (Supplemental Figure 1). We observed a similar overlap in the other detected RNA classes (small/large non-coding RNAs, intronic/intergenic regions; data not shown), which indicates absence of large technical variation. One would expect, when the DDR only controls a specific subset of genes, that most genes have equal expression in each sample and thus the presence of linear relationship between gene expression levels derived from two samples. A Pearson correlation analysis showed a high and very significant correlation between all conditions across all RNA classes (Figure 1D and Supplemental Figure 2), which indicates together with the transcript overlap that only minor variation is introduced by the technical procedure or experimental conditions. Next we visualized variation in expression using a principal component analysis (PCA). Samples with large technical or experimental variation would be randomly distributed in the plot whereas samples with predominantly biological variation would cluster per condition. The PCA plots mapping gene and microRNA expression alterations demonstrated that samples belonging to one condition clustered together (Figure 1E, 1F). In addition, there was a clear difference between mock-treatment and mES cells that were exposed to genotoxic stress, indicating the presence of differentially expressed genes (DEGs) and microRNAs (DEmiRs). Only gene expression 4h after UVC was similar to non-irradiated mES cells, indicating delayed gene expression changes in the cellular response to UVC. At the microRNA expression level however, there is a clear difference between 4h UVC treatment and control mES cells, suggesting that microRNA and gene expression have different kinetics in response to DNA damage. Indeed, gene expression clustered primarily per genotoxic agent, while microRNA expression appeared to group per time point. These observations indicate a difference in response to DNA damage between mRNAs and microRNAs.

Chapter 4
60
RNA expression kinetics
The PCA plots indicate that the regulation of gene and microRNA expression follows different kinetics. To further investigate gene and microRNA responses after DNA damage, we determined DEGs and DEmiRs in all conditions. As expected from the PCA plot, only 4 DEGs were identified 4h after UVC (Figure 2 and Supplemental Figure 3). The 8 and 12 hours after UVC treatment revealed many DEGs, over a thousand at 8 hours and around three thousand at 12 hours respectively. Approximately 80% of the DEGs at the 8h were also found at 12 hours, suggesting that 8 hours after UVC a general response is induced. In contrast to UVC, DEGs were identified 4h after IR and cisplatin (Figure 2A). About 50% of DEGs overlapped across all time points after IR as well as cisplatin treatment (Figure 2A). Moreover, the number of DEGs shared by all treatments per time point increased in time (Supplemental Figure 3A). Thus, there are many overlapping DEGs across time per genotoxic treatment as well as across DNA-damaging agents, indicating a general gene expression response after DNA damage. If there was a general gene expression response after DNA damage, one would expect that overlapping DEGs would be regulated in the same direction. Therefore, we plotted the fold changes from all overlapping DEGs after IR and matching fold changes from cisplatin and UV treatments (Figure 2B, panel I). Indeed, the direction of expression of common DEGs after IR was almost completely identical between time points as well as genotoxic stressors (Figure 2B; Supplemental Figure 3B). Figure 1. Experimental design and quality control. A) Sample preparation scheme in which mES cells were treated with 5 µM cisplatin, 4 J/m2 UVC, 4 Gy IR or mock-treated (equal volume DMSO). Both sequencing methods were performed on the exact same samples. B) The proportion of RNA species detected by mRNASeq with a cut-off of minimum five reads found in all biological replicates in at least one of the experimental groups. Coding transcripts (69.3%), non-coding transcripts (1.2%) and reads from mitochondrial RNA (1.5%), intronic
regions (11.8%) and intergenic regions (16.3%). C) The proportion of small RNA species detected by smallRNASeq with a cut-off of a minimum of five reads found across all biological replicates in at least one of the experimental groups. Small RNA classes: tRNA fragments (5.2%), small coding (2.5%), small non-coding (18.3%), mature microRNA (miR) (28.6%), microRNA isoforms (isomiR) (29.7%), small intergenic (8.5%) and small intronic RNAs (7.3%). The indicated percentage represents the total aligned RNAs from that particular class
compared to the total number of reads. D) Pearson correlation between all experimental conditions. The average number of sequence reads per RNA species per condition was used. Only mRNA or microRNA transcripts with at least 20 reads on average across all samples were used. E and F) Principal component analysis depicting mRNAs (E) and microRNAs (F).

The RNA landscape kinetics of the DNA damage response
61

Chapter 4
62

The RNA landscape kinetics of the DNA damage response
63

Chapter 4
64
Correspondingly, shared DEGs from cisplatin or UV treatments were uniformly regulated across time, but also highly similar in the other genotoxic stresses (Figure 2B, panel II and III). The high overlap and uniform direction of DEGs indicate a general gene expression response in time after DNA damage. If there was a general gene expression response after DNA damage, one would expect that overlapping DEGs would be regulated in the same direction. Therefore, we plotted the fold changes from all overlapping DEGs after IR and matching fold changes from cisplatin and UV treatments (Figure 2B, panel I). Indeed, the direction of expression from common DEGs after IR was almost completely identical between time points as well as genotoxic stressors (Figure 2B; Supplemental Figure 3B). Consistently, shared DEGs from cisplatin or UV treatments were uniformly regulated across time, but also highly similar in the other genotoxic stresses (Figure 2B, panel II and III). The high overlap and uniform direction of DEGs indicate a general gene expression response in time after DNA damage. The number of replicates could mask the percentage of overlapping DEGs due to decreased statistical power. It could be conceivable that a DEG found in one specific condition is similarly regulated in other conditions, but due to variance not identified as a DEG. Therefore, we selected fold changes of all DEGs in one condition (Figure 2C, y-axis) and examined their Pearson correlation coefficient with corresponding genes from the other conditions (Figure 2C, x-axis). If DNA damage-induced gene expression changes were similar between conditions, regardless of significance of each individual gene, one would expect a high correlation. We observed high and significant correlations between every condition and their corresponding genes in the other conditions, except for the 4h UVC time point (Figure 2C and Supplemental Figure 3C). In conclusion, DNA damage in general activates highly similar gene expression response across time. The PCA plots indicate different gene and microRNA expression responses after DNA damage (Figure 1E, 1F), in which time after treatment is the main determinant for microRNAs rather than the DNA-damaging agent. Subsequently, we determined DEmiRs per condition and determined overlap between conditions. As expected from the PCA plots, we observed that DEGs were more overlapping between genotoxic agents per time point (Figure 3A) than across time in a single genotoxic stress (Supplemental Figure 4A), although the percentage of DEmiRs per condition is high. This observation suggests that time is the main determinant in microRNA expression control after DNA damage.

The RNA landscape kinetics of the DNA damage response
65
Figure 2. Differential expressed genes and kinetics. A) Overlapping and specific differential expressed genes (DEGs) between the 4, 8, 12h time points after UVC, IR and cisplatin treatment. B) Heatmap depicting fold changes from overlapping DEGs in time from IR (panel I), cisplatin (panel II) and UVC (panel III) compared to the other genotoxic stresses. For UVC overlapping DEGs between 8 and 12h were also included. C) Pearson correlation using fold
changes of DEGs per condition (y-axis) and corresponding mRNAs in other conditions (x-axis).
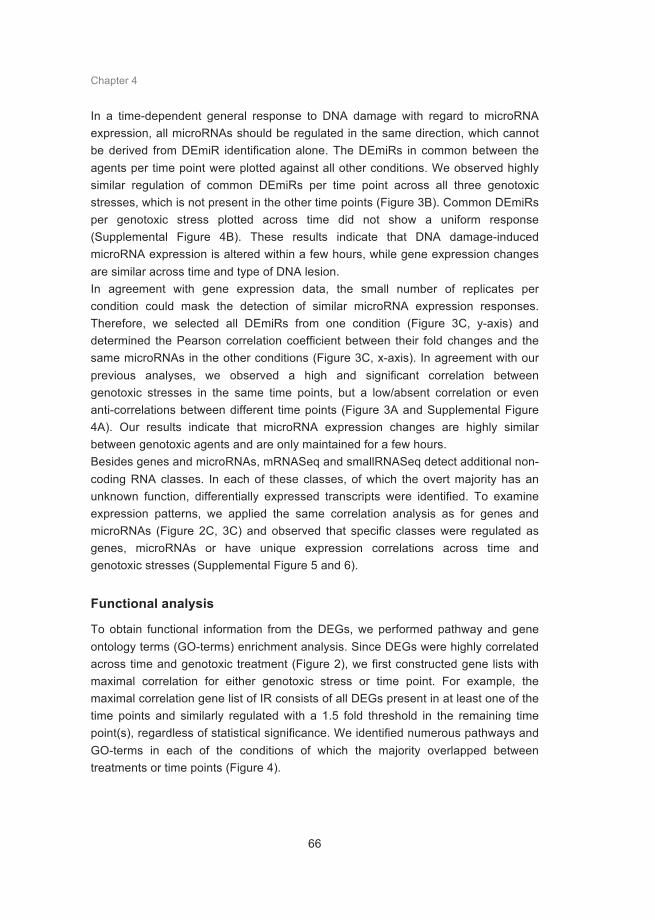
Chapter 4
66
In a time-dependent general response to DNA damage with regard to microRNA expression, all microRNAs should be regulated in the same direction, which cannot be derived from DEmiR identification alone. The DEmiRs in common between the agents per time point were plotted against all other conditions. We observed highly similar regulation of common DEmiRs per time point across all three genotoxic stresses, which is not present in the other time points (Figure 3B). Common DEmiRs per genotoxic stress plotted across time did not show a uniform response (Supplemental Figure 4B). These results indicate that DNA damage-induced microRNA expression is altered within a few hours, while gene expression changes are similar across time and type of DNA lesion. In agreement with gene expression data, the small number of replicates per condition could mask the detection of similar microRNA expression responses. Therefore, we selected all DEmiRs from one condition (Figure 3C, y-axis) and determined the Pearson correlation coefficient between their fold changes and the same microRNAs in the other conditions (Figure 3C, x-axis). In agreement with our previous analyses, we observed a high and significant correlation between genotoxic stresses in the same time points, but a low/absent correlation or even anti-correlations between different time points (Figure 3A and Supplemental Figure 4A). Our results indicate that microRNA expression changes are highly similar between genotoxic agents and are only maintained for a few hours. Besides genes and microRNAs, mRNASeq and smallRNASeq detect additional non-coding RNA classes. In each of these classes, of which the overt majority has an unknown function, differentially expressed transcripts were identified. To examine expression patterns, we applied the same correlation analysis as for genes and microRNAs (Figure 2C, 3C) and observed that specific classes were regulated as genes, microRNAs or have unique expression correlations across time and genotoxic stresses (Supplemental Figure 5 and 6).
Functional analysis
To obtain functional information from the DEGs, we performed pathway and gene ontology terms (GO-terms) enrichment analysis. Since DEGs were highly correlated across time and genotoxic treatment (Figure 2), we first constructed gene lists with maximal correlation for either genotoxic stress or time point. For example, the maximal correlation gene list of IR consists of all DEGs present in at least one of the time points and similarly regulated with a 1.5 fold threshold in the remaining time point(s), regardless of statistical significance. We identified numerous pathways and GO-terms in each of the conditions of which the majority overlapped between treatments or time points (Figure 4).
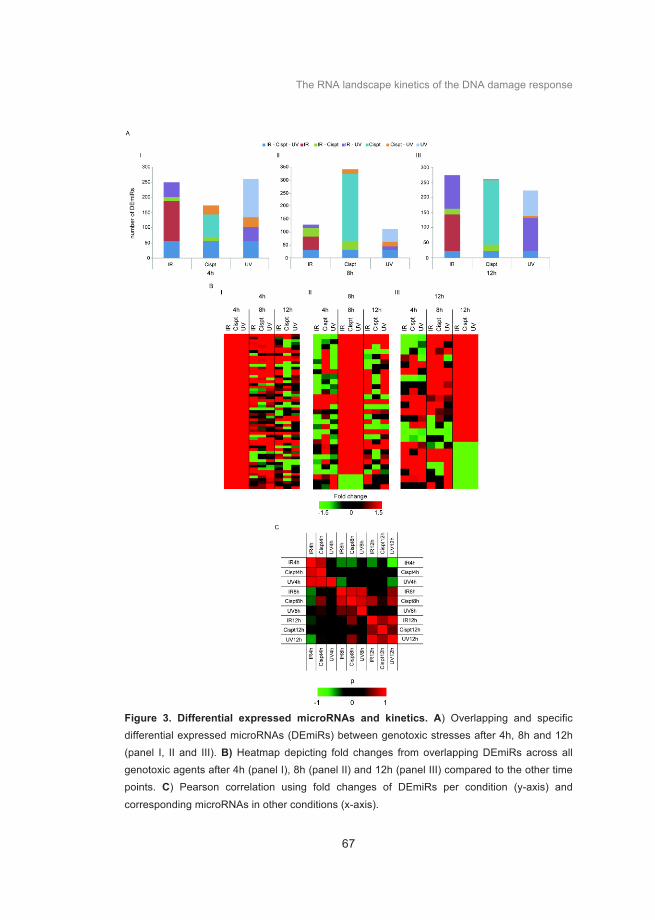
The RNA landscape kinetics of the DNA damage response
67
Figure 3. Differential expressed microRNAs and kinetics. A) Overlapping and specific differential expressed microRNAs (DEmiRs) between genotoxic stresses after 4h, 8h and 12h (panel I, II and III). B) Heatmap depicting fold changes from overlapping DEmiRs across all genotoxic agents after 4h (panel I), 8h (panel II) and 12h (panel III) compared to the other time points. C) Pearson correlation using fold changes of DEmiRs per condition (y-axis) and
corresponding microRNAs in other conditions (x-axis).

Chapter 4
68
Figure 4. KEGG pathways and Gene-Ontology analysis. Panel I) Venn diagrams of
significant (p-value <0.05) enriched KEGG pathways clustering treatment or time after
treatment. Maximum correlation DEG lists are used. Panel II) Venn diagrams of significant (p-
value <0.05) enriched Gene-Ontology terms clustering treatment or time after treatment.
Maximum correlation DEG lists are used.

The RNA landscape kinetics of the DNA damage response
69
As expected, the p53 pathway was found significantly enriched in all time points and treatments (Figure 4, panel I). Processes directly controlled by the p53 pathway, including apoptosis and cell cycle, were strongly regulated in the expected direction, that is upregulation of pro-apoptotic and cell cycle arrest genes and downregulation of anti-apoptotic and cell cycle progression genes (Figure 5A). Several additional p53 target genes were induced, such as DNA repair and autophagy genes (Figure 5A). Several p53 target genes, including Akt, Pten and Mdm2, were regulated by all agents in the opposite direction as expected from p53 activation, suggesting the presence of a negative feedback loop by secondary factors aimed at restricting p53 activity.
Figure 5. Heatmaps of core regulated pathways. A) Heatmap of significantly regulated p53 target genes. B) Heatmap of significantly regulated stem cell renewal, pluripotency and
differentiation markers. C) Heatmap of miR-290-295 cluster.

Chapter 4
70
Besides apoptosis, terminal differentiation is another possible cellular outcome when damage is beyond repair (155, 156). All genotoxic stresses control the Hedgehog and Wnt signalling pathways (Figure 4). These pathways are both involved in stem cell self-renewal and cellular differentiation (157, 158), indicating that DNA damage in mES cells induces terminal differentiation via these pathways. In order for a mES cell to differentiate, self-renewal should be inhibited (159). All self-renewal factors were gradually downregulated after DNA damage, most prominently after cisplatin, which is probably the most potent and persistent replication inhibitor (Figure 5B). Conversely, several differentiation markers gradually increased (Figure 5B). Together this indicates that cellular differentiation is initiated after DNA damage. It has been shown that the miR-290-295 cluster, containing microRNAs 290 to 295, is only expressed in mES cells and is not expressed in differentiated cells (160). These microRNAs are not yet downregulated (Figure 5C). suggesting that at the 12h time point terminal differentiation is still in the initiating phase, but is not yet completed.
Discussion
Here, we generated a time-resolved map of RNA expression changes in response to several types of DNA damage in mES cells. We isolated a common gene and microRNA expression response across all genotoxic stresses, in which gene and microRNA expression patterns were markedly different. Gene expression was highly similar across all time points and genotoxic stresses, while microRNAs were expressed in short waves. This points towards different roles for genes and microRNAs in executing specific steps in the DNA damage response. Numerous studies have been published in which gene and/or microRNA expression profiling has been performed after DNA damage, each using different time points, cell types, genotoxic stresses, dosages and technologies (21, 59-64, 161). These differences in experimental set up hamper the identification of common and specific responses activated by different types of DNA lesions. Several overrepresented pathways identified in our RNA sequencing datasets are also found by other studies, in which the p53 pathway is the best-studied example. Our study design allows detection of common and specific responses for genes, microRNAs and additional non-coding RNAs across time and type of DNA damage. The use of three different DNA lesion-inducing treatments has also the benefit of eliminating RNA expression responses from possible side effects. For example, cisplatin treatment provokes the regulation of a large number of RNAs. Cisplatin can also damage proteins and RNAs, which is likely to elicit additional cellular responses, including transcriptional alterations. Further putative side effects might be oxidative stress from IR and RNA and lipid membrane damage by UVC. Although

The RNA landscape kinetics of the DNA damage response
71
gene expression was highly similar across time and different genotoxic stresses, some noticeable differences were observed. The absence of DEGs 4 hours after UVC treatment as a result of technical errors is unlikely. Both the experimental set-up (Figure 1A) and the identification of several DEmiRs from the exact same samples overlapping with IR and cisplatin argue against this possibility. UV-lesions can induce DDR signalling by blocking DNA replication, leading to replication fork collapse and DDR signalling (162, 163). Secondly, UV-lesions efficiently block transcription, which also poses a signal for DDR activation (162, 163). The observed delayed UV-response in mES cells could be explained by these UV-lesion characteristics. Specialized translesion DNA polymerases will bypass damaged DNA during S-phase, which initially prevents replication fork arrest and DDR activation (164). Nucleotide excision repair (NER) is the main DNA repair machinery to repair UV-lesions. NER consists of two sub-branches: transcription-coupled repair (TCR) that repairs UV-lesions in transcribed DNA strands and global genome NER (GG-NER), which repairs UV-lesions across the genome (163). Transcription-blocking lesions can induce p53 signalling (165). It has been shown however, that mES cells rely more on GG-NER and to a lesser extent on TCR (148), which could also explain the observed delayed response. The experimental design of this study allows for analysing gene and microRNA kinetics responses across time. The clearest difference was observed between gene and microRNA expression in which the latter was expressed in time-specific patterns. Moreover, most DEGs and DEmiRs were induced, indicating a mainly activating response at the RNA level. These observations suggest that differential gene and microRNA expression are controlled by fundamentally different mechanisms. DNA damage-induced gene regulation as detected by RNA sequencing is likely the result of transcription activation in mES cells. MicroRNAs repress target gene expression by translation inhibition and/or mRNA degradation, in which the latter is detectable by RNA sequencing (29). The absence of DEGs and presence of many DEmiRs 4 hours after UVC indicate that translation inhibition, and not mRNA degradation, is the main mechanism of microRNAs to control gene expression in mES cells. In contrast, mouse NIH3T3 fibroblasts exhibit clear microRNA-mediated mRNA degradation after UV treatment as seen in a genome-wide profiling study (unpublished data), indicating cell type specific differences in choice of repression-mechanism. Therefore, gene expression alterations triggered by DNA damage will likely be the result of changes in promoter activity and concomitant transcription factors and/or repressor complexes. This can therefore be more easily studied in mES cells, since microRNA-mediated mRNA degradation does not interfere with mRNA expression changes. The short waves of microRNA expression are in agreement with a model in which microRNAs act in-between the early protein interaction and post-translational modification response and the relative slower transcription regulation (37). Post-transcriptional regulation of microRNAs

Chapter 4
72
themselves likely controls the observed fast and transient induction of microRNAs. Specialized proteins bind specific primary microRNAs and accelerate their maturation. Both the DNA damage checkpoint proteins ATM and p53 are shown to control post-transcriptional microRNA expression via this mechanism (38, 166). Thus, these results indicate expression kinetics is necessary for a properly functioning DDR. Numerous transcripts and fragments from non-coding and non-annotated regions were detected by mRNASeq and smallRNASeq. Hundreds of these transcripts or fragments were found differentially expressed. However, the overt majority doe not have a described function in literature. There are only a few non-coding RNAs verified and functionally characterised in relation to p53, including a large intergenic non-coding RNA (lincRNA) lincRNA-p21 (65). We found lincRNA-p21 expressed in mES cells and significantly regulated 8h after IR and cisplatin treatment. The hundreds of differentially expressed non-coding RNA transcripts without known function could add new layers to the DDR. Currently, little is known about the role of differential expression kinetics in the DDR. This study favours a model in which DDR-related transcription factors activate a general gene expression response required for the various steps within and the cellular outcome of DNA damage signalling, while microRNAs control the fine-tuning and timing of these events. This would imply that microRNAs regulate the outcome of DDR signalling depending on the type of genotoxic insult and/or the severity of the insult. The applied DNA damage doses in this study will lead to ~50% cell survival, but also apoptosis and/or terminal differentiation in mES cells as final cellular outcome. Further research is needed to elucidate how gene transcription and microRNA-mediated gene repression networks control cellular fate in response to DNA damage. In conclusion, we constructed an extensive overview of gene and microRNA expression changes in response to DNA damage, which will serve as a resource for future DDR studies.
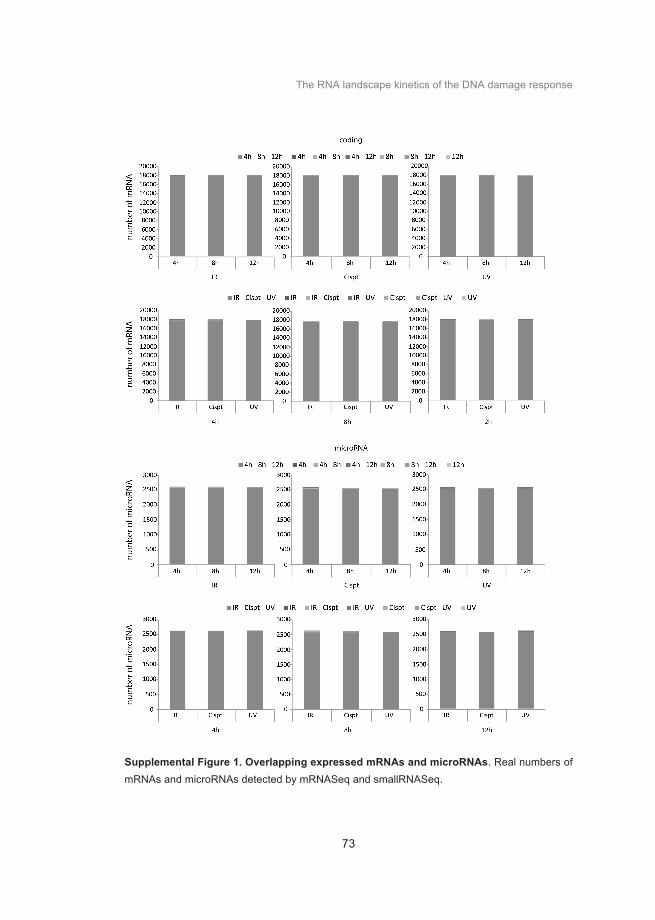
The RNA landscape kinetics of the DNA damage response
73
Supplemental Figure 1. Overlapping expressed mRNAs and microRNAs. Real numbers of mRNAs and microRNAs detected by mRNASeq and smallRNASeq.

Chapter 4
74
Supplemental Figure 2. Pearson expression correlation of additional RNA classes. Pearson correlation between all experimental conditions. The average number of sequence
reads per RNA species per condition was used. Only transcripts with at least 20 reads on average across all samples were used.
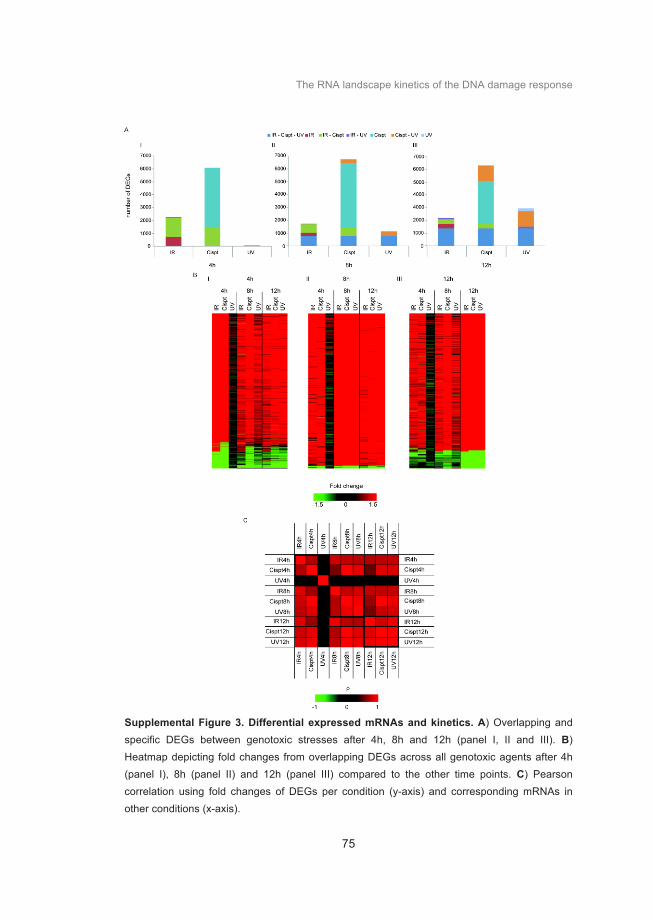
The RNA landscape kinetics of the DNA damage response
75
Supplemental Figure 3. Differential expressed mRNAs and kinetics. A) Overlapping and specific DEGs between genotoxic stresses after 4h, 8h and 12h (panel I, II and III). B) Heatmap depicting fold changes from overlapping DEGs across all genotoxic agents after 4h (panel I), 8h (panel II) and 12h (panel III) compared to the other time points. C) Pearson correlation using fold changes of DEGs per condition (y-axis) and corresponding mRNAs in other conditions (x-axis).

Chapter 4
76
Supplemental Figure 4. Differential expressed microRNAs and kinetics. A) Overlapping
and specific DEmiRs between the 4, 8, 12h time points after UVC, IR and cisplatin treatment. B) Heatmap depicting fold changes from overlapping DEmiRs in time from IR (panel I), cisplatin (panel II) and UVC (panel III) compared to the other genotoxic stresses. For UVC overlapping DEmiRs between 8 and 12h were also included. C) Pearson correlation using fold changes of DEmiRs per condition (y-axis) and corresponding microRNAs in other conditions (x-axis).

The RNA landscape kinetics of the DNA damage response
77
Supplemental Figure 5. Pearson correlation between differential expressed transcript and regions from mRNASeq. Pearson correlation using fold changes of differentially expressed long non-coding transcripts and non-annotated regions per condition (y-axis) and corresponding transcripts in other conditions (x-axis).

Chapter 4
78
Supplemental Figure 6. Pearson correlation between differential expressed transcript and fragments from smallRNASeq. Pearson correlation using fold changes of differentially expressed small non-coding transcripts per condition and non-annotated regions (y-axis) and
corresponding transcripts in other conditions (x-axis).

Chapter 5
Deciphering the RNA landscape by RNAome sequencing Kasper W.J. Derks, Branislav Misovic,
Mirjam C.G.N. van den Hout, Christel E.M. Kockx, Cesar Payan Gomez, Rutger W.W. Brouwer,
Harry Vrieling, Jan H.J. Hoeijmakers, Wilfred F.J. van IJcken,Joris Pothof
Submitted

Chapter 5
80
Abstract
Current RNA expression profiling methods rely on enrichment steps for specific RNA classes, thereby not detecting all RNA species. We report RNAome sequencing that determines expression of small and large RNAs from ribosomal RNA-depleted total RNA in a single sequence run. Since current analysis pipelines cannot reliably analyse small and large RNAs simultaneously, we developed TRAP, Total Rna Analysis Pipeline, a robust interface that is also compatible with existing RNA sequencing protocols. RNAome sequencing quantitatively preserved all RNA classes, allowing cross-class comparisons. We demonstrate the strength of RNAome sequencing in mouse embryonic stem cells treated with cisplatin. MicroRNA and mRNA expression in RNAome sequencing significantly correlated between replicates and was in concordance with both existing RNA sequencing methods and gene expression arrays generated from the same samples. Moreover, RNAome sequencing also detected additional RNA classes such as enhancer RNAs, novel RNA species and numerous differentially expressed RNAs undetectable by other methods. At the level of complete RNA classes, RNAome sequencing also identified a specific global repression of the microRNA and microRNA isoform classes whereas all other classes such as mRNAs were unchanged. We demonstrate that RNAome sequencing quantitatively preserves global and differential RNA expression patterns of RNA classes in mouse embryonic stem cells, which facilitates the identification of relationships between different RNA classes. These characteristics of RNAome sequencing will significantly improve expression analysis as well as studies on RNA biology not covered by existing methods.
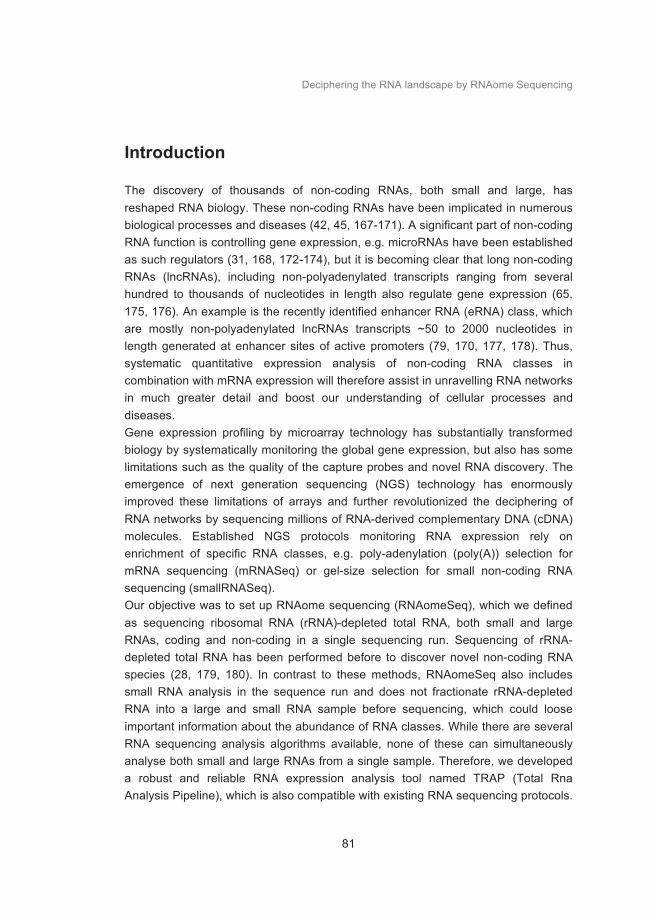
Deciphering the RNA landscape by RNAome Sequencing
81
Introduction
The discovery of thousands of non-coding RNAs, both small and large, has reshaped RNA biology. These non-coding RNAs have been implicated in numerous biological processes and diseases (42, 45, 167-171). A significant part of non-coding RNA function is controlling gene expression, e.g. microRNAs have been established as such regulators (31, 168, 172-174), but it is becoming clear that long non-coding RNAs (lncRNAs), including non-polyadenylated transcripts ranging from several hundred to thousands of nucleotides in length also regulate gene expression (65, 175, 176). An example is the recently identified enhancer RNA (eRNA) class, which are mostly non-polyadenylated lncRNAs transcripts ~50 to 2000 nucleotides in length generated at enhancer sites of active promoters (79, 170, 177, 178). Thus, systematic quantitative expression analysis of non-coding RNA classes in combination with mRNA expression will therefore assist in unravelling RNA networks in much greater detail and boost our understanding of cellular processes and diseases. Gene expression profiling by microarray technology has substantially transformed biology by systematically monitoring the global gene expression, but also has some limitations such as the quality of the capture probes and novel RNA discovery. The emergence of next generation sequencing (NGS) technology has enormously improved these limitations of arrays and further revolutionized the deciphering of RNA networks by sequencing millions of RNA-derived complementary DNA (cDNA) molecules. Established NGS protocols monitoring RNA expression rely on enrichment of specific RNA classes, e.g. poly-adenylation (poly(A)) selection for mRNA sequencing (mRNASeq) or gel-size selection for small non-coding RNA sequencing (smallRNASeq). Our objective was to set up RNAome sequencing (RNAomeSeq), which we defined as sequencing ribosomal RNA (rRNA)-depleted total RNA, both small and large RNAs, coding and non-coding in a single sequencing run. Sequencing of rRNA-depleted total RNA has been performed before to discover novel non-coding RNA species (28, 179, 180). In contrast to these methods, RNAomeSeq also includes small RNA analysis in the sequence run and does not fractionate rRNA-depleted RNA into a large and small RNA sample before sequencing, which could loose important information about the abundance of RNA classes. While there are several RNA sequencing analysis algorithms available, none of these can simultaneously analyse both small and large RNAs from a single sample. Therefore, we developed a robust and reliable RNA expression analysis tool named TRAP (Total Rna Analysis Pipeline), which is also compatible with existing RNA sequencing protocols.

Chapter 5
82
We show the improvements of RNAomeSeq over existing profiling protocols, i.e. mRNASeq, smallRNASeq and microarray, in mouse embryonic stem (mES) cells after cisplatin treatment.
Results
To obtain material for all omics protocols, mES cells were thawed, grown for 2 passages and subsequently either cisplatin- or mock-treated. 8 hours later total RNA was isolated. This complete procedure was repeated 4 times to obtain biological replicates for statistical analysis (Figure 1A). Cisplatin treatment was chosen due to its well-documented transcriptional response in mES cells (21). Samples received rigorous DNase treatment during total RNA isolation to eliminate genomic DNA contamination. Then, total RNA from each sample was aliquoted for usage in all omics protocols, i.e. RNAomeSeq, mRNASeq, smallRNASeq and Affymetrix gene expression arrays (Supplemental Table 1). The latter three were processed according to manufacturer’s instruction (see Material and Methods). Subsequently, total RNA aliquots for RNAomeSeq were depleted of highly abundant ribosomal RNA, using biotin-labelled LNA probes specific for ribosomal RNAs (i.e. 5S, 5.8S, 18S and 28S), and the remaining RNA was fragmented by sonication. All steps in this procedure were highly reproducible (Supplemental Figure 1). Sequencing adapters were ligated to the fragmented RNA allowing the generation of a cDNA library. Finally, adapter dimers (fragments < 145nt) were removed by gel size selection and the cDNA library was sequenced (36 nucleotides reads) (Figure 1B). While there are several RNA sequencing analysis algorithms available, none of these can reliably and simultaneously analyse both small and large RNAs from a single sample. Therefore, we developed TRAP (Total Rna Analysis Pipeline), which extracts data from sequence files, categorizes RNAs in classes, identifies post-transcriptional sequence modifications of small RNAs and performs statistical analysis. Moreover, TRAP is also compatible with standard mRNASeq and smallRNASeq (Figure 2). Briefly, prior to the analysis with TRAP, datasets containing small RNAs (i.e. the RNAomeSeq or smallRNASeq) were trimmed for adapter sequences. Then, sequence reads were divided into a small RNA category with RNA species length between 14 and 36 nucleotides after adapter trimming or into a group in which RNA species length is at least 36 nucleotides. The latter group was aligned to the reference genome with NARWHAL automation software (150). Expressed transcripts and regions were divided by RefSeq identifiers into 4 categories, i.e. coding transcripts, non-coding transcripts, intergenic or intronic transcripts (Figure 2A). All reads in the small RNA category were first aligned to
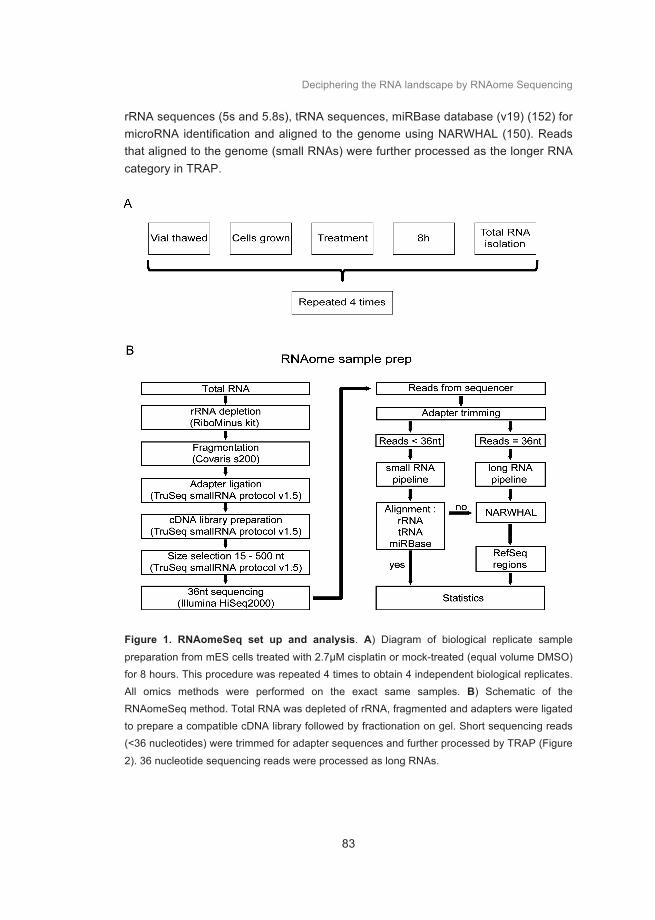
Deciphering the RNA landscape by RNAome Sequencing
83
rRNA sequences (5s and 5.8s), tRNA sequences, miRBase database (v19) (152) for microRNA identification and aligned to the genome using NARWHAL (150). Reads that aligned to the genome (small RNAs) were further processed as the longer RNA category in TRAP.
Figure 1. RNAomeSeq set up and analysis. A) Diagram of biological replicate sample
preparation from mES cells treated with 2.7µM cisplatin or mock-treated (equal volume DMSO) for 8 hours. This procedure was repeated 4 times to obtain 4 independent biological replicates. All omics methods were performed on the exact same samples. B) Schematic of the RNAomeSeq method. Total RNA was depleted of rRNA, fragmented and adapters were ligated to prepare a compatible cDNA library followed by fractionation on gel. Short sequencing reads (<36 nucleotides) were trimmed for adapter sequences and further processed by TRAP (Figure
2). 36 nucleotide sequencing reads were processed as long RNAs.

Chapter 5
84
The modular structure of TRAP also allows easy adjustments regarding transcript identifiers (e.g. GENCODE instead of RefSeq) or statistical algorithms (e.g. DESeq instead of EdgeR). The detection of short transcripts, such as snoRNAs, resulted in an overestimation of these transcripts when normalizing on transcripts length (such as RPKM or FPKM). Therefore, we only used statistical analysis algorithms with raw reads as input. There are several statistical analysis algorithms available for RNA sequencing datasets (151, 181-183). We tested the performance of 4 algorithms in the mRNASeq dataset and determined overlap in the microarray dataset (Supplemental Table 2). Three had similar performance, identifying 2055 to 2836 differentially expressed genes (DEGs), which were highly overlapping with the microarray results (74.2% - 76.8%). We used EdgeR(151) as the standard statistical analysis algorithm in TRAP for further analyses. Subsequently, we analysed the RNAomeSeq dataset. The reads obtained from RNAomeSeq allowed us to measure the abundance of all RNA classes found in mES cells (Figure 3A). Only 7.8% of the reads mapped to rRNA sequences (7.7% 45s in the large fraction, 0.1% 5/5.8s rRNA in small fraction), showing efficient depletion of rRNA. The percentage of reads that aligned (Supplemental Table 3) and did not align to the genome was similar to the mRNASeq and smallRNASeq datasets (Supplemental Figure 2). These unaligned reads are likely to result from SNP-rich regions (TRAP’s default settings allows 2 mismatches to the reference genome), small RNA fragments (TRAP’s default settings only include RNA molecules >14 nucleotides), reference genome differences or sequencing errors (Supplemental Figure 2). In the RNA fraction with a length of at least 36 nucleotides from RNAomeSeq we identified exonic reads, which refers to annotated, for function coding, transcripts (coding transcripts, mitochondrial transcripts, small nucleolar RNAs (snoRNAs) and annotated long non-coding RNAs (including e.g. pre-microRNAs)) and transcripts originating from intronic or intergenic regions (Figure 3A), which is similar to previously published long RNA classes distribution (184). The small RNA fraction contained mature microRNAs, microRNA isoforms (isomiRs) and additional small RNA molecules. In these non-microRNA/isomiR classes of small RNAs we identified fragments of tRNAs and small RNAs from coding, non-coding, intergenic and intronic regions (Figure 3A). The abundance of RNA classes found by mRNASeq (Figure 3B) and smallRNASeq (Figure 3C) showed the expected RNA classes enriched for poly(A)-coding transcripts and small RNAs, respectively.

Deciphering the RNA landscape by RNAome Sequencing
85
Figure 2. Schematic of the Total RNA Analysis Pipeline, TRAP, for analysis of sequencing datasets. A) Modules for long RNA analysis, script1 for RefSeq annotated exonic transcripts and script2 for RefSeq annotated non-exonic regions. B) Modules for small RNA
analysis, script3 to align trimmed reads to first rRNA, than tRNA sequences and the microRNA database, miRBase version 19.

Chapter 5
86

Deciphering the RNA landscape by RNAome Sequencing
87
Figure 3. The proportion of RNA species found in mES cells. A) The proportion of RNA classes detected by the RNAomeSeq protocol with a minimum of one read per million found across all biological replicates from at least one of the experimental groups. Detecting small RNA classes (right panel): tRNA fragments (0.2%), small coding (0.2%), small non-coding (0.3%), mature microRNA (miR) (0.7%), microRNA isoforms (isomiR) (0.9%), small intergenic (1.7%), small intronic (2.0%); and long RNA classes (left panel): non-coding transcripts also containing complete tRNAs (12.2%), coding transcripts (2.2%), snoRNA (19.4%), mitochondrial (1.9%), histones (0.2%), intronic region (37.4%), intergenic region (20.7%) classes. B) The proportion of RNA species detected by the mRNASeq protocol with a minimum of five reads found across all biological replicates from at least one of the experimental groups. Detecting coding transcripts (71.0%), non-coding transcripts (1.2%) and reads from mitochondrial (2.3%), histones (0.1%), intronic regions (9.3%) and intergenic regions (16.2%). C) The proportion of small RNA species detected by the smallRNASeq protocol with a minimum of five reads found across all biological replicates from at least one of the experimental groups. Detecting small RNA classes: tRNA fragments (4.0%), small coding (2.0%), small non-coding (17.6%), mature microRNA (miR) (27.9%), microRNA isoforms (isomiR) (25.7%), small intergenic (10.6%) and small intronic (12.1%). The indicated percentage represents the total aligned RNAs from that particular class compared to the total number of reads, excluding rRNA reads.

Chapter 5
88
To assess reliability, we determined correct RNA class representation in RNAomeSeq. Experimental verification of correct class representation is difficult to assess for most RNA classes. Poly(A) RNA however, can be quantitatively measured in a sample. Our results indicate that ~90% of total RNA represents rRNA (Additional file 2), ~2.2% of all reads referred to coding transcripts (Figure 3A) and mRNASeq that is based on poly(A) selection, indicated that ~71% of all reads map to coding regions (Figure 3B). This suggests that approximately 0.3% of total RNA represents poly(A) RNA. We measured poly(A) RNA content of our samples directly by poly(dT) beads isolation followed by bioanalyzer analysis (Supplemental Figure 3). This analysis indicate that indeed ~0.3% poly(A) RNA is present in total RNA, which is in line with our RNAomeSeq results. Additional cell lines from human and mouse origin had similar poly(A) RNA content, indicating that this observation is not specific for mES cells (Supplemental Figure 3). Reliability is also determined by putative biases introduced by RNAomeSeq compared to standard mRNASeq or smallRNASeq. First, we analysed the representation of transcripts in RNAomeSeq and mRNASeq by plotting the percentage of detected transcripts in transcript length bins (Figure 4A). A >99% overlap of coding transcripts was observed between RNAomeSeq and mRNASeq without any differences in transcript length distribution. Secondly, we determined gene expression correlation between RNAomeSeq and mRNASeq by plotting read count per million (CPM) per coding transcript in a XY-scatterplot (Figure 4B). Quantitative gene expression levels detected by RNAomeSeq were highly similar to mRNASeq (Pearson correlation coefficient R=0.86; p<2.2e-16). There was a noticeable difference: a class of coding transcripts was highly expressed in RNAomeSeq (Figure 4B, red circle), but hardly expressed in mRNASeq. This group consisted of histones, which have very short or absent poly-A tails and are therefore hard to detect with standard mRNASeq. Thirdly, we determined the distribution of sequence reads mapping to coding transcripts across the gene body (Figure 4C). In contrast to mRNASeq in which read density was equal across the gene body except for the 5’ and 3’ transcript ends, RNAomeSeq harboured several specific peaks. These peaks were produced by intronic snoRNAs, which transcripts overlap with exons from host genes. Therefore, these sequences were automatically included in this analysis. Removal of intronic snoRNAs from the analysis, which are also not detected by mRNASeq, abolished these peaks and produced a similar distribution as seen in mRNASeq. Finally, we determined any bias for small or large transcripts in the detected sequence reads. The percentage of detected sequence reads was plotted for transcript length bins (Figure 4D). A slight deviation was observed compared to mRNASeq, which could be explained by intronic snoRNAs and histone sequences (Figure 4D). In toto, RNAomeSeq performs equally compared to standard mRNASeq without any biases in detecting coding transcripts

Deciphering the RNA landscape by RNAome Sequencing
89
Subsequently, we determined putative biases in microRNA and isomiR detection by RNAomeSeq. By plotting the percentage of detected transcripts in transcript length bins, we observed that the representation of transcripts in RNAomeSeq and smallRNASeq was similar (Figure 5A). There was however, a clear shift towards increased microRNA length in both smallRNASeq and RNAomeSeq compared to miRBase (v19), which could be explained by a lack of isomiRs in miRBase. Quantitative microRNA and isomiR expression correlation between RNAomeSeq and smallRNASeq was also very similar (Pearson correlation coefficient R=0.76; p<2.2e-16) between RNAomeSeq and smallRNASeq as seen in a XY-scatterplot in which CPM per microRNA/isomiR has been plotted (Figure 5B). Finally, we determined any bias for microRNA/isomiR length in the detected sequence reads by plotting the percentage of detected microRNA/isomiR transcripts per length (Figure 5C). A slight deviation was observed between the two methods, i.e. a decrease in microRNA/isomiRs with a length of 21 nucleotides and an increase in 24 nucleotide long microRNAs/isomiRs. Sample preparation differences such as gel excision (smallRNASeq) might explain the differences. RNA fractionation as performed in RNAomeSeq could result in fragments of long transcripts in the small RNA compartment that align to the genome and thereby generate observed differences between RNAomeSeq and smallRNASeq (Figure 3A, 3C). We did not observe any obvious expression correlation in coding, non-coding, intergenic and intronic transcript levels between the small and large fractions in RNAomeSeq (Supplemental Figure 4). Taken together, this data indicate that RNAomeSeq correctly represents small RNA expression as well. Table 1. The Pearson-correlation between replicate samples in RNAomeSeq, mRNASeq and smallRNASeq. For the coding transcripts and/or microRNAs, all correlations had p-value < 2.2E-16.

Chapter 5
90
Figure 4. Representation of coding transcripts. A) Coding transcript length distribution of the whole genome or detected by mRNASeq and RNAomeSeq. B) The Pearson-correlation between and X-Y scatter plot of coding transcript expression between RNAomeSeq and mRNASeq, histones encircled in red. C) Distribution of reads along the body of all coding transcript for mRNASeq, RNAomeSeq and RNAomeSeq depl (depleted of histones and transcripts with intronic snoRNA). D) Distribution of reads aligning to the detected coding transcripts by mRNASeq, RNAomeSeq and RNAomeSeq depl (depleted of histones and transcripts with intronic snoRNA) in regard to transcript length.
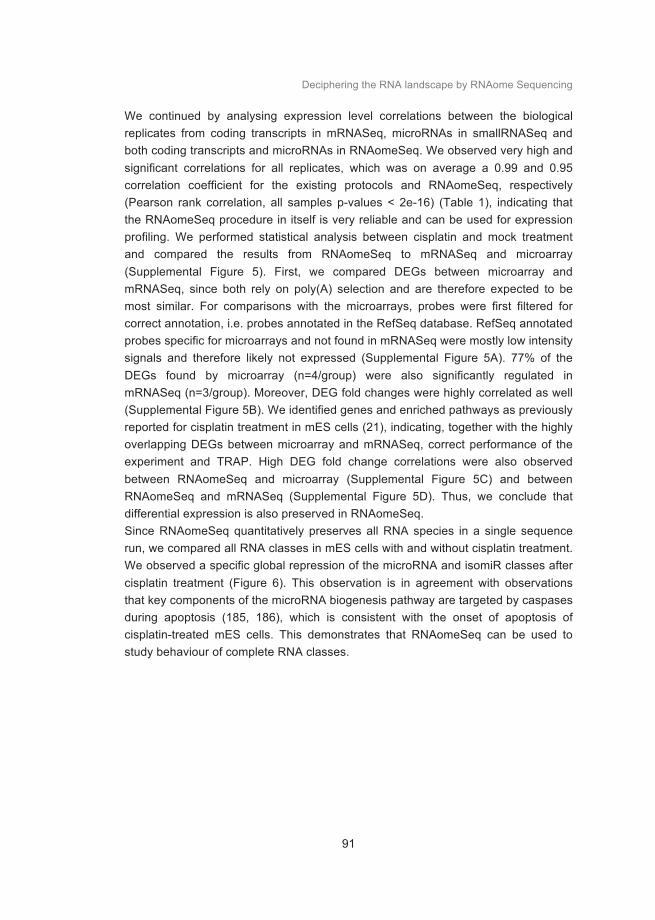
Deciphering the RNA landscape by RNAome Sequencing
91
We continued by analysing expression level correlations between the biological replicates from coding transcripts in mRNASeq, microRNAs in smallRNASeq and both coding transcripts and microRNAs in RNAomeSeq. We observed very high and significant correlations for all replicates, which was on average a 0.99 and 0.95 correlation coefficient for the existing protocols and RNAomeSeq, respectively (Pearson rank correlation, all samples p-values < 2e-16) (Table 1), indicating that the RNAomeSeq procedure in itself is very reliable and can be used for expression profiling. We performed statistical analysis between cisplatin and mock treatment and compared the results from RNAomeSeq to mRNASeq and microarray (Supplemental Figure 5). First, we compared DEGs between microarray and mRNASeq, since both rely on poly(A) selection and are therefore expected to be most similar. For comparisons with the microarrays, probes were first filtered for correct annotation, i.e. probes annotated in the RefSeq database. RefSeq annotated probes specific for microarrays and not found in mRNASeq were mostly low intensity signals and therefore likely not expressed (Supplemental Figure 5A). 77% of the DEGs found by microarray (n=4/group) were also significantly regulated in mRNASeq (n=3/group). Moreover, DEG fold changes were highly correlated as well (Supplemental Figure 5B). We identified genes and enriched pathways as previously reported for cisplatin treatment in mES cells (21), indicating, together with the highly overlapping DEGs between microarray and mRNASeq, correct performance of the experiment and TRAP. High DEG fold change correlations were also observed between RNAomeSeq and microarray (Supplemental Figure 5C) and between RNAomeSeq and mRNASeq (Supplemental Figure 5D). Thus, we conclude that differential expression is also preserved in RNAomeSeq. Since RNAomeSeq quantitatively preserves all RNA species in a single sequence run, we compared all RNA classes in mES cells with and without cisplatin treatment. We observed a specific global repression of the microRNA and isomiR classes after cisplatin treatment (Figure 6). This observation is in agreement with observations that key components of the microRNA biogenesis pathway are targeted by caspases during apoptosis (185, 186), which is consistent with the onset of apoptosis of cisplatin-treated mES cells. This demonstrates that RNAomeSeq can be used to study behaviour of complete RNA classes.
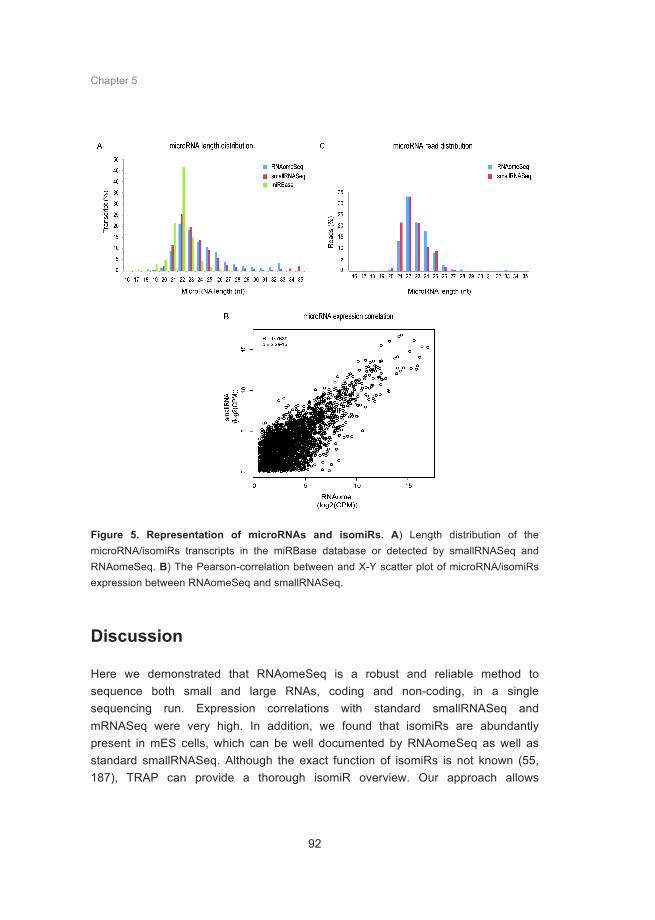
Chapter 5
92
Figure 5. Representation of microRNAs and isomiRs. A) Length distribution of the microRNA/isomiRs transcripts in the miRBase database or detected by smallRNASeq and RNAomeSeq. B) The Pearson-correlation between and X-Y scatter plot of microRNA/isomiRs expression between RNAomeSeq and smallRNASeq.
Discussion
Here we demonstrated that RNAomeSeq is a robust and reliable method to sequence both small and large RNAs, coding and non-coding, in a single sequencing run. Expression correlations with standard smallRNASeq and mRNASeq were very high. In addition, we found that isomiRs are abundantly present in mES cells, which can be well documented by RNAomeSeq as well as standard smallRNASeq. Although the exact function of isomiRs is not known (55, 187), TRAP can provide a thorough isomiR overview. Our approach allows

Deciphering the RNA landscape by RNAome Sequencing
93
simultaneous analysis of RNA expression, identification of novel RNAs and transcripts and a comparison between RNA classes. As far as we can determine, the RNAomeSeq method does not introduce additional biases in quantitative transcript expression within a RNA class, such as microRNAs or coding transcripts, compared with standard smallRNASeq and mRNASeq. Next to a high transcript expression correlation between RNAomeSeq and mRNASeq / smallRNASeq, we did not observe a transcript length bias or differences in read distribution across transcripts. There were some noticeable differences between RNAomeSeq and mRNASeq, mostly in the detection of specific RNA classes (see Figure 3). RNAomeSeq was able to identify non-polyadenylated RNAs, including histones and snoRNAs, and improved detection of annotated long non-coding RNAs. The completeness of RNAomeSeq also provides a disadvantage: sequencing depth should be sufficient in order to identify and classify differentially expressed genes. The expected decrease in sequencing costs however, will compensate for the required sequencing depth. Current methods based on RNA selection cannot quantitatively determine transcript level ratios across RNA classes. While RNAomeSeq detects most, if not all, RNA classes besides rRNA, it is conceivable that the technical procedures of RNAomeSeq introduce detection biases towards or against specific RNA species and classes. Therefore, it remains a question to what extent RNAomeSeq can be used to quantitatively determine transcript level ratios between RNA classes or map a complete quantitative RNAome from a sample. Qualitative analysis, i.e. comparisons between experimental groups, is not hampered by biases. Two putative biases could be identified. Small RNAs are favoured over longer RNAs in NGS methods and therefore overrepresented. Secondly, RNA fragmentation by sonication could result in a break at the hydroxyl or the phosphate group at the 3’ end. The 3' adapter used in the NGS protocol is specifically modified to ligate to RNAs with a 3' hydroxyl group, such as microRNAs, resulting from enzymatic cleavage by Dicer or other RNA processing enzymes. However, the detection of numerous isomiRs, to which specialized enzymes add additional nucleotides at the 3’ end after Dicer cleavage, would suggest that the 3’ adapter has tolerance for other 3’ ends as well. Furthermore, if we assume that breakage by sonication occurs randomly, we would expect that only 1 in 2 fragments could be used in sequence adapter ligation and subsequent cDNA formation, which could translate into a 2-fold underrepresentation of non-enzymatically processed small and longer RNAs in RNAomeSeq. To estimate an underrepresentation or overrepresentation of specific RNA classes, it is essential to know the ratio between specific RNA classes. Single cell sequencing experiments and subsequent follow up studies have provided an estimate for the total number of mRNAs (188) and microRNAs (189) in a single mES cell. These data indicate that for every mRNA molecule 5 microRNA molecules are present in

Chapter 5
94
mES cells. (188, 189) Since the smallRNASeq adapter ligation kit for RNAomeSeq was used, we assume that microRNAs and isomiRs are very efficient labelled and sequenced in which 1 microRNA translates to 1 sequence read. 2.2% of the detected reads in RNAomeSeq aligned to coding transcripts and 1.6% to microRNA transcripts. (Figure 3) Coding transcript with a mean length of 3300 nucleotides (Figure 4A) are likely to break evenly during fragmentation with an average fragment size of 300 nucleotides (Supplemental Figure 1). Thus, we expect approximately 11 fragments per transcript. Subsequent calculations estimate the presence of 1 mRNA molecule per 8 microRNA molecules in RNAomeSeq, suggesting a ~1.6 fold overrepresentation of microRNA or underrepresentation of mRNA molecules. While exact RNA content in a single cell or sample is difficult to assess, several observations allow us to provide a rough estimate of the expected number of mRNA sequencing reads in RNAomeSeq. The poly(A) content of a typical cell is 1% of the total RNA (190), implicating an underrepresentation of the poly(A) content in RNAomeSeq, since our experiments indicate ~0.3% poly(A) content and an estimated 0.2 – 025% mRNAs in total RNA from mES cells (Figure 3A and Supplemental Figure 3). Compared to other cell types however, mES cells have fewer mRNA molecules per cell (20-fold reduction) as well as lower total RNA content per cell (5.5-fold reduction) (188). This suggests a relative ~3.6-fold lower mRNA content in mES cells. The standard mRNASeq data indicates that ~71% of all poly(A) RNA refers to coding transcripts (Figure 3B). Extrapolating these estimations, one would expect ~2% of the reads in RNAomeSeq to refer to coding transcripts, which is in agreement with our observations. These calculations suggest an overrepresentation of microRNAs rather than underrepresentation of mRNA molecules in RNAomeSeq. Transcripts from intergenic and intronic regions were abundantly present among small and large RNA classes, among which we could also identify differential expressed RNAs, suggesting functional roles in the cellular cisplatin response. In particular the large content of intronic transcripts was intriguing for both cisplatin- and mock-treated samples. We found in RNAomeSeq that on average 37.4% of the reads originated from intronic regions. This could be the result of I) the presence of pre-mRNAs, II) more stable than anticipated spliced introns, or III) functional non-coding RNAs originating from intronic regions.

Deciphering the RNA landscape by RNAome Sequencing
95
Figure 6. Quantitative preservation of all RNA species Total proportion of RNA classes before and after cisplatin treatment. Panel I) Long RNA classes, Panel II) Small RNA classes. Error bars represent standard deviations. It is likely that a part of the intronic sequences can be explained by the presence of pre-mRNAs or stable introns, although we did not observe that reads from intronic regions were evenly distributed across all expressed introns/genes (Supplemental Figure 6), which is expected when introns are stable. We also did not observe any correlation between highly expressed genes and intronic transcripts nor the presence of reads that overlap exon-intron boundaries, which would have been expected from pre-mRNAs. We suggest that a significant part of all intronic
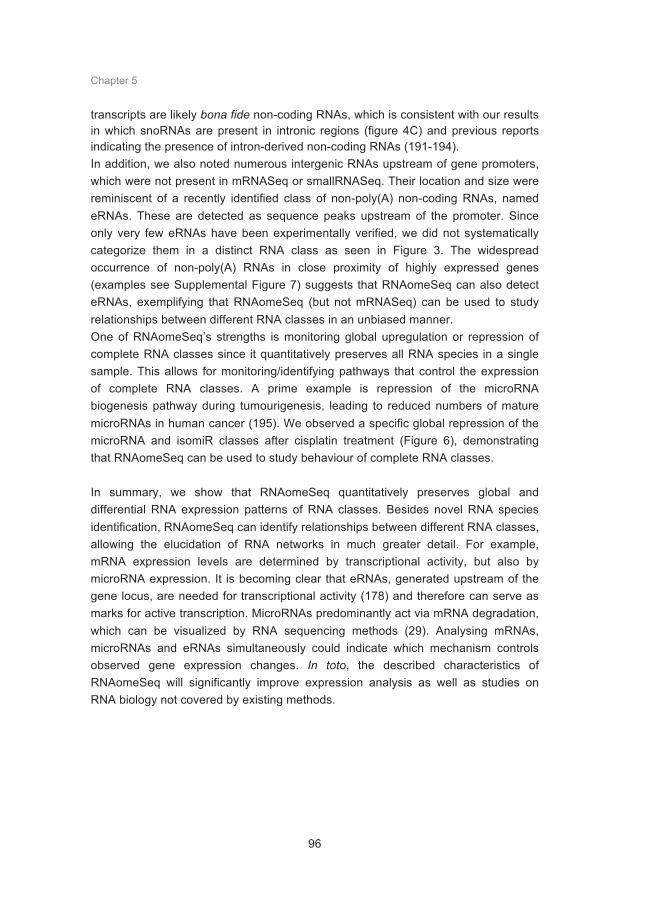
Chapter 5
96
transcripts are likely bona fide non-coding RNAs, which is consistent with our results in which snoRNAs are present in intronic regions (figure 4C) and previous reports indicating the presence of intron-derived non-coding RNAs (191-194). In addition, we also noted numerous intergenic RNAs upstream of gene promoters, which were not present in mRNASeq or smallRNASeq. Their location and size were reminiscent of a recently identified class of non-poly(A) non-coding RNAs, named eRNAs. These are detected as sequence peaks upstream of the promoter. Since only very few eRNAs have been experimentally verified, we did not systematically categorize them in a distinct RNA class as seen in Figure 3. The widespread occurrence of non-poly(A) RNAs in close proximity of highly expressed genes (examples see Supplemental Figure 7) suggests that RNAomeSeq can also detect eRNAs, exemplifying that RNAomeSeq (but not mRNASeq) can be used to study relationships between different RNA classes in an unbiased manner. One of RNAomeSeq’s strengths is monitoring global upregulation or repression of complete RNA classes since it quantitatively preserves all RNA species in a single sample. This allows for monitoring/identifying pathways that control the expression of complete RNA classes. A prime example is repression of the microRNA biogenesis pathway during tumourigenesis, leading to reduced numbers of mature microRNAs in human cancer (195). We observed a specific global repression of the microRNA and isomiR classes after cisplatin treatment (Figure 6), demonstrating that RNAomeSeq can be used to study behaviour of complete RNA classes. In summary, we show that RNAomeSeq quantitatively preserves global and differential RNA expression patterns of RNA classes. Besides novel RNA species identification, RNAomeSeq can identify relationships between different RNA classes, allowing the elucidation of RNA networks in much greater detail. For example, mRNA expression levels are determined by transcriptional activity, but also by microRNA expression. It is becoming clear that eRNAs, generated upstream of the gene locus, are needed for transcriptional activity (178) and therefore can serve as marks for active transcription. MicroRNAs predominantly act via mRNA degradation, which can be visualized by RNA sequencing methods (29). Analysing mRNAs, microRNAs and eRNAs simultaneously could indicate which mechanism controls observed gene expression changes. In toto, the described characteristics of RNAomeSeq will significantly improve expression analysis as well as studies on RNA biology not covered by existing methods.

Deciphering the RNA landscape by RNAome Sequencing
97
Methods
Total RNA isolation
Mouse embryonic stem (mES) cells (HM1) were cultured as described (21). One vial of mES cells was thawed and grown for two passages on feeder-coated plates followed by one passage on gelatin-coated plates before beginning the experiment. The mES cells in experiment were treated with 2.7µM cisplatin (75% survival; Platosin) or mock-treated (equal volume dimethylsulfoxide (DMSO)). After 8h continuous exposure total RNA was isolated using Qiazol Lysis Reagent (Qiagen) and total RNA was purified with the miRNeasy kit (Qiagen), according to manufacturer's protocols. The integrity (scores >9.0) of the RNA was determined on the Agilent 2100 Bioanalyzer (Agilent) according to manufacturer’s protocol. This procedure was repeated four times to obtain 4 independent biological replicates. Subsequent sequencing and array protocols were performed on the total RNA from the same biological samples.
Microarray sample preparation
The poly(A) RNA enrichment for Affymetrix GeneTitan® array was performed by ServiceXS, following their standard protocol. In short, 100ng of total RNA was labelled with the Affymetrix 3' IVT-Express Labeling Kit (containing oligo dT primers), amplified and fragmented before hybridizing to Affymetrix HT Mouse Genome 430 PM Array.
mRNASeq sample preparation
Total RNA enrichment for sequencing poly(A) RNAs was performed with the TruSeq mRNA sample preparation kit (Illumina) according to the manufacturer’s protocols. In short, 1 µg of total RNA for each sample was used for poly(A) RNA selection using magnetic beads coated with poly-dT, followed by thermal fragmentation. The fragmented poly(A) RNA enriched samples were subjected to cDNA synthesis using Illumina TruSeq preparation kit according to the manufacturer’s protocol. Briefly, cDNA was synthesized by reverse transcriptase (Super-Script II) using poly-dT and random hexamer primers. The cDNA fragments were then blunt-ended through an end-repair reaction, followed by dA-tailing. Subsequently, specific double-stranded bar-coded adapters were ligated and library amplification for 15 cycles was performed.

Chapter 5
98
SmallRNASeq sample preparation
The cDNA library for smallRNASeq was generated by the small RNASeq kit (Illumina TruSeq smallRNA v1.5) according to the manufacturer’s protocol. In short, specific bar-coded adapters were ligated to 1 µg of total RNA followed by reverse transcriptase and amplification for 11 cycles. Small RNAs were enriched by fractionation on a 15% Tris-borate-EDTA gel, excising the RNAs of 15-30 nucleotide of length.
RNAomeSeq sample preparation
Ribosomal RNA (rRNA) depletion was performed using RiboMinus Eukaryote Kit (Life Science), according to the manufacturer’s protocol. 10 µg of total RNA was incubated with biotin-labelled LNA probes (2 for each of the 4 rRNA species, i.e. 5S, 5.8S, 18S and 28S) and hybridized to streptavidin-coated magnetic beads. The rRNA-depleted samples were concentrated using the RiboMinus Concentration Module, according to manufacturer’s protocols. The concentrated rRNA-depleted samples were fragmented by sonication (Covaris s200, duty cycle 5% and 200burst/cycle for 210sec), to fragments smaller than 500 nucleotides. The cDNA library preparation was performed according to the smallRNASeq sample preparation. Adapter dimers, approx. 145 nucleotides in length, were removed by excising RNAs ranging 160- 645 nucleotide of length from the gel, corresponding to RNAs 15-500nt in length. The excised gel containing the adapter-ligated cDNA fragments were extracted from the gel using the gel breaker kit (IST Engineering). Finally, the cDNA was pooled after extraction and further prepared for sequencing.
Sequencing
The pooled cDNA libraries all consisted of equal concentration bar-coded samples, i.e. three mock- and three cisplatin-treated samples. The mRNASeq and smallRNASeq pooled libraries were sequenced in one lane each and the RNAomeSeq pooled library was sequenced in two lanes, all 36bp single read on the HiSeq2000 (Illumina).
Total RNA analysis pipeline
The analysis of the sequencing datasets was performed with TRAP, which stands for Total RNA Analysis Pipeline. The analysis was performed on a quad-core CPU desktop with 64-bits windows system and 16 gigabyte RAM. Per sample, the analysis takes around five minutes for mRNASeq and twenty minutes for smallRNASeq.

Deciphering the RNA landscape by RNAome Sequencing
99
The RNAomeSeq and smallRNASeq reads were, prior to the analysis with TRAP, trimmed for adapter sequences with a custom script. Reads from RNAomeSeq and mRNASeq were aligned to the mouse mm9 reference genome using Tophat (version 1.3.1.Linux_x86_64, --coverage-search, -butterfly-search, --segment-mismatches 1,--segment-length 18) via the NARWHAL automation software (150). We have developed NARWHAL to automate sequence data processing using pre-existing open-source tools. TRAP makes use of several R Bioconductor (196) packages, e.g. Biostrings (version 2.26.3), Rsamtools (version 1.10.2), IRanges (version 1.16.6), GenomicRanges (version 1.10.7), Limma (197) and EdgeR (151). Reads that aligned within and between RefSeq transcripts were extracted from the resulting BAM files using Scripts 1 and 2 in module I. RefSeq can be replaced in TRAP by other annotations such as GENCODE depending on the users preference. Exonic reads were summed per transcript. In module II, a specific transcript or region was referred to as expressed, when a predefined threshold was reached (1 read per million). The threshold was defined as a minimum number of reads that could be aligned to a transcript or non-exonic region across all biological replicates in at least one of the experimental groups. In module III, expressed transcripts were divided by RefSeq identifiers into coding and non-coding transcripts. The non-exonic regions were divided by location into an intergenic or intronic category. Statistical analysis of the transcripts and regions can be performed with several published statistical algorithms for mRNASeq that are all compatible with TRAP. We used in our analysis EdgeR (151), since this was the best performing statistical algorithm. Next, we used TRAP to analyse reads smaller than 36 nucleotides from smallRNASeq and RNAomeSeq. In module I, trimmed sequence reads were discarded if smaller than 14 nucleotides of length. Reads were referred to as expressed when the threshold was reached, which was defined as a predefined minimal reads being present in all biological replicates in at least one experimental group. In Module II, the expressed reads were first aligned to rRNA sequences (5s and 5.8s), tRNA sequences, the miRBase (152) database (v19) (using vmatchPattern from the Biostrings package) or the genome (using NARWHAL(150), using only bowtie; --best, -l 32, -n 2, -M 1). In module III, statistical analysis of the tRNA aligned reads and miRBase (152) aligned reads (microRNAs) was performed with EdgeR (151). The reads aligned to the genome (small RNAs) were further processed as long RNAs in Script 1 and 2 in TRAP. Threshold in TRAP can be manually set and adjusted according to needs.

Chapter 5
100
Statistics and pathway analysis
Differentially expressed (DE) transcripts were identified in the mRNASeq dataset with EdgeR (151), assuming negative binomial distribution of the reads. DE transcripts were identified in the Affymetrix dataset by computing a linear model using Limma (197). For both platforms cut-offs were used for DE transcripts detection (fold change > 1.5 and FDR < 0.05). Pathway analysis was performed with Ingenuity Pathway Analysis Software.
Proportion of RNA species
The proportion of RNA species was defined by the number of reads that primary aligned to the genome (script 1 and 2 proportion). Only reads used to align to the genome were 36 nucleotides of length or did not align to miRBase (152), tRNA or rRNA sequences. The proportion of small RNA reads (<36 nucleotides) was defined by being uniquely aligned to miRBase (152), rRNA or tRNA. The proportion of protein-coding RNAs found in the RNAomeSeq dataset was validated using a gel-analysis of poly(A) RNA enriched by poly-dT beads. We added magnetic beads coated with poly-dT, from the mRNASeq protocol (Illumina TruSeq), to 1ug of total RNA. The bound poly(A) RNA was subsequently analysed on an RNA pico-chip Agilent 2100 Bioanalyzer (Agilent), using manufacturer’s protocols.
Availability of supporting data
Data has been deposited in the GEO database under the number GSE48084.
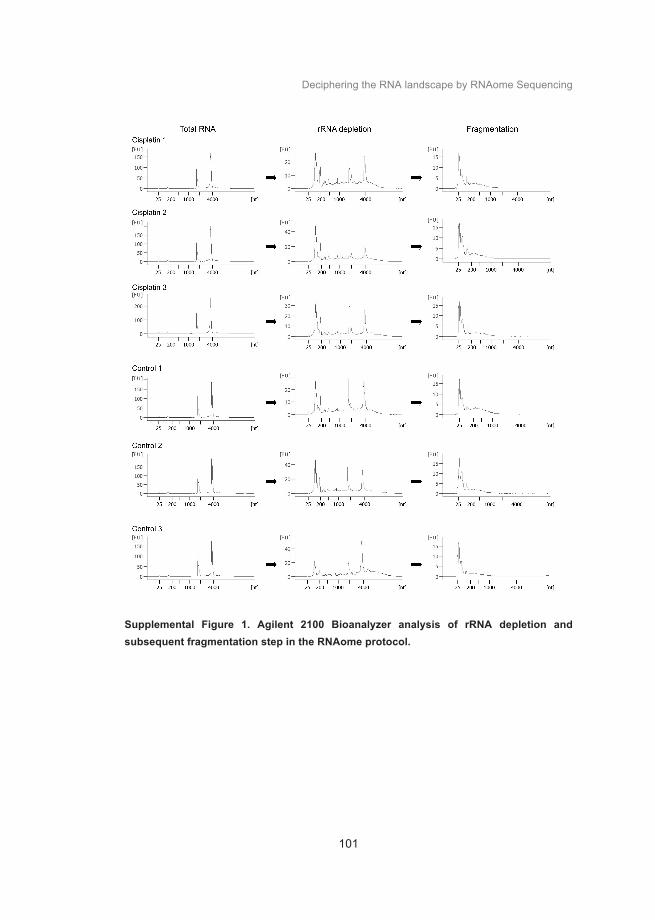
Deciphering the RNA landscape by RNAome Sequencing
101
Supplemental Figure 1. Agilent 2100 Bioanalyzer analysis of rRNA depletion and subsequent fragmentation step in the RNAome protocol.
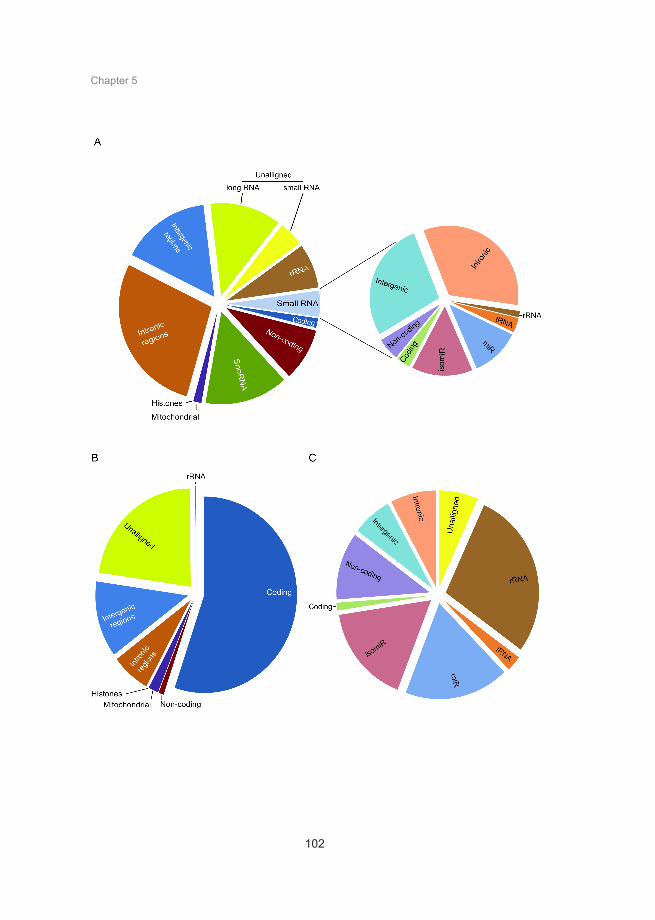
Chapter 5
102
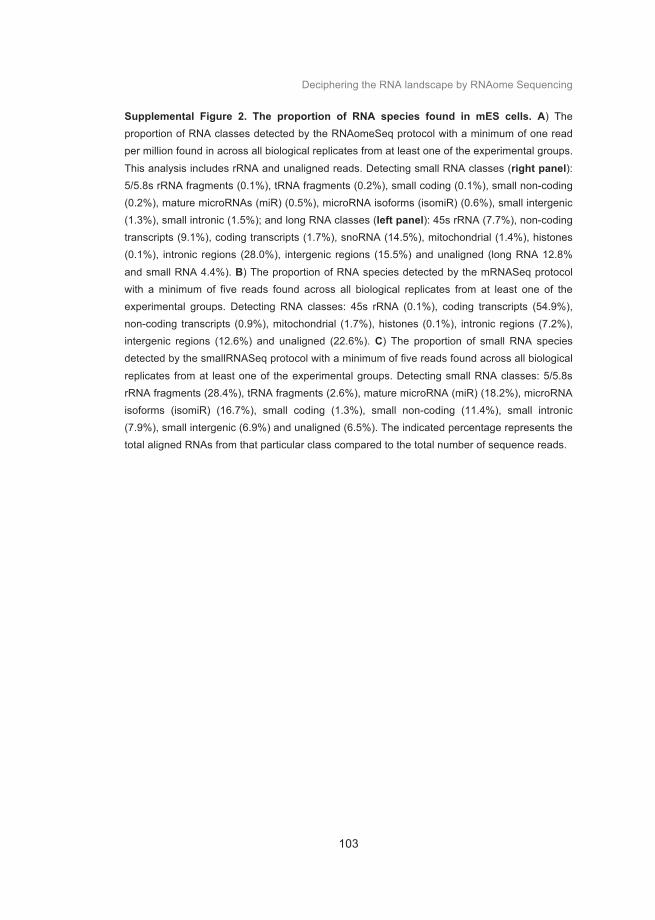
Deciphering the RNA landscape by RNAome Sequencing
103
Supplemental Figure 2. The proportion of RNA species found in mES cells. A) The proportion of RNA classes detected by the RNAomeSeq protocol with a minimum of one read per million found in across all biological replicates from at least one of the experimental groups.
This analysis includes rRNA and unaligned reads. Detecting small RNA classes (right panel): 5/5.8s rRNA fragments (0.1%), tRNA fragments (0.2%), small coding (0.1%), small non-coding (0.2%), mature microRNAs (miR) (0.5%), microRNA isoforms (isomiR) (0.6%), small intergenic (1.3%), small intronic (1.5%); and long RNA classes (left panel): 45s rRNA (7.7%), non-coding transcripts (9.1%), coding transcripts (1.7%), snoRNA (14.5%), mitochondrial (1.4%), histones (0.1%), intronic regions (28.0%), intergenic regions (15.5%) and unaligned (long RNA 12.8%
and small RNA 4.4%). B) The proportion of RNA species detected by the mRNASeq protocol with a minimum of five reads found across all biological replicates from at least one of the experimental groups. Detecting RNA classes: 45s rRNA (0.1%), coding transcripts (54.9%), non-coding transcripts (0.9%), mitochondrial (1.7%), histones (0.1%), intronic regions (7.2%), intergenic regions (12.6%) and unaligned (22.6%). C) The proportion of small RNA species detected by the smallRNASeq protocol with a minimum of five reads found across all biological
replicates from at least one of the experimental groups. Detecting small RNA classes: 5/5.8s rRNA fragments (28.4%), tRNA fragments (2.6%), mature microRNA (miR) (18.2%), microRNA isoforms (isomiR) (16.7%), small coding (1.3%), small non-coding (11.4%), small intronic (7.9%), small intergenic (6.9%) and unaligned (6.5%). The indicated percentage represents the total aligned RNAs from that particular class compared to the total number of sequence reads.

Chapter 5
104
Supplemental Figure 3. Poly-adenylated (Poly(A)) RNA content of total RNA. 1µg of total RNA was added to poly(dT) coated beads from the mRNASeq protocol and poly(A)+ RNA was isolated. The concentration of poly(A) RNAs was measured by Agilent 2100 Bioanalyzer
analysis. This indicated that on average ~0.3% (3ng) of the total RNA was poly(A)+ RNA. A representative plot is shown for mES (upper), U2OS (middle) and HEK293T (lower) cells.

Deciphering the RNA landscape by RNAome Sequencing
105
Supplemental Figure 4. Pearson correlation of transcripts (coding and non-coding) and regions (intergenic and intronic). A-D) The expression revealed no correlation for coding
transcripts (A), non-coding transcripts (B), Intronic regions (C) or Intergenic regions (D) and the corresponding fragments, between the long RNA fraction and the small RNA fraction.

Chapter 5
106
Supplemental Figure 5. Comparison between microarray and sequencing based coding transcript detection. A) Fluorescence intensity distribution for 3856 transcripts detected by microarray only. Note that microarray unique transcripts have in general a low intensity and are thus likely non-expressed genes. B-D) The correlation of fold changes of RefSeq annotated differentially expressed coding transcripts, FDR<0.05 and FC ±1.5, found in RNAomeSeq. (B) Microarray versus mRNASeq, (C) microarray versus RNAomeSeq and (D) mRNASeq versus RNAomeSeq.
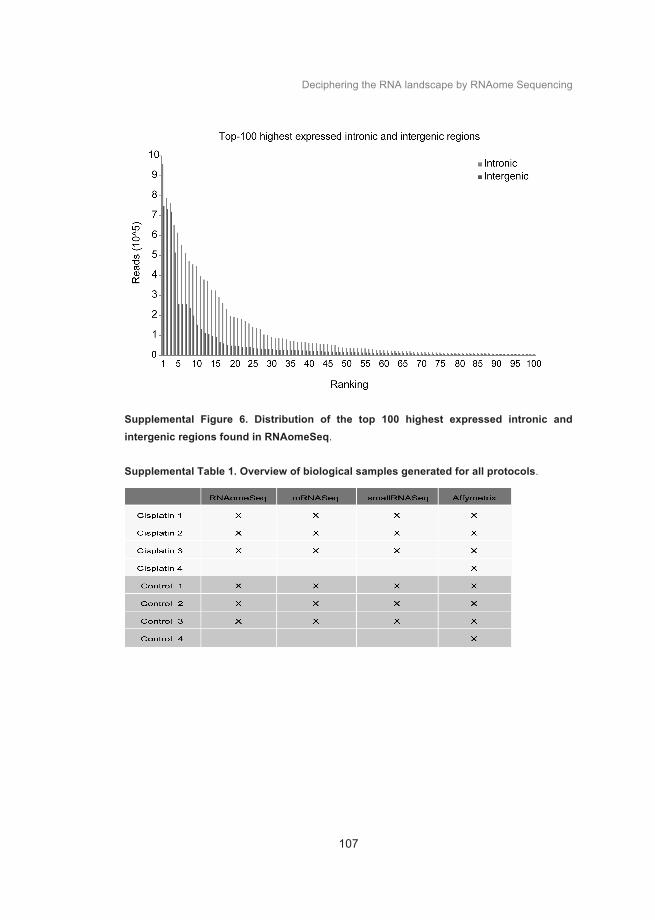
Deciphering the RNA landscape by RNAome Sequencing
107
Supplemental Figure 6. Distribution of the top 100 highest expressed intronic and intergenic regions found in RNAomeSeq. Supplemental Table 1. Overview of biological samples generated for all protocols.
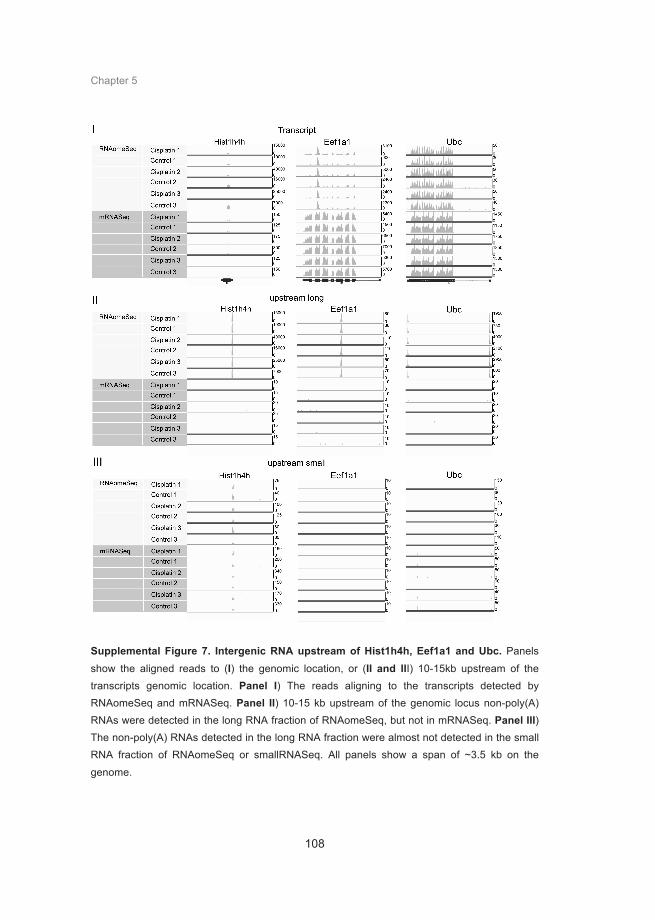
Chapter 5
108
Supplemental Figure 7. Intergenic RNA upstream of Hist1h4h, Eef1a1 and Ubc. Panels
show the aligned reads to (I) the genomic location, or (II and III) 10-15kb upstream of the transcripts genomic location. Panel I) The reads aligning to the transcripts detected by RNAomeSeq and mRNASeq. Panel II) 10-15 kb upstream of the genomic locus non-poly(A) RNAs were detected in the long RNA fraction of RNAomeSeq, but not in mRNASeq. Panel III) The non-poly(A) RNAs detected in the long RNA fraction were almost not detected in the small RNA fraction of RNAomeSeq or smallRNASeq. All panels show a span of ~3.5 kb on the
genome.
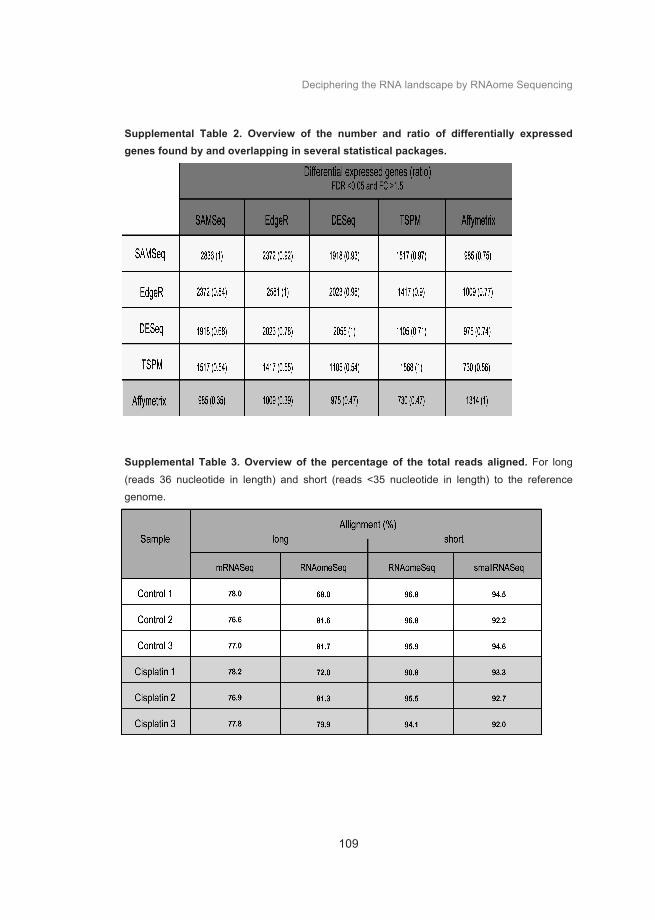
Deciphering the RNA landscape by RNAome Sequencing
109
Supplemental Table 2. Overview of the number and ratio of differentially expressed genes found by and overlapping in several statistical packages.
Supplemental Table 3. Overview of the percentage of the total reads aligned. For long
(reads 36 nucleotide in length) and short (reads <35 nucleotide in length) to the reference genome.


Chapter 6
General discussion and future perspectives
Adapted from: The DNA damage response: the omics era and its impact
Kasper WJ Derks, Joris Pothof, Jan HJ Hoeijmakers
DNA Repair (Amst). 2014 Jul;19:214-20.

Chapter 6
112
Discussion
In addition to endogenous sources such as reactive oxygen species and metabolic by-products, several exogenous sources also produce DNA lesions. Examples are ultraviolet (UV) light from the sun, ionizing radiation and numerous environmental and man-made chemicals. Besides activation of DNA repair systems, DNA damage also halts cell proliferation by triggering cell cycle checkpoints, thereby providing cells a time window to repair the DNA. When damage is beyond repair, cell death or cellular senescence is induced. All pathways associated with DNA damage, including DNA repair systems and cell cycle checkpoints, are collectively known as the DNA damage response (DDR). The DDR consists of hundreds of genes and is controlled and executed by enzymatic activities, protein-protein interactions, post-translational modifications and gene/microRNA expression changes. ((162, 198-201); Chapter 1) DDR defects can lead to incorrect repair, which result in mutations or chromosomal aberrations that ultimately triggers carcinogenesis. On the other hand, specific defects in DDR or hyper-activation can lead to increased levels of apoptosis or cellular senescence that will result in accelerated loss of tissue homeostasis, a contributing factor to aging (1-4). Moreover, the cellular context (e.g. cell type, proliferative state) and amount and type of DNA lesions also determine the cellular outcome of DDR signalling. It is therefore not surprising that cells have a sophisticated DDR that is tightly coordinated to balance cell survival and cell death or cellular senescence and decide cell fate. The induction of DNA lesions and concomitant mutations that drive cancer development by exogenous sources urges the development of tests to predict carcinogenic capacity of unknown chemical compounds and physical agents. Therefore, we investigated the cellular response to carcinogenic compounds, both genotoxic carcinogens (GTXC) and non-genotoxic carcinogens (NGTXC), to identify a molecular classifier that can serve as biomarker. Several in vivo microarray toxicogenomics studies were performed over the last years with varying predictive results. (87, 92-94, 97-100, 143) These studies provided evidence that specific mRNA expression changes could serve as classifiers predicting GTXC, but were less able to predict NGTXC. Thus far, toxicogenomics studies focussed on mRNAs whereas microRNAs have hardly been investigated. Therefore in chapter 2, we performed a short-term (7 days) in vivo exposure study using microarray technology to profile mRNA as well as microRNA expression. Mice were exposed to GTXC, NGTXC and non-carcinogens (NC). Subsequently, RNA expression profiles were generated from liver. We analysed the discriminative power of both microRNA and mRNA transcripts to classify the (genotoxic) carcinogenicity of chemicals in vivo.

General Discussion
113
The classifier set yielded consisted of mRNA transcripts being able to partly discriminate between GTXC, NGTXC, and NC. MicroRNA expression changes did not meet the applied criteria, which indicated that microRNA expression signatures have less discriminative power to identify carcinogenic compounds when compared to mRNA in short-term in vivo mouse exposure studies. Differences in RNA expression are highly time dependent, which should be considered in experimental design (21, 31, 40). Changes in microRNA expression are observed within hours after infliction of DNA damage and are generally restored to basal levels within 24 hours (31, 40), highlighting the importance of including microRNA kinetics and early time points in experimental design. Early time points in relation to microRNA expression changes were not taken into account in the experimental design of the in vivo exposure study (Chapter 2), which could have hampered microRNA biomarker identification. Therefore, we applied an in vitro approach in chapter 3 in which we treated mouse embryonic stem (mES) cells with GTXC, NGTXC and oxidative (Ox) compounds and isolated RNA for microRNA profiling 4, 8 and 12 hours after exposure. We took full advantage of the multiple time points present in this study and composed a classifier set to identify NGTXC, GTXC and Ox with the best performing time point to maximize the discriminative power of the microRNA expression profiles. The classifier set obtained at 4h after exposure was able to discriminate NGTXC from the other classes (GTXC and Ox). In all time points GTXC and Ox classified together. This could be explained by the fact that oxidative stress also leads to very transient DNA damage, at least in treated cell cultures. Oxidative-stress induced DNA lesions are rapidly repaired within hours (202-204) and therefore discriminative classifiers between GTXC and Ox can likely be found at later time points. Indeed, the classifier set to discriminate between GTXC and Ox with the highest predictive potential was obtained at the 12h time point. Thus, microRNA expression profiling can assist in compiling classifier sets to predict carcinogenic properties of compounds in vitro, but not in a short-term in vivo setup as used in chapter 2. Moreover, to verify the potential of our classifier sets, more elaborate validation studies with NGTXC and GTXC are essential. Currently, our results and those of others indicated that a set of single classifier transcripts, either microRNAs or mRNAs (or in combination), might not be sufficient to obtain the correct predictive power to identify carcinogenic compounds (especially NGTXC) to be applied as a general test. Therefore, additional genomics strategies and combinations of different biomolecule datasets, e.g. mRNAs, microRNAs, proteins and their modifications and metabolites, are likely necessary. The emergence of Next generation sequencing (NGS) has dramatically accelerated genomics and transcriptomics studies. Current throughput can handle dozens to hundreds of samples in a short time period. In addition, NGS leads to quantitative results (absolute numbers of sequences per genomic location/RNA species) instead

Chapter 6
114
of relative hybridization signals. NGS also provides datasets at the nucleotide resolution. Several dedicated experimental approaches have been developed that isolate specific DNA, RNA or chromatin species followed by sequencing. Examples at the DNA level include ChIPSeq (205), chromosome conformation capture sequencing methods (77) and more specific protocols to monitor double strand break (DSB) sites (84) and single cell analysis of mutations or chromosomal rearrangements (76). The increased complexity of the data generated by NGS requires appropriate analysis tools. While several RNA sequencing analysis algorithms are available, none of these can reliably and simultaneously analyse both small and large RNAs from a single sample. Therefore, we developed TRAP (Total Rna Analysis Pipeline; Chapter 5), which extracts data from sequence files, categorizes RNAs in classes, identifies post-transcriptional sequence modifications of small RNAs and performs statistical analysis. Moreover, TRAPs modular structure allows easy adjustments regarding transcripts identifiers or statistical algorithms and TRAP is compatible with existing RNA sequencing protocols. Our analysis tool allows simultaneous analysis of small and long RNA’s expression, identification of novel RNAs and transcripts and a comparison between RNA classes. With currently existing NGS-based transcriptomic methodologies we explored the RNA landscape of the DNA damage response. These NGS technologies are based on transcript selection: gel-excision for small non-coding RNAs (smallRNASeq) or poly-adenylation for protein coding RNAs (mRNASeq). In chapter 4 we treated mES cells with equitoxic doses of UV, ionizing radiation and cisplatin, each inducing a specific set of DNA lesions and isolated total RNA 4h, 8h and 12h after incubation that was used for sequencing. We mapped coding and non-coding RNA classes, both large and small (including microRNAs), and observed clear differences in expression kinetics. MicroRNAs showed a clear time and treatment dependent response, whereas the response of mRNAs revealed a more global response. These findings indicate the presence of waves of RNA expression responses. Further research will be aimed at unravelling the role of these complex RNA responses in the DDR. Current protocols used in chapter 4 are based on transcript selection. Therefore, these methods cannot intrinsically detect all RNA species in a single sample. In addition, existing protocols do not allow for monitoring changes in complete RNA classes. A prime example is repression of the microRNA biogenesis pathway during tumorigenesis, leading to reduced numbers of mature microRNAs in human cancer (195). To be able to detect these global changes and (almost) all RNA species in a single sequence run we developed a method that does not rely on class selection, RNAome Sequencing (RNAomeSeq) (Chapter 5). We defined RNAomeSeq as sequencing ribosomal RNA (rRNA)-depleted total RNA, both small and large RNAs (coding and non-coding), in a single sequencing run. Using RNAomeSeq we

General Discussion
115
detected the presence of tens of thousands of RNA species. Moreover, we were able to detect several recently discovered RNA classes, including small nucleolar RNAs and enhancer RNAs that escaped detection with existing protocols. The representation of the RNA classes detected by current protocols, i.e. mRNA and microRNA, was very accurate in RNAomeSeq. We observed no bias in transcript size and a high correlation in both expression and differential expression of transcripts, when comparing RNAomeSeq to the corresponding existing protocols, mRNASeq for coding and smallRNASeq for microRNAs. These analyses indicate that RNAomeSeq does not introduce significant biases in the detection of coding and microRNA transcripts. In addition, we observed a specific global repression of the microRNA and microRNA isoform classes after cisplatin treatment, demonstrating that RNAomeSeq can be used to study behaviour of complete RNA classes. The ability of RNAomeSeq to detect all RNA, except ribosomal RNA, will help in unravelling the involvement of RNA in cellular processes, diseases, such as aging-associated pathology and cancer, and provides an exponential increase in the number of potential classifier RNA molecules for diagnostic, prognostic and predictive purposes.
Future prospective Cellular heterogeneity in organs, cancer, aging, but also in cell cultures (206), such as different cell types and cell states (e.g. proliferating versus post-mitotic), can result in “noise” in datasets due to various responses to genotoxic stress. This could be addressed by single cell analysis. Several advances in single cell genomics and transcriptomics have been made including mutation and chromosomal rearrangement frequency determination (76, 207). These technologies will be useful to understand the evolution of cancer and metastasis. Furthermore, the relation of stochastic DNA damage in the aging process can be addressed. Recent advances in omics technologies offered much more complete datasets that monitor the behaviour of cellular macromolecules. Intelligent experimental design will allow integration of genomics, transcriptomics and proteomics datasets obtained under identical conditions and provide a holistic view of the complex DDR networks and final cellular outcome of these signalling events. Shifting the focus from single omics datasets to integration of multiple types of omics datasets requires sophisticated systems biology approaches and mathematical modelling. Development of dataset integration and visualization methods is needed to deal with these large and complex datasets. Both the RNA world as well as the technology to detect RNA have changed rapidly over the last decade. The emergence of NGS has tremendously improved the discovery of non-coding RNAs. This discovery of non-coding RNAs has added additional layers of complexity to the regulation of cellular processes. The function of

Chapter 6
116
most non-coding RNAs is obscure to date. Future research will not only be aimed at understanding their role in cellular processes, but also their role in diseases, potential as therapeutic targets and as markers for diagnostic, prognostic and predictive purposes. This will undoubtedly uncover the rest of the iceberg of the (non-coding) RNA world.

References 1. Hoeijmakers JH. DNA damage, aging, and cancer. The New England journal of
medicine. 2009;361(15):1475-85. 2. Bartek J, Bartkova J, Lukas J. DNA damage signalling guards against activated
oncogenes and tumour progression. Oncogene. 2007;26(56):7773-9. 3. Curtin NJ. DNA repair dysregulation from cancer driver to therapeutic target. Nat
Rev Cancer. 2012;12(12):801-17. 4. Bouwman P, Jonkers J. The effects of deregulated DNA damage signalling on
cancer chemotherapy response and resistance. Nat Rev Cancer. 2012;12(9):587-98.
5. Jackson SP, Bartek J. The DNA-damage response in human biology and disease. Nature. 2009;461(7267):1071-8.
6. Harper JW, Elledge SJ. The DNA damage response: ten years after. Mol Cell. 2007;28(5):739-45.
7. Matsuoka S, Huang M, Elledge SJ. Linkage of ATM to cell cycle regulation by the Chk2 protein kinase. Science. 1998;282(5395):1893-7.
8. Bensimon A, Schmidt A, Ziv Y, Elkon R, Wang SY, Chen DJ, et al. ATM-dependent and -independent dynamics of the nuclear phosphoproteome after DNA damage. Science signaling. 2010;3(151):rs3.
9. Bennetzen MV, Larsen DH, Bunkenborg J, Bartek J, Lukas J, Andersen JS. Site-specific phosphorylation dynamics of the nuclear proteome during the DNA damage response. Molecular & cellular proteomics : MCP. 2010;9(6):1314-23.
10. Pines A, Kelstrup CD, Vrouwe MG, Puigvert JC, Typas D, Misovic B, et al. Global phosphoproteome profiling reveals unanticipated networks responsive to cisplatin treatment of embryonic stem cells. Molecular and cellular biology. 2011;31(24):4964-77.
11. Povlsen LK, Beli P, Wagner SA, Poulsen SL, Sylvestersen KB, Poulsen JW, et al. Systems-wide analysis of ubiquitylation dynamics reveals a key role for PAF15 ubiquitylation in DNA-damage bypass. Nat Cell Biol. 2012;14(10):1089-98.
12. Schwertman P, Lagarou A, Dekkers DH, Raams A, van der Hoek AC, Laffeber C, et al. UV-sensitive syndrome protein UVSSA recruits USP7 to regulate transcription-coupled repair. Nat Genet. 2012;44(5):598-602.
13. Galanty Y, Belotserkovskaya R, Coates J, Polo S, Miller KM, Jackson SP. Mammalian SUMO E3-ligases PIAS1 and PIAS4 promote responses to DNA double-strand breaks. Nature. 2009;462(7275):935-9.
14. Morris JR. SUMO in the mammalian response to DNA damage. Biochemical Society transactions. 2010;38(Pt 1):92-7.
15. Guenole A, Srivas R, Vreeken K, Wang ZZ, Wang S, Krogan NJ, et al. Dissection of DNA damage responses using multiconditional genetic interaction maps. Mol Cell. 2013;49(2):346-58.
16. Pines A, Vrouwe MG, Marteijn JA, Typas D, Luijsterburg MS, Cansoy M, et al. PARP1 promotes nucleotide excision repair through DDB2 stabilization and recruitment of ALC1. J Cell Biol. 2012;199(2):235-49.
17. Beli P, Lukashchuk N, Wagner SA, Weinert BT, Olsen JV, Baskcomb L, et al. Proteomic investigations reveal a role for RNA processing factor THRAP3 in the DNA damage response. Mol Cell. 2012;46(2):212-25.
18. Kruse JP, Gu W. Modes of p53 regulation. Cell. 2009;137(4):609-22. 19. Daub H. DNA damage response: multilevel proteomics gains momentum. Mol
Cell. 2012;46(2):113-4. 20. Walther TC, Mann M. Mass spectrometry-based proteomics in cell biology. J Cell
Biol. 2010;190(4):491-500.

118
21. Kruse JJ, Svensson JP, Huigsloot M, Giphart-Gassler M, Schoonen WG, Polman JE, et al. A portrait of cisplatin-induced transcriptional changes in mouse embryonic stem cells reveals a dominant p53-like response. Mutat Res. 2007;617(1-2):58-70.
22. Garinis GA, Mitchell JR, Moorhouse MJ, Hanada K, de Waard H, Vandeputte D, et al. Transcriptome analysis reveals cyclobutane pyrimidine dimers as a major source of UV-induced DNA breaks. Embo J. 2005;24(22):3952-62.
23. Garinis GA, Uittenboogaard LM, Stachelscheid H, Fousteri M, van Ijcken W, Breit TM, et al. Persistent transcription-blocking DNA lesions trigger somatic growth attenuation associated with longevity. Nat Cell Biol. 2009;11(5):604-15.
24. Niedernhofer LJ, Garinis GA, Raams A, Lalai AS, Robinson AR, Appeldoorn E, et al. A new progeroid syndrome reveals that genotoxic stress suppresses the somatotroph axis. Nature. 2006;444(7122):1038-43.
25. Schumacher B, van der Pluijm I, Moorhouse MJ, Kosteas T, Robinson AR, Suh Y, et al. Delayed and accelerated aging share common longevity assurance mechanisms. PLoS Genet. 2008;4(8):e1000161.
26. Dolle ME, Kuiper RV, Roodbergen M, Robinson J, de Vlugt S, Wijnhoven SW, et al. Broad segmental progeroid changes in short-lived Ercc1(-/Delta7) mice. Pathobiology of aging & age related diseases. 2011;1.
27. Wilusz JE, Sunwoo H, Spector DL. Long noncoding RNAs: functional surprises from the RNA world. Genes Dev. 2009;23(13):1494-504.
28. Djebali S, Davis CA, Merkel A, Dobin A, Lassmann T, Mortazavi A, et al. Landscape of transcription in human cells. Nature. 2012;489(7414):101-8.
29. Guo H, Ingolia NT, Weissman JS, Bartel DP. Mammalian microRNAs predominantly act to decrease target mRNA levels. Nature. 2010;466(7308):835-40.
30. Lu J, Getz G, Miska EA, Alvarez-Saavedra E, Lamb J, Peck D, et al. MicroRNA expression profiles classify human cancers. Nature. 2005;435(7043):834-8.
31. Pothof J, Verkaik NS, van IW, Wiemer EA, Ta VT, van der Horst GT, et al. MicroRNA-mediated gene silencing modulates the UV-induced DNA-damage response. Embo J. 2009;28(14):2090-9.
32. Girardi C, De Pitta C, Casara S, Sales G, Lanfranchi G, Celotti L, et al. Analysis of miRNA and mRNA expression profiles highlights alterations in ionizing radiation response of human lymphocytes under modeled microgravity. PLoS One. 2012;7(2):e31293.
33. Di Francesco A, De Pitta C, Moret F, Barbieri V, Celotti L, Mognato M. The DNA-damage response to gamma-radiation is affected by miR-27a in A549 cells. Int J Mol Sci. 2013;14(9):17881-96.
34. Neijenhuis S, Bajrami I, Miller R, Lord CJ, Ashworth A. Identification of miRNA modulators to PARP inhibitor response. DNA repair. 2013;12(6):394-402.
35. Dolezalova D, Mraz M, Barta T, Plevova K, Vinarsky V, Holubcova Z, et al. MicroRNAs regulate p21(Waf1/Cip1) protein expression and the DNA damage response in human embryonic stem cells. Stem Cells. 2012;30(7):1362-72.
36. van Jaarsveld MT, Helleman J, Boersma AW, van Kuijk PF, van Ijcken WF, Despierre E, et al. miR-141 regulates KEAP1 and modulates cisplatin sensitivity in ovarian cancer cells. Oncogene. 2013;32(36):4284-93.
37. Pothof J, Verkaik NS, Hoeijmakers JH, van Gent DC. MicroRNA responses and stress granule formation modulate the DNA damage response. Cell Cycle. 2009;8(21):3462-8.
38. Zhang X, Wan G, Berger FG, He X, Lu X. The ATM kinase induces microRNA biogenesis in the DNA damage response. Mol Cell. 2011;41(4):371-83.
39. Wouters MD, van Gent DC, Hoeijmakers JH, Pothof J. MicroRNAs, the DNA damage response and cancer. Mutat Res. 2011;717(1-2):54-66.
Summary
119
40. van Jaarsveld MT, Wouters MD, Boersma AW, Smid M, van Ijcken WF, Mathijssen RH, et al. DNA damage responsive microRNAs misexpressed in human cancer modulate therapy sensitivity. Molecular oncology. 2013.
41. Esteller M. Non-coding RNAs in human disease. Nat Rev Genet. 2011;12(12):861-74.
42. Guttman M, Rinn JL. Modular regulatory principles of large non-coding RNAs. Nature. 2012;482(7385):339-46.
43. Jensen TH, Jacquier A, Libri D. Dealing with pervasive transcription. Mol Cell. 2013;52(4):473-84.
44. Mattick JS. The genetic signatures of noncoding RNAs. PLoS Genet. 2009;5(4):e1000459.
45. Mattick JS. Long noncoding RNAs in cell and developmental biology. Semin Cell Dev Biol. 2011;22(4):327.
46. Ulitsky I, Bartel DP. lincRNAs: genomics, evolution, and mechanisms. Cell. 2013;154(1):26-46.
47. Zhao J, Ohsumi TK, Kung JT, Ogawa Y, Grau DJ, Sarma K, et al. Genome-wide identification of polycomb-associated RNAs by RIP-seq. Mol Cell. 2010;40(6):939-53.
48. Carninci P. Is sequencing enlightenment ending the dark age of the transcriptome? Nat Methods. 2009;6(10):711-13.
49. Maher CA, Palanisamy N, Brenner JC, Cao X, Kalyana-Sundaram S, Luo S, et al. Chimeric transcript discovery by paired-end transcriptome sequencing. Proc Natl Acad Sci U S A. 2009;106(30):12353-8.
50. Mitelman F, Johansson B, Mertens F. The impact of translocations and gene fusions on cancer causation. Nat Rev Cancer. 2007;7(4):233-45.
51. Maher CA, Kumar-Sinha C, Cao X, Kalyana-Sundaram S, Han B, Jing X, et al. Transcriptome sequencing to detect gene fusions in cancer. Nature. 2009;458(7234):97-101.
52. Zhao Q, Caballero OL, Levy S, Stevenson BJ, Iseli C, de Souza SJ, et al. Transcriptome-guided characterization of genomic rearrangements in a breast cancer cell line. Proc Natl Acad Sci U S A. 2009;106(6):1886-91.
53. Berger MF, Levin JZ, Vijayendran K, Sivachenko A, Adiconis X, Maguire J, et al. Integrative analysis of the melanoma transcriptome. Genome Res. 2010;20(4):413-27.
54. Ameres SL, Zamore PD. Diversifying microRNA sequence and function. Nature reviews Molecular cell biology. 2013;14(8):475-88.
55. Neilsen CT, Goodall GJ, Bracken CP. IsomiRs--the overlooked repertoire in the dynamic microRNAome. Trends Genet. 2012;28(11):544-9.
56. Pelechano V, Wei W, Steinmetz LM. Extensive transcriptional heterogeneity revealed by isoform profiling. Nature. 2013;497(7447):127-31.
57. Churchman LS, Weissman JS. Nascent transcript sequencing visualizes transcription at nucleotide resolution. Nature. 2011;469(7330):368-73.
58. Core LJ, Waterfall JJ, Lis JT. Nascent RNA sequencing reveals widespread pausing and divergent initiation at human promoters. Science. 2008;322(5909):1845-8.
59. Kanematsu S, Tanimoto K, Suzuki Y, Sugano S. Screening for possible miRNA-mRNA associations in a colon cancer cell line. Gene. 2014;533(2):520-31.
60. Li A, Wei G, Wang Y, Zhou Y, Zhang XE, Bi L, et al. Identification of intermediate-size non-coding RNAs involved in the UV-induced DNA damage response in C. elegans. PLoS One. 2012;7(11):e48066.
61. Liu Q, Ullery J, Zhu J, Liebler DC, Marnett LJ, Zhang B. RNA-seq data analysis at the gene and CDS levels provides a comprehensive view of transcriptome responses induced by 4-hydroxynonenal. Mol Biosyst. 2013;9(12):3036-46.

120
62. Kenzelmann Broz D, Spano Mello S, Bieging KT, Jiang D, Dusek RL, Brady CA, et al. Global genomic profiling reveals an extensive p53-regulated autophagy program contributing to key p53 responses. Genes Dev. 2013;27(9):1016-31.
63. Li G, Qiu Y, Su Z, Ren S, Liu C, Tian Y, et al. Genome-Wide Analyses of Radioresistance-Associated miRNA Expression Profile in Nasopharyngeal Carcinoma Using Next Generation Deep Sequencing. PLoS One. 2013;8(12):e84486.
64. Hart M, Nolte E, Wach S, Szczyrba J, Taubert H, Rau T, et al. Comparative microRNA profiling of prostate carcinomas with increasing tumor stage by deep-sequencing. Molecular cancer research : MCR. 2013.
65. Huarte M, Guttman M, Feldser D, Garber M, Koziol MJ, Kenzelmann-Broz D, et al. A large intergenic noncoding RNA induced by p53 mediates global gene repression in the p53 response. Cell. 2010;142(3):409-19.
66. Liu Q, Huang J, Zhou N, Zhang Z, Zhang A, Lu Z, et al. LncRNA loc285194 is a p53-regulated tumor suppressor. Nucleic Acids Res. 2013;41(9):4976-87.
67. Zhang A, Zhou N, Huang J, Liu Q, Fukuda K, Ma D, et al. The human long non-coding RNA-RoR is a p53 repressor in response to DNA damage. Cell Res. 2013;23(3):340-50.
68. Marin-Bejar O, Marchese FP, Athie A, Sanchez Y, Gonzalez J, Segura V, et al. Pint lincRNA connects the p53 pathway with epigenetic silencing by the Polycomb repressive complex 2. Genome Biol. 2013;14(9):R104.
69. Paulsen MT, Veloso A, Prasad J, Bedi K, Ljungman EA, Tsan YC, et al. Coordinated regulation of synthesis and stability of RNA during the acute TNF-induced proinflammatory response. Proc Natl Acad Sci U S A. 2013;110(6):2240-5.
70. Francia S, Michelini F, Saxena A, Tang D, de Hoon M, Anelli V, et al. Site-specific DICER and DROSHA RNA products control the DNA-damage response. Nature. 2012;488(7410):231-5.
71. Ng SB, Turner EH, Robertson PD, Flygare SD, Bigham AW, Lee C, et al. Targeted capture and massively parallel sequencing of 12 human exomes. Nature. 2009;461(7261):272-6.
72. Stolk L, Perry JR, Chasman DI, He C, Mangino M, Sulem P, et al. Meta-analyses identify 13 loci associated with age at menopause and highlight DNA repair and immune pathways. Nat Genet. 2012;44(3):260-8.
73. Zhou W, Otto EA, Cluckey A, Airik R, Hurd TW, Chaki M, et al. FAN1 mutations cause karyomegalic interstitial nephritis, linking chronic kidney failure to defective DNA damage repair. Nat Genet. 2012;44(8):910-5.
74. Nakazawa Y, Sasaki K, Mitsutake N, Matsuse M, Shimada M, Nardo T, et al. Mutations in UVSSA cause UV-sensitive syndrome and impair RNA polymerase IIo processing in transcription-coupled nucleotide-excision repair. Nat Genet. 2012;44(5):586-92.
75. Gundry M, Li W, Maqbool SB, Vijg J. Direct, genome-wide assessment of DNA mutations in single cells. Nucleic Acids Res. 2012;40(5):2032-40.
76. Falconer E, Hills M, Naumann U, Poon SS, Chavez EA, Sanders AD, et al. DNA template strand sequencing of single-cells maps genomic rearrangements at high resolution. Nat Methods. 2012;9(11):1107-12.
77. de Wit E, de Laat W. A decade of 3C technologies: insights into nuclear organization. Genes Dev. 2012;26(1):11-24.
78. Hakim O, Resch W, Yamane A, Klein I, Kieffer-Kwon KR, Jankovic M, et al. DNA damage defines sites of recurrent chromosomal translocations in B lymphocytes. Nature. 2012;484(7392):69-74.
79. Melo CA, Drost J, Wijchers PJ, van de Werken H, de Wit E, Oude Vrielink JA, et al. eRNAs are required for p53-dependent enhancer activity and gene transcription. Molecular cell. 2013;49(3):524-35.
Summary
121
80. Iacovoni JS, Caron P, Lassadi I, Nicolas E, Massip L, Trouche D, et al. High-resolution profiling of gammaH2AX around DNA double strand breaks in the mammalian genome. Embo J. 2010;29(8):1446-57.
81. Massip L, Caron P, Iacovoni JS, Trouche D, Legube G. Deciphering the chromatin landscape induced around DNA double strand breaks. Cell Cycle. 2010;9(15):2963-72.
82. Akdemir KC, Jain AK, Allton K, Aronow B, Xu X, Cooney AJ, et al. Genome-wide profiling reveals stimulus-specific functions of p53 during differentiation and DNA damage of human embryonic stem cells. Nucleic Acids Res. 2013.
83. Zhou ZX, Zhang MJ, Peng X, Takayama Y, Xu XY, Huang LZ, et al. Mapping genomic hotspots of DNA damage by a single-strand-DNA-compatible and strand-specific ChIP-seq method. Genome Res. 2013;23(4):705-15.
84. Crosetto N, Mitra A, Silva MJ, Bienko M, Dojer N, Wang Q, et al. Nucleotide-resolution DNA double-strand break mapping by next-generation sequencing. Nat Methods. 2013;10(4):361-5.
85. Kinzler, Vogelstein. The genetic basis of human cancer. 2nd Edition ed. New York: McGraw-Hill; 2002 2002.
86. Silva LB, Van der Laan JW. Mechanisms of nongenotoxic carcinogenesis and assessment of the human hazard. RegulToxicolPharmacol. 2000;32(2):135-43.
87. Fielden MR, Brennan R, Gollub J. A gene expression biomarker provides early prediction and mechanistic assessment of hepatic tumor induction by nongenotoxic chemicals. ToxicolSci. 2007;99(1):90-100.
88. Hernandez LG, van Steeg H, Luijten M, van Benthem J. Mechanisms of non-genotoxic carcinogens and importance of a weight of evidence approach. MutatRes. 2009;682(2-3):94-109.
89. Lilienblum W, Dekant W, Foth H, Gebel T, Hengstler JG, Kahl R, et al. Alternative methods to safety studies in experimental animals: role in the risk assessment of chemicals under the new European Chemicals Legislation (REACH). ArchToxicol. 2008;82(4):211-36.
90. Luijten M, Muller JJA, Hernandez LG, van der Ven LTM, van Benthem J. Prediction of carcinogenic potential of substances using repeated dose toxicity data. 2012 2012. Report No.: 340700006/2012.
91. Manuppello J, Willett C. Longer rodent bioassay fails to address 2-year bioassay's flaws. EnvironHealth Perspect. 2008;116(12):A516-A7.
92. Ellinger-Ziegelbauer H, Gmuender H, Bandenburg A, Ahr HJ. Prediction of a carcinogenic potential of rat hepatocarcinogens using toxicogenomics analysis of short-term in vivo studies. MutatRes. 2008;637(1-2):23-39.
93. Fielden MR, Adai A, Dunn RT, Olaharski A, Searfoss G, Sina J, et al. Development and evaluation of a genomic signature for the prediction and mechanistic assessment of nongenotoxic hepatocarcinogens in the rat. ToxicolSci. 2011;124(1):54-74.
94. Fielden MR, Nie A, McMillian M, Elangbam CS, Trela BA, Yang Y, et al. Interlaboratory evaluation of genomic signatures for predicting carcinogenicity in the rat. ToxicolSci. 2008;103(1):28-34.
95. Guyton KZ, Kyle AD, Aubrecht J, Cogliano VJ, Eastmond DA, Jackson M, et al. Improving prediction of chemical carcinogenicity by considering multiple mechanisms and applying toxicogenomic approaches. MutatRes. 2009;681(2-3):230-40.
96. Jonker MJ, Bruning O, van Iterson M, Schaap MM, van der Hoeven TV, Vrieling H, et al. Finding transcriptomics biomarkers for in vivo identification of (non-)genotoxic carcinogens using wild-type and Xpa/p53 mutant mouse models. Carcinogenesis. 2009;30(10):1805-12.

122
97. Nie AY, McMillian M, Parker JB, Leone A, Bryant S, Yieh L, et al. Predictive toxicogenomics approaches reveal underlying molecular mechanisms of nongenotoxic carcinogenicity. MolCarcinog. 2006;45(12):914-33.
98. Thomas RS, Bao W, Chu TM, Bessarabova M, Nikolskaya T, Nikolsky Y, et al. Use of short-term transcriptional profiles to assess the long-term cancer-related safety of environmental and industrial chemicals. ToxicolSci. 2009;112(2):311-21.
99. Uehara T, Minowa Y, Morikawa Y, Kondo C, Maruyama T, Kato I, et al. Prediction model of potential hepatocarcinogenicity of rat hepatocarcinogens using a large-scale toxicogenomics database. ToxicolApplPharmacol. 2011;255(3):297-306.
100. Waters MD, Jackson M, Lea I. Characterizing and predicting carcinogenicity and mode of action using conventional and toxicogenomics methods. MutatRes. 2010;705(3):184-200.
101. Chen T. The role of MicroRNA in chemical carcinogenesis. JEnvironSciHealth CEnvironCarcinogEcotoxicolRev. 2010;28(2):89-124.
102. Elamin BK, Callegari E, Gramantieri L, Sabbioni S, Negrini M. MicroRNA response to environmental mutagens in liver. MutatRes. 2011;717(1-2):67-76.
103. Heneghan HM, Miller N, Kerin MJ. MiRNAs as biomarkers and therapeutic targets in cancer. CurrOpinPharmacol. 2010;10(5):543-50.
104. Kasinski AL, Slack FJ. Epigenetics and genetics. MicroRNAs en route to the clinic: progress in validating and targeting microRNAs for cancer therapy. NatRevCancer. 2011;11(12):849-64.
105. Malik AI, Williams A, Lemieux CL, White PA, Yauk CL. Hepatic mRNA, microRNA, and miR-34a-target responses in mice after 28 days exposure to doses of benzo(a)pyrene that elicit DNA damage and mutation. EnvironMolMutagen. 2012;53(1):10-21.
106. de Vries A, van Oostrom CT, Dortant PM, Beems RB, van Kreijl CF, Capel PJ, et al. Spontaneous liver tumors and benzo[a]pyrene-induced lymphomas in XPA-deficient mice. MolCarcinog. 1997;19(1):46-53.
107. van Kreijl CF, McAnulty PA, Beems RB, Vynckier A, van Steeg H, Fransson-Steen R, et al. Xpa and Xpa/p53+/- knockout mice: overview of available data. ToxicolPathol. 2001;29 Suppl:117-27.
108. Melis JP, Speksnijder EN, Kuiper RV, Salvatori DC, Schaap MM, Maas S, et al. Detection of genotoxic and non-genotoxic carcinogens in Xpc(-/-)p53(+/-) mice. Toxicol Appl Pharmacol. 2013;266(2):289-97.
109. Melis JP, Kuiper RV, Zwart E, Robinson J, Pennings JL, van Oostrom CT, et al. Slow accumulation of mutations in Xpc-/- mice upon induction of oxidative stress. DNA repair. 2013;12(12):1081-6.
110. Jonker MJ, Melis JP, Kuiper RV, van der Hoeven TV, Wackers PF, Robinson J, et al. Life spanning murine gene expression profiles in relation to chronological and pathological aging in multiple organs. Aging cell. 2013;12(5):901-9.
111. de Leeuw WC, Rauwerda H, Jonker MJ, Breit TM. Salvaging Affymetrix probes after probe-level re-annotation. BMCResNotes. 2008;1:66.
112. Irizarry RA, Hobbs B, Collin F, Beazer-Barclay YD, Antonellis KJ, Scherf U, et al. Exploration, normalization, and summaries of high density oligonucleotide array probe level data. Biostatistics. 2003;4(2):249-64.
113. Smyth GK. Limma: linear models for microarray data. In: Gentleman R, Carey V, Dudoit S, Irizarry R, Huber W, editors. Bioinformatics and Computational Biology Solutions using R and Bioconductor. New York: Springer; 2005. p. 397-420.
114. Wolfinger RD, Gibson G, Wolfinger ED, Bennett L, Hamadeh H, Bushel P, et al. Assessing gene significance from cDNA microarray expression data via mixed models. JComputBiol. 2001;8(6):625-37.
115. Storey JD, Tibshirani R. Statistical significance for genomewide studies. ProcNatlAcadSciUSA. 2003;100(16):9440-5.

Summary
123
116. Benjamini Y, Hochberg Y. Controlling the False Discovery Rate: A Practical and Powerful Approach to Multiple Testing Series B (Methodological). Journal of the Royal Statistical Society. 1995;57(1):289-300.
117. He L, He X, Lim LP, de SE, Xuan Z, Liang Y, et al. A microRNA component of the p53 tumour suppressor network. Nature. 2007;447(7148):1130-4.
118. Concepcion CP, Han YC, Mu P, Bonetti C, Yao E, D'Andrea A, et al. Intact p53-dependent responses in miR-34-deficient mice. PLoSGenet. 2012;8(7):e1002797.
119. Jain AK, Barton MC. Unmet expectations: miR-34 plays no role in p53-mediated tumor suppression in vivo. PLoSGenet. 2012;8(7):e1002859.
120. Chen JS, Su IJ, Leu YW, Young KC, Sun HS. Expression of T-cell lymphoma invasion and metastasis 2 (TIAM2) promotes proliferation and invasion of liver cancer. IntJCancer. 2012;130(6):1302-13.
121. Coma S, Amin DN, Shimizu A, Lasorella A, Iavarone A, Klagsbrun M. Id2 promotes tumor cell migration and invasion through transcriptional repression of semaphorin 3F. Cancer Res. 2010;70(9):3823-32.
122. Lasorella A, Rothschild G, Yokota Y, Russell RG, Iavarone A. Id2 mediates tumor initiation, proliferation, and angiogenesis in Rb mutant mice. MolCell Biol. 2005;25(9):3563-74.
123. Zhang Y, Liu C, Peng H, Zhang J, Feng Q. IL1 receptor antagonist gene IL1-RN variable number of tandem repeats polymorphism and cancer risk: a literature review and meta-analysis. PLoSOne. 2012;7(9):e46017.
124. Gao C, Pang L, Ren C, Ma T. Decreased expression of Nedd4L correlates with poor prognosis in gastric cancer patient. MedOncol. 2012;29(3):1733-8.
125. Rickman DS, Pflueger D, Moss B, VanDoren VE, Chen CX, de la Taille A, et al. SLC45A3-ELK4 is a novel and frequent erythroblast transformation-specific fusion transcript in prostate cancer. Cancer Res. 2009;69(7):2734-8.
126. Palta A, Dhiman P, Cruz SD. ZBTB16-RARalpha variant of acute promyelocytic leukemia with tuberculosis: a case report and review of literature. Korean JHematol. 2012;47(3):229-32.
127. Zhou MI, Foy RL, Chitalia VC, Zhao J, Panchenko MV, Wang H, et al. Jade-1, a candidate renal tumor suppressor that promotes apoptosis. ProcNatlAcadSciUSA. 2005;102(31):11035-40.
128. Ramirez-Herrick AM, Mullican SE, Sheehan AM, Conneely OM. Reduced NR4A gene dosage leads to mixed myelodysplastic/myeloproliferative neoplasms in mice. Blood. 2011;117(9):2681-90.
129. Morrison BH, Bauer JA, Lupica JA, Tang Z, Schmidt H, DiDonato JA, et al. Effect of inositol hexakisphosphate kinase 2 on transforming growth factor beta-activated kinase 1 and NF-kappaB activation. JBiolChem. 2007;282(21):15349-56.
130. Bender K, Gottlicher M, Whiteside S, Rahmsdorf HJ, Herrlich P. Sequential DNA damage-independent and -dependent activation of NF-kappaB by UV. EMBO J. 1998;17(17):5170-81.
131. Fernandez-Salguero PM, Hilbert DM, Rudikoff S, Ward JM, Gonzalez FJ. Aryl-hydrocarbon receptor-deficient mice are resistant to 2,3,7,8-tetrachlorodibenzo-p-dioxin-induced toxicity. ToxicolApplPharmacol. 1996;140(1):173-9.
132. Park JY, Shigenaga MK, Ames BN. Induction of cytochrome P4501A1 by 2,3,7,8-tetrachlorodibenzo-p-dioxin or indolo(3,2-b)carbazole is associated with oxidative DNA damage. ProcNatlAcadSciUSA. 1996;93(6):2322-7.
133. Seiler AE, Buesen R, Visan A, Spielmann H. Use of murine embryonic stem cells in embryotoxicity assays: the embryonic stem cell test. Methods Mol Biol. 2006;329:371-95.
134. Hendriks G, Atallah M, Morolli B, Calleja F, Ras-Verloop N, Huijskens I, et al. The ToxTracker assay: novel GFP reporter systems that provide mechanistic insight into the genotoxic properties of chemicals. Toxicological sciences : an official journal of the Society of Toxicology. 2012;125(1):285-98.

124
135. van Dartel DA, Pennings JL, de la Fonteyne LJ, Brauers KJ, Claessen S, van Delft JH, et al. Evaluation of developmental toxicant identification using gene expression profiling in embryonic stem cell differentiation cultures. Toxicological sciences : an official journal of the Society of Toxicology. 2011;119(1):126-34.
136. Melis JP, Derks KW, Pronk TE, Wackers P, Schaap MM, Zwart E, et al. In vivo murine hepatic microRNA and mRNA expression signatures predicting the (non-)genotoxic carcinogenic potential of chemicals. Archives of toxicology. 2014.
137. van Dartel DA, Pennings JL, van Schooten FJ, Piersma AH. Transcriptomics-based identification of developmental toxicants through their interference with cardiomyocyte differentiation of embryonic stem cells. Toxicol Appl Pharmacol. 2010;243(3):420-8.
138. Koufaris C, Wright J, Currie RA, Gooderham NJ. Hepatic microRNA profiles offer predictive and mechanistic insights after exposure to genotoxic and epigenetic hepatocarcinogens. Toxicological sciences : an official journal of the Society of Toxicology. 2012;128(2):532-43.
139. Iorio MV, Ferracin M, Liu CG, Veronese A, Spizzo R, Sabbioni S, et al. MicroRNA gene expression deregulation in human breast cancer. Cancer Res. 2005;65(16):7065-70.
140. Saeed AI, Sharov V, White J, Li J, Liang W, Bhagabati N, et al. TM4: a free, open-source system for microarray data management and analysis. BioTechniques. 2003;34(2):374-8.
141. Healy E, Dempsey M, Lally C, Ryan MP. Apoptosis and necrosis: mechanisms of cell death induced by cyclosporine A in a renal proximal tubular cell line. Kidney international. 1998;54(6):1955-66.
142. Yuzawa K, Kondo I, Fukao K, Iwasaki Y, Hamaguchi H. Mutagenicity of cyclosporine. Induction of sister chromatid exchange in human cells. Transplantation. 1986;42(1):61-3.
143. Luijten M, Speksnijder EN, van AN, Westerman A, Heisterkamp SH, van BJ, et al. Phenacetin acts as a weak genotoxic compound preferentially in the kidney of DNA repair deficient Xpa mice. MutatRes. 2006;596(1-2):143-50.
144. Li M, He Y, Dubois W, Wu X, Shi J, Huang J. Distinct regulatory mechanisms and functions for p53-activated and p53-repressed DNA damage response genes in embryonic stem cells. Mol Cell. 2012;46(1):30-42.
145. Meek DW. Tumour suppression by p53: a role for the DNA damage response? Nat Rev Cancer. 2009;9(10):714-23.
146. Purvis JE, Karhohs KW, Mock C, Batchelor E, Loewer A, Lahav G. p53 dynamics control cell fate. Science. 2012;336(6087):1440-4.
147. Batchelor E, Loewer A, Mock C, Lahav G. Stimulus-dependent dynamics of p53 in single cells. Molecular systems biology. 2011;7:488.
148. de Waard H, Sonneveld E, de Wit J, Esveldt-van Lange R, Hoeijmakers JH, Vrieling H, et al. Cell-type-specific consequences of nucleotide excision repair deficiencies: Embryonic stem cells versus fibroblasts. DNA repair. 2008;7(10):1659-69.
149. Carreras Puigvert J, von Stechow L, Siddappa R, Pines A, Bahjat M, Haazen LC, et al. Systems biology approach identifies the kinase Csnk1a1 as a regulator of the DNA damage response in embryonic stem cells. Science signaling. 2013;6(259):ra5.
150. Brouwer RW, van den Hout MC, Grosveld FG, van Ijcken WF. NARWHAL, a primary analysis pipeline for NGS data. Bioinformatics. 2012;28(2):284-5.
151. Robinson MD, McCarthy DJ, Smyth GK. EdgeR: a Bioconductor package for differential expression analysis of digital gene expression data. Bioinformatics. 2010;26(1):139-40.

Summary
125
152. Griffiths-Jones S, Grocock RJ, van Dongen S, Bateman A, Enright AJ. miRBase: microRNA sequences, targets and gene nomenclature. Nucleic acids research. 2006;34(Database issue):D140-4.
153. Huang da W, Sherman BT, Lempicki RA. Bioinformatics enrichment tools: paths toward the comprehensive functional analysis of large gene lists. Nucleic Acids Res. 2009;37(1):1-13.
154. Huang da W, Sherman BT, Lempicki RA. Systematic and integrative analysis of large gene lists using DAVID bioinformatics resources. Nature protocols. 2009;4(1):44-57.
155. Lin T, Chao C, Saito S, Mazur SJ, Murphy ME, Appella E, et al. p53 induces differentiation of mouse embryonic stem cells by suppressing Nanog expression. Nat Cell Biol. 2005;7(2):165-71.
156. Qin H, Yu T, Qing T, Liu Y, Zhao Y, Cai J, et al. Regulation of apoptosis and differentiation by p53 in human embryonic stem cells. J Biol Chem. 2007;282(8):5842-52.
157. Sato N, Meijer L, Skaltsounis L, Greengard P, Brivanlou AH. Maintenance of pluripotency in human and mouse embryonic stem cells through activation of Wnt signaling by a pharmacological GSK-3-specific inhibitor. Nature medicine. 2004;10(1):55-63.
158. Wu SM, Choo AB, Yap MG, Chan KK. Role of Sonic hedgehog signaling and the expression of its components in human embryonic stem cells. Stem cell research. 2010;4(1):38-49.
159. Loh YH, Wu Q, Chew JL, Vega VB, Zhang W, Chen X, et al. The Oct4 and Nanog transcription network regulates pluripotency in mouse embryonic stem cells. Nat Genet. 2006;38(4):431-40.
160. Lichner Z, Pall E, Kerekes A, Pallinger E, Maraghechi P, Bosze Z, et al. The miR-290-295 cluster promotes pluripotency maintenance by regulating cell cycle phase distribution in mouse embryonic stem cells. Differentiation. 2011;81(1):11-24.
161. Melis JP, Derks KW, Pronk TE, Wackers P, Schaap MM, Zwart E, et al. In vivo murine hepatic microRNA and mRNA expression signatures predicting the (non-)genotoxic carcinogenic potential of chemicals. Archives of toxicology. 2014;88(4):1023-34.
162. Hoeijmakers JH. Genome maintenance mechanisms for preventing cancer. Nature. 2001;411(6835):366-74.
163. Marteijn JA, Lans H, Vermeulen W, Hoeijmakers JH. Understanding nucleotide excision repair and its roles in cancer and ageing. Nature reviews Molecular cell biology. 2014;15(7):465-81.
164. Sale JE, Lehmann AR, Woodgate R. Y-family DNA polymerases and their role in tolerance of cellular DNA damage. Nature reviews Molecular cell biology. 2012;13(3):141-52.
165. van Gijssel HE, Mullenders LH, van Oosterwijk MF, Meerman JH. Blockage of transcription as a trigger for p53 accumulation by 2-acetylaminofluorene DNA-adducts. Life Sci. 2003;73(14):1759-71.
166. Suzuki HI, Yamagata K, Sugimoto K, Iwamoto T, Kato S, Miyazono K. Modulation of microRNA processing by p53. Nature. 2009;460(7254):529-33.
167. Bartel DP. MicroRNAs: target recognition and regulatory functions. Cell. 2009;136(2):215-33.
168. Hermeking H. MicroRNAs in the p53 network: micromanagement of tumour suppression. Nat Rev Cancer. 2012;12(9):613-26.
169. Leung AK, Sharp PA. MicroRNA functions in stress responses. Molecular cell. 2010;40(2):205-15.
170. Li W, Notani D, Ma Q, Tanasa B, Nunez E, Chen AY, et al. Functional roles of enhancer RNAs for oestrogen-dependent transcriptional activation. Nature. 2013;498(7455):516-20.

126
171. Nallar SC, Kalvakolanu DV. Regulation of snoRNAs in cancer: close encounters with interferon. J Interferon Cytokine Res. 2013;33(4):189-98.
172. Cawley K, Logue SE, Gorman AM, Zeng Q, Patterson J, Gupta S, et al. Disruption of microRNA Biogenesis Confers Resistance to ER Stress-Induced Cell Death Upstream of the Mitochondrion. PLoS One. 2013;8(8):e73870.
173. Shen J, Xia W, Khotskaya YB, Huo L, Nakanishi K, Lim SO, et al. EGFR modulates microRNA maturation in response to hypoxia through phosphorylation of AGO2. Nature. 2013;497(7449):383-7.
174. van Kouwenhove M, Kedde M, Agami R. MicroRNA regulation by RNA-binding proteins and its implications for cancer. Nature reviews Cancer. 2011;11(9):644-56.
175. Guttman M, Donaghey J, Carey BW, Garber M, Grenier JK, Munson G, et al. lincRNAs act in the circuitry controlling pluripotency and differentiation. Nature. 2011;477(7364):295-300.
176. Mercer TR, Dinger ME, Mattick JS. Long non-coding RNAs: insights into functions. Nature reviews Genetics. 2009;10(3):155-9.
177. Kim TK, Hemberg M, Gray JM, Costa AM, Bear DM, Wu J, et al. Widespread transcription at neuronal activity-regulated enhancers. Nature. 2010;465(7295):182-7.
178. Wang D, Garcia-Bassets I, Benner C, Li W, Su X, Zhou Y, et al. Reprogramming transcription by distinct classes of enhancers functionally defined by eRNA. Nature. 2011;474(7351):390-4.
179. Cui P, Lin Q, Ding F, Xin C, Gong W, Zhang L, et al. A comparison between ribo-minus RNA-sequencing and polyA-selected RNA-sequencing. Genomics. 2010;96(5):259-65.
180. Yang L, Duff MO, Graveley BR, Carmichael GG, Chen LL. Genomewide characterization of non-polyadenylated RNAs. Genome Biol. 2011;12(2):R16.
181. Li J, Tibshirani R. Finding consistent patterns: a nonparametric approach for identifying differential expression in RNA-Seq data. Statistical methods in medical research. 2013;22(5):519-36.
182. Anders S, Huber W. Differential expression analysis for sequence count data. Genome Biol. 2010;11(10):R106.
183. Auer PL, Doerge RW. A Two-Stage Poisson Model for Testing RNA-Seq Data. Stat Appl Genet Mol Biol. 2011;10(1).
184. Kapranov P, St Laurent G, Raz T, Ozsolak F, Reynolds CP, Sorensen PH, et al. The majority of total nuclear-encoded non-ribosomal RNA in a human cell is 'dark matter' un-annotated RNA. BMC biology. 2010;8:149.
185. Gong M, Chen Y, Senturia R, Ulgherait M, Faller M, Guo F. Caspases cleave and inhibit the microRNA processing protein DiGeorge Critical Region 8. Protein Sci. 2012;21(6):797-808.
186. Ghodgaonkar MM, Shah RG, Kandan-Kulangara F, Affar EB, Qi HH, Wiemer E, et al. Abrogation of DNA vector-based RNAi during apoptosis in mammalian cells due to caspase-mediated cleavage and inactivation of Dicer-1. Cell Death Differ. 2009;16(6):858-68.
187. Landgraf P, Rusu M, Sheridan R, Sewer A, Iovino N, Aravin A, et al. A mammalian microRNA expression atlas based on small RNA library sequencing. Cell. 2007;129(7):1401-14.
188. Islam S, Kjallquist U, Moliner A, Zajac P, Fan JB, Lonnerberg P, et al. Characterization of the single-cell transcriptional landscape by highly multiplex RNA-seq. Genome Res. 2011;21(7):1160-7.
189. Calabrese JM, Seila AC, Yeo GW, Sharp PA. RNA sequence analysis defines Dicer's role in mouse embryonic stem cells. Proc Natl Acad Sci U S A. 2007;104(46):18097-102.

Summary
127
190. Sasagawa Y, Nikaido I, Hayashi T, Danno H, Uno KD, Imai T, et al. Quartz-Seq: a highly reproducible and sensitive single-cell RNA sequencing method, reveals non-genetic gene-expression heterogeneity. Genome Biol. 2013;14(4):R31.
191. Yin QF, Yang L, Zhang Y, Xiang JF, Wu YW, Carmichael GG, et al. Long noncoding RNAs with snoRNA ends. Molecular cell. 2012;48(2):219-30.
192. Livyatan I, Harikumar A, Nissim-Rafinia M, Duttagupta R, Gingeras TR, Meshorer E. Non-polyadenylated transcription in embryonic stem cells reveals novel non-coding RNA related to pluripotency and differentiation. Nucleic acids research. 2013.
193. Chorev M, Carmel L. Computational identification of functional introns: high positional conservation of introns that harbor RNA genes. Nucleic acids research. 2013.
194. Eswaran J, Horvath A, Godbole S, Reddy SD, Mudvari P, Ohshiro K, et al. RNA sequencing of cancer reveals novel splicing alterations. Sci Rep. 2013;3:1689.
195. Kumar MS, Lu J, Mercer KL, Golub TR, Jacks T. Impaired microRNA processing enhances cellular transformation and tumorigenesis. Nat Genet. 2007;39(5):673-7.
196. Gentleman RC, Carey VJ, Bates DM, Bolstad B, Dettling M, Dudoit S, et al. Bioconductor: open software development for computational biology and bioinformatics. Genome Biol. 2004;5(10):R80.
197. Smyth GK. Linear models and empirical bayes methods for assessing differential expression in microarray experiments. Stat Appl Genet Mol Biol. 2004;3:Article3.
198. Houtgraaf JH, Versmissen J, van der Giessen WJ. A concise review of DNA damage checkpoints and repair in mammalian cells. Cardiovascular revascularization medicine : including molecular interventions. 2006;7(3):165-72.
199. von Stechow L, van de Water B, Danen EH. Unraveling DNA damage response-signaling networks through systems approaches. Archives of toxicology. 2013;87(9):1635-48.
200. Polo SE, Jackson SP. Dynamics of DNA damage response proteins at DNA breaks: a focus on protein modifications. Genes Dev. 2011;25(5):409-33.
201. Roos WP, Kaina B. DNA damage-induced cell death by apoptosis. Trends in molecular medicine. 2006;12(9):440-50.
202. Dantzer F, Bjoras M, Luna L, Klungland A, Seeberg E. Comparative analysis of 8-oxoG:C, 8-oxoG:A, A:C and C:C DNA repair in extracts from wild type or 8-oxoG DNA glycosylase deficient mammalian and bacterial cells. DNA repair. 2003;2(6):707-18.
203. Fortini P, Parlanti E, Sidorkina OM, Laval J, Dogliotti E. The type of DNA glycosylase determines the base excision repair pathway in mammalian cells. J Biol Chem. 1999;274(21):15230-6.
204. Lee HW, Lee HJ, Hong CM, Baker DJ, Bhatia R, O'Connor TR. Monitoring repair of DNA damage in cell lines and human peripheral blood mononuclear cells. Analytical biochemistry. 2007;365(2):246-59.
205. Park PJ. ChIP-seq: advantages and challenges of a maturing technology. Nat Rev Genet. 2009;10(10):669-80.
206. Stockholm D, Benchaouir R, Picot J, Rameau P, Neildez TM, Landini G, et al. The origin of phenotypic heterogeneity in a clonal cell population in vitro. PLoS One. 2007;2(4):e394.
207. Shapiro E, Biezuner T, Linnarsson S. Single-cell sequencing-based technologies will revolutionize whole-organism science. Nat Rev Genet. 2013;14(9):618-30.


Chapter 7
Summary / Samenvatting

Summary
130
Summary
DNA damage can originate from endogenous as well as exogenous sources. Endogenous sources are formed within the cell, including metabolites and reactive oxygen species. Exogenous sources originate from the (natural) environment, for example ultraviolet (UV) light from the sun, or man-made chemicals, including numerous chemicals. DNA lesions trigger a complex cellular response to repair the damage and maximize survival during the damage episode. All pathways associated with DNA damage are collectively known as the DNA damage response (DDR). The cellular outcome of DDR signalling is determined by the context (e.g. cell type, proliferative state), but also amount as well as type of DNA damage. The induction of DNA damage and concomitant mutations that drive cancer development by exogenous sources urges the development of tests to predict the capacity of unknown compounds to be carcinogenic. Therefore, we investigated the cellular response to carcinogenic compounds, both genotoxic carcinogens (GTXC) and non-genotoxic carcinogens (NGTXC), to identify a molecular classifier that can serve as biomarker for (genotoxic) carcinogenicity. Hence in chapter 2, we performed a relative short-term (7-days) in vivo exposure study using microarray technology to profile mRNA as well as microRNA expression. Mice were exposed to GTXC, NGTXC and non-carcinogen (NC) compounds. Subsequently, mRNA and microRNA expression profiles from the liver were analysed for discriminative power of both microRNA and mRNA transcripts to classify the (genotoxic) carcinogenicity of chemicals in vivo. The classifier set yielded consisted of mRNA transcripts being able to partly discriminate between GTXC, NGTXC, and NC. MicroRNA expression changes did not meet the applied criteria, which indicated that microRNA expression signatures have less discriminative power to identify carcinogenic compounds in a short-term in vivo mouse exposure studies. Differences in RNA expression are highly time-dependent, which should be considered in the experimental design. For example, changes in microRNA expression are observed within hours after DNA damage, whereas mRNA expression changes are observed up to days. Early time points in relation to microRNA expression changes were not taken into account in the experimental design of the in vivo exposure study in chapter 2, which might have hampered microRNA biomarker identification. Therefore, we applied an in vitro approach in chapter 3. Mouse embryonic stem (mES) cells were treated with GTXC, NGTXC and oxidative (Ox) compounds and after 4, 8 and 12 hours of exposure microRNA expression profiles were generated. The classifier sets from 4 and 12 hours after exposure could partially discriminate NGTXC from the other classes (GTXC and Ox)

Summary
131
and GTXC from the Ox class respectively. On the basis of chapter 2 and chapter 3 we conclude that microRNA expression profiling might assist in compiling classifier sets to predict carcinogenic properties of compounds in vitro, but not in a (relative) short-term in vivo setup. The emergence of Next generation sequencing (NGS) has dramatically accelerated genomics and transcriptomics studies. The accompanied increase in complexity of the data generated by NGS requires appropriate analysis tools. Therefore, we developed TRAP (Total Rna Analysis Pipeline; chapter 5). By combining currently existing NGS-based transcriptomic methodologies with TRAP we mapped the RNA landscape of the DDR. In chapter 4 we treated mES cells with cisplatin, UVC and ionizing radiation, each inducing a specific spectrum of DNA lesions. Total RNA was isolated after 4, 8 and 12 hours of exposure to these agents. Clear differences were observed in the kinetics of mRNA and microRNA expression. The changes in microRNAs showed a clear time and treatment dependent response, whereas the response of mRNAs revealed an independence of time or treatment. These findings indicate the presence of waves in RNA expression regulation. Further research will be aimed at unravelling the role of these complex RNA changes in the DDR. Current protocols to investigate RNA expression, used in chapter 4, are based on selection of specific classes of transcripts. In chapter 5, we developed a method, RNAome Sequencing (RNAomeSeq) that does not rely on selection of a predefined class. We defined RNAomeSeq as sequencing of total RNA in a single sequencing run being: only ribosomal RNA-depleted, containing both small and large RNAs as well as for-protein-coding and not-for-protein-coding RNAs. Using RNAomeSeq we detected tens of thousands RNA transcripts that were undetectable with existing protocols. Moreover, RNAomeSeq preserves the correct representation of the RNA detected transcripts, i.e. a high correlation between the expression of transcripts detected by RNAomeSeq and the corresponding existing protocols (mRNASeq for mRNAs and smallRNASeq for microRNAs) was observed. In addition, a microRNA specific global repression of the microRNA class after cisplatin treatment was observed, demonstrating that RNAomeSeq can be used to study behaviour of complete RNA classes. The ability of RNAomeSeq to detect total RNA, except ribosomal RNA, will help in unravelling the role of RNAs in physiological and pathological cellular processes. Moreover, RNAomeSeq provides an exponential increase in the number of RNA molecules for diagnostic, prognostic and predictive purposes.
Samenvatting
132
Samenvatting Schade aan het DNA kan veroorzaakt worden door endogene en exogene bronnen. Endogene bronnen worden door cellen zelf gevormd, zoals metabolieten en reactieve zuurstof radicalen. Exogene factoren zijn afkomstig uit onze (natuurlijke) omgeving, bijvoorbeeld ultraviolet (UV) licht van de zon en ioniserende straling (IR), of zijn door de mens gefabriceerd, zoals verscheidene chemicaliën. Alle cellulaire netwerken die geassocieerd zijn met DNA schade worden gezamenlijk de ‘DNA schade respons (DDR)’ genoemd. De uitkomst van de DDR signalering wordt beïnvloed door de cellulaire context (zoals celtype en proliferatiestatus), maar ook door de hoeveelheid alsmede de soort schade aan het DNA. Het induceren van schade aan het DNA alsmede mutaties die kanker ontwikkelen door exogene bronnen dringt aan tot het ontwerpen van testen om de capaciteit van onbekende stoffen met betrekking tot het veroorzaken van kanker te identificeren. Om die reden hebben wij onderzocht of de cellulaire responsen op kankerverwekkende stoffen, zowel DNA beschadigend (GTXC) als niet-DNA beschadigend (NGTXC), te classificeren zijn op moleculair niveau met het doel om uiteindelijk biomarkers voor kankerinductie (door DNA schade) te identificeren. In hoofdstuk 2 hebben we een relatief korte (7-dagen) in vivo blootstellingsstudie uitgevoerd en met behulp van microarray technologie zowel mRNA als microRNA expressie profielen gegenereerd. Muizen zijn daarvoor blootgesteld aan GTXC, NGTXC en niet-carcinogene (NC) stoffen. Vervolgens zijn mRNA en microRNA expressie profielen van de lever geanalyseerd om te onderzoeken of de kankerverwekkende capaciteit van deze stoffen in vivo te onderscheiden is. Onderscheid tussen GTXC, NGTXC en NC kon gedeeltelijk worden gemaakt, maar slechts door specifieke mRNA transcripten. MicroRNA expressie veranderingen voldeden niet aan de criteria, hetgeen duidt op een lager onderscheidend vermogen van microRNAs om de kankerverwekkende capaciteit van stoffen te voorspellen in een relatief korte in vivo blootstellingsstudie. Verschillen in RNA expressie zijn sterk tijdsafhankelijk, hetgeen in acht genomen dient te worden tijdens het opzetten van een experiment. Veranderingen in microRNA expressie na DNA schade worden bijvoorbeeld waargenomen binnen enkele uren, terwijl veranderingen in mRNA expressie tot dagen later kan worden waargenomen. Aangezien vroege tijdspunten niet zijn meegenomen in het experimenteel ontwerp van de in vivo blootstellingsstudie in hoofdstuk 2, kan dit de identificatie van microRNA als biomarker beïnvloed hebben. Zodoende is er voor een in vitro invalshoek gekozen in hoofdstuk 3. Voor deze studie zijn muis embryonale stamcellen (mES) behandeld met GTXC, NGTXC en oxidatieve (Ox) stoffen, waarna 4, 8 en 12 uur na blootstelling microRNA expressie profielen zijn gegenereerd. Na een blootstelling van 4 en 12 uur kon op basis van specifieke microRNA transcripten gedeeltelijk onderscheid gemaakt worden tussen

Samenvatting
133
respectievelijk de groep NGTXC versus de rest (GTXC en Ox) en GTXC versus Ox. Op basis van hoofdstuk 2 en hoofdstuk 3 kunnen we concluderen dat microRNA expressie profielen zouden kunnen bijdragen aan het samenstellen van lijsten die kankerverwekkende eigenschappen van stoffen kunnen voorspellen in in vitro, maar niet in (relatief) korte in vivo blootstellingstudies. De opkomst van Next Generation Sequencing (NGS) heeft een enorme impact gehad op genomische en transcriptomische studies. De complexiteit van de data gegenereerd door NGS vereist aangepaste analyse middelen. Zodoende hebben we TRAP (Total Rna Analysis Pipeline) ontwikkeld (hoofdstuk 5). Door bestaande NGS-gebaseerde protocollen voor transcriptoom analyse te combineren met TRAP hebben we het RNA landschap van de DDR in kaart gebracht. In hoofdstuk 4 hebben we mES cellen behandeld met cisplatin, UVC licht en ioniserende straling, welke ieder een specifiek spectrum van DNA schade veroorzaken. Na 4, 8 en 12 uur blootstelling aan deze factoren is RNA geïsoleerd en zijn mRNA en microRNA expressie profielen gegenereerd. Duidelijke verschillen werden waargenomen in de kinetiek van mRNA en microRNA expressie. De veranderingen in microRNAs waren afhankelijk van zowel de tijd als het type DNA schade, terwijl veranderingen in mRNAs onafhankelijk hiervan bleken te zijn. Deze bevindingen kunnen wijzen op de aanwezigheid van golven in de regulatie in RNA expressie. Verder onderzoek zal zich richten op het ontrafelen van deze complexe RNA veranderingen tijdens de DDR. De huidige protocollen om RNA expressie te meten, gebruikt in hoofdstuk 4, zijn gebaseerd op de isolatie van specifieke klasse van RNAs. In hoofdstuk 5 hebben we een methode ontwikkeld die niet op selectie van vooraf gedefinieerde klassen gebaseerd is, namelijk RNAome sequencing (RNAomeSeq). RNAomeSeq is door ons gedefinieerd als het in een enkel proces sequencen van het totale RNA dat slechts is ontdaan van ribosomaal RNA, en dus zowel kort als lang RNA als voor-eiwit-coderend en niet-voor-eiwit-coderend RNA bevat. Aan de hand van RNAomeSeq hebben we tienduizenden RNA transcripten gevonden, welke niet te detecteren waren met de bestaande protocollen. RNAomeSeq geeft een correcte weergaven van RNA transcripten, een hoge correlatie tussen expressie van transcripten gevonden met RNAomeSeq vergeleken met de overeenkomende bestaande protocollen (mRNASeq voor mRNA en smallRNASeq voor microRNAs). Ook werd een microRNA specifieke globale repressie na behandeling met cisplatin waargenomen, hetgeen demonstreert dat RNAomeSeq gebruikt kan worden om veranderingen in complete RNA klassen te bestuderen. De mogelijkheid om met behulp van RNAomeSeq het totale RNA, behalve ribosomaal RNA, te detecteren zal bijdragen aan het ontrafelen van de rol van RNA in fysiologische en pathogene cellulaire processen. Bovendien biedt RNAomeSeq een exponentiële toename in het aantal mogelijke RNA moleculen dat te gebruiken is voor diagnostische, prognostische of voorspellende doeleindes.


Chapter 8
Dankwoord
Curriculum Vitae
List of publications
PhD portfolio

136
Dankwoord Tsjonge, poehee, het is me toch gelukt om een boekje vol te schrijven. Hij is af en met trots mag ik jullie dan eindelijk mijn boekje presenteren! Geen bloed, zweet en tranen, maar vooral veel uren achter de computer en een flinke dosis stress hebben geleid tot dit resultaat. Om te beginnen mijn promotoren en mijn copromotor. Mijn eerste promotor, professor dr. Hoeijmakers, beste Jan. Bedankt voor de kans en de vrijheid die ik heb gekregen om binnen de afdeling Genetica mijn promotieonderzoek te mogen voltooien. Het altijd open staan van jouw deur om binnen te vallen met een vraag en de brainstorm sessies heb ik zeer kunnen waarderen. Mijn tweede promotor, professor dr. van der Horst, beste Bert. Ik kan me nog goed herinneren dat ik tijdens mijn sollicitatie bevlogen raakte over hoe je vertelde over de (voor mij toen nog onbekende) circadiaanse klok. Was ik niet aangenomen op het NTC-project dan had ik graag mijn promotieonderzoek op dit onderwerp gedaan. Vervolgens mijn copromotor, dr. Pothof, beste Joris. Allereerst bedankt voor de begeleiding van mijn promotieonderzoek. Je stimuleerde mij om samen te werken met de verschillende groepen, binnen en buiten het Erasmus. Dit was zeer leerzaam, prettig en vooral ook gezellig. Alle leden van mijn beoordelingscommissie, professor dr. Philipsen, professor dr. Agami en dr. Vrieling, heel erg bedankt voor de tijd en aandacht die jullie hebben besteed aan dit proefschrift. Dan het Vermeulen-lab waar ik het genoegen heb gehad om 4 jaar lang te hebben mogen vertoeven. Wim, bedankt voor de suggesties en sturing gedurende mijn promotie en bedankt dat ik in jouw lab heb mogen werken. De labuitjes en daaropvolgende bbq’s in jouw tuin waren altijd gezellig en iets om naar uit te kijken. Dan de mannen in Wims lab: Jurgen, Hannes en Arjan, bedankt voor de grappen en het lachen tijdens de koffie en/of lunch. De grappen konden (soms) niet hard genoeg zijn en was het maar goed dat er in het begin niet al te veel vrouwen rondliepen op het lab!! De oude mede-AIO’s, Joey, Maikel, Petra, Loes, Bert-Jaap en Özge bedankt voor de gezelligheid in het AIO-hok, op het lab en tijdens de PhD workshops. The “new” co-gradstudents, Serena, Imke, Franzi, Christina, Marie-Angela, Yasmin and Barbara, when I started the lab was an almost exclusive guys club, but now the girls have taken over. Good luck to you all with getting your PhD. Dan mag ik zeker Karen niet vergeten, de orde in de chaos op het lab, bedankt voor onze gesprekken en gezelligheid.
137
Nils, je verdient toch je eigen stukje. Net zoals mij ben jij ook van het lab naar achter de computer verdwenen. Het feit dat je op je racefiets naar het werk kwam, heeft mij aangespoord om ook een racefiets aan te schaffen, waardoor ik nu (mits het mooi weer is) “fanatiek” ben gaan fietsen. De gesprekken bij een kop koffie waren fijn en gezellig, hopelijk zullen er nog vele koppen koffie samen volgen. Ik mag de verouderingsgroep, a.k.a. “de andere kant”, natuurlijk niet vergeten, daar gaan we dan: Renate, Sander, Pim, Akos, Peter, Wilbert, Yvette, Sylvia, Roel, Ines, Annelieke, Yvonne, Cesar, Marshall en Marjolein, dank jullie allen voor de gezelligheid en warm welkom na mijn verhuizing naar jullie groep/kant van het gebouw. De secretaresses, Mariëlle, Marieke, Bep, Sonja en Jasperina, en dames van de keuken, jopie en joke, bedankt voor het kletsen en hulp. The Italian enclave, Pier, Chiara, Louana and Sara, the collaborations, small talk and jokes were highly appreciated and will hopefully all continue in the future! The last of the 7th floor but certainly not the least: Maria, my favourite postdoc ☺, I really learned a lot from you in the lab, many thanks for that! I loved working together and I hope we will continue doing so in the future. Sorry that we can’t take the train together anymore since I moved to Eindhoven. I really enjoyed the conversations, small talks and complaining about the NS (yes you became more Dutch than you are willing to admit). Op naar de 6e verdieping. Eerst Dik en Koos, bedankt voor de altijd openstaande deur om binnen te vallen met vragen en voor raad! Dan mag ik zeker de mensen van biomics niet vergeten, Christel, Zeliah, Edwin, Antoine, Walter, Frank, Mirjam, Rutger en Wilfred. Allen bedankt voor de fijne samenwerkingen en het altijd plat mogen lopen van jullie deur met al mijn vragen, het trap op en af lopen was ook nog eens goed voor de conditie, en was de gezelligheid zeker waard! De opmerkingen/reacties (ik noem geen namen) als ik voor de zoveelste keer langs kwam waren hartverwarmend te noemen ☺. Natuurlijk hebben er ook mensen van buiten het Erasmus meegeholpen aan het tot stand komen van dit boekje. Om te beginnen alle leden van het NTC WP1 dank jullie voor de constructieve kritiek tijdens de meetings. De aanwezigheid van Mirjam L en Joost van het RIVM, bracht (Brabantse) gezelligheid in de meetings van het NTC. Daarnaast zijn de samenwerkingen die hieruit zijn voortgekomen zeer prettig verlopen en hebben deze tot mooie artikelen geleid, zoals te zien is in dit boekje. Houdoe en bedankt!! Van het LUMC, de mede-aio’s en inmiddels dr. Mark en dr. Joris D bedankt voor de gezellige tijd tijdens de MGC workshops.
138
The one I definitely don’t want to forget and whom I owe a lot of thanks is Branko. Mr. B, you’re the person with the strangest working hours ever but you helped me to endure the struggle of learning to program in R. Again, thank you!!! Toch nog een extra stukje voor Joris, je dacht er toch niet met die karige paar regeltjes vanaf te komen? Na het plichtmatig kort bespreken van het promotieproject hadden we het al snel over van alles en nog wat waardoor het gesprek gigantisch uitliep. Ik verwachtte dan ook niks anders dan dat we gemakkelijk door een deur zouden kunnen en dat het wel goed zou komen qua begeleiding. De vele uren ouwehoeren dat wij de afgelopen jaren samen hebben gedaan, waren vaak leerzaam (als het over onderzoek ging) en een welkome afwisseling (wanneer het misschien even zo veel uren over al het andere ging). Bedankt! Een extra bedankje voor Caroline is op zijn plek, zonder jouw had ik niet van deze promotieplek af geweten en hier dus niet gestaan! De mannen (en aanhang waar toepasbaar) uit Tilburg: Jonas, Richard, Jonathan, Ruben en Gerrit. Ik ben benieuwd of jullie ooit gesnapt hebben waar ik mee bezig ben geweest de afgelopen jaren maar nu kunnen jullie het in ieder geval eindelijk lezen. De (te weinige) keren dat ik langskwam in Tilburg en de mannenweekenden zijn een fijne afleiding geweest de afgelopen jaren om even niet bezig te zijn met mijn promotieonderzoek. Jonas nog extra bedankt dat je mijn paranimf wilt zijn. De “schoonfamilie”, Hein, Margriet, Leonie en Jeroen, eindelijk is de laatste aan de beurt om te promoveren!! Wat een opluchting, nu is dan eindelijk de promotiestress voorbij in huize Paulis. Het heeft even geduurd, maar dan heb je ook wat: 3 doctoren. Dank jullie voor de bemoedigende woorden en interesse gedurende mijn promotieonderzoek. Pap, Mam, Eveline en Rosalie, het is dan zover na een juffrouw en dokter ook een doctor in het gezin. Het ver weg wonen in Leiden en daardoor niet snel even langs kunnen gaan viel soms zwaar, maar gelukkig wonen Yvette en ik nu weer lekker veilig onder de rivieren. Het is cliché, maar pap en mam bedankt voor de mogelijkheid die jullie mij hebben gegeven om te kunnen studeren. Pap, ik liet het vroeger waarschijnlijk niet vaak blijken, maar zonder jouw stimulatie om nieuwsgierig te zijn naar nieuwe dingen en te leren was ik nooit zo ver gekomen. En ik ben trots dat je mijn paranimf wilt zijn. Bedankt pap!!!! Mam, bedankt dat je er altijd voor me bent, voor een luisterend oor of gewoon om te kletsen, het heeft me gebracht waar ik nu ben!!

139
Als laatste maar zeker niet de minste, diegene die de afgelopen 5 jaar dit samen met mij heeft (moeten) doorstaan, Yvette. We hebben het gehaald, sjatteke!! Dat we nu beiden dr. zijn en in ruim 6 jaar avontuur, met aardig wat verhuizen (via Roermond, Leiden en Eindhoven), weer in het zuiden terecht zijn gekomen had ik nooit kunnen dromen. Doordat jij een jaar eerder begon met promoveren, wist ik wat me te wachten stond. Zonder je opbeurende humor en onnozelheid, je aansporingen en goed voorbeeld was dit boekje er niet geweest!!!! Dat ik na het promoveren nog vele (hopelijk minder stressvolle) avonturen samen met jou mag beleven!!!

140
Curriculum Vitae Kasper Derks was born on 28th of april 1986 in Terneuzen (the Netherlands). He graduated from secondary education at Odulphus Lyceum in Tilburg in 2004. He continued his education at the University of Maastricht, where he studied Clinical Molecular Life Sciences. During his Master studies he performed an internship on the effect of cetuximab on radiosensitivity in different cancer models (2008) and his Master project was focussed on the evaluation of the therapeutic effect of small molecules against CA IX in combination with conventional treatment modalities (2009). Both his internship and Master project were performed under the supervision of dr. L. Dubois in the laboratory of prof. dr. P. Lambin at the Maastricht Radiation Oncology (Maastro) department at the University of Maastricht. He obtained his Master of Science degree in 2009. From 2009 to 2013 he worked on his PhD research at the Erasmus University Medical Center, focusing on deciphering the RNA component of the DNA damage response. His work was performed at the Genetics laboratory under the guidance of prof. dr. J.H.J. Hoeijmakers, prof. dr. G.T.J. van der Horst and supervisor dr. J. Pothof. In January 2014, he started as a bioinformatics postdoctoral fellow at the Genetics department at the Erasmus University Medical Center.
141
List of publications The DNA damage response: the omics era and its impact Kasper W.J. Derks, Joris Pothof, Jan H.J. Hoeijmakers DNA Repair (Review) In vivo murine hepatic microRNA and mRNA expression signatures predicting the (non‐)genotoxic carcinogenic potential of chemicals Joost P. M. Melis*, Kasper W. J. Derks*. Tessa E. Pronk. Paul Wackers. Mirjam M. Schaap, Edwin Zwart, Wilfred F. J. van IJcken, Martijs J. Jonker, Timo M. Breit, Joris Pothof, Harry van Steeg, Mirjam Luijten * equal contribution Archives of Toxcology. A microRNA expression signature predicts the (non-)genotoxic carcinogenic potential of compounds in mouse embryonic stem cells Kasper W.J. Derks, Joost P.M. Melis, Tessa Pronk, Giel Hendriks, Harry Vrieling, Jan H.J. Hoeijmakers, Mirjam Luijten, Wilfred F. van IJcken, Joris Pothof Manuscript in preparation. The kinetics of the RNA landscape in murine embryonic stem cells in response to DNA damage Kasper W.J. Derks, Rutger W.W. Brouwer, Mirjam C.G.N. van den Hout, Christel E.M. Kockx, Jan H.J. Hoeijmakers, Wilfred F.J. van IJcken, Joris Pothof Manuscript in preparation Deciphering the RNA landscape by RNAome sequencing Kasper W.J. Derks, Branislav Misovic, Mirjam C.G.N. van den Hout, Christel E.M. Kockx, Cesar Payan Gomez, Rutger W.W. Brouwer, Harry Vrieling, Jan H.J. Hoeijmakers, Wilfred F.J. van IJcken, Joris Pothof Submitted

142
PhD portfolio
Year Courses Advanced RNA sequencing 2011 (Amsterdam Medical Center) Bioinformatics II: Programming in R 2010 (Amsterdam Medical Center)
Next Generation Sequencing 2009 (Leiden University Medical Center) Laboratory Animal Science 2008 (Certificate Art. 9, Maastricht University) Radiation Hygiene 2008 (Expertise level 5b,Maastricht University) Safe Microbiological Techniques 2008 (Certificate VMT, Maastricht University)
Presentations
Poster presentation Keystone meeting RNAi 2012 (Vancouver, Canada) NTC annual meeting 2011 (Rode Hoed, Amsterdam) MGC PhD workshop 2011 (Maastricht) NTC annual meeting 2010 (Rode Hoed, Amsterdam) Oral presentation NVT annual meeting 2014 (Veldhoven)

143
MGC meeting 2014 (Rotterdam) NTC annual meeting 2012 (Rode Hoed, Amsterdam) MGC PhD workshop 2012 (Dusseldorf) MGC meeting 2012 (Leiden)