Isolation of Ty1- copia retrotransposon in myrtle genome and development of S-SAP molecular marker
10
Isolation of Ty1-copia retrotransposon in myrtle genome and development of S-SAP molecular marker Pasqualina Woodrow • Giovanni Pontecorvo • Loredana F. Ciarmiello Received: 23 March 2011 / Accepted: 17 June 2011 / Published online: 2 July 2011 Ó Springer Science+Business Media B.V. 2011 Abstract Long terminal repeat (LTR)-retrotransposons are mobile genetic elements that are ubiquitous in plants and constitute a major portion of their nuclear genomes. LTR- retrotransposons possess unique properties that make them appropriate for investigating relationships between populations, varieties and closely related species. Myrtus communis L. is an evergreen shrub growing spontaneously throughout the Mediterranean area. Accessions show sig- nificant variations for agriculturally important traits, so the development of specific molecular markers for conserva- tion and characterization of myrtle germplasm is desirable to conserve biodiversity. In this study, we isolated the first retrotransposon Ty1-copia-like element (Tmc1) in Myrtus communis L. genome and used this as a molecular marker. We successfully employed the S-SAP marker system to specifically characterize four myrtle accessions belonging to different areas in the province of Caserta (Italy). The high level of polymorphism detected in isolated LTRs, make Tmc1 a good molecular marker for this species. Our findings confirm that retrotransposon-based molecular markers are particularly valuable tools for plant molecular characterization studies. Keywords Biodiversity assessment LTRs S-SAP Ty1-copia retrotransposon Introduction Myrtle (Myrtus communis L.) is a diploid evergreen shrub (2n = 22) belonging to the family of Myrtaceae. Myrtle is one of the most important plants that grow spontaneously throughout of the Mediterranean countries, including Tur- key, Greece, Italy, Algeria, Tunisia, and Morocco [1]. In Italy it grows along the coast and in the inner hills and it is found especially on the islands, where it is one of the most characteristic species. This species is economically important for production of essential oils from leaves and liqueur from fruits. Essential oils are gaining remarkable interest for their potential multipurpose use as antioxidant, antibacterial, and anti- septic agents; the essential oil obtained from the leaves was used in the past to treat lung disorders [2]. Since 2005, Italy has developed a program of genetic improvement, which allowed it to select over 40 cultivars. Molecular markers have revolutionized the genetic analysis of crop plants, where they play a vital role in linkage analysis, physical mapping, quantitative trait locus (QTL) analysis, marker-assisted selection and map-based cloning. However, the usefulness of any given marker system depends on the species under study and the chosen application. Several DNA based markers have been developed to detect polymorphisms [3, 4]. Over the last 15 years retrotransposon-based markers have been developed for crop species and trees across the plant kingdom, as well as for fungi and insects [5]. Ret- rotransposons are ubiquitous in plant genomes [6–9]. They are distributed as interspersed repetitive sequences throughout the length of all host chromosomes [10]. Their ubiquitous nature and their activity in creating genomic diversity by stably integrating large DNA segments into dispersed chromosomal loci make these elements ideal for P. Woodrow G. Pontecorvo (&) Department of Life Science, II University of Naples, Via Vivaldi, 43, 81100 Caserta, Italy e-mail: [email protected] L. F. Ciarmiello C.R.A.-Fruit Tree Research Unit, Via Torrino, 3, 81100 Caserta, Italy 123 Mol Biol Rep (2012) 39:3409–3418 DOI 10.1007/s11033-011-1112-8
Transcript of Isolation of Ty1- copia retrotransposon in myrtle genome and development of S-SAP molecular marker

Isolation of Ty1-copia retrotransposon in myrtle genomeand development of S-SAP molecular marker
Pasqualina Woodrow • Giovanni Pontecorvo •
Loredana F. Ciarmiello
Received: 23 March 2011 / Accepted: 17 June 2011 / Published online: 2 July 2011
� Springer Science+Business Media B.V. 2011
Abstract Long terminal repeat (LTR)-retrotransposons
are mobile genetic elements that are ubiquitous in plants
and constitute a major portion of their nuclear genomes.
LTR- retrotransposons possess unique properties that make
them appropriate for investigating relationships between
populations, varieties and closely related species. Myrtus
communis L. is an evergreen shrub growing spontaneously
throughout the Mediterranean area. Accessions show sig-
nificant variations for agriculturally important traits, so the
development of specific molecular markers for conserva-
tion and characterization of myrtle germplasm is desirable
to conserve biodiversity. In this study, we isolated the first
retrotransposon Ty1-copia-like element (Tmc1) in Myrtus
communis L. genome and used this as a molecular marker.
We successfully employed the S-SAP marker system to
specifically characterize four myrtle accessions belonging
to different areas in the province of Caserta (Italy). The
high level of polymorphism detected in isolated LTRs,
make Tmc1 a good molecular marker for this species. Our
findings confirm that retrotransposon-based molecular
markers are particularly valuable tools for plant molecular
characterization studies.
Keywords Biodiversity assessment � LTRs � S-SAP �Ty1-copia retrotransposon
Introduction
Myrtle (Myrtus communis L.) is a diploid evergreen shrub
(2n = 22) belonging to the family of Myrtaceae. Myrtle is
one of the most important plants that grow spontaneously
throughout of the Mediterranean countries, including Tur-
key, Greece, Italy, Algeria, Tunisia, and Morocco [1]. In
Italy it grows along the coast and in the inner hills and it is
found especially on the islands, where it is one of the most
characteristic species.
This species is economically important for production of
essential oils from leaves and liqueur from fruits. Essential
oils are gaining remarkable interest for their potential
multipurpose use as antioxidant, antibacterial, and anti-
septic agents; the essential oil obtained from the leaves was
used in the past to treat lung disorders [2]. Since 2005, Italy
has developed a program of genetic improvement, which
allowed it to select over 40 cultivars.
Molecular markers have revolutionized the genetic
analysis of crop plants, where they play a vital role in
linkage analysis, physical mapping, quantitative trait locus
(QTL) analysis, marker-assisted selection and map-based
cloning. However, the usefulness of any given marker
system depends on the species under study and the chosen
application. Several DNA based markers have been
developed to detect polymorphisms [3, 4].
Over the last 15 years retrotransposon-based markers
have been developed for crop species and trees across the
plant kingdom, as well as for fungi and insects [5]. Ret-
rotransposons are ubiquitous in plant genomes [6–9]. They
are distributed as interspersed repetitive sequences
throughout the length of all host chromosomes [10]. Their
ubiquitous nature and their activity in creating genomic
diversity by stably integrating large DNA segments into
dispersed chromosomal loci make these elements ideal for
P. Woodrow � G. Pontecorvo (&)
Department of Life Science, II University of Naples,
Via Vivaldi, 43, 81100 Caserta, Italy
e-mail: [email protected]
L. F. Ciarmiello
C.R.A.-Fruit Tree Research Unit, Via Torrino, 3,
81100 Caserta, Italy
123
Mol Biol Rep (2012) 39:3409–3418
DOI 10.1007/s11033-011-1112-8

development as molecular markers. They are classified into
two major families, based on the presence or absence of
long-terminal repeats (LTRs) at the transposon ends [11].
Retrotransposons move to new chromosomal locations via
an RNA intermediate that is converted into extrachromo-
somal DNA by the encoded reverse transcriptase/RNaseH
enzymes prior to reinsertion into the genome. Integration
sites shared between germplasm accessions are highly
likely to have been present in their last common ancestor.
Therefore, retrotransposon insertional polymorphisms can
help establish pedigrees and phylogenies as well as serve as
biodiversity indicators.
As retrotransposition is thought to be more or less ran-
dom with respect to the region of insertion, insertions at
exactly the same location appear unlikely. Thus, as
opposed to reversible changes in DNA sequence compo-
sition, insertion events of retrotransposons have been
claimed to be homoplasy-free phylogenetic markers with
minimal noise from reversal or parallel events: species,
which share an insertion at a particular locus are grouped
together on the tree and all species that lack the insertion
are considered basal to this clade [5, 12].
In contrast, microsatellites, SNPs and methods relying
on gain or loss of restriction sites suffer from a lack of
temporal directionality in the changes they detect, resulting
in the problem of homoplasy [5]. Several systems for
identifying transposon insertion sites have been developed
[13].
The sequence-specific amplification polymorphism
(S-SAP) approach is the most popular transposon based
molecular marker method at the present time [3, 14, 15].
The S-SAP marker approach is similar to that of AFLPs
in that genomic DNA is digested with restriction enzymes,
enzyme-specific adapters are ligated to the restriction
products and the resulting fragments are PCR-amplified
[16]. The final step differs between the two approaches:
AFLP uses two different adapter specific primers carrying
selective bases to reduce the number of amplified marker
bands to a manageable level; S-SAP uses a single adapter-
specific primer, together with a transposon-specific, label-
led primer with selective base(s) on the 30-end [16].
Here we isolated the first partial retrotransposon Ty1-
copia in Myrtus communis L. and we successfully used it as
a molecular marker by employing of the S-SAP marker
system to specifically identify of four Myrtus communis L.
accessions.
Materials and methods
Genomic DNA extraction
Field collected young leaves were frozen in liquid nitrogen
until their use. Genomic DNA was isolated from four
Myrtus communis L. accessions belonging to distinct geo-
graphical areas of Caserta province (Italy): Caiazzo, Castel
Morrone, Castel Volturno and Durazzano. Extractions, in
triplicate, were performed using 1 g of fresh leaf tissues for
each plant, by the CTAB procedure of Doyle and Doyle
[17], and purified with the ICRISAT DNA extraction
procedure [18] to improve the DNA quality. DNA quality
and quantity were determined spectrophotometrically and
by electrophoresis on 1% agarose gel stained by ethidium
bromide [19].
Isolating, cloning and sequencing of RNaseH-LTR
fragments
To isolate RNaseH-LTR sequences, we used the Pearce
protocol [20]. Partially restricted DNA (EcoRI for 2 h) was
ligated to adaptors [Adat1-Adat2 (Table 1)] overnight at
4�C. From a 109 dilution of the restriction-ligation reac-
tion, 1 ll was taken as template for a 20 ll PCR, con-
taining 12.5 pmol RH primer, 12.5 pmol of EcoRI adaptor
primers (Table 1), 1.5 mM MgCl2, 200 lL dNTPs, 1U
of Hot-star Taq DNA Polymerase (Qiagen). Cycling
Table 1 S-SAP adaptors and primer sequences
Type Primer/adaptor name Sequence 50 ? 30
S-SAP retrotransposon primers (position in LTR sequence) Tmc1-LTR (663-683) GCCTGATAGATCGACACTAA
Tmc2-LTR (345-365) TTTGTGGTGACCACCGCGCC
S-SAP adaptors Double-stranded EcoRI adaptor Adat1 (P)-ATTCGAGGATAGGCTTTGGG
Adat2 CCCAAAGCCTATCCTCG
S-SAP adaptor primers (restriction site) EcoRI CCCAAAGCCTATCCTCGAATTC
EcoRI?C CCCAAAGCCTATCCTCGAATTCC
EcoRI?T CCCAAAGCCTATCCTCGAATTCT
EcoRI?A CCCAAAGCCTATCCTCGAATTCA
EcoRI?G CCCAAAGCCTATCCTCGAATTCG
3410 Mol Biol Rep (2012) 39:3409–3418
123

conditions were those specified by Pearce et al. [21], with
minor changes, consisting of a denaturation step at 95�C
for 15 min, followed by 30 cycles at 94�C for 1 min, 60�C
for 1 min, 72�C for 1 min, with a final extension of 10 min.
The amplified fragments were purified and cloned using
pGEM-T easy cloning Kit (Promega).
Cloning was performed by mixing 3 ll of amplified
product with 50 ng of pGEM-T Easy Vector, 3U T4 DNA
ligase, and 19 ligation buffer in 10 ll volume. The ligation
product was cleaned with sec-butanol and precipitated with
ethanol. The sample was resuspended in 10 ll of 0.59
Tris–EDTA and used to transform Escherichia coli cells.
Twelve positive clones were sequenced using ABI 377
automated DNA sequencer (Applied Biosystems).
DNA sequence analysis
Nucleotide sequences data were analyzed and compared to
the GenBank-NCBI databases using the BLAST network
service (http://www.ncbi.nlm.nih.gov/BLAST/) and CEN-
SOR software to find conserved domains in Repbase, a
database of repetitive elements (http://www.girinst.org/
censor) [22].
Multiple sequences alignments were performed using
AliBee—Multiple Alignment 2.0 (http://www.genebee.
msu.su/services/malign_reduced.html) with Clustal W
algorithm [23] from the DDBJ Homology Search system
(http://www.ddbj.nig.ac.jp).
Sequence-specific amplification polymorphisms
procedure (S-SAP)
The S-SAP procedure was performed as described by
Waugh et al. [24] with the following modifications. Total
genomic DNA (2 lg) of M. communis for each accession
(Castel Volturno, Castel Morrone, Durazzano, Caiazzo)
was digested with EcoRI restriction enzyme (20 U)
(Roche) for 2 h at 37�C in a final volume of 50 ll. The
digested DNA samples were incubated at 80�C for 20 min
to inactivate the restriction enzyme. For ligation, 10 ll of
the restriction reaction was added to a mixture containing
T4 DNA ligase (1U, Roche), 1 mM ATP in 10 mM Tris–
HCL (pH 7.5), 10 mM MgAc, 50 mM KAc, to which
40 pmol EcoRI phosphorylated adaptors were added
(Table 1). The reaction mix was incubated overnight at
4�C and then pre-amplified, using 12.5 pmol of LTR pri-
mer (Tmc1-LTR and Tmc2-LTR for Tmc1 and Tmc2 ret-
rotransposon, respectively) and EcoRI primer (without
selective nucleotide primers) complementary to the adap-
tor sequences (Table 1), in a final volume of 20 ll con-
taining 12.5 pmol of each primer, 1.5 mM MgCl2, 200
lL dNTPs, 1U of Hot-star Taq DNA Polymerase (Qia-
gen). The PCR conditions were as follows: denaturation
step at 95�C for 15 min, followed by 30 cycles at 94�C for
1 min, 60�C for 1 min, 72�C for 1 min, with a final
extension of 10 min. Selective amplification was per-
formed with primer pairs containing one of the selective
nucleotides on the adapter primers named EcoRI?A,
EcoRI?C, EcoRI?G, EcoRI?T in combination with
specific LTR primer (Tmc1-LTR and Tmc2-LTR, alterna-
tively) (Table 1). The amplified fragments were separated
on 6.5% denaturant polyacrylamide sequencing gels
(20 9 30 9 0.04 cm).
Samples were then run at 80 V for 18 h in 19 TBE
buffer and transferred to nylon membrane (Hybond-N?,
Amersham) under standard conditions. For filter hybrid-
izations, we used the Tmc1 fragment (only LTR sequence)
obtained by PCR amplification, purified by agarose gel
electrophoresis and Dig-labelled by random priming
(Roche). Hybridizations were carried out (25 ng/ml of
digoxigenin-labeled DNA) at 65�C overnight and visual-
ized by immuno-staining colorimetric. S-SAP analysis was
performed on three different biological samples for each
accessions and each performed in triplicate.
Polymorphic S-SAP bands were selected, excised from
gels using a razor blade and re-suspended in 100 ll of
water. DNA was eluted from the bands by boiling for
15 min, salt-precipitated and re-suspended in 10 ll of
sterile water. A 5 ll-sample was then used as DNA tem-
plate in PCR amplification using the S-SAP conditions
and primers described above. Amplification products
were separated on 1.5% agarose gels, eluted cloned and
sequenced.
The uniqueness of each polymorphic S-SAP band was
tested by PCR. Primers (sequence available upon request)
were designed on the flanking genomic regions of clones
sequenced. Direct PCRs were performed using flanking
sequence primers in combination with Tmc1-LTR primer.
In each case DNA providing the S-SAP band was tested
against other DNA accessions.
The uniqueness of Tmc1 insertion was indicated when a
PCR product was obtained only in DNA from the corre-
sponding accession. All new insertions were named as
follows: the letter indicates the type of accession
(CV = Castel Volturno, D = Durazzano, C = Caiazzo,
CM = Castel Morrone); the number identified polymor-
phic copies of S-SAP bands.
SNP-PCR strategy
For each investigated accession, one specific nucleotide
position in LTR-D1 and LTR-CV1 clones was tested. For-
ward primers harbouring the population-specific nucleotide
at the 30 end and reverse common primers for each popu-
lation were designed. Moreover, primer sequences for
internal control (control 1 and control 2, primers) were
Mol Biol Rep (2012) 39:3409–3418 3411
123

constructed on initial sequence of 30 LTR Tmc1. Melting
temperature (Tm) calculations were performed with Oligo
Calc: Oligonucleotide Properties Calculator server (http://
www.basic.northwestern.edu/biotools/oligocalc.html).
Based on the modified PCR protocol previously
described by Newton and colleagues [25], SNPs PCRs
were performed in a volume of 50 ll containing approxi-
mately 80 ng genomic DNA, 1.5 mM of each dNTP
(Roche), 1 lM of each primer and 1U of Taq DNA poly-
merase in 10 mM Tris/HCl pH 8.3, 2.5 mM MgCl2(Roche). Control 1 (50-GTTGGAGTTGGCGAATACTTG-
30) and control 2 (50-TCGTTAGTTCATACTTCGATTT-
30) primers were included in all reactions. The PCR cycling
program consisted of a preliminary denaturation at 94�C
for 4 min, followed by 35 cycles of 30 s at 94�C, 45 s at 50
or 66�C, and 30 s at 72�C with a final extension step of
7 min at 72�C. Then, PCR products were electrophoresed
on 2% agarose gels and visualized in presence of 0.5 lg/ml
ethidium bromide.
Results and discussion
Isolation of LTR sequences from Myrtus communis
Isolating LTR sequences requires amplification between a
conserved region in the adjacent LTR sequence and a
flanking genomic DNA [20]. Using degenerate RNase H
primers designed on two conserved motifs of RNase H
domains (TKHIDVR and ADIFTK) and restriction-site
specific adaptors, we successfully amplified the putative
Ty1-copia RNaseH-LTR regions from M. communis.
Degenerated primers (RH1 and RH2) are derived from
consensus sequences of Tnt1 [26], Tto1 [27], Ta1-3-like
[28] and Silvia [29]. Different fragments were amplified
and seven of these (the most intense bands) were cloned
into the pGEM-T vector. 12 positive clones were
sequenced using ABI 377 automated DNA sequencer
(Applied Biosystems). The deduced amino acid sequences
of 12 clones were compared with other retrotransposons
reported in plants deposited in GenBank database and
analyzed using CENSOR software [22]. Sequences were
compared to the consensus RNaseH region [21] and only 2
sequences showed clear similarity to RNaseH domain of
Ty1-copia retrotransposons, while no other sequences
revealed the presence of RNase H. In particular, these two
clones were scanned for the following features: the con-
served ARTKIEVD and ADIFTK RNaseH domains, a stop
codon, a polypurine tract (PPT), an inverted terminal repeat
(IR) and a complete putative 30 LTR sequence (data not
shown). We named these two LTR retrotransposon
sequences Tmc1 and Tmc2, (Transposon, Myrtus commu-
nis) (a.n FR692046-FL693379).
Translated amino acid sequence comparisons from each
clone with RNase H sequences of the Ty1-copia retro-
transposons previously reported in both monocotyledon
and dicotyledon plant species (a.n. AC198009-D83003-
AC241300-FJ705357.1) showed a moderate (71–78%)
level of amino acid conservation.
S-SAP marker development in M. communis
Retrotransposons have found wide application in plant
genetics and with the exponential increase in retrotrans-
poson nucleotide sequences deposited in GenBank many
efficient tools in the field of so-called ‘‘transposon dis-
play’’, able to highlight the insertional profile have been
developed. Therefore, retrotransposon insertional poly-
morphisms can help establish pedigrees and phylogenies
[3] as well as serve as biodiversity indicators. Here we
analyzed, the extent of retrotransposon-related variability
in the genomes of wild genotypes of myrtle belonging to
distinct geographical areas in the Caserta province. We
have designed an anchor primer in the LTR sequence near
to the external terminus orientated towards the 30 end for
S-SAP analysis. Thus, DNA fingerprints of four myrtle
accessions were obtained using two specific primers con-
structed on the LTR region of Tmc1 and Tmc2 elements in
combination with four selective EcoRI primers (for a total
of 10 primer combinations for each accession) (Fig. 1;
Table 1).
Two LTR-derived primers named Tmc1-LTR and Tmc2-
LTR (Table 1) were selected for the final S-SAP analysis
based on the result of a pre-screening S-SAP assay to select
the most optimal primer combinations.
We have analyzed three plants for each accession. For
each plant, S-SAP assays were performed in triplicate and
identical patterns were observed (data not shown) indicat-
ing the absence of intra-accession polymorphisms.
The combinations with Tmc2-LTR primer did not pro-
duce enough polymorphic bands for a good marker system
(data not shown), indicating a low polymorphism in the
myrtle genome, whereas the combinations with Tmc1-LTR
primer generated a characteristic profiling for each popu-
lation. Each S-SAP polymorphic band concatenates a
region at the 30LTR of the target retrotransposon and the
unique ‘host’ genomic sequence in which each Tmc1 ret-
rotransposon copy is embedded. The clear and different
profiles produced in all samples showed that Tmc1 is
present in all myrtle accessions studied. This suggests that
Tmc1 has been integrationally active within these groups of
accessions since their divergence from the last common
ancestor. Once a retrotransposon is stably integrated into a
genomic location it is inherited in a Mendelian manner.
S-SAP-based polymorphism may result from transposi-
tional activity of retroelements and/or polymorphisms in
3412 Mol Biol Rep (2012) 39:3409–3418
123

the restriction site, as reported for AFLP and some
restriction fragment length polymorphisms [30].
The EcoRI?T primer combination generated a low
S-SAP profile compared with other EcoRI primer combi-
nations that gave a highly discriminating profile, with an
excellent degree of reproducibility (Fig. 2; Table 2).
Thirty-four polymorphic S-SAP bands were scored
using EcoRI?G, EcoRI?A, EcoRI?C and EcoRI primer
combinations. The results are showed in Fig. 2 and sum-
marized in the Table 2. The size of the S-SAP product
detected ranged from 200 to 1200 nucleotides. Slightly
small products (approx. 150 and 250 in size) were ampli-
fied with all primer combinations (Fig. 2). LTR sequence
of Tmc1 element was used as a probe in S-SAP Southern
blot analysis (high stringency). The high polymorphisms
observed in the four myrtle accessions may be the result of
high copy number of the intact retrotransposon related to
Tmc1 element or different copy number of the LTRs
themselves.
This hypothesis is supported by the small products (less
of 250 bp) and as Tmc1 LTR sequence does not contain
sites for the restriction enzyme EcoRI, such products may
be due to a member of Tmc1 family (Fig. 2).
We identified unique bands (present in only one acces-
sion) and non-unique bands (present in more than one
accessions). The non-unique polymorphic bands in more
Fig. 1 Isolation of S-SAP fragments containing Tmc1-Tmc2 retro-
transposon LTR sequences. Genomic DNA is partially digested with
EcoRI restriction enzyme. Adaptors are then ligated and PCR carried
out with a Tmc1-LTR and Tmc2-LTR primers (arrows) each of which
are used in combination with different selective primer combinations
EcoRI?X (A, T, C, G). The squares indicate the two RNaseH gene
conserved motifs. Lines indicate RNaseH-LTR regions of Tmc1 and
Tmc2 retrotransposon isolated with a Pearce protocol [21]
Fig. 2 S-SAP profiles of Tmc1retrotransposon with different
selective primer combinations:
Tmc1-LTR/EcoRI?A; Tmc1-LTR/EcoRI?T; Tmc1-LTR/
EcoRI?C; Tmc1-LTR/
EcoRI?G; Tmc1-LTR/
EcoRI?0. Lanes: C, D, CV,
CM, genomic DNA from
Caiazzo, Durazzano, Castel
Volturno and Castel Morrone
acessions, respectively. Circles
indicate polymorphic bands
eluted for each accession
Mol Biol Rep (2012) 39:3409–3418 3413
123
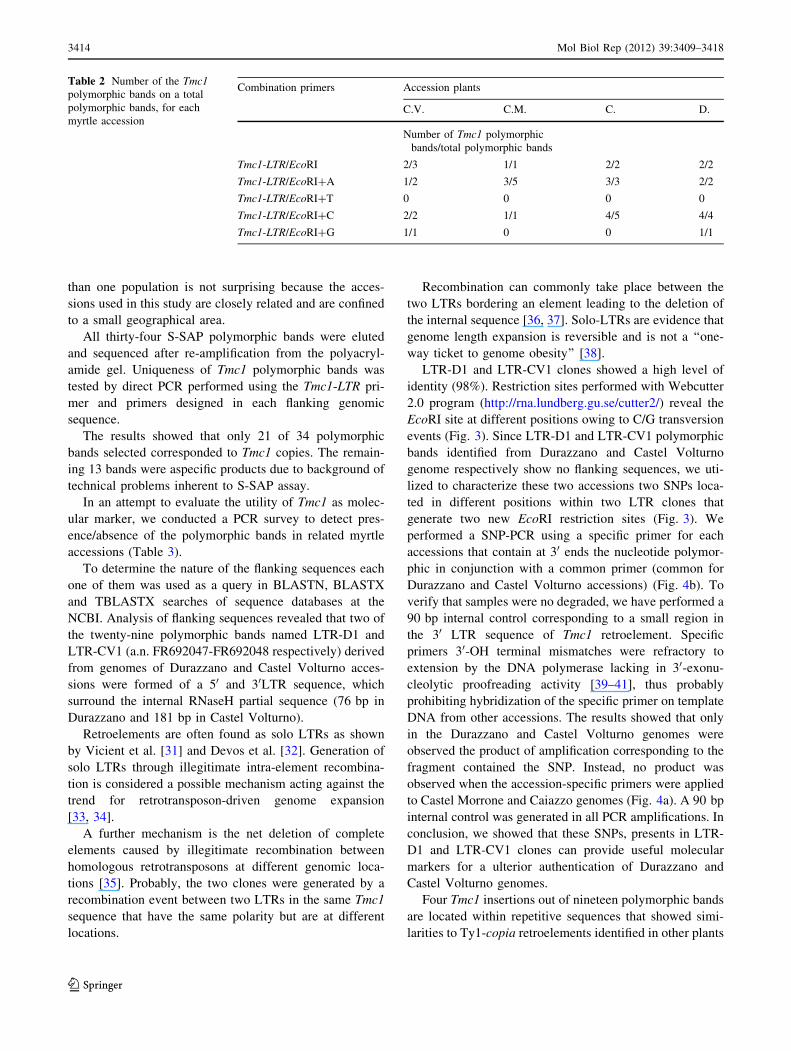
than one population is not surprising because the acces-
sions used in this study are closely related and are confined
to a small geographical area.
All thirty-four S-SAP polymorphic bands were eluted
and sequenced after re-amplification from the polyacryl-
amide gel. Uniqueness of Tmc1 polymorphic bands was
tested by direct PCR performed using the Tmc1-LTR pri-
mer and primers designed in each flanking genomic
sequence.
The results showed that only 21 of 34 polymorphic
bands selected corresponded to Tmc1 copies. The remain-
ing 13 bands were aspecific products due to background of
technical problems inherent to S-SAP assay.
In an attempt to evaluate the utility of Tmc1 as molec-
ular marker, we conducted a PCR survey to detect pres-
ence/absence of the polymorphic bands in related myrtle
accessions (Table 3).
To determine the nature of the flanking sequences each
one of them was used as a query in BLASTN, BLASTX
and TBLASTX searches of sequence databases at the
NCBI. Analysis of flanking sequences revealed that two of
the twenty-nine polymorphic bands named LTR-D1 and
LTR-CV1 (a.n. FR692047-FR692048 respectively) derived
from genomes of Durazzano and Castel Volturno acces-
sions were formed of a 50 and 30LTR sequence, which
surround the internal RNaseH partial sequence (76 bp in
Durazzano and 181 bp in Castel Volturno).
Retroelements are often found as solo LTRs as shown
by Vicient et al. [31] and Devos et al. [32]. Generation of
solo LTRs through illegitimate intra-element recombina-
tion is considered a possible mechanism acting against the
trend for retrotransposon-driven genome expansion
[33, 34].
A further mechanism is the net deletion of complete
elements caused by illegitimate recombination between
homologous retrotransposons at different genomic loca-
tions [35]. Probably, the two clones were generated by a
recombination event between two LTRs in the same Tmc1
sequence that have the same polarity but are at different
locations.
Recombination can commonly take place between the
two LTRs bordering an element leading to the deletion of
the internal sequence [36, 37]. Solo-LTRs are evidence that
genome length expansion is reversible and is not a ‘‘one-
way ticket to genome obesity’’ [38].
LTR-D1 and LTR-CV1 clones showed a high level of
identity (98%). Restriction sites performed with Webcutter
2.0 program (http://rna.lundberg.gu.se/cutter2/) reveal the
EcoRI site at different positions owing to C/G transversion
events (Fig. 3). Since LTR-D1 and LTR-CV1 polymorphic
bands identified from Durazzano and Castel Volturno
genome respectively show no flanking sequences, we uti-
lized to characterize these two accessions two SNPs loca-
ted in different positions within two LTR clones that
generate two new EcoRI restriction sites (Fig. 3). We
performed a SNP-PCR using a specific primer for each
accessions that contain at 30 ends the nucleotide polymor-
phic in conjunction with a common primer (common for
Durazzano and Castel Volturno accessions) (Fig. 4b). To
verify that samples were no degraded, we have performed a
90 bp internal control corresponding to a small region in
the 30 LTR sequence of Tmc1 retroelement. Specific
primers 30-OH terminal mismatches were refractory to
extension by the DNA polymerase lacking in 30-exonu-
cleolytic proofreading activity [39–41], thus probably
prohibiting hybridization of the specific primer on template
DNA from other accessions. The results showed that only
in the Durazzano and Castel Volturno genomes were
observed the product of amplification corresponding to the
fragment contained the SNP. Instead, no product was
observed when the accession-specific primers were applied
to Castel Morrone and Caiazzo genomes (Fig. 4a). A 90 bp
internal control was generated in all PCR amplifications. In
conclusion, we showed that these SNPs, presents in LTR-
D1 and LTR-CV1 clones can provide useful molecular
markers for a ulterior authentication of Durazzano and
Castel Volturno genomes.
Four Tmc1 insertions out of nineteen polymorphic bands
are located within repetitive sequences that showed simi-
larities to Ty1-copia retroelements identified in other plants
Table 2 Number of the Tmc1polymorphic bands on a total
polymorphic bands, for each
myrtle accession
Combination primers Accession plants
C.V. C.M. C. D.
Number of Tmc1 polymorphic
bands/total polymorphic bands
Tmc1-LTR/EcoRI 2/3 1/1 2/2 2/2
Tmc1-LTR/EcoRI?A 1/2 3/5 3/3 2/2
Tmc1-LTR/EcoRI?T 0 0 0 0
Tmc1-LTR/EcoRI?C 2/2 1/1 4/5 4/4
Tmc1-LTR/EcoRI?G 1/1 0 0 1/1
3414 Mol Biol Rep (2012) 39:3409–3418
123

Table 3 Presence (?) or absence (-) of Tmc1 polymorphic bands in myrtle accessions and nature of flanking restriction site
Insertion Myrtus communis accessions Nature of flanking sequence
C.V. C.M. C. D. BLASTx research
Tmc1-D1 – – – ? Sequence coding hypothetical protein LOC100251485
Tmc1-D2 – – – ? No significant hit
Tmc1-D3 – – – ? No significant hit
Tmc1-D4 – – – ? No significant hit
Tmc1-CV1 ? – – – No significant hit
Tmc1-CV2 ? – – – Sequence coding disease resistance protein XP002519369.1
Tmc1-CV3 ? – – – Sequence coding hypothetical protein LOC100263766
Tmc1-CV6 ? – – – Repetitive DNA sequence
Tmc1-CV7 ? – – – Repetitive DNA sequence
LTR-D1 – – – ? –
LTR-CV1 ? – – – –
Tmc1-CM1 – ? – – No significant hit
Tmc1-CM2 – ? – – Sequence coding disease resistance protein AAU89656.1
Tmc1-CM3 – ? – – No significant hit
Tmc1-CM4 – ? – – No significant hit
Tmc1-C1 – – ? – No significant hit
Tmc1-C2 – – ? – No significant hit
Tmc1-C3 – – ? – No significant hit
Tmc1-C4 – – ? – No significant hit
Tmc1-C5 – – ? – Copia-like retrotransposon insert in POL region
Tmc1-C6 – – ? – Copia-like retrotransposon insert in reverse transcriptase
Fig. 3 Nucleotide alignment of Tmc1, LTR-D1 and LTR-CV1 clones. Arrows indicated the presence of EcoRI cutter site in different position
within LTR-D1 and LTR-CV1 sequence. Two clones have been aligned on the 30LTR of Tmc1 element
Mol Biol Rep (2012) 39:3409–3418 3415
123

(Table 3). It is known, in fact, that retroelements tend to
aggregate in other retrotransposon-related sequences and
these nested insertions reduce active copy number, because
the so-formed multimers cannot fully transpose [42].
Although the meaning of nested insertion is not under-
stood. One possible explanation is that targeting retro-
transposons into non-essential retrotransposonic sequences
helps minimize deleterious mutations from transposition
[42]. Alternatively, insertion in coding regions could be
subsequently counter-selected by evolutionary processes.
Eleven insertions did not reveal any significant identity
to known sequences (Table 3). The absence of significant
hits for these sequences is probably due to the poor rep-
resentation of information for the myrtle genome within
available databases.
Results through BLASTx research showed that four
insertions are located within sequences coding resistance
protein belonging to the NBS-LRR family (Table 3). This
is surprising considering that it is a TE inserted in a genic
region with a high frequency.
Insertion sites within resistance gene is consistent with
the model for gene space in papilionoids recently proposed
by Bertioli et al. [43]. This model suggests that gene space
may be divided into two broadly defined components: more
conserved regions which tend to have low retrotransposon
densities are relatively stable during evolution and have
higher densities of evolutionary conserved genes; variable
regions that tend to have high retrotransposon densities,
and whose frequent restructuring may fuel the evolution of
plant disease resistance genes and perhaps other multigenic
families.
Insertions of Tmc1 within NBS-LRR genes may be tol-
erated because these resistance (R) genes are members of a
multigenic family and extra gene copies compensate for any
allelic deficiencies from a mutational insertion. Further-
more, homologous copies of a gene mutated by retrotrans-
poson insertions can provide or not a normal expression
pattern although there may be a dosage dependent effect.
Examples of associations between retrotransposon and
plant genes as well as of their impact on gene structure and
function and potential use as promoter sequences have been
found [44–49]. The transposition into gene-rich regions in
their natural host may be a general feature of copia-like
retrotransposons, as this has also been shown for the rice
Tos17 active element [50] and for copia-like elements of
Arabidopsis. In the rice genome Hayashi and Yoshida [45]
reported that a LTR retrotransposon named Renovator
contributed to the evolution of the resistance gene Pit which
confers race-specific resistance against the fungal pathogen
Magnaporthe grisea. Their results suggested that transpo-
son-mediated transcriptional activation may play an
important role in the refunctionalization of additional
‘‘sleeping’’ R genes in the plant genomes.
Conclusions
Retrotransposons have found wide application as molecular
markers in studies of plant genetics. With the increase of
retrotransposon accessions available to GenBank many
efficient techniques have developed in the field of ‘‘trans-
poson display’’. These techniques highlight the insertion
profile and indirectly the transposition of an mobile
element.
In this study we analyzed the intra-specific variability of
four myrtle accessions using retrotransposon as molecular
markers in SSAP analysis. The results showed that Tmc1 is
a good molecular marker for myrtus intra-specific authen-
tication. Tmc1 marker may provide an important means to
identify and select Myrtus communis.
This identification could be useful to isolate myrtle
clonal plants with more biologically active substances.
Acknowledgments The authors are grateful to Dr. Joseph Sepe
(University of Maryland University College), for improving the
manuscript. Sequence data from this article have been deposited with
the GenBank Data Library under Accession Nos. [FR692046-
FR692055] [FR692058-FR692069][FL693379].
Fig. 4 SNP-PCR strategy. a Lanes: M, molecular mass markers;
CVa, Da, CMa, Ca, amplification PCR products obtained from the
Durazzano, Castel Volturno, Caiazzo and Castel Morrone genomes
with the LTR-D1/Tmc1 primer combinations, respectively (600 bp
SNP- PCR products; 90 bp-internal control); CVb, Db, CMb, Cb,
amplification PCR products obtained from the Durazzano, Castel
Volturno, Caiazzo and Castel Morrone genomes with the LTR-CV1/
Tmc1 primer combinations, (372 bp SNP-PCR products; 90 bp-
internal control). b Sequences of primers used in this strategy
(mutated nucleotides are in boldface)
3416 Mol Biol Rep (2012) 39:3409–3418
123

References
1. Canhoto JM, Lopes ML, Cruz GS (1999) Somatic embryogenesis
and plant regeneration in myrtle (Myrtaceae). Plant Cell Tiss Org
Cult 57:13–21
2. Serce S, Ercisli S, Sengul M, Gunduz K, Orhan E (2010) Anti-
oxidant activities and fatty acid composition of wild grown
myrtle (Myrtus communis L.) fruits. Pharmacogn Mag 6:9–12
3. Schulman AH (2007) Molecular marker to assess genetic diver-
sity. Euphytica 158:313–321
4. Varshney RK, Graner A, Sorrells ME (2005) Genomic-assisted
breeding for crop improvement. Trends Plant Sci 10:621–630
5. Kalendar R, Flavell A, Ellis THN, Sjakste T, Moisy C, Schulman
AH (2011) Analysis of plant diversity with retrotransposon-based
molecular markers. Heredity 106:520–530
6. Flavell AJ, Dunbar E, Anderson R, Pearce SR, Hartley R,
Kumar A (1992) Ty1-copia group retrotransposons are ubiqui-
tous and heterogeneous in higher plants. Nucleic Acids Res
20:3639–3644
7. Flavell AJ, Smith DB, Kumar A (1992) Extreme heterogeneity of
Ty1-copia group retrotransposons in plants. Mol Gen Genomics
231:233–242
8. Kunze R, Saedler H, Lonnig WE (1997) Plant transposable ele-
ments. Adv Bot Res 27:331–469
9. Voytas DF, Cummings MP, Konieczny A, Ausubel FM, Roder-
mel SR (1992) Copia-like retrotransposons are ubiquitous among
plants. Proc Natl Acad Sci USA 89:7124–7128
10. Casacuberta JM, Santiago N (2003) Plant LTR-retrotransposons
and MITEs: control of transposition and impact on the evolution
of plant genes and genomes. Gene 311:1–11
11. Boeke JD, Corces V (1989) Transcription and reversetranscrip-
tion of retrotransposons. Annu Rev Microbiol 43:403–434
12. Kaiser VB, van Tuinen M, Ellegren H (2007) Insertion events
of CR1 retrotransposable elements elucidate the phylogenetic.
Branching order in galliform birds. Mol Biol Evol 24(1):
338–347
13. Grzebelus D (2006) Transposon insertion polymorphism as a new
source of molecular markers. J Fruit Ornam Plant Res 14(Suppl
1):21–29
14. Porceddu A, Albertini E, Barcaccia G, Marconi G, Bertoli FB,
Veronesi F (2002) Development of S-SAP markers based on an
LTR-like sequence from Medicago sativa L. Mol Gen Genomics
267:107–114
15. Queen RA, Gribbon BM, James C, Jack P, Flavell AJ (2004)
Retrotransposon-based molecular markers for linkage and genetic
diversity analysis in wheat. Mol Gen Genomics 271:91–97
16. Syed NH, Flavell AJ (2006) Sequence-specific amplification
polymorphisms (S-SAPs): a multi-locus approach for analyzing
trasposon insertions. Nat Protoc 1:2746–2752
17. Doyle JJ, Doyle JL (1987) A rapid DNA isolation procedure for
small quantities of fresh leaf tissue. Phytochem Bull 19:11–15
18. Sharma KK, Lavanya M, Anjaiah V (2000) A method for isola-
tion and purification of peanut genomic DNA suitable for ana-
lytical applications. Plant Mol Biol Rep 18:393a–393h
19. Sambrook J, Frithsch EF, Maniatis T (1989) Molecular cloning: a
laboratory manual, 2nd edn. Cold Spring Harbour Lab, Cold
Spring Harbour
20. Pearce SR, Knox M, Ellis TH, Flavell AJ, Kumar A (2000) Pea
Ty1-copia group retrotransposons: transpositional activity and
use as markers to study genetic diversity in Pisum. Mol Gen
Genet 263(6):898–907
21. Pearce SR, Stuart-Rogers C, Knox MR, Kumar A, Noel Ellis TH,
Flavell AJ (1999) Rapid isolation of plant Ty1-copia group ret-
rotransposon LTR sequences for molecular marker studies. Plant
J 19:711–717
22. Jurka J, Klonowski P, Dagman V, Pelton P (1996) Censor—a
program for identification and elimination of repetitive elements
from DNA sequences. Comput Chem 20:119–121
23. Thompson JD, Higgins DG, Gibson TJ (1994) CLUSTAL W:
improving the sensitivity of progressive multiple sequence
alignment through sequence weighting, positions-specific gap
penalties and weight matrix choice. Nucleic Acid Res 22:
4673–4680
24. Waugh R, McLean K, Flavell AJ, Pearce SR, Kumar A, Thomas
BB, Powell W (1997) Genetic distribution of Bare-1-like retro-
transposable elements in the barley genome revealed by
sequence-specific amplification polymorphisms (S-SAP). Mol
Gen Genet 253:687–694
25. Newton CR, Heptinstall LE, Summers C, Super M, Schwarz M,
Anwar R, Graham A, Smith JC, Markham AF (1989) Amplifi-
cation refractory mutation system for prenatal diagnosis and
carrier assessment in cystic fibrosis. Lancet 2:1481–1483
26. Grandbastien MA, Lucas H, More JB, Mhiri C, Vernhettes S,
Casacuberta JM (1997) The expression of the tobacco Tnt1 is
linked to the plant defence responses. Genetica 100:241–252
27. Hirochika H, Otsuki H, Yoshikawa M, Otsuki Y, Sugimoto K,
Takeda S (1996) Autonomous transposition of the tobacco ret-
rotransposon Tto1 in rice. Plant Cell 8:725–734
28. Theologis A, Ecker JR, Palm CJ, Federspiel NA, Kaul S, White O
et al (2000) Sequence and analysis of chromosome 1 of the plant
Arabidopsis thaliana. Nature 408:816–820
29. Guyot R, Cheng X, Su Y, Cheng Z, Schlagenhauf E, Keller B,
Ling HQ (2005) Complex organization and evolution of the
tomato pericentromeric region at the FER gene locus. Plant
Physiol 138:1205–1215
30. Sarwat M, Das S, Srivastava PS (2010) Estimation of genetic
diversity and evaluation of relatedness through molecular markers
among medicinally important trees: Terminalia arjuna, T. chebulaand T. bellerica. Mol Biol Rep. doi:10.1007/s11033-010-0649-2
31. Vicient CM, Suoniemi A, Anamthawat-Jonsson K et al (1999)
Retrotransposon BARE-1 and its role in genome evolution in the
genus Hordeum. Plant Cell 11:1769–1784
32. Devos KM, Brown JKM, Bennetzen JL (2002) Genome size
reduction through illegitimate recombination counteracts genome
expansion in Arabidopsis. Genome Res 12:1075–1079
33. Shirasu K, Schulman AH, Lahaye T, Schulze-Lefert P (2000) A
contiguous 66 kb barley DNA sequence provides evidence for
reversible genome expansion. Genome Res 10:908–915
34. Bennetzen JL, Ma J, Devos KM (2005) Mechanisms of recent
genome size variation in flowering plants. Ann Bot (Lond)
95:127–132
35. Vitte C, Bennetzen JL (2006) Analysis of retrotransposon struc-
tural diversity uncovers properties and propensities in angiosperm
genome evolution. Proc Natl Acad Sci USA 103:17638–17643
36. Vitte C, Panaud Q (2005) LTR retrotransposons and flowering
plant genome size: emergence of the increase/decrease model.
Cytogenet Genome Res 110:91–107
37. Vitte C, Panaud O (2003) Formation of Solo-LTRs through
unequal homologous recombination counterbalances amplifica-
tions of LTR retrotransposons. Mol Biol Evol 20:528–540
38. Kumar A, Bennetzen JL (1999) Plant retrotransposons. Annu Rev
Genet 33:479–532
39. Newton CR, Graham A, Heptinstall LE, Powell SJ, Summers C,
Kalsheker N, Smith JC, Markham AF (1989) Analysis of any
point mutation DNA. The amplification refractory mutation sys-
tem (ARMS). Nucleic Acids Res 17:2503–2516
40. Ciarmiello LF, Piccirillo P, Pontecorvo G, De Luca A, Kafantaris
I, Woodrow P (2011) A PCR based SNPs marker for specific
characterization of English walnut (Juglans regia L.) cultivars.
Mol Biol Rep 38(2):1237–1249
Mol Biol Rep (2012) 39:3409–3418 3417
123

41. Wang H, Sun H, Kwon W-S, Jin H, Yang D-C (2010) A PCR-
based SNP marker for specific authentication of Korean ginseng
(Panax ginseng) cultivar ‘‘Chunpoong’’. Mol Biol Rep 37:
1053–1057
42. Voytas DF (1996) Retroelements in genome organization. Sci-
ence 274(5288):737–738
43. Bertioli D, Moretzsohn M, Madsen LH et al (2009) An analysis
of synteny of Arachis with Lotus and Medicago sheds new light
on the structure, stability and evolution of legume genomes. BMC
Genomics 10:45
44. Woodrow P, Pontecorvo G, Ciarmiello LF, Fuggi A, Carillo P
(2011) Ttd1a promoter is involved in DNA-protein binding by
salt and light stresses. Mol Biol Rep 38:3787–3794. doi:
10.1007/s11033-010-0494-3
45. Hayashi K, Yoshida H (2009) Refunctionalization of the ancient
rice blast disease resistance gene Pit by the recruitment of a
retrotransposon as a promoter. Plant J 57:413–425
46. Le QH, Melayah D, Bonnivard E, Petit M, Grandbastien MA
(2007) Distribution dynamics of the Tnt1 retrotransposon in ta-
bacco. Mol Genet Genomics 278:639–651
47. Lenoir A, Lavie L, Prieto JL, Goubely C, Cote JC, Pelissier T,
Deragon JM (2001) The evolutionary origin and genomic orga-
nization of SINEs in Arabidopsis thaliana. Mol Biol Evol 18:
2315–2322
48. White SE, Habera LF, Wessler SR (1994) Retrotransposons in the
flanking regions of normal plant genes: a role for copia-like
elements in the evolution of gene structure and expression. Proc
Natl Acad Sci USA 91:11792–11796
49. Woodrow P, Pontecorvo G, Fantaccione S, Kafantaris I, Fuggi A,
Parisi D, Carillo P (2010) Polymorphism of a new Ty1-copiaretrotransposon in durum wheat under salt and light stresses.
Theor Appl Genet 121:311–322
50. Miyao A, Tanaka K, Murata K, Sawaki H, Takeda S, Abe K,
Shinozuka Y, Onosato K, Hirochika H (2003) Target site speci-
ficity of the Tos17 retrotransposon shows a preference for
insertion within genes and against insertion in retrotransposon
rich regions of the genome. Plant Cell 15:1771–1780
3418 Mol Biol Rep (2012) 39:3409–3418
123