Isolation in Public Clouds: Threats, Challenges and Defenses ...
227
Isolation in Public Clouds: Threats, Challenges and Defenses By Venkatanathan Varadarajan A dissertation submitted in partial fulfillment of the requirements for the degree of Doctor of Philosophy (Computer Sciences) at the UNIVERSITY OF WISCONSIN–MADISON 2015 Date of final oral examination: 30 th November 2015 The dissertation is approved by the following members of the Final Oral Committee: Michael Swift, Associate Professor, Computer Sciences Thomas Ristenpart, Associate Professor, Cornell Tech Aditya Akella, Associate Professor, Computer Sciences David Wood, Professor, Computer Sciences Nigel Boston, Professor, Dept. of Mathematics & ECE
-
Upload
khangminh22 -
Category
Documents
-
view
4 -
download
0
Transcript of Isolation in Public Clouds: Threats, Challenges and Defenses ...
Isolation in Public Clouds: Threats, Challenges and Defenses
By
Venkatanathan Varadarajan
A dissertation submitted in partial fulfillment ofthe requirements for the degree of
Doctor of Philosophy
(Computer Sciences)
at the
UNIVERSITY OF WISCONSIN–MADISON
2015
Date of final oral examination: 30th November 2015
The dissertation is approved by the following members of the Final OralCommittee:
Michael Swift, Associate Professor, Computer SciencesThomas Ristenpart, Associate Professor, Cornell TechAditya Akella, Associate Professor, Computer SciencesDavid Wood, Professor, Computer SciencesNigel Boston, Professor, Dept. of Mathematics & ECE
© Copyright by Venkatanathan Varadarajan 2015
All Rights Reserved
i
Dedicated to my brother, parents and the love of my life without whom this wouldnot have been possible.
ii
ISOLATION IN PUBLIC CLOUDS: THREATS, CHALLENGES ANDDEFENSES
Venkatanathan Varadarajan
Under the supervision ofProfessor Thomas Ristenpart and Professor Michael Swift
At the University of Wisconsin–Madison
Many applications that are in day-to-day use by customers over theInternet are hosted in the public clouds. Public infrastructure-as-a-serviceclouds, such as Amazon EC2, Google Compute Engine (GCE) and Mi-crosoft Azure allow clients to run virtual machines (VMs) on shared phys-ical infrastructure. This practice of multi-tenancy improves efficiency bymultiplexing resources among disparate customers at low costs. Unfortu-nately, it also introduces the risk of sharing a physical server to run bothsensitive customer applications and VMs that may belong to an arbitraryand potentially malicious users. Such a scenario uniquely arises becauseof multi-tenancy and the openness of public clouds.
The current management infrastructure of these public clouds is driventowards improving performance and efficiency and the security of thesesystems often takes the back seat in this drive forward. As a result it isunclear what the degree of isolation that these clouds provide againstmalicious users. In this dissertation, we focus on one of the main securitythreats to public clouds, cross-VM attacks, and evaluate how state-of-the-art cloud infrastructure fares against these attacks. The thesis of thisdissertation is that, “the practice of multi-tenancy in public clouds demandsstronger isolation between VMs on a single host in the presence of malicioususers.”
Any cross-VM attack involves two steps: placing an adversary con-trolled VM on the same host as one of the victim VMs, and then breachingthe isolation boundary to either steal sensitive victim information or affect
iii
its performance for greed or vandalism. In the first part of the disserta-tion, we start by evaluating the security of public clouds against cross-VMattacks on two levels: security against VM placement in cluster schedulersand isolation between multi-tenant VMs at the hypervisor. Amidst severalchallenges such as no known working co-residency detection mechanismand no prior work on analysis of placement policies of public clouds,we show that EC2, Azure and GCE are all vulnerable to adversarial VMplacement attacks. In addition, we also investigate the repercussions ofperformance interference between co-located VMs sharing the same host.Unlike cross-VM side-channels that steal secrets across VM boundaries,we discover that a greedy user could also steal resources and benefit fromimproved performance at the expense of others. Both these new find-ings demonstrate that multi-tenancy in public clouds demands strongerisolation.
In the second part of this dissertation, we venture to improve isolationbetween VMs in the hypervisor. A straightforward solution is hard isolationthat strictly partitions hardware resources between VMs. However, thiscomes at the cost of reduced efficiency. We investigate the principle ofsoft isolation: reduce the risk of sharing through better scheduling. Wedemonstrate this design principle by using it to defend against cross-VMattacks. With extensive experimentation, we show that such a mechanismnot only prevent a dangerous cross-VM attacks, but also incurs negligibleperformance overhead.
In summary, this dissertation shows that cross-VM co-location attacksstill remain a problem amidst the deployment of advanced virtualizationtechniques in modern clouds, hence demands stronger isolation. Wedemonstrate how this stronger isolation be achieved to defend against aclass of cross-VM attack without compromising on efficiency.
iv
Acknowledgments
It should come as no surprise that this dissertation and the associatedPh.D. is a result of a team effort. There are several members in this teamwho have contributed towards my Ph.D. either knowingly or unknowingly.Here, I record my heartfelt gratitude towards their participation in thisendeavor. I also warn you to brace yourself for an emotionally overloadedacknowledgment.
First, my family. I like to start with my elder brother, Dr. RamakrishnanVaradarajan. Yes, the other and the first doctorate in our the family, whowithout his knowledge enlightened me about the career path to innovateand push the frontier in a field of study. He also got his Ph.D. in ComputerScience (Databases) making it only easier for me to follow him. In facthe got his Post Doctorate at UW-Madison, further raising the bar in thesibling rivalry to new heights! Hence, he remains the root cause of myPh.D. without whose experience, encouragement and mentorship thiswould not have been possible. Next, my parents – Krishnan Varadarajanand Suganthy Pichumani. It is impossible to describe the pain and thecompromises they had to go through to send the only other son far awayfor five long years, that too in their sixties. Of course, they never oncevocalized their pain to me and always encouraged me to pursue research.I cannot thank them enough for their support. Finally, my close friend andnow to-be-wife, Harini Kumar. Sometimes you may not be able to shareeverything with your family but you can do so with your close friends.Harini was one such friend, who offered encouragement and support to
v
me throughout this endeavor. There were also times she had to endureimmeasurable pain to support me in this endeavor. I am forever indebtedto her for her support and thank her for her immense trust in me.
My mentors in my undergrad school, Prof. Ranjini Parthasarathy, Prof.Rajeshwari Sridhar, Prof. Bama and Prof. Pandu Rangan, at the right timealso encouraged me to explore research at the early stages and sometimesprovided platform to publishing research. I thank them for identifyingand nurturing my potential to do research.
I cannot thank my advisors, Prof. Michael Swift and Prof. ThomasRistenpart, enough for giving me this opportunity. If not for Prof. Swift, Iwould not have had chance to work with Prof. Ristenpart and let alonedirect me towards the fascinating area of cloud security. I came in withalmost zero experience in research. I am often baffled on how Prof. Swifttrusted that I am capable of good quality research in short duration of anindependent study. I could not have asked for such a fair, friendly, caringand open-minded advisor. I have lots of anecdotes that demonstrates eachof those qualities (mail me if you are interested to know about them). Prof.Ristenpart is another super star advisor. Knowing his name is a sufficienthead turner in conferences, let alone being his advisee. There were timeswhen I would go about introducing myself as, “the student of Ristenpart,you know the author of the famous, Hey you get off my cloud paper”. Beingco-advised by both of them was an amazing experience.
Finding an important problem is already a daunting part of a Ph.D.,but looking at it from numerous angles and predicting the gravity ofthe problem is totally a whole another thing. Both of them have been alive demonstration of how to do it. Without their expertise, I would nothave made several successful publications in such a relatively short timeperiod of 3 years. I owe it to them. They were immensely patient withme and my mediocre presentation skills. In the process I also successfullyinherited several (good) OCDs from them, esp. for paper writing and
vi
presentations, and often got commendations for them. One of those goodqualities that got etched in me is having the courage to pull the plug on alow quality work and always aiming to work for the overall good of theresearch community. For instances, while facing a question of working onone strong paper or several low quality papers, they always chose to dothe stronger version. I have never seen anyone work on a paper so hardeven after it got accepted into a conference by always trying to add valueto it. Perfection was their worst enemy. Such good qualities is what youexpect to learn from your academic fathers, and I am very glad I got togrow under these two great ones. Without their constant guidance andfinancial support this dissertation would not have been possible.
Thanks to all my collaborators, Thawan Kooburat, Benjamin Farley,Prof. Yinqian Zhang, and Prof. Ari Juels, who all helped in many of theresearch endeavors that contributed to this dissertation. I also thank thepreliminary exam committee members, Prof. Aditya Akella, Prof. DavidWood, Prof. Ari Juel, and my advisors, for all their valuable commentsthat helped shape this dissertation. I am also thankful for the short-livedsystem and security group led by my advisors with the weekly groupmeetings that helped in bouncing off ideas and have fun discussions. Ispecifically want to thank other graduate students: Sankaralingam Pa-neerselvam (Sankar), Ramakrishnan Durairajan, Srinath Sridharan, AdamEverspaugh, Vijay Chidambaram, Thanumalyan Sankaralingam, HarisVolos, Zev Weiss, Asim Kadav, Mohit Saxena, Matthew Renzelmann, MattFredrikson, Drew Davidson, Liang Wang, and Rahul Chatterjee, for help-ing with various things research. This includes patiently helping withproof-reading number of my manuscripts, attending practice talks, spend-ing time to brainstorm ideas and expecting nothing in return! Particularly,I want to thank Zev Weiss, and Sankar. Zev Weiss, during the early daysof my Ph.D. introduced me to many essential tools like emacs, screen, etc.,as I did not have the often assumed technical acumen that is acquired via
vii
working experience or self-learning. In hindsight, this played a critical inincreasing my productivity in the later years. It was pleasure working withhim on course projects, as I learned something new in every encounterwith him. Next is Sankar. I often (literally) turned to Sankar, who’s officedesk was right behind me, to bounce of ideas and questions on kernelhacking. Because he was the goto guy for Linux kernel related stuff. Par-ticularly, I thank him for being patient with me and my nagging for fourfull years.
It might come as a surprise to him, but Prof. Remzi Arpaci-Dusseauwas like an invisible guardian over my shoulder. There were severalinstances where the emails he forwarded to all graduates opened up manyopportunities both for my internships and full-time job search. I thankhim for those amazing opportunities. Further, organizing the WisconsinInstitute on Software-defined Datacenters Of Madison (WISDOM)1 andworkshop along with other professors in the department, brought in evenmore opportunities specifically for students in my area of interest.
Finally, friends in Madison. Family members and others in India of-ten worry that sending someone to do Ph.D. would eventually makethem insane. It is true, and friends are the ones who keep you sane dur-ing the Ph.D. experience. During my first year here, my brother andsister-in-law, Vaishnavi Sampath made Madison feel like home. I slowlystarted growing a network of friends because of whom I got introducedto weight-training, racquetball, badminton, volleyball, and indoor rock-climbing. The frequent get-togethers on weekends with potluck sup-pers often became part of life here. Such activities helped me take es-sential breaks away from the monotonous academic pursuits. I wouldlike to these friends: Ramakrishnan Durairajan, Sankaralingam Paneersel-vam, Uthra Srinath, Srinath Sridharan, Sibin Philip, Vijay Chidambaram,Thanumalyan Sankaralingam, Sandeep Vishwanathan, Surya Narayanan,
1wisdom.cs.wisc.edu
viii
Madhav Venkateswaran, Ragothaman Avanasi, Tyler Harter, Madhu Ra-manathan, Ragunanth Venkatesan, Chembian Parthiban, Swarna Chan-drasekar and many others. Specifically, I am indebted to Srinath and Uthrafor their generosity in many occasions during their time in Madison andbeyond. Apart from these friends, I would also like to thank my other fic-tional F.R.I.E.N.D.S: Chandler, Monica, Ross, Rachel, Joey and Phoebe forfilling my initial years of solitude away from home with joy and laughter.
ix
Contents
Abstract ii
Acknowledgments iv
Contents ix
List of Figures and Tables xiii
1 Introduction 11.1 Isolation in Modern Public Clouds 3
1.1.1 Influencing VM Placement 41.1.2 Stealing Performance from Neighboring VMs 6
1.2 Improving Isolation 91.3 Summary of Contributions 111.4 Outline 13
2 Background 152.1 Overview: Public Clouds 16
2.1.1 Compute Cloud API 172.1.2 Pricing Model 202.1.3 Other cloud services 21
2.2 Virtualization 222.2.1 Compute Virtualization 222.2.2 Network Virtualization 282.2.3 Storage Virtualization 29
x
2.3 Cluster Scheduler 302.4 Side-channels in Public Clouds 332.5 Other Non-IaaS Public Clouds 35
2.5.1 Container-based Clouds 36
3 Threat Model 383.1 Cloud Provider 383.2 Attacker 393.3 Victim 40
4 Motivation 424.1 Evaluating Modern Clouds for Co-location Attacks 43
4.1.1 Placement Policies used in Public Clouds 444.1.2 Prior Work on Co-location Detection 454.1.3 Challenges in Modern Clouds 46
4.2 (Lack of) Performance Isolation between VMs 494.3 Need for Defenses against Cross-VM Side-channels 51
4.3.1 An Example Cross-VM Side-channel 524.3.2 Prior Defenses and their Deficiencies 53
5 Co-location in Public Clouds 565.1 Definitions 57
5.1.1 Defining Placement Vulnerability 615.2 Detecting Co-Residence 62
5.2.1 Co-residency Tests 625.2.2 Cooperative Co-residency Detection 675.2.3 Uncooperative Co-residency Detection 71
5.3 Placement Vulnerability Study 765.3.1 Experimental Methodology 765.3.2 Effect of Number of Instances 815.3.3 Effect of Instance Launch Time 83
xi
5.3.4 Effect of Data Center Location 875.3.5 Effect of Launch Origin Machine 885.3.6 Other Observations 895.3.7 Cost of Launch Strategies 90
5.4 Summary of Placement Vulnerabilities 925.4.1 Limitations 94
5.5 Placement Vulnerability in PaaS 95
6 Stealing Performance from Neighboring VMs 976.1 Resource-freeing Attacks 986.2 Contention Measurements 1026.3 RFA for Cache versus Network 106
6.3.1 Evaluation on Local Testbed 1116.3.2 Evaluation on EC2 116
6.4 Discussion 122
7 Soft-isolation: Improving Isolation in Public Clouds 1267.1 MRT Guarantees and Soft Isolation 1287.2 Side-channels under MRT Guarantees 1317.3 Performance of MRT Mechanism 139
7.3.1 Methodology 1397.3.2 Latency Sensitivity 1407.3.3 Batch Efficiency 1427.3.4 System Performance 1457.3.5 Summary 147
7.4 Integrating Core-State Cleansing 1497.4.1 Design and Implementation 1497.4.2 Evaluation 151
8 Related Work 1568.1 Co-location in Public Clouds 156
xii
8.1.1 VM Placement Vulnerability Studies 1568.1.2 Defenses Against Co-location 1578.1.3 Co-residency Detection Techniques 158
8.2 Lack of Performance Isolation in Public Clouds 1608.2.1 Performance Interference 1618.2.2 Performance Isolation 1618.2.3 Gaming Schedulers 1628.2.4 Side-channel Attacks 162
8.3 Side-channel Attacks and Defenses 1638.3.1 Attacks 1638.3.2 Defenses 165
9 Conclusion and Lessons Learned 1689.1 Summary 1699.2 Conclusion 1729.3 Lessons Learned 173
9.3.1 CPU Scheduling is Delicate 1739.3.2 Security Starts at the Hardware 178
Bibliography 180
A Appendix A 199A.1 Modeling the Effects of MRTs 199
xiii
List of Figures and Tables
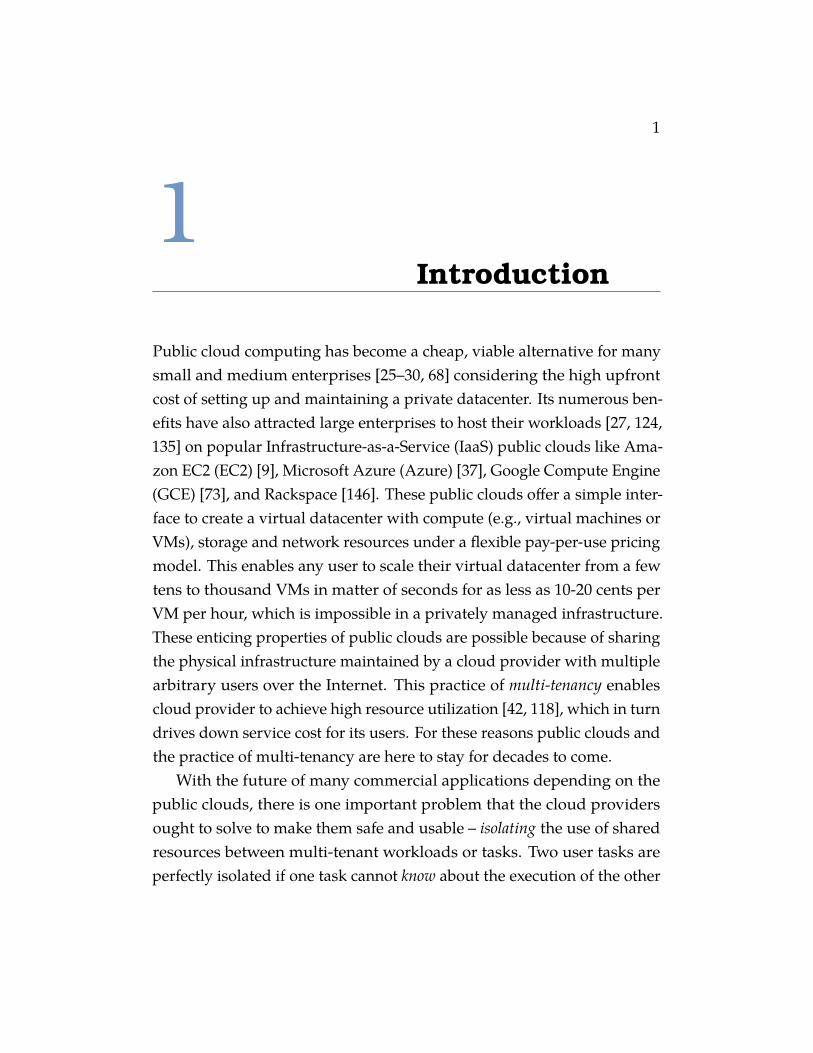
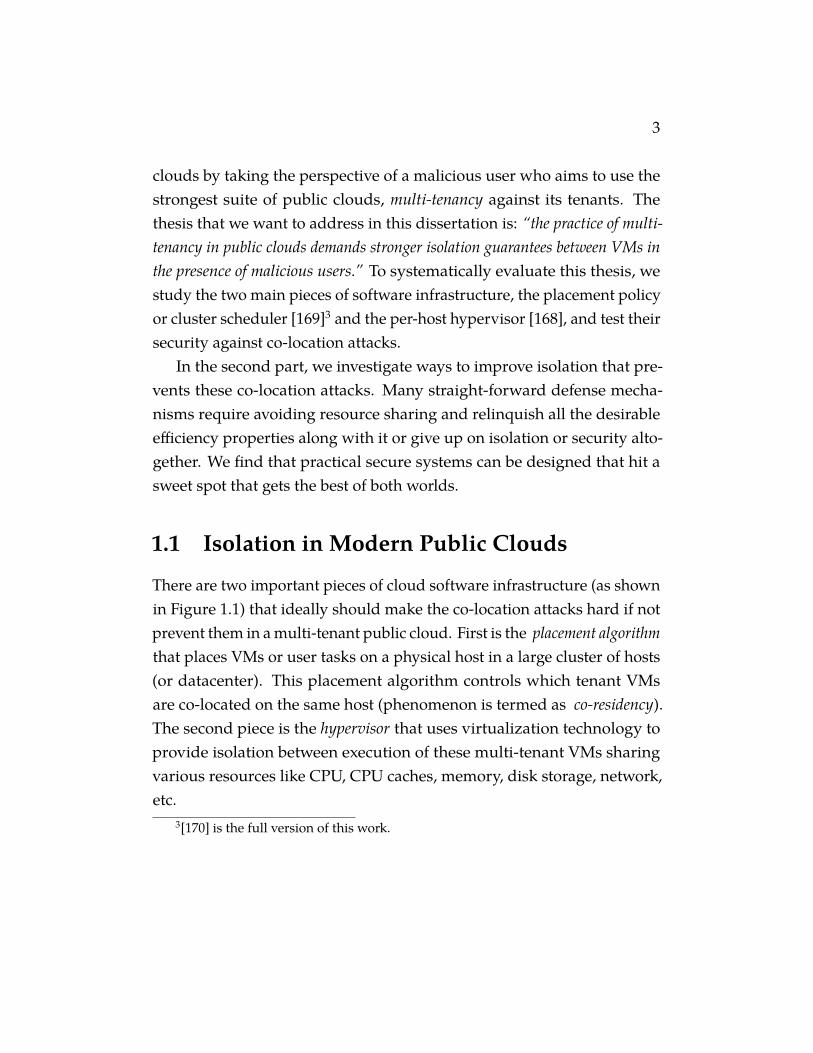
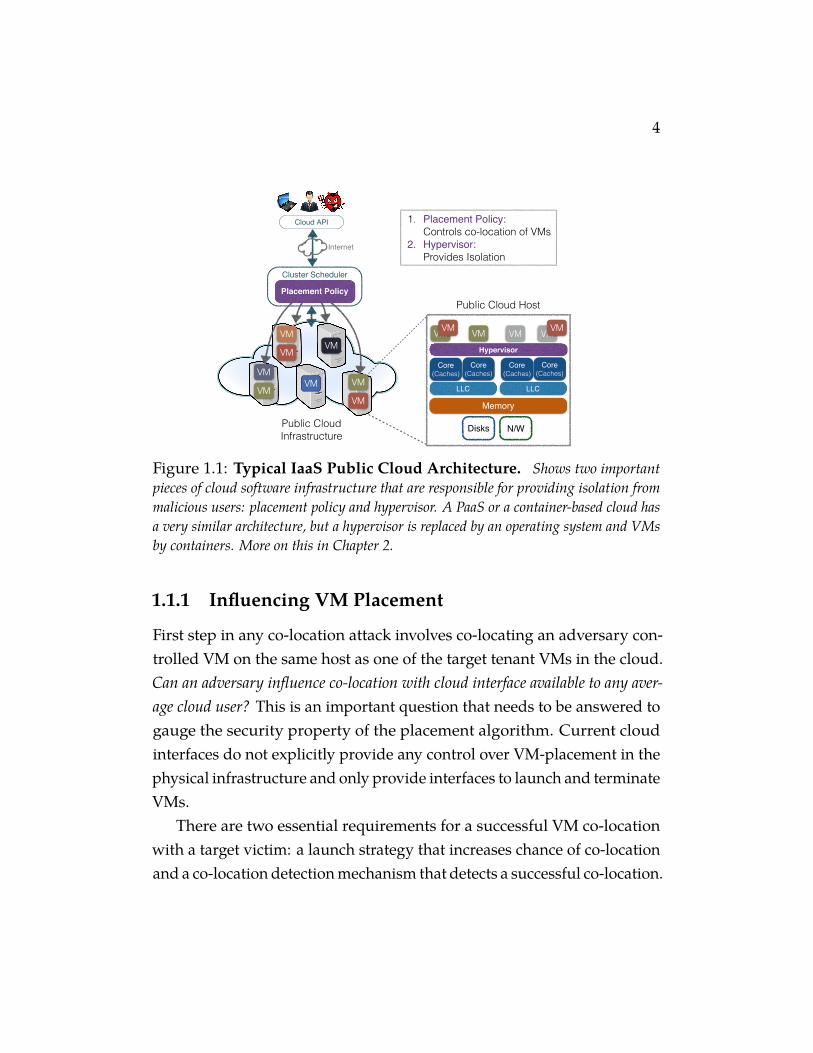
Figure 1.1 Typical IaaS Public Cloud Architecture. Shows two im-portant pieces of cloud software infrastructure that are responsiblefor providing isolation from malicious users: placement policy andhypervisor. A PaaS or a container-based cloud has a very similararchitecture, but a hypervisor is replaced by an operating systemand VMs by containers. More on this in Chapter 2. . . . . . . . 4
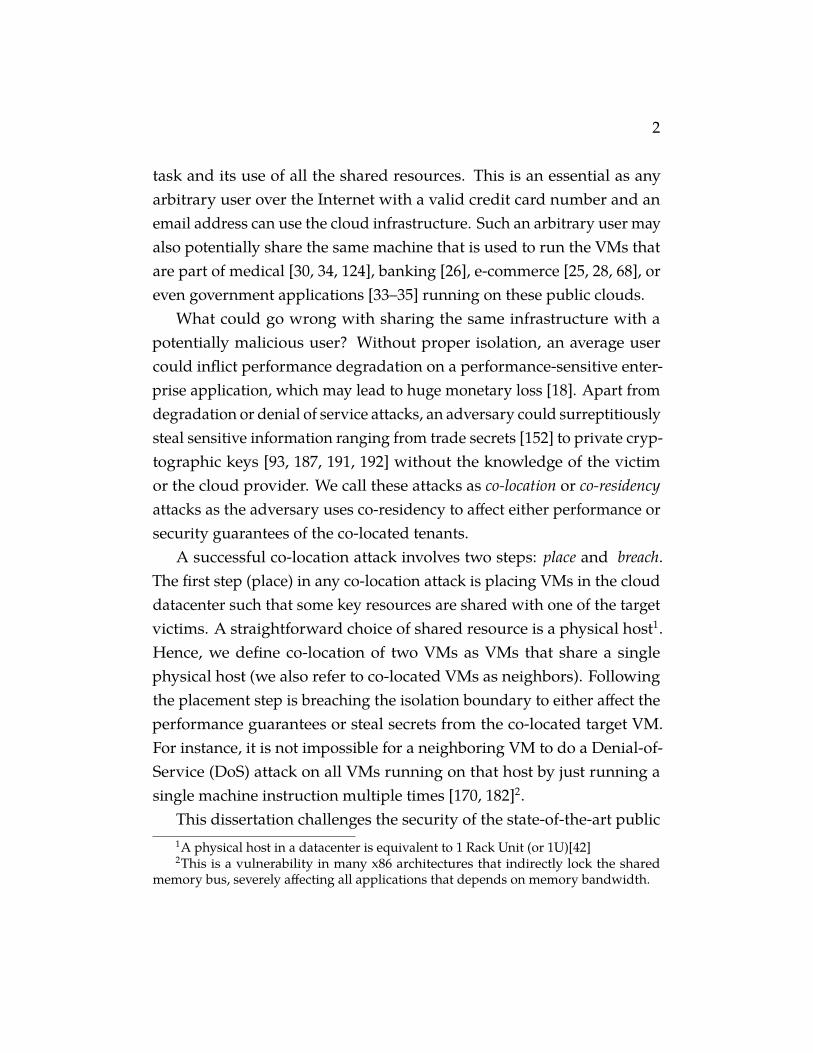
Figure 1.2 Resource Contention in Virtualized Systems. Thebar graph shows the worst-case performance degradation observedwhen running a microbenchmark in one VM that stresses a per-core resource (x-axis) with and without the same microbenchmarkon another VM that is scheduled on the same package or socketbut on different core. Note that the observed contention for CPUresource was in fact zero even when the VMs ran on the samehost. This result was gathered on a machine with the followingconfiguration: 4-core, 2-package 2.66 GHz Intel Xeon E5430 with6MB of shared L2 cache per package and 4GB of main memory,with Xen configured on top of it with guest VM configuration: 1GB memory, 40% cap and weight 256. . . . . . . . . . . . . . 8
xiv
Figure 2.1 Instance Types in EC2, GCE and Azure Public Clouds.Popular public clouds have numerous predefined VM configura-tions under different tiers. The type (*) mentioned is an authordefined tiers for VM types commonly found across public clouds.Shared-core instances are configured to consume only a fraction ofa physical core and hence often share the same core with anothertenant’s VM. X-Optimized instance types satisfy special require-ments for a cloud application like access to GPUs or better networkor memory configuration than other available instance types. xin the instance type takes set of values forming a hierarchy of in-stance types. For example, t1.micro and t1.medium in EC2 aretwo instance types under same hardware configuration (t1 - ma-chine generation with shared core) but different VM configuration.micro VM instances have 1 virtual CPU with 1GB of memorywhereas medium instances have 2 virtual CPUs with 4GB of mem-ory. This is the snapshot of instances types available as of October2015. . . . . . . . . . . . . . . . . . . . . . . . . . . . . . 18
Figure 2.2 VM Configurations of EC2 Instance Types.. Onlyshows a subset of the available instance types in Amazon EC2 [13]but diverse enough to give an idea of various VM configurationsavailable in the modern public clouds. EBS stands for Elastic BlockStores, which are network attached Hard Disk Drives (HDDs).Historically, EC2 provided an architecture agnostic CPU metric(called Elastic Compute Unit or ECU) but in 2014 EC2 exposedraw vCPU metrics that reflect the physical CPU limits. This is thereason the above CPU configuration varies for different instancetypes. . . . . . . . . . . . . . . . . . . . . . . . . . . . . . 18
xv
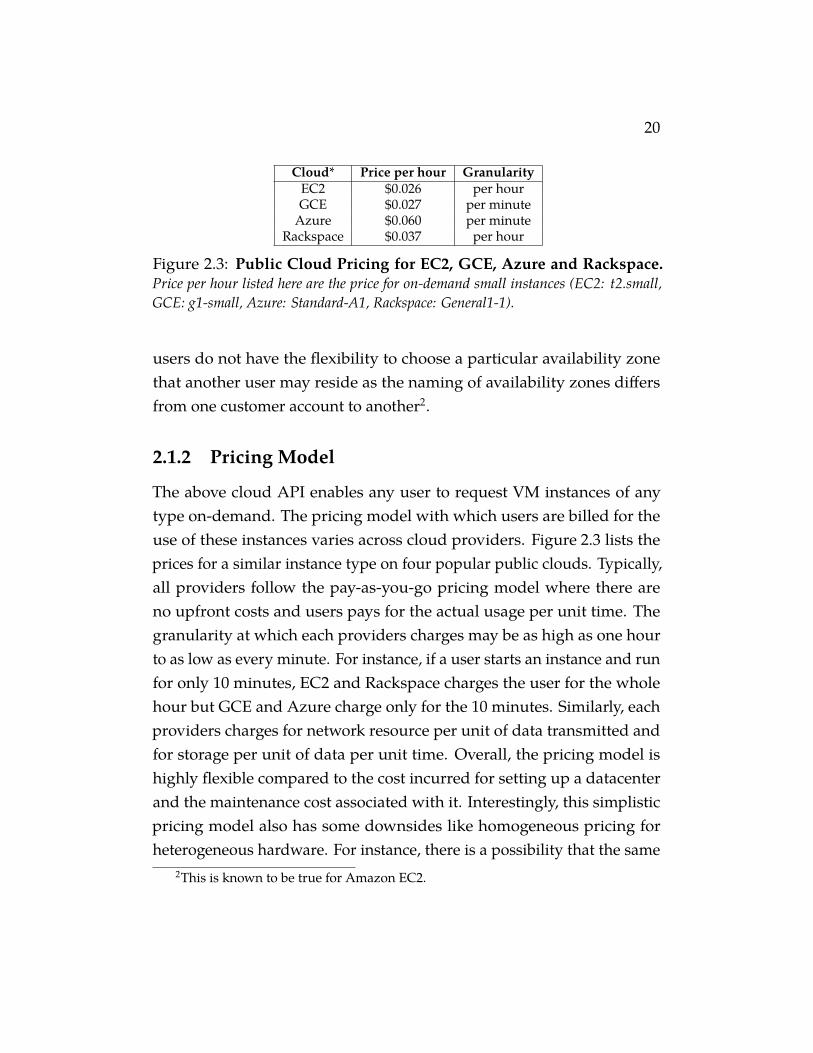
Figure 2.3 Public Cloud Pricing for EC2, GCE, Azure and Rackspace.Price per hour listed here are the price for on-demand small in-stances (EC2: t2.small, GCE: g1-small, Azure: Standard-A1,Rackspace: General1-1). . . . . . . . . . . . . . . . . . . . . 20
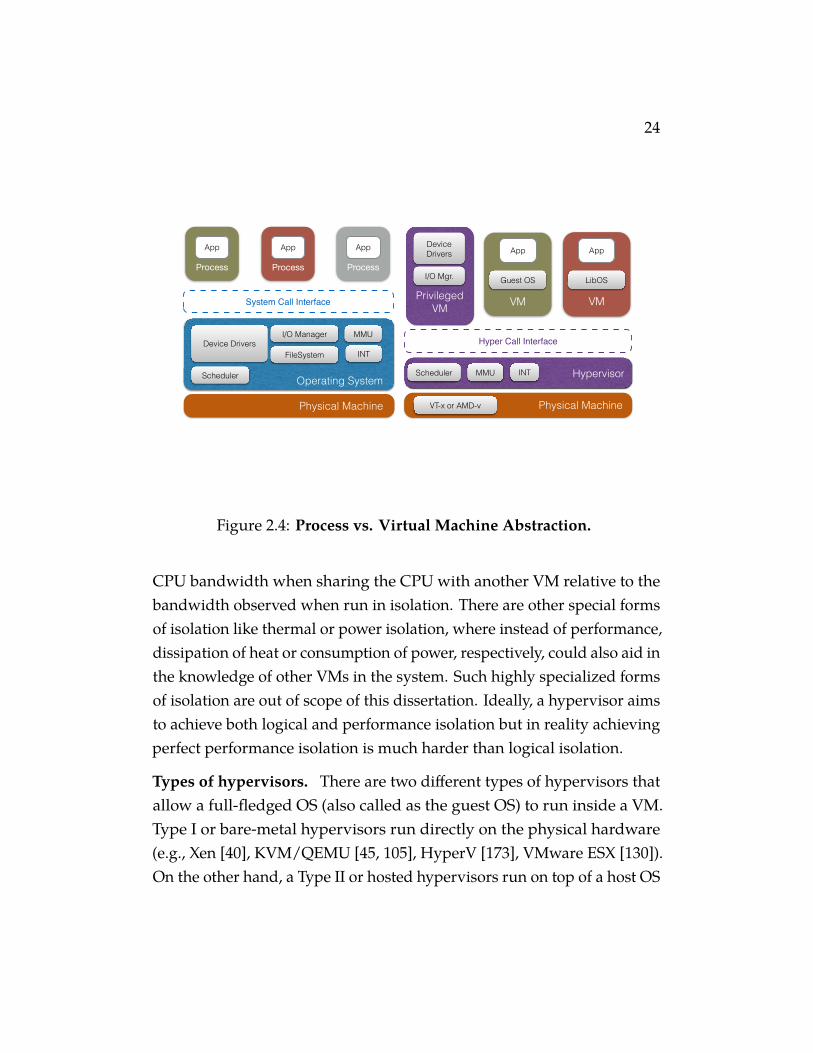
Figure 2.4 Process vs. Virtual Machine Abstraction. . . . . . . 24
Figure 4.1 Histogram of minimum network round trip times be-tween pairs of VMs. The frequency is represented as a frac-tion of total number of pairs in each category. The figure does notshow the tail of the histogram. . . . . . . . . . . . . . . . . . . 47
Figure 4.2 Resource contention in Xen. Percentage increase in work-load run times indicated in row when contending with workloadindicated in column. Percentage is computed as run time withcontention over run time on otherwise idle machine. For network,run time is the time to serve a fixed number of requests. A dashmeans there was no significant performance degradation. In thisexperiment, the VMs are pinned to the same core. Here LLC standsfor Last Level Cache. . . . . . . . . . . . . . . . . . . . . . . 50
Table 5.1 List of placement variables. . . . . . . . . . . . . . . 58Figure 5.2 Memory-locking – Sender. . . . . . . . . . . . . . . . 63Figure 5.3 Memory-probing – Receiver.. . . . . . . . . . . . . . 64Table 5.4 Local Testbed Machine Configuration. All are Intel
machines. SMT stands for Simultaneous Multi-Threaded cores (inIntel parlance, Hyper-threads). Ways x Sets x Word Size gives theLLC size. The word size is 64 bytes on all these x86-64 machines.Here, NUMA stands for Non-Uniform Memory Access. . . . . . 65
xvi
Table 5.5 Memory-probing and -locking on testbed machines.Slowdown relative to the baseline performance observed by thereceiver averaged across 10 samples. Same – sender and receiveron different cores on the same socket, Diff. – sender and receiveron different cores on different sockets. Xeon E5645 machine had asingle socket. . . . . . . . . . . . . . . . . . . . . . . . . . . 66
Figure 5.6 Distribution of performance degradation of memory-probing test. For varying number of pairs on each cloud(GCE:29, EC2:300, Azure:278). Note the x-axis plots performancedegradation. Also for EC2 x-axis range is cut short at 20 pairs forclarity. . . . . . . . . . . . . . . . . . . . . . . . . . . . . . 68
Table 5.7 Machine configuration in public clouds. The machineconfigurations observed over all runs with small instance types.GCE did not reveal the exact microarchitecture of the physicalhost (*). Ways × Sets ×Word Size gives the LLC size. The wordsize for all these x86-64 machines is 64 bytes. . . . . . . . . . . 69
Figure 5.8 Distribution of performance degradation of memory-probing and -locking tests. On AMD machines in Azurewith 40 pairs of nodes. Here NC stands for non-coresident and C,co-resident pairs. Note that the x-axis plots performance degradation. 70
Figure 5.9 An example victim web application architecture. . . 72Figure 5.10 Co-residency detection on an uncooperative victim.
The graph shows the average request latency at the co-residencydetector without and with memory-locking sender running on theco-resident attacker VM under varying background load on thevictim. Note that the y-axis is in log scale. The load is in thenumber of concurrent users, where each user on average generates20 HTTP requests per second to the webserver. . . . . . . . . . 74
xvii
Figure 5.11 Varying number of webservers behind the load bal-ancer. The graph shows the average request latency at the co-residency detector without and with memory-locking sender run-ning on the co-residency attacker VM under varying backgroundload on the victim. Note that the y-axis is in log scale. The errorbars show the standard deviation over 5 samples. . . . . . . . . 75
Table 5.12 Distribution of number of co-resident pairs on GCE. 79Table 5.13 Distribution of number of co-resident pairs on EC2. 80Table 5.14 Distribution of number of co-resident pairs on Azure.
Region: East US 1. . . . . . . . . . . . . . . . . . . . . . . . 80Figure 5.15 Chances of co-residency of 10 victim instances with
varying number of attacker instances. All these resultsare from one data center region (EC2: us-east, GCE: us-central1-a, Azure: East US) and the delays between victim and attackerinstance launch were 1 hour. Results are over at least 9 runs perrun configuration with at least 3 runs per time of day. . . . . . 81
Figure 5.16 Chances of co-residency of 30 attacker instances withvarying number of victim instances. All these resultsare from one data center region (EC2: us-east, GCE: us-central1-a, Azure: East US) and the delays between victim and attackerinstance launch were 1 hour. Results are over at least 9 runs perrun configuration with at least 3 runs per time of day. . . . . . . 83
xviii
Figure 5.17 Chances of co-residency with varying delays betweenvictim and attacker launches. Solid boxes correspond tozero delay (simultaneous launches) and gauze-like boxes corre-spond to 1 hour delay between victim and attacker launches. Wedid not observe any co-resident instances for runs with zero delayon EC2. All these results are from one data center region (EC2:us-east, GCE: us-central1-a, Azure: East US). Results are over atleast 9 runs per run configuration with at least 3 runs per time ofday. . . . . . . . . . . . . . . . . . . . . . . . . . . . . . . 84
Table 5.18 Distribution of number of co-resident pairs and suc-cess rate or chances of co-residency for shorter delaysunder 20x20 run configuration in EC2. A delay with 0+means victim and attacker instances were launched sequentially,i.e. attacker instances were not launched until all victim instanceswere running. The results averaged are over 9 runs with 3 runsper time of day. . . . . . . . . . . . . . . . . . . . . . . . . . 85
Figure 5.19 Chances of co-residency over long periods. Resultsinclude 9 runs over two weeks with 3 runs per time of day under20x20 run configuration. Note that we only conducted 3 runs for32 hour delay as opposed to 9 runs for all other delays. . . . . . . 85
Table 5.20 Effect of time of day. Chances of co-residency when anattacker changes the launch time of his instances. The results wereaggregated across all run configurations with 1 hour delay betweenvictim and attacker launch times. All times are in PT. . . . . . . 86
Figure 5.21 Median number of co-resident pairs across two re-gions. The box plot shows the median number of co-residentpairs excluding co-residency within the same account. Results areover at least 3 run per run configuration (x-axis). . . . . . . . . 87
xix
Figure 5.22 Distribution of number of co-resident instances perhost on Azure. The results shown are across all the runs. Wesaw at most 2 instances per host in EC2 and at most 3 instancesper host in GCE. . . . . . . . . . . . . . . . . . . . . . . . . 88
Figure 5.23 Launch strategy and co-residency detection executiontimes. The run configurations v × a indicates the number ofvictims vs. number of attackers launched. The error bars show thestandard deviation across at least 7 runs. . . . . . . . . . . . . 90
Table 5.24 Cost of running a launch strategy. Maximum cost col-umn refers to the maximum cost we incurred out of all the runs forthat particular configuration and cloud provider (in dollars). Thecost per hour of small instances at the time of this study were: 0.05,0.026 and 0.06 dollars for GCE, EC2 and Azure, respectively. Theminimum and maximum costs are in bold. . . . . . . . . . . . 91
Table 5.25 Probability of co-residency under the reference place-ment policy. . . . . . . . . . . . . . . . . . . . . . . . . 92
Table 5.26 Cost benefit analysis. N = 1000, P(atype) = 0.026, whichis the cost per instance-hour on EC2 (the cheapest). For simplicityTd(v,a) = (v∗a)∗3.85, where 3.85 is fastest average time to detectco-residency per instance-pair. Here, v×a is the run configurationof the strategy under test. Note that the cost benefit is the additionalcost incurred under the reference policy, hence is equal to costincurred by a ′ − a additional VMs. . . . . . . . . . . . . . . 92
Table 6.1 Xen configuration in our local testbed.. . . . . . . . . 103Table 6.2 Resource-specific workloads used to test contention.. 104
xx
Table 6.3 Resource Contention in Xen.. Percentage increase in work-load run times indicated in row when contending with workloadindicated in column. Percentage is computed as run time withcontention over run time on otherwise idle machine. For network,run time is the time to serve a fixed number of requests. A dashmeans there was no significant performance degradation. (Top) TheVMs are pinned to the same core. (Middle) The VMs are pinned todifferent cores on the same package. (Bottom) The VMs are pinnedto different packages. . . . . . . . . . . . . . . . . . . . . . . 105
Table 6.4 Performance Interference of a Webserver on LLCProbe.Runtimes (in microseconds) and percentage increase in perfor-mance degradation of LLCProbe (foreground) workload as a func-tion of request rate to victim (background). For Fixed Core bothVMs are pinned to the same core and for Floating Core Xen chooseswhere to execute them. . . . . . . . . . . . . . . . . . . . . . 108
Figure 6.5 Performance of LLCProbe under Pinned and Float-ing VM Configurations.. “Baseline” measures baselineperformance when no traffic was sent to the victim; it is shownin each grouping for comparison. “No-RFA” measures perfor-mance when no RFA requests were sent. (Left) Performance whenLLCProbe and web server VMs are pinned to same core. (Right)Performance when they float amongst cores. Error bars indicateone standard deviation. . . . . . . . . . . . . . . . . . . . . . 110
Figure 6.6 Cumulative VM Runtime Distributions of Webserverand LLCProbeVMs.. Runtime distribution of (top) the webserver domain (with load 2,000 rps) and (bottom) the LLCProbedomain under both no RFA and with RFA 320 in pinned core case. 113
Figure 6.7 Offered vs. Observed Load on Webserver with Vary-ing RFA Intensities.. Here all the VMs float across all cores. 114
xxi
Figure 6.8 Normalized performance for SPEC workloads on ourlocal testbed.. Normalized performance is calculated with thebaseline runtime over runtime for various RFA intensities. Allvalues are at a web server request rate of 3000 rps. . . . . . . . . 115
Table 6.9 Summary of EC2 machines and Number of Co-residentInstances.. For m1.small instances running under our EC2accounts. . . . . . . . . . . . . . . . . . . . . . . . . . . . 118
Figure 6.10 Normalized Performance Across All Machines on EC2..Here workload performance is normalized with baseline runtimeunder zero performance interference. . . . . . . . . . . . . . . 119
Figure 6.11 Average Runtimes of LLCProbe, bzip2, mcf, and sphinxBenchmarks Across 9 EC2 machines.. Baseline has notraffic to victim, while No-RFA and 512 RFA have foregroundrequest rate of 2000 rps. . . . . . . . . . . . . . . . . . . . . 121
Figure 7.1 Logic underlying the Xen MRT mechanism. . . . . . 130Table 7.2 Hardware configuration in local test bed. . . . . . . 132Figure 7.3 Heatmaps of I-cache set timing as observed by a prime-
probe attacker. Displayed values are from a larger trace of10,000 timings. (a) Timings for idle victim and no MRT. (b)–(d)Timings for varying MRT values with the victim running. . . . 133
Figure 7.4 Heatmaps of I-cache set timings as observed by a prime-probe attacker for 10x slower victim computations. Dis-played values are from a larger trace of 9,200 timings. . . . . . . 134
Listing 7.5 Modular exponentiation algorithm used in libgcryptversion 1.5.0. Note that the control flow followed when ei = 1is lines 5 → 6 → 7 → 8 → 9 and when ei = 0 is lines 5 → 6;denoted by the symbols 1 and 0, respectively. . . . . . . . . . . 135
xxii
Table 7.6 The average and minimal number of ElGamal secretkey bits operated upon between two attacker preemp-tions for a range of MRT values. Over runs with 40Kpreemptions. . . . . . . . . . . . . . . . . . . . . . . . . . . 136
Table 7.7 Rate of preemption with various MRT. Here the functioncalled is the Modular-Exponentiation implementation in libgcryptwith a 2048 bit exponent. Note that for zero MRT the rate ofpreemption is very high that victim computation involving a singlebit was preempted multiple times. . . . . . . . . . . . . . . . . 136
Figure 7.8 CDF of L2 data-loads per time slice experienced byOpenSSL-AES victim. L2 data loads are performance counterevents that happen when a program requests for a memory wordthat is not in both L1 and L2 private caches (effectively a miss).When running along-side a Prime+Probe attacker, these data-cacheaccesses can be observed by the attacker. . . . . . . . . . . . . . 137
Table 7.9 Xen configurations used for performance experiments.. . . . . . . . . . . . . . . . . . . . . . . . . . . . . . . . 140
Table 7.10 Workloads used in performance experiments. . . . . 141Figure 7.11 95th Percentile Latency of Various Latency Sensitive
Workloads. Under non-work-conserving scheduling. . . . . . 142Figure 7.12 95th Percentile Request Latency of Data-Caching Work-
load with Various Competing Micro-benchmarks. Un-der non-work-conserving scheduling. . . . . . . . . . . . . . . 143
Figure 7.13 25th, 50th, 75th, 90th, 95th and 99th Percentile Latencyof Data-Caching Workload when run alongside Nqueens.Under non-work-conserving scheduling. . . . . . . . . . . . . 144
Figure 7.14 Average runtime of graph500 workload when run along-side various competing workloads and under work-conserving scheduling. Averaged over 5 runs. . . . . . . 145
xxiii
Figure 7.15 Average runtime of various batch workloads undernon-work conserving setting. Note that for SPECjbbhigher is better (since the graph plots the throughput instead ofruntime). All data points are averaged across 5 runs. . . . . . . 146
Figure 7.16 Normalized Performance in a non-work-conservingconfiguration with 5msMRT. Normalized to performanceunder zero-MRT case. The left three workloads report 95th per-centile latency and the right three report runtime, averaged across5 runs. In both cases lower is better. . . . . . . . . . . . . . . 148
Figure 7.17 Instructions used to add noise. The assembly code isshown using X86 GAS Syntax. %rax holds the address of the ran-dom predicate used in the test instruction at the relative address0x2. The moves in the basic blocks <L13> and <L14> reads thedata in the buffer, which uses up the corresponding D-cache set. . 151
Figure 7.18 Median and 95th percentile latency impact of the cleans-ing scheduler under worst-case scenario. Here all themeasured workloads are feed by a client at 500 requests per second.The error bars show the standard deviation across 3 runs. . . . . 153
Figure 7.19 95th percentile latency impact of the cleansing sched-uler with varying load on the server. (a) Data-Cachingand (b) Data-Serving. The error bars show the standard deviationacross 3 runs. . . . . . . . . . . . . . . . . . . . . . . . . . 154
Figure 7.20 Median latency impact of the cleansing scheduler withvarying load on the servers. (a) Data-Caching and (b)Data-Serving. The error bars show the standard deviation across 3runs. . . . . . . . . . . . . . . . . . . . . . . . . . . . . . 154
Listing A.1 Pseudo-code of two sample procedures that leaks control-flow and data-access information. Procedure1 leaksdata-access information and Procedure2 leaks control-flow infor-mation. . . . . . . . . . . . . . . . . . . . . . . . . . . . . 200
1
1Introduction
Public cloud computing has become a cheap, viable alternative for manysmall and medium enterprises [25–30, 68] considering the high upfrontcost of setting up and maintaining a private datacenter. Its numerous ben-efits have also attracted large enterprises to host their workloads [27, 124,135] on popular Infrastructure-as-a-Service (IaaS) public clouds like Ama-zon EC2 (EC2) [9], Microsoft Azure (Azure) [37], Google Compute Engine(GCE) [73], and Rackspace [146]. These public clouds offer a simple inter-face to create a virtual datacenter with compute (e.g., virtual machines orVMs), storage and network resources under a flexible pay-per-use pricingmodel. This enables any user to scale their virtual datacenter from a fewtens to thousand VMs in matter of seconds for as less as 10-20 cents perVM per hour, which is impossible in a privately managed infrastructure.These enticing properties of public clouds are possible because of sharingthe physical infrastructure maintained by a cloud provider with multiplearbitrary users over the Internet. This practice of multi-tenancy enablescloud provider to achieve high resource utilization [42, 118], which in turndrives down service cost for its users. For these reasons public clouds andthe practice of multi-tenancy are here to stay for decades to come.
With the future of many commercial applications depending on thepublic clouds, there is one important problem that the cloud providersought to solve to make them safe and usable – isolating the use of sharedresources between multi-tenant workloads or tasks. Two user tasks areperfectly isolated if one task cannot know about the execution of the other
2
task and its use of all the shared resources. This is an essential as anyarbitrary user over the Internet with a valid credit card number and anemail address can use the cloud infrastructure. Such an arbitrary user mayalso potentially share the same machine that is used to run the VMs thatare part of medical [30, 34, 124], banking [26], e-commerce [25, 28, 68], oreven government applications [33–35] running on these public clouds.
What could go wrong with sharing the same infrastructure with apotentially malicious user? Without proper isolation, an average usercould inflict performance degradation on a performance-sensitive enter-prise application, which may lead to huge monetary loss [18]. Apart fromdegradation or denial of service attacks, an adversary could surreptitiouslysteal sensitive information ranging from trade secrets [152] to private cryp-tographic keys [93, 187, 191, 192] without the knowledge of the victimor the cloud provider. We call these attacks as co-location or co-residencyattacks as the adversary uses co-residency to affect either performance orsecurity guarantees of the co-located tenants.
A successful co-location attack involves two steps: place and breach.The first step (place) in any co-location attack is placing VMs in the clouddatacenter such that some key resources are shared with one of the targetvictims. A straightforward choice of shared resource is a physical host1.Hence, we define co-location of two VMs as VMs that share a singlephysical host (we also refer to co-located VMs as neighbors). Followingthe placement step is breaching the isolation boundary to either affect theperformance guarantees or steal secrets from the co-located target VM.For instance, it is not impossible for a neighboring VM to do a Denial-of-Service (DoS) attack on all VMs running on that host by just running asingle machine instruction multiple times [170, 182]2.
This dissertation challenges the security of the state-of-the-art public1A physical host in a datacenter is equivalent to 1 Rack Unit (or 1U)[42]2This is a vulnerability in many x86 architectures that indirectly lock the shared
memory bus, severely affecting all applications that depends on memory bandwidth.
3
clouds by taking the perspective of a malicious user who aims to use thestrongest suite of public clouds, multi-tenancy against its tenants. Thethesis that we want to address in this dissertation is: “the practice of multi-tenancy in public clouds demands stronger isolation guarantees between VMs inthe presence of malicious users.” To systematically evaluate this thesis, westudy the two main pieces of software infrastructure, the placement policyor cluster scheduler [169]3 and the per-host hypervisor [168], and test theirsecurity against co-location attacks.
In the second part, we investigate ways to improve isolation that pre-vents these co-location attacks. Many straight-forward defense mecha-nisms require avoiding resource sharing and relinquish all the desirableefficiency properties along with it or give up on isolation or security alto-gether. We find that practical secure systems can be designed that hit asweet spot that gets the best of both worlds.
1.1 Isolation in Modern Public Clouds
There are two important pieces of cloud software infrastructure (as shownin Figure 1.1) that ideally should make the co-location attacks hard if notprevent them in a multi-tenant public cloud. First is the placement algorithmthat places VMs or user tasks on a physical host in a large cluster of hosts(or datacenter). This placement algorithm controls which tenant VMsare co-located on the same host (phenomenon is termed as co-residency).The second piece is the hypervisor that uses virtualization technology toprovide isolation between execution of these multi-tenant VMs sharingvarious resources like CPU, CPU caches, memory, disk storage, network,etc.
3[170] is the full version of this work.
4
Core(Caches)
Memory
VMVM
LLCLLC
VM VM VMVM
Disks
Hypervisor
N/W
Cluster Scheduler
Cloud API
Placement Policy
VMVM
VM
VM
VM
VM
VMVM
Internet
Core(Caches)
Core(Caches)
Core(Caches)
Public Cloud Infrastructure
Public Cloud Host
1. Placement Policy: Controls co-location of VMs
2. Hypervisor:Provides Isolation
Figure 1.1: Typical IaaS Public Cloud Architecture. Shows two importantpieces of cloud software infrastructure that are responsible for providing isolation frommalicious users: placement policy and hypervisor. A PaaS or a container-based cloud hasa very similar architecture, but a hypervisor is replaced by an operating system and VMsby containers. More on this in Chapter 2.
1.1.1 Influencing VM Placement
First step in any co-location attack involves co-locating an adversary con-trolled VM on the same host as one of the target tenant VMs in the cloud.Can an adversary influence co-location with cloud interface available to any aver-age cloud user? This is an important question that needs to be answered togauge the security property of the placement algorithm. Current cloudinterfaces do not explicitly provide any control over VM-placement in thephysical infrastructure and only provide interfaces to launch and terminateVMs.
There are two essential requirements for a successful VM co-locationwith a target victim: a launch strategy that increases chance of co-locationand a co-location detection mechanism that detects a successful co-location.
5
Although cloud user may not explicitly control the placement policy,he/she may directly control values for certain input variables that are partof the cloud API (e.g., type of VM, choice of datacenter, time of launch) andindirectly control other variables (e.g., churn in the system time of day ofthe launch, day of the week). A set of values for these placement variablesform a launch strategy. Note that a successful co-location is useless if it isimpossible for the adversary to detect co-location with a victim VM in thewild.
In the past there are several studies [152, 182, 190] (some publishedin 2009) that found naïve launch strategies that involves launching largenumber of VMs until it results in a successful co-location. Further, co-location detection was also as simple as looking at the publicly accessibleIP addresses of the victim and the attacker VMs. Such simple strategies nolonger work in modern clouds either because of evolving (and unknown)placement algorithm or because of new countermeasures (e.g., VirtualPrivate Clouds) that makes it harder to detect co-location [93, 169]. Thereis also the ever increasing scale of the public clouds both in terms of thedatacenter size and the cloud user base that makes it even harder to controlplacement by any single cloud user since 2008.
All these aspects of the public cloud seem to promote a false senseof security against malicious users. Counter-intuitively, we show thatan adversary can influence co-location and sometimes do so at a cost as low as14 cents in some clouds [169]. We do this study by: (1) enumerating vari-ous placement variables in the cloud VM launch API that may influenceplacement, (2) Assign values to these variable which forms a launch strat-egy, and (3) execute the launch strategy with two distinct accounts whereone is a proxy for a victim and another the attacker. We repeat this onthree live public clouds (EC2, Azure and GCE) and observe co-locationbetween the two accounts to measure the placement policies’ degree ofsusceptibility to co-location. We then quantify the cost of co-location and
6
co-location success rate for each launch strategy. This forms the basisof our first-of-its-kind placement vulnerability study on public clouds.We also did brief experiments and found similar results on Platform-as-a-Service (PaaS) public cloud (e.g., Heroku [86]) that use containers forisolation as opposed to VMs.
Apart from showing that cheap launch strategies exists, we also showthat an average user could also detect co-location with any victim VM evenwhen they are part of a large multi-tiered cloud application. We use anexisting covert-channel [182] that uses contention on shared memory busfor covert communication. But, instead of requiring cooperation from thevictim, which is required in a covert-channel mechanism, we expose thiscontention via victim’s application performance. That is just by measuringvictim’s application performance while simultaneously creating memorycontention on the co-located attacker VM, one could reliably detect co-location without any cooperation from the victim or the cloud provider.To the best of our knowledge, this is the only uncooperative co-residencydetection mechanism that is known to work in the modern clouds.
These findings reflect the state of the placement policies used in publicclouds and how they may only optimize for efficiency or performanceand that they fail to address security concerns that especially arises in thepublic clouds because of their openness and multi-tenancy properties.
1.1.2 Stealing Performance from Neighboring VMs
A poorly designed placement algorithm that is vulnerable to adversarialVM co-location may still be safe from co-location attacks if the hypervi-sor multiplexing multi-tenant VMs on a single host provides a strongVM isolation. Recall our definition of isolation, if one VM cannot knowanything about the execution of other VMs or affect their performancevia shared resources then it is said to be strongly isolated and hence se-cure from malicious users/VMs. But in reality hypervisors are far from
7
providing even moderate levels of isolation between VMs. In fact, a ma-licious user can steal secret keys used in cryptographically secure proto-cols [93, 152, 187, 191, 192] by just observing a VM’s use of one or moreshared resources on that host. These are called side-channel attacks, as thename implies these are unintended communication channels in the systemthat may be used to siphon data.
There have been numerous works from security researchers demon-strating how to steal secrets from co-located VMs. But another intriguingquestion is: can a greedy user steal performance from neighboring VMs? Thisis also an important question that we seek to answer because in thesepublic clouds performance often may directly translate to money as itmay benefits one user at the expense of other VMs. This is also uniquelymotivated by fixed pay-per-min or -hour pricing model, where a customerpays the same cost irrespective of the amount of useful work completed ina unit time.
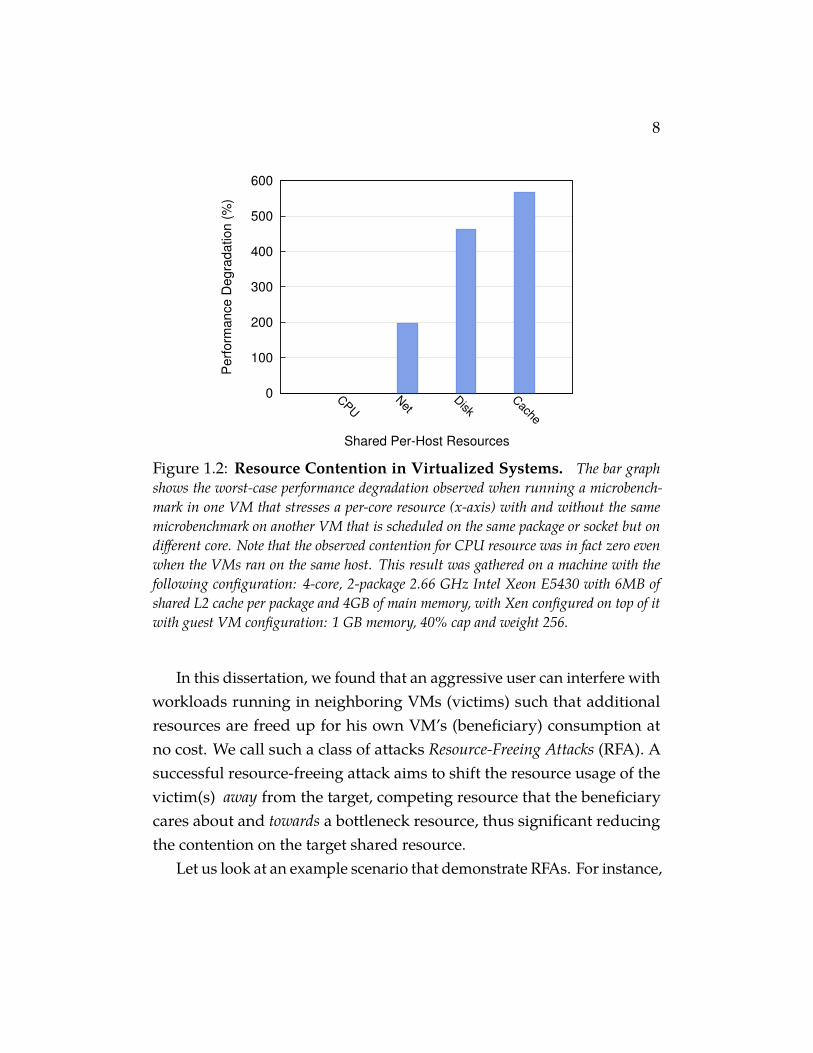
Let there be two applications running in two separate VMs but on thesame host and these two applications (or in general the VMs) competefor a set of resources on that host. It is well known that because of lackof proper isolation of some shared resources; a VM may perceive varyingperformance based on how many other VMs are competing for the sameresource. This subclass of (lack of) isolation is also called (lack of) perfor-mance isolation. A comprehensive study that we did on a local testbedrevealed that because of poor performance isolation in virtualized systemsa competing VM can slow down the performance of another VM by 3×-6×compared to when run in isolation [168]. A subset of the results from thisstudy is shown in Figure 1.2. With such huge performance degradationfor even a short duration of time may translate into huge monetary lossor poor quality of service while incurring the same cost. Such significantperformance loss may be sufficient to incentivize a greedy cloud user toworkaround and relieve the situation.
8
0
100
200
300
400
500
600
CPU
Net
Disk
Cache
Pe
rfo
rma
nce
De
gra
da
tio
n (
%)
Shared Per-Host Resources
Figure 1.2: Resource Contention in Virtualized Systems. The bar graphshows the worst-case performance degradation observed when running a microbench-mark in one VM that stresses a per-core resource (x-axis) with and without the samemicrobenchmark on another VM that is scheduled on the same package or socket but ondifferent core. Note that the observed contention for CPU resource was in fact zero evenwhen the VMs ran on the same host. This result was gathered on a machine with thefollowing configuration: 4-core, 2-package 2.66 GHz Intel Xeon E5430 with 6MB ofshared L2 cache per package and 4GB of main memory, with Xen configured on top of itwith guest VM configuration: 1 GB memory, 40% cap and weight 256.
In this dissertation, we found that an aggressive user can interfere withworkloads running in neighboring VMs (victims) such that additionalresources are freed up for his own VM’s (beneficiary) consumption atno cost. We call such a class of attacks Resource-Freeing Attacks (RFA). Asuccessful resource-freeing attack aims to shift the resource usage of thevictim(s) away from the target, competing resource that the beneficiarycares about and towards a bottleneck resource, thus significant reducingthe contention on the target shared resource.
Let us look at an example scenario that demonstrate RFAs. For instance,
9
let us assume that two VMs are competing for memory bandwidth and inaddition to the memory bandwidth, let the victim also relies on sequentialdisk bandwidth. It is well known that a workload’s performance may relyon multiple and diverse set of resources. A resource-freeing attack in thisscenario creates a disk bottleneck by periodically issuing random diskwrites, which naturally frees up memory bandwidth as the victim waitsfor the disk to complete its sequential accesses. Note that the beneficiaryVM’s performance should not depend on disk bandwidth for a profitableRFA.
The above example is one of the many instances of RFAs possible ina poorly isolated system. All these RFAs help point out two importantdeficiencies in public cloud systems. First, a poorly designed pricing/-billing model may negatively incentivize adversaries to commit maliciousactivities. This is because a simple pricing model such as the pay per hourof usage does not account for the performance interference from otherusers and end up charging each user the same irrespective of the usefulwork done per unit time. Second, using schedulers that permit unlimiteduse of idle (or unused) resources (i.e., work-conserving scheduler) increasethe profitability of the RFAs. Thus, this work provides fresh insight intoscheduler design paradigms that improves security.
1.2 Improving Isolation
In the light of the above two new findings that in contrary to traditionalwisdom even large and busy public clouds are vulnerable to co-locationattacks, the demand to improve isolation has never been higher.
A straightforward defense mechanism that can provide perfect iso-lation between VMs is: avoid any sharing between them. This could berealized either by strictly partitioning resources between users at the hy-pervisor or by having dedicated hardware for each tenant VM. Hence we
10
call such strict form of isolation as hard isolation. Although this solves allthe problems that arise in the presence of malicious tenants, it does it at ahigh cost and is impractical for multiple reasons. One, cloud providersno longer can multiplex resources and increase the service cost for cus-tomers [31]. Second, it does not bank on the idea that not all workloadsuse 100% of the resources all the time. Thus not sharing resources reducesthe resource utilization of the datacenter [42, 118], which in turn increasesthe service cost.
This brings us to the problem of finding a solution that does not give upthe pillars that form the public clouds – openness, multi-tenancy, sharingand low service cost. In other words, the challenge here is to find a defensemechanism that hits a sweet spot between efficiency and security. Weinvestigate a new design principle called soft-isolation: reduce the risk ofsharing through better scheduling.
We demonstrate soft-isolation paradigm by designing a hypervisorCPU scheduler to defend against one of the most dangerous class of co-location attacks: the cross-VM side-channel attacks that exploit per-coreshared states to steal secrets from neighboring VMs [93, 191]. A success-ful cross-VM side-channel attack involves two main steps: (1) frequentinterruption of the execution of a VM sharing the same per-core resource(e.g. TLB, L1 I/D-cache) and (2) measuring the time taken to access thatshared resource using high precision time stamp counters (TSCs). As theseper-core resources are typically stateful, the measured timing profile of theshared resource indirectly reveals the resource usage information of theother VM(s) sharing the same resource. This is the simplified version of across-VM side-channel attack although the actual attack is much more com-plex involving machine learning and multiple stages of post-processing ofthe timing profile.
As noted earlier, one essential requirement for the success of the side-channel attacks is the frequent preemptions, which were allowed by the
11
state-of-the-art hypervisor CPU schedulers for the benefit of interactiveworkloads. But an attacker could abuse this scheduler feature to preempta victim VM as quick as 10µs. To solve this problem, we adopted thesoft-isolation principle that guides us to ratelimit dangerous cross-VM pre-emptions instead of avoiding any cross-VM preemptions (hard-isolation),which may be achieved by pinning each VM to different CPU core. Weachieved this via a simple scheduler primitive we called the MinimumRunTime (MRT) guarantee. With MRT guarantee, a VM is allowed to runfor a guaranteed time interval (MRT value) irrespective of any outstandinginterrupts or preemptions. We discovered that a modest MRT value of1-5ms was sufficient to prevent any known attacks [166]. Further extensiveexperimentation with microbenchmarks and realistic cloud applicationsrevealed that a MRT value of 5ms incurs zero overhead on average andless than 7% overhead on the tail latency of interactive workloads likememcached [65] and cassandra [111].
1.3 Summary of Contributions
The work presented in this dissertation makes several contributions to thearea of cloud computing security. Some of the major contributions arelisted below.
• We systematically evaluated the placement policies used in publicclouds, quantifying the susceptibility of some launch strategies to-wards co-location. This is the first-of-its-kind elaborate study thatgives insight into how current efficiency optimized placement algo-rithms might have other security implications, in this case, cheapVM placement attack strategies. Apart from quantifying the costof co-location and we also designed a framework to compare thesecurity of placement policies used in distinct clouds against VMplacement attacks. Further the findings also freshly motivate sev-
12
eral previously published co-location attacks, as VM co-location is aprerequisite for the success of many co-location attacks.
• Apart from demonstrating that VM placement can be influenced in alive and busy public cloud systems, we also showed that co-locationcan be detected with any victim VM in a public cloud by just usingquirks in the microarchitecture of current generation X86 machines.
• The comprehensive measurement study on the level of performancedegradation due to resource contention helps gauge the quality ofperformance isolation in virtualized systems. The results help bolsterthe fact that even in 2015 state-of-the-art hypervisors still poorlyisolate VM executions on a single host.
• We discover and demonstrate a new class of attacks called Resource-Freeing Attacks that could be used by a greedy customer to relievemassive contention (3×-6×) on essential shared resources and boasthis performance at the neighbor’s expense. This work exposes prob-lems in the design of resource schedulers in a public cloud settingand shows how a flaw in the billing system could incentivize mali-cious activity in the public cloud.
• We evaluate the ability of system software to mitigate a class of cross-VM side-channel attacks (Prime+Probe) through scheduling. Wepropose a new design principle called soft isolation that aims to re-duce the risk of sharing by avoiding dangerous cross-VM interactionswhen sharing the same processor. With extensive experimental mea-surements, we demonstrate that such a mechanism can effectivelyprevent existing Prime+Probe side-channel attacks at negligible over-head.
13
1.4 Outline
The rest of this dissertation is organized into the following sections.
• Background. In Chapter 2 we provide a general background to un-derstand this dissertation, giving an overview of public clouds, virtu-alization, challenges in providing isolation, and background on cross-VM attacks in public clouds. That said, any readers who possessbasic understanding of virtualization, public clouds, and cross-VMattacks can safely skip this chapter.
• Threat model. In Chapter 3 we define our assumptions about thecloud provider, the attacker and the victim and justify how theseassumptions are valid and reasonable in a modern public cloudenvironment.
• Motivation. In Chapter 4 we list three specific problems that wetackle in this dissertation that we briefly described in this chapterand also argue why these problems help in validation our thesisabout isolation in public clouds.
• Evaluating and improving isolation in public clouds. Chapters 5,6 and 7 are the meat of this dissertation, where we go in greaterdetail about the three studies that we did about isolation in publicclouds. First, in Chapter 5 we categorically show that targeted VM co-location is practical even in modern clouds and why researchers andcloud providers need to worry about co-location attacks. Second,in Chapter 6 we demonstrate how lack of isolation between VMscould incentivize new attacks in public clouds. Third, in Chapter 7we propose a new design paradigm called soft-isolation that aims toimprove isolation between co-resident VMs without compromisingon efficiency. We also demonstrate on how this design principle canbe employed to defend against the dangerous cross-VM side-channel
14
attacks in the cloud. We record the results of all the three studies intheir respective chapters.
• Related work. In Chapter 8 we survey many prior and contempo-rary works that are related to the ideas presented in this dissertationand compare them with our works.
• Conclusion and lessons learned. Finally, in Chapter 9 we summa-rize the results of the studies presented and argue how they helpsupport the thesis of this dissertation. We also present some of thevaluable lessons learned during the research endeavors.
15
2Background
Historically, any enterprise that rely on compute resources to do simpleweb hosting invested in physical machine resources starting as a smallcluster of few tens of machines and growing into a large private datacenteras the enterprise grows. The emergence and popularity of Amazon EC2that enabled renting a fraction of a machine on-demand and pay onlyfor the usage (per hour) [9] changed this requirement of an enterprise.The most challenging aspect of these Infrastructure-as-a-Service (IaaS)cloud providers is renting out a fraction of a single machine to disparatecustomers. This scenario is very similar to what operating systems faced inthe era of mainframes where many users ran tasks on a shared mainframecomputer with the expectation that operating system provided fair shareof resources for every user and to isolated one user’s task execution anddata from another. In this era of cloud computing, instead of a singlemainframe computer there is a cluster of racks with many nodes per racksthat forms the shared infrastructure. The operating system for this clusterof nodes is responsible for where to place a task (placement) in this cluster,and isolate the tasks that share the same physical resources (isolation)among other responsibilities. The shared cloud resources include butare not limited to the per-node resources like CPU, memory, disk, anddatacenter-wide resources like shared networks that connect differentnodes and to the Internet. The user task is a Virtual Machine (VM), whichis equivalent to a user process in the mainframe era.
In this chapter, we will provide a broad background on this operating
16
system that manages the cloud but specifically focusing on how the systemis designed to isolate resource usage of disparate users of the cloud. Thisbackground is essential to understand the new attacks, vulnerabilitiesuncovered in this dissertation and defense mechanisms that aim at im-proving the isolation guarantees in public clouds. Particularly, we willlearn:
• How a cloud user interacts with the cloud and how is one billed?
• What is virtualization and how is it used to provide isolation betweenusers?
• How does a cluster scheduler work and what is its role in providingisolation?
• What are some of the security challenges that public clouds face?
2.1 Overview: Public Clouds
To get a quick bird’s eye view of a public cloud let us follow the life cycleof a VM, which is the fundamental scheduling entity for a cloud user.
Life cycle of a VM. A cloud user starts a VM by invoking the cloud APIthrough which a desired set of parameters describing the configuration ofthe VM is communicated to the cloud provider. The provider initiates theresource allocation for the new VM; this process is called VM provisioning.VM provisioning consists of two steps: VM placement, which selects thephysical host to run a VM using a VM placement algorithm followed bybootstrapping the VM on that host, which involves the per-host resourcemanager carving out physical resources for running the VM. The resultingVM-to-host mapping we call the VM placement and the per-host resourcemanager is called the hypervisor that is responsible for allocation andisolation of resources between VMs on that host. The VM interacts with the
17
hypervisor to set up network and storage resources or request new servicesthrough other cloud management infrastructures, which we collectivelyrefer to as the cloud fabric. The cloud fabric as a whole is also responsiblefor resource accounting, billing and performance monitoring for that VM.During the lifetime of the VM, it and its resources can be reconfigured.The cloud fabric may also choose to transparently migrate the VM to adifferent host. When the VM has completed its workload or when thecompute resource is no longer needed, it saves any necessary state to apersistent storage. Then the cloud user invokes the cloud API to initiate aVM termination call to the cloud fabric. The cloud fabric reclaims all theresources associated with the VM, ending the life cycle of a VM.
Cloud Interface. All public clouds provide a management interface forcustomers to rent resources either using specialized Software-as-a-Serviceslike a database engine [20], performance monitoring tool [6], load bal-ancer [16], etc. or raw compute or storage resources in form of VMs orvirtual disks. Typically, users start by registering an account with the cloudprovider that at least require a credit card or bank account credentialsand an email address. Then the users invoke the cloud interface to specifytheir resource requirements using the management interface or cloud API.There are several different APIs for accessing various services1 but werestrict our discussion to the Cloud API that helps a user to configure,launch and terminate VMs in the public cloud (in IaaS parlance oftenreferred to as Compute API).
2.1.1 Compute Cloud API
A typical cloud API consists many calls to the public cloud fabric that aid inVM configuration, which is not limited to launching and terminating VMsbut attaching/detaching storage volumes, create/delete VM snapshots,
1For instance, GCE had more than 100 Cloud APIs that were available at the timewhen this dissertation was written.

18
Type* EC2 GCE AzureShared-core t1.x, t2.x f1-micro, g1-small basic A0-A4
Standard x.medium n1-standard-N standard A0-A7Large x.large, x.Nxlarge n1-highcpu-N D1-D4 & D11-D14
X-Optimized memory, GPU, I/O n1-highmem-N network, memory
Figure 2.1: Instance Types in EC2, GCE and Azure Public Clouds. Popu-lar public clouds have numerous predefined VM configurations under different tiers. Thetype (*) mentioned is an author defined tiers for VM types commonly found across publicclouds. Shared-core instances are configured to consume only a fraction of a physical coreand hence often share the same core with another tenant’s VM. X-Optimized instancetypes satisfy special requirements for a cloud application like access to GPUs or betternetwork or memory configuration than other available instance types. x in the instancetype takes set of values forming a hierarchy of instance types. For example, t1.micro andt1.medium in EC2 are two instance types under same hardware configuration (t1 - ma-chine generation with shared core) but different VM configuration. micro VM instanceshave 1 virtual CPU with 1GB of memory whereas medium instances have 2 virtual CPUswith 4GB of memory. This is the snapshot of instances types available as of October 2015.
Instance Type CPU Memory Network Storaget2.micro 10% of 1 vCPU up to 3.3GHz 1GB Low EBS HDD
t2.medium 40% of 2 vCPU up to 3.3GHz 4GB Low EBS HDDm3.medium 1 vCPU, 2.5 GHz 3.75GB Moderate 4GB SSD
m3.xlarge 4 vCPUs, 2.5 GHz 15GB High 80GB SSDc4.xlarge 4 vCPUs, 2.9 GHz 7.5GB High EBS HDD
Figure 2.2: VM Configurations of EC2 Instance Types.. Only shows asubset of the available instance types in Amazon EC2 [13] but diverse enough to give anidea of various VM configurations available in the modern public clouds. EBS stands forElastic Block Stores, which are network attached Hard Disk Drives (HDDs). Historically,EC2 provided an architecture agnostic CPU metric (called Elastic Compute Unit or ECU)but in 2014 EC2 exposed raw vCPU metrics that reflect the physical CPU limits. This isthe reason the above CPU configuration varies for different instance types.
19
assigning IP addresses, etc. (e.g., EC2 API [10]). We focus on two impor-tant calls that affect the life cycle of a VM: VM launch and VM terminate.When a user wishes to launch a VM (in EC2 called RunInstances [11]), itis required to pass several parameters that define the VM and its configu-rations. This include: VM instance type, datacenter location, VM image,number of VMs of this type apart from various common parameters thatidentify the user with credentials like security tokens and/or API keys.Each public cloud has several instance types that are basically predefinedVM configurations with their own associated VM capacities. Some of thecommon instance types are shown in Figure 2.1. To get an idea of VMconfigurations associated with a VM type, we take a closer look at the con-figurations of a subset of instance types available in Amazon EC2 (shownin Figure 2.2). There is a spectrum of instance types that are ideal fordifferent workloads. For example, m3.medium instance are ideal for smalland mid-sized databases and c4.xlarge for high-performance front-endwebservers, video encoding, gaming and distributed analytics [13].
Apart from instance types, users also have different choices for datacen-ter location. A datacenter location typically consists of two dimensions: 1.the actual geographical location of the datacenter, e.g., US-east (also calledregions) and 2. the availability zone within a datacenter. Availability zonesare cluster of machines in a region that are designed to fail independent ofany failure in another availability zone in the same region. Here failuresinclude network, power or other management failures that might happenin a datacenter. For example, EC2 has 4 regions in the US with 2-5 avail-ability zones in each of these regions and has several regions in Europeand Asia. To fully utilize the presence of availability zones, customersare recommended to spawn redundant components of their applicationin at least 2 if not 3 availability zones. This increases the availability oftheir application as they could service user requests amidst unpredictablesystems failure in other availability zones. It is important to note that
20
Cloud* Price per hour GranularityEC2 $0.026 per hourGCE $0.027 per minute
Azure $0.060 per minuteRackspace $0.037 per hour
Figure 2.3: Public Cloud Pricing for EC2, GCE, Azure and Rackspace.Price per hour listed here are the price for on-demand small instances (EC2: t2.small,GCE: g1-small, Azure: Standard-A1, Rackspace: General1-1).
users do not have the flexibility to choose a particular availability zonethat another user may reside as the naming of availability zones differsfrom one customer account to another2.
2.1.2 Pricing Model
The above cloud API enables any user to request VM instances of anytype on-demand. The pricing model with which users are billed for theuse of these instances varies across cloud providers. Figure 2.3 lists theprices for a similar instance type on four popular public clouds. Typically,all providers follow the pay-as-you-go pricing model where there areno upfront costs and users pays for the actual usage per unit time. Thegranularity at which each providers charges may be as high as one hourto as low as every minute. For instance, if a user starts an instance and runfor only 10 minutes, EC2 and Rackspace charges the user for the wholehour but GCE and Azure charge only for the 10 minutes. Similarly, eachproviders charges for network resource per unit of data transmitted andfor storage per unit of data per unit time. Overall, the pricing model ishighly flexible compared to the cost incurred for setting up a datacenterand the maintenance cost associated with it. Interestingly, this simplisticpricing model also has some downsides like homogeneous pricing forheterogeneous hardware. For instance, there is a possibility that the same
2This is known to be true for Amazon EC2.
21
instance type might run on two different machines and be charged thesame cost even though the performance may differ even when run thesame workload inside those instances (e.g., m3.medium in EC2 may alsorun on an older generation microarchitecture) [61].
2.1.3 Other cloud services
One of the many advantages of the public clouds is its elasticity – abilityto scale the size of the virtual datacenter of any user dynamically withminimal effort. In fact there are several higher-level services that monitorload and automatically launch or terminate instances based on the work-load [32, 74, 150]. These services internally use the same mechanisms asusers to configure, launch and terminate VMs but agree upon the cloudapplication configuration and needs ahead of time.
There are also other services to: 1. load balance client request over theInternet among a set of front-end servers [16], 2. provide Content DeliveryNetworks (CDNs) [5], 3. Database services [20] and many more.
Public vs. private clouds. Typically, an enterprise invests in a cluster ofmachines or a datacenter to satisfy its computing needs and is responsiblefor its maintenance as well. Historically, these clusters are managed usinga mix of off-the-shelf and in-house enterprise tools. Recently, for ease ofmaintenance, these clusters are also managed using the same softwaremanagement infrastructure (e.g., OpenStack [138]) that are employed inpublic clouds and hence, virtualize the cluster of machines. Unlike publicclouds, the access to the datacenter is limited to only the employees ofthe enterprise. Such a private software/hardware infrastructure forms aprivate cloud. On the other hand, a public cloud has similar challengesas a private cloud but is accessible to any user over the Internet. In thisdissertation, we focus on security concerns that arise in a public cloudin the presence of malicious users. Although many of the problems and
22
solutions discussed here may also apply to private clouds, such discussionsare out of the scope of this dissertation.
2.2 Virtualization
Virtualization is a method that allows multiple users or programs to sharethe same resources. It provides an illusion that a user has all of the phys-ical resources but in fact the physical resource may be simultaneouslyshared between multiple users or each user uses the resource for a frac-tion of a time (time-multiplexing). This illusion is often called the virtualcounter-part of the actual resource (e.g., CPU vs. Virtual CPU). For exam-ple, Operating Systems (OS) in the era of mainframes virtualized a singlemainframe into multiple processes each of which had access to all theresources of the mainframe like memory, disks, CPU etc. Hence a processessentially is a virtual mainframe. In the public cloud setting, virtualiza-tion plays a major role in enabling sharing of a cluster of machines amongdisparate users over the Internet. Below we will take a close look at howthree major resources (compute, network, storage) are virtualized in thecloud.
2.2.1 Compute Virtualization
Compute Virtualization is a combination of software (operating system)and hardware protection mechanisms that provide a task abstraction en-abling resource sharing between disparate users. This is true since theera of mainframes where OSes with minimal hardware support virtualizeall resources (e.g., CPU, memory, disk, network). Note that an OS thatprovides process abstraction is far away from the physical machine layerand is designed to support various system management tasks that arehidden behind the process abstraction. For example, all processes used thesystem call interface to off-load management tasks to the OS like memory,
23
devices like disk, network, etc. But unlike operating systems that use aprocess abstraction, IaaS providers use a virtual machine (VM) abstraction.Figure 2.4 depicts these differences in the perspective of an applicationrunning in a process versus one running inside a VM environment. Asthe name suggests, the virtual machine is the lowest form of abstraction,where the system exposes the same interface a bare physical machineprovides, machine instructions. Hence, unlike a process abstraction, VMsrequire only minimal management support from the system software.For the same reason, the VM abstraction also promises highest level offreedom enabling any user to independently run an operating system oftheir choice irrespective of whom they are sharing the physical machinewith or the type of the machine they are running on. Here the systemsoftware that manages these VMs is called a hypervisor. These hypervisorsare solely responsible for two main function – efficiently sharing resourcesand isolation between disparate VMs. In this section, we will take a closelook at how the hypervisor strives to do both these functions.
Isolation. Recall the definition of isolation (in Chapter 1): two user tasksare perfectly isolated if one task cannot know about the execution of theother task and its use of all the shared resources. It is important to note thisis a stronger form of isolation than is expected from an ideal hypervisor.In reality, it is hard if not impossible to achieve this strict form of isolationand we often refer to two forms of isolation called logical and performanceisolation. Two VMs are logically isolated if one of the VMs cannot nameor identify an instance of a resource that is also shared by the other VM.Examples for a shared namespace that violate logical isolation betweentwo VMs are: a common physical host IP address or common hypervisoridentifier (e.g., Dom0 identifier in Xen [152]). Two VMs are performanceisolated if a VM is unable to know the presence of another VM by measuringthe performance of a shared resource. A lack of performance isolationis realized, for instance, when a VM perceives a significant reduction in
24
Physical Machine
Operating System
Device Drivers
System Call Interface
MMU
INT
Scheduler
FileSystem
I/O Manager
Process
App
Process
App
Process
App
Physical Machine
VM VM
HypervisorScheduler MMU INT
Privileged VM
Hyper Call Interface
DeviceDrivers
I/O Mgr. Guest OS LibOS
App App
VT-x or AMD-v
Figure 2.4: Process vs. Virtual Machine Abstraction.
CPU bandwidth when sharing the CPU with another VM relative to thebandwidth observed when run in isolation. There are other special formsof isolation like thermal or power isolation, where instead of performance,dissipation of heat or consumption of power, respectively, could also aid inthe knowledge of other VMs in the system. Such highly specialized formsof isolation are out of scope of this dissertation. Ideally, a hypervisor aimsto achieve both logical and performance isolation but in reality achievingperfect performance isolation is much harder than logical isolation.
Types of hypervisors. There are two different types of hypervisors thatallow a full-fledged OS (also called as the guest OS) to run inside a VM.Type I or bare-metal hypervisors run directly on the physical hardware(e.g., Xen [40], KVM/QEMU [45, 105], HyperV [173], VMware ESX [130]).On the other hand, a Type II or hosted hypervisors run on top of a host OS
25
using nested virtualization [46] hardware support or binary translationsupport [119] (e.g., VMware Workstation [163], VirtualBox [181]). In thisdissertation, we will focus only on type I hypervisors, as the other type isunsuitable for a public cloud environment.
The popular public clouds differ in their choice of hypervisors; GCEuses KVM, Azure: HyperV, EC2 and Rackspace: Xen. Although all thesehypervisors aim to achieve the same goals of isolation and close to bare-metal efficiency, they slightly differ in their system architecture and design.There are several metrics by which Hypervisors and their security guaran-tees are evaluated. One common metric is the Trusted Computing Base(TCB). A TCB is the minimal set of system software that is responsiblefor security guarantees of the system and is essential trusted. Hence, ingeneral the size of the TCB could be used as a proxy to gauge the securityof the system (smaller the better).
Xen [40] and HyperV [92, 173] follow a micro-kernel like system wherethe auxiliary management software is separated from the actual hypervisorand hence brandishes a very thin Trusted Computing Base (TCB). On theother hand, the KVM hypervisor, which comprises of the whole Linux OSand a kernel module (kvm.ko), has a large TCB. Although it has a largeTCB, the reused Linux OS source is highly mature and taps into all thecontributions to the mainline Linux OS. In this dissertation, we will focuson one of the hypervisors (Xen) that is freely accessible and is used by themost popular and a successful public cloud (EC2).
Xen Hypervisor
In order to understand the sources and effects of performance interference,we describe the Xen hypervisor mechanisms and policies for sharing re-sources between guest virtual machines while still providing performanceisolation. A key reason to use VM-based virtualization in cloud computingis their ability to logical isolation between customer applications. This is
26
because a VM-abstraction virtualizes everything about a machine, detach-ing a VM from its physical host. On top of this, achieving performanceisolation is a primary goal for hypervisors like Xen hypervisor used inEC2 [40]. To this end, Xen and other hypervisors focus on fairly allocatingCPU time and memory capacity [175]. However, other hardware resourcessuch as memory bandwidth, processor cache capacity, network, and diskhave received less attention.
CPU. The scheduler views VMs as a set of virtual CPUs (VCPUs), whichare scheduled entities (like threads or processes in OS) and its task is todetermine which VCPUs should be run on each physical CPU at any giventime. The Xen scheduler provides both fair-share allocation of CPU andlow-latency dispatch for I/O-intensive VCPUs. The commonly used CPUscheduler is the credit scheduler I [54].
The scheduler gives VCPUs credits at a pre-determined rate. The creditsrepresent a share of the CPU and provide access to the CPU. Every 10ms aperiodic scheduler tick removes credits from the currently running VCPUand if it has none remaining, switches to the next VCPU in the ready queue.VCPUs are given more credits periodically (typically every 30ms). Thus,if a CPU-bound process runs out of credit, it must suspend for up to 30msuntil it receives new credits to run. A VCPU that runs for short periodsmay never run out of credit, although the total amount it can accrue islimited.
In order to support low-latency I/O, Xen implements a boost mechanismthat raises the priority of a VM when it receives an event (loosely translatedas interrupt), which moves it towards the head of the ready queue. Thisallows it to preempt the running VM and respond to an I/O requestimmediately. However, a VM that has run out of credits cannot receivethis boost priority. The boost mechanism is a key component that is oftenabused in many security attacks [166, 168, 191].
The credit scheduler supports a work-conserving mode, in which idle
27
CPU time is distributed to runnable VCPUs, and a non-work-conservingmode, in which VMs’ CPU time is capped. The latter mode reducesefficiency but improves performance isolation. Though Amazon doesnot report which mode it uses, our experiments indicate that EC2 usesnon-work-conserving scheduling.
On a multiprocessor, Xen can either float VPCUs, letting them executeon any CPU, or pin them to particular CPUs. When floating, Xen allowsa VCPU to run on any CPU unless it ran in the last 1ms, in which case itis rescheduled on the same core to maintain cache locality. Experimentsshow that EC2 configures Xen to float VCPUs across cores.
Memory. Xen isolates memory access primarily by controlling the alloca-tion of memory pages to VMs. In cloud settings, Xen is often configuredto give each VM a static number of pages. It does not swap pages to disk,actively manage the amount of memory available to each VM, or use dedu-plication to maximize use of memory [175]. Furthermore, x86 hardwaredoes not provide the ability to enforce per-VCPU limits on memory band-width, hence Xen does not manage memory usage. Although recent Intelmicroarchitectures (since Broadwell, 2015) provide mechanisms to manageLLC usage in the OS (called Cache Allocation Technology (CAT) [94, 95]),current version of Xen is yet to utilize such facilities.
Devices. By default, Xen seeks fair sharing of disk and network by pro-cessing batches of requests from VMs in round-robin order [40]. For disks,this can lead to widely varying access times, as sets of random requestsmay incur a longer delay than sequential accesses. Further, Xen defaultsto a work conserving scheduler for other devices, so performance can alsodegrade if another VM that was not using a device suddenly begins to doso. However, we observe that EC2 sets caps on the network bandwidthavailable to an m1.small instance at around 300 Mbps, but does not capdisk bandwidth (more details in Chapter 6).
28
2.2.2 Network Virtualization
Compute virtualization described above is essential to provide isolationfor majority of the resources used by a VM but arbitrating and configuringdatacenter network is equally important. Unlike other per-host resources,the network spans the whole datacenter and into the Internet. The networkis often the only entry point for various security attacks and are hardest tosecure because of the inherent distributed nature of the network (with acluster of routers and switches).
Typically the cloud infrastructure, by default, configures each VM withat least two IP addresses, a public IP address for communication over theInternet, and a private or internal IP address for intra-datacenter commu-nications. Cloud providers aim to fully virtualize the network by usinga combination of several technologies [55]: network overlays for ease ofvirtualization in multi-tenant clouds [55], Virtual Local Area Networks(VLANs) [171] for network isolation for small networks, Software DefinedNetworking (SDN) for ease of management and control [53, 104, 121],Virtual Private Networks (VPNs) for secure inter-datacenter communi-cation [154], middleboxes3 and network firewalls for enforcing securitypolicies. Understanding and evaluating security properties provided bythese technology is not the focus of this dissertation. Readers interestedin gaining deeper understanding of the network virtualization techniquesare directed to relevant publications [55]. Overall, a combination of thesetechnologies enables a dynamic, agile network that isolates each user’straffic from another. This enables a user to configure and manage thenetwork as part of their own Virtual Private Cloud (VPC) [22, 44], wherethe user is given the view of a private cloud with a cluster of VMs whoseinteraction with each other and the Internet can be monitored and isolatedfrom others.
3Network Function Virtualization is another related keyword that would be usefulfor any interested readers.
29
2.2.3 Storage Virtualization
In addition to virtualizing network, often cloud providers benefit fromvirtualizing storage systems as well. There are several ways to providestorage resources to a VM. A straightforward method is to expose a logicalpartition of a disk on that host to each VM running on the same host.Although this results in a simple storage manager, it has several drawbackssuch as expensive VM migration, and complex VM snapshot process. Forinstance, on a VM failure the recovery process becomes complex withoutthe availability of the host as the VM’s persistent state is on the host’s localdisk. Current public clouds increasingly offer network-attached disks,where a virtual block-storage driver on the host emulates a local diskpartition that transparently communicates with a disk cluster. Here thedisk cluster could either be part of a Storage Area Network (SAN) or aNetwork-attached Storage (NAS). Although the details and distinctionbetween these two types of decentralized storage architectures is out ofscope of this dissertation, they help optimize for all the drawbacks of localdisk storage or direct-attached storage system. Amazon EC2 calls theirnetwork-attached disks as Elastic Block Store (EBS) [8] and the local disksas ephemeral disks, offering them as scratch disks whose state are notpersistent across VM termination. The added benefit of these network-attached disks is that it provides the flexibility of choosing either a SolidState Disks (SSDs) or Hard Disk Drives (HDDs) from any host with theadded benefit of almost infinite disk capacity.
Apart from these storage virtualization that operates at the block-level,some cloud providers also provide specialized storage like object storesthat are accessible via a separate API. For example, Amazon Web Servicesoffers an object store called Amazon Simple Storage Service (S3) [21] andGoogle Cloud offers Google Cloud Storage [72]. Both of them exposea simple put-get key-value store style interface. These object stores donot provide rich querying interfaces and store unstructured binary blob
30
associated with a key. There are also other NoSQL (e.g. DynamoDB [7],BigTable [70]) and SQL (e.g., Amazon RDS [20]) storage services thatprovide rich interfaces than the simple object stores. There are also storageservices for specific use cases like data archiving and long term backupstorage (e.g., Amazon Glacier [17]).
2.3 Cluster Scheduler
Cluster schedulers are responsible for selecting where to place VMs in adatacenter. The mapping of VM to host is called a VM placement and thelogic that decides this mapping is the placement algorithm or scheduler.The primary goal of a VM placement scheduler is maximizing datacenterefficiency and resource utilization of its servers [42]. Apart from this,the scheduler also controls co-location of multi-tenant VMs and hence isindirectly responsible for isolation in public clouds.
The placement for a specific VM may depend on many factors: the loadon each machine, the number of machines in the data center, the numberof concurrent VM launch requests, etc. as defined by the placement policyfor that public cloud. As mentioned earlier, the VM placement policies andthe associated placement algorithm that implements it in public clouds aimto increase data center efficiency, quality of service, or both. For instance, apolicy that aims to increase data center utilization may pack launched VMson fewer machines. Similarly policies that optimize the time to provisiona VM, which involves fetching an image over the network to the physicalmachine and booting, may choose the last machine that used the same VMimage, as it may already have the VM image cached on local disks. Policiesmay vary across cloud providers, and even within a provider based onthe nature of the VM launch requests.
Current public clouds do not disclose these placement policies andalgorithms used and the average user entrusts the cloud provider to pro-
31
vide best-effort safety measures. The existence of an open source cloudmanagement software, OpenStack [138] sheds light on the structure of astate-of-the-art cluster scheduler used in the wild. This is because a num-ber of public clouds (and some private clouds) use a version of OpenStackto manage their datacenter (e.g., Rackspace [146], HPE Helion [89]).
OpenStack cluster scheduler. OpenStack’s cluster scheduler (also callednova-scheduler) decides the placement of a VM in two stages. First, fromthe list of all hosts available in the datacenter it filters out hosts that cannotsatisfy the VM launch request. The scheduler can be configured with morethan one filter, each filter for a corresponding policy restriction. Second, itweighs and ranks the list of remaining hosts based on configured policyand chooses the host with highest weight to place the requested VM. Notethat there is also a non-weight based scheduler in the second stage calledthe chance scheduler, which as the name implies randomly selects one ofthe filtered hosts.
It is evident that the choice of the filters used and the host weighingpolicy defines the placement policy under this OpenStack scheduler ar-chitecture. There are several options for the filters and host ranking for acloud provider, and a few of them are described below (for the full list seethe Openstack documentation [139]).
By default, OpenStack is configured to use to the filter scheduler withthe following filters:
• Availability zone filter: selects only the machines that are in the re-quested availability zone,
• RAM filter: selects machines with sufficient physical memory,
• Image properties filter: selects machines that have the machine archi-tecture, hypervisors that are compatible with the image of choice,
32
• Affinity and Anti-affinity filter: selects machines that already hosts agroup of VMs (affinity) and avoids certain other VMs and their hosts(anti-affinity).
Regarding the weighing options, one can define a policy that enableseither spreading of VMs across all available machines after filtering orstack VMs on single machine before moving to the next. Here the formerincreases machine utilization whereas later saves power. By default, ahost’s weight is calculated based on the amount of unused RAM and theweighing policy is defined using a multiplier that defines how the weightof that host grows with the amount of its unused RAM capacity. Forexample, a negative multiplier promotes packing VMs on the same host.
In the current version of OpenStack there are very few filters that helpconfigure security policies. For instance, there is a filter to remove list ofmachine that hosts VMs that belong to untrusted users, although it is notclear how a user is defined trusted or untrusted. Overall, there are noknown policies in OpenStack for managing co-location of multi-tenantVMs.
VM migration. During the lifetime of a VM, a VM may not always runon a single host on which it was placed at start. Cloud providers mayalso migrate VMs to another machine. There are several reasons thatmay trigger a VM migration event – power cycling hosts for maintenanceor system upgrade purposes, efficiency reasons to pack multiple longrunning VMs on a small number of hosts, or security reasons to avoidlong periods of co-location with a group of VMs. Although there arebenefits for migrating VMs, migration affects the availability of the VMeven if it is for a brief time [132]. For this reason may cloud providersturn to live VM migration as a last resort (e.g., rolling critical securityupdate or other maintenance activity) [71]. Google Cloud acknowledgesthe possibility of VM migration for maintenance and provides a choice tothe user to do live VM migration (the default option) or to terminate and
33
re-launch the VM that is affected by the maintenance activity [71]. Othercloud providers provide only notifications in case of such disruptive VMmigration activities. Hence, the VM migration is often not visible to theuser and at the time of this writing no cloud providers provided any userinterface to trigger VM migrations.
2.4 Side-channels in Public Clouds
Any lack of isolation in the cloud infrastructure manifests as a securityconcern in a public cloud environment in the presence of malicious users.In this dissertation we focus on cross-VM attacks where a malicious VMis co-located with the victim VM and exploits lack of isolation to stealsensitive information. In this section, we provide a background on side-channel attacks in this section.
Side-channels. Two users when on different machines may communicatethrough network protocols by using their Internet Protocol (IP) addresses,when on the same machine may use system provided communicationchannels (e.g., using shared memory) for communication. There are alsounintended communication channels that may exist in a system that couldbe exploited by two users. These are called side-channels. Side-channels ina public cloud setting across VMs exist when there is a lack of proper isola-tion of shared resources used by those VMs. One can classify side-channelsbased on the lack of isolation they exploit, as: logical side-channels andperformance side-channels.
Logical side-channels allow information leakage via naming or identifica-tion of a shared resource that is explicitly observable, e.g., IP addresses,timestamp counter values. For instance, it is known that an OS assigns afile descriptor or IDs for opened files. Often, the file descriptors are num-bered starting from 0 and incrementally assigned to opened files. This
34
file-descriptor name space is shared across all process. Two processes canuse this shared namespace to communicate by opening and closing oneor more files and denote them as 0 or 1, respectively.
Performance side-channels are created when performance variations dueto resource contention are observable. For example, a shared disk canbe used as a side-channel by using the performance characteristics ofthe sequential and random accesses, where sequential accesses completefaster than random accesses because of the spatial locality of the sequentialaddresses and the seek latency of magnetic disk heads. A task doingsequential access will observe a significant drop in its disk throughput ifanother task does a random disk read. Here the performance of the firsttask could be used to know the access done by the second task and henceestablishing a performance side-channel.
Side-channel attacks. Note that in all the above examples, we consideredtwo tasks cooperating and using the side-channel for communication. Suchcooperative use of side-channel are often referred as covert-channels. Thereare also cases where the side-channels can be used to extract informationthat is potentially secret to another user. Such uses of a side-channel makeit a security attack (i.e., a side-channel attack). For instance, the above diskperformance side-channel may also be used to surreptitiously learn aboutdisk requests done by another user (or a victim), which may indirectlyleak some secret information (e.g., cryptographic secret keys used forconfidential communication).
In public clouds, even though virtualization provides isolation be-tween two VMs (good logical isolation, limited performance isolation),it is known that an attacker can use various performance side-channelsacross the VM boundary to steal cryptographic secrets (more on this inthe later chapters).
Types of side-channel attacks. Side-channel attacks can be broadly clas-
35
sified into three classes: time-, trace-, and access-driven. Time-drivenattacks arise when an attacker can glean useful information via repeatedobservations of the (total) duration of a victim operation, such as the timeto compute an encryption (e.g., [2, 47, 52, 83, 107]). Trace-driven attackswork by having an attacker continuously monitor a cryptographic opera-tion, for example via electromagnetic emanations or power usage leakedto the attacker (e.g., [66, 106, 145].
The third and the most damaging class of side-channel attacks are theaccess-driven side-channel attacks, in which the attacker is able to run aprogram on the same physical server as the victim. These abuse statefulcomponents of the system shared between attacker and victim program.They have proved damaging in a wide variety of settings [3, 78, 141, 143,152, 187, 191, 192]. In the cross-process setting, the attacker and victim aretwo separate processes running within the same operating system. In thecross-VM setting, the attacker and victim are two separate VMs runningco-resident (or co-tenant) on the same server. The cross-VM setting is ofparticular concern for public IaaS [152, 191] and PaaS clouds [192], whereit has been shown that an attacker can obtain co-residence of a maliciousinstance on the same server as a target [152].
2.5 Other Non-IaaS Public Clouds
Infrastructure-as-a-Service public clouds are not the only type of publicclouds that are available. A second type of public cloud that is increasingin popularity is the Platform-as-a-Service (PaaS) clouds that, unlike IaaSclouds, export a process-level abstraction that is higher up the softwarestack. Unlike IaaS where users are granted full control of a VM, PaaSproviders often managed compute tasks (or instances) for the execution ofhosted web applications, and allow multiple such instances to share thesame operating system. Typically, a PaaS user uploads application source
36
code (e.g., Java, PHP, Python, Ruby) which are then deployed in one ormore instance under the provider-managed host OS. Example of thesePaaS clouds include, Heroku [86], Google App Engine [67], OpenShift byRedHat [137], Amazon Elastic Beanstalk [32] etc.
There are two major classes of PaaS clouds. One, that provides arestricted interface as defined by the programming language runtimeslike Java Virtual Machine runtime or Python runtime interpreter. Theyoften are run in sandboxed environment where two different PaaS in-stances’ data and execution are isolated from each other and certain cloudproviders further restrict the runtime APIs for security reasons [69]. An al-ternative approach popular in PaaS clouds is to provides IaaS like flexibleinterface with either process-level isolation via file system access con-trols, or increasingly as Linux containers (e.g., LXC [117], OpenVZ [140]).Linux containers use existing process-level isolation mechanisms (likecgroups [51]) available in the Linux OS to run isolated systems (or contain-ers) that are managed by the same shared OS. They aim to provide flexibleVM like abstraction but do it higher up the stack. The system architectureis similar to what is pictured in Figure 2.4, where processes are replacedwith containers.
2.5.1 Container-based Clouds
An ardent reader would have noticed that a container-based PaaS cloudswhen compared to IaaS clouds, inherently do not provide (logical) isolationby design because of a lightweight, relatively flimsy process abstraction(refer to Figure 2.4). This is because, it is easier to ensure and enforce isola-tion at a lower level of the stack as the potential attack surface is naturallysmall with a well-defined interface with potentially untrusted code abovethe stack. On the other hand, a process-level abstraction has a large sharedsystem software with loosely defined and large system-call interface thatneeds to be secured (refer to [192] for a detailed discussion). Despite this
37
disadvantage, their increasingly popularity could be attributed to the sig-nificantly lower overhead of running an application inside a process (vs.inside a VM), and the ease of quickly launching and scaling PaaS instances.Emergence of application packaging ecosystems like Docker [58, 123] andopen source application orchestration systems like Kubernetes [110] thatease PaaS application management have also contributed to its popularity.Often cloud providers work around the security limitations of PaaS cloudsby running the PaaS instances of a single tenant inside a VM to get thebest of both worlds. In this dissertation, we primarily focus on IaaS cloudand leave PaaS clouds for future work.
38
3Threat Model
In this chapter we list the assumptions that we make about the public cloudprovider, the adversary and the victim and justify these assumptions. Thisdefines our threat model that we use throughout this dissertation.
3.1 Cloud Provider
Cloud provider is trusted. In our threat model, we assume that the cloudprovider is trusted and strives to provide best-effort security and perfor-mance guarantees. We also assume that the cloud provider does notcollude with adversaries, or have malicious insiders that may work for thebenefit of an adversary. This is a reasonable assumption if we considerthe level of trust we already place on the cloud provider. Hypervisorsthat manage VMs are under complete control of the cloud provider. As aresult they have access to all data (memory, disk, network) associated withany VM run on these hypervisors. In addition, the cloud provider alsohas physical access to the machines that run customer workloads. Further,it is in the best interest for the cloud provider to make its infrastructuretrustworthy to keep its business profitable. Hence, we trust the cloudprovider. Although designing systems obviates the necessity to trust thehypervisor is also interesting and challenging, it is not the focus of thisdissertation.
We assume a Type I hypervisor is employed by these cloud providers
39
and the hypervisor is trusted as much as the cloud provider who managesit. That is, the cloud provider is motivated to avoid poor configurationsof the hypervisor for the benefit of the users. For example, we assumethat Simultaneous MultiThreading (SMT) and memory deduplication orsharing are disabled in the hypervisor, which are known to enable severalclasses of co-location attacks (e.g., [1] and [188], respectively).
3.2 Attacker
Adversary as any cloud user. We assume that the attacker has no affili-ation of any form with the cloud provider. This partly follows from theabove assumption of trusting the cloud provider. But, it also means thatthe adversary has no internal knowledge of the workings of the publiccloud systems, (e.g., placement policies that are responsible for the VMplacements, hypervisor configurations, cloud user information). As thecloud provider is trusted to do the right thing, it is not necessary to dis-close any such knowledge to its customers. That said, it is only reasonableto assume that the adversary has access to any public knowledge that isexplicitly revealed by the provider (e.g., explicit documentation by theprovider) or implicitly accessible via usage of the cloud services throughthe existing interfaces that is available to any regular user.
Adversary is cost-conscious. We also assume that an adversary hasenough credentials to request a number of user accounts for these publicclouds. Even though there may be per-account limits that a cloud providerimposes (e.g., maximum of 30 active VMs per account), an adversary hasaccess to an unlimited number of accounts. This is reasonable as an at-tacker may have access to number of user credentials, i.e., stolen creditcards and email addresses, which is sufficient to create a large number ofuser accounts. Hence, the adversary has no limit on the number of VMs
40
he could launch at any given time. No resource limited cloud providercan defend against a resource unlimited adversary. For example, if acloud provider has a maximum of 50,000 servers for hosting user VMs,a resource unlimited adversary can always achieve co-location with avictim by launching the maximum number of VMs required to achieveco-location with every VM in the public cloud. Such a scenario modelsa naïve, brute adversary and there are alternative mechanisms to defendagainst such adversaries [125]. In this dissertation, we are concerned abouta sophisticated adversary who is resource conscious in terms of moneyand time spent on a successful attack. Such an adversary is also motivatedto do so because of the low risk of detection associated with such costconscious attacks.
Adversary controls VM’s software stack. The adversary controls theentire software stack of its instances (all layers above the hypervisor),including the guest operating system and applications. Although live VMmigration could be deployed by the cloud providers to improve isolation,we assume they are not used due to their disadvantages (refer to § 2.3).We later show through experiments that this configuration assumption isin fact true with many popular public cloud providers.
3.3 Victim
Victim reconnaissance. Regarding the information about the victim, weassume the adversary only has access to publicly available information asallowed by the cloud infrastructure. For instance, public IP address of avictim can be obtained by a DNS lookup and if the cloud infrastructureallows translation of a public IP address into an internal IP address, thenthe adversary has access to that information as well. Similarly, any publicinterface exposed by the victim’s VMs is both accessible and identifiable
41
by the attacker with help of certain tools (e.g., port scanning).In this dissertation, we do not explicitly explore the ways in which an
attacker can conduct victim reconnaissance. We assume that the adversaryhas access to tools to identify a set of target victims (and their VMs), andall associated information about the victim required for the attack. Forexample, to use an efficient launch strategy, the attacker might requireeither to know victim VMs’ launch time or to directly trigger their launches.The latter is possible by increasing load in order to cause the victim to scaleup by launching more instances as many users use auto-scaling featuresof the cloud (refer to § 2.1.3).
42
4Motivation
With the background on public clouds presented in Chapter 2, we areaware of the benefits of multi-tenancy and how the state-of-the-art cloudsystems share resources between disparate users. Although there is sig-nificant attention towards improving performance and efficiency of thepublic cloud infrastructure there is limited attention to evaluate the infras-tructure for security and their isolation guarantees. In this chapter we willmotivate three important problems that support our thesis: “the practice ofmulti-tenancy in public clouds demands stronger isolation guarantees betweenVMs in the presence of malicious users.” The three problems we focus in thisdissertation are:
1. Are co-location attacks impractical in modern clouds? (§ 5)
2. Are there unique opportunities for malicious users to exploit thelack of performance isolation for monetary or performance gains?(§ 6)
3. Can isolation be improved for security against malicious VMs with-out compromising the efficiency benefits of sharing? (§ 7)
In the following sections, we will motivate why these questions areimportant to answer and why it is important to do so now.
43
4.1 Evaluating Modern Clouds for Co-locationAttacks
As we mentioned earlier, recall that co-location attacks involve two steps:place and breach. The side-channel attacks are examples of the breachstep, which breaks the isolation boundary imposed by the hypervisor tosteal secrets. Less understood is the ability of adversaries to arrange for co-residency in the first place. In general, doing so consists of using a launchstrategy together with a mechanism for co-residency detection. Here a launchstrategy is a clever invocation of the cloud interface that increases thechances of co-location. As no cloud provider share co-residency status oftwo disparate VMs, the co-residency detection mechanism helps in learn-ing whether a launch strategy was successful in achieving co-residencywith the victim VM(s).
The only prior work on obtaining co-residency [152] exposed that Ama-zon EC2 was vulnerable to simple network-topology-based co-residencychecks and simple launch strategies like launching 20 VMs at the time ofthe victim VM launch. When such simple, advantageous launch strategiesexist, we say the cloud suffers from a placement vulnerability. Since then,Amazon has made several changes to their infrastructure, including im-proving placement policies and removing the ability to do the simplestco-residency check. It should be noted that there are several other popularpublic clouds besides Amazon EC2 that hosts sensitive customer applica-tions. Whether placement vulnerabilities exist in other public clouds has,to the best of our knowledge, never been explored.
The current state of the public clouds begs the question: is VM co-location possible in modern security-hardened clouds? To motivate thisquestion, we will take a closer look at two aspects of modern clouds: 1.why prior work on co-location detection no longer work, giving a falsesense of security to these attacks, 2. why we need a systematic study of
44
placement policies for testing their resilience to co-location attacks.
4.1.1 Placement Policies used in Public Clouds
When a user launches a VM, the cluster scheduler chooses the physicalhost in the whole datacenter to provision the VM. The algorithm thatdecides this is called the VM placement algorithm and the resulting VM-to-host mapping we call the VM placement. The placement for a specificvirtual machine may depend on many factors: the load on each machine,the number of machines in the data center, the number of concurrent VMlaunch requests, etc. The specifics of these factors that influence the VMplacement form the placement policy.
VM placement algorithms used in public clouds often aim to increasedata center efficiency, quality of service, or both by realizing some placementpolicy. For instance, a policy that aims to increase data center utilizationmay pack launched VMs on a single machine before choosing the nextmachine (called stacking). On the other hand, in order to avoid interfer-ence between similar workloads running inside VMs of the same user oravoid dependent failures, provider may also choose to spread the VMs ondifferent hosts. Policies may vary across cloud providers, and even withina provider.
Public cloud placement policies, although undocumented, often exhibitbehavior that is externally observable. One example is parallel placementlocality [152], in which VMs launched from different accounts within ashort time window are often placed on the same physical machine. Twoinstances launched sequentially, where the first instance is terminatedbefore the launch of the second one, are often placed on the same physicalmachine, a phenomenon called sequential placement locality [152]. This maycorrespond to a policy which optimizes for VM-image to machine affinity,to speed up provision by using the already cached VM image and/or diskstate in that host.
45
An adversary could capitalize on these advantageous strategies thatexploit aspects of the placement policy. This in turn could benefit the adver-sary by reducing the cost and risk of detection of such attacks. Surprisingly,there here has been no study that investigated the security aspect of theseefficiency-optimized placement policies. Although these placement poli-cies and their associated placement behaviors are not explicitly exposedby the cloud provider, they can be systematically measured with carefulexperiments. Understanding the state of the art placement policies helpboth drive future works on designing a placement policy with the rightbalance between efficiency and security, and also provide a framework forsystematically evaluating the new and improved placement policies in thefuture.
4.1.2 Prior Work on Co-location Detection
Ristenpart et al. [152] proposed several co-residency detection techniquesand used them to identify several launch strategies in Amazon EC2. Asco-resident status is not reported directly by the cloud provider, thesedetection methods usually exploit side-channels (either logical or perfor-mance side-channels described in Section 2.4). Ristenpart et al. discovereda logical side-channel via shared IP address namespace used in AmazonEC2. Particularly, each VM is assigned two IP addresses, a public IP addressfor communication over the Internet, and a private or internal IP addressfor intra-datacenter communications. The EC2 cloud infrastructure al-lowed translation of public IP addresses to their internal counterparts.This translation revealed the topology of the internal data center network,which allowed a remote adversary to map the entire public cloud infras-tructure and determine, for example, the availability zone and instancetype of a victim. Furthermore, co-resident VMs tended to have adjacentinternal IP addresses.
Similarly, a performance side-channel over the network has also been
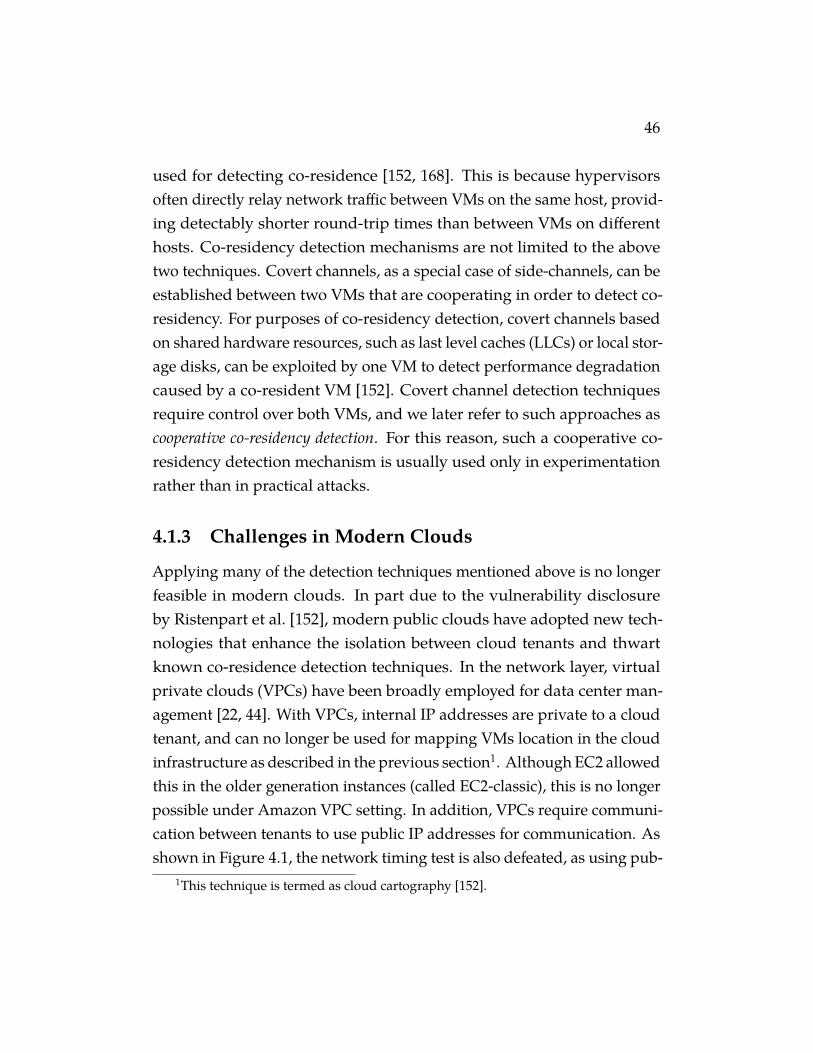
46
used for detecting co-residence [152, 168]. This is because hypervisorsoften directly relay network traffic between VMs on the same host, provid-ing detectably shorter round-trip times than between VMs on differenthosts. Co-residency detection mechanisms are not limited to the abovetwo techniques. Covert channels, as a special case of side-channels, can beestablished between two VMs that are cooperating in order to detect co-residency. For purposes of co-residency detection, covert channels basedon shared hardware resources, such as last level caches (LLCs) or local stor-age disks, can be exploited by one VM to detect performance degradationcaused by a co-resident VM [152]. Covert channel detection techniquesrequire control over both VMs, and we later refer to such approaches ascooperative co-residency detection. For this reason, such a cooperative co-residency detection mechanism is usually used only in experimentationrather than in practical attacks.
4.1.3 Challenges in Modern Clouds
Applying many of the detection techniques mentioned above is no longerfeasible in modern clouds. In part due to the vulnerability disclosureby Ristenpart et al. [152], modern public clouds have adopted new tech-nologies that enhance the isolation between cloud tenants and thwartknown co-residence detection techniques. In the network layer, virtualprivate clouds (VPCs) have been broadly employed for data center man-agement [22, 44]. With VPCs, internal IP addresses are private to a cloudtenant, and can no longer be used for mapping VMs location in the cloudinfrastructure as described in the previous section1. Although EC2 allowedthis in the older generation instances (called EC2-classic), this is no longerpossible under Amazon VPC setting. In addition, VPCs require communi-cation between tenants to use public IP addresses for communication. Asshown in Figure 4.1, the network timing test is also defeated, as using pub-
1This technique is termed as cloud cartography [152].
47
0
0.1
0.2
0.3
0.4
0.5
0.6
0.7
0.8
0.9
1
0 0.4 0.8 1.2 1.6 2 2.4 2.8
Fre
quency (
%)
Minimum Network RTT (ms)
Non-coresidentCo-resident
a: GCE
0
0.05
0.1
0.15
0.2
0.25
0.3
0.35
0.4
0 0.4 0.8 1.2 1.6 2 2.4 2.8
Fre
quency (
%)
Minimum Network RTT (ms)
Non-coresidentCo-resident
b: EC2
0
0.05
0.1
0.15
0.2
0.25
0.3
0.35
0 0.4 0.8 1.2 1.6 2 2.4 2.8
Fre
quency (
%)
Minimum Network RTT (ms)
Non-coresidentCo-resident
c: Azure
Figure 4.1: Histogram of minimum network round trip times betweenpairs of VMs. The frequency is represented as a fraction of total number of pairs ineach category. The figure does not show the tail of the histogram.
lic IP addresses seems to involve routing in the data center network ratherthan short-circuiting through the hypervisor. Here, the ground-truth ofco-residency is detected using a memory-based covert-channel (describedlater in Chapter 5). Notice that there is no clear distinction between thefrequency distribution of the network round trip times of co-resident andnon-coresident pairs on all three clouds.
In the system layer, persistent storage using local disks is no longer thedefault. For instance, many Amazon EC2 instance types do not supportlocal storage [12]; GCE and Azure provide only local Solid State Drives
48
(SSD) [38, 75], which are less susceptible to detectable delays from longseeks. In addition, covert channels based on last-level caches [152, 168, 184,190] are less reliable in modern clouds that use multiple CPU packages.Two VMs sharing the same machine may not share LLCs to establish thecovert channel. Hence, these LLC-based covert-channels can only capturea subset of co-resident instances.
As a result of these technology changes, none of the prior techniquesfor detecting co-residency reliably work in modern clouds, compellingus to develop new approaches for our study. Apart from the lack of aworking co-residency detection mechanism, there is no prior work thatsystematically evaluated the placement policies employed in public cloudsfor placement vulnerabilities.
Summary. Without a working co-residency mechanism, one may pre-maturely conclude that co-location attacks are impractical in security-hardened modern clouds. But taking a perspective of a highly motivatedattacker, it is now more important to answer the question: Are co-locationattacks impractical in modern clouds? If yes, it is a wakeup call for securityresearchers to concentrate on other important problems considering aplethora of previous works on co-location [93, 152, 182, 184, 188, 191, 192,195]. If no, how could one evaluate different public clouds for placementvulnerability and quantify the cost such attacks? In Chapter 5 we showthat not only that three most popular public clouds are vulnerable to VMplacement but also that such placements are very practical and extremelycheap to exploit in a live cloud.
49
4.2 (Lack of) Performance Isolation betweenVMs
Cloud computing provides high efficiency in part by multiplexing mul-tiple customer workloads onto a single physical machine. For example,Amazon’s Elastic Compute Cloud (EC2) [19] runs multiple customer vir-tual machines (VMs) on a single host. For small instances, they offer eachguest VM roughly 40% of a single CPU by time slicing. Similarly, accessto the local disk, network, memory, and cache are all shared by virtualmachines from multiple customers (as described in Section 2.2.1).
However, with this efficiency comes performance interference2. Whentwo customer applications share a machine, they contend for access toresources. Existing hardware and software virtualization mechanismsdo not provide perfect performance isolation. For example, running twoapplications that make heavy use of memory bandwidth can degradethe performance of both. Past work has demonstrated the existence andamount of this interference [41, 129].
As a result, there have been numerous proposals on how to constructhypervisors or processors that better isolate customer applications fromeach other. For example, fine-grained accounting of CPU usage [79], net-work traffic [158] or disk-queue utilization [77] can decrease the amount ofinterference. Unfortunately, the inherent tension between efficiency andisolation means that, in practice, cloud computing systems continue toprovide poor isolation as witnessed below.
Extent of Resource Contention
With the goal of determining the worst-case resource contention betweentwo VMs, we ran experiments on a local Xen testbed. The testbed machine
2We use performance interference and resource contention interchangeably.
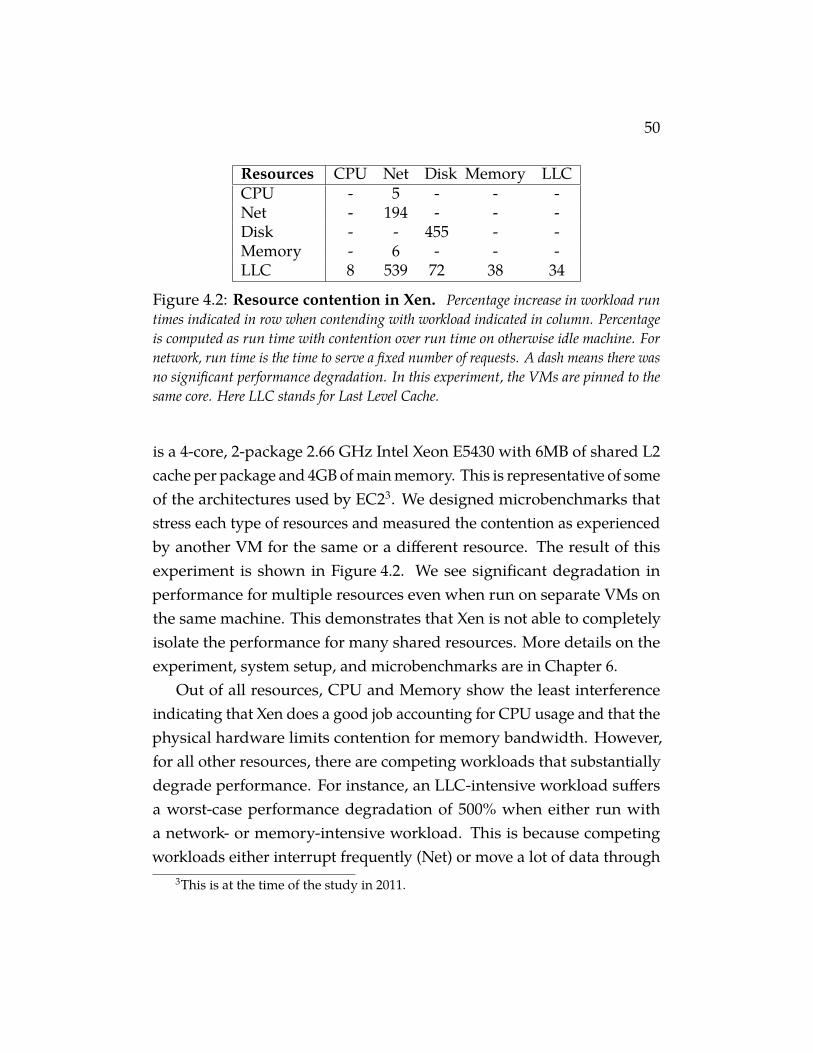
50
Resources CPU Net Disk Memory LLCCPU - 5 - - -Net - 194 - - -Disk - - 455 - -Memory - 6 - - -LLC 8 539 72 38 34
Figure 4.2: Resource contention in Xen. Percentage increase in workload runtimes indicated in row when contending with workload indicated in column. Percentageis computed as run time with contention over run time on otherwise idle machine. Fornetwork, run time is the time to serve a fixed number of requests. A dash means there wasno significant performance degradation. In this experiment, the VMs are pinned to thesame core. Here LLC stands for Last Level Cache.
is a 4-core, 2-package 2.66 GHz Intel Xeon E5430 with 6MB of shared L2cache per package and 4GB of main memory. This is representative of someof the architectures used by EC23. We designed microbenchmarks thatstress each type of resources and measured the contention as experiencedby another VM for the same or a different resource. The result of thisexperiment is shown in Figure 4.2. We see significant degradation inperformance for multiple resources even when run on separate VMs onthe same machine. This demonstrates that Xen is not able to completelyisolate the performance for many shared resources. More details on theexperiment, system setup, and microbenchmarks are in Chapter 6.
Out of all resources, CPU and Memory show the least interferenceindicating that Xen does a good job accounting for CPU usage and that thephysical hardware limits contention for memory bandwidth. However,for all other resources, there are competing workloads that substantiallydegrade performance. For instance, an LLC-intensive workload suffersa worst-case performance degradation of 500% when either run witha network- or memory-intensive workload. This is because competingworkloads either interrupt frequently (Net) or move a lot of data through
3This is at the time of the study in 2011.
51
the cache (Memory).
Summary. We found that certain cache-sensitive workloads take 5x longerwhen contending with other memory-intensive workloads. Unlike in pri-vate data centers, resource contention in public clouds arises betweendisparate customers. Unique to the public cloud setting, then, is the incen-tive for greedy customers to attempt to free up this resource contention fortheir application. This is because, irrespective of the performance degrada-tion perceived by the VMs, cloud providers charge all the VMs under thesame simple pricing model – pay per unit time (described in Section 2.1).This gives rise to the question: In the presence of performance interference,can a malicious user steal resources by interfering with neighboring VMs? Anaïve example of an attack would be crashing co-resident VMs, but thisrequires knowledge of an exploitable vulnerability and would be easilydetectable. We are interested in whether there exist more subtle strategiesfor freeing up resources. In Chapter 6 we show that a new class of attackscalled Resource-Freeing Attacks (RFAs) that exploit resource contentionto improve ones own performance at the expense of others.
4.3 Need for Defenses against Cross-VMSide-channels
A poorly designed placement algorithm that is vulnerable to adversarialVM co-location may still be safe from co-location attacks if the hypervisormultiplexing multi-tenant VMs on a single host provides better perfor-mance isolation. As we saw above, existing hypervisors do not provideperfect because of the tension between efficiency (via sharing) and isola-tion. In this section, we will take a close look at the particular problemof cross-VM side-channels (refer to Section 2.4 for background) and findthat there may be new unexplored directions to improve isolation without
52
compromising on efficiency.
4.3.1 An Example Cross-VM Side-channel
Zhang, Juels, Reiter, and Ristenpart (ZJRR) [191] demonstrated the firstcross-VM access-driven side-channel attack with sufficient granularity toextract ElGamal secret keys from the victim. They use a version of theclassic Prime+Probe technique [141]: the attacker first primes the cache(instruction or data) by accessing a set of addresses that fill the entire cache.It then yields the CPU, causing the hypervisor to run the victim, whichbegins to evict the attacker’s data or instructions from various cache. Asquickly as possible, the attacker preempts the victim, and then probes thecache by again accessing a set of addresses that cover the entire cache.By measuring the speed of each cache access, the attacker can determinewhich cache lines were displaced by the victim, and hence learn someinformation about which addresses the victim accessed.
The ZJRR attack builds off a long line of cross-process attacks (c.f., [3,4, 78, 141, 143]) all of which target per-core microarchitectural state. Whensimultaneous multi-threading (SMT) is disabled (as is typical in cloudsettings), such per-core attacks require that the attacker time-shares aCPU core with the victim. In order to obtain frequent observations ofshared state attacks abuse scheduler mechanisms that prioritize interactiveworkloads in order to preempt the victim. For example, ZJRR use inter-processor interrupts to preempt every 16µs on average. In their cross-process attack, Bangerter et al. abuse the Linux process scheduler [78].
Requirements for a successful attack. In this context, the best knownattacks rely on:
1. Shared per-core state that is accessible to the attacker and that has visi-bly different behavior based on its state, such as caches and branchpredictors.
53
2. The ability to preempt the victim VM at short intervals to allow only afew changes to that hardware state.
3. Access to a system clock with enough resolution to distinguish micro-architectural events (e.g., cache hits and misses).
These conditions are all true in contemporary multi-tenant cloud settings,such as Amazon’s EC2. Defenses can target any of these dependencies,and we discuss some existing approaches next.
4.3.2 Prior Defenses and their Deficiencies
Past work on defenses against such side-channel attacks identified theabove requirements for successful side-channels and tried to obviate oneor more of the above necessary conditions for attacks. We classify andsummarize these techniques below.
An obvious solution is to prevent an attacker and victim from sharinghardware, which we call hard isolation. Partitioning the cache in hardwareor software prevents its contents from being shared [103, 149, 157, 179,180]. This requires special-purpose hardware or loss of various usefulfeatures (e.g., large pages) and thus limits the adoption in a public cloudenvironment. Assigning VMs to run on different cores avoids sharing ofper-core hardware [101, 118, 164], and assigning them to different serversavoids sharing of any system hardware [152]. A key challenge here isidentifying an attacker and victim in order to separate them; otherwisethis approach reduces to using dedicated hardware for each customer,reducing utilization and thus raising the price of computing.
Beyond hard isolation are approaches that modify hardware to addnoise, either in the timing or by obfuscating the specific side-channel in-formation. The former can be accomplished by removing or modifyingtimers [115, 120, 172] to prevent attackers from accurately distinguishingbetween microarchitectural events, such as a cache hit and a miss. For
54
example, StopWatch [115] removes all timing side-channels and incurs aworst-case overhead of 2.8x for network intensive workloads. Specializedhardware-support could also be used to obfuscate and randomize pro-cessor cache usage [109, 180]. All of these defenses either result in loss ofhigh-precision timer or require hardware changes.
Goals. All the above mentioned prior works either compromise on ef-ficiency from resource sharing or add significant overhead or result inloss of a valuable feature making it hard for cloud providers to deploy thedefense mechanism. For the same reason, none of the previously proposeddefense mechanisms have not be deployed in public clouds to the best ofour knowledge. Hence, it is important to address this lack of a deployableand effective defense mechanism against side-channels. The desirableproperties of such a defense mechanism include:
1. Retain benefits of sharing, i.e., hard-isolation is not an option,
2. Do not compromise on any valuable features (e.g., high-resolutiontimers),
3. Easily deployable for cloud provider, i.e., no changes to hardware,
4. Zero or negligible overhead on legitimate workloads.
Notice that in addition to sharing resources and having access to fine-grained clocks, shared-core side-channel attacks also require the abilityto measure the state of the cache frequently. For example, the ZJRR attackon ElGamal preempted the victim every 16µs on average [191]. With lessfrequent interruptions, the attacker’s view of how hardware state changesin response to a victim becomes obscured. Perhaps surprisingly, then, isthe lack of any investigation of the relationship between CPU schedulingpolicies and side-channel efficacy. In particular, scheduling may enablewhat we call soft isolation: limiting the frequency of potentially dangerous
55
cross-VM interactions. (We use the adjective soft to indicate allowance ofoccasional failures, analogous to soft real-time scheduling.)
Summary. Although better co-location aware cluster scheduler may in-crease the cost of a co-location attack, VM co-location is always possiblewhen the cloud provider is resource limited. This leads to the inevitableneed to strengthen isolation between VMs at the hypervisor. Perhapssurprisingly, then, is the lack of a low overhead defense mechanism thatdoes not compromise on efficiency benefits of sharing or other valuablefeatures of the cloud. This raises the important question, is it possible todesign a hypervisor that achieves both improved isolation without compromis-ing efficiency? In Chapter 7 we try to answer this question and design asimple hypervisor CPU scheduler primitive that achieves these goals bytaking advantage of the above requirements of the cross-VM side-channelattacks. This gives rise to a new design principle called soft-isolation whereinstead of strictly partitioning resources, the system limits and managesdangerous interactions between multi-tenant VMs.
56
5Co-location in Public Clouds
In this chapter, we provide a framework to systematically evaluate publicclouds for placement vulnerabilities and show that three popular publiccloud providers may be vulnerable to co-location attacks. More specifically,we set out to answer four questions:
• Can co-residency be effectively detected in modern public clouds?
• Are known launch strategies [152] still effective in modern clouds?
• Are there any new exploitable placement vulnerabilities?
• Can we quantify the cost (time and money) of an attack for an adver-sary to achieve a certain probability of success?
We started this study by exploring the efficacy of prior co-residencytests, which we described in Chapter 4.1.2. This motivated us to developmore reliable tests for our placement study (§ 5.2.1). We also find a noveltest to detect co-residency with VMs uncontrolled by the attacker by justusing their public interface even when they are behind a load balancer(§ 5.2.3).
We use multiple customer accounts across three popular cloud provi-ders, launch VM instances under different scenarios that may affect theplacement algorithm, and test for co-residency between all launched in-stances. We analyze three popular cloud providers, Amazon Elastic Com-pute Cloud (EC2) [9], Google Compute Engine (GCE) [73] and Microsoft
57
Azure (Azure) [37], for vulnerabilities in their placement algorithm. Afterexhaustive experimentation with each of these cloud providers and at least190 runs per cloud provider, we show that an attacker can still successfullyarrange for co-location (§ 5.3). We find new launch strategies in these threeclouds that obtain co-location faster (10x higher success rate) and cheaper(up to $114 less) when compared to a secure reference placement policy.
Before describing the details of the study, we start by defining termsthat we will frequently encounter in the study in the next section.
5.1 Definitions
VM placement. The provider’s VM launch service receives from a clienta desired set of parameters describing the configuration of the VM. Theservice then allocates resources for the new VM; this process is called VMprovisioning. We are most interested in the portion of VM provisioningthat selects the physical host to run a VM, which we call the VM placementalgorithms. The resulting VM-to-host mapping we call the VM placement.The placement for a specific virtual machine may depend on many factors:the load on each machine, the number of machines in the data center, thenumber of concurrent VM launch requests, etc.
Placement variables. While cloud providers do not generally publishtheir VM placement algorithms, there are several variables under thecontrol of the user that could affect the VM placement, such as time-of-day, requested data center, and number of instances. A list of somenotable parameters is shown in Table 5.1. By controlling these variables,an adversary can partially influence the placement of VMs on physicalmachines that may also host a target set of VMs. We call these variablesplacement variables and the set of values for these variables form a launchstrategy. An example launch strategy is to launch 20 instances 10 minutes
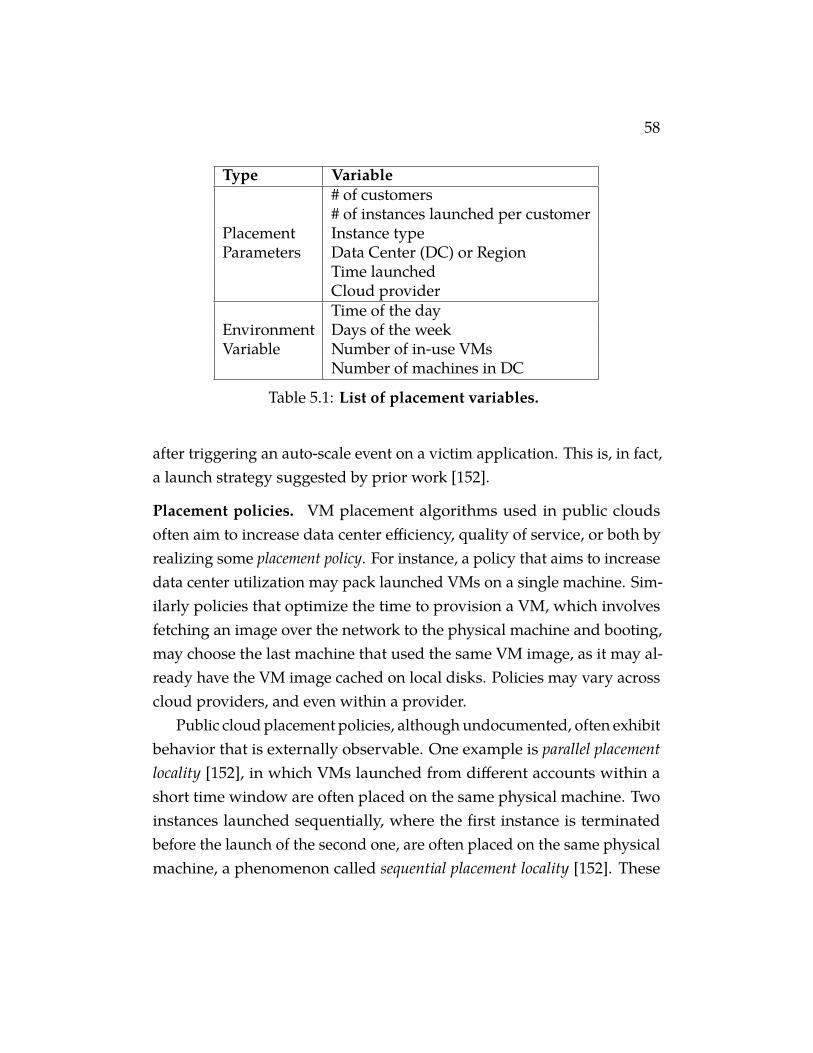
58
Type Variable# of customers# of instances launched per customer
Placement Instance typeParameters Data Center (DC) or Region
Time launchedCloud providerTime of the day
Environment Days of the weekVariable Number of in-use VMs
Number of machines in DC
Table 5.1: List of placement variables.
after triggering an auto-scale event on a victim application. This is, in fact,a launch strategy suggested by prior work [152].
Placement policies. VM placement algorithms used in public cloudsoften aim to increase data center efficiency, quality of service, or both byrealizing some placement policy. For instance, a policy that aims to increasedata center utilization may pack launched VMs on a single machine. Sim-ilarly policies that optimize the time to provision a VM, which involvesfetching an image over the network to the physical machine and booting,may choose the last machine that used the same VM image, as it may al-ready have the VM image cached on local disks. Policies may vary acrosscloud providers, and even within a provider.
Public cloud placement policies, although undocumented, often exhibitbehavior that is externally observable. One example is parallel placementlocality [152], in which VMs launched from different accounts within ashort time window are often placed on the same physical machine. Twoinstances launched sequentially, where the first instance is terminatedbefore the launch of the second one, are often placed on the same physicalmachine, a phenomenon called sequential placement locality [152]. These
59
placement behaviors are artifacts of the two placement policies describedearlier, respectively.
Other examples of policies and resulting behaviors exist as well. VMslaunched from the same accounts may either be packed on the same phys-ical machine to maximize locality (and hence co-resident with themselves)or striped across different physical machines to maximize redundancy(and hence never co-resident with themselves). In the course of normalusage, such behaviors are unlikely to be noticed, but they can be measuredwith careful experiments.
Launch strategies. An adversary can exploit placement behaviors toincrease the likelihood of co-locating with target victims. As pointedout by Ristenpart et al. [152], parallel placement locality can be exploitedby triggering a scale-up event on target victim by increasing their load,which will cause more victim VMs to launch. The adversary can thensimultaneously (or after a time lag) launch multiple VMs some of whichmay be co-located with the newly launched victim VM(s).
Cost of a launch strategy. Quantifying the cost of a launch strategy isstraightforward: it is the cost of launching a number of VMs and runningtests to detect co-residency with one or more target victim VMs. To beprecise, the cost of a launch strategy S is given byCS = a·P(atype)·Td(v,a).Here a is the number of attacker VMs of type atype launched to get co-located with one of the v victim VMs. P(atype) is the price of runningone VM of type atype for a unit time. Td(a, v) is the time (in billing units)to detect co-residency between all pairs of a attackers and v victim VMs,excluding pairs within each group. For simplicity, we assume that theattacker is running all instances until the last co-residency check completesor that, equivalently. When the time to finish co-residency checks is withinthe granularity of one unit of billing time (e.g., one hour on EC2), this isequivalent to a more refined model.
60
Reference placement policy. In order to define placement vulnerability,we need a yardstick to compare various placement policies and the launchstrategies that they may be vulnerable to. To aid this purpose, we definea simple reference placement policy that has good security propertiesagainst co-residency attacks and use it to gauge the placement policiesused in public clouds. Let there beNmachines in a data center and let eachmachine have unlimited capacity. Given a set of unordered VM launchrequests, the mapping of each VM to a machine follows a uniform randomdistribution. Let there be v victim VMs assigned to v unique machinesamong N, where v � N. The probability of at least one collision (i.e.co-residency) under the random placement policy and the above attackscenario when attacker launches a instances is given by 1−
(1−v/N
)a. Wecall this probability the reference probability.1 Recall that for calculatingthe cost of a launch strategy under this reference policy, we also needto define the price function, P(vmtype). For simplicity, we use the mostcompetitive minimum price offered by any cloud provider as the price forthe compute resource under the reference policy. For example, at the timeof this study, Amazon EC2 offered t2.small instances at $0.026 per hourof instance activity, which was the cheapest price across all three cloudsconsidered in this study.
Note that the reference placement policy makes several simplifyingassumptions, but these only benefit the attacker. This is conservative as wewill compare our experimental results to the best possible launch strategyunder the reference policy. For instance, the assumption on unlimitedcapacity of the servers only benefits the attacker as it never limits thenumber of victim VMs an attacker could potentially co-locate with. We usea conservative value of 1000 forN, which is at least an order-of-magnitudeless than the number of servers (50,000) in the smallest reported AmazonEC2 data centers [23]. Similarly, the price function of this placement policy
1This probability event follows a hypergeometric distribution.
61
also favors an attacker as it provides the cheapest price possible in themarket even though in reality a secure placement policy may demand ahigher price. Hence, it would be troubling if the state-of-the-art placementpolicies used in public clouds does not measure well even against such aconservative reference placement policy.
5.1.1 Defining Placement Vulnerability
Putting it all together, we define two metrics to gauge any launch strategyagainst a placement policy: (i) normalized success rate, and (ii) cost-benefit.The normalized success rate is the success rate of the launch strategy inthe cloud under test normalized to the success rate of the same strategyunder the reference placement policy. The cost-benefit of a strategy is theadditional cost that is incurred by the adversary in the reference placementpolicy to achieve the same success rate as the strategy in the placementpolicy under test. We define that a placement policy has a placementvulnerability if and only if there exists a launch strategy with a normalizedsuccess rate that is greater than 1.
Note that the normalized success rate quantifies how easy it is to getco-location. On the other hand, the cost benefit metric helps to quantifyhow cheap it is to get co-location compared to a more secure placementpolicy. These metrics can be used to compare launch strategies underdifferent placement policies, where a higher value for any of these metricsindicate that the placement policy is relatively more vulnerable to thatlaunch strategy. An ideal placement policy should aim to reduce both thesuccess rate and the cost benefit of any strategy.
Study overview. In this study, we develop a framework to systematicallyevaluate public clouds against launch strategies and uncover previouslyunknown placement behaviors. We approach this study by (i) identifyinga set of placement variables that characterize a VM, (ii) enumerating the
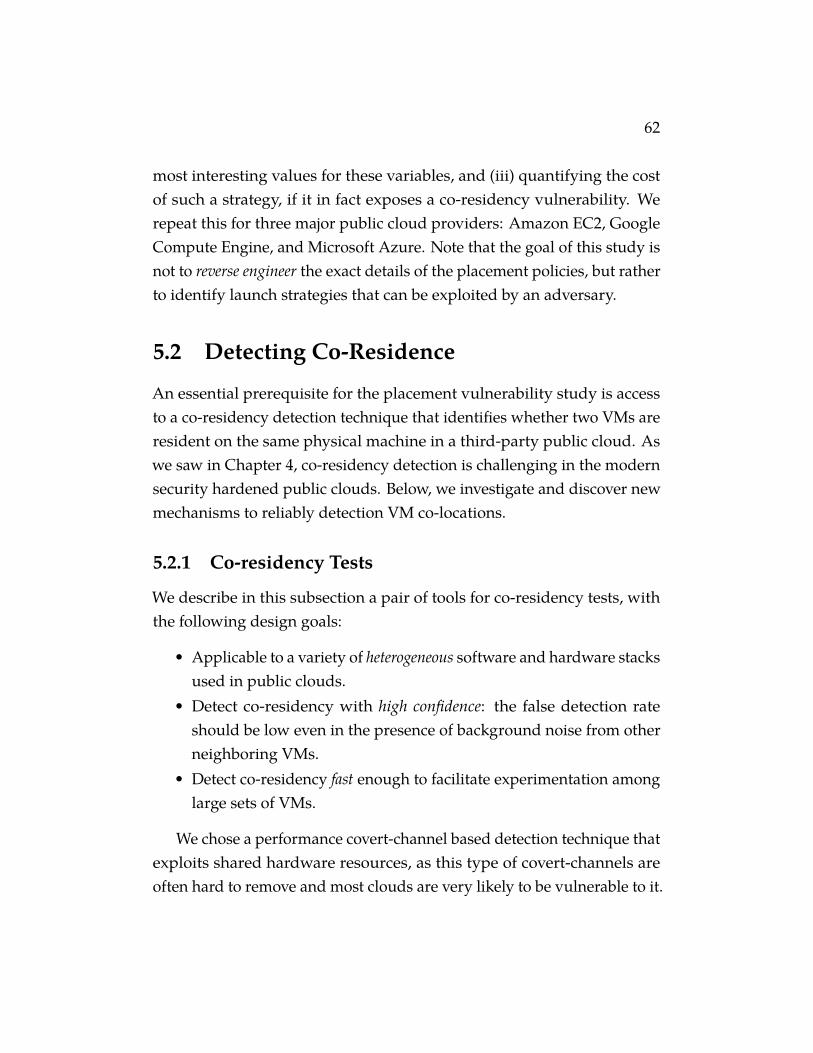
62
most interesting values for these variables, and (iii) quantifying the costof such a strategy, if it in fact exposes a co-residency vulnerability. Werepeat this for three major public cloud providers: Amazon EC2, GoogleCompute Engine, and Microsoft Azure. Note that the goal of this study isnot to reverse engineer the exact details of the placement policies, but ratherto identify launch strategies that can be exploited by an adversary.
5.2 Detecting Co-Residence
An essential prerequisite for the placement vulnerability study is accessto a co-residency detection technique that identifies whether two VMs areresident on the same physical machine in a third-party public cloud. Aswe saw in Chapter 4, co-residency detection is challenging in the modernsecurity hardened public clouds. Below, we investigate and discover newmechanisms to reliably detection VM co-locations.
5.2.1 Co-residency Tests
We describe in this subsection a pair of tools for co-residency tests, withthe following design goals:
• Applicable to a variety of heterogeneous software and hardware stacksused in public clouds.
• Detect co-residency with high confidence: the false detection rateshould be low even in the presence of background noise from otherneighboring VMs.
• Detect co-residency fast enough to facilitate experimentation amonglarge sets of VMs.
We chose a performance covert-channel based detection technique thatexploits shared hardware resources, as this type of covert-channels areoften hard to remove and most clouds are very likely to be vulnerable to it.
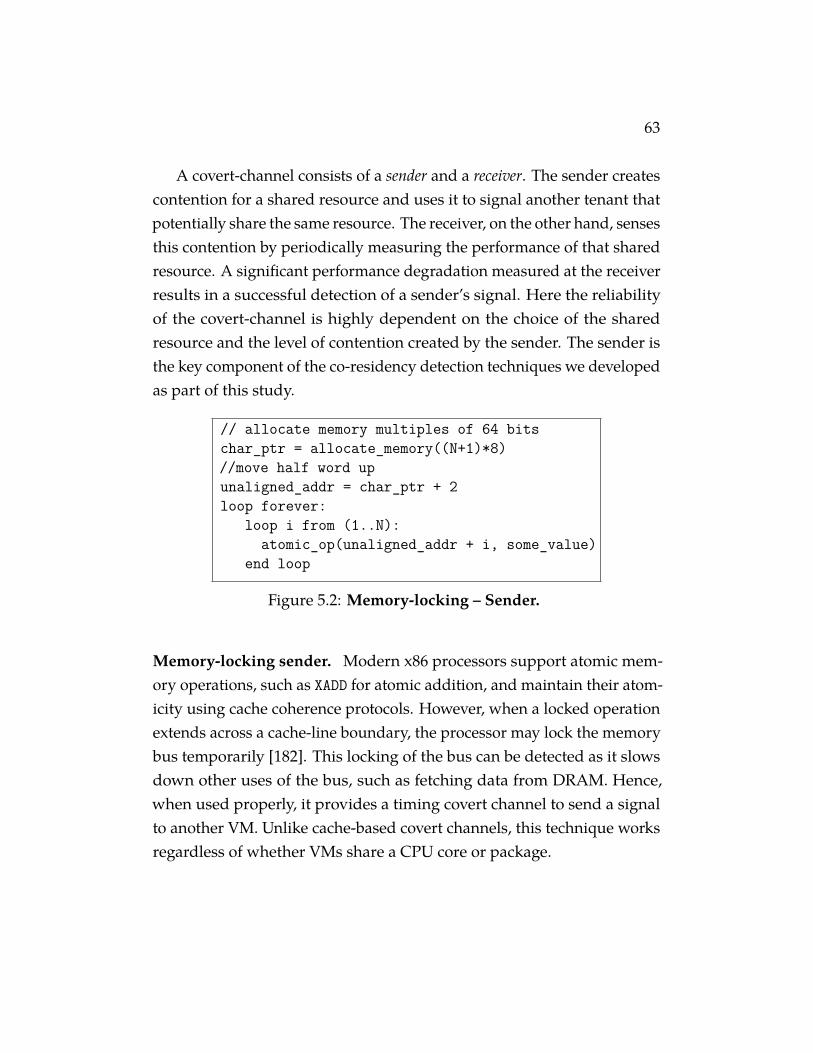
63
A covert-channel consists of a sender and a receiver. The sender createscontention for a shared resource and uses it to signal another tenant thatpotentially share the same resource. The receiver, on the other hand, sensesthis contention by periodically measuring the performance of that sharedresource. A significant performance degradation measured at the receiverresults in a successful detection of a sender’s signal. Here the reliabilityof the covert-channel is highly dependent on the choice of the sharedresource and the level of contention created by the sender. The sender isthe key component of the co-residency detection techniques we developedas part of this study.
// allocate memory multiples of 64 bitschar_ptr = allocate_memory((N+1)*8)//move half word upunaligned_addr = char_ptr + 2loop forever:
loop i from (1..N):atomic_op(unaligned_addr + i, some_value)
end loop
Figure 5.2: Memory-locking – Sender.
Memory-locking sender. Modern x86 processors support atomic mem-ory operations, such as XADD for atomic addition, and maintain their atom-icity using cache coherence protocols. However, when a locked operationextends across a cache-line boundary, the processor may lock the memorybus temporarily [182]. This locking of the bus can be detected as it slowsdown other uses of the bus, such as fetching data from DRAM. Hence,when used properly, it provides a timing covert channel to send a signalto another VM. Unlike cache-based covert channels, this technique worksregardless of whether VMs share a CPU core or package.
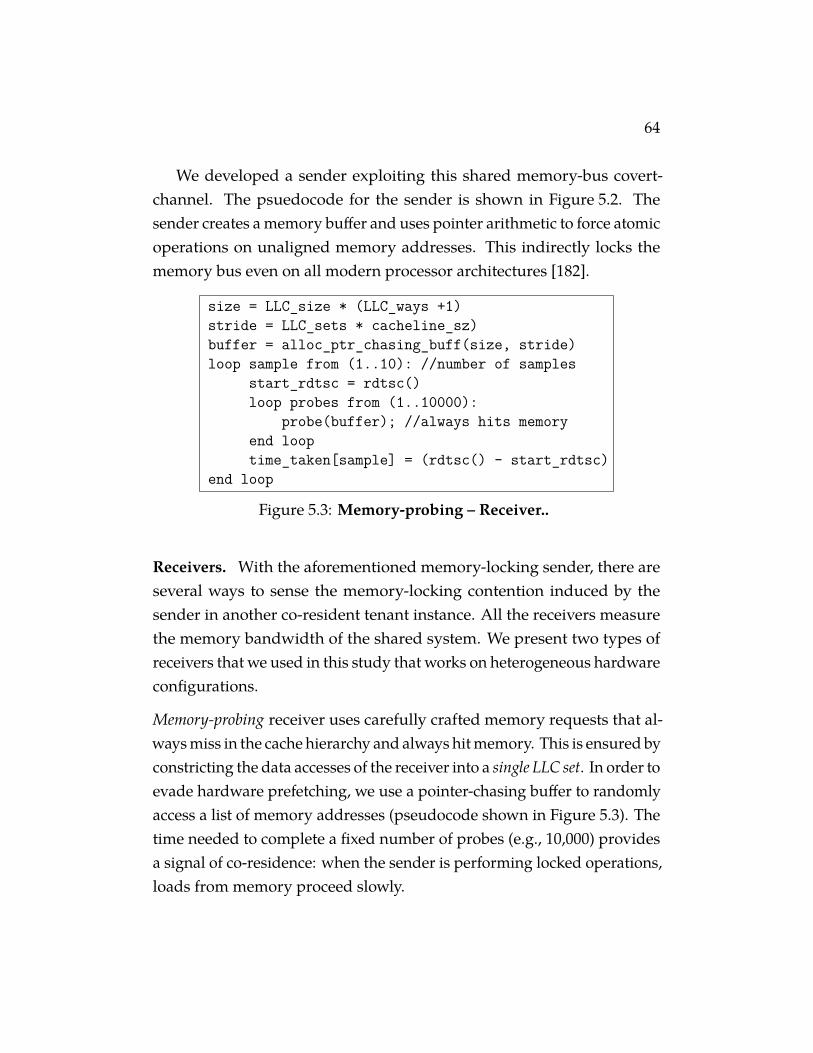
64
We developed a sender exploiting this shared memory-bus covert-channel. The psuedocode for the sender is shown in Figure 5.2. Thesender creates a memory buffer and uses pointer arithmetic to force atomicoperations on unaligned memory addresses. This indirectly locks thememory bus even on all modern processor architectures [182].
size = LLC_size * (LLC_ways +1)stride = LLC_sets * cacheline_sz)buffer = alloc_ptr_chasing_buff(size, stride)loop sample from (1..10): //number of samples
start_rdtsc = rdtsc()loop probes from (1..10000):
probe(buffer); //always hits memoryend looptime_taken[sample] = (rdtsc() - start_rdtsc)
end loop
Figure 5.3: Memory-probing – Receiver..
Receivers. With the aforementioned memory-locking sender, there areseveral ways to sense the memory-locking contention induced by thesender in another co-resident tenant instance. All the receivers measurethe memory bandwidth of the shared system. We present two types ofreceivers that we used in this study that works on heterogeneous hardwareconfigurations.
Memory-probing receiver uses carefully crafted memory requests that al-ways miss in the cache hierarchy and always hit memory. This is ensured byconstricting the data accesses of the receiver into a single LLC set. In order toevade hardware prefetching, we use a pointer-chasing buffer to randomlyaccess a list of memory addresses (pseudocode shown in Figure 5.3). Thetime needed to complete a fixed number of probes (e.g., 10,000) providesa signal of co-residence: when the sender is performing locked operations,loads from memory proceed slowly.
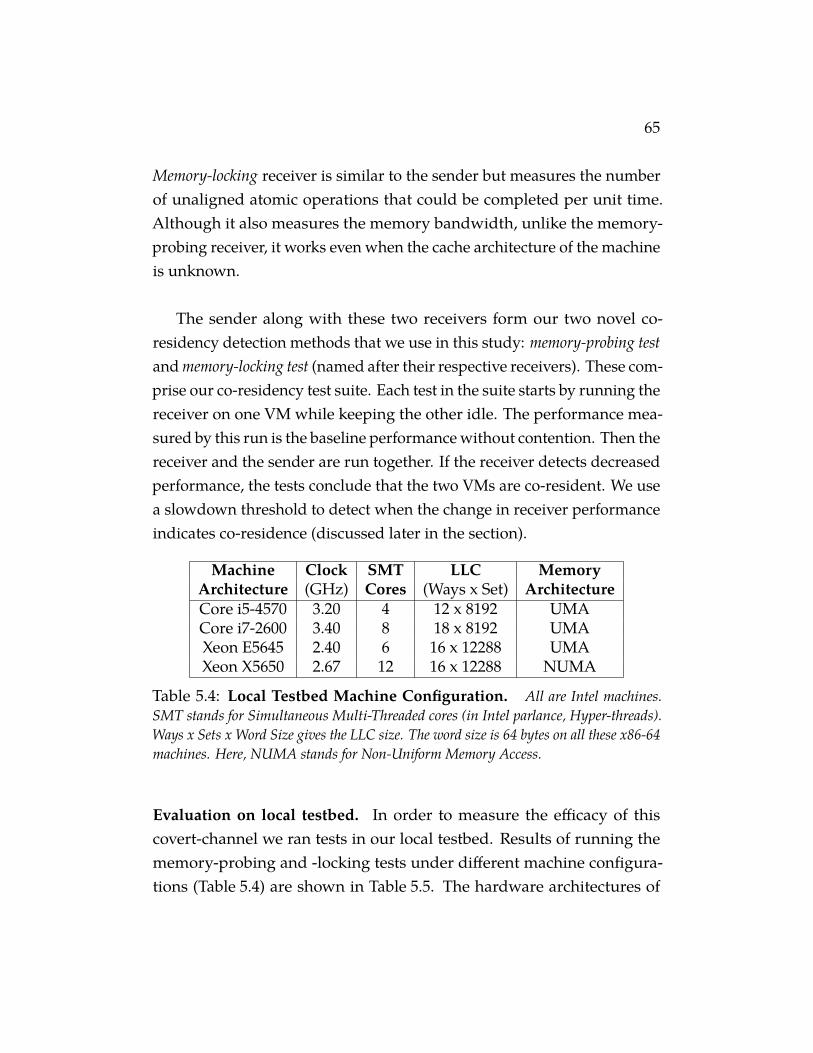
65
Memory-locking receiver is similar to the sender but measures the numberof unaligned atomic operations that could be completed per unit time.Although it also measures the memory bandwidth, unlike the memory-probing receiver, it works even when the cache architecture of the machineis unknown.
The sender along with these two receivers form our two novel co-residency detection methods that we use in this study: memory-probing testand memory-locking test (named after their respective receivers). These com-prise our co-residency test suite. Each test in the suite starts by running thereceiver on one VM while keeping the other idle. The performance mea-sured by this run is the baseline performance without contention. Then thereceiver and the sender are run together. If the receiver detects decreasedperformance, the tests conclude that the two VMs are co-resident. We usea slowdown threshold to detect when the change in receiver performanceindicates co-residence (discussed later in the section).
Machine Clock SMT LLC MemoryArchitecture (GHz) Cores (Ways x Set) ArchitectureCore i5-4570 3.20 4 12 x 8192 UMACore i7-2600 3.40 8 18 x 8192 UMAXeon E5645 2.40 6 16 x 12288 UMAXeon X5650 2.67 12 16 x 12288 NUMA
Table 5.4: Local Testbed Machine Configuration. All are Intel machines.SMT stands for Simultaneous Multi-Threaded cores (in Intel parlance, Hyper-threads).Ways x Sets x Word Size gives the LLC size. The word size is 64 bytes on all these x86-64machines. Here, NUMA stands for Non-Uniform Memory Access.
Evaluation on local testbed. In order to measure the efficacy of thiscovert-channel we ran tests in our local testbed. Results of running thememory-probing and -locking tests under different machine configura-tions (Table 5.4) are shown in Table 5.5. The hardware architectures of
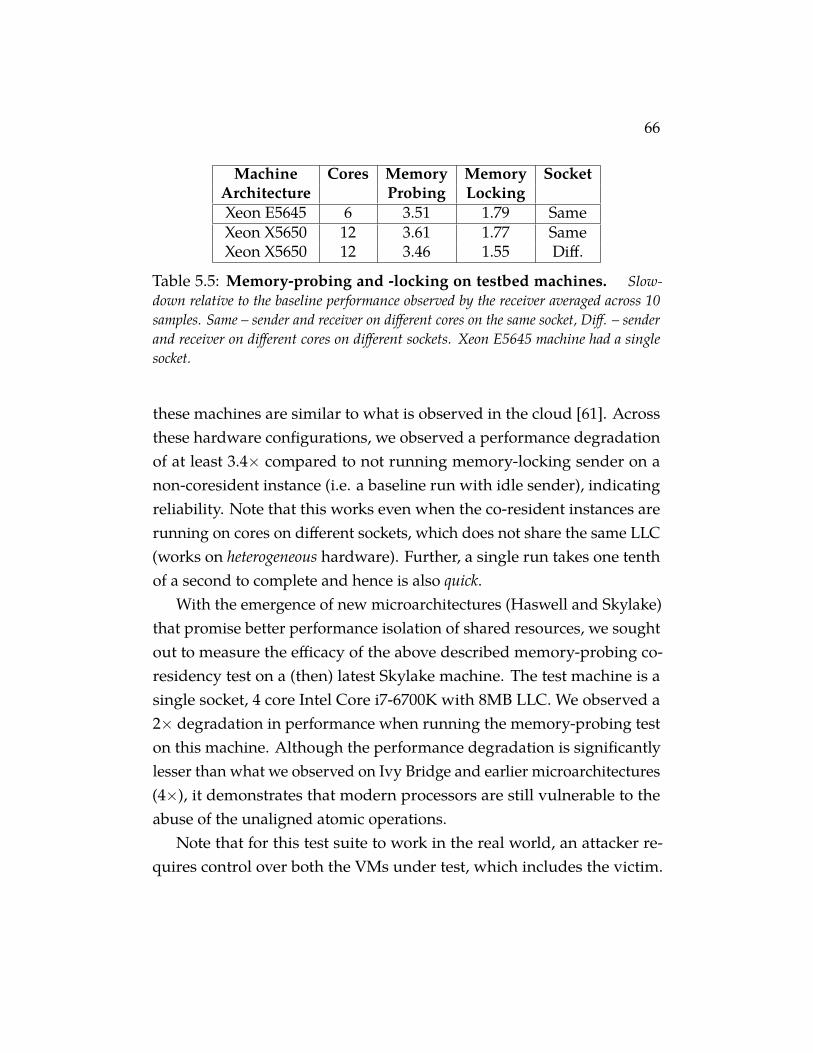
66
Machine Cores Memory Memory SocketArchitecture Probing LockingXeon E5645 6 3.51 1.79 SameXeon X5650 12 3.61 1.77 SameXeon X5650 12 3.46 1.55 Diff.
Table 5.5: Memory-probing and -locking on testbed machines. Slow-down relative to the baseline performance observed by the receiver averaged across 10samples. Same – sender and receiver on different cores on the same socket, Diff. – senderand receiver on different cores on different sockets. Xeon E5645 machine had a singlesocket.
these machines are similar to what is observed in the cloud [61]. Acrossthese hardware configurations, we observed a performance degradationof at least 3.4× compared to not running memory-locking sender on anon-coresident instance (i.e. a baseline run with idle sender), indicatingreliability. Note that this works even when the co-resident instances arerunning on cores on different sockets, which does not share the same LLC(works on heterogeneous hardware). Further, a single run takes one tenthof a second to complete and hence is also quick.
With the emergence of new microarchitectures (Haswell and Skylake)that promise better performance isolation of shared resources, we soughtout to measure the efficacy of the above described memory-probing co-residency test on a (then) latest Skylake machine. The test machine is asingle socket, 4 core Intel Core i7-6700K with 8MB LLC. We observed a2× degradation in performance when running the memory-probing teston this machine. Although the performance degradation is significantlylesser than what we observed on Ivy Bridge and earlier microarchitectures(4×), it demonstrates that modern processors are still vulnerable to theabuse of the unaligned atomic operations.
Note that for this test suite to work in the real world, an attacker re-quires control over both the VMs under test, which includes the victim.
67
We call this scenario as co-residency detection under cooperative victims(in short, cooperative co-residency detection). Such a mechanism is suffi-cient to observe placement behavior in public clouds (Section 5.2.2). Wefurther investigated approaches to detect co-residency under a realisticsetting with an uncooperative victim. In Section 5.2.3 we show how toadapt the memory-probing test to detect co-location with one of the manywebservers behind a load balancer.
5.2.2 Cooperative Co-residency Detection
In this section, we describe the methodology we used to detect co-residencyin public clouds. For the purposes of studying placement policies, we hadthe flexibility to control both VMs that we test for co-residence. We did thisby launching VMs from two separate accounts and test them for pairwiseco-residence. We encountered several challenges when running the co-residency test suite on three different public clouds - Google ComputerEngine, Amazon EC2 and Microsoft Azure.
First, we had to handle noise from neighboring VMs sharing the samehost. Second, hardware and software heterogeneity in the three differentpublic clouds required special tuning process for the co-residency detec-tion tests. Finally, testing co-residency for a large set of VMs demanded ascalable implementation. We elaborate on our solution to these challengesbelow.
Handling noise. Any noise from neighboring VMs could affect the per-formance of the receiver with and without the signal (or baseline) andresult in misdetection. To handle such noise, we alternate between mea-suring the performance with and without the sender’s signal, such thatany noise equally affects both the measurements. Secondly, we take tensamples of each measurement and only detect co-residence if the ratios ofboth the mean and median of these samples exceed the threshold. As each
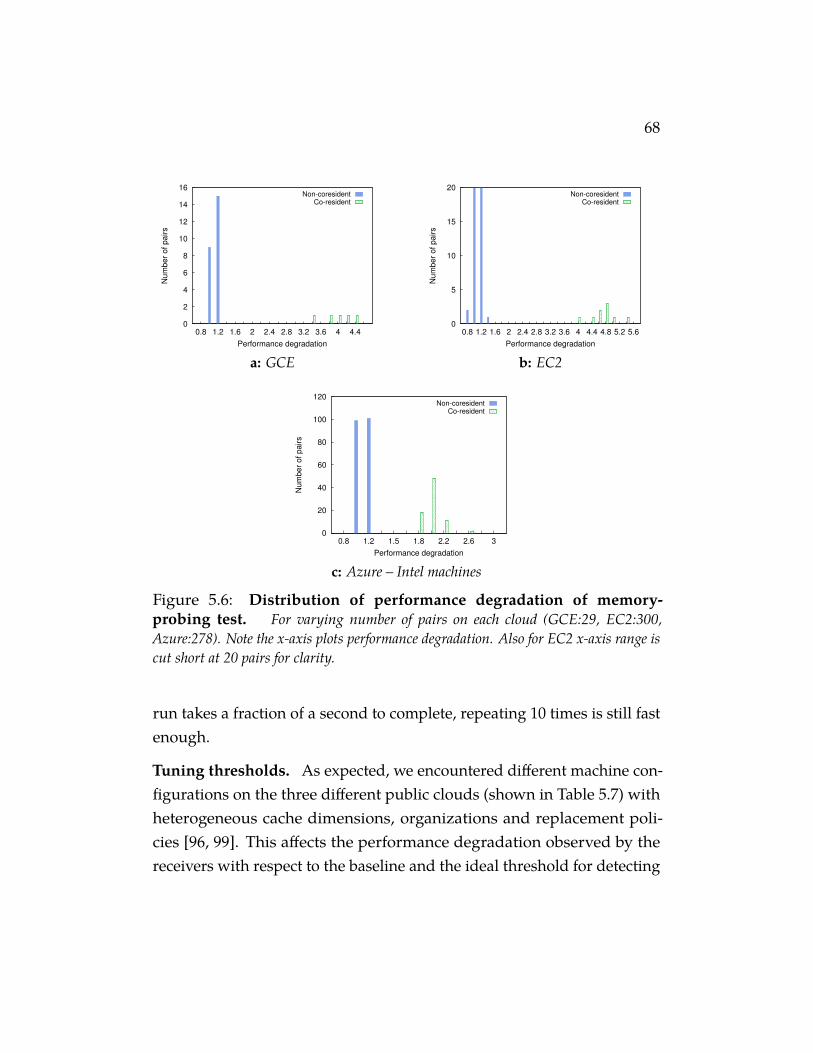
68
0
2
4
6
8
10
12
14
16
0.8 1.2 1.6 2 2.4 2.8 3.2 3.6 4 4.4
Num
ber
of pairs
Performance degradation
Non-coresidentCo-resident
a: GCE
0
5
10
15
20
0.8 1.2 1.6 2 2.4 2.8 3.2 3.6 4 4.4 4.8 5.2 5.6
Num
ber
of pairs
Performance degradation
Non-coresidentCo-resident
b: EC2
0
20
40
60
80
100
120
0.8 1.2 1.5 1.8 2.2 2.6 3
Num
ber
of pairs
Performance degradation
Non-coresidentCo-resident
c: Azure – Intel machines
Figure 5.6: Distribution of performance degradation of memory-probing test. For varying number of pairs on each cloud (GCE:29, EC2:300,Azure:278). Note the x-axis plots performance degradation. Also for EC2 x-axis range iscut short at 20 pairs for clarity.
run takes a fraction of a second to complete, repeating 10 times is still fastenough.
Tuning thresholds. As expected, we encountered different machine con-figurations on the three different public clouds (shown in Table 5.7) withheterogeneous cache dimensions, organizations and replacement poli-cies [96, 99]. This affects the performance degradation observed by thereceivers with respect to the baseline and the ideal threshold for detecting

69
Cloud Machine Clock LLCProvider Architecture (GHz) (Ways × Set)
EC2 Intel Xeon E5-2670 2.50 20 × 20480GCE Generic Xeon* 2.60* 20 × 16384
Azure Intel E5-2660 2.20 20 × 16384Azure AMD Opteron 4171 HE 2.10 48 × 1706
Table 5.7: Machine configuration in public clouds. The machine configu-rations observed over all runs with small instance types. GCE did not reveal the exactmicroarchitecture of the physical host (*). Ways × Sets ×Word Size gives the LLC size.The word size for all these x86-64 machines is 64 bytes.
co-residency. This is important because the thresholds we use to detectco-residence yield false positives, if set too low, and false negatives if settoo high. Hence, we tuned the threshold to each hardware we found onall three clouds.
We started with a conservative threshold of 1.5x and tuned to a fi-nal threshold of 2x for GCE and EC2 and 1.5x for Azure for both thememory-probing and -locking tests. Figure 5.6 shows the distribution ofperformance degradation under the memory-probing tests across Intelmachines in EC2, GCE, and Azure. For GCE and EC2, a performance degra-dation threshold of 2 clearly separates co-resident from non-coresidentinstances. For all Intel machines we encountered, although we ran bothmemory-locking and -probing tests, memory-probing was sufficient todetect co-residency. For Azure, overall we observe lower performancedegradation and the initial threshold of 1.5 was sufficient to detect co-location on Intel machines.
The picture for AMD machines in Azure differs significantly as shownin Figure 5.8. The distribution of performance degradation for both thememory-locking and the memory-probing tests shows that, unlike forother architectures, co-residency detection is highly sensitive to the choiceof the threshold for AMD machines. This may be due to the more asso-
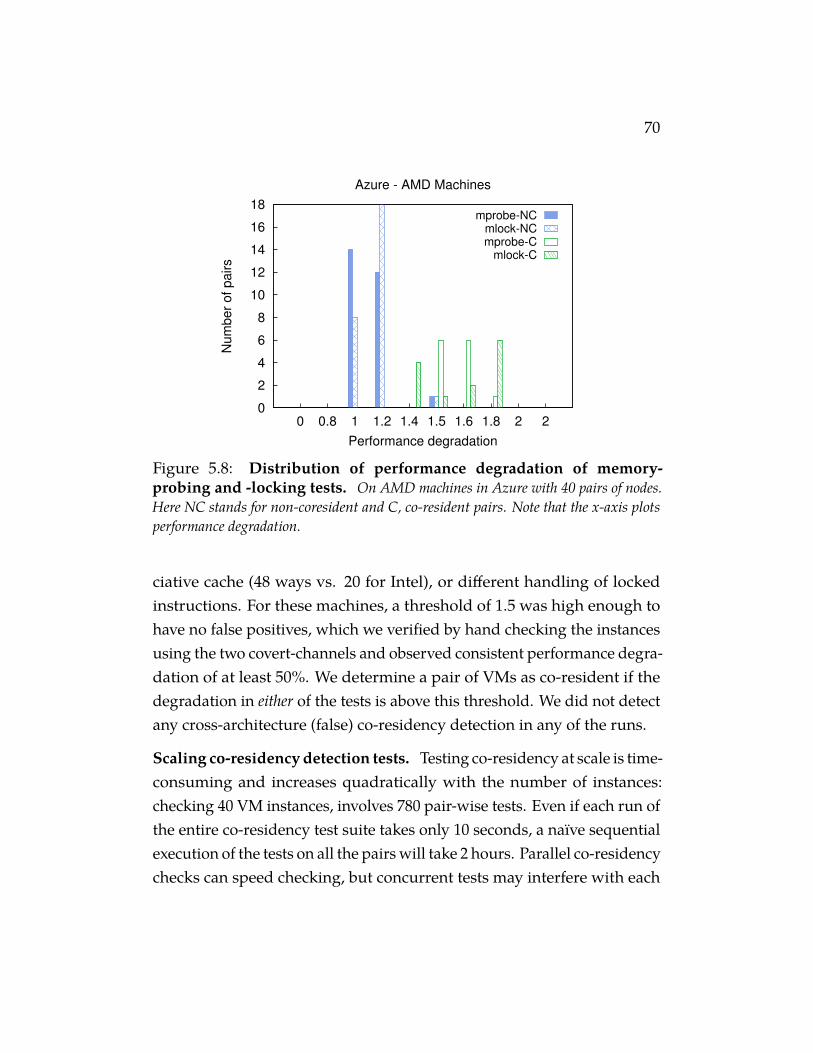
70
0
2
4
6
8
10
12
14
16
18
0 0.8 1 1.2 1.4 1.5 1.6 1.8 2 2
Nu
mb
er
of
pa
irs
Performance degradation
Azure - AMD Machines
mprobe-NCmlock-NCmprobe-C
mlock-C
Figure 5.8: Distribution of performance degradation of memory-probing and -locking tests. On AMD machines in Azure with 40 pairs of nodes.Here NC stands for non-coresident and C, co-resident pairs. Note that the x-axis plotsperformance degradation.
ciative cache (48 ways vs. 20 for Intel), or different handling of lockedinstructions. For these machines, a threshold of 1.5 was high enough tohave no false positives, which we verified by hand checking the instancesusing the two covert-channels and observed consistent performance degra-dation of at least 50%. We determine a pair of VMs as co-resident if thedegradation in either of the tests is above this threshold. We did not detectany cross-architecture (false) co-residency detection in any of the runs.
Scaling co-residency detection tests. Testing co-residency at scale is time-consuming and increases quadratically with the number of instances:checking 40 VM instances, involves 780 pair-wise tests. Even if each run ofthe entire co-residency test suite takes only 10 seconds, a naïve sequentialexecution of the tests on all the pairs will take 2 hours. Parallel co-residencychecks can speed checking, but concurrent tests may interfere with each
71
other.To parallelize the test, we partition the set of all VM pairs (
(v+a2
)) into
sets of pairs with no VMs twice; we run one of these sets at a time andrecord which pairs detected possible co-residence. After running all sets,we have a set of candidate co-resident pairs, which we test sequentially.Parallelizing co-residency tests significantly decreased the time takento test all co-residency pairs. For instance, the parallel version of thetest on one of the cloud providers took 2.4 seconds per pair whereas theserial version took almost 46.3 seconds per pair (a speedup of 20x). Whilethere are faster ways to parallelize co-residency detection, we chose thisapproach for simplicity.
Veracity of our tests. Notice that a performance degradation of 1.5x, 2xand 4x corresponds to 50%, 100% and 300% performance degradation.Such high performance degradation (even 50%) is clear enough signalto declare co-residency due to resource sharing. Furthermore, we handchecked by running the two tests in isolation on the detected instance-pairs for a significant fraction of the runs for all clouds and observed aconsistent covert-channel signal. Thus our methodology did not detectany false positives, which are more detrimental to our study than falsenegatives. Although co-residency here implies sharing of memory channel,which may not always mean sharing of cores or other per-core hardwareresources.
5.2.3 Uncooperative Co-residency Detection
Until now, we described a method to detect co-residency with a cooper-ative victim. In this section, we look at a more realistic setting where anadversary wishes to detect co-residency with a victim VM with accesseslimited to only public interfaces like HTTP or a key-value (KV) store’s put-get interface. We show that the basic cooperative co-residency detection
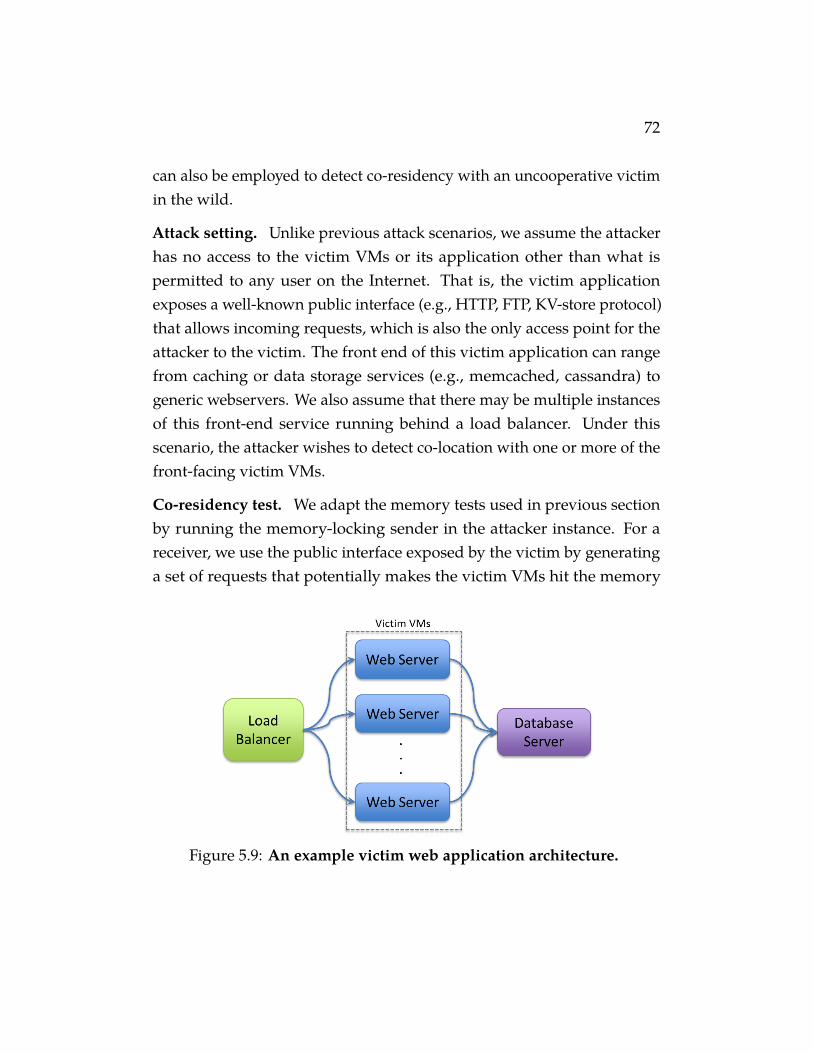
72
can also be employed to detect co-residency with an uncooperative victimin the wild.
Attack setting. Unlike previous attack scenarios, we assume the attackerhas no access to the victim VMs or its application other than what ispermitted to any user on the Internet. That is, the victim applicationexposes a well-known public interface (e.g., HTTP, FTP, KV-store protocol)that allows incoming requests, which is also the only access point for theattacker to the victim. The front end of this victim application can rangefrom caching or data storage services (e.g., memcached, cassandra) togeneric webservers. We also assume that there may be multiple instancesof this front-end service running behind a load balancer. Under thisscenario, the attacker wishes to detect co-location with one or more of thefront-facing victim VMs.
Co-residency test. We adapt the memory tests used in previous sectionby running the memory-locking sender in the attacker instance. For areceiver, we use the public interface exposed by the victim by generatinga set of requests that potentially makes the victim VMs hit the memory
Figure 5.9: An example victim web application architecture.
73
bus. This can be achieved by looping through a large number of requestsof sizes approximately equal or greater than the size of the LLC. Thiscreates a performance side-channel that leaks co-residency information.This receiver runs in an independent VM under the adversary’s control,which we call the co-residency detector.
Experiment setup. To evaluate the efficacy of this method, we used theOlio multi-tier web application [136] that is designed to mimic a social-networking application. We used an instance of this workload from Cloud-Suite [64]. Although Olio supports several tiers (e.g., memcached to cacheresults of database queries), we configured it with two tiers as shownin Figure 5.9, with each webserver and the database server running ina separate VM of type t2.small on Amazon EC2. Multiple of these web-server VMs are configured behind a HAProxy-based load balancer [82]running in an m3.medium instance (for better networking performance).The load balancer follows the standard configuration of using round-robinload balancing algorithm with sticky client sessions using cookies. Webelieve such a victim web application and its configuration is a reasonablegeneralization of real world applications running in the cloud.
For the attacker, we use an off-the-shelf HTTP performance measure-ment utility called HTTPerf [128] as the receiver in the co-residency detec-tion test. This receiver is run inside a t2.micro instance (for free of charge).We used a set of 212 requests that included web pages and web objects(images, PDF files). We gathered these requests using the access log ofmanual navigation around the web application from a web browser.
Evaluation methodology. We start with a known co-resident VM pairusing the cooperative co-residency detection method. We configure oneof the VMs as a victim webserver VM and launch four more VMs: twowebservers, one database server and a load balancer, all of which are notco-resident with the attacker VM.
Co-residency detection starts by measuring the average request latency
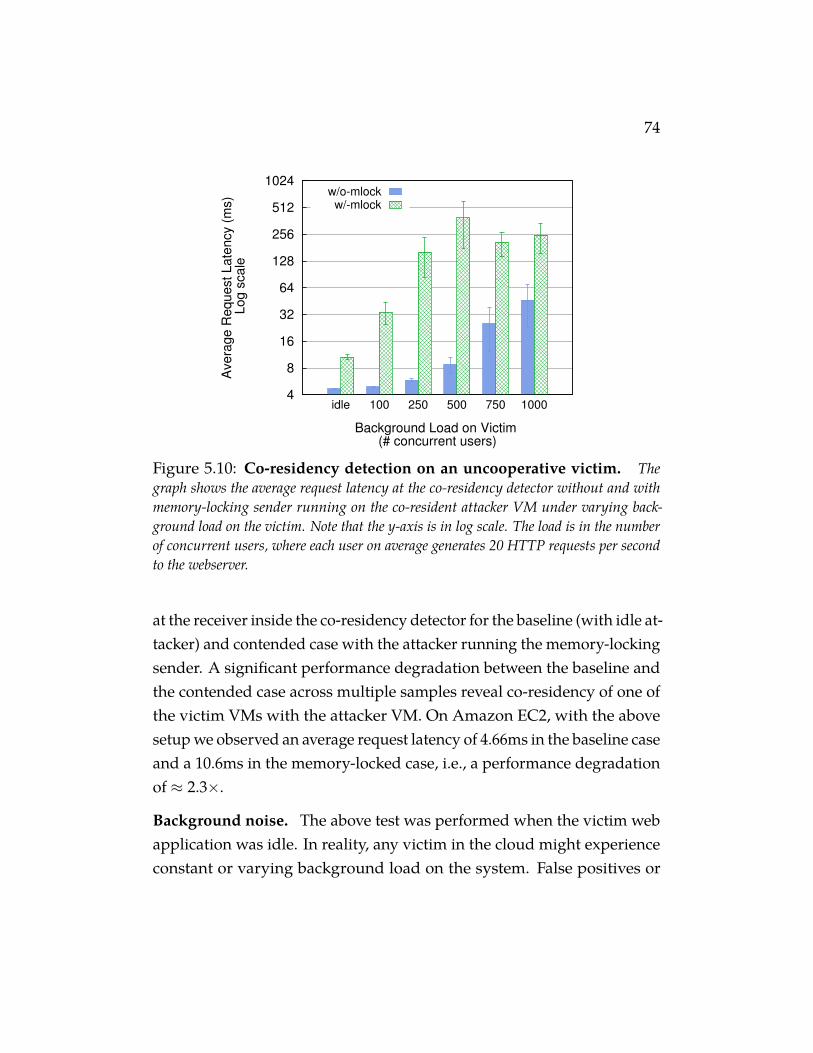
74
4
8
16
32
64
128
256
512
1024
idle 100 250 500 750 1000
Ave
rag
e R
eq
ue
st
La
ten
cy (
ms)
Lo
g s
ca
le
Background Load on Victim (# concurrent users)
w/o-mlockw/-mlock
Figure 5.10: Co-residency detection on an uncooperative victim. Thegraph shows the average request latency at the co-residency detector without and withmemory-locking sender running on the co-resident attacker VM under varying back-ground load on the victim. Note that the y-axis is in log scale. The load is in the numberof concurrent users, where each user on average generates 20 HTTP requests per secondto the webserver.
at the receiver inside the co-residency detector for the baseline (with idle at-tacker) and contended case with the attacker running the memory-lockingsender. A significant performance degradation between the baseline andthe contended case across multiple samples reveal co-residency of one ofthe victim VMs with the attacker VM. On Amazon EC2, with the abovesetup we observed an average request latency of 4.66ms in the baseline caseand a 10.6ms in the memory-locked case, i.e., a performance degradationof ≈ 2.3×.
Background noise. The above test was performed when the victim webapplication was idle. In reality, any victim in the cloud might experienceconstant or varying background load on the system. False positives or
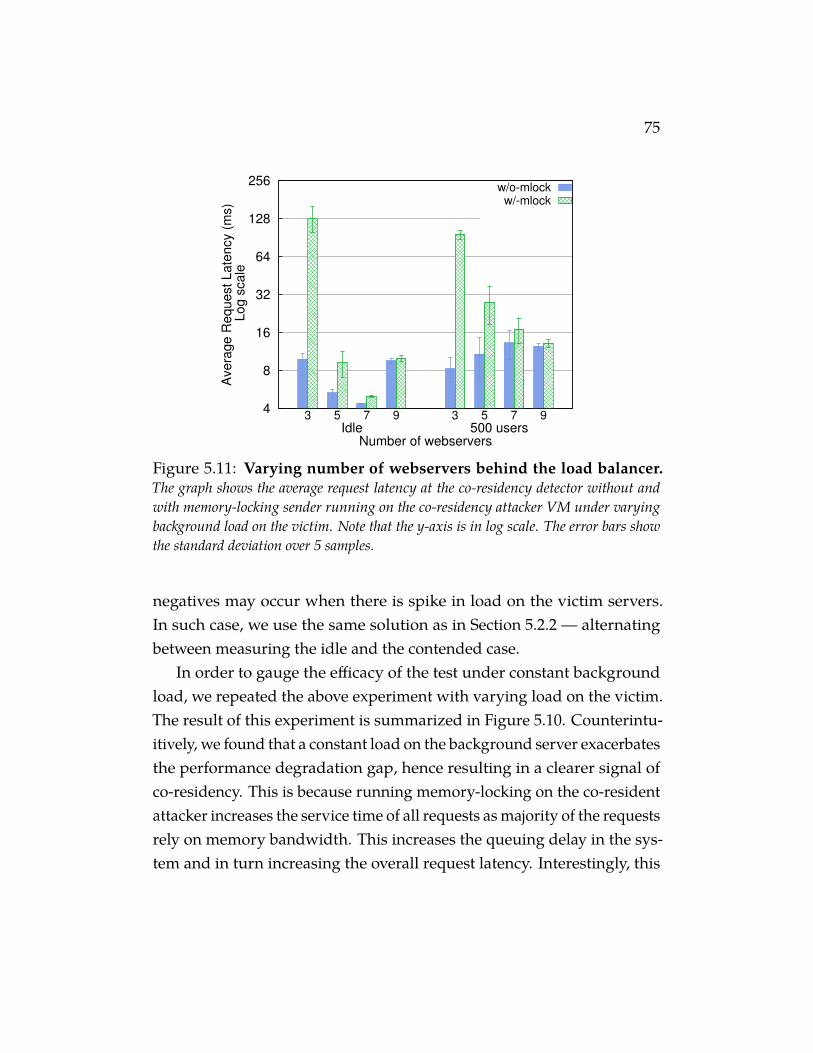
75
4
8
16
32
64
128
256
3 5 7 9 3 5 7 9
Ave
rag
e R
eq
ue
st
La
ten
cy (
ms)
Lo
g s
ca
le
Number of webservers
w/o-mlockw/-mlock
w/o-mlock
500 usersIdle
Figure 5.11: Varying number of webservers behind the load balancer.The graph shows the average request latency at the co-residency detector without andwith memory-locking sender running on the co-residency attacker VM under varyingbackground load on the victim. Note that the y-axis is in log scale. The error bars showthe standard deviation over 5 samples.
negatives may occur when there is spike in load on the victim servers.In such case, we use the same solution as in Section 5.2.2 — alternatingbetween measuring the idle and the contended case.
In order to gauge the efficacy of the test under constant backgroundload, we repeated the above experiment with varying load on the victim.The result of this experiment is summarized in Figure 5.10. Counterintu-itively, we found that a constant load on the background server exacerbatesthe performance degradation gap, hence resulting in a clearer signal ofco-residency. This is because running memory-locking on the co-residentattacker increases the service time of all requests as majority of the requestsrely on memory bandwidth. This increases the queuing delay in the sys-tem and in turn increasing the overall request latency. Interestingly, this
76
aforementioned performance gap stops widening at higher loads of 750 to1000 concurrent users as the system hits a bottleneck (in our case a networkbottleneck at the load balancer) even without running the memory-lockingsender. Thus, detecting co-residency with a victim VM that is part of ahighly loaded and bottlenecked application would be hard using this test.
We also experimented with increasing the number of victim webserversbehind the load balancer beyond 3 (Figure 5.11). As expected, the co-residency signal grew weaker with increasing victims, and at 9 webservers,the performance degradation was too low to be useful for detecting co-residency.
5.3 Placement Vulnerability Study
In this section, we evaluate three public clouds, Amazon EC2, GoogleCompute Engine and Microsoft Azure, for placement vulnerabilities andanswer the following questions: (i) what are all the strategies that anadversary can employ to increase the chance of co-location with one ormore victim VMs? (ii) what are the chances of success and cost of eachstrategy? and (iii) how do these strategies compare against the referenceplacement policy introduced in Section 5.1?
5.3.1 Experimental Methodology
Before presenting the results, we first describe the experiment setting andmethodology that we employed for this placement vulnerability study.
Experiment settings. Recall VM placement depends on several place-ment variables (shown in Table 5.1). We assigned reasonable values tothese placement variables and enumerated through several launch strate-gies. A run corresponds to one launch strategy and involves launchingmultiple VMs from two distinct accounts (i.e., subscriptions in Azure andprojects in GCE) and checking for co-residency between all pairs of VMs
77
launched. One account was designated as a proxy for the victim and theother for the adversary. We denote a run configuration by v× a, where v isthe number of victim instances and a is the number of attacker instanceslaunched in that run. We varied v and a for all v, a ∈ {10, 20, 30} andrestricted them to the inequality, v 6 a, as it increases the likelihood ofachieving co-residency.
Other placement variables that are part of the run configuration include:victim launch time (including time of the day, day of the week), delaybetween victim and attacker VM launches, victim and attacker instancetypes and data center location or region where the VMs are launched.We repeat each run multiple times across all three cloud providers. Therepetition of experiments is especially required to control the effect ofcertain environment variables like time of day. We repeat experimentsfor each run configuration over various times of the day and days of theweek. We fix the instance type of VMs to small instances (t2.small on EC2,g1.small on GCE and small or Standard-A1 on Azure) and data centerregions to us-east for EC2, us-central1-a for GCE and east-us for Azure,unless otherwise noted. All experiments were conducted over 3 monthsbetween December 2014 to February 2015.
For all experiments, we use a single Intel Core i7-2600 machine locatedat Wisconsin with 8 SMT cores to launch VM instances, log instance in-formation and run the co-residency detection test suite unless otherwisenoted.
Implementation and the Cloud APIs. In order to automate our exper-iments, we used Python and the libcloud2 library [24] to interface withEC2 and GCE. Unfortunately, libcloud did not support Azure. The onlyAzure cloud API on Linux platform was a node.js library and a cross-platform command-line interface (CLI). We built a wrapper around the
2We used libcloud version 0.15.1 for EC2, and a modified version of 0.16.0 for GCE tosupport the use of multiple accounts in GCE.
78
CLI. There were no significant differences across different cloud APIsexcept that Azure did not have any explicit interface to launch multipleVMs simultaneously.
As mentioned in the experiment settings, we experimented with vari-ous delays between the victim and attacker VM launches (0, 1, 2, 4 …hours).To save money, we reused the same set of victim instances for each of thelonger runs. That is, for the run configuration of 10x10 with 0, 1, 2, and 4hours of delay between victim and attacker VM launches, we launchedthe victim VMs only once at the start of the experiment. After runningco-residency tests on the first set of VM pairs, we terminated all the at-tacker instances and relaunched attacker VM instances after appropriatedelays (say 1 hour) and rerun the tests with the same set of victim VMs.We repeat this until we experiment with all delays for this configuration.We call this methodology the leap-frog method. It is also important to notethat zero delay here means parallel launch of VMs from our test machine(and not sequential launch of VMs from one account after another), unlessotherwise noted.
In the sections below, we take a closer look at the effect of varying oneplacement variable while keeping other variables fixed across all the cloudproviders. In each case, we use three metrics to measure the degree ofco-residency: chances of getting at least one co-resident instance across anumber of runs (or success rate), average number of co-resident instancesover multiple runs and average coverage (i.e., fraction of victim VMs withwhich attacker VMs were co-resident). Although these experiments weredone with victim VMs under our control, the results can be extrapolatedto guide an attacker’s launch strategy for an uncooperative victim. Wealso discuss a set of such strategic questions that the results help answer.At the end of this section, we summarize and calculate the cost of severalinteresting launch strategies and evaluate the public clouds against ourreference placement policy.
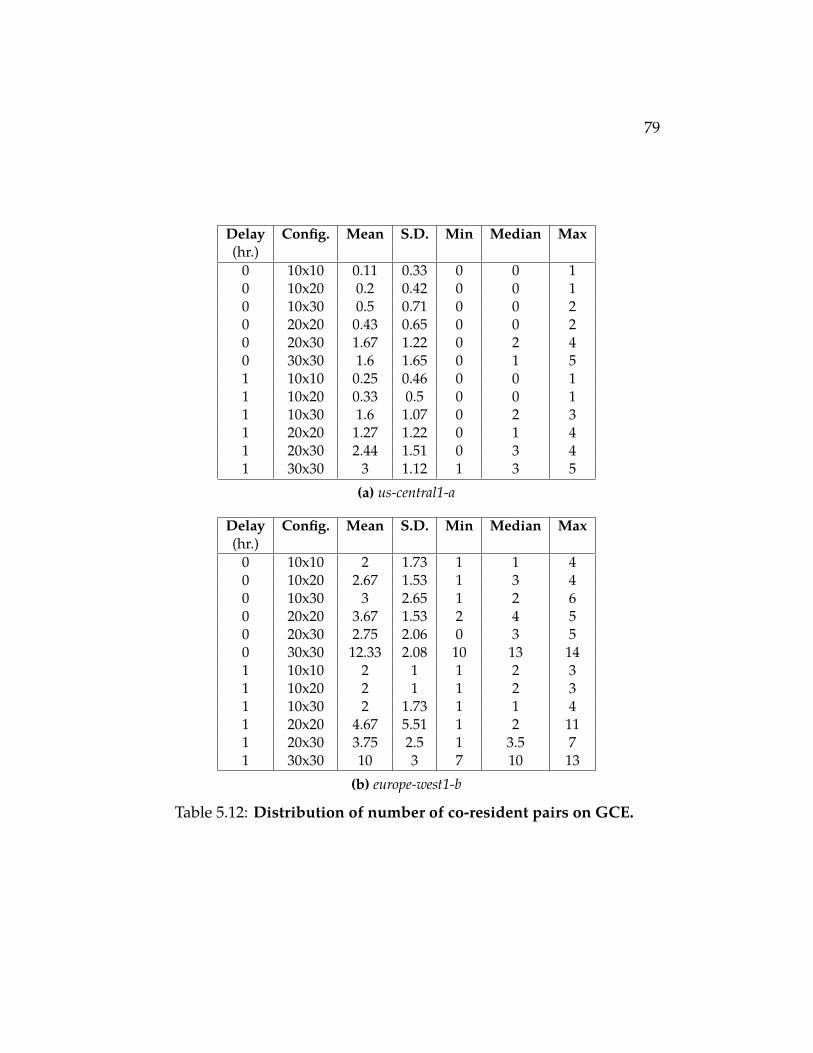
79
Delay Config. Mean S.D. Min Median Max(hr.)
0 10x10 0.11 0.33 0 0 10 10x20 0.2 0.42 0 0 10 10x30 0.5 0.71 0 0 20 20x20 0.43 0.65 0 0 20 20x30 1.67 1.22 0 2 40 30x30 1.6 1.65 0 1 51 10x10 0.25 0.46 0 0 11 10x20 0.33 0.5 0 0 11 10x30 1.6 1.07 0 2 31 20x20 1.27 1.22 0 1 41 20x30 2.44 1.51 0 3 41 30x30 3 1.12 1 3 5
(a) us-central1-a
Delay Config. Mean S.D. Min Median Max(hr.)
0 10x10 2 1.73 1 1 40 10x20 2.67 1.53 1 3 40 10x30 3 2.65 1 2 60 20x20 3.67 1.53 2 4 50 20x30 2.75 2.06 0 3 50 30x30 12.33 2.08 10 13 141 10x10 2 1 1 2 31 10x20 2 1 1 2 31 10x30 2 1.73 1 1 41 20x20 4.67 5.51 1 2 111 20x30 3.75 2.5 1 3.5 71 30x30 10 3 7 10 13
(b) europe-west1-b
Table 5.12: Distribution of number of co-resident pairs on GCE.
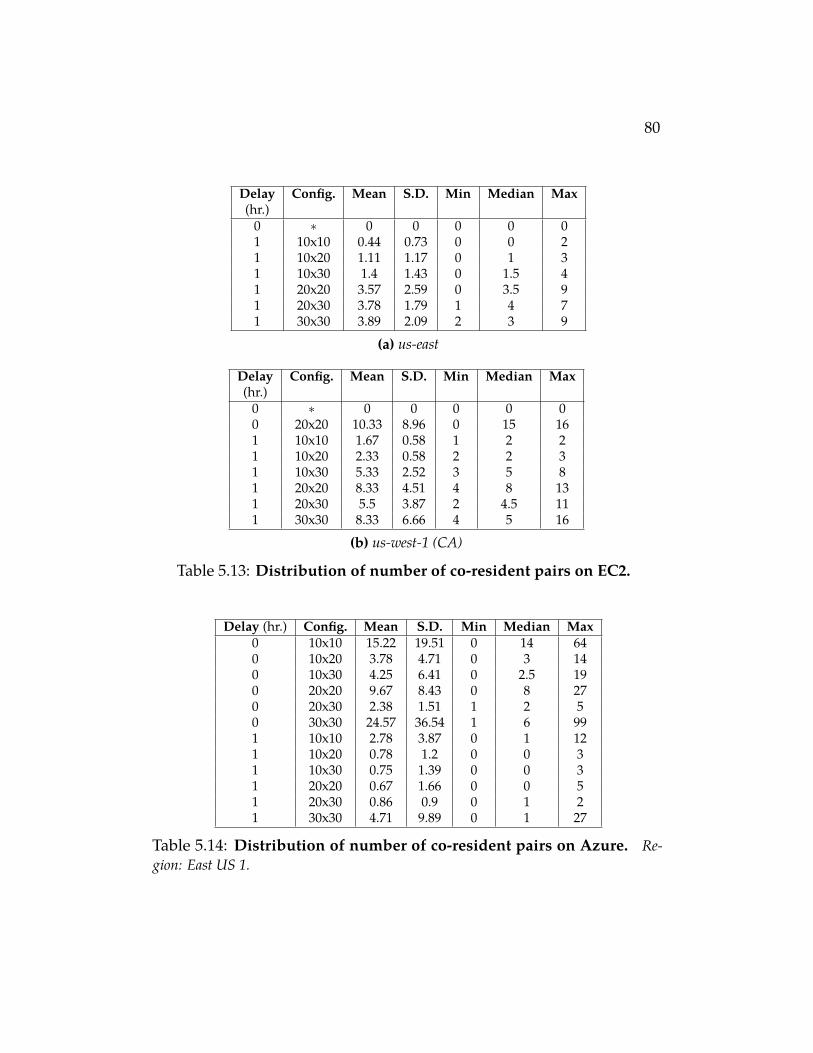
80
Delay Config. Mean S.D. Min Median Max(hr.)
0 ∗ 0 0 0 0 01 10x10 0.44 0.73 0 0 21 10x20 1.11 1.17 0 1 31 10x30 1.4 1.43 0 1.5 41 20x20 3.57 2.59 0 3.5 91 20x30 3.78 1.79 1 4 71 30x30 3.89 2.09 2 3 9
(a) us-east
Delay Config. Mean S.D. Min Median Max(hr.)
0 ∗ 0 0 0 0 00 20x20 10.33 8.96 0 15 161 10x10 1.67 0.58 1 2 21 10x20 2.33 0.58 2 2 31 10x30 5.33 2.52 3 5 81 20x20 8.33 4.51 4 8 131 20x30 5.5 3.87 2 4.5 111 30x30 8.33 6.66 4 5 16
(b) us-west-1 (CA)
Table 5.13: Distribution of number of co-resident pairs on EC2.
Delay (hr.) Config. Mean S.D. Min Median Max0 10x10 15.22 19.51 0 14 640 10x20 3.78 4.71 0 3 140 10x30 4.25 6.41 0 2.5 190 20x20 9.67 8.43 0 8 270 20x30 2.38 1.51 1 2 50 30x30 24.57 36.54 1 6 991 10x10 2.78 3.87 0 1 121 10x20 0.78 1.2 0 0 31 10x30 0.75 1.39 0 0 31 20x20 0.67 1.66 0 0 51 20x30 0.86 0.9 0 1 21 30x30 4.71 9.89 0 1 27
Table 5.14: Distribution of number of co-resident pairs on Azure. Re-gion: East US 1.
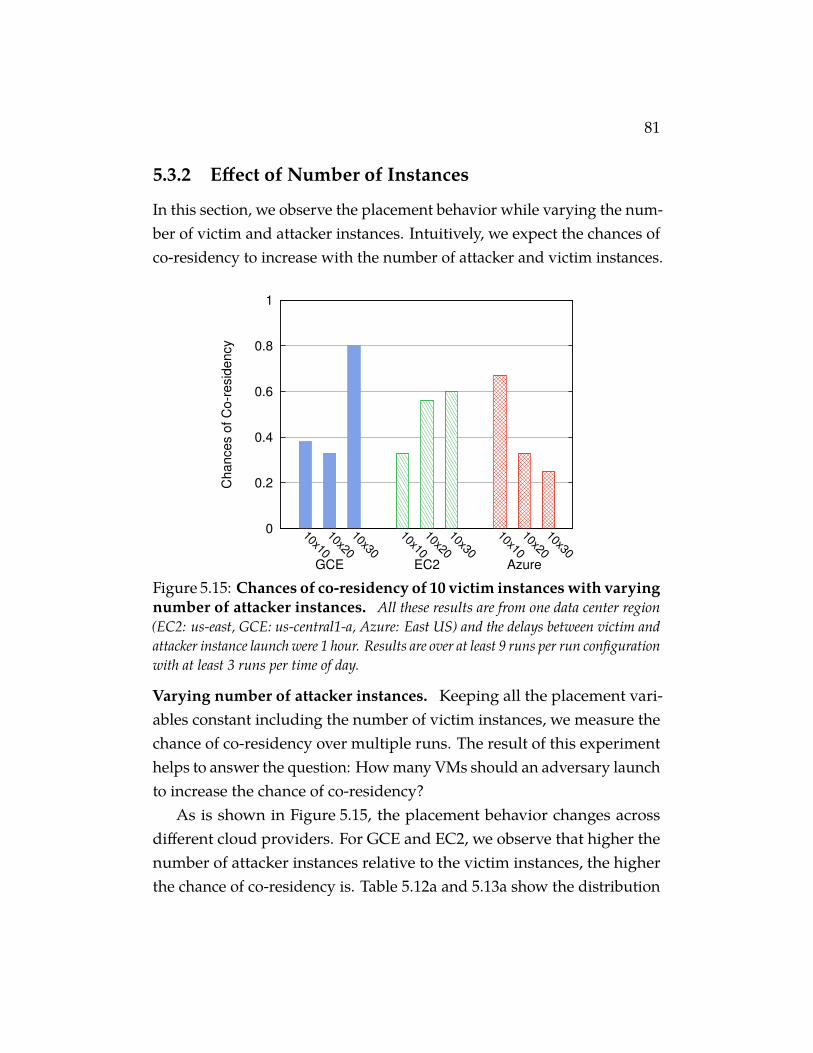
81
5.3.2 Effect of Number of Instances
In this section, we observe the placement behavior while varying the num-ber of victim and attacker instances. Intuitively, we expect the chances ofco-residency to increase with the number of attacker and victim instances.
0
0.2
0.4
0.6
0.8
1
10x10
10x20
10x30
10x10
10x20
10x30
10x10
10x20
10x30
Ch
an
ce
s o
f C
o-r
esid
en
cy
AzureEC2GCE
Figure 5.15: Chances of co-residency of 10 victim instances with varyingnumber of attacker instances. All these results are from one data center region(EC2: us-east, GCE: us-central1-a, Azure: East US) and the delays between victim andattacker instance launch were 1 hour. Results are over at least 9 runs per run configurationwith at least 3 runs per time of day.
Varying number of attacker instances. Keeping all the placement vari-ables constant including the number of victim instances, we measure thechance of co-residency over multiple runs. The result of this experimenthelps to answer the question: How many VMs should an adversary launchto increase the chance of co-residency?
As is shown in Figure 5.15, the placement behavior changes acrossdifferent cloud providers. For GCE and EC2, we observe that higher thenumber of attacker instances relative to the victim instances, the higherthe chance of co-residency is. Table 5.12a and 5.13a show the distribution
82
of number of co-resident VM pairs on GCE and EC2, respectively. Thenumber of co-resident VM pairs also increases with the number of attackerinstances, implying that the coverage of an attack could be increased withlarger fraction of attacker instances than the target VM instances if thelaunch times are coordinated.
Contrary to our expectations, the placement behavior observed onAzure is the inverse. The chances of co-residency with 10 attacker in-stances are almost twice as high as with 30 attacker instances. This is alsoreflected in the distribution of number of co-residency VM pairs (shownin Table 5.14). Further investigation revealed a correlation between thenumber of victim and attacker instances launched and the chance of co-residency. That is, for the run configuration of 10x10, 20x20 and 30x30,where number of victim and attacker instances are the same, and with0 delay, the chance of co-residency were equally high for all these con-figurations (between 0.9 to 1). This suggests a possible placement policythat collates VM launch requests together based on their request size andplaces them on the same group of machines.
Varying number of victim instances. Similarly, we also varied the num-ber of victim instances by keeping the number of attacker instances andother placement variables constant (results shown in Figure 5.16). Weexpect the chance of co-residency to increase with the number of victimstargeted. Hence, the results presented here help an adversary answer thequestion: What are the chances of co-residency with varying sizes of targetvictims?
As expected, we see an increase in the chances of co-residency withincreasing number of victim VMs across all cloud providers. We see thatthe absolute value of the chance of co-residency is lower for Azure thanother clouds. This may be the result of significant additional delay betweenvictim and attacker launch times in Azure as a result of our methodology(more on this later).
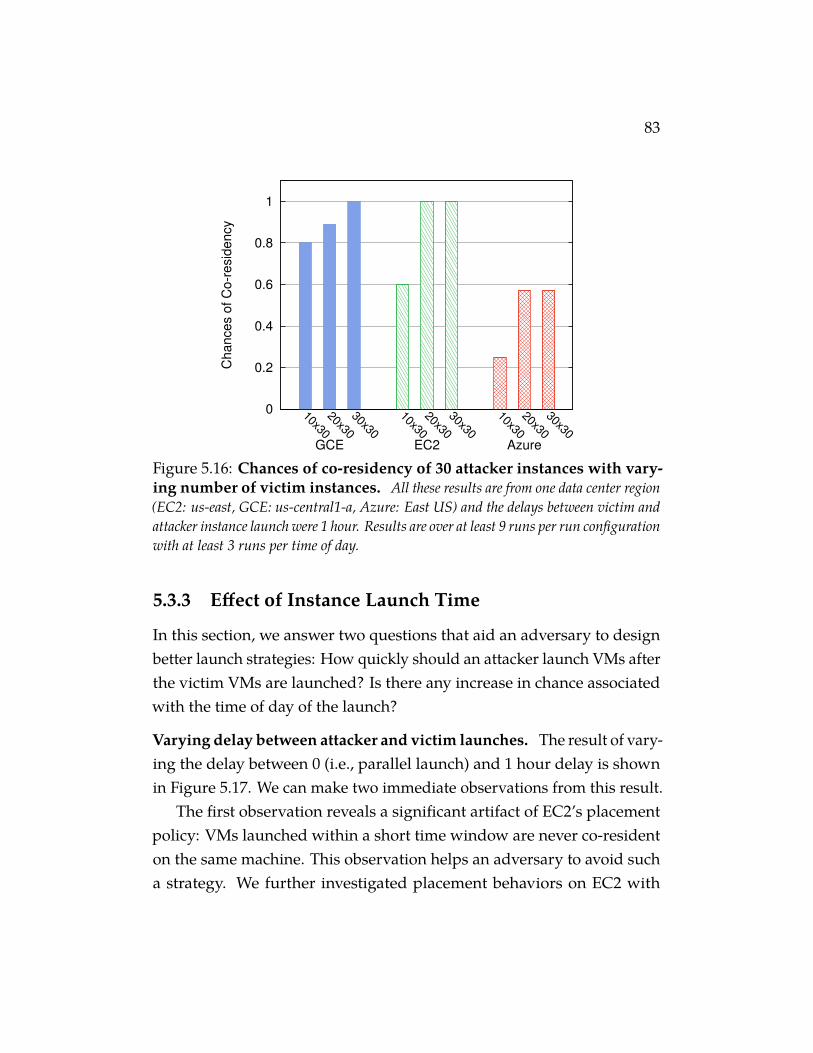
83
0
0.2
0.4
0.6
0.8
1
10x30
20x30
30x30
10x30
20x30
30x30
10x30
20x30
30x30
Ch
an
ce
s o
f C
o-r
esid
en
cy
AzureEC2GCE
Figure 5.16: Chances of co-residency of 30 attacker instances with vary-ing number of victim instances. All these results are from one data center region(EC2: us-east, GCE: us-central1-a, Azure: East US) and the delays between victim andattacker instance launch were 1 hour. Results are over at least 9 runs per run configurationwith at least 3 runs per time of day.
5.3.3 Effect of Instance Launch Time
In this section, we answer two questions that aid an adversary to designbetter launch strategies: How quickly should an attacker launch VMs afterthe victim VMs are launched? Is there any increase in chance associatedwith the time of day of the launch?
Varying delay between attacker and victim launches. The result of vary-ing the delay between 0 (i.e., parallel launch) and 1 hour delay is shownin Figure 5.17. We can make two immediate observations from this result.
The first observation reveals a significant artifact of EC2’s placementpolicy: VMs launched within a short time window are never co-residenton the same machine. This observation helps an adversary to avoid sucha strategy. We further investigated placement behaviors on EC2 with
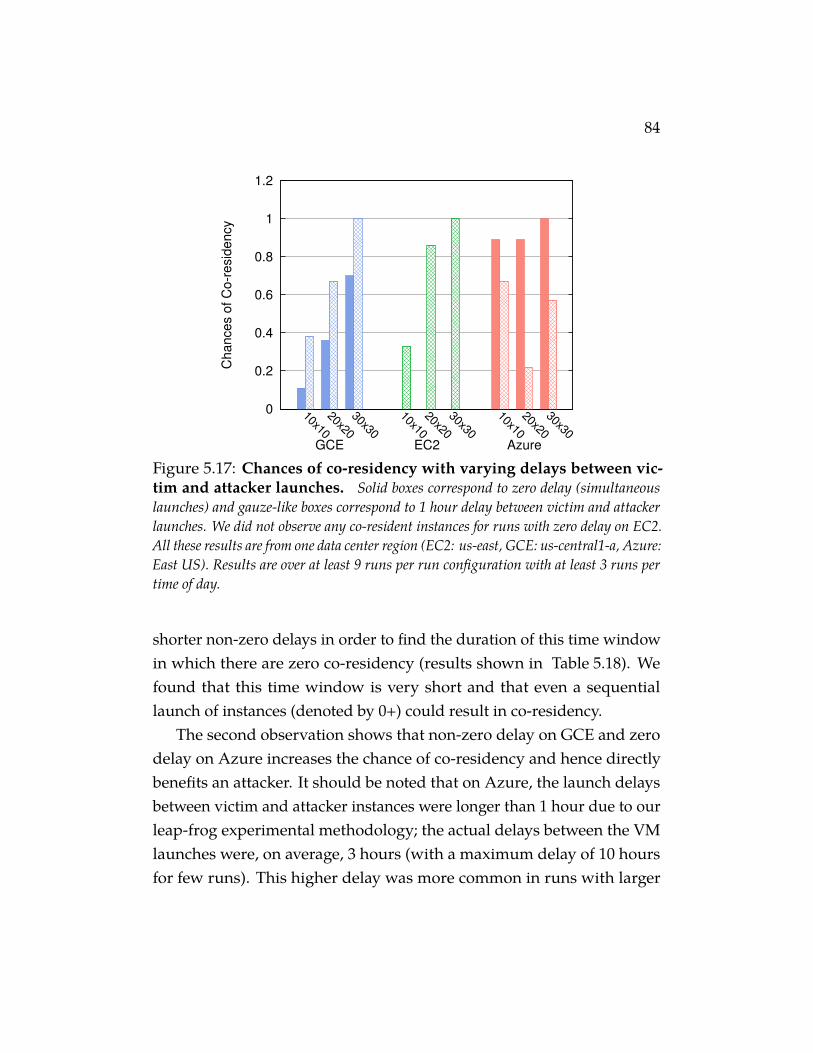
84
0
0.2
0.4
0.6
0.8
1
1.2
10x10
20x20
30x30
10x10
20x20
30x30
10x10
20x20
30x30
Ch
an
ce
s o
f C
o-r
esid
en
cy
AzureEC2GCE
Figure 5.17: Chances of co-residency with varying delays between vic-tim and attacker launches. Solid boxes correspond to zero delay (simultaneouslaunches) and gauze-like boxes correspond to 1 hour delay between victim and attackerlaunches. We did not observe any co-resident instances for runs with zero delay on EC2.All these results are from one data center region (EC2: us-east, GCE: us-central1-a, Azure:East US). Results are over at least 9 runs per run configuration with at least 3 runs pertime of day.
shorter non-zero delays in order to find the duration of this time windowin which there are zero co-residency (results shown in Table 5.18). Wefound that this time window is very short and that even a sequentiallaunch of instances (denoted by 0+) could result in co-residency.
The second observation shows that non-zero delay on GCE and zerodelay on Azure increases the chance of co-residency and hence directlybenefits an attacker. It should be noted that on Azure, the launch delaysbetween victim and attacker instances were longer than 1 hour due to ourleap-frog experimental methodology; the actual delays between the VMlaunches were, on average, 3 hours (with a maximum delay of 10 hoursfor few runs). This higher delay was more common in runs with larger
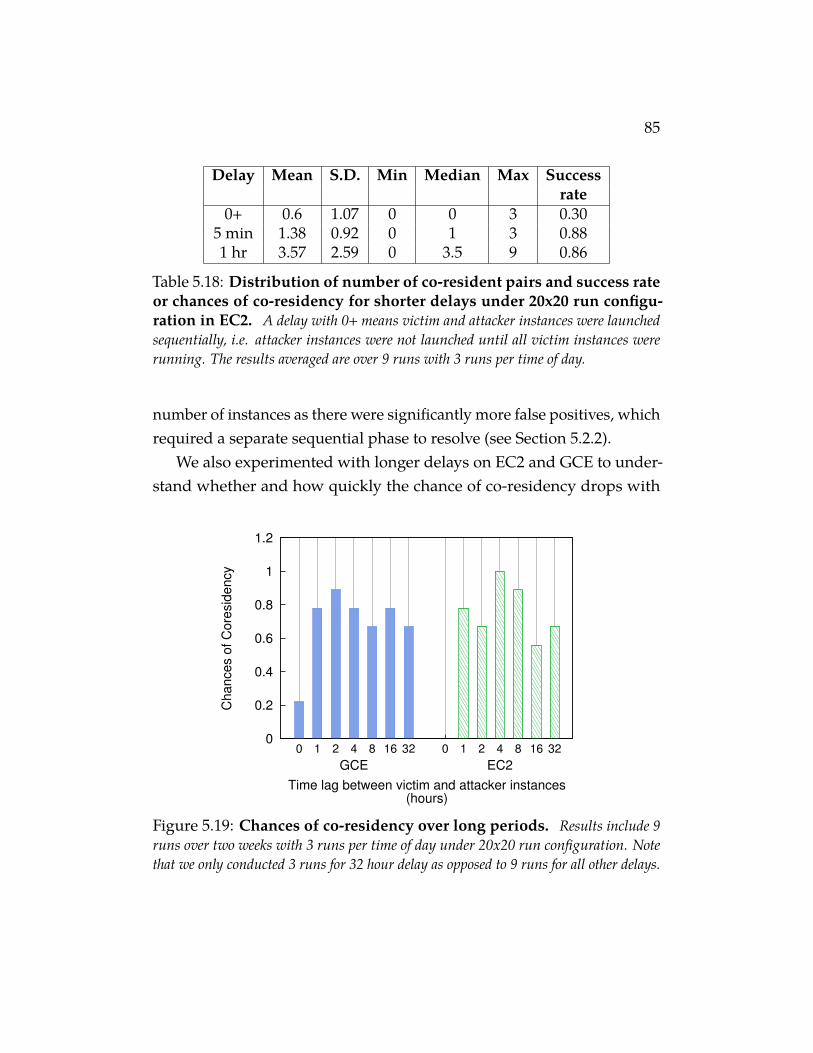
85
Delay Mean S.D. Min Median Max Successrate
0+ 0.6 1.07 0 0 3 0.305 min 1.38 0.92 0 1 3 0.881 hr 3.57 2.59 0 3.5 9 0.86
Table 5.18: Distribution of number of co-resident pairs and success rateor chances of co-residency for shorter delays under 20x20 run configu-ration in EC2. A delay with 0+ means victim and attacker instances were launchedsequentially, i.e. attacker instances were not launched until all victim instances wererunning. The results averaged are over 9 runs with 3 runs per time of day.
number of instances as there were significantly more false positives, whichrequired a separate sequential phase to resolve (see Section 5.2.2).
We also experimented with longer delays on EC2 and GCE to under-stand whether and how quickly the chance of co-residency drops with
0
0.2
0.4
0.6
0.8
1
1.2
0 1 2 4 8 16 32 0 1 2 4 8 16 32
Ch
an
ce
s o
f C
ore
sid
en
cy
Time lag between victim and attacker instances(hours)
EC2GCE
Figure 5.19: Chances of co-residency over long periods. Results include 9runs over two weeks with 3 runs per time of day under 20x20 run configuration. Notethat we only conducted 3 runs for 32 hour delay as opposed to 9 runs for all other delays.
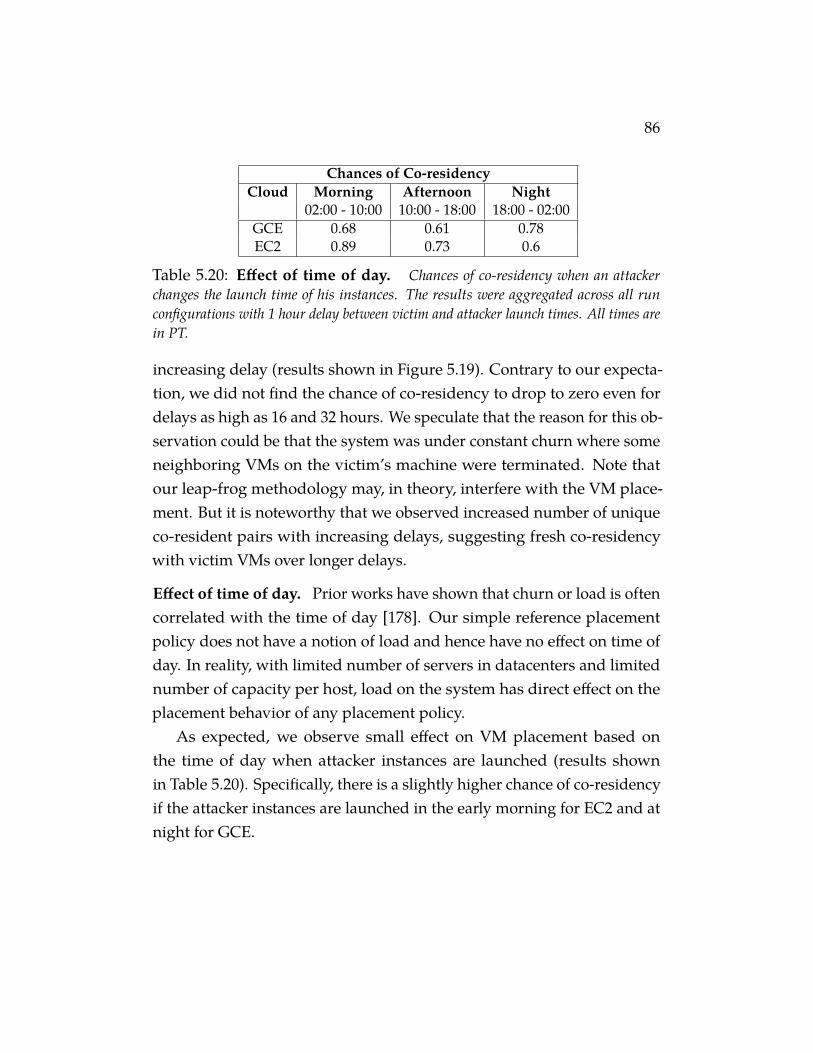
86
Chances of Co-residencyCloud Morning Afternoon Night
02:00 - 10:00 10:00 - 18:00 18:00 - 02:00GCE 0.68 0.61 0.78EC2 0.89 0.73 0.6
Table 5.20: Effect of time of day. Chances of co-residency when an attackerchanges the launch time of his instances. The results were aggregated across all runconfigurations with 1 hour delay between victim and attacker launch times. All times arein PT.
increasing delay (results shown in Figure 5.19). Contrary to our expecta-tion, we did not find the chance of co-residency to drop to zero even fordelays as high as 16 and 32 hours. We speculate that the reason for this ob-servation could be that the system was under constant churn where someneighboring VMs on the victim’s machine were terminated. Note thatour leap-frog methodology may, in theory, interfere with the VM place-ment. But it is noteworthy that we observed increased number of uniqueco-resident pairs with increasing delays, suggesting fresh co-residencywith victim VMs over longer delays.
Effect of time of day. Prior works have shown that churn or load is oftencorrelated with the time of day [178]. Our simple reference placementpolicy does not have a notion of load and hence have no effect on time ofday. In reality, with limited number of servers in datacenters and limitednumber of capacity per host, load on the system has direct effect on theplacement behavior of any placement policy.
As expected, we observe small effect on VM placement based onthe time of day when attacker instances are launched (results shownin Table 5.20). Specifically, there is a slightly higher chance of co-residencyif the attacker instances are launched in the early morning for EC2 and atnight for GCE.
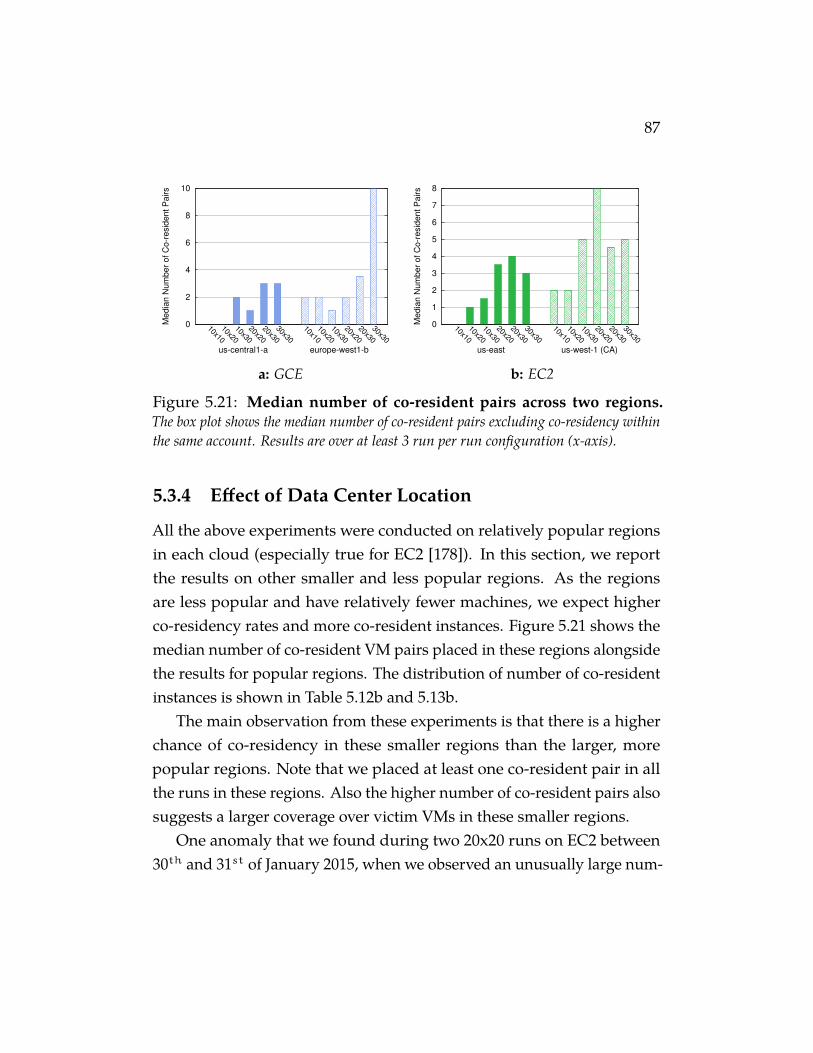
87
0
2
4
6
8
10
10x10
10x20
10x30
20x20
20x30
30x30
10x10
10x20
10x30
20x20
20x30
30x30
Media
n N
um
ber
of C
o-r
esid
ent P
airs
europe-west1-bus-central1-a
a: GCE
0
1
2
3
4
5
6
7
8
10x10
10x20
10x30
20x20
20x30
30x30
10x10
10x20
10x30
20x20
20x30
30x30
Media
n N
um
ber
of C
o-r
esid
ent P
airs
us-west-1 (CA)us-east
b: EC2
Figure 5.21: Median number of co-resident pairs across two regions.The box plot shows the median number of co-resident pairs excluding co-residency withinthe same account. Results are over at least 3 run per run configuration (x-axis).
5.3.4 Effect of Data Center Location
All the above experiments were conducted on relatively popular regionsin each cloud (especially true for EC2 [178]). In this section, we reportthe results on other smaller and less popular regions. As the regionsare less popular and have relatively fewer machines, we expect higherco-residency rates and more co-resident instances. Figure 5.21 shows themedian number of co-resident VM pairs placed in these regions alongsidethe results for popular regions. The distribution of number of co-residentinstances is shown in Table 5.12b and 5.13b.
The main observation from these experiments is that there is a higherchance of co-residency in these smaller regions than the larger, morepopular regions. Note that we placed at least one co-resident pair in allthe runs in these regions. Also the higher number of co-resident pairs alsosuggests a larger coverage over victim VMs in these smaller regions.
One anomaly that we found during two 20x20 runs on EC2 between30th and 31st of January 2015, when we observed an unusually large num-
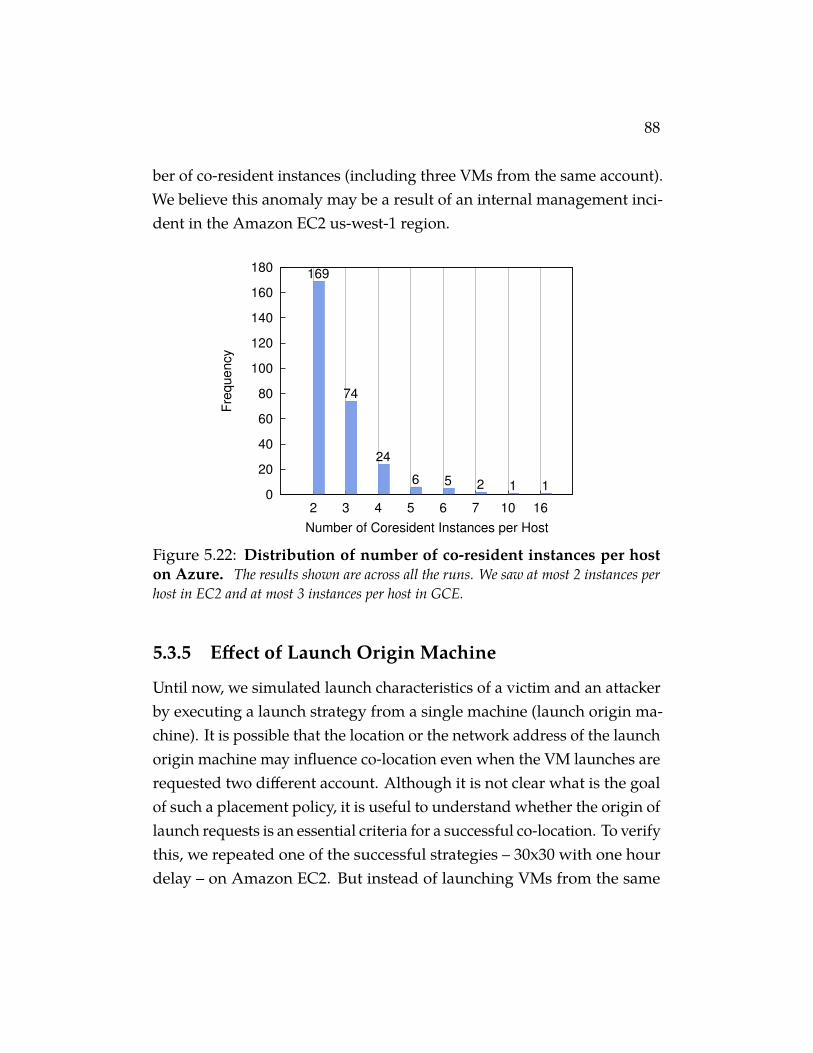
88
ber of co-resident instances (including three VMs from the same account).We believe this anomaly may be a result of an internal management inci-dent in the Amazon EC2 us-west-1 region.
0
20
40
60
80
100
120
140
160
180
2 3 4 5 6 7 10 16
Fre
qu
en
cy
Number of Coresident Instances per Host
169
74
24
6 5 2 1 1
Figure 5.22: Distribution of number of co-resident instances per hoston Azure. The results shown are across all the runs. We saw at most 2 instances perhost in EC2 and at most 3 instances per host in GCE.
5.3.5 Effect of Launch Origin Machine
Until now, we simulated launch characteristics of a victim and an attackerby executing a launch strategy from a single machine (launch origin ma-chine). It is possible that the location or the network address of the launchorigin machine may influence co-location even when the VM launches arerequested two different account. Although it is not clear what is the goalof such a placement policy, it is useful to understand whether the origin oflaunch requests is an essential criteria for a successful co-location. To verifythis, we repeated one of the successful strategies – 30x30 with one hourdelay – on Amazon EC2. But instead of launching VMs from the same
89
workstation at Wisconsin, we launched VMs under each account frommachines at different locations within the US. For the victim, we initiatedthe launch from a remote virtual machine in GCE in the us-east1-b region3.For the attacker, we used the same workstation at Wisconsin (central US).With three runs at three different times of day on a week day, we achievedco-location in 2 out of the 3 runs with a maximum of 3 co-resident pairs inone run. With the results gathered from previous experiments (conductedbetween December 2014 to February 2015), we expected all the three runsto result in at least one pair of co-resident instances between the attackerand the victim. We believe there are two reasons that we did not achieveco-location in all the three runs: 1) this new experiment was conductedin December 2015 almost one year after the first set of experiments andhence may be a result of any changes to the placement policy used byEC2, 2) Both set of experiments have their limitations. For example, theyinvolve only a small number of runs (3 or 9). Nevertheless, the fact thatwe observe some co-resident instances is sufficient to show that a singlelaunch origin machine is not a necessary criteria for successful co-locationin Amazon EC2.
5.3.6 Other Observations
We report several other interesting observations in this section. First, wefound more than two VMs can be co-resident on the same host on bothAzure and GCE, but not on EC2. Figure 5.22 shows the distribution ofnumber of co-resident instances per host. Particularly, in one of the runs,we placed 16 VMs on a single host.
Another interesting observation is related to co-resident instances fromthe same account. We term them as self-co-resident instances. We observedmany self-co-resident pairs on GCE and Azure (not shown). On the other
3This is one of the new regions recently introduced in GCE at the time of this experi-ment in December 2015.
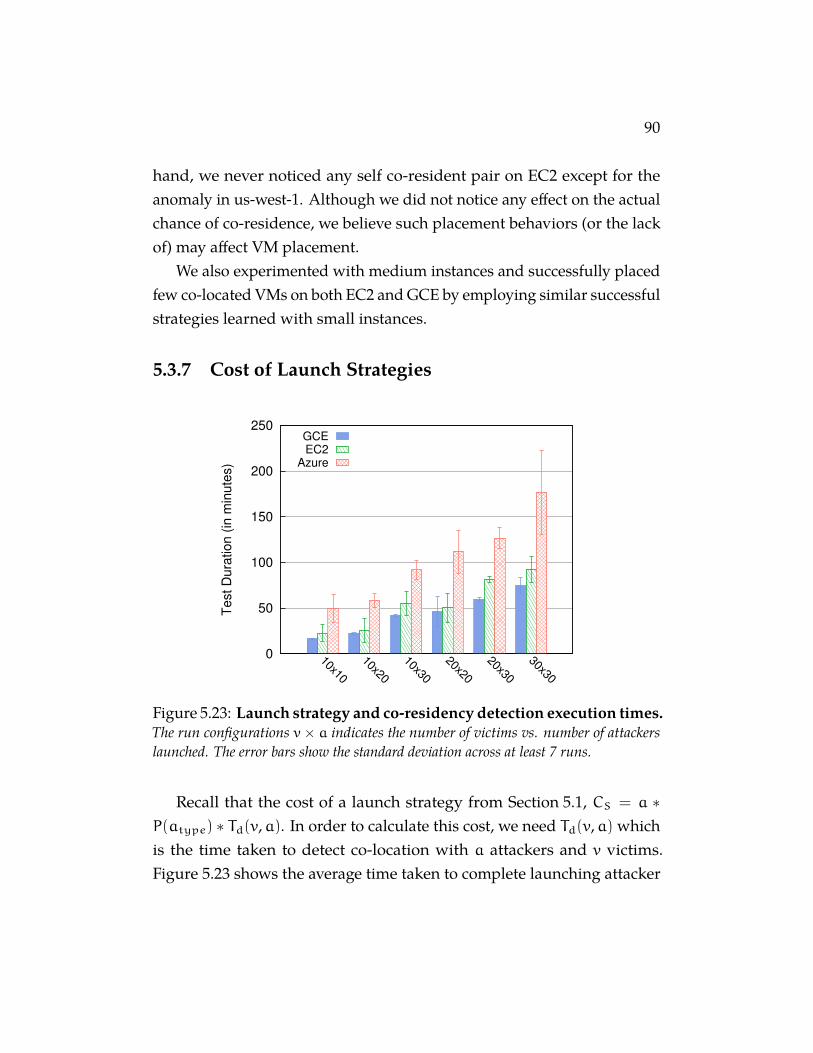
90
hand, we never noticed any self co-resident pair on EC2 except for theanomaly in us-west-1. Although we did not notice any effect on the actualchance of co-residence, we believe such placement behaviors (or the lackof) may affect VM placement.
We also experimented with medium instances and successfully placedfew co-located VMs on both EC2 and GCE by employing similar successfulstrategies learned with small instances.
5.3.7 Cost of Launch Strategies
0
50
100
150
200
250
10x10
10x20
10x30
20x20
20x30
30x30
Te
st
Du
ratio
n (
in m
inu
tes)
GCEEC2
Azure
Figure 5.23: Launch strategy and co-residency detection execution times.The run configurations v× a indicates the number of victims vs. number of attackerslaunched. The error bars show the standard deviation across at least 7 runs.
Recall that the cost of a launch strategy from Section 5.1, CS = a ∗P(atype) ∗ Td(v,a). In order to calculate this cost, we need Td(v,a) whichis the time taken to detect co-location with a attackers and v victims.Figure 5.23 shows the average time taken to complete launching attacker
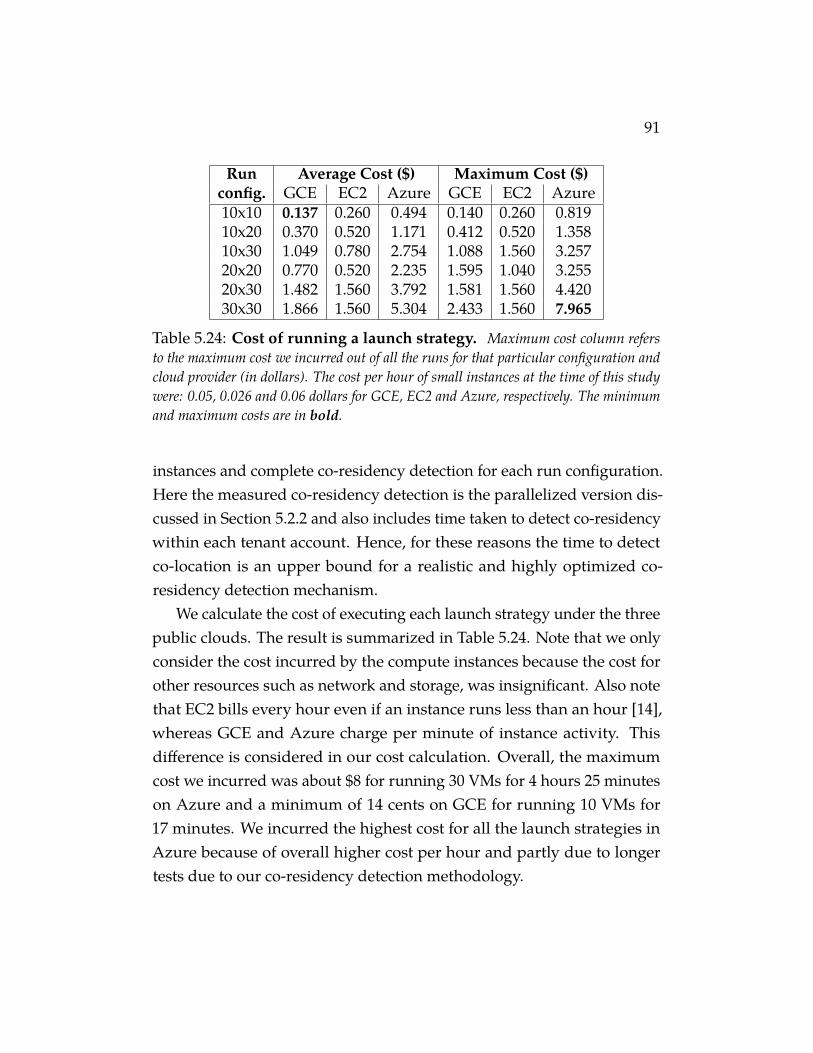
91
Run Average Cost ($) Maximum Cost ($)config. GCE EC2 Azure GCE EC2 Azure10x10 0.137 0.260 0.494 0.140 0.260 0.81910x20 0.370 0.520 1.171 0.412 0.520 1.35810x30 1.049 0.780 2.754 1.088 1.560 3.25720x20 0.770 0.520 2.235 1.595 1.040 3.25520x30 1.482 1.560 3.792 1.581 1.560 4.42030x30 1.866 1.560 5.304 2.433 1.560 7.965
Table 5.24: Cost of running a launch strategy. Maximum cost column refersto the maximum cost we incurred out of all the runs for that particular configuration andcloud provider (in dollars). The cost per hour of small instances at the time of this studywere: 0.05, 0.026 and 0.06 dollars for GCE, EC2 and Azure, respectively. The minimumand maximum costs are in bold.
instances and complete co-residency detection for each run configuration.Here the measured co-residency detection is the parallelized version dis-cussed in Section 5.2.2 and also includes time taken to detect co-residencywithin each tenant account. Hence, for these reasons the time to detectco-location is an upper bound for a realistic and highly optimized co-residency detection mechanism.
We calculate the cost of executing each launch strategy under the threepublic clouds. The result is summarized in Table 5.24. Note that we onlyconsider the cost incurred by the compute instances because the cost forother resources such as network and storage, was insignificant. Also notethat EC2 bills every hour even if an instance runs less than an hour [14],whereas GCE and Azure charge per minute of instance activity. Thisdifference is considered in our cost calculation. Overall, the maximumcost we incurred was about $8 for running 30 VMs for 4 hours 25 minuteson Azure and a minimum of 14 cents on GCE for running 10 VMs for17 minutes. We incurred the highest cost for all the launch strategies inAzure because of overall higher cost per hour and partly due to longertests due to our co-residency detection methodology.
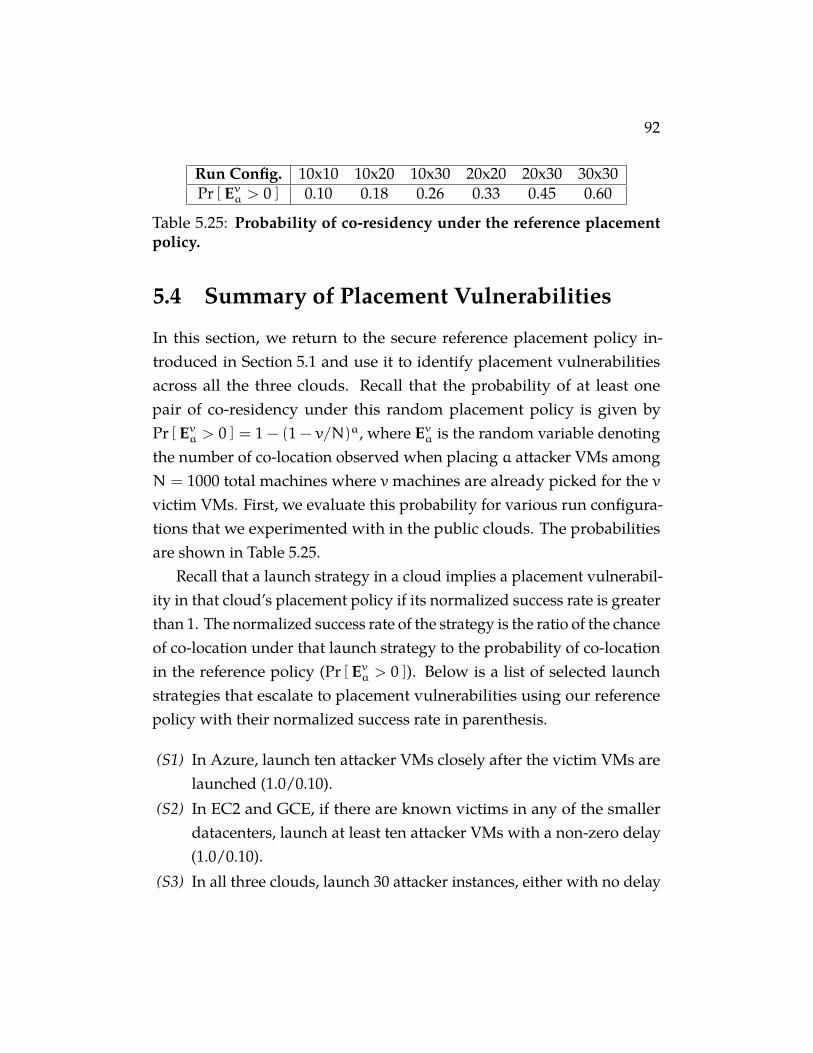
92
Run Config. 10x10 10x20 10x30 20x20 20x30 30x30Pr [ Ev
a > 0 ] 0.10 0.18 0.26 0.33 0.45 0.60
Table 5.25: Probability of co-residency under the reference placementpolicy.
5.4 Summary of Placement Vulnerabilities
In this section, we return to the secure reference placement policy in-troduced in Section 5.1 and use it to identify placement vulnerabilitiesacross all the three clouds. Recall that the probability of at least onepair of co-residency under this random placement policy is given byPr [ Ev
a > 0 ] = 1 − (1 − v/N)a, where Eva is the random variable denoting
the number of co-location observed when placing a attacker VMs amongN = 1000 total machines where v machines are already picked for the vvictim VMs. First, we evaluate this probability for various run configura-tions that we experimented with in the public clouds. The probabilitiesare shown in Table 5.25.
Recall that a launch strategy in a cloud implies a placement vulnerabil-ity in that cloud’s placement policy if its normalized success rate is greaterthan 1. The normalized success rate of the strategy is the ratio of the chanceof co-location under that launch strategy to the probability of co-locationin the reference policy (Pr [ Ev
a > 0 ]). Below is a list of selected launchstrategies that escalate to placement vulnerabilities using our referencepolicy with their normalized success rate in parenthesis.
(S1) In Azure, launch ten attacker VMs closely after the victim VMs arelaunched (1.0/0.10).
(S2) In EC2 and GCE, if there are known victims in any of the smallerdatacenters, launch at least ten attacker VMs with a non-zero delay(1.0/0.10).
(S3) In all three clouds, launch 30 attacker instances, either with no delay
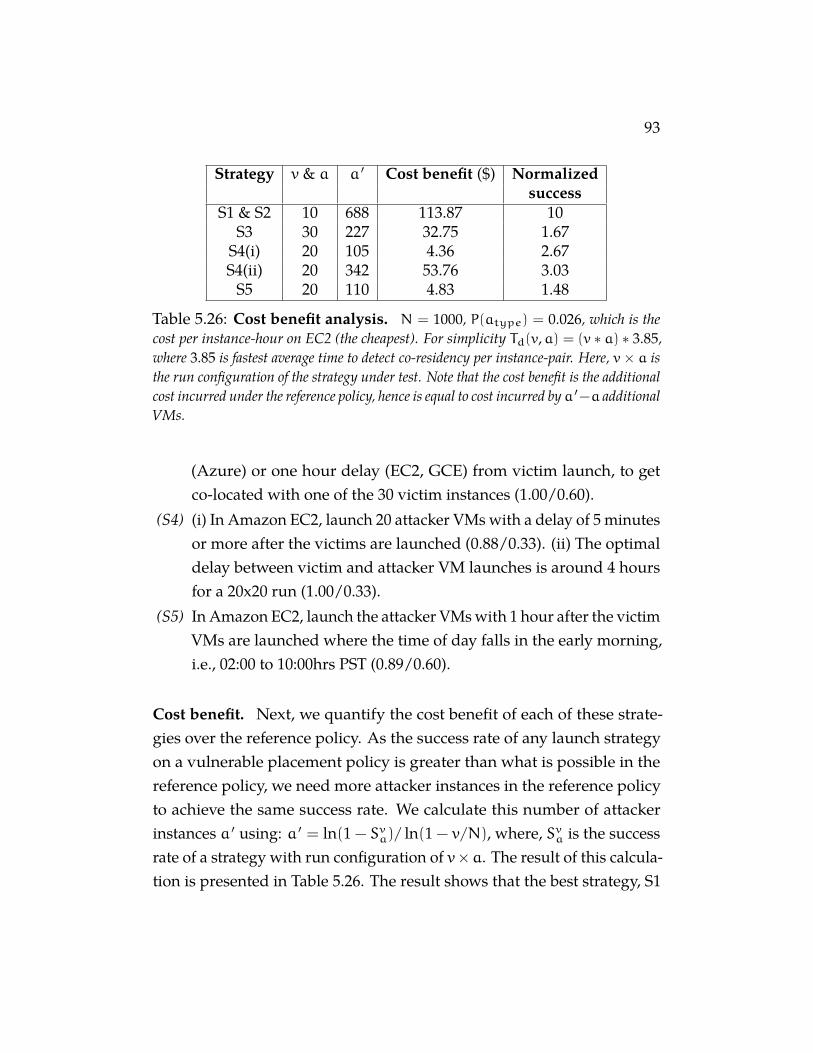
93
Strategy v & a a ′ Cost benefit ($) Normalizedsuccess
S1 & S2 10 688 113.87 10S3 30 227 32.75 1.67
S4(i) 20 105 4.36 2.67S4(ii) 20 342 53.76 3.03
S5 20 110 4.83 1.48
Table 5.26: Cost benefit analysis. N = 1000, P(atype) = 0.026, which is thecost per instance-hour on EC2 (the cheapest). For simplicity Td(v,a) = (v ∗ a) ∗ 3.85,where 3.85 is fastest average time to detect co-residency per instance-pair. Here, v× a isthe run configuration of the strategy under test. Note that the cost benefit is the additionalcost incurred under the reference policy, hence is equal to cost incurred by a ′−a additionalVMs.
(Azure) or one hour delay (EC2, GCE) from victim launch, to getco-located with one of the 30 victim instances (1.00/0.60).
(S4) (i) In Amazon EC2, launch 20 attacker VMs with a delay of 5 minutesor more after the victims are launched (0.88/0.33). (ii) The optimaldelay between victim and attacker VM launches is around 4 hoursfor a 20x20 run (1.00/0.33).
(S5) In Amazon EC2, launch the attacker VMs with 1 hour after the victimVMs are launched where the time of day falls in the early morning,i.e., 02:00 to 10:00hrs PST (0.89/0.60).
Cost benefit. Next, we quantify the cost benefit of each of these strate-gies over the reference policy. As the success rate of any launch strategyon a vulnerable placement policy is greater than what is possible in thereference policy, we need more attacker instances in the reference policyto achieve the same success rate. We calculate this number of attackerinstances a ′ using: a ′ = ln(1 − Sva)/ ln(1 − v/N), where, Sva is the successrate of a strategy with run configuration of v×a. The result of this calcula-tion is presented in Table 5.26. The result shows that the best strategy, S1
94
and S2, on all three cloud providers is $114 cheaper than what is possiblein the reference policy.
It is also evident that these metrics enable evaluating and comparingvarious launch strategies and their efficacy on various placement policiesboth on robust placements and attack cost. For example, note that althoughthe normalized success rate of S3 is lower than S4, it has a higher costbenefit for the attacker.
5.4.1 Limitations
Although we exhaustively experimented with a variety of placement vari-ables, the results have limitations. One major limitation of this study is thenumber of placement variables and the set of values for the variables thatwe used to experiment. For example, we limited our experiments withonly one instance type, one availability zone per region and used onlyone account for the victim VMs. Although different instance types mayexhibit different placement behavior, the presented results hold strongfor the chosen instance type. The only caveat that may affect the resultsis a placement policy that uses account ID for VM placement decisions.Since, we experimented with only one victim account (separate from thedesignated attacker account) across all providers our experiments, in theworst case, may have captured such a placement behavior that resultedin similar placement decisions for VMs from these two accounts. Giventhat we found similar results of co-location on three distinct public cloudssuch a worst-case scenario seems extremely unlikely.
Even though we ran at least 190 runs per cloud provider over a periodof 3 months to increase statistical significant of our results, we were stilllimited to at most 9 runs per run configuration (with 3 runs per time ofday). These limitations have only minor bearing on the results presented,if any, and the reported results are significant and impactful for cloudcomputing security research.

95
5.5 Placement Vulnerability in PaaS
While we mainly studied placement vulnerabilities in the context of IaaS,we also experimented with Platform-as-a-Service (PaaS) clouds. PaaSclouds offer elastic application hosting services. Unlike IaaS where usersare granted full control of a VM, PaaS provides managed compute tasks (orinstances) for the execution of hosted web applications, and allow multiplesuch instances to share the same operating system. These clouds useeither process-level isolation via file system access controls, or increasinglyLinux-style containers (see [192] for a more detailed description). As such,logical side-channels alone are usually sufficient for co-residency detectionpurposes. For instance, in PaaS clouds, co-resident instances often sharethe same public IP address as the host machine. This is because the host-to-instance network is often configured using Network Address Translation(NAT) and each instance is assigned a unique port under the host IPaddress for incoming connections.
We found that many such logical side-channel-based co-residencydetection approaches worked on PaaS clouds, even on those using con-tainers. Specifically, we used both system-level interrupt statistics via/proc/interrupts and shared public IP addresses of the instances to de-tect co-location in Heroku [87]. Note that both these techniques eitherrequire direct access to victim instances, or a software vulnerability toaccess procfs or initiate reverse connections, respectively.
Our brief investigation of co-location attacks in Heroku [86] showedthat naïve strategies like scaling two PaaS web applications to 30 instanceswith a time interval of 5 minutes between them, resulted in co-location in6 out of 10 attempts. Moreover, since the co-location detection was simpleand quick including the time taken for application scaling, we were able todo these experiments free of cost. This result reinforces prior findings onPaaS co-location attacks [192] and confirms the existence of cheap launchstrategies to achieve co-location and easy detection mechanisms to verify
96
it. We do not investigate PaaS clouds further in the rest of this dissertation.
97
6Stealing Performance from
Neighboring VMs
In Chapter 4.2 we witnessed the extent of performance interference be-tween VMs because of the lack of performance isolation. In this chapter,we will look at how a malicious user could abuse this lack of isolation forhis own performance by using an attack we call Resource-Freeing Attack.
We explore an approach based on two observations. First, applicationsare often limited by a single bottleneck resource, such as memory ornetwork bandwidth. Second, we observe that an application’s use ofresources can change unevenly based on workload. For example, a webserver may be network limited when serving static content, but CPUlimited when serving dynamic content.
A resource-freeing attack (RFA) leverages these observations to improve aVM’s performance by forcing a competing VM to saturate some bottleneck.If done carefully, this can slow down or shift the competing application’suse of a desired resource. For example, we investigate in detail an RFAthat improves cache performance when co-resident with a heavily usedApache web server. Greedy users will benefit from running the RFA, andthe victim ends up paying for increased load and the costs of reducedlegitimate traffic.
We begin this work with a comprehensive study of the resource in-terference exhibited by the Xen hypervisor in our local testbed (§ 6.2).In addition to testing for contention of a single resource, these results
98
show that workloads using different resources can contend as well, andthat scheduling choices on multicore processors greatly affect the perfor-mance loss. We then develop a proof-of-concept resource-freeing attackfor the cache-network contention scenario described above (§ 6.3). In acontrolled environment, we determine the necessary conditions for a suc-cessful resource-freeing attack, and show that average performance of acache-sensitive benchmark can be improved by as much as 212% when thetwo VMs always share a single core, highlighting the potential for RFAs toease cache contention for the attacker. If VMs float among all cores (thedefault configuration in Xen), we still see performance gains of up to 60%.When applied to several SPEC benchmarks [84], whose more balancedworkloads are less effected by cache contention, RFAs still provide benefit:in one case it reduces the effect of contention by 66.5% which translated toa 6% performance improvement.
Finally, we show that resource-freeing attacks are possible in uncon-trolled settings by demonstrating their use on Amazon’s EC2 (§ 6.3.2).Using co-resident virtual machines launched under accounts we control,we show that introducing additional workload on one virtual machinecan improve the performance of our cache-sensitive benchmark by up to13% and provides speedups for several SPEC benchmarks as well.
6.1 Resource-freeing Attacks
The interference encountered between VMs on public clouds motivates anew class of attacks, which we call resource-freeing attacks (RFAs). Thegeneral idea of an RFA is that when a guest virtual machine suffers due toperformance interference, it can affect the workload of other VMs on thesame physical server in a way that improves its own performance.
Attack setting. We consider a setting in which an attacker VM and one ormore victim VMs are co-resident on the same physical server in a public
99
cloud. There may be additional co-resident VMs as well. It is well knownthat public clouds make extensive use of multi-tenancy.
The RFAs we consider in Section 6.3 assume that the victim is running apublic network service, such as a web server. This is a frequent occurrencein public clouds. Measurements in 2009 showed that approximately 25%of IP addresses in one portion of EC2’s address space hosted a publiclyaccessible web server [151].
Launching RFAs that exploit a public network service require thatthe attacker knows with whom it is co-resident. On many clouds this isstraightforward: the attacker can scan nearby internal IP addresses onappropriate ports to see if there exist public network services. This wasshown to work in Amazon EC2, where for example m1.small co-residentinstances had internal IP addresses whose numerical distance from anattacker’s internal IP address was at most eight [151]. Furthermore, packetround-trip times can be used to verify co-residence. We expect that similartechniques work on other clouds, such as Rackspace.
The attacker seeks to interfere with the victim(s) to ease contentionfor resources on the node or nearby network. The attacker consists oftwo logical components, a beneficiary and a helper. The beneficiary is theapplication whose efficiency the attacker seeks to improve. The helperis a process, either running from within the same instance or on anothermachine, that the attacker will use to introduce new workload on thevictim. Without loss of generality, we will describe attacks in terms of onevictim, one beneficiary, and one helper.
We assume the beneficiary’s performance is reduced because of inter-ference on a single contended resource, termed the target resource. Forexample, a disk-bound beneficiary may suffer from competing disk ac-cesses from victim VMs.
Conceptual framework. The beneficiary and the helper work togetherto change the victim’s resource consumption in a manner that frees up the
100
target resource. This is done by increasing the time the victim spends onone portion of its workload, which limits its use of other resources.
There are two requirements for an RFA. First, an RFA must raise thevictim’s usage of one resource until it reaches a bottleneck. Once in abottleneck, the victim cannot increase usage of any resources because ofthe bottleneck. For example, once a web server saturates the network, itcannot use any more CPU or disk bandwidth. However, simply raising thevictim to a bottleneck does not free resources; it just prevents additionaluse of them. The second requirement of an RFA is to shift the victim’sresource usage so that a greater fraction of time is spent on the bottleneckresource, which prevents spending time on other resources. Thus, thebottleneck resource crowds out other resource usage. As an example, aweb server may be sent requests for low-popularity web pages that causerandom disk accesses. The latency of these requests may crowd requestsfor popular pages and overall reduce the CPU usage of the server.
There are two shifts in target resource usage that can help the benefi-ciary. First, if the victim is forced to use less of the resource, then theremay be more available for the beneficiary. Second, even if the victim usesthe same amount of the resource, the accesses may be shifted in time. Forexample, shifting a victim’s workload so that cache accesses are consol-idated into fewer, longer periods can aid the beneficiary by ensuring itretains cache contents for a larger percentage of its run time. A similareffect could be achieved for resources like the hard disk if we are able toprovide the beneficiary with longer periods of uninterrupted sequentialaccesses.
Modifying resource consumption. The helper modifies the victim’s re-source usage and pushes it to overload a bottleneck resource. This can bedone externally, by introducing new work over the network, or internally,by increasing contention for other shared resources.
A helper may introduce additional load to a server that both increases
101
its total load and skews its workload towards a particular resource. Theexample above of requesting unpopular content skews a web server’sresource usage away from the CPU towards the disk. This can createa bottleneck at either the server’s connection limit or disk bandwidth.Similarly, the helper may submit CPU-intensive requests for dynamic datathat drive up the server’s CPU usage until it exceeds its credit limit and ispreempted by the hypervisor.
The helper can also affect performance by increasing the load on othercontended resources. Consider again a web server that makes use of thedisk to fetch content. A helper running in the beneficiary’s instance canintroduce unnecessary disk requests in order to degrade the victim’s diskperformance and cause the disk to become a bottleneck. Similarly, thehelper could slow the victim by introducing additional network trafficthat makes network bandwidth a bottleneck for the server.
There exist some obvious ways an attacker might modify the workloadof a victim. If the attacker knows how to remotely crash the victim viasome exploitable vulnerability, then the helper can quite directly free upthe target resource (among others). However this is not only noisy, butrequires a known vulnerability. Instead, we focus on the case that theattacker can affect the victim only through use (or abuse) of legitimateAPIs.
Example RFA. As a simple example of an RFA, we look at the setting oftwo web servers, running in separate VMs on the same physical node, thatcompete for network bandwidth. Assume they both serve a mix of staticand dynamic content. Under similar loads, a work-conserving networkscheduler will fairly share network capacity and give each web server50% (indeed, our experiment show that Xen does fairly share networkbandwidth).
However, if we introduce CPU-intensive requests for dynamic contentto one web server that saturate the CPU time available to the server, we
102
find that the other server’s share of the network increases from 50% to 85%,because there is now less competing traffic. We note that this requiresa work-conserving scheduler that splits excess network capacity acrossthe VMs requesting it. A non-work conserving scheduler would cap thebandwidth available to each VM, and thus a decline in the use by one VMwould not increase the bandwidth available to others.
6.2 Contention Measurements
In order to understand which resources are amenable to resource-freeingattacks in a Xen environment, we created a local testbed that attempts toduplicate a typical configuration found in EC2 (in particular, the m1.smallinstance type).
Testbed. Although Amazon does not make their precise hardware config-urations public, we can still gain some insight into the hardware on whichan instance is running by looking at system files and the CPUID instruc-tion. Based on this, we use a platform consisting of a 4-core, 2-package2.66 GHz Intel Xeon E5430 with 6MB of shared L2 cache per package and4GB of main memory. This is representative of some of the architecturesused by EC2.
We install Xen on the testbed, using the configurations shown inTable 6.1. Again, while we do not have precise knowledge of Amazon’ssetup for Xen, our configuration approximates the EC2 m1.small instance.
This configuration allows us to precisely control the workload by vary-ing scheduling policies and by fixing workloads to different cores. Inaddition, it enables us to obtain internal statistics from Xen, such as tracesof scheduling activities.
Table 6.2 describes the workloads we use for stressing different hard-ware resources. The workloads run in a virtual machine with one VCPU.
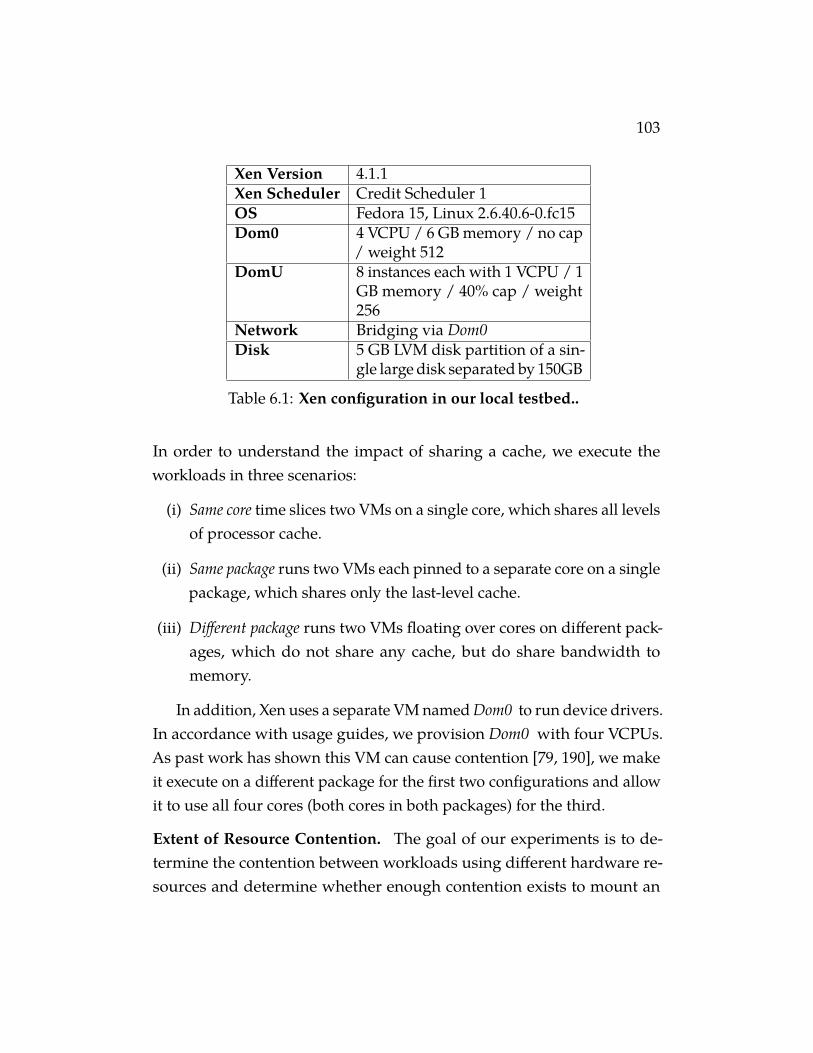
103
Xen Version 4.1.1Xen Scheduler Credit Scheduler 1OS Fedora 15, Linux 2.6.40.6-0.fc15Dom0 4 VCPU / 6 GB memory / no cap
/ weight 512DomU 8 instances each with 1 VCPU / 1
GB memory / 40% cap / weight256
Network Bridging via Dom0Disk 5 GB LVM disk partition of a sin-
gle large disk separated by 150GB
Table 6.1: Xen configuration in our local testbed..
In order to understand the impact of sharing a cache, we execute theworkloads in three scenarios:
(i) Same core time slices two VMs on a single core, which shares all levelsof processor cache.
(ii) Same package runs two VMs each pinned to a separate core on a singlepackage, which shares only the last-level cache.
(iii) Different package runs two VMs floating over cores on different pack-ages, which do not share any cache, but do share bandwidth tomemory.
In addition, Xen uses a separate VM named Dom0 to run device drivers.In accordance with usage guides, we provision Dom0 with four VCPUs.As past work has shown this VM can cause contention [79, 190], we makeit execute on a different package for the first two configurations and allowit to use all four cores (both cores in both packages) for the third.
Extent of Resource Contention. The goal of our experiments is to de-termine the contention between workloads using different hardware re-sources and determine whether enough contention exists to mount an
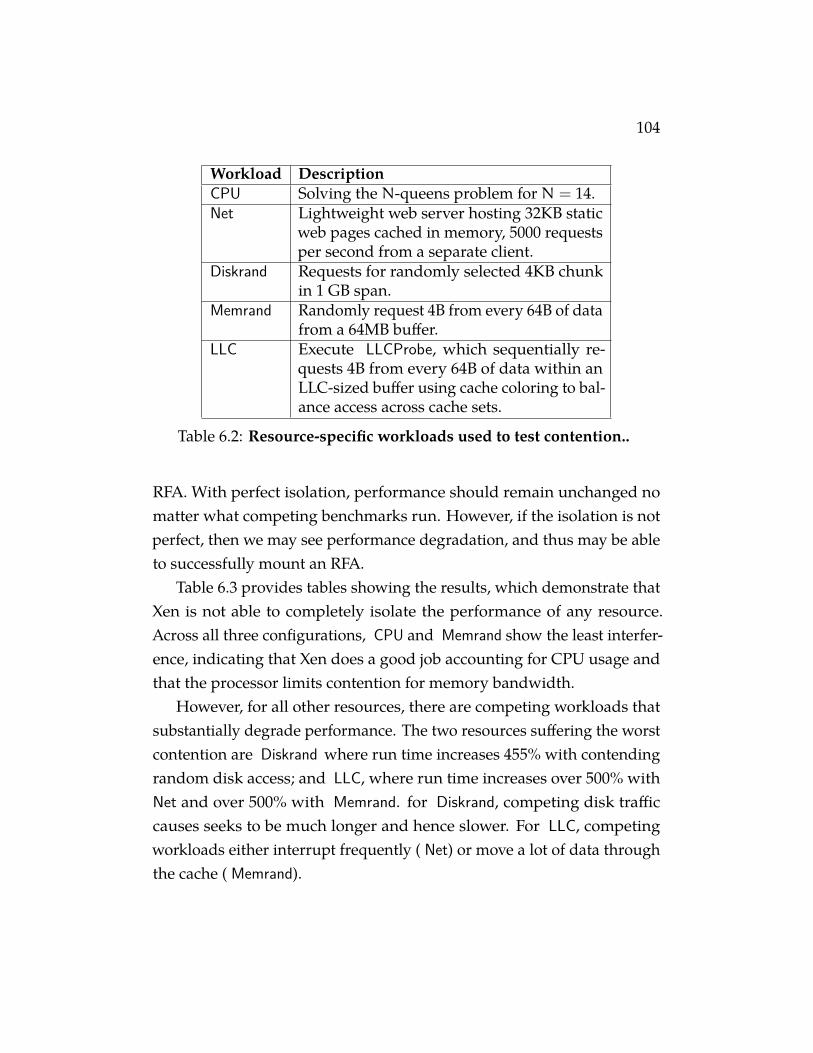
104
Workload DescriptionCPU Solving the N-queens problem for N = 14.Net Lightweight web server hosting 32KB static
web pages cached in memory, 5000 requestsper second from a separate client.
Diskrand Requests for randomly selected 4KB chunkin 1 GB span.
Memrand Randomly request 4B from every 64B of datafrom a 64MB buffer.
LLC Execute LLCProbe, which sequentially re-quests 4B from every 64B of data within anLLC-sized buffer using cache coloring to bal-ance access across cache sets.
Table 6.2: Resource-specific workloads used to test contention..
RFA. With perfect isolation, performance should remain unchanged nomatter what competing benchmarks run. However, if the isolation is notperfect, then we may see performance degradation, and thus may be ableto successfully mount an RFA.
Table 6.3 provides tables showing the results, which demonstrate thatXen is not able to completely isolate the performance of any resource.Across all three configurations, CPU and Memrand show the least interfer-ence, indicating that Xen does a good job accounting for CPU usage andthat the processor limits contention for memory bandwidth.
However, for all other resources, there are competing workloads thatsubstantially degrade performance. The two resources suffering the worstcontention are Diskrand where run time increases 455% with contendingrandom disk access; and LLC, where run time increases over 500% withNet and over 500% with Memrand. for Diskrand, competing disk trafficcauses seeks to be much longer and hence slower. For LLC, competingworkloads either interrupt frequently ( Net) or move a lot of data throughthe cache ( Memrand).
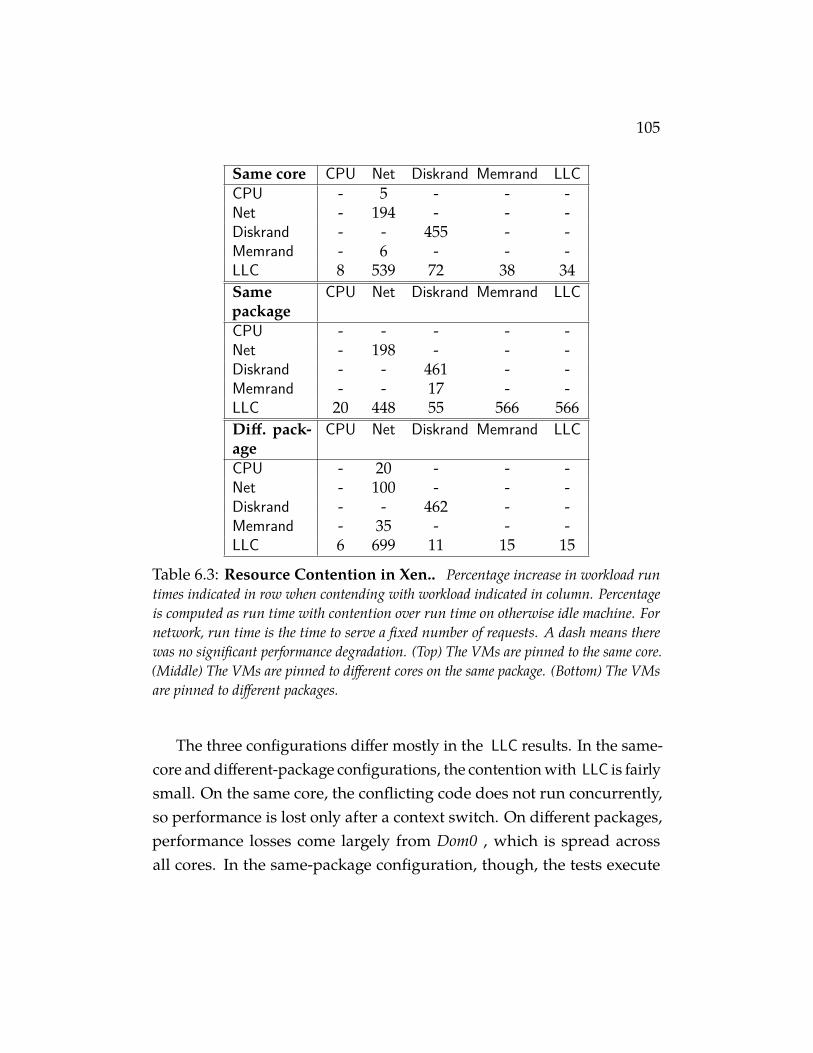
105
Same core CPU Net Diskrand Memrand LLCCPU - 5 - - -Net - 194 - - -Diskrand - - 455 - -Memrand - 6 - - -LLC 8 539 72 38 34Samepackage
CPU Net Diskrand Memrand LLC
CPU - - - - -Net - 198 - - -Diskrand - - 461 - -Memrand - - 17 - -LLC 20 448 55 566 566Diff. pack-age
CPU Net Diskrand Memrand LLC
CPU - 20 - - -Net - 100 - - -Diskrand - - 462 - -Memrand - 35 - - -LLC 6 699 11 15 15
Table 6.3: Resource Contention in Xen.. Percentage increase in workload runtimes indicated in row when contending with workload indicated in column. Percentageis computed as run time with contention over run time on otherwise idle machine. Fornetwork, run time is the time to serve a fixed number of requests. A dash means therewas no significant performance degradation. (Top) The VMs are pinned to the same core.(Middle) The VMs are pinned to different cores on the same package. (Bottom) The VMsare pinned to different packages.
The three configurations differ mostly in the LLC results. In the same-core and different-package configurations, the contention with LLC is fairlysmall. On the same core, the conflicting code does not run concurrently,so performance is lost only after a context switch. On different packages,performance losses come largely from Dom0 , which is spread acrossall cores. In the same-package configuration, though, the tests execute
106
concurrently and thus one program may displace data while the other isrunning.
One pair of resources stands out as the worst case across all configu-rations: the degradation caused by Net on LLC. This occurs for three rea-sons: (i) the HTTP requests cause frequent interrupts and hence frequentpreemptions due to boost; (ii) in the same-core and same-package configu-rations the web server itself runs frequently and displaces cache contents;and (iii) Dom0 runs the NIC device driver in the different-package config-uration. We will therefore focus our investigation of RFAs on the conflictbetween such workloads, and leave exploration of RFAs for other workloadcombinations to future work.
6.3 RFA for Cache versus Network
As we saw, a particularly egregious performance loss is felt by cache-bound workloads when co-resident with a network server. Unfortunately,co-residence of such workloads seems a likely scenario in public clouds:network servers are a canonical application (EC2 alone hosts several mil-lion websites [134]) while cache-bound processes abound. The remainderof the work seeks to understand whether a greedy customer can mountan RFA to increase performance when co-resident with one or more webservers.
Setting. We start by providing a full description of the setting on whichwe focus. The beneficiary is a cache bound program running alone in a VMwith one VCPU. We use the LLCProbe benchmark as stand-in for a real ben-eficiary. LLCProbe is intentionally a synthetic benchmark and is designedto expose idealized worst-case behavior. Nevertheless, Its pointer-chasingbehavior is reflected in real workloads [76]. We will also investigate morebalanced benchmarks such as SPEC CPU2006 [84], SPECjbb2005 [161] andgraph500 [76].
107
In addition to the beneficiary, there is a victim VM co-resident on thesame physical machine running the Apache web server (version 2.2.22).It is configured to serve a mix of static and dynamic content. The staticcontent consists of 4, 096 32KB web pages (enough to overlow the 6MBLLC) containing random bytes. The dynamic content is a CGI script thatcan be configured to consume varying amounts of CPU time via busylooping. This script serves as a stand in for either an actual web serverserving dynamic content on the web, or the effects of DoS attacks thatdrive up CPU usage, such as complexity attacks [56, 60]. The script takes aparameter to control duration of the attack, and spins until wall-clock timeadvances that duration. We note that this does not reflect the behaviorof most DoS attacks, which take a fixed number of cycles, but we use itto provide better control over the web server’s behavior. We confirmedthat the behaviors exhibited also arise with CGI scripts performing a fixednumber of computations.
The Apache server is configured with the mod_mem_cache module toreduce the latency of static content and FastCGI to pre-fork a process forCGI scripts. We also use the Multi-Processing Module for workers, whichis a hybrid multithreaded multi-process Apache web server design usedfor better performance and for handling larger request loads.
To simulate load on the web server, we use a custom-built multi-threaded load generator that sends web requests for the static content hostedby the victim. Each client thread in the load generator randomly selectsa static web page to request from the web server. The load generator in-cludes a rate controller thread that ensures that the actual load on theweb server does not exceed the specified request rate. The client uses 32worker threads, which we empirically determined is enough to sustainthe web server’s maximum rate. Requests are synchronous and hence theload generator waits for the response to the previous request and thena timeout (to prevent sending requests too fast) before sending the next
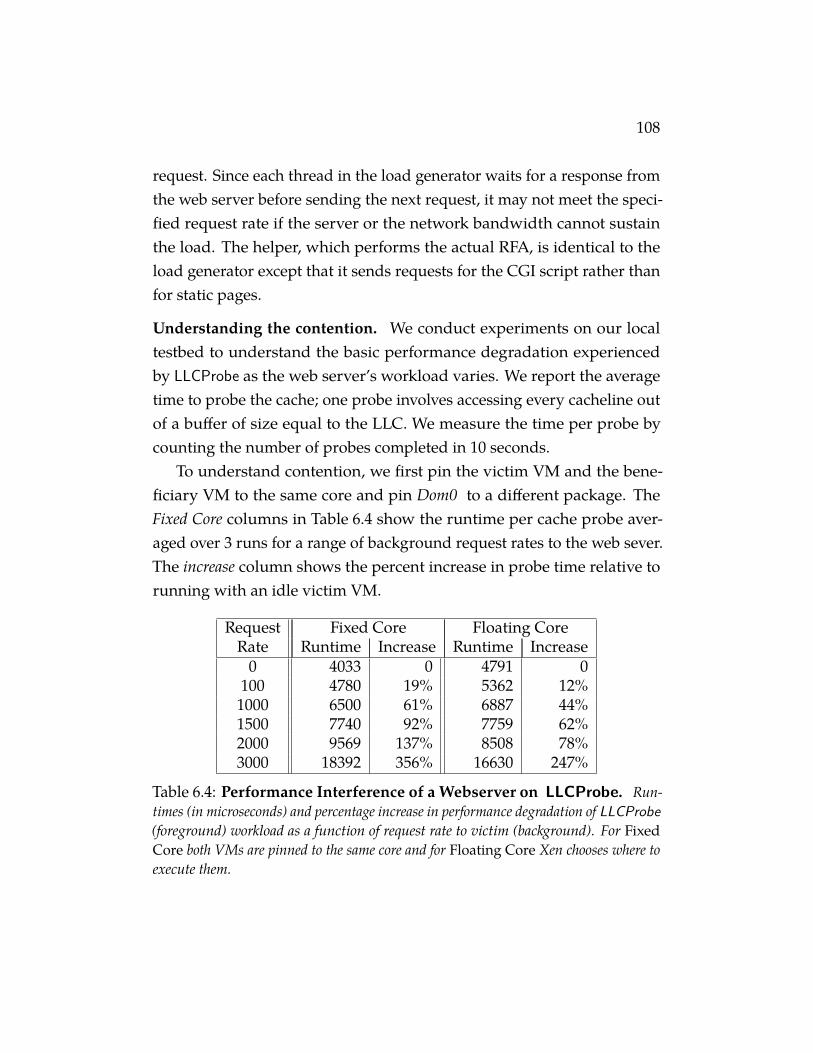
108
request. Since each thread in the load generator waits for a response fromthe web server before sending the next request, it may not meet the speci-fied request rate if the server or the network bandwidth cannot sustainthe load. The helper, which performs the actual RFA, is identical to theload generator except that it sends requests for the CGI script rather thanfor static pages.
Understanding the contention. We conduct experiments on our localtestbed to understand the basic performance degradation experiencedby LLCProbe as the web server’s workload varies. We report the averagetime to probe the cache; one probe involves accessing every cacheline outof a buffer of size equal to the LLC. We measure the time per probe bycounting the number of probes completed in 10 seconds.
To understand contention, we first pin the victim VM and the bene-ficiary VM to the same core and pin Dom0 to a different package. TheFixed Core columns in Table 6.4 show the runtime per cache probe aver-aged over 3 runs for a range of background request rates to the web sever.The increase column shows the percent increase in probe time relative torunning with an idle victim VM.
Request Fixed Core Floating CoreRate Runtime Increase Runtime Increase
0 4033 0 4791 0100 4780 19% 5362 12%
1000 6500 61% 6887 44%1500 7740 92% 7759 62%2000 9569 137% 8508 78%3000 18392 356% 16630 247%
Table 6.4: Performance Interference of a Webserver on LLCProbe. Run-times (in microseconds) and percentage increase in performance degradation of LLCProbe(foreground) workload as a function of request rate to victim (background). For FixedCore both VMs are pinned to the same core and for Floating Core Xen chooses where toexecute them.
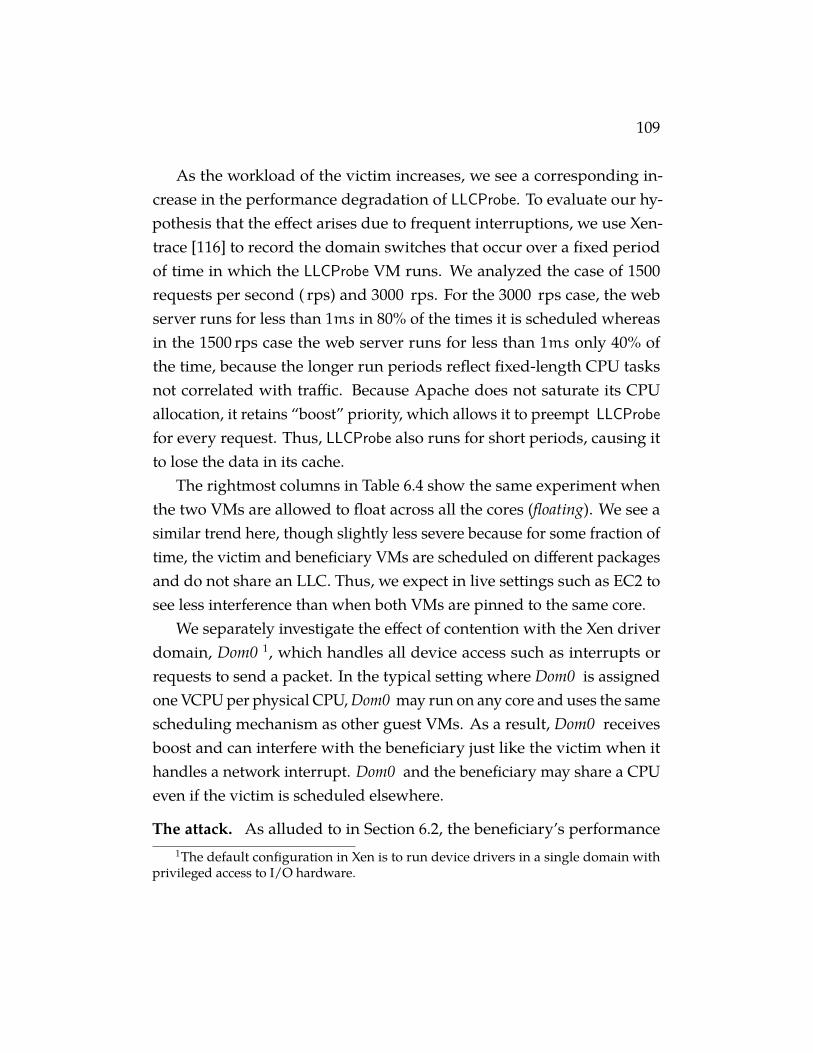
109
As the workload of the victim increases, we see a corresponding in-crease in the performance degradation of LLCProbe. To evaluate our hy-pothesis that the effect arises due to frequent interruptions, we use Xen-trace [116] to record the domain switches that occur over a fixed periodof time in which the LLCProbe VM runs. We analyzed the case of 1500requests per second ( rps) and 3000 rps. For the 3000 rps case, the webserver runs for less than 1ms in 80% of the times it is scheduled whereasin the 1500 rps case the web server runs for less than 1ms only 40% ofthe time, because the longer run periods reflect fixed-length CPU tasksnot correlated with traffic. Because Apache does not saturate its CPUallocation, it retains “boost” priority, which allows it to preempt LLCProbefor every request. Thus, LLCProbe also runs for short periods, causing itto lose the data in its cache.
The rightmost columns in Table 6.4 show the same experiment whenthe two VMs are allowed to float across all the cores (floating). We see asimilar trend here, though slightly less severe because for some fraction oftime, the victim and beneficiary VMs are scheduled on different packagesand do not share an LLC. Thus, we expect in live settings such as EC2 tosee less interference than when both VMs are pinned to the same core.
We separately investigate the effect of contention with the Xen driverdomain, Dom0 1, which handles all device access such as interrupts orrequests to send a packet. In the typical setting where Dom0 is assignedone VCPU per physical CPU, Dom0 may run on any core and uses the samescheduling mechanism as other guest VMs. As a result, Dom0 receivesboost and can interfere with the beneficiary just like the victim when ithandles a network interrupt. Dom0 and the beneficiary may share a CPUeven if the victim is scheduled elsewhere.
The attack. As alluded to in Section 6.2, the beneficiary’s performance1The default configuration in Xen is to run device drivers in a single domain with
privileged access to I/O hardware.
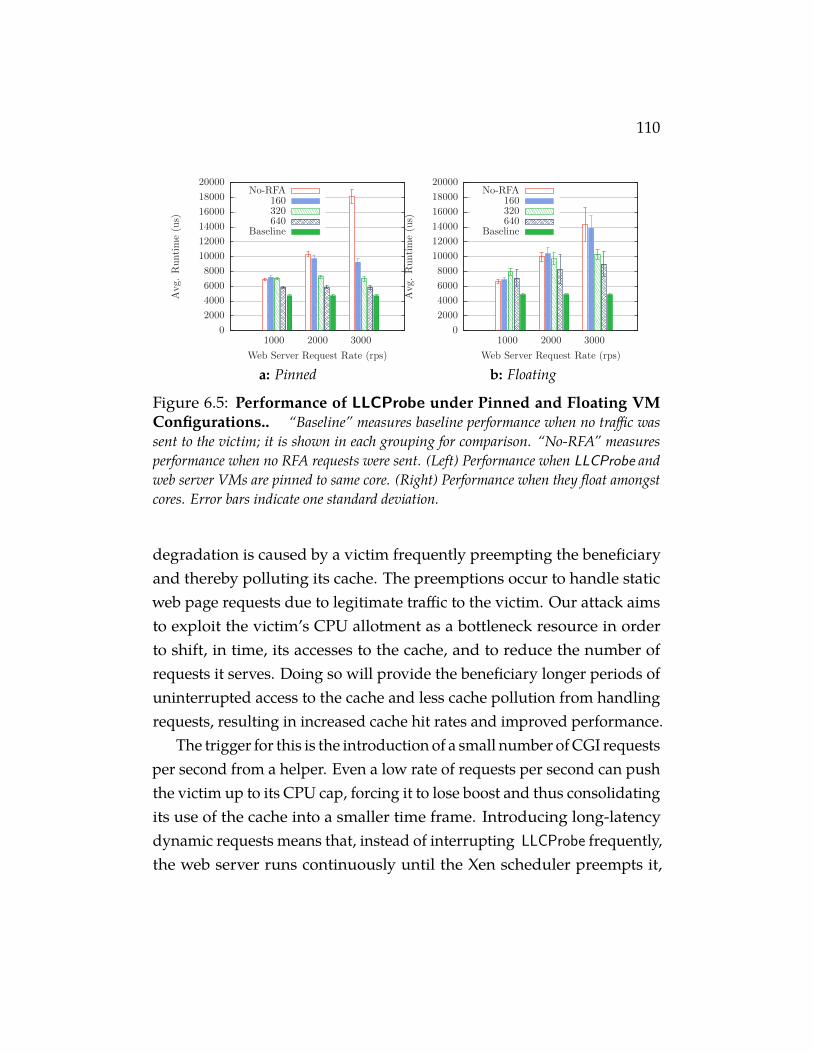
110
0
2000
4000
6000
8000
10000
12000
14000
16000
18000
20000
1000 2000 3000
Avg.Runtime(us)
Web Server Request Rate (rps)
No-RFA160320640
Baseline
a: Pinned
0
2000
4000
6000
8000
10000
12000
14000
16000
18000
20000
1000 2000 3000
Avg.Runtime(us)
Web Server Request Rate (rps)
No-RFA160320640
Baseline
b: Floating
Figure 6.5: Performance of LLCProbe under Pinned and Floating VMConfigurations.. “Baseline” measures baseline performance when no traffic wassent to the victim; it is shown in each grouping for comparison. “No-RFA” measuresperformance when no RFA requests were sent. (Left) Performance when LLCProbe andweb server VMs are pinned to same core. (Right) Performance when they float amongstcores. Error bars indicate one standard deviation.
degradation is caused by a victim frequently preempting the beneficiaryand thereby polluting its cache. The preemptions occur to handle staticweb page requests due to legitimate traffic to the victim. Our attack aimsto exploit the victim’s CPU allotment as a bottleneck resource in orderto shift, in time, its accesses to the cache, and to reduce the number ofrequests it serves. Doing so will provide the beneficiary longer periods ofuninterrupted access to the cache and less cache pollution from handlingrequests, resulting in increased cache hit rates and improved performance.
The trigger for this is the introduction of a small number of CGI requestsper second from a helper. Even a low rate of requests per second can pushthe victim up to its CPU cap, forcing it to lose boost and thus consolidatingits use of the cache into a smaller time frame. Introducing long-latencydynamic requests means that, instead of interrupting LLCProbe frequently,the web server runs continuously until the Xen scheduler preempts it,
111
which allows LLCProbe to run uninterrupted. The Xen credit schedulerallows a maximum of 30ms of credit per VCPU, with each domain beingallotted only one VCPU in our case. Therefore, the helper sends RFArequests that invoke the CPU-intensive CGI helper in an effort to use up thevictim’s CPU allotment. In addition, the CPU-intensive requests displacelegitimate traffic and thus reduce the rate of requests that pollute the cache.
Here the helper is any system that can make CGI requests. Giventhe very low rate required, this could be a free micro instance runningon the cloud or —scaling up— a single system that performs the RFAagainst many victims in parallel (that are each co-resident with a differentbeneficiary). While for some applications the helper might be put to betteruse helping with whatever computation the beneficiary is performing, inothers this will not be possible (e.g., if it is not easily parallelized) or notas cost effective. We also mention that one might include a lightweighthelper on the same VM as the beneficiary, but this would require care toensure that interference from the client does not outweigh the potentialspeedup due to the RFA. In our experiments to follow, we run the helperon a system different from the one on which the beneficiary and victimco-reside.
6.3.1 Evaluation on Local Testbed
The results above show that LLCProbe experiences a significant perfor-mance gap when running on an otherwise idle server as opposed to onethat is hosting one or more active web servers. In this section, we showthat this performance gap can be narrowed using the RFA outlined above.In the following we look at the effectiveness of the attack under a range ofRFA intensities, which specifies the their total runtime per second. Unlessotherwise noted, we implement the RFA using CGI requests specifying40ms of computation. We investigate a range of RFA intensities: 160, 320,and 640ms. This allows understanding both the effect of overloading the
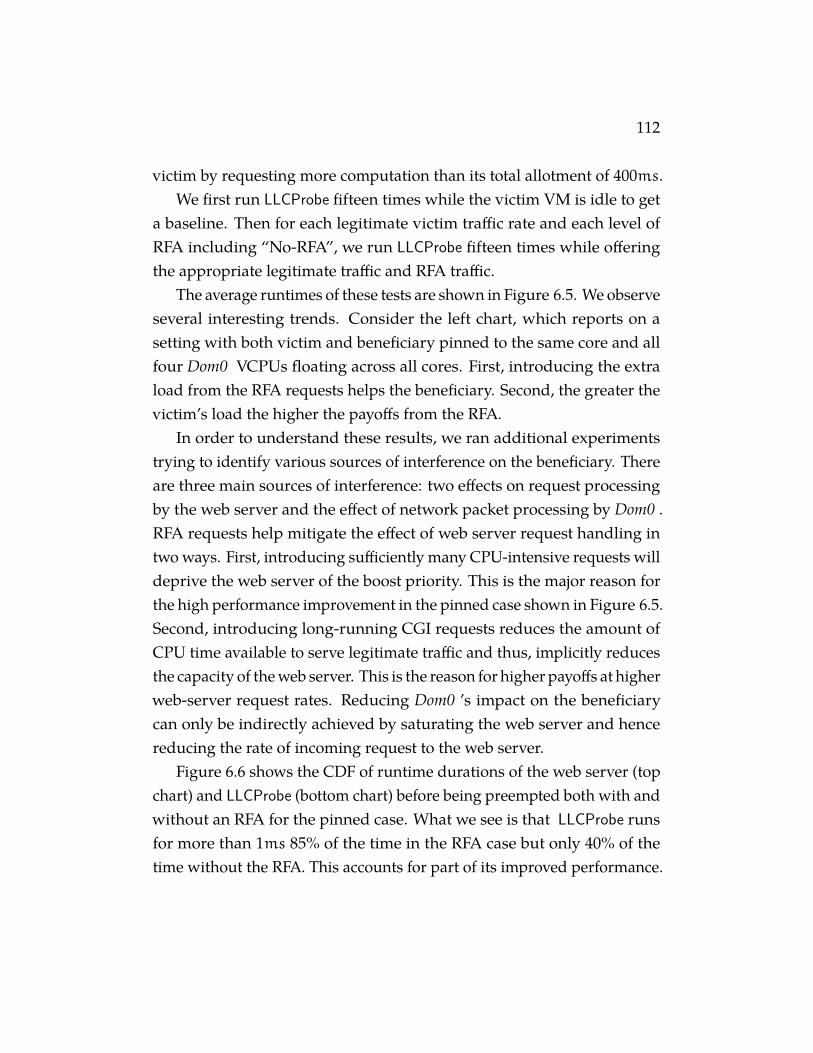
112
victim by requesting more computation than its total allotment of 400ms.We first run LLCProbe fifteen times while the victim VM is idle to get
a baseline. Then for each legitimate victim traffic rate and each level ofRFA including “No-RFA”, we run LLCProbe fifteen times while offeringthe appropriate legitimate traffic and RFA traffic.
The average runtimes of these tests are shown in Figure 6.5. We observeseveral interesting trends. Consider the left chart, which reports on asetting with both victim and beneficiary pinned to the same core and allfour Dom0 VCPUs floating across all cores. First, introducing the extraload from the RFA requests helps the beneficiary. Second, the greater thevictim’s load the higher the payoffs from the RFA.
In order to understand these results, we ran additional experimentstrying to identify various sources of interference on the beneficiary. Thereare three main sources of interference: two effects on request processingby the web server and the effect of network packet processing by Dom0 .RFA requests help mitigate the effect of web server request handling intwo ways. First, introducing sufficiently many CPU-intensive requests willdeprive the web server of the boost priority. This is the major reason forthe high performance improvement in the pinned case shown in Figure 6.5.Second, introducing long-running CGI requests reduces the amount ofCPU time available to serve legitimate traffic and thus, implicitly reducesthe capacity of the web server. This is the reason for higher payoffs at higherweb-server request rates. Reducing Dom0 ’s impact on the beneficiarycan only be indirectly achieved by saturating the web server and hencereducing the rate of incoming request to the web server.
Figure 6.6 shows the CDF of runtime durations of the web server (topchart) and LLCProbe (bottom chart) before being preempted both with andwithout an RFA for the pinned case. What we see is that LLCProbe runsfor more than 1ms 85% of the time in the RFA case but only 40% of thetime without the RFA. This accounts for part of its improved performance.

113
a: Webserver b: LLCProbe
Figure 6.6: Cumulative VM Runtime Distributions of Webserver andLLCProbeVMs.. Runtime distribution of (top) the web server domain (with load2,000 rps) and (bottom) the LLCProbe domain under both no RFA and with RFA 320 inpinned core case.
Similarly, the web server changes from running longer than 1ms for only10% of the time to 60% of the time. Furthermore, we can see that the webserver often runs out of scheduling credit from the vertical line at 30ms,indicating that it uses up some of its scheduling quanta.
Figure 6.7 shows the effect of displacing legitimate traffic at higherRFA intensities for the floating case. At low web-server request rates andlow RFA intensities, the offered and the observed load remain similar.However, at 3000 rps and RFA intensity of 320, the observed load reducesto 1995 rps, which leads LLCProbe to have performance similar to No-RFAcase at 2000 rps (right graph in Figure 6.5). This is the primary reason forlarge performance improvement at 3000 rps in both pinned and floatingcase shown in Figure 6.5.
In the floating case shown on the right in Figure 6.5, we see that RFArequests can sometimes hurt performance. There appear to be two reasonsfor this. First, some percentage of the time LLCProbe and Apache arerunning concurrently on two different cores sharing an LLC. Because the
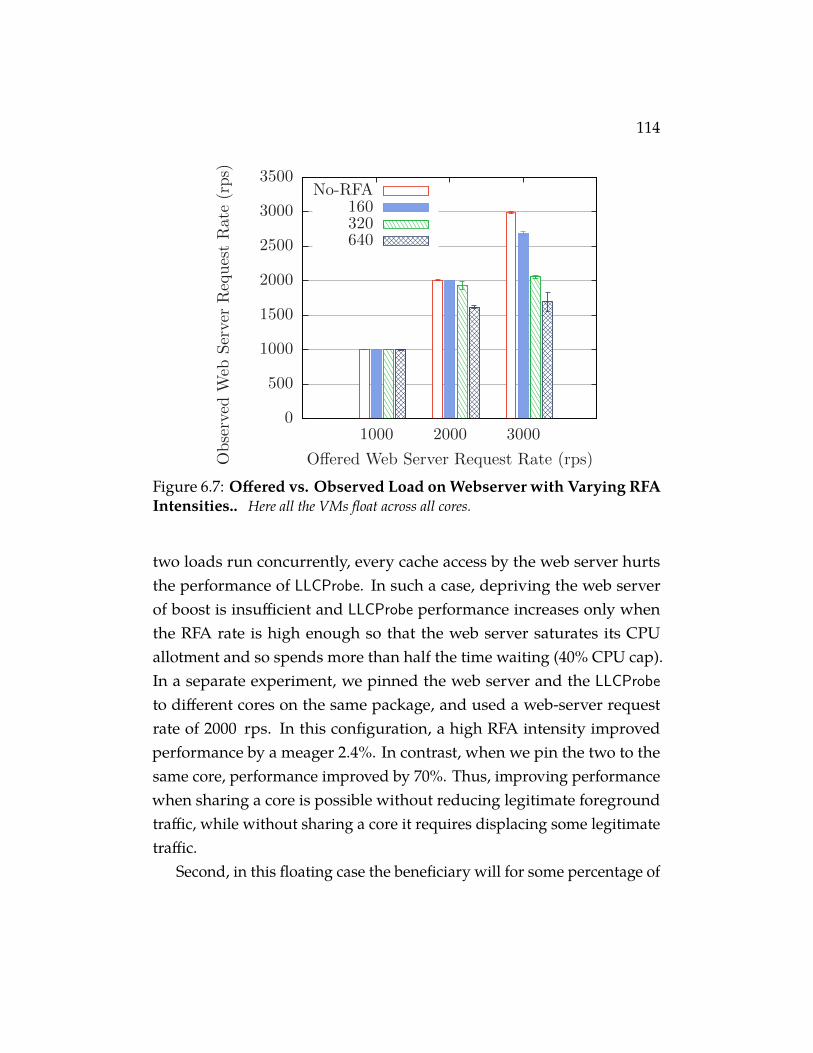
114
0
500
1000
1500
2000
2500
3000
3500
1000 2000 3000
Observed
Web
Server
RequestRate
(rps)
Offered Web Server Request Rate (rps)
No-RFA160320640
Figure 6.7: Offered vs. Observed Load on Webserver with Varying RFAIntensities.. Here all the VMs float across all cores.
two loads run concurrently, every cache access by the web server hurtsthe performance of LLCProbe. In such a case, depriving the web serverof boost is insufficient and LLCProbe performance increases only whenthe RFA rate is high enough so that the web server saturates its CPUallotment and so spends more than half the time waiting (40% CPU cap).In a separate experiment, we pinned the web server and the LLCProbeto different cores on the same package, and used a web-server requestrate of 2000 rps. In this configuration, a high RFA intensity improvedperformance by a meager 2.4%. In contrast, when we pin the two to thesame core, performance improved by 70%. Thus, improving performancewhen sharing a core is possible without reducing legitimate foregroundtraffic, while without sharing a core it requires displacing some legitimatetraffic.
Second, in this floating case the beneficiary will for some percentage of
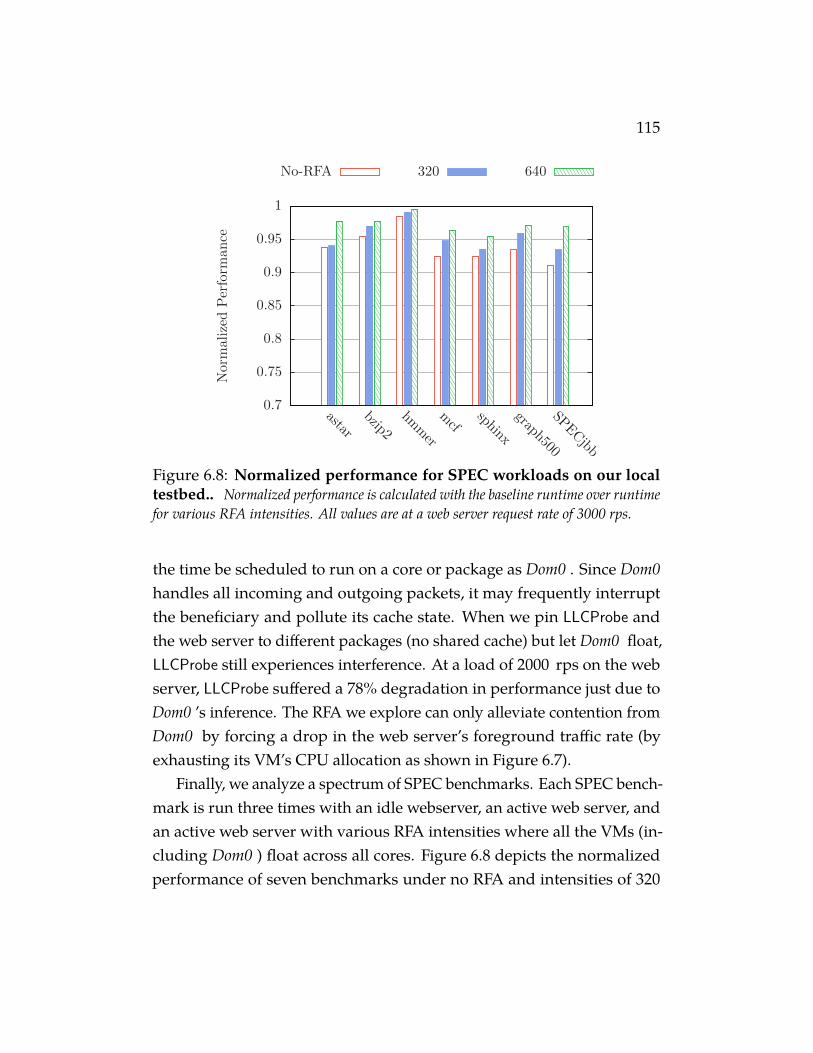
115
0.7
0.75
0.8
0.85
0.9
0.95
1
astar
bzip2
hmmer
mcf
sphinx
graph500
SPECjbb
Norm
alizedPerform
ance
No-RFA 320 640
Figure 6.8: Normalized performance for SPEC workloads on our localtestbed.. Normalized performance is calculated with the baseline runtime over runtimefor various RFA intensities. All values are at a web server request rate of 3000 rps.
the time be scheduled to run on a core or package as Dom0 . Since Dom0handles all incoming and outgoing packets, it may frequently interruptthe beneficiary and pollute its cache state. When we pin LLCProbe andthe web server to different packages (no shared cache) but let Dom0 float,LLCProbe still experiences interference. At a load of 2000 rps on the webserver, LLCProbe suffered a 78% degradation in performance just due toDom0 ’s inference. The RFA we explore can only alleviate contention fromDom0 by forcing a drop in the web server’s foreground traffic rate (byexhausting its VM’s CPU allocation as shown in Figure 6.7).
Finally, we analyze a spectrum of SPEC benchmarks. Each SPEC bench-mark is run three times with an idle webserver, an active web server, andan active web server with various RFA intensities where all the VMs (in-cluding Dom0 ) float across all cores. Figure 6.8 depicts the normalizedperformance of seven benchmarks under no RFA and intensities of 320
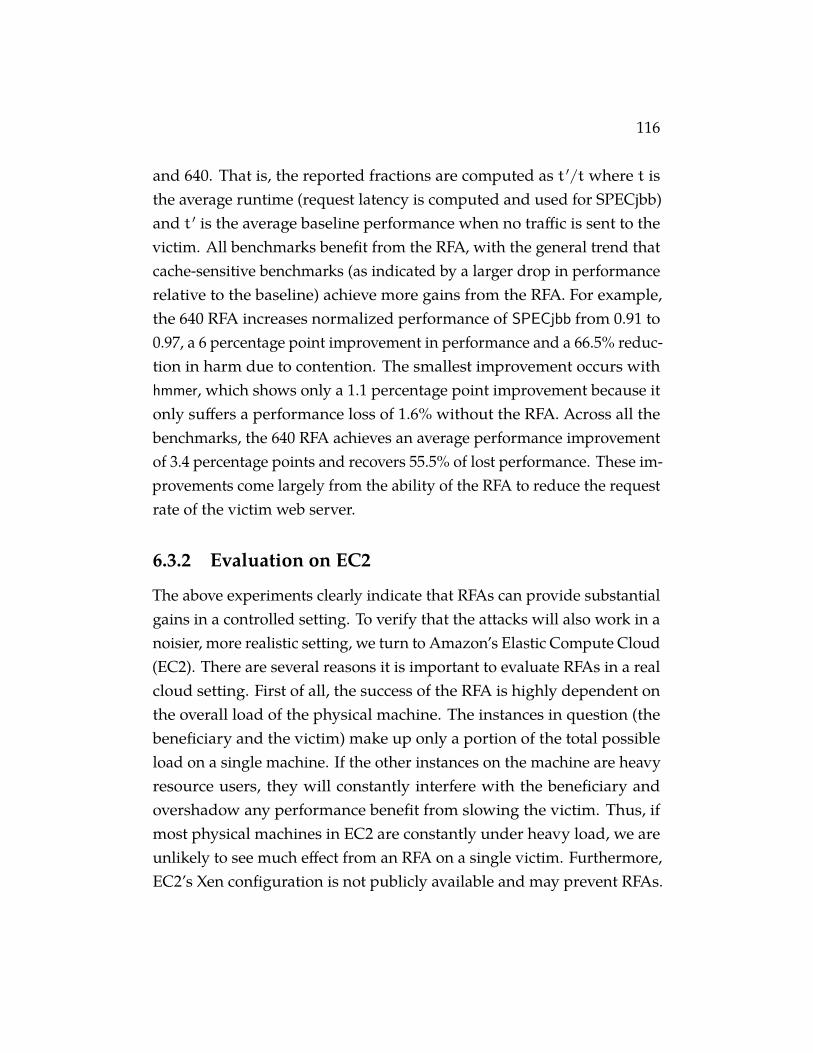
116
and 640. That is, the reported fractions are computed as t ′/t where t isthe average runtime (request latency is computed and used for SPECjbb)and t ′ is the average baseline performance when no traffic is sent to thevictim. All benchmarks benefit from the RFA, with the general trend thatcache-sensitive benchmarks (as indicated by a larger drop in performancerelative to the baseline) achieve more gains from the RFA. For example,the 640 RFA increases normalized performance of SPECjbb from 0.91 to0.97, a 6 percentage point improvement in performance and a 66.5% reduc-tion in harm due to contention. The smallest improvement occurs withhmmer, which shows only a 1.1 percentage point improvement because itonly suffers a performance loss of 1.6% without the RFA. Across all thebenchmarks, the 640 RFA achieves an average performance improvementof 3.4 percentage points and recovers 55.5% of lost performance. These im-provements come largely from the ability of the RFA to reduce the requestrate of the victim web server.
6.3.2 Evaluation on EC2
The above experiments clearly indicate that RFAs can provide substantialgains in a controlled setting. To verify that the attacks will also work in anoisier, more realistic setting, we turn to Amazon’s Elastic Compute Cloud(EC2). There are several reasons it is important to evaluate RFAs in a realcloud setting. First of all, the success of the RFA is highly dependent onthe overall load of the physical machine. The instances in question (thebeneficiary and the victim) make up only a portion of the total possibleload on a single machine. If the other instances on the machine are heavyresource users, they will constantly interfere with the beneficiary andovershadow any performance benefit from slowing the victim. Thus, ifmost physical machines in EC2 are constantly under heavy load, we areunlikely to see much effect from an RFA on a single victim. Furthermore,EC2’s Xen configuration is not publicly available and may prevent RFAs.
117
Thus, to understand if RFAs actually behave as an attacker would hope, itis necessary to verify their effectiveness in a live setting like EC2.
Ethical considerations. When using EC2 for experiments, we are obli-gated to consider the ethical, contractual, and legal implications of ourwork. In our experiments, we use instances running under our accounts inour names as stand-ins for RFA victims and beneficiaries. We abide by theAmazon user agreement, and use only the legitimate Amazon-providedAPIs. We only attempt to send reasonable levels of traffic (slightly morethan 2000 rps for a small web page) to our own instances (the stand-ins forvictims). We do not directly interact with any other customer’s instances.Our experiments are therefore within the scope of typical customer behav-ior on EC2: running a utilized web server and a CPU intensive application.Our experiments can therefore indirectly impact other customer’s serviceonly to the same extent as typical use.
Test machines. To test an RFA, we require control of at least two instancesrunning on the same physical machine. As AWS does not provide thiscapability directly, we used known techniques [152] to achieve sets of co-resident m1.small instances on 12 different physical machines in the EC2us.east-1c region. Specifically, we launched large numbers of instancesof the same type and then used RTT times of network probes to checkco-residence. Co-residence was confirmed using a cache-based covertchannel. Nine of these were the same architecture: Intel Xeon E5507 witha 4MB LLC. We discarded the other instances to focus on those for whichwe had a large corpus, which are summarized in Table 6.9.
Each instance ran Ubuntu 11.04 with Linux kernel 2.6.38-11-virtual. Foreach machine, we choose one of the co-resident instances to play the role ofthe beneficiary and another one to be the victim. The beneficiary was con-figured with various benchmarks while the victim had the same Apacheinstallation and configuration as in the local testbed (see Section 6.3.1).Any remaining co-resident instances were left idle.
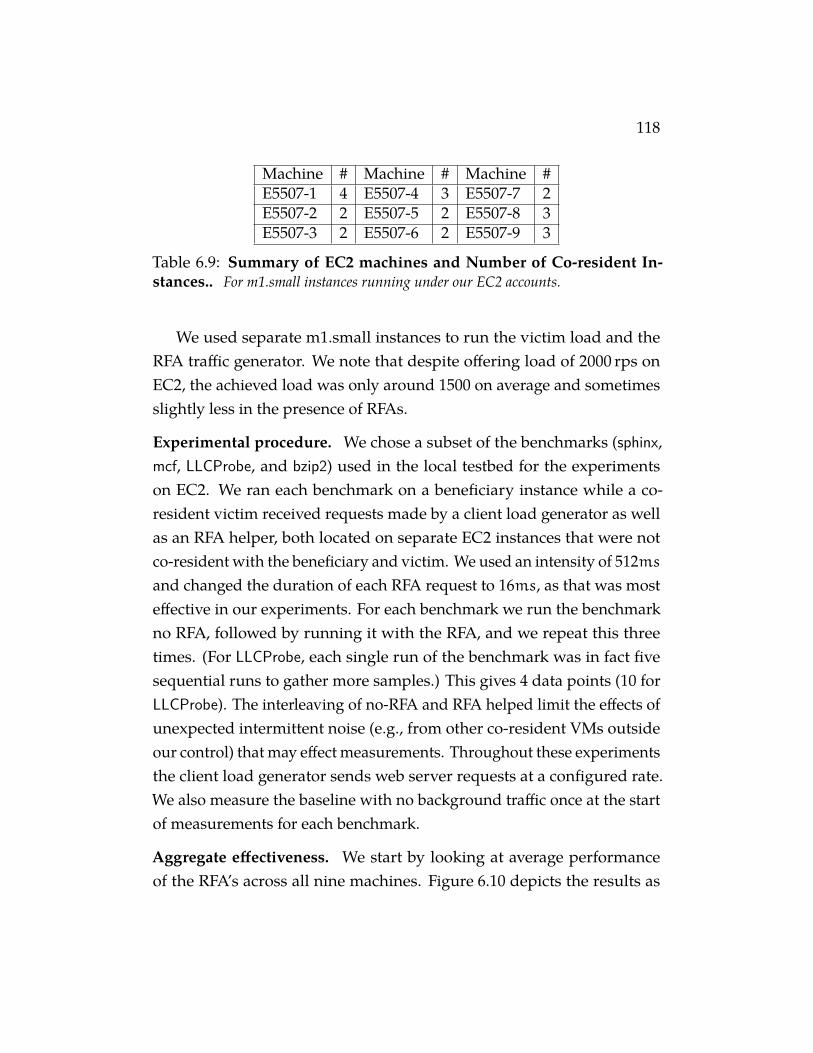
118
Machine # Machine # Machine #E5507-1 4 E5507-4 3 E5507-7 2E5507-2 2 E5507-5 2 E5507-8 3E5507-3 2 E5507-6 2 E5507-9 3
Table 6.9: Summary of EC2 machines and Number of Co-resident In-stances.. For m1.small instances running under our EC2 accounts.
We used separate m1.small instances to run the victim load and theRFA traffic generator. We note that despite offering load of 2000 rps onEC2, the achieved load was only around 1500 on average and sometimesslightly less in the presence of RFAs.
Experimental procedure. We chose a subset of the benchmarks (sphinx,mcf, LLCProbe, and bzip2) used in the local testbed for the experimentson EC2. We ran each benchmark on a beneficiary instance while a co-resident victim received requests made by a client load generator as wellas an RFA helper, both located on separate EC2 instances that were notco-resident with the beneficiary and victim. We used an intensity of 512msand changed the duration of each RFA request to 16ms, as that was mosteffective in our experiments. For each benchmark we run the benchmarkno RFA, followed by running it with the RFA, and we repeat this threetimes. (For LLCProbe, each single run of the benchmark was in fact fivesequential runs to gather more samples.) This gives 4 data points (10 forLLCProbe). The interleaving of no-RFA and RFA helped limit the effects ofunexpected intermittent noise (e.g., from other co-resident VMs outsideour control) that may effect measurements. Throughout these experimentsthe client load generator sends web server requests at a configured rate.We also measure the baseline with no background traffic once at the startof measurements for each benchmark.
Aggregate effectiveness. We start by looking at average performanceof the RFA’s across all nine machines. Figure 6.10 depicts the results as
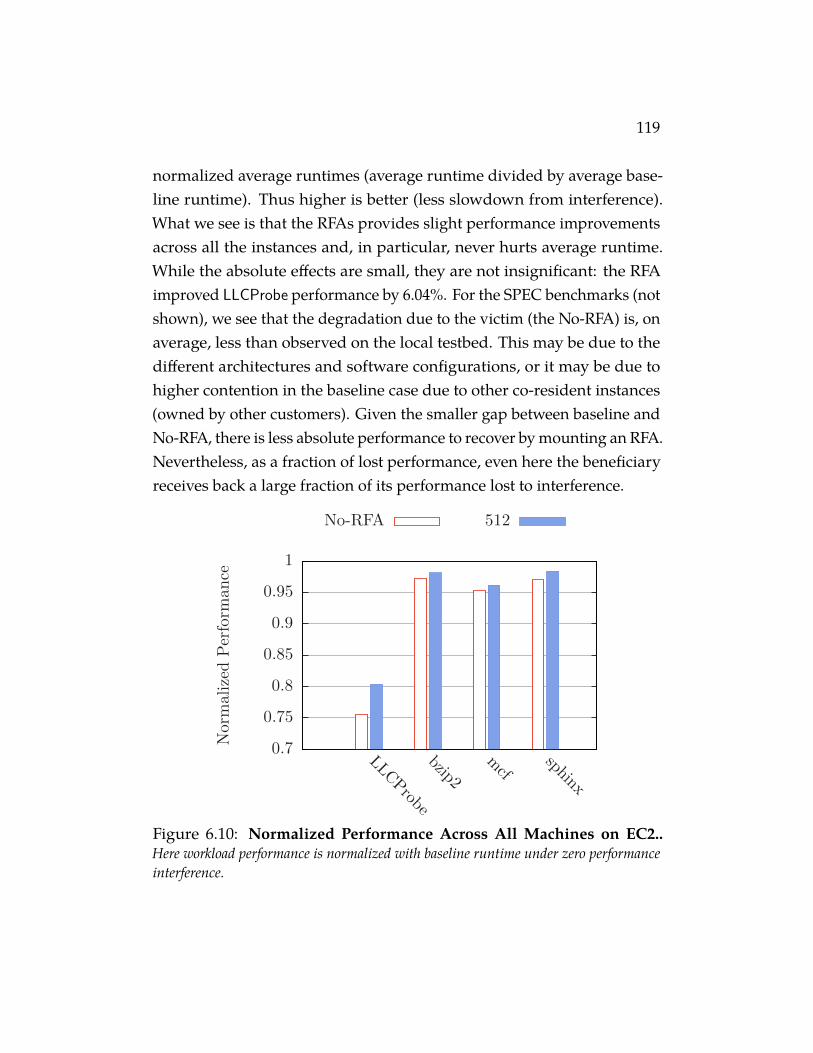
119
normalized average runtimes (average runtime divided by average base-line runtime). Thus higher is better (less slowdown from interference).What we see is that the RFAs provides slight performance improvementsacross all the instances and, in particular, never hurts average runtime.While the absolute effects are small, they are not insignificant: the RFAimproved LLCProbe performance by 6.04%. For the SPEC benchmarks (notshown), we see that the degradation due to the victim (the No-RFA) is, onaverage, less than observed on the local testbed. This may be due to thedifferent architectures and software configurations, or it may be due tohigher contention in the baseline case due to other co-resident instances(owned by other customers). Given the smaller gap between baseline andNo-RFA, there is less absolute performance to recover by mounting an RFA.Nevertheless, as a fraction of lost performance, even here the beneficiaryreceives back a large fraction of its performance lost to interference.
0.7
0.75
0.8
0.85
0.9
0.95
1
LLCProbe
bzip2
mcf
sphinx
Norm
alizedPerform
ance
No-RFA 512
Figure 6.10: Normalized Performance Across All Machines on EC2..Here workload performance is normalized with baseline runtime under zero performanceinterference.
120
Per-machine breakdown. To understand the effect further and, in par-ticular, to get a better sense of whether other (uncontrolled) co-residentinstances are causing contention, we breakdown the results by individualmachine. Figure 6.11 depicts average runtimes for each machine and foreach of the four benchmarks. (The error bars for LLCProbe denote onestandard deviation — for the other benchmarks we omitted these dueto having three samples.) As it can be seen, the baseline, No-RFA, andRFA performances all vary significantly across the different machines.While we cannot know the precise reason for this, we speculate that it ismostly due to contention from other customer VMs or, possibly, slightdifferences in configuration and baseline software performance of thedistinct machines.
Likewise the benefit of performing an RFA varies by machine. In thecase of LLCProbe, RFAs were always beneficial, but the degree to whichthey improved performance varied. Machine E5507-6 had the highestspeedup of 13% from the RFA, which corresponded to decreasing the costof contention by about 33%. Interestingly, there seems to be little correla-tion between benchmarks, for example E5507-6 had negative improvementfrom RFA for the bzip2 and mcf benchmarks. Other machines faired bet-ter for SPEC benchmarks, for example E5507-1 had a 3.2% performanceimprovement under RFAs.
These varied results are not unexpected in the noisy environment ofEC2. We draw two general conclusions. First, RFAs can provide significantspeedups in the (real-world) environment of EC2, but the benefits willvary depending on a variety of environmental factors. Second, given thatthe aggregate benefit across all machines is positive, a greedy customerwill —on average over the long term— benefit from mounting RFAs.
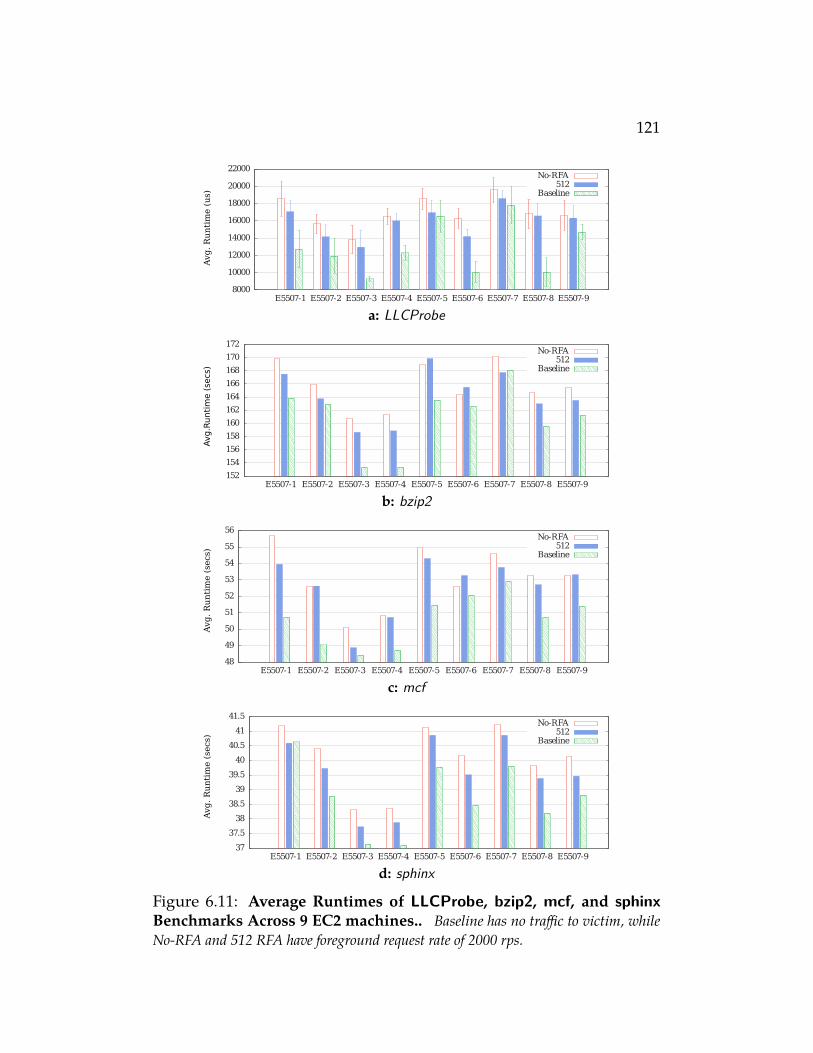
121
8000
10000
12000
14000
16000
18000
20000
22000
E5507-1 E5507-2 E5507-3 E5507-4 E5507-5 E5507-6 E5507-7 E5507-8 E5507-9
Avg
. R
un
tim
e (
us)
No-RFA512
Baseline
a: LLCProbe
152
154
156
158
160
162
164
166
168
170
172
E5507-1 E5507-2 E5507-3 E5507-4 E5507-5 E5507-6 E5507-7 E5507-8 E5507-9
Avg.R
unti
me (
secs)
No-RFA512
Baseline
b: bzip2
48
49
50
51
52
53
54
55
56
E5507-1 E5507-2 E5507-3 E5507-4 E5507-5 E5507-6 E5507-7 E5507-8 E5507-9
Avg
. R
un
tim
e (
secs)
No-RFA512
Baseline
c: mcf
37
37.5
38
38.5
39
39.5
40
40.5
41
41.5
E5507-1 E5507-2 E5507-3 E5507-4 E5507-5 E5507-6 E5507-7 E5507-8 E5507-9
Avg
. R
un
tim
e (
secs)
No-RFA512
Baseline
d: sphinx
Figure 6.11: Average Runtimes of LLCProbe, bzip2, mcf, and sphinxBenchmarks Across 9 EC2 machines.. Baseline has no traffic to victim, whileNo-RFA and 512 RFA have foreground request rate of 2000 rps.
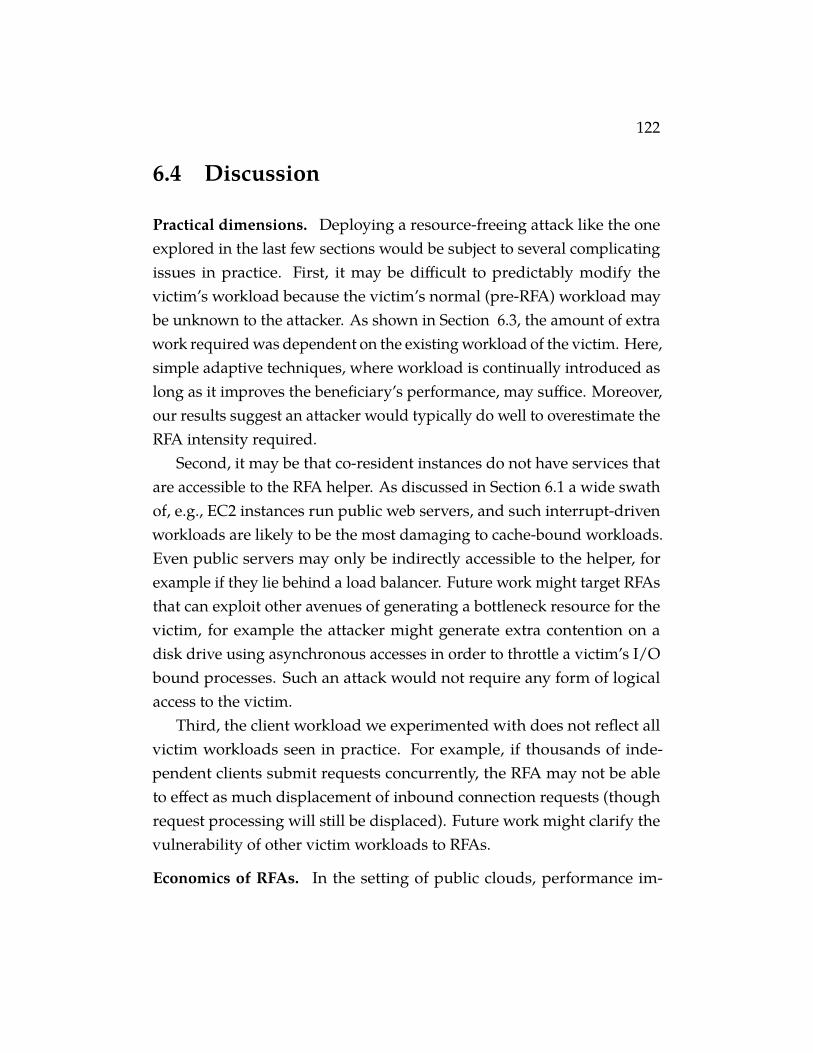
122
6.4 Discussion
Practical dimensions. Deploying a resource-freeing attack like the oneexplored in the last few sections would be subject to several complicatingissues in practice. First, it may be difficult to predictably modify thevictim’s workload because the victim’s normal (pre-RFA) workload maybe unknown to the attacker. As shown in Section 6.3, the amount of extrawork required was dependent on the existing workload of the victim. Here,simple adaptive techniques, where workload is continually introduced aslong as it improves the beneficiary’s performance, may suffice. Moreover,our results suggest an attacker would typically do well to overestimate theRFA intensity required.
Second, it may be that co-resident instances do not have services thatare accessible to the RFA helper. As discussed in Section 6.1 a wide swathof, e.g., EC2 instances run public web servers, and such interrupt-drivenworkloads are likely to be the most damaging to cache-bound workloads.Even public servers may only be indirectly accessible to the helper, forexample if they lie behind a load balancer. Future work might target RFAsthat can exploit other avenues of generating a bottleneck resource for thevictim, for example the attacker might generate extra contention on adisk drive using asynchronous accesses in order to throttle a victim’s I/Obound processes. Such an attack would not require any form of logicalaccess to the victim.
Third, the client workload we experimented with does not reflect allvictim workloads seen in practice. For example, if thousands of inde-pendent clients submit requests concurrently, the RFA may not be ableto effect as much displacement of inbound connection requests (thoughrequest processing will still be displaced). Future work might clarify thevulnerability of other victim workloads to RFAs.
Economics of RFAs. In the setting of public clouds, performance im-
123
provement can translate directly to cost improvement since one pays perunit time. For long running jobs, even modest improvements in perfor-mance can significantly lower cost. Of course, one must account for thecost of mounting the RFA itself, which could diminish the cost savings.The RFAs we explored used a helper that sends a small number of web re-quests to the victim. For example, our helper uses only 15 Kbps of networkbandwidth with a CPU utilization of 0.7% (of the E5430 as configured inour local testbed). We located this helper on a separate machine. That thehelper is so lightweight means that one might implement it in a varietyof ways to ameliorate its cost. For example, by running it in places wherespare cycles cannot be used for the main computational task or even on anon-cloud system used to help manage cloud tasks. One could also use acheap VM instance that runs helpers for a large set of beneficiaries, therebyamortizing the cost of the VM instance.
A related issue is that of VM migration. While contemporary IaaSclouds do not enable dynamic migration, customers may move a VM fromone system to (hopefully) another by shutting it down and restarting it.The beneficiary could therefore try to migrate away from a contendedhost instead of mounting an RFA. We view migration and RFAs as twocomplementary directions along which a greedy customer will attemptto optimize their efficiency. Which strategy, or a combination thereof,works best will depend on the contention, the workload, the likelihoodof ending up on an uncontended host, pricing, etc. Understanding therelative economic and performance benefits of migration and RFAs is aninteresting question for future work.
Preventing RFAs. To prevent the kinds of RFAs we consider, one coulddeploy VMs onto dedicated instances. This was suggested in the cloudsetting by Ristenpart et al. [152], and subsequently added as a featurein EC2. However, the significant cost of dedicated instances makes itimpractical for a variety of settings.
124
There are two primary methods for preventing RFAs even in the caseof multiplexed physical servers: stronger isolation and smarter schedul-ing. A hypervisor that provides strong isolation for every shared resourcecan prevent RFAs. This entails using non-work conserving scheduling,so that idleness of a resource allocated to one VM does not benefit an-other. In addition, it requires hardware support for allocating access toprocessor resources, such as the cache and memory bandwidth. Withcurrent hardware, the only possibility is cache coloring, which sets virtual-to-physical mappings to ensure that guest virtual machines do not sharecache sets [102]. This effectively partitions the cache in hardware, whichhurts performance for memory-intensive workloads. Finally, it requiresthat the hypervisor never overcommit and promise more resources to VMsthan are physically available, because concurrent use of overcommittedresources cannot be satisfied. While this approach may work, it sacrificesperformance and efficiency by leaving resources idle.
A second approach is to apply smarter scheduling. Based on the con-tention results in Section 6.2, the hypervisor can monitor the VMs betweenprocesses and attempt to schedule those workloads that do not conflict.This approach, often applied to multicore and multithreaded schedul-ing [48, 63, 159], detects workloads with conflicting resource usages viastatistics and processor performance counters, and attempts to schedulethem at different times, so they do not concurrently share the contendedresource, or on separate cores or packages to reduce contention, as in thecase of the LLC.
A final idea would be to prevent RFAs by detecting and blocking them.We suspect that this would be very difficult in most settings. RFAs need notabuse vulnerabilities on a system, rather they can simply take advantageof legitimate functionality (e.g., CGI scripts on a web server). Moreoverthey are stealthy in the sense that it may only require a few requests persecond to drive the victim up against a resource bottleneck. A provider or

125
the victim itself would be hard pressed to detect and block RFA requestswithout preventing legitimate access to the resource.
126
7Soft-isolation: ImprovingIsolation in Public Clouds
Cross-VM side-channel attacks are one of the most dangerous co-locationattacks that have been demonstrated in the public clouds [93, 152]. Per-haps surprisingly, then, is the lack of any investigation of the relationshipbetween hypervisor scheduling policies and side-channel efficacy.
In this chapter, we evaluate the ability of system software to mitigatecache-based side-channel attacks through scheduling. In particular, we fo-cus on the type of mechanism that has schedulers ensure that CPU-boundworkloads cannot be preempted before a minimum time quantum, evenin the presence of higher priority or interactive workloads. We say thatsuch a scheduler offers a minimum run time (MRT) guarantee. Xen version4.2 features an MRT guarantee mechanism for the stated purpose of im-proving the performance of batch workloads in the presence of interactiveworkloads that thrash their cache footprint [59]. A similar mechanism alsoexists in the Linux CFS scheduler [126].
Cache-based side-channel attacks are an example of such highly inter-active workloads that thrash the cache. One might therefore hypothesizethat by reducing the frequency of preemptions via an MRT guarantee, oneachieves a level of soft isolation suitable for mitigating, or even prevent-ing, a broad class of shared-core side-channel attacks. We investigate thishypothesis, providing the first analysis of MRT guarantees as a defenseagainst cache-based side-channel attacks. With detailed measurements of
127
cache timing, we show that even an MRT below 1mscan defend againstexisting attacks.
But an MRT guarantee can have negative affects as well: latency-sensitive workloads may be delayed for the minimum time quantum. Toevaluate the performance impact of MRT guarantees, we provide extensivemeasurements with a corpus of latency-sensitive and batch workloads.We conclude that while worst-case latency can be hindered by large MRTsin some cases, in practice Xen’s existing core load-balancing mechanismsmitigate the cost by separating CPU-hungry batch workloads from latency-sensitive interactive workloads. As just one example, memcached, whenrunning alongside batch workloads, suffers only a 7% overhead on 95th-percentile latency for a 5msMRT compared to no MRT. Median latency isnot affected at all.
The existing MRT mechanism only protects CPU-hungry programsthat do not yield the CPU or go idle. While we are aware of no side-channelattacks that exploit such victim workloads, we nevertheless investigate asimple and lightweight use of CPU state cleansing to protect programs thatquickly yield the CPU by obfuscating predictive state. By implementingthis in the hypervisor scheduler, we can exploit knowledge of when across-VM preemption occurs and the MRT has not been exceeded. Thisgreatly mitigates the overheads of cleansing, attesting to a further valueto soft-isolation style mechanisms. In our performance evaluation of thismechanism, we see only a 10–50µsworse-case overhead on median latencydue to cleansing while providing protection for all guest processes withina VM (and not just select ones, as was the case in Düppel). In contrast,other proposed defenses have similar (or worse) overhead but require newhardware, new guest operating systems, or restrict system functionality.
In the next section, we describe the Xen hypervisor scheduling system,its MRT mechanism, and the principle of soft isolation. In Section 7.2 wemeasure the effectiveness of MRT as a defense. Section 7.3 shows the per-
128
formance of Xen’s MRT mechanism, and Section 7.4 describes combiningMRT with cache cleansing.
7.1 MRT Guarantees and Soft Isolation
We investigate a different strategy for mitigating per-core side-channels:adjusting hypervisor core scheduling to limit the rate of preemptions. Thistargets the second requirement of attacks such as ZJRR. Such a schedulerwould realize a security design principle that we call soft isolation1: limitingthe frequency of potentially dangerous interactions between mutuallyuntrustworthy programs. Unlike hard isolation mechanisms, we willallow shared state but attempt to use scheduling to limit the damage.Ideally, the flexibility of soft isolation will ease the road to deployment,while still significantly mitigating or even preventing side-channel attacks.We expect that soft isolation can be incorporated as a design goal in avariety of resource management contexts. That said, we focus in the restof this work on CPU core scheduling.
Xen scheduling. Hypervisors schedule virtual machines much like anoperating system schedules processes or threads. Just as a process maycontain multiple threads that can be scheduled on different processors, avirtual machine may consist of multiple virtual CPUs (VCPUs) that can bescheduled on different physical CPUs (PCPUs). The primary differencebetween hypervisor and OS scheduling is that the set of VCPUs across allVMs is relatively static, as VM and VCPU creation/deletion is a rare event.In contrast, processes and threads are frequently created and deleted.
Hypervisor schedulers provide low-latency response times to interac-tive tasks by prioritizing VCPUs that need to respond to an outstandingevent. The events are typically physical device or virtual interrupts from
1The term “soft” is inherited from soft real-time systems, where one similarly relaxesrequirements (in that case, time deadlines, in our case, isolation).
129
packet arrivals or completed storage requests. Xen’s credit scheduler nor-mally lets a VCPU run for 30ms before preempting it so another VCPU canrun. However, when a VCPU receives an event, it may receive boost priority,which allows it to preempt non-boosted VCPUs and run immediately.
VCPUs are characterized by Xen as either interactive (or latency-sensitive)if they are mostly idle until an interrupt comes in, at which point theyexecute for a short period and return to idle. Typical interactive workloadsare network servers that execute in response to an incoming packet. Werefer to VCPUs that are running longer computations as batch or CPU-hungry, as they typically execute for longer than the scheduler’s time slice(30ms for Xen) without idling.
Schedulers can be work conserving, meaning that they will never let aPCPU idle if a VCPU is ready to run, or non-work conserving, meaning thatthey enforce strict limits on how much time a VCPU can run. While work-conserving schedulers can provide higher utilization, they also provideworse performance isolation: if one VCPU goes from idle to CPU-hungry,another VCPU on the same PCPU can see its share of the PCPU drop inhalf. As a result, many cloud environments use non-work conservingschedulers. For example, Amazon EC2’s m1.small instances are configuredto be non-work conserving, allocating roughly 40% of a PCPU (called capin Xen) to each VCPU of a VM.
Since version 4.2, Xen has included a mechanism for rate limiting pre-emptions of a VCPU; we call this mechanism a minimum run-time (MRT)guarantee. The logic underlying this mechanism is shown as a flowchart inFigure 7.1. Xen exposes a hypervisor parameter, ratelimit_us (the MRTvalue) that determines the minimum time any VCPU is guaranteed to runon a PCPU before being available to be context-switched out of the PCPUby another VCPU. One could also rate limit preemptions in other ways,but an MRT guarantee is simple to implement. Note that the MRT is notapplicable to VMs that voluntarily give up the CPU, which happens when
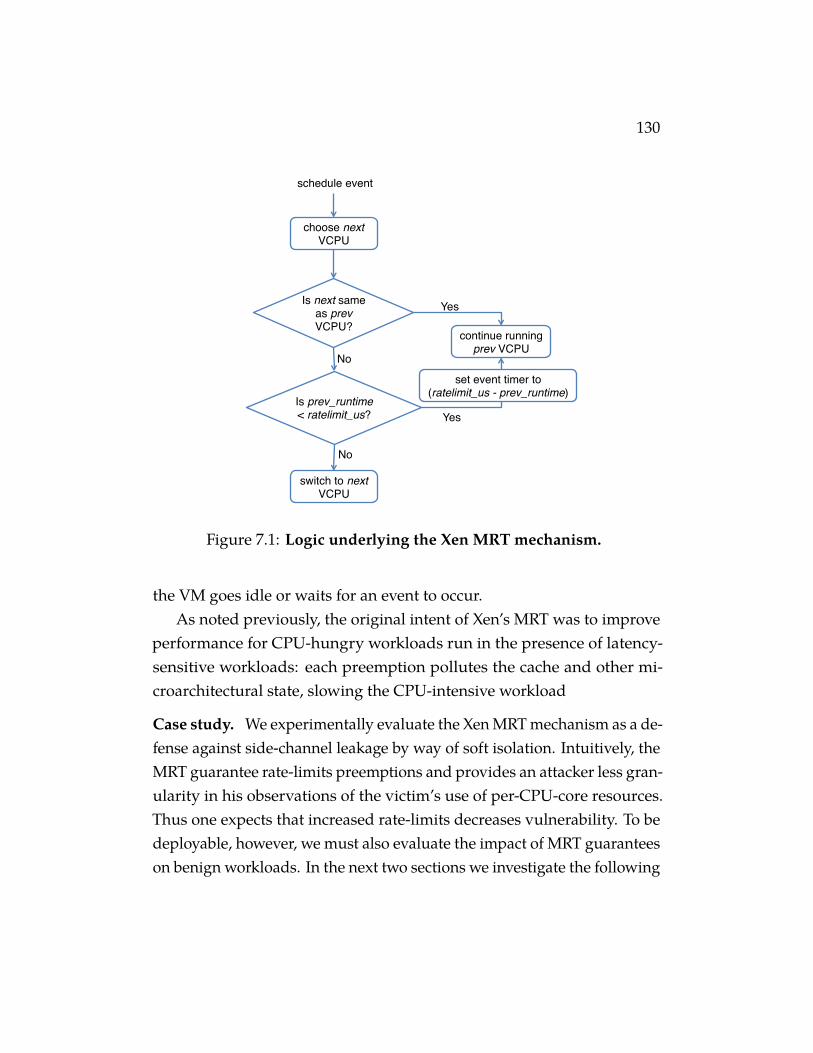
130
choose next VCPU!
schedule event!
Is next same as prev VCPU?!
Is prev_runtime < ratelimit_us?!
No!
continue running prev VCPU!
Yes!
Yes!
switch to next VCPU!
No!
set event timer to (ratelimit_us - prev_runtime)!
Figure 7.1: Logic underlying the Xen MRT mechanism.
the VM goes idle or waits for an event to occur.As noted previously, the original intent of Xen’s MRT was to improve
performance for CPU-hungry workloads run in the presence of latency-sensitive workloads: each preemption pollutes the cache and other mi-croarchitectural state, slowing the CPU-intensive workload
Case study. We experimentally evaluate the Xen MRT mechanism as a de-fense against side-channel leakage by way of soft isolation. Intuitively, theMRT guarantee rate-limits preemptions and provides an attacker less gran-ularity in his observations of the victim’s use of per-CPU-core resources.Thus one expects that increased rate-limits decreases vulnerability. To bedeployable, however, we must also evaluate the impact of MRT guaranteeson benign workloads. In the next two sections we investigate the following
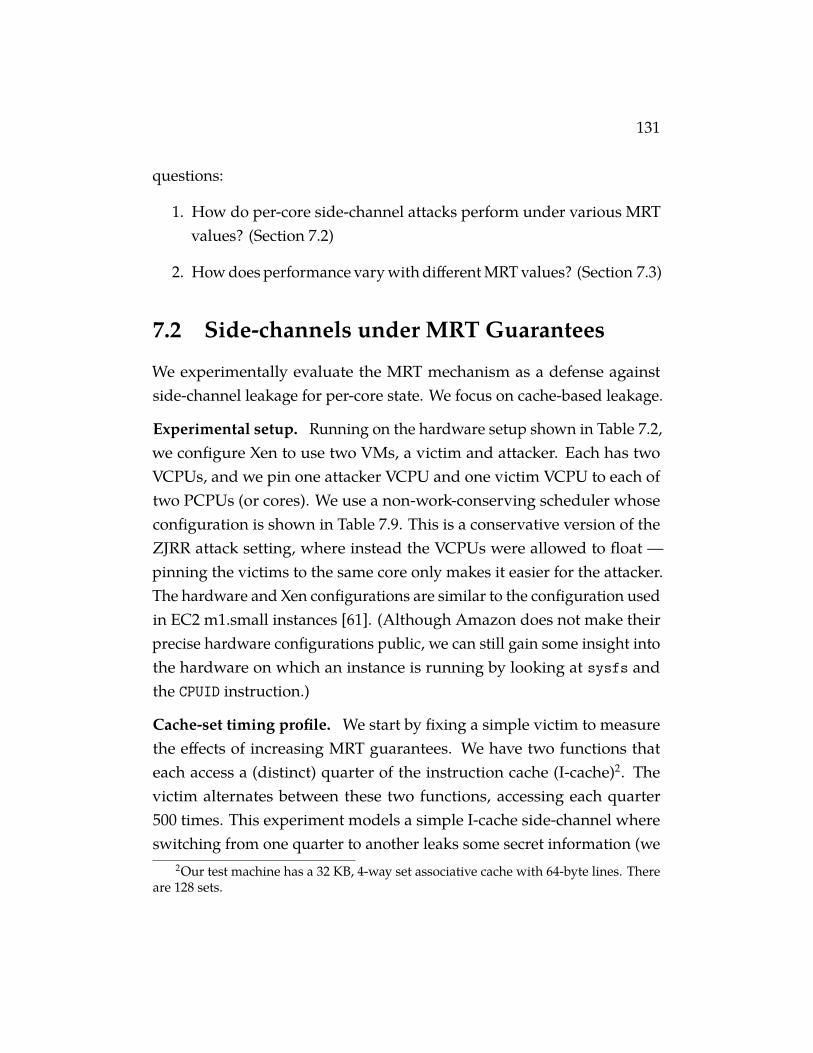
131
questions:
1. How do per-core side-channel attacks perform under various MRTvalues? (Section 7.2)
2. How does performance vary with different MRT values? (Section 7.3)
7.2 Side-channels under MRT Guarantees
We experimentally evaluate the MRT mechanism as a defense againstside-channel leakage for per-core state. We focus on cache-based leakage.
Experimental setup. Running on the hardware setup shown in Table 7.2,we configure Xen to use two VMs, a victim and attacker. Each has twoVCPUs, and we pin one attacker VCPU and one victim VCPU to each oftwo PCPUs (or cores). We use a non-work-conserving scheduler whoseconfiguration is shown in Table 7.9. This is a conservative version of theZJRR attack setting, where instead the VCPUs were allowed to float —pinning the victims to the same core only makes it easier for the attacker.The hardware and Xen configurations are similar to the configuration usedin EC2 m1.small instances [61]. (Although Amazon does not make theirprecise hardware configurations public, we can still gain some insight intothe hardware on which an instance is running by looking at sysfs andthe CPUID instruction.)
Cache-set timing profile. We start by fixing a simple victim to measurethe effects of increasing MRT guarantees. We have two functions thateach access a (distinct) quarter of the instruction cache (I-cache)2. Thevictim alternates between these two functions, accessing each quarter500 times. This experiment models a simple I-cache side-channel whereswitching from one quarter to another leaks some secret information (we
2Our test machine has a 32 KB, 4-way set associative cache with 64-byte lines. Thereare 128 sets.
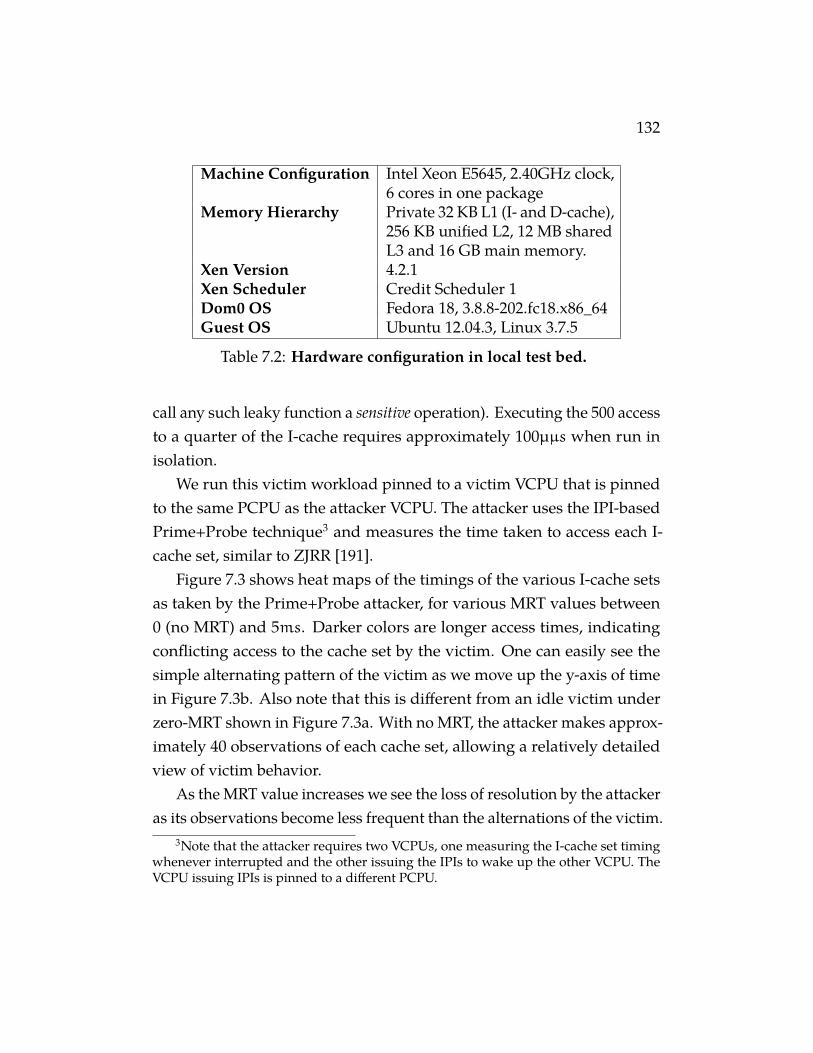
132
Machine Configuration Intel Xeon E5645, 2.40GHz clock,6 cores in one package
Memory Hierarchy Private 32 KB L1 (I- and D-cache),256 KB unified L2, 12 MB sharedL3 and 16 GB main memory.
Xen Version 4.2.1Xen Scheduler Credit Scheduler 1Dom0 OS Fedora 18, 3.8.8-202.fc18.x86_64Guest OS Ubuntu 12.04.3, Linux 3.7.5
Table 7.2: Hardware configuration in local test bed.
call any such leaky function a sensitive operation). Executing the 500 accessto a quarter of the I-cache requires approximately 100µµs when run inisolation.
We run this victim workload pinned to a victim VCPU that is pinnedto the same PCPU as the attacker VCPU. The attacker uses the IPI-basedPrime+Probe technique3 and measures the time taken to access each I-cache set, similar to ZJRR [191].
Figure 7.3 shows heat maps of the timings of the various I-cache setsas taken by the Prime+Probe attacker, for various MRT values between0 (no MRT) and 5ms. Darker colors are longer access times, indicatingconflicting access to the cache set by the victim. One can easily see thesimple alternating pattern of the victim as we move up the y-axis of timein Figure 7.3b. Also note that this is different from an idle victim underzero-MRT shown in Figure 7.3a. With no MRT, the attacker makes approx-imately 40 observations of each cache set, allowing a relatively detailedview of victim behavior.
As the MRT value increases we see the loss of resolution by the attackeras its observations become less frequent than the alternations of the victim.
3Note that the attacker requires two VCPUs, one measuring the I-cache set timingwhenever interrupted and the other issuing the IPIs to wake up the other VCPU. TheVCPU issuing IPIs is pinned to a different PCPU.
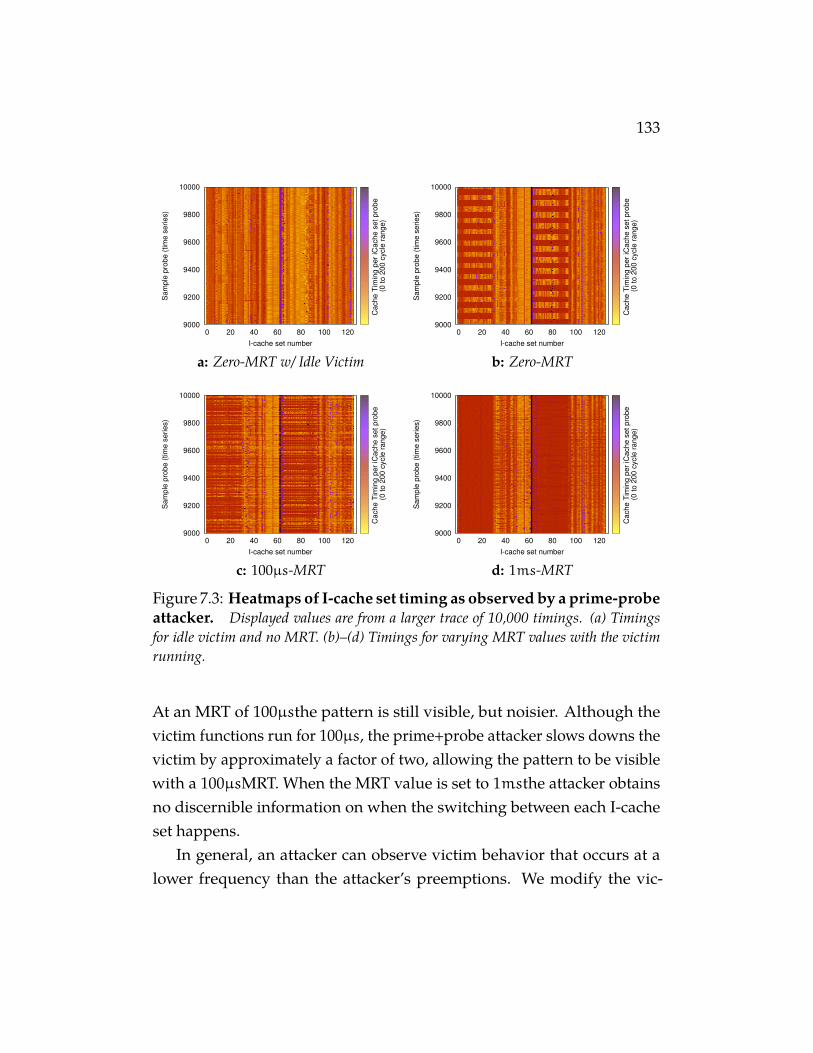
133
9000
9200
9400
9600
9800
10000
0 20 40 60 80 100 120
Sam
ple
pro
be (
tim
e s
eries)
I-cache set number
Cache T
imin
g p
er
iCache s
et pro
be
(0 to 2
00 c
ycle
range)
a: Zero-MRT w/ Idle Victim
9000
9200
9400
9600
9800
10000
0 20 40 60 80 100 120
Sam
ple
pro
be (
tim
e s
eries)
I-cache set number
Cache T
imin
g p
er
iCache s
et pro
be
(0 to 2
00 c
ycle
range)
b: Zero-MRT
9000
9200
9400
9600
9800
10000
0 20 40 60 80 100 120
Sam
ple
pro
be (
tim
e s
eries)
I-cache set number
Cache T
imin
g p
er
iCache s
et pro
be
(0 to 2
00 c
ycle
range)
c: 100µs-MRT
9000
9200
9400
9600
9800
10000
0 20 40 60 80 100 120
Sam
ple
pro
be (
tim
e s
eries)
I-cache set number
Cache T
imin
g p
er
iCache s
et pro
be
(0 to 2
00 c
ycle
range)
d: 1ms-MRT
Figure 7.3: Heatmaps of I-cache set timing as observed by a prime-probeattacker. Displayed values are from a larger trace of 10,000 timings. (a) Timingsfor idle victim and no MRT. (b)–(d) Timings for varying MRT values with the victimrunning.
At an MRT of 100µsthe pattern is still visible, but noisier. Although thevictim functions run for 100µs, the prime+probe attacker slows downs thevictim by approximately a factor of two, allowing the pattern to be visiblewith a 100µsMRT. When the MRT value is set to 1msthe attacker obtainsno discernible information on when the switching between each I-cacheset happens.
In general, an attacker can observe victim behavior that occurs at alower frequency than the attacker’s preemptions. We modify the vic-
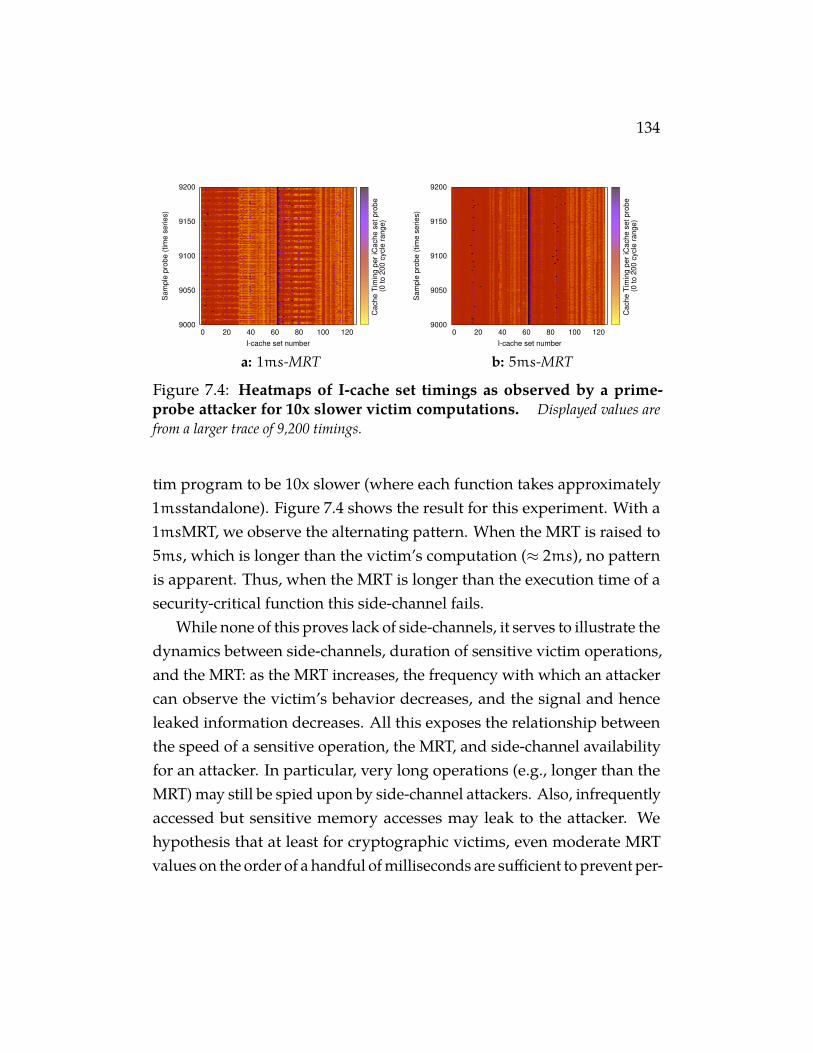
134
9000
9050
9100
9150
9200
0 20 40 60 80 100 120
Sam
ple
pro
be (
tim
e s
eries)
I-cache set number
Cache T
imin
g p
er
iCache s
et pro
be
(0 to 2
00 c
ycle
range)
a: 1ms-MRT
9000
9050
9100
9150
9200
0 20 40 60 80 100 120
Sam
ple
pro
be (
tim
e s
eries)
I-cache set number
Cache T
imin
g p
er
iCache s
et pro
be
(0 to 2
00 c
ycle
range)
b: 5ms-MRT
Figure 7.4: Heatmaps of I-cache set timings as observed by a prime-probe attacker for 10x slower victim computations. Displayed values arefrom a larger trace of 9,200 timings.
tim program to be 10x slower (where each function takes approximately1msstandalone). Figure 7.4 shows the result for this experiment. With a1msMRT, we observe the alternating pattern. When the MRT is raised to5ms, which is longer than the victim’s computation (≈ 2ms), no patternis apparent. Thus, when the MRT is longer than the execution time of asecurity-critical function this side-channel fails.
While none of this proves lack of side-channels, it serves to illustrate thedynamics between side-channels, duration of sensitive victim operations,and the MRT: as the MRT increases, the frequency with which an attackercan observe the victim’s behavior decreases, and the signal and henceleaked information decreases. All this exposes the relationship betweenthe speed of a sensitive operation, the MRT, and side-channel availabilityfor an attacker. In particular, very long operations (e.g., longer than theMRT) may still be spied upon by side-channel attackers. Also, infrequentlyaccessed but sensitive memory accesses may leak to the attacker. Wehypothesis that at least for cryptographic victims, even moderate MRTvalues on the order of a handful of milliseconds are sufficient to prevent per-
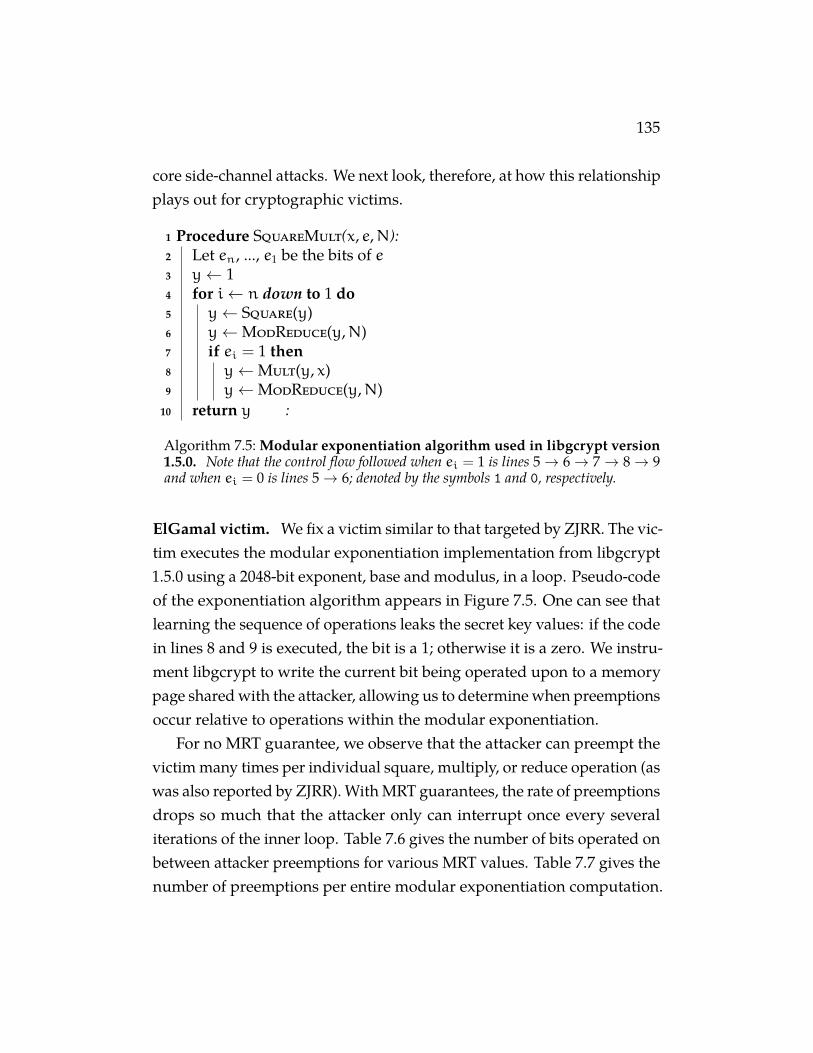
135
core side-channel attacks. We next look, therefore, at how this relationshipplays out for cryptographic victims.
1 Procedure SquareMult(x, e,N):2 Let en, ..., e1 be the bits of e3 y← 14 for i← n down to 1 do5 y← Square(y)6 y←ModReduce(y,N)7 if ei = 1 then8 y←Mult(y, x)9 y←ModReduce(y,N)
10 return y :
Algorithm 7.5: Modular exponentiation algorithm used in libgcrypt version1.5.0. Note that the control flow followed when ei = 1 is lines 5→ 6→ 7 → 8→ 9and when ei = 0 is lines 5→ 6; denoted by the symbols 1 and 0, respectively.
ElGamal victim. We fix a victim similar to that targeted by ZJRR. The vic-tim executes the modular exponentiation implementation from libgcrypt1.5.0 using a 2048-bit exponent, base and modulus, in a loop. Pseudo-codeof the exponentiation algorithm appears in Figure 7.5. One can see thatlearning the sequence of operations leaks the secret key values: if the codein lines 8 and 9 is executed, the bit is a 1; otherwise it is a zero. We instru-ment libgcrypt to write the current bit being operated upon to a memorypage shared with the attacker, allowing us to determine when preemptionsoccur relative to operations within the modular exponentiation.
For no MRT guarantee, we observe that the attacker can preempt thevictim many times per individual square, multiply, or reduce operation (aswas also reported by ZJRR). With MRT guarantees, the rate of preemptionsdrops so much that the attacker only can interrupt once every severaliterations of the inner loop. Table 7.6 gives the number of bits operated onbetween attacker preemptions for various MRT values. Table 7.7 gives thenumber of preemptions per entire modular exponentiation computation.
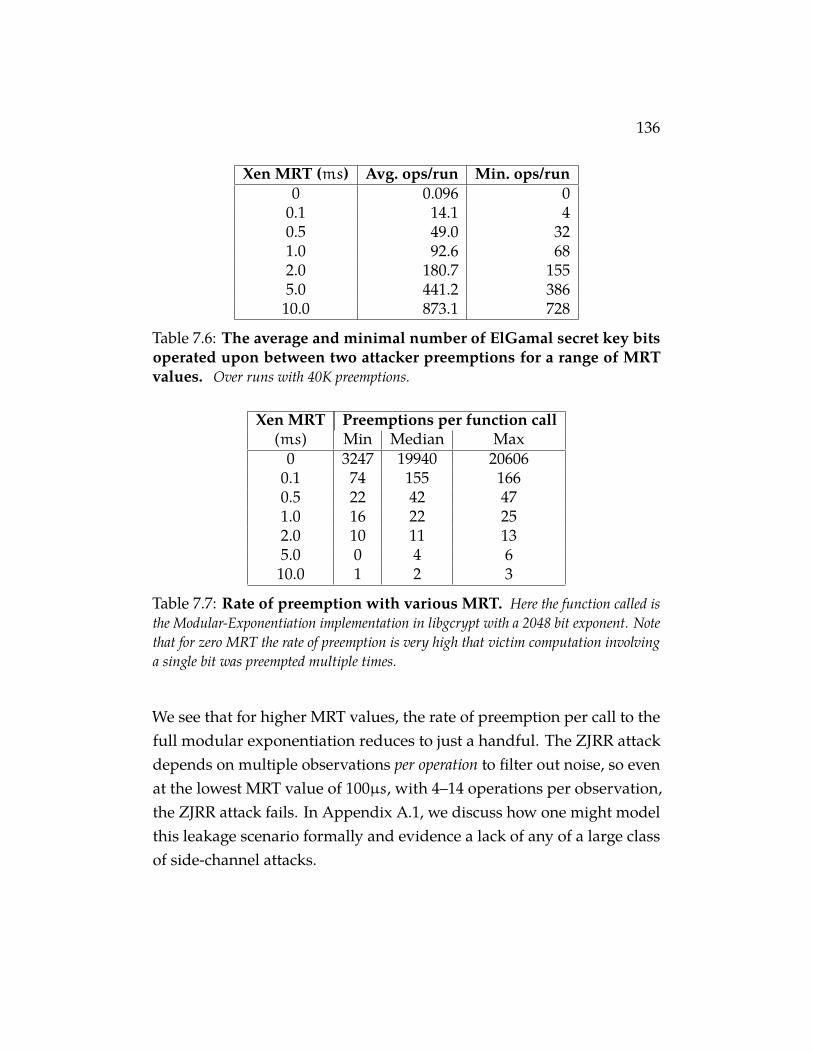
136
Xen MRT (ms) Avg. ops/run Min. ops/run0 0.096 0
0.1 14.1 40.5 49.0 321.0 92.6 682.0 180.7 1555.0 441.2 386
10.0 873.1 728
Table 7.6: The average and minimal number of ElGamal secret key bitsoperated upon between two attacker preemptions for a range of MRTvalues. Over runs with 40K preemptions.
Xen MRT Preemptions per function call(ms) Min Median Max
0 3247 19940 206060.1 74 155 1660.5 22 42 471.0 16 22 252.0 10 11 135.0 0 4 610.0 1 2 3
Table 7.7: Rate of preemption with various MRT. Here the function called isthe Modular-Exponentiation implementation in libgcrypt with a 2048 bit exponent. Notethat for zero MRT the rate of preemption is very high that victim computation involvinga single bit was preempted multiple times.
We see that for higher MRT values, the rate of preemption per call to thefull modular exponentiation reduces to just a handful. The ZJRR attackdepends on multiple observations per operation to filter out noise, so evenat the lowest MRT value of 100µs, with 4–14 operations per observation,the ZJRR attack fails. In Appendix A.1, we discuss how one might modelthis leakage scenario formally and evidence a lack of any of a large classof side-channel attacks.
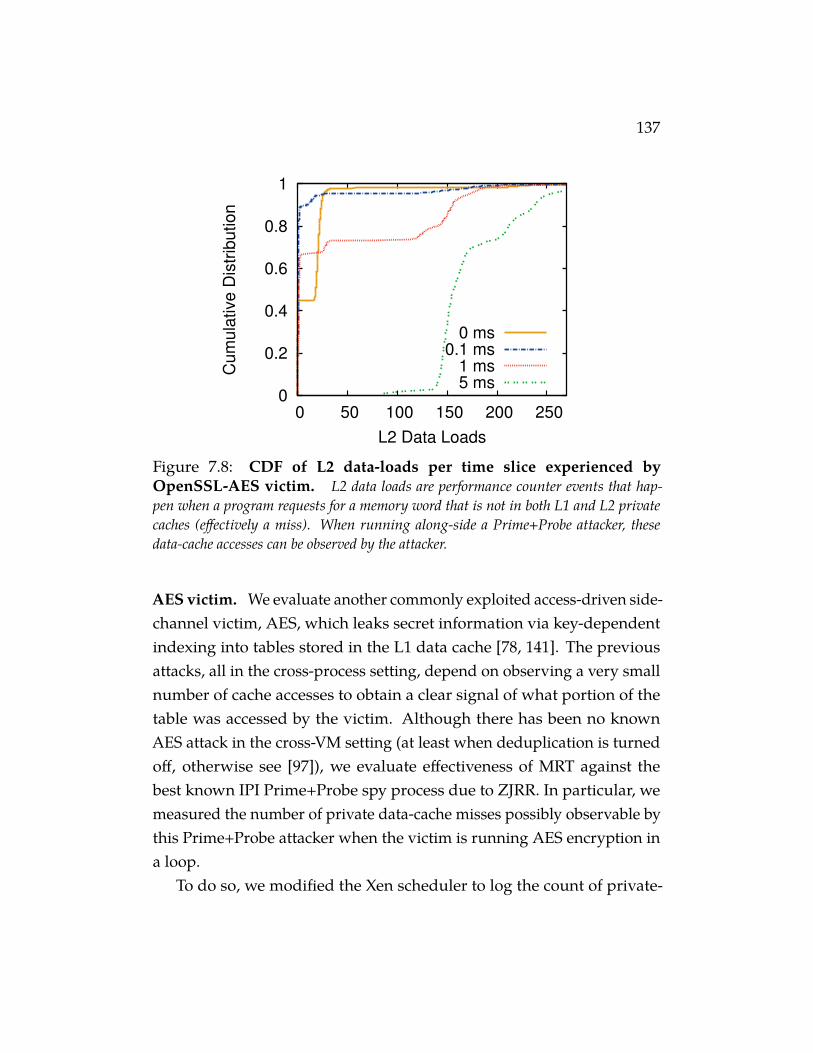
137
0
0.2
0.4
0.6
0.8
1
0 50 100 150 200 250
Cum
ula
tive D
istr
ibution
L2 Data Loads
0 ms
0.1 ms
1 ms
5 ms
Figure 7.8: CDF of L2 data-loads per time slice experienced byOpenSSL-AES victim. L2 data loads are performance counter events that hap-pen when a program requests for a memory word that is not in both L1 and L2 privatecaches (effectively a miss). When running along-side a Prime+Probe attacker, thesedata-cache accesses can be observed by the attacker.
AES victim. We evaluate another commonly exploited access-driven side-channel victim, AES, which leaks secret information via key-dependentindexing into tables stored in the L1 data cache [78, 141]. The previousattacks, all in the cross-process setting, depend on observing a very smallnumber of cache accesses to obtain a clear signal of what portion of thetable was accessed by the victim. Although there has been no knownAES attack in the cross-VM setting (at least when deduplication is turnedoff, otherwise see [97]), we evaluate effectiveness of MRT against thebest known IPI Prime+Probe spy process due to ZJRR. In particular, wemeasured the number of private data-cache misses possibly observable bythis Prime+Probe attacker when the victim is running AES encryption ina loop.
To do so, we modified the Xen scheduler to log the count of private-
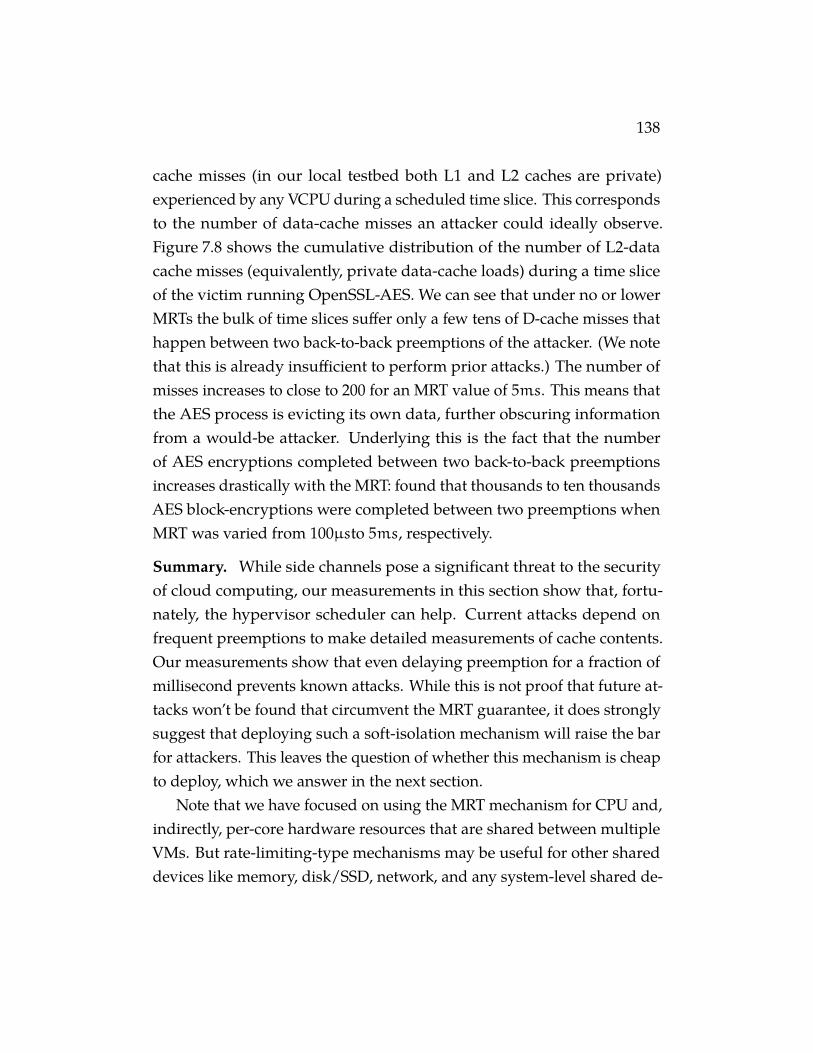
138
cache misses (in our local testbed both L1 and L2 caches are private)experienced by any VCPU during a scheduled time slice. This correspondsto the number of data-cache misses an attacker could ideally observe.Figure 7.8 shows the cumulative distribution of the number of L2-datacache misses (equivalently, private data-cache loads) during a time sliceof the victim running OpenSSL-AES. We can see that under no or lowerMRTs the bulk of time slices suffer only a few tens of D-cache misses thathappen between two back-to-back preemptions of the attacker. (We notethat this is already insufficient to perform prior attacks.) The number ofmisses increases to close to 200 for an MRT value of 5ms. This means thatthe AES process is evicting its own data, further obscuring informationfrom a would-be attacker. Underlying this is the fact that the numberof AES encryptions completed between two back-to-back preemptionsincreases drastically with the MRT: found that thousands to ten thousandsAES block-encryptions were completed between two preemptions whenMRT was varied from 100µsto 5ms, respectively.
Summary. While side channels pose a significant threat to the securityof cloud computing, our measurements in this section show that, fortu-nately, the hypervisor scheduler can help. Current attacks depend onfrequent preemptions to make detailed measurements of cache contents.Our measurements show that even delaying preemption for a fraction ofmillisecond prevents known attacks. While this is not proof that future at-tacks won’t be found that circumvent the MRT guarantee, it does stronglysuggest that deploying such a soft-isolation mechanism will raise the barfor attackers. This leaves the question of whether this mechanism is cheapto deploy, which we answer in the next section.
Note that we have focused on using the MRT mechanism for CPU and,indirectly, per-core hardware resources that are shared between multipleVMs. But rate-limiting-type mechanisms may be useful for other shareddevices like memory, disk/SSD, network, and any system-level shared de-
139
vices which suffer from a similar access-driven side-channels. For instance,a timed disk read could reveal user’s disk usage statistics like relative diskhead positions [100]. Fine-grained sharing of the disk across multipleusers could leak sensitive information via such a timing side-channel. Re-ducing the granularity of sharing by using MRT-like guarantees in the diskscheduler (e.g., servicing requests from user for at least Tmin, minimumservice time, before serving requests from another user) would result in asystem with similar security guarantees as above, eventually making suchside-channels harder to exploit. Further research is required to analyze theend-to-end performance impact of such a mechanism for various shareddevices and schedulers that manage them.
7.3 Performance of MRT Mechanism
The analysis in the preceding section demonstrates that MRT guaranteescan meaningfully mitigate a large class of cache-based side-channel attacks.The mitigation becomes better as MRT increases. We therefore turn todetermining the maximal MRT guarantee one can fix while not hinderingperformance.
7.3.1 Methodology
We designed experiments to quantify the negative and positive effects ofMRT guarantees as compared to a baseline configuration with no MRT (orzero MRT). Our testbed configuration uses the same hardware as in thelast section and the Xen configurations are summarized in Table 7.9. Werun two DomU VMs each with a single VCPU. The two VCPUs are pinnedto the same PCPU. Pinning to the same PCPU serves to isolate the effectof the MRT mechanism. The management VM, Dom0, has 6 VCPUs, onefor each PCPU (a standard configuration option). The remaining PCPUsin the system are otherwise left idle.
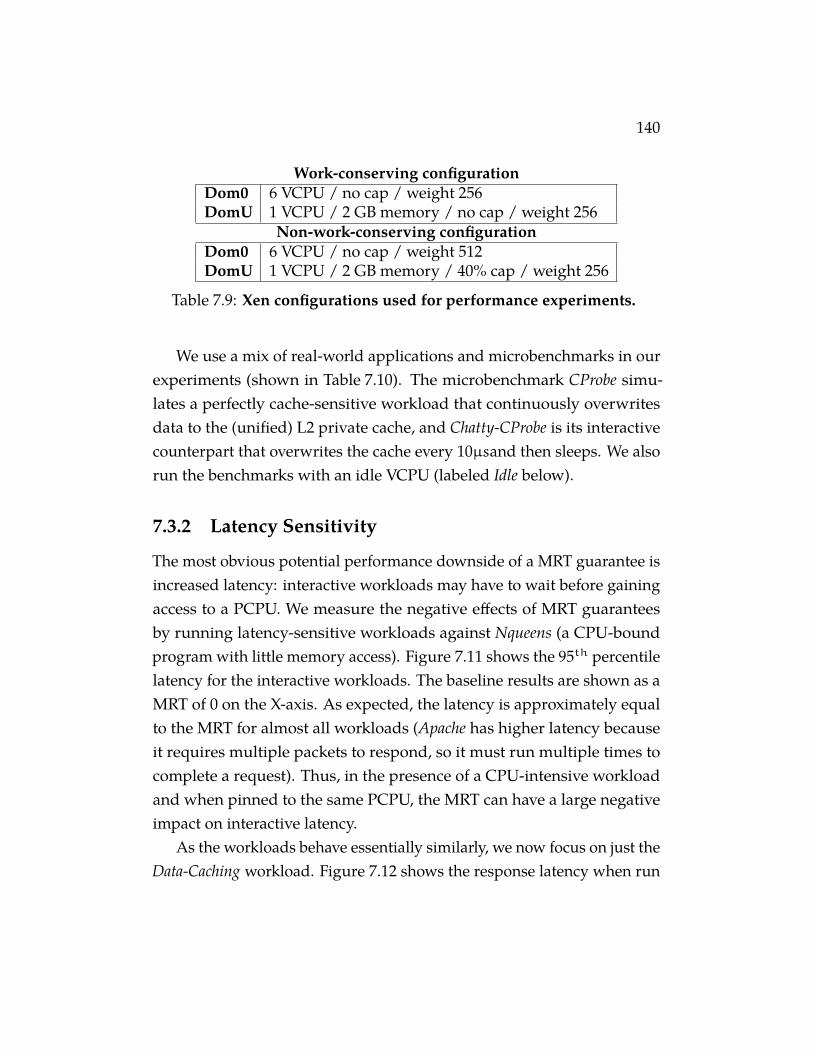
140
Work-conserving configurationDom0 6 VCPU / no cap / weight 256DomU 1 VCPU / 2 GB memory / no cap / weight 256
Non-work-conserving configurationDom0 6 VCPU / no cap / weight 512DomU 1 VCPU / 2 GB memory / 40% cap / weight 256
Table 7.9: Xen configurations used for performance experiments.
We use a mix of real-world applications and microbenchmarks in ourexperiments (shown in Table 7.10). The microbenchmark CProbe simu-lates a perfectly cache-sensitive workload that continuously overwritesdata to the (unified) L2 private cache, and Chatty-CProbe is its interactivecounterpart that overwrites the cache every 10µsand then sleeps. We alsorun the benchmarks with an idle VCPU (labeled Idle below).
7.3.2 Latency Sensitivity
The most obvious potential performance downside of a MRT guarantee isincreased latency: interactive workloads may have to wait before gainingaccess to a PCPU. We measure the negative effects of MRT guaranteesby running latency-sensitive workloads against Nqueens (a CPU-boundprogram with little memory access). Figure 7.11 shows the 95th percentilelatency for the interactive workloads. The baseline results are shown as aMRT of 0 on the X-axis. As expected, the latency is approximately equalto the MRT for almost all workloads (Apache has higher latency becauseit requires multiple packets to respond, so it must run multiple times tocomplete a request). Thus, in the presence of a CPU-intensive workloadand when pinned to the same PCPU, the MRT can have a large negativeimpact on interactive latency.
As the workloads behave essentially similarly, we now focus on just theData-Caching workload. Figure 7.12 shows the response latency when run
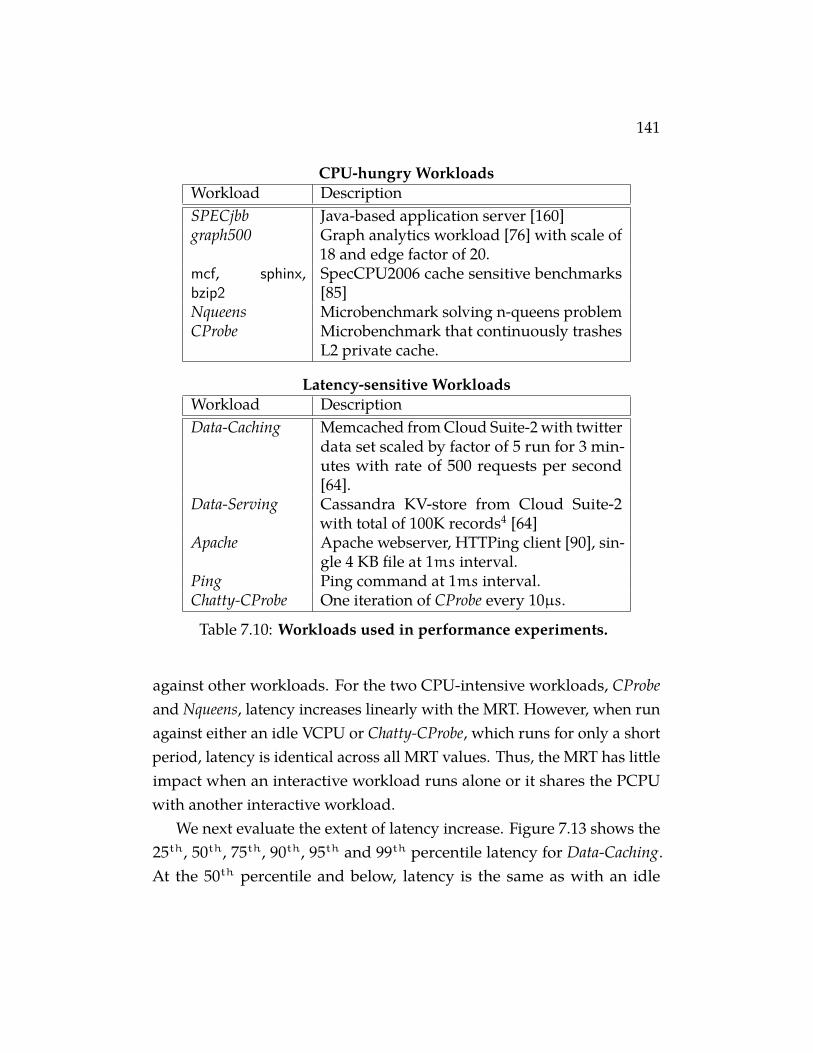
141
CPU-hungry WorkloadsWorkload DescriptionSPECjbb Java-based application server [160]graph500 Graph analytics workload [76] with scale of
18 and edge factor of 20.mcf, sphinx,bzip2
SpecCPU2006 cache sensitive benchmarks[85]
Nqueens Microbenchmark solving n-queens problemCProbe Microbenchmark that continuously trashes
L2 private cache.
Latency-sensitive WorkloadsWorkload DescriptionData-Caching Memcached from Cloud Suite-2 with twitter
data set scaled by factor of 5 run for 3 min-utes with rate of 500 requests per second[64].
Data-Serving Cassandra KV-store from Cloud Suite-2with total of 100K records4 [64]
Apache Apache webserver, HTTPing client [90], sin-gle 4 KB file at 1ms interval.
Ping Ping command at 1ms interval.Chatty-CProbe One iteration of CProbe every 10µs.
Table 7.10: Workloads used in performance experiments.
against other workloads. For the two CPU-intensive workloads, CProbeand Nqueens, latency increases linearly with the MRT. However, when runagainst either an idle VCPU or Chatty-CProbe, which runs for only a shortperiod, latency is identical across all MRT values. Thus, the MRT has littleimpact when an interactive workload runs alone or it shares the PCPUwith another interactive workload.
We next evaluate the extent of latency increase. Figure 7.13 shows the25th, 50th, 75th, 90th, 95th and 99th percentile latency for Data-Caching.At the 50th percentile and below, latency is the same as with an idle
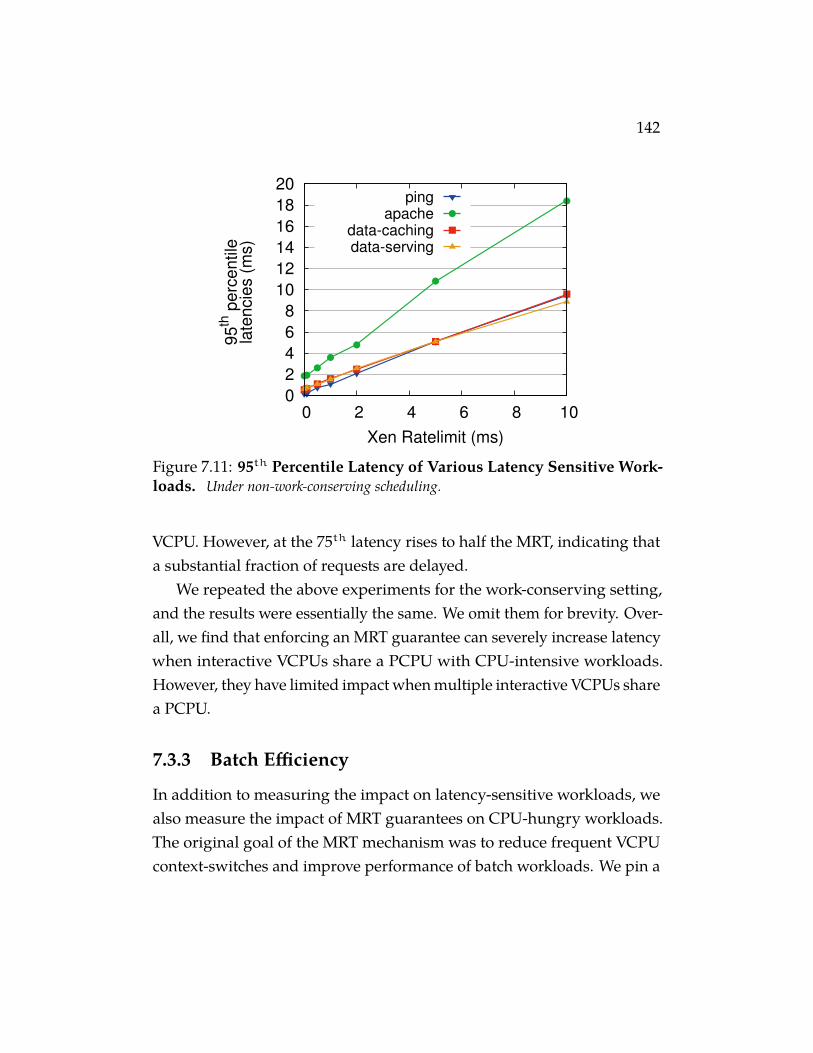
142
0
2
4
6
8
10
12
14
16
18
20
0 2 4 6 8 10
95
th p
erc
entile
la
tencie
s (
ms)
Xen Ratelimit (ms)
pingapache
data-cachingdata-serving
Figure 7.11: 95th Percentile Latency of Various Latency Sensitive Work-loads. Under non-work-conserving scheduling.
VCPU. However, at the 75th latency rises to half the MRT, indicating thata substantial fraction of requests are delayed.
We repeated the above experiments for the work-conserving setting,and the results were essentially the same. We omit them for brevity. Over-all, we find that enforcing an MRT guarantee can severely increase latencywhen interactive VCPUs share a PCPU with CPU-intensive workloads.However, they have limited impact when multiple interactive VCPUs sharea PCPU.
7.3.3 Batch Efficiency
In addition to measuring the impact on latency-sensitive workloads, wealso measure the impact of MRT guarantees on CPU-hungry workloads.The original goal of the MRT mechanism was to reduce frequent VCPUcontext-switches and improve performance of batch workloads. We pin a
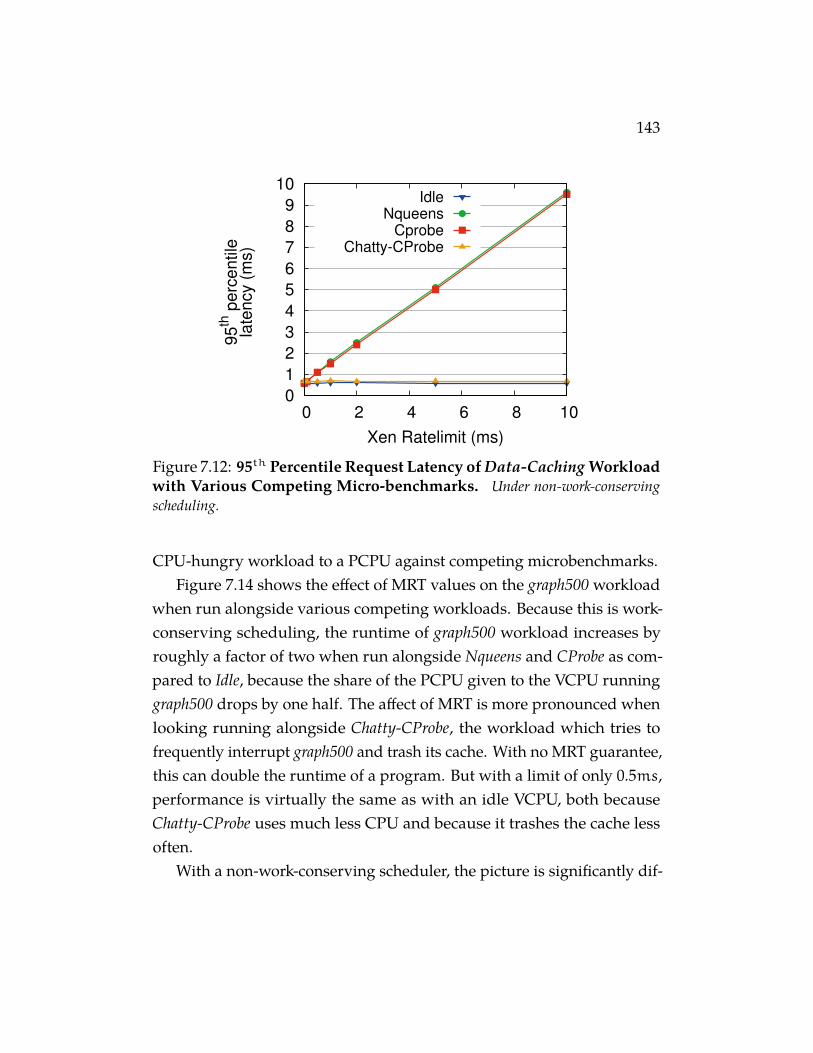
143
0
1
2
3
4
5
6
7
8
9
10
0 2 4 6 8 10
95
th p
erc
entile
la
tency (
ms)
Xen Ratelimit (ms)
IdleNqueens
CprobeChatty-CProbe
Figure 7.12: 95th Percentile Request Latency of Data-Caching Workloadwith Various Competing Micro-benchmarks. Under non-work-conservingscheduling.
CPU-hungry workload to a PCPU against competing microbenchmarks.Figure 7.14 shows the effect of MRT values on the graph500 workload
when run alongside various competing workloads. Because this is work-conserving scheduling, the runtime of graph500 workload increases byroughly a factor of two when run alongside Nqueens and CProbe as com-pared to Idle, because the share of the PCPU given to the VCPU runninggraph500 drops by one half. The affect of MRT is more pronounced whenlooking running alongside Chatty-CProbe, the workload which tries tofrequently interrupt graph500 and trash its cache. With no MRT guarantee,this can double the runtime of a program. But with a limit of only 0.5ms,performance is virtually the same as with an idle VCPU, both becauseChatty-CProbe uses much less CPU and because it trashes the cache lessoften.
With a non-work-conserving scheduler, the picture is significantly dif-
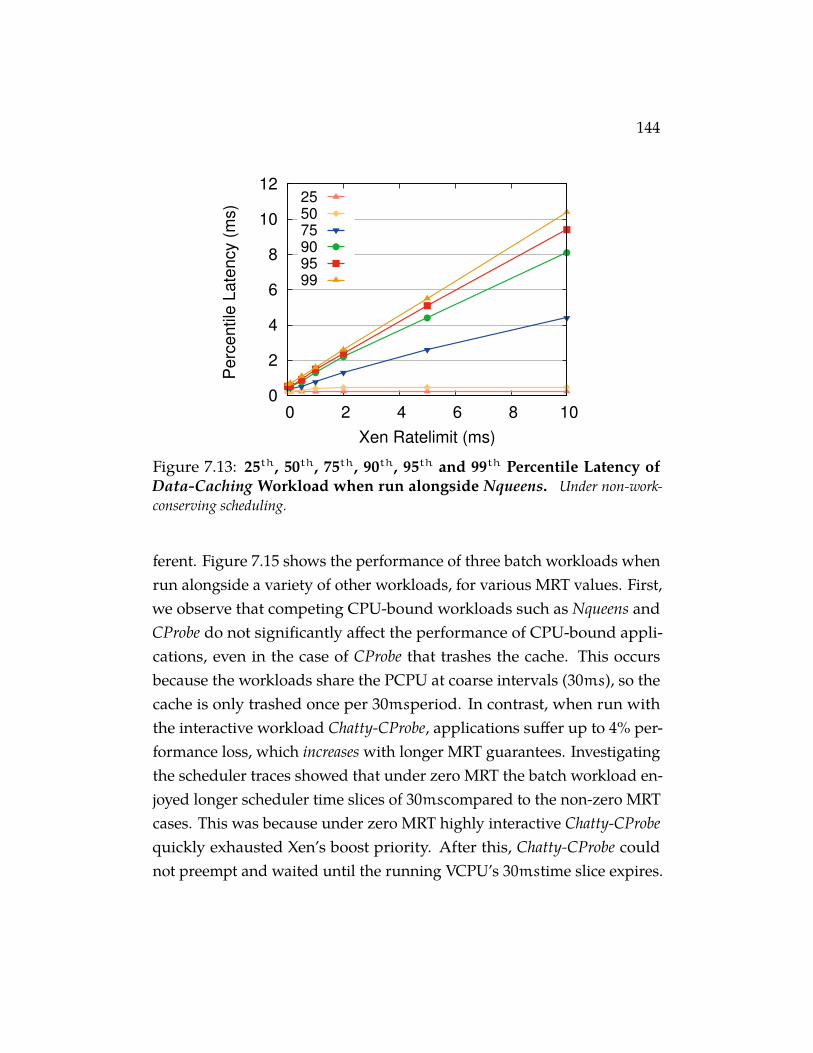
144
0
2
4
6
8
10
12
0 2 4 6 8 10
Perc
entile
Late
ncy (
ms)
Xen Ratelimit (ms)
255075909599
Figure 7.13: 25th, 50th, 75th, 90th, 95th and 99th Percentile Latency ofData-Caching Workload when run alongside Nqueens. Under non-work-conserving scheduling.
ferent. Figure 7.15 shows the performance of three batch workloads whenrun alongside a variety of other workloads, for various MRT values. First,we observe that competing CPU-bound workloads such as Nqueens andCProbe do not significantly affect the performance of CPU-bound appli-cations, even in the case of CProbe that trashes the cache. This occursbecause the workloads share the PCPU at coarse intervals (30ms), so thecache is only trashed once per 30msperiod. In contrast, when run withthe interactive workload Chatty-CProbe, applications suffer up to 4% per-formance loss, which increases with longer MRT guarantees. Investigatingthe scheduler traces showed that under zero MRT the batch workload en-joyed longer scheduler time slices of 30mscompared to the non-zero MRTcases. This was because under zero MRT highly interactive Chatty-CProbequickly exhausted Xen’s boost priority. After this, Chatty-CProbe couldnot preempt and waited until the running VCPU’s 30mstime slice expires.
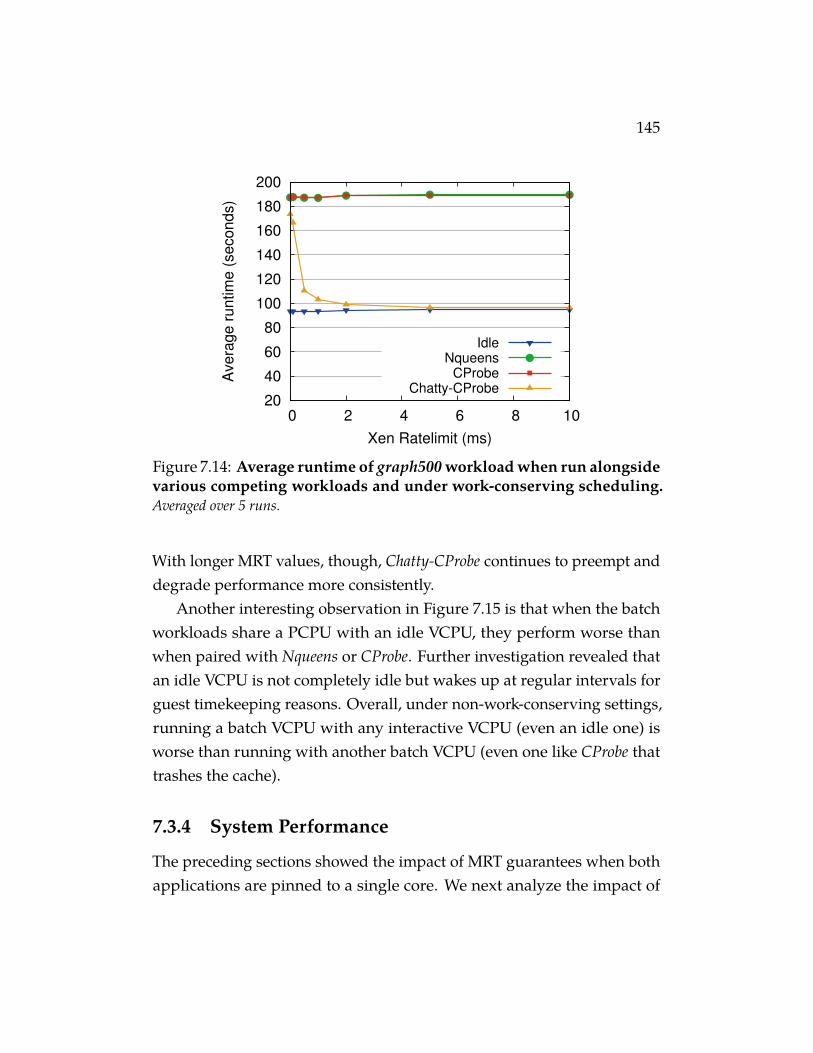
145
20
40
60
80
100
120
140
160
180
200
0 2 4 6 8 10
Ave
rag
e r
un
tim
e (
se
co
nd
s)
Xen Ratelimit (ms)
IdleNqueens
CProbeChatty-CProbe
Figure 7.14: Average runtime of graph500 workload when run alongsidevarious competing workloads and under work-conserving scheduling.Averaged over 5 runs.
With longer MRT values, though, Chatty-CProbe continues to preempt anddegrade performance more consistently.
Another interesting observation in Figure 7.15 is that when the batchworkloads share a PCPU with an idle VCPU, they perform worse thanwhen paired with Nqueens or CProbe. Further investigation revealed thatan idle VCPU is not completely idle but wakes up at regular intervals forguest timekeeping reasons. Overall, under non-work-conserving settings,running a batch VCPU with any interactive VCPU (even an idle one) isworse than running with another batch VCPU (even one like CProbe thattrashes the cache).
7.3.4 System Performance
The preceding sections showed the impact of MRT guarantees when bothapplications are pinned to a single core. We next analyze the impact of
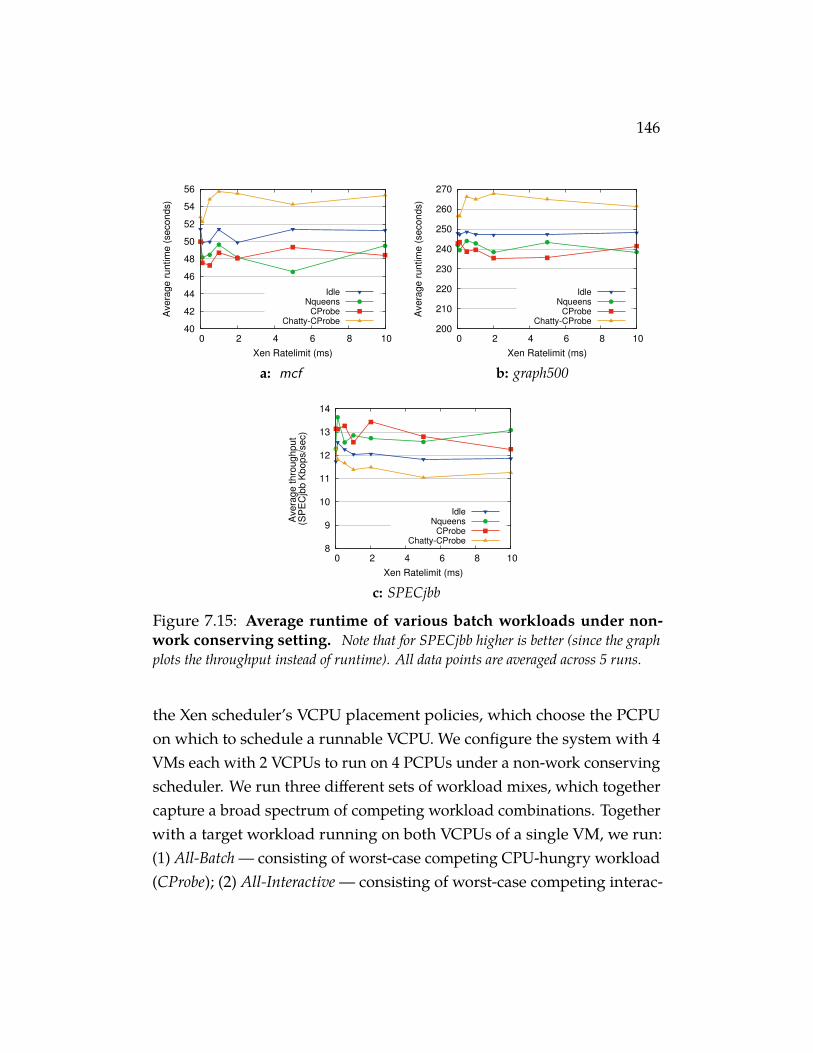
146
40
42
44
46
48
50
52
54
56
0 2 4 6 8 10
Ave
rage
ru
ntim
e (
se
co
nd
s)
Xen Ratelimit (ms)
IdleNqueens
CProbeChatty-CProbe
a: mcf
200
210
220
230
240
250
260
270
0 2 4 6 8 10
Ave
rage
ru
ntim
e (
se
co
nd
s)
Xen Ratelimit (ms)
IdleNqueens
CProbeChatty-CProbe
b: graph500
8
9
10
11
12
13
14
0 2 4 6 8 10
Ave
rag
e th
rou
gh
put
(SP
EC
jbb
Kb
op
s/s
ec)
Xen Ratelimit (ms)
IdleNqueens
CProbeChatty-CProbe
c: SPECjbb
Figure 7.15: Average runtime of various batch workloads under non-work conserving setting. Note that for SPECjbb higher is better (since the graphplots the throughput instead of runtime). All data points are averaged across 5 runs.
the Xen scheduler’s VCPU placement policies, which choose the PCPUon which to schedule a runnable VCPU. We configure the system with 4VMs each with 2 VCPUs to run on 4 PCPUs under a non-work conservingscheduler. We run three different sets of workload mixes, which togethercapture a broad spectrum of competing workload combinations. Togetherwith a target workload running on both VCPUs of a single VM, we run:(1) All-Batch — consisting of worst-case competing CPU-hungry workload(CProbe); (2) All-Interactive — consisting of worst-case competing interac-
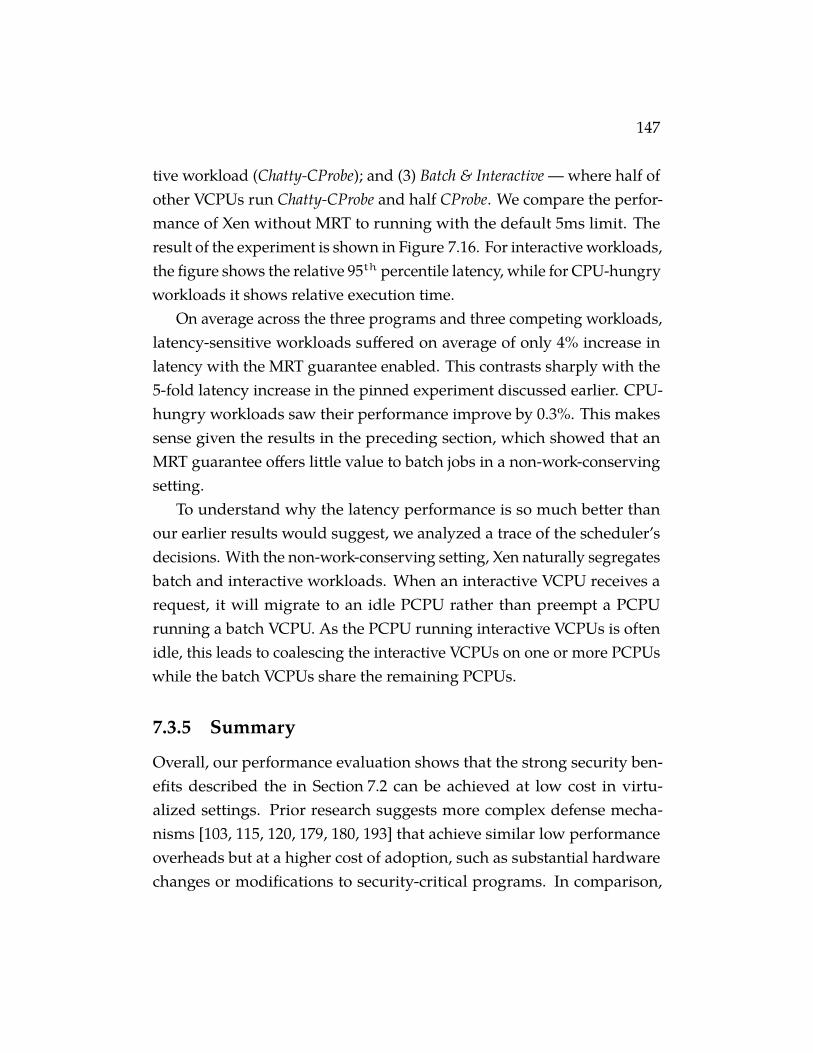
147
tive workload (Chatty-CProbe); and (3) Batch & Interactive — where half ofother VCPUs run Chatty-CProbe and half CProbe. We compare the perfor-mance of Xen without MRT to running with the default 5ms limit. Theresult of the experiment is shown in Figure 7.16. For interactive workloads,the figure shows the relative 95th percentile latency, while for CPU-hungryworkloads it shows relative execution time.
On average across the three programs and three competing workloads,latency-sensitive workloads suffered on average of only 4% increase inlatency with the MRT guarantee enabled. This contrasts sharply with the5-fold latency increase in the pinned experiment discussed earlier. CPU-hungry workloads saw their performance improve by 0.3%. This makessense given the results in the preceding section, which showed that anMRT guarantee offers little value to batch jobs in a non-work-conservingsetting.
To understand why the latency performance is so much better thanour earlier results would suggest, we analyzed a trace of the scheduler’sdecisions. With the non-work-conserving setting, Xen naturally segregatesbatch and interactive workloads. When an interactive VCPU receives arequest, it will migrate to an idle PCPU rather than preempt a PCPUrunning a batch VCPU. As the PCPU running interactive VCPUs is oftenidle, this leads to coalescing the interactive VCPUs on one or more PCPUswhile the batch VCPUs share the remaining PCPUs.
7.3.5 Summary
Overall, our performance evaluation shows that the strong security ben-efits described the in Section 7.2 can be achieved at low cost in virtu-alized settings. Prior research suggests more complex defense mecha-nisms [103, 115, 120, 179, 180, 193] that achieve similar low performanceoverheads but at a higher cost of adoption, such as substantial hardwarechanges or modifications to security-critical programs. In comparison,
148
0.8
0.9
1
1.1
1.2
pingm
emcached
cassandra
mcf
specjbb
graph500
Norm
aliz
ed P
erf
orm
ance
All-BatchAll-Interactive
Interactive-BatchIdle
Figure 7.16: Normalized Performance in a non-work-conserving config-uration with 5msMRT. Normalized to performance under zero-MRT case. Theleft three workloads report 95th percentile latency and the right three report runtime,averaged across 5 runs. In both cases lower is better.
the MRT guarantee mechanism is simple and monotonically improvesthe security against many existing side-channel attacks with zero cost ofadoption and low overhead.
We note that differences between the hypervisor and the OS schedulingmean that the MRT mechanism cannot be as easily applied by an operatingsystem to defend against malicious processes. As mentioned above, ahypervisor schedules a small and relatively static number of VCPUS ontoPCPUs. Thus, it is feasible to coalesce VCPUs with interactive behavioronto PCPUs separate from those running batch VCPUs. Furthermore,virtualized settings generally run with share-based scheduling, where eachVM or VCPU is assigned a fixed share of CPU resources. In contrast, the OSscheduler must schedule an unbounded number of threads, often withoutassigned shares. Thus, there may be more oversubscription of PCPUs,
149
which removes the idle time that allows interactive VCPUs to coalesceseparately from batch VCPUs. As a result, other proposed defenses maystill be applicable for non-virtualized systems, such as PaaS platforms thatmultiplex code from several customers within a single VM [86].
7.4 Integrating Core-State Cleansing
While the MRT mechanism was shown to be a cheap mitigation for protect-ing CPU-hungry workloads, it may not be effective at protecting interactiveones. If a (victim) VCPU yields the PCPU quickly, the MRT guaranteedoes not apply and an attacker may observe its residual state in the cache,branch predictor, or other hardware structures. We are unaware of any at-tacks targeting such interactive workloads, but that is no guarantee futureattacks won’t.
We investigate incorporating per-core state-cleansing into hypervisorscheduling. Here we are inspired in large part by the Düppel system [193],which was proposed as a method for guest operating systems to protectthemselves by periodically cleansing a fraction of the L1 caches. We willsee that by integrating a selective state-cleansing (SC) mechanism for I-cache, D-cache and branch predictor states into a scheduler that alreadyenforces an MRT guarantee incurs much less overhead than one mightexpect. When used, our cleansing approach provides protection for allprocesses within a guest VM (unlike Düppel, which targeted particularprocesses).
7.4.1 Design and Implementation
We first discuss the cleansing process, and below discuss when to apply it.The cleanser works by executing a specially crafted sequence of instructionsthat together overwrite the I-cache, D-cache, and branch predictor states of
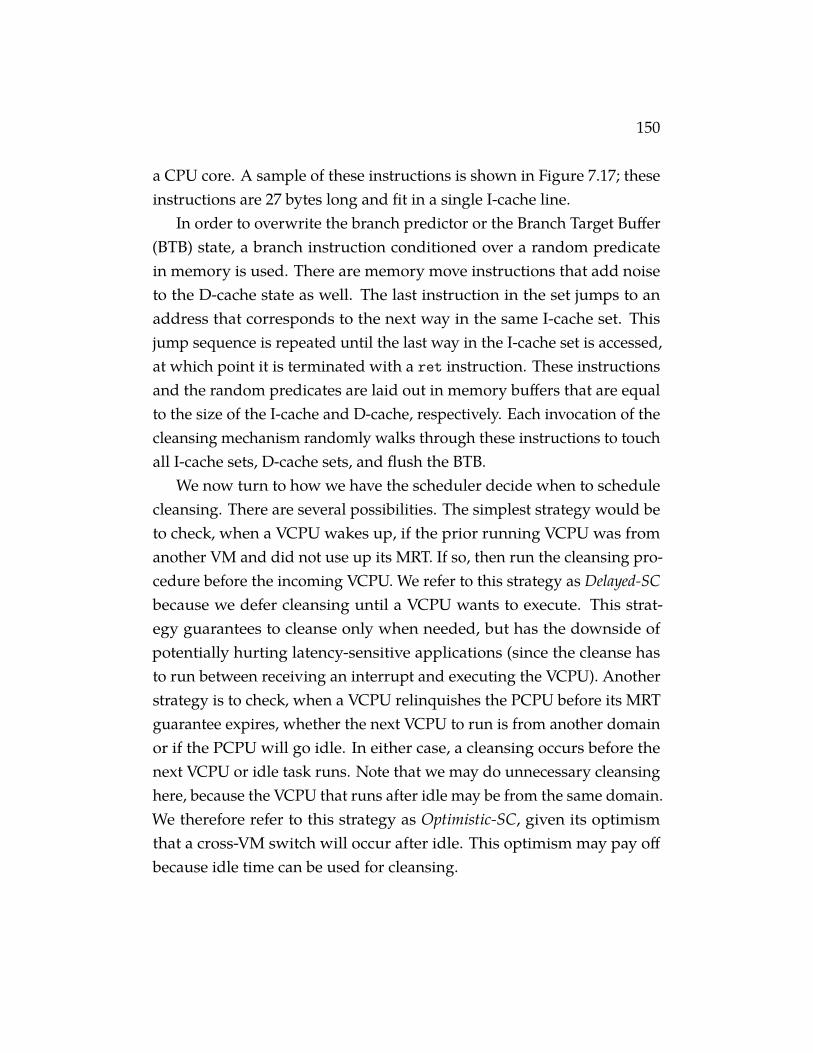
150
a CPU core. A sample of these instructions is shown in Figure 7.17; theseinstructions are 27 bytes long and fit in a single I-cache line.
In order to overwrite the branch predictor or the Branch Target Buffer(BTB) state, a branch instruction conditioned over a random predicatein memory is used. There are memory move instructions that add noiseto the D-cache state as well. The last instruction in the set jumps to anaddress that corresponds to the next way in the same I-cache set. Thisjump sequence is repeated until the last way in the I-cache set is accessed,at which point it is terminated with a ret instruction. These instructionsand the random predicates are laid out in memory buffers that are equalto the size of the I-cache and D-cache, respectively. Each invocation of thecleansing mechanism randomly walks through these instructions to touchall I-cache sets, D-cache sets, and flush the BTB.
We now turn to how we have the scheduler decide when to schedulecleansing. There are several possibilities. The simplest strategy would beto check, when a VCPU wakes up, if the prior running VCPU was fromanother VM and did not use up its MRT. If so, then run the cleansing pro-cedure before the incoming VCPU. We refer to this strategy as Delayed-SCbecause we defer cleansing until a VCPU wants to execute. This strat-egy guarantees to cleanse only when needed, but has the downside ofpotentially hurting latency-sensitive applications (since the cleanse hasto run between receiving an interrupt and executing the VCPU). Anotherstrategy is to check, when a VCPU relinquishes the PCPU before its MRTguarantee expires, whether the next VCPU to run is from another domainor if the PCPU will go idle. In either case, a cleansing occurs before thenext VCPU or idle task runs. Note that we may do unnecessary cleansinghere, because the VCPU that runs after idle may be from the same domain.We therefore refer to this strategy as Optimistic-SC, given its optimismthat a cross-VM switch will occur after idle. This optimism may pay offbecause idle time can be used for cleansing.
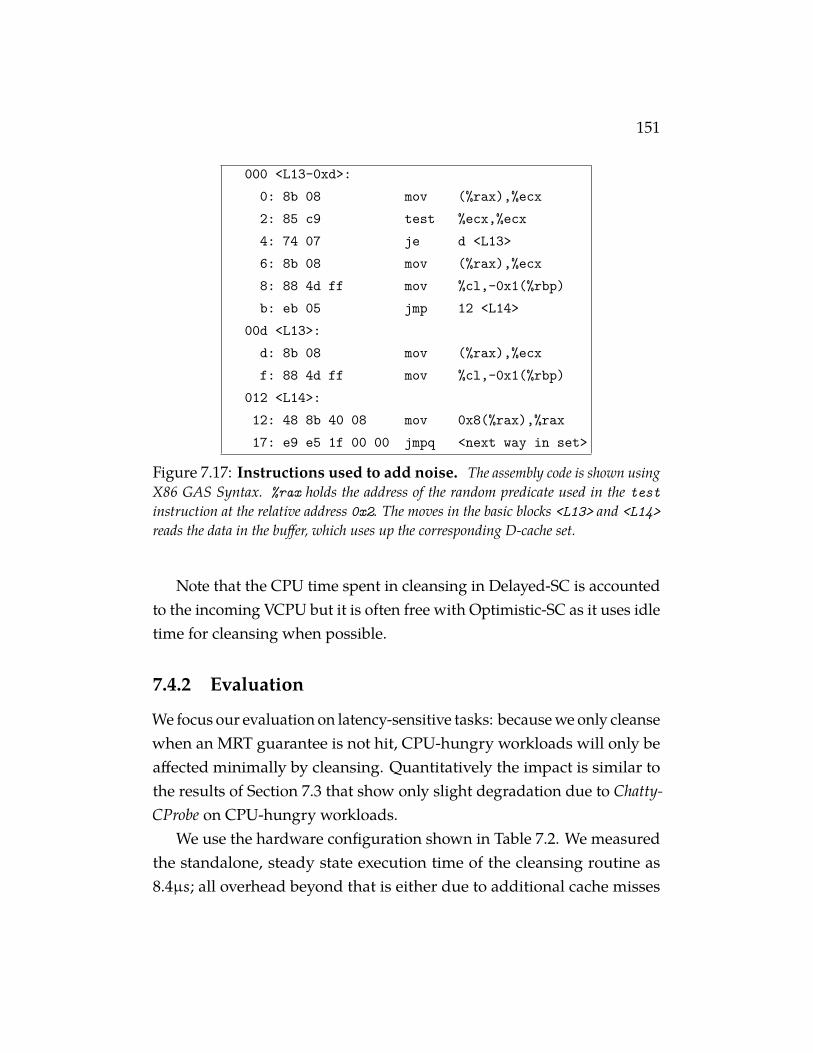
151
000 <L13-0xd>:0: 8b 08 mov (%rax),%ecx2: 85 c9 test %ecx,%ecx4: 74 07 je d <L13>6: 8b 08 mov (%rax),%ecx8: 88 4d ff mov %cl,-0x1(%rbp)b: eb 05 jmp 12 <L14>
00d <L13>:d: 8b 08 mov (%rax),%ecxf: 88 4d ff mov %cl,-0x1(%rbp)
012 <L14>:12: 48 8b 40 08 mov 0x8(%rax),%rax17: e9 e5 1f 00 00 jmpq <next way in set>
Figure 7.17: Instructions used to add noise. The assembly code is shown usingX86 GAS Syntax. %rax holds the address of the random predicate used in the testinstruction at the relative address 0x2. The moves in the basic blocks <L13> and <L14>reads the data in the buffer, which uses up the corresponding D-cache set.
Note that the CPU time spent in cleansing in Delayed-SC is accountedto the incoming VCPU but it is often free with Optimistic-SC as it uses idletime for cleansing when possible.
7.4.2 Evaluation
We focus our evaluation on latency-sensitive tasks: because we only cleansewhen an MRT guarantee is not hit, CPU-hungry workloads will only beaffected minimally by cleansing. Quantitatively the impact is similar tothe results of Section 7.3 that show only slight degradation due to Chatty-CProbe on CPU-hungry workloads.
We use the hardware configuration shown in Table 7.2. We measuredthe standalone, steady state execution time of the cleansing routine as8.4µs; all overhead beyond that is either due to additional cache misses
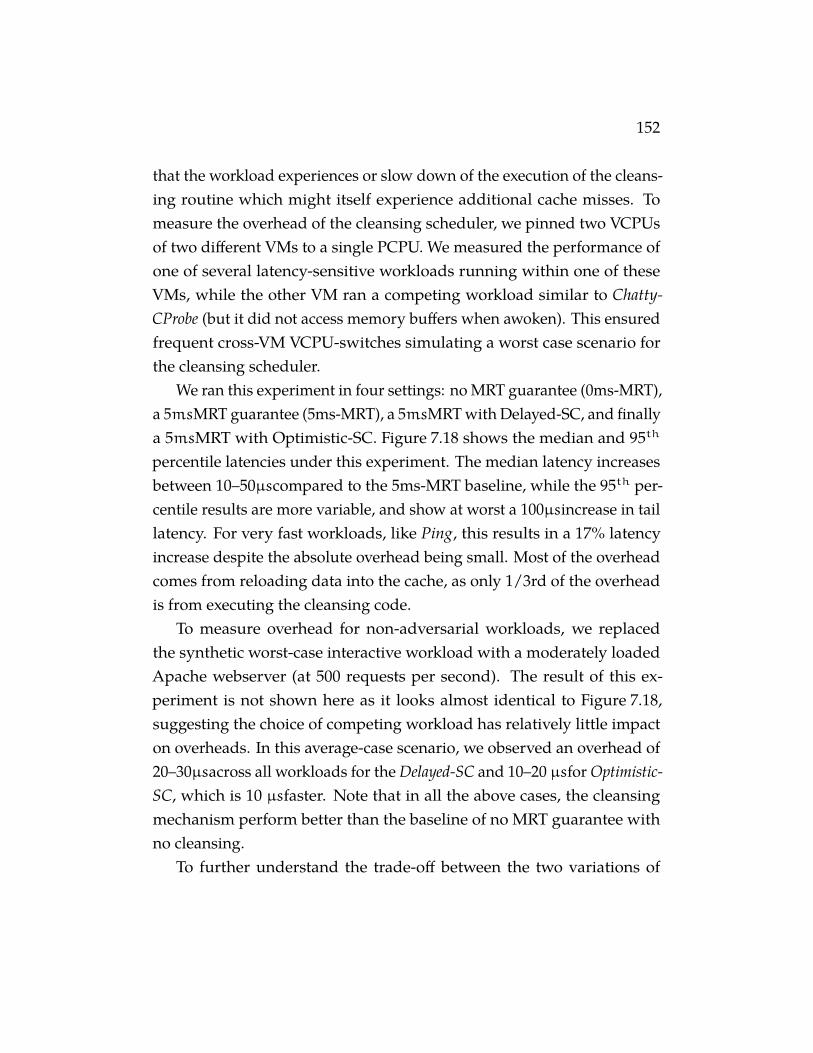
152
that the workload experiences or slow down of the execution of the cleans-ing routine which might itself experience additional cache misses. Tomeasure the overhead of the cleansing scheduler, we pinned two VCPUsof two different VMs to a single PCPU. We measured the performance ofone of several latency-sensitive workloads running within one of theseVMs, while the other VM ran a competing workload similar to Chatty-CProbe (but it did not access memory buffers when awoken). This ensuredfrequent cross-VM VCPU-switches simulating a worst case scenario forthe cleansing scheduler.
We ran this experiment in four settings: no MRT guarantee (0ms-MRT),a 5msMRT guarantee (5ms-MRT), a 5msMRT with Delayed-SC, and finallya 5msMRT with Optimistic-SC. Figure 7.18 shows the median and 95th
percentile latencies under this experiment. The median latency increasesbetween 10–50µscompared to the 5ms-MRT baseline, while the 95th per-centile results are more variable, and show at worst a 100µsincrease in taillatency. For very fast workloads, like Ping, this results in a 17% latencyincrease despite the absolute overhead being small. Most of the overheadcomes from reloading data into the cache, as only 1/3rd of the overheadis from executing the cleansing code.
To measure overhead for non-adversarial workloads, we replacedthe synthetic worst-case interactive workload with a moderately loadedApache webserver (at 500 requests per second). The result of this ex-periment is not shown here as it looks almost identical to Figure 7.18,suggesting the choice of competing workload has relatively little impacton overheads. In this average-case scenario, we observed an overhead of20–30µsacross all workloads for the Delayed-SC and 10–20 µsfor Optimistic-SC, which is 10 µsfaster. Note that in all the above cases, the cleansingmechanism perform better than the baseline of no MRT guarantee withno cleansing.
To further understand the trade-off between the two variations of
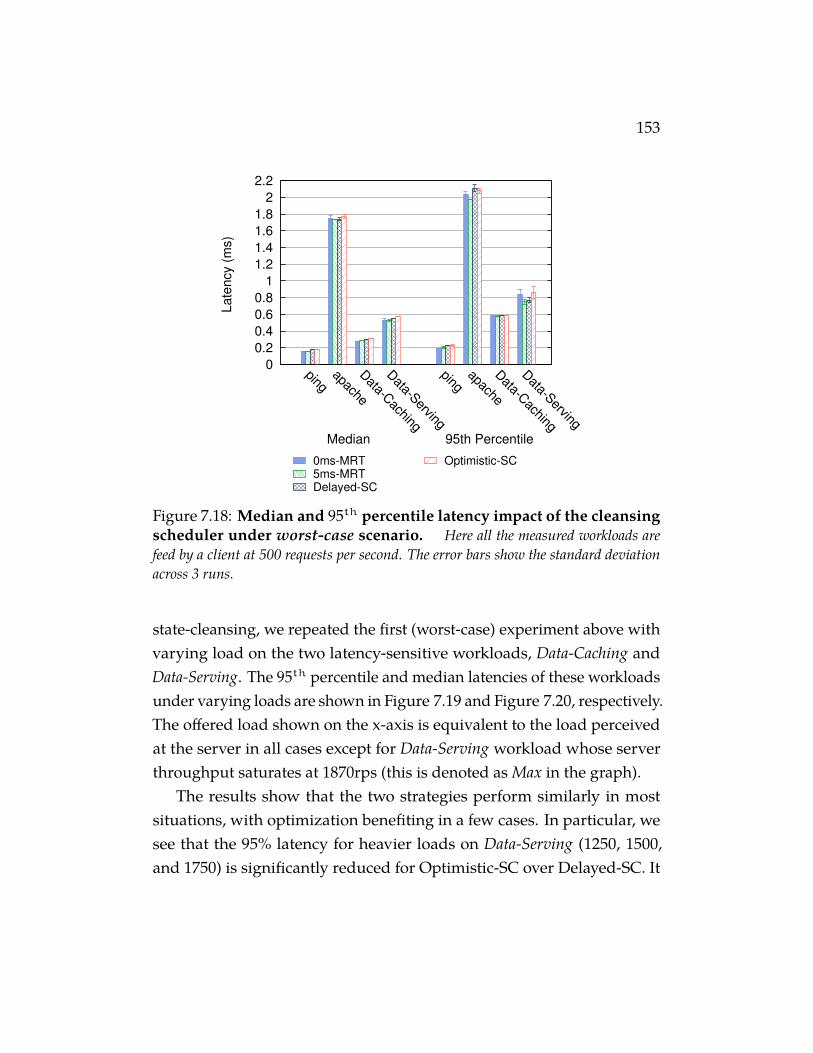
153
0
0.2
0.4
0.6
0.8
1
1.2
1.4
1.6
1.8
2
2.2
pingapache
Data-C
aching
Data-Serving
pingapache
Data-C
aching
Data-Serving
La
ten
cy (
ms)
0ms-MRT5ms-MRTDelayed-SC
Optimistic-SC
95th PercentileMedian
Figure 7.18: Median and 95th percentile latency impact of the cleansingscheduler under worst-case scenario. Here all the measured workloads arefeed by a client at 500 requests per second. The error bars show the standard deviationacross 3 runs.
state-cleansing, we repeated the first (worst-case) experiment above withvarying load on the two latency-sensitive workloads, Data-Caching andData-Serving. The 95th percentile and median latencies of these workloadsunder varying loads are shown in Figure 7.19 and Figure 7.20, respectively.The offered load shown on the x-axis is equivalent to the load perceivedat the server in all cases except for Data-Serving workload whose serverthroughput saturates at 1870rps (this is denoted as Max in the graph).
The results show that the two strategies perform similarly in mostsituations, with optimization benefiting in a few cases. In particular, wesee that the 95% latency for heavier loads on Data-Serving (1250, 1500,and 1750) is significantly reduced for Optimistic-SC over Delayed-SC. It
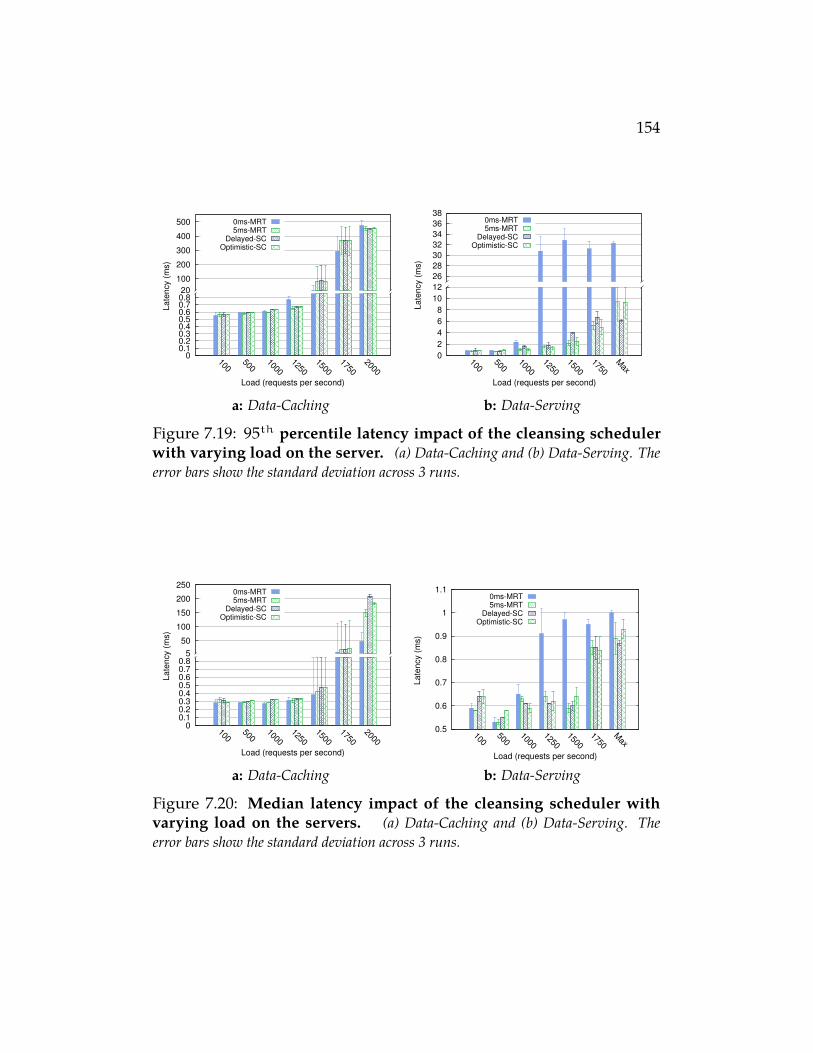
154
0 0.1 0.2 0.3 0.4 0.5 0.6 0.7 0.8
100500
10001250
15001750
2000
Load (requests per second)
100
200
300
400
500
Late
ncy (
ms)
20
0ms-MRT5ms-MRT
Delayed-SCOptimistic-SC
a: Data-Caching
0
2
4
6
8
10
12
100500
10001250
15001750
Max
Load (requests per second)
26
28
30
32
34
36
38
Late
ncy (
ms)
0ms-MRT5ms-MRT
Delayed-SCOptimistic-SC
b: Data-Serving
Figure 7.19: 95th percentile latency impact of the cleansing schedulerwith varying load on the server. (a) Data-Caching and (b) Data-Serving. Theerror bars show the standard deviation across 3 runs.
0 0.1 0.2 0.3 0.4 0.5 0.6 0.7 0.8
100500
10001250
15001750
2000
Load (requests per second)
50
100
150
200
250
Late
ncy (
ms)
5
0ms-MRT5ms-MRT
Delayed-SCOptimistic-SC
a: Data-Caching
0.5
0.6
0.7
0.8
0.9
1
1.1
100500
10001250
15001750
Max
Late
ncy (
ms)
Load (requests per second)
0ms-MRT5ms-MRT
Delayed-SCOptimistic-SC
b: Data-Serving
Figure 7.20: Median latency impact of the cleansing scheduler withvarying load on the servers. (a) Data-Caching and (b) Data-Serving. Theerror bars show the standard deviation across 3 runs.
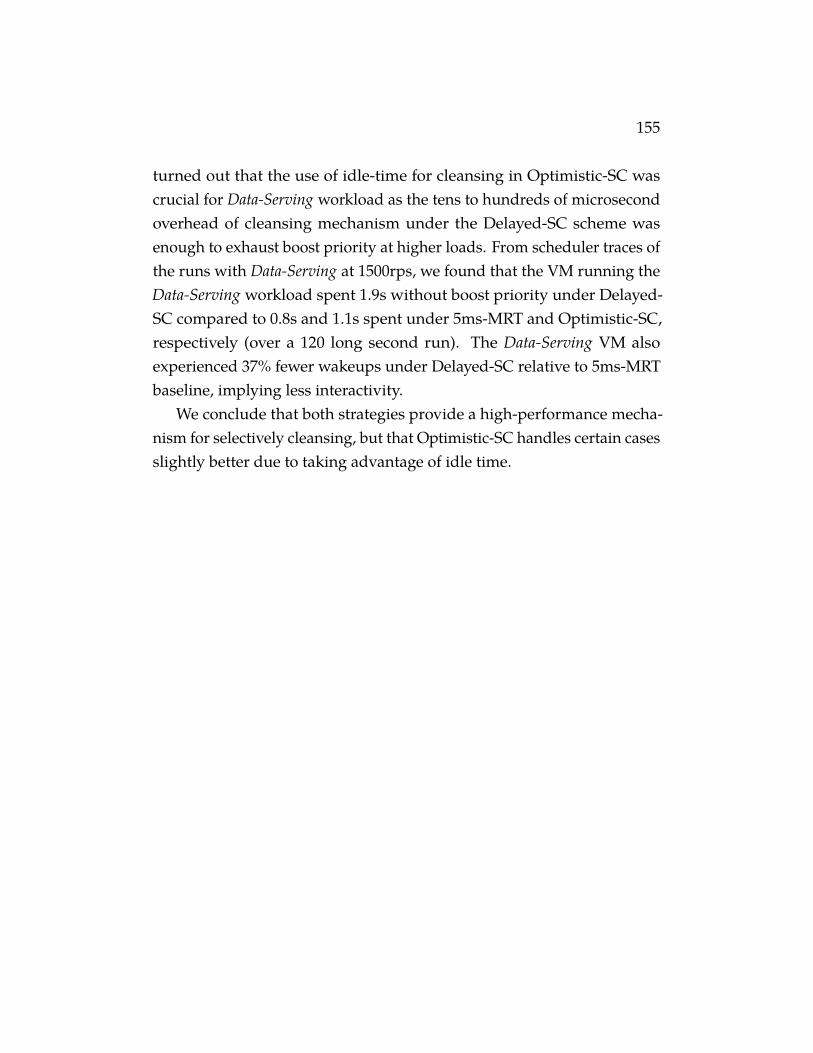
155
turned out that the use of idle-time for cleansing in Optimistic-SC wascrucial for Data-Serving workload as the tens to hundreds of microsecondoverhead of cleansing mechanism under the Delayed-SC scheme wasenough to exhaust boost priority at higher loads. From scheduler traces ofthe runs with Data-Serving at 1500rps, we found that the VM running theData-Serving workload spent 1.9s without boost priority under Delayed-SC compared to 0.8s and 1.1s spent under 5ms-MRT and Optimistic-SC,respectively (over a 120 long second run). The Data-Serving VM alsoexperienced 37% fewer wakeups under Delayed-SC relative to 5ms-MRTbaseline, implying less interactivity.
We conclude that both strategies provide a high-performance mecha-nism for selectively cleansing, but that Optimistic-SC handles certain casesslightly better due to taking advantage of idle time.
156
8Related Work
In this chapter, we survey several prior research related to the three prob-lems that are tackled in this dissertation, in their respective sections: 1.placement vulnerability (§ 8.1), 2. lack of performance isolation (§ 8.2),and 3. cross-VM side-channel attacks (§ 8.3).
8.1 Co-location in Public Clouds
Our work on understanding placement vulnerabilities in modern security-hardened public clouds (Chapter 5) derive inspiration from many relatedworks. There are also subsequent works in this area that signifies theimportance of this problem. We survey all those related works in thissection.
8.1.1 VM Placement Vulnerability Studies
Ristenpart et al. [152] first studied the placement vulnerability in publicclouds, which showed that a malicious cloud tenant could place one of hisVMs on the same machine as a target VM with high probability. Placementvulnerabilities exploited in their study include publicly available mappingof VM’s public/internal IP addresses, disclosure of Dom0 IP addresses,and a shortcut communication path between co-resident VMs. Their studywas followed by Xu et al. [184] and further extended by Herzberg et al. [88].However, the results of these studies have been outdated by the recent
157
development of cloud technologies, which is the main motivation of ourwork.
Concurrent with our work, Xu et al. [185] conducted a systematic mea-surement study of co-resident threats in Amazon EC2. Their focus, how-ever, is in-depth evaluation of co-residency detection using network routetraces and quantification of co-residence threats on older generation in-stances with EC2’s classic networking [15] (prior to Amazon VPC). Incontrast, we study placement vulnerabilities in the context of VPC on EC2,as well as on Azure and GCE. That said, the two studies are complementaryand collectively strengthen the arguments made by each other.
8.1.2 Defenses Against Co-location
New VM placement policies to defend against placement attacks havebeen studied by Han et al. [80, 81] and Azar et al. [36]. Han et al. proposetwo different policies for reducing the chances of co-location of an adver-sary: 1. game-theoretic defense: use a pool of policies and select a policyat random or 2. place VMs that belong to a user in a smaller subset ofmachines instead of stripping each VM on different machines, therebyreducing the probability of co-location. Although, both these mechanismsincrease the cost of a simple attacker, it is unclear whether their proposedpolicies work against the performance and reliability goals of public cloudproviders. In fact, we consider a random placement policy as a moresecure and apt reference policy for comparing different placement policies.Further, Han et al. themselves admit that the second placement policycould be circumvented by a sophisticated attacker who could judiciouslyuse multiple accounts to increase his chance of co-location. On the otherhand, Azar et al. take a formal approach to designing co-location resis-tance placement algorithm [36]. In their formal model, they consider bothefficiency (as total amount of resources used) and security, which theydefine by introducing a formal notion of co-location resistance. This work
158
establishes foundation to reason and design placement algorithms withstrict notion of security against co-location attacks, although there is along gap that needs to be filled to employ them in practice.
Recently, Moon et al. propose a cloud-provider-assisted migrationmechanism, where they use a moving target philosophy to bound infor-mation leakage via co-location of any single tenant [127]. First, they startby formalizing information leakage due to co-residency between differentuser VMs and propose four models, one model for each type of victim(Replicated vs. Non-replicated) and adversary (Collaborative vs. Non-collaborative). Second, they design an efficient and scalable algorithm thatdecides when and where to migrate a VM, taking into account the historyof migration and resource needs for migration. But, as mentioned earlierVM migration is often expensive and involve non-negligible downtimefor a commercial application. Further, as the Moon et al. point out, afaster attack may still succeed under this defense. Nevertheless, this is asignificant step in the right direction and will greatly improve security ofthe cloud infrastructure against malicious users.
8.1.3 Co-residency Detection Techniques
Techniques for co-residency detection have been studied in various con-texts. We categorize these techniques into one of the two major classes:side-channel approaches to detecting co-residency with uncooperative VMsand covert-channel approaches to detecting co-residency with cooperativeVMs.
Side-channel based detection. Side-channels allow one party to exfil-trate secret information from another; hence these approaches may beadapted in practical placement attack scenarios with targets not controlledby the attackers. Network round-trip timing side-channel was used by Ris-tenpart et al. [152] and subsequently others [61, 168] to detect co-residency.
159
Zhang et al. [190] developed a system called HomeAlone to enable VMs todetect third-party VMs using timing side-channels in the last level caches.Bates et al. [43] proposed a side-channel for co-residency detection by caus-ing network traffic congestion in the host NICs from attacker-controlledVMs; the interference of target VM’s performance, if the two VMs areco-resident, should be detectable by remote clients. However, none ofthese approaches works effectively in modern cloud infrastructures forreasons mentioned earlier (in Section 4.1).
Covert-channel based detection. Covert-channels, a topic studied sincethe 1970s [112], are secretive communication channels that involve twocolluding parties. Covert-channels on shared hardware components canbe used for co-residency detection when both VMs under test are coopera-tive. Coarse-grained covert-channels in CPU caches and hard disk driveswere used in Ristenpart et al. [152] for co-residency confirmation. Xu etal. [184] established covert-channels in shared last level caches betweentwo colluding VMs in the public clouds. Wu el al. [182] exploited memorybus as a covert-channel on modern x86 processors, in which the senderissues atomic operations on memory blocks spanning multiple cache linesto cause memory bus locking or similar effects on recent processors. How-ever, covert-channels proposed in the latter two studies were not designedfor co-residency detection, while those developed in our work are tunedfor this purpose. Concurrent to our work, Zhang et al. also used the samememory-covert channel in their recent work on placement vulnerabilitystudy [185].
Recently (in 2015), Inci et al. explored several techniques to detectco-residency including techniques suggested in many prior works andconcluded that an LLC based covert-channel was the most reliable tech-nique among the lot [93]. Note that an LLC-based covert-channel may notbe effective in detecting all VM co-locations running on a multi-socketmulti-core machine as LLCs are a per-socket resource. In contrast, we dis-
160
covered an uncooperative co-residency detection mechanism that dependson creating and detecting contention on a shared memory bus, which is asystem-wide shared resource.
Other techniques. Kohno et al. [108] demonstrated how clock skew inprevious generation machines could be used to fingerprint machines. Theyutilize timestamps in TCP (or ICMP) network pings to remotely identify aunique machine (or differentiate two machines). Such a technique wouldalso be applicable to virtualized platform where hypervisors give nativeaccess to the system clock as virtualizing system clock adds non-trivialoverheads. An attacker could cleverly adapt this mechanism to detect co-residency by comparing the machine fingerprints of the two VMs undertest. Although, analysis of clock-skew is non-trivial, the advantage ofthis approach over the others is that the attacker only require a networkaddress and a publicly accesible TCP endpoint (e.g. ssh) on VMs undertest. Despite these advantages, because of the complexity of this technique,we use a simpler alternative technique in our study.
8.2 Lack of Performance Isolation in PublicClouds
Our work on Resource-Freeing Attack (RFA) (Chapter 6) builds on pastwork surveying the performance interference of virtual machines, hard-ware and software techniques for improving performance isolation, side-channel attacks, and scheduler vulnerabilities. Many of these works arealso related to our work on scheduler-based defenses against cross-VMattacks that aim to improve performance isolation (Chapter 7).
161
8.2.1 Performance Interference
Numerous works have found severe performance interference in cloudcomputing platforms [113, 144, 155, 177]. Our study of performance inter-ference focuses more on the worst-case interference in a controlled settingthan on the actual interference in cloud platforms. In addition, we mea-sure the interference from pairs of different workloads rather than twoinstances of the same workload. Finally, our work looks at the impact ofmulticore scheduling by pinning VMs to a specific core.
8.2.2 Performance Isolation
There are numerous prior works that have attempted to reduce the effectof performance interference between competing workloads. Majority ofthese works have focused on performance- and efficiency-centric goalswith limited or no focus on security implications of the system. Particularly,they either focus on Quality-of-Service (QoS) of a subset of applications(foreground or interactive) or aim to improve the datacenter utilizationand sometimes both. Nevertheless, such works help reduce contentionand hence the need for RFAs.
Contention for cache and processor resources is a major cause of per-formance loss, and many projects have studied resource-aware CPU sched-ulers that avoid contention [48, 98, 122, 196]. In cache/network contention,these schedulers may place the cache and network workloads on differ-ent packages to avoid affecting the cache. Similar work has been doneat the cluster level to place jobs [39, 57, 114, 156, 162, 186, 189]. Thesesystems attempt to place workloads that use non-interfering resourcestogether or even to leave a processor idle if interference is bad. Thesecluster schedulers either do task placement apriori at the start of the taskor detect interference and migrate tasks to a different machine. Some ofthem also try to throttle interfering low priority (background) tasks to
162
reduce performance interference with a high priority (foreground) tasks.Although none of these systems are designed for public clouds, several ofthese techniques could be adopted to improve isolation in public clouds.
Beyond scheduling, software mechanisms can ensure performance iso-lation for many other hardware resources, including cache [148], disk [77],memory bandwidth [174] and network [158]. In addition to the softwaretechniques, changes to low-level hardware have been proposed to bettershare memory bandwidth and processor caches [133, 147]. Many of thetechniques that defend against side-channels (described in a later section,§ 8.3.2) could also improve isolation.
Overall, all the above mechanisms would reduce the amount of con-tention and hence reduce the need and the benefit of RFAs.
8.2.3 Gaming Schedulers
The network/cache RFA works by forcing the scheduler to context switchat much coarser granularities than normal. Similar techniques have beenused in the past to game schedulers in Linux [165] and Xen [194] in orderto extend the timeslice of a thread. These techniques exploit the differencebetween the granularity of CPU allocation (cycles) and the granularity ofaccounting (timer ticks). There are also other attacks that enable Denialof Service on Linux Completely Fair Scheduler (CFS) [78]. Unlike theseattacks, RFAs influence the scheduler to view an originally interactiveworkload as a CPU-bound workload, in the process influencing resourceallocation that may benefit another task.
8.2.4 Side-channel Attacks
RFAs exploit the lack of isolation to boost performance. Several worksdemonstrated side-channel attacks through the shared LLC that can be
163
used to extract information about co-resident virtual machines (e.g., [152,184, 190]). More details in the following section.
8.3 Side-channel Attacks and Defenses
The work on soft-isolation to address information leakage across multi-tenant VM boundaries and improve performance isolation, also derivesmotivation from many related works. We survey works on side-channelattacks that motivate the problem we address (§ 8.3.1) and various pro-posed defenses which shows that our work takes an approach that has notbeen explored in the recent past (§ 8.3.2).
8.3.1 Attacks
Side-channel attacks can be classified into three types: time-, trace-, andaccess-driven. Time-driven attacks arise when an attacker can glean usefulinformation via repeated observations of the (total) duration of a victim op-eration, such as the time to compute an encryption (e.g., [2, 47, 52, 83, 107]).Trace-driven attacks work by having an attacker continuously monitor acryptographic operation, for example via electromagnetic emanations orpower usage leaked to the attacker (e.g., [66, 106, 145].
In this dissertation, we focus on access-driven side-channel attacks, inwhich the attacker is able to run a program on the same physical server asthe victim. These abuse stateful components of the system shared betweenattacker and victim program, and have proved damaging in a wide varietyof settings, including [3, 78, 141, 143, 152, 187].
In cloud setting. In the cross-VM setting, the attacker and victim are twoseparate VMs running co-resident (or co-tenant) on the same server. Thecross-VM setting is of particular concern for public IaaS clouds, where it
164
has been shown that an attacker can obtain co-residence of a maliciousVM on the same server as a target [152].
Zhang, Juels, Reiter, and Ristenpart (ZJRR) [191] demonstrated thefirst cross-VM attack with sufficient granularity to extract ElGamal secretkeys from the victim. They use a version of the classic Prime+Probetechnique [141]: the attacker first primes the cache (instruction or data)by accessing a fixed set of addresses that fill the entire cache. He thenyields the CPU, causing the hypervisor to run the victim, which begins toevict the attacker’s data or instructions from various cache. As quickly aspossible, the attacker preempts the victim, and then probes the cache byagain accessing a set of addresses that cover the entire cache. By measuringthe speed of each cache access, the attacker can determine which cachelines were displaced by the victim, and hence learn some informationabout which addresses the victim accessed. The ZJRR attack builds off along line of cross-process attacks (c.f., [3, 4, 78, 141, 143]) all of which targetper-core microarchitectural state. When simultaneous multi-threading(SMT) is disabled (as is typical in cloud settings), such per-core attacksrequire that the attacker time-shares a CPU core with the victim. Similarto the cross-process attack demonstrated by Bangerter et al. that abusethe Linux process scheduler [78], ZJRR uses inter-processor interrupts tomake frequent observation of shared state.
Fewer attacks thus far have abused (what we call) off-core state, such aslast-level caches used by multiple cores. Some off-core attacks are coarse-grained, allowing attackers to learn only a few bits of information (e.g.,whether the victim is using the cache or not [152]). An example of a fine-grained off-core attack is the recent Flush+Reload attack of Yarom andFalkner [187]. Their attack extends the Bangerter et al. attack to instead tar-get last-level caches on some modern Intel processors and has been shownto enable very efficient theft of cryptographic keys in both cross-processand cross-VM settings. However, like the Bangerter et al. attack, it relies on
165
the attacker and victim having shared memory pages. This is a commonsituation for cross-process settings, but also arises in cross-VM settingsshould the hypervisor perform memory page deduplication. While severalhypervisors implement deduplication, thus far no IaaS clouds are knownto use the feature and so are not vulnerable.
Attack on live public clouds. Zhang et al. demonstrated first of its kindsuccessful side-channel attack across tenant instances in a container-basedPaaS cloud [192]. They showed how a malicious user could steal potentiallysensitive application data like number of items in the shopping cart of ane-commerce application, hijack user accounts and break single sign-onuser authentication applications across multi-tenant container boundary.
Recently, Inci et al. demonstrated cross-VM side-channel on modernimplementation of RSA in a popular public clouds (EC2) [93], which apartfrom the actual side-channel attack included figuring out how to detect co-location, and reverse engineering the hardware LLC algorithm that mapsan address to memory location. The latter is essential for speeding up theactual attack making it practical in live clouds. This further demonstratesthe practicality of side-channel attacks in modern security-hardened cloudinfrastructure.
8.3.2 Defenses
Hard isolation. An obvious solution is to prevent a successful side-channel attack is to avoid sharing hardware between attacker and victimtasks, which we call hard isolation. Partitioning the cache in hardware orsoftware prevents its contents from being shared [103, 149, 157, 179, 180].This requires special-purpose hardware or loss of various useful features(e.g., large pages) and thus limits the adoption in a public cloud envi-ronment. Similarly, one can allocate exclusive memory resources for asensitive process [103] in the software. Such a mechanism requires iden-
166
tification of the sensitive application and hence is not a general-purposesolution. Assigning VMs to run on different cores avoids sharing of per-core hardware [101, 118, 164], and assigning them to different serversavoids sharing of any system hardware [152]. A key challenge here isidentifying an attacker and victim in order to separate them; otherwisethis approach reduces to using dedicated hardware for each customer,reducing utilization and thus raising the price of computing.
Another form of hard isolation is to reset hardware state when switch-ing from one VM to another. For example, flushing the caches on ev-ery context switch prevents the cache state from being shared betweenVMs [193]. However, this can decrease performance of cache-sensitiveworkloads both because of the time taken to do the flush and the loss incache efficiency.
Adding noise. Beyond hard isolation are approaches that modify hard-ware to add noise, either in the timing or by obfuscating the specificside-channel information. The former can be accomplished by removingor modifying timers [115, 120, 172] to prevent attackers from accuratelydistinguishing between microarchitectural events, such as a cache hit anda miss. For example, StopWatch [115] removes all timing side-channelsand incurs a worse-case overhead of 2.8x for network intensive workloads.Specialized hardware-support could also be used to obfuscate and ran-domize processor cache usage [109, 180]. All of these defenses either resultin loss of high-precision timer or require hardware changes.
An alternative to adding noise to the timing information, prior workshave also attempted to add noise to the shared state. Düppel adds noise tothe local processor cache state by flushing caches when sensitive applica-tions run inside a VM [193]. Similarly, programs can be changed to obfus-cate access patterns [49, 50]. These approaches are not general-purpose, asthey rely on identifying and fixing all security-relevant programs. Worst-case overheads for these mechanisms vary from 6–7%.
167
Recently, Xiao et al. used differential privacy mechanisms to pluginformation leakage in shared pseudo filesystems like procfs [183], whichare often used in attacks on a multi-user environment. This fixes a specificvulnerability in a system shared resource in a novel way but again is not ageneral purpose solution.
Smart scheduling. This dissertation is not the first to explore smart sched-uler designs to improve security which includes defending against side-channel attacks. In 1992, Wei-Ming Hu proposed a new process schedulercalled lattice scheduler [91] that plugs cache covert-channels. Processesunder the lattice scheduler are tagged into access classes of varying se-crecy and the scheduler avoids scheduling processes that resulted in adownward transition in secrecy, i.e., a regular process is scheduled after ahighly sensitive (high secrecy) process. Our work is similar to this simplescheduler mechanism in the fact that any interaction other than intra-tenant (multiple VCPU of a single user VM) as sensitive and ratelimitssuch interaction.
Several past efforts attempt to minimize performance interference be-tween workloads (e.g., Q-clouds [131], mClock [77] and Bubble-Up [118]),but do not consider adversarial workloads such as side-channel attacks.
168
9Conclusion and Lessons
Learned
Many enterprise applications [25–30, 34, 68, 124, 135] that are in day-to-day use by customers over the Internet are hosted in the public clouds.These applications run inside virtual machines that share the same hostto run other VMs that belong to arbitrary users (multi-tenancy). Theonus is on the cloud infrastructure to make sure that this sharing is onlyprofitable and not insecure. Unfortunately, we show that the state-of-the-art cloud infrastructure do not provide sufficient isolation proving thethesis that: “the practice of multi-tenancy in public clouds demands strongerisolation guarantees between VMs in the presence of malicious users.” In thischapter, we will revisit this thesis and show how the conclusion of theworks (Chapter 5, 6 & 7) presented in this dissertation support this thesis.
We specifically focused on one of the major security threats in publicclouds, co-location or cross-VM attacks and demonstrated how lack ofisolation enable a malicious user to exploit such attacks in live clouds.In the first part of the dissertation we evaluated the placement policiesused in public clouds for vulnerabilities that enable any user to influenceco-location with a set of target victim VMs. Apart from evaluating thecluster scheduler, we explored how performance interference betweenco-located VMs could incentivize new attacks that help steal resourcesfrom neighboring VMs.
In the second part, we investigated a new design principle called soft-
169
isolation that improve VM isolation without compromising on the ef-ficiency of resource sharing between VMs. We demonstrated this soft-isolation principle with a simple CPU scheduler primitive, MinimumRunTime (MRT) guarantee, which limits dangerous cross-VM interactionsbetween multi-tenant VMs. We showed that this simple modification tothe hypervisor’s CPU scheduler was sufficient to prevent many knowncross-VM side-channel attacks.
In this chapter, we will summarize the contribution of these works(§ 9.1) and share some of the lessons learned in the process (§ 9.3) thatmight benefit any budding researcher and the community.
9.1 Summary
In this section, we will recall the important questions/problems that wemotivated in Chapter 4 and see how the pieces of the dissertation answerthem, consequently tying it back to the thesis of this dissertation.
(Q1) Are co-location attacks impractical in modern clouds?
We started by systematically analyzing the placement policy of three pop-ular public clouds (Amazon EC2, Microsoft Azure and Google ComputeEngine) for placement vulnerability [170]. We did this by observing place-ment behavior of the clouds’ VM placement policy by simulating VMlaunch scenarios of both the victims and an attacker. In order to observeplacement behavior we also required a mechanism to detect whether twoVMs (that belong to different users) are co-located on the same host, ascloud providers do not expose this information. We showed that all priorpublished techniques no longer worked, and hence investigated new waysto reliably detect co-location with any victim VM. Overall, this extensivestudy on three clouds lead to two important conclusions. First, there existsadversarial launch strategy for all three public clouds that resulted in
170
targeted co-location with the victim VMs. Although the launch strategyvaried based on the cloud provider and their specific placement algorithm,the resulting launch strategies were extremely cheap and sometimes in-curred as low as 14 cents in some clouds. Second, we found that manyprior techniques to cheaply detect co-location no longer worked. We founda new technique that uses a shared-memory bus performance side-channelto detect co-location with victim VMs. We do this by just using victimVM’s public interfaces (e.g. HTTP) even when they are part of a largemulti-tiered cloud application.
In summary, the answer to the question is no, achieving co-locationwith a set of target victim VMs is practical as we demonstrated it onthree public clouds. Our results demonstrate that even though cloudproviders have massive datacenters with numerous physical servers, thechances of co-location are far higher than expected. PaaS clouds are noexception to these attacks. Counter-intuitive to conventional wisdom, it isalso extremely cheap to do the attack in live clouds.
(Q2) Are there unique opportunities for malicious users to exploit the lack ofperformance isolation for monetary or performance gains?
After analyzing the cluster scheduler and its placement policy, we turned toanalyze the (lack of) performance isolation in Hypervisors that multiplexmulti-tenant VMs on the same machine. With a set of carefully designedmicrobenchmarks that stresses different per-host resources like processorcache, memory, network and disks, we showed that worst-case resourcecontention between two VMs for any two resources can degrade perfor-mance of one of the VMs by as high as 5×-6×. Understanding the extentof resource contention, taking the perspective of a malicious and greedyuser, we set out to find ways to reduce this contention. We demonstrateda new class of attacks called Resource-Freeing Attacks (RFAs) [168], wherethe goal is to free up contention on a target resource that the attacker caresabout. RFAs achieve this by interfering with the victim’s performance by
171
using their public interface to create a bottleneck on another resource thatvictim relies on and thereby freeing up the target resource. This was basedon a simple observation that real-world workloads depend on more thanone hardware resource for its performance. We demonstrated this attackon a realistic setting where a highly-loaded webserver (network-intensive)degrades the performance of a cache-sensitive workload by approximately5×. Using RFAs and our understanding on how CPU schedulers handlean interactive and batch type workloads in VMs, we were able to reducecontention and improve performance by 60% in this scenario. For moder-ately cache-sensitive SPEC workloads, RFAs relieved contention by 66.5%,which translated into 6% performance improvement in a live and busypublic cloud (Amazon EC2).
In summary, the answer to the question is yes, RFAs exploit lack ofisolation for performance gain, which may in turn be translated into mon-etary gains as well. This work leads to two important conclusions: 1. inthe presence of performance heterogeneity in public clouds because ofinterference (and hardware heterogeneity [61]), a simple and static pay-per-hour pricing model hugely incentivizes attacks like RFAs, 2. RFAsprovide insight into design principle for resource schedulers – a purelywork-conserving schedulers make RFAs hugely profitable. Hence a hybridscheduler, where majority of the resources are reserved to VMs and onlya fraction of the free resources are distributed between active VMs, getsthe best of both worlds – efficiency via sharing and improved isolation forsecurity.
(Q3) Can isolation be improved for security without compromising the fruits ofefficiency via sharing?
In the second part of the dissertation, we sought to solve the problem ofimproving isolation, particularly, to thwart Cross-VM side-channel attacksthat exploit lack of isolation for stealing secrets across the VM boundary.We observed that all the prior works either had high-overhead or required
172
specialized hardware and hence were hard to deploy in the wild. We alsoobserved that all the most effective Prime+Probe side-channels relied onHypervisor’s CPU scheduler allowing frequent cross-VM preemptions atan interval as low as 16µs. This lead us to investigated the relationshipbetween CPU scheduling policies and side-channel efficacy. We showedthat a simple scheduler primitive called minimum runtime guarantee of5ms ratelimited the dangerous cross-VM preemptions long enough suchthat it was sufficient to thwart all known cross-VM attacks [166]. Withextensive performance evaluation we also showed that counter-intuitive toconventional wisdom this change did not affect any latency sensitive work-loads. Complementary to this protection mechanism for batch victims, wealso proactively designed a protective mechanism to avoid informationleakage from interactive victim VMs using a low-overhead state-cleansingmechanism. Both of these mechanisms resulted in no overhead for theaverage-case and negligible overhead of 7% in the worst-case. This waspossibly partly because of a smarter multi-core scheduler that avoidedscheduling interactive and batch style VMs on the same core.
In summary, the answer is yes, with soft-isolation we were able to getbest of both sharing and isolation by carefully scheduling VM interactionswith the hypervisor’s CPU scheduler.
9.2 Conclusion
Cross-VM co-location attacks still remain a problem in modern cloudsamidst deployment of advanced virtualization techniques that improveisolation. This dissertation shows that public clouds need to be moreaggressive when it comes to isolation as arbitrary users have several toolsto achieve co-location and game schedulers because of lack of properisolation. It is also important to note that, it is not only the softwareinfrastructure that needs to be fixed to improve isolation, the design of
173
machine architecture is also an equally significant player in providingisolation across VMs. Apart from playing devil’s advocate against thestate of security in modern clouds, we also demonstrate that striving toimprove isolation without compromising on efficiency is also possible. Atthis point, it should come as no surprise that, “the practice of multi-tenancyin public clouds demands stronger isolation guarantees between multi-tenantVMs in the presence of malicious users.”
9.3 Lessons Learned
Until this point of the dissertation, we presented a research endeavor thatwas smooth, coherent with no failures similar to a bed of roses (with thornystems cut out). This is the section where we present the thorny stems thatwe encountered. As often famously quoted Thomas Alva Edison’s sayinggoes:
“I have not failed. I’ve just found 10,000 ways thatwon’t work.”
– Thomas A. Edison
; we also record our failures here. Although it would be hard for Edisonto publish a paper with that attitude as it would be received by a whole-hearted rejection from a modern conference program committee!
9.3.1 CPU Scheduling is Delicate
In the work on soft-isolation [166] we presented a simple modificationto the CPU scheduler for preventing some classes of side-channels. Infact, the final proposal was a simple change in scheduler configuration asthe Minimum RunTime (MRT) scheduler primitive was already presentin both KVM (Linux CFS [126]) and Xen hypervisors [59]. Although it
174
was introduced as a performance improvement of batch workloads, weshowed that it also had good security properties that prevented informa-tion leakage via per-core shared state. Recall, under this MRT mechanisma vCPU or a VM cannot be preempted until a minimum scheduled runtime(denoted by the MRT value) is elapsed. Arriving at this relatively simpleproposal was not a easy as it was preceded by numerous failures in try-ing to design a reasonably efficient CPU scheduler with the soft-isolationprinciple.
In this work, the main challenge is to find the right balance betweenpreventing malicious side-channel workloads and affecting the perfor-mance of legitimate interactive workloads. Here side-channel workloadsare highly preemptive (several orders higher, 10µsvs. 1ms) than legitimateworkloads.
We will describe the approach that eventually failed to performance asexpected, below. We designed a mechanism which involved adaptivelyratelimiting dangerous cross-VM preemptions at a fine-granularity and aVM migration scheduler to balance preemptions across different cores inthe same host. We defined a preemption interval threshold called LeakageVulnerability Window (LVW) below which a cross-VM preemption isvulnerable to information leakage. We also defined a threshold numberof cross-VM preemptions (migration threshold) above which a migrationis forced. The above two fine-grained and coarse-grained components ofthe preemption scheduler are guided by these two thresholds. These twomechanisms are described below:
• Balancing preemption across available cores. The idea here is instead oflimiting preemption, moving highly preemptive vCPUs (which arescheduling units in a hypervisor’s CPU scheduler) across multiplecores after the number of cross-VM preemptions exceed a threshold(migration threshold). Here we assume that each VM belongs toa different user and a preemption is potentially dangerous if it re-
175
sults in a context switch between two vCPUs of two disparate VMs(referred to as cross-VM preemption). This would limit the effectof any targeted side-channel attack on a victim VM. Consideringmoderns servers that at least have 8 to 16 cores with large sharedLLCs, intuitively this approach would only marginally affect anylegitimate latency sensitive workloads because of cache misses dueto vCPU migration. Surprisingly, macro benchmarks faired poorlyagainst the baseline with a nominal 1ms MRT. This is because ofthe fact that VCPU migrations are cheap only when done rarely andthe cost of migration quickly became expensive for a moderatelyinteractive legitimate workload.
• Adaptive preemption ratelimiting. The above failure suggested us toavoid frequent VM migration and we set out to design a fine-granularmechanism to provide soft-isolation by ratelimiting cross-VM pre-emptions. A straight-forward method would be use existing staticMRT mechanism, but we believed an adaptively ratelimiting mecha-nism would further reduce overhead of a static MRT mechanism onlegitimate interactive workloads. The goal of such a mechanism isto detect and penalize a highly preemptive VMs with higher MRTvalues and thereby scheduling cross-VM preemptions as a resource.There are several ways we can increase MRT value. One exampleis an exponential back-off style increasing of MRT by doubling thecurrent MRT value if the VM indulges in frequent preemptions (i.e.preemption interval < LVW).
We experimented with several variations of the above scheduler withvarying migration threshold and policies for learning the MRT value.Here, a higher migration threshold trades off isolation for performanceby reducing the rate of vCPU migration. Similarly different policies forlearning dynamically learning MRT value decide how quickly or accu-
176
rately the system arrives at an ideal MRT value for a VM. After extensiveexperiments with microbenchmarks and real-world benchmarks we weresurprised to learn that the payoff from using the two level preemptionscheduler did not fair well against both the security and performance ofthe simple static MRT mechanism.
We learned two crucial lessons in this experiment:
1. Designing schedulers or even adding minor modifications to themwithout any regression is an art that is hard to get correct the firsttime.
2. Absence of standard and extensive tests to identify any regressionmade this even more difficult.
Apart from these lessons, we made two main observations on why thisresearch endeavor failed.
Current CPU schedulers are extremely complex. It would not be inap-propriate to equate CPU scheduler design to dark magic. One of the mainlesson we learned from working with CPU schedulers is that intuitionoften fails in predicting the actual outcome in a scheduler. When sched-ulers work at very short time scales (tens of µs to tens of milliseconds),it is almost impossible to simulate the outcome with just one’s intuition.Only handful of people with extensive experience in designing schedulersare sufficiently equipped to do this daunting task. This task of modify-ing existing schedulers is further exacerbated by the complexity of thestate-of-the-art mature CPU schedulers. I took almost two months to geta sufficient understanding of the Linux Completely Fair Scheduler [126].There are numerous corner cases that specializes scheduling designs forcertain specific scenarios. To quantify the complexity of the schedulersubsystem, we translated the logic into plain English by sifting through the
177
source code of the scheduler1. It took 7 two column pages in plain Englishto summarize the core scheduler logic [167]. This is not considering theinteractions of the scheduler with other subsystems. Frustrated by thiscomplexity, we switched to working with Xen hypervisor’s CPU sched-uler, which was relatively very simple. Nevertheless, the above adaptivecross-VM preemption scheduler did not perform well when implementedin Xen relative to the existing static MRT mechanism.
Batch vs. interactive – a never ending tension. Systems community fordecades have been working on the problem of satisfying the complimen-tary needs of both batch and interactive workloads [54, 142, 153, 176].Batch workloads benefit from longer scheduler time slices and are highlycache-sensitive. On the other hand, interactive workloads benefit fromquicker wakeups and in general are not highly sensitive cache-hotnessrequiring shorter time slices.
Schedulers have tried to find the right balance between schedulingthese two classes of workloads. Sliding this delicate balance a little furtherin either side adversely affects the performance of the other. Further, thiscoarse classification of workloads is not accurate, making this balanceeven more difficult. In this dissertation, we found that the security as-pects of these schedulers make this balance trickier. The balancing batchvs. interactive workload still remains as a hard problem when considering ad-versarial workloads like side-channels. For example, Prime+Probe attackersabuse properties of interactive workloads to preempt batch like victimworkloads frequently.
Identifying and separating these workload classes on separate cores ina multi-core system might alleviate this problem. In fact, one of the sur-prising revelations from the soft-isolation project [166] is that the existingmulti-core scheduler in Xen did a good job in separating batch and interac-
1Currently there is no single document that completely explains the Linux CFSschedulers.
178
tive workloads on different cores 2. This hugely reduced the negative effectof longer MRT values on interactive workload’s wakeup latency. On theother hand, consequently this separation has a negative effect on utiliza-tion [42, 118]. Hence, balancing the batch and the interactive workloadsremain a never ending problem.
9.3.2 Security Starts at the Hardware
There were also several failed attempts that did not satisfy publication andhence did not make it into this dissertation. We had instances were lackof proper hardware support made it hard to design a secure and efficientsystem on top of it.
For managing processor caches in software. One of the most difficultresources to manage in the Operating System are memory bandwidthand processor caches. An ardent reader might have noticed that this isthe same resource that is also a major source of performance interferencein virtualized environments (§ 6.2). The main reason for this is becausethere are no hardware support to account and control usage of both theseresources. All prior work have worked around this problem either us-ing paging to limit memory usage and page coloring to control cacheusage [103, 148, 157] or hardware performance counters to account andCPU scheduling to control memory and cache usage [62, 63]. Both theseworkarounds only give coarse control over the resources and limits theextent to which software can effectively and efficiently manage them. Thisdemonstrates the requirement for two main recommendations for hard-ware vendors: 1. accounting per task cache usage that enable monitoringtask responsible for particular misses (self or other), 2. mechanisms tomonitor, control memory bandwidth per task (and/or per core). It turnsout that recently (at the time of writing this dissertation), Intel’s newer
2It is not clear if this side-effect of the scheduler is intentional as we did not find anydiscussion or comment stating any such goal in the scheduler source code
179
generation processors (since Broadwell, 2015) provides hardware supportand interfaces to manage and allocate last-level caches [94, 95]. Althoughthere are still some limitations, it is a good first step in the right direction.To the best of our knowledge, there is no known support for allocationand management of the memory bandwidth.
Need for testing of hardware for security. When investigating variousmechanisms to detect co-location, we stumbled up on a peculiar microar-chitecture design bug in x86 processors that enabled a malicious user todegrade whole system performance by running a single instruction (referto § 5.2.3). This was because of naïve implementation of an atomic in-struction, where in order to provide atomicity over an unaligned memoryaddress the hardware was designed to lock a globally shared memorybus. Note that an atomic operation over an unaligned address is uncon-ventional and almost never occurs in modern applications. Although thatmay not stop an adversary from abusing these features for a maliciousintent. Unfortunately, even after this discovery of this vulnerability it issurprisingly hard to detect these abuses efficiently in software.
The lesson we learn here is that security starts at the hardware and it ishard to expect designers at every layer to be security conscious. But, it isimportant to test the security aspects of these mechanisms (esp. hardwarevendors) as well as it is not unreasonable to suspect the presence of otherrelated side-channels that are waiting to be discovered and abused. Inaddition, it is high time we also incorporate security testing in every layerof the application stack.
180
Bibliography
[1] O. Aciiçmez, B. B. Brumley, and P. Grabher. New results on instruc-tion cache attacks. In Cryptographic Hardware and Embedded Systems,CHES 2010, 12th International Workshop, pages 110–124, August 2010.
[2] O. Aciiçmez, W. Schindler, and Ç. K. Koç. Cache based remotetiming attack on the AES. In Topics in Cryptology – CT-RSA 2007,The Cryptographers’ Track at the RSA Conference 2007, pages 271–286,February 2007.
[3] Onur Aciiçmez. Yet another microarchitectural attack:: Exploitingi-cache. In Proceedings of the 2007 ACM Workshop on Computer SecurityArchitecture, CSAW ’07, pages 11–18, New York, NY, USA, 2007. ACM.
[4] Onur Aciiçmez, Çetin Kaya Koç, and Jean-Pierre Seifert. On thepower of simple branch prediction analysis. In Proceedings of the2Nd ACM Symposium on Information, Computer and CommunicationsSecurity, ASIACCS ’07, pages 312–320, New York, NY, USA, 2007.ACM.
[5] Amazon cloudfront cdn, 2015. http://docs.aws.amazon.com/AmazonCloudFront/latest/DeveloperGuide/Introduction.html.
[6] Amazon cloudwatch, 2015. http://docs.aws.amazon.com/AmazonCloudWatch/latest/DeveloperGuide/WhatIsCloudWatch.html.
[7] Amazon dynamodb, 2015. https://aws.amazon.com/dynamodb/.
181
[8] Amazon elastic block store (amazon ebs), 2015. http://docs.aws.amazon.com/AWSEC2/latest/UserGuide/AmazonEBS.html.
[9] Amazon elastic compute cloud. http://aws.amazon.com/ec2/.
[10] Amazon elastic compute cloud api reference, 2015. http://docs.aws.amazon.com/AWSEC2/latest/APIReference.
[11] Amazon elastic compute cloud api reference – runinstances, 2015.http://docs.aws.amazon.com/AWSEC2/latest/APIReference/API_RunInstances.html.
[12] Amazon ec2 instance store. http://docs.aws.amazon.com/AWSEC2/latest/UserGuide/InstanceStorage.html.
[13] Amazon ec2 instances, 2015. https://aws.amazon.com/ec2/instance-types/.
[14] Amazon ec2 pricing, 2015. http://aws.amazon.com/ec2/pricing/.
[15] Amazon ec2 and amazon virtual private cloud: Differ-ences between ec2-classic and ec2-vpc. http://docs.aws.amazon.com/AWSEC2/latest/UserGuide/using-vpc.html#differences-ec2-classic-vpc.
[16] Amazon elastic load balancer, 2015. https://aws.amazon.com/documentation/elastic-load-balancing/.
[17] Amazon glacier, 2015. https://aws.amazon.com/glacier/.
[18] Amazon found every 100ms of latency cost them1% in sales, 2008. http://blog.gigaspaces.com/amazon-found-every-100ms-of-latency-cost-them-1-in-sales/.
[19] Amazon Ltd. Amazon elastic compute cloud (EC2). http://aws.amazon.com/ec2/.
[20] Amazon relational database service (amazon rds), 2015.http://docs.aws.amazon.com/AmazonRDS/latest/UserGuide/Welcome.html.
[21] Amazon simple storage service documentation, 2015. https://aws.amazon.com/documentation/s3/.
182
[22] Amazon Web Services. Extend your it infrastructure with amazonvirtual private cloud. Technical report, Amazon, 2013.
[23] Aws innovation at scale, re:invent 2014, slide 9-10. http://www.slideshare.net/AmazonWebServices/spot301-aws-innovation-at-scale-aws-reinvent-2014.
[24] Apache libcloud. http://libcloud.apache.org/.
[25] Aws case study: Airbnb, 2015. https://aws.amazon.com/solutions/case-studies/airbnb/.
[26] Aws case study: Coinbase, 2015. https://aws.amazon.com/solutions/case-studies/coinbase/.
[27] Aws case study: Dow jones, 2015. https://aws.amazon.com/solutions/case-studies/dow-jones/.
[28] Aws case study: Expedia, 2015. https://aws.amazon.com/solutions/case-studies/expedia/.
[29] Aws case study: Intuit, 2015. https://aws.amazon.com/solutions/case-studies/intuit-cloud-migration/.
[30] Aws case study: Pfizer, 2015. https://aws.amazon.com/solutions/case-studies/pfizer/.
[31] Aws documentation: Dedicated instances, 2015. http://docs.aws.amazon.com/AmazonVPC/latest/UserGuide/dedicated-instance.html.
[32] Aws elastic beanstalk. http://aws.amazon.com/elasticbeanstalk/.
[33] Aws case study: Us food and drug administration (fda),2015. https://aws.amazon.com/solutions/case-studies/us-food-and-drug-administration/.
[34] Aws case study: Healthcare.gov, 2015. https://aws.amazon.com/solutions/case-studies/healthcare-gov/.
183
[35] Aws case study: Nasa/jpl’s mars curiosity mission,2015. https://aws.amazon.com/solutions/case-studies/nasa-jpl-curiosity/.
[36] Yossi Azar, Seny Kamara, Ishai Menache, Mariana Raykova, andBruce Shepard. Co-location-resistant clouds. In In Proceedings of theACM Workshop on Cloud Computing Security, pages 9–20, 2014.
[37] Windows azure. http://www.windowsazure.com/.
[38] Virtual machine and cloud service sizes for azure. https://msdn.microsoft.com/en-us/library/azure/dn197896.aspx.
[39] Mohammad Banikazemi, Dan Poff, and Bulent Abali. Pam: a novelperformance/power aware meta-scheduler for multi-core systems.In High Performance Computing, Networking, Storage and Analysis, 2008.SC 2008. International Conference for, pages 1–12. IEEE, 2008.
[40] Paul Barham, Boris Dragovic, Keir Fraser, Steven Hand, Tim Harris,Alex Ho, Rolf Neugebauer, Ian Pratt, and Andrew Warfield. Xenand the art of virtualization. In SOSP, 2003.
[41] Sean K. Barker and Prashant Shenoy. Empirical evaluation of latency-sensitive application performance in the cloud. In MMSys, 2010.
[42] Luiz André Barroso, Jimmy Clidaras, and Urs Hölzle. The datacenteras a computer: An introduction to the design of warehouse-scalemachines. Synthesis lectures on computer architecture, 8(3):1–154, 2013.
[43] Adam Bates, Benjamin Mood, Joe Pletcher, Hannah Pruse, MasoudValafar, and Kevin Butler. Detecting co-residency with active trafficanalysis techniques. In Proceedings of the 2012 ACM Workshop onCloud Computing Security Workshop, pages 1–12. ACM, 2012.
[44] Brian Beach. Virtual private cloud. In Pro Powershell for Amazon WebServices, pages 67–88. Springer, 2014.
[45] Fabrice Bellard. Qemu, a fast and portable dynamic translator. InUSENIX Annual Technical Conference, FREENIX Track, pages 41–46,2005.

184
[46] Muli Ben-Yehuda, Michael D Day, Zvi Dubitzky, Michael Factor,Nadav Har’El, Abel Gordon, Anthony Liguori, Orit Wasserman, andBen-Ami Yassour. The turtles project: Design and implementationof nested virtualization. In OSDI, volume 10, pages 423–436, 2010.
[47] D. J. Bernstein. Cache-timing attacks on AES, 2005.
[48] M. Bhadauria and S. A. McKee. An approach to resource-awareco-scheduling for cmps. In ICS, 2010.
[49] Johannes Blömer, Jorge Guajardo, and Volker Krummel. Provablysecure masking of aes. In Selected Areas in Cryptography, pages 69–83.Springer, 2005.
[50] Ernie Brickell, Gary Graunke, Michael Neve, and Jean-Pierre Seifert.Software mitigations to hedge aes against cache-based software sidechannel vulnerabilities. IACR Cryptology ePrint Archive, 2006:52,2006.
[51] Neil Brown. Control groups series, 2014. https://lwn.net/Articles/604609/.
[52] D. Brumley and D. Boneh. Remote timing attacks are practical.Computer Networks, 48(5):701–716, 2005.
[53] Martin Casado, Michael J Freedman, Justin Pettit, Jianying Luo,Nick McKeown, and Scott Shenker. Ethane: Taking control of theenterprise. In ACM SIGCOMM Computer Communication Review,volume 37, pages 1–12. ACM, 2007.
[54] L. Cherkasova, D.Gupta, and A. Vahdat. Comparison of the threecpu schedulers in xen. SIGMETERICS Performance Evaluation Review,25(2), September 2007.
[55] NM Mosharaf Kabir Chowdhury and Raouf Boutaba. A survey ofnetwork virtualization. Computer Networks, 54(5):862–876, 2010.
[56] Scott A. Crosby and Dan S. Wallach. Denial of service via algorithmiccomplexity attacks. In Usenix Security, 2003.
185
[57] Christina Delimitrou and Christos Kozyrakis. Paragon: Qos-awarescheduling for heterogeneous datacenters. ACM SIGARCH ComputerArchitecture News, 41(1):77–88, 2013.
[58] What is docker? https://www.docker.com/what-docker.
[59] George Dunlap. Xen 4.2: New scheduler parameters.http://blog.xen.org/index.php/2012/04/10/xen-4-2-new-scheduler-parameters-2/.
[60] Jake Edge. Denial of service via hash collisions. http://lwn.net/Articles/474912/, January 2012.
[61] Benjamin Farley, Ari Juels, Venkatanathan Varadarajan, ThomasRistenpart, Kevin D. Bowers, and Michael M. Swift. More for yourmoney: Exploiting performance heterogeneity in public clouds. InProceedings of the Third ACM Symposium on Cloud Computing. ACM,2012.
[62] Alexandra Fedorova, Margo Seltzer, and Michael D Smith. Cache-fair thread scheduling for multicore processors. Division of Engi-neering and Applied Sciences, Harvard University, Tech. Rep. TR-17-06,2006.
[63] Alexandra Fedorova, Margo Seltzer, and Michael D. Smith. Improv-ing performance isolation on chip multiprocessors via an operatingsystem scheduler. In PACT, 2007.
[64] Michael Ferdman, Almutaz Adileh, Onur Kocberber, StavrosVolos, Mohammad Alisafaee, Djordje Jevdjic, Cansu Kaynak,Adrian Daniel Popescu, Anastasia Ailamaki, and Babak Falsafi.Clearing the clouds: a study of emerging scale-out workloads onmodern hardware. In Proceedings of the seventeenth international confer-ence on Architectural Support for Programming Languages and OperatingSystems. ACM, 2012.
[65] Brad Fitzpatrick. Distributed caching with memcached. Linuxjournal, 2004(124):5, 2004.
[66] K. Gandolfi, C. Mourtel, and F. Olivier. Electromagnetic analysis:Concrete results. In Cryptographic Hardware and Embedded Systems –CHES 2001, volume 2162 of LNCS, pages 251–261, May 2001.
186
[67] Google app engine: Platform as a service. https://cloud.google.com/appengine/docs.
[68] Best buy slashes app development time and resources withgoogle app engine, 2015. https://cloud.google.com/customers/best-buy/.
[69] The jre class white list, 2015. https://cloud.google.com/appengine/docs/java/jrewhitelist.
[70] Google cloud bigtable, 2015. https://cloud.google.com/bigtable/.
[71] Google compute engine docs: Transparent maintenance, 2015.https://cloud.google.com/compute/docs/zones#maintenance.
[72] Google cloud storage documentation, 2015. https://cloud.google.com/storage/docs/overview.
[73] Google compute engine. https://cloud.google.com/compute/.
[74] Google compute enginer autoscaler. http://cloud.google.com/compute/docs/autoscaler/.
[75] Google compute engine – disks. https://cloud.google.com/compute/docs/disks/.
[76] Graph 500 benchmark 1. http://www.graph500.org/.
[77] Ajay Gulati, Arif Merchant, and Peter J. Varma. mclock: Handlingthroughput variability for hypervisor io scheduling. In OSDI, 2010.
[78] D. Gullasch, E. Bangerter, and S. Krenn. Cache games – bringingaccess-based cache attacks on AES to practice. In Security and Privacy,2011 IEEE Symposium on, 2011.
[79] Diwaker Gupta, Ludmila Cherkasova, Rob Gardner, and Amin Vah-dat. Enforcing performance isolation across virtual machines in xen.In Middleware, 2006.
187
[80] Yi Han, Tansu Alpcan, Jeffrey Chan, and Christopher Leckie. Secu-rity games for virtual machine allocation in cloud computing. InDecision and Game Theory for Security. Springer International Publish-ing, 2013.
[81] Yi Han, J. Chan, T. Alpcan, and C. Leckie. Virtual machine allocationpolicies against co-resident attacks in cloud computing. In IEEEInternational Conference on Communications,, 2014.
[82] Haproxy: The reliable, high performance tcp/http load balancer.http://www.haproxy.org/.
[83] M. Weißand B. Heinz and F. Stumpf. A cache timing attack on AESin virtualization environments. In 16th International Conference onFinancial Cryptography and Data Security, February 2012.
[84] J. L. Henning. Spec cpu2006 benchmark descriptions. In SIGARCHComputer Architecture News, 2006.
[85] John L. Henning. Spec cpu2006 benchmark descriptions. SIGARCHComput. Archit. News, 2006.
[86] Heroku PaaS system. https://www.heroku.com/.
[87] Heroku devcenter: Dynos and the dyno manager, ip addresses.https://devcenter.heroku.com/articles/dynos#ip-addresses.
[88] Amir Herzberg, Haya Shulman, Johanna Ullrich, and Edgar Weippl.Cloudoscopy: Services discovery and topology mapping. In 2013ACM Workshop on Cloud Computing Security Workshop, pages 113–122,2013.
[89] Hpe helion. http://www8.hp.com/us/en/cloud/helion-overview.html.
[90] HTTPing. Httping client. http://www.vanheusden.com/httping/.
[91] Wei-Ming Hu. Lattice scheduling and covert channels. In Researchin Security and Privacy, 1992. Proceedings., 1992 IEEE Computer SocietySymposium on, pages 52–61. IEEE, 1992.
188
[92] Hyperv architecture, 2015. https://msdn.microsoft.com/en-US/library/cc768520(v=bts.10).aspx.
[93] Mehmet Sinan Inci, Berk Gulmezoglu, Gorka Irazoqui, ThomasEisenbarth, and Berk Sunar. Seriously, get off my cloud! cross-vm rsa key recovery in a public cloud. Cryptology ePrint Archive,Report 2015/898, 2015. http://eprint.iacr.org/.
[94] Cache monitoring technology and cache allocation technology.http://www.intel.com/content/www/us/en/communications/cache-monitoring-cache-allocation-technologies.html.
[95] Intel Corporation. White paper: Improving real-time performanceby utilizing cache allocation technology. Technical report, Intel,2015.
[96] Intel Ivy Bridge cache replacement policy. http://blog.stuffedcow.net/2013/01/ivb-cache-replacement/.
[97] Gorka Irazoqui, Mehmet Sinan Inci, Thomas Eisenbarth, and BerkSunar. Wait a minute! A fast, Cross-VM attack on AES. CryptologyePrint Archive, Report 2014/435, 2014. http://eprint.iacr.org/.
[98] Aamer Jaleel, Hashem H Najaf-Abadi, Samantika Subramaniam,Simon C Steely, and Joel Emer. Cruise: cache replacement andutility-aware scheduling. In ACM SIGARCH Computer ArchitectureNews, volume 40, pages 249–260. ACM, 2012.
[99] David Kanter. L3 cache and ring interconnect. http://www.realworldtech.com/sandy-bridge/8/.
[100] Paul A Karger and John C Wray. Storage channels in disk armoptimization. In 2012 IEEE Symposium on Security and Privacy, pages52–52. IEEE Computer Society, 1991.
[101] Eric Keller, Jakub Szefer, Jennifer Rexford, and Ruby B. Lee. No-hype: virtualized cloud infrastructure without the virtualization.In Proceedings of the 37th annual international symposium on Computerarchitecture, ISCA ’10, pages 350–361, New York, NY, USA, 2010.ACM.
189
[102] R. E. Kessler and Mark D. Hill. Page placement algorithms for largereal-indexed caches. ACM TOCS, 10(4):338–359, November 1992.
[103] Taesoo Kim, Marcus Peinado, and Gloria Mainar-Ruiz. Stealthmem:System-level protection against cache-based side channel attacks inthe cloud. In Proceedings of the 21st USENIX Conference on SecuritySymposium, Security’12. USENIX Association, 2012.
[104] Keith Kirkpatrick. Software-defined networking. Commun. ACM,56(9):16–19, September 2013.
[105] Avi Kivity, Yaniv Kamay, Dor Laor, Uri Lublin, and Anthony Liguori.Kvm: the linux virtual machine monitor. In Proceedings of the LinuxSymposium, volume 1, pages 225–230, 2007.
[106] P. Kocher, J. Jaffe, and B. Jun. Differential power analysis. In Advancesin Cryptology – CRYPTO ’99, volume 1666 of LNCS, pages 388–397,August 1999.
[107] P. C. Kocher. Timing attacks on implementations of Diffie-Hellman,RSA, DSS, and other systems. In N. Koblitz, editor, Advances in Cryp-tology – Crypto’96, volume 1109 of LNCS, pages 104–113. Springer-Verlag, 1996.
[108] T Kohno, A Broido, and K Claffy. Remote physical device finger-printing. In Security and Privacy, 2005 IEEE Symposium on, pages211–225. IEEE, 2005.
[109] Jingfei Kong, Onur Aciiçmez, Jean-Pierre Seifert, and Huiyang Zhou.Hardware-software integrated approaches to defend against soft-ware cache-based side channel attacks. In HPCA, pages 393–404.IEEE Computer Society, 2009.
[110] What is kubernetes? http://kubernetes.io/v1.0/docs/whatisk8s.html.
[111] Avinash Lakshman and Prashant Malik. Cassandra: a decentralizedstructured storage system. ACM SIGOPS Operating Systems Review,44(2):35–40, 2010.
[112] Butler W. Lampson. A note on the confinement problem. Commun.ACM, 16(10):613–615, October 1973.
190
[113] A. Li, X. Yang, S. Kandula, and M. Zhang. Cloudcmp: Comparingpublic cloud providers. In IMC, 2010.
[114] J. Li, M. Qiu, J. Niu, W. Gao, Z. Zong, and X. Qin. Feedback dynamicalgorithms for preemptable job scheduling in cloud systems. In WI-IAT, 2010.
[115] Peng Li, Debin Gao, and Michael K. Reiter. Mitigating access-driventiming channels in clouds using stopwatch. 2013 43rd Annual IEEE/I-FIP International Conference on Dependable Systems and Networks (DSN),0:1–12, 2013.
[116] Linux man page. xentrace(8). http://linux.die.net/man/8/xentrace.
[117] What is lxc?, 2015. https://linuxcontainers.org/lxc/introduction/.
[118] Jason Mars, Lingjia Tang, Robert Hundt, Kevin Skadron, andMary Lou Soffa. Bubble-up: increasing utilization in modern ware-house scale computers via sensible co-locations. In Proceedings of the44th Annual IEEE/ACM International Symposium on Microarchitecture,MICRO-44 ’11. ACM, 2011.
[119] David Marshall. Understanding full virtualization, paravirtualiza-tion, and hardware assist, 2007.
[120] Robert Martin, John Demme, and Simha Sethumadhavan. Time-warp: Rethinking timekeeping and performance monitoring mech-anisms to mitigate side-channel attacks. In Proceedings of the 39thAnnual International Symposium on Computer Architecture, ISCA ’12.IEEE Computer Society, 2012.
[121] Nick McKeown, Tom Anderson, Hari Balakrishnan, Guru Parulkar,Larry Peterson, Jennifer Rexford, Scott Shenker, and Jonathan Turner.Openflow: enabling innovation in campus networks. ACM SIG-COMM Computer Communication Review, 38(2):69–74, 2008.
[122] Andreas Merkel, Jan Stoess, and Frank Bellosa. Resource-consciousscheduling for energy efficiency on multicore processors. In EuroSys,2010.
191
[123] Dirk Merkel. Docker: lightweight linux containers for consistentdevelopment and deployment. Linux Journal, 2014(239):2, 2014.
[124] Ge healthcare delivers core customer solutions on the mi-crosoft cloud, 2015. https://customers.microsoft.com/Pages/CustomerStory.aspx?recid=12166.
[125] Chirag Modi, Dhiren Patel, Bhavesh Borisaniya, Avi Patel, and Mut-tukrishnan Rajarajan. A survey on security issues and solutions atdifferent layers of cloud computing. The Journal of Supercomputing,63(2):561–592, 2013.
[126] Ingo Molnar. Linux Kernel Documentation: CFS Scheduler De-sign. http://www.kernel.org/doc/Documentation/scheduler/sched-design-CFS.txt.
[127] Soo-Jin Moon, Vyas Sekar, and Michael K Reiter. Nomad: Mitigatingarbitrary cloud side channels via provider-assisted migration. InProceedings of the 22nd ACM SIGSAC Conference on Computer andCommunications Security, pages 1595–1606. ACM, 2015.
[128] David Mosberger and Tai Jin. httperf⣔a tool for measuring webserver performance. ACM SIGMETRICS Performance Evaluation Re-view, 26(3):31–37, 1998.
[129] Thomas Moscibroda and Onur Mutlu. Memory performance at-tacks: Denial of memory service in multi-core systems. In UsenixSecurity Symposium, 2007.
[130] Al Muller and Seburn Wilson. Virtualization with vmware esxserver. 2005.
[131] Ripal Nathuji, Aman Kansal, and Alireza Ghaffarkhah. Q-clouds:Managing performance interference effects for QoS-aware clouds.In Proceedings of the 5th European Conference on Computer Systems,EuroSys ’10, pages 237–250, 2010.
[132] Michael Nelson, Beng-Hong Lim, Greg Hutchins, et al. Fast trans-parent migration for virtual machines. In USENIX Annual TechnicalConference, General Track, pages 391–394, 2005.
192
[133] K. J. Nesbit, J. Laudon, and J. E. Smith. Virtual private caches. InISCA, 2007.
[134] Netcraft Ltd. August 2011 web server survey.http://news.netcraft.com/archives/2011/08/05/august-2011-web-server-survey-3.html, August 2011.
[135] Four reasons we choose amazon⣙s cloud as our comput-ing platform, 2010. http://techblog.netflix.com/2010/12/four-reasons-we-choose-amazons-cloud-as.html.
[136] Olio workload. https://cwiki.apache.org/confluence/display/OLIO/The+Workload.
[137] Openshift red hat’s platform as a service. https://www.openshift.com/.
[138] The openstack project, 2015. https://wiki.openstack.org/wiki/Main_Page.
[139] Openstack scheduling in kilo release, 2015. http://docs.openstack.org/kilo/config-reference/content/section_compute-scheduler.html.
[140] Openvz virtuozzo containers, 2015. http://openvz.org/Main_Page.
[141] Dag Arne Osvik, Adi Shamir, and Eran Tromer. Cache attacks andcountermeasures: The case of AES. In Proceedings of the 2006 TheCryptographers’ Track at the RSA Conference on Topics in Cryptology,pages 1–20, Berlin, Heidelberg, 2006. Springer-Verlag.
[142] Chandandeep Singh Pabla. Completely fair scheduler. Linux Journal,2009(184):4, 2009.
[143] Colin Percival. Cache missing for fun and profit. In Proc. of BSDCan2005, 2005.
[144] X. Pu, L. Liu, Y. Mei, S. Sivathanu, Y. Koh, and C. Pu. Understand-ing performance interference of i/o workload in virtualized cloudenvironments. In CLOUD, 2010.
193
[145] J.-J. Quisquater and D. Samyde. Electromagnetic analysis (EMA):Measures and counter-measures for smart cards. In Smart CardProgramming and Security, International Conference on Research in SmartCards, E-smart 2001, volume 2140 of LNCS, pages 200–210, September2001.
[146] Rackspace. http://www.rackspacecloud.com/.
[147] Nauman Rafique, Won-Taek Lim, and Mithuna Thottethodi. Effec-tive management of DRAM bandwidth in multicore processors. InPACT, 2007.
[148] H. Raj, R. Nathuji, A. Singh, and P. England. Resource managementfor isolation enhanced cloud services. In CCSW, 2009.
[149] Himanshu Raj, Ripal Nathuji, Abhishek Singh, and Paul England.Resource management for isolation enhanced cloud services. InProceedings of the 2009 ACM workshop on Cloud computing security,pages 77–84. ACM, 2009.
[150] Rightscale. http://www.rightscale.com.
[151] T. Ristenpart, E. Tromer, H. Shacham, and S. Savage. Hey, you, getoff my cloud: exploring information leakage in third party computeclouds. In CCS, 2009.
[152] Thomas Ristenpart, Eran Tromer, Hovav Shacham, and Stefan Sav-age. Hey, you, get off of my cloud: Exploring information leakage inthird-party compute clouds. In Proceedings of the 16th ACM conferenceon Computer and communications security, pages 199–212. ACM, 2009.
[153] Dennis M Ritchie and Ken Thompson. The unix time-sharing system.Communications of the ACM, 17(7):365–375, 1974.
[154] Eric C Rosen and Yakov Rekhter. Bgp/mpls ip virtual private net-works (vpns). 2006.
[155] J. Schad, J. Dittrich, and J. Quiane-Ruiz. Runtime measurements inthe cloud: Observing, analyzing, and reducing variance. In PVLDB,2010.
194
[156] B. Sharma, R. Prabhakar, S. Lim, M. T. Kandemir, and C. R. Das.Mrorchestrator: A fine-grained resource orchestration frameworkfor hadoop mapreduce. Technical Report CSE-12-001, PennsylvaniaState University, January 2012.
[157] Jicheng Shi, Xiang Song, Haibo Chen, and Binyu Zang. Limitingcache-based side-channel in multi-tenant cloud using dynamic pagecoloring. In Dependable Systems and Networks Workshops (DSN-W),2011 IEEE/IFIP 41st International Conference on, pages 194–199. IEEE,2011.
[158] Alan Shieh, Srikanth Kandula, Albert Greenberg, and ChanghoonKim. Seawall: Performance isolation for cloud datacenter networks.In HotCloud, 2010.
[159] Allan Snavely, Dean M. Tullsen, and Geoff Voelker. Symbiotic jobscheduling with priorities for a simultaneous multithreading pro-cessor. In SIGMETRICS, 2002.
[160] SPEC. SPECjbb2005 - Industry-standard server-side Java benchmark(J2SE 5.0). Standard Performance Evaluation Corporation, June 2005.
[161] Specjbb2005. http://www.spec.org/jbb2005/.
[162] S. Srikantaiah, A. Kansal, and F. Zhao. Energy aware consolida-tion for cloud computing. In Proc. HotPowerWorkshop Power AwareComput. Syst, 2008.
[163] Jeremy Sugerman, Ganesh Venkitachalam, and Beng-Hong Lim.Virtualizing i/o devices on vmware workstation’s hosted virtualmachine monitor. In USENIX Annual Technical Conference, GeneralTrack, pages 1–14, 2001.
[164] Lingjia Tang, Jason Mars, and Mary Lou Soffa. Contentiousness vs.sensitivity: improving contention aware runtime systems on multi-core architectures. In Proceedings of the 1st International Workshop onAdaptive Self-Tuning Computing Systems for the Exaflop Era, EXADAPT’11, pages 12–21, New York, NY, USA, 2011. ACM.
[165] D. Tsafrir, Y. Etsion, and D. G. Feitelson. Secretly monopolizingthe CPU without superuser privileges. In 16th USENIX SecuritySymposium, pages 1–18, 2007.
195
[166] V Varadarajan, T Ristenpart, and M Swift. Scheduler-based defensesagainst cross-vm side-channels. In 23rd USENIX Security Symposium.USENIX Association, 2014.
[167] Venkatanathan Varadarajan. Understanding linux’s completely fairscheduler. http://pages.cs.wisc.edu/~venkatv/.
[168] Venkatanathan Varadarajan, Thawan Kooburat, Benjamin Farley,Thomas Ristenpart, and Michael M. Swift. Resource-freeing attacks:Improve your cloud performance (at your neighbor’s expense). InProceedings of the 2012 ACM conference on Computer and communica-tions security, pages 281–292. ACM, 2012.
[169] Venkatanathan Varadarajan, Yinqian Zhang, Thomas Ristenpart,and Michael Swift. A placement vulnerability study in multi-tenantpublic clouds. In 24th USENIX Security Symposium (USENIX Secu-rity 15), pages 913–928, Washington, D.C., August 2015. USENIXAssociation.
[170] Venkatanathan Varadarajan, Yinqian Zhang, Thomas Ristenpart,and Michael M. Swift. A placement vulnerability study in multi-tenant public clouds. CoRR, abs/1507.03114, 2015.
[171] G. Varghese, J. Bassett, R.E. Thomas, P. Higginson, G. Cobb, B.A.Spinney, and R. Simcoe. Virtual lans, May 6 2003. US Patent6,560,236.
[172] Bhanu C. Vattikonda, Sambit Das, and Hovav Shacham. Eliminatingfine grained timers in Xen (short paper). In Thomas Ristenpart andChristian Cachin, editors, Proceedings of CCSW 2011. ACM Press,October 2011.
[173] Anthony Velte and Toby Velte. Microsoft virtualization with Hyper-V.McGraw-Hill, Inc., 2009.
[174] Ben Verghese, Anoop Gupta, and Mendel Rosenblum. Performanceisolation: sharing and isolation in shared-memory multiprocessors.In ASPLOS, pages 181–192, 1998.
[175] C. A. Waldspurger. Memory resource management in vmware esxserver. In OSDI, 2002.
196
[176] Carl A Waldspurger and William E Weihl. Lottery scheduling: Flex-ible proportional-share resource management. In Proceedings of the1st USENIX conference on Operating Systems Design and Implementation,page 1. USENIX Association, 1994.
[177] Guohui Wang and T. S. Eugene Ng. The impact of virtualization onnetwork performance of amazon EC2 data center. In IEEE INFO-COM, 2010.
[178] Liang Wang, Antonio Nappa, Juan Caballero, Thomas Ristenpart,and Aditya Akella. Whowas: A platform for measuring web deploy-ments on IaaS clouds. In Proceedings of the 2014 Conference on InternetMeasurement Conference, pages 101–114. ACM, 2014.
[179] Zhenghong Wang and Ruby B. Lee. New cache designs for thwartingsoftware cache-based side channel attacks. In Proceedings of the 34thannual international symposium on Computer architecture, ISCA ’07,pages 494–505, New York, NY, USA, 2007. ACM.
[180] Zhenghong Wang and Ruby B. Lee. A novel cache architecture withenhanced performance and security. In Proceedings of the 41st annualIEEE/ACM International Symposium on Microarchitecture, MICRO 41,pages 83–93, Washington, DC, USA, 2008. IEEE Computer Society.
[181] Jon Watson. Virtualbox: bits and bytes masquerading as machines.Linux Journal, 2008(166):1, 2008.
[182] Zhenyu Wu, Zhang Xu, and Haining Wang. Whispers in the hyper-space: High-speed covert channel attacks in the cloud. In USENIXSecurity symposium, pages 159–173, 2012.
[183] Qiuyu Xiao, Michael K Reiter, and Yinqian Zhang. Mitigating stor-age side channels using statistical privacy mechanisms. In Proceed-ings of the 22nd ACM SIGSAC Conference on Computer and Communi-cations Security, pages 1582–1594. ACM, 2015.
[184] Yunjing Xu, Michael Bailey, Farnam Jahanian, Kaustubh Joshi, MattiHiltunen, and Richard Schlichting. An exploration of L2 cachecovert channels in virtualized environments. In Proceedings of the3rd ACM workshop on Cloud computing security workshop, pages 29–40.ACM, 2011.
197
[185] Zhang Xu, Haining Wang, and Zhenyu Wu. A measurement studyon co-residence threat inside the cloud. In USENIX Security Sympo-sium, 2015.
[186] Hailong Yang, Alex Breslow, Jason Mars, and Lingjia Tang. Bubble-flux: Precise online qos management for increased utilization inwarehouse scale computers. In ACM SIGARCH Computer ArchitectureNews, volume 41, pages 607–618. ACM, 2013.
[187] Yuval Yarom and Katrina Falkner. Flush+Reload: a High Resolu-tion, Low Noise, L3 Cache Side-Channel Attack. Cryptology ePrintArchive, Report 2013/448, 2013. http://eprint.iacr.org/.
[188] Yuval Yarom and Katrina Falkner. Flush+reload: A high resolution,low noise, L3 cache side-channel attack. In 23rd USENIX SecuritySymposium, pages 719–732. USENIX Association, 2014.
[189] Xiao Zhang, Eric Tune, Robert Hagmann, Rohit Jnagal, VrigoGokhale, and John Wilkes. Cpi2: Cpu performance isolation forshared compute clusters. In SIGOPS European Conference on Com-puter Systems (EuroSys), pages 379–391, Prague, Czech Republic,2013.
[190] Y. Zhang, A. Juels, A. Oprea, and M. K. Reiter. Homealone: Co-residency detection in the cloud via side-channel analysis. In Pro-ceedings of the 2011 IEEE Symposium on Security and Privacy, SP ’11,pages 313–328, Washington, DC, USA, 2011. IEEE Computer Society.
[191] Yinqian Zhang, Ari Juels, Michael K. Reiter, and Thomas Ristenpart.Cross-VM side channels and their use to extract private keys. In Pro-ceedings of the 2012 ACM conference on Computer and communicationssecurity, pages 305–316. ACM, 2012.
[192] Yinqian Zhang, Ari Juels, Michael K Reiter, and Thomas Ristenpart.Cross-tenant side-channel attacks in PaaS clouds. In Proceedings ofthe 2014 ACM SIGSAC Conference on Computer and CommunicationsSecurity, pages 990–1003. ACM, 2014.
198
[193] Yinqian Zhang and Michael K. Reiter. Düppel: Retrofitting com-modity operating systems to mitigate cache side channels in thecloud. In Proceedings of the 2013 ACM SIGSAC Conference on Com-puter; Communications Security, CCS ’13. ACM, 2013.
[194] F. Zhou, M. Goel, P. Desnoyers, and R. Sundaram. Scheduler vulner-abilities and attacks in cloud computing. arXiv:1103.0759v1 [cs.DC],March 2011.
[195] Fangfei Zhou, Manish Goel, Peter Desnoyers, and Ravi Sundaram.Scheduler vulnerabilities and attacks in cloud computing. CoRR,abs/1103.0759, 2011.
[196] Sergey Zhuravlev, Sergey Blagodurov, and Alexandra Fedorova.Addressing shared resource contention in multicore processors viascheduling. In ASPLOS, 2010.
199
AAppendix A
A.1 Modeling the Effects of MRTs
In this section we investigate a model that, while abstract, enables moreformal reasoning about the security offered by the MRT guarantee forsome classes of victims.
The model. Recall that in a preemption-driven side-channel attack, theattacker must interleave execution on a CPU core with the victim in orderto frequently measure some shared resource such as CPU caches, branchpredictors, or the like. Consider the example pseudo-code proceduresin Figure A.1. The first includes a side-channel vulnerability because anattacker can infer the value of the secret using based on inferring whichportions of a CPU data cache are accessed by a victim.
For either of the procedures, we can represent the side-channel leakageas a sequence of actions by the victim and which the attacker seeks tolearn. Fix a finite alphabet of symbols Σ = {A,B,C, . . .}, each representinga microarchitectual operation on state that is time-shared between theattacker and victim. For example in Procedure1 the possible actions areaccesses to the table elements, e.g., A accessing the first element of F, B thesecond element, and so on. In Procedure2, action A represents bringingthe memory footprint of function Fa into the I-cache and B representsfunction Fb. An execution of the victim leads to a sequence of actionsS1,S2, . . . ,Sn for some number n and with Si ∈ Σ. The attacker’s goal is to
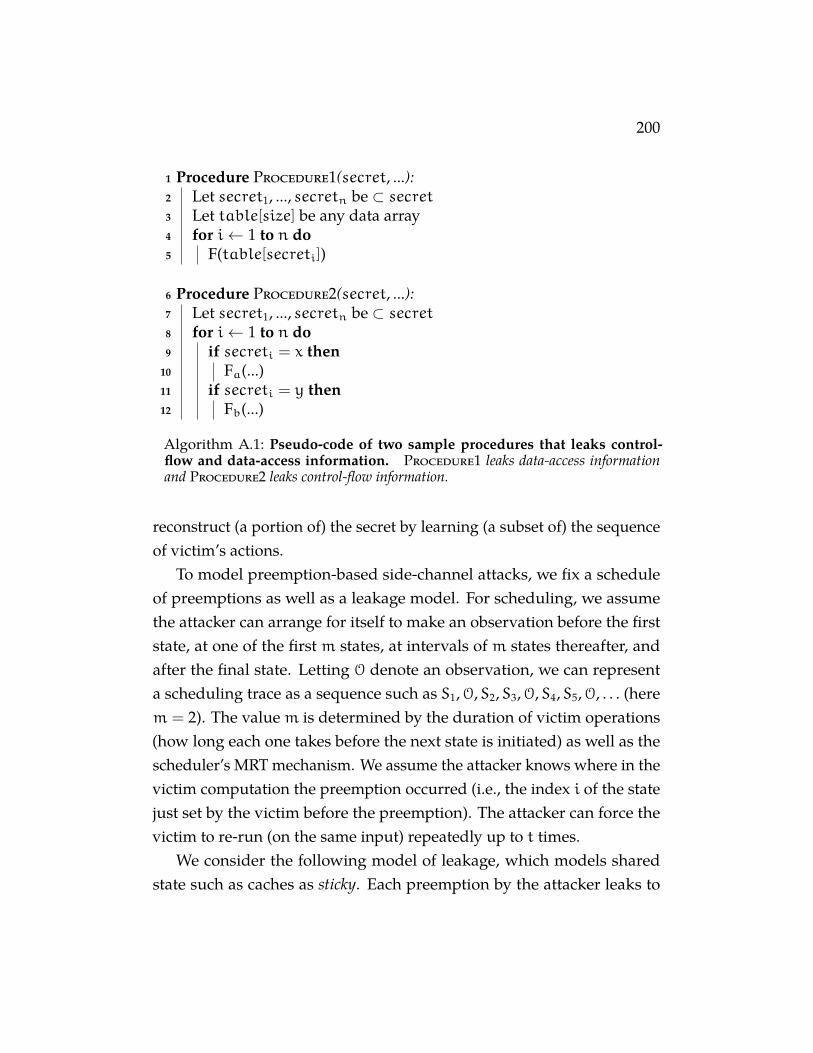
200
1 Procedure Procedure1(secret, ...):2 Let secret1, ..., secretn be ⊂ secret3 Let table[size] be any data array4 for i← 1 to n do5 F(table[secreti])
6 Procedure Procedure2(secret, ...):7 Let secret1, ..., secretn be ⊂ secret8 for i← 1 to n do9 if secreti = x then
10 Fa(...)11 if secreti = y then12 Fb(...)
Algorithm A.1: Pseudo-code of two sample procedures that leaks control-flow and data-access information. Procedure1 leaks data-access informationand Procedure2 leaks control-flow information.
reconstruct (a portion of) the secret by learning (a subset of) the sequenceof victim’s actions.
To model preemption-based side-channel attacks, we fix a scheduleof preemptions as well as a leakage model. For scheduling, we assumethe attacker can arrange for itself to make an observation before the firststate, at one of the first m states, at intervals of m states thereafter, andafter the final state. Letting O denote an observation, we can representa scheduling trace as a sequence such as S1,O,S2,S3,O,S4,S5,O, . . . (herem = 2). The valuem is determined by the duration of victim operations(how long each one takes before the next state is initiated) as well as thescheduler’s MRT mechanism. We assume the attacker knows where in thevictim computation the preemption occurred (i.e., the index i of the statejust set by the victim before the preemption). The attacker can force thevictim to re-run (on the same input) repeatedly up to t times.
We consider the following model of leakage, which models sharedstate such as caches as sticky. Each preemption by the attacker leaks to
201
it all types of operations executed (states visited) by the victim since thelast observation, but not the order of the states visited or their numberof times each state is visited. So if states A,C,A,B are visited betweentwo observations the attacker learns {A,B,C}. This models many side-channels due to shared state, such as caches, in which an operation affectsthe shared state in a fixed way independent of the order of operations.Note that this is generous to the attacker, in that known attacks do notreveal a noise-free set of all states visited: operations or data may haveoverlapping effects obfuscating which of the kinds of operations occurred.
Now consider the victim of the ZJRR attack, shown in Figure 7.5 fromSection 7.2. The attacker wants to extract code paths, distinguishing be-tween 5 → 6 → 7 → 8 → 9 and 5 → 6. The former reflects a one bit inthe secret key, and involves square and reduce and multiply plus reduceoperations. For simplicity, we treat the two code paths as the types ofoperations/states, so an execution is simply a sequence of values b1, . . . ,bnover a binary alphabet.1 In ElGamal the secret key, and so this sequenceof states, is uniformly random.
Note that because we (conservatively) assume the attacker can schedulepreemptions subject only to the rate limit, and that the attacker can makean observation before the first and after the last operation, which impliesthe attacker can trivially learn the first and last m bits of the key. Thequestion is what can be learned about the remaining bits of the key, andhere we can take advantage of the sticky model. In particular, considerfor illustrative purposes a sequence of key bits b1,b2,b3,b4,b5. Supposethatm = 2, then the adversary can learn all of the bits via a sequence bylearning b1 via an observationO,b1,O,b2 · · · ,b7. From there the adversarycan perform a sliding window of size m = 2, learning each subsequent
1This is not quite without loss, since in fact the two code paths require differingamounts of time, reflecting the timing side channel. Our focus is on access-driven sidechannels, so we ignore this subtlety. Future refinements to the model to include differenttiming of operations could address it.
202
bit by knowledge of the previous bit and the side-channel which giveswhether both 0, 1 are observed in a window, just 0, or just 1.
However, as soon as m = 3 the adversary cannot always learn theentire bit string. Consider observation schedule O,b1,b2,b3,O,b4. Asbefore, the adversary can use previous observations to learn b1 and b2,but this observation will only leak b3 in the case that b1 = b2. Otherwise,the second observation returns {0, 1} and the bit could be either value.Likewise for observation schedule b1,b2,O,b3,b4,b5,O the value of b3 isonly learned if b4 = b5. Since bits are uniform, the probability that b3 isnot learnable is 1/4.
We can provide an upper bound for arbitrary 2 < m 6 n, as follows.The attacker can always learn bits b1,b2 and bn−1,bn by way of the reason-ing above. For simplicity we allow the attacker to in fact learn the firstmbits and the lastm bits. If nom-bit substring is all zeros or all ones, thenthe attacker can learn no further bits with certainty. By a (loose) unionbound, the probability that there exists anym-bit substring that is equalto all zeros or all ones is at most 2(n −m)/2m. If we set m = 68, whichcorresponds to the minimal value seen in experiments for n = 2048-bitexponents when run in the attack setting with the 1msMRT (see Table 7.6),then this probability is at most 2−56.
This argument is admittedly informal, but it provides intuition regard-ing how one might show how the MRT guarantee can prevent attacks(under some well-stated assumptions on the side-channel).