Groundwater flow modelling of periods with temperate climate ...

ARTICLE IN PRESS
0277-3791/$ - se
doi:10.1016/j.qu
�Correspond
E-mail addr
Quaternary Science Reviews 24 (2005) 1361–1374
Is vegetation responsible for glacial inception during periods of mutedinsolation changes?
S. Desprata,�, M.F. Sanchez Gonia, J.-L. Turonb, J.F. McManusc, M.F. Loutred,J. Dupratb, B. Malaizeb, O. Peyrone, J.-P. Peypouqueta
aEcole Pratique des Hautes Etudes, Paleoclimatologie et Paleoenvironnements Marins, Departement de Geologie et Oceanographie,
Universite Bordeaux 1, Avenue des Facultes, 33405 Talence, FrancebDepartement de Geologie et Oceanographie, Universite Bordeaux 1, Avenue des Facultes, 33405 Talence, France
cDepartment of Geology and Geophysics, Woods Hole Oceanographic Institution, MA 02543, USAdUniversite Catholique de Louvain, Chemin du Cyclotron 2, 1348 Louvain-la-Neuve, Belgium
eLaboratoire de Chrono-Ecologie, UMR-CNRS 6565, Faculte des Sciences et Techniques, 16 route de Gray, 25030 Besanc-on, France
Abstract
The Marine Isotope Stage 11 interglacial, centred at �400 ka, appears to be the best candidate for understanding climatic changes
in the context of low insolation forcing such as that of our present interglacial. Direct correlation between terrestrial (pollen) and
marine climatic indicators and ice volume proxy from deep-sea core MD01-2447 (off northwestern Iberia) shows for the first time
the phase relationship between southwestern European vegetation, sea surface temperatures in the northeastern Atlantic mid-
latitudes and ice volume during MIS 11. A warmest 32,000 years-long period and three following warm/cold cycles occurred
synchronously on land and ocean. The end of the warmest period sees the glacial inception which coincides with the replacement of
warm deciduous forest by conifer (pine-fir) expansion in northwestern Iberia and, consequently, with the southward migration of the
tree line in high latitudes in response to declining summer insolation. As weak insolation changes alone cannot account for ice
growth, the associated vegetation changes must now be considered as a potential major feedback mechanism for glaciation initiation
during MIS 11.
r 2005 Elsevier Ltd. All rights reserved.
1. Introduction
Marine Isotope Stage (MIS) 11, the interglacial datedat c. 400 ka, is marked by Earth’s orbital geometry beingvery similar to that of MIS 1 (�14 ka-present) (Loutreand Berger, 2003) and, therefore, appears to be the bestcandidate to predict the natural evolution of the presentinterglacial. The climate behaviour simulated by theLLN-2D model for MIS 11 and MIS 1 shows anunusually 50,000 years long period of warmth andminimum northern hemisphere continental ice volume(Loutre and Berger, 2003). The new EPICA-DOME Crecord suggests that temperature remains warm for
e front matter r 2005 Elsevier Ltd. All rights reserved.
ascirev.2005.01.005
ing author.
ess: [email protected] (S. Desprat).
28,000 years during MIS11 (EPICA community mem-bers, 2004). Marine data from MIS 11 have led to thetraditional idea of an exceptional interglacial in theoceanic realm, the longest and warmest of the last 500 ka(Droxler and Farrell, 2000; Howard, 1997). This ischallenged by several authors who claim that thisinterglacial was not substantially warmer than today(e.g. Bauch et al., 2000; Hodell et al., 2000). A recentreview of the putative continental records of MIS 11suggests that this interval was moister than present andtemperature estimates varied from similar to the present,to warmer from place to place (Rousseau, 1999).However, the lack of accurate chronology for the fewavailable terrestrial records precludes a reliable correla-tion between the marine and terrestrial stratigraphiesand, therefore, the establishment of the climate of MIS
ARTICLE IN PRESSS. Desprat et al. / Quaternary Science Reviews 24 (2005) 1361–13741362
11 and its variability over the continent. This makes itdifficult to determine phase-relationships betweenocean, continent, ice and atmospheric responses toorbital and sub-orbital climate changes over thisinterglacial, and complicates the comparison of modelsimulations with geological data. Our data, from apollen-rich deep-sea core retrieved in the northwesternIberian margin and spanning the last �425,000 years,document for the first time the climatic variability ofMIS 11 in Iberia and, further, show the phase relation-ship between southwestern European vegetations, mar-ine climatic changes in the northeastern Atlantic mid-latitudes and the ice volume fluctuations over MIS 11.This new evidence over the interglacial/glacial transitionof MIS 11 highlights the potentially major role ofvegetation changes in fostering the glacial inception incontext of low insolation forcing.
2. Environmental setting
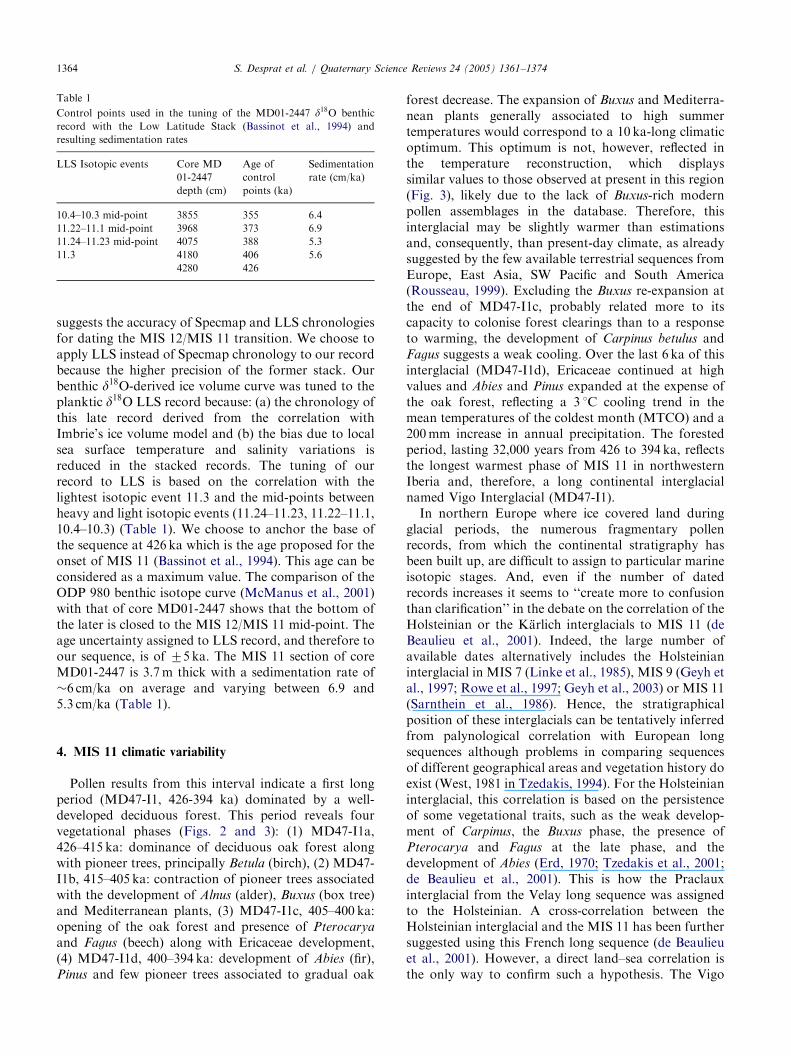
Core MD01-2447 (421090N 091400W) was retrieved�100 km off the Galician coast at 2080 m water depth(Fig. 1). This site is under the influence of the NorthAtlantic Deep Water mass. The present-day climate ofnorthwestern Iberia is temperate and humid with meanannual temperature of 10 and 17 1C (Mean Temperatureof the Coldest Month, MTCO ¼ 5–12 1C; Mean Tem-perature of the Warmest Month, MTWA ¼ 17–22 1C)and mean annual precipitation between 1000 and2000 mm.an�1 (Atlas Nacional de Espana, 1992). Thisregion, incised in the north by the Rias Baixas valleys(Galician coast basin) and the Mino-Sil river (Sil basin)(Atlas Nacional de Espana, 1993) and crossed in thesouth by the Douro river, belongs to the Eurosiberian
Fig. 1. Location of MD01-2447 and other marine and terrestrial
sequences discussed in the text.
and sub-Mediterranean regions (Ozenda, 1982) wheredeciduous oak woodlands with heaths dominate (AlcaraAriza et al., 1987).
Studies on present-day pollen deposition in marinesediments show that pollen grains reach marine sitesfrom the adjacent continent by both fluvial and aeoliantransport and subsequent sinking through the watercolumn (Heusser and Balsam, 1977; Heusser, 1978;Chmura et al., 1999; Dupont and Wyputta, 2003).Further, it is suggested that cores located nearcontinental regions with well-developed hydrographicbasins and prevailing offshore winds, as it is the case ofour core, mainly recruit pollen from rivers (Dupont andWyputta, 2003; Heusser, 1978; Turon, 1984). Thenorthwestern Iberian rivers, mainly the Douro andMino and slightly the Rias Baixas, provide sediments tothe shelf area. On the shelf, the fine-particle sediments insuspension are transported northwards by polewardcurrents, and some are deposited in the Douro andGalicia Mud Patches (Dias et al., 2002). Extreme stormevents can produce re-suspension of some sedimentfrom the mud patches and transport of sediments off theshelf can occur (Jouanneau et al., 2002; Vitorino, 2002).Pollen grains belonging to the fine-particle fraction havea similar behaviour as fine sediments during thesedimentary processes (Chmura and Eisma, 1995;Muller, 1959). Pollen grains preserved in marine coreMD01-2447, mainly come, therefore, from the Galicianand Douro fluvial basins and represent an integratedimage of the regional vegetation of the adjacentcontinent.
3. Material and methods
Pollen and classical climate indicators (plankticforamifera assemblages, benthic and planktic d18O)have been analysed from the same sample set of deep-sea core MD01-2447 (Fig. 1). Pollen-derived tempera-ture and precipitation were estimated through theModern Analogue Technique constrained by biomisa-tion procedure.
3.1. Pollen analysis
The profile was subsampled for pollen analysis at 10or 5 cm intervals. The sample preparation techniquefollowed the procedure described by de Vernal et al.(1996). Exotic pollen (Lycopodium) was added to eachsample to determine pollen concentrations (pollengrains per unit of sediment volume). After chemicaland physical treatments (cold HCl, cold HF and sievingthrough 10 mm nylon mesh screens), the residue wasmounted unstained in glycerol. Pollen was countedusing a Zeiss Axioscope light microscope at 400 and1000 (oil immersion) magnifications. A minimum of 300

ARTICLE IN PRESSS. Desprat et al. / Quaternary Science Reviews 24 (2005) 1361–1374 1363
pollen grains (100 pollen grains without Pinus) and aminimum of 20 taxa were counted in each of the 43samples analysed. The pollen percentages for each taxonare based on a main pollen sum that excludes Pinus,aquatic plants, pteridophyte spores and indeterminablepollen. Pinus was excluded from the main sum becauseof its over-representation in marine deposits (Heusserand Balsam, 1977; Turon, 1984). Pinus percentages werecalculated from the main sum plus Pinus. Spores andaquatic pollen percentages were obtained from the totalsum (pollen+spores+indeterminables+unknowns).
3.2. Pollen-derived quantitative climatic reconstruction
The Modern Analogue Technique (MAT) constrainedby biomisation procedure has been applied to MD01-2447 pollen sequence to estimate annual precipitationand winter and summer temperatures in northwesternIberia during MIS 11. This technique is based on a veryrecently improved modern pollen database from Eur-asia, Scandes Mountains, Tibetan Plateau and northernAfrica composed by 868 pollen spectra (Peyron, unpub.data). The climatic parameters—mean temperature ofthe coldest (MTCO) and the warmest months (MTWA),annual precipitation (PANN)—have been calculated ateach modern pollen site from meteorological data, usingan interpolation based on an Artificial Neural Networktechnique. The bioclimatic parameters selected seem toplay a determinant role on the distribution of thevegetation and related pollen assemblages (Prenticeet al., 1993). However, since Pinus is overrepresentedin marine sediments, this pollen type has been removedfrom the marine pollen counting as well as from thecontinental pollen database. The biomisation procedureattributes to each of the modern and fossil pollenspectra a type of biome such as tundra, taiga, temperatedeciduous forest, warm mixed forest, or steppes. TheMAT, initially developed for continental pollen se-quences (Cheddadi, 1988; Guiot, 1990; Guiot et al.,1993), cannot, however, choose all the modern pollenanalogues close to our fossil spectra but only thosesimilar corresponding to the same biome. Usually, 5–10modern spectra which have the smallest chord distancewith the fossil spectrum are considered as the bestmodern analogues of the given pollen spectrum, andused for the reconstruction. Their climatic parametersestimated are averaged by a weighting inverse to thechord distance. The error is computed as lower andupper limits of positive and negative deviation ofextreme analogues compared to the mean value.
3.3. Isotopic analyses
Oxygen isotopes have been measured over the wholeMD01-2447 core. Marine Isotope Stages 11 to 1 havebeen clearly identified.
MD01-2447 sampling resolution for MIS 11 intervalis 10 or 5 cm for Cibicides wuellerstorfi (48 samples) andMelonis barleeanus (5 samples) benthic foraminifera,and 10 cm for Globigerina bulloides planktic foramini-fera. Each specimen has been picked up within the250–315 mm grain-size fraction, and cleaned with dis-tilled water. The preparation of each aliquot (4 to 8specimens, representing a mean weight of 80 mg) hasbeen done using the Micromass Multiprep autosampler,using an individual acid attack for each sample. The CO
2
gas extracted has been analysed against NBS 19standard, taken as an international reference standard.All the analyses have been carried out at the Depart-ment of Geology and Oceanography of BordeauxUniversity, UMR 5805 EPOC, using an Optima Micro-
mass mass spectrometer.To construct a consistent benthic d18O curve, we used
Cibicides wuellerstorfi values as reference on whichMelonis barleeanus has been adjusted by a correctingfactor of �0.28 per mil. Generally, Cibicides wueller-
storfi and Melonis barleeanus are calibrated to Uvigerina
species, using a +0.64 per mil and +0.36 correctingfactor, respectively (Duplessy et al., 1984; Graham et al.,1981; Jansen et al., 1988; Shackleton and Opdyke, 1973).
3.4. Chronological framework
The chronostratigraphy of MD01-2447 sequence hasbeen derived from the astronomical tuned chronology ofthe Low Latitude Stack (LLS) (Bassinot et al., 1994).The chronology of MIS 11 remains problematic. Firstly,the lack of accurate dating of sea level changes duringthis period precludes building up age models indepen-dent of orbital forcing. Secondly, the weak variations ofinsolation make difficult to choose the critical tie-pointsfor the orbital tuning of the records. However, this lateapproach remains the only mean to chronologicallyconstrain MIS 11 leading to three principal chronolo-gies: Specmap stack (Imbrie et al., 1984), Low latitudestack (Bassinot et al., 1994) and ODP 677 records(Shackleton et al., 1990), to which are generally tunedMIS 11 sequences. Specmap planktic d18O record istuned to orbital parameter variations, while LLS andODP planktic d18O are adjusted on Imbrie’s ice volumemodel (Imbrie and Imbrie, 1980). LLS and Specmapchronologies are roughly equivalent considering that theresponse time lags of ice-sheets to insolation variationsare similar in the Specmap tuning and ice volume model,and that both Imbrie et al. and Bassinot et al. associate1.5 precession cycles to Termination V. On the contrary,ODP 677 chronology shows a great discrepancy for theage of Termination V which is 10 kyrs younger thanSpecmap and LLS chronologies, due to the Shackleton’schoice to restrain the glacial/interglacial transition to 0.5precession cycle. The recent dating of alluvial deposits ofhigh stand sea level in Italy (Karner and Marra, 2003)
ARTICLE IN PRESS
Table 1
Control points used in the tuning of the MD01-2447 d18O benthic
record with the Low Latitude Stack (Bassinot et al., 1994) and
resulting sedimentation rates
LLS Isotopic events Core MD
01-2447
depth (cm)
Age of
control
points (ka)
Sedimentation
rate (cm/ka)
10.4–10.3 mid-point 3855 355 6.4
11.22–11.1 mid-point 3968 373 6.9
11.24–11.23 mid-point 4075 388 5.3
11.3 4180 406 5.6
4280 426
S. Desprat et al. / Quaternary Science Reviews 24 (2005) 1361–13741364
suggests the accuracy of Specmap and LLS chronologiesfor dating the MIS 12/MIS 11 transition. We choose toapply LLS instead of Specmap chronology to our recordbecause the higher precision of the former stack. Ourbenthic d18O-derived ice volume curve was tuned to theplanktic d18O LLS record because: (a) the chronology ofthis late record derived from the correlation withImbrie’s ice volume model and (b) the bias due to localsea surface temperature and salinity variations isreduced in the stacked records. The tuning of ourrecord to LLS is based on the correlation with thelightest isotopic event 11.3 and the mid-points betweenheavy and light isotopic events (11.24–11.23, 11.22–11.1,10.4–10.3) (Table 1). We choose to anchor the base ofthe sequence at 426 ka which is the age proposed for theonset of MIS 11 (Bassinot et al., 1994). This age can beconsidered as a maximum value. The comparison of theODP 980 benthic isotope curve (McManus et al., 2001)with that of core MD01-2447 shows that the bottom ofthe later is closed to the MIS 12/MIS 11 mid-point. Theage uncertainty assigned to LLS record, and therefore toour sequence, is of 75 ka. The MIS 11 section of coreMD01-2447 is 3.7 m thick with a sedimentation rate of�6 cm/ka on average and varying between 6.9 and5.3 cm/ka (Table 1).
4. MIS 11 climatic variability
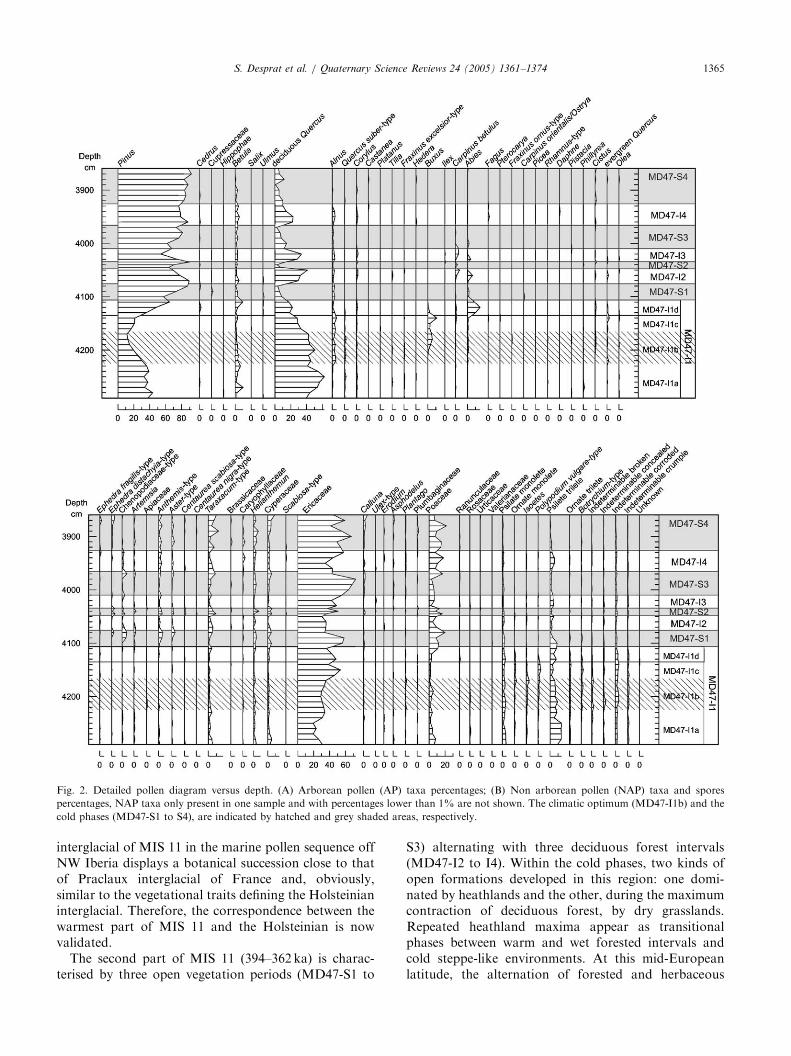
Pollen results from this interval indicate a first longperiod (MD47-I1, 426-394 ka) dominated by a well-developed deciduous forest. This period reveals fourvegetational phases (Figs. 2 and 3): (1) MD47-I1a,426–415 ka: dominance of deciduous oak forest alongwith pioneer trees, principally Betula (birch), (2) MD47-I1b, 415–405 ka: contraction of pioneer trees associatedwith the development of Alnus (alder), Buxus (box tree)and Mediterranean plants, (3) MD47-I1c, 405–400 ka:opening of the oak forest and presence of Pterocarya
and Fagus (beech) along with Ericaceae development,(4) MD47-I1d, 400–394 ka: development of Abies (fir),Pinus and few pioneer trees associated to gradual oak
forest decrease. The expansion of Buxus and Mediterra-nean plants generally associated to high summertemperatures would correspond to a 10 ka-long climaticoptimum. This optimum is not, however, reflected inthe temperature reconstruction, which displayssimilar values to those observed at present in this region(Fig. 3), likely due to the lack of Buxus-rich modernpollen assemblages in the database. Therefore, thisinterglacial may be slightly warmer than estimationsand, consequently, than present-day climate, as alreadysuggested by the few available terrestrial sequences fromEurope, East Asia, SW Pacific and South America(Rousseau, 1999). Excluding the Buxus re-expansion atthe end of MD47-I1c, probably related more to itscapacity to colonise forest clearings than to a responseto warming, the development of Carpinus betulus andFagus suggests a weak cooling. Over the last 6 ka of thisinterglacial (MD47-I1d), Ericaceae continued at highvalues and Abies and Pinus expanded at the expense ofthe oak forest, reflecting a 3 1C cooling trend in themean temperatures of the coldest month (MTCO) and a200 mm increase in annual precipitation. The forestedperiod, lasting 32,000 years from 426 to 394 ka, reflectsthe longest warmest phase of MIS 11 in northwesternIberia and, therefore, a long continental interglacialnamed Vigo Interglacial (MD47-I1).
In northern Europe where ice covered land duringglacial periods, the numerous fragmentary pollenrecords, from which the continental stratigraphy hasbeen built up, are difficult to assign to particular marineisotopic stages. And, even if the number of datedrecords increases it seems to ‘‘create more to confusionthan clarification’’ in the debate on the correlation of theHolsteinian or the Karlich interglacials to MIS 11 (deBeaulieu et al., 2001). Indeed, the large number ofavailable dates alternatively includes the Holsteinianinterglacial in MIS 7 (Linke et al., 1985), MIS 9 (Geyh etal., 1997; Rowe et al., 1997; Geyh et al., 2003) or MIS 11(Sarnthein et al., 1986). Hence, the stratigraphicalposition of these interglacials can be tentatively inferredfrom palynological correlation with European longsequences although problems in comparing sequencesof different geographical areas and vegetation history doexist (West, 1981 in Tzedakis, 1994). For the Holsteinianinterglacial, this correlation is based on the persistenceof some vegetational traits, such as the weak develop-ment of Carpinus, the Buxus phase, the presence ofPterocarya and Fagus at the late phase, and thedevelopment of Abies (Erd, 1970; Tzedakis et al., 2001;de Beaulieu et al., 2001). This is how the Praclauxinterglacial from the Velay long sequence was assignedto the Holsteinian. A cross-correlation between theHolsteinian interglacial and the MIS 11 has been furthersuggested using this French long sequence (de Beaulieuet al., 2001). However, a direct land–sea correlation isthe only way to confirm such a hypothesis. The Vigo
ARTICLE IN PRESS
Fig. 2. Detailed pollen diagram versus depth. (A) Arborean pollen (AP) taxa percentages; (B) Non arborean pollen (NAP) taxa and spores
percentages, NAP taxa only present in one sample and with percentages lower than 1% are not shown. The climatic optimum (MD47-I1b) and the
cold phases (MD47-S1 to S4), are indicated by hatched and grey shaded areas, respectively.
S. Desprat et al. / Quaternary Science Reviews 24 (2005) 1361–1374 1365
interglacial of MIS 11 in the marine pollen sequence offNW Iberia displays a botanical succession close to thatof Praclaux interglacial of France and, obviously,similar to the vegetational traits defining the Holsteinianinterglacial. Therefore, the correspondence between thewarmest part of MIS 11 and the Holsteinian is nowvalidated.
The second part of MIS 11 (394–362 ka) is charac-terised by three open vegetation periods (MD47-S1 to
S3) alternating with three deciduous forest intervals(MD47-I2 to I4). Within the cold phases, two kinds ofopen formations developed in this region: one domi-nated by heathlands and the other, during the maximumcontraction of deciduous forest, by dry grasslands.Repeated heathland maxima appear as transitionalphases between warm and wet forested intervals andcold steppe-like environments. At this mid-Europeanlatitude, the alternation of forested and herbaceous
ARTICLE IN PRESS
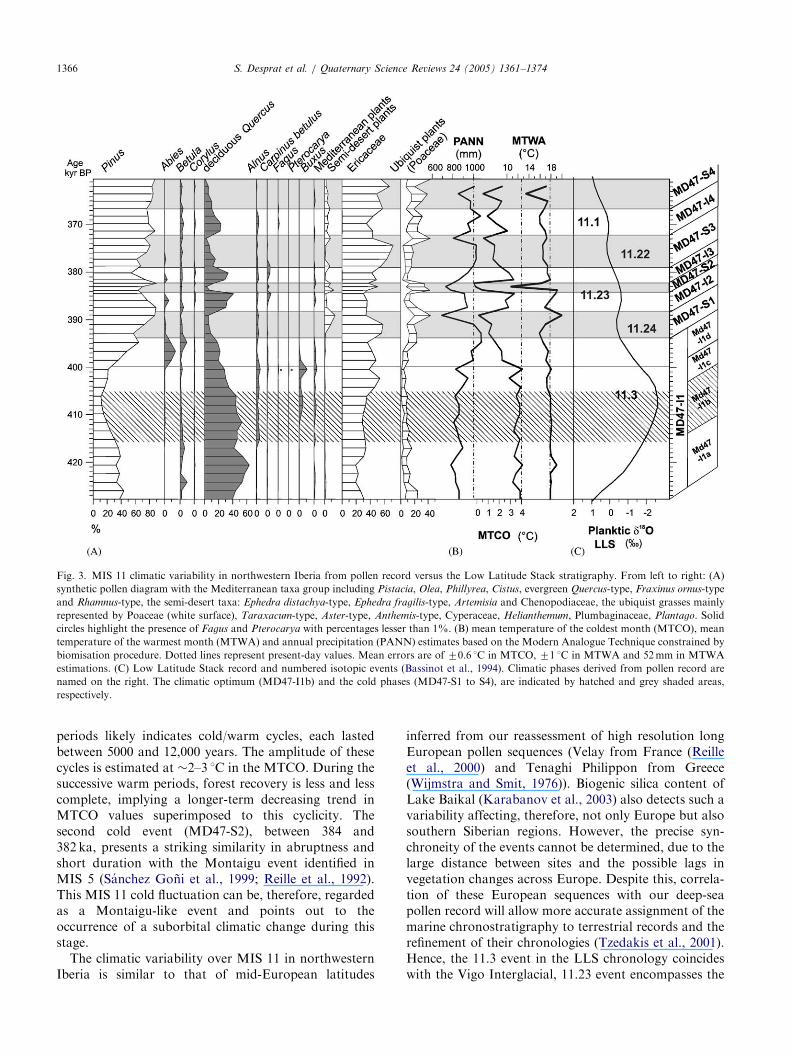
Fig. 3. MIS 11 climatic variability in northwestern Iberia from pollen record versus the Low Latitude Stack stratigraphy. From left to right: (A)
synthetic pollen diagram with the Mediterranean taxa group including Pistacia, Olea, Phillyrea, Cistus, evergreen Quercus-type, Fraxinus ornus-type
and Rhamnus-type, the semi-desert taxa: Ephedra distachya-type, Ephedra fragilis-type, Artemisia and Chenopodiaceae, the ubiquist grasses mainly
represented by Poaceae (white surface), Taraxacum-type, Aster-type, Anthemis-type, Cyperaceae, Helianthemum, Plumbaginaceae, Plantago. Solid
circles highlight the presence of Fagus and Pterocarya with percentages lesser than 1%. (B) mean temperature of the coldest month (MTCO), mean
temperature of the warmest month (MTWA) and annual precipitation (PANN) estimates based on the Modern Analogue Technique constrained by
biomisation procedure. Dotted lines represent present-day values. Mean errors are of 70.6 1C in MTCO, 71 1C in MTWA and 52 mm in MTWA
estimations. (C) Low Latitude Stack record and numbered isotopic events (Bassinot et al., 1994). Climatic phases derived from pollen record are
named on the right. The climatic optimum (MD47-I1b) and the cold phases (MD47-S1 to S4), are indicated by hatched and grey shaded areas,
respectively.
S. Desprat et al. / Quaternary Science Reviews 24 (2005) 1361–13741366
periods likely indicates cold/warm cycles, each lastedbetween 5000 and 12,000 years. The amplitude of thesecycles is estimated at �2–3 1C in the MTCO. During thesuccessive warm periods, forest recovery is less and lesscomplete, implying a longer-term decreasing trend inMTCO values superimposed to this cyclicity. Thesecond cold event (MD47-S2), between 384 and382 ka, presents a striking similarity in abruptness andshort duration with the Montaigu event identified inMIS 5 (Sanchez Goni et al., 1999; Reille et al., 1992).This MIS 11 cold fluctuation can be, therefore, regardedas a Montaigu-like event and points out to theoccurrence of a suborbital climatic change during thisstage.
The climatic variability over MIS 11 in northwesternIberia is similar to that of mid-European latitudes
inferred from our reassessment of high resolution longEuropean pollen sequences (Velay from France (Reilleet al., 2000) and Tenaghi Philippon from Greece(Wijmstra and Smit, 1976)). Biogenic silica content ofLake Baikal (Karabanov et al., 2003) also detects such avariability affecting, therefore, not only Europe but alsosouthern Siberian regions. However, the precise syn-chroneity of the events cannot be determined, due to thelarge distance between sites and the possible lags invegetation changes across Europe. Despite this, correla-tion of these European sequences with our deep-seapollen record will allow more accurate assignment of themarine chronostratigraphy to terrestrial records and therefinement of their chronologies (Tzedakis et al., 2001).Hence, the 11.3 event in the LLS chronology coincideswith the Vigo Interglacial, 11.23 event encompasses the

ARTICLE IN PRESSS. Desprat et al. / Quaternary Science Reviews 24 (2005) 1361–1374 1367
following two first warm periods (MD47-I2 and MD47-I3) incised by the Montaigu-like event (MD47-S2) andthe last warmth (MD47-I4) corresponds to the 11.1event (Fig. 3).
The climatic variability of northwestern Iberia duringMIS 11, estimated from pollen assemblages, parallelsthe sea surface temperature shifts suggested by planktic(G. bulloides) oxygen isotope measurements and plankticforaminifera assemblages obtained from the samesample set (Figs. 4 and 5). The Vigo Interglacial isassociated with warm conditions in the ocean. Theclimatic optimum, observed on land between 415 and405 ka, is contemporaneous with the warmest seasurface environments, as shown by the development oftropical and subtropical planktic foraminifera. Thiscoincides with the ice volume minimum indicated by thelightest values of benthic (C. wuellerstorfi) oxygenisotopes. The lowest planktic d18O values occur para-doxically just after this climatic optimum. We explainthese low isotopic values by sea surface salinity decreaselinked to the precipitation increase (Fig. 3) documentedover the adjacent continent rather than by increase insea surface temperatures at the end of the interglacial. Infact, this interval sees the disappearance of tropicalforaminifera and the strong decrease of subtropical onestraducing a cooling trend at the end of Vigo Interglacialalso shown by conifer-tree development. In northernlatitudes, at sites 980 (Fig. 5B) and 983, a comparablelong warm period to the Vigo Interglacial is inferred
Fig. 4. Direct correlation between pollen and marine proxies versus depth. Fr
three planktic foraminifera assemblages, planktic d18O curve and benthic d1
polar species. Summer subtropical species (solid squares) contain prin
Globoturborotalita rubescens and Globorotalia crassaformis. Tropical species
Globigerinoides trilobus. Pollen-derived climatic phases on land are represent
from the adjusted N. pachyderma d. d18O records, a seasurface temperature proxy (McManus et al., 2003). Thisperiod, characterised in site 980 by climatic fluctuationsof 71 1C (Oppo et al., 1998), is regarded as stableaccording to McManus et al. definition (McManus etal., 2003) that means the absence of oscillationsexceeding certain amplitude within several thousandyears. This low amplitude variability during the ‘‘stable’’part of MIS 11 is similar to that identified over theHolocene in the North Atlantic (Bond et al., 1997). Inparticular, Oppo et al. (1998) identified three SST cyclesof �1 1C amplitude during the 12 ka-long period ofminimum ice volume, possibly associated with reductionof the vigorous thermohaline circulation. The NADWdecrease during these cool events remains, however,unclear certainly due to the close location of source deepwater formation to the studied site. In the Iberianregion, apparently only two cool events, ca 417 and402 ka, have synchronously affected forest and warmforaminifera assemblages during the Vigo Interglacial.Two concomitant reductions of NADW production areexpressed by carbonate content and benthic d13Cdecreases in Bermuda ODP site 1063 of which thechronology derived, as MD01-2447, from the orbitallytuned LLS record (Poli et al., 2000). The lowerfrequency of small changes in North Atlantic low andmid latitudes, in comparison with that observed innorthern regions, can be explained by the less resolutionanalysis of MD01-2447 and site 1063. The stability
om the left to the right: pollen diagram of selected taxa, percentages of8O record. Neogloboquadrina pachyderma left coiling (dotted line) is a
cipally Globigerinoides ruber alba and also Globigerinella calida,
(solid circles) include Beela digitata, Neogloboquadrina dutertrei and
ed as in Figs. 2 and 3.
ARTICLE IN PRESS
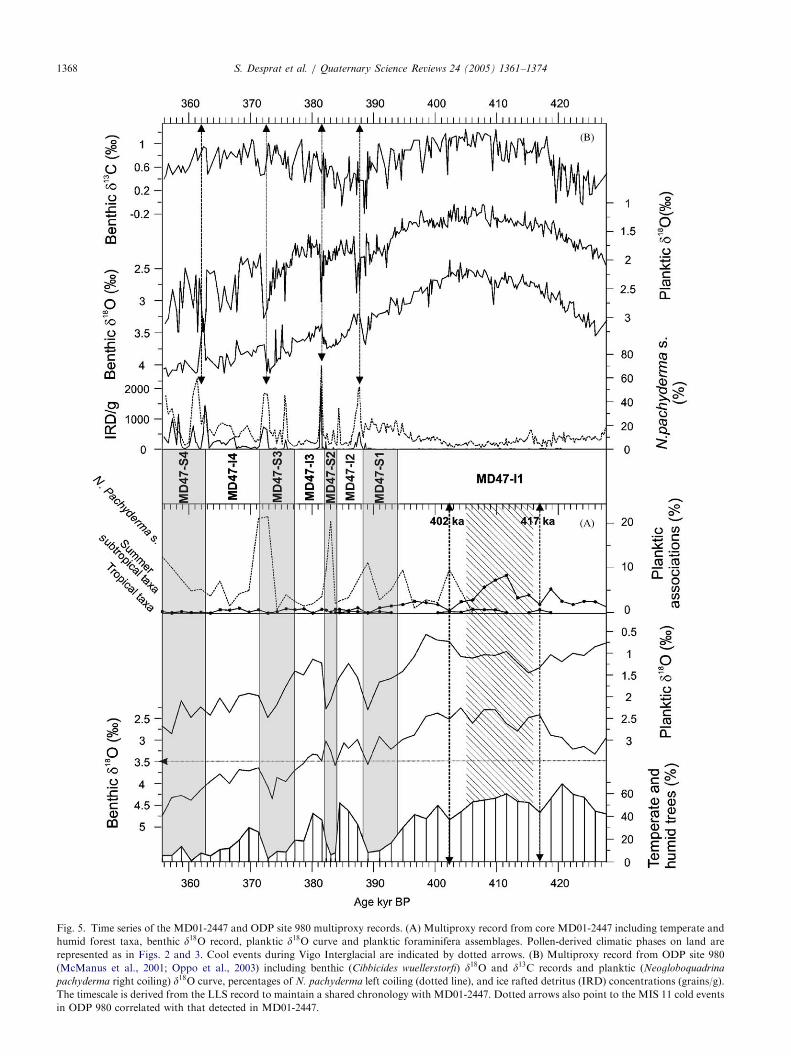
Fig. 5. Time series of the MD01-2447 and ODP site 980 multiproxy records. (A) Multiproxy record from core MD01-2447 including temperate and
humid forest taxa, benthic d18O record, planktic d18O curve and planktic foraminifera assemblages. Pollen-derived climatic phases on land are
represented as in Figs. 2 and 3. Cool events during Vigo Interglacial are indicated by dotted arrows. (B) Multiproxy record from ODP site 980
(McManus et al., 2001; Oppo et al., 2003) including benthic (Cibbicides wuellerstorfi) d18O and d13C records and planktic (Neogloboquadrina
pachyderma right coiling) d18O curve, percentages of N. pachyderma left coiling (dotted line), and ice rafted detritus (IRD) concentrations (grains/g).
The timescale is derived from the LLS record to maintain a shared chronology with MD01-2447. Dotted arrows also point to the MIS 11 cold events
in ODP 980 correlated with that detected in MD01-2447.
S. Desprat et al. / Quaternary Science Reviews 24 (2005) 1361–13741368
ARTICLE IN PRESSS. Desprat et al. / Quaternary Science Reviews 24 (2005) 1361–1374 1369
invoked by McManus is, however, challenged by thecooling trend marking the end of the Vigo interglacialin Iberia. At site 980, the relative abundance ofN. pachyderma s. (Fig. 5B) (Oppo et al., 1998) slightlyincreases toward the end of this warm period indicatinga cooling which is not highlighted by the adjustedN. pachyderma d. d18O record. Off Iberia and at site 980this cooling is likely associated with both ice volumegrowth and deep water temperature decrease as shownby the increasing benthic d18O values. The cooling trendlasted several thousand years until reaching actual coldconditions at �390 ka. In Iberia, the interglacial endedto give way to the millennial scale climatic variabilitycharacterizing the second part of MIS 11.
The three warm/cold cycles including the coldMontaigu-like event identified on land have also a clearimprint in the adjacent oceanic environments (Figs. 4and 5). Stadial phases are characterised by heavyplanktic isotopic values along with peaks of the polarforaminifera N. pachyderma s. At sites 980 and 983,millennial-scale sea surface temperature oscillations of�4 1C can be inferred from variations of �1% in theplanktic isotopic values. The cold phases are associatedwith ice rafting events (Oppo et al., 1998) and reductionin deep water formation (Fig. 5B). These phases seem tocorrespond with the cold events in the Iberian region.Further, the abruptness of the Montaigu-like event inmid latitudes is reproduced in the northern ones. Aweakening in thermohaline circulation during coldphases is also suggested for the southwestern NorthAtlantic as reported by three drops in carbonate contentand d13C in the middle of 11.23, at 11.22 and at 11.24(Poli et al., 2000). This climatic variability is apparently arecurrent pattern through the European continent andthe North Atlantic environments. Furthermore, a strik-ing similarity exists between the deuterium-derivedAntarctica temperature from Vostok (Petit et al.,1999), and the North Atlantic paleoclimatic record,revealing similar interhemispheric climatic patterns dur-ing MIS 11. Unfortunately, the chronology and recordcorrelation uncertainties preclude evaluating the leadsand lags between different regions to the climaticvariability of MIS 11.
5. The MIS 11 glacial inception and associated potential
major feedback mechanisms
Earth’s particular orbital configuration during MIS11 implies an astronomical climatic forcing greatlydifferent than succeeding interglacial stages such asMIS 5. This different orbital forcing is traduced by arelatively weak northern summer insolation and lowamplitude variations during MIS 11, contrasting withthe large insolation changes and associated high maximaduring MIS 5. This raises the question of the ‘‘Stage 11
Paradox’’: astronomical forcing during stage 11 is toolow by itself to drive climate into interglacial conditions(Li et al., 1998) and yet the 12-11 Termination appearsto be the largest of the last million years (Imbrie andImbrie, 1980). Moreover, insolation changes cannotalone trigger the glacial initiation during MIS 11 as thesummer insolation decrease is modest. The Earth Modelof Intermediate Complexity (EMIC) LLN 2-D forced byinsolation and Vostok (GT4 timescale)-CO2 variationssimulates a 45 ka-long ice-free interval in the northernHemisphere and an ice volume lower than 10 � 106 km3
for 65 ka (Loutre, 2003). A quasi ice-free intervalcorresponding to the entire MIS 11 is, however, notrealistic considering geological data (Imbrie et al., 1984).As shown by McManus et al. (1999), for the last 0.5million years, climate variability begins when benthic(C. wuellerstorfi) d18O values become heavier than 3.5per mil. The Iberian record also reflect millennial scalevariability beyond this d18O figure not only in oceanenvironments but also in the southwestern Europeanregions during MIS 11. This value, even if partlyindicative of relatively cold bottom water temperature,may represent an ice volume threshold beyond which theclimatic variability is amplified by feedback mechan-isms: ice-sheets would become large enough to releasenumerous icebergs whose meltwater would enhanceimportant reduction of NADW production and conse-quently a decrease of poleward heat flux (McManus etal., 1999). The 3.5 benthic d18O value and the presenceof ice rafted detritus during the first cold event (390 ka)in the North Atlantic imply necessarily an ice-sheetgrowth during the end of the Vigo Interglacial periodand, therefore, at least 30 ka earlier than that simulatedby the LLN-2D climate model. This evidence has led toother LLN 2-D experiments testing how a 10 ka changein the CO2 chronology, based on the uncertainties of theVostok GT4 timescale, could influence the simulatedMIS 11 ice volume trends. In this later experiment, theglacial inception is simulated only because both CO2
and insolation decrease together (Loutre, 2003; Ray-naud et al., 2003). This assumption of parallelismbetween CO2 and insolation at the end of the warmestMIS 11 phase is in agreement with the recent Vostokage-scale for this time interval proposed by Ruddiman(2005) and based on synchronism between precessionand CH4 oscillations. This author suggests the decreaseof carbonic gas and methane, which are considered earlyresponders to astronomical changes, as a major addi-tional source of forcing for ice-sheet growth. However,these greenhouse gases need intermediate mechanisms todecrease, such as advances of Antarctic sea-ice or ice-sheet growth (Ruddiman, 2005 and references therein).For the last glacial inception, other environmentalparameters such as vegetation or thermohaline circula-tion are considered to be potential feedback mechanisms(de Noblet et al., 1996; Khodri et al., 2001) and these are
ARTICLE IN PRESSS. Desprat et al. / Quaternary Science Reviews 24 (2005) 1361–13741370
not explicitly represented in the LLN-2D model.Southward displacement of convection zones as positivefeedback mechanism has been put forward by the IPSL-CM2 ocean-atmosphere coupled model to explain theonset of the last glaciation (Khodri et al., 2001). A weakdecreasing trend in the benthic d13C from ODP 980 sitesuggests a reduction of deep water formation at the endof Vigo Interglacial and, therefore, a possible role of thethermohaline circulation in the ice-sheet build-up duringMIS 11.
The EMIC MoBidic, which includes a dynamicalvegetation model and the ocean dynamics, has simulated
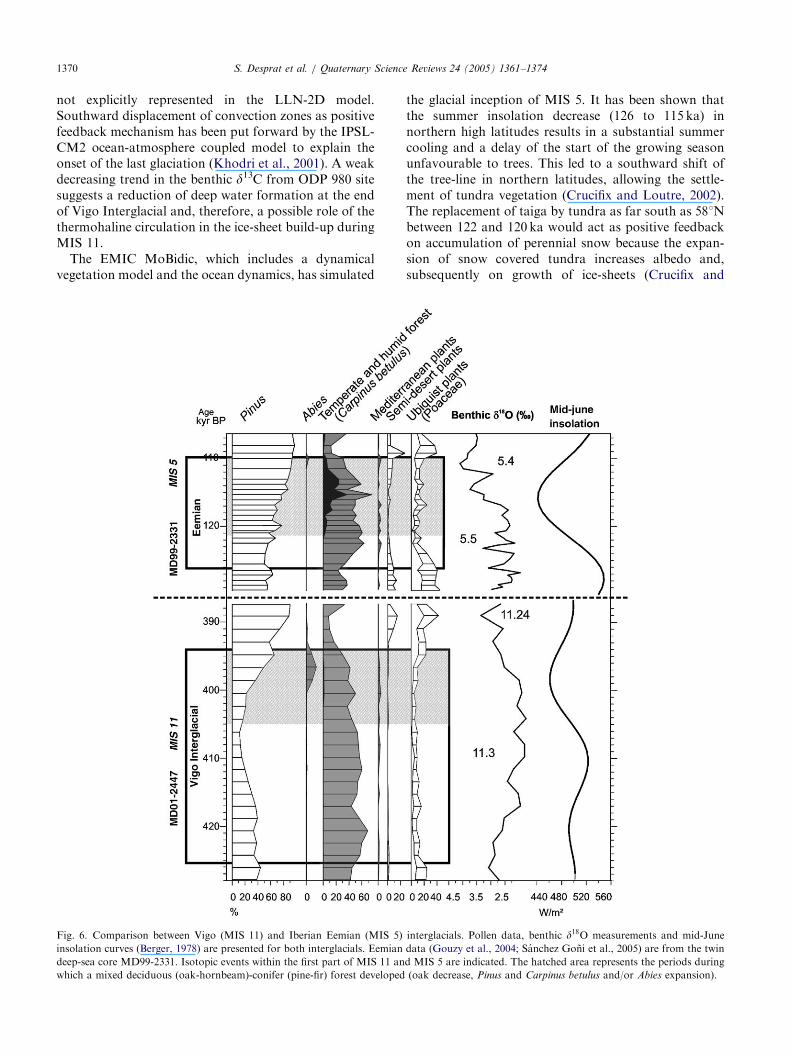
Fig. 6. Comparison between Vigo (MIS 11) and Iberian Eemian (MIS 5)
insolation curves (Berger, 1978) are presented for both interglacials. Eemian
deep-sea core MD99-2331. Isotopic events within the first part of MIS 11 an
which a mixed deciduous (oak-hornbeam)-conifer (pine-fir) forest developed
the glacial inception of MIS 5. It has been shown thatthe summer insolation decrease (126 to 115 ka) innorthern high latitudes results in a substantial summercooling and a delay of the start of the growing seasonunfavourable to trees. This led to a southward shift ofthe tree-line in northern latitudes, allowing the settle-ment of tundra vegetation (Crucifix and Loutre, 2002).The replacement of taiga by tundra as far south as 581Nbetween 122 and 120 ka would act as positive feedbackon accumulation of perennial snow because the expan-sion of snow covered tundra increases albedo and,subsequently on growth of ice-sheets (Crucifix and
interglacials. Pollen data, benthic d18O measurements and mid-June
data (Gouzy et al., 2004; Sanchez Goni et al., 2005) are from the twin
d MIS 5 are indicated. The hatched area represents the periods during
(oak decrease, Pinus and Carpinus betulus and/or Abies expansion).
ARTICLE IN PRESS
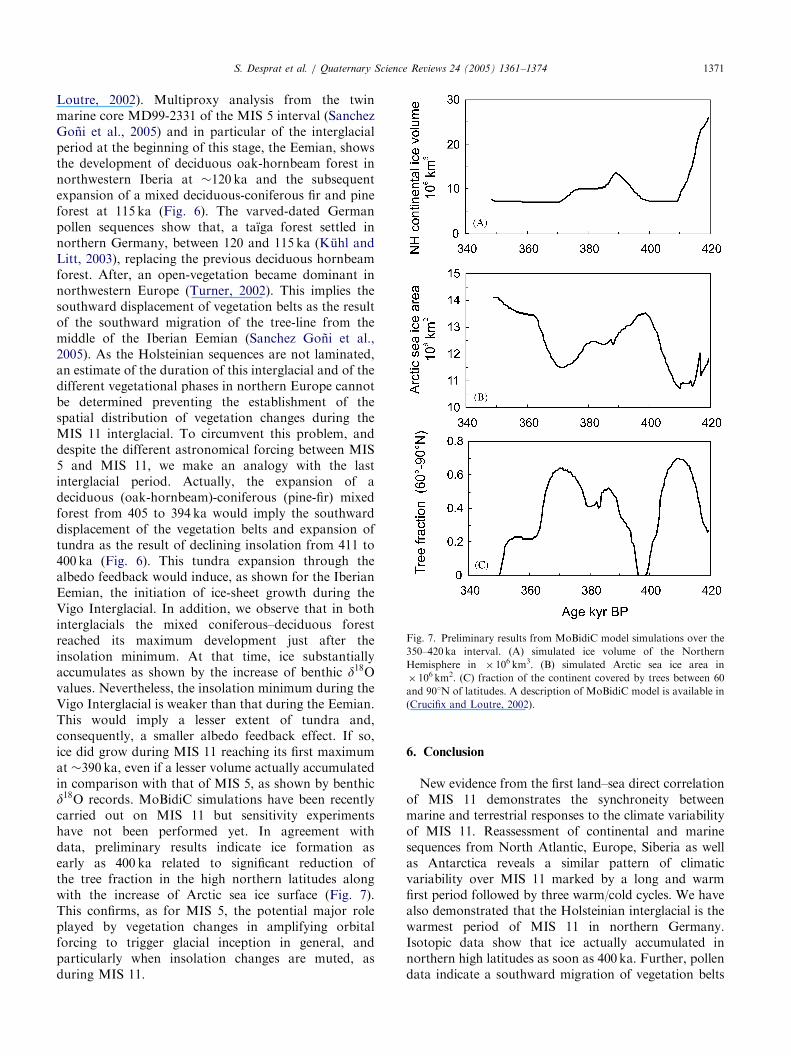
Fig. 7. Preliminary results from MoBidiC model simulations over the
350–420 ka interval. (A) simulated ice volume of the Northern
Hemisphere in � 106 km3. (B) simulated Arctic sea ice area in
� 106 km2. (C) fraction of the continent covered by trees between 60
and 901N of latitudes. A description of MoBidiC model is available in
(Crucifix and Loutre, 2002).
S. Desprat et al. / Quaternary Science Reviews 24 (2005) 1361–1374 1371
Loutre, 2002). Multiproxy analysis from the twinmarine core MD99-2331 of the MIS 5 interval (SanchezGoni et al., 2005) and in particular of the interglacialperiod at the beginning of this stage, the Eemian, showsthe development of deciduous oak-hornbeam forest innorthwestern Iberia at �120 ka and the subsequentexpansion of a mixed deciduous-coniferous fir and pineforest at 115 ka (Fig. 6). The varved-dated Germanpollen sequences show that, a taıga forest settled innorthern Germany, between 120 and 115 ka (Kuhl andLitt, 2003), replacing the previous deciduous hornbeamforest. After, an open-vegetation became dominant innorthwestern Europe (Turner, 2002). This implies thesouthward displacement of vegetation belts as the resultof the southward migration of the tree-line from themiddle of the Iberian Eemian (Sanchez Goni et al.,2005). As the Holsteinian sequences are not laminated,an estimate of the duration of this interglacial and of thedifferent vegetational phases in northern Europe cannotbe determined preventing the establishment of thespatial distribution of vegetation changes during theMIS 11 interglacial. To circumvent this problem, anddespite the different astronomical forcing between MIS5 and MIS 11, we make an analogy with the lastinterglacial period. Actually, the expansion of adeciduous (oak-hornbeam)-coniferous (pine-fir) mixedforest from 405 to 394 ka would imply the southwarddisplacement of the vegetation belts and expansion oftundra as the result of declining insolation from 411 to400 ka (Fig. 6). This tundra expansion through thealbedo feedback would induce, as shown for the IberianEemian, the initiation of ice-sheet growth during theVigo Interglacial. In addition, we observe that in bothinterglacials the mixed coniferous–deciduous forestreached its maximum development just after theinsolation minimum. At that time, ice substantiallyaccumulates as shown by the increase of benthic d18Ovalues. Nevertheless, the insolation minimum during theVigo Interglacial is weaker than that during the Eemian.This would imply a lesser extent of tundra and,consequently, a smaller albedo feedback effect. If so,ice did grow during MIS 11 reaching its first maximumat �390 ka, even if a lesser volume actually accumulatedin comparison with that of MIS 5, as shown by benthicd18O records. MoBidiC simulations have been recentlycarried out on MIS 11 but sensitivity experimentshave not been performed yet. In agreement withdata, preliminary results indicate ice formation asearly as 400 ka related to significant reduction ofthe tree fraction in the high northern latitudes alongwith the increase of Arctic sea ice surface (Fig. 7).This confirms, as for MIS 5, the potential major roleplayed by vegetation changes in amplifying orbitalforcing to trigger glacial inception in general, andparticularly when insolation changes are muted, asduring MIS 11.
6. Conclusion
New evidence from the first land–sea direct correlationof MIS 11 demonstrates the synchroneity betweenmarine and terrestrial responses to the climate variabilityof MIS 11. Reassessment of continental and marinesequences from North Atlantic, Europe, Siberia as wellas Antarctica reveals a similar pattern of climaticvariability over MIS 11 marked by a long and warmfirst period followed by three warm/cold cycles. We havealso demonstrated that the Holsteinian interglacial is thewarmest period of MIS 11 in northern Germany.Isotopic data show that ice actually accumulated innorthern high latitudes as soon as 400 ka. Further, pollendata indicate a southward migration of vegetation belts
ARTICLE IN PRESSS. Desprat et al. / Quaternary Science Reviews 24 (2005) 1361–13741372
involving albedo increase and glacial inception as early as405 ka. This ice growth is associated with a generaloceanic and atmospheric cooling till 390 ka. Geologicalrecords and MoBidiC experiments contradict the 50 ka-long ice-free interval simulated by the LLN-2D modelwhich is only forced by CO2 and insolation. Models forpredicting the future of our present interglacial, char-acterised as MIS 11 by weak insolation changes, shouldnot underestimate the effect of declining insolation onvegetation and the associated feedback mechanisms thathelp foster glaciation.
Acknowledgments
IPEV and PNEDC French programs providedfinancial support. We thank logistics and coring teamson board of the R/V Marion Dufresne II during theGeosciences oceanographic cruise and Marie-HeleneCastera, Karine Charlier, Olivier Ther and Franc-oiseVinc-on for invaluable technical assistance. We gratefullyacknowledge the reviewers, in particular ChronisTzedakis whose comments permit to greatly improvethe manuscript. This paper is Bordeaux 1 University,UMR-CNRS 5805 EPOC Contribution no 1541.
References
Alcara Ariza, F., Asensi Marfil, A., de Bolos y Capdevilla, O., Costa
Tales, M., Arco Aguilar, M., Diaz Gonzales, T.E., Diez Garretas,
B., Fernandez Prieto, J.A., Fernandez Gonzales, F., Izco Sevillan-
do, J., Loidi Arregui, J., Martinez Parras, J.M., Navarro Andres,
F., Ninot I Sugranes, J.M., Peinado Lorca, M., Rivas Martinez, S.,
Sanchez Mata, D., Valle Guitierrez, C., Vigo I Bonada, J.,
Wildpret de la Torre, W., 1987. La vegetacion de Espana.
Collection Aula Abierta. Universidad de Alcala de Henares, 544pp.
Atlas Nacional de Espana, C., 1992. Ministerio de Obras Publicas y
Transportes, Direccion General del Instituto Geografico Nacional,
Madrid.
Atlas Nacional de Espana, H., 1993. Ministerio de Obras Publicas,
Transportes y Medio Ambiente, Direccion General del Instituto
Geografico Nacional, Madrid.
Bassinot, F.C., Labeyrie, J.D., Vincent, E., Quidelleur, X., Shackleton,
N.J., Lancelot, Y., 1994. The astronomical theory of climate and
the age of the Brunhes-Matuyama magnetic reversal. Earth and
Planetary Science Letters 126, 91–108.
Bauch, H.A., Erlenkeuser, H., Helmke, J.P., Struck, U., 2000. A
paleoclimatic evaluation of Marine Oxygen Isotope Stage 11 in the
high-northern Atlantic (Nordic seas). Global and Planetary
Change 24, 27–39.
Berger, A.L., 1978. Long-term variations of daily insolation and
Quaternary climatic changes. Journal of the Atmospheric Sciences
35 (12), 2362–2367.
Bond, G., Showers, W., Cheseby, M., Lotti, R., Almasi, P.,
deMenocal, P., Priore, P., Cullen, H., Hajdas, I., Bonani, G.,
1997. A pervasive millennial-scale cycle in North Atlantic Holocene
and Glacial Climates. Science 278, 1257–1266.
Cheddadi, R., 1988. Reconstitution paleoclimatique en Mediterranee
orientale depuis 70.000 ans. In: di Castri, F., Floret, C., Rambal,
S., Roy, J. (Eds.), Time Scales and Water Stress—Proceedings of
the Fifth International Conference on Mediterranean Ecosystems.
I.U.B.S., Paris.
Chmura, G.L., Eisma, D., 1995. A palynological study of surface and
suspended sediments on a tidal flat: implications for pollen
transport and deposition in coastal waters. Marine Geology 128,
183–200.
Chmura, G.L., Smirnov, A., Campbell, I.D., 1999. Pollen transport
through distributaries and depositional patterns in coastal waters.
Palaeogeography, Palaeoclimatology, Palaeoecology 149, 257–270.
Crucifix, M., Loutre, M.F., 2002. Transient simulations over the last
interglacial period (126-115 kyr BP): feedback and forcing analysis.
Climate Dynamics 19, 417–433.
de Beaulieu, J.-L., Andrieu-Ponel, V., Reille, M., Gruger, E., Tzedakis,
C., Svobodova, H., 2001. An attempt at correlation between the
Velay pollen sequence and the Middle Pleistocene stratigraphy
from central Europe. Quaternary Science Reviews 20, 1593–1602.
de Noblet, N.I., Prentice, I.C., Joussaume, S., Texier, D., Botta, A.,
Haxeltine, A., 1996. Possible role of atmosphere–biosphere
interactions in triggering the last glaciation. Geophysical Research
Letters 23 (22), 3191–3194.
de Vernal, A., Henry, M., Bilodeau, G., 1996. Techniques de
preparation et d’analyse en micropaleontologie. Les Cahiers du
GEOTOP 3, 16–27.
Dias, J.M.A., Jouanneau, J.M., Gonzalez, R., Araujo, M.F., Drago,
T., Garcia, C., Oliveira, A., Rodrigues, A., Vitorino, J., Weber, O.,
2002. Present-day sedimentary processes on the northern Iberian
shelf. Progress in Oceanography 52, 249–259.
Droxler, A.W., Farrell, J.W., 2000. Marine Isotope Stage (MIS 11):
new insights for a warm future. Global and Planetary Change 24,
1–5.
Duplessy, J.-C., Shackleton, N.J., Matthews, R.K., Prell, W., Ruddi-
man, W.F., Caralp, M., Hendy, C.H., 1984. 13C record of benthic
foraminifera in the last interglacial ocean: implication for carbon
cycle and the global deep water circulation. Quaternary Research
21, 225–243.
Dupont, L., Wyputta, U., 2003. Reconstructing pathways of aeolian
pollen transport to the marine sediments along the coastline of SW
Africa. Quaternary Science Reviews 22, 157–174.
EPICA community members (Augustin, L., Barbante, C., Barnes,
P.R.F., Barnola, J.M., Bigler, M., Castellano, E., Cattani, O.,
Chappellaz, J., Dahl-Jensen, D., Delmonte, B., Dreyfus, G.,
Durand, G., Falourd, S., Fisher, H., Fluckiger, J., Hansson,
M.E., Huybrechts, P., Jugie, G., Johnsen, S.J., Jouzel, J.,
Kaufmann, P., Kipfstuhl, J., Lambert, F., Lipenkov, V.Y., Littot,
G.C., Longinelli, A., Lorrain, R., Maggi, V., Masson-Delmotte, V.,
Miller, H., Mulvaney, R., Oerlemans, J., Oerter, H., Orombelli, G.,
Parrenin, F., Peel, D.A., Petit, J.-R., Raynaud, D., Ritz, C., Ruth,
U., Schwander, J., Siegenthaler, U., Souchez, R., Stauffer, B.,
Steffensen, J.P., Stenni, B., Stocker, T.F., Tabacco, I.E., Udisti, R.,
Van De Wal, R.S.W., Van Den Broeke, M., Weiss, J., Wilhelms,
F., Winthers, J.-G., Wolff, E.W., Zucchelli, M.), 2004. Eight glacial
cycles from an Antarctic ice core. Nature 429, 623–628.
Erd, K., 1970. Pollen-analytical classification of the Middle Pleistocene
in the German Democratic Republic. Palaeogeography, Palaeocli-
matology, Palaeoecology 8, 129–145.
Geyh, M.A., Henning, G., Oezen, D., 1997. U/Th datierung
interglazialer und interstadialer niedermoor-torfe und lignite—
Stand und Zukunft. In: Freund, H., Caspers, G. (Eds.), Vegetation
und palaoklima der Weichsel-Kaltzeit im nordlichen Mitteleuropa
ergenisse palaobotanischer, -faunistischer und geologischer unter-
suchungen. Schriftenreihe der Deutschen Geologischen Ge-
sellschaft, Hannover, pp. 187–199.
Geyh, M., Muller, H., Oezen, D., 2003. The absolute age of the
Holsteinian interglacial. In: Sirocko, F., Mangini, A. (Eds.),
DEKLIM-EEM workshop, Heidelberg, Germany, pp. 43–44.

ARTICLE IN PRESSS. Desprat et al. / Quaternary Science Reviews 24 (2005) 1361–1374 1373
Gouzy, A., Malaize, B., Pujol, C., Charlier, K., 2004. Climatic ‘‘pause’’
during Termination II identified in shallow and intermediate waters
off the Iberian margin. Quaternary Science Reviews 23, 1523–1528.
Graham, D.W., Corliss, B.H., Bender, M.L., Keigwin, D., 1981.
Carbon and oxygen disequilibria of recent deep-sea benthic
foraminifera. Marine Micropaleontology 6, 483–497.
Guiot, J., 1990. Methodology of the last climatic cycle reconstruction
from pollen data. Palaeogeography, Palaeoclimatology, Palaeoe-
cology 80, 49–69.
Guiot, J., Beaulieu, D.J.-L., Cheddadi, R., David, F., Ponel, P., Reille,
M., 1993. The climate in Western Europe during the last Glacial/
Interglacial cycle derived from pollen and insect remains.
Palaeogeography, Palaeoclimatology, Palaeoecology 103, 73–93.
Heusser, L., 1978. Spores and pollen in the marine realm. In: Haq,
B.U., Boersma, A. (Eds.), Introduction to Marine Micropaleontol-
ogy. Elsevier, New York, pp. 327–339.
Heusser, L.E., Balsam, W.L., 1977. Pollen distribution in the N.E.
Pacific Ocean. Quaternary Research 7, 45–62.
Hodell, D.A., Charles, C.D., Ninnemann, U.S., 2000. Comparison of
interglacial stages in the South Atlantic sector of the southern
ocean for the past 450 kyr: implications for Marine Isotope Stage
(MIS) 11. Global and Planetary Change 24, 7–26.
Howard, W.R., 1997. A warm future in the past. Nature 388, 418–419.
Imbrie, J., Imbrie, J.Z., 1980. Modelling the climatic response to
orbital variations. Science 207, 943–953.
Imbrie, J., Hays, J.D., Martinson, D.G., McIntyre, A., Mix, A.C.,
Morley, J.J., Pisias, N.G., Prell, W.L., Shackleton, N.J., 1984. The
orbital theory of Pleistocene climate: support from a revised
chronology of the marine d18O: In: Berger, A.L., Imbrie, J., Hays,
J., Kukla, G., Saltzman, B. (Eds.), Milankovitch and Climate. D.
Riedel Publishing Company, Hingham, pp. 269–305.
Jansen, E., Bleil, U., Henrich, R., Kringstad, L., Slettemark, B., 1988.
Paleoenvironmental changes in the Norwegian Sea and the
northeast Atlantic during the last 2.8 m.y.: Deep Sea Drilling
Project/Ocean Drilling Program sites 610, 642, 643 and 644.
Paleoceanography 3 (5), 563–581.
Jouanneau, J.M., Weber, O., Drago, T., Rodrigues, A., Oliveira, A.,
Dias, J.M.A., Garcia, C., Schimdt, S., Reyss, J.L., 2002. Recent
sedimentation and sedimentary budget on the western Iberian
shelf. Progress in Oceanography 52, 261–275.
Karabanov, E., Prokopenko, A., Williams, D., Khursevich, G.,
Kuzmin, M., Bezrukova, E., Gvozdkov, A., 2003. High-resolution
MIS 11 record from the continental sedimentary archive of Lake
Baikal, Siberia. In: Droxler, A.W., Poore, R.Z., Burckle, L.H.
(Eds.), Earth’s climate and orbital eccentricity: the Marine Isotope
Stage 11 question. Geophysical Monograph. American Geophysi-
cal Union, Washington, DC, pp. 223–230.
Karner, D.B., Marra, F., 2003. 40Ar/39Ar dating of glacial Termina-
tion V and the duration of Marine Isotopic Stage 11. In: Droxler,
A.W., Poore, R.Z., Burckle, L.H. (Eds.), Earth’s Climate and
Orbital Eccentricity: the Marine Isotope Stage 11. Geophysical
Monograph. American Geophysical Union, Washington, DC,
pp. 61–66.
Khodri, M., Leclainche, Y., Ramstein, G., Braconnot, P., Marti, O.,
Cortijo, E., 2001. Simulating the amplification of orbital forcing by
ocean feedbacks in the last glaciation. Nature 410, 570–574.
Kuhl, N., Litt, T., 2003. Quantitative time series reconstruction of
Eemian temperature at three European sites using pollen data.
Vegetation History and Archaeobotany 12, 205–214.
Li, X.S., Berger, A., Loutre, M.F., 1998. CO2 and Northern
Hemisphere ice volume variations over the middle and late
Quaternary. Climate Dynamics 14 (7–8), 537–544.
Linke, G., Katzenberger, O., Grun, R., 1985. Description and ESR
dating of the Holsteinian interglaciation. Quaternary Science
Reviews 4, 319–331.
Loutre, M.F., 2003. Clues from MIS 11 to predict the future climate—
a modelling point of view. Earth and Planetary Science Letters 212
(1–2), 213–224.
Loutre, M.F., Berger, A., 2003. Marine Isotope Stage 11 as an
analogue for the present interglacial. Global and Planetary Change
36 (3), 209–217.
McManus, J.F., Oppo, D.W., Cullen, J.L., 1999. A 0.5-million-year
record of millennial-scale climate variability in the North Atlantic.
Science 283, 971–975.
McManus, J.F., Oppo, D.W., Cullen, J.L., 2001. ODP 980 Isotope and
IRD Data. IGBP PAGES/World Data Center A for Paleoclima-
tology. Data Contribution Series #2001-065. NOAA/NGDC
Paleoclimatology Program, Boulder CO, USA.
McManus, J., Oppo, D., Cullen, J., Healey, S., 2003. Marine isotope
stage 11 (MIS 11): analog for Holocene and future climate. In:
Droxler, A.W., Poore, R.Z., Burckle, L.H. (Eds.), Earth’s climate
and orbital eccentricity: the marine isotope stage 11 question.
Geophysical Monograph. American Geophysical Union, Washing-
ton DC, pp. 69–85.
Muller, J., 1959. Palynology of recent Orinoco delta and shelf
sediments. Micropaleontology 5, 1–32.
Oppo, D.W., McManus, J.F., Cullen, J.L., 1998. Abrupt climate
events 500,000 to 340,000 years ago: evidence from subpolar North
Atlantic sediments. Science 279, 1335–1338.
Oppo, D.W., et al., 2003. ODP 980 Subpolar North Atlantic
Foraminifer and IRD Data, 500-340 KYrBP, IGBP PAGES/
World Data Center for Paleoclimatology. Data Contribution Series
# 2003-008. NOAA/NGDC Paleoclimatology Program, Boulder
CO, USA.
Ozenda, P., 1982. Les vegetaux dans la biosphere. Doin, Paris 431pp.
Petit, J.R., Jouzel, J., Raynaud, D., Barkov, N.I., Barnola, J.-M.,
Basile, I., Bender, M., Chappellaz, J., Davis, M., Delaygue, G.,
Delmotte, M., Kotyakov, V.M., Legrand, M., Lipenkov, V.Y.,
Lorius, C., Pepin, L., Ritz, C., Saltzman, E., Stievenard, M., 1999.
Climate and atmospheric history of the past 420,000 years from the
Vostok ice core, Antarctica. Nature 399, 429–436.
Poli, M.S., Thunell, R.C., Rio, D., 2000. Millennial-scale changes in
the North Atlantic Deep Water circulation during Marine Isotope
Stages 11 and 12: linkage to Antarctic climate. Geology 28 (9),
807–810.
Prentice, I.C., Sykes, M.T., Lautenschlager, M., Harrison, S.P.,
Denissenko, O., Bartlein, P., 1993. Modelling global vegetation
patterns and terrestrial carbon storage at the last glacial maximum.
Global Ecology and Biogeography Letters 3, 67–76.
Raynaud, D., Loutre, M.F., Ritz, C., Chapellaz, J., Barnola, J.-M.,
Jouzel, J., Lipenkov, V.Y., Petit, J.-R., Vimeux, F., 2003. Marine
Isotope Stage (MIS) 11 in the Vostok ice core: CO2 forcing and
stability of East Antarctica. In: Droxler, A.W., Poore, R.Z.,
Burckle, L.H. (Eds.), Earth’s Climate and Orbital Eccentricity: the
Marine Isotope Stage 11. Geophysical Monograph. American
Geophysical Union, Washington, DC, pp. 27–40.
Reille, M., Guiot, J., de Beaulieu, J.-L., 1992. The Montaigu event: an
abrupt climatic change during the early wurm in Europe. In:
Kukla, G.J., Went, E. (Eds.), Start of a Glacial. NATO ASI Series.
Springer-Verlag, Berlin Heidelberg, pp. 85–95.
Reille, M., de Beaulieu, J.-L., Svobodova, V., Andrieu-Ponel, V.,
Goeury, C., 2000. Pollen analytical biostratigraphy of the last five
climatic cycles from a long continental sequence from the Velay
region (Massif Central, France). Journal of Quaternary Science 15
(7), 665–685.
Rousseau, D.-D., 1999. The continental record of Stage 11. In:
Poore, R.Z., Burckle, L., Droxler, A., McNulty, W.E. (Eds.),
Marine Oxygen Isotope Stage 11 and Associated Terrestrial
Records. US Department of the Interior, US Geological Survey,
pp. 59–72.

ARTICLE IN PRESSS. Desprat et al. / Quaternary Science Reviews 24 (2005) 1361–13741374
Rowe, P.J., Richards, D.A., Atkinson, T.C., Bottrell, S.H., Cliff, R.A.,
1997. Geochemistry and radiometric dating of a Middle Pleistocene
peat. Geochimica et Cosmochimica Acta 61 (19), 4201–4211.
Ruddiman, W.F. Cold climate during the closest Stage 11 analog to
recent Millennia. Quaternary Science Reviews 24, 1111–1121.
Sanchez Goni, M.F., Eynaud, F., Turon, J.-L., Shackleton, N.J., 1999.
High resolution palynological record off the Iberian margin: direct
land–sea correlation for the Last Interglacial complex. Earth and
Planetary Science Letters 171, 123–137.
Sanchez Goni, M.F., Loutre M.F., Crucifix, M., Peyron, O., Santos,
L., Duprat, J., Malaize, B., Turon, J.-L., Peypouquet, J.-P.
Increasing vegetation and climate gradient in Western Europe
over the Last Glacial Inception (122–110 ka): models-data compar-
ison. Earth and Planetary Science Letters 231, 111–130.
Sarnthein, M., Stremme, H.E., Mangini, A., 1986. The Holstein
interglaciation: time-stratigraphic position and correlation to stable
isotope stratigraphy of deep-sea sediments. Quaternary Research
26, 283–298.
Shackleton, N.J., Opdyke, N.D., 1973. Oxygen isotope and paleo-
magnetic stratigraphy of Equatorial Pacific core V28-238: oxygen
isotope temperatures and ice volumes on a 105 year and 106 year
scale. Quaternary Research 3, 39–55.
Shackleton, N.J., Berger, A., Peltier, W.R., 1990. An alternative
astronomical calibration of the lower Pleistocene timescale based
on ODP Site 677. Transactions of the Royal Society of Edinburgh:
Earth Sciences 81, 251–261.
Turner, C., 2002. Formal status and vegetational development of the
Eemian interglacial in Northwestern and Southwestern Europe.
Quaternary Research 58, 41–44.
Turon, J.-L., 1984. Le palynoplancton dans l’environnement actuel de
l’Atlantique nord-oriental. Evolution climatique et hydrologique
depuis le dernier maximum glaciaire. Memoires de l’Institut de
Geologie du bassin d’Aquitaine 17. Universite de Bordeaux I,
Bordeaux, 313pp.
Tzedakis, P.C., 1994. Vegetation change through glacial-interglacial
cycles: a long pollen sequence perspective. Philosophical Transac-
tions of the Royal Society of London B 345, 403–432.
Tzedakis, P.C., Andrieu, V., de Beaulieu, J.-L., Birks, H.J.B.,
Crowhurst, S., Follieri, M., Hooghiemstra, H., Magri, D., Reille,
M., Sadori, L., Shackleton, N.J., Wijmstra, T.A., 2001. Establish-
ing a terrestrial chronological framework as a basis for bio-
stratigraphical comparisons. Quaternary Science Reviews 20,
1583–1592.
Vitorino, J., 2002. Winter dynamics on the northern Portuguese shelf.
Part 2: bottom boundary layers and sediment dispersal. Progress in
Oceanography 52, 155–170.
Wijmstra, T.A., Smit, A., 1976. Palynology of the middle part
(30–78 m) of the 120 m deep section in Northern Greece
(Macedonia). Acta Botanica Neerlandica 25, 297–312.
Copyright © 2022 FDOKUMEN