Iron Steel and Scrap 2017.pmd - Indian Bureau of Mines
27
9-1 IRON & STEEL AND SCRAP Indian Minerals Yearbook 2017 (Part-II : Metals & Alloys) 56 th Edition IRON & STEEL AND SCRAP (ADVANCE RELEASE) GOVERNMENT OF INDIA MINISTRY OF MINES INDIAN BUREAU OF MINES Indira Bhavan, Civil Lines, NAGPUR – 440 001 PHONE/FAX NO. (0712) 2565471 PBX : (0712) 2562649, 2560544, 2560648 E-MAIL : [email protected] Website: www.ibm.gov.in March, 2018
-
Upload
khangminh22 -
Category
Documents
-
view
0 -
download
0
Transcript of Iron Steel and Scrap 2017.pmd - Indian Bureau of Mines
9-1
IRON & STEEL AND SCRAP
Indian Minerals Yearbook 2017 (Part-II : Metals & Alloys)
56th
Edition
IRON & STEEL AND SCRAP
(ADVANCE RELEASE)
GOVERNMENT OF INDIA
MINISTRY OF MINES INDIAN BUREAU OF MINES
Indira Bhavan, Civil Lines,
NAGPUR – 440 001
PHONE/FAX NO. (0712) 2565471
PBX : (0712) 2562649, 2560544, 2560648
E-MAIL : [email protected] Website: www.ibm.gov.in
March, 2018
9-2
IRON & STEEL AND SCRAP
9 Iron & Steel and Scrap
Iron & steel is decidedly the vital component of
a count ry ' s economy and i s cons idered
amongst the driving force of modernisation.
The level of per capita consumption of steel is
treated as one of the important indicators of
soc io-economic deve lopment and l iv ing
standards in any country. Steel continues to
be the foremost of engineering materials, which
not only is environment-friendly but also is
recyclable.
The finished steel production in India has
grown from a mere 1.1 million tonnes in 1951 to
101.80 million tonnes in 2016-17. The contribution of
non-alloy steel segment stood at 91.70 million
tonnes, while the rest was contributed by alloy steel.
The growth in the Steel Sector in the early decades
after independence was mainly in the Public Sector
units. However, following the adoption of new
economic policy and subsequent deregulation and
decontrol of Indian Iron & Steel Sector, the 1990s
witnessed accelerated growth in the Private Sector,
catapulting its share of steel production from 45%
in 1992-93 to 85.40% in 2016-17.
Steel exports from India began in 1964. Exports
in the first five years were mainly as a result of
low demand in the domestic Iron and Steel market.
Exports subsequently declined due to revival of
domestic demand. India once again started
exporting steel in 1975 which subsequently
registered a slump due to rising domestic demand.
Post liberalisation, a rejuvenation in the Steel
Sector resulted in large-scale exports of iron and
steel. In 2016-17, India's finished steel exports &
imports were at 8.24 & 7.23 million tonnes,
respectively. Though the country's production
of iron & steel is sufficient to meet the domestic
demand, it imports mainly finished/semi-finished
steel and iron & steel (scrap) to meet specific
requirements and supply of essential grades.
Liberalisation of the Indian Steel SectorThe Government's new economic policies
have opened up opportunities for expansion of
the Steel Industry. With a view to accelerating
growth in the Steel Sector, the Government since
1991 has been initiating and implementing a
number of policy measures. These measures have
impacted the Indian Steel Sector positively in
terms of modernisation and growth.
NATIONAL STEEL POLICY
The New National Steel Policy-2017 has been
approved on 03 .05 .2017 and some of the
Highlights of the National Steel Policy 2017 are
enumerated below:
1. The Indian steel sector has grown rapidly
over the past few years and presently it is the
third largest steel producer globally, contributing
to about 2% of the country’s GDP. India has also
crossed 100 MT mark for production for sale in
2016-17.
2. The New Steel Policy, 2017 aspires to
achieve 300MT of steel making capacity by 2030.
This would translate into additional investment
of ̀ 10 lakh crore by 2030-31.
3. The Policy seeks to increase consumption
of s teel and the major segments that could
influence the consumpion are Infrastructure,
Automobiles and Housing. New Steel Policy seeks
to increase per capita steel consumption to the
level of 160 kg by 2030 from the existing level of
around 60 kg.
4. Potential of MSME Steel Sector has been
recognised. Policy stipulates encouragement and
adoption of energy efficient technologies in the
MSME Steel Sector to improve the overal l
productivity and reduce energy intensity.
5. Steel Ministry will facilitate R&D in the
Sec tor th rough the es tab l i shment o f S tee l
Research and Technology Mission of India
(SRTMI). The initiative is aimed to spearhead R&D
of national importance in Iron & Steel Sector
utilising tripartite synergy amongst Industry,
na t iona l R&D labora tor ies and academic
institutions.

9-3
IRON & STEEL AND SCRAP
6. Ministry through policy measures will
ensure availability of raw materials like iron ore,
coking coal and non-coking coal, natural gas etc.
at competitive rates.
7. With the roll out of the National Steel
Policy-2017, it is envisaged that the Industry will
be s tee red in c rea t ing an envi ronment for
promoting domestic steel and thereby ensuring a
scenario where production meets the anticipated
pace of growth in consumpt ion , through a
technolog ica l ly advanced and g loba l ly
competitive Steel Industry. This will be facilitated
by Ministry of Steel, in coordination with relevant
Ministries, as may be required.
The principal objectives that the National
Steel Policy 2017 aims to achieve are the following:
a) Build a globally competitive industry with
a crude steel capacity of 300 MT by
2030-31.
b) Increase per Capita Steel Consumption to
160 kg by 2030-31.
c) To domestically meet entire demand of
high-grade automotive steel, electrical
s tee l , spec ia l s t ee l s and a l loys fo r
strategic applications by 2030-31.
d) Increase domestic availability of washed
coking coa l so as to reduce impor t
dependence on coking coal to 50% by
2030-31.
e) To be net exporter of steel by 2025-26.
f) Encourage industry to be a world leader
on energy and raw material efficient steel
production by 2030-31, in a safe and
sustainable manner.
g) Develop and implement quality standards
for domestic steel products.
Expected impact/outcome of NSP 2017
(a) India to be world leader in energy effici-
ency and sustainability.
(b) Cost-effective and quality steel destina-
tion.
(c) Attain global standards in Industrial Safety
& Health.
(d) Substantially reduce the carbon foot-print
of the industry.
(e) Domestically meet the entire demand of
high grade.
STRUCTURE AND ROLE OFINDIAN STEEL INDUSTRY
India is currently the 3 rd largest producer of
crude steel in the world. Earlier, as per the
Notifications released by Ministry of Steel dated
12.12.2013 and 24.04.2015, a steel plant had been
c lass i f i ed on the bas i s o f p rocess rou te /
technology adopted and on the basis of size/
capacity. The classification was Primary steel
producers, Integrated steel producers, Secondary
steel producers and Other s tee l producers .
Subsequently, the guidelines for classification
have been rev ised v ide Not i f ica t ion da ted
12.05.2016, and as per the latest classification,
steel producers with their registered off ice
addresses will be listed plant-wise & location-wise
in accordance with the crude steel production
capacity. The earlier classification along with
process route adopted for iron/steel making as
'Integrated steel plants', 'Primary steel producers'
'Secondary steel producers', 'Main producers',
'Major producers ' and 'Others ' s tands to be
withdrawn as per the latest notification.
In 2016-17, the production of pig iron was 9.97
million tonnes and the percentage share of Private
Sector (excluding SAIL) was about 96%.
In the year 2016-17, the production of sponge
iron was 28.76 million tonnes. The production of
crude steel was 97.94 million tonnes and finished
steel was 101.80 million tonnes.
The Secondary Steel Sector const i tutes
Electric Arc Furnace/Induction Furnace, pig iron/
sponge iron units, re-rolling units, HR units, CR
units, galvanised/colour coated units, tin plate
units, wire-drawing units, etc. for producing either
semi-finished or finished steel.

9-4
IRON & STEEL AND SCRAP
The important iron & steel units in India are
Steel Authority of India, Rashtriya Ispat Nigam
Ltd, Tata Steel, Essar Steel, JSW Steel, Jindal Steel
& Power Ltd, Bhushan Steel Ltd and Bhushan
Power & Steel Ltd as well as large number of Mini
Steel Plants based on Electric Furnaces & Energy
Optimising Furnaces (EOF). Besides the steel
producing units, there are a large number of
Sponge Iron Plants, Mini Blast Furnace units, Hot
& Cold Rolling Mills & Galvanising/Colour
Coating units which are spread across the country.
The structure of the Indian Steel Industry in
2016-17 is furnished in Table-1. Production of iron
& steel, crude steel, pig iron and finished steel
for sale (alloy/ non-alloy) by SAIL, TSL, RINL,
ESL, JSWL, JSPL and other producers along with
production of crude steel from oxygen route,
electric arc furnance route and induction furnance
route during the year 2012-13 to 2016-17 have been
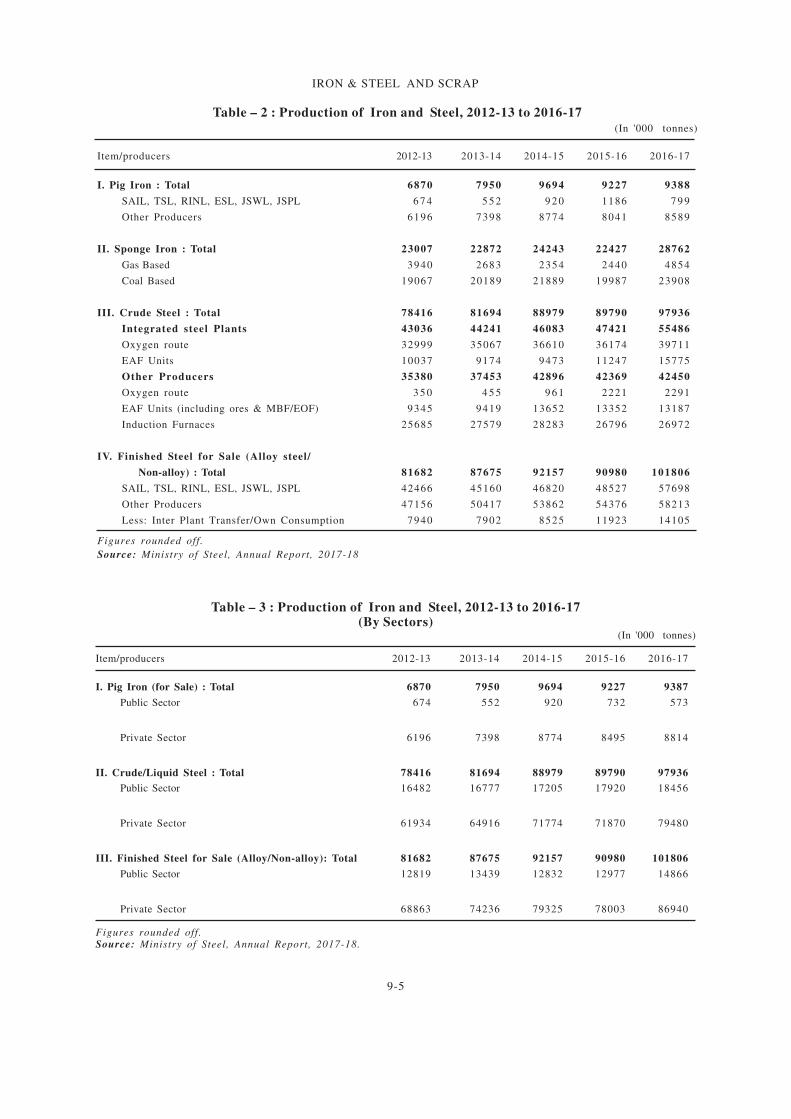
reflected in Table-2. Also, the production of
sponge iron through gas-based & coal-based
units during the year 2012-13 to 2016-17 is also
provided in Table-2. The production of iron &
Steel by Public and Private Sectors during
2012-13 to 2016-17 is furnished in Table-3. The
details on plant-wise capacity and production of
hot metal and crude/liquid steel are listed out in
Table-4. Table-5 elucidates the production of
crude/liquid steel by BOF and EAF/IF routes.
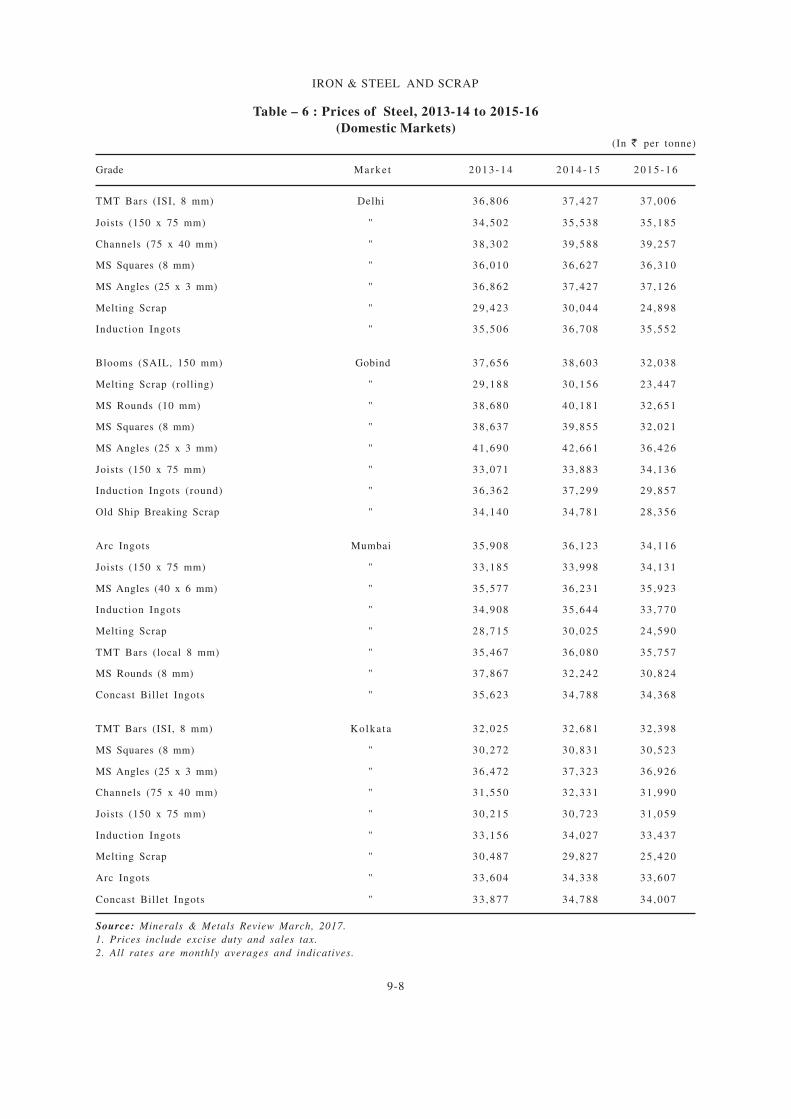
Prices of steel are provided in Table-6.
Table – 1 : Structure of the Indian Steel Industry, 2016-17
(Capacity/Production: In million tonnes)
ProductionSector Type of units Total
Annual 2015-16 2016-17 (P) capacity
Crude Steel SAIL, TSL, RINL, ESL, JSWL, JSPL 67.77 47.42 55.49
Other Producers 60.51 40.37 42.45
Public Sector 23.82 17.92 18.46
Private Sector 104.46 71.87 79.48
Pig iron/ Hot Metal 42.51 9.221
9.391
Sponge Iron 48.63 22.43 28.76
Non-Flat Products NA 41.91 44.01
Flat Products NA 40.81 49.34
Total finished steel (Non-alloy) NA 82.72 93.35
Total finished steel (Alloy/Stainless) NA 8.26 8.45
Total finished steel (Alloy+Non alloy) NA 90.98 101.80
Source: Ministry of Steel, Annual Report, 2016-17 & 2017-18.1 Production for sale only
9-5
IRON & STEEL AND SCRAP
Table – 3 : Production of Iron and Steel, 2012-13 to 2016-17(By Sectors)
(In '000 tonnes)
Item/producers 2012-13 2013-14 2014-15 2015-16 2016-17
I. Pig Iron (for Sale) : Total 6870 7950 9694 9227 9387
Public Sector 674 552 920 732 573
Private Sector 6196 7398 8774 8495 8814
II. Crude/Liquid Steel : Total 78416 81694 88979 89790 97936
Public Sector 16482 16777 17205 17920 18456
Private Sector 61934 64916 71774 71870 79480
III. Finished Steel for Sale (Alloy/Non-alloy): Total 81682 87675 92157 90980 101806
Public Sector 12819 13439 12832 12977 14866
Private Sector 68863 74236 79325 78003 86940
Figures rounded off.Source: Ministry of Steel, Annual Report, 2017-18.
Table – 2 : Production of Iron and Steel, 2012-13 to 2016-17
(In '000 tonnes)
Item/producers 2012-13 2013-14 2014-15 2015-16 2016-17
I. Pig Iron : Total 6870 7950 9694 9227 9388
SAIL, TSL, RINL, ESL, JSWL, JSPL 6 7 4 5 5 2 9 2 0 1186 7 9 9
Other Producers 6196 7398 8774 8041 8589
II. Sponge Iron : Total 23007 22872 24243 22427 28762
Gas Based 3940 2683 2354 2440 4854
Coal Based 19067 20189 21889 19987 23908
III. Crude Steel : Total 78416 81694 88979 89790 97936
Integrated steel Plants 43036 44241 46083 47421 55486
Oxygen route 32999 35067 36610 36174 39711
EAF Units 10037 9174 9473 11247 15775
Other Producers 35380 37453 42896 42369 42450
Oxygen route 3 5 0 4 5 5 9 6 1 2221 2291
EAF Units (including ores & MBF/EOF) 9345 9419 13652 13352 13187
Induction Furnaces 25685 27579 28283 26796 26972
IV. Finished Steel for Sale (Alloy steel/
Non-alloy) : Total 81682 87675 92157 90980 101806
SAIL, TSL, RINL, ESL, JSWL, JSPL 42466 45160 46820 48527 57698
Other Producers 47156 50417 53862 54376 58213
Less: Inter Plant Transfer/Own Consumption 7940 7902 8525 11923 14105
Figures rounded off.
Source: Ministry of Steel, Annual Report, 2017-18

9-6
IRON & STEEL AND SCRAP
Table – 4 : Capacity and Production of Hot Metal and Crude/Liquid Steel, 2015-16 and 2016-17
(By Principal Producers)(In '000 tonnes)
Annual installed capacity Production
Hot metal Crude/Liquid Hot metal Crude/Liquid steel
Unit steel
2015-16 2016-17 2015-16 2016-17
Public Sector
Bokaro Steel Plant (Jharkhand) 4585 4360 3700 3410 3392 3154
Bhilai Steel Plant (Chhattisgarh) 4700 3925 5317 5041 5058 4737
Rourkela Steel Plant (Odisha) 2120 4400 3042 3094 2730 2932
Durgapur Steel Plant (West Bengal) 2088 1802 2170 2318 1975 2042
IISCO Steel Plant, Burnpur (West Bengal) 550 2500 1431 1810 871 1394
Visvesvaraya Iron & Steel Plant (Karnataka) 205 118 60 54 42 39
Salem Steel Plant (Tamil Nadu) – 180 _ _ 120 108
Alloy Steel Plant, Durgapur (West Bengal) – 234 _ _ 91 88
Rashtriya Ispat Nigam Ltd (Andhra Pradesh) 3400 6300 3975 4043 3641 3962
Private Sector
JSW Steel Ltd (Karnataka) _ 10000 _ _ 8385 9655
Tata Steel Ltd (Jharkhand) _ 12500 10655 13059 9960 11688
JSW Ispat Steel Ltd /JSW Steel Ltd (Maharashtra) _ 5000 _ _ 4294 6851
Essar Steel Ltd (Gujarat) _ 10000 - - 3685 5391
Jindal Steel & Power Ltd (Chhattisgarh) 1670 8600 _ _ 3177 3445
Jindal Stainless Ltd – 1800 _ _ 1258 1391
Bhushan Steel Ltd – 5600 – _ 3078 5601
Bhushan Power & Steel Ltd (Odisha) – 2500 – _ 1832 3324
Figures rounded off.
Source: Ministry of Steel, Annual Report, 2017-18.

9-7
IRON & STEEL AND SCRAP
Table – 5 : Production of Crude/Liquid Steel, 2013-14 to 2016-17
(By Route)
( In’000 tonnes)
Route/plant 2013-14 2014-15 2015-16 2016-17
All Routes: (A+B) Total 81694 88979 89790 97936
A. Oxygen Route : Total 35522 37571 38395 42002
Bhilai Steel Plant (Chhattisgarh) 5 1 3 6 4 8 0 7 5 0 5 8 4 7 3 7
Durgapur Steel Plant (West Bengal) 2 0 1 9 2 0 6 3 1 9 7 5 2 0 4 2
Rourkela Steel Plant (Odisha) 2 2 9 1 2 7 9 2 2 7 3 0 2 9 3 2
Bokaro Steel Plant (Jharkhand) 3 7 7 6 3 8 3 1 3 3 9 2 3 1 5 4
IISCO Steel Plant (West Bengal) 1 2 7 1 4 1 8 7 1 1 3 9 4
Salem Steel Plant (Tamil Nadu) 9 1 1 2 5 1 2 0 1 0 8
Visvesvaraya Iron & Steel Ltd (Karnataka) 1 3 4 6 4 2 3 9
Visakhapatnam Steel Plant (RINL, Andhra Pradesh) 3 2 0 2 3 2 9 6 3 6 4 1 3 9 6 2
Tata Steel Ltd (Jharkhand) 9 1 5 5 9 3 3 1 9 9 6 0 11688
JSW Steel Ltd (Karnataka) 9 2 5 7 10178 8 3 8 5 9 6 5 5
Other Oxygen Route 4 5 5 9 6 1 2 2 2 1 2 2 9 1
B. Electric Route: Total 46172 51408 51395 55934
Electric Arc Furnace 18593 23125 24599 28962
Alloy Steel Plant, Durgapur (West Bengal) 1 2 2 1 0 4 9 1 8 8
Essar Steel Ltd (Gujarat) 3 2 4 5 2 8 5 4 3 6 8 5 5 3 9 1
JSW Ispat Steel Ltd//JSW Steel Ltd (Maharashtra) 2 9 7 1 2 9 5 8 4 2 9 4 6 8 5 1
Jindal Steel & Power Ltd (Chhattisgarh) 2 8 3 6 3 5 5 7 3 1 7 7 3 4 4 5
Lloyds Steel Ltd 5 6 6 6 5 8 5 6 9 5 7 5
Jindal Stainless Ltd 1 1 1 1 1 9 0 7 1 2 5 8 1 3 9 1
Bhushan Steel Ltd 1 0 8 4 2 1 8 0 3 0 7 8 5 6 0 1
Bhushan Power & Steel Ltd (Odisha) 1 7 1 4 1 2 1 3 1 8 3 2 3 3 2 4
Other Electric Arc Furnace Route 4 9 4 4 7 6 9 4 6 6 1 5 2 2 9 6
Electric Induction Furnace 27579 28283 26796 26972
Figures rounded off.
Source: Ministry of Steel, Annual Report, 2017-18.
9-8
IRON & STEEL AND SCRAP
Table – 6 : Prices of Steel, 2013-14 to 2015-16
(Domestic Markets)(In ` per tonne)
Grade Marke t 2 0 1 3 - 1 4 2 0 1 4 - 1 5 2 0 1 5 - 1 6
TMT Bars (ISI, 8 mm) Delhi 36 ,806 37 ,427 37 ,006
Joists (150 x 75 mm) " 34 ,502 35 ,538 35 ,185
Channels (75 x 40 mm) " 38 ,302 39 ,588 39 ,257
MS Squares (8 mm) " 36 ,010 36 ,627 36 ,310
MS Angles (25 x 3 mm) " 36 ,862 37 ,427 37 ,126
Melting Scrap " 29 ,423 30 ,044 24 ,898
Induction Ingots " 35 ,506 36 ,708 35 ,552
Blooms (SAIL, 150 mm) Gobind 37 ,656 38 ,603 32 ,038
Melting Scrap (rolling) " 29 ,188 30 ,156 23 ,447
MS Rounds (10 mm) " 38 ,680 40 ,181 32 ,651
MS Squares (8 mm) " 38 ,637 39 ,855 32 ,021
MS Angles (25 x 3 mm) " 41 ,690 42 ,661 36 ,426
Joists (150 x 75 mm) " 33 ,071 33 ,883 34 ,136
Induction Ingots (round) " 36 ,362 37 ,299 29 ,857
Old Ship Breaking Scrap " 34 ,140 34 ,781 28 ,356
Arc Ingots Mumbai 35 ,908 36 ,123 34 ,116
Joists (150 x 75 mm) " 33 ,185 33 ,998 34 ,131
MS Angles (40 x 6 mm) " 35 ,577 36 ,231 35 ,923
Induction Ingots " 34 ,908 35 ,644 33 ,770
Melting Scrap " 28 ,715 30 ,025 24 ,590
TMT Bars (local 8 mm) " 35 ,467 36 ,080 35 ,757
MS Rounds (8 mm) " 37 ,867 32 ,242 30 ,824
Concast Billet Ingots " 35 ,623 34 ,788 34 ,368
TMT Bars (ISI, 8 mm) Kolka ta 32 ,025 32 ,681 32 ,398
MS Squares (8 mm) " 30 ,272 30 ,831 30 ,523
MS Angles (25 x 3 mm) " 36 ,472 37 ,323 36 ,926
Channels (75 x 40 mm) " 31 ,550 32 ,331 31 ,990
Joists (150 x 75 mm) " 30 ,215 30 ,723 31 ,059
Induction Ingots " 33 ,156 34 ,027 33 ,437
Melting Scrap " 30 ,487 29 ,827 25 ,420
Arc Ingots " 33 ,604 34 ,338 33 ,607
Concast Billet Ingots " 33 ,877 34 ,788 34 ,007
Source: Minerals & Metals Review March, 2017.
1. Prices include excise duty and sales tax.
2. All rates are monthly averages and indicatives.

9-9
IRON & STEEL AND SCRAP
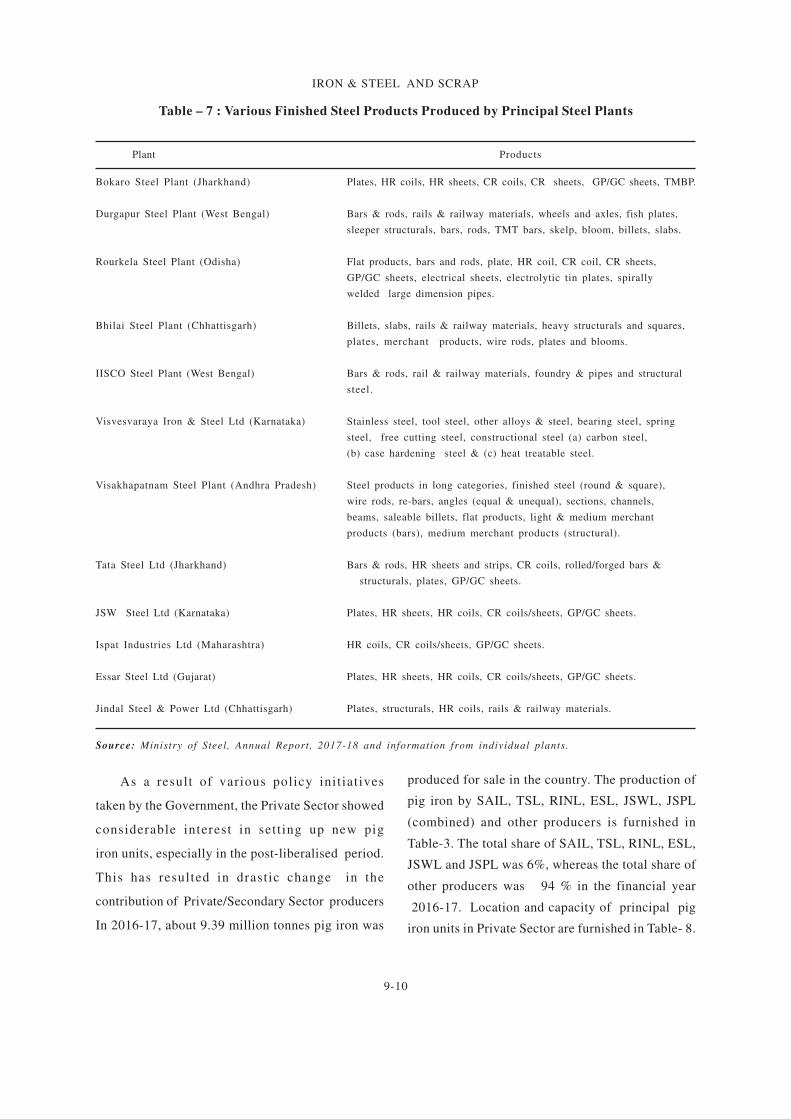
Finished Steel/Crude SteelThe Indian Steel Industry continued to record
increased production of Finished Steel from87.67 million tonnes in 2013-14 to 101.80 milliontonnes in 2016-17. Finished Steel produced bythe SAIL, TSL, RINL, ESL, JSWL, JSPL was 57.70million tonnes while that produced by OtherProducers was 58.21 million tonnes (including14.10 million tonnes for IPT/own consumption) inthe year 2016-17. The import and export of totalFinished Steel stood at 7.23 million tonnes and8.24 million tonnes respectively in the year 2016-17. Various Finished Steel products produced byprincipal steel plants are furnished in Table-7.
Crude Steel production has shown a sustainedrise in last five years along with capacity. TheCrude Steel working Capacity and CapacityUtilisation during the last five years is given
below:
Production of Crude Steel grew at a CAGR of5.71% from 78.42 million tonnes in 2012-13 to 97.94mi l l ion tonnes in 2016-17 . In the year2016-17, the production of Crude Steel was mainlyBasic Oxygen Furnace Route (42 million tonnes),Electric Arc Furace Route (28.96 millin tonnes) andInduction Furnace Route (26.97 million tonnes) inthe country. The contribution of public andprivate sector was 18.46 million tonnes and 79.48million tonnes, respectively.
Blast Furnace /Bas ic Oxygen Furnace(BF/BOF)
Presently, there are around 58 Blast Furnaceand 17 Basic Oxygen Furnace units with aninstalled capacity of 79.91 million tonnes and 50.85mi l l ion tonnes , respec t ive ly. The repor tedproduction of crude steel by BF/BOF route wasabout 42 million tonnes.
Electric Arc Furnace (including corex & MBF/EOF)Steel produced in the Electric Arc Furnace
(including corex & MBF/EOF) is mostly byrecycling of steel scrap using Electric Arc Furnace(EAF). Presently, there are more than 48 EAFbased steel plants that are operational in thecountry with an aggregate working capacity ofaround 37.81 million tonnes per annum. Thereported production of steel ingots/concast billetsby EAF units in 2016-17 was estimated at 28.96million tonnes as against 24.60 million tonnes in2015-16 (Table-5).
The recent developments in EAF technology,viz, to increase oxygen consumption, to reducepower consumption and to reduce tap time haveled to increase in meta l p roduc t ion . Thedevelopment of thin slab casting has made EAFroute more productive. This route enables slabstrips rolling at lesser cost, facilitating productionof cheaper strips/sheets than those that can beachieved through BF/BOF route.
Induction Furnace (IF)
Presently, in India, EAF based industries areyet to switch over to induction furnace route. Aninduction furnace is an electrical furnace in whichheat is generated through electro-magnet icinduction in an electrically conductive medium.Induc t ion fu rnaces use s tee l mel t ingscraps, sponge iron and pig iron/cast iron. Onan average, the proportion of these items is40% sponge iron + 10% cast iron or pig ironand the remaining is steel melting scraps. Thereare ground induction furnaces with an aggregateworking capacity of 39.62 million tonnes. Theseunits reported production of about 26.97 milliontonnes steel in 2016-17 as against production of26.80 million tonnes in 2015-16.
Pig Iron
Pig iron is one of the basic raw materialsrequired by the Foundry & Casting Industry formanufacturing various types of castings for theengineering section. The main sources of pig ironhave traditionally been the integrated steel plantsof SAIL besides plants of Tata Steel Ltd andRashtriya Ispat Nigam Ltd. Domestic productionof pig iron lags behind and is not in tandem withthe demand. Efforts were, therefore, made toincrease pig iron manufacturing facilities in thesecondary sector.
Production o Crude Steel and WorkingCapacity from 2012-13 to 2016-17
Year Working Production %Utilisation
capacity
2012-13 97.024 78.42 81%
2013-14 102.26 81.69 80%
2014-15 109.85 88.98 81%
2015-16 121.97 89.79 74%
2016-17 128.28 97.94 76%
(Quantity in million tonnes)
9-10
IRON & STEEL AND SCRAP
Table – 7 : Various Finished Steel Products Produced by Principal Steel Plants
Plant Products
Bokaro Steel Plant (Jharkhand) Plates, HR coils, HR sheets, CR coils, CR sheets, GP/GC sheets, TMBP.
Durgapur Steel Plant (West Bengal) Bars & rods, rails & railway materials, wheels and axles, fish plates,
sleeper structurals, bars, rods, TMT bars, skelp, bloom, billets, slabs.
Rourkela Steel Plant (Odisha) Flat products, bars and rods, plate, HR coil, CR coil, CR sheets,
GP/GC sheets, electrical sheets, electrolytic tin plates, spirally
welded large dimension pipes.
Bhilai Steel Plant (Chhattisgarh) Billets, slabs, rails & railway materials, heavy structurals and squares,
plates, merchant products, wire rods, plates and blooms.
IISCO Steel Plant (West Bengal) Bars & rods, rail & railway materials, foundry & pipes and structural
steel.
Visvesvaraya Iron & Steel Ltd (Karnataka) Stainless steel, tool steel, other alloys & steel, bearing steel, spring
steel, free cutting steel, constructional steel (a) carbon steel,
(b) case hardening steel & (c) heat treatable steel.
Visakhapatnam Steel Plant (Andhra Pradesh) Steel products in long categories, finished steel (round & square),
wire rods, re-bars, angles (equal & unequal), sections, channels,
beams, saleable billets, flat products, light & medium merchant
products (bars), medium merchant products (structural).
Tata Steel Ltd (Jharkhand) Bars & rods, HR sheets and strips, CR coils, rolled/forged bars &
structurals, plates, GP/GC sheets.
JSW Steel Ltd (Karnataka) Plates, HR sheets, HR coils, CR coils/sheets, GP/GC sheets.
Ispat Industries Ltd (Maharashtra) HR coils, CR coils/sheets, GP/GC sheets.
Essar Steel Ltd (Gujarat) Plates, HR sheets, HR coils, CR coils/sheets, GP/GC sheets.
Jindal Steel & Power Ltd (Chhattisgarh) Plates, structurals, HR coils, rails & railway materials.
Source: Ministry of Steel, Annual Report, 2017-18 and information from individual plants.
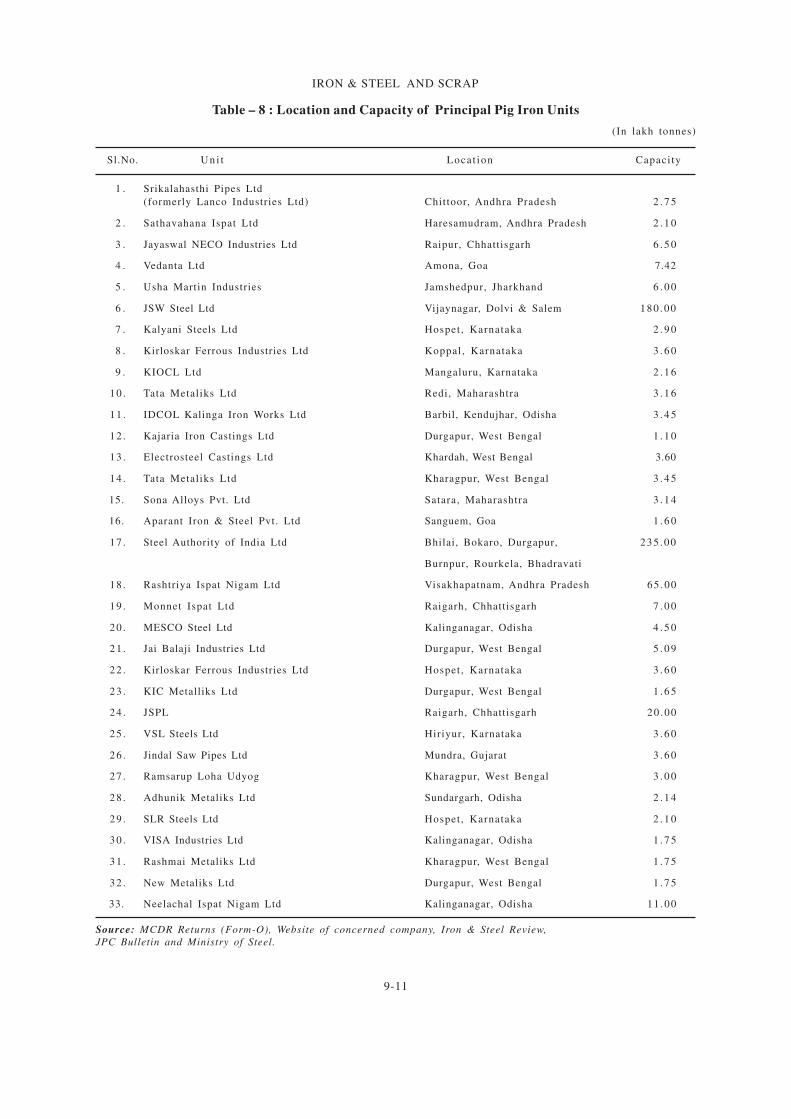
As a result of various policy init iatives
taken by the Government, the Private Sector showed
considerable interest in sett ing up new pig
iron units, especially in the post-liberalised period.
This has resulted in drastic change in the
contribution of Private/Secondary Sector producers
In 2016-17, about 9.39 million tonnes pig iron was
produced for sale in the country. The production of
pig iron by SAIL, TSL, RINL, ESL, JSWL, JSPL
(combined) and other producers is furnished in
Table-3. The total share of SAIL, TSL, RINL, ESL,
JSWL and JSPL was 6%, whereas the total share of
other producers was 94 % in the financial year
2016-17. Location and capacity of principal pig
iron units in Private Sector are furnished in Table- 8.
9-11
IRON & STEEL AND SCRAP
Table – 8 : Location and Capacity of Principal Pig Iron Units
(In lakh tonnes)
Sl.No. U n i t Locat ion Capacity
1 . Srikalahasthi Pipes Ltd
(formerly Lanco Industries Ltd) Chittoor, Andhra Pradesh 2 . 7 5
2 . Sathavahana Ispat Ltd Haresamudram, Andhra Pradesh 2 . 1 0
3 . Jayaswal NECO Industries Ltd Raipur, Chhattisgarh 6 . 5 0
4 . Vedanta Ltd Amona, Goa 7.42
5 . Usha Martin Industries Jamshedpur, Jharkhand 6 . 0 0
6 . JSW Steel Ltd Vijaynagar, Dolvi & Salem 180 .00
7 . Kalyani Steels Ltd Hospet , Karnataka 2 . 9 0
8 . Kirloskar Ferrous Industries Ltd Koppal, Karnataka 3 . 6 0
9 . KIOCL Ltd Mangaluru, Karnataka 2 . 1 6
10 . Tata Metaliks Ltd Redi, Maharashtra 3 . 1 6
11 . IDCOL Kalinga Iron Works Ltd Barbil, Kendujhar, Odisha 3 . 4 5
12 . Kajaria Iron Castings Ltd Durgapur, West Bengal 1 . 1 0
13 . Electrosteel Castings Ltd Khardah, West Bengal 3.60
14 . Tata Metaliks Ltd Kharagpur, West Bengal 3 . 4 5
15. Sona Alloys Pvt. Ltd Satara, Maharashtra 3 . 1 4
16. Aparant Iron & Steel Pvt. Ltd Sanguem, Goa 1 . 6 0
17 . Steel Authority of India Ltd Bhilai, Bokaro, Durgapur, 235 .00
Burnpur, Rourkela, Bhadravati
18 . Rashtriya Ispat Nigam Ltd Visakhapatnam, Andhra Pradesh 65 .00
19 . Monnet Ispat Ltd Raigarh, Chhattisgarh 7 . 0 0
20 . MESCO Steel Ltd Kalinganagar, Odisha 4 . 5 0
21 . Jai Balaji Industries Ltd Durgapur, West Bengal 5 . 0 9
22 . Kirloskar Ferrous Industries Ltd Hospet , Karnataka 3 . 6 0
23 . KIC Metalliks Ltd Durgapur, West Bengal 1 . 6 5
24 . JSPL Raigarh, Chhattisgarh 20 .00
25 . VSL Steels Ltd Hiriyur, Karnataka 3 . 6 0
26 . Jindal Saw Pipes Ltd Mundra, Gujarat 3 . 6 0
27 . Ramsarup Loha Udyog Kharagpur, West Bengal 3 . 0 0
28 . Adhunik Metaliks Ltd Sundargarh, Odisha 2 . 1 4
29 . SLR Steels Ltd Hospet , Karnataka 2 . 1 0
30 . VISA Industries Ltd Kalinganagar, Odisha 1 . 7 5
31 . Rashmai Metaliks Ltd Kharagpur, West Bengal 1 . 7 5
32 . New Metaliks Ltd Durgapur, West Bengal 1 . 7 5
33. Neelachal Ispat Nigam Ltd Kalinganagar, Odisha 11 .00
Source: MCDR Returns (Form-O), Website of concerned company, Iron & Steel Review,
JPC Bulletin and Ministry of Steel.
9-12
IRON & STEEL AND SCRAP
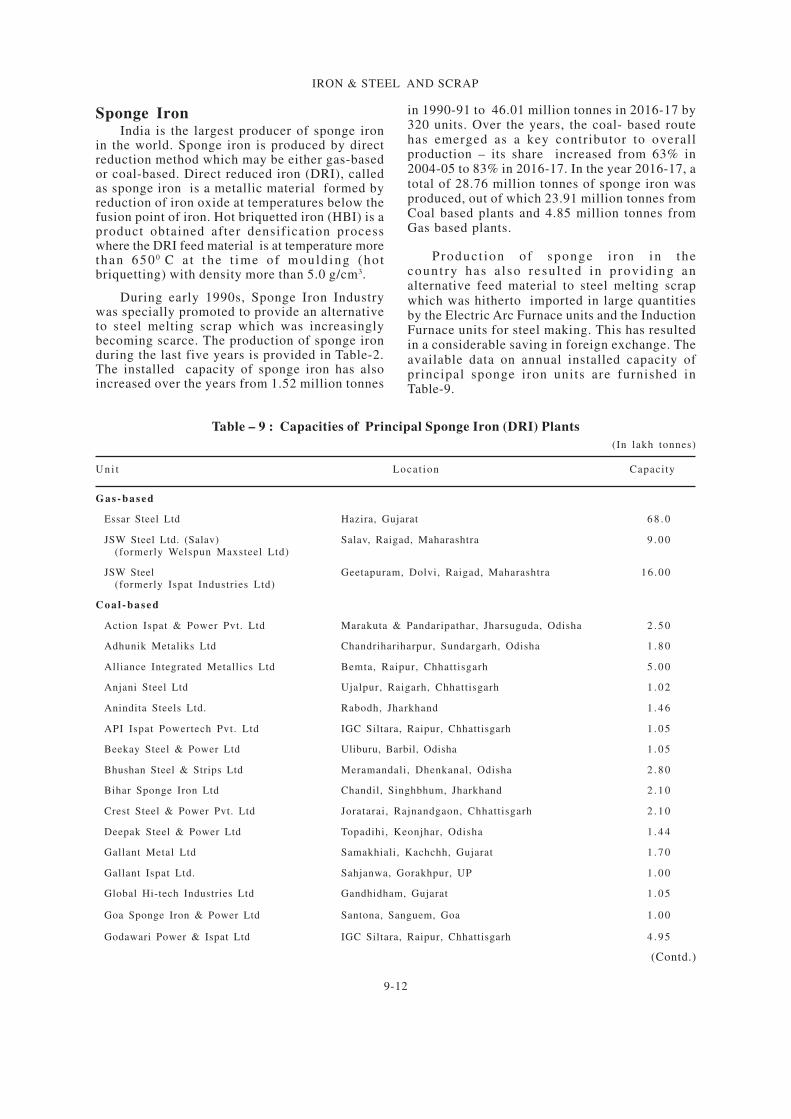
Sponge IronIndia is the largest producer of sponge iron
in the world. Sponge iron is produced by directreduction method which may be either gas-basedor coal-based. Direct reduced iron (DRI), calledas sponge iron is a metallic material formed byreduction of iron oxide at temperatures below thefusion point of iron. Hot briquetted iron (HBI) is aproduct obtained after densification processwhere the DRI feed material is at temperature morethan 650 0 C a t the t ime of mould ing (ho tbriquetting) with density more than 5.0 g/cm3.
During early 1990s, Sponge Iron Industrywas specially promoted to provide an alternativeto steel melting scrap which was increasinglybecoming scarce. The production of sponge ironduring the last five years is provided in Table-2.The installed capacity of sponge iron has alsoincreased over the years from 1.52 million tonnes
in 1990-91 to 46.01 million tonnes in 2016-17 by320 units. Over the years, the coal- based routehas emerged as a key contributor to overallproduction – its share increased from 63% in2004-05 to 83% in 2016-17. In the year 2016-17, atotal of 28.76 million tonnes of sponge iron wasproduced, out of which 23.91 million tonnes fromCoal based plants and 4.85 million tonnes fromGas based plants.
Produc t ion of sponge i ron in thecount ry has a l so resu l ted in p rov id ing analternative feed material to steel melting scrapwhich was hitherto imported in large quantitiesby the Electric Arc Furnace units and the InductionFurnace units for steel making. This has resultedin a considerable saving in foreign exchange. Theavailable data on annual installed capacity ofprincipal sponge iron units are furnished inTable-9.
Table – 9 : Capacities of Principal Sponge Iron (DRI) Plants
(In lakh tonnes)
U n i t Locat ion Capacity
Gas-based
Essar Steel Ltd Hazira, Gujarat 6 8 . 0
JSW Steel Ltd. (Salav) Salav, Raigad, Maharashtra 9 . 0 0
(formerly Welspun Maxsteel Ltd)
JSW Steel Geetapuram, Dolvi, Raigad, Maharashtra 16 .00
(formerly Ispat Industries Ltd)
C o a l - b a s e d
Action Ispat & Power Pvt. Ltd Marakuta & Pandaripathar, Jharsuguda, Odisha 2 . 5 0
Adhunik Metaliks Ltd Chandrihariharpur, Sundargarh, Odisha 1 . 8 0
Alliance Integrated Metallics Ltd Bemta, Raipur, Chhattisgarh 5 . 0 0
Anjani Steel Ltd Ujalpur, Raigarh, Chhattisgarh 1 . 0 2
Anindita Steels Ltd. Rabodh, Jharkhand 1 . 4 6
API Ispat Powertech Pvt. Ltd IGC Siltara, Raipur, Chhattisgarh 1 . 0 5
Beekay Steel & Power Ltd Uliburu, Barbil, Odisha 1 . 0 5
Bhushan Steel & Strips Ltd Meramandali, Dhenkanal, Odisha 2 . 8 0
Bihar Sponge Iron Ltd Chandil, Singhbhum, Jharkhand 2 . 1 0
Crest Steel & Power Pvt. Ltd Joratarai, Rajnandgaon, Chhattisgarh 2 . 1 0
Deepak Steel & Power Ltd Topadihi, Keonjhar, Odisha 1 . 4 4
Gallant Metal Ltd Samakhiali, Kachchh, Gujarat 1 . 7 0
Gallant Ispat Ltd. Sahjanwa, Gorakhpur, UP 1 . 0 0
Global Hi-tech Industries Ltd Gandhidham, Gujarat 1 . 0 5
Goa Sponge Iron & Power Ltd Santona, Sanguem, Goa 1 . 0 0
Godawari Power & Ispat Ltd IGC Siltara, Raipur, Chhattisgarh 4 . 9 5
(Contd.)

9-13
IRON & STEEL AND SCRAP
Table - 9 (Concld.)
U n i t Locat ion Capacity
Gopani Iron & Power Pvt. Ltd Tadali, Chandrapur, Maharashtra 1 . 2 0
Goldstar Steel & Alloys Ltd Srirampuram, Vizianagaram, Andhra Pradesh 2 . 2 0
Grewal Associates Pvt. Ltd Matkambed, Kendujhar, Odisha 1 . 2 0
Haldia Steels Pvt. Ltd Durgapur, West Bengal 1 . 2 0
Ind Synergy Ltd Kotmar, Raigarh, Chhattisgarh 3 . 0 0
Jai Balaji Sponge Ltd Baktarnagar, Raniganj, West Bengal 1 . 0 5
Jai Balaji Jyoti Steels Ltd Sundargarh, Odisha 1 . 2 0
Jai Shri Balaji Steel Pvt. Ltd (HEG Ltd) Borai, Durg, Chhattisgarh 1 . 2 0
Jaiswal Neco Ltd IGC Siltara, Raipur, Chhattisgarh 2 . 5 5
Janki Corporation Ltd Sidiginamola, Ballari, Karnataka 1 . 8 0
Jindal Steel & Power Ltd Kharsia Road, Raigarh, Chhattisgarh 1 . 3 7
Lloyds Metals & Engineering Ltd Ghuggus, Chandrapur, Maharashtra 2 . 7 0
Mastek Steels Pvt. Ltd Holakundi, Ballari, Karnataka 1 . 0 5
MGM Steels Ltd Chintapokhri, Dhenkanal, Odisha 1 . 0 5
Monnet Ispat Energy Ltd Chandkhuri Marg, Hasaud, Raipur, Chhattisgarh 3 . 0 0
Monnet Ispat & Energy Ltd Naharpalli, Raigarh, Chhattisgarh 5 . 0 0
MSP Steel & Power Ltd Jamgaon, Raigarh, Chhattisgarh 1 . 9 2
Nalwa Steel & Power Ltd Taraimal, Raigarh, Chhattisgarh 1 . 9 8
Nova Iron & Steel Ltd Dagori, Bilaspur, Chhattisgarh 1 . 5 0
OCL Iron & Steel Ltd Lamloi, Sundargarh, Odisha 1 . 2 0
Orissa Sponge Iron Ltd Palaspanga, Keonjhar, Odisha 2 . 5 0
Prakash Industries Ltd Champa, Janj-gir-Champa, Chhattisgarh 4 . 5 0
Rungta Mines Ltd Karakola and Kamando, Sundargarh, Odisha 4 . 2 0
Rashmi Cement Ltd Barbil, Kendujhar, Odisha 3 . 6 0
Sarda Energy & Minerals Ltd IGC Siltara, Raipur, Chhattisgarh 2 . 1 0
Scaw Industries Pvt. Ltd Gundichapara, Dhenkanal, Odisha 1 . 0 0
Shivshakti Steel Ltd Chakradharpur, Raigarh, Chhattisgarh 1 . 0 0
Shri Bajrang Power & Ispat Ltd Urla, Raipur, Chhattisgarh 2 . 1 0
Shyam Sel Ltd Dewabdighi, Burdwan, West Bengal 1 . 0 0
Singhal Enterprises Pvt. Ltd Taraimal, Raigarh, Chhattisgarh 2 . 5 3
Sree Metaliks Ltd Loidapada, Kendujhar, Odisha 1 . 7 4
Sri Venkatesh Iron & Alloys Ltd Ramgarh, Jharkhand 1 . 2 0
S.K.S. Ispat & Power Ltd Raipur, Chhattisgarh 2 . 7 0
Sunflag Iron & Steel Co Ltd Bhandara, Maharashtra 1 . 5 0
Sunil Ispat & Power Ltd IGC Siltara, Raipur, Chhattisgarh 1 . 1 5
Sunil Sponge Iron Ltd Chiraipani, Raigarh, Chhattisgarh 1 . 0 5
Tata Sponge Iron Ltd (Ipitata Sponge) Joda, Kendujhar, Odisha 3 . 9 0
Vandana Global Ltd IGC Siltara, Raipur, Chhattisgarh 2 . 1 6
Vallabh Steels Ltd Sahnewal, Ludhiana, Punjab 1 . 2 0
Visa Steels Ltd KIC, Jajpur Road, Odisha 3 . 0 0
Zoom Vallabh Steels Ltd Dughda, Saraikela-Kharswan, Jharkhand 1 . 2 0
I.G.C.: Industrial Growth Centre.
Source: Sponge Iron Manufacturers' Association (SIMA) and individual plants.
9-14
IRON & STEEL AND SCRAP
Consumption of SteelAs per world Steel in figures, 2017 India's per
capita steel consumption increased from 53 kg in
2010 to 63 kg in 2016 and it is far below the level
of other developed and some of the developing
countries. The world per capita steel consumption
in 2016 is reflected as 208 kg.
Apparent consumption of steel is calculated
by taking into consideration with respect to
export of steel, total domestic production and
import of steel in the country. It is also treated as
the actual domestic demand of steel in the
country. The apparent consumption of finished
steel in India since 2012-13 is furnished in
Table-10.
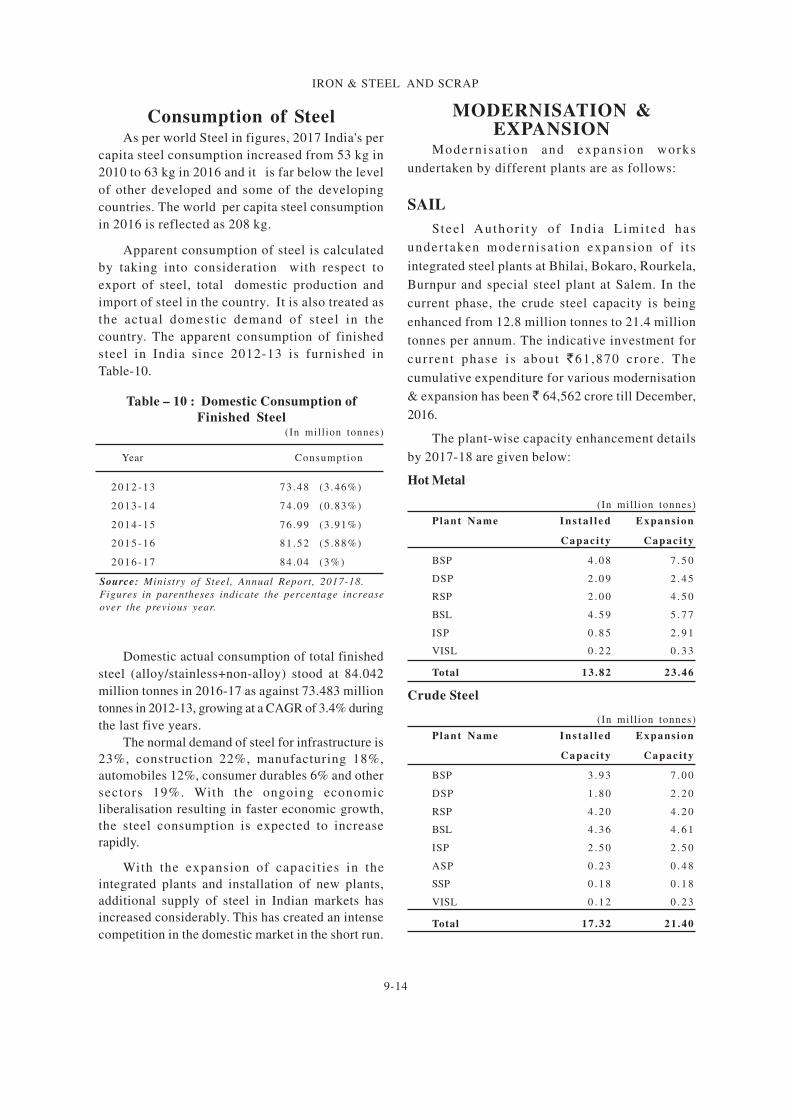
MODERNISATION &EXPANSION
Modern isa t ion and expans ion works
undertaken by different plants are as follows:
SAIL
Stee l Author i ty o f Ind ia L imi ted has
under taken modernisa t ion expansion of i t s
integrated steel plants at Bhilai, Bokaro, Rourkela,
Burnpur and special steel plant at Salem. In the
current phase, the crude steel capacity is being
enhanced from 12.8 million tonnes to 21.4 million
tonnes per annum. The indicative investment for
current phase i s about `61,870 crore . The
cumulative expenditure for various modernisation
& expansion has been ` 64,562 crore till December,
2016.
The plant-wise capacity enhancement details
by 2017-18 are given below:
Hot Metal
(In million tonnes)
Plant Name I n s t a l l e d Expans ion
Capac i ty Capac i ty
BSP 4 . 0 8 7 . 5 0
DSP 2 . 0 9 2 . 4 5
RSP 2 . 0 0 4 . 5 0
BSL 4 . 5 9 5 . 7 7
ISP 0 . 8 5 2 . 9 1
VISL 0 . 2 2 0 . 3 3
Total 13 .82 23 .46
Crude Steel
(In million tonnes)
Plant Name I n s t a l l e d Expans ion
Capac i ty Capac i ty
BSP 3 . 9 3 7 . 0 0
DSP 1 . 8 0 2 . 2 0
RSP 4 . 2 0 4 . 2 0
BSL 4 . 3 6 4 . 6 1
ISP 2 . 5 0 2 . 5 0
ASP 0 . 2 3 0 . 4 8
SSP 0 . 1 8 0 . 1 8
VISL 0 . 1 2 0 . 2 3
Total 17 .32 21 .40
Domestic actual consumption of total finished
steel (alloy/stainless+non-alloy) stood at 84.042
million tonnes in 2016-17 as against 73.483 million
tonnes in 2012-13, growing at a CAGR of 3.4% during
the last five years.
The normal demand of steel for infrastructure is
23%, construction 22%, manufacturing 18%,
automobiles 12%, consumer durables 6% and other
sectors 19%. With the ongoing economic
liberalisation resulting in faster economic growth,
the steel consumption is expected to increase
rapidly.
With the expansion of capacities in the
integrated plants and installation of new plants,
additional supply of steel in Indian markets has
increased considerably. This has created an intense
competition in the domestic market in the short run.
Table – 10 : Domestic Consumption of
Finished Steel(In million tonnes)
Year Consumption
2 0 1 2 - 1 3 73 .48 (3 .46%)
2 0 1 3 - 1 4 74 .09 (0 .83%)
2 0 1 4 - 1 5 76 .99 (3 .91%)
2 0 1 5 - 1 6 81 .52 (5 .88%)
2 0 1 6 - 1 7 84 .04 (3%)
Source: Ministry of Steel, Annual Report, 2017-18.
Figures in parentheses indicate the percentage increase
over the previous year.
9-15
IRON & STEEL AND SCRAP
The modernisation & expansion of Rourkela
Steel Plant (RPS), IISCO Steel Plant (ISP) and Salem
Steel Plant got completed in 2015. At IISCO Steel
Plant, Burnpur, India's largest blast furnace
(4,160 m3), has been installed.
SAIL is finalising its Vision-2025 document,
proposals for innovation are expected to steer the
Company to increase its production capacity of
Hot Metal to 50 MTPA, along with related/
enabling business activities, in line with growing
demand of steel in the country. This will not only
enhance SAIL's contribution to nation building
but will also place SAIL amongst the top steel
companies globally.
Bhilai Steel Plant
Bhilai Steel Plant (BSP) is India’s sole
producer of rails and heavy steel plates and major
producer of structural products. The plant is the
sole supplier of the country’s longest rail tracks
of 260 metres. With an annual production capacity
of 3.153 MT of saleable steel, the plant also
specialises in other products such as wire rods
and merchant products.
The Board of SAIL has given in principle
approval to the proposal for modernisation
and capacity expansion of Bhilai Steel Plant
to 7.5 million tonnes of hot metal and 7 million
tonnes of crude steel per annum. The proposal
includes: a) Installation of a new blast furnace;
b) A new 7 metres tall coke oven battery and a
new sinter machine; c) Phasing out of ingot route
with 100% continuous casting by adding a new
steel melting shop of 4 million tpy capacity;
d) Installation of a universal beam mill of 1 million
tpy capacity; e) Addition of a new bar & roll
mill of 0.9 million tpy capacity; f) Installation of a
new universal rail mill of 1.2 million tpy capacity
and g) capacity expansion of plate mill to
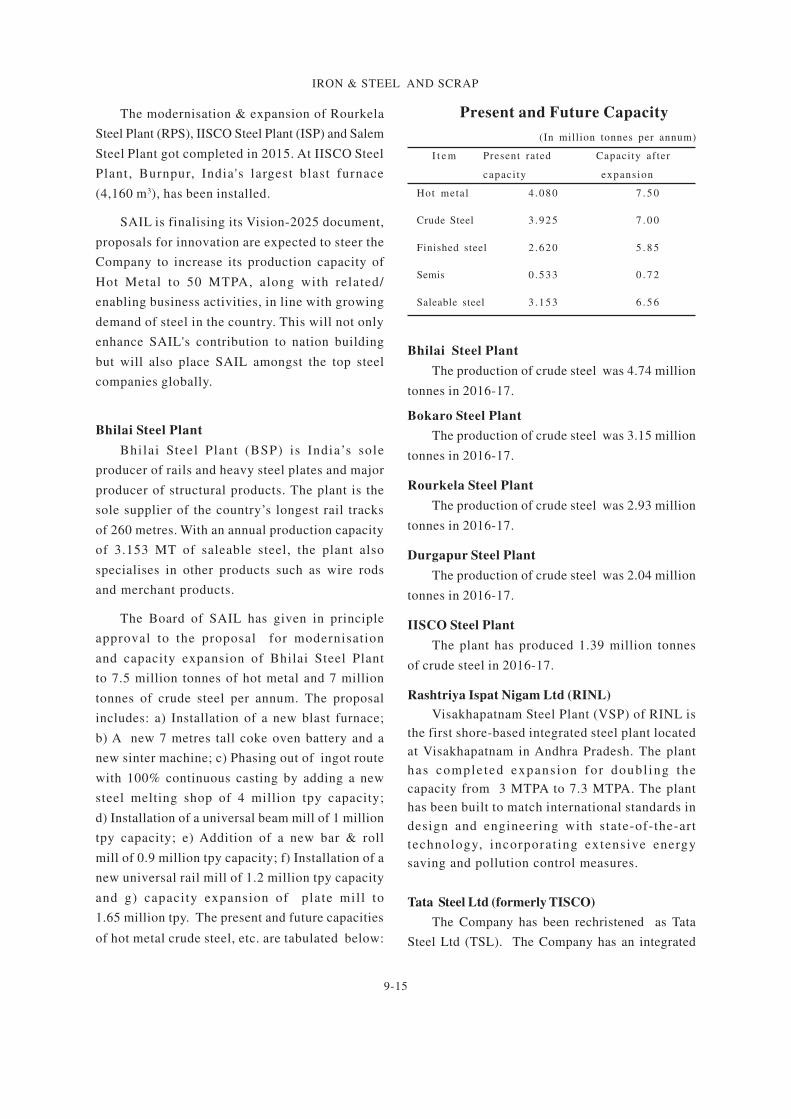
1.65 million tpy. The present and future capacities
of hot metal crude steel, etc. are tabulated below:
Present and Future Capacity
(In million tonnes per annum)
I t e m Present rated Capacity after
capaci ty expansion
Hot metal 4 .080 7 . 5 0
Crude Steel 3 .925 7 . 0 0
Finished steel 2 .620 5 . 8 5
Semis 0 .533 0 . 7 2
Saleable steel 3 .153 6 . 5 6
Bhilai Steel Plant
The production of crude steel was 4.74 million
tonnes in 2016-17.
Bokaro Steel Plant
The production of crude steel was 3.15 million
tonnes in 2016-17.
Rourkela Steel Plant
The production of crude steel was 2.93 million
tonnes in 2016-17.
Durgapur Steel Plant
The production of crude steel was 2.04 million
tonnes in 2016-17.
IISCO Steel Plant
The plant has produced 1.39 million tonnes
of crude steel in 2016-17.
Rashtriya Ispat Nigam Ltd (RINL)
Visakhapatnam Steel Plant (VSP) of RINL is
the first shore-based integrated steel plant located
at Visakhapatnam in Andhra Pradesh. The plant
has comple ted expans ion for doubl ing the
capacity from 3 MTPA to 7.3 MTPA. The plant
has been built to match international standards in
design and engineering with state-of-the-art
technology, incorporat ing extensive energy
saving and pollution control measures.
Tata Steel Ltd (formerly TISCO)
The Company has been rechristened as Tata
Steel Ltd (TSL). The Company has an integrated

9-16
IRON & STEEL AND SCRAP
steel plant located at Jamshedpur, Jharkhand, with
annual crude steel making capacity of 9.7 million
tonnes and variety of finishing mills. TSL has
produced 11.12 million tonnes of finished steel in
2016-17 as compared to 9.53 million tonnes in
2015-16. The production of crude steel in 2015-16
was 9.96 million tonnes as against 11.69 million
tonnes in 2016-17.
The Company is planning to initiate second
phase of expansion at Kalinganagar plant in Odisha
to double its capacity to 6 million tpy. The first phase
of Kalinganagar project started commercial
production in May, 2016. The Government of Odisha
has allotted 2000 acres of land for the plant at
Kalinganagar. The Company initially plans to set up
a 7.0 million tpy capacity integrated steel plant at
Jagdalpur in Bastar region of Chhattisgarh, but
subsequently decided against the project due to
delay in land allocation. The Company also signed
an MoU with the Government of Jharkhand for
setting up of a 12 million tonnes per year integrated
steel plant at Saraikela in phases. The above projects
are, however, subjected to raw material linkages and
requisite approvals.
JSW Steel Ltd
JSW Steel Ltd's combined installed capacity of
its plants at Karnataka, Tamil Nadu and Maharashtra
of crude steel was 18 million tpy with value added
products constituting 1.8 million tpy spread across
six locations; Toranagallu (Vijayanagar Works),
Salem (Salem Works), Vasind, Tarapur (downstream
units), Dolvi and Kalmeshwar (Maharashtra).
Vijayanagar Works existing operations produce flat
and long steel products; Salem Works has its focus
only in long products while the downstream units
produce CR/galvanised, colour-coated, value-added
flat products. All the existing operating facilities
have been accredited with OHSAS-18001, ISO-9001:
2000 and ISO - 14001. Vijayanagar Works has
integrated operations from beneficiation plant to 1
million tpy Cold Rolling Mill Complex. The Salem
Works has an integrated manufacturing facility with
an overall crude steel capacity of 1 million tpy,
comprising sinter plant, blast furnace, EOF, billet
caster, bloom caster & rolling with associated
facilities, such as, coke oven, power plant, oxygen
plant, etc. The slabs and HR coil produced at
Vijaynagar Works are further processed in
downstream units at Vasind and Tarapur into value-
added HR plates, CR, galvanised, galvalume and
colour-coated products.
The Company has enhanced the total capacity
to 10 million tpy at Vijayanagar Works. Two subsidiaries
of the Company – M/s JSW Bengal Steel Ltd and
M/s JSW Jharkhand Steel Ltd – have been incorporated
to set up greenfield steel plants with 10 million tpy
capacity each in West Bengal and Jharkhand,
respectively. The Company is in possession of
required land in West Bengal, while in Jharkhand,
it has obtained a mining lease for iron ore.
The Vijaynagar works is also the first Indian
plant that underakes large-scale, low-grade iron
beneficiation process. Its 4.62 MTPA coke
manufacturing unit is also the largest such facility in
a single location. The Company has a manufacturing
capacity of 9.2 MT of pellets annually at Vijayanagar.
JSW Steel has acquired a majority stake in Ispat
Steel w.e.f. 21.12.2010. It has set up one of the largest
integrated steel plants in the Private Sector in India
at Dolvi in Raigad district, Maharashtra. The plant
has a capacity to produce 5 million tonnes of Steel
per annum. The Integrated Steel plant functions on
the Convertor-cum-Electric Arc Furnace route
(CONARC Process) to produce steel through modern
Twin Shell Electric Arc Furnace. JSW, Dolvi also
having a sinter plant of capacity 4.74 MTPA. The
expansion work at the Dolvi plant to enhance
capacity from 3.3 MTPA to 5 MTPA has completed
recently.
9-17
IRON & STEEL AND SCRAP
The Company aims to produce 44 million tonnes
of steel annually with Greenfield integrated steel
plants coming up in West Bengal and Jharkhand (of
10 MTPA each) by 2030. Company also plans to
expand it's Vijaynagar works to 20 MTPA, Dolvi
works to 10 MTPA and salav to 3 MTPA.
Jindal Steel & Power Ltd (JSPL)
JSPL having manufacturing facilities for steel
products in three locations; Raigarh in Chhattisgarh,
Angul in Odisha and Patratu in Jharkhand. JSPL has
set up a rail & universal beam plant with capabilities
to produce 121 m long single piece rail and is the
first in the country to manufacture large-size parallel
flange beams. The sponge iron plant at Raigarh,
Chhattisgarh has capacity of 1.37 million tpy.
Facilities at Raigarh also include a Sinter plant of
2.84 MTPA and Steel melt shop of 3.25 MTPA.
Under the 'Make in India' vision, JSPL has
successfully completed Angul Greenfield project with
installation of 4 MTPA Bast Furnace, the largest
ever built in India. Other plants being set up are: 6
million tpy integrated steel plant at Patratu, Jharkhand
and 7 million tpy steel plant at Raigarh, Chhattisgarh.
It has planned to implement these projects in phases.
The present plant at Raigarh is also under expansion
to 7 million tpy (3 million tpy through EF route and 4
million tpy through BOF route) comprising 3 million
tpy flat products and 4 million tpy long products. It
will also have 6 million tpy gas-based DRI plant with
matching coal gasification unit and 4 million tpy hot
metal capacity.
Essar Steel Limited (ESL)
A state-of-the-art hot rolled coil steel plant was
set up at Hazira, Gujarat with 10 million tonnes
capacity per annum supported by a 20 MTPA pellet
facility. It is the largest fully-integrated manufacturer
of high-quality flat steel products in western India.
The Company's operations include 8 million tpy and
12 million tpy beneficiation plants at Bailadila in
Chhattisgarh and Dabuna in Odisha. Essar has the
world's second largest slurry pipeline of 267 km and
also 253 km to transport beneficiated iron ore slurry
to the pellet plants namely, 8 million tpy pellet complex
at Visakhapatnam, Andhra Pradesh and 6 million tpy
plant at Paradip, Odisha. The Essar Steel Complex
at Hazira in Surat district, Gujarat houses the world's
largest gas-based single location sponge iron plant
with a capacity of 6.8 million tpy. The complex also
houses 1.4 million tpy cold rolling plant, 4.6 million
tpy electric arc furnace, 4.6 million tpy continuous
caster and 3.6 million tpy hot strip mill. Outstanding
performance has been observed in the 3 DRI-HBI
modules of the company.
The Company has plans to double the capacity
of pelletisation at Paradip, Odisha from 6 MTPA to
12 MTPA. The scheme also includes installation of
pellet plant and iron ore beneficiation plant. The
Company has plans to set up a steel plant of 3.2
million tonnes per annum capacity at Bastar,
Chhattisgarh, (In the first phase, a 1.6 million tpy
steel plant with a captive power plant is to be set
up), 3 million tonnes per annum in Jharkhand and 6
million tonnes per annum in Karnataka.
Electrosteel Steels
Electrosteel Steels Limited is one of the pioneer
Companies that manufactures of Ductile Iron (DI)
pipe. The Company is in the process of setting up
2.51 MTPA Greenfield Steel and DI pipe plant based
on iron ore processed through Blast Furnace (BF),
Basic Oxygen Furnace (BOF), Continuous Casting
(CC), Hot Rolling Mill Route.
Monnet Ispat and Energy Limited
Monnet Ispat & Energy Ltd is a reputed steel
manufacturer in the country having integrated steel
plant of 1.8 MTPA, which include 0.8 MTPA sponge
iron, 0.7 MTPA blast furnace, 0.50 MTPA rebar mill,
0.2 MTPA structural mill, 230 MW power plant, 0.75
MTPA sinter plant, 1.20 MTPA pelletisation plant and
1.00 MTPA coal beneficiation plant at Raipur &
Raigarh in the State of Chhattisgarh. The Company
has reportedly invested ` 7,600 crore in its
diversification activities and further proposes to
9-18
IRON & STEEL AND SCRAP
expand its capacities from 1.8 MTPA to 2.4 MTPA
with incorporation of additional facilities of coke
oven, blast furnace, sponge iron, power, cement
grinding unit, lime dolomite plant, rolling mill, slag
crushing & automisation plant, etc.
Neelachal Ispat Nigam Limited (NINL)
NINL has an iron & steel plant with 1.1 million
tonnes per annum capac i ty loca ted a t
Kalinganagar, Duburi, Jajpur districts, Odisha. In
addition, NINL along with Odisha Government
have plans for setting up one million tonne steel
plant at Kalinganagar, Jajpur, Odisha. The other
product of the Company that is sold in the
domestic market is granulated slag which is
consumed by several cement plants.
National Mineral Development
Corporation Ltd
NMDC is now d i rec t ing i t s resources
to diversify into steel making and other value-
added products. The Company has plans to set
up an integrated steel plant with three million
tonnes capacity in Chhattisgarh near Nagarnar,
Bastar district, construction work for the project
is in progress . NMDC is in the process of
expanding i t s bus iness th rough forward
integration in both greenfield and brownfield
projects by setting up (a) 2.0 million tpy pellet
plant in Chhattisgarh with 2 MTPA beneficiation
plant at Bacheli and (b) 1.2 million tpy pellet plant
at Donimalai in Karnataka. Consruction work for
the project is in progress.
Further, NMDC had participated in the Legacy
Iron's right issue in August 2014. Post right issue,
NMDC's equity in Legacy Iron has increased from
48.82% to 78.56%. NMDC has acquired 50% equity
in Legacy Iron Ore Ltd Australia. NMDC has
signed an MoU with RINL for laying a slurry
pipeline from Bailadila Complex (Chhattisgarh) to
Vizag (Andhra Pradesh) via Jagdalpur to facilitate
transmission of iron ore concentrate.
KIOCL LtdThe Company operates a 350 cu m capacity
blast furnace at Panambur, New Mangaluru
Port for production of pig iron with 2.16 lakh tpy
capacity and a Ductile Iron Spun Pipe (DISP)
plant of 1,00,000 tonnes per year capacity. The
hot meta l f rom b las t fu rnace i s the main
feed stock for the DISP plant. The Company
is a l so in the process o f se lec t ing a jo in t
venture equity partner for an integrated steel plant
to be set up in Karnataka with initial capacity of
1.5 MTPA and expandable to 5 MTPA with equity
participation. The Company also operates a
3.5 million tpy pellets plant at Mangaluru with
heamatite ore purchased from NMDC. Also, under
the 'Make in India' initiative of Govt. of India,
KIOCL produced high-grade pel le ts out of
imported high-grade ore procurred from Brazil. It
has signed an MoU with Kerala State Industrial
Development Corporation Ltd (KSIDL) for setting
up of i ron ore min ing , benef ic ia t ion and
pelletisation plant in Kerala.
VISA Steel Ltd
VISA Steel is a leading player in the special
steel (0.5 MTPA), ferrochrome (1,80,000 tpa) and
metallurgical coke (0.4 million tpa) business in
India. The Company is setting up an integrated
1 million tpa special steel plant and 2,50,000 MTPA
fe r rochrome p lant a t Kal inganagar Indus t r ia l
Complex in Odisha. The first phase of 0.5 million
tpa spec ia l s t ee l long produc t p lan t i s fu l ly
operational. The facilities include a 2,25,000 tpa
pig iron plant, 3,00,000 tpa sponge iron plant,
5,00,000 tpa steel melt shop (with EAF, LRF and
VD) & 5,00,000 tpa rolling mill (bar & wire rod
mill). VISA Steel is also operating 1,80,000 tpa
ferrochrome plant and a 75 MW captive power
plant. VISA Sun Coke Limited, a joint venture
Company between VISA Steel Limited and Sun
Coke Energy, USA operates a 4,00,000 MTPA heat
recovery coke p lan t and assoc ia ted s team
generation units at Kalinganagar in Odisha. VISA
Steel has signed an MoU with the Government of
Chhattisgarh for setting up a 2.5 million integrated
carbon steel plant at Korarlia, district Raigarh.
IRON & STEEL SCRAPIron & steel scrap is one of the essential
requirements for manufacture of steel in Mini-steel
Industry. It is also consumed by some major steel
plants. Scrap, especially from the Ship Breaking

9-19
IRON & STEEL AND SCRAP
Industry supplies substantial quantity of re-
rollable steel and steel scrap for the Iron & Steel
Industry. Iron scrap is available in the country in
the form of pressed bundles, a mixture of used
steel components (called as a commercial scrap),
turnings & borings and heavy melting scrap.
These are generated by industries of all sectors
l ike automobiles , rai lways and engineering
workshops.
The collection and processing of scrap in
an organised manner is undertaken by a few
units in the country. In the local market, scrap
is supplied by dealers who in turn arrange to
have scrap collected manually or through sub-
dealers.
The consumption of scrap is mainly reported
by Induction Furnace and Electric Arc Furnace
units, Integrated Steel Plants and Alloy Steel &
Foundry industries. Scraps are used in the Steel
Sector after recycling. Recycling scrap helps in
conservation of energy as remelting of scrap
requires much less energy than production of iron
or steel from iron ore. Also, the consumption of
iron and scrap by remelting reduces the burden
on landfill disposal facilities and prevents the
accumulation of abandoned steel products in the
environment. It increases the availability of semi-
finished material, which otherwise would have to
be produced using the ore. Thus, it helps in
conservation of natural resources.
Ship Breaking
Ship breaking has been a major source of
scrap generation. Ship breaking activities are
carried out at various places on the Indian coast,
the largest concentration being in the West coast.
Private entrepreneurs handle the task of ship
breaking in India. It is a labour-intensive job, and
in India, it is a cost-efficient activity. Locations
of present ship breaking activities are:
i) Alang and Sosiya yards in Bhavnagar
district, Gujarat,
ii) Sachana district, Gujarat
iii) Mumbai and
iv) Kolkata
Alang & Sosiya yards account for 90%
concentration of the Ship Breaking Industry in
India. The yard has capacity to recycle about 450
ships per year generating re-rollable steel of > 4.5
million tonnes per annum. There are a total of 167
plots available for ship recycling spread over 10
km stretch along the coast of Alang. During 2012-
13 and 2013-14, a total of 394 and 298 ships were
beached by the Industry accounting for 3.8 million
tonnes and 3.06 million tonnes, respectively, in
terms of LDT (Light Displacement Tonnage, viz,
physical weight of a ship). Today, Alang possibly
represents the single largest concentration of Ship
Breaking Industry in the world. The life of an
average ocean-going ship is about 20 years.
About 40% of the ships broken are dry cargo
ships, while the remaining 40% of the ships broken
are wet cargo, tanker and specialised ships.
These recyclable steels mainly as steel scrap
provide feed to Steel and Foundry Industry in
India. The steel generated from ship recycling
contributes to around 1% to 2% of the domestic
steel demand.
The recommendations of a committee of
Technical Experts on Ship Breaking set up by the
Government of India on the directions of the
Hon'ble Supreme Court have been accepted by the
Hon'ble Supreme Court on 6.9.2007, on the issue
of handling & management of the hazardous
industrial waste generated during ship breaking.
In pursuance of the directions of the Hon’ble
Supreme Court in CWP 657 of 1995, Government
of India in the Ministry of Steel had formulated
and notified the comprehensive code for ship
breaking and ship recycling, namely Ship breaking
Code, 2013, vide notification dated 7th March,
2013.
9-20
IRON & STEEL AND SCRAP
MSTC Ltd(Formerly Metal Scrap Trade Corp. Ltd)
Presently, the Company undertakes trading
activities, e-commerce, disposal of ferrous and non-
ferrous scrap, surplus stores and other secondary
arising mostly from Public Sector Undertakings and
Government Departments, including Ministry of
Defence. The Company also undertakes import of
raw materials in bulk required by large industrial
houses on back-to-back basis. The items of import
include petroleum products, low ash metallurgical
coke, coking coal, steam coal, DR pellets, HR coils
and heavy melting scrap. It also undertakes trading
of items within the country in competition with any
other private trader.
Ferro Scrap Nigam Ltd (FSNL)
FSNL is a wholly owned subsidiary of MSTC
Ltd under the Ministry of Steel. The Company
undertakes the recovery and processing of scrap
from slag and refuse dumps in the nine steel plants
at Bhilai, Bokaro, Burnpur, Durgapur, Rourkela,
Visakhapatnam, Dolvi, Duburi and Haridwar and
also at Rail Wheel factory Bengaluru. The scrap
so recovered is returned to the steel plants for
recycling disposal and the Company is paid
processing charges on the quantity recovered at
varying rates depending on the category of scrap.
Scrap is generated during iron & steel making
and also in the rolling mills. In addition, the
Company provides steel mill services, such as,
scarfing of slabs, handling of BOF slag, etc. In
the year 2016-17, the FSNL has recovered 2.64
million tonnes of scrap having value of ̀ 2325.74
crores.
TRADE POLICYAs per the notified Export-Import Policy
incorporated under the Foreign Trade Policy
(FTP) for 2015-20, the imports of primary forms
of pig iron, spiegeleisen, sponge iron, ferro-alloys,
stainless steel , remelt ing scrap, as also the
semi- f in i shed produc ts o f i ron , non-a l loy
steel or s ta inless s teel (such as f la t - rol led
products, bars, rods, coils and wires), primaryand
semi-finished forms of other alloy-steels, etc. are
unrestricted. Similarly, the exports are also allowed
freely.
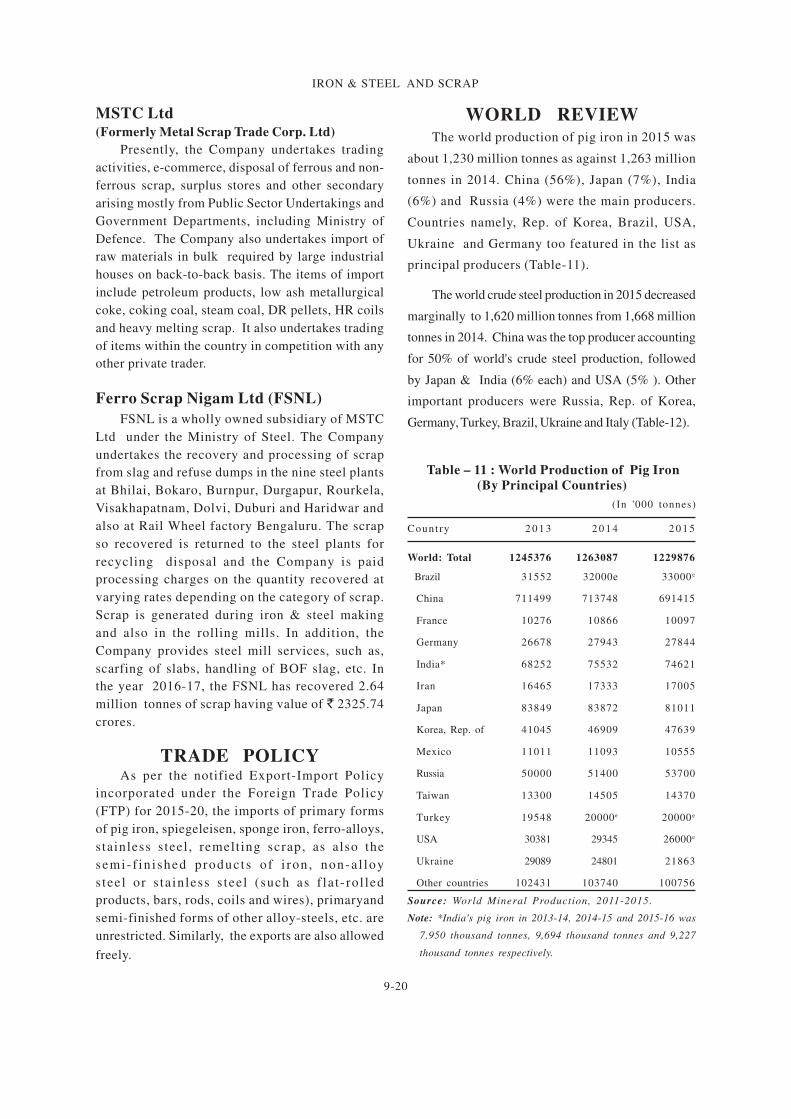
WORLD REVIEWThe world production of pig iron in 2015 was
about 1,230 million tonnes as against 1,263 million
tonnes in 2014. China (56%), Japan (7%), India
(6%) and Russia (4%) were the main producers.
Countries namely, Rep. of Korea, Brazil, USA,
Ukraine and Germany too featured in the list as
principal producers (Table-11).
The world crude steel production in 2015 decreased
marginally to 1,620 million tonnes from 1,668 million
tonnes in 2014. China was the top producer accounting
for 50% of world's crude steel production, followed
by Japan & India (6% each) and USA (5% ). Other
important producers were Russia, Rep. of Korea,
Germany, Turkey, Brazil, Ukraine and Italy (Table-12).
Table – 11 : World Production of Pig Iron
(By Principal Countries)
(In '000 tonnes)
Count ry 2 0 1 3 2 0 1 4 2 0 1 5
World: Total 1245376 1263087 1229876
Brazil 31552 32000e 33000 e
China 711499 713748 691415
France 10276 10866 10097
Germany 26678 27943 27844
India* 68252 75532 74621
Iran 16465 17333 17005
Japan 83849 83872 81011
Korea, Rep. of 41045 46909 47639
Mexico 11011 11093 10555
Russia 50000 51400 53700
Taiwan 13300 14505 14370
Turkey 19548 20000e 20000 e
USA 30381 29345 26000e
Ukraine 29089 24801 21863
Other countries 102431 103740 100756
Source: World Mineral Production, 2011-2015.
Note: *India's pig iron in 2013-14, 2014-15 and 2015-16 was
7,950 thousand tonnes, 9,694 thousand tonnes and 9,227
thousand tonnes respectively.

9-21
IRON & STEEL AND SCRAP
Table – 12 : World Production of Crude Steel(By Principal Countries)
(In '000 tonnes)
Count ry 2 0 1 3 2 0 1 4 2 0 1 5
World: Total 1642297 1668591 1619992
Brazil 34163 33912 33200
Canada 12349 12595 12473
China 813139 822306 803823
France 15685 16144 14984
Germany 42645 42943 42674
India* 81690 88980 89790
Iran 15631 14308 14340e
Italy 24093 23714 22018
Japan 110595 110666 105134
Korea, Rep. of 66061 71542 69670
Mexico 18242 18995 18228
Russia 68800 70300 69400
Spain 14252 14163 14845
Taiwan 21466 22511 21000
Turkey 34654 34035 31517
USA 86878 88347 81000e
Ukraine 33199 27373 23166
UK 11858 12034 10907
Other countries 136898 143723 141823
Source: World Mineral Production, 2011-2015.
Note: *India's Crude steel in 2013-14, 2014-15 and 2015-16
was 81,694 thousand tonnes, 88,979 thousand tonnes and
89,790 thousand tonnes respectively.
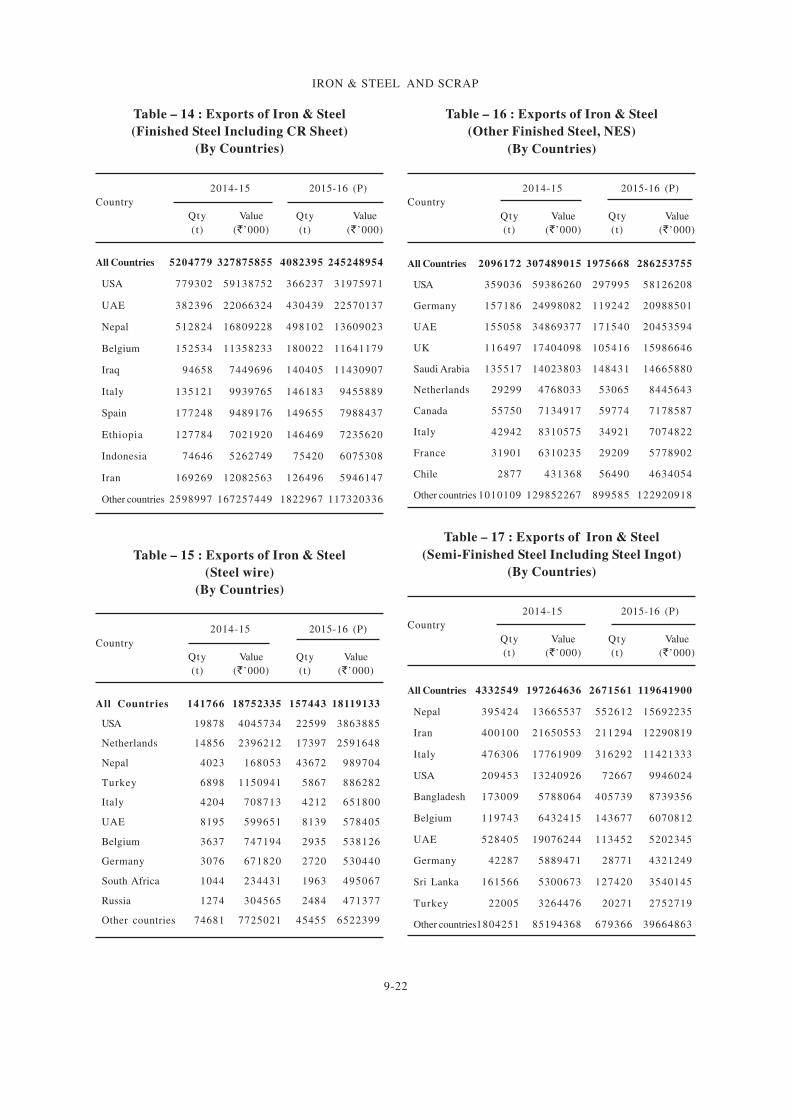
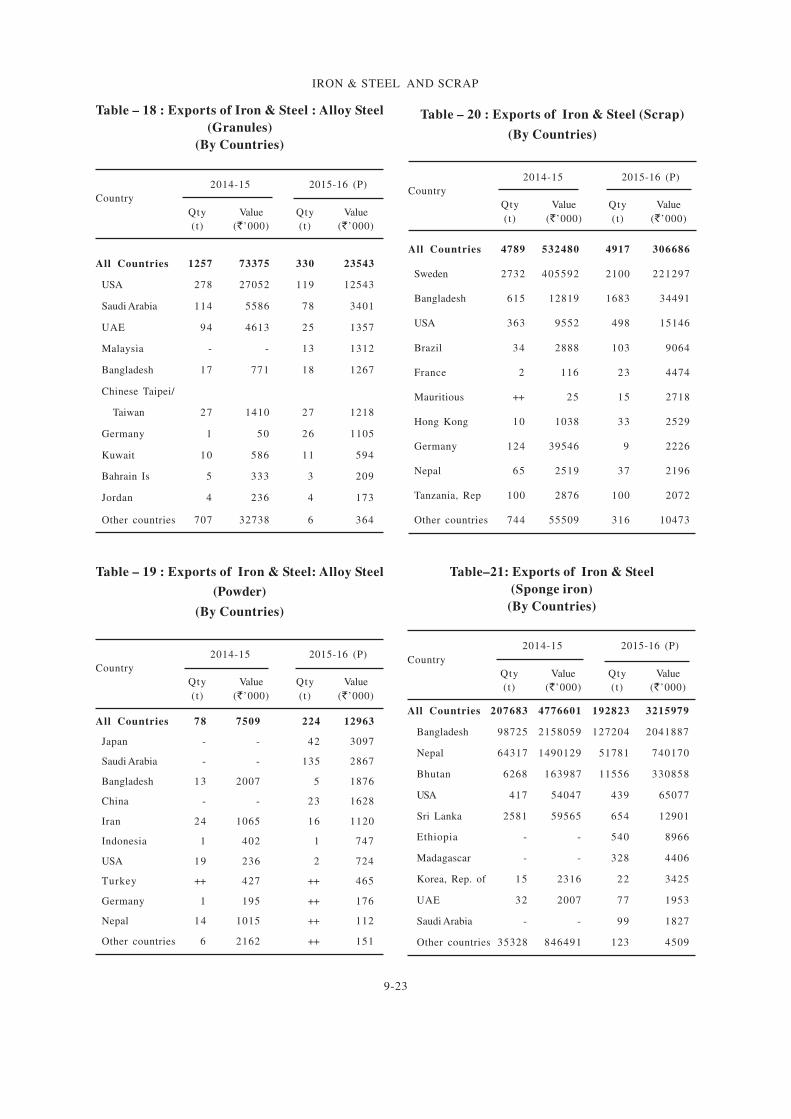
FOREIGN TRADEExports
Exports of iron and steel (total) decreased in
2015-16 to 9.12 million tonnes from 12.08 million tonnes
in the previous year. Steel exports in 2015-16 comprised
mainly of finished steel (including cold rolled sheets)
with 4.08 million tonnes (45%) and semi-finished steel
(including steel ingots) with 2.67 million tonnes (29%).
Other items together accounted for the remaining 26%
exports. Exports in 2015-16 were mainly to Nepal (13%),
USA & UAE (8% each) and Bangladesh (7% ). Exports
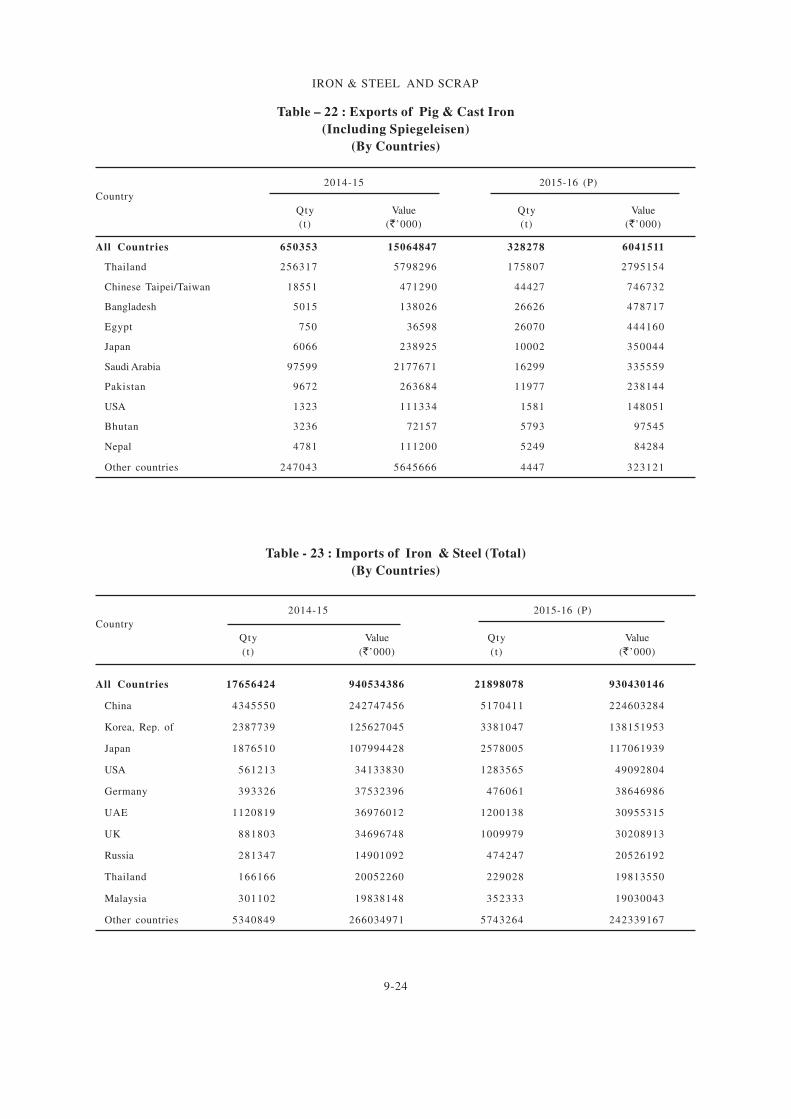
of pig and cast iron including spiegeleisen decreased
sharply by 80% to 3.28 lakh tonnes in 2015-16 from
6.50 lakh tonnes in the previous year. Exports were
mainly to Thailand (54%) (Tables- 13 to 22).
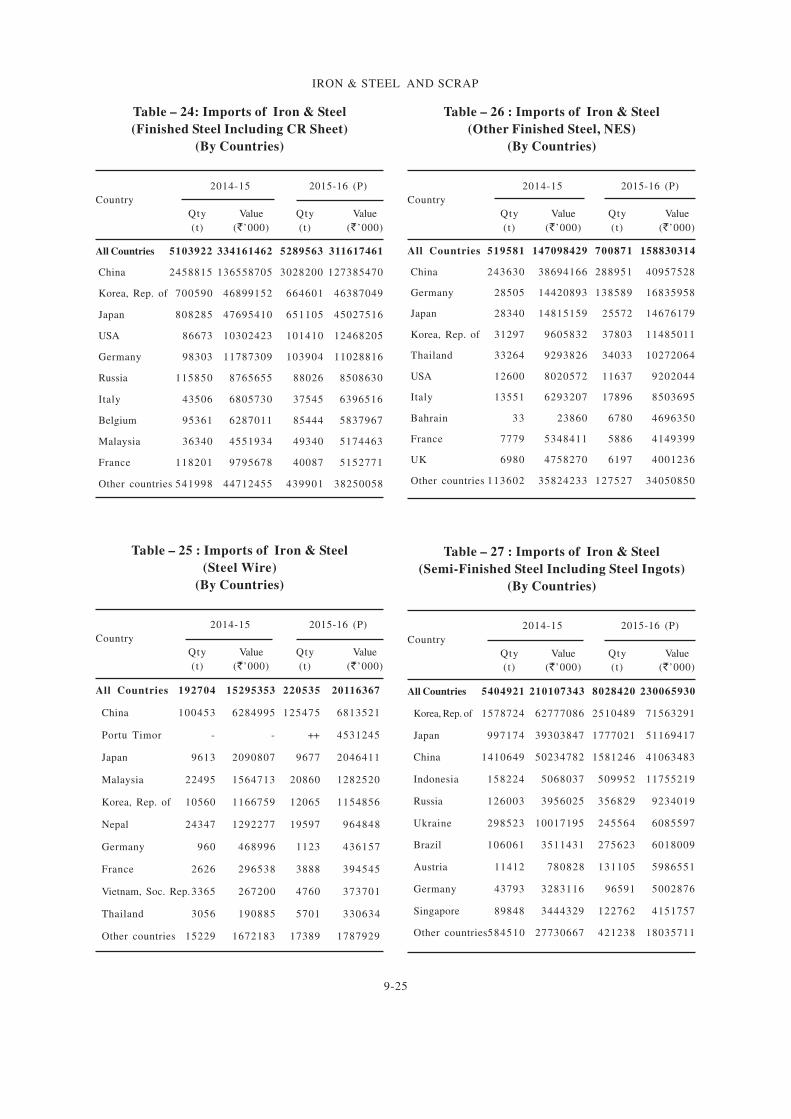
Imports
Imports of iron and steel (total) in 2015-16
increased sharply by 24% to 21.90 million tonnes
from 17.66 million tonnes in the previous year.
Imports in 2015-16 comprised semi-finished steel,
including ingots with 8.03 million tonnes (37%),
iron & steel scrap with 7.22 million tonnes (33%)
and finished steel, including cold rolled sheets
with 5.29 million tonnes (24%). Imports in 2015-
16 were mainly from China (24%), Republic of
Korea, (15%) and Japan (12%). The imports of
p ig and cas t i ron ( inc lud ing sp iege le i sen)
decreased to 62 thousand tonnes in 2015-16 from
68 thousand tonnes in the previous year. Imports
were mainly from Indonesia (25%), China (11%)
and Sweden (7%) (Tables-23 to 32).
Table – 13 : Exports of Iron & Steel (Total)
(By Countries)
2014-15 2015-16 (P)
Country
Qty Value Qty Value
(t) (`’000) (t) (`’000)
All Countries 12077670 868623121 9122896 677365320
USA 1411084 141922567 765860 104798227
UAE 1082821 77404825 727312 49310095
Nepal 1018670 35774206 1182825 33785827
Germany 238237 36954926 181681 30185051
Italy 660127 37608198 502403 28781594
Saudi Arabia 739336 47619830 250217 21656258
Belgium 296936 21779509 346885 21383538
UK 216924 24822054 157155 20626569
Iran 583011 39218247 346457 19738085
Bangladesh 475401 16057615 675631 18488404
Other countries 5355123 389461144 3986470 328611672
9-22
IRON & STEEL AND SCRAP
Table – 14 : Exports of Iron & Steel
(Finished Steel Including CR Sheet)
(By Countries)
2014-15 2015-16 (P)
Country
Qty Value Qty Value
(t) (`’000) (t) (` ’000)
All Countries 5204779 327875855 4082395 245248954
USA 779302 59138752 366237 31975971
UAE 382396 22066324 430439 22570137
Nepal 512824 16809228 498102 13609023
Belgium 152534 11358233 180022 11641179
Iraq 94658 7449696 140405 11430907
Italy 135121 9939765 146183 9455889
Spain 177248 9489176 149655 7988437
Ethiopia 127784 7021920 146469 7235620
Indonesia 74646 5262749 75420 6075308
Iran 169269 12082563 126496 5946147
Other countries 2598997 167257449 1822967 117320336
Table – 15 : Exports of Iron & Steel
(Steel wire)
(By Countries)
2014-15 2015-16 (P)
Country
Qty Value Qty Value
(t) (`’000) (t) (`’000)
All Countries 141766 18752335 157443 18119133
USA 19878 4045734 22599 3863885
Netherlands 14856 2396212 17397 2591648
Nepal 4023 168053 43672 989704
Turkey 6898 1150941 5867 886282
Italy 4204 708713 4212 651800
UAE 8195 599651 8139 578405
Belgium 3637 747194 2935 538126
Germany 3076 671820 2720 530440
South Africa 1044 234431 1963 495067
Russia 1274 304565 2484 471377
Other countries 74681 7725021 45455 6522399
Table – 16 : Exports of Iron & Steel
(Other Finished Steel, NES)
(By Countries)
2014-15 2015-16 (P)
Country
Qty Value Qty Value
(t) (`’000) (t) (`’000)
All Countries 2096172 307489015 1975668 286253755
USA 359036 59386260 297995 58126208
Germany 157186 24998082 119242 20988501
UAE 155058 34869377 171540 20453594
UK 116497 17404098 105416 15986646
Saudi Arabia 135517 14023803 148431 14665880
Netherlands 29299 4768033 53065 8445643
Canada 55750 7134917 59774 7178587
Italy 42942 8310575 34921 7074822
France 31901 6310235 29209 5778902
Chile 2877 431368 56490 4634054
Other countries 1010109 129852267 899585 122920918
Table – 17 : Exports of Iron & Steel
(Semi-Finished Steel Including Steel Ingot)
(By Countries)
2014-15 2015-16 (P)
Country
Qty Value Qty Value
(t) (`’000) (t) (`’000)
All Countries 4332549 197264636 2671561 119641900
Nepal 395424 13665537 552612 15692235
Iran 400100 21650553 211294 12290819
Italy 476306 17761909 316292 11421333
USA 209453 13240926 72667 9946024
Bangladesh 173009 5788064 405739 8739356
Belgium 119743 6432415 143677 6070812
UAE 528405 19076244 113452 5202345
Germany 42287 5889471 28771 4321249
Sri Lanka 161566 5300673 127420 3540145
Turkey 22005 3264476 20271 2752719
Other countries1804251 85194368 679366 39664863
9-23
IRON & STEEL AND SCRAP
Table – 19 : Exports of Iron & Steel: Alloy Steel
(Powder)
(By Countries)
2014-15 2015-16 (P)
Country
Qty Value Qty Value
(t) (`’000) (t) (`’000)
All Countries 78 7509 224 12963
Japan - - 42 3097
Saudi Arabia - - 135 2867
Bangladesh 13 2007 5 1876
China - - 23 1628
Iran 24 1065 16 1120
Indonesia 1 402 1 747
USA 19 236 2 724
Turkey ++ 427 ++ 465
Germany 1 195 ++ 176
Nepal 14 1015 ++ 112
Other countries 6 2162 ++ 151
Table–21: Exports of Iron & Steel
(Sponge iron)
(By Countries)
2014-15 2015-16 (P)
Country
Qty Value Qty Value
(t) (`’000) (t) (`’000)
All Countries 207683 4776601 192823 3215979
Bangladesh 98725 2158059 127204 2041887
Nepal 64317 1490129 51781 740170
Bhutan 6268 163987 11556 330858
USA 417 54047 439 65077
Sri Lanka 2581 59565 654 12901
Ethiopia - - 540 8966
Madagascar - - 328 4406
Korea, Rep. of 15 2316 22 3425
UAE 32 2007 77 1953
Saudi Arabia - - 99 1827
Other countries 35328 846491 123 4509
Table – 20 : Exports of Iron & Steel (Scrap)
(By Countries)
2014-15 2015-16 (P)
Country
Qty Value Qty Value
(t) (`’000) (t) (`’000)
All Countries 4789 532480 4917 306686
Sweden 2732 405592 2100 221297
Bangladesh 615 12819 1683 34491
USA 363 9552 498 15146
Brazil 34 2888 103 9064
France 2 116 23 4474
Mauritious ++ 25 15 2718
Hong Kong 10 1038 33 2529
Germany 124 39546 9 2226
Nepal 65 2519 37 2196
Tanzania, Rep 100 2876 100 2072
Other countries 744 55509 316 10473
Table – 18 : Exports of Iron & Steel : Alloy Steel
(Granules)
(By Countries)
2014-15 2015-16 (P)
Country
Qty Value Qty Value
(t) (`’000) (t) (`’000)
All Countries 1257 73375 330 23543
USA 278 27052 119 12543
Saudi Arabia 114 5586 78 3401
UAE 94 4613 25 1357
Malaysia - - 13 1312
Bangladesh 17 771 18 1267
Chinese Taipei/
Taiwan 27 1410 27 1218
Germany 1 50 26 1105
Kuwait 10 586 11 594
Bahrain Is 5 333 3 209
Jordan 4 236 4 173
Other countries 707 32738 6 364
9-24
IRON & STEEL AND SCRAP
Table – 22 : Exports of Pig & Cast Iron
(Including Spiegeleisen)
(By Countries)
2014-15 2015-16 (P)
Country
Qty Value Qty Value
(t) (`’000) (t) (`’000)
All Countries 650353 15064847 328278 6041511
Thailand 256317 5798296 175807 2795154
Chinese Taipei/Taiwan 18551 471290 44427 746732
Bangladesh 5015 138026 26626 478717
Egypt 750 36598 26070 444160
Japan 6066 238925 10002 350044
Saudi Arabia 97599 2177671 16299 335559
Pakistan 9672 263684 11977 238144
USA 1323 111334 1581 148051
Bhutan 3236 72157 5793 97545
Nepal 4781 111200 5249 84284
Other countries 247043 5645666 4447 323121
Table - 23 : Imports of Iron & Steel (Total)
(By Countries)
2014-15 2015-16 (P)
Country
Qty Value Qty Value
(t) (`’000) (t) (` ’000)
All Countries 17656424 940534386 21898078 930430146
China 4345550 242747456 5170411 224603284
Korea, Rep. of 2387739 125627045 3381047 138151953
Japan 1876510 107994428 2578005 117061939
USA 561213 34133830 1283565 49092804
Germany 393326 37532396 476061 38646986
UAE 1120819 36976012 1200138 30955315
UK 881803 34696748 1009979 30208913
Russia 281347 14901092 474247 20526192
Thailand 166166 20052260 229028 19813550
Malaysia 301102 19838148 352333 19030043
Other countries 5340849 266034971 5743264 242339167
9-25
IRON & STEEL AND SCRAP
Table – 27 : Imports of Iron & Steel
(Semi-Finished Steel Including Steel Ingots)
(By Countries)
2014-15 2015-16 (P)
Country
Qty Value Qty Value
(t) (`’000) (t) (`’000)
All Countries 5404921 210107343 8028420 230065930
Korea, Rep. of 1578724 62777086 2510489 71563291
Japan 997174 39303847 1777021 51169417
China 1410649 50234782 1581246 41063483
Indonesia 158224 5068037 509952 11755219
Russia 126003 3956025 356829 9234019
Ukraine 298523 10017195 245564 6085597
Brazil 106061 3511431 275623 6018009
Austria 11412 780828 131105 5986551
Germany 43793 3283116 96591 5002876
Singapore 89848 3444329 122762 4151757
Other countries584510 27730667 421238 18035711
Table – 25 : Imports of Iron & Steel
(Steel Wire)
(By Countries)
2014-15 2015-16 (P)
Country
Qty Value Qty Value
(t) (`’000) (t) (` ’000)
All Countries 192704 15295353 220535 20116367
China 100453 6284995 125475 6813521
Portu Timor - - ++ 4531245
Japan 9613 2090807 9677 2046411
Malaysia 22495 1564713 20860 1282520
Korea, Rep. of 10560 1166759 12065 1154856
Nepal 24347 1292277 19597 964848
Germany 960 468996 1123 436157
France 2626 296538 3888 394545
Vietnam, Soc. Rep.3365 267200 4760 373701
Thailand 3056 190885 5701 330634
Other countries 15229 1672183 17389 1787929
Table – 24: Imports of Iron & Steel
(Finished Steel Including CR Sheet)
(By Countries)
2014-15 2015-16 (P)
Country
Qty Value Qty Value
(t) (`’000) (t) (` ’000)
All Countries 5103922 334161462 5289563 311617461
China 2458815 136558705 3028200 127385470
Korea, Rep. of 700590 46899152 664601 46387049
Japan 808285 47695410 651105 45027516
USA 86673 10302423 101410 12468205
Germany 98303 11787309 103904 11028816
Russia 115850 8765655 88026 8508630
Italy 43506 6805730 37545 6396516
Belgium 95361 6287011 85444 5837967
Malaysia 36340 4551934 49340 5174463
France 118201 9795678 40087 5152771
Other countries 541998 44712455 439901 38250058
Table – 26 : Imports of Iron & Steel
(Other Finished Steel, NES)
(By Countries)
2014-15 2015-16 (P)
Country
Qty Value Qty Value
(t) (`’000) (t) (`’000)
All Countries 519581 147098429 700871 158830314
China 243630 38694166 288951 40957528
Germany 28505 14420893 138589 16835958
Japan 28340 14815159 25572 14676179
Korea, Rep. of 31297 9605832 37803 11485011
Thailand 33264 9293826 34033 10272064
USA 12600 8020572 11637 9202044
Italy 13551 6293207 17896 8503695
Bahrain 33 23860 6780 4696350
France 7779 5348411 5886 4149399
UK 6980 4758270 6197 4001236
Other countries 113602 35824233 127527 34050850

9-26
IRON & STEEL AND SCRAP
Table – 28 : Imports of Iron & Steel: Alloy Steel
(Granules)
(By Countries)
2014-15 2015-16 (P)
Country
Qty Value Qty Value
(t) (`’000) (t) (` ’000)
All Countries 18570 852396 16076 761176
Spain 4231 237868 4617 221863
France 3942 189324 4040 164616
China 1499 81865 2035 91576
Italy 2106 115995 1540 77328
South Africa 1036 49993 1217 52404
Germany 798 54994 898 50892
Chinese Taipei/
Taiwan 864 48350 938 44801
Japan 3152 24261 130 21996
Thailand 497 25963 386 18027
Australia - - 22 5994
Other countries 445 23783 253 11679
Table-29 : Imports of Iron & Steel: Alloy Steel
( Powder)
(By Countries)
2014-15 2015-16 (P)
Country
Qty Value Qty Value
(t) (`’000) (t) (` ’000)
All Countries 2505 587519 2433 584091
UK 221 154910 222 145493
Sweden 950 139685 1147 135468
USA 303 74553 331 95914
China 187 49795 310 81607
Japan 8 15971 19 51204
Canada 780 86164 319 33295
Belgium 38 38726 46 30278
Germany 4 5604 29 8872
South Africa 9 787 9 766
Singapore 5 18600 1 562
Other countries ++ 2724 ++ 632
Table-30 : Imports of Iron & Steel (Scrap)
(By Countries)
2014-15 2015-16 (P)
Country
Qty Value Qty Value
(t) (`’000) (t) (`’000)
All Countries 5935948 203477830 7218869 184440592
USA 446989 13944386 1156907 25515760
UAE 869141 26633270 1025900 22915429
UK 839487 25904270 970218 22432019
South Africa 898553 23243347 773903 16166401
Singapore 239872 9422737 399914 10012088
Australia 253667 8311686 406566 8675425
Malaysia 197755 9998219 223670 8202171
Thailand 107253 8592480 143221 6893837
Netherlands 135167 10037742 108197 6577405
Korea, Rep. of 55405 4370141 118343 6073583
Other countries 1892659 63019552 1892030 50976474

9-27
IRON & STEEL AND SCRAP
FUTURE OUTLOOK
India is ranked as third largest producer of
crude steel in the world. The Steel Industry in
general is on the upswing due to strong growth in
demand propelled by the strong domestic demand
for steel particularly from the Construction,
Manufacturing and Automotive sectors. India is
also the largest producer of sponge iron in the
world. The economic reforms and the consequent
liberalisation of the Iron & Steel Sector brought a
sea change in the Industry, particularly in the field
of greenfield steel plants in the Private Sector.
The growth of the Steel Sector is linked
intricately with the growth of the Indian economy,
especially with growth of the steel consuming
sec tors . The Budget 2017 main ta ined the
consistent and pragmatic emphasis on providing
impetus to attract investment for fuelling large
scale infrastructure development. This coupled
with 12th Five Year Plan's target of trillion dollar
infrastructure investment are big positives for
steel demand.
As per the report of the Working Group on
Mineral Exploration and Development (other
than coal & lignite) for XII Five Year Plan
(2012-17) of the erstwhile Planning Commission,
technologies for agglomeration, pelletisation
and direct use of fines to produce steel and taken
up to achieve the national goal to produce 200
million tonnes per annum of steel by 2020.
The New Steel Policy, 2017 aspires to achieve
300 MT of steel making capacity by 2030. The new
Steel Policy further seeks to increase per capita
steel consumption to the level of 160 kg by 2030
from the existing level of around 60 kg.
The World Steel Association forecasts that
global steel demand will increase by 1.3% and 0.9%
in 2017 and 2018, respectively. Global steel demand
over the next decade will mainly depend on the
emerging and developing economies.
Table-31 : Imports of Iron & Steel
(Sponge Iron)
(By Countries)
2014-15 2015-16 (P)
Country
Qty Value Qty Value
(t) (`’000) (t) (` ’000)
All Countries 143129 3331349 31226 600354
Bahrain 17456 404676 14551 276293
UAE 42519 990195 12992 247474
Oman 63903 1466392 3563 74918
Bhutan - - 110 1110
Germany 6 401 10 514
UK - - ++ 23
USA ++ 49 ++ 12
Italy - - ++ 10
Russia 18000 433923 - -
Saudi Arabia 1033 24069 - -
Other countries 212 11644 - -
Table-32 : Imports of Pig & Cast Iron
(Incl. Speigeliesen)
(By Countries)
2014-15 2015-16 (P)
Country
Qty Value Qty Value
(t) (`’000) (t) (`’000)
All Countries 68887 4591408 62422 3979008
Indonesia 13648 727259 15902 842794
China 4088 399668 6590 405032
Sweden 4233 381901 4643 350341
Germany 1564 320542 2016 311991
Japan 500 245414 481 271445
USA 2453 297092 2036 260355
Italy 5532 353935 3231 225510
UK 1811 224810 924 224911
Spain 5968 344698 4508 219438
Chinese Taipei/
Taiwan 5916 219659 4633 140112
Other countries 23174 1076430 17458 727079