Internet of Things (IoT) based Smart Agriculture Aiming ... - arXiv
Upload
khangminh22Category
view
2download
0
water
Review
IoT Based Smart Water Quality Monitoring: Recent Techniques,Trends and Challenges for Domestic Applications
Farmanullah Jan 1 , Nasro Min-Allah 1 and Dilek Düstegör 2,*
Citation: Jan, F.; Min-Allah, N.;
Düstegör, D. IoT Based Smart Water
Quality Monitoring: Recent
Techniques, Trends and Challenges
for Domestic Applications. Water
2021, 13, 1729. https://doi.org/
10.3390/w13131729
Academic Editor: Talis Juhna
Received: 22 May 2021
Accepted: 9 June 2021
Published: 22 June 2021
Publisher’s Note: MDPI stays neutral
with regard to jurisdictional claims in
published maps and institutional affil-
iations.
Copyright: © 2021 by the authors.
Licensee MDPI, Basel, Switzerland.
This article is an open access article
distributed under the terms and
conditions of the Creative Commons
Attribution (CC BY) license (https://
creativecommons.org/licenses/by/
4.0/).
1 Department of Computer Science, College of Computer Science and Information Technology,Imam Abdulrahman Bin Faisal University, P.O. Box 1982, Dammam 34221, Saudi Arabia;[email protected] (F.J.); [email protected] (N.M.-A.)
2 Department of Computer Engineering, College of Computer Science and Information Technology,Imam Abdulrahman Bin Faisal University, P.O. Box 1982, Dammam 34221, Saudi Arabia
* Correspondence: [email protected]
Abstract: Safe water is becoming a scarce resource, due to the combined effects of increased popu-lation, pollution, and climate changes. Water quality monitoring is thus paramount, especially fordomestic water. Traditionally used laboratory-based testing approaches are manual, costly, timeconsuming, and lack real-time feedback. Recently developed systems utilizing wireless sensornetwork (WSN) technology have reported weaknesses in energy management, data security, andcommunication coverage. Due to the recent advances in Internet-of-Things (IoT) that can be appliedin the development of more efficient, secure, and cheaper systems with real-time capabilities, wepresent here a survey aimed at summarizing the current state of the art regarding IoT based smartwater quality monitoring systems (IoT-WQMS) especially dedicated for domestic applications. Inbrief, this study probes into common water-quality monitoring (WQM) parameters, their safe-limitsfor drinking water, related smart sensors, critical review, and ratification of contemporary IoT-WQMSvia a proposed empirical metric, analysis, and discussion and, finally, design recommendations foran efficient system. No doubt, this study will benefit the developing field of smart homes, offices,and cities.
Keywords: Internet-of-Things; water quality; smart water tank; smart city; smart home; smart offices;smart embedded systems
1. Introduction
Water is essential for life on earth. Yet, numerous countries are facing shortages offreshwater [1–3]. This alarming issue strongly motivated them to utilize other availableresources instead. For example, Gulf countries are acquiring freshwater from the seathrough a tedious desalination process [4,5]. Increased costal industrialization and resultingwater pollution, however, is making this process even more challenging. Other countriesare processing rainwater to obtain freshwater [6]. However, lately climate change isaffecting rainfalls, which is putting into jeopardy this option [7–9].
Countries where freshwater is more accessible are unfortunately not safe from waterrelated issues [10–12]. Water pollution has been reported for years as a growing concern [13].For example, the America Clean Water Foundation established the water monitoring day(called the EarthEcho Water Challenge) in 2003 [13,14]. Its main agenda is to spread publicawareness regarding water pollution. Both the United States Environmental ProtectionAgency (USEPA) and World Health Organization (WHO) are constantly providing updatesand recommendations on how to cope with the newly detected water contaminants anddiseases [15–18].
On the top of pollution and studies pointing out to global-warming’s impact onwater resources [19–21], the World Water Council (WWC) is predicting a global populationincrease by 40% to 50% over the next 50 years [22]. This significant growth, in conjunction
Water 2021, 13, 1729. https://doi.org/10.3390/w13131729 https://www.mdpi.com/journal/water
Water 2021, 13, 1729 2 of 37
with urbanization and industrialization, may greatly increase the overall water demand.All aforementioned pointers are indicating a potential global water crisis coming.
In the eve of such a water crisis, freshwater is commonly turning into an indus-trial product. Under the municipality control in urban areas, it is often stored in over-head/underground tanks, sometimes for extended period prior to consumption [23].Continuous monitoring of water quality is thus necessary, to classify water for its suitableapplication and prevent waste. For example, water that is not good for drinking can beused for cleaning purposes.
Recently, motivated by the progress in Internet-of-Things (IoT), several IoT-basedsolutions have been devised to water monitoring [19–21,24]. Most commercial systems(e.g., Hach guardian blue, Canary, optiEDS, Libelium Inc., Biz4Intellia, and Bluebox)have reported enhanced efficiency as opposed to previous systems centered around oldertechnologies [19,25]. However, these systems are either very costly or their architecturesare closed for public usage [19,26,27]. Therefore, the usage of such commercial systems hasbeen limited to developed countries only. This act led to a plethora of studies to devisecheap and reliable IoT-based smart solution to water monitoring, aiming to benefit fromthe communication infrastructure already existing for smart applications [28,29].
As an open research area of concern, several related review/survey articles have beenpublished to highlight progress in the sensor and wireless communication technology,cloud services, and computing devices among others. In [30], authors present an excellentreview on WSN technology for leak detection, but the article offers no contents on waterquality monitoring. While Pule et al. [31] focus their survey on environmental monitoringwith emphasis on water, they mainly cover WSN technology missing new IoT based smartsystems. Similarly, Ahmed et al. [19] centered their review paper around water qualitymonitoring, covering all technologies including WSN, but new IoT based systems. Geethaand Gouthami [32] in their review paper also included the real-time dimension of smartwater quality monitoring systems but kept a rather generic scope while covering IoT basedtechniques. Damor and Sharma [24] in their review paper made a first attempt to coverIoT based systems, but a critical analysis, and comparison of methods is missing. In theirstudy, Banna et al. [21] provide a survey of existing and emerging sensors technologiesfor water monitoring. However, it also has given very less attention to IoT based systems.Adu-manu et al. [20] published an exclusive review on water quality monitoring usingWSN technology. This is a great resource of knowledge, but unfortunately only covers upto WSN-based water monitoring systems and needs to be extended to include the newIoT applications in the same field. In [25], the Public Utilities Board Singapore provides asuccess story of the application of commercial smart-water monitoring technologies formanaging water distribution network. However, as we mentioned earlier, these commercialsystems are generally expensive and can hardly be widely adopted. Finally, Pujar et al. [33]and Li et al. [34] address in their recent respective review papers smart water systems, butthey fail to focus on the quality aspects of the water.
As highlighted above, available reviews that are focusing on new IoT technologiesfail to focus on water quality, and reviews centered around water quality monitoringsystems are weak in reporting about IoT technologies and consequent smart systems.Additionally, to the best of authors’ knowledge, no contemporary review is dedicated todomestic water applications, although maintaining the quality of drinking water above aminimum threshold is vital [15,17,35,36].
Aiming to fill the research gap, this study offers an in-depth literature review onIoT-WQMS for domestic water. Thus, major contributions of this study are:
• Definition of a new evaluation-rubric considering standard requirements for drinking water;• Systematic comparison of contemporary IoT-WQMS, highlighting weaknesses and strengths;• Recommendations to design an efficient IoT-WQMS for drinking water.
Water 2021, 13, 1729 3 of 37
The rest of this article is structured as follows: Section 2 offers background knowledgeto better understand the freshwater crisis. It also reminds important water quality index(WQI), and WHO safe limits for drinking water. Section 3 details water quality monitoringtechniques, highlighting the evolution of water monitoring methods from traditional tosmart water monitoring, including the related IoT technology and common WQM sensors.Section 4 offers a critical review of contemporary IoT-WQMS for domestic water. Allsystems have been evaluated via a newly developed empirical rubric, which is mainlybased on the WHO standard-parameters of drinking water. Section 5 provides detaileddiscussion and analysis, with pros and cons of contemporary IoT-WQMS. Moreover, itoffers a set of useful recommendations to design an efficient IoT-WQMS. Finally, Section 6concludes this study. Table 1 shows the acronyms used in this article.
Table 1. Acronyms used in the article.
Acronym Description Acronym Description
AWQI Acceptability Water Quality Index PCB Printed circuit boardsBRB belief rule-based PPM Parts per millionC-Cl chloramines PR PressureCl Chloride PVC Polyvinyl chlorideCl2 amount of residual chlorine present in water as dissolved gas RC Residual chlorineCO2 Carbon Dioxide SLM Sensors layer moduleCSM Cloud services module SLM-CM Communication-moduleDO dissolved oxygen SLM-DM Digital-moduleDWQI Drinking water quality index SLM-SM Sensors-moduleEC Electrical conductivity SoC System-on-ChipFC Fecal coliform SPI Serial peripheral interfaceF-Cl Free chlorine T TemperatureFR Flow rate TC Total coliformGWM Gateway module t-Cl Total ChlorineHOCl Concentration of free chlorine TDS Total dissolved solidsHWQI Health water quality index TH Total hardnessIoT Internet of Things TSS Total suspended solidsIoT-WQMS IoT based smart water quality monitoring systems Turb TurbulenceLDR Light dependent resistor UIM User interface moduleLoS Line-of-site USEPA United States Environmental Protection AgencyLPG Liquified Petroleum Gas VDA Vector distance algorithmML Machine learning WHO World Health OrganizationmV milli-volt WQI Water Quality IndexNTU Nephelometric Turbidity Unit WQMS Water Quality Monitoring SystemOcl Hypochlorite ion WSN Wireless Sensor NetworkORP Oxidation reduction potential WWC World Water Council
2. Background
This section provides details about the prominent water concerns (e.g., pollution),water quality, water quality index, safe limits for drinking water, and WQM sensors.
2.1. Water Background and Existing Conerns
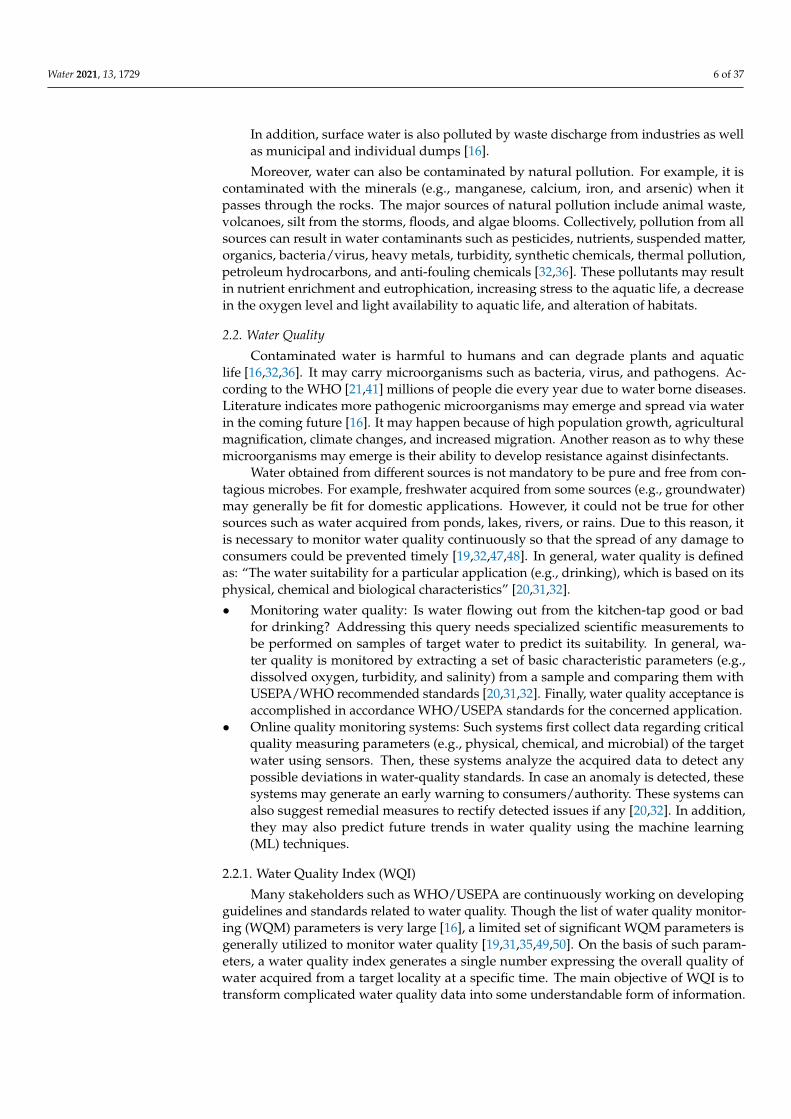
There is a visual misconception that most of earth is made of water (Figure 1). While71% of earth surface is covered with water, this ratio is smaller as compared with its totalvolume [37,38]. Around 97% of total earth water is available in oceans, which is not directlyuseful for agriculture, humans, and plants due to heavy salt content [16]. Only the remain-ing 3% of total earth water exists in the form of freshwater [39]. Unfortunately, around 69%of it is also trapped in polar-icecaps and glaciers. In addition, approximately 30% of it isgroundwater. Consequently, around 1% of freshwater is available for humans [37,38]. Inaddition to its scarcity, freshwater is today under paramount stress due to many challengessuch as [40]:

Water 2021, 13, 1729 4 of 37
1. High consumption in urban areas;2. Heavy consumption in industrial applications;3. Used largely in agricultural activities;4. Affected by climatic changes due to global-warming phenomenon.
Combined with the uneven distribution of water around the world, a large humanpopulation does not have access to safe water. Therefore, thousands of humans die and getaffected every year due water-borne diseases such as malaria, cholera, polio, dengue, andtyphoid, etc. [41].
Figure 1. The blue marble, courtesy of Nasa [42].
2.1.1. Seawater Desalination
Due to heavy salt contents, direct drinking of seawater may cause dehydration inhumans, and it may thus become fatal if consumed for longer periods. In many water-scarcecountries, freshwater is running short due to drastic urbanization and industrializationgrowth. However, to overcome this issue, such countries are now acquiring freshwater fromseawater through a desalination process, e.g., reverse osmosis [4]. This process basicallyremoves the dissolved salt contents and other minerals from seawater if any. For potablewater, minerals are added to get water quality according to WHO/USEPA standards. Waterdesalination is a costly process, which needs considerable energy, manpower, and funds.
2.1.2. Groundwater Depletion
Groundwater exists beneath earth’s surface, which is stored in and moves graduallythrough the geologic formations (called aquifers) of the sand, soil, gravel, and rocks [43,44].Water can easily flow through spaces existing in such objects. However, the speed at whichwater flows from one point to another greatly relies on size of spaces and how well theyare linked together.
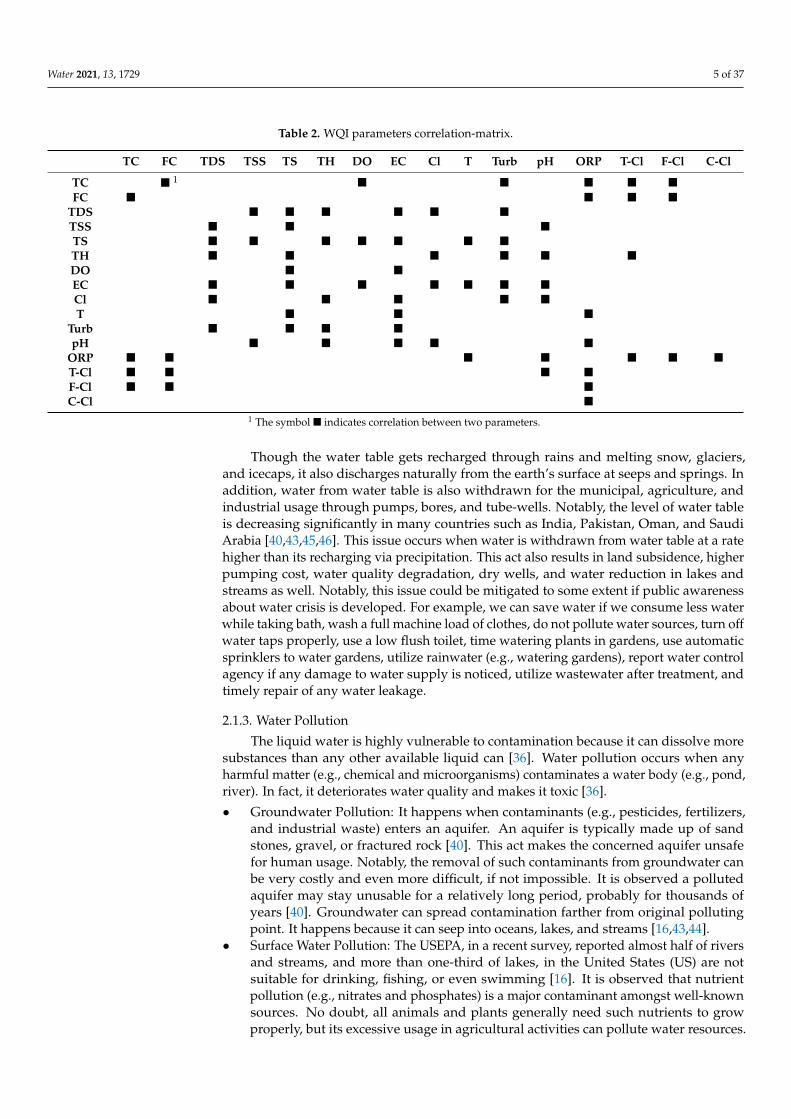
The literature reveals groundwater exists everywhere around our globe, but its re-sources are distributed unevenly by nature [37,40]. Is the water table under the earthsurface shallow or deep? May its level rise or fall? Answering these questions generallyrelies on many factors. For example, melting of snow/glaciers and heavy rainfalls generallycauses the level of the water table to rise. On other hand, its level may fall due to overwater pumping. The term water table means the depth by which voids and fractures inrocks or soil-pore spaces get fully saturated with water (Table 2) [43,44].
Water 2021, 13, 1729 5 of 37
Table 2. WQI parameters correlation-matrix.
TC FC TDS TSS TS TH DO EC Cl T Turb pH ORP T-Cl F-Cl C-Cl
TC 1 FC
TDS TSS TS TH DO EC Cl T
Turb pH
ORP T-Cl F-Cl C-Cl
1 The symbol indicates correlation between two parameters.
Though the water table gets recharged through rains and melting snow, glaciers,and icecaps, it also discharges naturally from the earth’s surface at seeps and springs. Inaddition, water from water table is also withdrawn for the municipal, agriculture, andindustrial usage through pumps, bores, and tube-wells. Notably, the level of water tableis decreasing significantly in many countries such as India, Pakistan, Oman, and SaudiArabia [40,43,45,46]. This issue occurs when water is withdrawn from water table at a ratehigher than its recharging via precipitation. This act also results in land subsidence, higherpumping cost, water quality degradation, dry wells, and water reduction in lakes andstreams as well. Notably, this issue could be mitigated to some extent if public awarenessabout water crisis is developed. For example, we can save water if we consume less waterwhile taking bath, wash a full machine load of clothes, do not pollute water sources, turn offwater taps properly, use a low flush toilet, time watering plants in gardens, use automaticsprinklers to water gardens, utilize rainwater (e.g., watering gardens), report water controlagency if any damage to water supply is noticed, utilize wastewater after treatment, andtimely repair of any water leakage.
2.1.3. Water Pollution
The liquid water is highly vulnerable to contamination because it can dissolve moresubstances than any other available liquid can [36]. Water pollution occurs when anyharmful matter (e.g., chemical and microorganisms) contaminates a water body (e.g., pond,river). In fact, it deteriorates water quality and makes it toxic [36].
• Groundwater Pollution: It happens when contaminants (e.g., pesticides, fertilizers,and industrial waste) enters an aquifer. An aquifer is typically made up of sandstones, gravel, or fractured rock [40]. This act makes the concerned aquifer unsafefor human usage. Notably, the removal of such contaminants from groundwater canbe very costly and even more difficult, if not impossible. It is observed a pollutedaquifer may stay unusable for a relatively long period, probably for thousands ofyears [40]. Groundwater can spread contamination farther from original pollutingpoint. It happens because it can seep into oceans, lakes, and streams [16,43,44].
• Surface Water Pollution: The USEPA, in a recent survey, reported almost half of riversand streams, and more than one-third of lakes, in the United States (US) are notsuitable for drinking, fishing, or even swimming [16]. It is observed that nutrientpollution (e.g., nitrates and phosphates) is a major contaminant amongst well-knownsources. No doubt, all animals and plants generally need such nutrients to growproperly, but its excessive usage in agricultural activities can pollute water resources.
Water 2021, 13, 1729 6 of 37
In addition, surface water is also polluted by waste discharge from industries as wellas municipal and individual dumps [16].
Moreover, water can also be contaminated by natural pollution. For example, it iscontaminated with the minerals (e.g., manganese, calcium, iron, and arsenic) when itpasses through the rocks. The major sources of natural pollution include animal waste,volcanoes, silt from the storms, floods, and algae blooms. Collectively, pollution from allsources can result in water contaminants such as pesticides, nutrients, suspended matter,organics, bacteria/virus, heavy metals, turbidity, synthetic chemicals, thermal pollution,petroleum hydrocarbons, and anti-fouling chemicals [32,36]. These pollutants may resultin nutrient enrichment and eutrophication, increasing stress to the aquatic life, a decreasein the oxygen level and light availability to aquatic life, and alteration of habitats.
2.2. Water Quality
Contaminated water is harmful to humans and can degrade plants and aquaticlife [16,32,36]. It may carry microorganisms such as bacteria, virus, and pathogens. Ac-cording to the WHO [21,41] millions of people die every year due to water borne diseases.Literature indicates more pathogenic microorganisms may emerge and spread via waterin the coming future [16]. It may happen because of high population growth, agriculturalmagnification, climate changes, and increased migration. Another reason as to why thesemicroorganisms may emerge is their ability to develop resistance against disinfectants.
Water obtained from different sources is not mandatory to be pure and free from con-tagious microbes. For example, freshwater acquired from some sources (e.g., groundwater)may generally be fit for domestic applications. However, it could not be true for othersources such as water acquired from ponds, lakes, rivers, or rains. Due to this reason, itis necessary to monitor water quality continuously so that the spread of any damage toconsumers could be prevented timely [19,32,47,48]. In general, water quality is definedas: “The water suitability for a particular application (e.g., drinking), which is based on itsphysical, chemical and biological characteristics” [20,31,32].
• Monitoring water quality: Is water flowing out from the kitchen-tap good or badfor drinking? Addressing this query needs specialized scientific measurements tobe performed on samples of target water to predict its suitability. In general, wa-ter quality is monitored by extracting a set of basic characteristic parameters (e.g.,dissolved oxygen, turbidity, and salinity) from a sample and comparing them withUSEPA/WHO recommended standards [20,31,32]. Finally, water quality acceptance isaccomplished in accordance WHO/USEPA standards for the concerned application.
• Online quality monitoring systems: Such systems first collect data regarding criticalquality measuring parameters (e.g., physical, chemical, and microbial) of the targetwater using sensors. Then, these systems analyze the acquired data to detect anypossible deviations in water-quality standards. In case an anomaly is detected, thesesystems may generate an early warning to consumers/authority. These systems canalso suggest remedial measures to rectify detected issues if any [20,32]. In addition,they may also predict future trends in water quality using the machine learning(ML) techniques.
2.2.1. Water Quality Index (WQI)
Many stakeholders such as WHO/USEPA are continuously working on developingguidelines and standards related to water quality. Though the list of water quality monitor-ing (WQM) parameters is very large [16], a limited set of significant WQM parameters isgenerally utilized to monitor water quality [19,31,35,49,50]. On the basis of such param-eters, a water quality index generates a single number expressing the overall quality ofwater acquired from a target locality at a specific time. The main objective of WQI is totransform complicated water quality data into some understandable form of information.

Water 2021, 13, 1729 7 of 37
WQI has been controversial among researchers, which seems a bit logical because asingle number alone may not portray the entire picture of water quality. It is because alarge number of WQM parameters are generally ignored while computing it. In a broadersense, it basically offers a general idea about the overall water quality. Notably, the WHOgenerally recommends three common indices [18]:
1. Drinking water quality index (DWQI): It involves all WHO recommended guidelinesincluding microbes.
2. Health water quality index (HWQI): It involves microbial and health related qualitymeasuring parameters.
3. Acceptability water quality index (AWQI): It involves quality measuring parametersneeded for acceptability only.
In brief, HWQI involves parameters that may have adverse effects on human’s health.It is more concerned with consumers’ perception of water quality. Its main objective is toassess parameters related to water taste and odor. Notably, it is a relevant index, whichinvolves both AWQI and HWQI. Note, these indices only give an overall picture of waterquality, with no guarantee whether it is bad or good against a particular application [16].
2.2.2. Common WQI Parameters for Domestic Water
Communities living around globe use different sets of USEPA and WHO recom-mended WQM parameters to compute WQI of drinking water [19,32]. The followingtext highlights some WQI parameters commonly utilized by traditional laboratory-basedmethods while measuring water quality [19–21]:
• Total coliform (TC): It includes bacteria usually present in soil, animal and humanwaste, etc. The fecal coliforms belong to class of TC, which are generally found in fecesand guts of humans and animals. The membrane filtration, most probable number,multiple tube fermentation, and minimal medium ONPG methods are commonlyused to measure TC. Its unit is the number of organisms/100 mL (milliliter). Coliformbacteria are usually harmless to humans, but its presence is a signal of disease-causingpathogens. Commonly observed symptoms include general flu-type symptoms (e.g.,abdominal cramps, fever, and diarrhea) and gastrointestinal upset.
• Fecal coliform (FC): It is a subgroup of total coliform. Its most common member isEscherichia coli (E-Coli). These are bacteria existing in waste and intestines of bothcold- and warm-blooded humans and animals. FC are not pathogenic by themselves,but its presence means other pathogenic organisms may exist. The membrane filtration,most probable number, multiple tube fermentation, and minimal medium ONPGare common methods to measure FC. Its measuring unit is number of organismsper 100 mL.
• Total dissolved solids (TDS): It represents remains of both organic and inorganicsoluble solids present in water such as magnesium, calcium, sodium, potassiumcations, etc. It is highly correlated with salinity because water becomes saline if itincreases beyond a minimum threshold. Its major sources include pesticides, sewagetreatment, fertilizer, flood water, etc. The gravimetric method is generally used tomeasure it in mg/L.
• Total suspended solids (TSS): It represents the amount of remains of both organic andinorganic material suspended in water. It is correlated with light absorption in water.An increase in TSS may result in more light absorption, which will let water absorbsless oxygen. This act may have adverse effects on aquatic life. The gravimetric schemeis generally utilized to measure it in mg/L.
Water 2021, 13, 1729 8 of 37
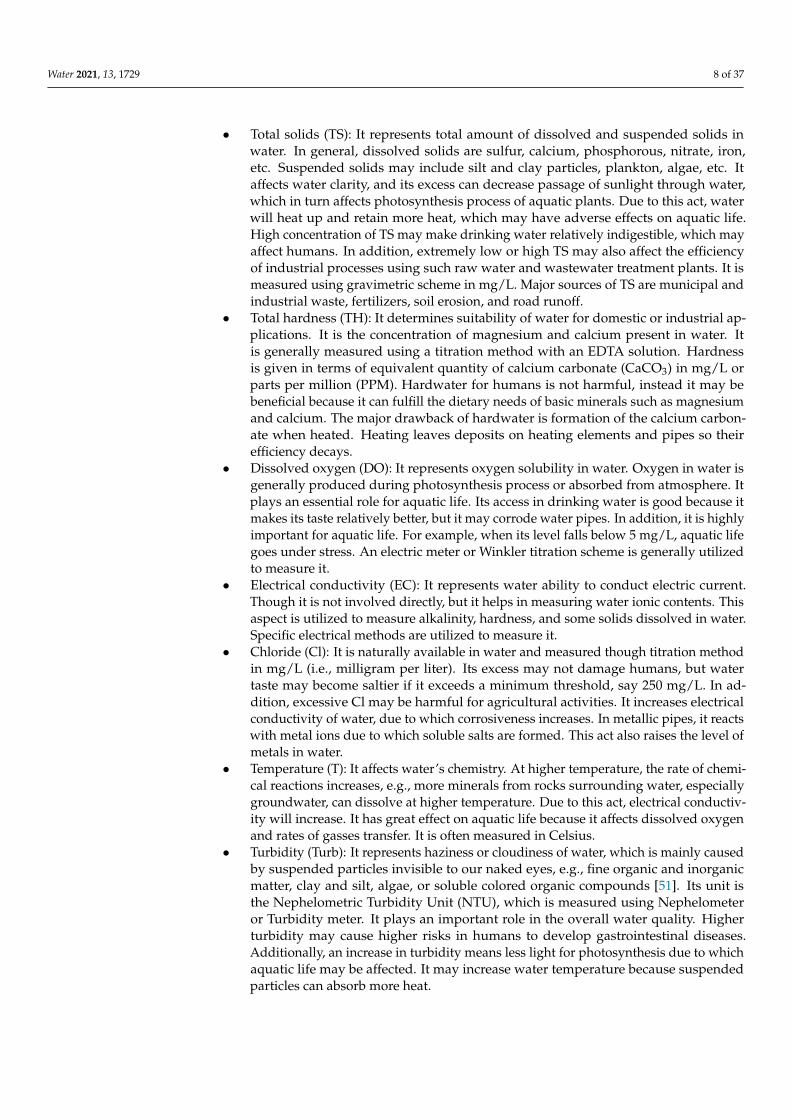
• Total solids (TS): It represents total amount of dissolved and suspended solids inwater. In general, dissolved solids are sulfur, calcium, phosphorous, nitrate, iron,etc. Suspended solids may include silt and clay particles, plankton, algae, etc. Itaffects water clarity, and its excess can decrease passage of sunlight through water,which in turn affects photosynthesis process of aquatic plants. Due to this act, waterwill heat up and retain more heat, which may have adverse effects on aquatic life.High concentration of TS may make drinking water relatively indigestible, which mayaffect humans. In addition, extremely low or high TS may also affect the efficiencyof industrial processes using such raw water and wastewater treatment plants. It ismeasured using gravimetric scheme in mg/L. Major sources of TS are municipal andindustrial waste, fertilizers, soil erosion, and road runoff.
• Total hardness (TH): It determines suitability of water for domestic or industrial ap-plications. It is the concentration of magnesium and calcium present in water. Itis generally measured using a titration method with an EDTA solution. Hardnessis given in terms of equivalent quantity of calcium carbonate (CaCO3) in mg/L orparts per million (PPM). Hardwater for humans is not harmful, instead it may bebeneficial because it can fulfill the dietary needs of basic minerals such as magnesiumand calcium. The major drawback of hardwater is formation of the calcium carbon-ate when heated. Heating leaves deposits on heating elements and pipes so theirefficiency decays.
• Dissolved oxygen (DO): It represents oxygen solubility in water. Oxygen in water isgenerally produced during photosynthesis process or absorbed from atmosphere. Itplays an essential role for aquatic life. Its access in drinking water is good because itmakes its taste relatively better, but it may corrode water pipes. In addition, it is highlyimportant for aquatic life. For example, when its level falls below 5 mg/L, aquatic lifegoes under stress. An electric meter or Winkler titration scheme is generally utilizedto measure it.
• Electrical conductivity (EC): It represents water ability to conduct electric current.Though it is not involved directly, but it helps in measuring water ionic contents. Thisaspect is utilized to measure alkalinity, hardness, and some solids dissolved in water.Specific electrical methods are utilized to measure it.
• Chloride (Cl): It is naturally available in water and measured though titration methodin mg/L (i.e., milligram per liter). Its excess may not damage humans, but watertaste may become saltier if it exceeds a minimum threshold, say 250 mg/L. In ad-dition, excessive Cl may be harmful for agricultural activities. It increases electricalconductivity of water, due to which corrosiveness increases. In metallic pipes, it reactswith metal ions due to which soluble salts are formed. This act also raises the level ofmetals in water.
• Temperature (T): It affects water’s chemistry. At higher temperature, the rate of chemi-cal reactions increases, e.g., more minerals from rocks surrounding water, especiallygroundwater, can dissolve at higher temperature. Due to this act, electrical conductiv-ity will increase. It has great effect on aquatic life because it affects dissolved oxygenand rates of gasses transfer. It is often measured in Celsius.
• Turbidity (Turb): It represents haziness or cloudiness of water, which is mainly causedby suspended particles invisible to our naked eyes, e.g., fine organic and inorganicmatter, clay and silt, algae, or soluble colored organic compounds [51]. Its unit isthe Nephelometric Turbidity Unit (NTU), which is measured using Nephelometeror Turbidity meter. It plays an important role in the overall water quality. Higherturbidity may cause higher risks in humans to develop gastrointestinal diseases.Additionally, an increase in turbidity means less light for photosynthesis due to whichaquatic life may be affected. It may increase water temperature because suspendedparticles can absorb more heat.
Water 2021, 13, 1729 9 of 37
• Potential of hydrogen (pH): Water with pH of 7 is considered as neutral. However,a value from 0 to 6 indicates acidity, while a range from 8 to 14 means alkalinity.Water with pH values from 6.5 to 8.5 is generally safe for human drinking [16]. It ismeasured using pH electrodes and electrometry. Acidic water is naturally corrosiveand soft. Drinking acidic water can cause serious diseases, e.g., diarrhea, kidneydisease, vomiting, and liver disease. In addition, it can also leach metals from fixturesand pipes, due to which aesthetic issues may happen, e.g., laundry staining. Drinkingalkaline water may also cause serious diseases, e.g., gastrointestinal issues. It maycreate aesthetic issues such as coffee having a bitter taste. In addition, it may causedeposits in the plumbing and degrade efficiency of electric water heater, heatingelements in industry, etc.
• Oxidation reduction potential (ORP): It is also known as the REDOX. It is measurementof a substance capability to either reduce or oxidize another substance. In general, anORP meter is used to measure ORP in millivolt (mV). A positive reading means thesubstance is an oxidizer (i.e., acceptor of electrons), whereas a negative reading meansit is a reducer (i.e., donors of electrons). To kill unwanted pathogens and bacteria inwater, generally chlorine having a high ORP is added. Oxidation will attract electronsfrom cell membranes, bacteria’s DNA, and proteins. In addition, oxygen also has highORP due to which it can disinfect water.
• Total chlorine (T-Cl): It represents the sum of free and combined chlorine. The levelsof T-Cl need to be measured precisely. It is necessary to identify the amount ofappropriate solutions, which need to be added to water in order to maintain theresidual levels of free chlorine. Numerous municipalities intentionally add chlorine towater to help kill harmful microorganisms (e.g., viruses and bacteria) that could makeus sick if ingested.
• Free chlorine (F-Cl): It is also known as the free chlorine residual, chlorine residual,or residual chlorine. It indicates the level of water potability. It is the amount ofresidual chlorine (RC) present in water as a dissolved gas (Cl2), hypochlorite ion(OCl−), and/or hypochlorous acid (HOCl). A test kit capable to measure free-Cl willshow the total amount of Cl2, OCL−, and HOCL. Its unit is mg/L. It is generally usedto disinfect contaminated water. F-Cl in water is tested through pool test kits, digitalcolorimeters, or color-wheel test kits. Its presence in water means water is protectedfrom recontamination during storage and free from most disease-causing pathogens.
• Combined chlorine (C-Cl): It is also known as Chloramines. It represents residualchlorine in water, which is chemically combined with ammonia or organic aminesgenerally found in polluted or natural water body. Ammonia is, sometimes, addeddeliberately to public water supply through a chloramination process. When free-Clmakes contact with different contaminants, it transforms into C-Cl (chloramines),which is less capable of disinfecting water. Chloramines may irritate the mucousmembranes, cause red-eyes and eye-stinging, irritate respiratory systems, and reducethe disinfection power of free-Cl.
As shown in Table 2, most WQI parameters have strong correlation with each other.For example, DO decreases with a rise in temperature and vice versa. ORP gives anindication of FC [48]. Similarly, higher turbidity means higher level of TSS [35].
2.2.3. WHO/USEPA Safe Limits of Drinking Water
WQM parameters commonly used in contemporary IoT-WQMS include EC, pH, Turb,ORP, Free-Cl, RC, TDS, T, DO, sodium, fluoride, manganese, magnesium hardness, calciumhardness, and hydrogen sulfide [20]. Table 3 shows threshold limits of these parameters,which are recommended by WHO/USEPA for drinking water. For optimal values andcorresponding effects, developers should consult detailed explanation in [16,17]. For safety,researchers and other stakeholders are advised to strictly adhere to WHO/USEPA safetyguidelines of drinking water.

Water 2021, 13, 1729 10 of 37
Table 3. WQM parameters safe limits for drinking water.
Parameter Comments Safe Limits Unit
EC It is the ability of an aqueous solution to allow electric current. It is generallyused to measure salinity in water. 300~800 µS/cm
pH pH = − log[H+]; effective hydrogen-ion concentration. 6.5~8.5 pHTurb Solids suspended in water, which hurdle with light transmission. 1.0~5.0 NTUORP It indicates the ability to either accept or release electrons via a chemical reaction. 650~700 mVFree-Cl It is responsible to chlorinate microbes in water. 0.2~5.0 mg/L
RC Residual chlorine is the amount of chlorine which remains in waterafter chlorination. 2.0~3.0 mg/L
TDS It is the amount of organic and inorganic materials. 600~1000 mg/LT It has high correlation with DO and pH. 10~22 CDO Amount of oxygen dissolved in water. 5.0~6.0 mg/LSodium A common mineral existing in the form of salt (Sodium chloride). 30~60 mg/L
Fluoride When fluorine reacts with minerals in soil/rocks, then fluoridesalt is developed.
4 or 2(secondarystandard)
mg/L
Manganese This mineral exists in rocks/soil. <0.1 mg/L
Magnesium- hardness This is amount of the magnesium salt. It affects water taste and may leavedeposits on heating elements, etc. 50~100 mg/L
Calcium- hardness It is amount of calcium salt and may degrade performance of detergents, etc. 75~100 mg/LHydrogen sulfide It is formed when sulfur and sulfate-reducing bacteria react in water. 0.05~0.1 mg/L
2.3. WQM Sensors
A sensor can detect events or changes in its environment and transfer the acquiredinformation to other electronic devices such as embedded microprocessors [52]. WQMsensors are capable to detect chemical, physical, and biological properties of water. It isknown WQI contains around 100 parameters related to water quality [18]. Among theseparameters, WHO/USEPA recommends a small set of parameters to determine qualityof drinking water [19–21,32]. This is logical because it is impossible for the commercialmarket to offer sensors against each parameter. Fortunately, most WQM parameters have ahigh correlation among themselves (Table 4) [18,19,32].
Table 4. WQM sensors for IoT-WQMS.
Sensor-Model Parameters Vendor Comments
WQ101 [53] T Global water A Xylem brand; Fully encapsulated electronics.WQ401 [53] DO Global water A Xylem brand; Fully encapsulated electronics.WQ600 [53] ORP Global water A Xylem brand; Fully encapsulated electronics.WQ730 and WQ720 [53] Turb Global water A Xylem brand; Fully encapsulated electronics.WQ-COND [53] EC Global water A Xylem brand; Fully encapsulated electronics.WQ201 pH Sensor [53] pH Global water A Xylem brand; Fully encapsulated electronics.FC80 free chlorine sensor [54] Free-Cl Fierce-Electronics Product of Electro-Chemical Devices.
Proteus water sensor for real-timedetecting E.coli bacteria [55] E-Coli Libelium
Multi-parameter probe. It applies fluorescence tomonitor COD, BOD, TOC and Total coliforms (andvariations there upon) in real-time.
Based on this logic, commonly used WQM parameters in IoT-WQMS are turbidity(Turb), pH, free-Cl, oxidation reduction potential, dissolved oxygen, electrical conductivity,temperature (T), and E-Coli. Table 4 details some recommended WQM sensors for these pa-rameters, which are available in market. In addition to individual sensors, multiparametersensors’ modules also exist in market [20,21].
3. Water Quality Monitoring Systems
This section presents an overview of water monitoring techniques from traditional toWSN to smart monitoring.

Water 2021, 13, 1729 11 of 37
3.1. Evolution of Water Quality Monitoring Schemes
As mentioned earlier, maintaining water quality at a recommended level is highlydemanded for humans. In this context, humans have been devising numerous waterquality monitoring schemes, which are highlighted in the following text.
3.1.1. Traditional Water Quality Monitoring
In most developing countries, water quality is still monitored using traditionallaboratory-based methods [19,21]. It comprises following steps:
• Manually collecting samples from water source (e.g., lake);• Transporting samples to concerned laboratory;• Performing analysis to detect contamination and microbes if any;• Predicting overall water quality in context with WQI.
Though traditional schemes are still dominant in many developing countries, theyhave some limitations: (i) specialized equipment/tools/apparatus and expert personnelare generally required to assess water quality, (ii) results can be lost/exchanged with othersamples’ reports due human-error, (iii) equipment may be obsolete, (iv) developing astate-of-the-art facility and its subsequent maintenance is costly, (v) lack of predictingfuture-trends and real-time feedback, (vi) properties of water may deviate due to samplestransportation delays and (vii), finally, data manipulation errors (e.g., round-off errors)may also occur. Most importantly, longer delays in generating the water quality reportsmay be disastrous if people keep on using pathogenic water. For example, microbiologicalanalysis may take 24~48 h to quantify fecal coliform bacteria [21,41]. In case of longerdelays in getting reports, the consumption of contaminated water may result in the lossof humans.
3.1.2. Enhanced Traditional Water Quality Monitoring
With advances in sensors technology, traditional water quality measuring techniqueswere slightly improved. In such systems, expert personnel started measuring some waterparameters on-site using portable sensors [20]. Though this act relatively improved tradi-tional methods, but majority of above-mentioned issues were still intact. For example, suchschemes were still unable to offer real-time feedback about water quality, spatial resolutionwas limited because data was still collected manually, transport delays, etc. [19–21].
3.1.3. WSN-Based Water Quality Monitoring
With further advances in portable sensors, communication and computing technolo-gies, researchers approached towards using WSN technology.
In brief, WSN-based water quality monitoring systems [19,33] work as follows: First,an embedded microprocessor-based gadget (also called node) reads specific water prop-erties using portable sensors (e.g., pH) installed on-site. Next, it processes acquired datalocally if required. After that, it transfers data to a main station (e.g., server computer)using a wireless communication media (e.g., ZigBee, Wi-Fi and LoRaWAN), where allrequired processing and analysis are then carried out. Finally, results are updated, andfeedback is sent to relevant consumers and/or water authorities if needed.
3.1.4. WSN and Machine Learning (ML) Techniques Based Water Quality Monitoring
Though WSN greatly resolved some plights of previous systems, these systems inheritlimitations, e.g., high energy requirements, compromised security, low communicationspeed, storage issues, high installation/maintenance costs, etc. In parallel, researchers alsoinvolved ML techniques to assess water quality using a small number of WQM parametersand predict about future trends [19,25,56,57]. No doubt, this act greatly enhanced efficiencyof the WSN systems, but most of the aforementioned issues were still unresolved such ascost of infrastructure, spatial resolution, etc.

Water 2021, 13, 1729 12 of 37
3.1.5. Smart Water Quality Monitoring
Finally, researchers resorted towards application of IoT technology. With IoT, watercan be monitored in real time from any location of the world using a combination ofportable sensors, digital computing devices, communication media (e.g., TCP/IP proto-cols), and internet services [58,59]. IoT-based water quality monitoring is also known assmart water quality monitoring [60–67]. These systems have been deployed to monitorwater quality for domestic applications [21,68], water used in agriculture [69–71] andaquaculture [72–75], municipal waste recycle [70], etc. In addition, these systems monitorwater quality in lakes [76–80], rivers [81], etc. In contrast with previous water monitoringsystems, IoT-WQMS aesthetically resolved many issues. The following text highlights itsmajor contributions:
• Low-cost: This technology uses existing commercially available communication in-frastructure; therefore, the overall cost of developing an IoT-WQMS is reduced.
• Increased spatial-resolution: Since the backbone of IoT-technology is the Internet,ideally there should be no spatial limitations.
• Low computational-cost: Heavy computational load is generally transferred to cloudservers, e.g., Ubidots IoT-Platform [82]. Due to this act, developers can use anyordinary processor-based node (e.g., NodeMCU (ESP8266) kit) instead of a hi-techcomputing device, such as Raspberry Pi 4 Model-B, DE1 SoC FPGA board, etc. [52].
• Low energy-requirements: After shifting heavy computational load to cloud server,the local nodes must perform small tasks and stay mostly in sleeping mode. Due tothis act, a small battery could easily operate Sensor’s nodes in remote areas.
• Provision of real-time feedback: These systems can easily provide real time feedback toboth end-users and relevant water authority via an SMS, email, Twitter, Facebook, etc.
• Improved water quality: Developers can easily integrate analytical tools (e.g., MLtechniques) in a cloud server to infer some WQM parameters based on measuredvalues of WQM parameters using sensors. In addition, future water trends could alsobe predicted using ML techniques [82].
3.2. A Typical IoT-WQMS Model
A typical IoT-WQMS comprises four basic modules (Figure 2):
• Sensors layer module (SLM);• Gateway module (GWM);• Cloud services module (CSM);• User interface module (UIM).
Figure 2. High level IoT-WQMS model.
Water 2021, 13, 1729 13 of 37
These modules are detailed explicitly in following text.
• SLM: It plays a critical role in the overall efficiency of an IoT-WQMS. It is becauseall other subsequent modules greatly rely on its output. Therefore, any malfunction(e.g., sensors biofouling) in this module may lead to inaccurate reporting of waterquality [20]. Biofouling (called biological fouling) is unwanted accumulation of mi-croorganisms (e.g., algae) on sensors’ surface being submerged in water. In general, atypical SLM comprises three submodules: Sensors-module (SLM-SM), Digital-module(SLM-DM) and Communication-module (SLM-CM). Briefly, SLM-SM first reads datafrom WQM sensors (e.g., Ph). Next, SLM-DM processes data, updates local displays ifany and transfers it to the SLM-CM that transfers data to a target cloud server (e.g.,Ubidots IoT-Platform [82]) via a local Wi-Fi router or a GSM/GPRS modem. Note,many commercial kits offer SLM-SM, SLM-DM, and SLM-CM modules built-on thesame printed circuit board (e.g., Arduino Nano 33-IoT). Otherwise, a communicationshield (e.g., ESP8266 transceiver module or DTMF enabled SIM900 GPRS/GSM shield)could also be plugged in another microprocessor based electronic kit (e.g., ArduinoUno) if desired.
• GWM: As SLM is responsible to transfer data to a GWM, i.e., a local gateway. A gate-way allows communication between a device-to-cloud, device-to-device, or network-to-network. Though it may be costly, but for an optimal performance and strongsecurity, developers are encouraged to use recently developed IoT-gateways [83].These gateways are capable to perform numerous critical functions, e.g., protocoltranslation, device connectivity, security, updating, management, data filtering andprocessing, etc. In case a local gateway is not available, then developers may also usea DTMF-enabled SIM900 GPRS/GSM shield to transfer data to cloud server.
• CSM: It provides a flexible, efficient, and scalable model to deliver services andinfrastructure required to empower IoT-enabled devices and applications [82]. In thisconcern, many cloud services have already been available in market [82], e.g., Blynk-,Adafruit-, and Ubidots IoT-Platforms. Using these platforms, developers can easilystore, visualize, and analyze sensors data. In addition, IoT-things (e.g., water-pump)could also be accessed and managed more comfortably. Cloud servers are capableto predict future trends in water quality and can inform end users via an alert (e.g.,Twitter) in case any anomaly is detected. Notably, most of these cloud services are notcost free, and therefore, customers must need to pay for commercial activities if any.
• UIM: Almost all contemporary cloud IoT-Platforms provide an interface to end-users.These platforms can send messages via an SMS, Facebook, Twitter, email, etc. Inaddition, these service providers also facilitate end users via their mobile apps, whichcan be installed easily on a smart phone. For example, with Arduino IoT cloud app [84]being installed on a smart phone, end-users can quickly connect, manage and controltheir own IoT-things (e.g., sensor) from any location of the globe.
4. Review of IoT-WQMS for Domestic Water
This section provides a review of contemporary work on IoT-WQMS for domesticwater. The research methodology was as follows: First, authors downloaded a set of140 articles using the Google chrome search engine, individual journals’ websites, IEEEXplore, and other sources. In this concern, different phrases and keywords were used forsearching purpose, e.g., IoT-based water monitoring, IoT-based water quality monitoringsystems, water quality review, water leakage survey, water leakage review, water qualitysurvey, smart water monitoring systems, Internet-of-Things based water quality monitoringsystems, Internet-of-Things based domestic water quality monitoring, etc.
Next, the authors manually inspected these articles on a one-by-one basis. It wasobserved that 9 articles were developed on general reports, 11 on pipes leakage detection,10 on water-management (e.g., auto-reading of meters, bills generation, and water-gridmonitoring), 5 on flood-level monitoring, 18 on water level monitoring in tanks, 15 on theagriculture and aquaculture, 14 on the auto-controlling water pump, 17 on water control in
Water 2021, 13, 1729 14 of 37
smart cities, 10 review/survey articles on water quality and leakage detection, and the restwere focused on quality monitoring of domestic water.
As detailed in Introduction section, authors have had acquired a set of 10 survey/reviewpapers on the water monitoring, but almost all of these were not focused on smart mon-itoring of domestic water quality. Moreover, the papers being published on domesticwater quality control were further filtered to pinpoint only those articles that were citedby contemporary works continuously. In this regard, some lower ranked conference andjournal papers were excluded from this survey. Finally, authors decided to consider only20 articles (3 conference papers and 17 journal articles) in this study.
As highlighted in Section 2.2.2, WHO/USEPA suggested three types of water qualityindices, i.e., DWQI, AWQI, and HWQI. In general, these indices contain many parametersrelated to water quality. In traditional laboratory-based methods, generally many suchparameters are used while monitoring water quality. However, it may not be feasible forIoT-WQMS, because currently so many WQM sensors are not available. As highlighted inTable 2, many WQM parameters have high correlation among themselves. Therefore, tobenefit from this fact, most researchers [32,35,48,68] agreed upon on using most prominentWQM parameters in IoT-WQMS for domestic water. These parameters are as follows:
• Potential of hydrogen (pH);• Turbidity (Turb);• Temperature (T);• Oxidation potential reduction (OPR);• Electrical conductivity.
Some relevant WQM parameters could also be inferred based on measured valuesof these five parameters using ML schemes. For example, ORP has strong correlationwith the sanitizing power of free chlorine or any other reducing/oxidizing chemicals [85].Measuring ORP is empirical, precise, and does not need any user interpretation. In addition,concentration of free chlorine can be inferred based on measured values of pH, T, andORP [48]. Similarly, the amount of dissolved oxygen in water can be inferred from itscorrelation property with T [86]. Likewise, total suspended solids (TSS) and total dissolvedsolids in water could be inferred form measured value of turbidity [35]. Similarly, EC couldbe utilized to infer estimate of alkalinity, hardness, and some solids dissolved in water.Based on WQM parameters and analytical tools (e.g., ML techniques), authors propose thefollowing empirical rubric:
λ = (2x0 + 2x1 + 2.5x2 + x3 + x4) + 1.5 (1)
where λ represents the overall rating of a contemporary IoT-WQMS. The symbols x0,x1, x2, x3, x4, and α represent pH, Turb, ORP, T, EC, and ML tools, respectively. Theseare binary variables, i.e., a variable value is set to one if corresponding parameter isinvolved in IoT-WQMS or else zero. Since current literature reveals no Thump-rule to ratifycontemporary IoT-WQMS with, therefore the authors assigned weights to variables usedin Equation (1) empirically, which is entirely based on their importance. It seems expedientbecause all WQM parameters do not contribute equally when computing water quality. Forexample, turbidity (or TSS/TDS) and pH could be felt while looking at water appearancethrough a glass and/or drinking. We also assigned a higher weight to ORP, because it couldnot be felt when humans drink water containing pathogenic microorganism. Comparedwith T and EC, we assigned higher weight to because ML techniques are capable to inferother important parameters (e.g., DO, coliform bacteria, and salinity) based on measuredvalues of few WQM parameters. No doubt, further improvement/modification in thisrubric is possible, which we are planning to probe into in future work. The following textpresents a comprehensive survey of contemporary work being published on IoT-WQMSfor domestic water.

Water 2021, 13, 1729 15 of 37
Ahmed et al. [19] published their work on water monitoring. In the first part, theauthors present a comprehensive review on traditional laboratory and WSN-based waterquality monitoring schemes. However, its second part proposed an IoT-WQMS for domesticwater. This system comprises four basic modules: (i) sensing, (ii) coordinator, (iii) dataprocessing and analysis, and (iv) storage and core analytics. The authors claimed for theusage of four sensors (Figure 3), but the sensing module shows only pH, turbidity, andtemperature, and the sensor for TSS is thus missing from diagram. In the coordinatormodule, an Arduino kit collects data from sensors and transfers it to an on-site PC via aZigBee device. For both modules, authors did not provide any hardware specifications(e.g., model). The third module takes in data from coordinator module and stores it locallyinto MySql-database.
Due to large data availability, data filtering and analysis were done to extract usefulinformation and explore hidden trends. Finally, the fourth module preprocesses receiveddata and transfers useful data to a cloud server vis REST web-services. This module appliesvarious ML schemes (e.g., ANN and K-means clustering) to analyze data and determinea suitable application of water, e.g., drinking. They also claimed for an Applicationdashboard being developed in cloud. End users can view water quality via a desktop PCand/or smart phone. To summarize, its first part is much informative and has contribution,but the second one is just compiled at abstract level. For example, the proposed system hasnot been validated experimentally. In addition, they did not provide any technical detailsabout sensors (e.g., model, range, and vendor). Due to these deficiencies, the second partmay not be helpful to relevant community. Table 5 shows a summary of this approach.
Figure 3. IoT-WQMS proposed in [19].
Geetha and Gouthami [32] published their work on real-time smart water qualitymonitoring. In the first part, they offered a review of IoT-based water monitoring schemes.In the second part, they proposed an IoT-WQMS to monitor quality of in-pipe domesticwater. This system is focused on monitoring pH, temperature, turbidity, and electricalconductivity. In addition, they also monitored water level in a water tank. For pH, theyused a three-in-one pH meter (no technical detailed provided). For conductivity, the sensorused was YL-69. The models for other sensors are not specified. Notably, authors did not

Water 2021, 13, 1729 16 of 37
use any ML techniques to improve predictability of water quality. Decisions are purelybased on preset threshold values of these parameter in accordance with WHO standards.
In brief, this system functions as follows: First, the TI CC3200 Wi-Fi Launchpad readssensors via its 12-bit ADC module. This card is based on a 32-bit powerful MCU (i.e.,ARM Cortex M4 core) with a built-in Wi-Fi module. It is a suitable choice for analog signalconditioning, processing, logging, and transferring data to cloud. Its programming is donein the ENERGIA IDE. Next, it processes data and updates a local LCD. Then, it sendsdata to a local Wi-Fi router through its built-in Wi-Fi module. Finally, a local Wi-Fi routertransfers data to Ubidots IoT-platform [87], where the authors had developed a dashboard.Ubidots is an excellent service, but it offers limited resources for free of cost and developersneed to pay fee for commercial activities [82]. In Ubidots server, sensors data is comparedwith preset threshold values. If any WQM parameter has deviated from its nominal range,then an SMS is sent to the phone of the end-user.
This system is validated on water samples polluted manually with salt and soil.Experimental results are discussed. Though using few WQM parameters without machinelearning techniques are not enough to properly predict water quality, it is still a betteroption, because it may avoid drinking of water containing high level of dirt, acidity,alkalinity, salinity, etc. A main drawback of this system lies in its conductivity sensor, i.e.,YL-69 (Figure 4). The bared metallic strips of this sensor have direct connection with waterwhile measuring conductivity. It is fine for a short time, but these metals may get corrodedif they remain submerged for longer. A similar issue also exists in Ref. [88].
Figure 4. A typical YL-69 sensor, with necessary parts [32].
Damor and Sharma [24] published an article on IoT-based water monitoring system.Its first part offers a review, but the second part proposes an IoT-WQMS. Only pH andturbidity were considered. In addition, the authors also used an Ultrasonic senor (HCSR04)to monitor water level in an overhead tank and control the water pump automatically.Using two WQM parameters does not fulfill the minimum requirement of WHO/USEPAstandards of drinking water [19,21]. No machine learning techniques were utilized to inferother WQM parameters and make the overall decision relatively better.
Authors have used the Arduino Uno kit as a front-end interface. This card is centeredaround ATmega328 (8-bit MCU), which is relatively rich in peripherals (e.g., ADC, memory,digital I/O, I2C, and SPI) generally required for analog signal conditioning, processing,and logging. First, this gadget reads sensors via its 10-bit ADC module. Data is processedlocally to extract useful information. Next, it serially shifts data to a NodeMCU. Thiscard is based on ESP8266 SoC, which is produced by the Espressif Systems. ESP8266 is
Water 2021, 13, 1729 17 of 37
a low-cost Wi-Fi microchip, which has full TCP/IP stack and a powerful 32-bit MCU.Then, NodeMCU transfers data to the ThingSpeak IoT-Platform via a local Wi-Fi router.ThingSpeak service is cost free for limited resources only and developers have to pay ifcommercial activities are required [82]. In ThingSpeak, authors had developed a dashboardfor the visual presentation of sensors data and water level in target tank. End users cancheck water quality and its level in respective tanks via the ThingSpeak app.
To summarize, the authors presented this article quite poorly. They provide notechnical specifications about sensors (e.g., model). Experimental results were not discussed.A main drawback of this system is the usage of Arduino Uno and NodeMCU together.Since NodeMCU is based on ESP8266 SoC, which has all peripherals (e.g., ADC unit, digitalI/O, timers/counters, memory, 32-bit CPU, and Wi-Fi module), therefore it alone is enoughfor analog signal conditioning, processing, logging, and transferring data to cloud server.Though NodeMCU has only one ADC module, but the designers could use a simple digitalmultiplexing chip to utilize this module for many analog inputs.
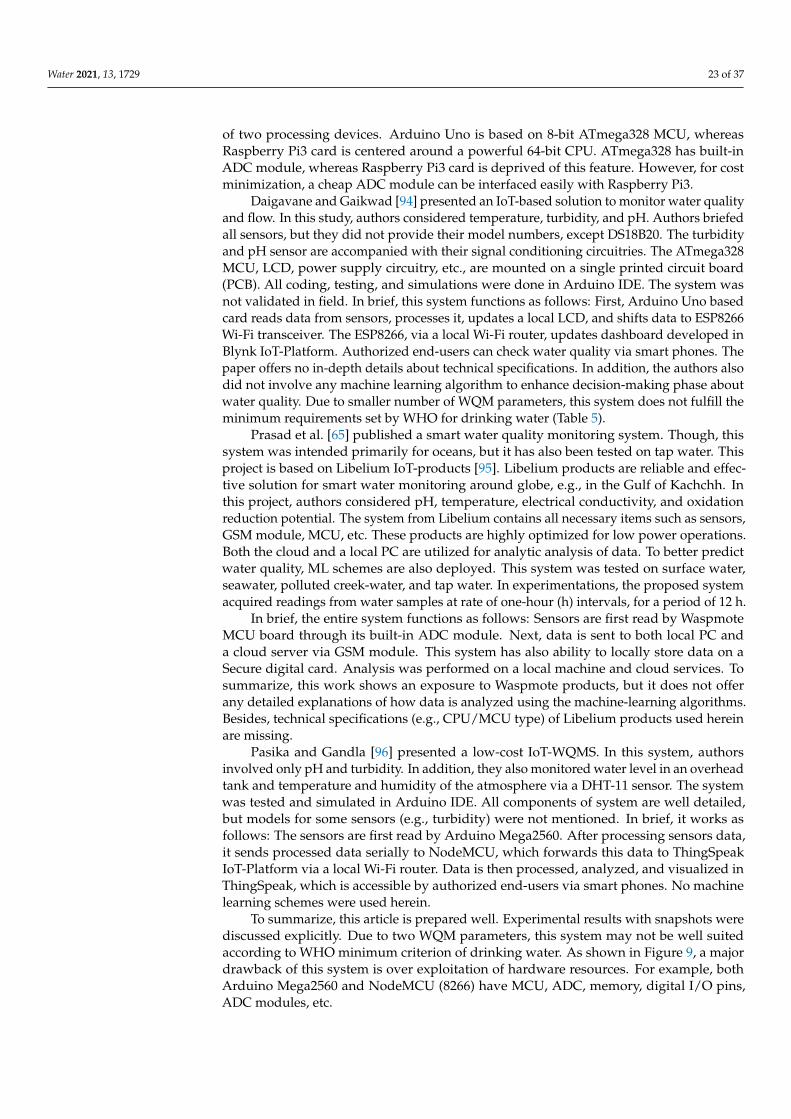
Simitha and Subodh [86] published their work on IoT/WSN-based water qualitymonitoring system for smart cities. As shown in Table 5, this system considered pH,turbidity, temperature, and dissolved oxygen. Instead of using a sensor to computedissolved oxygen, authors utilized a table showing temperature correlation with dissolvedoxygen. Authors utilized DS18B20 to measure water temperature. It is a waterprooftemperature sensor with 12-bit built-in ADC module and one-wire digital communicationinterface. For pH, they used a complete module (Model: E201-C-9). This kit has a BNCconnector, pH probe, and the requisite circuitry for signal conditioning of pH. The outputof such sensors is generally sensitive to changes in temperature. The kit automaticallyrectifies this issue using output of DS18B20. Technical details (e.g., model) are not providedfor the turbidity sensor. The circuit’s simulation was done in Proteus IDE. Final testing andsimulation of system were performed in Arduino IDE.
Briefly, the system functions as follows: First, Arduino Uno kit reads data from sensors,conditions it if not already, processes data, updates a local LCD for end-users, and transfersdata to a LoRa transmitter (i.e., SX1278 Ra-02 LoRa) via its serial peripheral interface (SPI).Next, the LoRa transmitter transfers data wirelessly to a LoRa receiver being interfacedwith an ESP32 Wi-Fi kit. The LoRa module is based on LoRaWAN protocol, which isa low-power wide area network (LPWAN) wireless communication technology. Due toLoRa technology, distance between sensors and communication modules can be 3~8 km(for urban to rural area, respectively), which is much better than ZigBee, WiMAX, Wi-Fi,Bluetooth, etc. The same LoRa chip can be used as both transmitter and receiver. Allreceived data parameters are updated in Serial-monitor console of Arduino IDE. Then,ESP32 kit access a local Wi-Fi router to transfer data to ThingSpeak IoT-platform for visualpurposes. The ThingSpeak has communication with a Raspberry Pi card equipped witha local display. It seems the Raspberry Pi card and local display have been used for thecontrol room, but the authors did not mention anything about this mystery. Users cancheck water quality via their smart phones. To summarize, overall presentation of article isfair. Its performance can be improved if ML techniques are also incorporated.
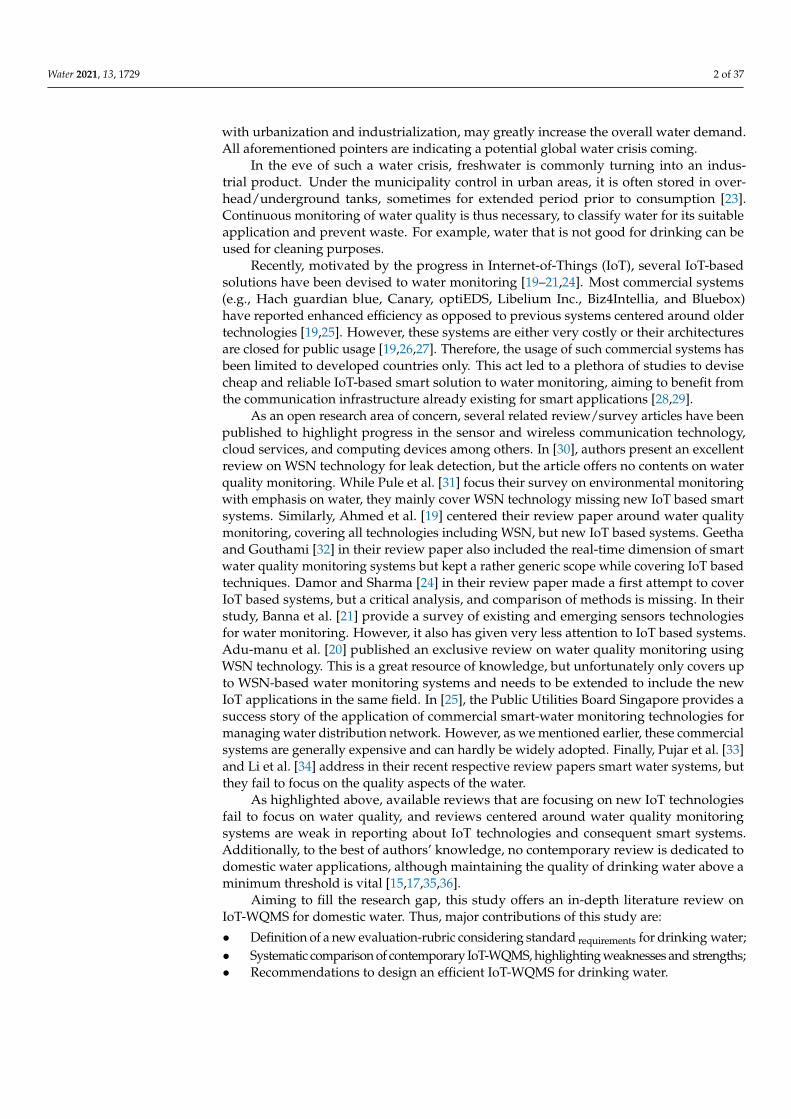
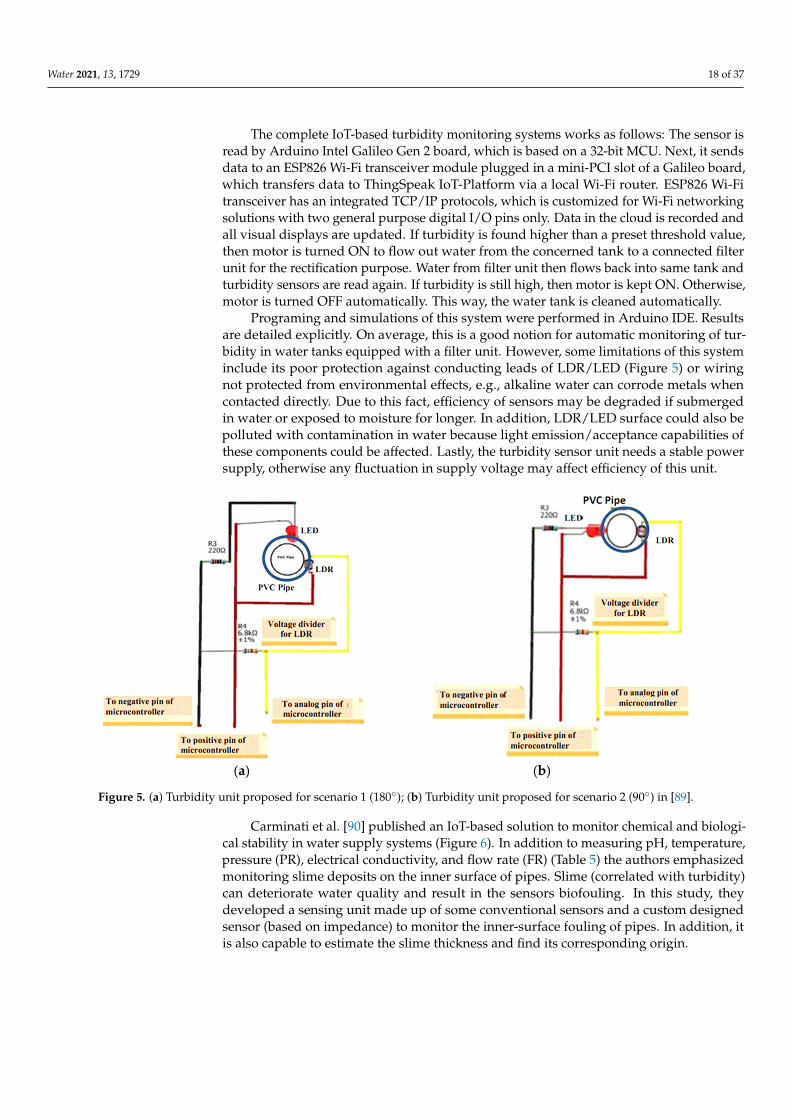
Ibrahim et al. [89] published a low-cost IoT-based solution to measure turbidity ofdomestic water in tanks equipped with water filters. In this study, authors developedan indigenous light detection unit to measure turbidity. For experimentations, they useda combination of an LDR (i.e., light dependent resistor) and an LED (i.e., light emittingdiode) fixed inside a PVC (polyvinyl chloride) pipe. They recorded turbidity readingsfor two unique positions: 180 and 90 between LDR and LED. The measured outputsignal (voltage) from designed circuit versus TSS in target water-sample was analyzedand graphed in two setups: (i) in total darkness and (ii) in presence of ambient light. Inaddition, the authors also performed comparative analysis for the designed sensing-unitsubmerged into still-water and water flowing in pipe.
Water 2021, 13, 1729 18 of 37
The complete IoT-based turbidity monitoring systems works as follows: The sensor isread by Arduino Intel Galileo Gen 2 board, which is based on a 32-bit MCU. Next, it sendsdata to an ESP826 Wi-Fi transceiver module plugged in a mini-PCI slot of a Galileo board,which transfers data to ThingSpeak IoT-Platform via a local Wi-Fi router. ESP826 Wi-Fitransceiver has an integrated TCP/IP protocols, which is customized for Wi-Fi networkingsolutions with two general purpose digital I/O pins only. Data in the cloud is recorded andall visual displays are updated. If turbidity is found higher than a preset threshold value,then motor is turned ON to flow out water from the concerned tank to a connected filterunit for the rectification purpose. Water from filter unit then flows back into same tank andturbidity sensors are read again. If turbidity is still high, then motor is kept ON. Otherwise,motor is turned OFF automatically. This way, the water tank is cleaned automatically.
Programing and simulations of this system were performed in Arduino IDE. Resultsare detailed explicitly. On average, this is a good notion for automatic monitoring of tur-bidity in water tanks equipped with a filter unit. However, some limitations of this systeminclude its poor protection against conducting leads of LDR/LED (Figure 5) or wiringnot protected from environmental effects, e.g., alkaline water can corrode metals whencontacted directly. Due to this fact, efficiency of sensors may be degraded if submergedin water or exposed to moisture for longer. In addition, LDR/LED surface could also bepolluted with contamination in water because light emission/acceptance capabilities ofthese components could be affected. Lastly, the turbidity sensor unit needs a stable powersupply, otherwise any fluctuation in supply voltage may affect efficiency of this unit.
Water 2021, 13, x FOR PEER REVIEW 19 of 38
(a) (b)
Figure 5. (a) Turbidity unit proposed for scenario 1 (180°); (b) Turbidity unit proposed for scenario 2 (90°) in [89].
Carminati et al. [90] published an IoT-based solution to monitor chemical and biological stability in water supply systems (Figure 6). In addition to measuring pH, temperature, pressure (PR), electrical conductivity, and flow rate (FR) (Table 5) the authors emphasized monitoring slime deposits on the inner surface of pipes. Slime (correlated with turbidity) can deteriorate water quality and result in the sensors biofouling. In this study, they developed a sensing unit made up of some conventional sensors and a custom designed sensor (based on impedance) to monitor the inner-surface fouling of pipes. In addition, it is also capable to estimate the slime thickness and find its corresponding origin.
Figure 5. (a) Turbidity unit proposed for scenario 1 (180); (b) Turbidity unit proposed for scenario 2 (90) in [89].
Carminati et al. [90] published an IoT-based solution to monitor chemical and biologi-cal stability in water supply systems (Figure 6). In addition to measuring pH, temperature,pressure (PR), electrical conductivity, and flow rate (FR) (Table 5) the authors emphasizedmonitoring slime deposits on the inner surface of pipes. Slime (correlated with turbidity)can deteriorate water quality and result in the sensors biofouling. In this study, theydeveloped a sensing unit made up of some conventional sensors and a custom designedsensor (based on impedance) to monitor the inner-surface fouling of pipes. In addition, itis also capable to estimate the slime thickness and find its corresponding origin.

Water 2021, 13, 1729 19 of 37
Figure 6. Main circuitry of the system proposed in [90].
All sensors are technically detailed, along with calibration methods. Notably, authorsexplained all circuits, electronic components, communication devices, power generationvia a turbine unit, and computing devices in explicit details. Editing and simulation of thissystem were done in Arduino IDE. In short, the whole system architecture is as follows:To energize entire circuitry, energy is generated from water flowing in pipe using turbinetechnology; the main components of this part are sealed lead-acid battery (6 V, 1200 mAh),ATmega328 (8-bit MCU), a current sensing chip (MAX4373), LCD, and a buck-boost Direct-current/Direct-current (DC/DC) convertor.
Sensors are read by main board centered around ATmega2560 (8-bit MCU). Forcommunication between different modules and/or units, they utilized LoRaWAN device(mDot by the Multitech) and GSM modem (M10 by the Quectel). Data through GSMmodem is transferred to ThingSpeak IoT-Platform for analysis, detecting anomalies andgenerating alert messages to end-users if any fault is detected. Note, a GSM modemgenerally accepts a SIM card and functions like an ordinary cellphone for providing adata link to a remote network. For end-users, they use ThingSpeak app installed on asmart phone. The system was tested and validated in the laboratory and field. Thoughthis system does not fulfil the minimum requirements of WHO standards of drinkingwater, it have other significant achievements. For example, it proposed an effective sensingunit to monitor slime deposits on inner surface of water supply pipes. In addition, it alsohighlighted a workable notion of utilizing a turbine to yield electrical energy.
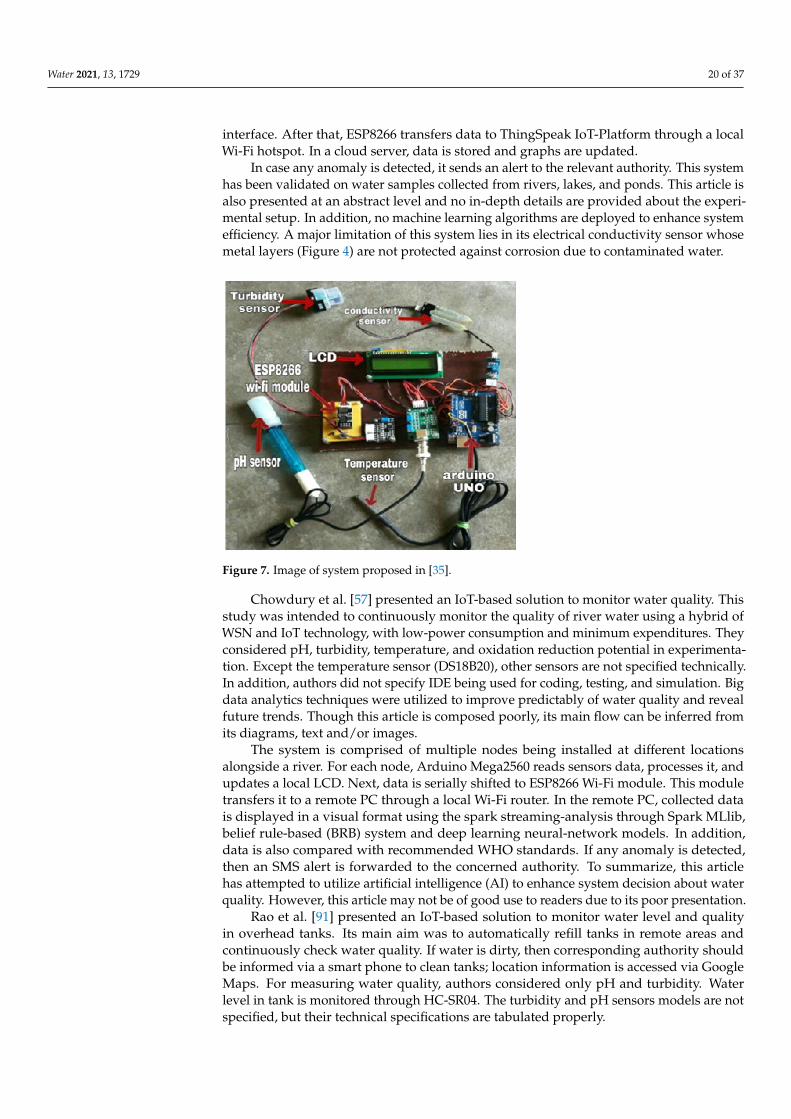
Manoharan et al. [35] presented a water quality-analyzer system based on IoT tech-nology. In this study, they tried to monitor pH, turbidity, temperature, and electrical con-ductivity. Sensors were not technically specified, except the temperature sensor (DS18B20).As shown in Figure 7, except DS18B20, which is interfaced with Arduino Uno, all othersensors are accompanied by their own signal conditioning kits. Programming was donein C-language, probably in Arduino IDE. The overall system functions as follows: First,Arduino Uno reads data from sensors, processes it, and updates results on a local LCD forusers. Next, it transfers data to ESP8266 Wi-Fi transceiver through its serial communication
Water 2021, 13, 1729 20 of 37
interface. After that, ESP8266 transfers data to ThingSpeak IoT-Platform through a localWi-Fi hotspot. In a cloud server, data is stored and graphs are updated.
In case any anomaly is detected, it sends an alert to the relevant authority. This systemhas been validated on water samples collected from rivers, lakes, and ponds. This article isalso presented at an abstract level and no in-depth details are provided about the experi-mental setup. In addition, no machine learning algorithms are deployed to enhance systemefficiency. A major limitation of this system lies in its electrical conductivity sensor whosemetal layers (Figure 4) are not protected against corrosion due to contaminated water.
Figure 7. Image of system proposed in [35].
Chowdury et al. [57] presented an IoT-based solution to monitor water quality. Thisstudy was intended to continuously monitor the quality of river water using a hybrid ofWSN and IoT technology, with low-power consumption and minimum expenditures. Theyconsidered pH, turbidity, temperature, and oxidation reduction potential in experimenta-tion. Except the temperature sensor (DS18B20), other sensors are not specified technically.In addition, authors did not specify IDE being used for coding, testing, and simulation. Bigdata analytics techniques were utilized to improve predictably of water quality and revealfuture trends. Though this article is composed poorly, its main flow can be inferred fromits diagrams, text and/or images.
The system is comprised of multiple nodes being installed at different locationsalongside a river. For each node, Arduino Mega2560 reads sensors data, processes it, andupdates a local LCD. Next, data is serially shifted to ESP8266 Wi-Fi module. This moduletransfers it to a remote PC through a local Wi-Fi router. In the remote PC, collected datais displayed in a visual format using the spark streaming-analysis through Spark MLlib,belief rule-based (BRB) system and deep learning neural-network models. In addition,data is also compared with recommended WHO standards. If any anomaly is detected,then an SMS alert is forwarded to the concerned authority. To summarize, this articlehas attempted to utilize artificial intelligence (AI) to enhance system decision about waterquality. However, this article may not be of good use to readers due to its poor presentation.
Rao et al. [91] presented an IoT-based solution to monitor water level and qualityin overhead tanks. Its main aim was to automatically refill tanks in remote areas andcontinuously check water quality. If water is dirty, then corresponding authority shouldbe informed via a smart phone to clean tanks; location information is accessed via GoogleMaps. For measuring water quality, authors considered only pH and turbidity. Waterlevel in tank is monitored through HC-SR04. The turbidity and pH sensors models are notspecified, but their technical specifications are tabulated properly.

Water 2021, 13, 1729 21 of 37
In brief, this system works as follows: First, a Raspberry Pi kit reads data from sensors.As stated before, Raspberry Pi kits are powerful minicomputers enriched in peripherals(e.g., ADC/DAC, memory, I/O ports, Wi-Fi, and timers/counters). Next, it processessensors data and transfers it to a local Wi-Fi router for uploading to ThingSpeak IoT-Platform. In the cloud, data is recorded, graphs are updated, and water level and qualityare checked according to preset threshold values. If water level is found above or below aspecific threshold, then an alert is sent to clients who can control motor switching statusthrough their smart phone. In addition, if turbidity is found above a preset threshold, thenit means the water in tank got dirty because of mud, dry leaves, etc. To clean the tank, theconcerned authority is also sent tank’s location via Google Maps. This article is not welldocumented, e.g., missing of technical data, language, and IDE not specified. On average,this system can be used safely for tank cleaning purpose only, but for water quality twoparameters are not considered enough according to WHO standards for drinking water.
Imran et al. [92] presented an IoT-based solution to monitor water level and quality inoverhead tanks, in particular for offices and homes. In this study, authors monitored pHof water only, which is not enough to predict overall water quality. In addition, they alsotried to monitor water level in tank and leakage of Liquified Petroleum Gas (LPG), if any.Authors did not provide any technical specifications about the sensors, except the LPGsensor (Model: MQ-6). In addition, authors did not detail their experimental setup. Thissystem functions as follows: First, an electronic kit centered on an 8-bit MCU (PIC16F877developed by the Microchip Inc.) reads data from sensors. After processing data andupdating a local LCD, it utilizes its accompanying SIM900 GPRS modem to transfer datato a cloud server. End-users can use smart phones to monitor their water tanks. Theoverall paper presentation is poor. For example, in the abstract, the authors also claim formonitoring turbidity and dissolved oxygen, but in the results and diagram, only pH andMQ-6 are shown. Due to smaller number of WQM parameters, this system does not fulfilthe minimum WHO standards (Table 5).
Gowthamy et al. [64] presented a low cost IoT-based solution to monitor quality,level, and quantity of water in overhead tanks. Only pH and turbidity were consideredto monitor water quality. In addition, they also used a combination of ultrasonic sensorand a flow sensor to control water level and quantity in tanks, respectively. Technicalspecifications of sensors are not provided. The entire system is based on an Arduino Unoand ESP8266 Wi-Fi transceiver. Programming, testing, and simulation of this system wereperformed in Arduino IDE. No machine learning methods were utilized for better decisionmaking. In short, this system works as follows: The Arduino Uno reads sensors, does somelocal processing, and shifts data to a cloud sever (not specified) via ESP8266 and a localWi-Fi router. The cloud server is used to store data, visualize sensors data, and send analert to end users via a smart phone in case any anomaly is detected. To summarize, thissystem is not well mature and should be consulted if auto-filling of tank and/or cleaningis desired only. For measuring drinking water quality, it is not suitable.
Priya et al. [68] published a real-time system to monitor water quality and detectcontaminations in water distribution system, which is used to supply water from a maintank to consumers. In this concern, authors considered pH, turbidity, temperature, oxida-tion reduction potential, and electrical conductivity. Sensors’ specifications are detailedthoroughly, but not models. The main architecture of this system (Figure 8) has three majorparts: (i) water quality monitoring unit, (ii) central processing unit, and (iii) notificationunit for administration office.
In brief, this system functions as follows: Water from the main tank is controlledvia an automatic solenoid valve, which is supervised by a cloud server. Once the valveis open, water flows concurrently in all pipes towards customers houses. The sensorsmodules are embedded in each street pipe. For every street, data from relevant sensors isread by an Atmega328 MCU-based board. All nodes of the same street could share datawith each other. Data to central processing unit (server) is transferred via a ZigBee device.Note, ZigBee device is based on the IEEE 802.15.4. This device is generally utilized for

Water 2021, 13, 1729 22 of 37
two-way communication between a control system and a sensor. Like Wi-Fi/Bluetooth,ZigBee has short-range of communication with connectivity up to 100 m (meters). Theserver then processes sensors data using Fuzzy logic to classify it as acceptable, rejected,or desirable. In case an anomaly is detected, the concerned street’s water-supply is thenblocked through a solenoid valve, and end-users and authority are informed about this act.The sever is interfaced with internet through an ethernet module. This unit also sends alertsto notification unit for administrative usage. End-users and/or the concerned authority canalso check water quality via smart phones. Water quality report is sent/shown to end-userswith their home number as well. Though this paper is highly focused on WSN concept andutilizes internet for smart phone applications only, it is a best kick-off for IoT-WQMS.
Figure 8. Architecture of the system proposed in [68]. (a) Water quality monitoring unit. (b) Central processing unit.(c) Notification unit for administration office.
Thiyagarajan et al. [93] presented an IoT-based solution to monitor water qualityin residential tanks. This system involved pH and TDS. Sensors’ specifications are notprovided. In brief, this system functions as follows: First, Arduino Uno reads data fromsensors. It transfers data serially to Raspberry Pi3 card. This card deploys K-meansclustering algorithm to classify target water as lemonish, salty, muddy, tap, or drinkingwater. These different classes were used to train a stated algorithm. Raspberry Pi3 transfersdata to a desktop PC, which transfers it to a cloud server through an ethernet port. End-users can access the cloud via a smart phone to check water quality.
Notably, this paper is not well documented, e.g., authors did not specify IDE andlanguages being used in experimentation. In addition, it does not fulfill the minimumrequirements of WHO drinking water; the authors deployed ML techniques to compensatethis deficiency to some extent. However, a major limitation of this system is involvement
Water 2021, 13, 1729 23 of 37
of two processing devices. Arduino Uno is based on 8-bit ATmega328 MCU, whereasRaspberry Pi3 card is centered around a powerful 64-bit CPU. ATmega328 has built-inADC module, whereas Raspberry Pi3 card is deprived of this feature. However, for costminimization, a cheap ADC module can be interfaced easily with Raspberry Pi3.
Daigavane and Gaikwad [94] presented an IoT-based solution to monitor water qualityand flow. In this study, authors considered temperature, turbidity, and pH. Authors briefedall sensors, but they did not provide their model numbers, except DS18B20. The turbidityand pH sensor are accompanied with their signal conditioning circuitries. The ATmega328MCU, LCD, power supply circuitry, etc., are mounted on a single printed circuit board(PCB). All coding, testing, and simulations were done in Arduino IDE. The system wasnot validated in field. In brief, this system functions as follows: First, Arduino Uno basedcard reads data from sensors, processes it, updates a local LCD, and shifts data to ESP8266Wi-Fi transceiver. The ESP8266, via a local Wi-Fi router, updates dashboard developed inBlynk IoT-Platform. Authorized end-users can check water quality via smart phones. Thepaper offers no in-depth details about technical specifications. In addition, the authors alsodid not involve any machine learning algorithm to enhance decision-making phase aboutwater quality. Due to smaller number of WQM parameters, this system does not fulfill theminimum requirements set by WHO for drinking water (Table 5).
Prasad et al. [65] published a smart water quality monitoring system. Though, thissystem was intended primarily for oceans, but it has also been tested on tap water. Thisproject is based on Libelium IoT-products [95]. Libelium products are reliable and effec-tive solution for smart water monitoring around globe, e.g., in the Gulf of Kachchh. Inthis project, authors considered pH, temperature, electrical conductivity, and oxidationreduction potential. The system from Libelium contains all necessary items such as sensors,GSM module, MCU, etc. These products are highly optimized for low power operations.Both the cloud and a local PC are utilized for analytic analysis of data. To better predictwater quality, ML schemes are also deployed. This system was tested on surface water,seawater, polluted creek-water, and tap water. In experimentations, the proposed systemacquired readings from water samples at rate of one-hour (h) intervals, for a period of 12 h.
In brief, the entire system functions as follows: Sensors are first read by WaspmoteMCU board through its built-in ADC module. Next, data is sent to both local PC anda cloud server via GSM module. This system has also ability to locally store data on aSecure digital card. Analysis was performed on a local machine and cloud services. Tosummarize, this work shows an exposure to Waspmote products, but it does not offerany detailed explanations of how data is analyzed using the machine-learning algorithms.Besides, technical specifications (e.g., CPU/MCU type) of Libelium products used hereinare missing.
Pasika and Gandla [96] presented a low-cost IoT-WQMS. In this system, authorsinvolved only pH and turbidity. In addition, they also monitored water level in an overheadtank and temperature and humidity of the atmosphere via a DHT-11 sensor. The systemwas tested and simulated in Arduino IDE. All components of system are well detailed,but models for some sensors (e.g., turbidity) were not mentioned. In brief, it works asfollows: The sensors are first read by Arduino Mega2560. After processing sensors data,it sends processed data serially to NodeMCU, which forwards this data to ThingSpeakIoT-Platform via a local Wi-Fi router. Data is then processed, analyzed, and visualized inThingSpeak, which is accessible by authorized end-users via smart phones. No machinelearning schemes were used herein.
To summarize, this article is prepared well. Experimental results with snapshots werediscussed explicitly. Due to two WQM parameters, this system may not be well suitedaccording to WHO minimum criterion of drinking water. As shown in Figure 9, a majordrawback of this system is over exploitation of hardware resources. For example, bothArduino Mega2560 and NodeMCU (8266) have MCU, ADC, memory, digital I/O pins,ADC modules, etc.

Water 2021, 13, 1729 24 of 37
Figure 9. Block diagram of the system proposed in [96].
Srivastava et al. [97] published a smart-phone-based system to monitor water qualitywith accesses to location information via the Google Maps app. In this study, authorsinvolved pH, TDS, and temperature. Other important WQM parameters such as ORP,EC, and salinity were inferred from measured values of these parameters using statisticalmodeling techniques. The learning models (e.g., Artificial Neural Network) were trained onpH and TDS datasets and others measured parameters just mentioned. Instead of relyingon the readymade commercial electronic kits, authors developed a front-end interface unitfrom standard parts such as a pH sensor (LMP01200), HC-05 Bluetooth module, EEPROMmemory chips, and a dedicated 8-bit MCU. This module is responsible for reading sensors,local processing, and logging data. Interface between the Google-Firebase IoT-platform andfront-end unit is a smart phone. In this concern, authors developed a dedicated applicationto carry out analysis in cloud.
Based on machine learning techniques, the measured and inferred WQM parameterswere converted to a single WQI number, which is easy to interpret for understanding. Inaddition, the developed smart phone application is also capable to auto-calibrate sensitiveparts for on-site application. End-users can get SMS, WhatsApp messages, and emails.The overall results of this system are satisfactory in comparison with contemporary work.However, one big bottleneck of this system may be the product cost if it must be installedat many points, e.g., in smart city. However, the overall system cost could be minimized ifa SIM900 GSM/GPRS modem is utilized, instead of smart phones, for data transmissionbetween cloud server and sensors module (Figure 10).
Figure 10. Block diagram of the system proposed in [97].
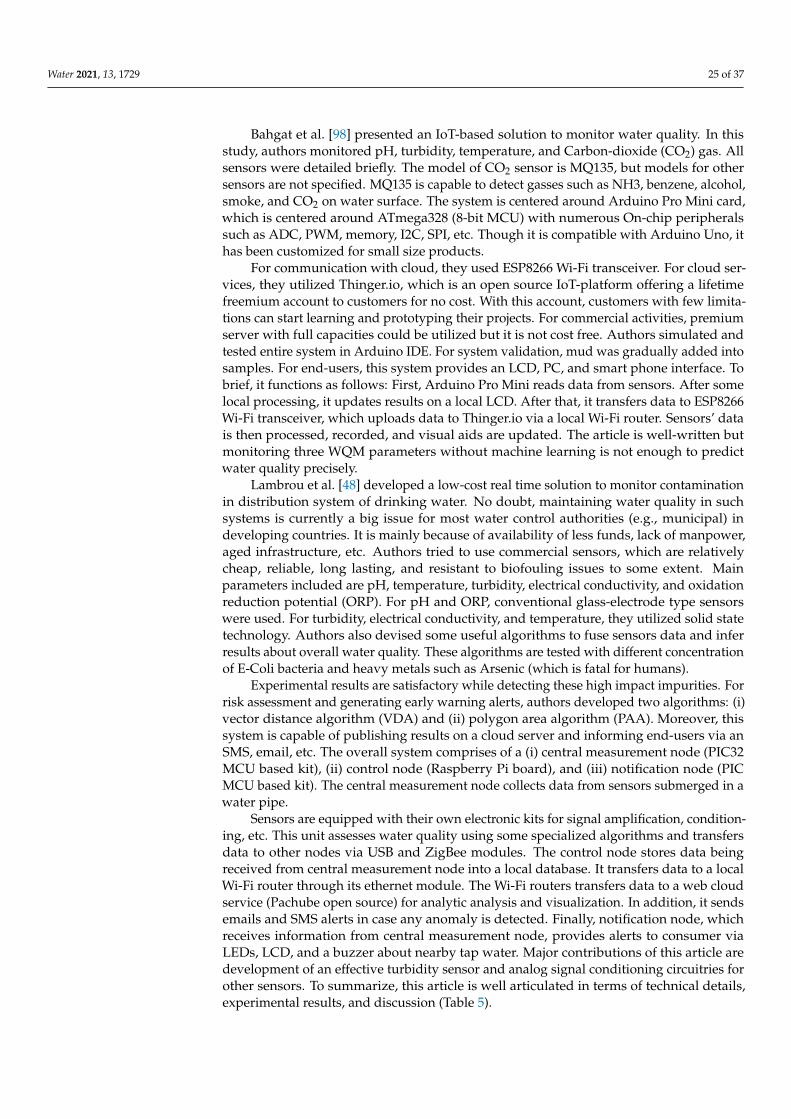
Water 2021, 13, 1729 25 of 37
Bahgat et al. [98] presented an IoT-based solution to monitor water quality. In thisstudy, authors monitored pH, turbidity, temperature, and Carbon-dioxide (CO2) gas. Allsensors were detailed briefly. The model of CO2 sensor is MQ135, but models for othersensors are not specified. MQ135 is capable to detect gasses such as NH3, benzene, alcohol,smoke, and CO2 on water surface. The system is centered around Arduino Pro Mini card,which is centered around ATmega328 (8-bit MCU) with numerous On-chip peripheralssuch as ADC, PWM, memory, I2C, SPI, etc. Though it is compatible with Arduino Uno, ithas been customized for small size products.
For communication with cloud, they used ESP8266 Wi-Fi transceiver. For cloud ser-vices, they utilized Thinger.io, which is an open source IoT-platform offering a lifetimefreemium account to customers for no cost. With this account, customers with few limita-tions can start learning and prototyping their projects. For commercial activities, premiumserver with full capacities could be utilized but it is not cost free. Authors simulated andtested entire system in Arduino IDE. For system validation, mud was gradually added intosamples. For end-users, this system provides an LCD, PC, and smart phone interface. Tobrief, it functions as follows: First, Arduino Pro Mini reads data from sensors. After somelocal processing, it updates results on a local LCD. After that, it transfers data to ESP8266Wi-Fi transceiver, which uploads data to Thinger.io via a local Wi-Fi router. Sensors’ datais then processed, recorded, and visual aids are updated. The article is well-written butmonitoring three WQM parameters without machine learning is not enough to predictwater quality precisely.
Lambrou et al. [48] developed a low-cost real time solution to monitor contaminationin distribution system of drinking water. No doubt, maintaining water quality in suchsystems is currently a big issue for most water control authorities (e.g., municipal) indeveloping countries. It is mainly because of availability of less funds, lack of manpower,aged infrastructure, etc. Authors tried to use commercial sensors, which are relativelycheap, reliable, long lasting, and resistant to biofouling issues to some extent. Mainparameters included are pH, temperature, turbidity, electrical conductivity, and oxidationreduction potential (ORP). For pH and ORP, conventional glass-electrode type sensorswere used. For turbidity, electrical conductivity, and temperature, they utilized solid statetechnology. Authors also devised some useful algorithms to fuse sensors data and inferresults about overall water quality. These algorithms are tested with different concentrationof E-Coli bacteria and heavy metals such as Arsenic (which is fatal for humans).
Experimental results are satisfactory while detecting these high impact impurities. Forrisk assessment and generating early warning alerts, authors developed two algorithms: (i)vector distance algorithm (VDA) and (ii) polygon area algorithm (PAA). Moreover, thissystem is capable of publishing results on a cloud server and informing end-users via anSMS, email, etc. The overall system comprises of a (i) central measurement node (PIC32MCU based kit), (ii) control node (Raspberry Pi board), and (iii) notification node (PICMCU based kit). The central measurement node collects data from sensors submerged in awater pipe.
Sensors are equipped with their own electronic kits for signal amplification, condition-ing, etc. This unit assesses water quality using some specialized algorithms and transfersdata to other nodes via USB and ZigBee modules. The control node stores data beingreceived from central measurement node into a local database. It transfers data to a localWi-Fi router through its ethernet module. The Wi-Fi routers transfers data to a web cloudservice (Pachube open source) for analytic analysis and visualization. In addition, it sendsemails and SMS alerts in case any anomaly is detected. Finally, notification node, whichreceives information from central measurement node, provides alerts to consumer viaLEDs, LCD, and a buzzer about nearby tap water. Major contributions of this article aredevelopment of an effective turbidity sensor and analog signal conditioning circuitries forother sensors. To summarize, this article is well articulated in terms of technical details,experimental results, and discussion (Table 5).

Water 2021, 13, 1729 26 of 37
Cho-Zin et al. [99] presented an IoT-based solution for water quality monitoring. Theauthors involved temperature, pH, turbidity, and CO2. In addition, they also monitoredwater level via an LV-MAXSONAR-EZ1 sensor; it is a Sonar. For temperature, CO2, andturbidity, authors used DS18B20, SKU: SEN0219, and SKE: SEN0189 sensors, respectively.However, the model for pH is not specified. The entire system is deployed on DE1-SoCFPGA Development Kit (Figure 11). This board offers a flexible hardware design-platformbuilt around an Altera System-on-Chip (SoC) FPGA. Briefly, this SoC integrates a hardprocessor system (i.e., dual-core ARM cortex-A9 microprocessor, with 800 MHz clockingfrequency), memory, and peripherals interfaces knotted with FPGA module through ahigh-bandwidth interconnect backbone. For coding and simulations, authors used AlteraQuartus-II IDE. The control unit to read sensors and communicate with ZigBee transceiverwas implemented in FPGA fabric using the Nios-II soft-core processor available in theQuartus-II Qsys Tools. The C-code running over the Nios-II CPU and VHDL codes wereutilized to run control unit. Code to process WQM parameters and commands of thewireless transceiver modules were programmed in Nios-II Eclipse through C and VHDLlanguages. For data visualization, authors installed Grafana package on a desktop PC,with Linux operating system. Moreover, pin connections for all sensors and devices aredetailed explicitly. For analog signal conditioning, an onboard ADC module is utilized. Forwireless communication between a remote PC and this board, authors utilized ZigBee PROS1 module. This is a radiofrequency module, which can provide robust communication inthe peer-to-peer, point-to-point, and multipoint/star configurations.
Figure 11. DE1-SoC Development Kit (Top view) [99].
After powering this system, it was installed on the bank of a lake to monitor waterquality, where data was collected over a period of 15 days. Data was transferred by FPGAboard to a remote PC equipped with a ZigBee receiver module and located 86 m awayfrom lake. Data was processed, stored, and analyzed to visualize probable trends in waterquality. Authors did not discuss using ML schemes to enhance decision-making phase.Experimental results being illustrated on LiCliplse console-windows are satisfactory. Tosummarize, this system does not qualify the minimum WHO standards of drinking water.A major limitation of this design is overall cost of using an expensive DE1-SoC FPGA board.This card is utilized to read sensors and transfer data to a remote PC via an external ZigBeekit only. No doubt, this is not a big task to which such a powerful SoC should be assigned.This wastage of technical resources and the overall system cost could be optimized asfollows: Firstly, developers should buy a simple FPGA chip and burn target bitstream fileinto its fabric via a chip-programmer. After that, it can be mounted onto a customized PCBalong with supporting electronic circuitry. Secondly, a NodeMCU (EPS8266) module orArduino Nano 33 IoT card should be utilized to better perform this task.

Water 2021, 13, 1729 27 of 37
5. Discussion and Recommendations
Section 4 provided detailed survey of contemporary IoT-based solutions for waterquality monitoring. In all articles, authors were focused on coming up with systems, whichshould be cheap, portable, low-power, IoT-enabled, real-time, and qualifying WHO/USEPAminimum standards of drinking water. Ironically, very few articles meet the criteria.Figure 12 shows the overall rating of each article based on the proposed empirical rubricgiven in Equation (1). Only three articles [48,68,97] fully satisfy this criterion, where authorsconsidered minimum criterion of drinking water and used machine learning to enhanceoverall water quality index. The remaining articles could be either improved or used forother applications such as cleaning of water storage tanks.
Figure 12. Rating of contemporary IoT-WQMS using proposed empirical rubric.
Table 5. Comparison of contemporary IoT-WQMS.
Ref. WQMParameters
IoT-WQMS λ(%)# SLM GWM CSM UIM Comments
1 [19] pH, Turb, Tand TSS
Arduino Uno kit and ZigBeekit Wi-Fi Router
Cloud viaREST-webservices
Desktop PC,smart phone,and web
65 Hardware not specifiedproperly
2 [32] pH, T, Turband EC.
TI CC3200 wi-fi Launchpadboard. Built-in Wi-Fi moduleof TI CC3200
Wi-Fi Router Ubidots Local LCD,smart phones 60
Few WQM parametersused. Sensor YL-69 isnot a good choice
3 [24] pH and Turb Arduino Uno kit andNodeMCU (ESP8266) kit Wi-Fi Router ThingSpeak Smart Phone 40
Presented poorly andhardware is notoptimized
4 [86] pH, Turb, Tand DO
ATmega328 MCU, SX1278Ra-02 LoRa module andESP32 Wi-Fi module
Wi-Fi Router ThingSpeak LCD, smartphone, and PC 50
Can be furtherimproved. Sometechnical information ismissing
5 [89] TurbArduino Intel Galileo boardand ESP8266 Wi-Fitransceiver module
Wi-Fi Router ThingSpeak Web-basedmotor control 20 Turbidity is monitored
only
6 [90] pH., T, EC,and Slime
ATmega2560 MCU andLoRaWAN device
GSMModem ThingSpeak Smart phone 60
Well explained, but it isgood for the slimedetection and energycrisis applications
7 [35] pH, Turb, Tand EC
Arduino Uno R3 kit andESP8266 Wi-Fi transceivermodule
Wi-Fi Router ThingSpeak LCD, smartphone, and PC 60 Presented poorly
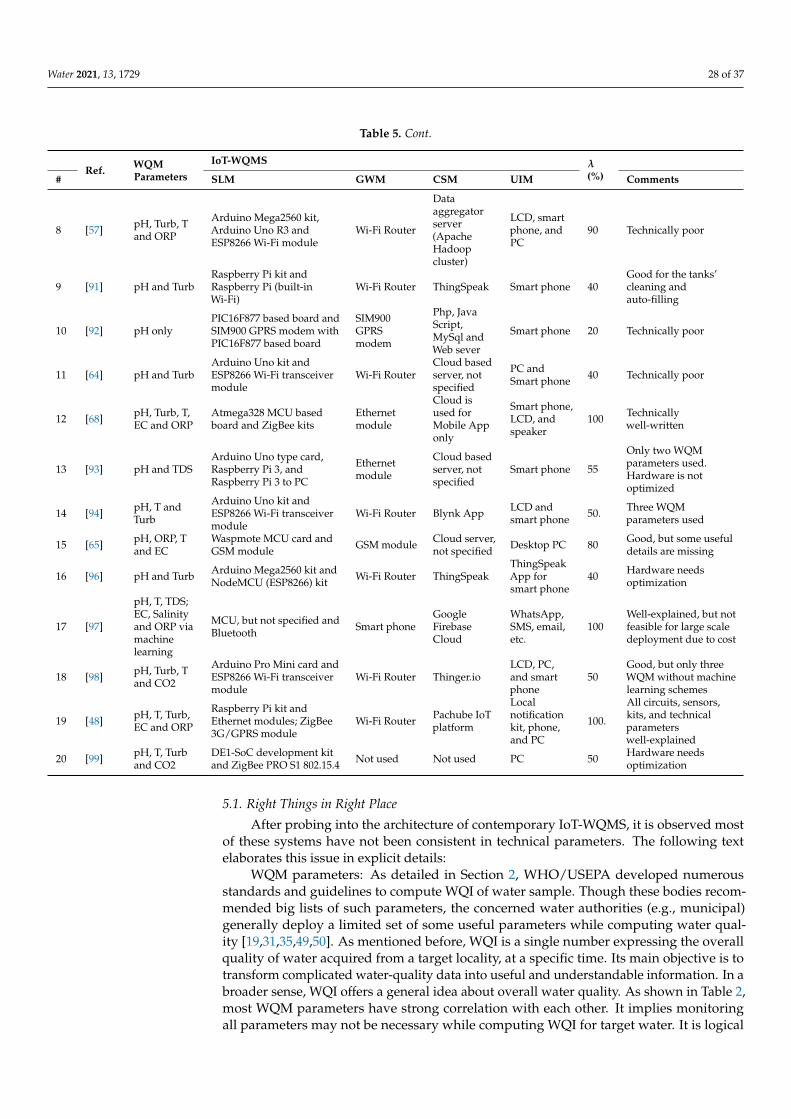
Water 2021, 13, 1729 28 of 37
Table 5. Cont.
Ref. WQMParameters
IoT-WQMS λ(%)# SLM GWM CSM UIM Comments
8 [57] pH, Turb, Tand ORP
Arduino Mega2560 kit,Arduino Uno R3 andESP8266 Wi-Fi module
Wi-Fi Router
Dataaggregatorserver(ApacheHadoopcluster)
LCD, smartphone, andPC
90 Technically poor
9 [91] pH and TurbRaspberry Pi kit andRaspberry Pi (built-inWi-Fi)
Wi-Fi Router ThingSpeak Smart phone 40Good for the tanks’cleaning andauto-filling
10 [92] pH onlyPIC16F877 based board andSIM900 GPRS modem withPIC16F877 based board
SIM900GPRSmodem
Php, JavaScript,MySql andWeb sever
Smart phone 20 Technically poor
11 [64] pH and TurbArduino Uno kit andESP8266 Wi-Fi transceivermodule
Wi-Fi RouterCloud basedserver, notspecified
PC andSmart phone 40 Technically poor
12 [68] pH, Turb, T,EC and ORP
Atmega328 MCU basedboard and ZigBee kits
Ethernetmodule
Cloud isused forMobile Apponly
Smart phone,LCD, andspeaker
100 Technicallywell-written
13 [93] pH and TDSArduino Uno type card,Raspberry Pi 3, andRaspberry Pi 3 to PC
Ethernetmodule
Cloud basedserver, notspecified
Smart phone 55
Only two WQMparameters used.Hardware is notoptimized
14 [94] pH, T andTurb
Arduino Uno kit andESP8266 Wi-Fi transceivermodule
Wi-Fi Router Blynk App LCD andsmart phone 50. Three WQM
parameters used
15 [65] pH, ORP, Tand EC
Waspmote MCU card andGSM module GSM module Cloud server,
not specified Desktop PC 80 Good, but some usefuldetails are missing
16 [96] pH and Turb Arduino Mega2560 kit andNodeMCU (ESP8266) kit Wi-Fi Router ThingSpeak
ThingSpeakApp forsmart phone
40 Hardware needsoptimization
17 [97]
pH, T, TDS;EC, Salinityand ORP viamachinelearning
MCU, but not specified andBluetooth Smart phone
GoogleFirebaseCloud
WhatsApp,SMS, email,etc.
100Well-explained, but notfeasible for large scaledeployment due to cost
18 [98] pH, Turb, Tand CO2
Arduino Pro Mini card andESP8266 Wi-Fi transceivermodule
Wi-Fi Router Thinger.ioLCD, PC,and smartphone
50Good, but only threeWQM without machinelearning schemes
19 [48] pH, T, Turb,EC and ORP
Raspberry Pi kit andEthernet modules; ZigBee3G/GPRS module
Wi-Fi Router Pachube IoTplatform
Localnotificationkit, phone,and PC
100.
All circuits, sensors,kits, and technicalparameterswell-explained
20 [99] pH, T, Turband CO2
DE1-SoC development kitand ZigBee PRO S1 802.15.4 Not used Not used PC 50 Hardware needs
optimization
5.1. Right Things in Right Place
After probing into the architecture of contemporary IoT-WQMS, it is observed mostof these systems have not been consistent in technical parameters. The following textelaborates this issue in explicit details:
WQM parameters: As detailed in Section 2, WHO/USEPA developed numerousstandards and guidelines to compute WQI of water sample. Though these bodies recom-mended big lists of such parameters, the concerned water authorities (e.g., municipal)generally deploy a limited set of some useful parameters while computing water qual-ity [19,31,35,49,50]. As mentioned before, WQI is a single number expressing the overallquality of water acquired from a target locality, at a specific time. Its main objective is totransform complicated water-quality data into useful and understandable information. In abroader sense, WQI offers a general idea about overall water quality. As shown in Table 2,most WQM parameters have strong correlation with each other. It implies monitoringall parameters may not be necessary while computing WQI for target water. It is logical
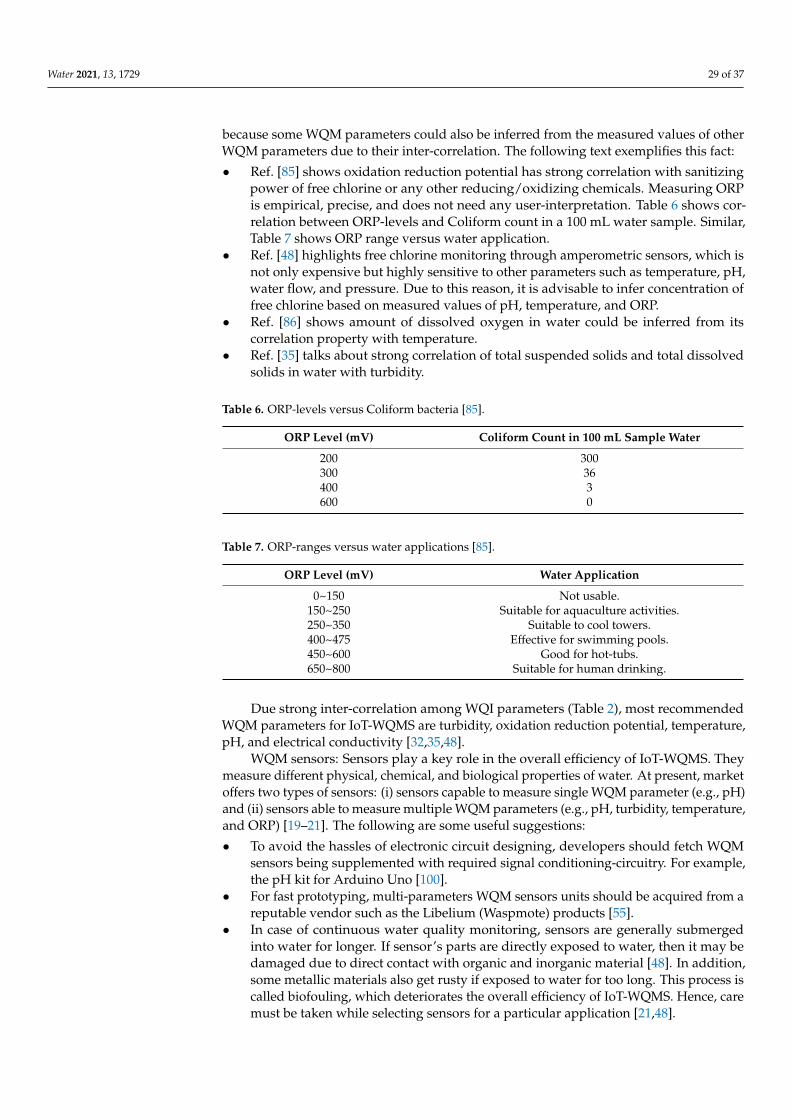
Water 2021, 13, 1729 29 of 37
because some WQM parameters could also be inferred from the measured values of otherWQM parameters due to their inter-correlation. The following text exemplifies this fact:
• Ref. [85] shows oxidation reduction potential has strong correlation with sanitizingpower of free chlorine or any other reducing/oxidizing chemicals. Measuring ORPis empirical, precise, and does not need any user-interpretation. Table 6 shows cor-relation between ORP-levels and Coliform count in a 100 mL water sample. Similar,Table 7 shows ORP range versus water application.
• Ref. [48] highlights free chlorine monitoring through amperometric sensors, which isnot only expensive but highly sensitive to other parameters such as temperature, pH,water flow, and pressure. Due to this reason, it is advisable to infer concentration offree chlorine based on measured values of pH, temperature, and ORP.
• Ref. [86] shows amount of dissolved oxygen in water could be inferred from itscorrelation property with temperature.
• Ref. [35] talks about strong correlation of total suspended solids and total dissolvedsolids in water with turbidity.
Table 6. ORP-levels versus Coliform bacteria [85].
ORP Level (mV) Coliform Count in 100 mL Sample Water
200 300300 36400 3600 0
Table 7. ORP-ranges versus water applications [85].
ORP Level (mV) Water Application
0~150 Not usable.150~250 Suitable for aquaculture activities.250~350 Suitable to cool towers.400~475 Effective for swimming pools.450~600 Good for hot-tubs.650~800 Suitable for human drinking.
Due strong inter-correlation among WQI parameters (Table 2), most recommendedWQM parameters for IoT-WQMS are turbidity, oxidation reduction potential, temperature,pH, and electrical conductivity [32,35,48].
WQM sensors: Sensors play a key role in the overall efficiency of IoT-WQMS. Theymeasure different physical, chemical, and biological properties of water. At present, marketoffers two types of sensors: (i) sensors capable to measure single WQM parameter (e.g., pH)and (ii) sensors able to measure multiple WQM parameters (e.g., pH, turbidity, temperature,and ORP) [19–21]. The following are some useful suggestions:
• To avoid the hassles of electronic circuit designing, developers should fetch WQMsensors being supplemented with required signal conditioning-circuitry. For example,the pH kit for Arduino Uno [100].
• For fast prototyping, multi-parameters WQM sensors units should be acquired from areputable vendor such as the Libelium (Waspmote) products [55].
• In case of continuous water quality monitoring, sensors are generally submergedinto water for longer. If sensor’s parts are directly exposed to water, then it may bedamaged due to direct contact with organic and inorganic material [48]. In addition,some metallic materials also get rusty if exposed to water for too long. This process iscalled biofouling, which deteriorates the overall efficiency of IoT-WQMS. Hence, caremust be taken while selecting sensors for a particular application [21,48].
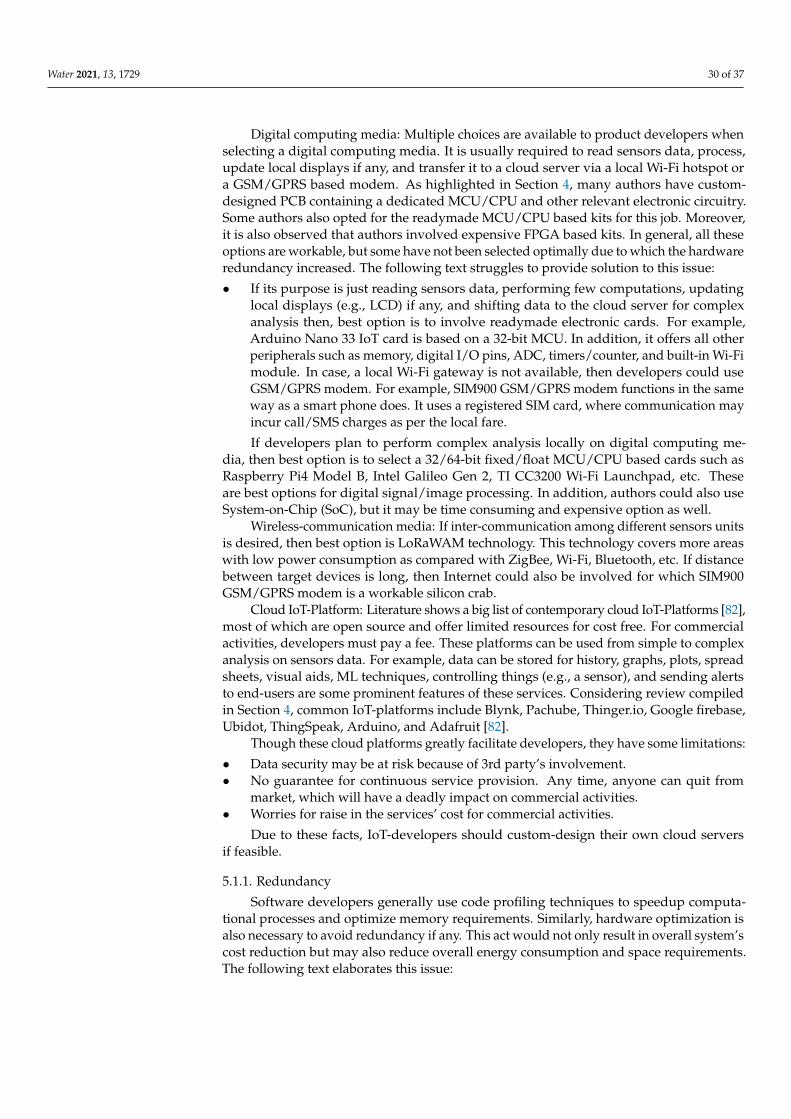
Water 2021, 13, 1729 30 of 37
Digital computing media: Multiple choices are available to product developers whenselecting a digital computing media. It is usually required to read sensors data, process,update local displays if any, and transfer it to a cloud server via a local Wi-Fi hotspot ora GSM/GPRS based modem. As highlighted in Section 4, many authors have custom-designed PCB containing a dedicated MCU/CPU and other relevant electronic circuitry.Some authors also opted for the readymade MCU/CPU based kits for this job. Moreover,it is also observed that authors involved expensive FPGA based kits. In general, all theseoptions are workable, but some have not been selected optimally due to which the hardwareredundancy increased. The following text struggles to provide solution to this issue:
• If its purpose is just reading sensors data, performing few computations, updatinglocal displays (e.g., LCD) if any, and shifting data to the cloud server for complexanalysis then, best option is to involve readymade electronic cards. For example,Arduino Nano 33 IoT card is based on a 32-bit MCU. In addition, it offers all otherperipherals such as memory, digital I/O pins, ADC, timers/counter, and built-in Wi-Fimodule. In case, a local Wi-Fi gateway is not available, then developers could useGSM/GPRS modem. For example, SIM900 GSM/GPRS modem functions in the sameway as a smart phone does. It uses a registered SIM card, where communication mayincur call/SMS charges as per the local fare.
If developers plan to perform complex analysis locally on digital computing me-dia, then best option is to select a 32/64-bit fixed/float MCU/CPU based cards such asRaspberry Pi4 Model B, Intel Galileo Gen 2, TI CC3200 Wi-Fi Launchpad, etc. Theseare best options for digital signal/image processing. In addition, authors could also useSystem-on-Chip (SoC), but it may be time consuming and expensive option as well.
Wireless-communication media: If inter-communication among different sensors unitsis desired, then best option is LoRaWAM technology. This technology covers more areaswith low power consumption as compared with ZigBee, Wi-Fi, Bluetooth, etc. If distancebetween target devices is long, then Internet could also be involved for which SIM900GSM/GPRS modem is a workable silicon crab.
Cloud IoT-Platform: Literature shows a big list of contemporary cloud IoT-Platforms [82],most of which are open source and offer limited resources for cost free. For commercialactivities, developers must pay a fee. These platforms can be used from simple to complexanalysis on sensors data. For example, data can be stored for history, graphs, plots, spreadsheets, visual aids, ML techniques, controlling things (e.g., a sensor), and sending alertsto end-users are some prominent features of these services. Considering review compiledin Section 4, common IoT-platforms include Blynk, Pachube, Thinger.io, Google firebase,Ubidot, ThingSpeak, Arduino, and Adafruit [82].
Though these cloud platforms greatly facilitate developers, they have some limitations:
• Data security may be at risk because of 3rd party’s involvement.• No guarantee for continuous service provision. Any time, anyone can quit from
market, which will have a deadly impact on commercial activities.• Worries for raise in the services’ cost for commercial activities.
Due to these facts, IoT-developers should custom-design their own cloud serversif feasible.
5.1.1. Redundancy
Software developers generally use code profiling techniques to speedup computa-tional processes and optimize memory requirements. Similarly, hardware optimization isalso necessary to avoid redundancy if any. This act would not only result in overall system’scost reduction but may also reduce overall energy consumption and space requirements.The following text elaborates this issue:
Water 2021, 13, 1729 31 of 37
• Ref. [24]: In this article, authors utilized Arduino Uno and NodeMCU for simply read-ing sensors data and shifting it to a local Wi-Fi router. Arduino Uno is centered aroundan 8-bit ATmega328 fixed-point MCU, with many on-chip peripherals such as ADC,PWM, UART, I2C, SPI, memory, etc. Similarly, NodeMCU is based on ESP8266 SoC,which has all peripherals (e.g., one ADC unit, digital I/O, timers/counters, memory,32-bit fixed-point CPU, and Wi-Fi module). Authors used Arduino Uno for readingsensors data and shifting it serially to NodeMCU, which just transfers it to a local Wi-Firouter. Note, NodeMCU alone is enough for analog signal conditioning, processing,logging, and transferring data to a local Wi-Fi router. Though it has only one inputpin to access its ADC module, designers could use a simple digital multiplexing chipto expand its capability to read multiple continuous signals. Similarly, authors inRef. [96] used Arduino Mega2560 and NodeMCU again for simply reading sensorsdata and shifting to a local Wi-Fi router. Arduino ATmega2560 is an advanced versionof Arduino Uno, but again same could be replaced by NodeMCU.
• Ref. [93]: In this article, authors used Arduino Uno and Raspberry Pi3. As mentionedabove, Arduino Uno is based on 8-bit ATmega328 MCU, whereas Raspberry Pi3 cardis centered around a powerful 64-bit CPU. ATmega328 has built-in ADC module, butRaspberry Pi3 card has been deprived of it. However, for cost minimization, a cheapADC module could be interfaced with Raspberry Pi3.
• Ref. [97]: In this article, authors utilized a smart phone to acquire data from anindigenous card through Bluetooth technology and then transfer it to cloud serverusing the same phone. The overall system cost could be optimized if a SIM900GSM/GPRS modem is utilized, instead of a smart phone.
• Ref. [99]: In this article, authors utilized a DE1-SoC FPGA board, which is a very expen-sive card and should only be used for hi-tech designs and prototyping. Unfortunately,this board is utilized for simply reading sensors data and transferring it to a remotePC via a ZigBee kit. This is not a complex task for which such a powerful siliconcrab is deployed. To be honest, this is wastage of technical resources. To address thisissue, developers could fetch a simple FPGA chip from a local market and burn targetbitstream file into its fabric via a chip-programmer. After that, it can be mounted ona customized PCB along with supporting electronic circuitry. Alternatively, authorscould also use Arduino Uno R3 or Arduino Mino Pro, etc. Notably, tentative costs ofDE1-SoC FPGA board and Arduino Uno R3 are USD 249 and USD 23, respectively;prices were fetched from Google Chrome on 16th August 2020.
5.1.2. Machine Learning Techniques
As mentioned earlier, considering all WQM parameters while computing WQI maynot be feasible. Moreover, the commercial market may also not offer sensor against eachparameter. Fortunately, most of these parameters possess strong correlations among them-selves (Table 2). It implies that it is feasible to use a small set of sensors to measuresome parameters (e.g., pH, turbidity, and ORP) and then, based on the measured val-ues of these measurements, infer other important parameters (e.g., free chlorine) usingmathematical models. To resolve this issue, researchers approached towards machinelearning [35,48,65,85,86]. ML is seen as a subset of artificial intelligence (AI). Based onsample data (called training data), ML algorithms build a mathematical model capable tomake decisions or predictions without being clearly programmed to perform so [52]. ForIoT-WQMS, supervised ML algorithms are well-suited. Though ML techniques greatlyenhances the overall efficiency of IoT-WQMS, they have some limitations:
• Additional demand for technical resources, e.g., memory, higher CPU throughput.• Greater the size of training data, the better the performance of ML algorithms.
Water 2021, 13, 1729 32 of 37
There exist two options to address issue of additional resources. Firstly, developersshould use a simple 8-bit MCU based card (e.g., NodeMCU (ESP8266)) and then shiftacquired data to a cloud server for analytical analysis using ML algorithms. Secondly,they could also use a readymade kit based-on a powerful CPU/MCU, e.g., Raspberry Pi4Model B, TI CC3200 Wi-Fi Launchpad, Arduino Intel Galileo board, or DE1 SoC FPGAboard. However, to address second issue, developers could request local/internationalwater-quality control authority to provide them with data for training purposes, if available.
5.2. Recommendations
Following are some useful suggestions and recommendations to design a secure andreliable IoT-WQMS:
WQM parameters: Based on technical review of IoT-WQMS given in Section 4, mostrecommended WQM parameters [32,35,48] are the following:
• Turbidity;• Oxidation reduction potential;• Temperature;• pH;• Electrical conductivity.
Research consensus on these parameters is logical because they have high correlationwith other parameters (Table 2) [19–21]. In addition, these parameters could better predictthe overall water quality. For example, turbidity shows how much shady or cloudytarget water is. Moreover, it is highly correlated with total suspended solid (TSS) [35].When water is dirty, its turbidity is high. Hence, it could be used for example to cleanunderground/overhead tanks.
As stated earlier, ORP is highly correlated with sanitizing power of free chlorine or anyother reducing/oxidizing chemicals in water [85]. It has a high correlation with presenceof E-Coli bacteria. Temperature has great impact on overall water quality. It is becauseit affects pH, EC, DO, etc. Due to this fact, temperature measurement are necessary tocompensate other parameters. In addition, it could also be used to infer other parameterssuch as DO [86]. EC is utilized to measure alkalinity, hardness, and some solids dissolvedin water. Finally, pH measures acidity or alkalinity of water.
WQM sensors: As different manufacturers produced sensors for similar applications,therefore selection of appropriate sensors strongly impacts overall system efficiency. Range,response time, resolution, sensitivity, and reliability are some important considerationswhile choosing a sensor. For example, some sensors are designed in such a way when theyare submerged in water, then their sensitive parts are auto cleaned when water flows withhigh pressure. On other hand, if same sensors are submerged in static water (e.g., overheadtank), then their sensitive parts may get contaminated due to reactions with water andcontaminations [48].
Sensors-Node: It can read sensors data, recondition, process, update local displaysif any, and transfer data to a master unit or a cloud server via a local Wi-Fi router orGSM/GPRS modem. If task assigned to it is simple and complex are intended to beperformed in cloud, then developers should use commercial IoT cards, e.g., Arduino Nano33 IoT card and NodeMCU. Such cards are cheap, power optimized, light weight, andeasily accessible. If complex analysis are desired to be performed locally, then developersshould involve commercial cards such as Raspberry Pi4 Model B (64-bit CPU), Intel GalileoGen 2 (32-bit MCU), TI CC3200 Wi-Fi Launchpad (32-bit MCU), etc. If a local Wi-Fi routeris not available, then SIM900 GSM/GPRS modem should be utilized. If SIM900 modulefalls expensive or the range of communication is within few kilometers, then LoRaWANtechnology is best option as highlighted in Table 8 [31]. Communication in the line-of-site(LoS) is possible up to 10 kilometers (km).

Water 2021, 13, 1729 33 of 37
Table 8. WSN standards comparison.
Wireless Standard Frequency Band (MHz) Network Topology Data-Rate (kbps) Range Capability (LoS) Relative Power Consumption
SigFox 902, 868 Star 1 40 km Very lowLoRaWAN 915, 868 Star 50 10 km+ Very lowBluetooth 2400 P2P/star 720 10~100 m HighZigBee 2400, 915, 868 Star/tree/mesh 250, 40, 20 100 m+ LowIEEE 802.15.4 2400, 915, 868 Star 250, 40, 20 100 m+ Low
Gateway: For IoT objects to function reliably, all parts of the concerned IoT-basedsystem should be secure. For instance, cyber criminals can hack any connected object suchas smart TV, security camera, refrigerator, etc. Some security risks inherited in IoT devicesfrom manufacturers’ side are (i) insecure storage and data transfer, (ii) guessable, weak,or hard coded passwords, (iii) hardware issues, (iv) lack of a secure update mechanismand (v) unpatched and old embedded software and/or operating systems. Under suchconditions, developers are advised to use IoT gateways [83].
Cloud IoT-Servers: There exists many public cloud IoT-servers [82], which can accessand control things, store sensors data, perform analytic analysis, generate early warningalerts, and so forth. However, most of these are not cost free for commercial activities. Inaddition, data security may also be at higher risk due to third party involvement. Mostimportantly, services could also be ceased without any prior acknowledgment. Hence,authors are encouraged to custom develop cloud server if feasible to minimize risks.
Machine learning: Finally, authors advise developers to involve ML techniques foroptimal results.
6. Conclusions
This study presented a review on IoT-based solution for quality monitoring of do-mestic water. Firstly, it introduces readers with the freshwater crisis, including its origin,pollution, depletion of underground water, and seawater desalination. It also details thewater quality index recommended by WHO, commonly used water quality index parame-ters, and WHO recommended safe limits for drinking water. Secondly, it details evolutionof water monitoring from traditional to smart water monitoring. For the sake of readerscomfort, it briefly elaborates a typical IoT based water quality monitoring system. Thirdly,it presents a comprehensive survey of contemporary IoT-WQMS for domestic water. Inthis concern, many critical parameters (e.g., sensors, cloud service, user-interface, andgateway) are discussed and compared. In addition, each article is also rated using ourproposed empirical rubric, which is based on WHO standards of drinking water. Fourthly,in-depth technical discussion and analysis are offered related to IoT-WQMS. Finally, au-thors also suggested a set of useful recommendations to design an efficient IoT-WQMS fordomestic water.
To conclude, this study would surely benefit the research community interested insmart water monitoring, as well as engineers developing applications for smart environ-ments (e.g., smart homes, offices, and cities).
As a future work, it will be interesting to explore optimal designing of smart wart qual-ity monitoring system, exploring optimal portable sensors’ technology, usage of secure andreliable IoT servers, and devising resilient schemes mitigating potential security breaches.
Author Contributions: Conceptualization, F.J. and D.D.; resources, F.J.; writing—original draftpreparation, F.J.; writing—review and editing, D.D.; funding acquisition, N.M.-A. All authors haveread and agreed to the published version of the manuscript.
Funding: This research was funded by the Deanship of Scientific Research (DSR), Imam Abdulrah-man Bin Faisal University (IAU), grant number 2019-381-CSIT. The APC was funded by the Deanshipof Scientific Research (DSR), Imam Abdulrahman Bin Fai-sal University (IAU).
Institutional Review Board Statement: Not applicable.
Informed Consent Statement: Not applicable.
Water 2021, 13, 1729 34 of 37
Data Availability Statement: Not applicable.
Acknowledgments: Authors are thankful to the Deanship of Scientific Research (DSR), Imam Abdul-rahman Bin Faisal University (IAU) for the generous funding under project numbered: 2019-381-CSIT.Moreover, we are highly pleased to authors, corporations, companies, and organizations whosematerial has been utilized in the preparation of this article.
Conflicts of Interest: The authors declare no conflict of interest.
References1. Yaroshenko, I.; Kirsanov, D.; Marjanovic, M.; Lieberzeit, P.A.; Korostynska, O.; Mason, A.; Frau, I.; Legin, A. Real-time water
quality monitoring with chemical sensors. Sensors 2020, 20, 3432. [CrossRef]2. Sambito, M.; Freni, G. Strategies for improving optimal positioning of quality sensors in urban drainage systems for non-
conservative contaminants. Water 2021, 13, 934. [CrossRef]3. Piazza, S.; Sambito, M.; Feo, R.; Freni, G.; Puleo, V. Optimal positioning of water quality sensors in water distribution networks:
Comparison of numerical and experimental results’. In Proceedings of the CCWI 2017—Computing and Control for the WaterIndustry; The University of Sheffield: Sheffield, UK, 2017.
4. Nassrullah, H.; Anis, S.F.; Hashaikeh, R.; Hilal, N. Energy for desalination: A state-of-the-art review. Desalination 2020, 491,114569. [CrossRef]
5. Viola, A.; Curto, D.; Franzitta, V.; Trapanese, M. Sea water desalination and energy consumption: A case study of wave energyconverters (WEC) to desalination applications in sicily. In Proceedings of the OCEANS 2016 MTS/IEEE Monterey, OCE 2016,Monterey, CA, USA, 19–23 September 2016.
6. Hofman-Caris, R.; Bertelkamp, C.; de Waal, L.; van den Brand, T.; Hofman, J.; van der Aa, R.; van der Hoek, J.P. Rainwaterharvesting for drinkingwater production: A sustainable and cost-effective solution in The Netherlands? Water 2019, 11, 511.[CrossRef]
7. Gao, G.; Xiao, K.; Chen, M. An intelligent IoT-based control and traceability system to forecast and maintain water quality infreshwater fish farms. Comput. Electron. Agric. 2019, 166, 105013. [CrossRef]
8. Franco, J.D.; Ramirez-delReal, T.A.; Villanueva, D.; Gárate-García, A.; Armenta-Medina, D. Monitoring of Ocimum basilicumseeds growth with image processing and fuzzy logic techniques based on Cloudino-IoT and FIWARE platforms. Comput. Electron.Agric. 2020, 173, 105389. [CrossRef]
9. Zhu, X.; Li, D.; He, D.; Wang, J.; Ma, D.; Li, F. A remote wireless system for water quality online monitoring in intensive fishculture. Comput. Electron. Agric. 2010, 71, S3. [CrossRef]
10. Ramos, H.M.; Carravetta, A.; Mc Nabola, A. New challenges in water systems. Water 2020, 12, 2340. [CrossRef]11. Giudicianni, C.; Herrera, M.; di Nardo, A.; Carravetta, A.; Ramos, H.M.; Adeyeye, K. Zero-net energy management for the
monitoring and control of dynamically-partitioned smart water systems. J. Clean. Prod. 2020, 252, 119745. [CrossRef]12. Ramos, H.M.; Mcnabola, A.; Amparo López-Jiménez, P.; Pérez-Sánchez, M. Smart Water Management towards Future Water
Sustainable Networks. Water 2020, 12, 58. [CrossRef]13. EarthEcho Water Challenge. Available online: https://www.monitorwater.org/ (accessed on 19 May 2021).14. Dadoo, M.; Daraghmi, Y.-A. Smart Water Leakage Detection Using Wireless Sensor Networks (SWLD). Int. J. Netw. Commun.
2017, 7, 1–16.15. Drinking-Water. Available online: https://www.who.int/news-room/fact-sheets/detail/drinking-water (accessed on
19 May 2021).16. EPA, U. S. E. P. A. The Facts about Nutrient Pollution. United State Environmental Protection Agency, 1–2; 2012. Available online:
www.epa.gov/nutrientpollution (accessed on 9 June 2021).17. Water. Available online: https://www.epa.nsw.gov.au/your-environment/water (accessed on 19 May 2021).18. Tobergte, D.R.; Curtis, S. Global Drinking Water Quality Index Development and Sensitivity Analysis Report. J. Chem. Inf. Model.
2013, 53, 1689–1699.19. Ahmed, U.; Mumtaz, R.; Anwar, H.; Mumtaz, S.; Qamar, A.M. Water quality monitoring: From conventional to emerging
technologies. Water Sci. Technol. Water Supply 2020, 20, 28–45. [CrossRef]20. Adu-Manu, K.S.; Tapparello, C.; Heinzelman, W.; Katsriku, F.A.; Abdulai, J.D. Water quality monitoring using wireless sensor
networks: Current trends and future research directions. ACM Trans. Sens. Netw. 2017, 13, 1–41. [CrossRef]21. Banna, M.H.; Imran, S.; Francisque, A.; Najjaran, H.; Sadiq, R.; Rodriguez, M.; Hoorfar, M. Online drinking water quality
monitoring: Review on available and emerging technologies. Crit. Rev. Environ. Sci. Technol. 2014, 44, 1370–1421. [CrossRef]22. Water Crisis|World Water Council. Available online: https://www.worldwatercouncil.org/en/water-crisis (accessed on
19 May 2021).23. Min-Allah, N.; Farooqui, M.; Alwashmi, A.; Almahasheer, S.; Alsufayyan, M.; Altulaihan, N. Smart monitoring of water tanks in
KSA. In Proceedings of the 2018 International Conference on Computational Science and Computational Intelligence, CSCI 2018,Las Vegas, NV, USA, 12–14 December 2018; pp. 1044–1047.
24. Damor, P.; Sharma, K. IoT based Water Monitoring System: A Review. Int. J. Adv. Eng. Res. Dev. 2017, 4, 1–6.25. Managing the water distribution network with a Smart Water Grid. Smart Water 2016, 1, 1–13. [CrossRef]

Water 2021, 13, 1729 35 of 37
26. Abba, S.; Namkusong, J.W.; Lee, J.A.; Crespo, M.L. Design and performance evaluation of a low-cost autonomous sensor interfacefor a smart iot-based irrigation monitoring and control system. Sensors 2019, 19, 3643. [CrossRef]
27. Nawandar, N.K.; Satpute, V.R. IoT based low cost and intelligent module for smart irrigation system. Comput. Electron. Agric.2019, 162, 979–990. [CrossRef]
28. Vijai, P.; Sivakumar, P.B. Design of IoT Systems and Analytics in the Context of Smart City Initiatives in India. In Proceedings of theProcedia Computer Science; Elsevier B.V.: Amsterdam, The Netherlands, 2016; Volume 92, pp. 583–588.
29. Mohammed Shahanas, K.; Bagavathi Sivakumar, P. Framework for a Smart Water Management System in the Context of SmartCity Initiatives in India. In Proceedings of the Procedia Computer Science; Elsevier B.V.: Amsterdam, The Netherlands, 2016; Volume92, pp. 142–147.
30. Ali, H.; Choi, J.H. A review of underground pipeline leakage and sinkhole monitoring methods based on wireless sensornetworking. Sustainability 2019, 11, 4007. [CrossRef]
31. Pule, M.; Yahya, A.; Chuma, J. Wireless sensor networks: A survey on monitoring water quality. J. Appl. Res. Technol. 2017, 15,562–570. [CrossRef]
32. Geetha, S.; Gouthami, S. Internet of things enabled real time water quality monitoring system. Smart Water 2016, 2, 1–19.[CrossRef]
33. Pujar, P.M.; Kenchannavar, H.H.; Kulkarni, U.P. Wireless Sensor Network based Water Monitoring Systems: A survey.In Proceedings of the 2016 2nd International Conference on Applied and Theoretical Computing and Communication Technology,iCATccT 2016, Bangalore, India, 21–23 July 2016; pp. 155–159.
34. Bichai, F.; Ashbolt, N. Public health and water quality management in low-exposure stormwater schemes: A critical review ofregulatory frameworks and path forward. Sustain. Cities Soc. 2017, 28, 453–465. [CrossRef]
35. Manoharan, S.; Sathiyaraj, G.; Thiruven, K. Water Quality Analyzer using IoT. Int. J. Innov. Technol. Explor. Eng. 2019, 8, 34–37.36. Water Pollution Facts, Types, Causes and Effects of Water Pollution|NRDC. Available online: https://www.nrdc.org/stories/
water-pollution-everything-you-need-know (accessed on 19 May 2021).37. Earth’s Freshwater|National Geographic Society. Available online: https://www.nationalgeographic.org/media/earths-fresh-
water/ (accessed on 19 May 2021).38. How Much Water is There on Earth? Available online: https://www.usgs.gov/special-topic/water-science-school/science/how-
much-water-there-earth?qt-science_center_objects=0#qt-science_center_objects (accessed on 19 May 2021).39. Nasirudin, M.A.; Za’bah, U.N.; Sidek, O. Fresh water real-time monitoring system based on wireless sensor network and GSM. In
Proceedings of the 2011 IEEE Conference on Open Systems, ICOS 2011, Langkawi, Malaysia, 25–28 September 2011; pp. 354–357.40. Groundwater—Wikipedia. Available online: https://en.wikipedia.org/wiki/Groundwater (accessed on 19 May 2021).41. Berman, J. WHO: Waterborne Disease is World’s Leading Killer|Voice of America—English. Available online: https://www.
voanews.com/archive/who-waterborne-disease-worlds-leading-killer (accessed on 19 May 2021).42. Petsko, G.A. The blue marble. Genom. Biol. 2011, 12, 112. [CrossRef] [PubMed]43. Ezugwu, C.N.; Apeh, S. Ground Water and Surface Water as One Resource: Connectivity and Interaction. IOSR J. Mech. Civ. Eng.
2017, 14, 54–59. [CrossRef]44. Brands, E.; Rajagopal, R.; Eleswarapu, U.; Li, P. Groundwater. In International Encyclopedia of Geography: People, the Earth,
Environment and Technology; John Wiley & Sons, Ltd: Oxford, UK, 2017; pp. 1–17.45. Nacht, S.J. Ground-water monitoring system considerations: Discusses factors that should be considered when designing a
system for the collection and analysis of water quality data. Groundw. Monit. Remediat. 1983, 3, 33–39. [CrossRef]46. Way, S.; McKee, C.R.; Wainwright, H.K. A Computerized Ground Water Monitoring System. Groundw. Monit. Remediat. 1984, 4,
21–25. [CrossRef]47. Cloete, N.A.; Malekian, R.; Nair, L. Design of Smart Sensors for Real-Time Water Quality Monitoring. IEEE Access 2016, 4,
3975–3990. [CrossRef]48. Lambrou, T.P.; Anastasiou, C.C.; Panayiotou, C.G.; Polycarpou, M.M. A low-cost sensor network for real-time monitoring and
contamination detection in drinking water distribution systems. IEEE Sens. J. 2014, 14, 2765–2772. [CrossRef]49. Babu Loganathan, G.; Principal, D.; Chengalvaraya, P.; Kumar, R.S. Iot Based Water and Soil Quality Monitoring System. Int. J.
Mech. Eng. Technol. 2019, 10, 537–541.50. Vinod, G.V.; Peter, A.V.; Rao, I.S.; Sailaja, S.; Babu, Y.S.N. IoT based water quality monitoring system using WSN. Ind. J. Public
Health Res. Dev. 2018, 9, 1575–1578. [CrossRef]51. Suzuki, J.; Imamura, M.; Nakano, D.; Yamamoto, R.; Fujita, M. Effects of water turbidity and different temperatures on oxidative
stress in caddisfly (Stenopsyche marmorata) larvae. Sci. Total Environ. 2018, 630, 1078–1085. [CrossRef] [PubMed]52. Wikipedia. Available online: https://www.wikipedia.org/ (accessed on 20 May 2021).53. globalw.com. Available online: http://www.globalw.com/catalog_wq.html (accessed on 19 May 2021).54. FierceElectronics|Independent Electronics News, Analysis and Resources for Design Engineers and Engineering. Available
online: https://www.fierceelectronics.com/ (accessed on 19 May 2021).55. ROTEUS WATER SENSOR for Realtime Detecting e.coli Bacteria in Rivers——Libelium. Available online: https://www.libelium.
com/libeliumworld/proteus-water-sensor-for-detecting-e-coli-bacteria/ (accessed on 19 May 2021).
Water 2021, 13, 1729 36 of 37
56. Kashid, S.G.; Pardeshi, S.A. A survey of water distribution system and new approach to intelligent water distribution system. InProceedings of the 1st International Conference on Networks and Soft Computing, ICNSC 2014—Proceedings, Guntur, India,19–20 August 2014; pp. 339–344.
57. Chowdury, M.S.U.; Emran, T.B.; Ghosh, S.; Pathak, A.; Alam, M.M.; Absar, N.; Andersson, K.; Hossain, M.S. IoT based real-timeriver water quality monitoring system. In Proceedings of the Procedia Computer Science; Elsevier B.V.: Amsterdam, The Netherlands,2019; Volume 155, pp. 161–168.
58. Min-Allah, N.; Jan, F.; Alrashed, S. Pupil detection schemes in human eye: A review. Multimed. Syst. 2021. [CrossRef]59. Jan, F.; Alrashed, S.; Min-Allah, N. Iris segmentation for non-ideal Iris biometric systems. Multimed. Tools Appl. 2021, 1–29.
[CrossRef]60. Kumar, S.; Yadav, S.; Yashaswini, H.M.; Salvi, S. An IoT-based smart water microgrid and smart water tank management system.
In Proceedings of the Advances in Intelligent Systems and Computing; Springer: Berlin/Heidelberg, Germany, 2019; Volume 906,pp. 417–431.
61. Kawarkhe, M.B.; Agrawal, S.; Corresponding, I. Smart Water Monitoring System Using IOT at Home. IOSR J. Comput. Eng. 2019,21, 14–19. [CrossRef]
62. Spandana, K.; Seshagiri Rao, V.R. Internet of Things (Iot) Based Smart Water Quality Monitoring System. Int. J. Eng. Technol. 2018,7, 259–262. [CrossRef]
63. Madhavireddy, V.; Koteswarrao, B. Smart Water Quality Monitoring System Using Iot Technology. Int. J. Eng. Technol. 2018, 7,636. [CrossRef]
64. Gowthamy, J.; Reddy, C.R.; Meher, P.; Shrivastava, S.; Kumar, G. Smart Water Monitoring System using IoT. Int. Res. J. Eng.Technol. 2008, 2008, 1170.
65. Prasad, A.N.; Mamun, K.A.; Islam, F.R.; Haqva, H. Smart water quality monitoring system. In Proceedings of the 2015 2ndAsia-Pacific World Congress on Computer Science and Engineering, APWC on CSE 2015, Nadi, Fiji, 2–4 December 2016.
66. Deepiga, M.T.; Sivasankari, M.A. Smart Water Monitoring System Using Wireless Sensor Network at Home/Office. Int. Res. J.Eng. Technol. 2015, 2, 1305–1314.
67. Patil, Y.; Singh, R. Smart Water Tank Management System for Residential Colonies Using Atmega128A Microcontroller. Proc. Int.J. Sci. Eng. Res. 2014, 5, 355–357.
68. Kavi Priya, S.; Shenbagalakshmi, G.; Revathi, T. Design of smart sensors for real time drinking water quality monitoring andcontamination detection in water distributed mains. Int. J. Eng. Technol. 2017, 7, 47. [CrossRef]
69. Suwaileh, W.; Johnson, D.; Hilal, N. Membrane desalination and water re-use for agriculture: State of the art and future outlook.Desalination 2020, 491, 114559. [CrossRef]
70. Khatri, N.; Sharma, A.; Khatri, K.K.; Sharma, G.D. An IoT-based innovative real-time pH monitoring and control of mu-nicipal wastewater for agriculture and gardening. In Proceedings of the Smart Innovation, Systems and Technologies; Springer:Berlin/Heidelberg, Germany, 2018; Volume 79, pp. 353–362.
71. Mohammadintan, S.B. Water Monitoring System for Agriculture Sector; Universiti Malaysia Perlis: Perlis, Malaysia, 2007.72. Lin, Y.B.; Tseng, H.C. FishTalk: An IoT-Based Mini Aquarium System. IEEE Access 2019, 7, 35457–35469. [CrossRef]73. Raju, K.R.S.R.; Varma, G.H.K. Knowledge based real time monitoring system for aquaculture Using IoT. In Proceedings of the 7th
IEEE International Advanced Computing Conference, IACC 2017, Hyderabad, India, 5–7 January 2017; pp. 318–321.74. Espinosa-Faller, F.; Rendon-Rodriguez, G.E. A ZigBee Wireless Sensor Network for Monitoring an Aquaculture Recirculating
System. J. Appl. Res. Technol. 2012, 10, 380–387. [CrossRef]75. Encinas, C.; Ruiz, E.; Cortez, J.; Espinoza, A. Design and implementation of a distributed IoT system for the monitoring of water
quality in aquaculture. In Proceedings of the Wireless Telecommunications Symposium, Chicago, IL, USA, 26–28 April 2017.76. Rani, S.S.; Sundari, V.K. IoT Based Water Level Monitoring System for Lake in a Cloud Environment; 2019, 12, 21–25. Int. J. Lakes
Rivers 2019, 12, 21–25.77. Huang, L.; Cheng, S. Unmanned monitoring system of rivers and lakes based on WSN. In Proceedings of the 2012 International
Conference on Systems and Informatics, Yantai, China, 19–20 May 2012; pp. 495–498.78. Zhu, G.; Zhao, G.; Zhang, Z.; Lu, X. Water quality of water source area in Taihu Lake and effect on water treatment process. In
Proceedings of the 2011 International Conference on Consumer Electronics, Communications and Networks, Xianning, China,16–18 April 2011; pp. 3783–3786.
79. Liao, R.; Shen, Y.; Zhan, N.; Liu, C.; Huang, Y. Research on the water purification for reclaimed water resource supply-type lakesby the method of recirculation filtration. In Proceedings of the 2011 International Conference on Remote Sensing, Environmentand Transportation Engineering, Nanjing, China, 24–26 June 2011; pp. 5271–5275.
80. Yang, C.; Wang, X. The water quality and pollution character in Qingshuihai lake valley-typical urban drinking water sources. InProceedings of the 2011 International Conference on Remote Sensing, Environment and Transportation Engineering, Nanjing,China, 24–26 June 2011; pp. 7287–7291.
81. Jing, W.; Liu, T. Application of wireless sensor network in Yangtze River basin water environment monitoring. In Proceedings ofthe 2015 27th Chinese Control and Decision Conference, CCDC 2015, Qingdao, China, 23–25 May 2015; pp. 5981–5985.
82. Ray, P.P. A survey of IoT cloud platforms. Futur. Comput. Inform. J. 2016, 1, 35–46. [CrossRef]83. IoT Routers and Gateways—Cisco. Available online: https://www.cisco.com/c/en/us/products/routers/industrial-routers-
gateways/index.html#~benefits (accessed on 6 June 2021).
Water 2021, 13, 1729 37 of 37
84. Arduino—HomePage. Available online: https://www.arduino.cc/en/IoT/HomePage (accessed on 19 May 2021).85. Vasudevan, G.; Kumar, B.S. Embedded based real time monitoring and detection of bacterial contamination in drinking water
using ORP measurement. Int. J. Electron. Commun. Eng. 2015, 2, 1–4. [CrossRef]86. Simitha, K.M.; Subodh Raj, M.S. IoT and WSN Based Water Quality Monitoring System. In Proceedings of the 3rd International
Conference on Electronics and Communication and Aerospace Technology, Coimbatore, India, 12–14 June 2019; pp. 205–210.87. IoT platform|Internet of Things|Ubidots. Available online: https://ubidots.com/ (accessed on 19 May 2021).88. Das, B.; Jain, P.C. Real-time water quality monitoring system using Internet of Things. In Proceedings of the 2017 International
Conference on Computer, Communications and Electronics, Jaipur, India, 1–2 July 2017; pp. 78–82.89. Noorjannah Ibrahim, S.; Asnawi, A.L.; Abdul Malik, N.; Mohd Azmin, N.F.; Jusoh, A.Z.; Mohd Isa, F.N. Web based water
turbidity monitoring and automated filtration system: IoT application in water management. Int. J. Electr. Comput. Eng. 2018, 8,2503–2511. [CrossRef]
90. Carminati, M.; Turolla, A.; Mezzera, L.; Di Mauro, M.; Tizzoni, M.; Pani, G.; Zanetto, F.; Foschi, J.; Antonelli, M. A self-poweredwireless water quality sensing network enabling smart monitoring of biological and chemical stability in supply systems. Sensors2020, 20, 1125. [CrossRef]
91. Raghava Rao, K.; Srinija, S.; Bindu, K.H.; Satish Kumar, D. IOT based water level and quality monitoring system in overheadtanks. Int. J. Eng. Technol. 2018, 7, 379–383. [CrossRef]
92. Ahmed Sha, S.K.; Sankari, S.; Professor, A. Smart Tank Water Monitoring System Using IOT Cloud Server at Home/Office. Int. J.Eng. Sci. Comput. 2018, 8, 16748–16751.
93. Pappu, S.; Vudatha, P.; Sankaranarayanan, S. Intelligent IoT Based Water Quality Monitoring System. Int. J. Appl. Eng. Res. 2017,12, 5447–5454.
94. Daigavane, V.V.; Gaikwad, M.A. Water Quality Monitoring System Based on IOT. Adv. Wirel. Mob. Commun. 2017, 10, 1107–1116.95. Water Management IoT Technology Solution|Libelium. Available online: https://www.libelium.com/iot-solutions/smart-
water/ (accessed on 19 May 2021).96. Pasika, S.; Gandla, S.T. Smart water quality monitoring system with cost-effective using IoT. Heliyon 2020, 6, e04096. [CrossRef]
[PubMed]97. Srivastava, S.; Vaddadi, S.; Sadistap, S. Smartphone-based System for water quality analysis. Appl. Water Sci. 2018, 8, 130.
[CrossRef]98. Bhagat, P.S.; Gulhane, D.V.S.; Rohankar, P.T.S. Implementation of Internet of Things for Water Quality Monitoring. Int. J. Trend Sci.
Res. Dev. 2019, 3, 306–311. [CrossRef]99. Cho Zin, M.; Lenin, G.; Huo Chong, L.; Prassana, M.V. Real-time water quality system in internet of things. In Proceedings of the
IOP Conference Series: Materials Science and Engineering, Sarawak, Malaysia, 26–28 November 2018; Institute of Physics Publishing:Sarawak, Malaysia; Volume 495, p. 012021.
100. Arduino—Home. Available online: https://www.arduino.cc/ (accessed on 19 May 2021).
Copyright © 2022 FDOKUMEN