IoT-based Smart Greenhouse with Disease Prediction using ...
9
(IJACSA) International Journal of Advanced Computer Science and Applications, Vol. 12, No. 7, 2021 113 | Page www.ijacsa.thesai.org IoT-based Smart Greenhouse with Disease Prediction using Deep Learning Neda Fatima 1 *, Salman Ahmad Siddiqui 2 , Anwar Ahmad 3 Department of Electronics and Communication Engineering Jamia Millia Islamia, New Delhi, India Abstract—Rapid industrialization and urbanization has led to decrease in agricultural land and productivity worldwide. This is combined with increasing demand of chemical free organic vegetables by the educated urban households, and thus, greenhouses are quickly catching trend for their specialized advantages especially in extreme weather countries. They provide an ideal environment for longer and efficient growing seasons and ensure profitable harvests. The present paper designs and demonstrates a comprehensive IoT based Smart Greenhouse system that implements a novel combination of monitoring, alerting, cloud storage, automation and disease prediction, viz. a readily deployable complete package. It continuously keeps track of ambient conditions like temperature, humidity and soil moisture conditions to ensure a higher yield of crop and immediate redressal in case of abnormal conditions. It also has a built-in automatic irrigation management system. Finally, it employs the most efficient deep learning model for disease identification with leaf images. Furthermore, with memory and storage optimization through cloud storage, an individual living in the city can also build a greenhouse and can monitor it from his home and take redressal methods as and when desired. Keywords—Cloud; deep learning; greenhouse; humidity; IoT; soil moisture; temperature I. INTRODUCTION With increasing globalization and consequent urbanization, land under agriculture has been reducing. Furthermore, with excessive amount of fertilizers and pesticides, its natural productivity has also been depleting. Moreover, with the increasing awareness about the harmful effects of pesticides and fertilizers on human body and environment, demands have risen for organic plants and vegetables. Consequently, greenhouses have emerged to be highly beneficial gardening solutions especially in extreme weather condition countries. Greenhouses offer a controlled environment which guarantees higher yields in a sustainable pattern. The controlled growing pattern with a longer growing season allows for round the year harvest with a diversity of crops, exotic plants in particular. The greenhouse structure shield plants from extreme weather protection such as strong, gusty winds or high intensity ultraviolet rays. The enclosed structure allows for diffused penetration of light and prevents pest attacks and damage of crops by stray animals thus reducing potential man-animal conflicts. Easy portability and customization of the structures provide for better planting efficiency and higher yields with modern outlook. Thus, greenhouses offer viable cultivation and plantation in a sustainable manner with least damage to environment. The present research and the development of Smart Greenhouse System that focuses on novel combination of monitoring, alerting, automation and data analysis aspects of the greenhouse. The system design architecture comprises of four parts i.e. firstly, automated monitoring system that is Temperature, humidity and soil moisture monitoring with data storage on cloud. Secondly, it sends alerts to the farmer in case the ambient conditions shift from the appropriate conditions to take remedial action. Thirdly, it provides for automatic switching of irrigation on the basis of sensor data. Finally, the system implements plant disease detection analysis through deep learning techniques. II. REVIEW OF LITERATURE This section describes the different works in the current area of research. There are researches [1], [2] cited to understand the importance and pressing need of greenhouses in agriculture. It describes the sustainable advantages of greenhouses particularly with respect to climate change. It demonstrates their portability and customization that helps to make it easy to implement for modern farming practices. Since limited space is utilized, it leads to cost efficient solutions with improved yield and decreased effect of pests and erratic weather conditions. Sincere efforts and earlier attempts have been made in the area of Smart greenhouses, however, the research has been restricted to only a few certain aspects and do not cover all the parameters that influence the system. For instance, in [3], a review paper has been presented to demonstrate different values of temperature and humidity for different types of crops that can be grown in a greenhouse. Furthermore, in [4], methods have been studied and demonstrated to improve crop yields in the system. The author in [5] presents a demonstration of solar panels and sensors in greenhouses and limits its functioning to determine the stress conditions in the greenhouse. In [6], the paper focuses only on the automation aspect and presents an automatic irrigation system for the greenhouse that makes human interference minimal for running of greenhouse. Similarly in [7], using Raspberry Pi and Arduino, different parameters that impact the yield of crops like humidity, CO2 levels, light intensity, soil moisture, and temperature are being monitored, controlled and coordinated. *Corresponding Author
-
Upload
khangminh22 -
Category
Documents
-
view
0 -
download
0
Transcript of IoT-based Smart Greenhouse with Disease Prediction using ...

(IJACSA) International Journal of Advanced Computer Science and Applications,
Vol. 12, No. 7, 2021
113 | P a g e
www.ijacsa.thesai.org
IoT-based Smart Greenhouse with Disease Prediction
using Deep Learning
Neda Fatima1*, Salman Ahmad Siddiqui2, Anwar Ahmad3
Department of Electronics and Communication Engineering
Jamia Millia Islamia, New Delhi, India
Abstract—Rapid industrialization and urbanization has led to
decrease in agricultural land and productivity worldwide. This is
combined with increasing demand of chemical free organic
vegetables by the educated urban households, and thus,
greenhouses are quickly catching trend for their specialized
advantages especially in extreme weather countries. They
provide an ideal environment for longer and efficient growing
seasons and ensure profitable harvests. The present paper
designs and demonstrates a comprehensive IoT based Smart
Greenhouse system that implements a novel combination of
monitoring, alerting, cloud storage, automation and disease
prediction, viz. a readily deployable complete package. It
continuously keeps track of ambient conditions like temperature,
humidity and soil moisture conditions to ensure a higher yield of
crop and immediate redressal in case of abnormal conditions. It
also has a built-in automatic irrigation management system.
Finally, it employs the most efficient deep learning model for
disease identification with leaf images. Furthermore, with
memory and storage optimization through cloud storage, an
individual living in the city can also build a greenhouse and can
monitor it from his home and take redressal methods as and
when desired.
Keywords—Cloud; deep learning; greenhouse; humidity; IoT;
soil moisture; temperature
I. INTRODUCTION
With increasing globalization and consequent urbanization, land under agriculture has been reducing. Furthermore, with excessive amount of fertilizers and pesticides, its natural productivity has also been depleting. Moreover, with the increasing awareness about the harmful effects of pesticides and fertilizers on human body and environment, demands have risen for organic plants and vegetables. Consequently, greenhouses have emerged to be highly beneficial gardening solutions especially in extreme weather condition countries.
Greenhouses offer a controlled environment which guarantees higher yields in a sustainable pattern. The controlled growing pattern with a longer growing season allows for round the year harvest with a diversity of crops, exotic plants in particular. The greenhouse structure shield plants from extreme weather protection such as strong, gusty winds or high intensity ultraviolet rays. The enclosed structure allows for diffused penetration of light and prevents pest attacks and damage of crops by stray animals thus reducing potential man-animal conflicts.
Easy portability and customization of the structures provide for better planting efficiency and higher yields with modern
outlook. Thus, greenhouses offer viable cultivation and plantation in a sustainable manner with least damage to environment.
The present research and the development of Smart Greenhouse System that focuses on novel combination of monitoring, alerting, automation and data analysis aspects of the greenhouse. The system design architecture comprises of four parts i.e. firstly, automated monitoring system that is Temperature, humidity and soil moisture monitoring with data storage on cloud. Secondly, it sends alerts to the farmer in case the ambient conditions shift from the appropriate conditions to take remedial action. Thirdly, it provides for automatic switching of irrigation on the basis of sensor data. Finally, the system implements plant disease detection analysis through deep learning techniques.
II. REVIEW OF LITERATURE
This section describes the different works in the current area of research. There are researches [1], [2] cited to understand the importance and pressing need of greenhouses in agriculture. It describes the sustainable advantages of greenhouses particularly with respect to climate change. It demonstrates their portability and customization that helps to make it easy to implement for modern farming practices. Since limited space is utilized, it leads to cost efficient solutions with improved yield and decreased effect of pests and erratic weather conditions.
Sincere efforts and earlier attempts have been made in the area of Smart greenhouses, however, the research has been restricted to only a few certain aspects and do not cover all the parameters that influence the system. For instance, in [3], a review paper has been presented to demonstrate different values of temperature and humidity for different types of crops that can be grown in a greenhouse. Furthermore, in [4], methods have been studied and demonstrated to improve crop yields in the system.
The author in [5] presents a demonstration of solar panels and sensors in greenhouses and limits its functioning to determine the stress conditions in the greenhouse. In [6], the paper focuses only on the automation aspect and presents an automatic irrigation system for the greenhouse that makes human interference minimal for running of greenhouse. Similarly in [7], using Raspberry Pi and Arduino, different parameters that impact the yield of crops like humidity, CO2 levels, light intensity, soil moisture, and temperature are being monitored, controlled and coordinated.
*Corresponding Author

(IJACSA) International Journal of Advanced Computer Science and Applications,
Vol. 12, No. 7, 2021
114 | P a g e
www.ijacsa.thesai.org
Incorporating the use of sensors and IoT, the paper [8] develops a drip irrigation mechanism and a tube well controlled using a GSM Module. In [9], the paper presents an on field study in a tomato greenhouse located in Michurinsk, Russia's Tambov region with deployment of the Internet of Things (IoT) to identify the monitoring aspect of greenhouse and the growth rate of tomatoes. Similar application of the Internet of Things (IoT) in automation of greenhouse environment has been performed in the paper [10]. The paper [11] demonstrated an IoT system with a bot notification on tomato growing stages to provide smart farming solutions. In [12], the paper attempts to establish an automated greenhouse control system for speeding up the plant growth and increasing their production. In [13], a web application is developed to monitor and track the greenhouse's parameters and the plants' growth in a greenhouse.
Employing the aspect of machine learning, the paper [14] presents the idea of environmental monitoring and disease detection in green house for Bangladesh. The paper [15] reviews the applications of artificial neural networks (ANNs) in greenhouse technology and presents model development in adaptation of new technologies. The author in [16] presents a method for early detection of leaf diseases in plants based on feature extraction. The author in [17] specifically reviews deep learning and transfer learning algorithms in advanced technologies for agricultural disease image recognition. The author in [18] uses forest classifier algorithm with color histogram for plant disease detection using a set of images.
Similarly while in [19], the review research attempts to explore the application of IoT in arable farming, the author in [20] limits it to monitoring function of greenhouse using WSN.
The present paper addresses the shortcomings of the previous research like limited automation and inefficiencies in the predictive modeling by testing multiple deep learning models on an enlarged and varied dataset unlike its predecessors. The previous studies are incomplete and insufficient in one way or the other. The present paper demonstrates a novel comprehensive solution implementing an IoT based Smart Greenhouse that employs sensory data for continuous monitoring and automation as alerts are sent as soon as temperature, humidity fall below or rise above the ambient levels. It operates the automatic irrigation system as soil moisture levels rise or fall below the threshold. Furthermore, the paper tests multiple deep learning models and finally justifies the adoption of the most efficient model for the disease detection in the plant through leaf images and provides for early disease detection to prevent/reduce yield loss.
III. METHODOLOGY
This paper proposes an all-inclusive approach for implementing a Smart Greenhouse with aspects of monitoring, alerting, efficient memory utilization, irrigation automation and disease prediction of plants. It leverages the combination of sensor data to obtain input based on Temperature, Humidity and soil moisture sensors and images taken from camera placed in the greenhouse to evaluate three different deep learning models.
The microcontroller monitors the ambient parameters and alerts the farmer when the parameters drop/ rise from the normal. The continuous monitoring of parameters is stored at a cloud account promoting memory efficiency. The microcontroller is programmed to operate the irrigation motor based on the inputs from the sensors. Further, the image data set from internet and real time has been used to train and test the deep learning models that predict the disease. The workflow of the proposed methodology is shown in Fig. 1.
Fig. 1. System Overview.
The block illustration of the system depicting the components and their connections has been represented in Fig. 2. On the basis of this demarcation, the developed system is subdivided into three subsystems each with different functioning:
Ambient Condition Monitoring and Alerting System.
Automated Irrigation System.
Disease Prediction System.
Fig. 2. Block Illustration.
A. Ambient Condition Monitoring and Alerting System
1) Temperature and Humidity Sensor data has been taken
as Input from DHT 11 Humidity and Temperature sensor.
2) DHT 11 is a simple and ultra low-cost digital
temperature and humidity sensor. A thermistor and a
capacitive humidity sensor are used to test the ambient air
quality and the outcome of the digital signal provided by the
data pin. It is easy to use; however, in order to collect
information, it takes a few seconds.
(IJACSA) International Journal of Advanced Computer Science and Applications,
Vol. 12, No. 7, 2021
115 | P a g e
www.ijacsa.thesai.org
3) Thus, in this system, an ambient temperature threshold
is set. An alert will be sent to the farmer‟s phone/email so as
to increase or decrease the temperature as desired when there
is a deviation of ±50°F from the set parameters.
4) Soil Moisture Sensor has been used that detects the
ambient moisture content in the soil. Capacitance is used by
the soil moisture sensor to obtain the dielectric permittivity of
the surrounding medium.
5) Dielectric permittivity is a function of water content in
the soil. The sensor generates a voltage that is proportional to
the dielectric permittivity, and accordingly, to the soil water
content. The water content is averaged over the whole length
of the sensor.
6) It measures loss in soil moisture in due course of time
because of reasons like evaporation and plant uptake. It also
helps to assess optimum soil moisture content for different
plant species and to monitor soil moisture content to control
irrigation.
7) The inputs from the sensors are fed to Raspberry Pi.
Raspberry Pi 3 is a development board in Pi series that can be
considered a single board computer. It operates on LINUX
Operating system. It has high processing speed making it
suitable for advanced operations like disease detection and
image processing. It uses Wireless LAN and Bluetooth facility
and can set up WIFI Hotspot for internet connectivity. It has
dedicated port for LCD Display and a dedicated camera port.
8) The data from the sensors are stored into ThingSpeak
cloud via Raspberry Pi using write API of ThingSpeak thus
promoting memory efficiency.
9) Using the data fed by the sensors, heat index is
computed. These heat indexes measured can be then compared
with the heat index of the plants and crops that are planted.
The Heat Index (HI) is a thermodynamic value that combines
air temperature and relative humidity to determine the
equivalent temperature experienced by humans.
10) The heat index formula is expressed as,
HI=c1+c2T+c3R+c4TR+c5T2+c6R2+c7T2R+c8TR2+c9T2R2 (1)
In this formula,
HI = heat index in degrees Fahrenheit
R = Relative humidity
T = Temperature in ∘F
c1 = -42.379; c2= -2.04901523
c3 = -10.14333127; c4 = -0.22475541
c5 = -6.83783 x 10⁻³
; c6 = -5.481717 x 10⁻²
c7 = -1.22874 x 10⁻³
; c8 = 8.5282 x 10⁻⁴
c9 = -1.99 x 10⁻⁶
B. Automated Irrigation System
1) The information received by the temperature and
humidity sensor and also the soil moisture sensor is
continuously fed to the cloud via Raspberry Pi.
2) Raspberry Pi connected to Wi-Fi allows any device
connected to that network to communicate with the module.
3) In this system, when the irrigation levels are too high
or too low, an alert is sent to turn off/ on the water supply to
inform about the ambient presence of soil moisture.
4) Based on input from this sensor, this farmer can control
the on and off of motor through 5V Single Channel Relay
Module mechanism by sending SMS to GSM module for
changing the motor motion.
5) This Relay board module controls higher current loads
from microcontroller development board. It can switch up to
7amps and it is safely driven by transistor bc547 which
protects the input device from relay circuit. To further protect
the microcontroller from relay kick back, a freewheeling diode
is present.
C. Disease Prediction System
Three different deep learning models were trained with set parameters and results were obtained to identify the most efficient model. Following the comparison of models, the image dataset was taken from real time as well as internet and model was trained.
1) SSD mobile net model: The ssd_mobilenet_v1_coco
model is a Single-Shot multi box Detection (SSD) network
that is intended to perform object detection. It differs from
mobilenet-ssd in the way that the latter can detect only faces
whereas ssd_mobilenet_v1_coco model can detect objects.
SSD architecture is a single convolution network which learns to predict and classify bounding box locations in one pass. Thus, SSD is trained end to end. The SSD network comprises of base architecture (in our instance, MobileNet) and multiple convolution layers.
MobileNet employs an efficient CNN architecture designed for mobile and embedded vision application. In order to build lightweight deep neural networks, this architecture uses proven depth-wise separable convolutions.
A feature layer is obtained after going through certain number of convolutions for feature extraction. To detect the location of bounding boxes, SSD operates on feature maps.
For each feature map location, k bounding boxes are predicted. These k bounding boxes have different sizes and aspect ratios.
For each of the bounding box, c class scores and 4 offsets relative to the original default bounding box shape are computed.
The shape of the box is not predicted by SSD instead it predicts its position. Each k bounding boxes have a predetermined shape which has been set prior to actual training.
2) EfficientDet D0 Model: Object detectors, in general,
comprise of three major components: a backbone which
performs feature extraction from the given image; a feature
network which inputs multiple levels of features from the
backbone and outputs a list of fused features which exhibit
salient features of the image; and the final class/box network
that uses the fused features to predict the class and location of
each object.
(IJACSA) International Journal of Advanced Computer Science and Applications,
Vol. 12, No. 7, 2021
116 | P a g e
www.ijacsa.thesai.org
EfficientDet is a type of object detection model, which uses EfficientNet as the backbone network, utilizes several optimization and backbone tweaks, such as the use of a BiFPN, and a compound scaling method that uniformly scales the resolution, depth and width for all backbones, feature networks and box/class prediction networks at the same time. EfficientNet has higher accuracy than previous ResNet networks.
3) Faster RCNN model: Faster RCNN (Region Based
Convolutional Neural Networks) architecture comprises of
two modules:
a) Region Proposal Network (RPN).
b) Fast R-CNN.
The RPN generates region proposals and applies the concept of attention in neural networks, so it guides the Fast R-CNN detection module to detect objects in the proposed regions.
The Faster RCNN is a two stage detector:
In the first pass, input image is taken and output is generated as regions where objects may be detected (called as region proposals or regions of interest). This process can be carried out either by an external algorithm (Selective Search) or even by a neural network.
In the second pass, a neural network identifies these regions of interest and classifies it into one of the target object classes. The extracted feature vectors are then classified using the Fast R-CNN. The class scores of the detected objects as well as to their bounding-boxes are returned as output.
Certain parameters were compared to be able to predict the most efficient model. Loss parameters constitute an important feature for efficient model determination. A loss function is used to optimize deep learning algorithms. Loss value determines the behavior of deep learning model after every iteration of optimization. The deviation of the predicted values from the actual values in the training data is determined by loss function. The loss is minimized by changing model weights.
Loss is the penalty for a bad prediction. If the model's prediction is perfect, the loss is zero; otherwise, the loss is greater. The loss is calculated on training and validation and its interpretation implies the correctness of model prediction. The loss comprises of two parts in the Tensorflow Object Detection API: the localization loss for bounding box offset prediction and the classification loss for conditional class probabilities. Both parts are calculated by the sum of squared errors. Unlike accuracy, a loss is not a percentage. The goal of training a model is to find a set of weights and biases that have low loss, on average, across all examples.
Another important parameter is Mean Average Precision. Mean Average Precision is a popular evaluation metric used for object detection (i.e. localisation and classification) in computer vision systems. Localization determines the location of an instance (e.g. bounding box coordinates) and classification demonstrates what it is (e.g. tomato leaf/corn leaf). The mAP or simply AP in coco models measures the
performance of models for performing document/information retrieval and object detection tasks. It summarizes the precision-recall curve into a single value that represents the average of all precisions. Here, the difference between the current and next recalls is calculated and then multiplied by the current precision using a loop that scans all precisions/recalls. Alternatively, AP is the weighted sum of precisions at each threshold where weight is the increase in recall.
If higher precision implies more confidence in the model when it classifies a sample as Positive, then higher Recall connotes higher number of positive samples correctly identified as Positive by the model.
When a model has a high recall but a low precision, it accurately identifies the majority of positive samples but has a lot of false positives (i.e. classifies many Negative samples as Positive). On the contrary, if a model has high precision but low recall, then the model is accurate in identification of sample as Positive however, only some of the positive samples are classified as such.
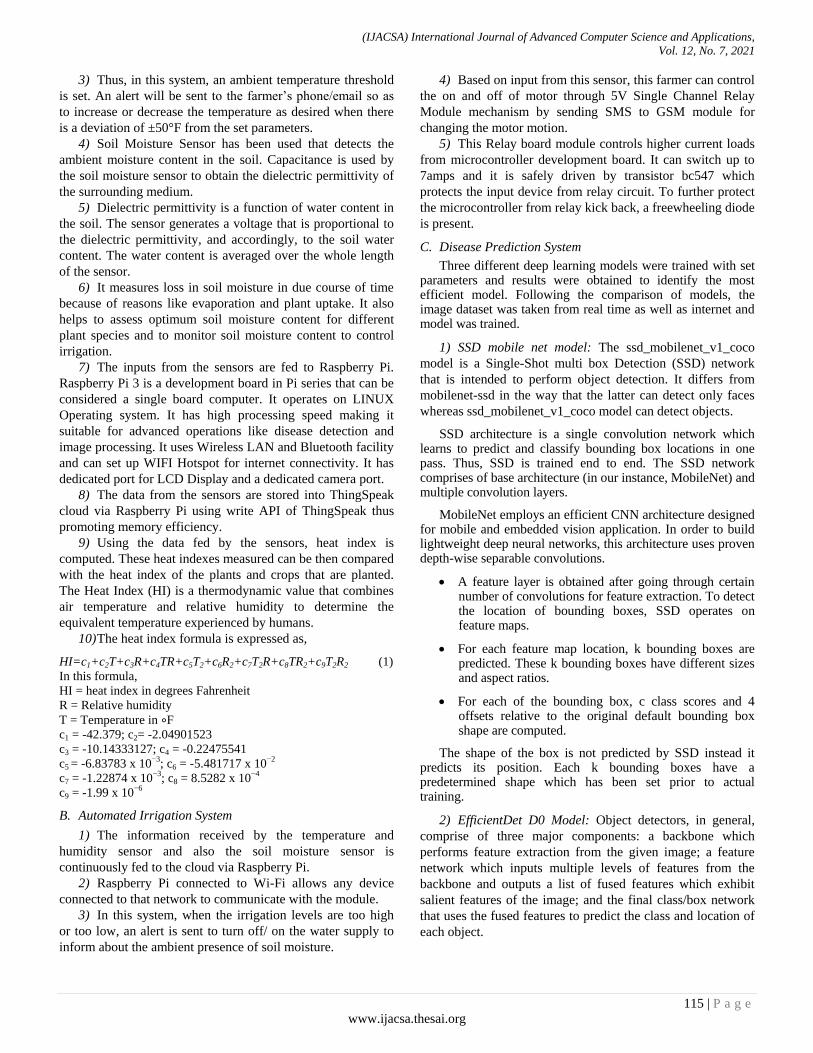
4) Model training steps: The flowchart in Fig. 3
represents the training model methodology as implemented in
the present system. The same sequence has been employed for
SSD Mobile Net, EfficientDet D0 512*512 model and Faster
RCNN Model as well.
Labeled Image
generated and saved as
XML file
Image Resized
CSV File generated for
training
Label Map created
Configuration File
created
Model trained using
faster_rcnn_inception_v
2_coco
Image Data
collected
Inference Graph
created
Fig. 3. Model Training Steps.

(IJACSA) International Journal of Advanced Computer Science and Applications,
Vol. 12, No. 7, 2021
117 | P a g e
www.ijacsa.thesai.org
D. System Schematic
Fig. 4 represents the schematic diagram and the pin connections of the system.
Fig. 4. System Schematic.
IV. RESULTS
A. Ambient Condition Monitoring Results
1) Temperature and Humidity were monitored and stored
on cloud account on ThingSpeak as shown in Fig. 5 and 6 that
can be continuously monitored in real time even from a
remote area.
2) Heat index can be calculated with the formula in
Equation (1) and have been tabulated in Table I. Monitoring
of heat index is depicted in Fig. 7.
3) Furthermore, to compute accuracy of measurement,
measured temperatures by sensor (denoted by TM) have been
compared with a standard room thermometer (denoted by TA)
and Root mean square error has been computed.
4) Similarly, humidity measured by sensor (denoted by
HM) has been compared with a standard hygrometer (denoted
by HA) and Root mean square error has been computed.
5) Soil Moisture measured (denoted by SMM) is also
monitored in real time as shown in Fig. 8 and tabulated in
Table I.
6) The Root Mean Square Error calculated for
Temperature, denoted by RMSET=1.292788 and Root Mean
Square error calculated for Humidity, denoted by
RMSEH=1.040833.
7) Alerts are sent when ambient conditions deviate from
the threshold levels. Different threshold can be set according
to seasons. For example, in summer months, the temperature
limit is kept as 38°C and humidity limit as 55 RH. If there is a
greater deviation during the day from these limits, planters
will be informed.
8) The threshold value has been kept 500 in summer
season and irrigation motor is switched ON if the „dryness‟
rises to 500 and above and remains OFF below threshold
value of 500.
Fig. 5. Temperature Monitoring Results.
Fig. 6. Humidity Monitoring Results.
Fig. 7. Heat Index Monitoring Results.
Fig. 8. Soil Moisture Monitoring Results.

(IJACSA) International Journal of Advanced Computer Science and Applications,
Vol. 12, No. 7, 2021
118 | P a g e
www.ijacsa.thesai.org
TABLE I. MEASURED AND ACTUAL TEMPERATURE AND HUMIDITY
READINGS AND SOIL MOISTURE READINGS
Time
Duration
TA
(°F)
TM
(°F)
HA
(%)
HM
(%)
Heat
Index
(°F)
SMM Motor
ON/OFF
Morning
IST 0900-
1100
86.9 87.08 45% 45.00 88.03 310 OFF
86.9 85.10 46% 47.00 85.88 325 OFF
89.6 87.80 41% 41.00 87.91 399 OFF
89.6 87.62 40% 40.00 87.62 420 OFF
Afternoon
IST 1500-
1700
98.6 98.78 41% 43.00 108.86 520 ON
98.6 99.14 41% 40.00 107.35 610 ON
97.7 98.60 41% 41.00 106.92 710 ON
97.7 98.78 41% 39.00 105.85 854 ON
Evening
IST 1800-
2000
95 96.44 44% 45.00 105.02 810 ON
95 96.26 44% 43.00 103.27 756 ON
95 96.26 44% 44.00 103.94 675 ON
95 96.44 44% 45.00 105.02 602 ON
B. Model Training Results
1) Training time was an important determinant for
predicting efficiency of deep learning models. Training took
around 4 hours for SSD Mobile Net and 3 hours for
EfficientDet D0 and less than 2 hours for Faster RCNN model.
2) Higher loss is the worse (bad prediction) for any model.
Loss decrement including classification loss, localisation loss,
clone loss as well as regularisation loss for the three models is
demonstrated by the graphs in Fig. 9, 10, and 11.
3) The loss parameters obtained for the three models have
been tabulated in Table II.
4) The mAP calculates a score by comparing the ground-
truth bounding box to the detected box. A higher score implies
a more precise model. mAP values can be compared for all
three models. Table III depicts the mAP values for all models.
5) Mean Average Recall (mAR) values have been
compared in Table III for the training models. It implies the
maximum number of positives correctly identified as positives
by the model.
6) Further, the model performance were further validated
by changing the optimiser hyper parameter (such as Adam
optimiser, momentum optimiser, RMSprop optimiser) in the
configuration file of the models and Faster RCNN proved the
most efficient in these as well.
7) As can be inferred from the speed parameters, loss
values and mAP and mAR values, faster_rcnn_inception_v2
model performed better than EfficientDet D0 512*512 model
and ssd_mobilenet_v1_coco_2018_01_28. This justifies its
adoption for deployment in disease prediction algorithm.
Fig. 9. Loss Parameters of SSD MobileNet.
Fig. 10. Loss Parameters of EfficientDet D0.
Fig. 11. Loss Parameters of Faster RCNN.
TABLE II. LOSS PARAMETER COMPARISON FOR THREE MODELS
Model Min loss Max loss Avg loss
SSD Mobile Net 0.4601 26.232 3.75
EfficientDet D0 0.494 2.008 0.9972
Faster_RCNN 0.0207 1.7 0.4
(IJACSA) International Journal of Advanced Computer Science and Applications,
Vol. 12, No. 7, 2021
119 | P a g e
www.ijacsa.thesai.org
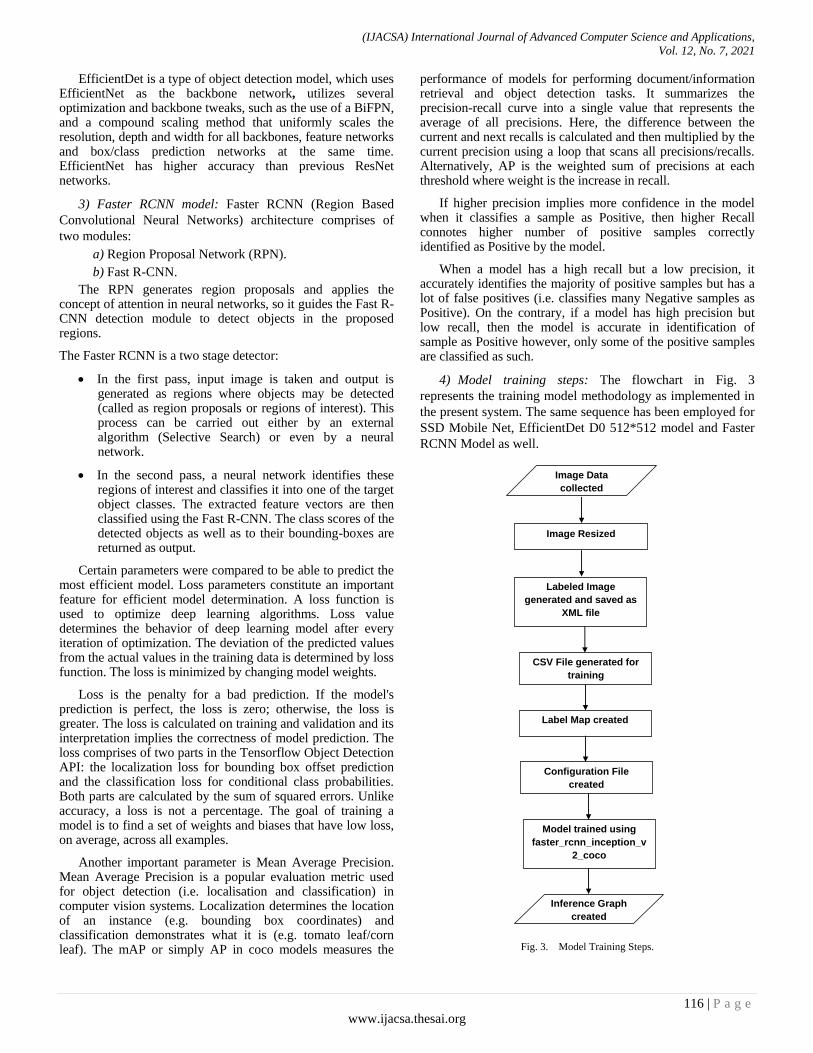
TABLE III. MAPAND MAR PARAMETER COMPARISON FOR THREE
MODELS
Models
mAP
IoU =
0.50:0.95
mAP
IoU =
0.50
mAP
IoU =
0.75
mAR
([email protected]:0.95)
maxdet=100
Faster_RCNN 0.414 0.804 0.39 0.601
EfficientDet D0 0.182 0.386 0.211 0.539
SSD_MobileNet 0.439 0.681 0.431 0.543
C. Disease Prediction Results
In view of the parameter comparisons from Tables II and III, Faster RCNN inception model was chosen to be deployed and its results on dataset images and real time images were obtained. In conducting the experiments and evaluation, Tensorflow version 2.4.0 has been used and Keras version 2.4.3.
1) The total dataset consists of 1000 images, with 80% of
the images being used to train the models and the rest 20%
being used for testing.
2) The hyper-parameters tuned are: learning rate, batch
size, and optimizer used. The optimal parameters have been
obtained through the grid search, i.e. a learning rate of 0.002,
batch size of 16 images.
3) The total number of true positive values is divided by
the entire object detector and multiplied by 100. Thus, the
accuracy obtained is 80.4%.
4) Smaller percentage of data for testing datasets has been
used because a bigger dataset has been implemented, and
using this approach, a large amount of data can be leveraged
for training purposes.
5) The images were taken at real time at a tomato farm
field and corn farm field and some from internet. For the
disease prediction, four varieties of leaf images are considered
for testing the working of the proposed system, viz. healthy
tomato, healthy corn, rust corn, bacterial tomato.
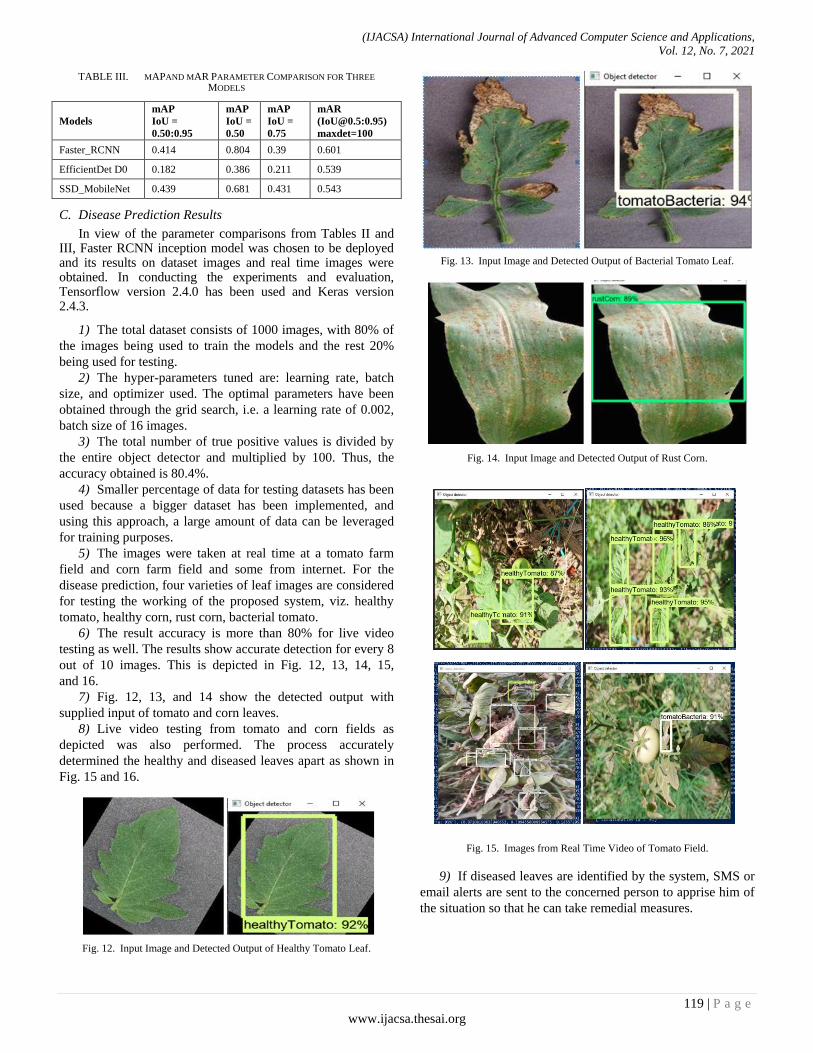
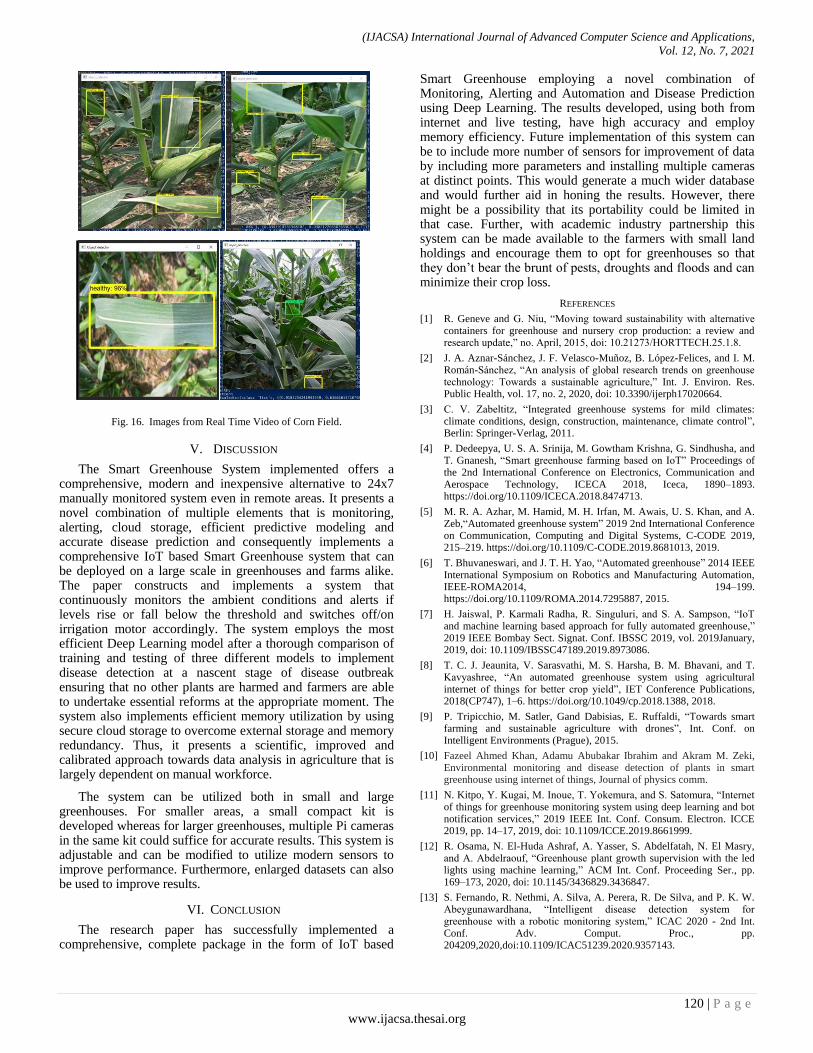
6) The result accuracy is more than 80% for live video
testing as well. The results show accurate detection for every 8
out of 10 images. This is depicted in Fig. 12, 13, 14, 15,
and 16.
7) Fig. 12, 13, and 14 show the detected output with
supplied input of tomato and corn leaves.
8) Live video testing from tomato and corn fields as
depicted was also performed. The process accurately
determined the healthy and diseased leaves apart as shown in
Fig. 15 and 16.
Fig. 12. Input Image and Detected Output of Healthy Tomato Leaf.
Fig. 13. Input Image and Detected Output of Bacterial Tomato Leaf.
Fig. 14. Input Image and Detected Output of Rust Corn.
Fig. 15. Images from Real Time Video of Tomato Field.
9) If diseased leaves are identified by the system, SMS or
email alerts are sent to the concerned person to apprise him of
the situation so that he can take remedial measures.
(IJACSA) International Journal of Advanced Computer Science and Applications,
Vol. 12, No. 7, 2021
120 | P a g e
www.ijacsa.thesai.org
Fig. 16. Images from Real Time Video of Corn Field.
V. DISCUSSION
The Smart Greenhouse System implemented offers a comprehensive, modern and inexpensive alternative to 24x7 manually monitored system even in remote areas. It presents a novel combination of multiple elements that is monitoring, alerting, cloud storage, efficient predictive modeling and accurate disease prediction and consequently implements a comprehensive IoT based Smart Greenhouse system that can be deployed on a large scale in greenhouses and farms alike. The paper constructs and implements a system that continuously monitors the ambient conditions and alerts if levels rise or fall below the threshold and switches off/on irrigation motor accordingly. The system employs the most efficient Deep Learning model after a thorough comparison of training and testing of three different models to implement disease detection at a nascent stage of disease outbreak ensuring that no other plants are harmed and farmers are able to undertake essential reforms at the appropriate moment. The system also implements efficient memory utilization by using secure cloud storage to overcome external storage and memory redundancy. Thus, it presents a scientific, improved and calibrated approach towards data analysis in agriculture that is largely dependent on manual workforce.
The system can be utilized both in small and large greenhouses. For smaller areas, a small compact kit is developed whereas for larger greenhouses, multiple Pi cameras in the same kit could suffice for accurate results. This system is adjustable and can be modified to utilize modern sensors to improve performance. Furthermore, enlarged datasets can also be used to improve results.
VI. CONCLUSION
The research paper has successfully implemented a comprehensive, complete package in the form of IoT based
Smart Greenhouse employing a novel combination of Monitoring, Alerting and Automation and Disease Prediction using Deep Learning. The results developed, using both from internet and live testing, have high accuracy and employ memory efficiency. Future implementation of this system can be to include more number of sensors for improvement of data by including more parameters and installing multiple cameras at distinct points. This would generate a much wider database and would further aid in honing the results. However, there might be a possibility that its portability could be limited in that case. Further, with academic industry partnership this system can be made available to the farmers with small land holdings and encourage them to opt for greenhouses so that they don‟t bear the brunt of pests, droughts and floods and can minimize their crop loss.
REFERENCES
[1] R. Geneve and G. Niu, “Moving toward sustainability with alternative containers for greenhouse and nursery crop production: a review and research update,” no. April, 2015, doi: 10.21273/HORTTECH.25.1.8.
[2] J. A. Aznar-Sánchez, J. F. Velasco-Muñoz, B. López-Felices, and I. M. Román-Sánchez, “An analysis of global research trends on greenhouse technology: Towards a sustainable agriculture,” Int. J. Environ. Res. Public Health, vol. 17, no. 2, 2020, doi: 10.3390/ijerph17020664.
[3] C. V. Zabeltitz, “Integrated greenhouse systems for mild climates: climate conditions, design, construction, maintenance, climate control”, Berlin: Springer-Verlag, 2011.
[4] P. Dedeepya, U. S. A. Srinija, M. Gowtham Krishna, G. Sindhusha, and T. Gnanesh, “Smart greenhouse farming based on IoT” Proceedings of the 2nd International Conference on Electronics, Communication and Aerospace Technology, ICECA 2018, Iceca, 1890–1893. https://doi.org/10.1109/ICECA.2018.8474713.
[5] M. R. A. Azhar, M. Hamid, M. H. Irfan, M. Awais, U. S. Khan, and A. Zeb,“Automated greenhouse system” 2019 2nd International Conference on Communication, Computing and Digital Systems, C-CODE 2019, 215–219. https://doi.org/10.1109/C-CODE.2019.8681013, 2019.
[6] T. Bhuvaneswari, and J. T. H. Yao, “Automated greenhouse” 2014 IEEE International Symposium on Robotics and Manufacturing Automation, IEEE-ROMA2014, 194–199. https://doi.org/10.1109/ROMA.2014.7295887, 2015.
[7] H. Jaiswal, P. Karmali Radha, R. Singuluri, and S. A. Sampson, “IoT and machine learning based approach for fully automated greenhouse,” 2019 IEEE Bombay Sect. Signat. Conf. IBSSC 2019, vol. 2019January, 2019, doi: 10.1109/IBSSC47189.2019.8973086.
[8] T. C. J. Jeaunita, V. Sarasvathi, M. S. Harsha, B. M. Bhavani, and T. Kavyashree, “An automated greenhouse system using agricultural internet of things for better crop yield”, IET Conference Publications, 2018(CP747), 1–6. https://doi.org/10.1049/cp.2018.1388, 2018.
[9] P. Tripicchio, M. Satler, Gand Dabisias, E. Ruffaldi, “Towards smart farming and sustainable agriculture with drones”, Int. Conf. on Intelligent Environments (Prague), 2015.
[10] Fazeel Ahmed Khan, Adamu Abubakar Ibrahim and Akram M. Zeki, Environmental monitoring and disease detection of plants in smart greenhouse using internet of things, Journal of physics comm.
[11] N. Kitpo, Y. Kugai, M. Inoue, T. Yokemura, and S. Satomura, “Internet of things for greenhouse monitoring system using deep learning and bot notification services,” 2019 IEEE Int. Conf. Consum. Electron. ICCE 2019, pp. 14–17, 2019, doi: 10.1109/ICCE.2019.8661999.
[12] R. Osama, N. El-Huda Ashraf, A. Yasser, S. Abdelfatah, N. El Masry, and A. Abdelraouf, “Greenhouse plant growth supervision with the led lights using machine learning,” ACM Int. Conf. Proceeding Ser., pp. 169–173, 2020, doi: 10.1145/3436829.3436847.
[13] S. Fernando, R. Nethmi, A. Silva, A. Perera, R. De Silva, and P. K. W. Abeygunawardhana, “Intelligent disease detection system for greenhouse with a robotic monitoring system,” ICAC 2020 - 2nd Int. Conf. Adv. Comput. Proc., pp. 204209,2020,doi:10.1109/ICAC51239.2020.9357143.
(IJACSA) International Journal of Advanced Computer Science and Applications,
Vol. 12, No. 7, 2021
121 | P a g e
www.ijacsa.thesai.org
[14] Shamse Tasnim Cynthia, Kazi Md. Shahrukh Hossain, Md. Nazmul Hasan, Md. Asaduzzaman, Amit Kumar Das, “Automated detection of plant diseases using image processing and faster r-cnn algorithm, International conference on sustainable technologies in Industry”, 2019.
[15] A. Escamilla-García, G. M. Soto-Zarazúa, M. Toledano-Ayala, E. Rivas-Araiza, and A. Gastélum-Barrios, “Applications of artificial neural networks in greenhouse technology and overview for smart agriculture development,” Appl. Sci., vol. 10, no. 11, 2020, doi: 10.3390/app10113835.
[16] C. Mattihalli, E. Gedefaye, F. Endalamaw, and A. Necho, “Real time automation of agriculture land, by automatically detecting plant leaf diseases and auto medicine,” Proc. - 32nd IEEE Int. Conf. Adv. Inf. Netw. Appl. Work. WAINA 2018, vol. 2018-January, pp. 325–330, 2018, doi: 10.1109/WAINA.2018.00106.
[17] Y. Yuan, L. Chen, H. Wu, and L. Li, “Advanced agricultural disease
image recognition technologies: A review,” Inf. Process. Agric., no. xxxx, pp. 1–12, 2021, doi: 10.1016/j.inpa.2021.01.003.
[18] M. H. Jumat, M. S. Nazmudeen, and A. T. Wan, “Smart farm prototype for plant disease detection, diagnosis and treatment using IoT device in a greenhouse,” IET Conf. Publ., vol. 2018, no. CP750, 2018, doi: 10.1049/cp.2018.154.
[19] R. K. Kodali, V. Jain, and S. Karagwal, “IoT based smart greenhouse" IEEE Region 10 Humanitarian Technology Conference 2016, R10-HTC 2016 - Proceedings. https://doi.org/10.1109/R10-HTC.2016.7906846, 2017.
[20] R. A. Li, X. Sha, and K. Lin,“Smart greenhouse: A real-time mobile intelligent monitoring system based on WSN”, IWCMC 2014 - 10th International Wireless Communications and Mobile Computing Conference,1152–1156. https://doi.org/10.1109/IWCMC.2014.6906517, 2014.