ion-mobility-spectrometry-history-characteristics-applications
88
ION MOBILITY SPECTROMETRY: HISTORY, CHARACTERISTICS AND APPLICATIONS ESPECTROMETRÍA DE MOVILIDAD IÓNICA: HISTORIA, CARACTERÍSTICAS Y APLICACIONES TITULO BREVE. Espectrometría de Movilidad Iónica Roberto Fernández-Maestre, PhD Licenciado en Biología y Química, Doctor en Química Analítica (Washington State University), Docente del Programa de Química, Campus de Zaragocilla, Universidad de Cartagena, Cartagena, Colombia. [email protected] . Tel 6698180 SUMMARY Ion mobility spectrometry (IMS) is an analytical technique that separates ions in the gas phase. Ions are separated at atmospheric pressure under the influence of an electric field, according to their size and shape. IMS is the best choice for detection of narcotics, chemical and biological warfare agents and explosives in airports
-
Upload
unicartagena -
Category
Documents
-
view
3 -
download
0
Transcript of ion-mobility-spectrometry-history-characteristics-applications

ION MOBILITY SPECTROMETRY: HISTORY, CHARACTERISTICS AND
APPLICATIONS
ESPECTROMETRÍA DE MOVILIDAD IÓNICA: HISTORIA,
CARACTERÍSTICAS Y APLICACIONES
TITULO BREVE. Espectrometría de Movilidad Iónica
Roberto Fernández-Maestre, PhD
Licenciado en Biología y Química, Doctor en Química
Analítica (Washington State University), Docente del
Programa de Química, Campus de Zaragocilla, Universidad
de Cartagena, Cartagena, Colombia.
[email protected]. Tel 6698180
SUMMARY
Ion mobility spectrometry (IMS) is an analytical
technique that separates ions in the gas phase. Ions are
separated at atmospheric pressure under the influence of
an electric field, according to their size and shape. IMS
is the best choice for detection of narcotics, chemical
and biological warfare agents and explosives in airports

and customs. IMS can detect almost anything that can be
ionized and has been applied to the analysis from the
lightest elements such as helium to the most complex
mixtures such as proteomes, metabolomes and complete
organisms such as bacteria, chiral separations, and
structure determination. Although since 2000 there have
been approximately fifty reviews of IMS, this review is
probably the only general evaluation of this technique
since then.
Keywords: ion mobility spectrometry, gas-phase ions,
reduced mobility, ion sources
RESUMEN
La espectrometría de movilidad iónica (IMS) es una
técnica analítica que separa iones en fase gaseosa. Los
iones son separados a presión atmosférica bajo la
influencia de un campo eléctrico de acuerdo a su tamaño y
forma. IMS es la mejor opción para detectar narcóticos,
agentes químicos y biológicos de guerra, y explosivos en

aeropuertos y aduanas. IMS puede detectar casi cualquier
cosa que pueda ser ionizada y se ha aplicado al análisis
de elementos ligeros como el helio, mezclas más complejas
como proteomas, metabolomas y organismos completos, tales
como bacterias, separaciones quirales, y la determinación
de estructuras. Aunque desde el año 2000 se han
presentado aproximadamente cincuenta revisiones de la
IMS, la presente es probablemente la única en evaluar
este tema de manera general desde esa fecha y es
probablemente la primera en publicarse en una revista
latinoamericana.
Palabras clave: espectrometría de movilidad iónica, iones
gaseosos, movilidad reducida, fuentes de ionización

ContenidoINTRODUCTION............................................4IMS HISTORY.............................................4INSTRUMENTATION.........................................7
ION SOURCES..........................................7Radioactive sources...................................8Electrospray Ionization...............................9Secondary electrospray ionization....................10Corona-spray and corona-discharge ionization.........11Matrix-assisted laser desorption ionization (MALDI). .11Photoionization sources..............................12DRIFT TUBE..........................................12ION GATES...........................................13DRIFT GASES.........................................14DOPING AGENTS.......................................16
DETECTION METHODS......................................19IMS ANALYSIS...........................................20
SAMPLE INTRODUCTION.................................20SPECTRA.............................................22REDUCED MOBILITY....................................22CALIBRATION.........................................24COLLISION CROSS SECTIONS............................25
APPLICATIONS OF IMS....................................27REFERENCES.............................................29
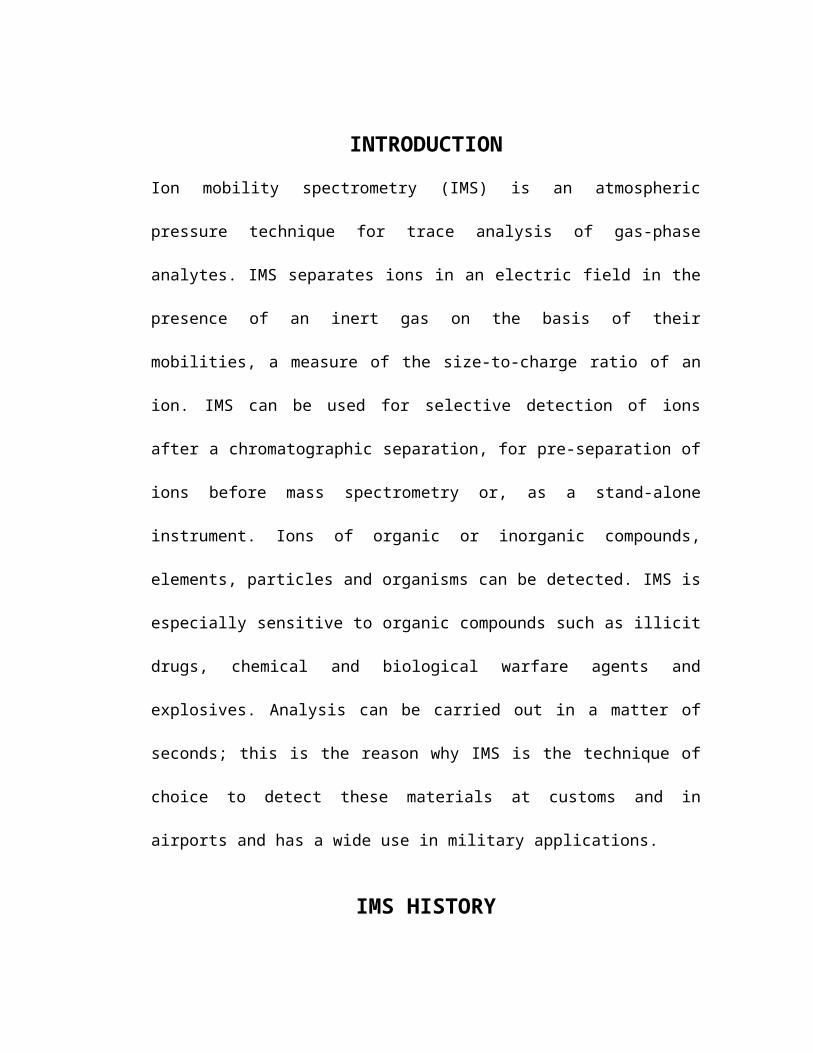
INTRODUCTIONIon mobility spectrometry (IMS) is an atmospheric
pressure technique for trace analysis of gas-phase
analytes. IMS separates ions in an electric field in the
presence of an inert gas on the basis of their
mobilities, a measure of the size-to-charge ratio of an
ion. IMS can be used for selective detection of ions
after a chromatographic separation, for pre-separation of
ions before mass spectrometry or, as a stand-alone
instrument. Ions of organic or inorganic compounds,
elements, particles and organisms can be detected. IMS is
especially sensitive to organic compounds such as illicit
drugs, chemical and biological warfare agents and
explosives. Analysis can be carried out in a matter of
seconds; this is the reason why IMS is the technique of
choice to detect these materials at customs and in
airports and has a wide use in military applications.
IMS HISTORY
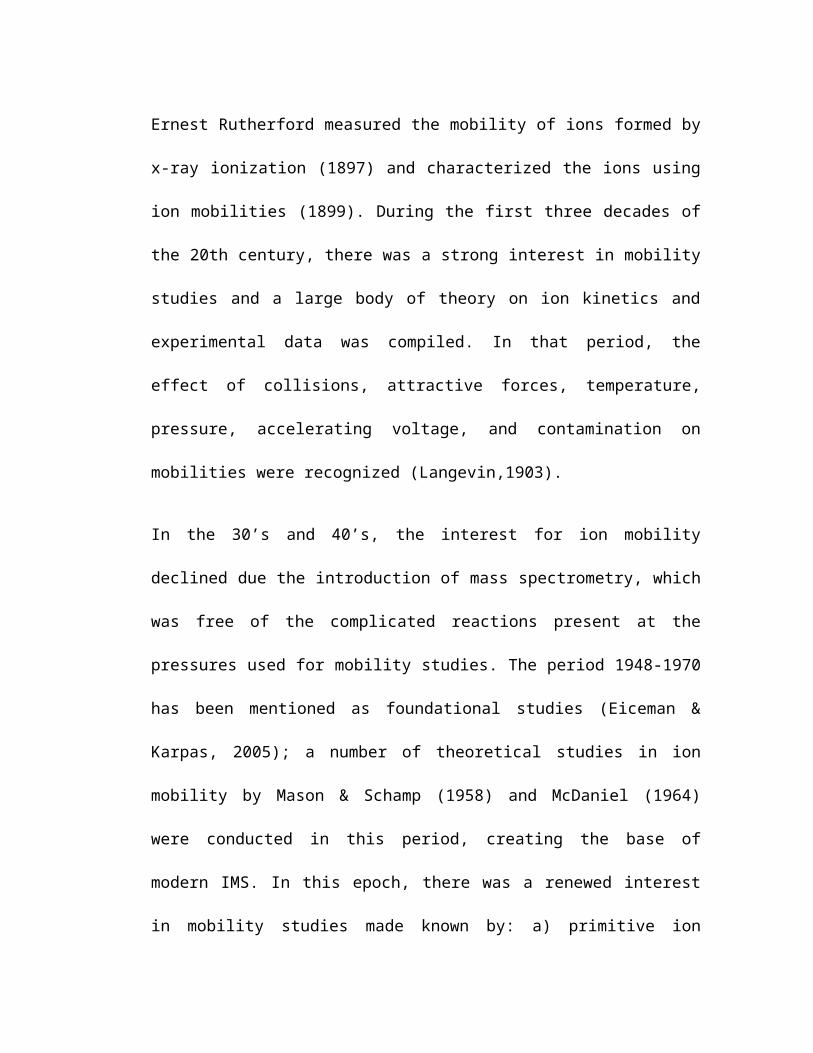
Ernest Rutherford measured the mobility of ions formed by
x-ray ionization (1897) and characterized the ions using
ion mobilities (1899). During the first three decades of
the 20th century, there was a strong interest in mobility
studies and a large body of theory on ion kinetics and
experimental data was compiled. In that period, the
effect of collisions, attractive forces, temperature,
pressure, accelerating voltage, and contamination on
mobilities were recognized (Langevin,1903).
In the 30’s and 40’s, the interest for ion mobility
declined due the introduction of mass spectrometry, which
was free of the complicated reactions present at the
pressures used for mobility studies. The period 1948-1970
has been mentioned as foundational studies (Eiceman &
Karpas, 2005); a number of theoretical studies in ion
mobility by Mason & Schamp (1958) and McDaniel (1964)
were conducted in this period, creating the base of
modern IMS. In this epoch, there was a renewed interest
in mobility studies made known by: a) primitive ion
detectors, used by military forces during and after world
word II for the detection of fuel from submarines, and
other applications (Eiceman & Karpas, 2005); b) an
ionization anemometer, invented by Lovelock in 1948, that
was sensitive to organic vapors (Lovelock & Wasilewska,
1949) which opened the possibility of using mobility
instruments for chemical analysis; and c) the
construction of suitable drift tubes, such as that of
Albritton and McDaniel, similar to modern drift tubes
(Albritton et al. 1968).
IMS was introduced as an analytical tool by Cohen &
Karasek (1970). In an ion mobility spectrometer, organic
molecules are ionized and driven by an electric field
against a counterflow of neutral drift gas. In their way
to the detector, the ions collide multiple times with the
drift gas, which reduce their speed. After each
collision, ions are accelerated again by the imposed
field. The alternation of accelerations and collisions
results in a constant average ion velocity that depends

on the ion charge, mass, and collision cross section.
This dependence allows the identification of the ions by
their arrival time at a downfield detector (St. Louis et
al. 1989).
The second edition of a book on IMS is available (Eiceman
& Karpas, 2005) and several IMS reviews have been
published. Márquez-Sillero et al. (2011) assessed
environmental applications of IMS, the analytical tools
developed to solve the limitations regarding selectivity
and sensitivity and its coupling to other detection
systems; IMS coupled to gas chromatography for the
sensitive and selective detection of compounds after
chromatographic separation was reviewed by Kanu and Hill
(2008); gas chromatography-IMS has proved versatile for
the sensitive and selective detection of compounds,
especially complex mixtures in difficult matrices; Kanu et
al. (2008) compared and contrasted several types of
ion mobility–mass spectrometers and described their
advantages for application to a wide range of analytes;
Johnson et al. (2007) evaluated IMS potentials in space
exploration including IMS in manned space flight, the
International Space Station Volatile Organic Analyzer,
IMS in robotic space exploration, potential
extraterrestrial missions and current/future directions
and development. Finally, Weis (2005) reviewed IMS in
combination with quantum chemical calculations to
determine the structure of cluster ions of metals and
semi-metals; they found that clusters of less than 100
atoms show a rich variation in shape as function of the
number of atoms. Other review focused on ion sources
(Guharay et al. 2008) and most others on the study of large
macromolecule interactions and structure elucidation. The
present paper features probably the only one general
review in IMS since 2000.
IMS main advantages and disadvantages are presented in
Table 1.

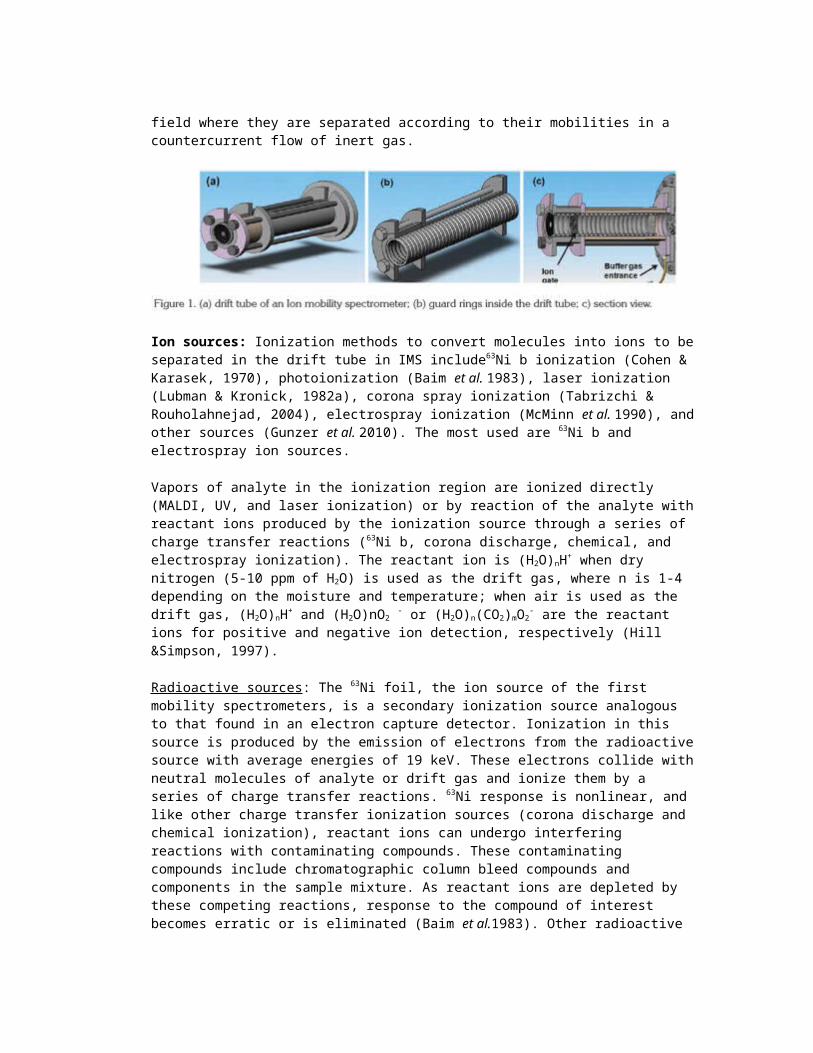
INSTRUMENTATIONThe ion mobility spectrometer consists of three basic
units kept at atmospheric pressure: an ionization source
and an ion drift tube (Figure 1) maintained at either a
positive or negative uniform electric field gradient, and
a detector. Ions produced in the ionization source are
accelerated down the electric field where they are
separated according to their mobilities in a
countercurrent flow of inert gas.
ION SOURCES
There are several ionization methods to convert molecules
into ions to be separated in the drift tube in IMS. These
methods include 63Ni ionization (Cohen & Karasek, 1970),
photoionization (Baim et al. 1983), laser ionization (Lubman
& Kronick, 1982a), resonance enhanced two-photon
ionization (Lubman & Kronick, 1982b), corona spray
ionization (Tabrizchi & Rouholahnejad, 2004),
electrospray ionization (McMinn et al. 1990), and other
sources (Gunzer et al. 2010). The most used are 63Ni and
electrospray ion sources.
Vapors of analyte in the ionization region are ionized
directly (MALDI, UV, and laser ionization) or by reaction
of the analyte with reactant ions produced by the
ionization source through a series of charge transfer
reactions (63Ni , corona discharge, chemical, and
electrospray ionization). (H2O)nH+ is the reactant ion
when dry nitrogen (5–10 ppm of H2O) is used as the drift
gas, where n is 1–4 depending on the moisture and
temperature; when air is used as the drift gas, (H2O)nH+
and (H2O)nO2- or (H2O)n(CO2)mO2
- are the reactant ions for
positive and negative ion detection, respectively (Hill &
Simpson, 1997).
Radioactive sourcesThe 63Ni foil, the ion source of the first mobility
spectrometers, is a secondary ionization source analogous
to that found in an electron capture detector. Ionization
in this source is produced by the emission of electrons

from the radioactive source with average energies of 19
keV. These electrons collide with neutral molecules of
analyte or drift gas and ionize them by a series of
charge transfer reactions. 63Ni response is nonlinear, and
like other charge transfer ionization sources (corona
discharge and chemical ionization), reactant ions can
undergo interfering reactions with contaminating
compounds. These contaminating compounds include
chromatographic column bleed compounds and components in
the sample mixture. As reactant ions are depleted by
these competing reactions, response to the compound of
interest become erratic or is eliminated (Baim et al. 1983).
Other radioactive isotope less frequently used is 241Am,
that emits more energetic electrons that can exceed 5 MeV
(Guharay et al. 2008). An advantage of radioactive sources
is that they do not require a power supply and,
consequently, are suitable for portable instruments.
Disadvantages are radioactive contamination due to wrong
manipulation, the need to supply the samples in vapor

phase, and bureaucratic complications due to governmental
regulations.
Electrospray Ionization
The development of electrospray ionization (ESI) was
successfully introduced to IMS by Hill and greatly
expanded the range of compounds that could be analyzed by
IMS (Hallen et al. 1989). In the ESI process, a high
electric potential is applied to the needle of the sample
injection syringe, which creates electric charges.
Electrospray occurs when the sample liquid is drawn by a
coulombic force from the needle toward the target
electrode (target screen, Figure 2) that is held at a
lower voltage (~3.5 kV). As it travels toward the target
electrode, solvent evaporates leaving increasingly
charged droplets that ‘explode’ due to coulombic
repulsion. This process produces droplets of increasingly
smaller radius, ideally culminating in molecular ions (De
Hoffmann & Stroobant, 2001). Electrospray sources are
ideal for liquid samples and non-volatile high molecular

weight analytes. Electrospray is a soft ionization source
that yields simple spectra with no fragmentation where
the molecular weight can be easily determined when
coupling IMS to mass spectrometry. The use of
electrospray IMS as a separation and detection device has
been demonstrated for explosives (Asbury et al. 2000),
chemical warfare degradation products (Rearden &
Harrington, 2005), and biological mixtures (Valentine et
al. 1998).
Secondary electrospray ionization
(SESI) was first introduced to IMS by Hill in 2000 (Wu et
al. 2000). Ionization in SESI is analogous to that of
corona spray or atmospheric pressure chemical ionization.
In SESI, a usual ESI device produce solvent ions that,
acting as reactant ions, ionize liquid or gaseous
analytes. SESI-IMS-MS has been applied to the
determination of volatile organic compounds (Dillon et al.
2010) and to the detection of illicit drugs, where it was
found to be more sensitive than ESI-IMS-MS (Wu et al.
2000). SESI allows easy and fast sampling by applying
jets of ions with a probe and picking up the secondary
ions with a second probe to specific sites on a surface;
therefore, SESI can sample difficult-to-access surfaces,
organelles on a cell etc. and map and image surfaces.
SESI also allows semi non-destructive analysis to
evaluate valuable objects since the jet of ions exerts
negligible damage to sampled objects.

Corona-spray and corona-discharge ionization
In corona ionization, a high electric field is applied
to the electrospray needle tip and the bath gas
surrounding the needle ionizes. These ions react with
neutral molecules, which may evaporate from the liquid at
the needle tip. Applications of corona ionization include
O2 generation (Sabo & Matejcik, 2011) and detection of
volatile organic compound (Boggio et al. 2011). Corona –
spray and corona discharge are alternatives to
conventional radioactive ionization; the high power
consumption of DC corona discharge becomes one of the
limits to usefulness in portable IMS systems for which a
short pulsed corona discharge source has been developed
(Yuan et al. 2005).
Matrix-assisted laser desorption ionization (MALDI)
MALDI was first coupled to IMS by 1990 (Wyttenbach et al.
1996). In MALDI, macromolecules such as proteins or DNA
strands are dissolved in a solution of a small organic
molecule (matrix). The solution is dried on a target and
a laser pulse is applied. The matrix absorbs the laser
pulse and sublimes carrying some analyte. Singly charged
protonated molecules are produced during the sublimation
or in the gas phase in contrast to ESI where multiply
charged ions are produced, making the analysis simpler
and potentially more sensitive (De Hoffmann & Stroobant,
2001). MALDI-IMS-time of flight MS has been extensively
used for biomolecular analysis (Ugarov et al. 2004). MALDI
is ideal for the determination of molecular weights and
analysis of macromolecules since it does not fragment
analytes.
Photoionization sources
These sources use photoionization lamps and lasers.
Photoionization is achieved through the use of a short
wavelength UV lamp and is an inexpensive, practical
alternative to laser sources for use in an ion mobility
GC detector for aromatic and other unsaturated organic
compounds; their major advantage is that, by adjusting
the wavelength, the analyst can selectively ionize

predetermined compounds; other advantages includes the
lack of reactant ions enabling the use of the entire Ion
mobility spectrum from 0 to 20 ms for observation of
analyte Ions (Baim et al. 1983). Ultraviolet light from a
NdYAG pulsed and ArF excimer lasers was used by Lubman &
Kronick (1982b) at atmospheric pressure as ionization
sources in an ion mobility spectrometer; they found
advantages such as the production of only one peak, the
molecular ion or MH+, reducing the problem of multiple
peaks occurring in IMS, great sensitivity, i.e., at least
down to 1 ppb for benzene, and additional means of
discrimination by the use of a particular wavelength.
Disadvantages of UV lamps are the moderate energies
supplied that limit the ionization and the types of
compounds analyzed.
DRIFT TUBE
In the drift tube, ions are separated by an electric
field before entering the detector. The following
description corresponds to a traditional drift tube: the
drift tube is usually made of a series of stainless-steel
guard rings between insulating quartz, glass, or ceramic
rings (99.5% Al2O3), stacked on top of one another to form
a completely enclosed tube (Figure 1). Each guard ring is
connected to the next one in series through 1-M or 0.5
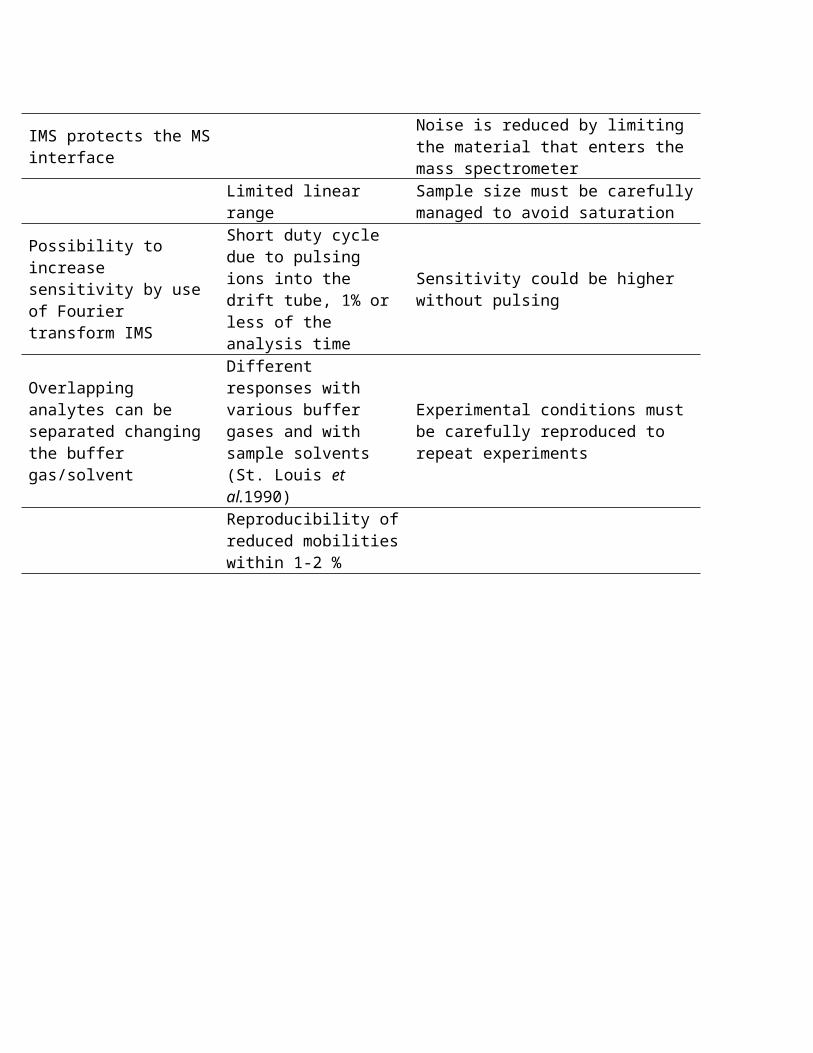
M resistors (Figure 2). A high electrical potential (~12
kV) is placed on the first guard ring, the target screen,
to produce a 200-400 V/cm field throughout the drift tube
(Fernandez-Maestre et al. 2010a); alteration of the length
of the ion separation region by addition or removal of
stainless steel rings is possible. The rings are held
inside a ceramic tube (Figure 2b) that has an aperture
all along its length to introduce the electric contacts
of the rings; this ceramic tube is housed inside an
aluminum oven for heating (Figure 2a). Previous IMS
designs used round insulator beads, which produced large
apertures between the guard rings; this open design
allowed undesired neutral species or radicals in the

tube; the introduction of the close design, described
above, begun the modern era of IMS (Baim & Hill, 1982).
ION GATES
Once the gas-phase ions are formed in the ionization
source, they are directed by the electric field down the
drift tube toward the detector. On their way, they
encounter sets of parallel wires that prevent the ions
from continuing their migration through the spectrometer.
These sets of parallel wires are called ion gates. The
entrance ion gate is placed at the beginning of the drift
region and is electronically opened for a few tenths of a
millisecond to permit a pulse of analyte ions to enter
this region; typical pulses are 0.2 ms long. The gate is
open (all ions pass) when each gate wire is at the
potential of the drift field at that place in the drift
tube and is closed (ions are stopped) when a potential
higher than the drift voltage is placed between each pair
of adjacent wires. After passing the gate, the ions drift
with the electric field, some faster and some slower

according to their individual ion mobilities, and arrive
at the collector electrode at different times. Before
arriving to the detector, ions can find a second gate
placed just in front of it. The purpose of this aperture
grid is to shield some detectors from the inductive
effects of the incoming ion cloud. With no aperture grid,
a collector electrode responds to the ion cloud before
the cloud arrives at the electrode, producing a broadened
ion peak (Hill & Simpson, 1997). The aperture grid can be
opened at progressively larger intervals after the
entrance gate to create an ion mobility spectrum or can
be opened at fixed intervals after that gate to monitor
only ions of a given mobility (Baim & Hill, 1982). The
use of ion gates decrease the sensitivity since they are
open only a fraction of the analysis time; to increase
sensitivity, Fourier Transform IMS (FTIMS) and pulsed
sources have been used; in FTIMS, a second ion gate is
placed close to the collector, and synchronized with the
entrance gate at a rate that is continuously varied from

low to high frequency. As ions migrating through the
drift region of the spectrometer go in and out of phase
with the oscillating gates, the ion current at the
collector increases and decreases producing an
interferogram; signal to noise ratio increase in FTIMS
because he gates are open 50% of the time (Hill &
Simpson, 1997).
DRIFT GASES
A countercurrent of dry neutral gas is used in IMS as a
clean and inert matrix through which ions drift. The
drift gas also serves to keep the spectrometer drift tube
clean by keeping neutral compounds, introduced with the
sample or coming from the atmosphere, from passing into
the drift region (Hill & Simpson, 1997). The drift gas,
usually nitrogen or air, enters the bottom of the
spectrometer with flow rates on the order of 0.5-1.5
L/min, passes through the drift tube and exits through
the ionization region (Figure 1, buffer gas entrance).
Helium, carbon dioxide, and argon also have been used as

drift gases; when drift gases are changed, sensitivity
and resolving power change; helium was by far the most
sensitive, giving nearly nine times more peak area than
that seen in nitrogen; fast ions have lower resolving
powers due to increased contributions from the ion pulse
width (0,2m) to the overall peak width, whereas for
slower drifting ions, diffusion becomes the main band-
spreading mechanism; when the effect of the starting
pulse width was removed, the drift gases all performed
nearly identically, which indicates that drift gases
produce similar resolving powers (Asbury & Hill, 2000).
Carbon dioxide has been used as a drift gas when coupling
IMS to supercritical fluid chromatography (SFC). Use of
carbon dioxide as a drift gas was difficult in earlier
IMS experiments because it formed such large clusters
with ions that the mobility of the ion cluster was
independent of the core ion species (Ellis et al. 1976);
however, when analyzing large molecules or using
temperatures higher than 220ºC this situation changes; it

was demonstrated that the patterns of the ion mobility
spectra were similar to those for nitrogen while ion
drift times were considerably longer in CO2;
unfortunately, these longer drift times lead to
broadening by diffusion and reduced sensitivity
(Rokushika et al. 1987); also, when using unidirectional
flow FTIMS as a detector for SFC and nitrogen as a drift
gas, there were no differences in the mobilities of the
reactant ions caused by CO2 contamination, indicating
that the identities of the reactant ions were unaffected
by CO2 flow (Eatherton et al. 1988) maybe because the high
temperature of the IMS tube did not allow clustering with
CO2; for flows above 40mL/min, the signal for reactant
ions decreased and eventually disappeared, which makes
necessary to split the SFC flow for packed columns
(Morrissey & Widmer, 1991).
DOPING AGENTS
Doping agents (reagent gases) added to the drift gas
control ionization and increase selectivity in IMS. When

using methylene chloride as a doping agent for the
detection of explosives, the negative ion Cl2 selectively
attaches these electronegative molecules and sensitivity
increase (Lawrence & Neudorfl, 1988). In the positive ion
mode, low proton affinities compounds such as normal
hydrocarbons are unresponsive. To observe hydrocarbon
signal, water must be purged from sample and drift gas,
and a dopant agent must be added to the drift gas or a
metastable helium ionization source must be used; in this
source, an inert gas in the presence of a strong electric
field can be excited to a metastable state through
collisions with electrons from a -source; this excited
molecules can then ionize molecules with high ionization
potentials (Kojiro et al. 1991). The addition of doping
agents to ion mobility spectrometers to selectively
ionize compounds was first applied by Kim et al. (1978) who
added ammonia to the N2 buffer gas to ionize amines. When
using a very high affinity compound like NH3 as a doping
agent, the selectivity increases since fewer compounds

compete with ammonia for proton and only very strong gas-
phase bases are detected, for example amines and drugs
(Kim et al. 1978). Other doping agents used to ease
analysis are carbon tetrachloride for explosives
(Spangler et al. 1985) and dichloromethane, dibromomethane,
methyl iodide, acetic acid, dimethyl sulfide and
acetonitrile for explosives (Proctor & Todd, 1984).
During the analysis of high proton affinity vapor
analytes with IMS in air, a high number of interferences
arises due to the small proton affinity of water; one way
to circumvent this is to add the drift gas with small
quantities of ketones, which allows the formation of
dimers with a higher stability than that of water
clusters. The spectra will simplify because only
compounds whose proton affinities are above that of the
acetone dimers are detected (Hill & Simpson, 1997). Other
examples of the addition of doping agents to the buffer
gas are acetone and dimethylsulfoxide added to mixtures
of volatile organic and organophosphorus compounds
(Eiceman et al. 1995); acetone, water, and dimethylsulfoxide
added to volatile organic compounds (Meng et al. 1995);
acetone and 5-nonanone added to hydrazine and
monomethylhydrazine to skip the interference of ammonia
(Eiceman et al. 1993); 4-heptanone added to alkanolamines in
the presence of interferences of ammonia, Freon 22, and
diesel fuel (Gan & Corino, 2000), and ketones added to
hydrazines to avoid ammonia interference (Bollan et al.
2007). The use of doping agents in IMS was reviewed by
Puton et al. (2008). All these researchers introduced the
doping agents to the buffer gas in the reaction region of
the mobility spectrometer to selectively change ion
mobilities but only to avoid interferences.
The application of these selective changes in ion
mobilities due to addition of a doping agent to the
buffer gas had been applied to separate interferences but
not to separate analytes with similar K0 values. Doping
agents that are introduced by the end of the drift
region, and not with the analyte in the reaction region,

are called buffer gas modifiers. Separation is achieved
because selective clustering of the modifiers with the
analytes occur which change analyte mobilities depending
on the size and steric hindrance on the charge of the
analyte ions. Sugar, drug and amino acids enantiomers
were separated using (S)-2-butanol (Dwivedi et al. 2006);
however, these authors only used the differences between
enantiomers and did not take advantage of the differences
in compounds mobilities. Fernandez-Maestre et al. (2010b)
did so by separating overlapping α-amino acids using 2-
butanol and demonstrated the formation of analyte-
modifier clusters; the authors also observed a decrease
on cluster formation with temperature increase. The
formation, or the lack of formation, of clusters analyte-
modifiers was also demonstrated for 2,4-lutidine, 2,6-di-
tert-butyl pyridine, tetraalkylammonium ions, and -amino
acids using water, methyl 2-chloropropionate, and
trifluoromethyl benzyl alcohol as modifiers (Fernandez-
Maestre et al. 2010a). The formation of gas-phase
intramolecular bridges in diamines such as arginine,
histidine, and lysine and the drug atenolol was
demonstrated by Fernandez-Maestre et al. (2012) introducing
modifiers in the buffer gas on a mobility spectrometer.
The diamines mobilities were unaffected when modifiers
were introduced into the buffer gas due to the formation
of intramolecular bridges that hindered the attachment of
modifier molecules to the positive charge of ions and
delocalized the charge, which deterred clustering; ethyl
lactate, nitrobenzene, 2-butanol, and tetrahydro-furan-2-
carbonitrile were used as modifiers. Separations with the
addition of buffer gas modifiers opens up prospects for
extending the application of IMS to the determination of
complex mixtures.
DETECTION METHODSIn IMS, the most common and simple detection device to
measure the ion intensity is a collector plate that works
as a Faraday cup. In many instruments, a biased aperture

gate placed close to this cup serves either as a detector
or to increment the efficiency of the Faraday cup. This
gate prevents the buildup of an ion charge on the
collector plate, imparts energy to the ions to increase
collection efficiency and filters out artifact signals
coming from the opening and closing of the entrance gate
(Eiceman & Karpas, 2005). Faraday cups can be replaced by
detectors such as mass spectrometers that introduce
additional identification capabilities to IMS.
Ion Mobility-mass spectrometry (IMS-MS). A common
detection technique for IMS is mass spectrometry (MS).
Coupling MS to IMS allows the determination of molecular
weights, fragmentations, clustering and other type of
reactions in the drift tube. All kinds of MS instruments
have been interfaced to IMS systems including quadrupole
(Clowers & Hill, 2005), time of flight (Ugarov et al.
2004), Fourier-transform ion cyclotron resonance, FTICR
(Bluhm et al. 2000), sectors (McDaniel et al. 1962) and ion
trap (Clowers & Hill, 2005). The coupling of these
detectors to IMS adds an identification dimension to the
detection of ions. When coupling IMS to MS, there are
several possible modes of operation. In the IMS only
mode, MS serves as a detection technique for IMS and no
scan is performed: all ions reach the detector without
scanning and the resulting spectra are similar to those
in IMS alone operation; the drift time change is
negligible because, although the distance the ions travel
inside the MS instrument is similar to that in IMS, in MS
the ions travel much faster due to the absence of drift
gas in the vacuum conditions. In the MS mode, both gates
are open (in the case of quadrupoles) and all ions pass
continuously and directly to the mass spectrometer and
are mass analyzed; the mass spectrum is obtained in this
mode. In the case of IMS-tof-MS, the ions are sent by
pulses to the MS. In the IMS-MS mode, all peaks of the IMS
spectrum are mass analyzed continuously; this is possible
because one mass spectrum can be acquired in less than
one millisecond, so several MS spectra can be taken for
every mobility peak; therefore, separation of all the
ions with different masses and the same mobilities can be
separated. In Selected Ion Monitoring mode, the MS
instrument is set to detect one determined mass-to-charge
value; the result is an ion mobility spectrum of all ions
with the specified mass.
IMS ANALYSIS
SAMPLE INTRODUCTION
Samples can be introduced in the IMS tube directly if
they are in a vapor form. Liquid samples or solutions can
be introduced by means of ESI, SESI, and corona spray
ionization sources, or through a chromatographic
instrument, and solid samples may use MALDI and thermal
or laser desorption. Direct injection of laboratory air
considerably changes the identity of the reactant ions
observed in IMS, complicating the analysis (St. Louis et
al. 1990); water and ammonia clusters from the environment,
and chloride and nitrate ions limit the capability of IMS
to analyze compounds with low proton or electron
affinities and introduces other unwanted reactions.
Membrane inlets allow sample introduction that keep
reactive molecules such as water and ammonia out of the
reaction region; membranes are common when non-purified
air is used as the buffer gas such as in field
measurements. Spangler and Carrico (1983) tested two
membranes for sample introduction: MEM-100
dimethylsilicone and Celgard 2400 (microporous
polypropylene film); non-porous membranes as
dimethylsilicone were capable of reducing significantly
all atmospheric contaminants except CO2; polypropylene
membranes were less effective to diminish intake of
reactive molecules from sampled air.
Introducing the sample using a chromatographic technique
gives a second dimension for easy resolving complex
mixtures. Gas chromatography (GC) was first coupled to
IMS by Karasek (1970) and later were liquid
chromatography, SFC, and capillary electrophoresis
(Hallen et al. 1989). SFC-IMS has been applied to the
determination of nicotine in tobacco (Wu et al. 1998), GC-
MS for the analysis of bacteria by pyrolysis (Dworzanski
et al. 2005), and liquid chromatography for analysis of
carbohydrates (Lee et al. 1998).
SPECTRA
Spectra are graphs of intensity of the ion peaks (ion
current) vs. drift time on the x axis. The zero drift time
is taken as the time the entrance gate is open (in
occasions when the gate is closed) to let the ions enter
the drift tube. Most of the ions are neutralized in the
aperture gate, which is open only about 1% of the duty
cycle. Signals are very noisy and it is necessary to
average as many as 250 spectra to obtain a clean
spectrum. However, the total analysis time is less than
one minute, faster than most other separation techniques
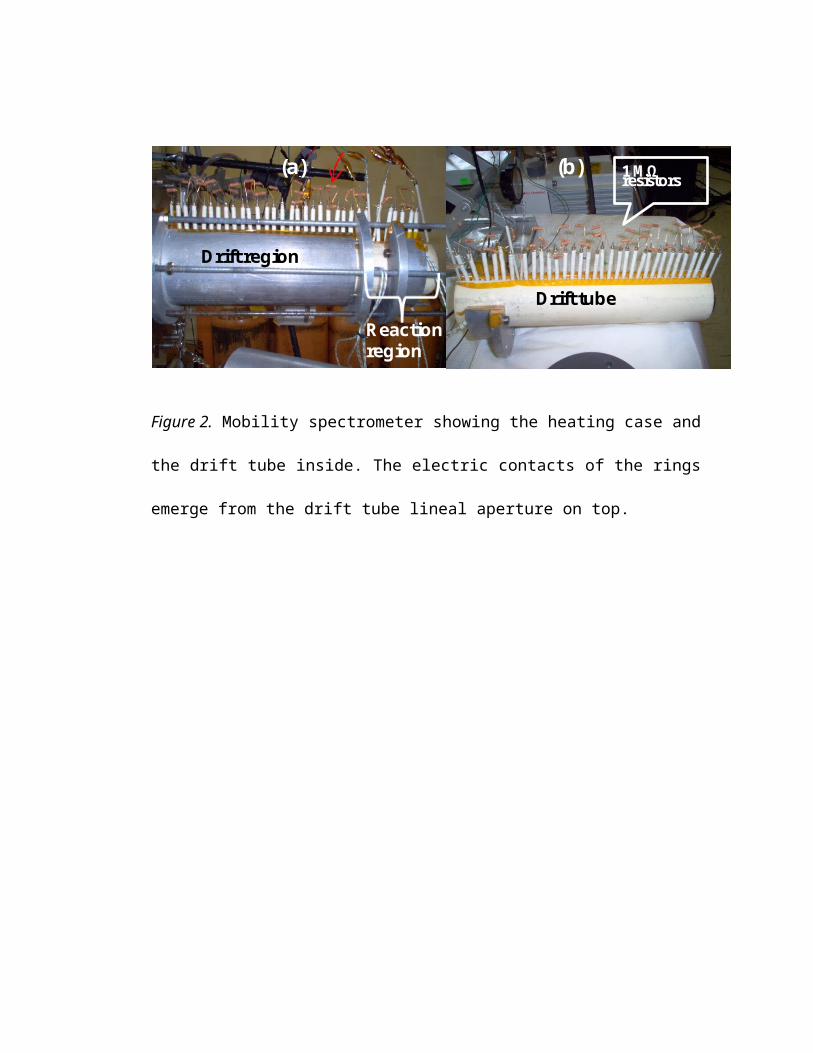
(Eiceman & Karpas, 2005). Figure 3a shows a typical ion
mobility spectrum of the positive reactant ions in
nitrogen, in this case, the water reactant ion, (H2O)nH+.
IMS spectra can show drift times of 10 ms for small

molecules to more than 100 ms for macromolecules like
proteins and nucleic acids, being the most common about
20–25 ms (Hill & Simpson, 1997). Figure 3b shows a
loratadine IMS spectrum with a drift time of 35 ms.
In 2-D mode, the drift time is displayed in the y axis of
the spectrum vs m/z in the x axis. This mode has been
used for the study of proteomes (McLean et al. 2005) and
metabolomes (Dwivedi et al. 2010).
REDUCED MOBILITY
Ion mobility spectrometry separates compounds on the
basis of their different gas-phase velocities, commonly
in nitrogen or air, giving mobility constants (K),
defined as:
Where v is the velocity of the ion in cm/s and E is the
electric field in the drift region of the spectrometer in
V/cm. If weak-field conditions exist (i.e. less than 500

V/cm), v should be a linear function of E. Mobility
constants are more easily calculated by measuring the
time an ion travels down the drift tube. Mobilities can
then be found by replacing E = V/L and v = td/L in eq. 1
Where L is the distance the ion travels to reach the
detector in centimeters, V is the total voltage drop in
the drift tube that forces the ions through the drift
tube in volts, and td is the time in seconds the ion takes
to travel down the drift tube till the detector. To
compare ion mobilities in different experimental
conditions mobilities must be normalized to standard
conditions obtaining the reduced mobility (in cm2 V-1 s-1):
Where P is the pressure in kPa. and T is the temperature
in K. Factors affecting Ion mobilities at atmospheric

pressure comprise mass, size, and charge (Revercomb &
Mason, 1975). Reduced mobilities exhibit a mass-related
temperature dependence for homologous series of compounds
e.g., alcohols, carbohydrates, amines etc.; for amines,
this temperature dependence is positive (i.e., mobility
increases with increasing temperature) for low molecular
mass ions, almost constant for intermediate masses (90-
180 Da) ions, and negative for heavy ions (Berant &
Karpas, 1989). Reduced mobility values are reproducible
to within 1-2% in different laboratories (Eiceman &
Karpas, 2005); a compilation of these values has been
published (Shumate et al. 1986).
CALIBRATION
To calibrate the IMS instrument, the fact that under
certain conditions the product K0t is constant can be
used. This means that the reduced mobility of different
analyte ions may be calculated from that of a calibrant,
K0c:

where tc is the drift time of the calibrant at the
specific conditions of the experiment and td is the drift
time of the analyte at the same conditions (Eiceman et al.
2003). 2,4-lutidine is the compound commonly chosen as
calibrant (Berant & Karpas, 1989). This method skips the
reading of barometers and eliminates the errors due to
wrong measurements of the parameters in eq. 3 but can
introduce errors due to contamination of the drift tube
which can produce clustering that change ion mobilities.
Tetraalkylammonium ions, 2-4, lutidine, and di-tert-
butylpyridine are good standards for IMS because they
produce a single peak and a very sensitive signal.
Fernandez-Maestre et al. (2010a) addressed issues such as
errors produced by contamination and demonstrated that
2,4-lutidine or the single use of one calibration
standard could lead to errors when contamination was
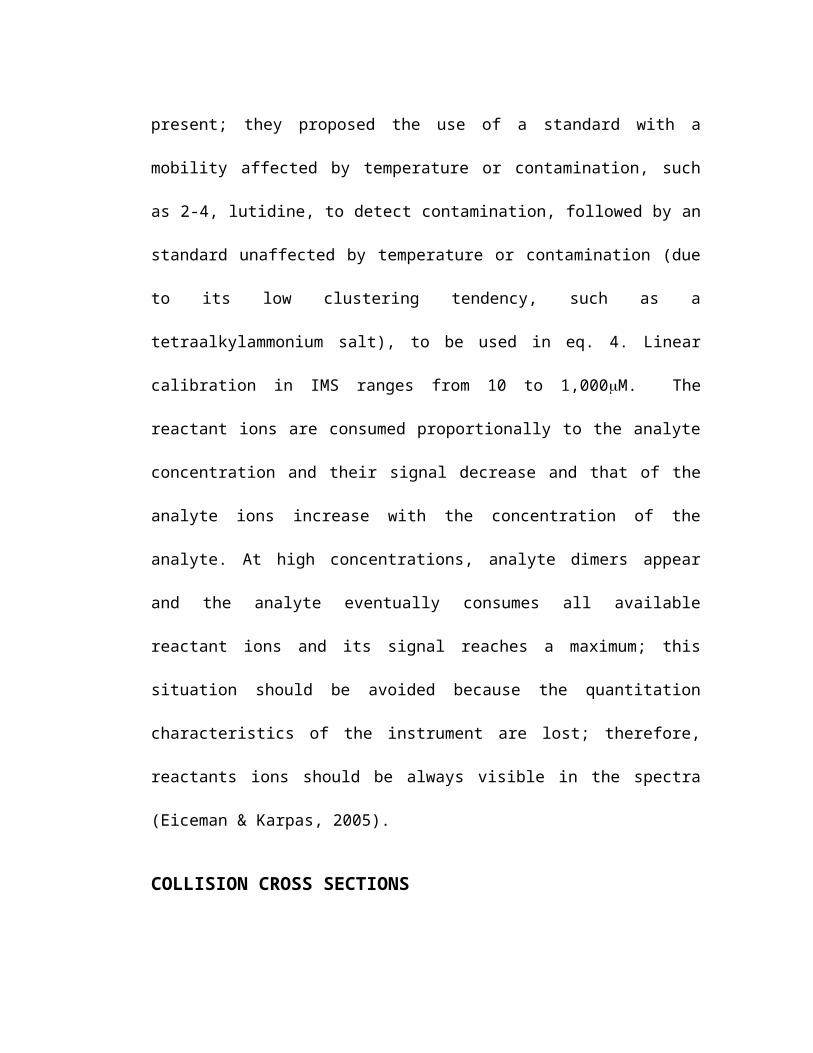
present; they proposed the use of a standard with a
mobility affected by temperature or contamination, such
as 2-4, lutidine, to detect contamination, followed by an
standard unaffected by temperature or contamination (due
to its low clustering tendency, such as a
tetraalkylammonium salt), to be used in eq. 4. Linear
calibration in IMS ranges from 10 to 1,000mM. The
reactant ions are consumed proportionally to the analyte
concentration and their signal decrease and that of the
analyte ions increase with the concentration of the
analyte. At high concentrations, analyte dimers appear
and the analyte eventually consumes all available
reactant ions and its signal reaches a maximum; this
situation should be avoided because the quantitation
characteristics of the instrument are lost; therefore,
reactants ions should be always visible in the spectra
(Eiceman & Karpas, 2005).
COLLISION CROSS SECTIONS

Kinetic theory yields a form for the mobility at standard
temperature and pressure conditions (Mason & Schamp,
1958):
In this equation, (the Mason–Shamp equation), P is the
pressure in Torr., T the temperature in ºC, q the charge
of the ion, N0 the gas number density at standard
temperature and pressure conditions (N0 = P/kT), m the
reduced mass of an ion-drift gas pair, k the Boltzmann
constant, the ion-neutral collision cross section and
a small correction term with a magnitude of less than
0.02, when the ion mass is larger than the mass of the
drift gas molecule. The reduced mass is defined as mM/(m
+ M) where m and M are the molecular mass of the analyte
and the drift gas, respectively; this equation is useful
for calculating collision cross sections of molecules,
especially important for macromolecules like proteins

that can adopt different conformations, which are closely
related to their biological activity. Computational
methods have been used to investigate the structure of
gas-phase ions; this has been achieved by correlating
theoretically calculated structures with collision cross
sections that were established experimentally (Hill et al.
2002).

APPLICATIONS OF IMS
Only in this decade, commercial bench top IMS analyzers
were available after decades of absence from the market.
Figure 4 shows the GA-2100 Electrospray IMS
commercialized by Excellims Corporation (2011) as being
“faster than HPLC… perfect for rapidly and sensitively
analyzing liquid samples…Pharmaceutical Cleaning
Validation, process monitoring, and many other types of
analysis”. IMS has served as a stand-alone vapor monitor
(Dam, 1984), and as a detector for gas (Baim & Hill,
1982), supercritical fluid (Eatherton et al. 1986), and
liquid chromatography (McMinn et al. 1990). IMS has had
dissimilar applications such as the study of folding of
conformers (Giganti et al. 2011) and conformational changes
in oligosaccharides (Seo et al. 2011), detection of
contaminants in food (Bota & Harrington, 2006), analysis
of protein structures (Myung et al. 2006), determination of
illegal drugs in human hair (Sheibania et al. 2011),
detection of moulds (Tiebe et al. 2010), identification of
wood species (Lawrence et al. 1991) and detection of

emissions from surfaces (Vautz et al. 2006), and has been
proposed as an analytical separation tool for searching
the chemical signatures of life during exploration of
solar system bodies (Johnson et al. 2007).
In biology, IMS has been applied to the determination of
bacteria by enzyme substrate reactions. A method add (o-
nitrophenyl) galactopyranoside to cell cultures where
bacterial enzymes cleave it to o-nitrophenol; this
relatively high vapor pressure product can be detected by
IMS sampling the headspace of the sample (Snyder et al.
1991). Applications in medicine include the detection of
drugs in breath of patients (Carstens et al. 2010),
determination of methanol and ethanol in human saliva
(Bocos-Bintintan et al. 2010), and metabolites and volatile
organic compounds as a tool to diagnose chronic
obstructive pulmonary disease (Bessa et al. 2011),
bronchial carcinoma (Finthammer et al. 2010), and other
diseases (Bunkowski et al. 2010). Also, commonly used
volatile anesthetic agents halothane, isoflurane,

enflurane, sevoflurane, and desflurane have been
determined with IMS (Rosenblatt et al. 1995). IMS has also
been applied to the detection of acetaminophen,
aspartame, bisacodyl, caffeine, dextromethorphan,
diphenhydramine, famotidine, glucosamine, guaifenesin,
loratadine, niacin, phenylephrine, pyridoxine, thiamin,
and tetrahydrozoline in over-the-counter-drugs and
aspartame and caffeine in beverages (Fernandez-Maestre &
Hill, 2009). These applications could be of interest in
third-world countries due to the low cost of this
technique, especially for countries like Colombia where
cheap and sensitive methods of medical diagnostic are
required.
Not only are organic compounds detected by IMS but
airborne molecular contamination (Shupp et al. 2007) and
many inorganic species can be monitored continuously;
these inorganic species include as Cl-, l-, Br-, HF, HCl,
HI, HBr, NH3, NO2, HCN, PCl3, ClO2, BF3, HNO3, F2, Br2, I2

and Cl2 (Bacon et al. 1991); this is important for the
detection of dangerous leakages in industrial factories.
Ion mobility spectrometry is an analytical technique with
a promising future due to increased terrorism and drug
trafficking since it is the technique of choice for rapid
and low cost detection of illicit drugs and explosives.
IMS portability and easy operation make it an essential
tool for military, police and security personnel.
Conflictos de intereses: El manuscrito fue preparado por
el autor; declaro que no existe ningún conflicto de
intereses que ponga en riesgo la validez de esta
revisión.
REFERENCES1. ALBRITTON, D.L., MILLER, T.M., MARTIN, D.W., &
MCDANIEL, E.W. 1968. Mobilities of Mass-Identified H3+ and H+ Ions in Hydrogen. Phys. Rev. 171(1):94-102.
2. ASBURY, G.R., KLASMEIER, J., & HILL, JR. H.H. 2000.Analysis of explosives using electrosprayionization/ion mobility spectrometry (ESI/IMS). Talanta50(6):1291-1298.

3. ASBURY, G.R., & HILL, Jr. H.H. 2000. Using DifferentDrift Gases To Change Separation Factors () in IonMobility Spectrometry. Anal. Chem. 72(3):580-584.
4. BACON, A.T., GETZ, R., & Reategui, J. 1991. Ion-Mobility Spectrometry Tackles Tough Process Monitoring.J. Chem. Eng. Program. 87(6):61-64.
5. BAIM, M.A., & HILL, Jr. H.H. 1982. Tunable SelectiveDetection for Capillary Gas Chromatography by IonMobility Monitoring. Anal. Chem. 54(1):38-43.
6. BAIM, M.A., EATHERTON, R.L., & HILL, Jr H.H. 1983. IonMobility Detector for Gas Chromatography with a DirectPhotoionization Source. Anal. Chem. 55(11):1761-1766.
7. BERANT, Z., & KARPAS, Z. 1989. Mass-MobilityCorrelation of Ions in View of New Mobility Data. J. Am.Chem. Soc. 111(11):3819-3824.
8. BESSA, V., DARWICHE, K., TESCHLER, H., SOMMERWERCK,U., RABIS, T., BAUMBACH, J.I., & FREITAG, L. 2011.Detection of volatile organic compounds (VOCs) inexhaled breath of patients with chronic obstructivepulmonary disease (COPD) by ion mobility spectrometry.Int. J. Ion Mob. Spectrom. 14(1):7-13.
9. BLUHM, B.K., GILLIG, K.J., & RUSSELL, D.H. 2000.Development of a Fourier-transform ion cyclotronresonance mass spectrometer-ion mobility spectrometer.Rev. Sci. Instrum. 71(11):4078-4086.
10. BOCOS-BINTINTAN, V., MOLL, V.H., FLANAGAN, R.J., &THOMAS, C.L.P. 2010. Rapid determination of alcoholsin human saliva by gas chromatography differentialmobility spectrometry following selective membraneextraction. Int. J. Ion Mob. Spectrom. 13(2):55-63.
11. BOGGIO, N.G., PIERPAULI, K., RINALDI, C.A., &LAMAGNA, A. 2011. Detection of Volatile OrganicCompound with an Ion Mobility Spectrometry Cell TypeDevice with a Corona Discharge Ionization Source.Sensor Lett. 9(2):866-868.
12. BOLLAN, H.R., STONE, J.A., BROKENSHIRE, J.L.,RODRIGUEZ, M.R., & EICEMAN, G.A. 2007. Mobility
Resolution and Mass Analysis of Ions from Ammonia andHydrazine Complexes with Ketones Formed in Air atAmbient Pressure. J. Am. Soc. Mass Spectrom. 18(5):940–951.
13. BOTA, G.M., & HARRINGTON, P.B. 2006. Directdetection of trimethylamine in meat food productsusing ion mobility spectrometry. Talanta 68(3):629-635.
14. BUNKOWSKI, A. ET AL. 2010. One year time series ofinvestigations of analytes within human breath usingion mobility spectrometry. Int. J. Ion Mob. Spectrom. 13(3-4):141.
15. CARSTENS, E.T.H., HIRN, A., QUINTEL, M., NOLTE, J.,JÜNGER, M., PERL, T., & VAUTZ, W. 2010 . On-linedetermination of serum propofol concentrations byexpired air analysis. Int. J. Ion Mob. Spectrom. 13(1):37-40,
16. CLOWERS, B.H., & HILL, H.H. 2005. Mass Analysis ofMobility-Selected Ion Populations Using Dual Gate, IonMobility, Quadrupole Ion Trap Mass Spectrometry. Anal.Chem. 77(18):5877-5885.
17. COHEN, M.J., & KARASEK, F.W. 1970. Plasmachromatography — a new dimension for gaschromatography and mass spectrometry. J. Chromatogr. Sci.8(6):330-337.
18. DAM, R.J. 1984. The Role of Plasma Chromatography inToxic gas Monitoring. In: T.W. Carr (editor), PlasmaChromatography. New York: Plenum Press. (Chapter 6) pp.177.
19. DE HOFFMANN, E., & STROOBANT, V. 2001. MassSpectrometry: Principles and Applications. Second Edition. JohnWiley and Sons.
20. DILLON, L.A., STONE, V.N., CROASDELL, L.A., FIELDEN,P.R., GODDARD, N.J., & THOMAS, C.L.P. 2010.Optimisation of secondary electrospray ionisation(SESI) for the trace determination of gas-phasevolatile organic compounds. Analyst 135(2):306-314.
21. DWIVEDI, P., WU, C., MATZ, L.M., CLOWERS, B.H.,SIEMS, W.F., & HILL, Jr. H.H. 2006. Chiral Separationby Ion Mobility Spectrometry. Anal. Chem. 78(24):8200-8206.
22. DWIVEDI, P., PUZON, G., TAM, M., LANGLAIS, D.,JACKSON, S., KAPLAN, K., SIEMS, W.F., & HILL, H.H.2010. Metabolic profiling of Escherichia coli by ionmobility-mass spectrometry with MALDI ion source. J.Mass Spectrom. 45(12):1383-1393.
23. DWORZANSKI, J.P., TRIPATHI, A., SNYDER, A.P.,MASWDEH, W.M., & WICK, C.H. 2005. Novel biomarkers forGram-type differentiation of bacteria by pyrolysis–gaschromatography–mass spectrometry. J. Anal. Appl. Pyrolysis73(1):29–38.
24. EATHERTON, R.L., MORRISSEY, M.A., SIEMS, W.F., &HILL, Jr. H.H. 1986. Ion Mobility Detection AfterSupercritical Fluid Chromatography. J. High Resolut.Chromatogr. Chromatogr. Commun. 9(1):154-160.
25. EATHERTON, R.L., MORRISSEY, M.A., & HILL, H.H. 1988.Comparison of Ion Mobility Constants of Selected Drugsafter Capillary Gas Chromatography and CapillarySupercritical Fluid Chromatography. Anal. Chem.60(20):2240-2243.
26. EICEMAN, G.A., SALAZAR, M.R., RODRIGUEZ, M.R.,LIMERO, T.F., BECK, S.W., CROSS, J.H., YOUNG, R., &JAMES, J.T. 1993. Ion Mobility Spectrometry ofHydrazine, Monomethylhydrazine, and Ammonia in Airwith 5-Nonanone Reagent Gas. Anal. Chem. 65(13):1696-1702.
27. EICEMAN, G.A., WANG, Y.F., GARCIA-GONZALEZ, L.,HARDEN, C.S., & SHOFF, D.B. 1995. Enhanced selectivityin ion mobility spectrometry analysis of complexmixtures by alternate reagent gas chemistry. Anal. Chim.Acta 306(1):21-33.
28. EICEMAN, G.A., NAZAROV, E.G., & STONE, J.A. 2003.Chemical standards in ion mobility spectrometry. Anal.Chim. Acta 493(2):185-194.
29. EICEMAN, G.A., & KARPAS, Z. 2005. Ion MobilitySpectrometry. Second Edition Boca Raton: FL.CRC Press.
30. ELLIS, H.W., PAI, R.Y., GATLAND, I.R., MCDANIEL,E.W., WERNLUND, R., & COHEN, M.J. 1976. Ion identity

and transport properties in CO2 over a wide pressurerange. J. Chem. Phys. 64(10):3935- 3941.
31. EXCELLIMS CORPORATION. 2011. Available in internetin: http://www.excellims.com. Accessed on 12/2/2011.
32. FERNANDEZ-MAESTRE, R., & HILL Jr., H.H. Ion mobilityspectrometry for the rapid analysis of over-the-counter drugs and beverages. 2009. Int. J. Ion Mob.Spectrom.12(1):3-14.
33. FERNANDEZ-MAESTRE, R., HARDEN, C.S., EWING, R.G.,CRAWFORD, C.L., & HILL Jr., H.H. 2010a. ChemicalStandards in Ion Mobility Spectrometry. Analyst135(6):1433-1442.
34. FERNANDEZ-MAESTRE, R., WU, C., & HILL, H.H. 2010b.Using a Buffer Gas Modifier to Change SeparationSelectivity in Ion Mobility Spectrometry. Int. J. MassSpectrom. 298(1-3):2-9.
35. FERNANDEZ-MAESTRE, R., WU, C., & HILL Jr., H.H.2012. Buffer Gas Modifiers Effect Resolution In IonMobility Spectrometry Through Selective Ion-MoleculeClustering Reactions. Rap. Comm. Mass Spectrom. Accepted
36. FINTHAMMER, M., BEIERLE, C., FISSELER, J., KERN-ISBERNER, G., & BAUMBACH, J.I. 2010. Usingprobabilistic relational learning to support bronchialcarcinoma diagnosis based on ion mobilityspectrometry. Int. J. Ion Mob. Spectrom. 13(2):83-93.
37. GAN, T.H., & CORINO, G.T. 2000. Selective Detectionof Alkanolamine Vapors by Ion Mobility Spectrometrywith Ketone Reagent Gases. Anal. Chem. 72(4):807-815.
38. GIGANTI, V.G., KUNDOOR, S., BEST, W.A., & ANGEL,L.A. 2011. Ion Mobility-Mass Spectrometry Study ofFolded Ubiquitin Conformers Induced By Treatment withcis-[Pd(en)(H2O)2]2+ J. Am. Soc. Mass Spectrom. 22(2):300-309.
39. GUHARAY, S.K. DWIVEDI, P. & HILL, H.H. 2008. IonMobility Spectrometry: Ion Source Development andApplications in Physical and Biological Sciences. IEEET. Plasma Sci. 36, 4, 1458-1470.
40. GUNZER, F., ULRICH, A., & BAETHER, W. 2010. A novelnon-radioactive electron source for ion mobilityspectrometry. Int. J. Ion Mob. Spectrom. 13(1):9–16.
41. HALLEN R.W., SHUMATE C.B., SIEMS W.F., TSUDA T., &HILL H.H. 1989. Preliminary investigation of ionmobility spectrometry after capillary electrophoreticintroduction J. Chromatogr. A 480, 233–245.
42. HILL JR., H.H., & SIMPSON, G. 1997. Capabilities andLimitations of Ion Mobility Spectrometry for FieldScreening Applications. J. Field Anal. Chem. Technol.1(3):119-134.
43. HILL, H.H., ASBURY, G.R., WU, C., MATZ, L.M., &ICHIYE, T. 2002. Charge location on gas-phasepeptides. Int. J. Mass Spectrom. 219(1):23–37.
44. JOHNSON, P.V., BEEGLE, L.W., KIM, H.I., EICEMAN,G.A., & KANIK, I. 2007. Ion mobility spectrometry inspace exploration. Int. J. Mass Spectrom. 262(1-2):1-15.
45. KANU, A.B., & HILL Jr., H.H. 2008. Ion mobilityspectrometry detection for gas chromatography. J.Chromatogr. A 1177(1):12-27.
46. KANU, A.B., DWIVEDI, P., TAM, M., MATZ, L., HILL, &H.H. Jr. 2008. Ion mobility-mass spectrometry. J. MassSpectrom. 43(1):1-22.
47. KARASEK F.W 1970. Res. Develop. 21(12):25 (cited inKARASEK F.W 1972. Trace Analysis and FundamentalStudies by Plasma Chromatography. Int. J. Environ. Anal. Chem.21(12):157-166
48. KIM, S.H., KARASEK, F.W., & ROKUSHIKA, S. 1978.Plasma Chromatography with Ammonium Reactant Ions. Anal.Chem. 50(1):152-155.
49. KOJIRO, D.R., COHEN, M.J., STIMAC, R.M., WERNLUND,R.F., HUMPHRY, D.E., & NORISHIGE, T. 1991.Determination of C1–C4 Alkanes by Ion MobilitySpectrometry. Anal. Chem. 63(20):2295-2300.
50. LANGEVIN, P. 1903. L'ionization des gaz. Ann. Chim.Phys. 28:289-384.

51. LAWRENCE, A.H., BARBOUR, R.J., & SUTCLIFFE, R. 1991.Identification of wood species by ion mobilityspectrometry. Anal. Chem. 63(13):1217-1221.
52. LAWRENCE, A.H., & NEUDORFL, P. 1988. Detection ofEthylene Glycol Dinitrate Vapors by Ion MobilitySpectrometry Using Chloride Reagent Ions. Anal. Chem.60(2):104-109.
53. LEE, D-S., WU, C., & HILL Jr., H.H. 1998. Detectionof Carbohydrates by Electrospray Ionization - IonMobility Spectrometry following Microbore High-Performance Liquid Chromatography. J. Chromatogr. A822(1):1-9.
54. LOVELOCK, J.E., & WASILEWSKA, E.M. 1949. Anionisation anemometer. J. Sci. Instr. 26(11):367-370.
55. LUBMAN, D.M., & KRONICK, M.N. 1982a. Plasmachromatography with laser-produced ions. Anal. Chem.54(9):1546-1551.
56. LUBMAN, D.M., & KRONICK, M.N. 1982b. Discriminationof isomers of xylene by resonance enhanced two-photonionization. Anal. Chem. 54(13):2289-2291.
57. MÁRQUEZ-SILLERO, I., AGUILERA-HERRADOR, E.,CÁRDENAS, S., & VALCÁRCEL, M. 2011.Ion-mobility spectrometry for environmental analysis. TrACTrends Anal. Chem. 30(5):677.
58. MASON, E.A., & SCHAMP, Jr. H.W. 1958. Mobility ofGaseous Ions in Weak Electric Fields. Ann. Phys.4(3):233-270.
59. MCDANIEL, E.W., MARTIN, D.W., & BARNES, W.S. 1962.Drift-Tube Mass Spectrometer for Studies of Low-EnergyIon–Molecule reactions. Rev. Sci. Instr. 33(1):2-7.
60. MCDANIEL, E.W. 1964. Collisional Phenomena in Ionized Gases,New York: Wiley.
61. MCLEAN, J.A., RUOTOLO, B.T., GILLIG, K.J., &RUSSELL, D.H. 2005. Ion mobility–mass spectrometry: anew paradigm for proteomics. Int. J. Mass Spectrom.240(3):301–315.
62. MCMINN, D.G., KINZER, J.A., SHUMATE, C.B., SIEMS,W.F., & HILL Jr., H.H. 1990. Ion mobility detection
following liquid chromatographic separation. J.Microcolumn Sep. 2(4):188-192.
63. MENG, Q., KARPAS, Z., & EICEMAN, G.A. 1995.Monitoring Indoor Ambient Atmospheres for VolatileOrganic Compounds using an Ion Mobility Analyzer Arraywith Selective Chemical Ionization. Int. J. Environ. Anal.Chem. 61(2):81-94.
64. MORRISSEY, M.A., & WIDMER, H.M. 1991. Ion-mobilityspectrometry as a detection method for packed-columnsupercritical fluid chromatography. J. Chromatogr.552:551-61
65. MYUNG, S., WISEMAN, J.M., VALENTINE, S.J., TAKATS,Z., COOKS, R.G., & CLEMMER, D.E. 2006. CouplingDesorption Electrospray Ionization with Ion Mobility /Mass Spectrometry for Analysis of Protein Structure:Evidence for Desorption of Folded and DenaturedStates. J. Phys. Chem. B 110(10):5045-5051.
66. PROCTOR, C.J., & TODD, J.F.J. 1984. Alternative reagent ions for plasma chromatography. Anal. Chem. 56(11):1794-1797.
67. PUTON, J., NOUSIAINEN, M., & SILLANPAA, M. 2008. Ionmobility spectrometers with doped gases. Talanta 76(5):978-987.
68. REARDEN, P., & HARRINGTON, P.B. 2005. Rapidscreening of precursor and degradation products ofchemical warfare agents in soil by solid-phasemicroextraction ion mobility spectrometry (SPME–IMS).Anal. Chim. Acta 545(1):13–20.
69. REVERCOMB, H.E., & MASON, E.A. 1975. Theory ofplasma chromatography/ gaseous electrophoresis. Anal.Chem. Rev. 47(7):970–983.
70. ROKUSHIKA, S., HATANO, H., & HILL Jr., H.H. 1987.Ion Mobility Spectrometry after Supercritical FluidChromatography. Anal. Chem. 59(1):8-12.
71. ROSENBLATT, R., SACRISTAN, E., SHAHNARIAN, A., &PEURA, R.A. 1995. Preliminary feasibility study ofanesthetic agent identification from ion mobilityspectra using a neural network. Bioengineering Conf.
1995. Proc. IEEE. 21st Annual Northeast, 70–71, DOI:10.1109/NEBC.1995.513737.
72. RUTHERFORD, E. 1897. The Velocity and Rate ofRecombination of the Ions of Gases exposed to RontgenRadiation. Phil. Mag. 44(270):422-440.
73. RUTHERFORD, E. 1899. Uranium Radiation and theElectrical Conduction Produced by it. Phil. Mag.47(284):109-163.
74. SABO, M., & MATEJCIK, S. 2011. Ion MobilitySpectrometry for Monitoring High-Purity Oxygen. Anal.Chem. 83(6):1985–1989.
75. SEO, Y., SCHENAUER, M.R., & LEARY, J.A. 2011.Biologically relevant metal-cation binding inducesconformational changes in heparin oligosaccharides asmeasured by ion mobility mass spectrometry. Int. J. MassSpectrom. 303(2-3):191-198.
76. SHEIBANIA, A., TABRIZCHI, M., & GHAZIASKAR, H.S.2011. Determination of Methadone in Human Hair byHeadspace Extraction and Ion Mobility Spectrometry.Anal. Lett. 44(4):667 – 675.
77. SHUMATE, C.B., ST LOUIS R.H., & HILL Jr., H.H. 1986.Table of reduced mobility values from ambient pressureion mobility spectrometry. J. Chromatogr. 373:141–173.
78. SHUPP, A.M., RODIER, D., & ROWLEY, S. 2007.Monitoring airborne molecular contamination: aquantitative and qualitative comparison of real-timeand grab-sampling techniques. Proc. SPIE. 6518, 65183Z.doi:10.1117/12.707776.
79. SNYDER, A.P., SHOFF, D.B., EICEMAN, G.A., BLYTH,D.A., & PARSONS, J.A. 1991. Detection of bacteria byion mobility spectrometry. Anal. Chem. 63(5):526-529.
80. SPANGLER, G.E., & CARRICO, J.P. 1983. Membrane inletfor Ion Mobility Spectrometry. Int. J. Mass Spectrom. Ion Phys.52(2-3):267-287.

81. SPANGLER, G.E., CAMPBELL, D.N., & CARRICO, J.P.1985. Recent Advances in Ion Mobility Spectrometry forExplosives Vapor Detection. J. Test Eval. 13(3):234-241.
82. ST. LOUIS, R.H., SIEMS, W.F., & HILL Jr., H.H. 1989.Evaluation of Direct Axial Sample Introduction for IonMobility Detection After Capillary Gas Chromatography.J. Chromatogr. 479(2):221-231.
83. ST. LOUIS, R.H., HILL, Jr., H.H., & Eiceman, G.A.Ion Mobility Spectrometry in Analytical Chemistry. CRCCr. Rev. Anal. Chem. 21(5), 1990:321-355
84. TABRIZCHI, M., & ROUHOLAHNEJAD, F. 2004. Coronadischarge ion mobility spectrometry at reducedpressures. Rev. Sci. Instr. 75(11):4656-4662.
85. TIEBE, C., HÜBERT, T., KOCH, B., RITTER, U., &STEPHAN, I. 2010. Investigation of gaseous metabolitesfrom moulds by Ion Mobility Spectrometry (IMS) and GasChromatography-Mass Spectrometry (GC-MS). Int. J. Ion Mob.Spectrom. 13(1):17-24.
86. UGAROV, M.V., EGAN, T., KHABASHESKU, D.V., SCHULTZ,J.A., PENG, H., KHABASHESKU, V.N., FURUTANI, H.,PRATHER, K.S., WANG, J.H.W., JACKSON, S.N., & WOODS,A.S. 2004. MALDI Matrices for Biomolecular AnalysisBased on Functionalized Carbon Nanomaterials. Anal. Chem.76(22):6734-6742.
87. VALENTINE, S.J., COUNTERMAN, A.E., HOAGLUND, C.S.,REILLY, J.P., & CLEMMER, D.E. 1998. Gas-phaseseparations of protease digests. J. Am. Soc. Mass Spectrom.9(11):1213-1216.
88. VAUTZ, W., BAUMBACH, J.I., & UHDE, E. 2006.Detection of emissions from surfaces using ionmobility spectrometry. Anal. BioAnal. Chem. 384(4):980-986.
89. WEIS, P. 2005. Structure determination of gaseousmetal and semi-metal cluster ions by ion mobilityspectrometry. Int. J. Mass Spectrom. 245(1-3):1-13.
90. WU, C., SIEMS, W.F., HILL JR., H.H., & HANNAN, R.M.1998. Analytical determination of nicotine in tobaccoby supercritical fluid chromatography-ion mobilitydetection. J. Chromatogr. A 811(1-2):157-161.
91. WU, C., SIEMS, W.F., & HILL Jr., H.H. 2000.Secondary Electrospray Ionization Ion MobilitySpectrometry/Mass Spectrometry of Illicit Drugs. Anal.Chem. 72(2):396–403.
92. WYTTENBACH T., VON HELDEN G., & BOWERS M.T. 1996.Gas-Phase Conformation of Biological Molecules: Bradykinin J. Am. Chem. Soc. 118 (35), 8355-8364
93. YUAN, A., ALIAGA-ROSSEL, R., CHOI, P., & GILLES,J.P. 2005. Development of a short pulsed coronadischarge ionization source for ion mobilityspectrometry. Rev. Sci. Instr. 76(8):085105- 085105-6.
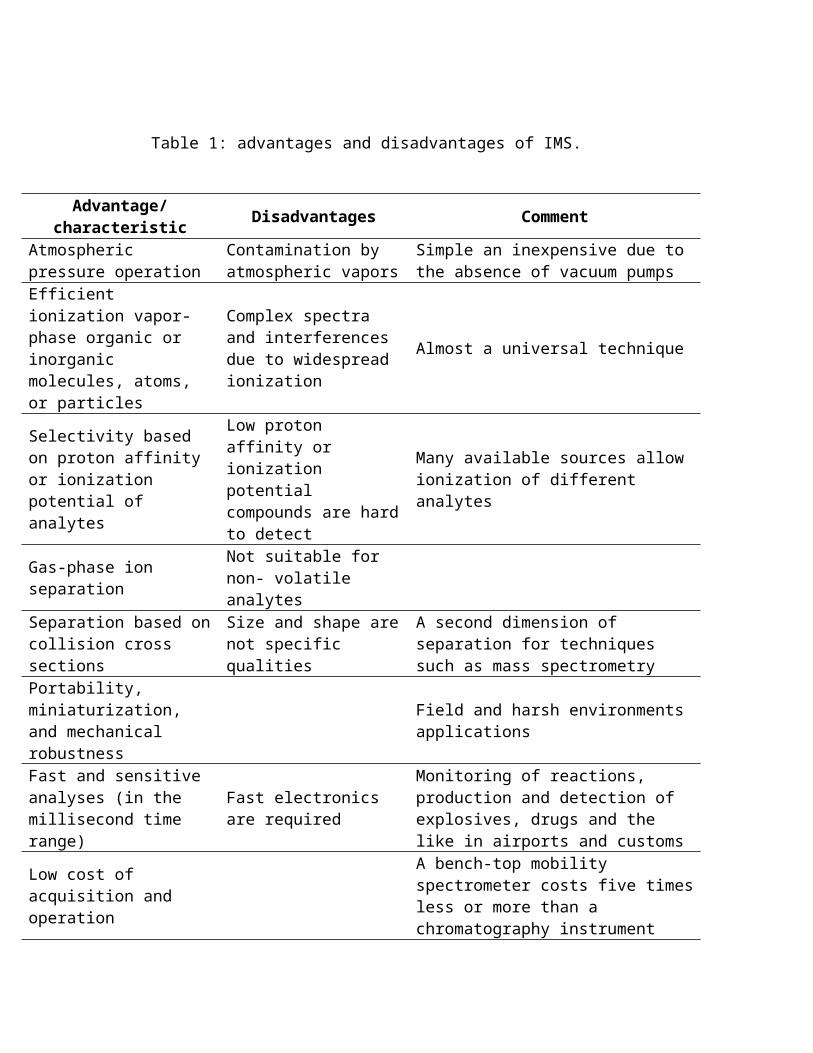
Table 1: advantages and disadvantages of IMS.
Advantage/characteristic Disadvantages Comment
Atmospheric pressure operation
Contamination by atmospheric vapors
Simple an inexpensive due to the absence of vacuum pumps
Efficient ionization vapor-phase organic or inorganic molecules, atoms, or particles
Complex spectra and interferences due to widespread ionization
Almost a universal technique
Selectivity based on proton affinity or ionization potential of analytes
Low proton affinity or ionization potential compounds are hardto detect
Many available sources allow ionization of different analytes
Gas-phase ion separation
Not suitable for non- volatile analytes
Separation based oncollision cross sections
Size and shape arenot specific qualities
A second dimension of separation for techniques such as mass spectrometry
Portability, miniaturization, and mechanical robustness
Field and harsh environments applications
Fast and sensitive analyses (in the millisecond time range)
Fast electronics are required
Monitoring of reactions, production and detection of explosives, drugs and the like in airports and customs
Low cost of acquisition and operation
A bench-top mobility spectrometer costs five timesless or more than a chromatography instrument
IMS protects the MSinterface
Noise is reduced by limiting the material that enters the mass spectrometer
Limited linear range
Sample size must be carefullymanaged to avoid saturation
Possibility to increase sensitivity by use of Fourier transform IMS
Short duty cycle due to pulsing ions into the drift tube, 1% or less of the analysis time
Sensitivity could be higher without pulsing
Overlapping analytes can be separated changing the buffer gas/solvent
Different responses with various buffer gases and with sample solvents (St. Louis et al.1990)
Experimental conditions must be carefully reproduced to repeat experiments
Reproducibility ofreduced mobilitieswithin 1-2 %

Figure 1. (a) drift tube of an Ion mobility spectrometer, (b) guard rings inside
the drift tube c) section view.
1 M Ω resistors(a) (b)
Drift region
Reaction region
Drift tube
Figure 2. Mobility spectrometer showing the heating case and
the drift tube inside. The electric contacts of the rings
emerge from the drift tube lineal aperture on top.
Figure 3. Typical IMS spectra of (a) positive reactant ions from the ESI solution
and (b) IMS-Selected Ion Monitoring spectrum of loratadine analyte (See
Detection Methods for further explanation).
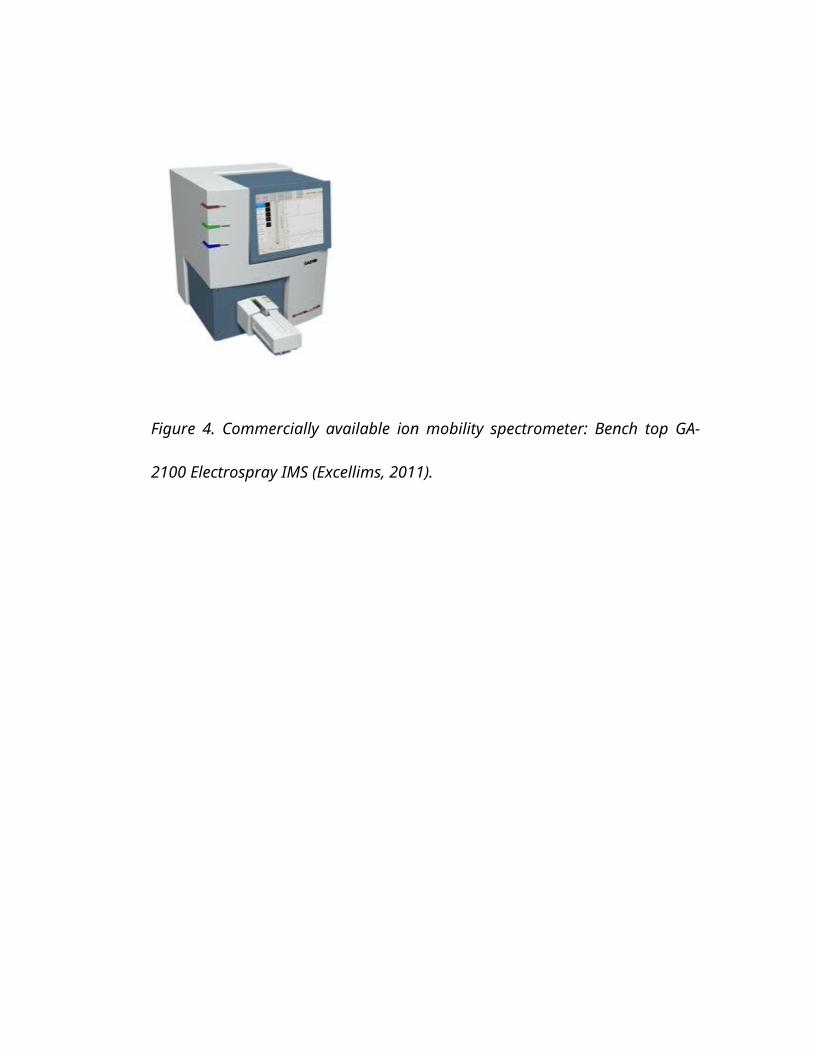
Figure 4. Commercially available ion mobility spectrometer: Bench top GA-
2100 Electrospray IMS (Excellims, 2011).

rev.udcaactual.divulg.cient. vol.15 no.2 Bogotá jul./dic. 2
012
CIENCIAS EXACTAS Y NATURALES - Artículo Técnico
ION MOBILITY SPECTROMETRY: HISTORY, CHARACTERISTICS AND APPLICATIONS
ESPECTROMETRÍA DE MOVILIDAD IÓNICA: HISTORIA, CARACTERÍSTICAS YAPLICACIONES
Roberto Fernández-Maestre1
1 Licenciado en Biología y Química, Doctor en Química Analítica, Docente del Programa de Química, Campus de Zaragocilla, Universidad de Cartagena, Cartagena, Colombia. [email protected]
Rev. U.D.C.A Act. & Div. Cient. 15(2): 467 - 479, 2012
SUMMARY
Ion mobility spectrometry (IMS) is an analytical technique that separates ions in the gas phase. Ions are separated at atmospheric pressure under the influence of an electric field, according to their size and shape. IMS is the best choice for detection of narcotics, chemical and biological warfare agents and explosives in airports and customs. IMS can detect almost anything that can be ionized and has been applied to the analysis from the lightest elements such as helium to the most complex mixtures such as proteomes, metabolomes and complete organisms such as bacteria, chiral separations, and structure determination. Although since 2000there have been approximately fifty reviews of IMS, this review is probably the only general valuation of this technique since then.
Key words: Ion mobility spectrometry, gas-phase ions, reduced mobility, ion sources.
RESUMEN

La espectrometría de movilidad iónica (IMS) es una técnica analíticaque separa iones en fase gaseosa. Los iones son separados a presión atmosférica bajo la influencia de un campo eléctrico de acuerdo a sutamaño y forma. IMS es la mejor opción para detectar narcóticos, agentes químicos y biológicos de guerra, y explosivos en aeropuertosy aduanas. IMS puede detectar casi cualquier cosa que pueda ser ionizada y se ha aplicado al análisis de elementos ligeros como el helio, mezclas más complejas como proteomas, metabolomas y organismos completos, tales como bacterias, separaciones quirales, yla determinación de estructuras. Aunque desde el año 2000 se han presentado aproximadamente cincuenta revisiones de la IMS, la presente es probablemente la única en evaluar este tema de manera general desde esa fecha y es probablemente la primera en publicarse en una revista latinoamericana.
Palabras clave: Espectrometría de movilidad iónica, iones gaseosos, movilidad reducida, fuentes de ionización.
INTRODUCTION
Ion mobility spectrometry (IMS) is an atmospheric pressure techniquefor trace analysis of gas-phase analytes. IMS separates ions in an electric field in the presence of an inert gas on the basis of theirmobilities, a measure of the size- to-charge ratio of an ion. IMS can be used for selective detection of ions after a chromatographic separation, for pre- separation of ions before mass spectrometry or,as a stand- alone instrument. Ions of organic or inorganic compounds, elements, particles and organisms can be detected. IMS isespecially sensitive to organic compounds such as illicit drugs, chemical and biological warfare agents and explosives. Analysis can be carried out in a matter of seconds; this is the reason why IMS isthe technique of choice to detect these materials at customs and in airports and has a wide use in military applications.
History: Ernest Rutherford measured the mobility of ions formed by x-ray ionization (1897) and characterized the ions using ion mobilities (1899). During the first three decades of the 20th century, there was a strong interest in mobility studies and a largebody of theory on ion kinetics and experimental data was compiled. In that period, the effect of collisions, attractive forces, temperature, pressure, accelerating voltage, and contamination on mobilities were recognized (Langevin, 1903).

In the 30's and 40's, the interest for ion mobility declined due theintroduction of mass spectrometry, which was free of the complicatedreactions present at the pressures used for mobility studies. The period 1948-1970 has been mentioned as foundational studies (Eiceman& Karpas, 2005); a number of theoretical studies in ion mobility by Mason & Schamp (1958) and McDaniel (1964) were conducted in this period, creating the base of modern IMS. In this epoch, there was a renewed interest in mobility studies made known by: a) primitive iondetectors, used by military forces during and after world word II for the detection of fuel from submarines, and other applications (Eiceman & Karpas, 2005); b) an ionization anemometer, invented by Lovelock in 1948, that was sensitive to organic vapors (Lovelock & Wasilewska, 1949) which opened the possibility of using mobility instruments for chemical analysis; and c) the construction of suitable drift tubes, such as that of Albritton and McDaniel, similar to modern drift tubes (Albritton et al. 1968).
IMS was introduced as an analytical tool by Cohen & Karasek (1970). In an ion mobility spectrometer, organic molecules are ionized and driven by an electric field against a counterflow of neutral drift gas. In their way to the detector, the ions collide multiple times with the drift gas, which reduce their speed. After each collision, ions are accelerated again by the imposed field. The alternation of accelerations and collisions results in a constant average ion velocity that depends on the ion charge, mass, and collision cross section. This dependence allows the identification of the ions by their arrival time at a downfield detector (St. Louis et al. 1989).
The second edition of a book on IMS is available (Eiceman &Karpas, 2005) and several IMS reviews have been published. Márquez-Sillero et al. (2011) assessed environmental applications of IMS, the analytical tools developed to solve the limitations regarding selectivity and sensitivity and its coupling to other detection systems; IMS coupledto gas chromatography for the sensitive and selective detection of compounds after chromatographic separation was reviewed by Kanu &Hill (2008); gas chromatography-IMS has proved versatile for the sensitive and selective detection of compounds, especially complex mixtures in difficult matrices; Kanu et al.(2008) compared and contrasted several types of ion mobility-mass spectrometers and described their advantages for application to a wide range of analytes; Johnson et al. (2007) evaluated IMS potentials in space exploration including IMS in manned space flight, the International Space Station Volatile Organic Analyzer, IMS in robotic space exploration, potential extraterrestrial missions and current/future directions and development. Finally, Weis (2005) reviewed IMS in

combination with quantum chemical calculations to determine the structure of cluster ions of metals and semi-metals; they found thatclusters of less than 100 atoms show a rich variation in shape as function of the number of atoms. Other review focused on ion sources(Guharay et al. 2008) and most others on the study of large macromolecule interactions and structure elucidation.
IMS main advantages and disadvantages are presented in table 1.
Instrumentation: The ion mobility spectrometer consists of three basic units kept at atmospheric pressure: an ionization source and an ion drift tube (Figure 1) maintained at either a positive or at anegative uniform electric field gradient, and a detector. Ions produced in the ionization source are accelerated down the electric
field where they are separated according to their mobilities in a countercurrent flow of inert gas.
Ion sources: Ionization methods to convert molecules into ions to beseparated in the drift tube in IMS include63Ni b ionization (Cohen & Karasek, 1970), photoionization (Baim et al. 1983), laser ionization (Lubman & Kronick, 1982a), corona spray ionization (Tabrizchi & Rouholahnejad, 2004), electrospray ionization (McMinn et al. 1990), andother sources (Gunzer et al. 2010). The most used are 63Ni b and electrospray ion sources.
Vapors of analyte in the ionization region are ionized directly (MALDI, UV, and laser ionization) or by reaction of the analyte withreactant ions produced by the ionization source through a series of charge transfer reactions (63Ni b, corona discharge, chemical, and electrospray ionization). The reactant ion is (H2O)nH+ when dry nitrogen (5-10 ppm of H2O) is used as the drift gas, where n is 1-4 depending on the moisture and temperature; when air is used as the drift gas, (H2O)nH+ and (H2O)nO2 - or (H2O)n(CO2)mO2
- are the reactant ions for positive and negative ion detection, respectively (Hill &Simpson, 1997).
Radioactive sources: The 63Ni foil, the ion source of the first mobility spectrometers, is a secondary ionization source analogous to that found in an electron capture detector. Ionization in this source is produced by the emission of electrons from the radioactivesource with average energies of 19 keV. These electrons collide withneutral molecules of analyte or drift gas and ionize them by a series of charge transfer reactions. 63Ni response is nonlinear, and like other charge transfer ionization sources (corona discharge and chemical ionization), reactant ions can undergo interfering reactions with contaminating compounds. These contaminating compounds include chromatographic column bleed compounds and components in the sample mixture. As reactant ions are depleted by these competing reactions, response to the compound of interest becomes erratic or is eliminated (Baim et al.1983). Other radioactive

isotope less frequently used is 241Am, that emits more energetic electrons that can exceed 5 MeV (Guharay et al. 2008). An advantage of radioactive sources is that they do not require a power supply and, consequently, are suitable for portable instruments. Disadvantages are radioactive contamination due to wrong manipulation, the need tosupply the samples in vapor phase, and bureaucratic complications due to governmental regulations.
Electrospray Ionization: The development of electrospray ionization (ESI) was successfully introduced to IMS by Hill and greatly expanded the range of compounds that could be analyzed by IMS (Hallen et al. 1989). In the ESI process, a high electric potential is applied to the needle of the sample injection syringe, which createselectric charges. Electrospray occurs when the sample liquid is drawn by a coulombic force from the needle toward the target electrode (target screen, Figure 2) that is held at a lower voltage (~3.5 kV). As it travels toward the target electrode, solvent evaporates leaving increasingly charged droplets that 'explode' due to coulombic repulsion. This process produces droplets of increasingly smaller radius, ideally culminating in molecular ions (De Hoffmann & Stroobant, 2001). Electrospray sources are ideal for liquid samples and non-volatile high molecular weight analytes. Electrospray is a soft ionization source that yields simple spectra with no fragmentation where the molecular weight can be easily determined when coupling IMS to mass spectrometry. The use of electrospray IMS as a separation and detection device has been demonstrated for explosives (Asbury et al. 2000), chemical warfare degradation products (Rearden & Harrington, 2005), and biological mixtures (Valentine et al. 1998).

Secondary electrospray ionization: (SESI) was first introduced to IMS by Hill in 2000 (Wu et al. 2000). In SESI, a usual ESI device produces solvent ions that, acting as reactant ions, ionize liquid or gaseous analytes. SESI-IMS-MS has been applied to the detection of illicit drugs, where it was found to be more sensitive than ESI-IMS-MS (Wu et al. 2000). SESI allows easy and fast sampling by applyingjets of ions with a probe and picking up the secondary ions with a second probe to specific sites on a surface; therefore, SESI can sample difficult-to-access surfaces, organelles on a cell and map and image surfaces. SESI also allows semi non-destructive analysis to evaluate valuable objects since the jet of ions exerts negligibledamage to sampled objects.
Corona-spray and corona-discharge ionization: In corona ionization, a high electric field is applied to the electrospray needle tip and the bath gas surrounding the needle ionizes. These ions react with neutral molecules, which may evaporate from the liquid at the needletip. Applications of corona ionization include O2 generation (Sabo & Matejcik, 2011) and detection of volatile organic compound (Boggio et al. 2011). Corona -spray and corona discharge are alternatives to conventional radioactive ionization; the high power consumption of DC corona discharge becomes one of the limits to usefulness in portable IMS systems for which a short pulsed corona discharge source has been developed (Yuan et al. 2005).
Matrix-assisted laser desorption ionization (MALDI): MALDI was firstcoupled to IMS by 1990 (Wyttenbach et al.1996). In MALDI, macromolecules such as proteins or DNA strands are dissolved in a solution of a small organic molecule (matrix). The solution is driedon a target and a laser pulse is applied. The matrix absorbs the laser pulse and sublimes carrying some analyte. Singly charged protonated molecules are produced during the sublimation or in the gas phase, making the analysis simpler and potentially more sensitive (De Hoffmann & Stroobant, 2001). MALDI is ideal for the determination of molecular weights and analysis of macromolecules since it does not fragment analytes.
Photoionization sources: These sources use photoionization lamps andlasers. Photoionization is achieved through the use of a short wavelength UV lamp and is an inexpensive, practical alternative to laser sources for use in an ion mobility GC detector for aromatic and other unsaturated organic compounds; their major advantage is that, by adjusting the wavelength, the analyst can selectively ionize predetermined compounds; other advantages includes the lack of reactant ions enabling the use of the entire Ion mobility

spectrum from 0 to 20m for observation of analyte Ions (Baim et al. 1983). Ultraviolet light from a NdYAG pulsed and ArF excimer lasers was used by Lubman & Kronick (1982b) at atmospheric pressure as ionization sources in an ion mobility spectrometer; they found advantages such as the production of only one peak, the molecular ion or MH+, reducing the problem of multiple peaks occurring in IMS, great sensitivity, i.e., at least down to 1 ppb for benzene, and additional means of discrimination by the use of a particular wavelength. Disadvantages of UV lamps are the moderate energies supplied that limit the ionization and the types of compounds analyzed.
Drift tube: In the drift tube, ions are separated by an electric field before entering the detector. The following description corresponds to a traditional drift tube: the drift tube is usually made of a series of stainless-steel guard rings between insulating quartz, glass, or ceramic rings (99.5% Al2O3), stacked on top of one another to form a completely enclosed tube (Figure 1). Each guard ring is connected to the next one in series through 1-MΩ or 0.5 MΩ resistors (Figure 2). A high electrical potential (~12 kV) is placedon the first guard ring, the target screen, to produce a 200-400 V/cm field throughout the drift tube (Fernández-Maestre et al. 2010a); alteration of the length of the ion separation region by addition orremoval of stainless steel rings is possible. The rings are held inside a ceramic tube (Figure 2b) that has an aperture all along itslength to introduce the electric contacts of the rings; this ceramictube is housed inside an aluminum oven for heating (Figure 2a). Previous IMS designs used round insulator beads, which produced large apertures between the guard rings; this open design allowed undesired neutral species or radicals in the tube; the introduction of the close design.
Ion gates: Once the gas-phase ions are formed in the ionization source, they are directed by the electric field down the drift tube toward the detector. On their way, they encounter sets of parallel wires that prevent the ions from continuing their migration through the spectrometer. These sets of parallel wires are called ion gates.The entrance ion gate is placed at the beginning of the drift regionand is electronically opened for a few tenths of a millisecond to permit a pulse of analyte ions to enter this region; typical pulses are 0.2m long. The gate is open (all ions pass) when each gate wire is at the potential of the drift field at that place in the drift tube and is closed (ions are stopped) when a potential higher than the drift voltage is placed between each pair of adjacent wires. After passing the gate, the ions drift with the electric field, some

faster and some slower according to their individual ion mobilities,and arrive at the collector electrode at different times. Before arriving to the detector, ions can find a second gate placed just infront of it. The purpose of this aperture grid is to shield some detectors from the inductive effects of the incoming ion cloud. Withno aperture grid, a collector electrode responds to the ion cloud before the cloud arrives at the electrode, producing a broadened ionpeak (Hill & Simpson, 1997). The aperture grid can be opened at progressively larger intervals after the entrance gate to create an ion mobility spectrum or can be opened at fixed intervals after thatgate to monitor only ions of a given mobility (Baim & Hill,1982). The use of ion gates decrease the sensitivity since they are open only a fraction of the analysis time; to increase sensitivity, Fourier Transform IMS (FTIMS) and pulsed sources have been used; in FTIMS, a second ion gate is placed close to the collector, and synchronized with the entrance gate at a rate that is continuously varied from low to high frequency. As ions migrating through the drift region of the spectrometer go in and out of phase with the oscillating gates, the ion current at the collector increases and decreases producing an interferogram; signal to noise ratio increasein FTIMS because he gates are open 50% of the time (Hill & Simpson, 1997; Eatherton et al. 1988).
Drift gases: A countercurrent of dry neutral gas is used in IMS as aclean and inert matrix through which ions drift. The drift gas also serves to keep the spectrometer drift tube clean by keeping neutral compounds, introduced with the sample or coming from the atmosphere,from passing into the drift region (Hill & Simpson, 1997). The driftgas, usually nitrogen or air, enters the bottom of the spectrometer with flow rates on the order of 0.5-1.5L/min, passes through the drift tube and exits through the ionization region (Figure 1, buffergas entrance). Helium, carbon dioxide, and argon also have been usedas drift gases; when drift gases are changed, sensitivity and resolving power change; helium was by far the most sensitive, givingnearly nine times more peak area than that seen in nitrogen; fast ions have lower resolving powers due to increased contributions fromthe ion pulse width (~0,2m) to the overall peak width, whereas for slower drifting ions, diffusion becomes the main band-spreading mechanism; when the effect of the starting pulse width was removed, the drift gases all performed nearly identically, which indicates that drift gases produce similar resolving powers (Asbury & Hill, 2000).
Carbon dioxide has been used as a drift gas when coupling IMS to supercritical fluid chromatography (SFC). Use of carbon dioxide as a

drift gas was difficult in earlier IMS experiments because it formedsuch large clusters with ions that the mobility of the ion cluster was independent of the core ion species (Ellis et al. 1976); however, when analyzing large molecules or using temperatures higher than 220°C this situation changes; it was demonstrated that the patterns of the ion mobility spectra were similar to those for nitrogen whileion drift times were considerably longer in CO2; unfortunately, theselonger drift times lead to broadening by diffusion and reduced sensitivity (Rokushika et al. 1987); also, when using unidirectional flow FTIMS as a detector for SFC and nitrogen as a drift gas, there were no differences in the mobilities of the reactant ions caused byCO2contamination, indicating that the identities of the reactant ionswere unaffected by CO2 flow (Eatherton et al.1988) maybe because the high temperature of the IMS tube did not allow clustering with CO2; for flows above 40mL/min, the signal for reactant ions decreased andeventually disappeared, which makes necessary to split the the chromatographic flow for packed columns (Morrissey & Widmer, 1991).
Doping agents: Doping agents (reagent gases) added to the drift gas control ionization and increase selectivity in IMS. When using methylene chloride as a doping agent for the detection of explosives, the negative ion Cl2selectively attaches these electronegative molecules and sensitivity increase (Lawrence & Neudorfl, 1988). In the positive ion mode, low proton affinities compounds such as normal hydrocarbons are unresponsive. To observe hydrocarbon signal, water must be purged from sample and drift gas, and a dopant agent must be added to the drift gas or a metastable helium ionization source must be used; in this source, an inert gas in the presence of a strong electric field can be excited to a metastable state through collisions with electrons from a β-source; this excited molecules can then ionize molecules with high ionization potentials (Kojiro et al. 1991). The addition of doping agents to ion mobility spectrometers to selectively ionize compoundswas first applied by Kim et al. (1978) who added ammonia to the N2 buffer gas to ionize amines. When using a very high affinity compound like NH3 as a doping agent, the selectivity increases since fewer compounds compete with ammonia for proton and only very stronggas-phase bases are detected, for example amines and drugs (Kim et al. 1978). Other doping agents used to ease analysis are carbon tetrachloride for explosives (Spangler et al. 1985) and dichloromethane, dibromomethane, methyl iodide, acetic acid, dimethyl sulfide and acetonitrile for explosives (Proctor & Todd, 1984).
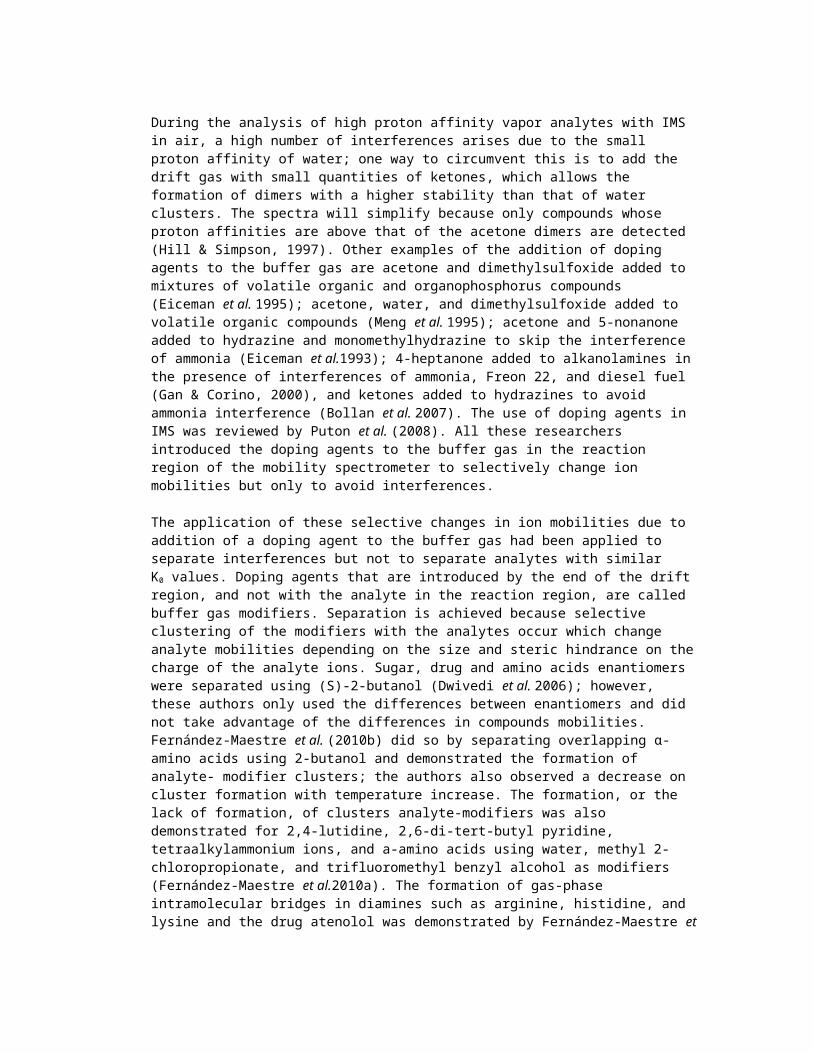
During the analysis of high proton affinity vapor analytes with IMS in air, a high number of interferences arises due to the small proton affinity of water; one way to circumvent this is to add the drift gas with small quantities of ketones, which allows the formation of dimers with a higher stability than that of water clusters. The spectra will simplify because only compounds whose proton affinities are above that of the acetone dimers are detected (Hill & Simpson, 1997). Other examples of the addition of doping agents to the buffer gas are acetone and dimethylsulfoxide added to mixtures of volatile organic and organophosphorus compounds (Eiceman et al. 1995); acetone, water, and dimethylsulfoxide added to volatile organic compounds (Meng et al. 1995); acetone and 5-nonanone added to hydrazine and monomethylhydrazine to skip the interference of ammonia (Eiceman et al.1993); 4-heptanone added to alkanolamines in the presence of interferences of ammonia, Freon 22, and diesel fuel (Gan & Corino, 2000), and ketones added to hydrazines to avoid ammonia interference (Bollan et al. 2007). The use of doping agents in IMS was reviewed by Puton et al. (2008). All these researchers introduced the doping agents to the buffer gas in the reaction region of the mobility spectrometer to selectively change ion mobilities but only to avoid interferences.
The application of these selective changes in ion mobilities due to addition of a doping agent to the buffer gas had been applied to separate interferences but not to separate analytes with similar K0 values. Doping agents that are introduced by the end of the drift region, and not with the analyte in the reaction region, are called buffer gas modifiers. Separation is achieved because selective clustering of the modifiers with the analytes occur which change analyte mobilities depending on the size and steric hindrance on thecharge of the analyte ions. Sugar, drug and amino acids enantiomers were separated using (S)-2-butanol (Dwivedi et al. 2006); however, these authors only used the differences between enantiomers and did not take advantage of the differences in compounds mobilities. Fernández-Maestre et al. (2010b) did so by separating overlapping α-amino acids using 2-butanol and demonstrated the formation of analyte- modifier clusters; the authors also observed a decrease on cluster formation with temperature increase. The formation, or the lack of formation, of clusters analyte-modifiers was also demonstrated for 2,4-lutidine, 2,6-di-tert-butyl pyridine, tetraalkylammonium ions, and a-amino acids using water, methyl 2-chloropropionate, and trifluoromethyl benzyl alcohol as modifiers (Fernández-Maestre et al.2010a). The formation of gas-phase intramolecular bridges in diamines such as arginine, histidine, and lysine and the drug atenolol was demonstrated by Fernández-Maestre et
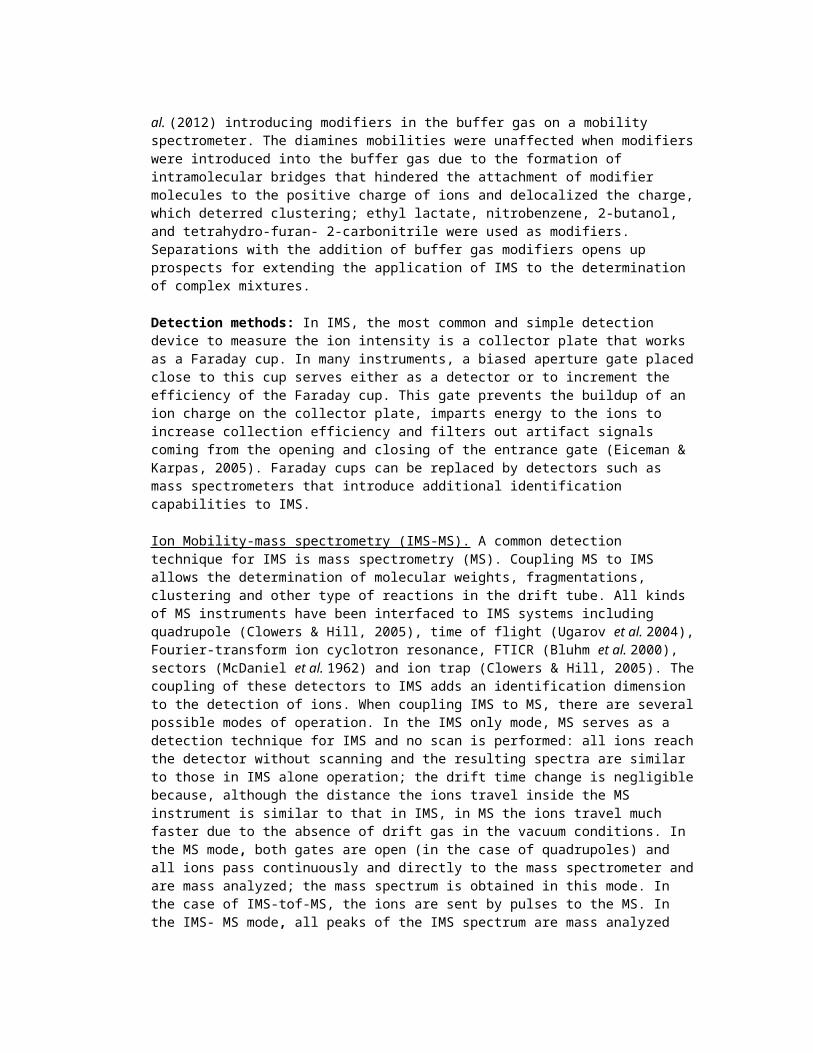
al. (2012) introducing modifiers in the buffer gas on a mobility spectrometer. The diamines mobilities were unaffected when modifierswere introduced into the buffer gas due to the formation of intramolecular bridges that hindered the attachment of modifier molecules to the positive charge of ions and delocalized the charge,which deterred clustering; ethyl lactate, nitrobenzene, 2-butanol, and tetrahydro-furan- 2-carbonitrile were used as modifiers. Separations with the addition of buffer gas modifiers opens up prospects for extending the application of IMS to the determination of complex mixtures.
Detection methods: In IMS, the most common and simple detection device to measure the ion intensity is a collector plate that works as a Faraday cup. In many instruments, a biased aperture gate placedclose to this cup serves either as a detector or to increment the efficiency of the Faraday cup. This gate prevents the buildup of an ion charge on the collector plate, imparts energy to the ions to increase collection efficiency and filters out artifact signals coming from the opening and closing of the entrance gate (Eiceman & Karpas, 2005). Faraday cups can be replaced by detectors such as mass spectrometers that introduce additional identification capabilities to IMS.
Ion Mobility-mass spectrometry (IMS-MS). A common detection technique for IMS is mass spectrometry (MS). Coupling MS to IMS allows the determination of molecular weights, fragmentations, clustering and other type of reactions in the drift tube. All kinds of MS instruments have been interfaced to IMS systems including quadrupole (Clowers & Hill, 2005), time of flight (Ugarov et al. 2004),Fourier-transform ion cyclotron resonance, FTICR (Bluhm et al. 2000), sectors (McDaniel et al. 1962) and ion trap (Clowers & Hill, 2005). Thecoupling of these detectors to IMS adds an identification dimension to the detection of ions. When coupling IMS to MS, there are severalpossible modes of operation. In the IMS only mode, MS serves as a detection technique for IMS and no scan is performed: all ions reachthe detector without scanning and the resulting spectra are similar to those in IMS alone operation; the drift time change is negligiblebecause, although the distance the ions travel inside the MS instrument is similar to that in IMS, in MS the ions travel much faster due to the absence of drift gas in the vacuum conditions. In the MS mode, both gates are open (in the case of quadrupoles) and all ions pass continuously and directly to the mass spectrometer andare mass analyzed; the mass spectrum is obtained in this mode. In the case of IMS-tof-MS, the ions are sent by pulses to the MS. In the IMS- MS mode, all peaks of the IMS spectrum are mass analyzed

continuously; this is possible because one mass spectrum can be acquired in less than one millisecond, so several MS spectra can be taken for every mobility peak; therefore, separation of all the ionswith different masses and the same mobilities can be separated. In Selected Ion Monitoring mode, the MS instrument is set to detect onedetermined mass-to-charge value; the result is an ion mobility spectrum of all ions with the specified mass.
IMS analysis: Sample introduction: Samples can be introduced in the IMS tube directly if they are in a vapor form. Liquid samples or solutions can be introduced by means of ESI, SESI, and corona spray ionization sources, or through a chromatographic instrument, and solid samples may use MALDI and thermal or laser desorption. Direct injection the environment and chloride and nitrate ions limit the capability of IMS to analyze compounds with low proton or electron affinities and introduce other unwanted reactions. Membrane inlets allow sample introduction that keep reactive molecules such as waterand ammonia out of the reaction region; membranes are common when non-purified air is used as the buffer gas such as in field measurements. Spangler & Carrico (1983) tested two membranes for sample introduction: MEM-100 dimethylsilicone and Celgard 2400 (microporous polypropylene film); non-porous membranes as dimethylsilicone were capable of reducing significantly all atmospheric contaminants except CO2; polypropylene membranes were less effective to diminish intake of reactive molecules from sampledair.
Introducing the sample using a chromatographic technique gives a second dimension for easy resolving complex mixtures. Gas chromatography (GC) was first coupled to IMS by Karasek (1970) and later was liquid chromatography, SFC, and capillary electrophoresis (Hallen et al. 1989). SFC-IMS has been applied to the determination of nicotine in tobacco (Wu et al. 1998), GC-MS for the analysis of bacteria by pyrolysis (Dworzanski et al. 2005), and liquid chromatography for analysis of carbohydrates (Lee et al. 1998).
Spectra: Spectra are graphs of intensity of the ion peaks (ion current) vs. drift time on the x axis. The zero drift time is taken asthe time the entrance gate is open (in occasions when the gate is closed) to let the ions enter the drift tube. Most of the ions are neutralized in the aperture gate, which is open only about 1% of theduty cycle. Signals are very noisy and it is necessary to average asmany as 250 spectra to obtain a clean spectrum. However, the total analysis time is less than one minute, faster than most other separation techniques (Eiceman & Karpas, 2005). Figure 3a shows a
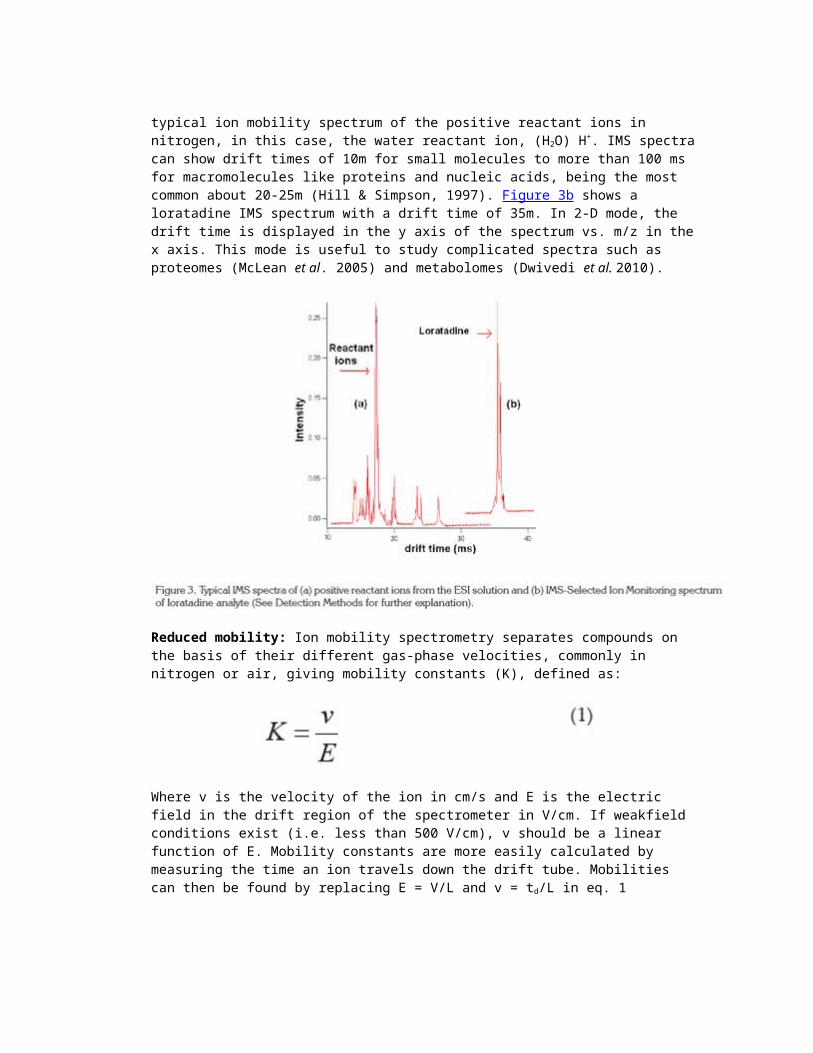
typical ion mobility spectrum of the positive reactant ions in nitrogen, in this case, the water reactant ion, (H2O) H+. IMS spectracan show drift times of 10m for small molecules to more than 100 ms for macromolecules like proteins and nucleic acids, being the most common about 20-25m (Hill & Simpson, 1997). Figure 3b shows a loratadine IMS spectrum with a drift time of 35m. In 2-D mode, the drift time is displayed in the y axis of the spectrum vs. m/z in thex axis. This mode is useful to study complicated spectra such as proteomes (McLean et al. 2005) and metabolomes (Dwivedi et al. 2010).
Reduced mobility: Ion mobility spectrometry separates compounds on the basis of their different gas-phase velocities, commonly in nitrogen or air, giving mobility constants (K), defined as:
Where v is the velocity of the ion in cm/s and E is the electric field in the drift region of the spectrometer in V/cm. If weakfield conditions exist (i.e. less than 500 V/cm), v should be a linear function of E. Mobility constants are more easily calculated by measuring the time an ion travels down the drift tube. Mobilities can then be found by replacing E = V/L and v = td/L in eq. 1

Where L is the distance the ion travels to reach the detector in centimeters, V is the total voltage drop in the drift tube that forces the ions through the drift tube in volts, and td is the time in seconds the ion takes to travel down the drift tube till the detector. To compare ion mobilities in different experimental conditions mobilities must be normalized to standard conditions obtaining the reduced mobility (in cm2 V-1 s-1):
Where P is the pressure in kPa and T the temperature in K. Factors affecting Ion mobilities at atmospheric pressure comprise mass, size, and charge (Revercomb &Mason, 1975). Reduced mobilities exhibit a mass-related temperature dependence for homologous series of compounds e.g., alcohols, carbohydrates, amines; for amines, thistemperature dependence is positive (i.e., mobility increases with increasing temperature) for low molecular mass ions, almost constantfor intermediate masses (90-180 Da) ions, and negative for heavy ions (Berant & Karpas, 1989). Reduced mobility values are reproducible to within 1-2% in different laboratories (Eiceman & Karpas, 2005); a compilation of these values has been published (Shumate et al. 1986).
Calibration: To calibrate the IMS instrument, the fact that under certain conditions the product K0t is constant can be used. This means that the reduced mobility of different analyte ions may be calculated from that of a calibrant, K0c:
where tc is the drift time of the calibrant at the specific conditions of the experiment and td is the drift time of the analyte at the same conditions (Eiceman et al. 2003). 2,4-lutidine is the

compound commonly chosen as calibrant (Berant & Karpas, 1989). This method skips the reading of barometers and eliminates the errors dueto wrong measurements of the parameters in eq. 3 but can introduce errors due to contamination of the drift tube which can produce clustering that change ion mobilities.
Tetraalkylammonium ions, 2-4, lutidine, and di-tert- butylpyridine are good standards for IMS because they produce a single peak and a very sensitive signal. Fernandez- Maestre et al. (2010a) addressed issues such as errors produced by contamination and demonstrated that 2,4-lutidine or the single use of one calibration standard could lead to errors when contamination was present; they proposed the use of a standard with a mobility affected by temperature or contamination, such as 2-4, lutidine, to detect contamination, followed by an standard unaffected by temperature or contamination (due to its low clustering tendency, such as a tetraalkylammonium salt), to be used in eq. 4. Linear calibration in IMS ranges from 10to 1,000mM. The reactant ions are consumed proportionally to the analyte concentration and their signal decrease and that of the analyte ions increase with the concentration of the analyte. At highconcentrations, analyte dimers appear and the analyte eventually consumes all available reactant ions and its signal reaches a maximum; this situation should be avoided because the quantitation characteristics of the instrument are lost; therefore, reactants ions should be always visible in the spectra (Eiceman & Karpas, 2005).
Collision cross sections: Kinetic theory yields a form for the mobility at standard temperature and pressure conditions (Mason & Schamp, 1958):
In this equation, (the Mason-Shamp equation), P is the pressure in Torr., T the temperature in °C, q the charge of the ion, N0 the gas number density at standard temperature and pressure conditions (N0 = P/kT), μ the reduced mass of an ion-drift gas pair, k the Boltzmann constant, ω the ionneutral collision cross section and α a small correction term with a magnitude of less than 0.02, when the ion mass is larger than the mass of the drift gas molecule. The reduced mass is defined as mM/(m + M) where m and M are the molecular mass of the analyte and the drift gas, respectively; this equation is useful for calculating collision cross sections of molecules,

especially important for macromolecules like proteins that can adoptdifferent conformations, which are closely related to their biological activity.
Applications of IMS: Only in this decade, commercial bench top IMS analyzers were available after decades of absence from the market. The GA-2100 Electrospray IMS is commercialized by Excellims Corporation (2011) as being "faster than HPLC... perfect for rapidlyand sensitively analyzing liquid samples... Pharmaceutical Cleaning Validation, process monitoring, and many other types of analysis". IMS has had dissimilar applications such as the detection of contaminants in food (Bota & Harrington, 2006), analysis of protein structures (Myung et al. 2006), determination of illegal drugs in humanhair (Sheibania et al. 2011), detection of moulds (Tiebe et al. 2010), identification of wood species (Lawrence et al. 1991) and detection of emissions from surfaces (Vautz et al.2006), and has been proposed as ananalytical separation tool for searching the chemical signatures of life during exploration of solar system bodies (Johnson et al. 2007).
In biology, IMS has been applied to the determination of bacteria byenzyme substrate reactions. A method add (o-nitrophenyl) galactopyranoside to cell cultures where bacterial enzymes cleave itto o-nitrophenol; this relatively high vapor pressure product can bedetected by IMS sampling the headspace of the sample (Snyder et al. 1991). Applications in medicine include the detection of drugs in breath of patients (Carstens et al. 2010), determination of methanol and ethanol in human saliva (Bocos-Bintintan et al. 2010), and volatilemetabolites to diagnose chronic obstructive pulmonary disease (Bessa et al. 2011), bronchial carcinoma (Finthammer et al.2010), and other diseases (Bunkowski et al. 2010). IMS has also been applied to the detection of acetaminophen, aspartame, bisacodyl, caffeine, dextromethorphan, diphenhydramine, famotidine, glucosamine, guaifenesin, loratadine, niacin, phenylephrine, pyridoxine, thiamin,and tetrahydrozoline in over-the-counter-drugs and aspartame and caffeine in beverages (Fernandez- Maestre & Hill, 2009). These applications could be of interest in third-world countries due to the low cost of this technique, especially for countries like Colombia where cheap and sensitive methods of medical diagnostic arerequired.
Not only are organic compounds detected by IMS but airborne molecular contamination (Shupp et al. 2007) and many inorganic species can be monitored continuously; these inorganic species include as Cl- , l- , Br- , HF, HCl, HI, HBr, NH3, NO2, HCN, PCl3, ClO2, BF3, HNO3,

F2, Br2, I2 and Cl2 (Bacon et al. 1991); this is important for the detection of dangerous leakages in industrial factories.
Ion mobility spectrometry is an analytical technique with a promising future due to increased terrorism and drug trafficking since it is the technique of choice for rapid and low cost detectionof illicit drugs and explosives. IMS portability and easy operation make it an essential tool for military, police and security personnel.
Conflicts of interest: The manuscript was prepared and revised by the author, who declares the absence of any conflict which can put the validity of the presented review in risk.
BIBLIOGRAPHY
1. ALBRITTON, D.L.; MILLER, T.M.; MARTIN, D.W.; MCDANIEL, E.W. 1968.Mobilities of mass-identified H3+ and H+ions in hydrogen. Phys. Rev. 171(1):94-102. [ Links ]
2. ASBURY, G.R.; KLASMEIER, J.; HILL, Jr. H.H. 2000. Analysis of explosives using electrospray ionization/ ion mobility spectrometry (ESI/IMS). Talanta. 50(6):1291-1298. [ Links ]
3. ASBURY, G.R.; HILL, Jr. H.H. 2000. Using different drift gases tochange separation factors (a) in ion mobility spectrometry. Anal. Chem. 72(3):580-584. [ Links ]
4. BACON, A.T.; GETZ, R.; REATEGUI, J. 1991. Ion-mobility spectrometry tackles tough process monitoring. J. Chem. Eng. Program. 87(6):61-64. [ Links ]
5. BAIM, M.A.; HILL, Jr. H.H. 1982. Tunable selective detection for capillary gas chromatography by ion mobility monitoring. Anal. Chem. 54(1):38-43. [ Links ]
6. BAIM, M.A.; EATHERTON, R.L.; HILL, Jr H.H. 1983. Ion mobility detector for gas chromatography with a direct photoionization source. Anal. Chem. 55(11):1761-1766. [ Links ]
7. BERANT, Z.; KARPAS, Z. 1989. Mass-mobility correlation of ions inview of new mobility data. J. Am. Chem. Soc. 111(11):3819-3824.[ Links ]

8. BESSA, V.; DARWICHE, K.; TESCHLER, H.; SOMMERWERCK, U.; RABIS, T.; BAUMBACH, J.I.; FREITAG, L. 2011. Detection of volatile organic compounds (VOCs) in exhaled breath of patients with chronic obstructive pulmonary disease (COPD) by ion mobility spectrometry. Int. J. Ion Mob. Spectrom. 14(1):7-13. [ Links ]
9. BLUHM, B.K.; GILLIG, K.J.; RUSSELL, D.H. 2000. Development of a Fourier-transform ion cyclotron resonance mass spectrometer-ion mobility spectrometer. Rev. Sci. Instrum. 71(11):4078-4086.[ Links ]
10. BOCOS-BINTINTAN, V.; MOLL, V.H.; FLANAGAN, R.J.; THOMAS, C.L.P. 2010. Rapid determination of alcohols in human saliva by gas chromatography differential mobility spectrometry following selective membrane extraction. Int. J. Ion Mob. Spectrom. 13(2):55-63. [ Links ]
11. BOGGIO, N.G.; PIERPAULI, K.; RINALDI, C.A.; LAMAGNA, A. 2011. Detection of volatile organic compound with an ion mobility spectrometry cell type device with a corona discharge ionization source. Sensor Lett. 9(2):866-868. [ Links ]
12. BOLLAN, H.R.; STONE, J.A.; BROKENSHIRE, J.L.; RODRIGUEZ, M.R.; EICEMAN, G.A. 2007. Mobility resolution and mass analysis of ions from ammonia and hydrazine complexes with ketones formed in air at ambient pressure. J. Am. Soc. Mass Spectrom. 18(5):940-951.[ Links ]
13. BOTA, G.M.; HARRINGTON, P.B. 2006. Direct detection of trimethylamine in meat food products using ion mobility spectrometry. Talanta 68(3):629-635. [ Links ]
14. BUNKOWSKI, A.; MADDULA, S.; DAVIES, A.N.; WESTHOFF, M.;LITTERST,P.; BÖDEKER, B.; BAUMBACH, J.I. 2010. One year time series of investigations of analytes within human breath using ion mobility spectrometry. Int. J. Ion Mobil. Spectrom. 13(3-4):141-148.[ Links ]
15. CARSTENS, E.T.H.; HIRN, A.; QUINTEL, M.; NOLTE, J.; JÜNGER, M.; PERL, T.; VAUTZ, W. 2010. Online determination of serum propofol concentrations by expired air analysis. Int. J. Ion Mob. Spectrom. 13(1):37-40. [ Links ]
16. CLOWERS, B.H.; HILL, H.H. 2005. Mass analysis of mobility-selected ion populations using dual gate, ion mobility, quadrupole

ion trap mass spectrometry. Anal. Chem. 77(18):5877-5885.[ Links ]
17. COHEN, M.J.; KARASEK, F.W. 1970. Plasma chromatography - a new dimension for gas chromatography and mass spectrometry. J. Chromatogr. Sci. 8(6):330-337. [ Links ]
18. DE HOFFMANN, E.; STROOBANT, V. 2001. Mass spectrometry: principles and applications. 3rd edition. John Wiley and Sons. 493p.[ Links ]
19. DWIVEDI, P.; WU, C.; MATZ, L.M.; CLOWERS, B.H.; SIEMS, W.F.; HILL, Jr. H.H. 2006. Chiral separation by ion mobility spectrometry.Anal. Chem. 78(24):8200- 8206. [ Links ]
20. DWIVEDI, P.; PUZON, G.; TAM, M.; LANGLAIS, D.; JACKSON, S.; KAPLAN, K.; SIEMS, W.F.; HILL, H.H. 2010. Metabolic profiling of Escherichia coli by ion mobility-mass spectrometry with MALDI ion source. J. Mass Spectrom. 45(12):1383-1393. [ Links ]
21. DWORZANSKI, J.P.; TRIPATHI, A.; SNYDER, A.P.; MASWDEH, W.M.; WICK, C.H. 2005. Novel biomarkers for Gram-type differentiation of bacteria by pyrolysis-gas chromatography-mass spectrometry. J. Anal.Appl. Pyrolysis 73(1):29-38. [ Links ]
22. EATHERTON, R.L.; MORRISSEY, M.A.; HILL, H.H. 1988. Comparison ofion mobility constants of selected drugs after capillary gas chromatography and capillary supercritical fluid chromatography. Anal. Chem. 60(20):2240-2243. [ Links ]
23. EICEMAN, G.A.; SALAZAR, M.R.; RODRIGUEZ, M.R.; LIMERO, T.F.; BECK, S.W.; CROSS, J.H.; YOUNG, R.; JAMES, J.T. 1993. Ion mobility spectrometry of hydrazine, monomethylhydrazine, and ammonia in air with 5-nonanone reagent gas. Anal. Chem. 65(13):1696-1702.[ Links ]
24. EICEMAN, G.A.; WANG, Y.F.; GARCIA-GONZALEZ, L.; HARDEN, C.S.; SHOFF, D.B. 1995. Enhanced selectivity in ion mobility spectrometry analysis of complex mixtures by alternate reagent gas chemistry. Anal. Chim. Acta 306(1):21-33. [ Links ]
25. EICEMAN, G.A.; NAZAROV, E.G.; STONE, J.A. 2003. Chemical standards in ion mobility spectrometry. Anal. Chim. Acta 493(2):185-194. [ Links ]

26. EICEMAN, G.A.; KARPAS, Z. 2005. Ion mobility spectrometry. 2nd edition. Boca Raton: FL.CRC Press. 350p. [ Links ]
27. ELLIS, H.W.; PAI, R.Y.; GATLAND, I.R.; MCDANIEL, E.W.; WERNLUND,R.; COHEN, M.J. 1976. Ion identity and transport properties in CO2 over a wide pressure range. J. Chem. Phys. 64(10):3935-3941.[ Links ]
28. EXCELLIMS CORPORATION. 2011. Available in internet in: http://www.excellims.com Accessed on 12/2/2011.[ Links ]
29. FERNÁNDEZ-MAESTRE, R.; HILL Jr., H.H. 2009. Ion mobility spectrometry for the rapid analysis of over- the-counter drugs and beverages. Int. J. Ion Mob. Spectrom. 12(1):3-14. [ Links ]
30. FERNÁNDEZ-MAESTRE, R.; HARDEN, C.S.; EWING, R.G.; CRAWFORD, C.L.; HILL Jr., H.H. 2010a. Chemical standards in ion mobility spectrometry. Analyst 135(6):1433-1442. [ Links ]
31. FERNÁNDEZ-MAESTRE, R.; WU, C.; HILL, H.H. 2010b. Using a buffer gas modifier to change separation selectivity in ion mobility spectrometry. Int. J. Mass Spectrom. 298(1-3):2-9. [ Links ]
32. FERNÁNDEZ-MAESTRE, R.; WU, C.; HILL Jr., H.H. 2012. Buffer gas modifiers effect resolution in ion mobility spectrometry through selective ion-molecule clustering reactions. Rap. Comm. Mass Spectrom. Accepted. [ Links ]
33. FINTHAMMER, M.; BEIERLE, C.; FISSELER, J.; KERN-ISBERNER, G.; BAUMBACH, J.I. 2010. Using probabilistic relational learning to support bronchial carcinoma diagnosis based on ion mobility spectrometry. Int. J. Ion Mob. Spectrom. 13(2):83- 93.[ Links ]
34. GAN, T.H.; CORINO, G.T. 2000. Selective detection of alkanolamine vapors by ion mobility spectrometry with ketone reagentgases. Anal. Chem. 72(4):807- 815. [ Links ]
35. GUHARAY, S.K.; DWIVEDI, P.; HILL, H.H. 2008. Ion mobility spectrometry: ion source development and applications in physical and biological sciences. IEEE T. Plasma Sci. 36(4):1458-1470.[ Links ]

36. GUNZER, F.; ULRICH, A.; BAETHER, W. 2010. A novel non-radioactive electron source for ion mobility spectrometry. Int. J. Ion Mob. Spectrom. 13(1):9-16. [ Links ]
37. HALLEN, R.W.; SHUMATE, C.B.; SIEMS, W.F.; TSUDA, T.; HILL, H.H. 1989. Preliminary investigation of ion mobility spectrometry after capillary electrophoretic introduction. J. Chromatogr. A. 480:233-245. [ Links ]
38. HILL, Jr., H.H.; SIMPSON, G. 1997. Capabilities and limitations of ion mobility spectrometry for field screening applications. J. Field Anal. Chem. Technol. 1(3):119-134. [ Links ]
39. JOHNSON, P.V.; BEEGLE, L.W.; KIM, H.I.; EICEMAN, G.A.; KANIK, I.2007. Ion mobility spectrometry in space exploration. Int. J. Mass Spectrom. 262(1- 2):1-15. [ Links ]
40. KANU, A.B.; HILL Jr., H.H. 2008. Ion mobility spectrometry detection for gas chromatography. J. Chromatogr. A. 1177(1):12-27.[ Links ]
41. KANU, A.B.; DWIVEDI, P.; TAM, M.; MATZ, L.; HILL, H.H. Jr. 2008.Ion mobility-mass spectrometry. J. Mass Spectrom. 43(1):1-22.[ Links ]
42. KARASEK, F.W 1970. Drift-mass spectrometer. Res. Develop. 21(12):25 (cited in KARASEK F.W 1972. Trace analysis and fundamentalstudies by plasma chromatography. Int. J. Environ. Anal. Chem. 21(12):157-166. [ Links ]
43. KIM, S.H.; KARASEK, F.W.; ROKUSHIKA, S. 1978. Plasma chromatography with ammonium reactant ions. Anal. Chem. 50(1):152-155. [ Links ]
44. KOJIRO, D.R.; COHEN, M.J.; STIMAC, R.M.; WERNLUND, R.F.; HUMPHRY, D.E.; NORISHIGE, T. 1991. Determination of C1-C4 alkanes byion mobility spectrometry. Anal. Chem. 63(20):2295- 2300.[ Links ]
45. LANGEVIN, P. 1903. L'ionization des gaz. Ann. Chim. Phys. 28:289-384. [ Links ]
46. LAWRENCE, A.H.; NEUDORFL, P. 1988. Detection of ethylene glycol dinitrate vapors by ion mobility spectrometry using chloride reagentions. Anal. Chem. 60(2):104-109. [ Links ]

47. LAWRENCE, A.H.; BARBOUR, R.J.; SUTCLIFFE, R. 1991. Identification of wood species by ion mobility spectrometry. Anal. Chem. 63(13):1217-1221. [ Links ]
48. LEE, D-S.; WU, C.; HILL Jr., H.H. 1998. Detection of carbohydrates by electrospray ionization - ion mobility spectrometryfollowing microbore high- performance liquid chromatography. J. Chromatogr. A. 822(1):1-9. [ Links ]
49. LOVELOCK, J.E.; WASILEWSKA, E.M. 1949. An ionisation anemometer.J. Sci. Instr. 26(11):367-370. [ Links ]
50. LUBMAN, D.M.; KRONICK, M.N. 1982a. Plasma chromatography with laser-produced ions. Anal. Chem. 54(9):1546-1551. [ Links ]
51. LUBMAN, D.M.; KRONICK, M.N. 1982b. Discrimination of isomers of xylene by resonance enhanced two- photon ionization. Anal. Chem. 54(13):2289-2291. [ Links ]
52. MÁRQUEZ-SILLERO, I.; AGUILERA-HERRADOR, E.; CÁRDENAS; S.; VALCÁRCEL, M. 2011.Ion-mobility spectrometry for environmental analysis. TrAC Trends Anal. Chem. 30(5):677. [ Links ]
53. MASON, E.A.; SCHAMP, Jr. H.W. 1958. Mobility of gaseous ions in weak electric fields. Ann. Phys. 4(3):233-270. [ Links ]
54. McDANIEL, E.W.; MARTIN, D.W.; BARNES, W.S. 1962. Drift-tube massspectrometer for studies of low- energy ion-molecule reactions. Rev.Sci. Instr. 33(1):2-7. [ Links ]
55. McDANIEL, E.W. 1964. Collisional phenomena in ionized gases, NewYork: Wiley. 242p. [ Links ]
56. McLEAN, J.A.; RUOTOLO, B.T.; GILLIG, K.J.; RUSSELL, D.H. 2005. Ion mobility-mass spectrometry: a new paradigm for proteomics. Int. J. Mass Spectrom. 240(3):301-315. [ Links ]
57. McMINN, D.G.; KINZER, J.A.; SHUMATE, C.B.; SIEMS, W.F.; HILL Jr., H.H. 1990. Ion mobility detection following liquid chromatographic separation. J. Microcolumn Sep. 2(4):188-192.[ Links ]
58. MENG, Q.; KARPAS, Z.; EICEMAN, G.A. 1995. Monitoring indoor ambient atmospheres for volatile organic compounds using an ion
mobility analyzer array with selective chemical ionization. Int. J. Environ. Anal. Chem. 61(2):81-94. [ Links ]
59. MORRISSEY, M.A.; WIDMER, H.M. 1991. Ion-mobility spectrometry asa detection method for packed- column supercritical fluid chromatography. J. Chromatogr. 552:551-561. [ Links ]
60. MYUNG, S.; WISEMAN, J.M.; VALENTINE, S.J.; TAKATS, Z.; COOKS, R.G.; CLEMMER, D.E. 2006. Coupling desorption electrospray ionization with ion mobility / mass spectrometry for analysis of protein structure: evidence for desorption of folded and denatured states. J. Phys. Chem. B 10 (10):5045-5051. [ Links ]
61. PROCTOR; C.J.; TODD, J.F.J. 1984. Alternative reagent ions for plasma chromatography. Anal. Chem. 56(11):1794-1797.[ Links ]
62. PUTON, J.; NOUSIAINEN, M.; SILLANPAA, M. 2008. Ion mobility spectrometers with doped gases. Talanta 76(5):978-987.[ Links ]
63. REARDEN, P.; HARRINGTON, P.B. 2005. Rapid screening of precursorand degradation products of chemical warfare agents in soil by solid-phase microextraction ion mobility spectrometry (SPME-IMS). Anal. Chim. Acta 545(1):13-20. [ Links ]
64. REVERCOMB, H.E.; MASON, E.A. 1975. Theory of plasma chromatography/ gaseous electrophoresis. Anal. Chem. Rev. 47(7):970-983. [ Links ] [ Links ]
66. RUTHERFORD, E. 1897. The velocity and rate of recombination of the ions of gases exposed to Rontgen radiation. Phil. Mag. 44(270):422-440. [ Links ]
67. RUTHERFORD, E. 1899. Uranium radiation and the electrical conduction produced by it. Phil. Mag. 47(284):109-163.[ Links ]
68. SABO, M.; MATEJCIK, S. 2011. Ion mobility spectrometry for monitoring high-purity oxygen. Anal. Chem. 83(6):1985-1989.[ Links ]
69. SHEIBANIA, A.; TABRIZCHI, M.; GHAZIASKAR, H.S. 2011. Determination of methadone in human hair by headspace extraction and

ion mobility spectrometry. Anal. Lett. 44(4):667-675.[ Links ]
70. SHUMATE, C.B.; ST. LOUIS, R.H.; HILL Jr., H.H. 1986. Table of reduced mobility values from ambient pressure ion mobility spectrometry. J. Chromatogr. 373:141-173. [ Links ]
71. SHUPP, A.M.; RODIER, D.; ROWLEY, S. 2007. Monitoring airborne molecular contamination: a quantitative and qualitative comparison of real-time and grab- sampling techniques. Proc. SPIE, the International Society for Optical Engineering 6518, 65183Z. doi:10.1117/12.707776. [ Links ]
72. SNYDER, A.P.; SHOFF, D.B.; EICEMAN, G.A.; BLYTH, D.A.; PARSONS, J.A. 1991. Detection of bacteria by ion mobility spectrometry. Anal.Chem. 63(5):526- 529. [ Links ]
73. SPANGLER, G.E.; CARRICO, J.P. 1983. Membrane inlet for ion mobility spectrometry. Int. J. Mass Spectrom. Ion Phys. 52(2-3):267-287. [ Links ]
74. SPANGLER, G.E.; CAMPBELL, D.N.; CARRICO, J.P. 1985. Recent Advances in ion mobility spectrometry for explosives vapor detection. J. Test Eval. 13(3):234- 241. [ Links ]
75. ST. LOUIS, R.H.; SIEMS, W.F.; HILL Jr., H.H. 1989. Evaluation ofdirect axial sample introduction for ion mobility detection after capillary gas chromatography. J. Chromatogr. 479(2):221-231.[ Links ]
76. ST. LOUIS, R.H.; HILL, Jr.; H.H.; EICEMAN, G.A. 1990. Ion mobility spectrometry in analytical chemistry. CRC Cr. Rev. Anal. Chem. 21(5):321-355. [ Links ]
77. TABRIZCHI, M.; ROUHOLAHNEJAD, F. 2004. Corona discharge ion mobility spectrometry at reduced pressures. Rev. Sci. Instr. 75(11):4656-4662. [ Links ]
78. TIEBE, C.; HÜBERT, T.; KOCH, B.; RITTER, U.; STEPHAN, I. 2010. Investigation of gaseous metabolites from moulds by ion mobility spectrometry (IMS) and gas chromatography-mass spectrometry (GC-MS).Int. J. Ion Mob. Spectrom. 13(1):17-24. [ Links ]
79. UGAROV, M.V.; EGAN, T.; KHABASHESKU, D.V.; SCHULTZ, J.A.; PENG, H.; KHABASHESKU, V.N.; FURUTANI, H.; PRATHER, K.S.; WANG, J.H.W.;
JACKSON, S.N.; WOODS, A.S. 2004. MALDI matrices for biomolecular analysis based on functionalized carbon nanomaterials. Anal. Chem. 76(22):6734-6742. [ Links ]
80. VALENTINE, S.J.; COUNTERMAN, A.E.; HOAGLUND, C.S.; REILLY, J.P.;CLEMMER, D.E. 1998. Gas-phase separations of protease digests. J. Am. Soc. Mass Spectrom. 9(11):1213-1216. [ Links ]
81. VAUTZ, W.; BAUMBACH, J.I.; UHDE, E. 2006. Detection of emissionsfrom surfaces using ion mobility spectrometry. Anal. BioAnal. Chem. 384(4):980-986. [ Links ]
82. WEIS, P. 2005. Structure determination of gaseous metal and semi-metal cluster ions by ion mobility spectrometry. Int. J. Mass Spectrom. 245(1-3):1-13. [ Links ]
83. WU, C.; SIEMS, W.F.; HILL Jr., H.H.; HANNAN, R.M. 1998. Analytical determination of nicotine in tobacco by supercritical fluid chromatography-ion mobility detection. J. Chromatogr. A. 811(1-2):157-161. [ Links ]
84. WU, C.; SIEMS, W.F.; HILL Jr., H.H. 2000. Secondary electrosprayionization ion mobility spectrometry/ mass spectrometry of illicit drugs. Anal. Chem. 72(2):396-403. [ Links ]
85. WYTTENBACH T.; VON HELDEN G.; BOWERS M.T. 1996. Gas-phase conformation of biological molecules:  bradykinin. J. Am. Chem. Soc. 118(35):8355-8364 [ Links ]
86. YUAN, A.; ALIAGA-ROSSEL, R.; CHOI, P.; GILLES, J.P. 2005. Development of a short pulsed corona discharge ionization source forion mobility spectrometry. Rev. Sci. Instr. 76(8):085105-085105-6.[ Links ]