Metabolomic analysis on the toxicological effects of TiO2 ...
Upload
mpi-inf-mpgCategory
view
1download
0
Metabolites 2012, 2, 733-755; doi:10.3390/metabo2040733
metabolitesISSN 2218-1989
www.mdpi.com/journal/metabolites/ Review
Computational Methods for Metabolomic Data Analysis of Ion Mobility Spectrometry Data—Reviewing the State of the Art
Anne-Christin Hauschild 1,2,*, Till Schneider 1,2, Josch Pauling 1,2, Kathrin Rupp 3, Mi Jang 3,
Jörg Ingo Baumbach 3 and Jan Baumbach 1,2,4,*
1 Computational Systems Biology Group, Max Planck Institute for Informatics, D-66123,
Saarbrücken, Germany 2 Cluster of Excellence for Multimodal Computing and Interaction,Saarland University, D-66123
Saarbrücken, Germany 3 Department Microfluidics and Clinical Diagnostics, KIST Europe-Korea Institute of Science and
Technology Europe, Campus E7.1, D-66123, Saarbrücken, Germany 4 Computational Biology group, Department of Mathematics and Computer Science, University of
Southern Denmark, DK-5230, Odense, Denmark
* Authors to whom correspondence should be addressed; E-Mails: [email protected]
(A.C.H.); [email protected] (J.B.); Tel.: +49 681 302-70885 (A.C.H.); Fax: +49 681
9325 399. (A.C.H.); Tel.: +49 681 302 70880 (J.B.); Fax: +49 681 9325 399 (J.B.).
Received: 8 August 2012; in revised form: 24 September 2012 / Accepted: 25 September 2012 /
Published: 16 October 2012
Abstract: Ion mobility spectrometry combined with multi-capillary columns (MCC/IMS)
is a well known technology for detecting volatile organic compounds (VOCs). We may
utilize MCC/IMS for scanning human exhaled air, bacterial colonies or cell lines, for
example. Thereby we gain information about the human health status or infection threats.
We may further study the metabolic response of living cells to external perturbations. The
instrument is comparably cheap, robust and easy to use in every day practice. However, the
potential of the MCC/IMS methodology depends on the successful application of
computational approaches for analyzing the huge amount of emerging data sets. Here, we
will review the state of the art and highlight existing challenges. First, we address methods
for raw data handling, data storage and visualization. Afterwards we will introduce
de-noising, peak picking and other pre-processing approaches. We will discuss statistical
methods for analyzing correlations between peaks and diseases or medical treatment.
Finally, we study up-to-date machine learning techniques for identifying robust biomarker
OPEN ACCESS

Metabolites 2012, 2
734
molecules that allow classifying patients into healthy and diseased groups. We conclude
that MCC/IMS coupled with sophisticated computational methods has the potential to
successfully address a broad range of biomedical questions. While we can solve most of
the data pre-processing steps satisfactorily, some computational challenges with statistical
learning and model validation remain.
Keywords: ion mobility spectrometry; clinical diagnostics; peak detection; statistics;
statistical learning methods; metabolomics; volatile organic compounds
1. Introduction
Ion mobility spectrometers combined with a multi-capillary column (MCC/IMS) are well known for
detecting volatile organic compounds (VOCs). Initially developed for military purposes, nowadays
they are used for various applications: process control in chemical or petro industry or scanning human
exhaled air/breath, bacterial colonies or cell lines for example. The combination of the MCC/IMS
methodology and sophisticated computational approaches has the potential to successfully address a
broad range of biomedical questions. On the one hand, building statistical models for disease
prediction and identification of biomarkers, and on the other hand, determining cell states and
metabolic responses of microorganisms or the assessment of food quality.
1.1. Overview: Ion Mobility Spectrometry
There are several analytical detection methods for human breath investigations. The major
spectrometric methods currently employed are gas chromatography-mass spectrometry (GC/MS) [1–4], solid phase micro extraction-gas chromatography coupled with mass spectrometry
(SPME-GC/MS) [1,5,6], electronic noses [7–10], proton transfer reaction-mass spectrometry
(PTR-MS) [11,12] and ion mobility spectrometry (IMS) [13–19]. The real time analysis
(e.g. PTR-MS, IMS) has the advantage that no pre-concentration step is needed [20]. Sampling is
achieved directly by using Tedlar bags [21–23], needle traps [24], SPME [5,25], sample loops [26] and
different adsorbents. They are all non-invasive and should provide early and fast diagnosis or therapy
monitoring for the identification of disease-specific biomarkers in the patients’ breath.
Ion mobility spectrometry is a method to detect volatile organic compounds (VOCs). The first IMS
instruments, created in the early 1970s, were originally used for military applications [27,28]. Further
IMS were used to detect drugs or explosives, e.g. at airports. With the growing importance of
metabolomics, the focus changed, and today IMS is also used in medical applications. Through
combination of the IMS with multi capillary columns (MCC), many possible application opportunities
arise. The main advantages of this method are the short time required to collect a sample (about 10 s),
the non-invasive nature of the method, the use of easily obtainable exhaled breath, and the robust and
easy handling in every day practice. The MCC/IMS based on BioScout was developed by B&S
Analytik (Dortmund, Germany) for medical [29,30] and biomedical [31] applications as well as for
process analysis [14].

Metabolites 2012, 2
735
The time needed to acquire a single spectrum takes only 10 ms to 100 ms [32]. To receive a
MCC/IMS chromatogram a certain setup of the MCC/IMS is needed. Driven by the carrier gas the
analytes first reach the MCC, where the pre-separation takes place. In this column there are approx.
1.000 parallel capillaries, each with a film thickness of 200 nm and an inner diameter of 40 µm. In
general the OV-5 phase (5% Phenyl / 95% Dimethyl Polysiloxan) is used [30]. After passing the MCC,
the analytes reach the ionization chamber, where they become chemically ionized by collisions with
ionized carrier gas molecules. The carrier gas molecules were previously ionized by a radioactive
ionization source (63Ni) and from so-called reactant ions. After the chemical ionization, the resulting
product ions enter the drift region when the ion shutter is open (Figure 1). In this region, an external
electric field is applied. A so-called drift gas will flow from the Faraday-Plate towards the ions; neutral
molecules cannot enter the drift region and the ionized molecules will gain energy from the electric
field and soon reach a steady drift velocity by collision with neutral drift gas molecules. That means
that all molecules are, in an ideal case, totally separated when they reach the Faraday-Plate. In the end,
a spectrum is generated, which is called ion mobility spectrum. The accumulation of all IMS spectra
pre-separated by the MCC is called IMS chromatogram.
Figure 1. Working principle of an Ion Mobility Spectrometer.
1.2. Outline
The present paper gives an overview of the state of the art data processing, data mining and
evaluation methods, used for the analysis of MCC/IMS chromatograms. Figure 2 depicts the workflow
of the processing pipeline handling the MCC/IMS data. The first step is the data collection in
laboratories and hospitals, both the results of the diagnostic technique analyzing human breath, as well
as additional information (e.g., age, gender, medication, medium of the bacterial strain, various
diagnostic techniques, etc.). The next step is the pre-processing of the chromatograms, enhancing the
quality (e.g., de-noising, smoothing) and detecting the VOC areas (peaks). The results are verified

Metabolites 2012, 2
736
using the available visualization tools. The pre-processed data is subsequently accumulated in a
centralized data repository, e.g., a database. Furthermore, the additional information of the organism is
prepared to be included into the system. Statistical techniques like Mann-Whitney U test and principal
component analysis as well as statistical learning methods, e.g., decision tree and support vector
machines are applied to find biomarkers. The biomarkers are verified in the wet lab. They may later be
used for disease prediction and disease specific pathway analysis.
Each step of the workflow will be explained in the following chapters of this review. We start with
a recap of the data format, the visualization and a detailed explanation of the different preprocessing
steps: RIP detailing, smoothing, de-noising and peak finding. In addition, an introduction to the
existing databases and the future requirements is given. Section three depicts the studies using
statistical techniques like Mann-Whitney U test, correlation and principle component analysis. We
continue with a description of the statistical learning methods applied to MCC/IMS data sets in section
four. Finally, we will sum up, illuminate unsolved problems, and provide potential solutions.
Figure 2. Workflow of the data processing, data mining and evaluation methods used in
clinical breath diagnostics.

Metabolites 2012, 2
737
2. First Steps with IMS Data
2.1. Data Format
Over the years, the central question that has motivated the application of IMS and MCC/IMS
devices has changed from “Is a particular analyte present?” (detection of explosives, drugs, and
chemical warfare agents) to “Which analytes are present in which concentration?” (biomedical on-site
analysis, drug monitoring, disease fingerprinting) [33]. This leads to utilizing computational and
bioinformatical techniques, which are explained throughout the following sections. A broader area of
application comes with new requirements in terms of tracking experimental conditions, since this may
influence not only the measurement itself, but also its interpretation and give vital information for
further data processing, such as the combined analysis of data from different studies. Thus, a
sophisticated uniform data format is required, which stores not only the data itself but also
experimental and technical conditions. Vautz et al. proposed such a standard file format [33]. It
consists of a header and the data matrix. The header comprises all sampling conditions such as general
information, sample information, IMS (device) information, external sampling control, and statistics.
They also provide standard nomenclature rules and an extension that is dedicated to sensor-controlled
sampling. For details, please refer to supplementary material of Vautz et al. [33]. A later, related
publication by Maddula et al. suggests an extension to the standard file format, which allows
cross-linking gas chromatography/mass selective detector (GC/MSD) data with MCC/IMS data [34].
2.2. Visualization
Several software tools are available for the visualization of IMS-chromatograms. The software
package IPHEX (by A. Bunkowski, University Bielefeld, Germany) supports the visualization
including single spectra and total ion current of the MCC [35]. The commercial software package
VisualNow (B&S Analytik, Dortmund, Germany), which is implemented in Java, is another state of
the art software tool. It provides the ability to show two- and three-dimensional plots of the whole IMS
chromatogram as well as all technical parameters. The acquired data of the MCC/IMS file includes a
set of parameters describing the measurements, experimental setup and a set of single spectra at
different retention times, see Section 2.1 for more details [36]. In both software tools the
IMS-chromatogram of the selected data file is plotted as a two-dimensional picture, e.g., VisualNow
plot shown in Figure 3 (a).
In the MCC/IMS-chromatogram the X-axis represents the reduced inverse mobility
1/Ko (Vs/cm2) and the Y-axis shows the retention time (s). The reduced inverse mobility is
proportional to the drift time. Moreover, in order to compare spectra obtained using different
experimental conditions the value is normalized by temperature and pressure [37]. The signal height is
the signal from the Faraday plate of the IMS device. In general, the so-called intensity is color-coded
in both plots, whereby the yellow color means the highest signal and the white color the lowest. In the
three-dimensional plot the Z-axis expresses the intensity [38]. In order to compare or show single
spectra of different peaks, a spectrum can be selected and shown in a separate plot, which can be
examined visually.
Metabolites 2012, 2
738
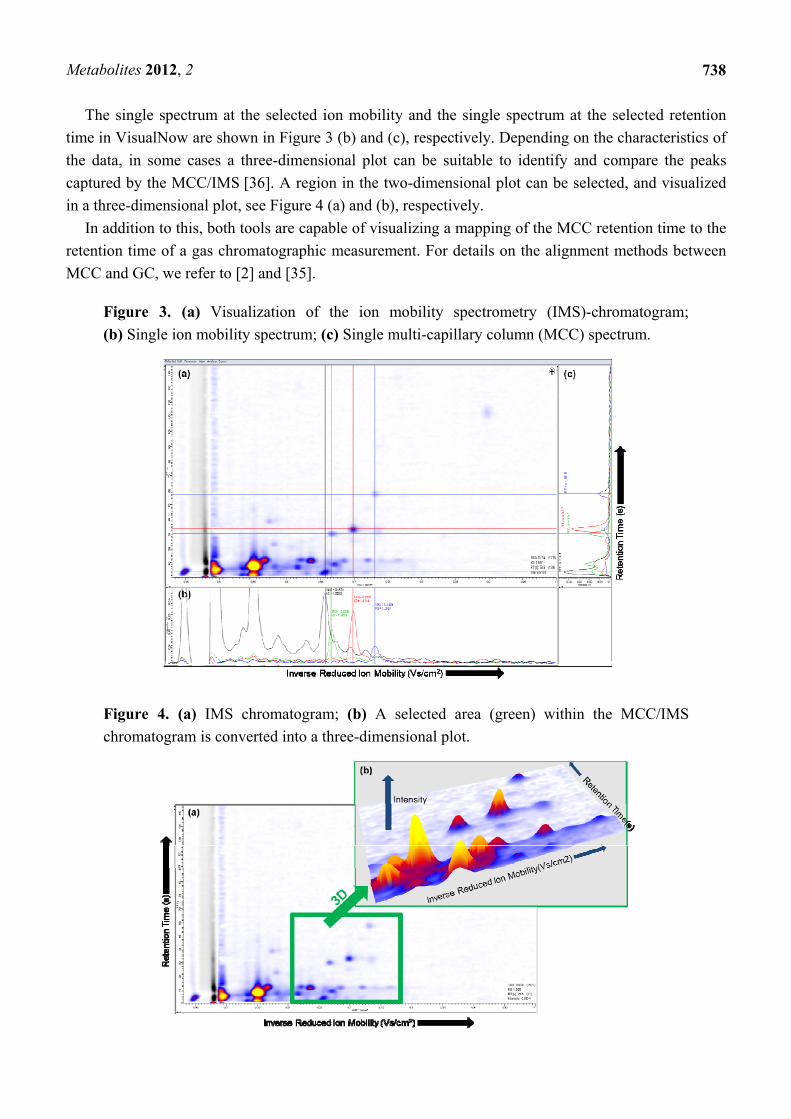
The single spectrum at the selected ion mobility and the single spectrum at the selected retention
time in VisualNow are shown in Figure 3 (b) and (c), respectively. Depending on the characteristics of
the data, in some cases a three-dimensional plot can be suitable to identify and compare the peaks
captured by the MCC/IMS [36]. A region in the two-dimensional plot can be selected, and visualized
in a three-dimensional plot, see Figure 4 (a) and (b), respectively.
In addition to this, both tools are capable of visualizing a mapping of the MCC retention time to the
retention time of a gas chromatographic measurement. For details on the alignment methods between
MCC and GC, we refer to [2] and [35].
Figure 3. (a) Visualization of the ion mobility spectrometry (IMS)-chromatogram;
(b) Single ion mobility spectrum; (c) Single multi-capillary column (MCC) spectrum.
Figure 4. (a) IMS chromatogram; (b) A selected area (green) within the MCC/IMS
chromatogram is converted into a three-dimensional plot.

Metabolites 2012, 2
739
2.3. Pre-processing
A MCC/IMS measurement typically consists of more than a million three-dimensional data points
indicating signal intensities. Furthermore, there is a characteristic signal structure found in all IMS
spectra of a chromatogram that is known as the reactant ion peak (RIP). The RIP is generally the
highest and broadest peak and appears in the shape of a broad vertical line on the chromatogram
(Figure 5). The signal descent on the right side of the RIP is called RIP tailing (Figure 5). RIP tailing
can be considered as a source of disturbance. For this reason, Bader et al. performed RIP de-tailing by
fitting a lognormal function to the mean of all spectra and subtracting this function from each spectrum
in the chromatogram [39]. Bunkowski achieved RIP de-tailing by subtracting the 25% quantile
intensity determined for each 1/K0 value over all spectra [40].
Besides RIP tailing, the random fluctuation in the signals, casually called noise, affects the ability to
distinguish low intensity signals. Basically, all signal and non-signal (background) parts of a spectrum
are overlaid by noise. Therefore, the data needs to be pre-processed by smoothing and de-noising
methods (Section 2.3.1.), in order to improve the signal-to-noise ratio as well as the clarity of the
peaks, which are related to specific analytes. As the noise in the IMS data does not typically vary
around zero, a baseline correction is performed, which improves the comparison of IMS data. Bader
addressed this problem by subtracting the mean intensity of a pure noise region from all spectra of an
IMS chromatogram [39].
Figure 5. MCC/IMS chromatograms of raw (a) smoothed, (b) and de-noised, (c) data,
illustrating the remaining information after de-noising and smoothing. 2D side views of
raw (d) smoothed, (e) and de-noised chromatograms also show different baselines of the
peaks caused by RIP tailing; (f) [41]. Reproduced with permission from Bader et al.,
International Journal of Ion Mobility Spectrometry published by Springer-Verlag, 2008.

Metabolites 2012, 2
740
2.3.1. De-noising and Smoothing
In Bader et al. 2008 [39], a multi resolution analysis was applied to the data, which includes
discrete wavelet transforms on different levels of resolution for both de-noising and smoothing, based
on a combination of the approaches presented by Urbas et al. [42], and Cai et al. [43]. The
corresponding wavelet coefficients, utilized to reconstruct the original chromatogram, can be altered
using hard and soft thresholding. Removing coefficients corresponding to high frequency regions,
independent of the coefficient amplitude, results in smoothing. The elimination of low amplitude
coefficients regardless of frequency, results in de-noising. In doing so, IMS data is compressed to 25%
or less of the original data, with negligible loss of information.
Another approach for de-noising is the application of a filter pipeline described by Bunkowski [40],
where a median filter is first employed for de-noising, followed by a Savitzky-Golay filter, described
in Savitzky et al. [44], and finally a Gaussian filter [45].
In addition to computational methods for de-noising, which are applied to the raw data, there are
also methods for de-noising in electrical engineering, which are considered during the instrument
design. Unfortunately all these methods, which are out of the scope of this publication, have the
limitation of partial irrecoverable raw data loss. Especially in cases of large concentration differences
within one sample and co-existing large, small, and sometimes overlapping peaks, the balance between
noise reduction and the potential loss of resolution has to be considered carefully.
2.3.2. Peak Detection
After pre-processing, peaks have to be identified in each single MCC/IMS measurement. Bader and
Bunkowski developed different strategies to accomplish this task. Bader et al. presented three methods
for peak finding referred to as Merged Peak Cluster Localization (MPCL), Growing Interval Merging
(GIM), and Wavelet-Based Multiscale Peak Detection (WBMPD) [39]. The algorithms of Bunkowski et
al. are based on water shed transformation (WST) [40]. The methods are explained in the following
sections.
Merged Peak Cluster Localization (MPCL): This peak picking method utilizes a robust, locally
weighted regression and smoothing scatterplot (LOWESS) algorithm by Cleveland et al. for baseline
correction and reduction of RIP tailing [46]. In the first phase, all data points starting after the RIP are
separated into two classes (peak and non-peak) by k-means clustering using a Euclidean distance
metric of the intensity, whereby the two starting mean values can be chosen. Under the assumption of
noise varying around zero, the non-peak class mean can be chosen as zero. Due to a large degree of
misclassifications of high noise intensity points to the peak cluster, a filtering step is performed,
whereby a peak cluster point is assigned to the non-peak cluster if at least one of its eight neighbor
points belongs to the non-peak cluster. In the second phase, different peaks are identified by a merging
regions algorithm based on Bruce et al. [47]. Taking the binary data points delivered from the first
phase, adjacent points of the peak class are merged to form one peak. Finally, a set of distinct peaks for
a single measurement is obtained. The limitation of this approach lies in the distinction of two
overlapping neighbor peaks, where the overlap’s signal intensity is above the peak-to-noise-threshold.
In this case, the merging regions algorithm will fail to distinguish between the two peaks [39].

Metabolites 2012, 2
741
Growing interval merging (GIM): This approach was used to overcome the resolution problems
of the previous method. An iterative algorithm starts at the top of the intensity range, separates noise
from peak data points and merges the discovered peaks in a stepwise manner along the intensity scale.
Noise and RIP thresholds are defined by analysis of the intensity histogram, which is divided into three
regions, namely noise (most data points), peak (second most data points) and RIP (small number of
data points). The intensity range given in the peak region is divided into subintervals with evenly
distributed data points. Those subintervals are scanned stepwise with descending intensity.
Subsequently, the data points of the current sub-interval are assigned to the peak class. Afterwards, the
second phase of the MPCL method is applied. This process yields peak lists with distinct peaks. All
elements of the current peak list are merged with the ones contained in the previous peak list, provided
they have several data points in common. Subsequently, the old peak parameters (maximum intensity
with 1/K0 and RT coordinate, two ellipse axes and ellipse area) are overridden by the current
parameters. This merging procedure allows the algorithm to distinguish between peaks which overlap
or whose in-between area lifts off from the noise. Overall, GIM outperforms MPCL in terms of peak
resolution, and extracts six parameters for each peak found. Nevertheless, there are limitations to the
method, as overlapping peaks cannot always be distinguished. Furthermore, the separation of peaks
with one or more local maxima in the tailing region is not possible.
Wavelet-based multiscale peak detection (WBMPD): The third peak-finding method of
Bader [41] is partly based on “The multiscale processing of single spectra”, introduced by Randolph
and Yasui [48], which is less suited for processing a series of spectra. Multiple resolution analysis
(MRA) is performed using the maximal overlap discrete wavelet transform (MODWT), allowing the
sample size to be arbitrary while the discrete wavelet transform is bound to a sample size that is a
power of two. Furthermore, MODWT is translation invariant, which is beneficial for shifted IMS
chromatograms. Compared to Daubechies D(4) wavelets, Haar wavelets show less artifacts in the RIP
region at low retention times in a chromatogram, and are therefore preferred. The stepwise MRA
process passes a chromatogram from higher to lower resolutions. It splits the low pass part of the
current chromatogram into four sub-images: lowpass-highpass (LH), lowpass-lowpass (LL),
highpass-lowpass (HL), and highpass-highpass (HH). The LH image of this so-called wavelet
decomposition contains only details, which means the fine-grained variations within the
chromatogram, in contrast to the coarse chromatogram structure of the LL image. Here, the GIM
method of the previous paragraph is applied to the LH image. All decomposition steps are then
connected by merging common peaks. In doing so, current ellipse peak parameters are replaced by
ellipse parameters of the next step, where more grainy structures are scanned if both ellipses have peak
data points in common. Newly found ellipses, which do not share peak data points, are added to the
peak list. Compared to the standalone GIM method, WBMBT can detect peaks enclosed in the
shoulder of other peaks. The evaluation of Bader et al. shows that this method is highly sensitive, with
only a small number of false positive classifications that can be filtered out by a clustering method
when comparing a set of measurements.
Water shed transformation (WST): Another peak finding method for IMS data is described by
Bunkowski [40]. This method is based on an approach of Wegner et al. [49] used for spot detection on
2D gel electrophoresis images. For further details about water shed transformation, the reader is
referred to the publications of Meyer et al. [50] or Vincent et al. [51].

Metabolites 2012, 2
742
The intuitive underlying working principle of this method is as follows. Imagine that an IMS
chromatogram image is turned upside down and interpreted as a topographical surface. This surface is
flooded with water, from bottom to top, from different sources that are each located at a local intensity
maximum (peak). The water will accumulate stepwise in catchment basins from higher to lower
intensities, i.e., the highest peaks are filled with water first.
When the water level reaches the limit of overflow to another basin, a watershed is built which
separates the basins. The overall process segments an IMS chromatogram into peaks and peak
parameters similar to the aforementioned methods. However, in contrast to the other approaches, this
method delivers the volume of a peak, which can then be taken into account for further analysis.
Unfortunately, no well-structured assessment of this method is available so far.
2.3.3. Merging Peak Sets
Enabling further analysis of differences and similarities between measurements requires a grouping
of peaks that are related to the same analyte. Therefore, the determination of peak sets among all
measurements, together with the unambiguous assignment of peaks to those sets, is necessary. In all
peak finding and characterization approaches described here, typical peak regions serve as peak group
descriptors, which are characterized by a center point, 1/K0 radius, and RT radius, and can also be used
to identify specific analytes [29,52]. The challenge is to refer each peak to a general peak region.
Unfortunately, all parameters of a peak related to a particular analyte vary among several
measurements. This impedes assignment to the correct peak region, especially if there is a fluctuation
in the position of maximum peak intensity. Based on the coordinates of the maximum for each peak, a
pipeline of two separate clustering methods is established [39]. The first clustering is used to find the
mean position of each cluster. The second clustering method takes these positions as starting points
and associates each peak to a cluster. Bader et al. [39] compared different combinations of clustering
methods. The combination of Ward’s clustering method [53] (1) with a k-means algorithm using the
Euclidean distance; (2) gives the best results according to the variance ratio criterion and average
silhouette width [39].
2.4. Database
Driven by the demand for rapid data analysis and biomarker discovery, there is a need for the
establishment of a centralized data repository to facilitate the identification of analytes and for data
mining in studies such as clinical trials. In contrast to other techniques like mass spectrometric data,
for which a couple of data organizing tools are available (for example OpenMS [54]), the IMS
community lacks such a system.
In 2007, Lesniak developed the first database schema to organize IMS data [55]. Nevertheless, this
approach is not able to store arbitrary entities, attributes and values, as well as relations between
entities, which is beneficial to make the database adaptable to any kind of up-coming medical
annotation data. The goal is to allow a flexible management of analytical data (MCC/IMS, GC/MS)
combined with medical data (diseases, medication, age, gender, etc.) provided by physicians or
biologists. Flexibility can be ensured by an ontology-based generalized data structure, which enables
the system to store any kind of information without changing the database schema.

Metabolites 2012, 2
743
Note that a major drawback of such a generic model is a performance loss under particular
circumstances due to a higher model complexity. Compared to conventional database schemas, queries
are more complex and especially attribute-centric queries perform worse [56]. However, in a proper
case of application, profit can be derived from the flexibility offered by such a model.
A database system including metabolite profiles and corresponding patient data will allow the
extraction of interesting data sets as a starting point for statistical analysis (Section 3) and statistical
learning (Section 4). Such a system is currently being developed at KIST Europe and the Max Planck
Institute for Informatics, Saarbrücken Germany.
3. Statistical Analysis
3.1. Statistical Tests
The aim of clinical diagnostics is to detect molecules, so-called biomarkers, that can give the
answer to a specific question, e.g., concerning the health status of a person (disease, no-disease). If a
single molecule or antibody in the blood, urine or breath having direct relation to the analyzed disease
status exists, it can be detected by statistical tests.
For methodological reasons, the assumption that the intensity of molecules within the
chromatogram is drawn from a Gaussian distribution is not valid [57]. Therefore the community of ion
mobility spectrometry relies on non-parametric tests, especially the Mann-Whitney U test. This test,
also called rank sum test, is an unpaired hypothesis test to verify whether two samples are drawn from
the same distribution, or more precisely, whether one of two samples of independent observations
tends to have smaller values than the other. In the following we briefly describe several studies
analyzing exhaled air of patients using MCC/IMS, applied Mann-Whitney U test to distinguish
between different health states.
In 2011, Bessa et al. [58] and Koczulla et al. [59] examined the volatile organic compounds in
exhaled breath of patients suffering from chronic obstructive pulmonary disease (COPD). The first
study used the rank sum test to differentiate between COPD patients and healthy controls. The second
study focused on the classification of COPD patients with and without alpha 1-antitrypsin deficiency.
In both studies, rank sum analysis led to the identification of potential single biomarker candidates.
A further example for the application of the rank sum test is the detection of microorganisms in the
human body. According to Rabis et al. 2011, bacteria produce VOCs [60]. In their study, they focused
on pseudomonas aeruginosa, a bacterium, which is associated with COPD exacerbation. They
investigated the exhaled air of pseudomonas-infected patients compared to healthy non-smokers. The
Mann-Whitney U test was applied to deduce the most discriminative signals, which resulted in a best
accuracy of 88%.
3.2. Correlation
Another method to evaluate the relation of different variables is the Pearson correlation. In 2011
Maddula et al. utilized this to analyze the similarity between the metabolites, which they used as
indicators in their disease analysis, especially those identified as important [61]. In fact, the Pearson
correlation can be used (1) to find sets or clusters of related metabolites exposing the same behavior

Metabolites 2012, 2
744
and (2) to reduce the data set by selecting representatives for each cluster. Moreover, it would be
interesting to investigate whether a set of metabolites showing the same pattern also originates from
the same pathway.
Additionally, the Pearson correlation was applied to evaluate whether medication levels detected
within the breath can be associated with other state of the art methods for that purpose. Both Kreuder
et al. [62] and Carstens et al. [63] investigated the intensity of propofol within the breath of patients
undergoing anesthesia, utilizing the MCC/IMS technique. While Kreuder et al. [62] compared the
MCC/IMS propofol intensity with the TCI pump calculated plasma values, Carstens et al. [63]
correlated their results with the propofol serum concentration determined by gas chromatography-mass
spectrometry (GC/MS). Both studies report a strong correlation between the level of propofol in breath
and the used plasma level.
3.3. Principal Component Analysis
Principal Component Analysis (PCA), first introduced by Pearson [64], is a computational/-
mathematical technique that is used in practice to reduce the dimensionality of a given data set and to
find linearly independent variables that most dominantly express the underlying data model (principal
components). A very high dimensional of the data set can cause extensive over-fitting in any following
statistical learning procedures. A prior reduction of the parameter space is necessary. In contrast to
other methods that use an orthogonal transformation, a PCA allows for an inverse transformation of
the data back into the initial parameter space. Therefore, PCA results can directly be interpreted and
used for follow-up analyses. These characteristics are fundamental in the statistical analysis of
metabolic measurements derived from IMS breath sampling. Westhoff et al. applied a PCA for the
detection of distinctive metabolites that separated breath samples taken from COPD patients from
those of healthy controls [65]. The authors identified a single discriminative analyte (cyclohexanone, CAS
108-94-1) out of 104 initially detected VOCs that classified the datasets with a sensitivity of 60%, a
specificity of 91%, and a positive predictive value of 95%. Note that further studies still have to
validate this analyte as a COPD indicator. In a related study, Westhoff et al. embedded PCA into a
comprehensive statistical analysis of IMS breath samples taken from 95 COPD patients and 35 healthy
individuals including Mann-Whitney U test, correlation analysis and decision trees [66]. Cheung et al.
applied PCA to Py-GC-DMS data sets of two strains of B. subtilis and one strain of
B. megaterium [67]. PCA proved to be sufficient to discriminate bacterial strains on species level,
while separation of the two B. subtilis strains required chemometric methods using supervised
classification. Additionally, the PCA algorithm results in a multidimensional scaling of the original
data by using the first two or three principal components. This can be visualized by various software
tools or packages for the statistical environment R [68].
4. Statistical Learning
4.1. Reduced Ion Mobility Prediction
Initially, the ion mobility spectrometry method has been used to detect specific target analytes with
known reduced ion mobility K0. This changed during the shift of application areas from military

Metabolites 2012, 2
745
towards medical and process control purposes resulting in the analysis of complex mixtures in rather
humid environment. Therefore, an accurate database of relevant analytes and their specific positions
(K0, retention time) for automated identification of the peaks within an IMS chromatogram is needed.
To create such a database either each reference substance has to be measured by the IMS or parallel
measurements with other mass spectrometric methods have to be carried out. However, to create a
reference database solely on the basis of these methods is time consuming and expensive. Therefore,
computational methods for reduced ion mobility prediction have been developed.
An early review by Revercomb and Mason describes the fundamental theory of ion mobility (K) on
a molecular scale [69]. According to this theory, K can be calculated using several factors: charge of
the ion, number density of the drift gas, the Bolzmann constant, temperature, ion mass, mass of the
drift gas, and the ion collision cross section. Considering constant operating conditions and only single
charged positive molecular ions, K as well as K0 is only dependent on ion mass and collision cross
section. For homologous series of compounds the correlations between ion mobility and ion mass are
fairly accurate, which was demonstrated by studies on ketones and amines in the late seventies [70,71].
The first attempts to predict K0 for non-homologous compounds incorporated structural descriptors
in addition to the mass, to encode the elusive collision cross section of the fundamental ion mobility
theory. Quantitative structure-property relationship methods, namely multiple linear regression and
computational neural networks in combination with numeric structural features were utilized to predict
the mobility. The set of features consisted of topological, geometric, electrostatic, and combinations of
the three types of molecule attributes.
The validation on a test-set resulted in a root mean square error of around 0.04 [72]. A similar set of
functional descriptors was used in 2007 in combination with a multiple linear regression for feature
selection and a projection pursuit regression for prediction [73].
A more recent approach utilized the information of the number of carbon atoms within the
molecule, to predict the reduced ion mobility of polar aliphatic organic compounds. In this study they
discovered a linear relation between the number of carbon atoms and the reduced ion mobility of the
compounds within a certain homologous series, as a fast and intuitive method for K0 estimation [74].
4.2. Probabilistic Relational Learning
Probabilistic relational learning (PRL) is a very active field in research at the intersection of
machine learning, logic, and probability theory. Relational models are the most common representation
of structured data. Most statistical learning methods work with “flat” data representations, including
objects and their attributes. In contrast to this, probabilistic relational models allow the properties of
objects to depend probabilistically on each other and on the properties of other related objects. Data as
enterprise business information, marketing and sales data and medical records can be explicitly
modeled as relational models to discover useful relationships and even more importantly, to discover
unknown information [75].
Particularly the identification of biomarkers is one of the major goals in clinical diagnostic research.
A biomarker or a set of biomarkers in clinical breath diagnostics is a VOC or a set of VOCs, of which
the presence, absence or intensity is an indicator for a certain disease. Therefore statistical relational
learning is well suited for analyzing the structure of IMS data and for identifying biomarkers.

Metabolites 2012, 2
746
In IMS research, the methodology of probabilistic relational learning was applied in 2011 for the
first time by Finthammer et al. for biomarker detection and biomedical diagnosis of bronchial
carcinoma [76]. First, they applied a k-means algorithm for peak clustering in order to identify the
molecules detected by the MCC/IMS. Subsequently, they estimated the probability of a peak cluster
(PCi) occurring in a measurement and the conditional probability, i.e., the probability for a
measurement including a certain peak PCi originating from a patient suffering from bronchial
carcinoma. Based on these probabilities, a set of diagnostic rules for bronchial carcinoma was learned
by using Inductive Logic Programming [77]. The result is a Markov logic network (MLN) defined as a
set of (positive or negative) weighted first-order logic formulas together with a set of constants. Table
1 shows an example of the resulting diagnostic rules.
Table 1. Example of MLN formula emerged from Alchemy’s structure learning
(90% accuracy), where pc i (M ) is the presence of peak cluster number i in sample M and bc
( M ) indicates that the sample M originates from a patient suffering from bronchial
carcinoma (¬bc ( M ) = healthy control) [76]. Reproduced with permission from
Finthammer et al., International Journal of Ion Mobility Spectrometry published by
Springer-Verlag, 2010.
# Formula Weight37 pc7(M ) � bc ( M ) 4.43
39 pc11 (M ) � pc9(M ) 4.82
44 pc17 (M ) pc28 (M ) ∧ � pc21 (M ) 5.05
46 pc15 (M ) pc25 (M ) ∧ � pc5(M ) −4.30
47 pc17 (M ) ∧ pc19 (M ) ∧ pc20 (M ) � pc9(M ) −8.98
53 pc12 (M ) ∧ pc20 (M ) ∧ pc22 (M ) � pc11 (M ) −8.14
57 ¬pc1(M ) ∧¬pc18 (M ) ∧¬pc23 (M ) ∧ pc31 (M ) � bc ( M ) 6.38
61 ¬pc10 (M ) ∧ pc14 (M ) ∧¬pc18 (M ) ∧ pc21 (M ) � bc ( M ) 7.15
62 ¬pc12 (M ) ∧¬pc22 (M ) ∧¬pc30 (M ) ∧ pc31 (M ) � bc ( M ) 7.49
66 pc4(M ) ∧ pc26 (M ) ∧ pc28 (M ) ∧ pc29 (M ) � bc ( M ) −5.62
68 ¬pc9(M ) ∧¬pc13 (M ) ∧¬pc16 (M ) ∧ pc23 (M ) ∧¬pc29 (M ) � ¬bc ( M ) 4.01
70 pc1(M ) ∧ pc3(M ) ∧¬pc15 (M ) ∧¬pc23 (M ) ∧ pc26 (M ) � ¬bc ( M ) −5.18
72 pc0(M ) ∧¬pc11 (M ) ∧¬pc12 (M ) ∧¬pc21 (M ) ∧ pc22 (M ) � ¬bc ( M ) 2.45
75 pc5(M ) ∧ pc7(M ) ∧¬pc28 (M ) ∧¬pc29 (M ) ∧ pc31 (M ) � ¬bc ( M ) −2.78
80 pc0(M ) ∧¬pc12 (M ) ¬pc16 (M ) pc30 (M ) ¬pc32 (M ) � bc ( M ) −5.55
81 ¬pc6(M ) ∧¬pc13 (M ) ∧¬pc28 (M ) ∧ pc31 (M ) ∧ pc32 (M ) � ¬bc ( M ) 5.61
82 ¬pc3(M ) ∧¬pc4(M ) ∧ pc25 (M ) ∧¬pc28 (M ) ∧¬pc32 (M ) � ¬bc ( M ) 8.77
89 ¬pc3(M ) ∧¬pc11 (M ) ∧ pc13 (M ) ∧¬pc17 (M ) ∧¬pc31 (M ) � ¬bc ( M ) −5.15
The best model in this study was based on the rules shown in Table 1. Estimating the influence of
connected peaks regarding the health state achieved a cross validation accuracy of up to 90%.
However, MLN learning aims at extracting relational, intelligible information from the observed data,
which can hardly be measured by statistical parameters. Nevertheless, the authors state that although

Metabolites 2012, 2
747
the PRL allows drawing some conclusions between the occurrence of peak clusters and bronchial
carcinoma, they emphasized that MLNs have certain shortcomings. From the knowledge
representation point of view, the weights of a MLN formula have no clear probabilistic semantics and
hence only “simple” MLNs are interpretable [76].
4.3. Statistical Learning and Biomarkers
The general aim of statistical learning is to use the information on the attributes of the samples,
encoded in variables or features to infer a certain class. The most common application area of learning
methods in bioinformatics is disease prediction. The physician gathers information on both patients
suffering from a certain disease and a set of healthy controls. This information is extracted by using
different diagnostic techniques, e.g. analyzing blood, urine or breath of the patients, and subsequently
used to train computational models.
The first study using statistical learning approaches on a set of IMS chromatograms to predict the
health status of patients was done by Baumbach et al. in 2007 [78]. They developed a software
architecture that analyzed the data of lung cancer patients and healthy persons. Due to a lack of
advanced pre-processing and peak location methods, they applied a Gaussian filter to reduce the effect
of background noise. The complexity of the model was reduced by decreasing the number of features;
the relevant part of each chromatogram (right of the RIP) was separated by a grid, while each feature
was calculated as the average intensity of the corresponding grid element. Subsequently, a set of
techniques, namely naive Bayes, multi-layer perceptron, and support vector machine (SVM) were
applied to achieve an outstanding performance (accuracy and AUC both 99%) distinguishing between
the healthy and the diseased [78]. Despite the good results, one has to consider that (1) the prediction
was done on a comparatively large feature set and a small sample size (35 lung cancer patients and 72
healthy controls), and (2) the accuracy and AUC were evaluated on the training set.
The next study was carried out only recently in 2011 by Westhoff et al. [66]. This study
incorporated the advanced pre-processing and peak location methods described in Section 2.3 to
extract those positions in the chromatogram that correspond to volatile organic compounds. They
utilized Mann-Whitney U tests and a decision tree to classify the measurements of 95 COPD patients
and 35 healthy controls. Similar to the previous study, the models were trained on the whole set
resulting in a very good performance (accuracy 95%). Additionally, Westhoff et al. extracted the most
interesting molecules either having the lowest p-values by Mann-Whitney U test or chosen as variables
in the decision tree [66].
Another, more recent study by Hauschild et al. in 2012 focused on the classification and biomarker
identification of COPD and bronchial carcinoma based on MCC/IMS data. The data set was composed
of 35 healthy controls (HC) and 84 patients either suffering from chronic obstructive pulmonary
disease (COPD) or both COPD and bronchial carcinoma (COPD+BC). Like the study of Westhoff
et al. [66], the advanced pre-processing and peak location methods provided by the VisualNow
software were used to build the features for COPD and bronchial carcinoma prediction. To get a broad
overview of the potential of the data and the different classification techniques, six different
sophisticated statistical learning methods have been applied: Decision trees, naive Bayes, neural
networks, random forest and linear as well as radial SVM [79]. Similar to the previous studies of

Metabolites 2012, 2
748
Baumbach et al. [78] and Westhoff et al. [66], the set of samples was small (119 volunteers), which
leads to a very noisy estimation of the predictive performance. Therefore, in contrast to the previous
studies, the authors used cross validation to provide an accurate estimate for the actual performance of
the predictive model. The random forest was reported to produce the best prediction results for the
COPD prediction (accuracy 94%, AUC 92%) and the bronchial carcinoma prediction (accuracy 79%).
Due to the low performance, the authors suggest that further analysis of the separation between COPD
and bronchial carcinoma patients is needed. In fact, all tested methods showed a very low sensitivity
for the COPD class in contrast to a high sensitivity for the BC class, which indicates that the
differentiation between class COPD and COPD + BC is difficult. In fact, most of the measurements of
COPD patients falsely predicted suffering from both COPD and bronchial carcinoma, which might be
reducible to the characteristic of COPD as a common and important independent risk factor for lung
cancer. Both studies, Westhoff et al. 2011 [66] as well as Hauschild et al. [79], identified a set of ten
most informative features, whereby five of these twenty features overlapped in the inverse drift time as
well as retention time, which means they represent the same VOCs.
Table 2. An overview of the four studies in Section 4, analyzing MCC/IMS data of
different diseases (bronchial carcinoma (BC) and chronic obstructive pulmonary disease
(COPD)). The ACC is the accuracy given by the percentage of correctly classified samples,
# is the number of samples in that study, the AUC is the area under the receiver operating
characteristics (ROC) curve, and CV indicates whether cross validation was used.
Study Disease # ACC AUC CV
Finthammer et al. 2010 [76] BC 158 90% - √ Baumbach et al. 2007 [78] BC 107 99% 99% - Westhoff et al. 2011 [66] COPD 130 94% - - Hauschild et al. 2012 [79] COPD and BC 119 94% 92% √
5. Summary and Conclusion
We conclude that MCC/IMS coupled with sophisticated computational methods has the potential to
successfully address a broad range of biomedical questions. The investigation of a rather large number
of volatile metabolites, especially in breath, opens the way for a totally non-invasive method of
investigation with respect to systems biology and personalized medicine. Based on the chemical
analysis of some mL of volatiles, time series and continuous investigations of cells, organs, animals
and humans could be realized. Such continuous sampling is rather complicated using techniques that
require the invasive collection of blood or other material. On one hand, detection limits down to the
pg/L-range (pptv-range) are achieved in a rather humid and complex environment. On the data analysis
side, many problems on the way to a comprehensive framework for the analysis of MCC/IMS
chromatograms have been solved, for example, the definition of the data format, the visualization and the
general evaluation using statistical techniques. Nevertheless some computational challenges
remain, Table 3.
One of the main tasks is to develop a flexible and comprehensive centralized data repository, which
is still unsolved. In contrast to this, pre-processing methods like RIP detailing, smoothing and
de-noising have been studied extensively in the last five to ten years. However, the assessment of the

Metabolites 2012, 2
749
quality of these techniques has been done solely by visual appearance. The same holds for the results
of the peak detection methods, which were evaluated, if at all, using visual comparison with the
manually selected peak lists. Besides, the question of when a peak is recognized as a peak is still open
and varies from operator to operator. In the future, pre-processing and peak picking methods have to
be validated and compared according to the aim of the study, i.e., the classification performance.
Table 3. This shows the ranking of the achievements in MCC/IMS data analysis using
computational methods.
Computational requirements Completed
Data format ***
Visualization ***
Pre-processing methods **
Peak detection methods **
Centralized data repository *
Statistical approaches ***
Statistical learning methods *
Differentiation of diseases, infections, cancer, etc. *
Disease pathway identification -
“***”accomplished; “**” almost complete; “*” first steps have been made; “-” not solved
The next steps in the framework would be biomarker identification and disease classification using
statistical methods like Mann-Whitney U tests and more sophisticated learning methods. In contrast to
the statistical analysis methods, statistical learning methods train models that are able to predict the
class of samples using a set of features found to be most informative for this model. So far, the
statistical learning methods applied to MCC/IMS data concentrated solely on supervised methods.
However, unsupervised learning methods in general have a great potential of extracting additional
information from the data, which has not been shown so far in the present field of interest.
Unsupervised clustering methods can find groups of molecules or samples without any information on
the classes (healthy vs. disease). Therefore, such methods are to be applied on large datasets generated
in multicenter studies in different hospitals and should show their potential with respect to specific and
unspecific metabolic questions in the future. To complete the framework, an automated analysis of the
IMS data, starting with a centralized database, followed by an automated biomarker identification and
classification, is needed, which is generally open for different instrumentations and
metabolic questions.
Such a centralized and flexible storage, which is capable of gathering all kinds of confounding
factors, diet or medication, for instance, allows for the discovery of their influence within the IMS
chromatograms and hence a more accurate disease modeling accounting for these contaminations. One
question has been left untouched so far: “How to find the disease-specific pathway?” Once the most
interesting analytes considered as potential biomarkers are detected, the identity of these molecules is
determined by mass spectrometric methods. Subsequently, the pathways within the human or bacterial

Metabolites 2012, 2
750
organisms containing these potential biomarkers can be further investigated by novel computational
techniques. In a recent review by Khatri et al., these techniques for pathway analysis have been
categorized into three generations of approaches: the first-generation "over-representation analysis"
(ORA) approaches, the second-generation "functional class scoring" (FCS) approaches, and the
third-generation "pathway topology" (PT) approaches [80].
We conclude that the basic computational methods for pre-processing, biomarker identification and
disease prediction are available. However, a comprehensive framework providing a pipeline to
automatically pre-process and evaluate complete sets of MCC/IMS data is still required.
Acknowledgments
The financial support of the Ministry of Education Science and Technology (MEST) of the
Republic of Korea is acknowledged thankfully. Part of the work of this paper has been supported by
the Deutsche Forschungsgemeinschaft (DFG) within the Collaborative Research Center
(Sonderforschungsbereich) SFB 876 “Providing Information by Resource-Constrained Analysis”,
project TB1 “Resource-Constrained Analysis of Spectrometry Data”.
In addition, the work was supported partly by the German Federal Ministry of Economics and
Technology based on a decision of the Deutscher Bundestag within the project KF2368102AKO.
Conflict of Interest
The authors declare no conflict of interest.
References
1. Ligor, T.; Ligor, M.; Amann, A.; Ager, C.; Bachler, M.; Dzien, A.; Buszewski, B. The analysis of
healthy volunteers' exhaled breath by the use of solid-phase microextraction and GC-MS.
J. Breath Res. 2008, 2, 046006:1–046006: 8.
2. Jünger, M.; Bödeker, B.; Baumbach, J.I. Peak assignment in multi-capillary column - ion mobility
spectrometry using comparative studies with gas chromatography-mass spectrometry for exhalred
breath analysis. Anal. Bioanal. Chem. 2010, 396, 471–482.
3. Mieth, M.; Schubert, J.K.; Groger, T.; Sabel, B.; Kischkel, S.; Fuchs, P.; Hein, D.; Zimmermann,
R.; Miekisch, W. Automated Needle Trap Heart-Cut GC/MS and Needle Trap Comprehensive
Two-Dimensional GC/TOF-MS for Breath Gas Analysis in the Clinical Environment. Anal.
Chem. 2010, 82, 2541–2551.
4. Kushch, I.; Schwarz, K.; Schwentner, L.; Baumann, B.; Dzien, A.; Schmid, A.; Unterkofler, K.;
Gastl, G.; Spanel, P.; Smith, D.; et al. Compounds enhanced in a mass spectrometric profile of
smokers' exhaled breath versus non-smokers as determined in a pilot study using PTR-MS.
J. Breath Res. 2008, 2, 026002:1–026002:26.
5. Ligor, M.; Ligor, T.; Bajtarevic, A.; Ager, C.; Pienz, M.; Klieber, M.; Denz, H.; Fiegl, M.; Hilbe,
W.; Weiss, W.; et al. Determination of volatile organic compounds in exhaled breath of patients
with lung cancer using solid phase microextraction and gas chromatography mass spectrometry.
Clin. Chem. Lab. Med. 2009, 47, 550–560.

Metabolites 2012, 2
751
6. Buszewski, B.; Ulanowska, A.; Ligor, T.; Denderz, N.; Amann, A. Analysis of exhaled breath
from smokers, passive smokers and non-smokers by solid-phase microextraction gas
chromatography/mass spectrometry. Biomed. Chromatogr. 2009, 23, 551–556.
7. Cheng, Z.J.; Warwick, G.; Yates, D.H.; Thomas, P.S. An electronic nose in the discrimination of
breath from smokers and non-smokers: a model for toxin exposure. J. Breath Res. 2009, 3,
036003/036001–036003/036005.
8. Dragonieri, S.; Annema, J.T.; Schot, R.; van der Schee, M.P.C.; Spanevello, A.; Carratu, P.; Resta, O.;
Rabe, K.F.; Sterk, P.J. An electronic nose in the discrimination of patients with non-small cell
lung cancer and COPD. Lung Cancer 2009, 64, 166–170.
9. Dragonieri, S.; Schot, R.; Mertens, B.J.A.; le Cessie, S.; Gauw, S.A.; Spanevello, A.; Resta, O.;
Willard, N.P.; Vink, T.J.; Rabe, K.F.; et al. An electronic nose in the discrimination of patients
with asthma and controls. J. Allergy Clin. Immun. 2007, 120, 856–862.
10. Horvath, I.; Lazar, Z.; Gyulai, N.; Kollai, M.; Losonczy, G. Exhaled biomarkers in lung cancer.
Eur. Respir. J. 2009, 34, 261–275.
11. Beauchamp, J.; Kirsch, F.; Buettner, A. Real-time breath gas analysis for pharmacokinetics:
monitoring exhaled breath by on-line proton-transfer-reaction mass spectrometry after ingestion
of eucalyptol-containing capsules. J. Breath Res. 2010, doi:10.1088/1752-7155/4/2/026006.
12. Herbig, J.; Mueller, M.; Schallhart, S.; Titzmann, T.; Graus, M.; Hansel, A. On-line breath
analysis with PTR-TOF. J. Breath Res. 2009, 3, 027004:1–027004:10.
13. Perl, T.; Bödecker, B.; Jünger, M.; Nolte, J.; Vautz, W. Alignment of retention time obtained from
multicapillary column gas chromatography used for VOC analysis with ion mobility
spectrometry. Anal. Bioanal. Chem. 2010, 397, 2385–2394.
14. Baumbach, J.I. Process analysis using ion mobility spectrometry. Anal. Bioanal. Chem. 2006,
384, 1059–1070.
15. Baumbach, J.I.; Westhoff, M. Ion mobility spectrometry to detect lung cancer and airway
infections. Spectrosc. Eur. 2006, 18, 22–27.
16. Westhoff, M.; Litterst, P.; Freitag, L.; Baumbach, J.I. Ion mobility spectrometry in the diagnosis
of Sarcoidosis: Results of a feasibility study. J. Physiol. Pharmacol. 2007, 58, 739–751.
17. Vautz, W.; Nolte, J.; Fobbe, R.; Baumbach, J.I. Breath analysis—performance and potential of ion
mobility spectrometry. J. Breath Res. 2009, doi: 036010.031088/031752037155/036003/-
036003/036004.
18. Basanta, M.; Koimtzis, T.; Singh, D.; Wilson, I.; Thomas, C.L.P. An adaptive breath sampler for
use with human subjects with an impaired respiratory function. Analyst 2007, 132, 153–163.
19. Basanta, M.; Koimtzis, T.; Thomas, C.L.P. Sampling and analysis of exhaled breath on human
subjects with thermal desorption gas chromatography - differential mobility spectrometry. Int. J.
Ion Mobility Spectrom. 2006, 9, 45–49.
20. King, J.; Kupferthaler, A.; Frauscher, B.; Hackner, H.; Unterkofler, K.; Teschl, G.; Hinterhuber, H.;
Amann, A.; Högl, B. Measurement of endogenous acetone and isoprene in exhaled breath during
sleep. Physiol. Meas. 2012, doi:10.1088/0967–3334/33/3/413.
21. Lee, J.H.; Hwang, S.M.; Lee, D.W.; Heo, G.S. Determination of volatile organic compounds
(VOCs) using Tedlar bag/solid-phase microextraction/gas chromatography/mass spectrometry
(SPME/GC/MS) in ambient and workplace air. B Korean Chem. Soc. 2002, 23, 488–496.

Metabolites 2012, 2
752
22. Schulz, K.; Jensen, M.L.; Balsley, B.B.; Davis, K.; Birks, J.W. Tedlar bag sampling technique for
vertical profiling of carbon dioxide through the atmospheric boundary layer with high precision
and accuracy. Environ. Sci. Technol. 2004, 38, 3683–3688.
23. Beauchamp, J.; Herbig, J.; Gutmann, R.; Hansel, A. On the use of Tedlar bags for breath-gas
sampling and analysis. J. Breath Res. 2008, 046001: 1–046001:19.
24. Filipiak, W.; Filipiak, A.; Ager, C.; Wiesenhofer, H.; Amann, A. Optimization of sampling
parameters for collection and preconcentration of alveolar air by needle traps. J. Breath Res. 2012,
6, 027107.
25. Bajtarevic, A.; Ager, C.; Pienz, M.; Klieber, M.; Schwarz, K.; Ligor, M.; Ligor, T.; Filipiak, W.;
Denz, H.; Fiegl, M.; et al. Noninvasive detection of lung cancer by analysis of exhaled breath.
BMC Cancer 2009, doi:10.1186/1471-2407-9-348.
26. Miekisch, W.; Hengstenberg, A.; Kischkel, S.; Beckmann, U.; Mieth, M.; Schubert, J.K.
Construction and Evaluation of a Versatile CO2 Controlled Breath Collection Device. Ieee Sen. J.
2010, 10, 211–215.
27. Baumbach, J.I.; Eiceman, G.A. Ion Mobility Spectrometry: Arriving On Site and Moving Beyond
a Low Profile. Appl. Spectrosc. 1999, 53, 338A–355A.
28. Hill, H.H., Jr.; Siems, W.F.; St Louis, R.H.; McMinn, D.G. Ion mobility spectrometry.
Anal. Chem. 1990, 62, 1201A–1209A.
29. Ruzsanyi, V.; Baumbach, J.I.; Sielemann, S.; Litterst, P.; Westhoff, M.; Freitag, L. Detection of
human metabolites using multi-capillary columns coupled to ion mobility spectrometers. J.
Chromatogr. A 2005, 1084, 145–151.
30. Baumbach, J.I. Ion Mobility Spectrometry coupled with Multi-Capillary Columns for Metabolic
Profiling of Human Breath. J. Breath Res. 2009, 3, 1–16.
31. Maddula, S.; Blank, L.; Schmid, A.; Baumbach, J.I. Detection of volatile metabolites of
Escherichia coli by multi capillary column coupled ion mobility spectrometry. Anal. Bioanal.
Chem. 2009, 394, 791–800.
32. Eiceman, G.A.; Karpas, Z. Ion Mobility Spectrometry; 2nd ed.; CRC Press, Taylor & Francis:
Boca Raton, FL, USA, 2005; Vol. 1, p. 337.
33. Vautz, W.; Bödecker, B.; Bader, S.; Baumbach, J.I. Recommendation of a standard format for
data sets from GC/IMS with sensor-controlled sampling. Int. J. Ion Mobility Spectrom. 2008, 11,
71–76.
34. Maddula, S.; Rupp, K.; Baumbach, J.I. Recommendation for an upgrade to the standard format in
order to cross-link the GC/MSD and the MCC/IMS data. Int. J. Ion Mobility Spectrom. 2012, 15,
79–81.
35. Bunkowski, A. Software tool for coupling chromatographic total ion current dependencies of
GC/MSD and MCC/IMS. Int. J. Ion Mobility Spectrom. 2010, 13, 169–175.
36. Bödeker, B.; Vautz, W.; Baumbach, J.I. Visualisation of MCC/IMS―Data. Int. J. Ion Mobility
Spectrom. 2008, 11, 77–82.
37. Borsdorf, H.; Eiceman, G.A. Ion Mobility Spectrometry: Principles and Applications. Appl.
Spectrosc. Rev. 2006, 41, 323–375.
38. Cumeras, R.; Schneider, T.; Favrod, P.; Figueras, E.; Gracia, I.; Maddula, S.; Baumbach, J.I.
Stability and alignment of MCC/IMS devices. Int. J. Ion Mobility Spectrom. 2012, 15, 41–46.

Metabolites 2012, 2
753
39. Bader, S. Identification and Quantification of Peaks in Spectrometric Data. Technical University
of Dortmund: Dortmund, Germany, 2008.
40. Bunkowski, A. MCC-IMS data analysis using automated spectra processing and explorative
visualization methods. PhD thesis, University Bielefeld: Bielefeld, Germany, 2011.
41. Bader, S.; Urfer, W.; Baumbach, J.I. Preprocessing of Ion Mobility Spectra by Lognormal
Detailing and Wavelet Transform. Int. J. Ion Mobility Spectrom. 2008, 11, 43–50.
42. Urbas, A.A.; Harrington, P.B. Two-dimensional wavelet compression of ion mobility spectra.
Anal. Chim. Acta 2001, 446, 393–412.
43. Cai, C.; de B. Harrington, P. Different Discrete Wavelet Transforms Applied to Denoising
Analytical Data. J. Chem. Inf. Comp. Sci. 1998, 38, 1161–1170.
44. Savitzky, A.; Golay, M.J.E. Smoothing and Differentiation of Data by Simplified Least Squares
Procedures. Anal. Chem. 1964, 36, 1627–1639.
45. Haddad, R.A.; Akansu, A.N. A class of fast Gaussian binomial filters for speech and image-
processing. IEEE T. Signal Proces. 1991, 39, 723–727.
46. Cleveland, W.S. Robust locally weighted regression and smoothing scatterplots. J. Am. Stat.
Assoc. 1979, 74, 829–836.
47. Bruce, J.; Balch, T.; Veloso, M.; Intelligent Robots and Systems, 2000. (IROS 2000). In
proceedings of Ieee Fast and inexpensive color image segmentation for interactive robots,
Takamatsu, Japan, 31 Oct–05 Nov, 2000.
48. Randolph, T.W.; Yasui, Y. Multiscale processing of mass spectrometry data. Biometrics 2006, 62,
589–597.
49. Wegner, S.; Sahlström, A.; Pleißner, K.P.; Oswald, H.; Fleck, E. Bildverarbeitung für die
Medizin. Eine hierarchische Wasserscheidentransformation für die Spotdetektion in 2D-Gel-
Elektrophorese-Bildern. In Proceedings: Bildverarbeitung für die Medizin Aachen, Germany,
26–27March, 1998.
50. Meyer, F.; Beucher, S. Morphological segmentation. J. Vis. Commun. Image R 1990, 1, 21–46.
51. Vincent, L. Watersheds in Digital Spaces: An Efficient Algorithm Based on Immersion
Simulations. IEEE T. Pattern. Anal. 1991, 13, 583–598.
52. Bödeker, B.; Vautz, W.; Baumbach, J.I. Peak Finding and Referencing in MCC/IMS - Data. Int. J.
Ion Mobility Spectrom. 2008, 11, 83–88.
53. Ward, J.H. Hierarchical grouping to optimize an objective function. J. Am. Stat. Assoc. 1963,
doi:10.1080/01621459.1963.10500845.
54. Sturm, M.; Bertsch, A.; Gröpl, C.; Hildebrandt, A.; Hussong, R.; Lange, E.; Pfeifer, N.; Schulz-
Trieglaff, O.; Zerck, A.; Reinert, K.; et al. OpenMS-An open-source software framework for mass
spectrometry. BMC Bioinformatics 2008, doi:10.1186/1471-2105-9-163.
55. Lesniak, T. Entwurf, Erprobung und Bewertung eines Informationsschemas für Untersuchungen
von Metaboliten. Diploma Thesis, University of Dortmund, Dortmund, Germany, 2007.
56. Chen, R.S.; Nadkarni, P.; Marenco, L.; Levin, F.; Erdos, J.; Miller, P.L. Exploring Performance
Issues for a Clinical Database Organized Using an Entity-Attribute-Value Representation. J. Am.
Med. Inform. Assn. 2000, 7, 475–487.
57. Vogtland, D.; Baumbach, J.I. Breit-Wigner-Function and IMS-Signals. Int. J. Ion Mobility
Spectrom. 2009, 12, 109–114.

Metabolites 2012, 2
754
58. Bessa, V.; Darwiche, K.; Teschler, H.; Sommerwerck, U.; Rabis, T.; Baumbach, J.I.; Freitag, L.
Detection of volatile organic compounds (VOCs) in exhaled breath of patients with chronic
obstructive pulmonary disease (COPD) by ion mobility spectrometry. Int. J. Ion Mobility
Spectrom. 2011, 14, 7–13.
59. Koczulla, R.; Hattesohl, A.; Schmid, S.; Bödeker, B.; Maddula, S.; Baumbach, J.I. MCC/IMS as
potential noninvasive technique in the diagnosis of patients with COPD with and without alpha 1-
antitrypsin deficiency. Int. J. Ion Mobility Spectrom. 2011, 14, 177–185.
60. Rabis, T.; Sommerwerck, U.; Anhenn, O.; Darwiche, K.; Freitag, L.; Teschler, H.; Bödeker, B.;
Maddula, S.; Baumbach, J.I. Detection of infectious agents in the airways by ion mobility
spectrometry of exhaled breath. Int. J. Ion Mobility Spectrom. 2011, 11, 187–195.
61. Maddula, S.; Rabis, T.; Sommerwerck, U.; Anhenn, O.; Darwiche, K.; Freitag, L.; Teschler, H.;
Baumbach, J.I. Correlation analysis on data sets to detect infectious agents in the airways by ion
mobility spectrometry of exhaled breath. Int. J. Ion Mobility Spectrom. 2011, 14, 197–206.
62. Kreuder, A.-E.; Buchinger, H.; Kreuer, S.; Volk, T.; Maddula, S.; Baumbach, J.I. Characterization
of propofol in human breath of patients undergoing anesthesia. Int. J. Ion Mobility Spectrom.
2011, 14, 167–175.
63. Carstens, E.; Hirn, A.; Quintel, M.; Nolte, J.; Juenger, M.; Perl, T.; Vautz, W. On-line
determination of serum propofol concentrations by expired air analysis. Int. J. Ion Mobility
Spectrom. 2010, 13, 37–40.
64. Pearson, K. On lines and planes of closest fit to systems of points in space. Philosophical
Magazine 1901, 2, 559–572.
65. Westhoff, M.; Litterst, P.; Maddula, S.; Bödecker, B.; Rahmann, S.; Davies, A.N.; Baumbach, J.I.
Differentiation of chronic obstructive pulmonary disease (COPD) including lung cancer from
healthy control group by breath analysis using ion mobility spectrometry. Int. J. Ion Mobility
Spectrom. 2010, 13, 131–139.
66. Westhoff, M.; Litterst, P.; Maddula, S.; Bödeker, B.; Baumbach, J.I. Statistical and
bioinformatical methods to differentiate chronic obstructive pulmonary disease (COPD) including
lung cancer from healthy control by breath analysis using ion mobility spectrometr. Int. J. Ion
Mobility Spectrom. 2011, 11, 139–149.
67. Cheung, W.; Xu, Y.; Thomas, C.L.P.; Goodacre, R. Discrimination of bacteria using pyrolysis-gas
chromatography-differential mobility spectrometry (Py-GC-DMS) and chemometrics. Analyst
2009, 134, 557–563.
68. Team, R.D.C. R: A language and environment for statistical computing. Available online:
http://www.google.com.hk/url?sa=t&rct=j&q=A+language+and+environment+for+statistical+comput
ing&source=web&cd=1&ved=0CCoQFjAA&url=http%3A%2F%2Fwww.lsw.uni-heidelberg. de%2
Fusers%2Fchristlieb%2Fteaching%2FUKStaSS10%2FR-refman.pdf&ei=_753UMmgJ--eiAeu7IGoA
Q&usg=AFQjCNHz-GCuz9CII0JC8onCa91DwwVoHQ&cad=rjt/, accessed on 12 October 2012.
69. Revercomb, H.E.; Mason, E.A. Theory of Plasma Chromatography Gaseous Electrophoresis -
Review. Anal. Chem. 1975, 47, 970–983.
70. Benezra, S.A. Separation of Mixtures of Aromatic Ketones in Sub-Nanogram Range by Plasma
Chromatography. J. Chromatogr. Sci. 1976, 14, 122–125.

Metabolites 2012, 2
755
71. Karasek, F.W.; Kim, S.H.; Rokushika, S. Plasma chromatography of alkyl amines. Anal. Chem.
1978, 50, 2013–2016.
72. Wessel, M.D.; Sutter, J.M.; Jurs, P.C. Prediction of Reduced Ion Mobility Constants of Organic
Compounds from Molecular Structure. Anal. Chem. 1996, 68, 4237–4243.
73. Liu, H.; Yao, X.; Liu, M.; Hu, Z.; Fan, B. Prediction of gas-phase reduced ion mobility constants
(K0) based on the multiple linear regression and projection pursuit regression. Talanta 2007, 71,
258–263.
74. Hariharan, C.B.; Baumbach, J.I.; Vautz, W. Linearized Equations for the Reduced Ion Mobilities
of Polar Aliphatic Organic Compounds. Anal. Chem. 2010, 82, 427–431.
75. Friedman, N.; Getoor, L.; Koller, D.; Pfeffer, A. Learning Probabilistic Relational Models. In
Proceedings of the Sixteenth International Joint Conferences on Artificial Intelligence (IJCAI-99),
Stockholm, Sweden, July 31–August 6 1999; pp. 1300–1309.
76. Finthammer, M.; Beierle, C.; Fisseler, J.; Kern-Isberner, G.; Möller, B.; Baumbach, J.I.
Probabilistic Relational Learning for Medical Diagnosis Based on Ion Mobility Spectrometry. Int.
J. Ion Mobility Spectrom. 2010, 13, 83–92.
77. Muggleton, S.; de Raedt, L. Inductive logic programming: Theory and methods. J. Logic
Program. 1994, 19/20, 629–679.
78. Baumbach, J.; Bunkowski, A.; Lange, S.; Oberwahrenbrock, T.; Kleinboelting, N.; Rahmann, S.;
Baumbach, J.I. IMS2―An integrated medical software system for early lung cancer detection
using ion mobility spectrometry data of human breath. J. Integr. Bioinformatics 2007, 4, 75.
79. Hauschild, A.-C.; Baumbach, J.I.; Baumbach, J. Integrated Statistical Learning of Metabolic Ion
Mobility - Spectrometry Profiles for Pulmonary Disease Identification. Genet. Mol. Res. 2012, 11,
2733–2744.
80. Khatri, P.; Sirota, M.; Butte, A.J. Ten Years of Pathway Analysis: Current Approaches and
Outstanding Challenges. PLoS Comput. Biol. 2012, 8, e1002375.
© 2012 by the authors; licensee MDPI, Basel, Switzerland. This article is an open access article
distributed under the terms and conditions of the Creative Commons Attribution license
(http://creativecommons.org/licenses/by/3.0/).
Copyright © 2022 FDOKUMEN