
Ion Mobility Mass Spectrometry: a Tutorial - Zenodo
124
Ion Mobility Mass Spectrometry: a Tutorial Valérie Gabelica INSERM/CNRS/Univ. Bordeaux ARNA Laboratory (U1212, UMR5320) Institut Européen de Chimie et Biologie Bordeaux, France
-
Upload
khangminh22 -
Category
Documents
-
view
3 -
download
0
Transcript of Ion Mobility Mass Spectrometry: a Tutorial - Zenodo

Ion Mobility Mass Spectrometry: a TutorialValérie Gabelica INSERM/CNRS/Univ. BordeauxARNA Laboratory (U1212, UMR5320)Institut Européen de Chimie et BiologieBordeaux, France
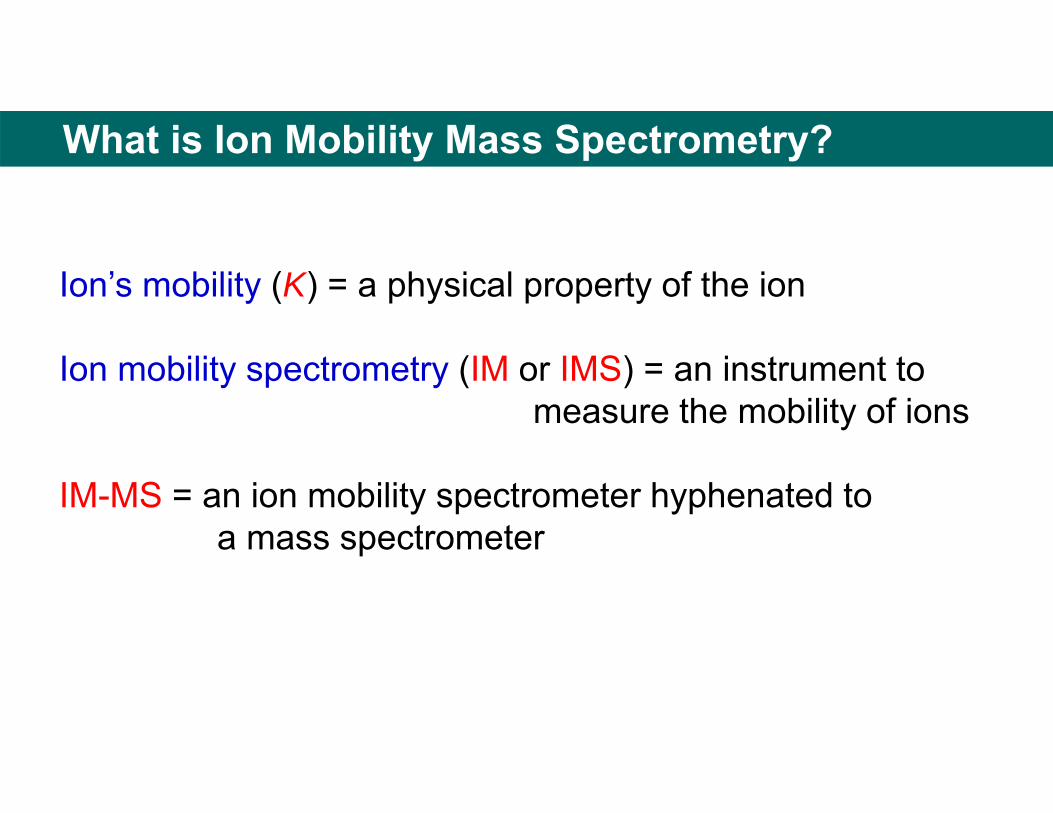
What is Ion Mobility Mass Spectrometry?
Ion’s mobility (K) = a physical property of the ion
Ion mobility spectrometry (IM or IMS) = an instrument to measure the mobility of ions
IM-MS = an ion mobility spectrometer hyphenated to a mass spectrometer
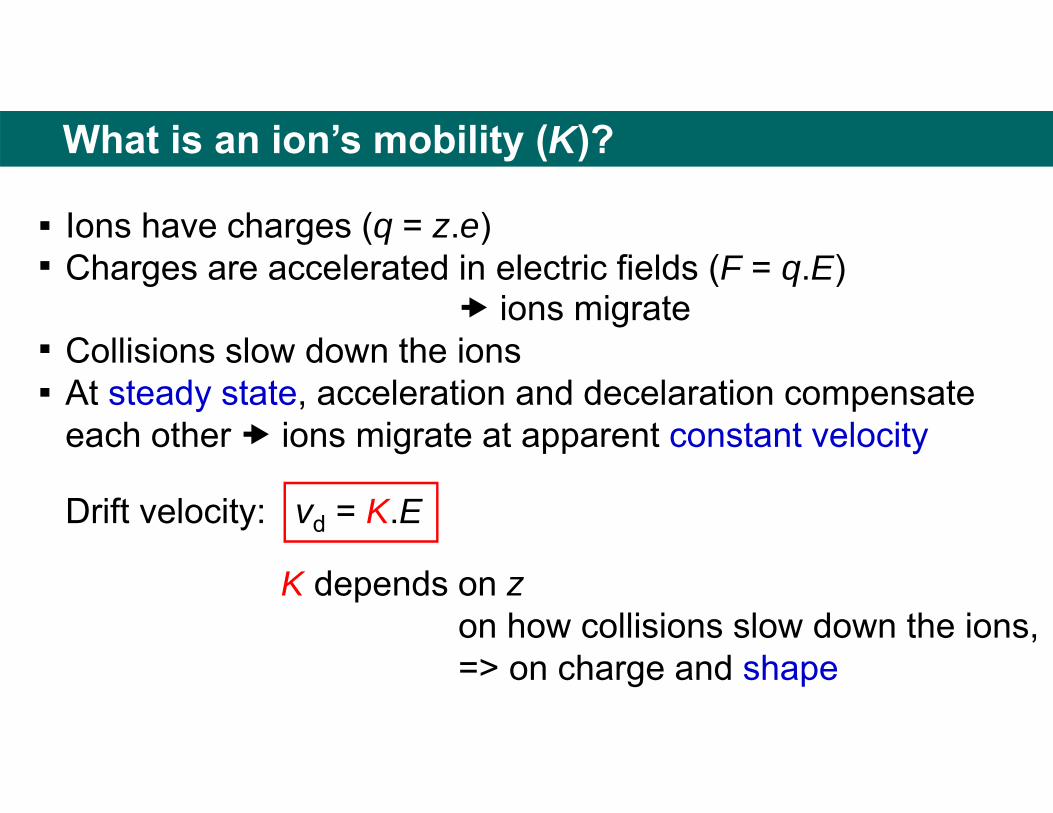
What is an ion’s mobility (K)?
Ions have charges (q = z.e)Charges are accelerated in electric fields (F = q.E)
ions migrate
Drift velocity: vd = K.E
Collisions slow down the ionsAt steady state, acceleration and decelaration compensateeach other ions migrate at apparent constant velocity
K depends on zon how collisions slow down the ions, => on charge and shape

What is Ion Mobility Mass Spectrometry?
https://labs.chem.ucsb.edu/bowers/michael/theory_analysis/ion-mobility/index.shtml

t = 0
Drift time (ms)
Inte
nsity
Det
ecto
r
ESIE
ion mobility
Experimental collisioncross section (Ų)
Solution structureHere: 50 ns MD in solution
(could use NMR constraints)
Crystal structurePDB entry 352D,
resolved at 0.95 Å
Theoreticalcollision cross section
(Ų)Gas phase structure
+1 µs MD in gas phase
D’Atri, Porrini, Rosu & Gabelica, J. Mass Spectrom. (2015) Tutorial, 50: 711
What is Ion Mobility Mass Spectrometry?
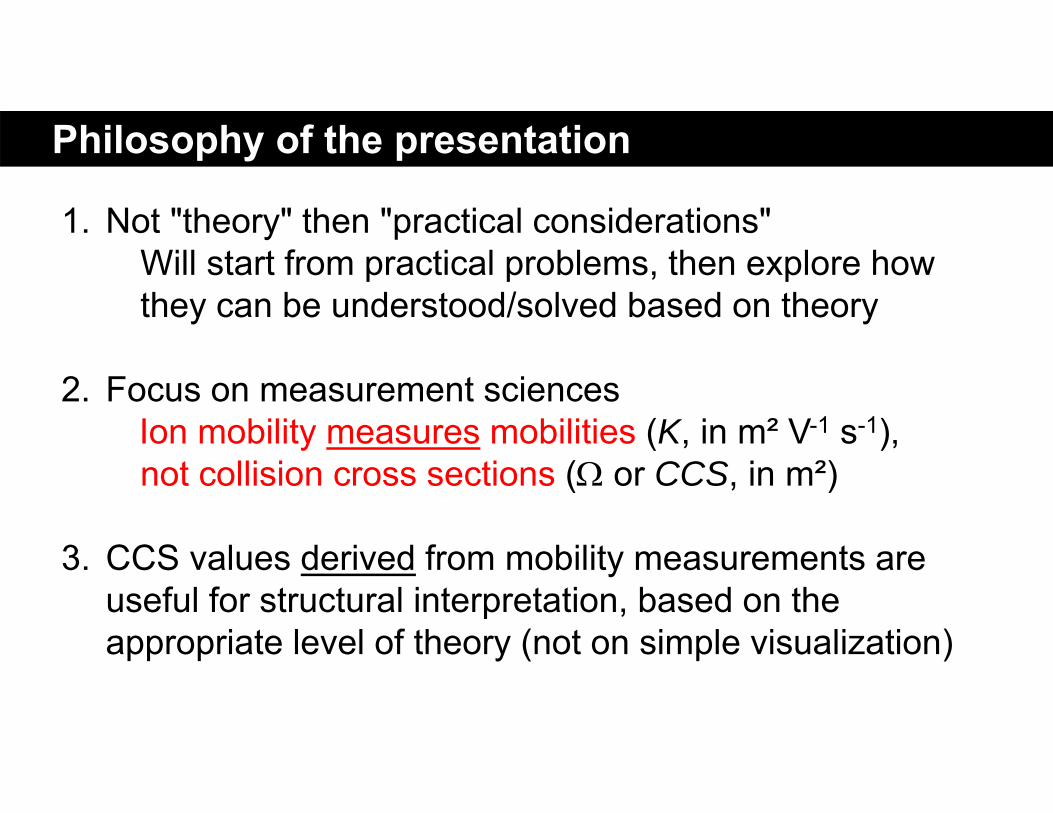
Philosophy of the presentation
1. Not "theory" then "practical considerations"Will start from practical problems, then explore how they can be understood/solved based on theory
2. Focus on measurement sciencesIon mobility measures mobilities (K, in m² V-1 s-1), not collision cross sections ( or CCS, in m²)
3. CCS values derived from mobility measurements are useful for structural interpretation, based on the appropriate level of theory (not on simple visualization)

What is an ion’s mobility (K)?
Ions have charges (q = z.e)Charges are accelerated in electric fields (F = q.E)
ions migrate
Drift velocity: vd = K.E
Collisions slow down the ionsAt steady state, acceleration and decelaration compensateeach other ions migrate at apparent constant velocity
K depends on zon how collisions slow down the ions, => on charge and shape

Illustration of the steady state in ion mobility
Field ELow pressureNo collisions
No fieldLow pressureNo collisions
Field EPressure p
Field EPressure 2p
Field E/2Pressure p
Figure 1.3 from Shvartsburg AA: Differential Ion Mobility Spectrometry. Nonlinear Ion Transport and Fundamentals of FAIMS. Boca Raton: CRC Press; 2009.
MS:
IMS:Apparent steadystate velocity vd
vd = K.E

Influence of electric field E on drift velocity vd
Field ELow pressureNo collisions
No fieldLow pressureNo collisions
Field EPressure p
Field EPressure 2p
Field E/2Pressure p
Figure 1.3 from Shvartsburg AA: Differential Ion Mobility Spectrometry. Nonlinear Ion Transport and Fundamentals of FAIMS. Boca Raton: CRC Press; 2009.
MS:
IMS:Apparent steadystate velocity vd
vd = K.E
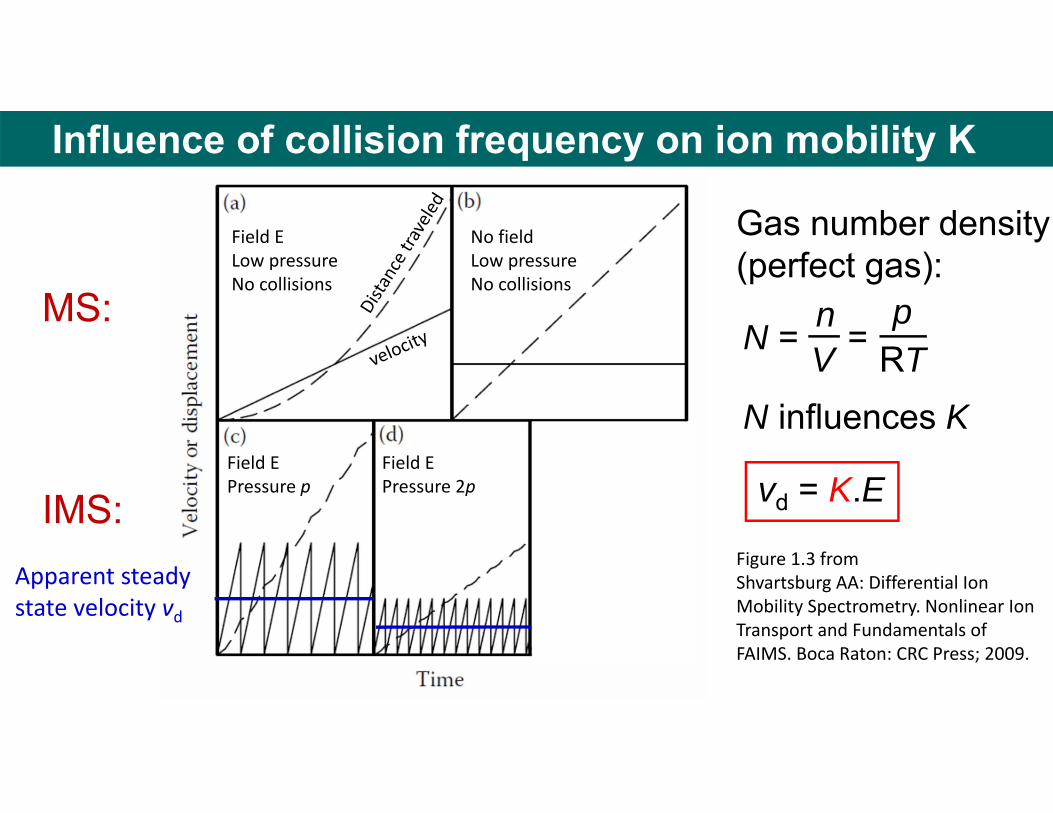
Influence of collision frequency on ion mobility K
Field ELow pressureNo collisions
No fieldLow pressureNo collisions
Field EPressure p
Field EPressure 2p
Field E/2Pressure p
Figure 1.3 from Shvartsburg AA: Differential Ion Mobility Spectrometry. Nonlinear Ion Transport and Fundamentals of FAIMS. Boca Raton: CRC Press; 2009.
MS:
IMS:Apparent steadystate velocity vd
N = = nV
pRT
Gas number density(perfect gas):
vd = K.E
N influences K

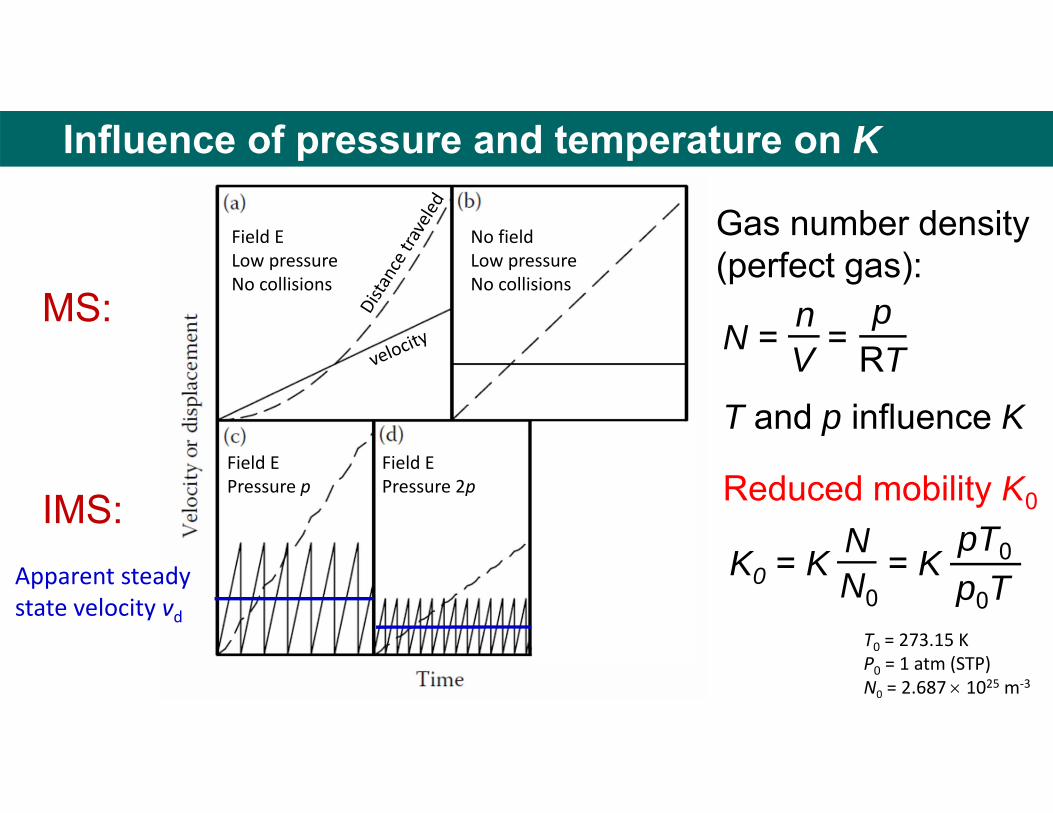
Influence of pressure and temperature on K
Field ELow pressureNo collisions
No fieldLow pressureNo collisions
Field EPressure p
Field EPressure 2p
Field E/2Pressure p
Figure 1.3 from Shvartsburg AA: Differential Ion Mobility Spectrometry. Nonlinear Ion Transport and Fundamentals of FAIMS. Boca Raton: CRC Press; 2009.
MS:
IMS:Apparent steadystate velocity vd
vd = K.E
N = = nV
pRT
Gas number density(perfect gas):
N influences K
Influence of pressure and temperature on K
Field ELow pressureNo collisions
No fieldLow pressureNo collisions
Field EPressure p
Field EPressure 2p
Field E/2Pressure p
MS:
IMS:Apparent steadystate velocity vd
N = = nV
pRT
Gas number density(perfect gas):
T and p influence K
K0 = K = KNN0
pT0
p0T
Reduced mobility K0
T0 = 273.15 KP0 = 1 atm (STP)N0 = 2.687 1025 m‐3
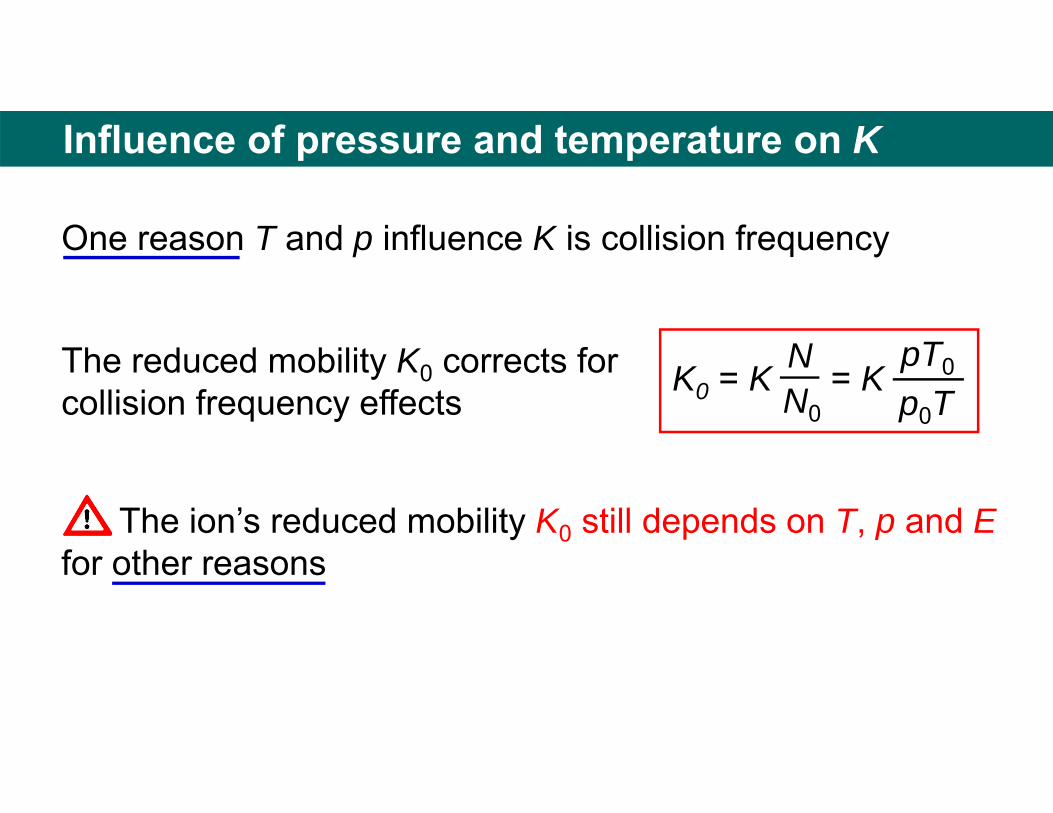
Influence of pressure and temperature on K
One reason T and p influence K is collision frequency
K0 = K = KNN0
pT0
p0TThe reduced mobility K0 corrects for collision frequency effects
The ion’s reduced mobility K0 still depends on T, p and Efor other reasons

Effect of E/N on K0
lower Ehigher NLow E/N K0 independent on E/N
Not too much accelerationbetween collisions No collisional activation
(no energy transfer into internal energy)
Elastic collisions Criterion: vd << vthermal

Effect of E/N on K0
Low E/N K0 independent on E/N
Higher E/N
𝐾𝐸𝑁 𝐾 0 1 𝛼
𝐸𝑁 𝛼
𝐸𝑁 ⋯
Linear IMS methods assume "low E/N"
Nonlinear IMS methods (FAIMS, DIMS,…)exploit the E/N dependence of the mobilityfor separation purposes
K+ ions in rare gases
1 Td = 10‐21 V m²

Effect of E/N on K0
Low E/N K0 independent on E/N
Linear IMS methods assume "low E/N" Low-field drift tube IMS Travelling wave IMS Trapped IMS Low-field differential mobility analyzers
(Agilent, Tofwerk)(Waters)(Bruker)
(SEADM)
Is the assumption justified?

How to determine K?
vd = K.E K = vdE
Determine vd and E Easiest in principle: constant field and linear tube Drift tube ion mobility spectrometry (DTIMS)
length: Lt = 0 t = td
V E = VL
vd = Ltd
K = L²td.V
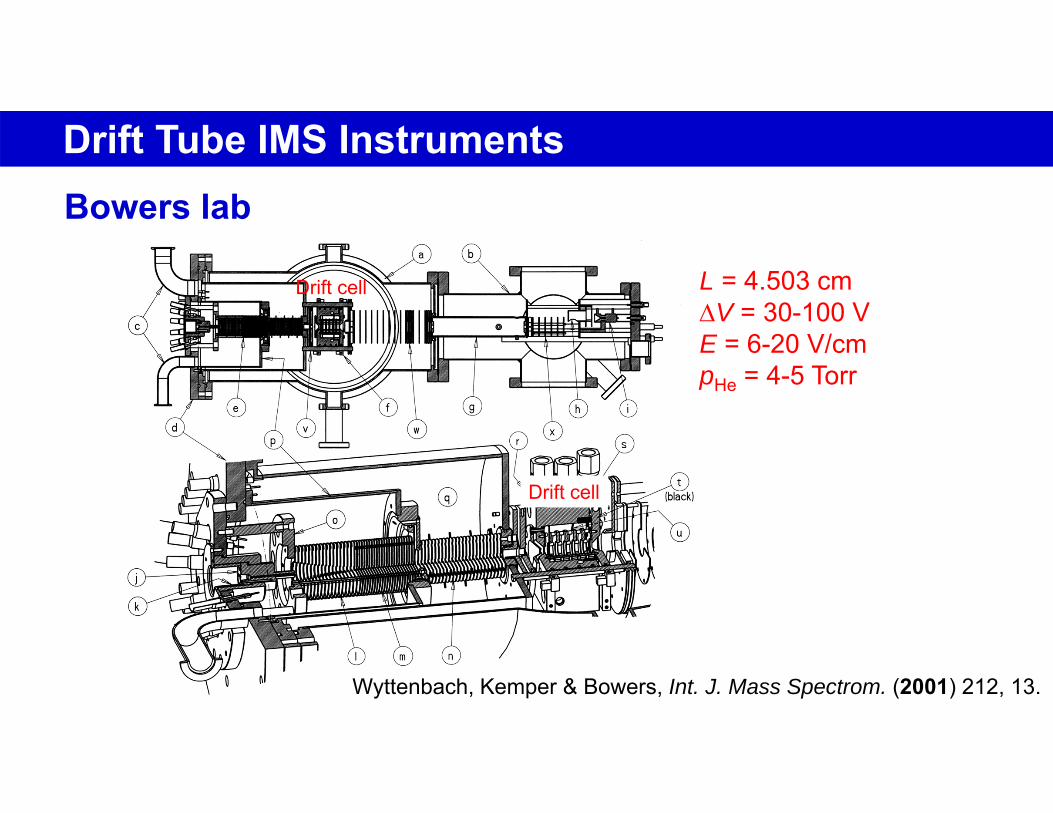
Drift Tube IMS InstrumentsBowers lab
Drift cell L = 4.503 cmV = 30-100 VE = 6-20 V/cmpHe = 4-5 Torr
Wyttenbach, Kemper & Bowers, Int. J. Mass Spectrom. (2001) 212, 13.
Drift cell

Drift Tube IMS InstrumentsJarrold lab
Dugourd, Hudgins, Clemmer & Jarrold, Rev. Sci. Instrum. (1997) 68, 1122.
L = 63 cmV = 14000 VE 220 V/cmpHe = 500 Torr
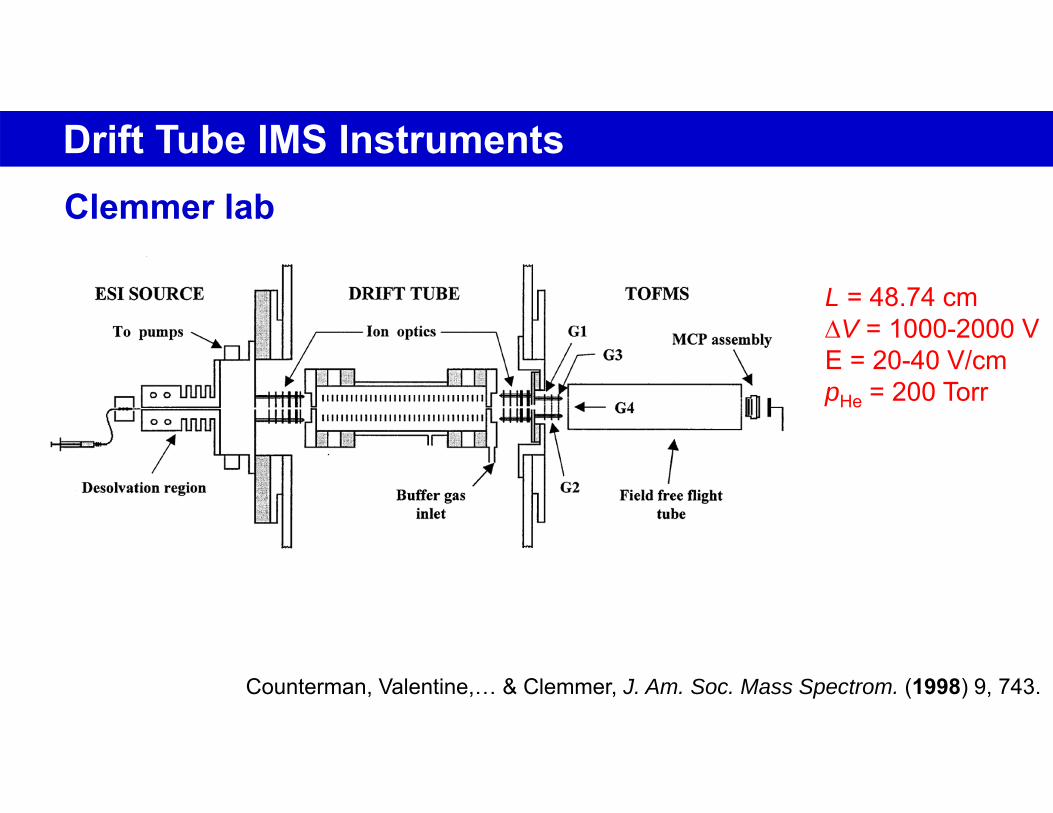
Drift Tube IMS InstrumentsClemmer lab
Counterman, Valentine,… & Clemmer, J. Am. Soc. Mass Spectrom. (1998) 9, 743.
L = 48.74 cmV = 1000-2000 VE = 20-40 V/cmpHe = 200 Torr
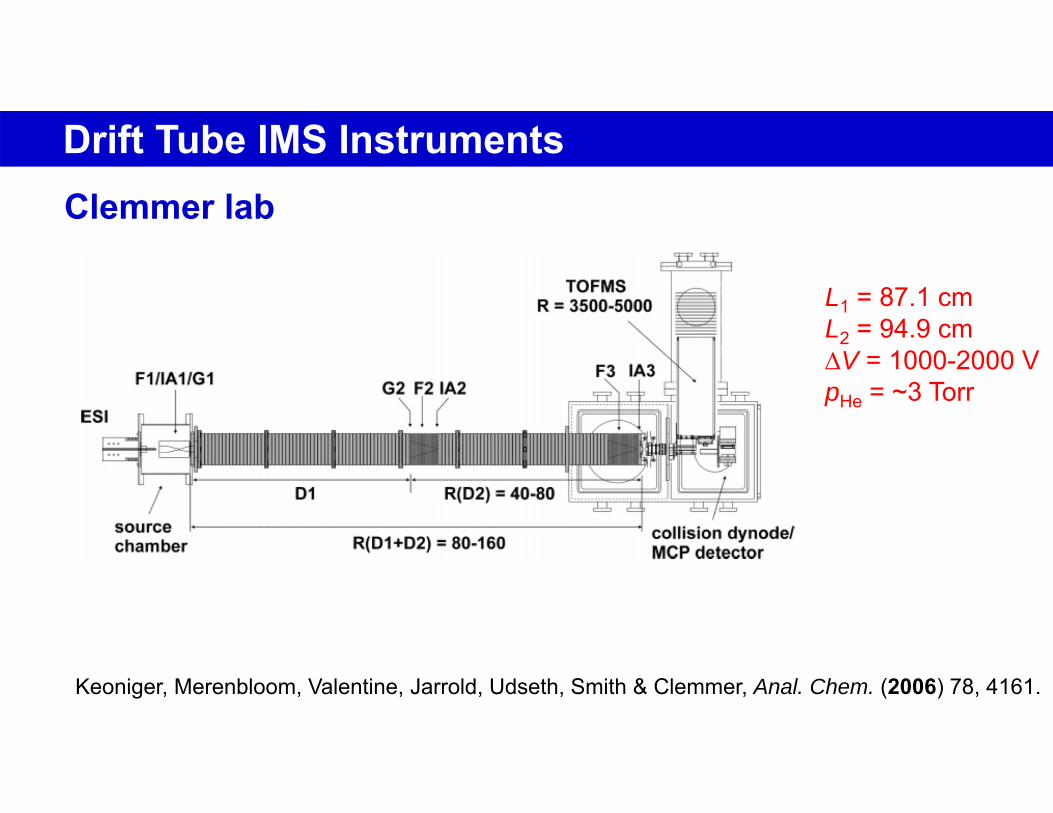
Drift Tube IMS InstrumentsClemmer lab
Keoniger, Merenbloom, Valentine, Jarrold, Udseth, Smith & Clemmer, Anal. Chem. (2006) 78, 4161.
L1 = 87.1 cmL2 = 94.9 cmV = 1000-2000 VpHe = ~3 Torr
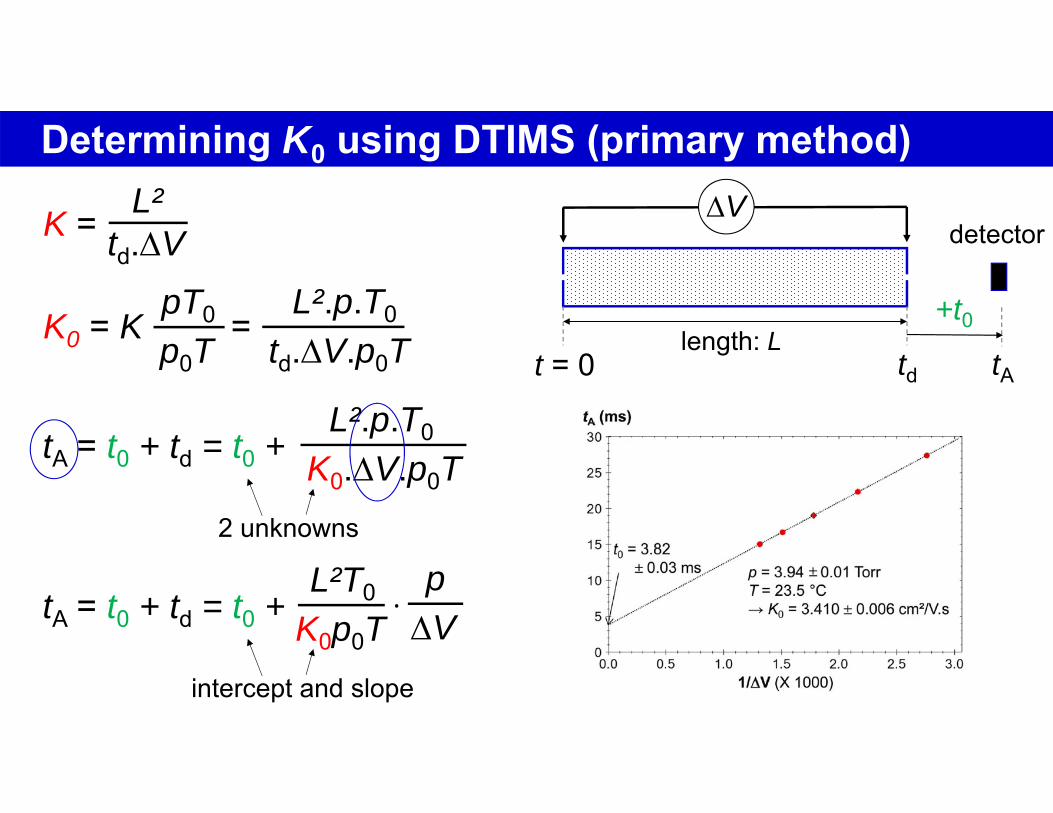
Determining K0 using DTIMS (primary method)
length: Lt = 0 td
VK = L²td.V
K0 = K =pT0
p0TL².p.T0
td.V.p0T tA
detector
+t0
tA = t0 + td = t0 +L².p.T0
K0.V.p0T2 unknowns
tA = t0 + td = t0 +L²T0
K0p0Tintercept and slope
pV
.
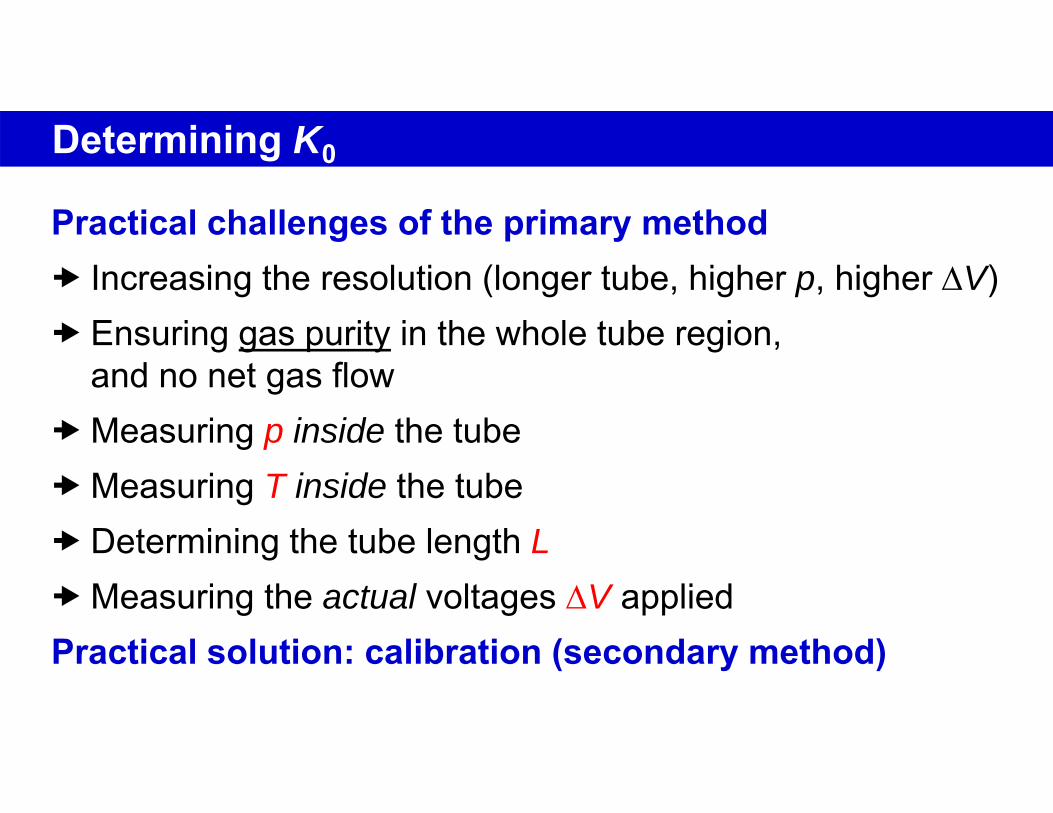
Determining K0
Practical challenges of the primary method Increasing the resolution (longer tube, higher p, higher V) Ensuring gas purity in the whole tube region,
and no net gas flowMeasuring p inside the tubeMeasuring T inside the tube Determining the tube length LMeasuring the actual voltages V appliedPractical solution: calibration (secondary method)

Calibration with compounds of known K0
Principle of "secondary methods of measurement":Instead of characterizing perfectly p, T, L, Vs and gas flowsfor each mobility measurement Calibrate instrument with compound(s) of known K0 value(s) and an appropriate mathematical function
DTIMS calibration, first order:
Approx: tA = tfix + 1K0 tA
1K0
tA = t0 + td = t0 +L²T0
K0p0TpV
.

Alternatives to home-made Drift Tube IMSDifferential Mobility Analyzers (DMA)
Travelling wave IMS (TWIMS)
Commercial DTIMS
Trapped ion mobility spectrometry (TIMS)
J. Fernandez de la Mora (<1998)SEADMAerosol sciences
K. GilesWaters SYNAPT™ (2006)Structural biology
F. Fernandez-Lima, M. ParkBruker timsTOF™ (2016)
PNNL designs (R. D. Smith)Agilent 6560 IMS-Q-TOF (2013)
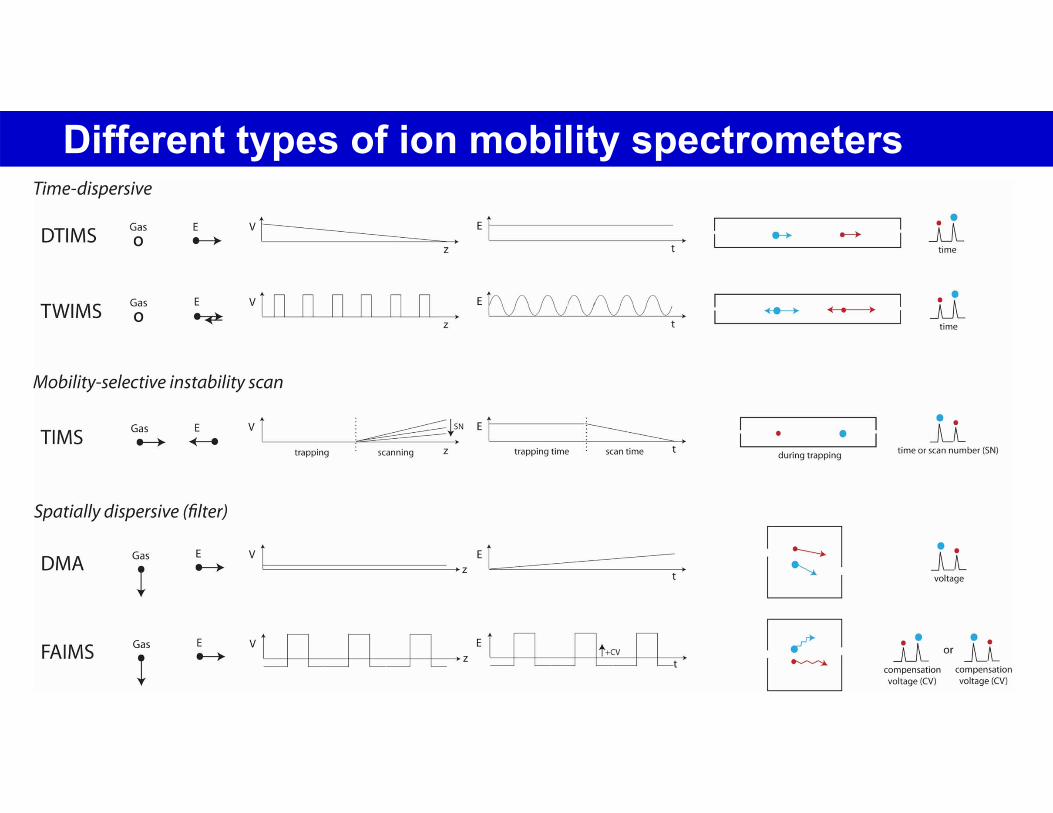
Different types of ion mobility spectrometers
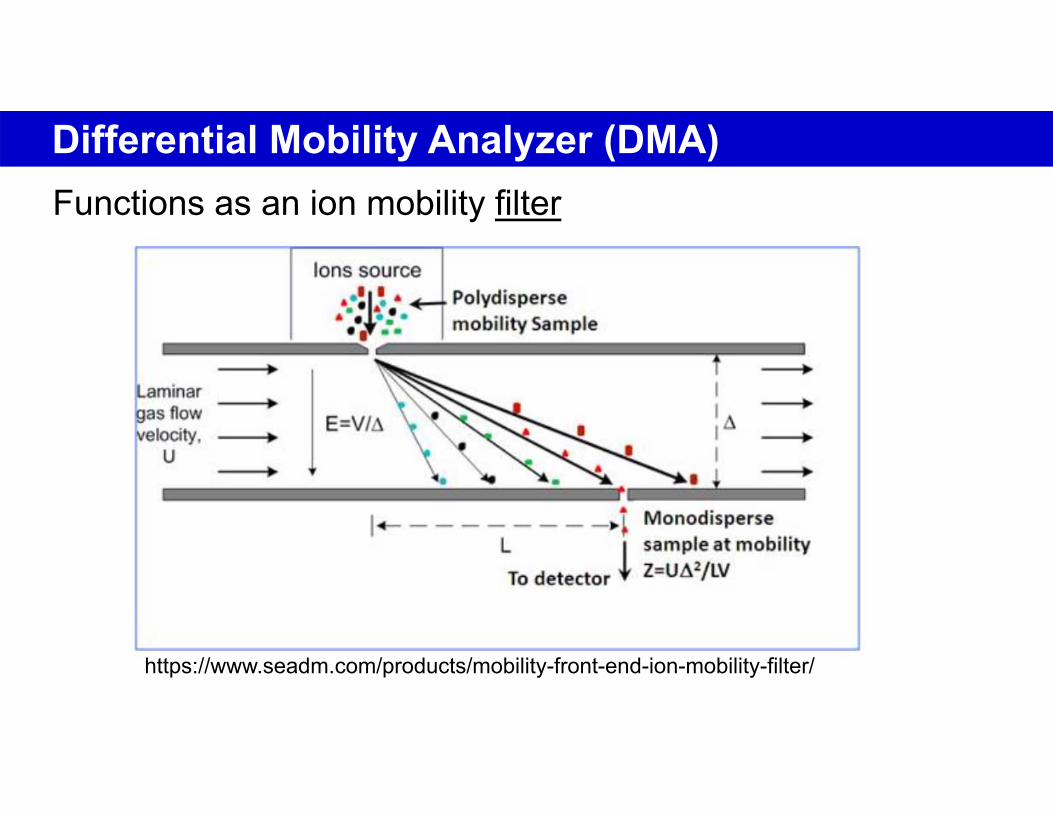
Differential Mobility Analyzer (DMA)
https://www.seadm.com/products/mobility-front-end-ion-mobility-filter/
Functions as an ion mobility filter

Calibration with compounds of known K0
Principle of "secondary methods of measurement":Instead of characterizing perfectly p, T, L, Vs and gas flowsfor each mobility measurement Calibrate instrument with compound(s) of known K0 value(s) and an appropriate mathematical function
DMA calibration:
K0(ion) = K0(calibrant)Vcalibrant
Vion
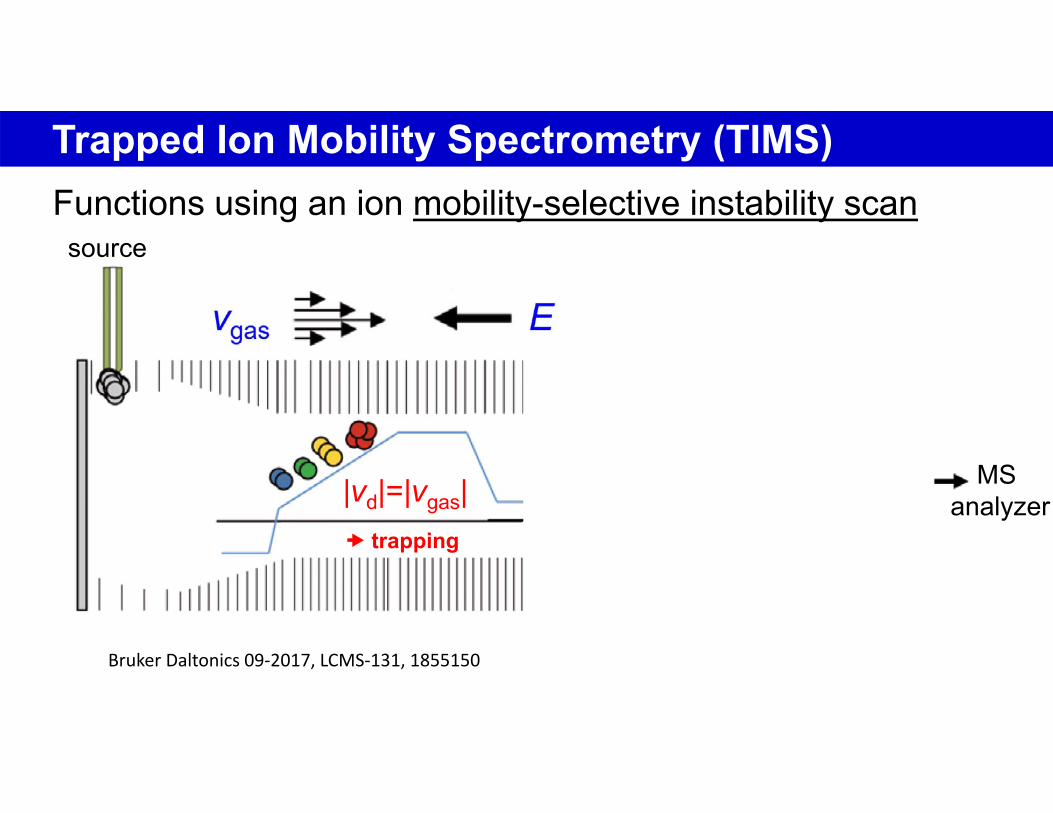
Trapped Ion Mobility Spectrometry (TIMS)Functions using an ion mobility-selective instability scan
Bruker Daltonics 09‐2017, LCMS‐131, 1855150
trapping scanning
source
MS analyzer
vgas E
|vd|=|vgas|

Trapped Ion Mobility Spectrometry (TIMS)Functions using an ion mobility-selective instability scan
Bruker Daltonics 09‐2017, LCMS‐131, 1855150
trapping scanning
source
MS analyzer
vgas E
|vd|=|vgas|

Calibration with compounds of known K0
Principle of "secondary methods of measurement":Instead of characterizing perfectly p, T, L, Vs and gas flowsfor each mobility measurement Calibrate instrument with compound(s) of known K0 value(s) and an appropriate mathematical function
TIMS calibration, first order:
Approx: K0 = a + b 1Velution
K0
1Ve
Travelling Wave Ion Mobility Spectrometry (TWIMS)
RF (-)
RF (+)
Ion ExitIon Entry
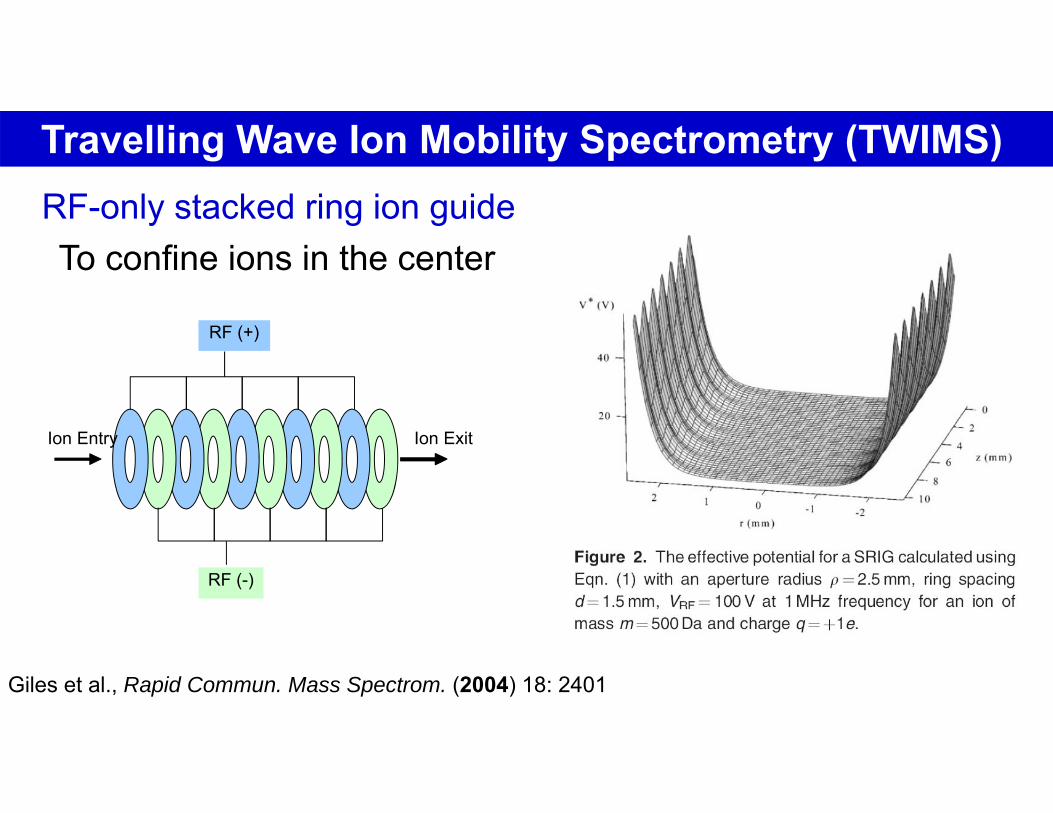
RF-only stacked ring ion guideTo confine ions in the center
Giles et al., Rapid Commun. Mass Spectrom. (2004) 18: 2401

Travelling Wave Ion Mobility Spectrometry (TWIMS)
RF (-)
RF (+)
Ion ExitIon Entry
RF-only stacked ring ion guideTo confine ions in the center
Giles et al., Rapid Commun. Mass Spectrom. (2004) 18: 2401
Travelling Wave Ion Mobility Spectrometry (TWIMS)
RF (-)
RF (+)
Ion ExitIon Entry
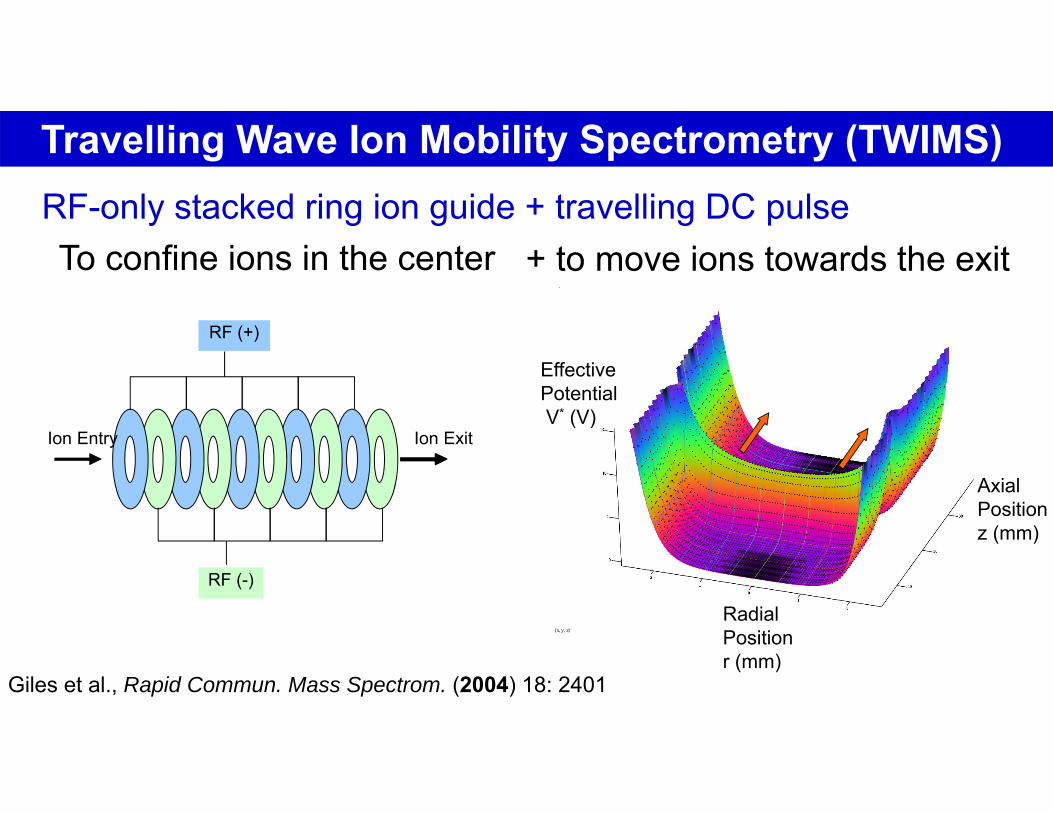
RF-only stacked ring ion guide + travelling DC pulse To confine ions in the center
Giles et al., Rapid Commun. Mass Spectrom. (2004) 18: 2401
+ to move ions towards the exitPot
x y z( )
Axial Positionz (mm)
Effective PotentialV* (V)
Radial Positionr (mm)
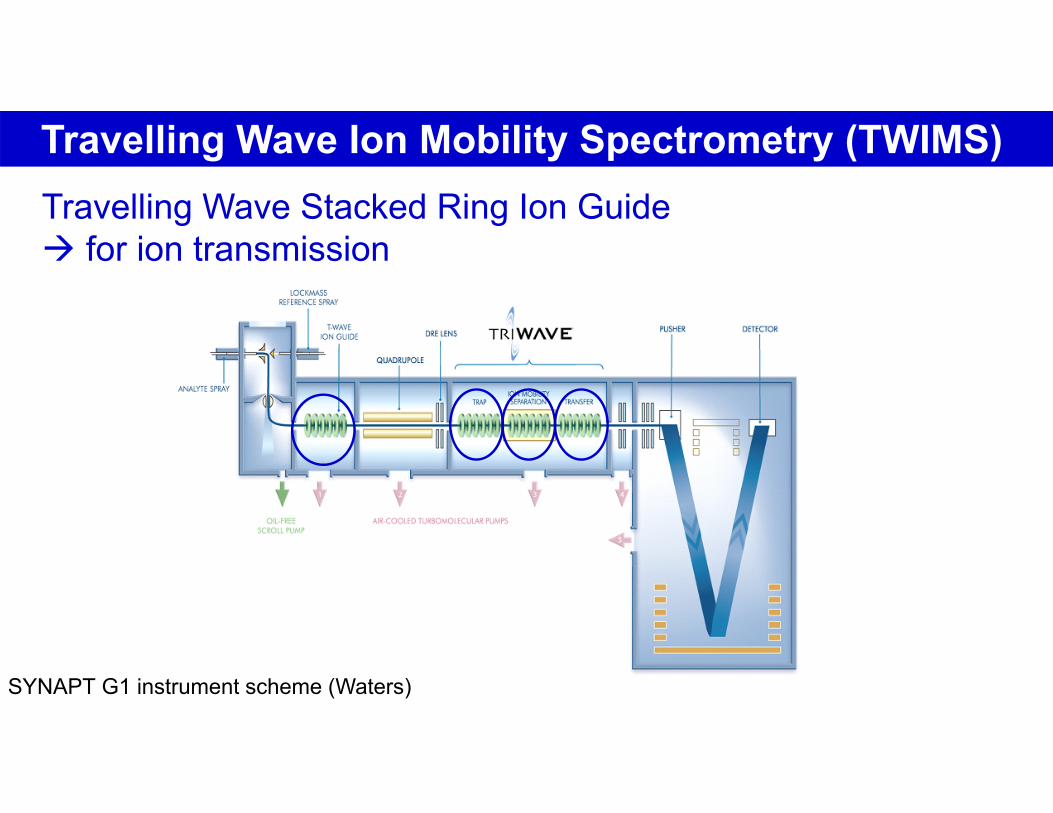
Travelling Wave Ion Mobility Spectrometry (TWIMS)Travelling Wave Stacked Ring Ion Guide for ion transmission
SYNAPT G1 instrument scheme (Waters)
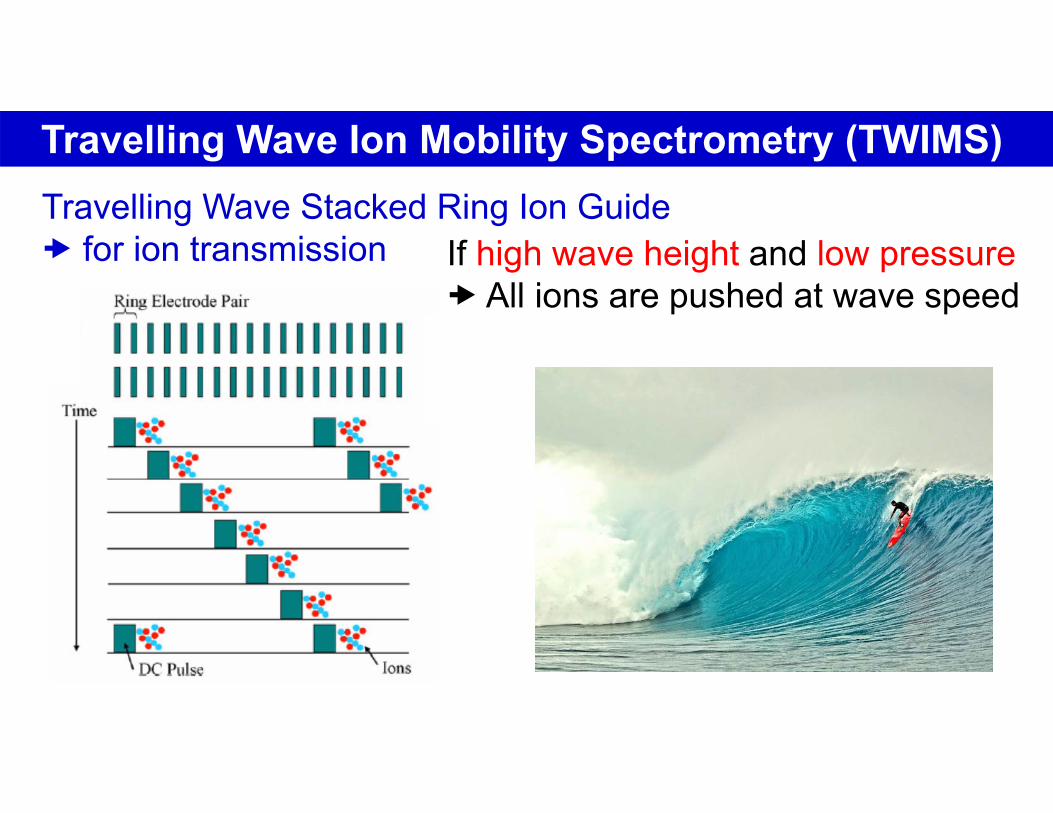
Travelling Wave Ion Mobility Spectrometry (TWIMS)Travelling Wave Stacked Ring Ion Guide for ion transmission If high wave height and low pressure
All ions are pushed at wave speed
All ions « surf » in front of the wave
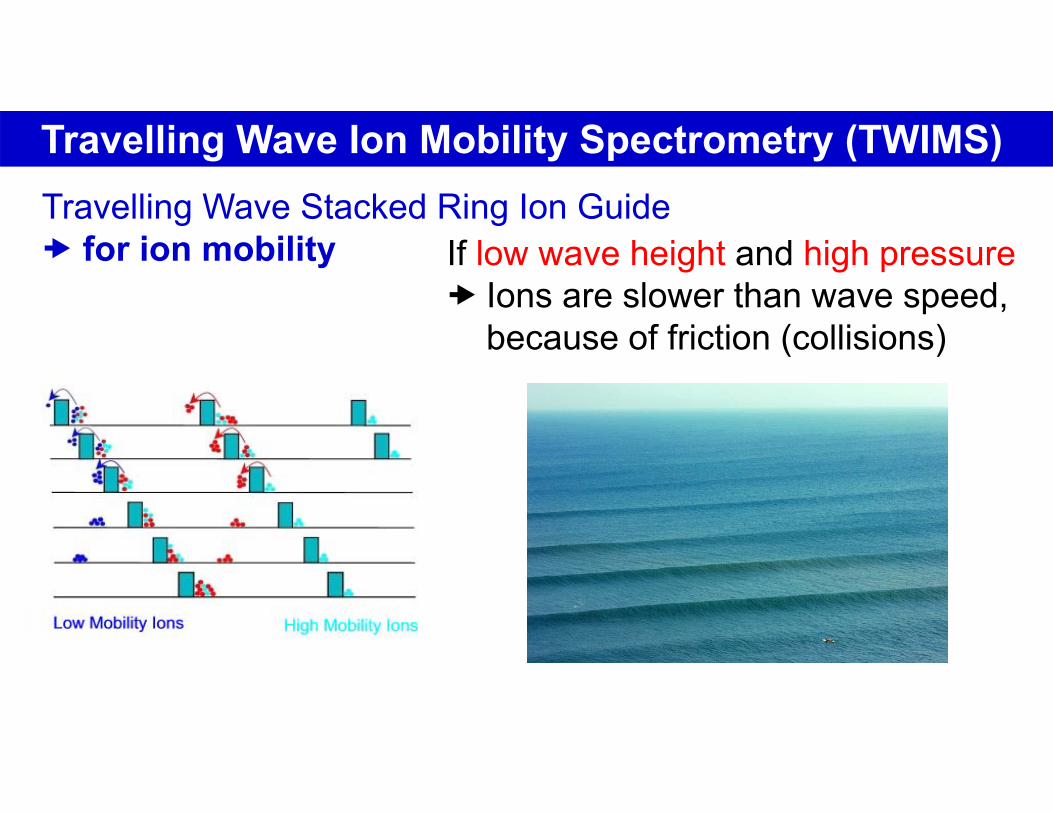
Travelling Wave Ion Mobility Spectrometry (TWIMS)Travelling Wave Stacked Ring Ion Guide for ion mobility If low wave height and high pressure
Ions are slower than wave speed, because of friction (collisions)
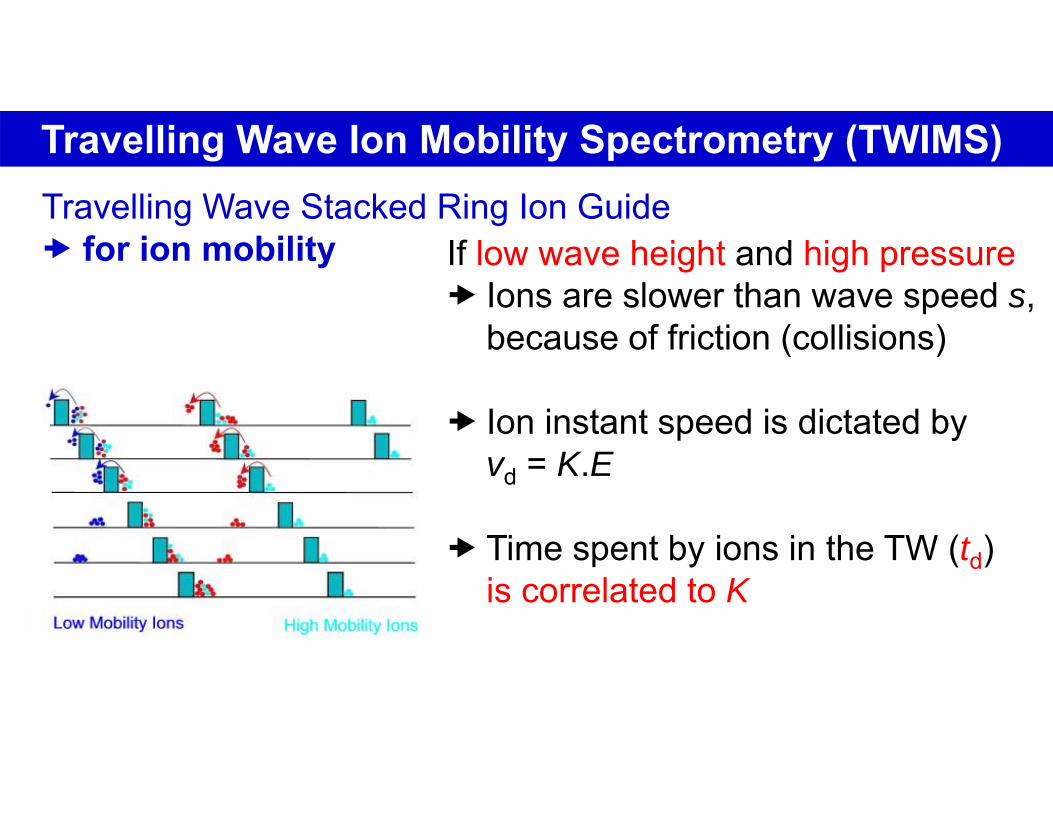
Travelling Wave Ion Mobility Spectrometry (TWIMS)Travelling Wave Stacked Ring Ion Guide for ion mobility If low wave height and high pressure
Ions are slower than wave speed s, because of friction (collisions)
Ion instant speed is dictated by vd = K.E
Time spent by ions in the TW (td) is correlated to K
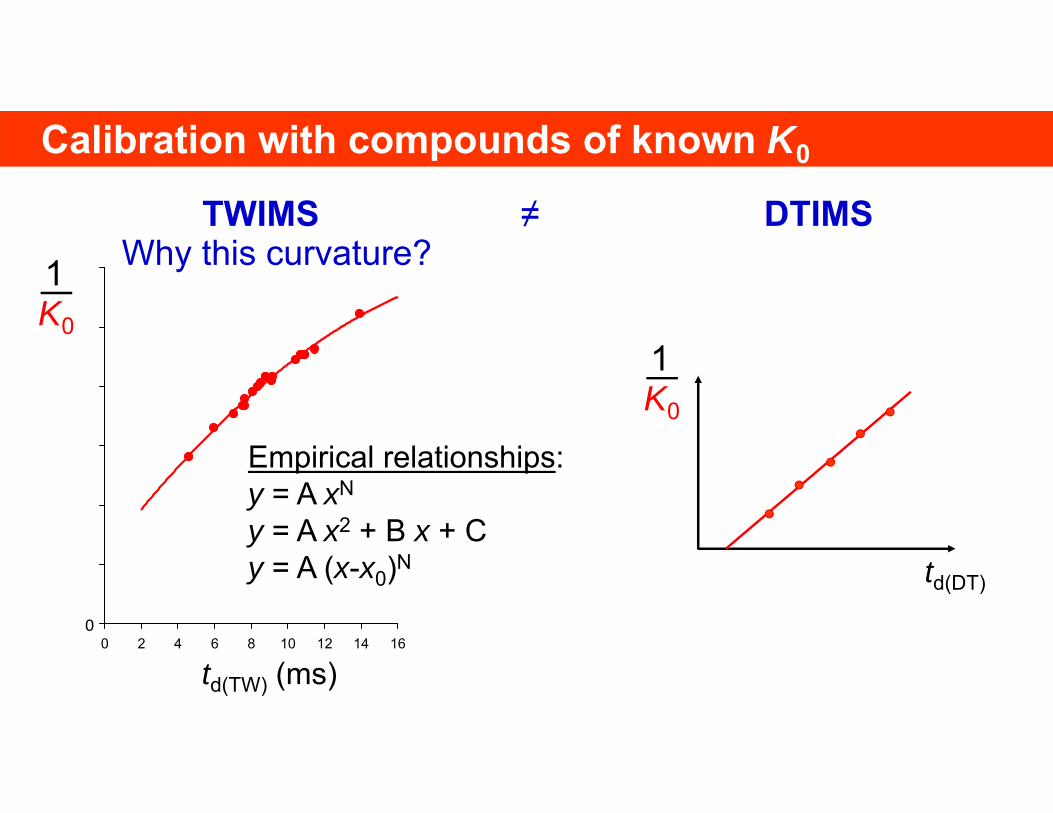
Calibration with compounds of known K0
1
0 2 4 6 8 10 12 14 16
td(TW) (ms)
K01K0
TWIMS DTIMS
td(DT)
0
≠
Empirical relationships:y = A xN
y = A x2 + B x + Cy = A (x-x0)N
Why this curvature?
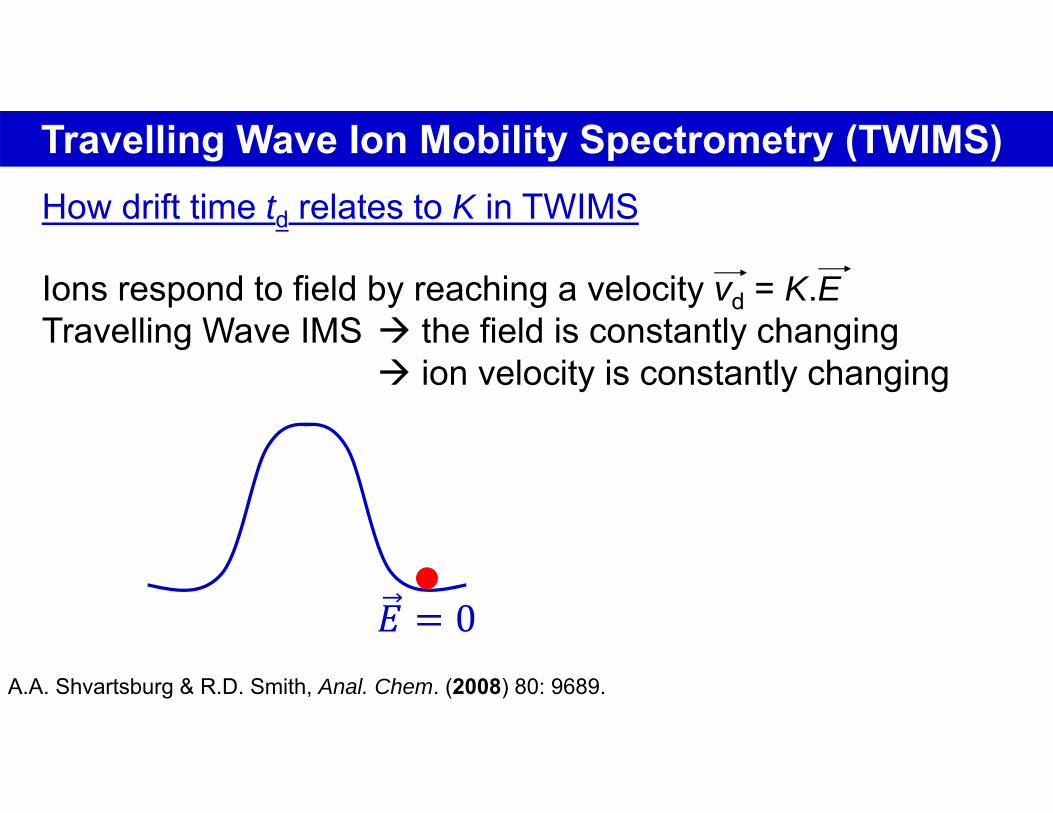
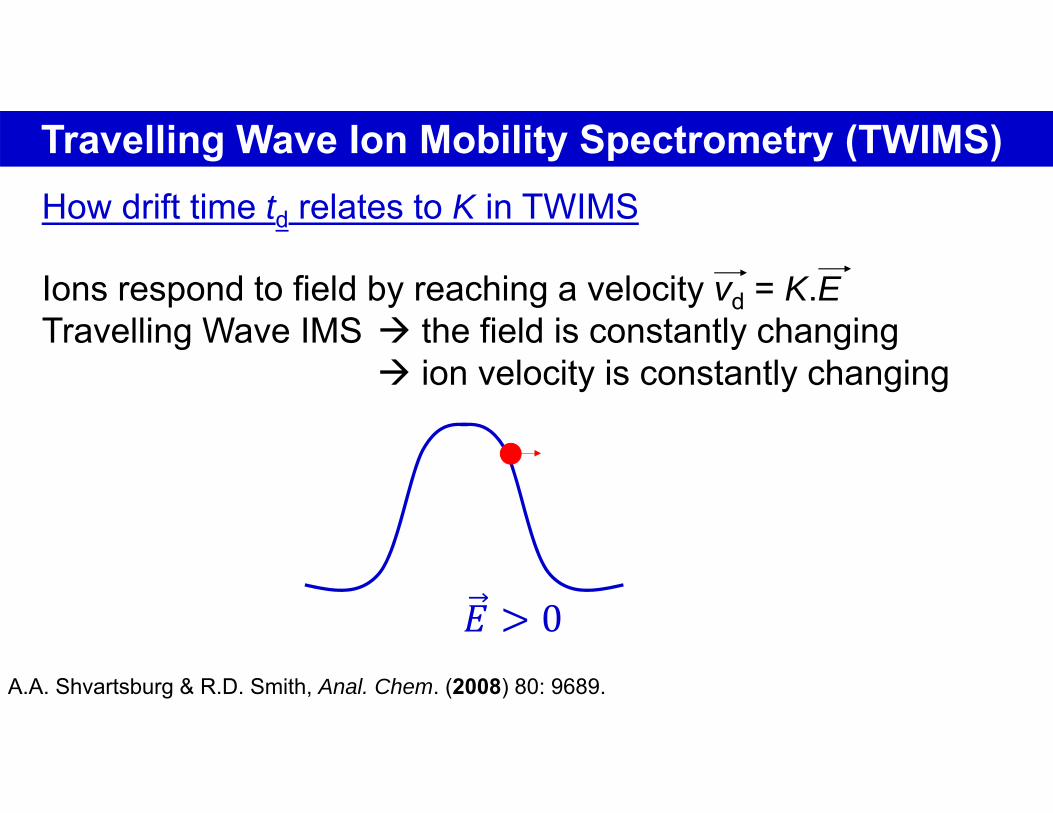
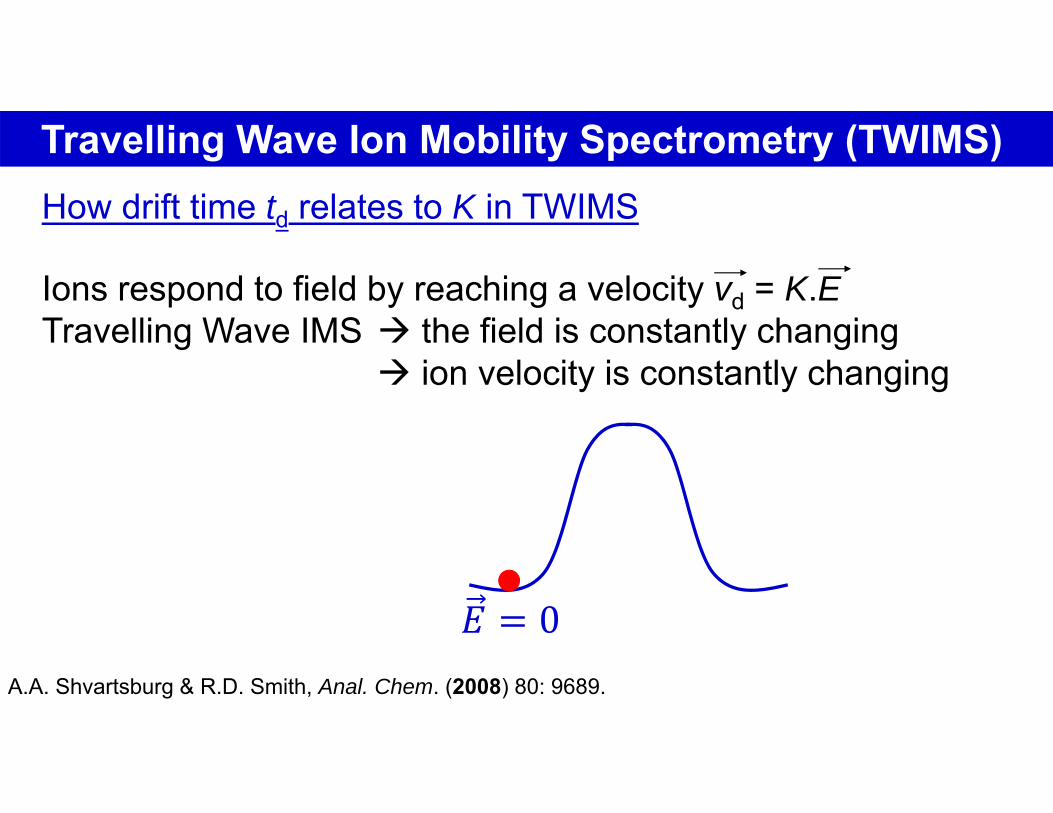
Travelling Wave Ion Mobility Spectrometry (TWIMS)How drift time td relates to K in TWIMS
A.A. Shvartsburg & R.D. Smith, Anal. Chem. (2008) 80: 9689.
Ions respond to field by reaching a velocity vd = K.ETravelling Wave IMS the field is constantly changing
ion velocity is constantly changing
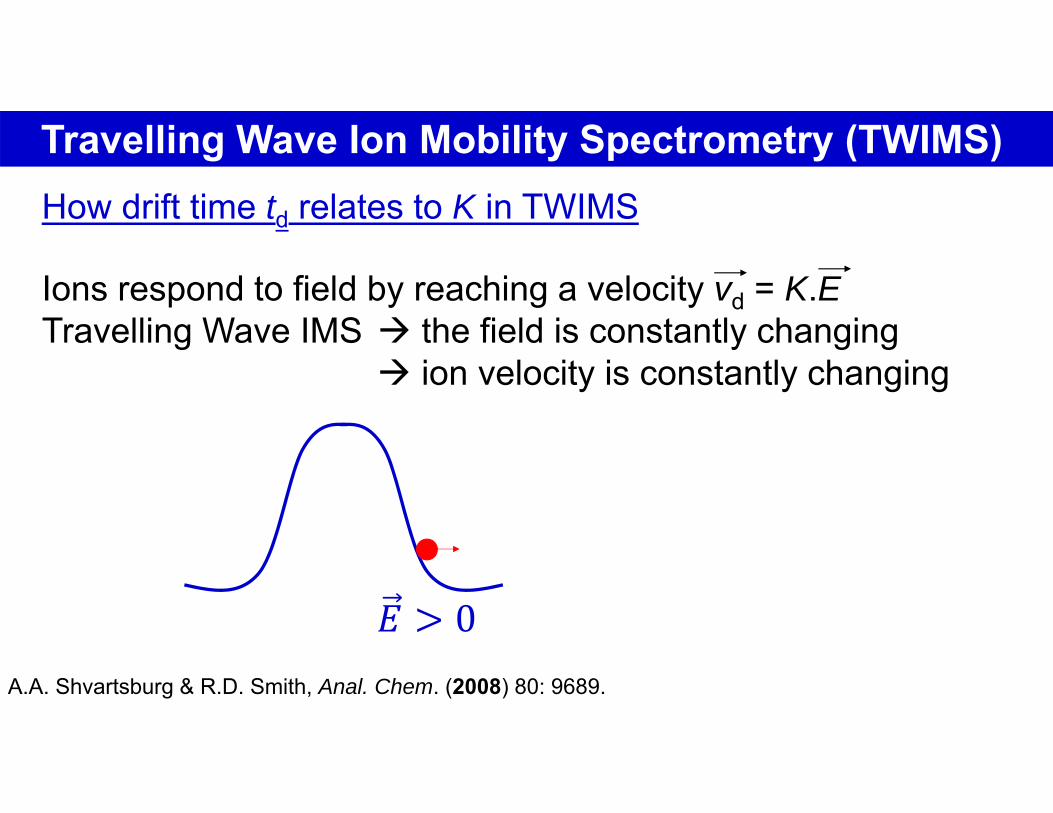
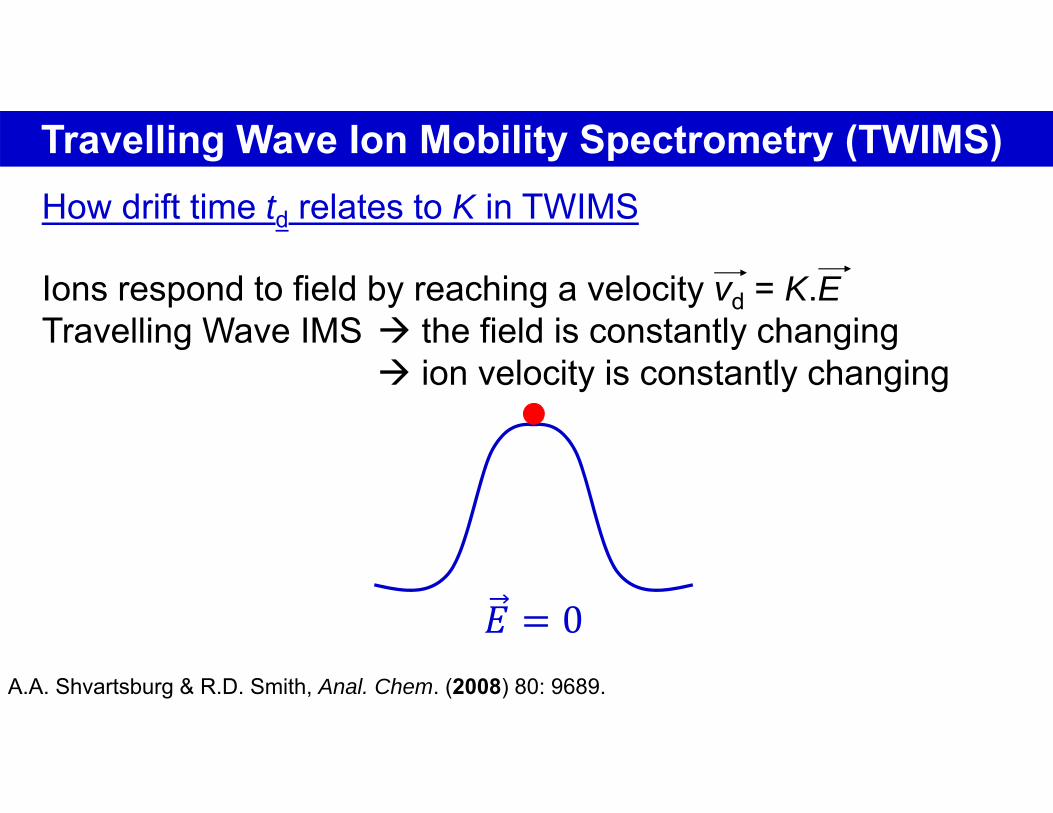
Travelling Wave Ion Mobility Spectrometry (TWIMS)How drift time td relates to K in TWIMS
A.A. Shvartsburg & R.D. Smith, Anal. Chem. (2008) 80: 9689.
Ions respond to field by reaching a velocity vd = K.ETravelling Wave IMS the field is constantly changing
ion velocity is constantly changing
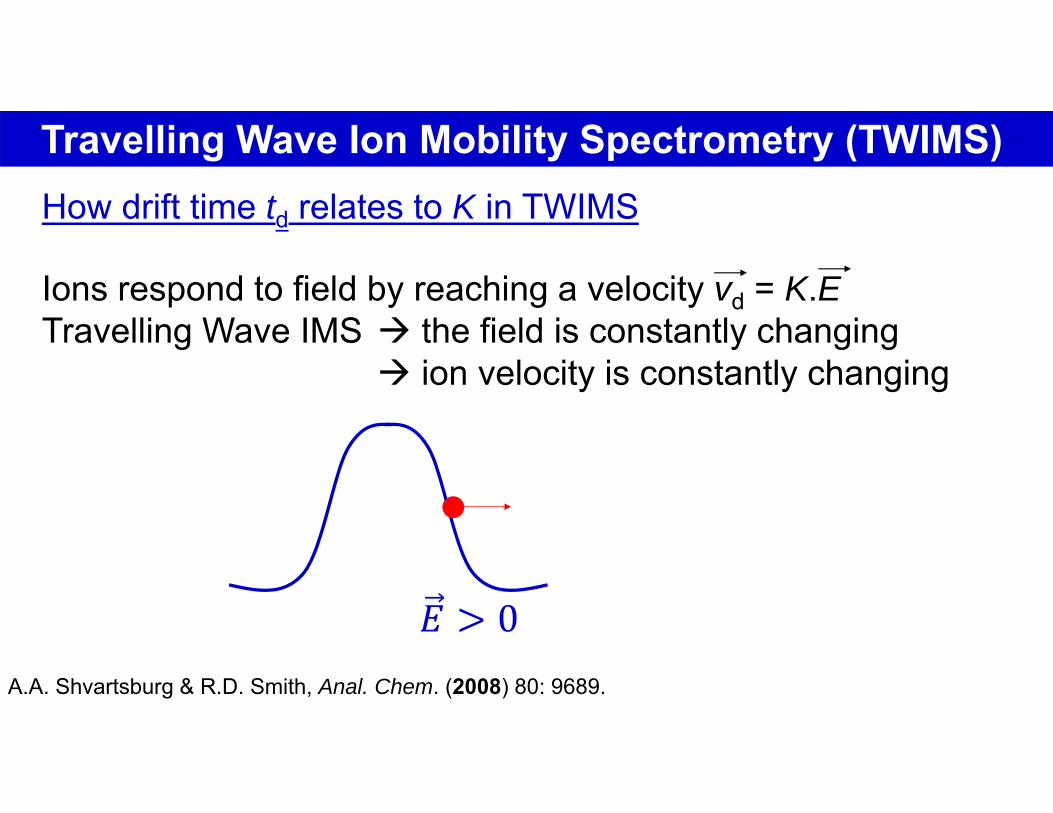
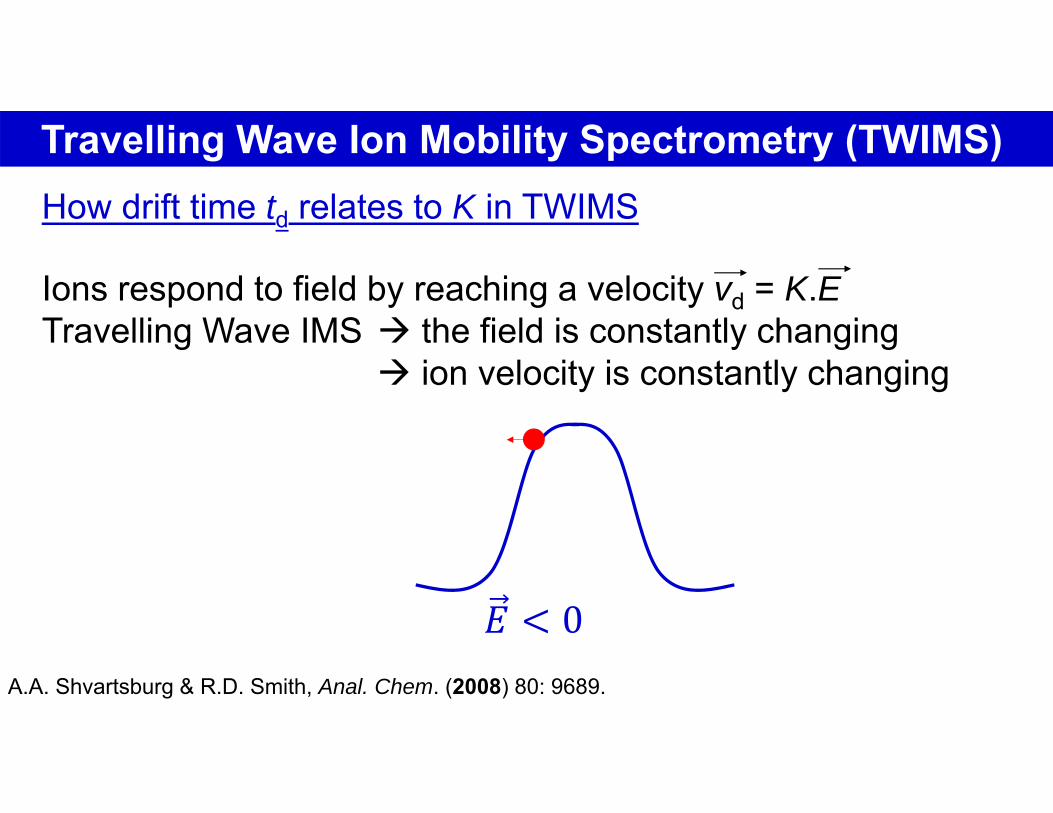
Travelling Wave Ion Mobility Spectrometry (TWIMS)How drift time td relates to K in TWIMS
A.A. Shvartsburg & R.D. Smith, Anal. Chem. (2008) 80: 9689.
Ions respond to field by reaching a velocity vd = K.ETravelling Wave IMS the field is constantly changing
ion velocity is constantly changing
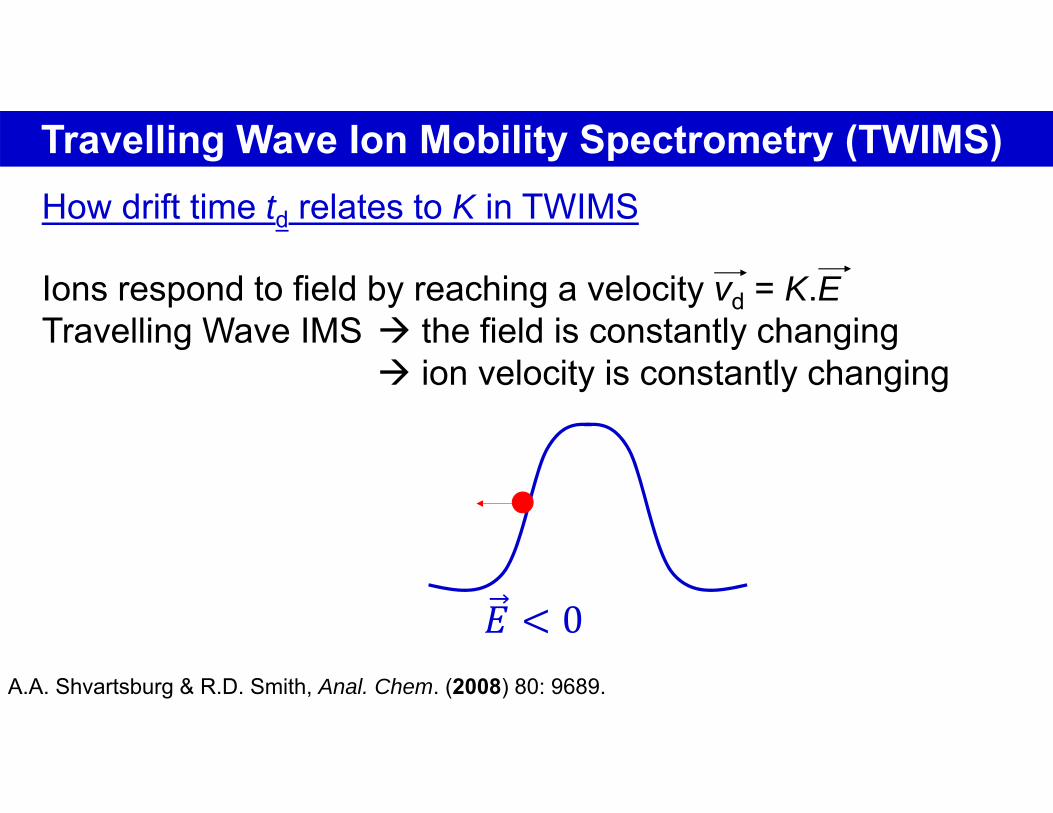
Travelling Wave Ion Mobility Spectrometry (TWIMS)How drift time td relates to K in TWIMS
A.A. Shvartsburg & R.D. Smith, Anal. Chem. (2008) 80: 9689.
Ions respond to field by reaching a velocity vd = K.ETravelling Wave IMS the field is constantly changing
ion velocity is constantly changing
Travelling Wave Ion Mobility Spectrometry (TWIMS)How drift time td relates to K in TWIMS
A.A. Shvartsburg & R.D. Smith, Anal. Chem. (2008) 80: 9689.
Ions respond to field by reaching a velocity vd = K.ETravelling Wave IMS the field is constantly changing
ion velocity is constantly changing
Travelling Wave Ion Mobility Spectrometry (TWIMS)How drift time td relates to K in TWIMS
A.A. Shvartsburg & R.D. Smith, Anal. Chem. (2008) 80: 9689.
Ions respond to field by reaching a velocity vd = K.ETravelling Wave IMS the field is constantly changing
ion velocity is constantly changing
Travelling Wave Ion Mobility Spectrometry (TWIMS)How drift time td relates to K in TWIMS
A.A. Shvartsburg & R.D. Smith, Anal. Chem. (2008) 80: 9689.
Ions respond to field by reaching a velocity vd = K.ETravelling Wave IMS the field is constantly changing
ion velocity is constantly changing
Travelling Wave Ion Mobility Spectrometry (TWIMS)How drift time td relates to K in TWIMS
A.A. Shvartsburg & R.D. Smith, Anal. Chem. (2008) 80: 9689.
Ions respond to field by reaching a velocity vd = K.ETravelling Wave IMS the field is constantly changing
ion velocity is constantly changing
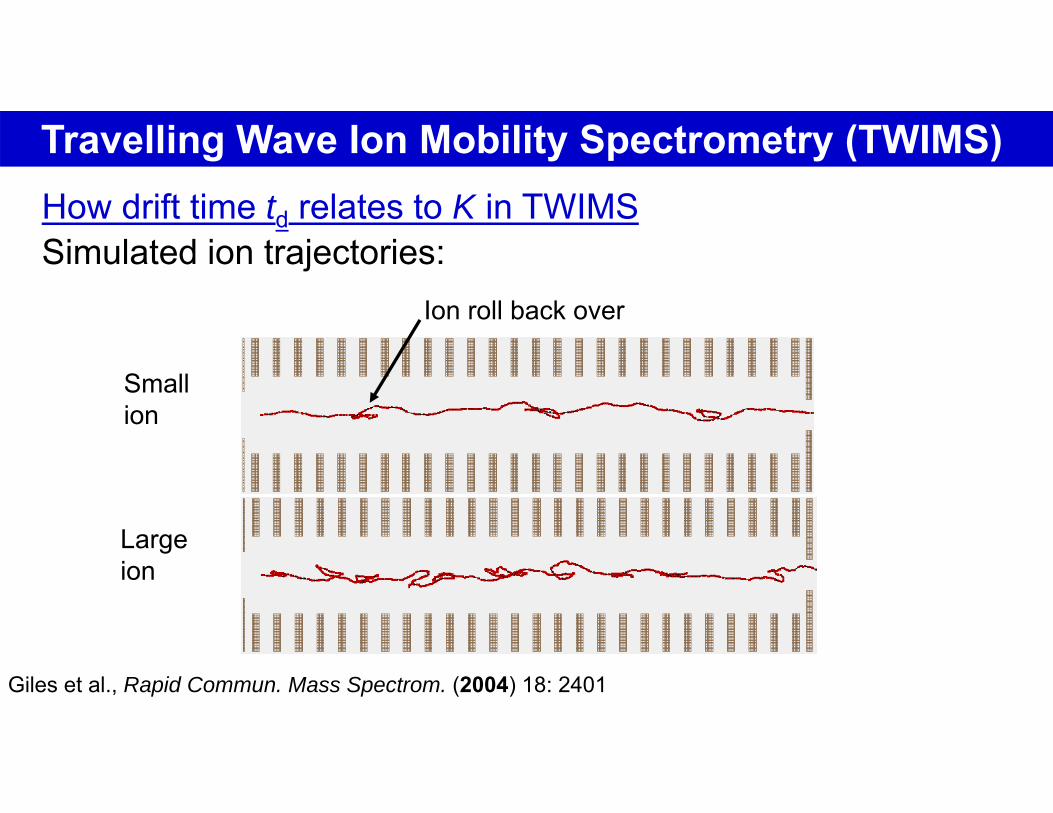
Travelling Wave Ion Mobility Spectrometry (TWIMS)How drift time td relates to K in TWIMS
Ion roll back over
Small ion
Large ion
Giles et al., Rapid Commun. Mass Spectrom. (2004) 18: 2401
Simulated ion trajectories:
Travelling Wave Ion Mobility Spectrometry (TWIMS)How drift time td relates to K in TWIMS
A.A. Shvartsburg & R.D. Smith, Anal. Chem. (2008) 80: 9689.
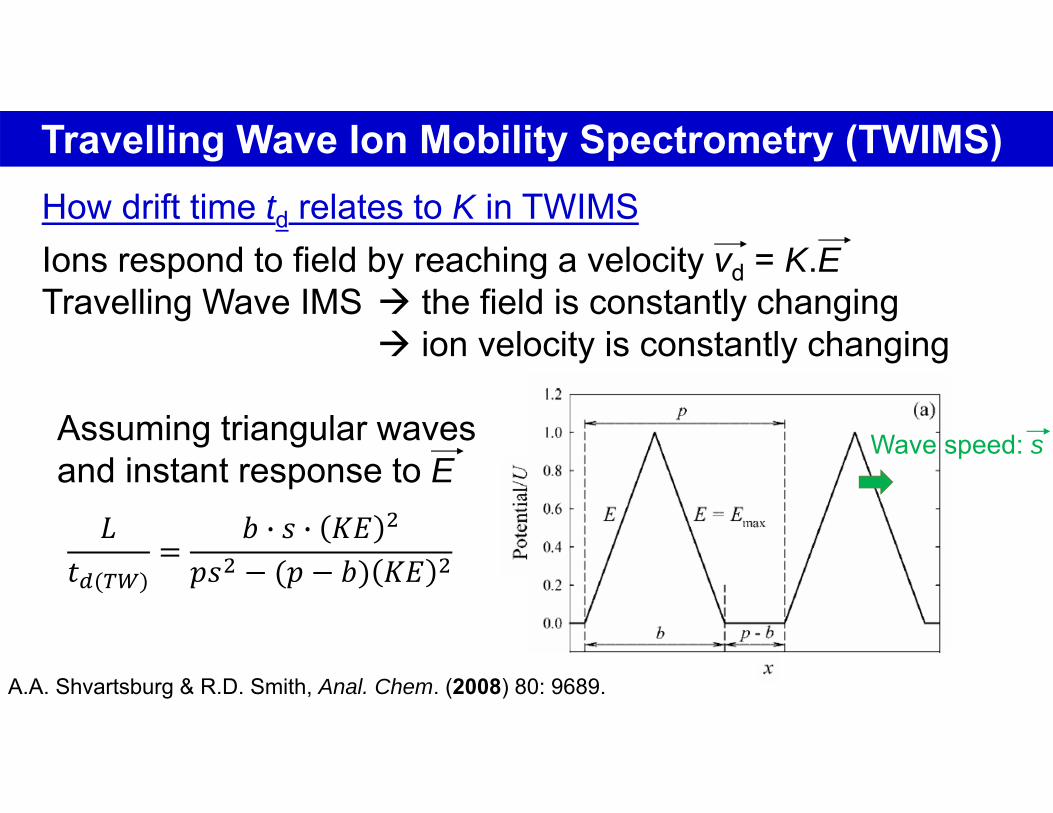
Ions respond to field by reaching a velocity vd = K.ETravelling Wave IMS the field is constantly changing
ion velocity is constantly changing
Wave speed: s
𝐿𝑡
𝑏 · 𝑠 · 𝐾𝐸𝑝𝑠 𝑝 𝑏 𝐾𝐸
Assuming triangular wavesand instant response to E
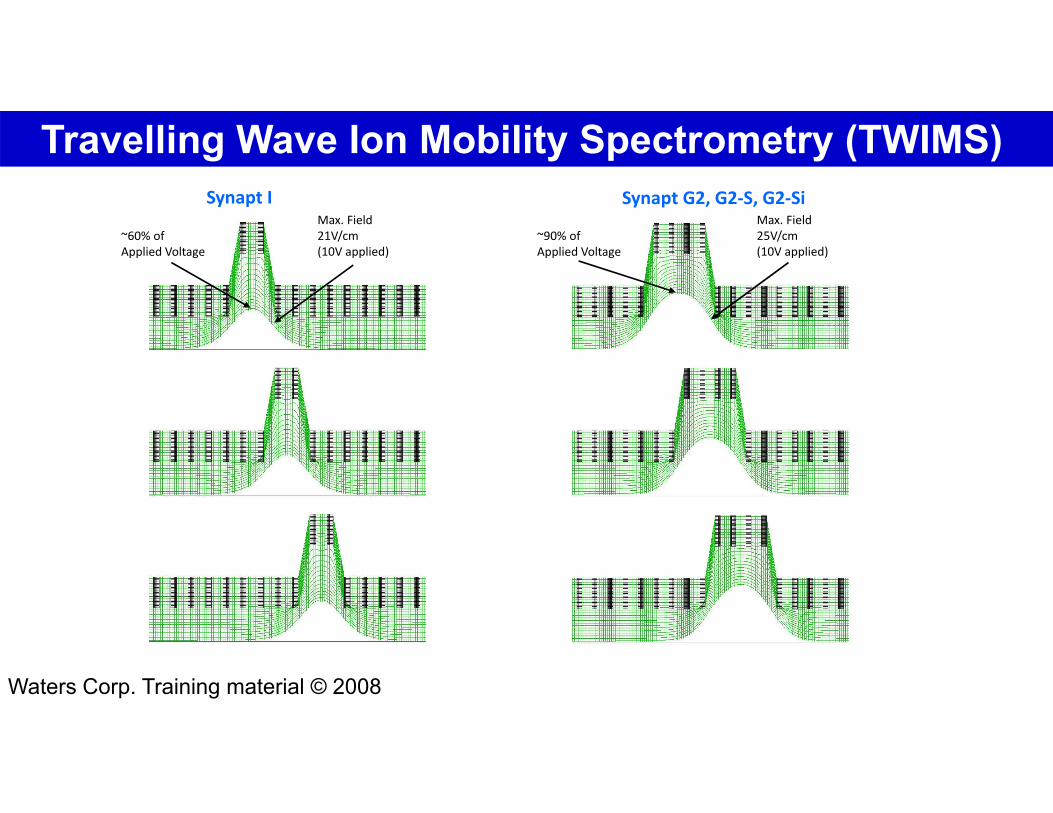
Travelling Wave Ion Mobility Spectrometry (TWIMS)
Waters Corp. Training material © 2008
~90% of Applied Voltage
Max. Field 25V/cm(10V applied)
Synapt I
~60% of Applied Voltage
Synapt G2, G2‐S, G2‐SiMax. Field 21V/cm(10V applied)
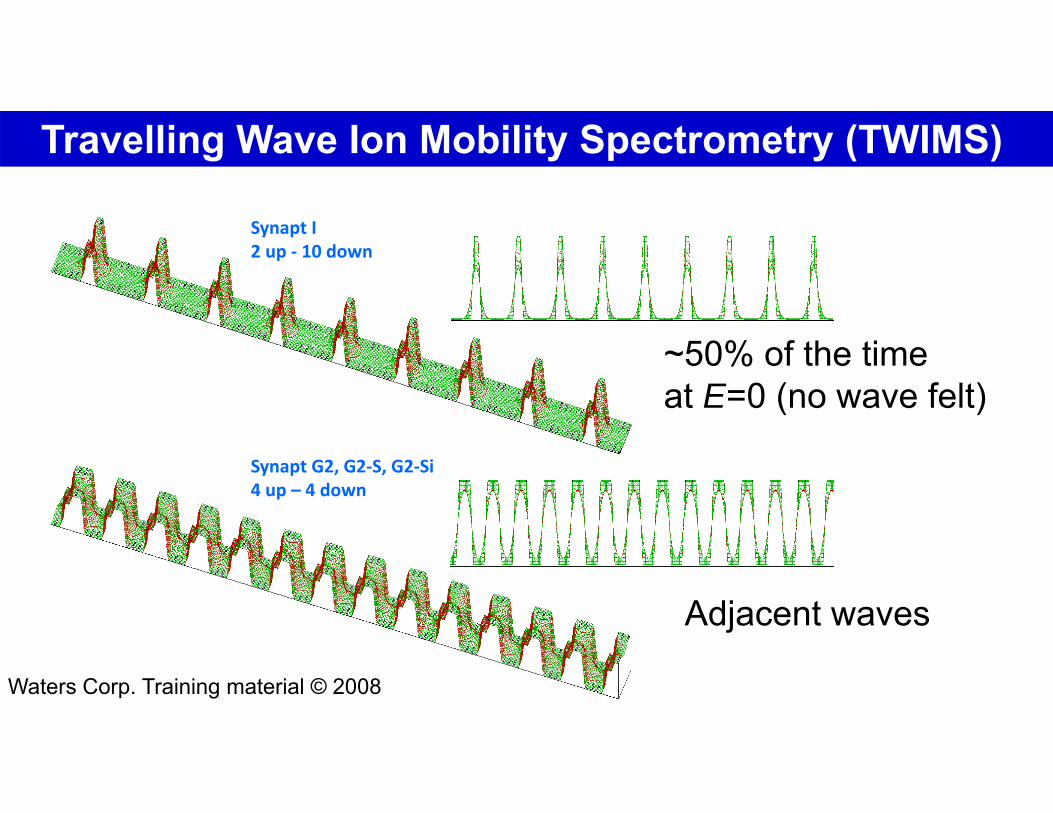
Synapt I2 up ‐ 10 down
Synapt G2, G2‐S, G2‐Si4 up – 4 down
Adjacent waves
~50% of the time at E=0 (no wave felt)
Travelling Wave Ion Mobility Spectrometry (TWIMS)
Waters Corp. Training material © 2008

Travelling Wave Ion Mobility Spectrometry (TWIMS)How drift time td relates to K in TWIMS
A.A. Shvartsburg & R.D. Smith, Anal. Chem. (2008) 80: 9689.
Ions respond to field by reaching a velocity vd = K.ETravelling Wave IMS the field is constantly changing
ion velocity is constantly changing
𝐿𝑡
𝑏 · 𝑠 · 𝐾𝐸𝑝𝑠 𝑝 𝑏 𝐾𝐸
Assuming triangular wavesand instant response to E
Synapt ISynapt G2, G2-S, G2-Si
p=2bp=b
𝑡𝐿 · 𝑠𝐾𝐸
1𝐾 ∝ 𝐴 · 𝑡 .

Calibration of TWIMS
1
0 2 4 6 8 10 12 14 16
td(TW) (ms)
K01K0
TWIMS DTIMS
td(DT)
0
≠
Empirical relationships:y = A xN
y = A x2 + B x + Cy = A (x-x0)N
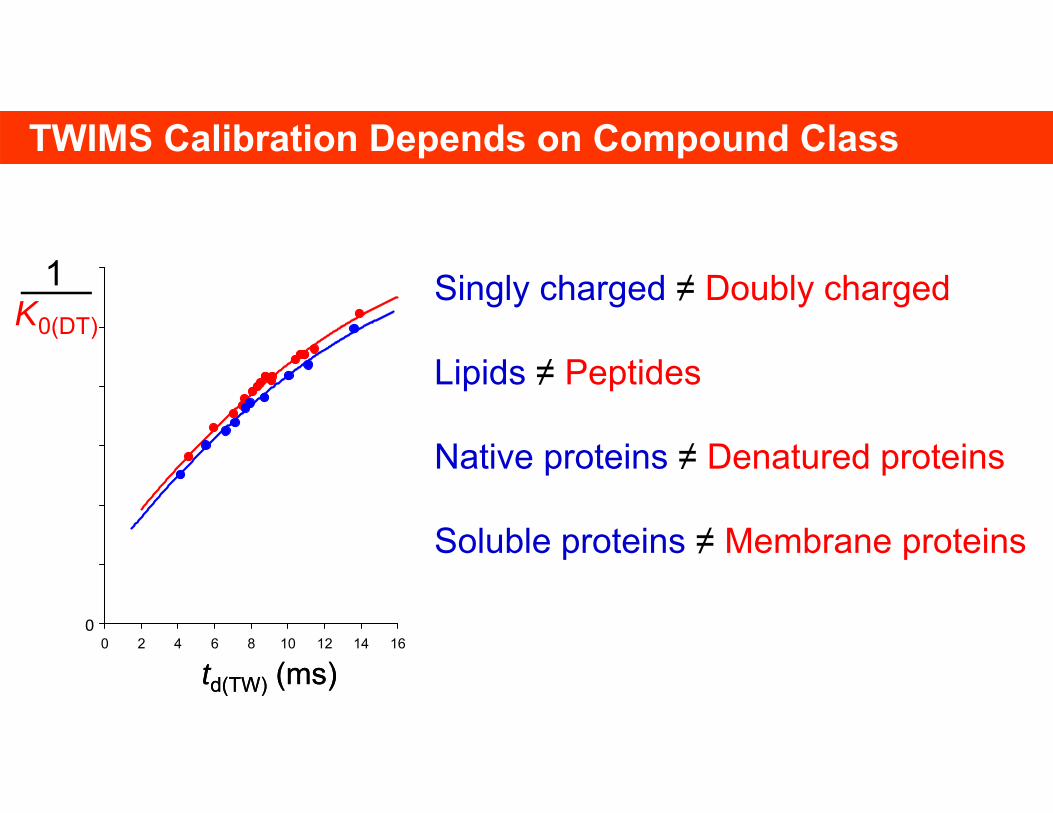
1
0 2 4 6 8 10 12 14 16
td(TW) (ms)
K0(DT)
td(TW) (ms)
0
Singly charged ≠ Doubly charged
Lipids ≠ Peptides
Native proteins ≠ Denatured proteins
Soluble proteins ≠ Membrane proteins
TWIMS Calibration Depends on Compound Class
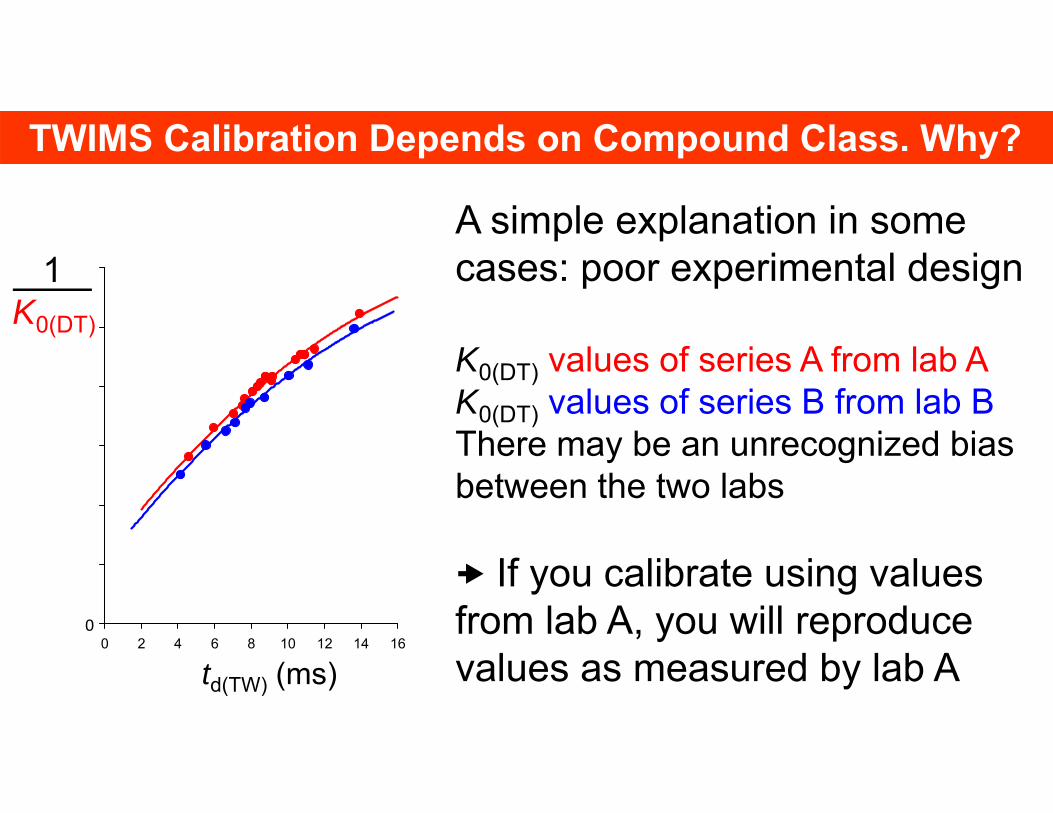
TWIMS Calibration Depends on Compound Class. Why?
1
0 2 4 6 8 10 12 14 16
td(TW) (ms)
K0(DT)
0
A simple explanation in somecases: poor experimental design
K0(DT) values of series A from lab AK0(DT) values of series B from lab BThere may be an unrecognized biasbetween the two labs
If you calibrate using values from lab A, you will reproducevalues as measured by lab A
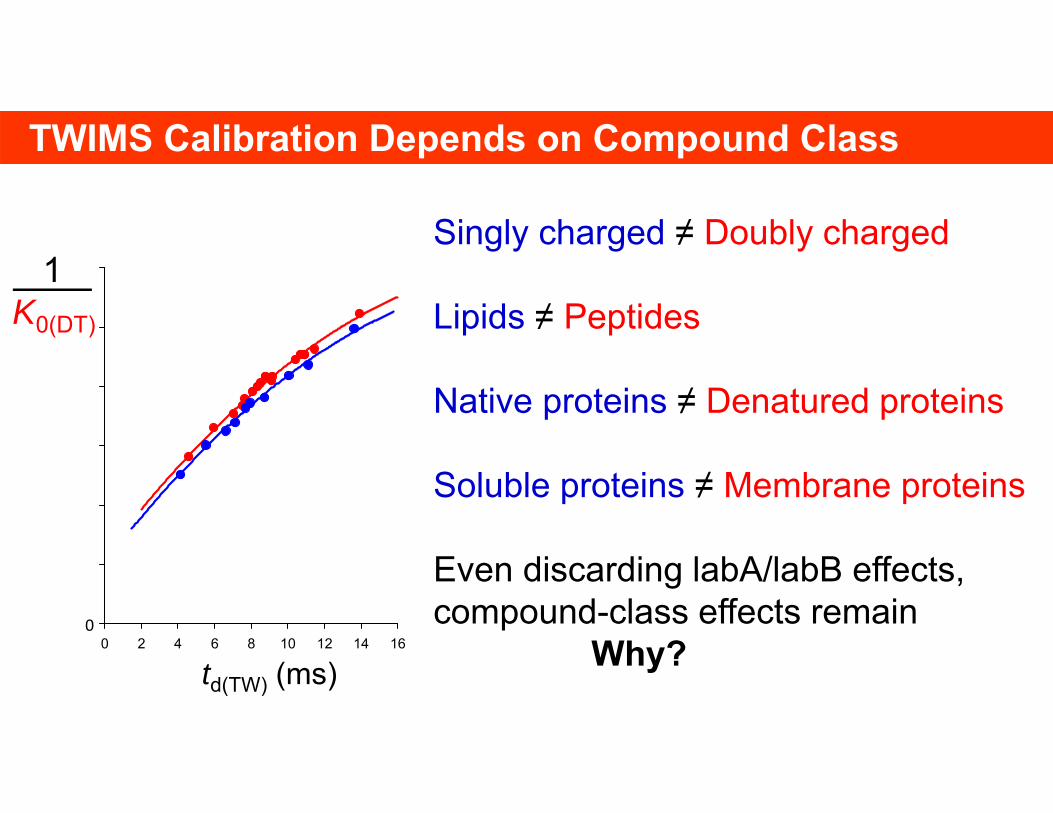
Singly charged ≠ Doubly charged
Lipids ≠ Peptides
Native proteins ≠ Denatured proteins
Soluble proteins ≠ Membrane proteins
Even discarding labA/labB effects, compound-class effects remain
Why?
TWIMS Calibration Depends on Compound Class
1
0 2 4 6 8 10 12 14 16
td(TW) (ms)
K0(DT)
0

TWIMS Calibration Depends on Compound Class. Why?
1
0 2 4 6 8 10 12 14 16
td(TW) (ms)
K0(DT)
0
Hypothesis 1:K0(TW) ≠ K0(DT)And the relationship depends on compound class
How cound K0 be differentin DT and in TW?

Influence of pressure and temperature on K
One reason T and p influence K is collision frequency
K0 = K = KNN0
pT0
p0TThe reduced mobility K0 corrects for collision frequency effects
The ion’s reduced mobility K0 still depends on T, p and Efor other reasons

Effect of E/N on K0
Is the "low E/N" assumption justified?
The value of the low field limit (E/N, in Td) is unknownIt depends on - the ion
- the collision gas- the measurement precision
Low-field limit criterion: vd << vthermal
How much is vthermal? 𝑣8 𝑘 𝑇
𝜋𝜇𝜇
𝑚 𝑚𝑚 𝑚
= reduced mass
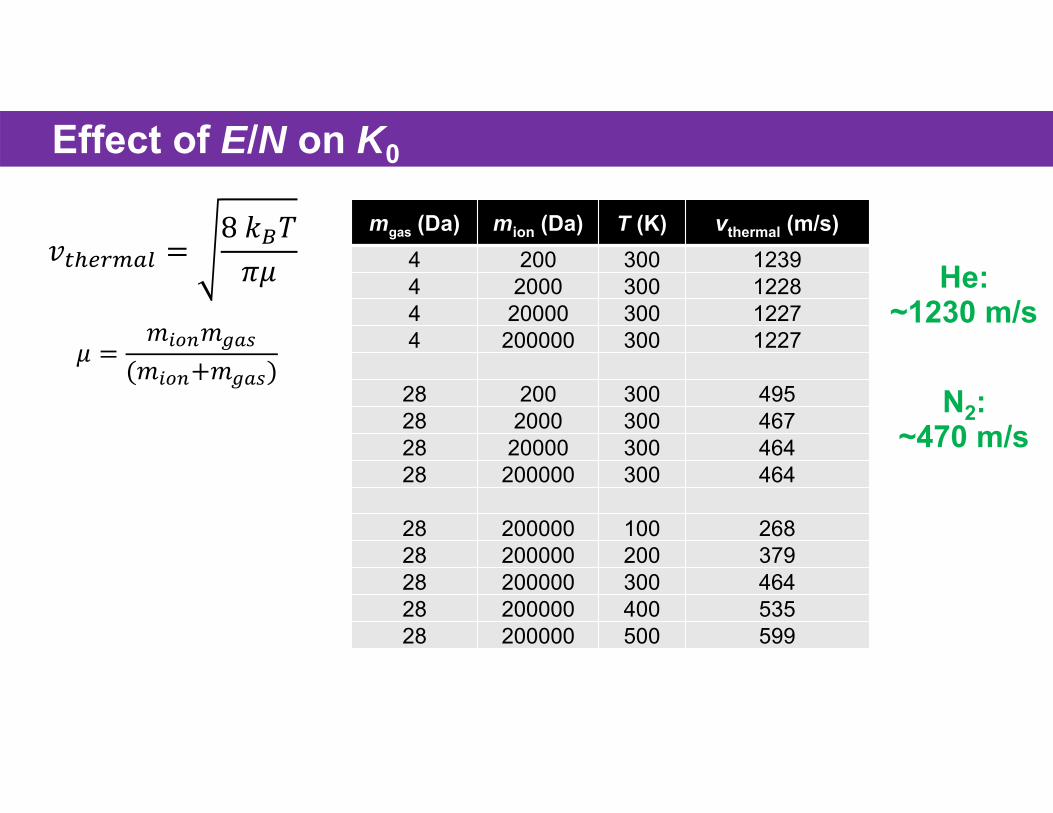
mgas (Da) mion (Da) T (K) vthermal (m/s)4 200 300 12394 2000 300 12284 20000 300 12274 200000 300 1227
28 200 300 49528 2000 300 46728 20000 300 46428 200000 300 464
28 200000 100 26828 200000 200 37928 200000 300 46428 200000 400 53528 200000 500 599
Effect of E/N on K0
𝑣8 𝑘 𝑇
𝜋𝜇 He:
𝜇𝑚 𝑚
𝑚 𝑚
~1230 m/s
N2:~470 m/s
Effect of E/N on K0
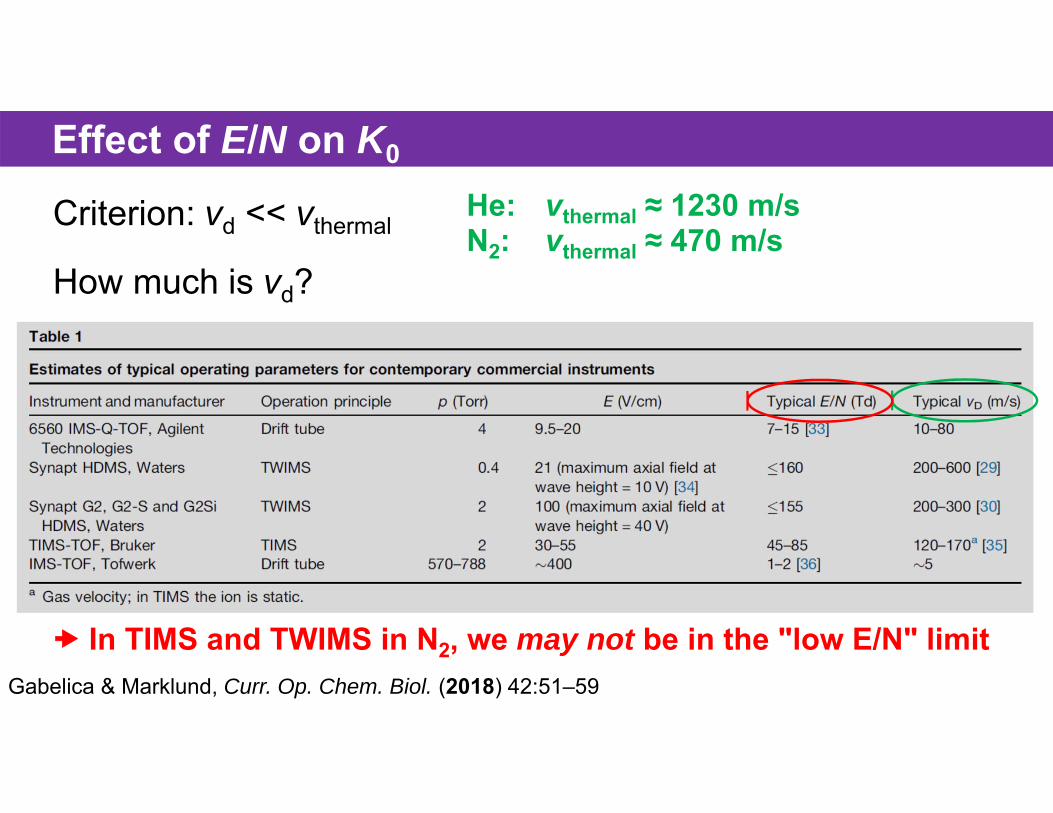
He: vthermal ≈ 1230 m/sN2: vthermal ≈ 470 m/s
Criterion: vd << vthermal
How much is vd?
In TIMS and TWIMS in N2, we may not be in the "low E/N" limitGabelica & Marklund, Curr. Op. Chem. Biol. (2018) 42:51–59
Effect of E/N on K0
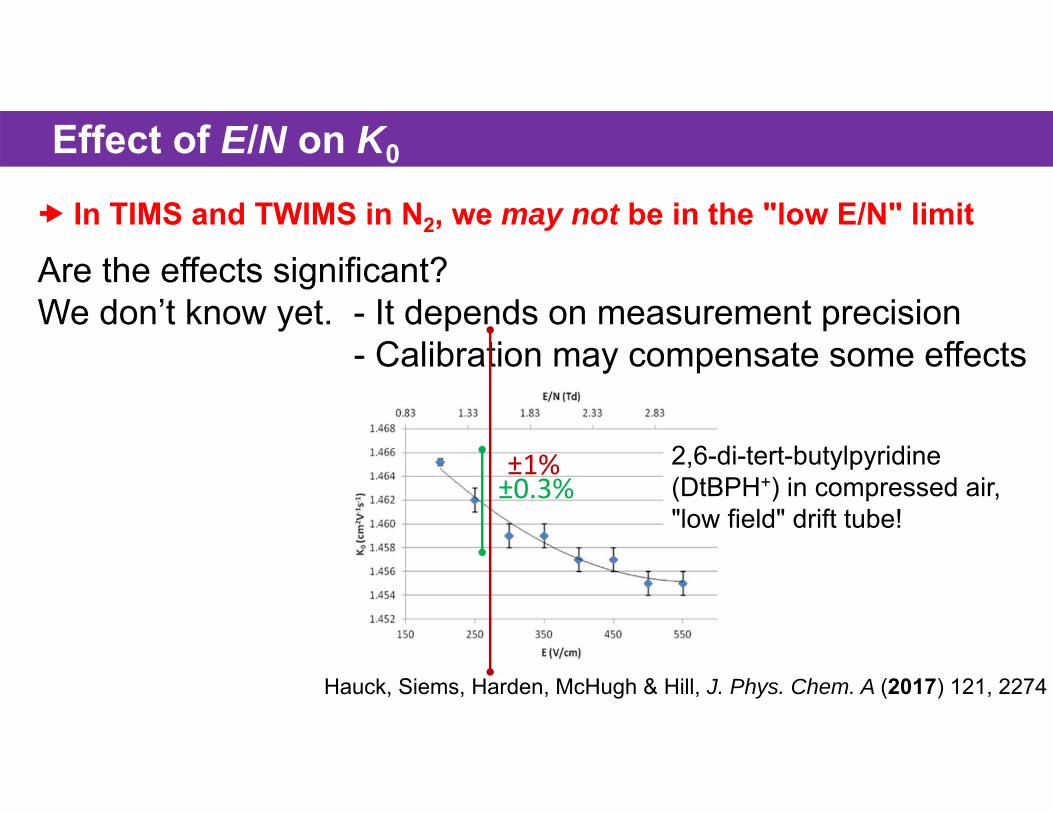
In TIMS and TWIMS in N2, we may not be in the "low E/N" limit
Are the effects significant?We don’t know yet. - It depends on measurement precision
- Calibration may compensate some effects
Hauck, Siems, Harden, McHugh & Hill, J. Phys. Chem. A (2017) 121, 2274
2,6-di-tert-butylpyridine (DtBPH+) in compressed air,"low field" drift tube!
±0.3%±1%
TWIMS Calibration Depends on Compound Class. Why?
1
0 2 4 6 8 10 12 14 16
td(TW) (ms)
K0(DT)
0
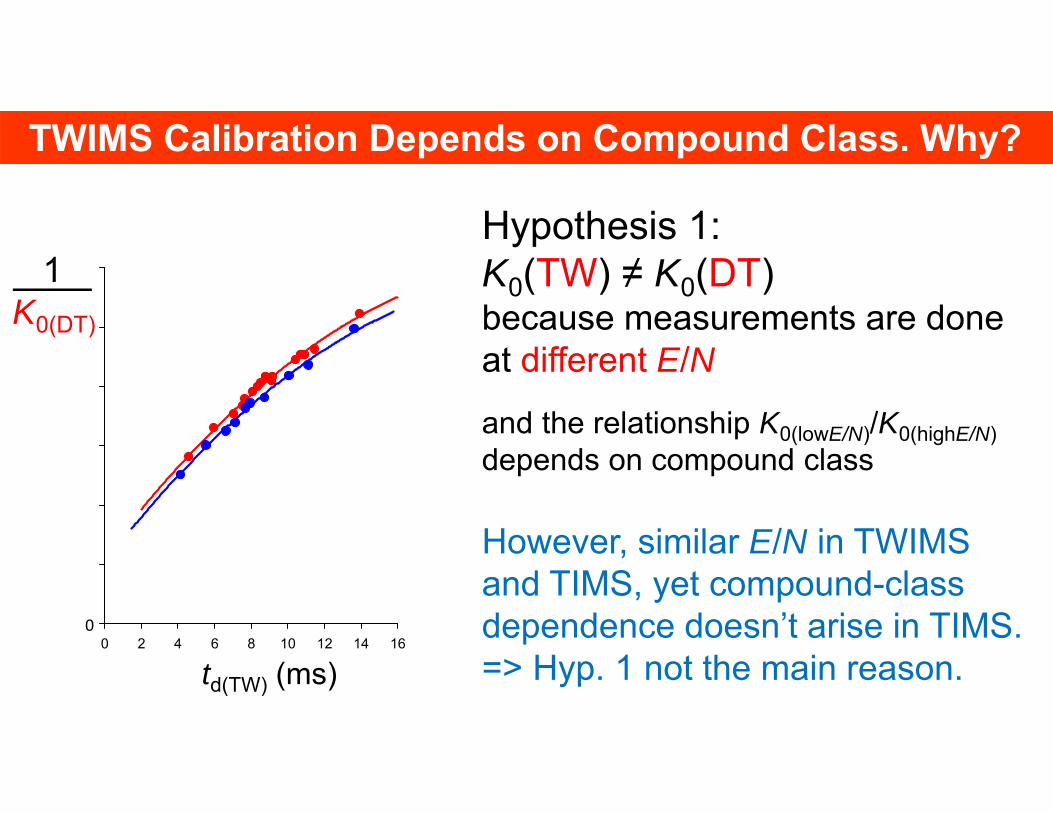
Hypothesis 1:K0(TW) ≠ K0(DT)because measurements are doneat different E/N
and the relationship K0(lowE/N)/K0(highE/N) depends on compound class
However, similar E/N in TWIMS and TIMS, yet compound-class dependence doesn’t arise in TIMS.=> Hyp. 1 not the main reason.

TWIMS Calibration Depends on Compound Class. Why?
1
0 2 4 6 8 10 12 14 16
td(TW) (ms)
K0(DT)
0
Hypothesis 2:K0(TW) ≠ K0(DT)because measurements are donein different gases
and the relationship K0(gas1)/K0(gas2)depends on compound class

Gases in TWIMS
Gases in DTIMSBefore 2010: almost only He data were available2010: N2 data available (RF-confining drift cell in a Synapt)
Synapt G1 N2 most commonHe, Ar, CO2,… possible but rare
Synapt G2 N2 most common in IM regionHelium cell right in front in practice: N2/He mixture
G1: Bush, Hall, Giles, Hoyes, Robinson & Ruotolo, Anal. Chem. (2010) 82: 9557.G2: Allen, Giles, Gilbert & Bush, Analyst (2016) 141: 884.
2013: Agilent drift tube: most common is N2
Ar ArHe
N2
Effect of the collision gas and T on K0
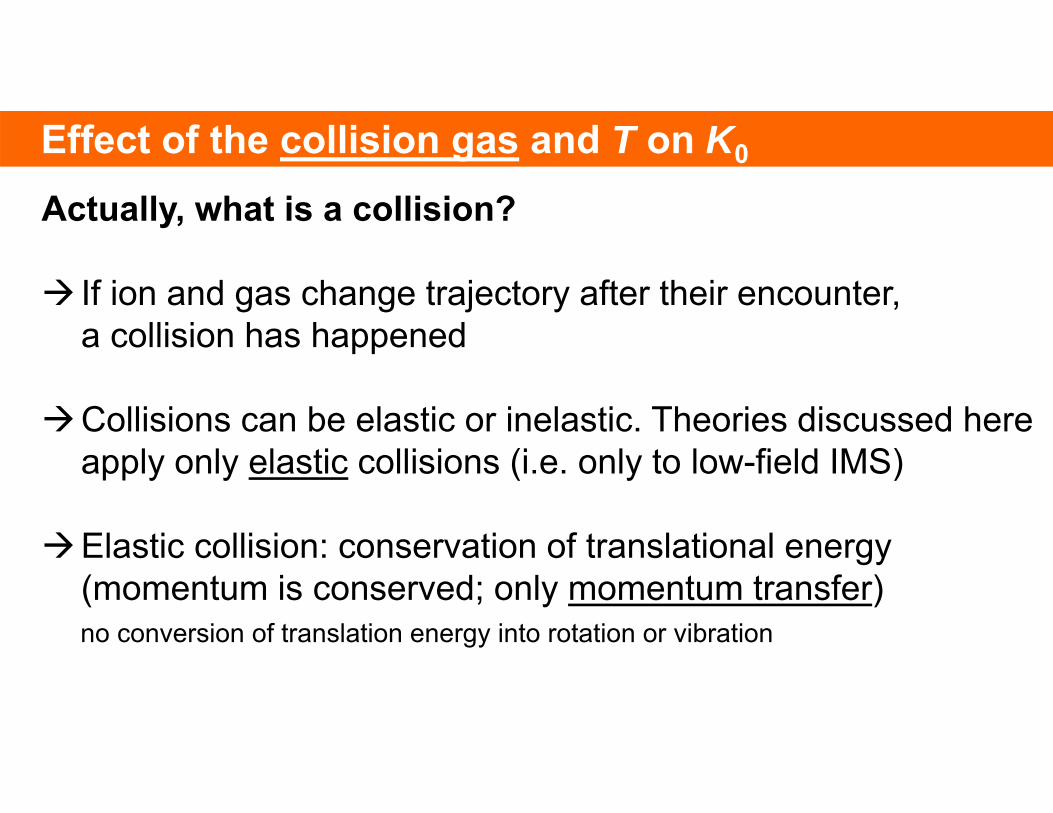
Actually, what is a collision?
If ion and gas change trajectory after their encounter, a collision has happened
Collisions can be elastic or inelastic. Theories discussed hereapply only elastic collisions (i.e. only to low-field IMS)
Elastic collision: conservation of translational energy(momentum is conserved; only momentum transfer)no conversion of translation energy into rotation or vibration
Rleationship between K and “Collision Cross Section”
𝐾3
162𝜋
µ𝑘 𝑇𝑧𝑒𝑁Ω
316
2𝜋µ𝑘 𝑇
𝑧𝑒
𝑁 𝑝𝑝 · 𝑇
𝑇 Ω
𝐾3
162𝜋
µ𝑘 𝑇𝑧𝑒
𝑁 Ω
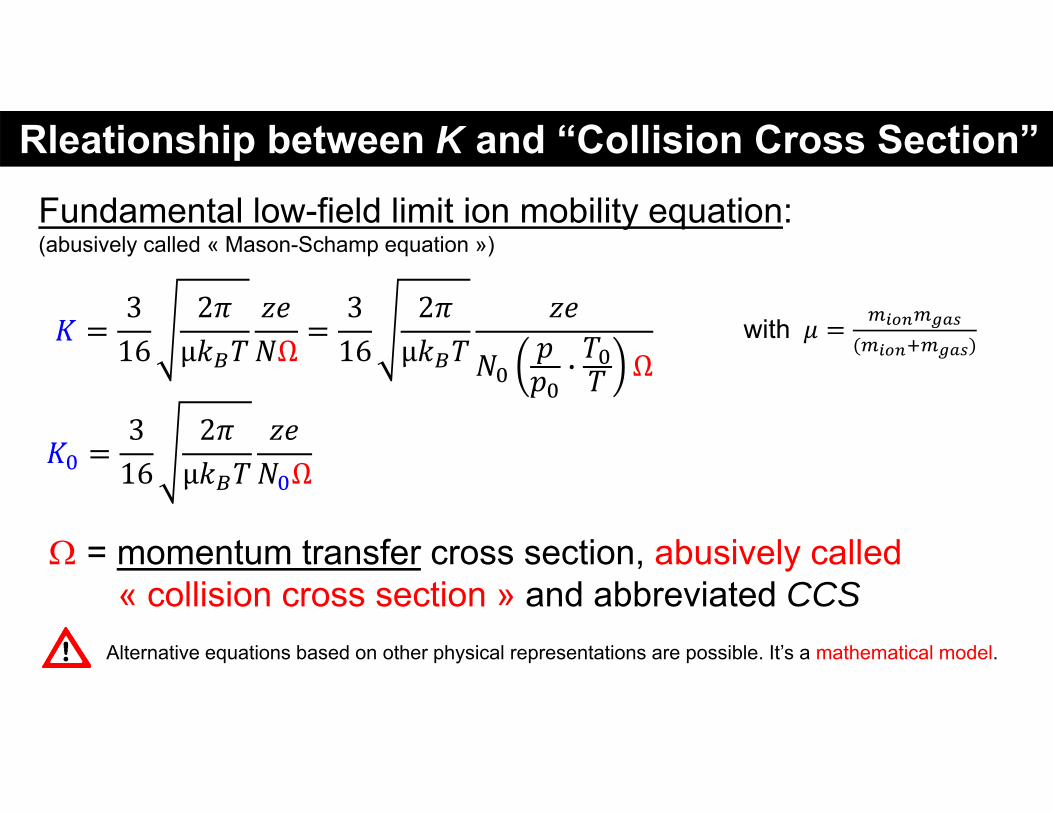
Fundamental low-field limit ion mobility equation:(abusively called « Mason-Schamp equation »)
with 𝜇
Alternative equations based on other physical representations are possible. It’s a mathematical model.
= momentum transfer cross section, abusively called« collision cross section » and abbreviated CCS

Effect of the collision gas and T on K0
Historically, the term « collision cross section » was used in the context of a hard spheres collision model
Atoms are not hard spheres!
Wyttenbach, Bleiholder & BowersAnal. Chem. (2013) 85, 2191.
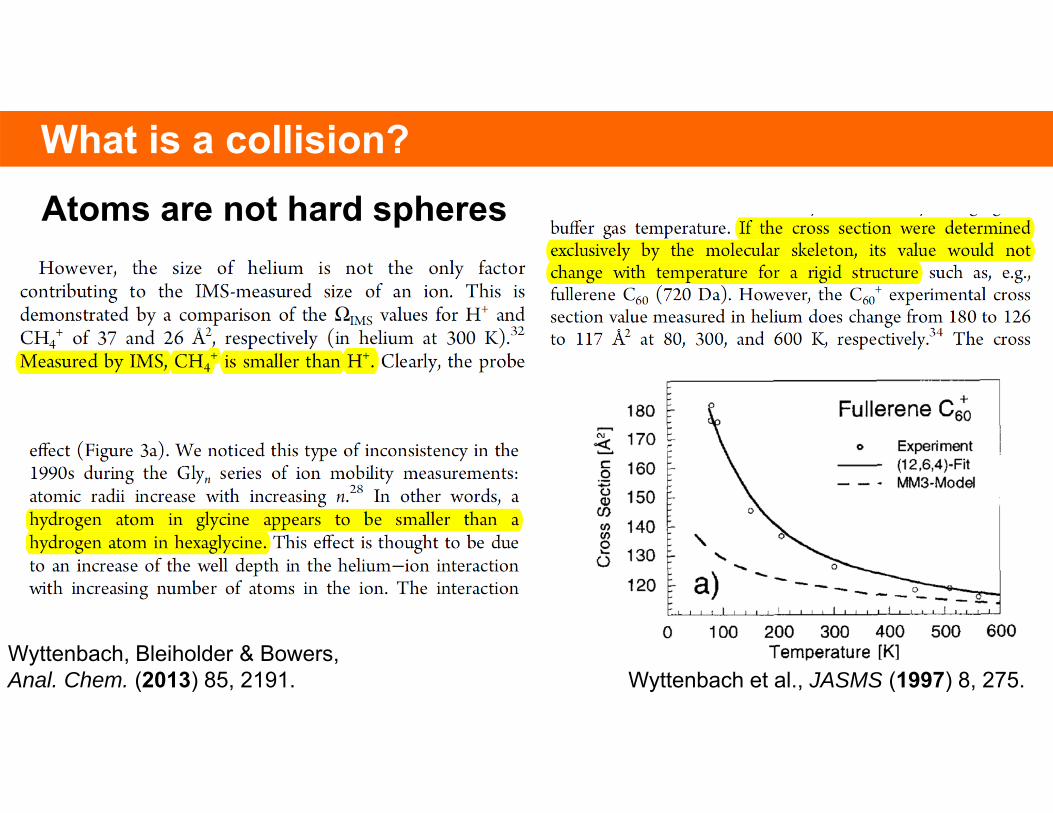
What is a collision?Atoms are not hard spheres
Wyttenbach, Bleiholder & Bowers, Anal. Chem. (2013) 85, 2191. Wyttenbach et al., JASMS (1997) 8, 275.

Effect of the collision gas and T on K0
Long-range and short-range interactions between gas and ion
Wyttenbach, Bleiholder & Bowers, Anal. Chem. (2013) 85, 2191.
Interaction potentials:• Repulsive at very short distance• Attractive at medium distance• Null at infinite distance
Example: Lennard-Jones interaction potentials
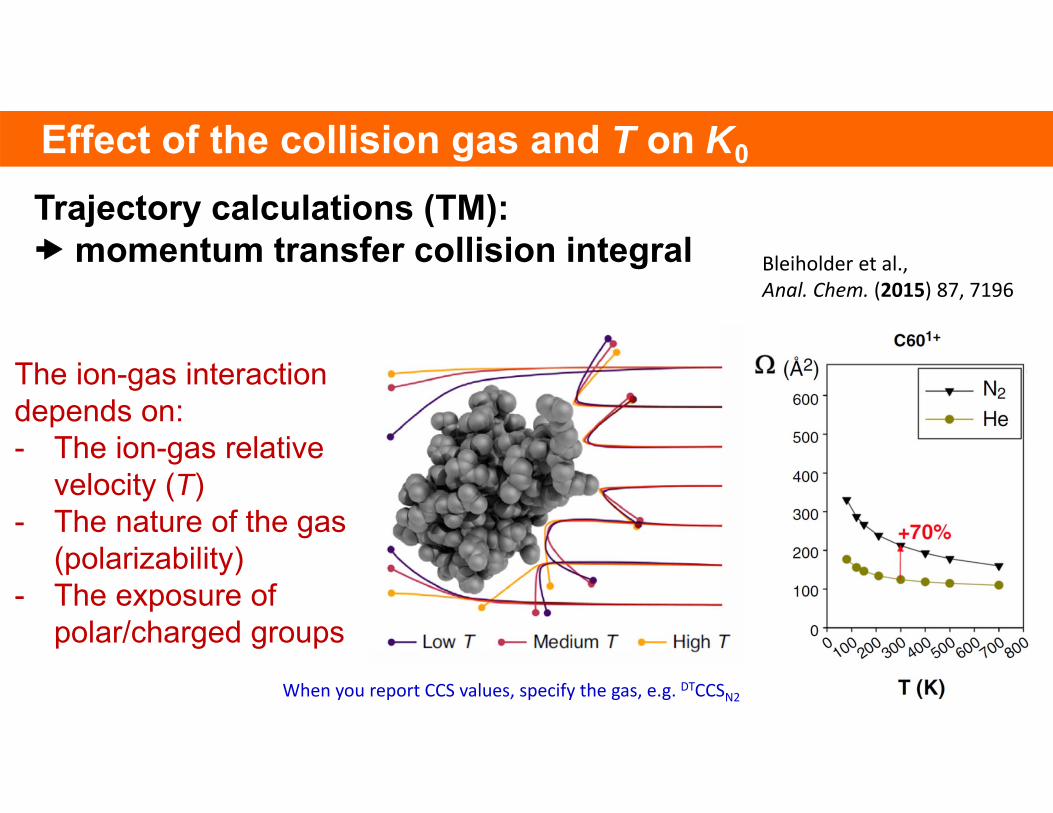
Trajectory calculations (TM): momentum transfer collision integral
The ion-gas interaction depends on: - The ion-gas relative
velocity (T)- The nature of the gas
(polarizability)- The exposure of
polar/charged groups
Bleiholder et al., Anal. Chem. (2015) 87, 7196
When you report CCS values, specify the gas, e.g. DTCCSN2
Effect of the collision gas and T on K0

The ion-gas interaction depends on: - The ion-gas relative
velocity (T)- The nature of the gas
(polarizability)- The exposure of
polar/charged groups
Young & Bleiholder, J. Am. Soc. Mass Spectrom. (2017) 28: 619.
Effect of the collision gas and T on K0
Trajectory calculations (TM): momentum transfer collision integral
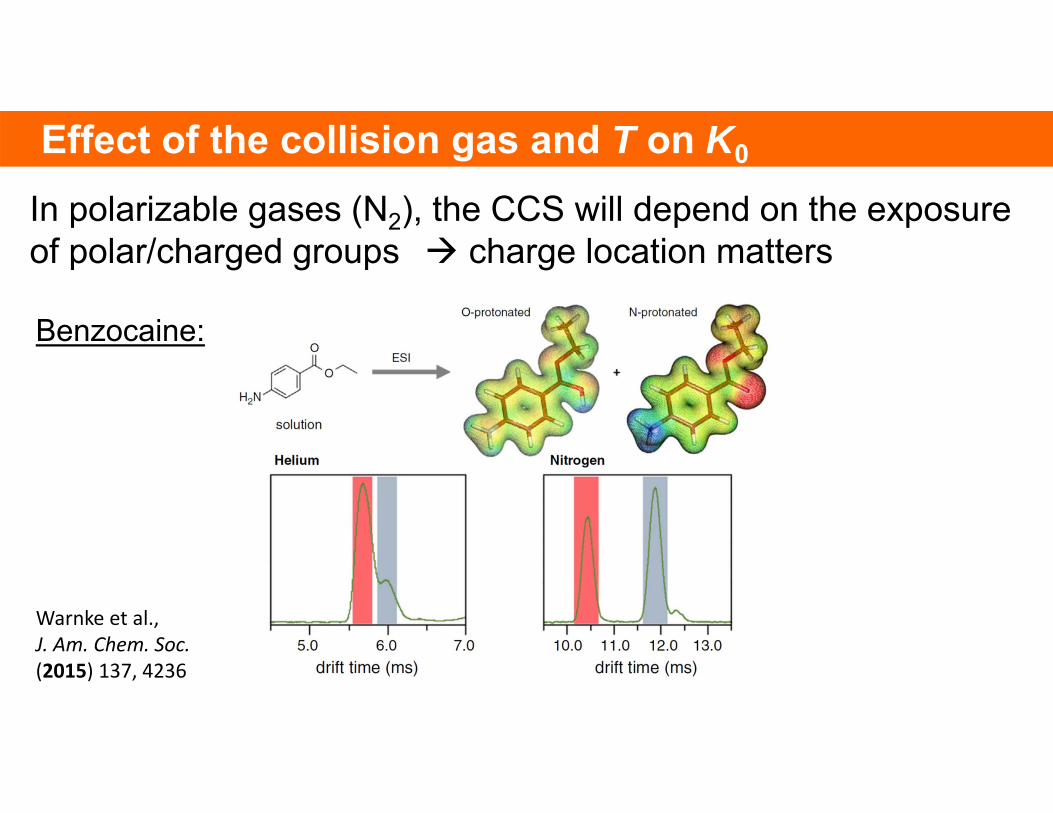
In polarizable gases (N2), the CCS will depend on the exposureof polar/charged groups charge location matters
Benzocaine:
Warnke et al., J. Am. Chem. Soc.(2015) 137, 4236
Effect of the collision gas and T on K0
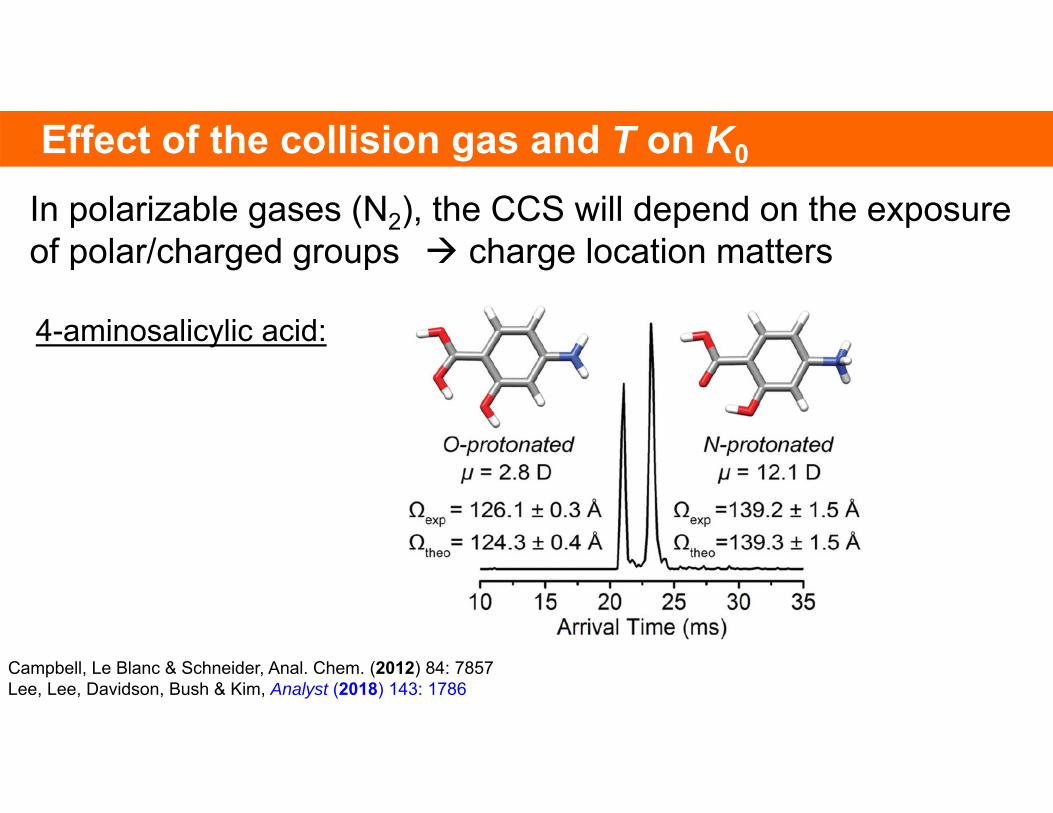
In polarizable gases (N2), the CCS will depend on the exposureof polar/charged groups charge location matters
4-aminosalicylic acid:
Effect of the collision gas and T on K0
Campbell, Le Blanc & Schneider, Anal. Chem. (2012) 84: 7857Lee, Lee, Davidson, Bush & Kim, Analyst (2018) 143: 1786

Effect of the collision gas and T on K0
In polarizable gases (N2), the CCS will depend on the exposureof polar/charged groups conformation matters

TWIMS Calibration Depends on Compound Class. Why?
1
0 2 4 6 8 10 12 14 16
td(TW) (ms)
K0(DT)
0
Hypothesis 2:K0(TW) ≠ K0(DT)because measurements are donein different gases
and the relationship K0(gas1)/K0(gas2)depends on compound class
Conclusion: hyp. 2 is correct whenusing DTKHe values to calibrate TW (operating in mainly N2)
TWIMS Calibration Depends on Compound Class. Why?
1
0 2 4 6 8 10 12 14 16
td(TW) (ms)
K0(DT)
0
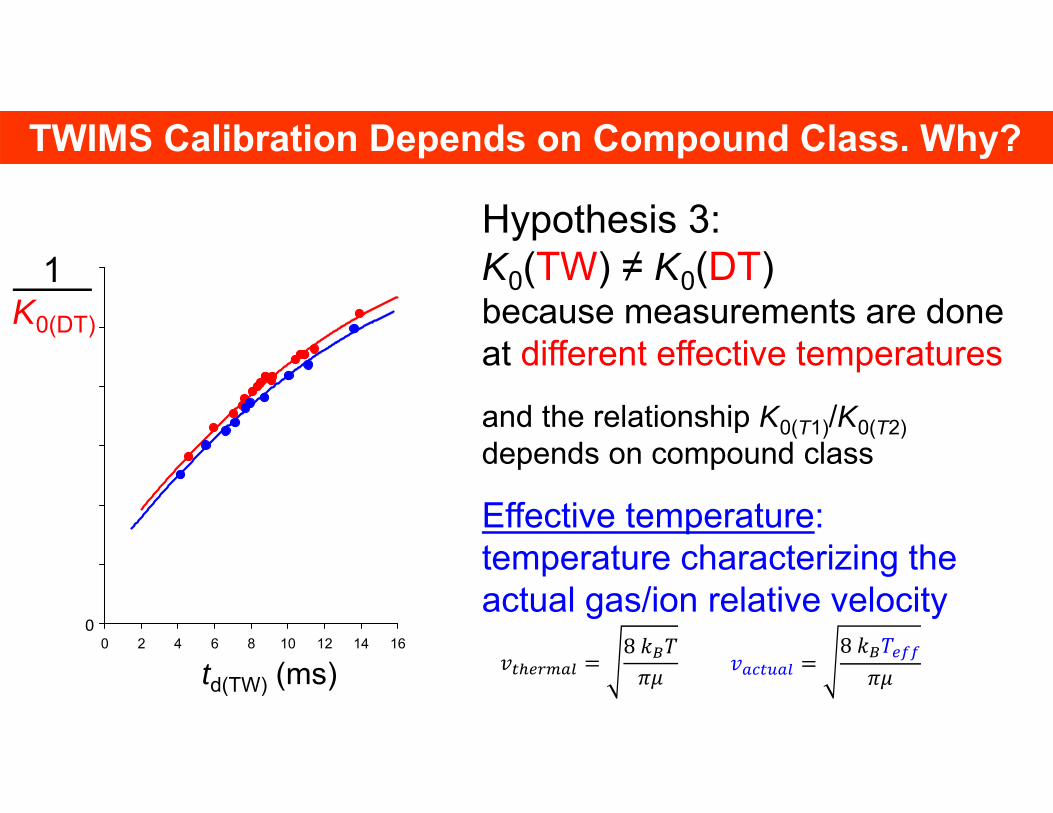
Hypothesis 3:K0(TW) ≠ K0(DT)because measurements are doneat different effective temperatures
and the relationship K0(T1)/K0(T2)depends on compound class
Effective temperature: temperature characterizing the actual gas/ion relative velocity
𝑣8 𝑘 𝑇
𝜋𝜇 𝑣8 𝑘 𝑇
𝜋𝜇
1
0 2 4 6 8 10 12 14 16
K0
td(TW) (ms)0
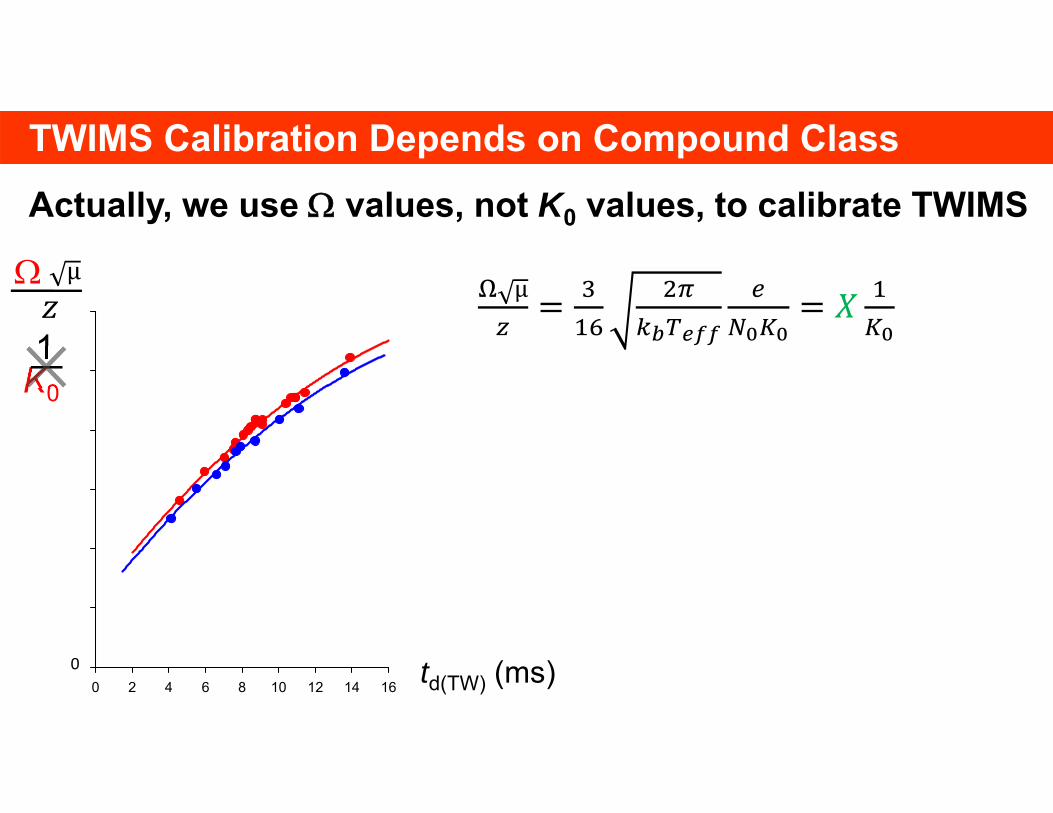
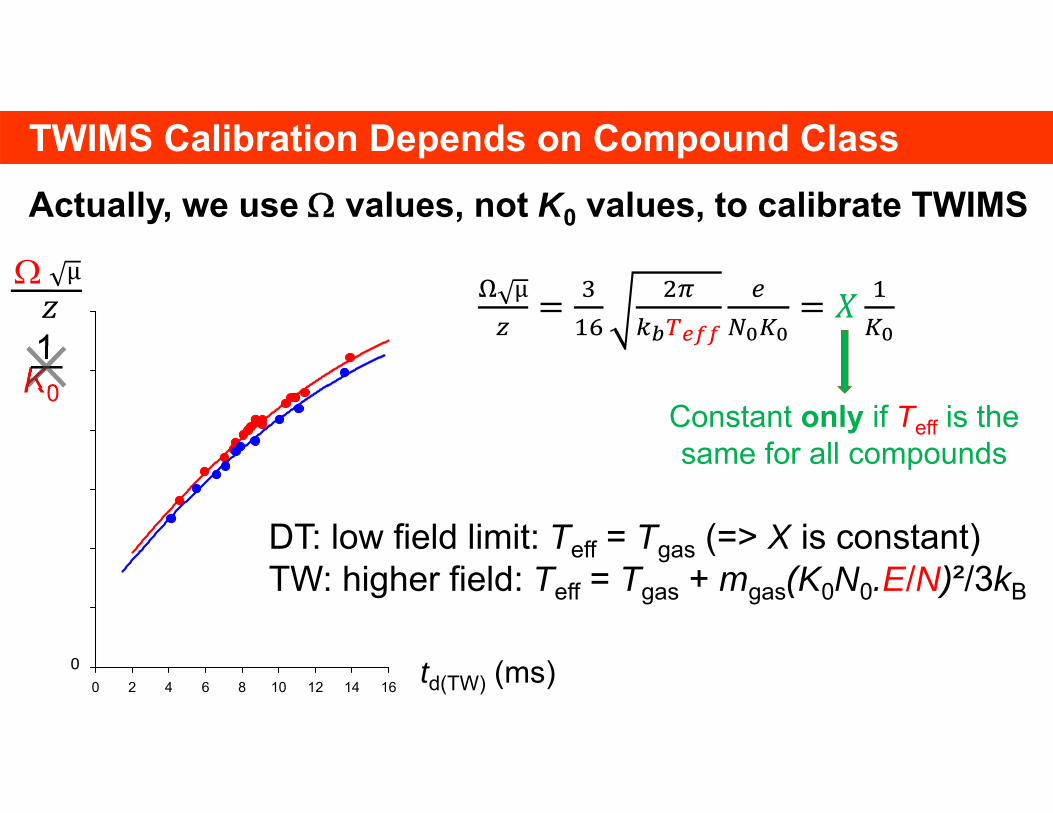
TWIMS Calibration Depends on Compound Class Actually, we use values, not K0 values, to calibrate TWIMS
µµ
1
0 2 4 6 8 10 12 14 16
K0
td(TW) (ms)
TWIMS Calibration Depends on Compound Class Actually, we use values, not K0 values, to calibrate TWIMS
µµ
Constant only if Teff is the same for all compounds
DT: low field limit: Teff = Tgas (=> X is constant)TW: higher field: Teff = Tgas + mgas(K0N0.E/N)²/3kB
0

TWIMS Calibration Depends on Compound Class Actually, we use values, not K0 values, to calibrate TWIMSWe don’t know Teff(TW), but at Emax/N ≥ 100 Td, Teff > Tgas
Small molecule fragmentation inside the TWIMS proves that collisions are inelastic
Synapt I Synapt G2
Teff = 555 Kwave height = 13 Vwave speed = 600 m/s pN2 = 0.516 mbar Teff = 728 K
wave height = 40 Vwave speed = 800 m/s pN2(Pirani) = 4.5 mbar
Morsa &al. Anal. Chem. (2011)Morsa &al. JASMS (2014)
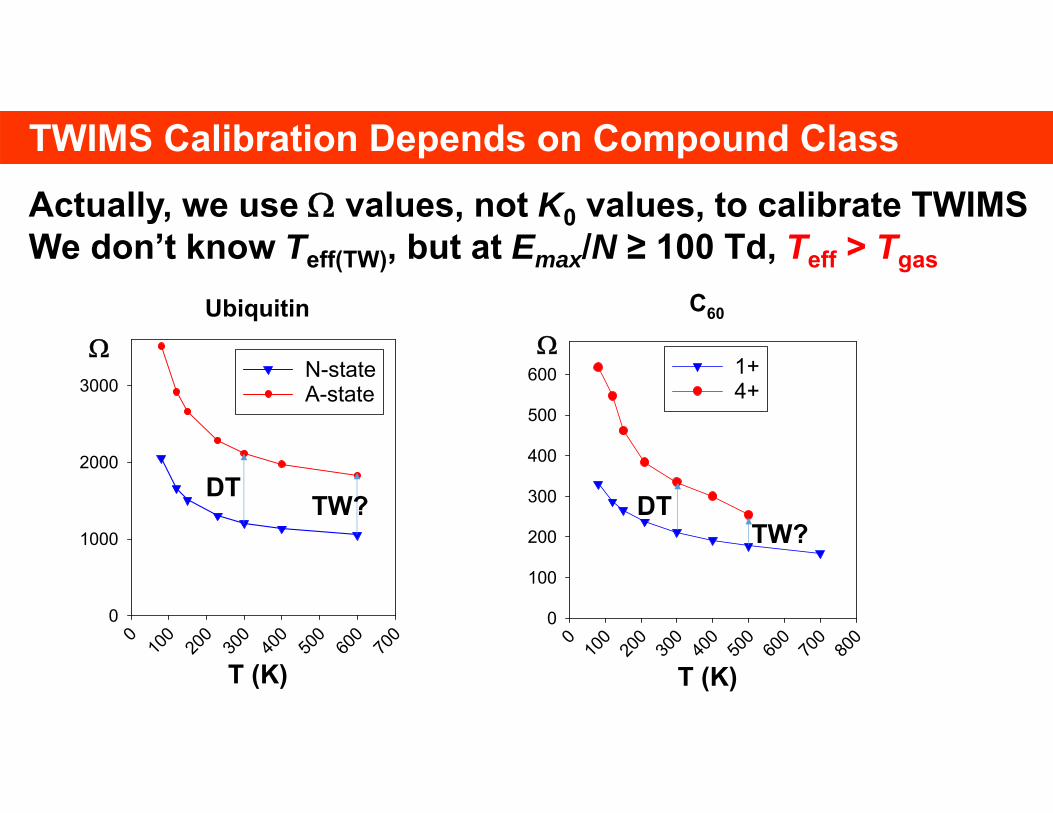
C60
T (K)
010
020
030
040
050
060
070
080
0
0
100
200
300
400
500
600 1+4+
TWIMS Calibration Depends on Compound Class Actually, we use values, not K0 values, to calibrate TWIMSWe don’t know Teff(TW), but at Emax/N ≥ 100 Td, Teff > Tgas
Ubiquitin
T (K)
010
020
030
040
050
060
070
0
0
1000
2000
3000N-stateA-state
DT DTTW?
TW?
TWIMS Calibration Depends on Compound Class. Why?
1
0 2 4 6 8 10 12 14 16
td(TW) (ms)
K0(DT)
0
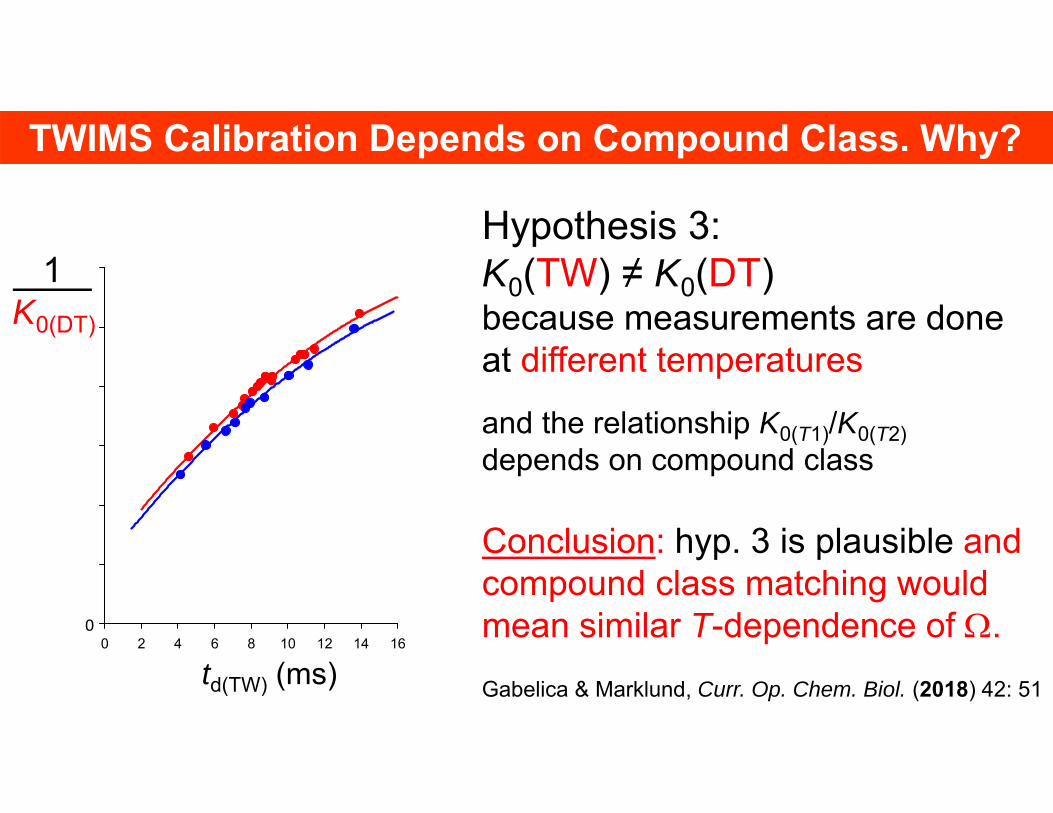
Hypothesis 3:K0(TW) ≠ K0(DT)because measurements are doneat different temperatures
and the relationship K0(T1)/K0(T2)depends on compound class
Conclusion: hyp. 3 is plausible and compound class matching wouldmean similar T-dependence of .Gabelica & Marklund, Curr. Op. Chem. Biol. (2018) 42: 51

TWIMS Calibration Depends on Compound Class Hypothesis 4: velocity relaxation effectsi.e., ions do not respond immediately to field changesi.e., vD = K.E is not satisfied at all times in TWIMS
Richardson, Langridge & Giles, Int. J. Mass Spectrom. (2018) 428: 71.
Velocity relaxation depends on K and m/z With the current mathematical model for calibration, analyte and
calibrant must have similar velocity relaxation effects Must have a similar dependence of K0 on (m/z)
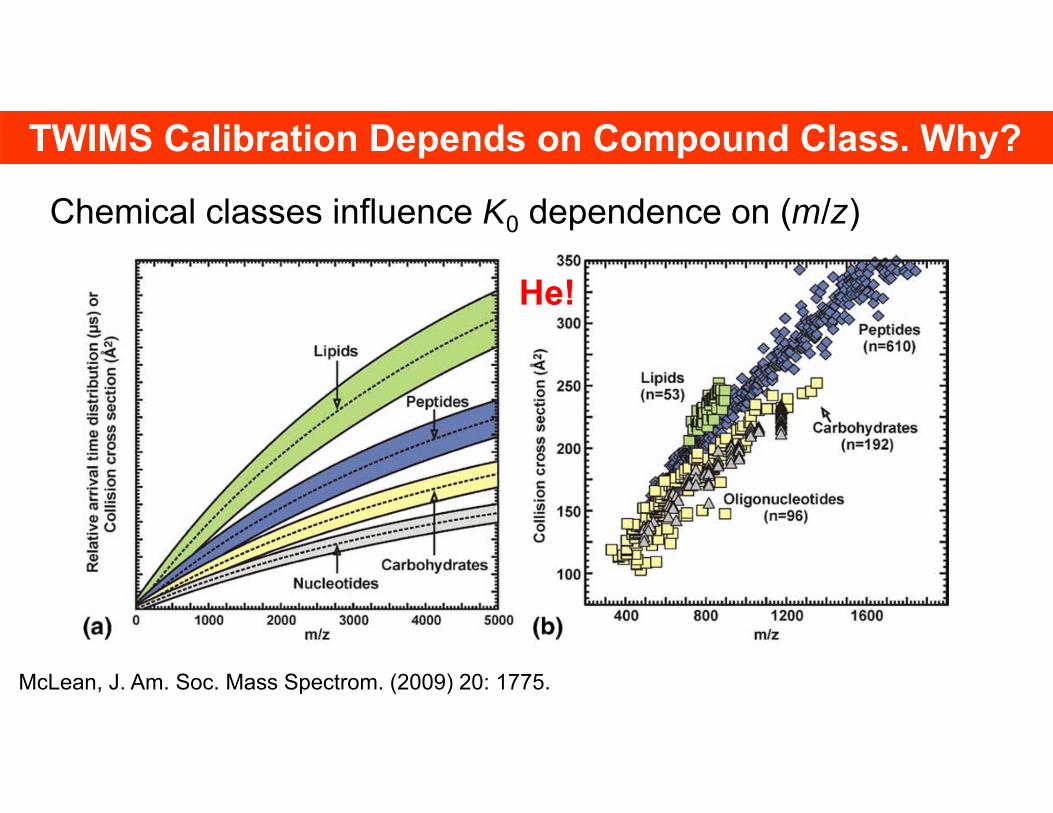
McLean, J. Am. Soc. Mass Spectrom. (2009) 20: 1775.
TWIMS Calibration Depends on Compound Class. Why?
Chemical classes influence K0 dependence on (m/z)
He!
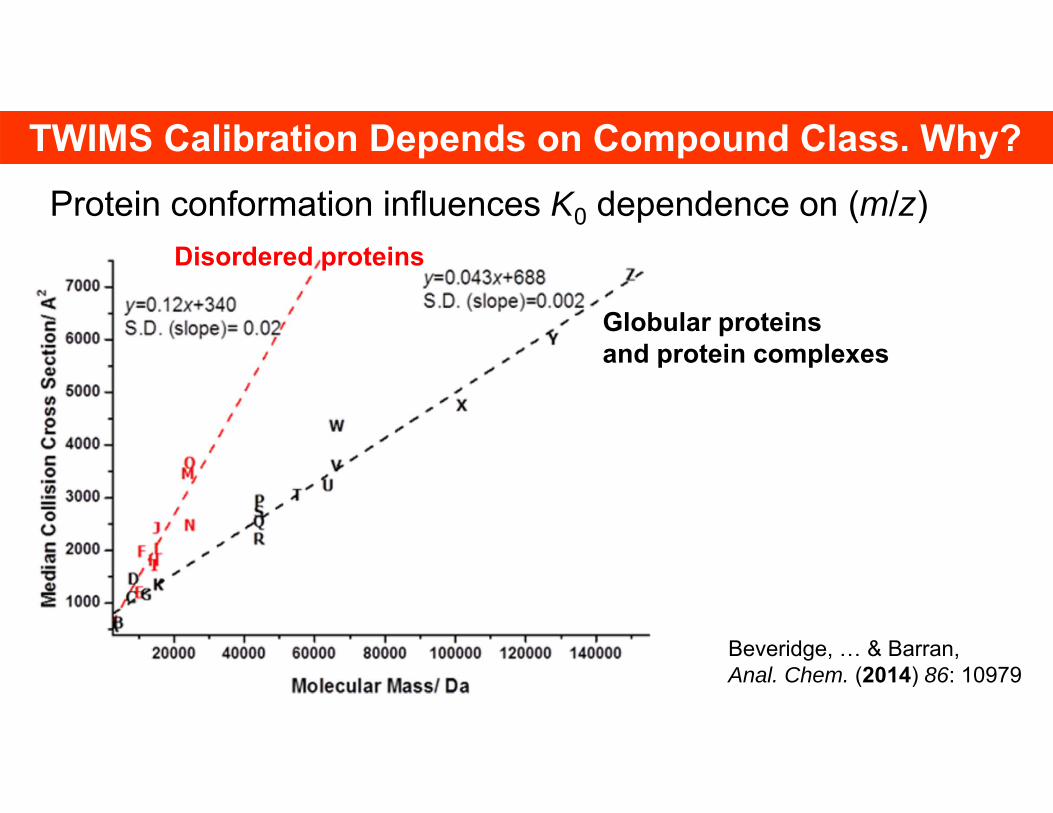
Disordered proteins
Globular proteinsand protein complexes
Beveridge, … & Barran, Anal. Chem. (2014) 86: 10979
Protein conformation influences K0 dependence on (m/z)
TWIMS Calibration Depends on Compound Class. Why?

TWIMS Calibration Depends on Compound Class Hypothesis 4: velocity relaxation effectsi.e., ions do not respond immediately to field changesi.e., vD = K.E is not satisfied at all times in TWIMS
Richardson, Langridge & Giles, Int. J. Mass Spectrom. (2018) 428: 71.
With the current mathematical model for calibration, analyte and calibrant must have similar velocity relaxation effects
Must have a similar dependence of K0 on (m/z) Meaning to belong to a same class of structures
Future: new calibrations procedures for TWIMS?
i.e.:
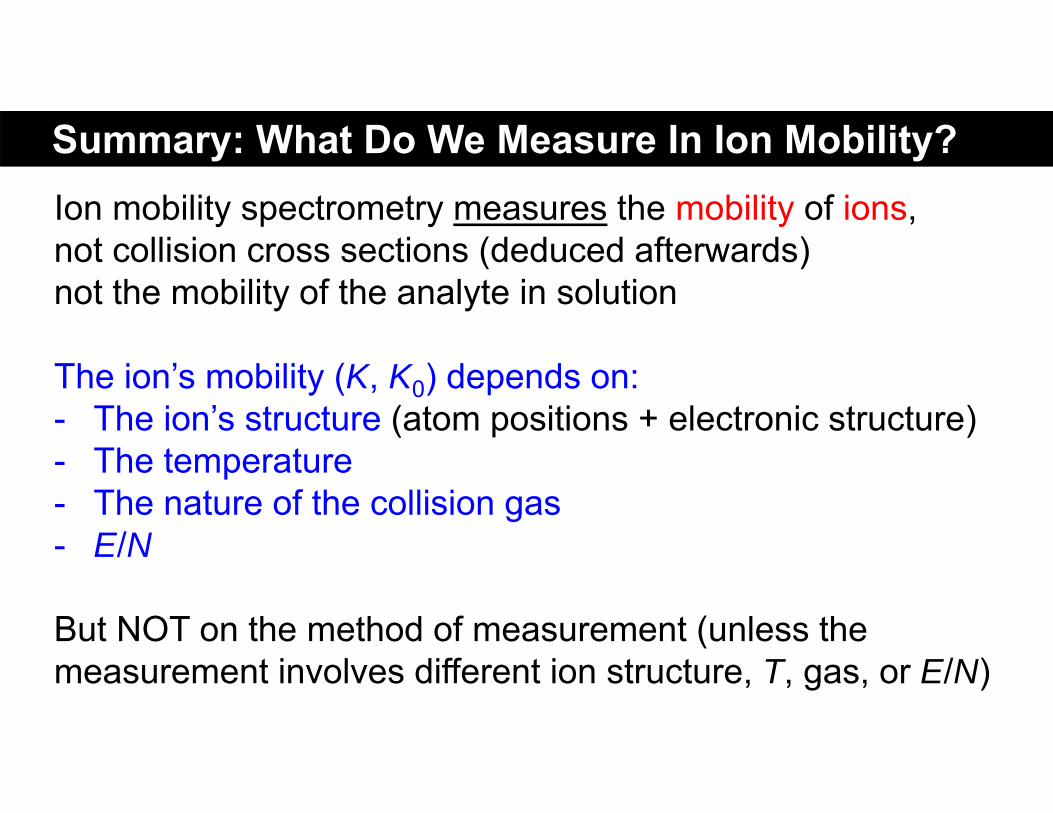
Summary: What Do We Measure In Ion Mobility? Ion mobility spectrometry measures the mobility of ions, not collision cross sections (deduced afterwards)not the mobility of the analyte in solution
The ion’s mobility (K, K0) depends on:- The ion’s structure (atom positions + electronic structure)- The temperature- The nature of the collision gas- E/N
But NOT on the method of measurement (unless the measurement involves different ion structure, T, gas, or E/N)
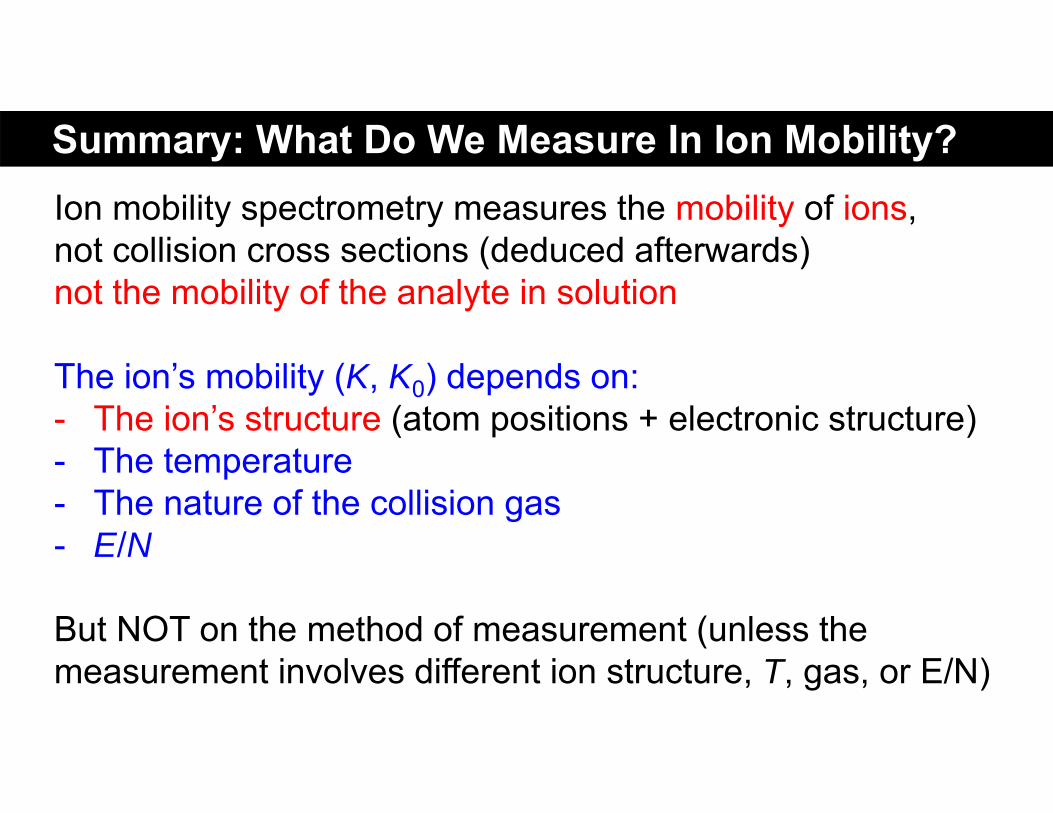

How analytes become ions affect the resultRecall: in N2, the CCS will depend on the exposure of polar/charged groups charge location matters
influence of solventBenzocaine:
Warnke et al., J. Am. Chem. Soc.(2015) 137, 4236
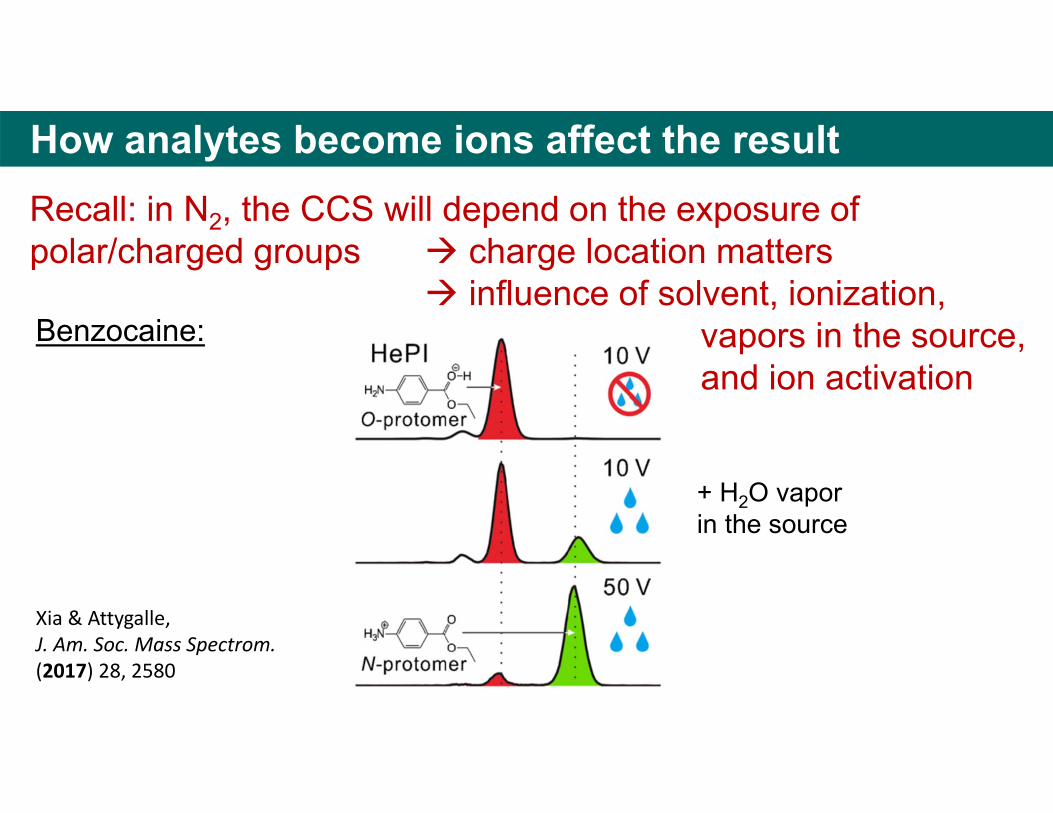
Recall: in N2, the CCS will depend on the exposure of polar/charged groups charge location matters
influence of solvent, ionization, vapors in the source, and ion activation
Benzocaine:
Xia & Attygalle, J. Am. Soc. Mass Spectrom.(2017) 28, 2580
+ H2O vaporin the source
How analytes become ions affect the result

Importance of controlling ionization mechanisms,including for native MS
How analytes become ions affect the result
+
‐ ‐ ‐‐ ‐‐ ‐
‐ ‐‐ ‐‐
‐ ‐‐‐
‐
‐‐‐
‐
‐‐
‐‐
‐
‐‐
‐‐‐ ‐‐‐
‐ ‐‐
‐‐
‐
‐‐
‐‐
Desiredoutcome in native MS
CHARGED RESIDUE
CHAIN EXTRUSION
unfolding
compaction
‒
+
+
+
+
++
+
+
++
+
+
+
++
+
‒
‒
‒
‒
‒
‒
‒
‒
‒
‒‒
‒
‒
‒
‒
‒‒
‒‒
‒‒
‒‒
‒‒
‒‒
‒‒
‒‒
‒‒
‒
‒
‒‒
‒
‒
‒‒‒
‒
‒
‒‒
‒
‒‒
‒‒
‒‒
‒‒
‒‒‒
‒‒
‒ ‒
‒
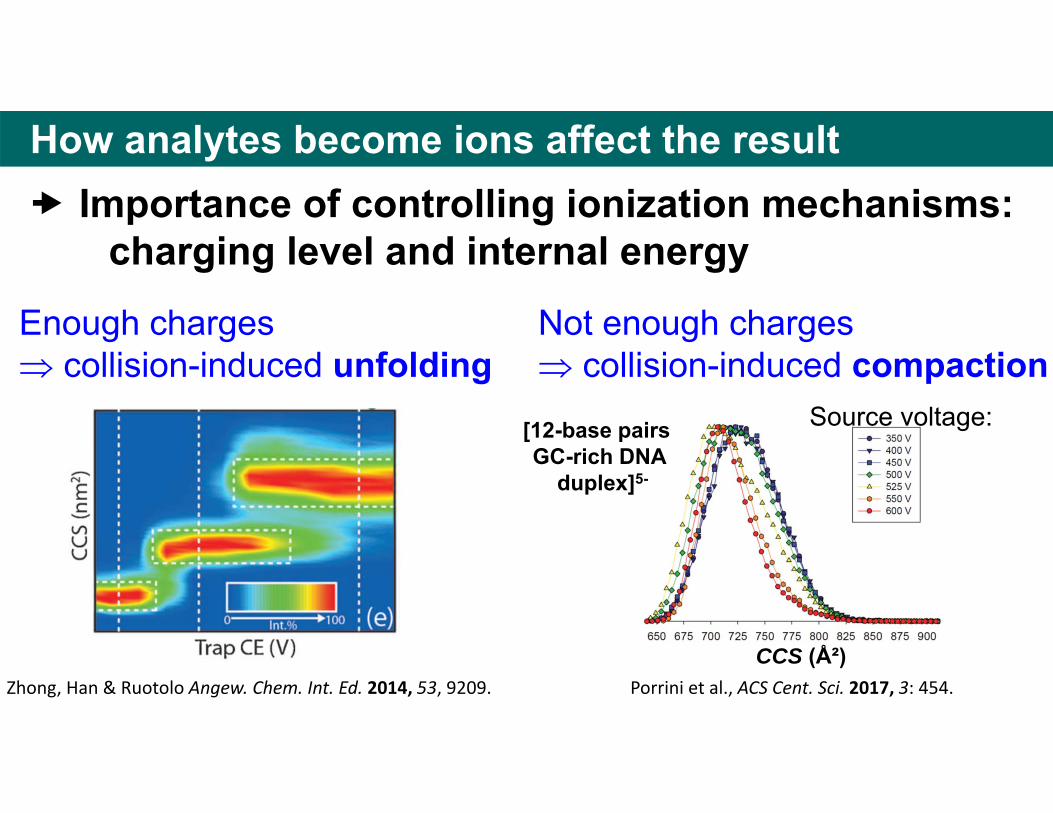
Importance of controlling ionization mechanisms:charging level and internal energy
How analytes become ions affect the result
Enough charges collision-induced unfolding
Not enough charges collision-induced compaction
Porrini et al., ACS Cent. Sci. 2017, 3: 454.
Source voltage:[12-base pairs GC-rich DNA
duplex]5-
Zhong, Han & Ruotolo Angew. Chem. Int. Ed. 2014, 53, 9209.CCS (Ų)

Sensitive to activation too risky as calibrant
[Cytochrome c]7+ [Cytochrome c]11+ [Cytochrome c]16+
DTCCSHe = 1221 Ų DTCCSHe = 2651 Ų DTCCSHe = 2060 Ų
2110 Ų2175 Ų2248 Ų2294 Ų
Choosing robust calibrants
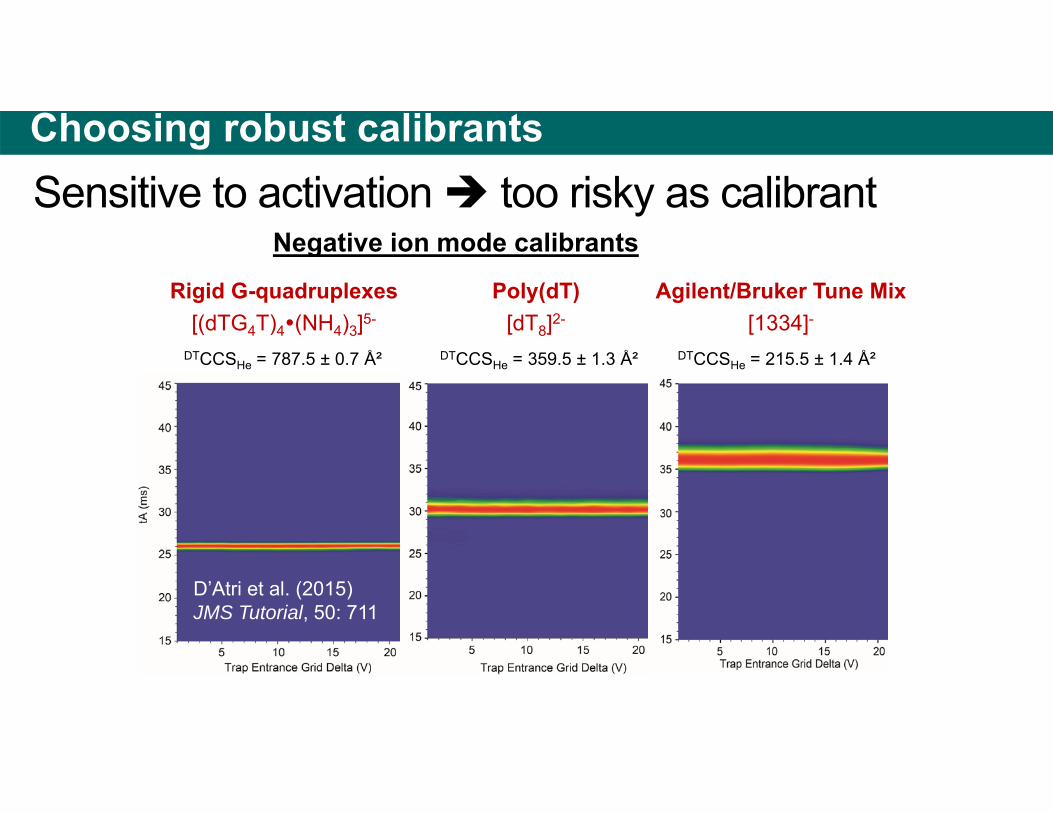
Negative ion mode calibrants
DTCCSHe = 787.5 ± 0.7 Ų DTCCSHe = 359.5 ± 1.3 Ų DTCCSHe = 215.5 ± 1.4 Ų
[(dTG4T)4(NH4)3]5- [dT8]2- [1334]-Rigid G-quadruplexes Poly(dT) Agilent/Bruker Tune Mix
D’Atri et al. (2015) JMS Tutorial, 50: 711
Sensitive to activation too risky as calibrantChoosing robust calibrants

TWIMS Calibration Depends on Compound Class. Why?
1
0 2 4 6 8 10 12 14 16
td(TW) (ms)
K0(DT)
0
Hypothesis 5:K0(TW) ≠ K0(DT)because measurements are doneon different ion structures
and the relationship K0(conf1)/K0(conf2)depends on compound class
RF-only drift cell in Synapt wassupposed to solve that, but in pure N2, ion preparation is not as soft as with He cell => Problems persist!
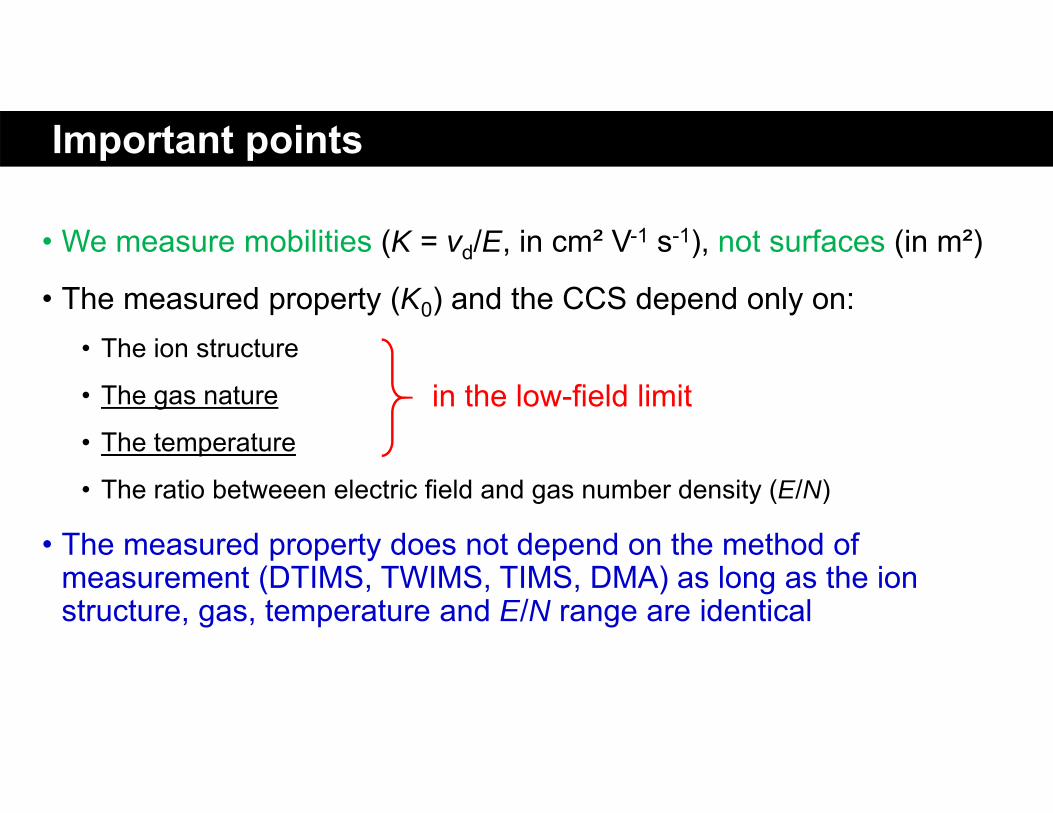
• We measure mobilities (K = vd/E, in cm² V-1 s-1), not surfaces (in m²)
• The measured property (K0) and the CCS depend only on:• The ion structure
• The gas nature
• The temperature
• The ratio betweeen electric field and gas number density (E/N)
• The measured property does not depend on the method of measurement (DTIMS, TWIMS, TIMS, DMA) as long as the ion structure, gas, temperature and E/N range are identical
in the low-field limit
Important points
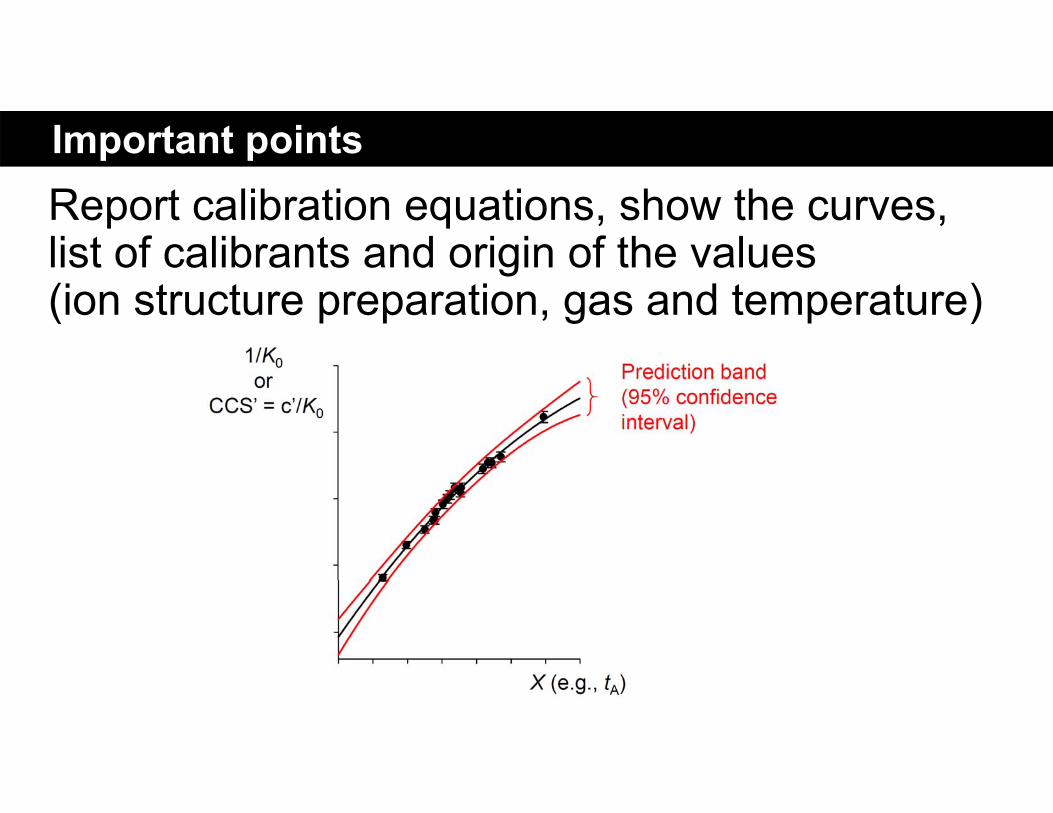
Report calibration equations, show the curves, list of calibrants and origin of the values (ion structure preparation, gas and temperature)
Important points
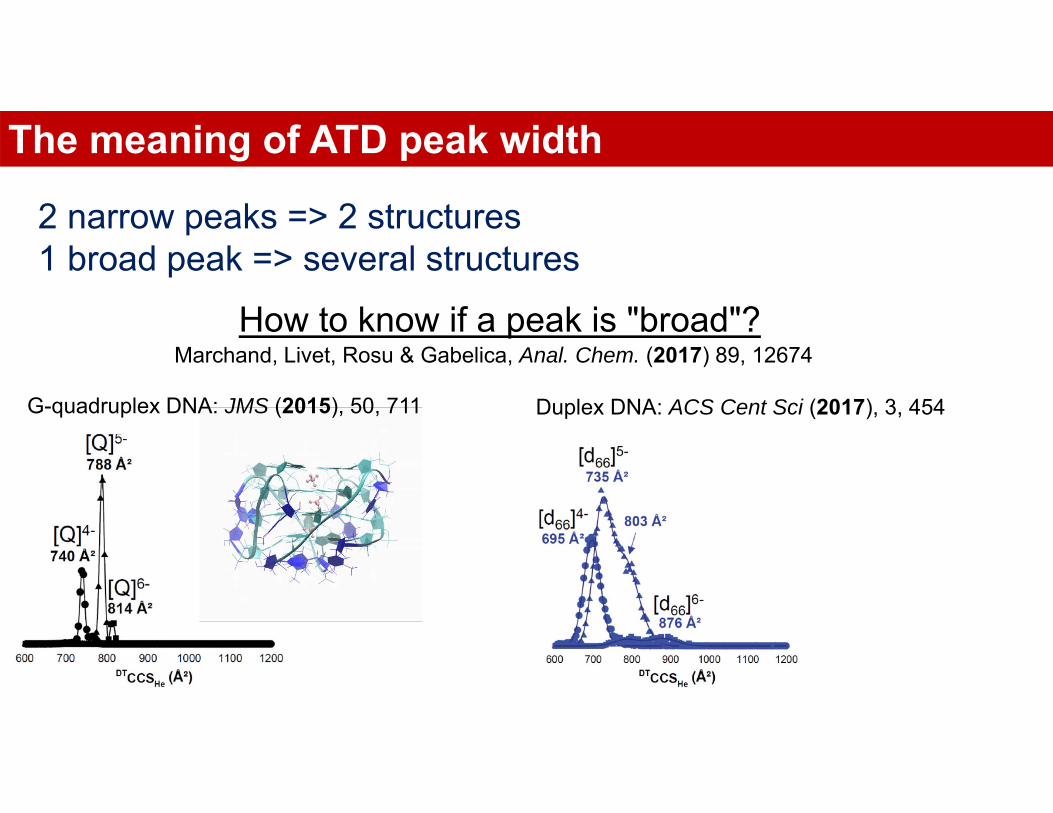
The meaning of ATD peak width
2 narrow peaks => 2 structures1 broad peak => several structures
How to know if a peak is "broad"?Marchand, Livet, Rosu & Gabelica, Anal. Chem. (2017) 89, 12674
Duplex DNA: ACS Cent Sci (2017), 3, 454G-quadruplex DNA: JMS (2015), 50, 711

The meaning of ATD peak width
2 narrow peaks => 2 structures1 broad peak => several structures
How to know if a peak is "broad"?Marchand, Livet, Rosu & Gabelica, Anal. Chem. (2017) 89, 12674
Duplex DNA: ACS Cent Sci (2017), 3, 454G-quadruplex DNA: JMS (2015), 50, 711

The meaning of ATD peak width
2 narrow peaks => 2 structures1 broad peak => several structures
Duplex DNA: ACS Cent Sci (2017), 3, 454G-quadruplex DNA: JMS (2015), 50, 711
Ion mobility peak width reflects the multiplicity of ways ions can rearrange prior to IMS analysis
The meaning of ATD peak width
2 narrow peaks => 2 structures1 broad peak => several structures
1 narrow peak => 1 structure?
Ion mobility peak width reflects the multiplicity of ways ions can rearrange prior to IMS analysis
Not necessarily! Narrow peak can also be due to fast structural inter-conversioninside the IMS
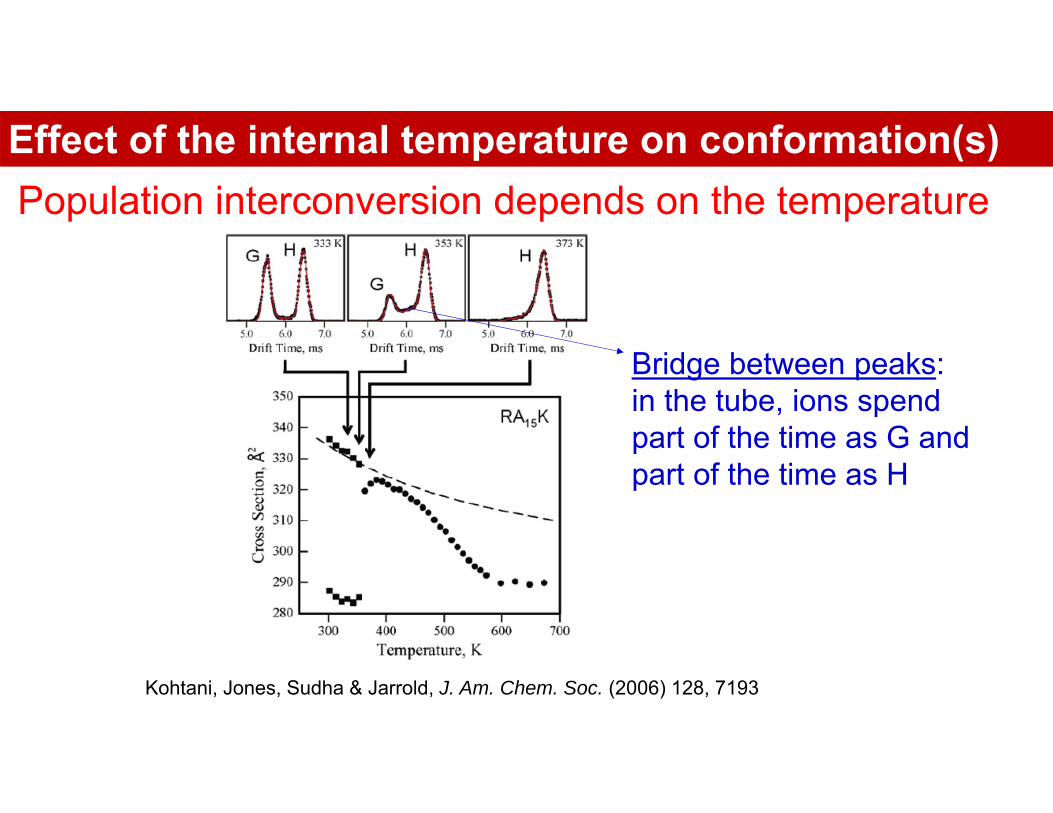
Population interconversion depends on the temperature
Kohtani, Jones, Sudha & Jarrold, J. Am. Chem. Soc. (2006) 128, 7193
Bridge between peaks:in the tube, ions spend part of the time as G and part of the time as H
Effect of the internal temperature on conformation(s)
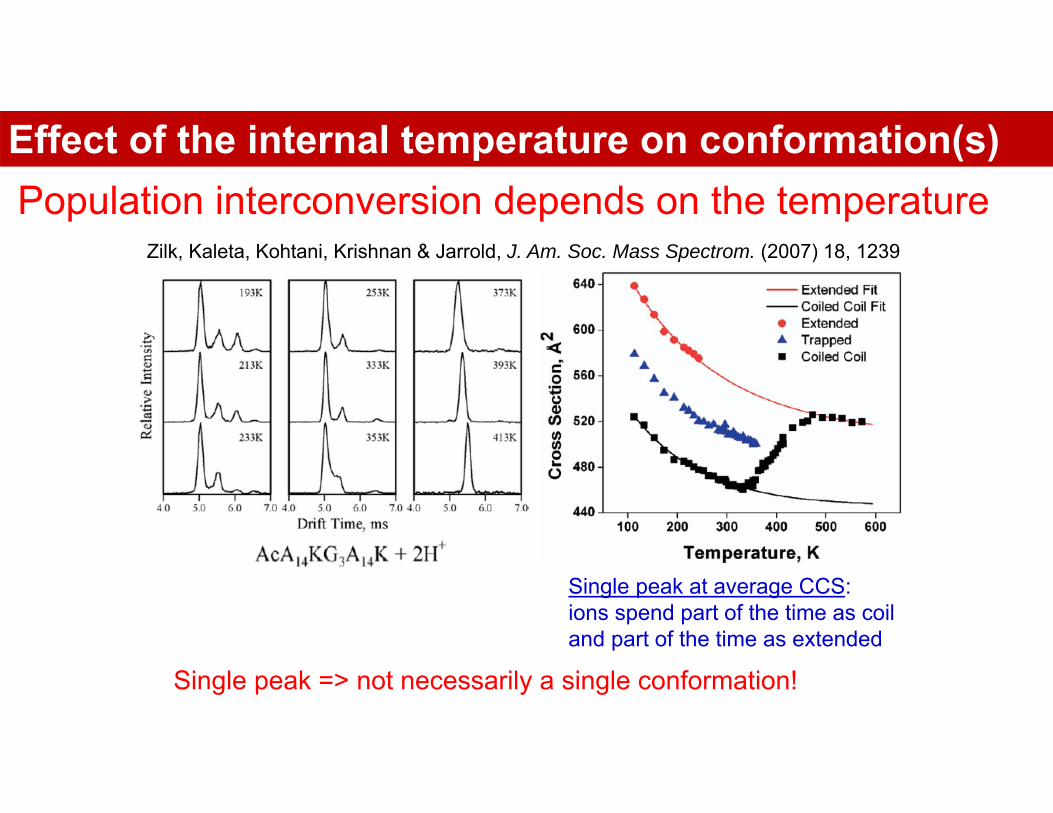
Single peak at average CCS:ions spend part of the time as coil and part of the time as extended
Single peak => not necessarily a single conformation!
Zilk, Kaleta, Kohtani, Krishnan & Jarrold, J. Am. Soc. Mass Spectrom. (2007) 18, 1239
Population interconversion depends on the temperatureEffect of the internal temperature on conformation(s)
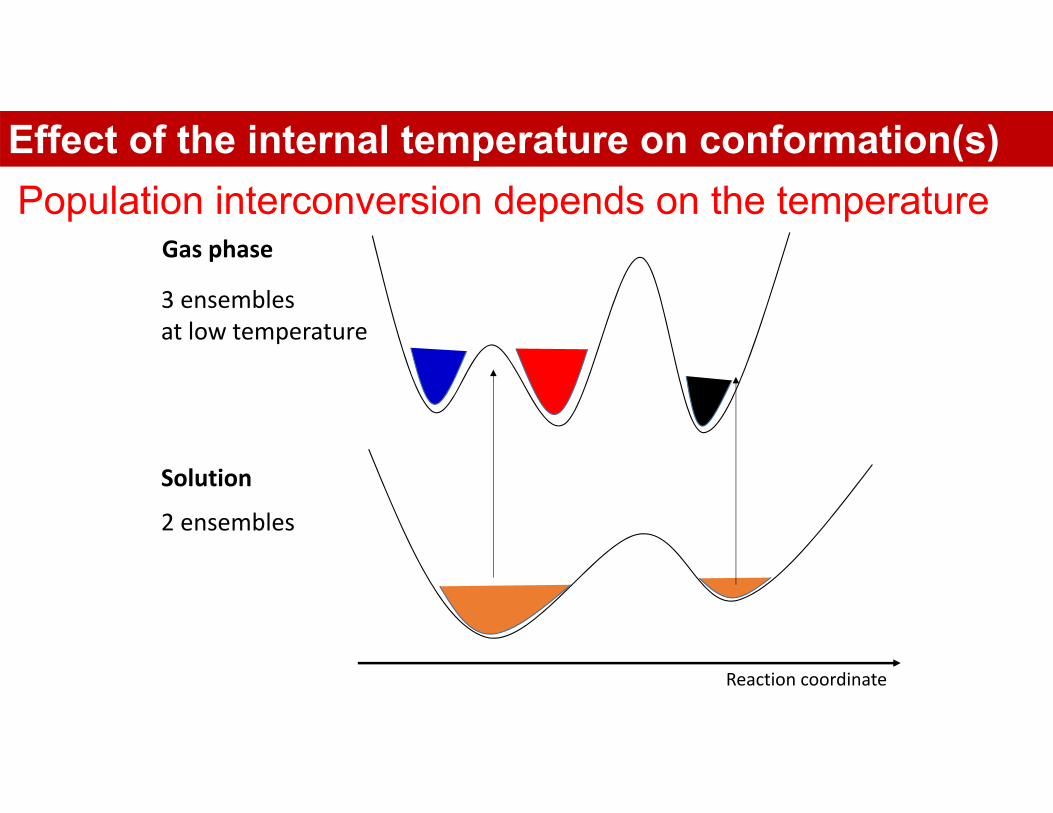
Reaction coordinate
Solution
Gas phase
2 ensembles
3 ensembles at low temperature
Population interconversion depends on the temperatureEffect of the internal temperature on conformation(s)
The meaning of ATD peak width
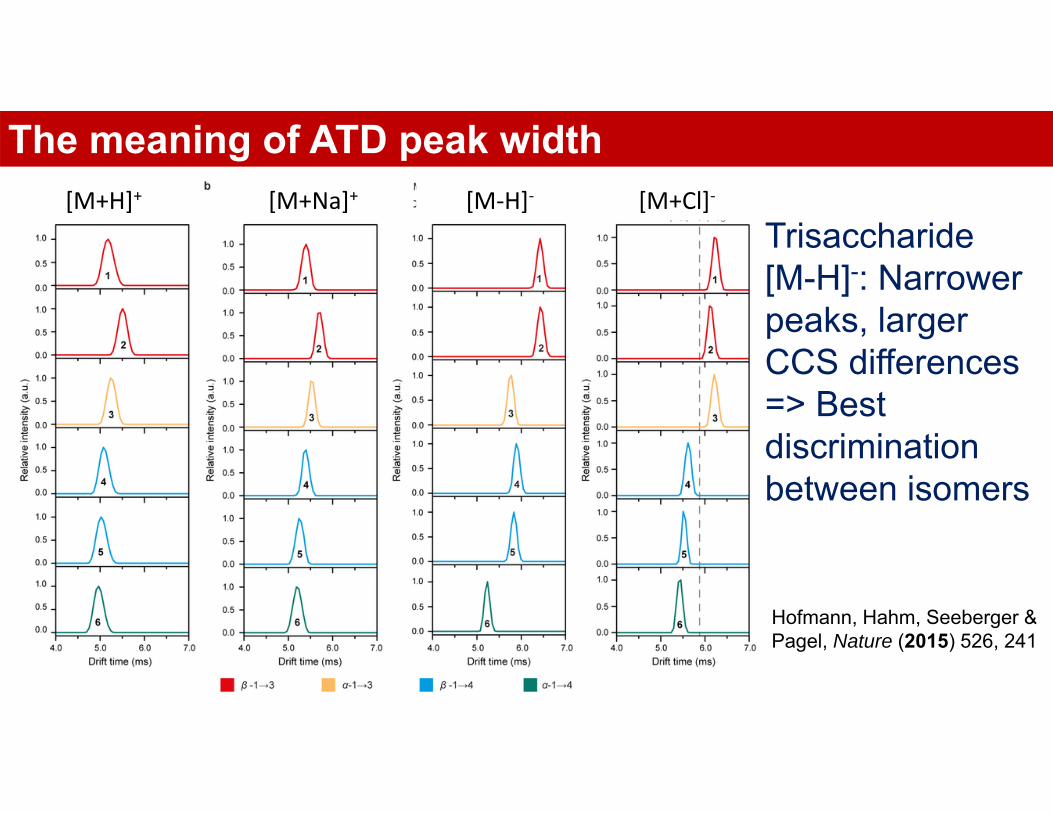
Trisaccharide[M-H]-: Narrowerpeaks, largerCCS differences=> Best discrimination between isomers
[M‐H]‐ [M+Cl]‐[M+H]+ [M+Na]+
Hofmann, Hahm, Seeberger & Pagel, Nature (2015) 526, 241
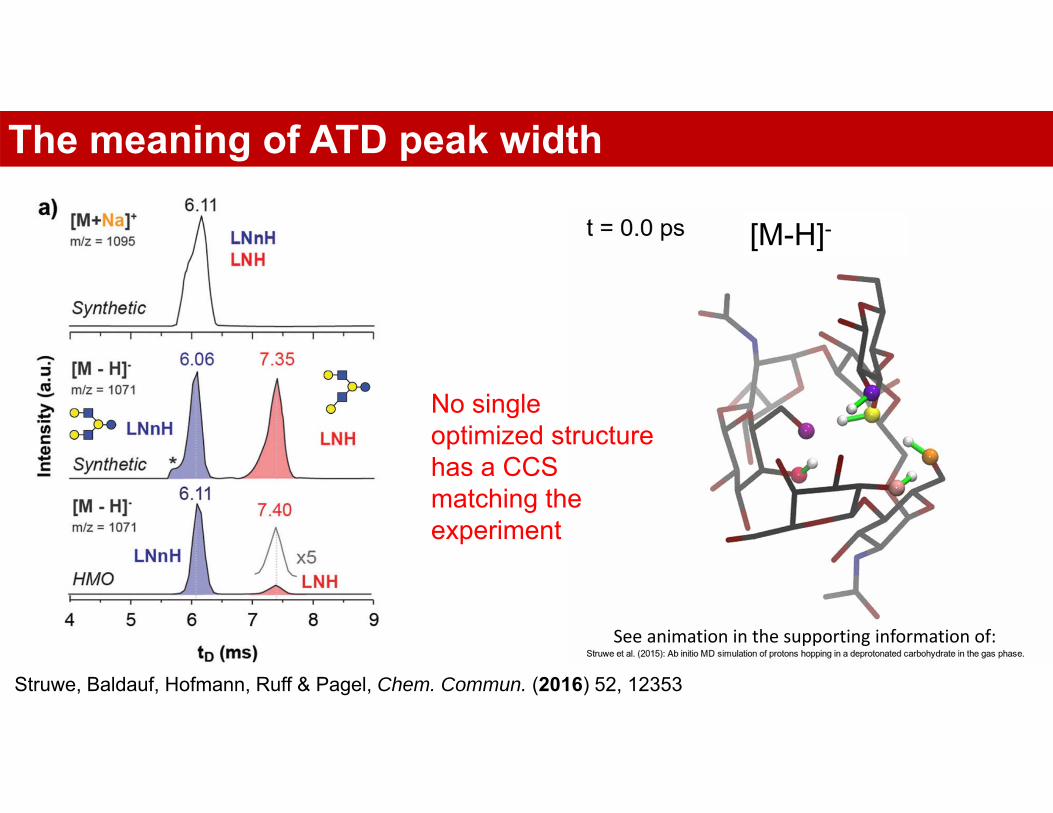
[M-H]-
The meaning of ATD peak width
No single optimized structure has a CCS matching the experiment
Struwe, Baldauf, Hofmann, Ruff & Pagel, Chem. Commun. (2016) 52, 12353
See animation in the supporting information of:
The meaning of ATD peak width
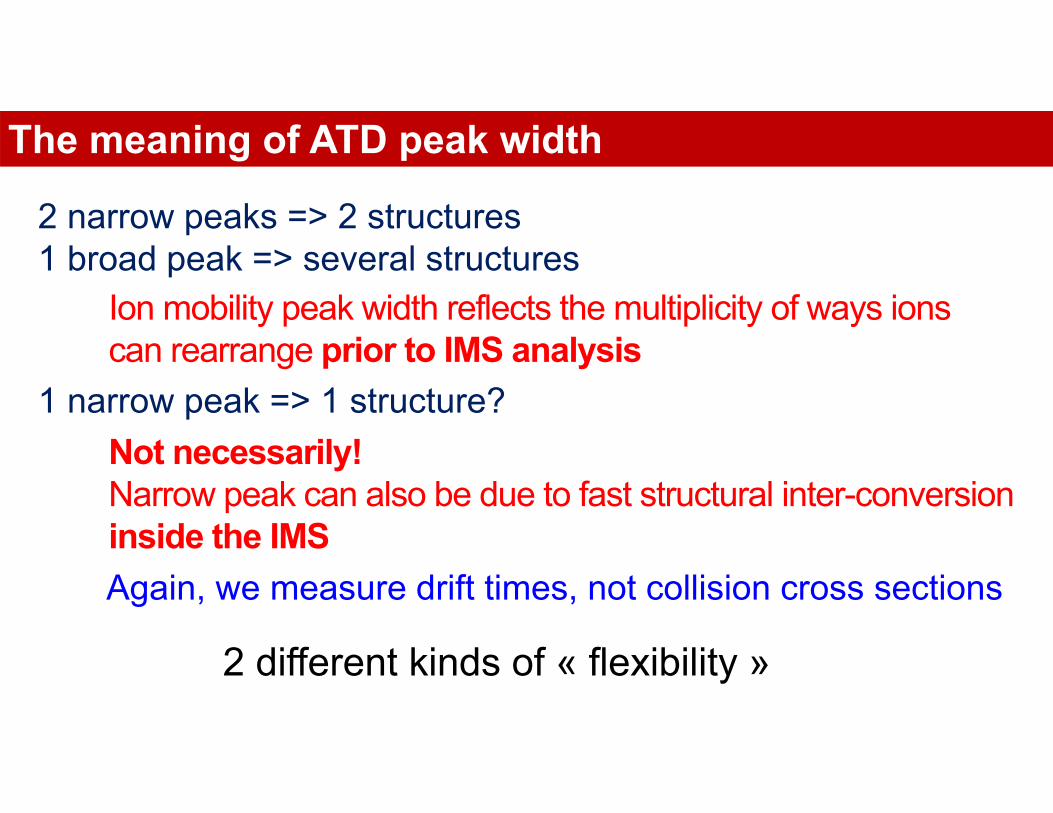
2 narrow peaks => 2 structures1 broad peak => several structures
1 narrow peak => 1 structure?
Ion mobility peak width reflects the multiplicity of ways ions can rearrange prior to IMS analysis
Not necessarily! Narrow peak can also be due to fast structural inter-conversioninside the IMS
2 different kinds of « flexibility »
Again, we measure drift times, not collision cross sections
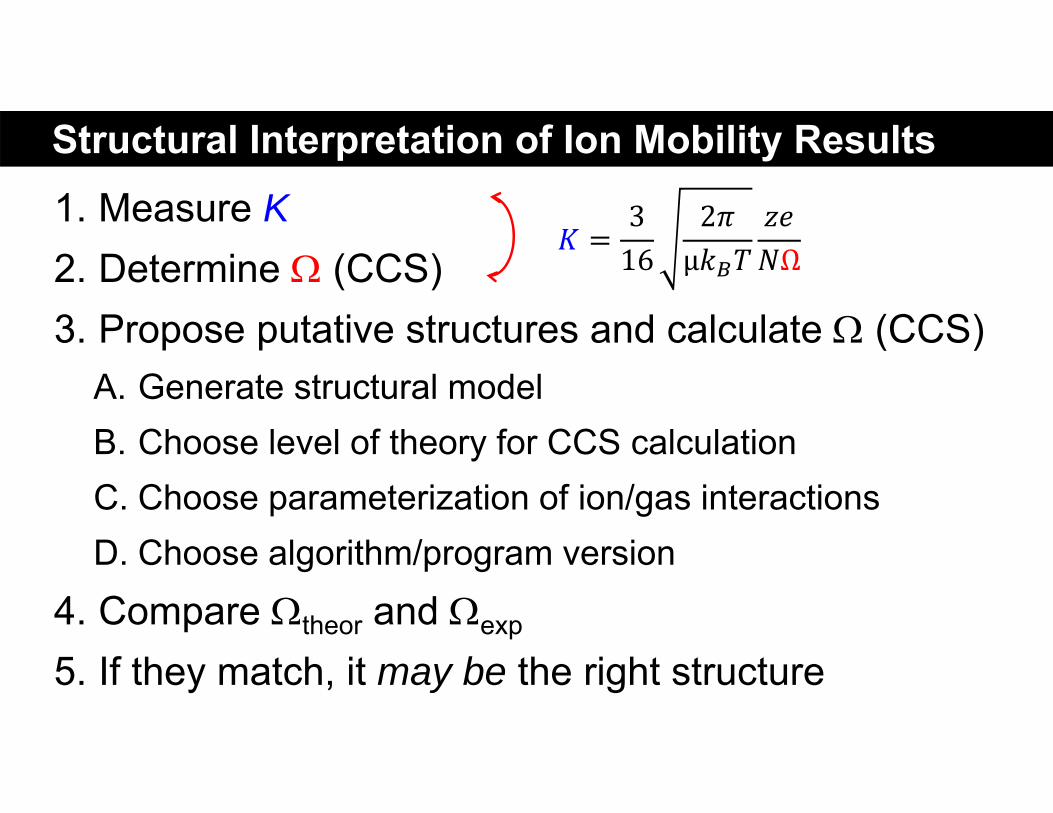
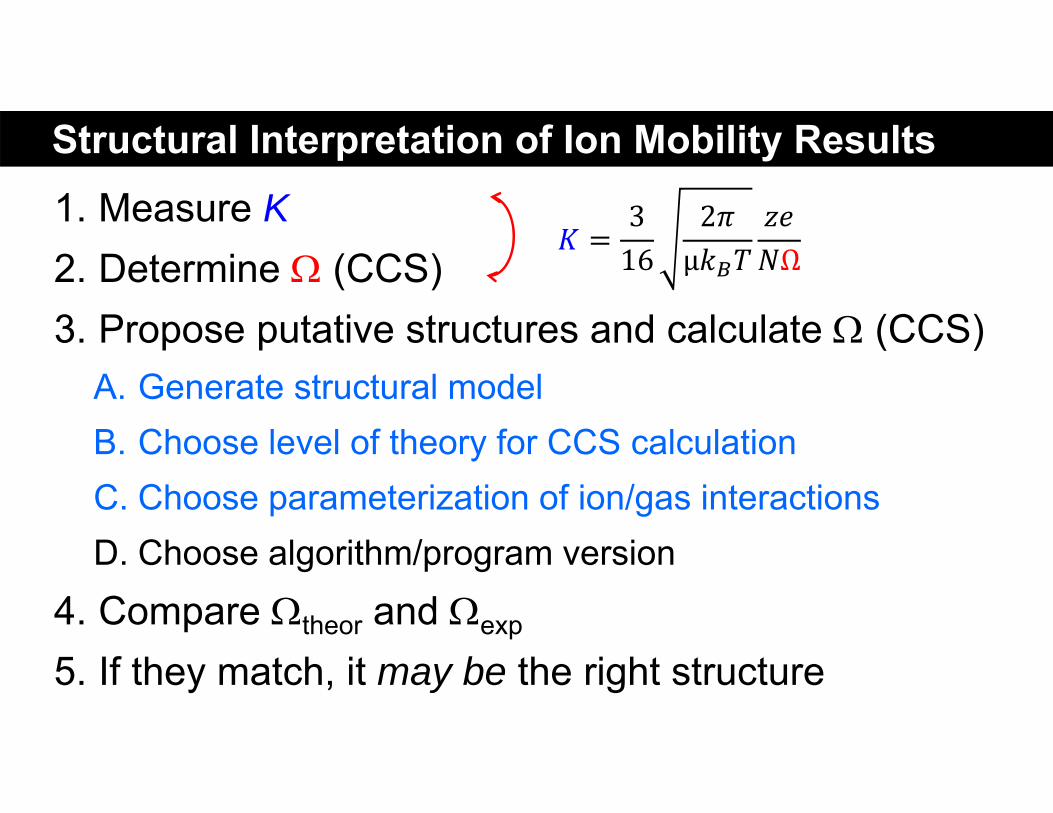
Structural Interpretation of Ion Mobility Results 1. Measure K2. Determine (CCS)3. Propose putative structures and calculate (CCS)
A. Generate structural modelB. Choose level of theory for CCS calculationC. Choose parameterization of ion/gas interactionsD. Choose algorithm/program version
4. Compare theor and exp
5. If they match, it may be the right structure
𝐾3
162𝜋
µ𝑘 𝑇𝑧𝑒𝑁Ω
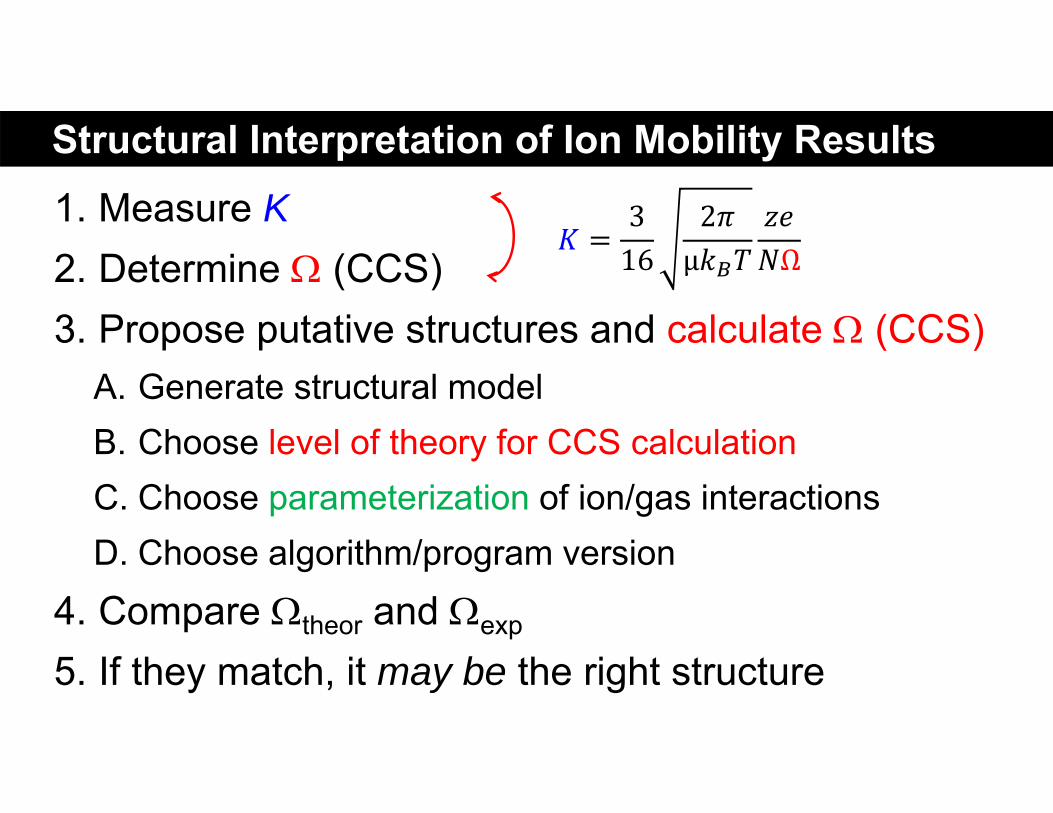
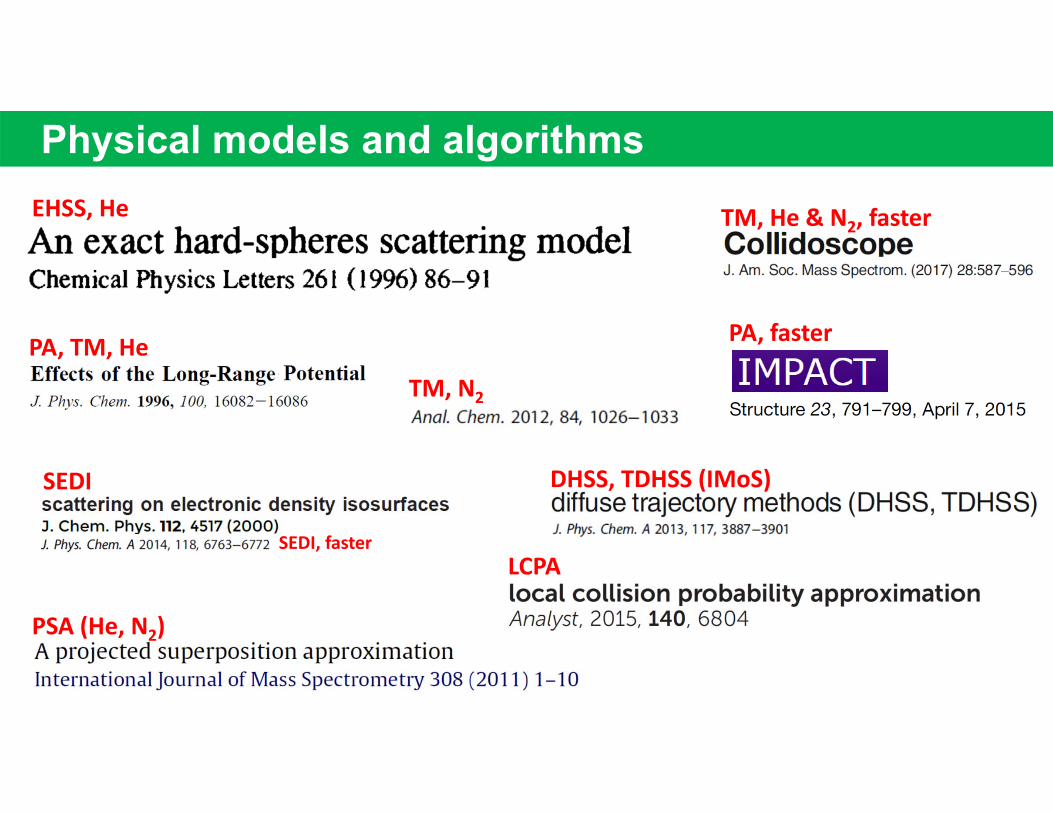
PA, TM, He
EHSS, He
SEDI
PSA (He, N2)
DHSS, TDHSS (IMoS)
TM, He & N2, faster
LCPA
PA, faster
TM, N2
SEDI, faster
Physical models and algorithms
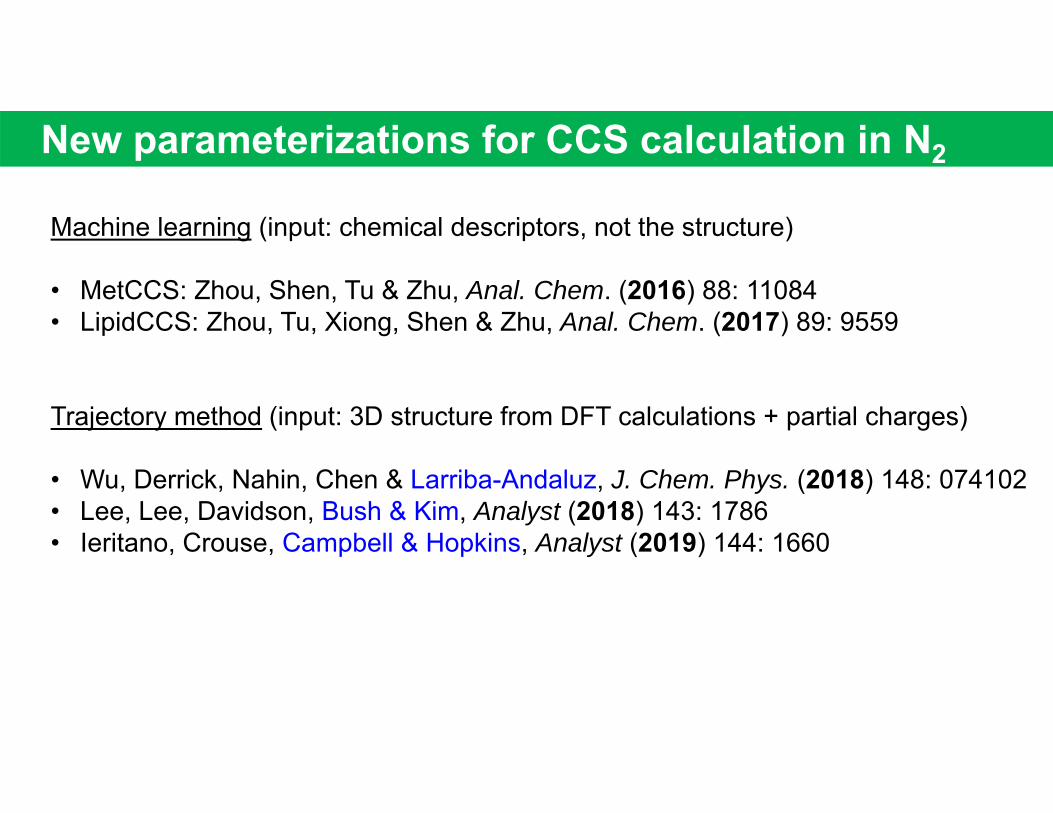
New parameterizations for CCS calculation in N2
Machine learning (input: chemical descriptors, not the structure)
• MetCCS: Zhou, Shen, Tu & Zhu, Anal. Chem. (2016) 88: 11084• LipidCCS: Zhou, Tu, Xiong, Shen & Zhu, Anal. Chem. (2017) 89: 9559
Trajectory method (input: 3D structure from DFT calculations + partial charges)
• Wu, Derrick, Nahin, Chen & Larriba-Andaluz, J. Chem. Phys. (2018) 148: 074102• Lee, Lee, Davidson, Bush & Kim, Analyst (2018) 143: 1786• Ieritano, Crouse, Campbell & Hopkins, Analyst (2019) 144: 1660
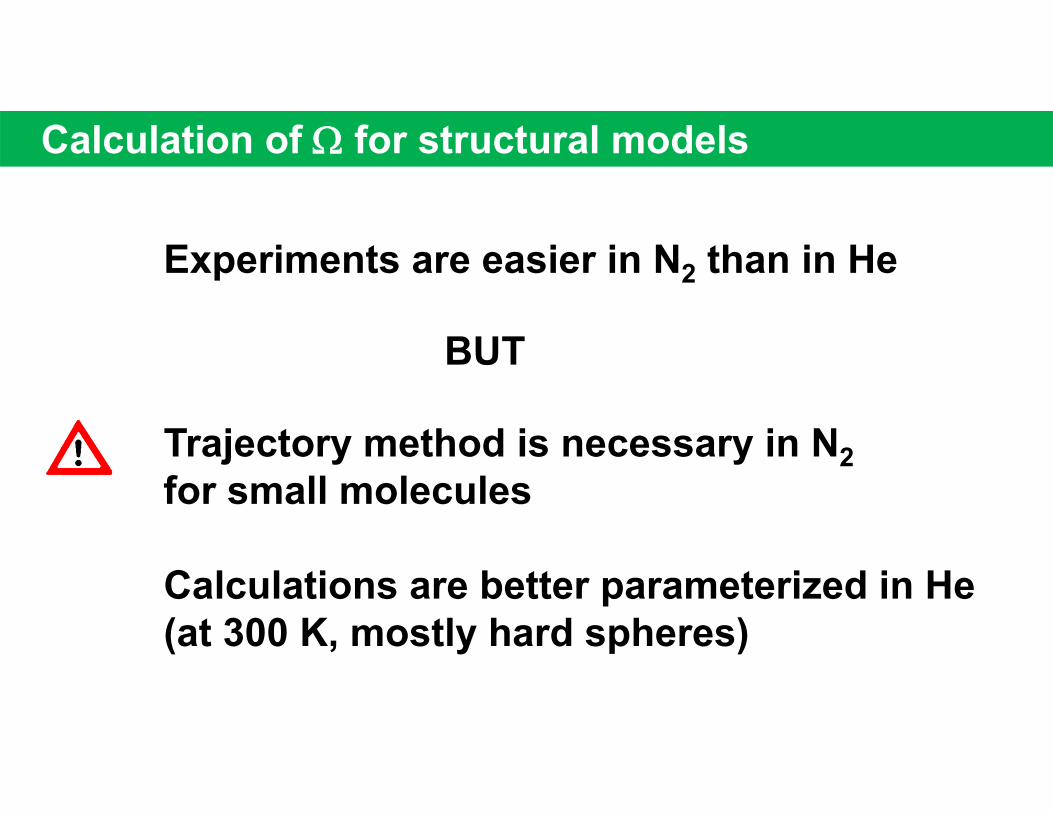
Calculation of for structural models
Trajectory method is necessary in N2for small molecules
Calculations are better parameterized in He(at 300 K, mostly hard spheres)
Experiments are easier in N2 than in He
BUT
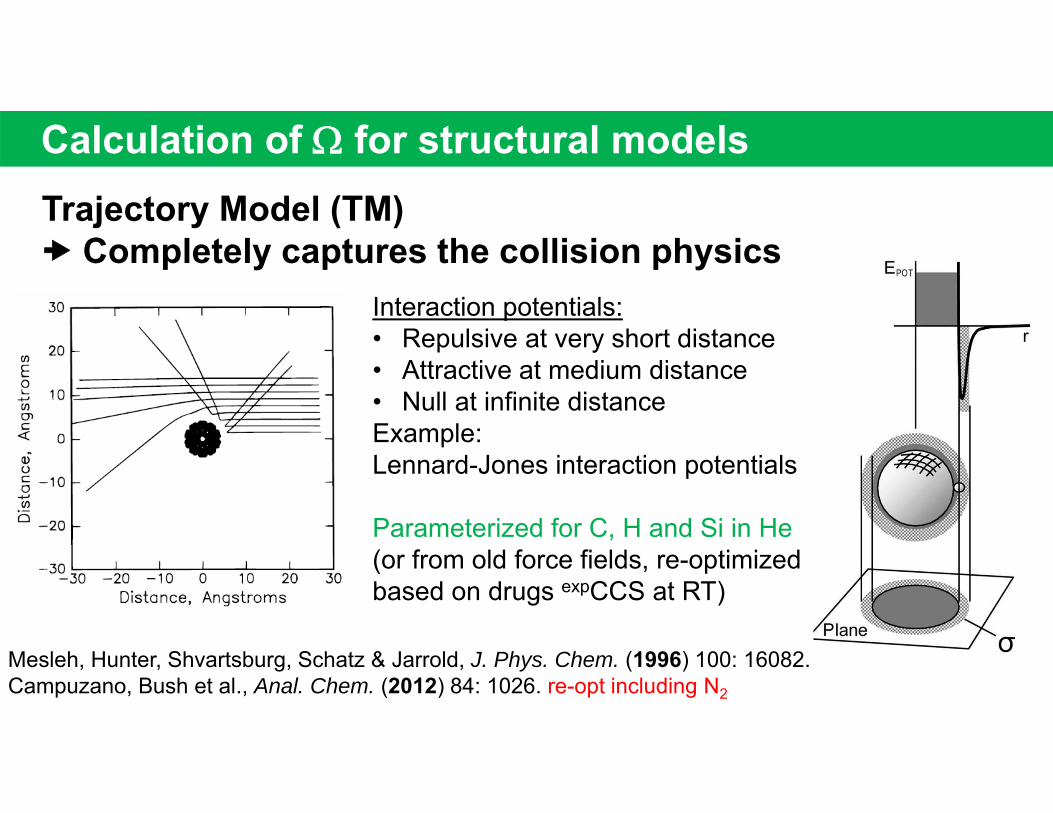
Calculation of for structural modelsTrajectory Model (TM) Completely captures the collision physics
Mesleh, Hunter, Shvartsburg, Schatz & Jarrold, J. Phys. Chem. (1996) 100: 16082.Campuzano, Bush et al., Anal. Chem. (2012) 84: 1026. re-opt including N2
Interaction potentials:• Repulsive at very short distance• Attractive at medium distance• Null at infinite distanceExample: Lennard-Jones interaction potentials
Parameterized for C, H and Si in He(or from old force fields, re-optimizedbased on drugs expCCS at RT)
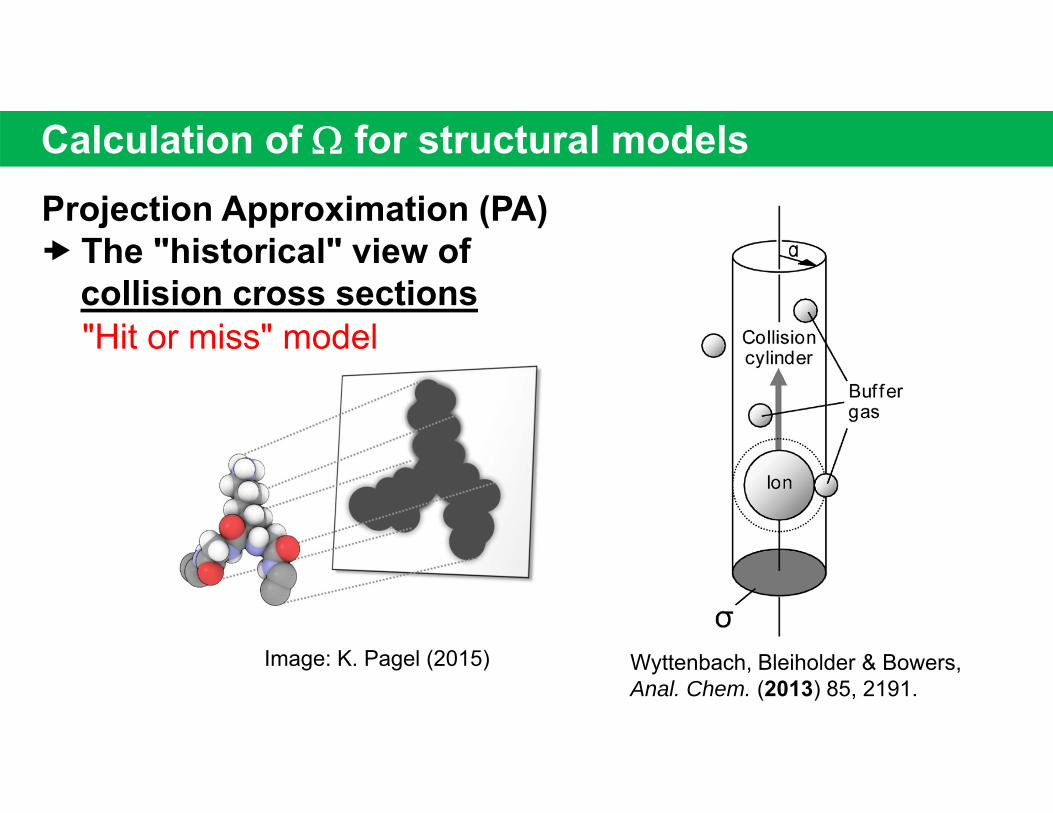
Calculation of for structural modelsProjection Approximation (PA) The "historical" view of
collision cross sections
Wyttenbach, Bleiholder & Bowers, Anal. Chem. (2013) 85, 2191.
hit
Image: K. Pagel (2015)
"Hit or miss" model

Calculation of for structural modelsElastic hard spheres scattering (EHSS)Momentum transfer cross section
Wyttenbach, Bleiholder & Bowers, Anal. Chem. (2013) 85, 2191. Less
efficient
Moreefficient
Surface roughnessmatters
Structural Interpretation of Ion Mobility Results 1. Measure K2. Determine (CCS)3. Propose putative structures and calculate (CCS)
A. Generate structural modelB. Choose level of theory for CCS calculationC. Choose parameterization of ion/gas interactionsD. Choose algorithm/program version
4. Compare theor and exp
5. If they match, it may be the right structure
𝐾3
162𝜋
µ𝑘 𝑇𝑧𝑒𝑁Ω
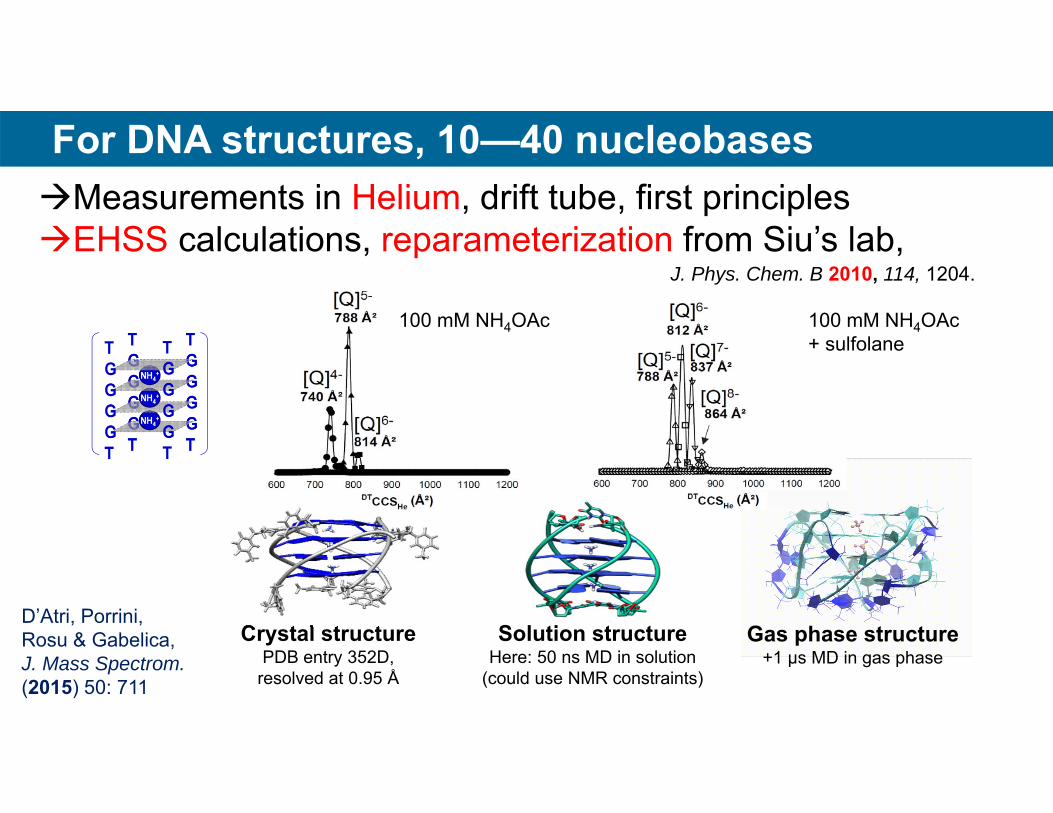
For DNA structures, 10—40 nucleobases
Solution structureHere: 50 ns MD in solution
(could use NMR constraints)
Crystal structurePDB entry 352D,
resolved at 0.95 Å
Gas phase structure+1 µs MD in gas phase
D’Atri, Porrini, Rosu & Gabelica, J. Mass Spectrom. (2015) 50: 711
100 mM NH4OAc 100 mM NH4OAc+ sulfolane
Measurements in Helium, drift tube, first principlesEHSS calculations, reparameterization from Siu’s lab,
J. Phys. Chem. B 2010, 114, 1204.
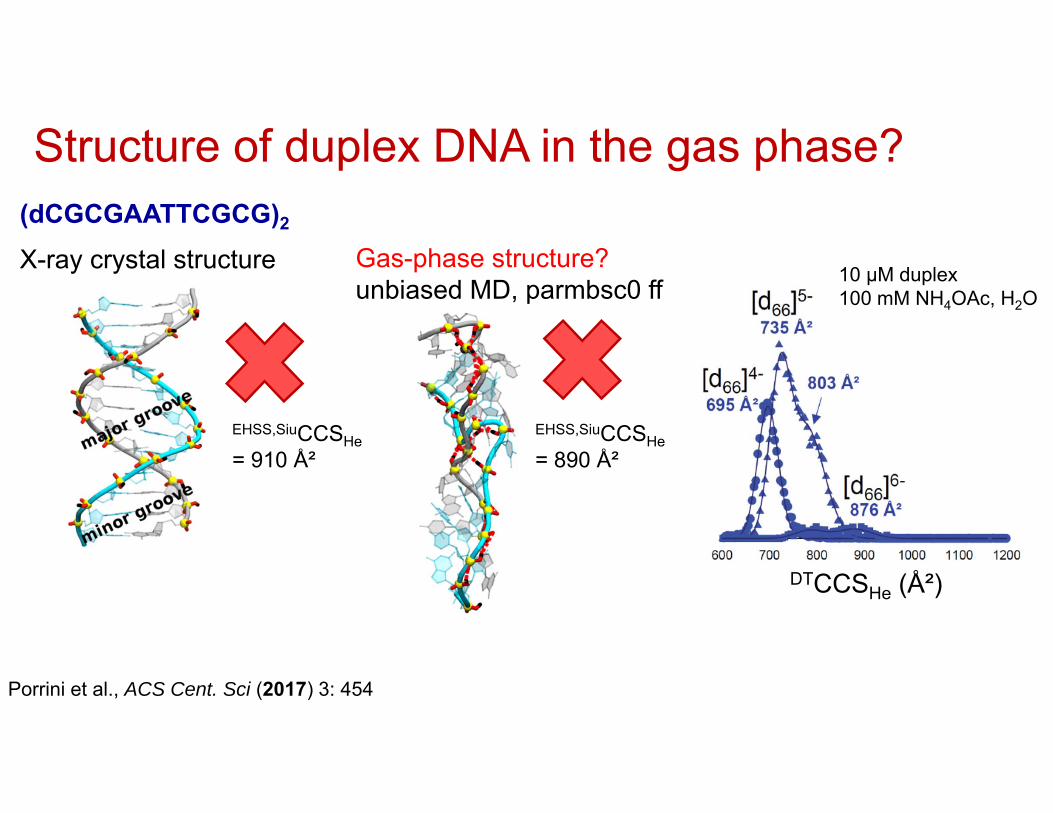
X-ray crystal structure Gas-phase structure?unbiased MD, parmbsc0 ff
DTCCSHe (Ų)
Porrini et al., ACS Cent. Sci (2017) 3: 454
EHSS,SiuCCSHe= 910 Ų
EHSS,SiuCCSHe= 890 Ų
10 µM duplex100 mM NH4OAc, H2O
Structure of duplex DNA in the gas phase?(dCGCGAATTCGCG)2
Porrini et al., ACS Cent. Sci (2017) 3: 454
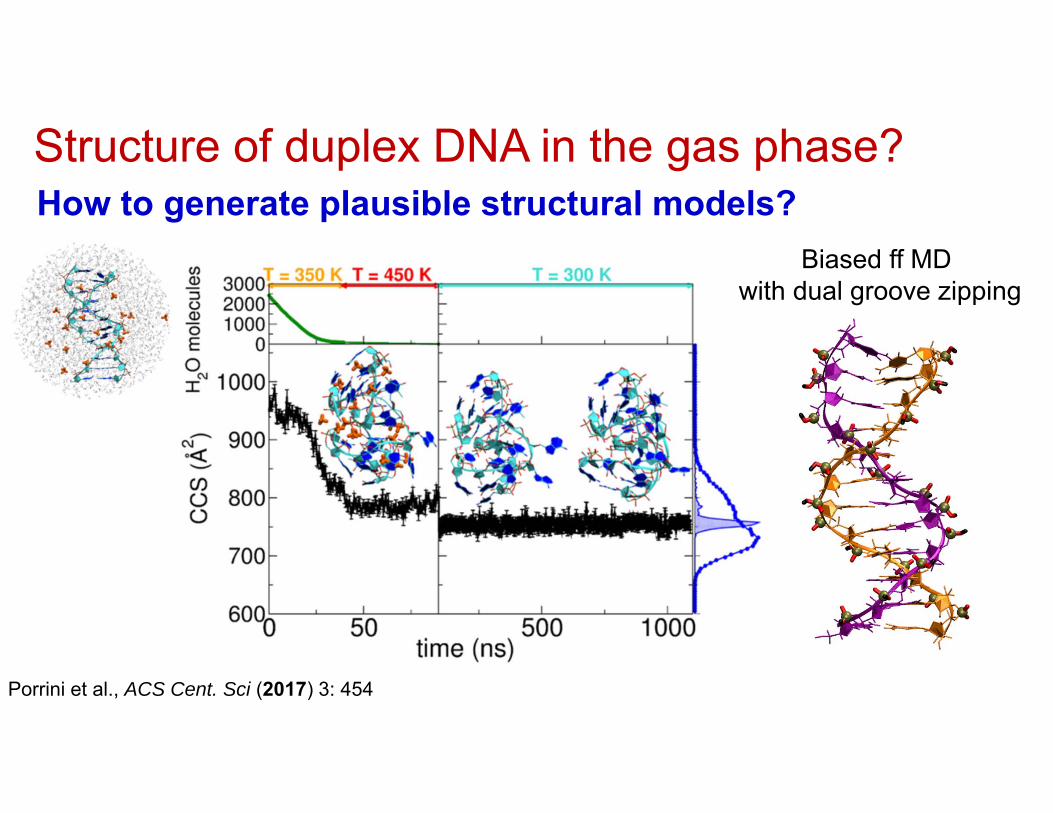
Structure of duplex DNA in the gas phase?How to generate plausible structural models?
Biased ff MD with dual groove zipping
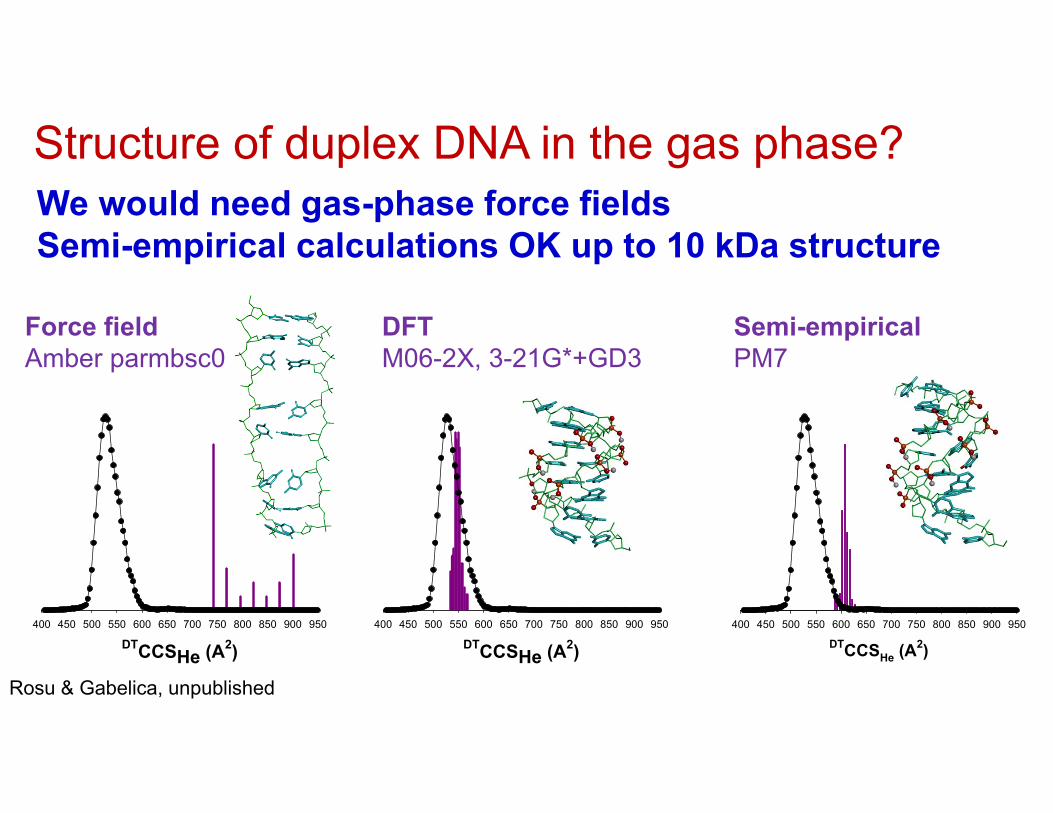
Structure of duplex DNA in the gas phase?
DTCCSHe (A2)400 450 500 550 600 650 700 750 800 850 900 950
DTCCSHe (A2)
400 450 500 550 600 650 700 750 800 850 900 950
DTCCSHe (A2)400 450 500 550 600 650 700 750 800 850 900 950
Force fieldAmber parmbsc0
Semi-empiricalPM7
DFTM06-2X, 3-21G*+GD3
Rosu & Gabelica, unpublished
We would need gas-phase force fieldsSemi-empirical calculations OK up to 10 kDa structure
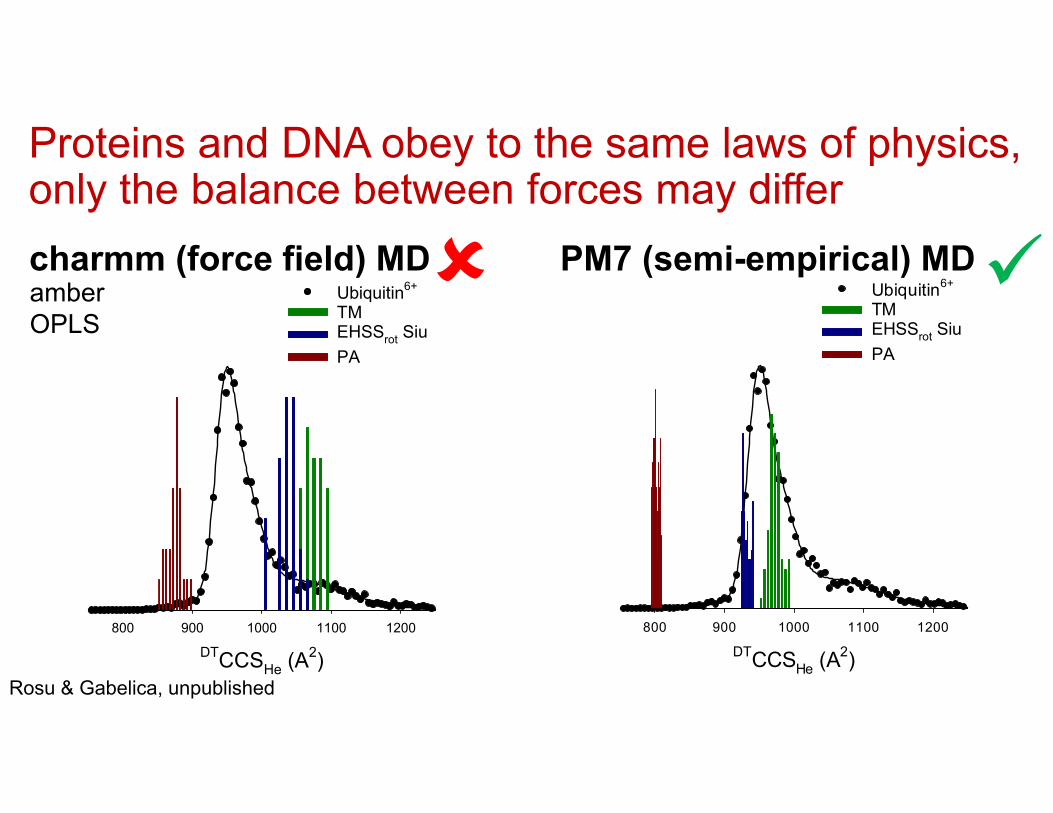
Proteins and DNA obey to the same laws of physics,only the balance between forces may differcharmm (force field) MD PM7 (semi-empirical) MD
DTCCSHe (A2)
800 900 1000 1100 1200
Ubiquitin6+
TMEHSSrot SiuPA
DTCCSHe (A2)
800 900 1000 1100 1200
Ubiquitin6+
TMEHSSrot SiuPA
amberOPLS
Rosu & Gabelica, unpublished
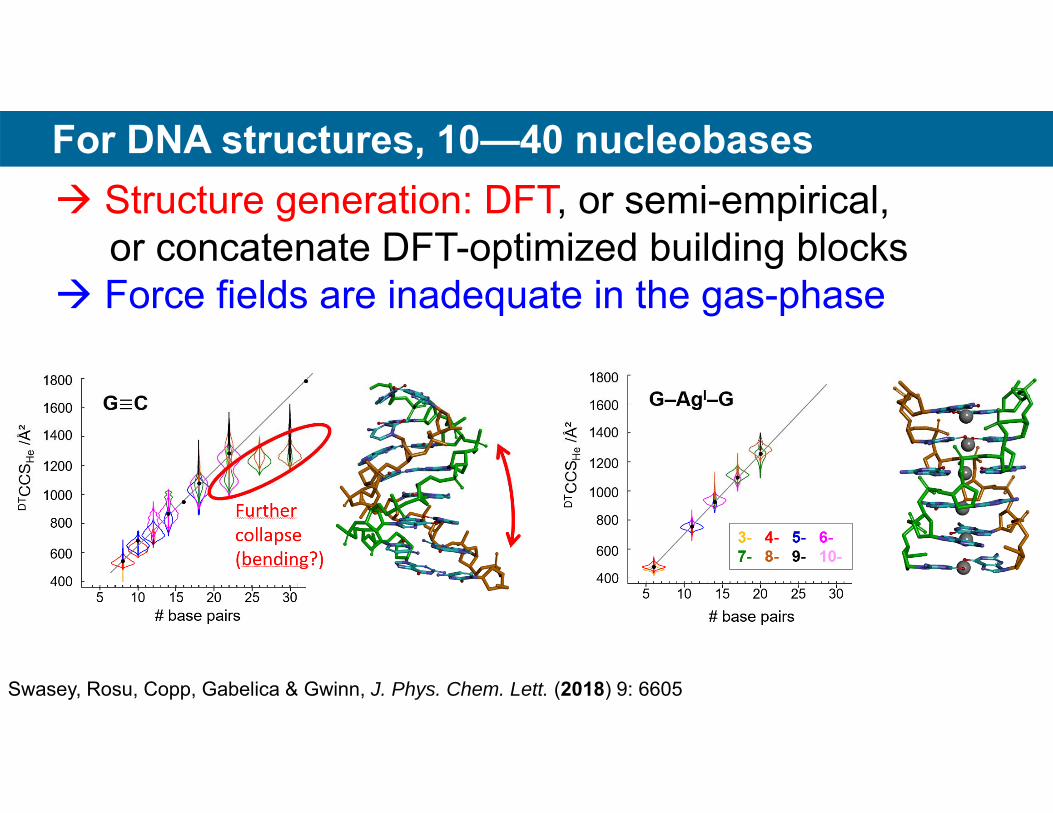
For DNA structures, 10—40 nucleobases Structure generation: DFT, or semi-empirical,
or concatenate DFT-optimized building blocks Force fields are inadequate in the gas-phase
Swasey, Rosu, Copp, Gabelica & Gwinn, J. Phys. Chem. Lett. (2018) 9: 6605
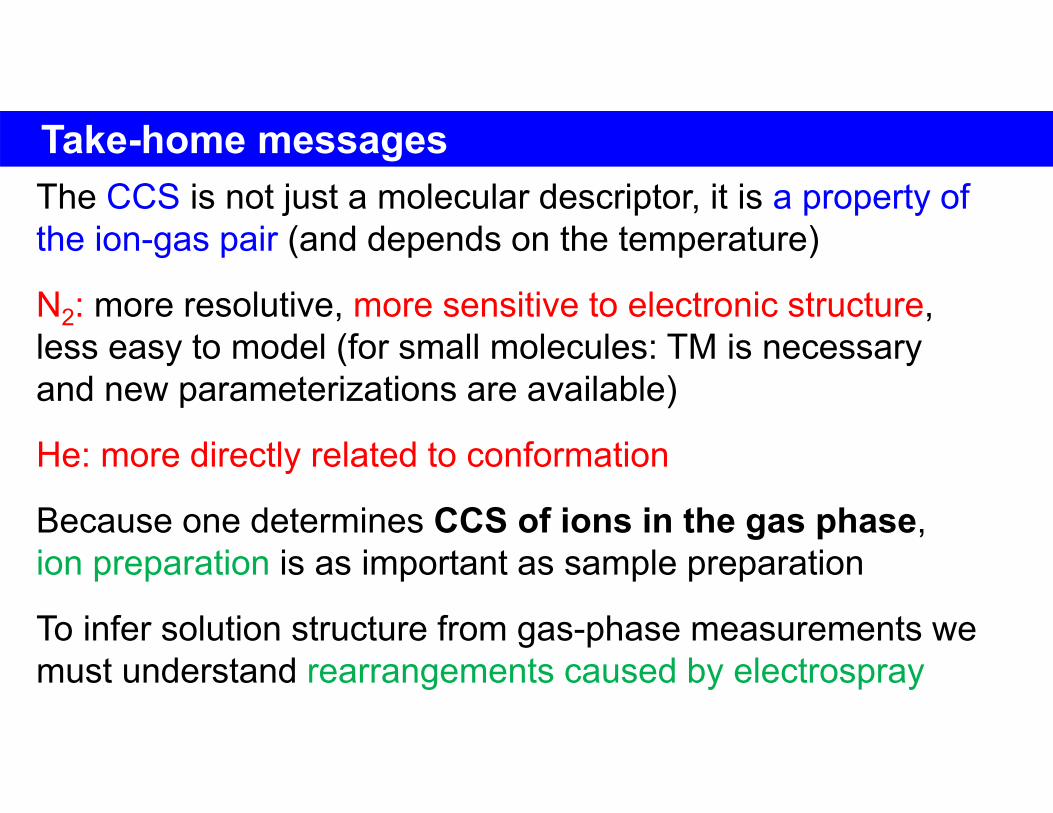
Take-home messagesThe CCS is not just a molecular descriptor, it is a property of the ion-gas pair (and depends on the temperature)
N2: more resolutive, more sensitive to electronic structure, less easy to model (for small molecules: TM is necessaryand new parameterizations are available)
He: more directly related to conformation
Because one determines CCS of ions in the gas phase, ion preparation is as important as sample preparation
To infer solution structure from gas-phase measurements wemust understand rearrangements caused by electrospray
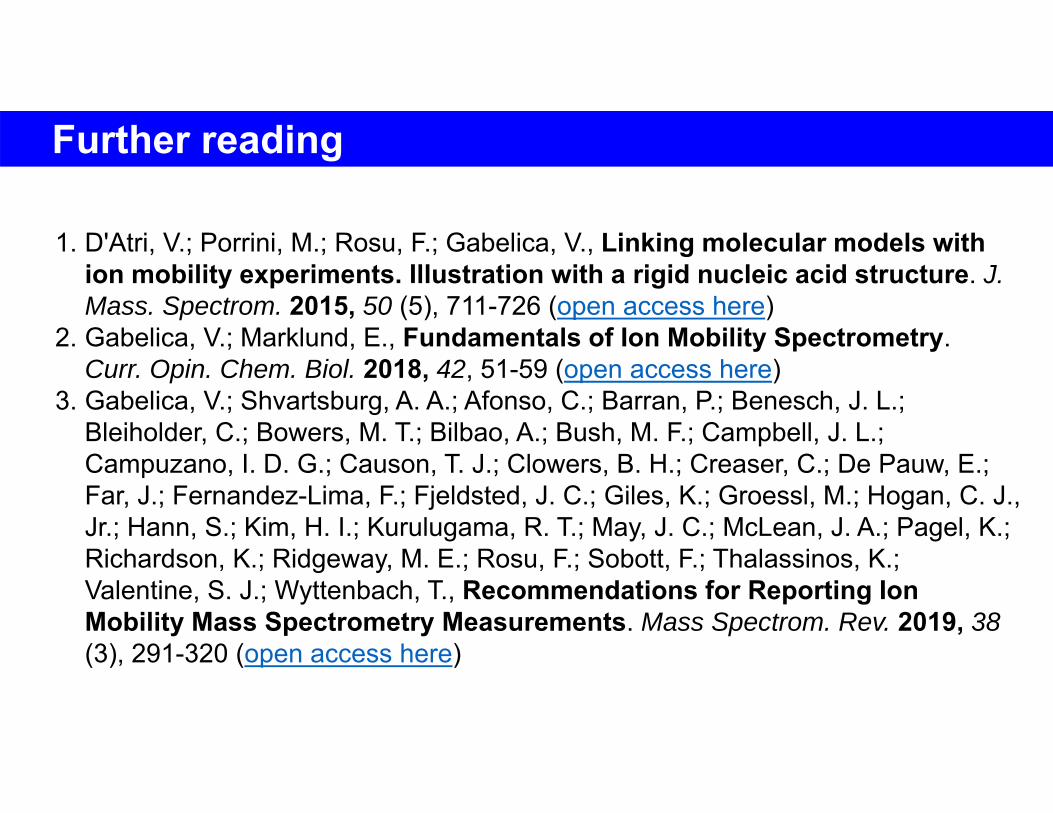
Further reading
1. D'Atri, V.; Porrini, M.; Rosu, F.; Gabelica, V., Linking molecular models with ion mobility experiments. Illustration with a rigid nucleic acid structure. J. Mass. Spectrom. 2015, 50 (5), 711-726 (open access here)
2. Gabelica, V.; Marklund, E., Fundamentals of Ion Mobility Spectrometry. Curr. Opin. Chem. Biol. 2018, 42, 51-59 (open access here)
3. Gabelica, V.; Shvartsburg, A. A.; Afonso, C.; Barran, P.; Benesch, J. L.; Bleiholder, C.; Bowers, M. T.; Bilbao, A.; Bush, M. F.; Campbell, J. L.; Campuzano, I. D. G.; Causon, T. J.; Clowers, B. H.; Creaser, C.; De Pauw, E.; Far, J.; Fernandez-Lima, F.; Fjeldsted, J. C.; Giles, K.; Groessl, M.; Hogan, C. J., Jr.; Hann, S.; Kim, H. I.; Kurulugama, R. T.; May, J. C.; McLean, J. A.; Pagel, K.; Richardson, K.; Ridgeway, M. E.; Rosu, F.; Sobott, F.; Thalassinos, K.; Valentine, S. J.; Wyttenbach, T., Recommendations for Reporting Ion Mobility Mass Spectrometry Measurements. Mass Spectrom. Rev. 2019, 38(3), 291-320 (open access here)