Ion detection in the photoionization of a Rb Bose–Einstein condensate
14
arXiv:1002.0212v1 [physics.atom-ph] 1 Feb 2010 Ion detection in the photoionization of a Rb Bose-Einstein condensate M. Viteau†, J. Radogostowicz†, A. Chotia + , M. G. Bason + , N. Malossi†, F. Fuso†, D. Ciampini†, O. Morsch + , I. I. Ryabtsev + §, E. Arimondo†. + ‖ † CNISM UdR Pisa, Dipartimento di Fisica E. Fermi, Universit`a di Pisa, Largo Pontecorvo 3, I-56127 Pisa, Italy + CNR-INO, Dipartimento di Fisica E. Fermi, Universit`a di Pisa, Largo Pontecorvo 3, I-56127 Pisa, Italy PACS numbers: 03.65.Xp, 03.75.Lm Abstract. Two-photon ionization of Rubidium atoms in a magneto-optical trap and a Bose-Einstein condensate (BEC) is experimentally investigated. Using 100 ns laser pulses, we detect single ions photoionized from the condenstate with a 35(10)% efficiency. The measurements are performed using a quartz cell with external electrodes, allowing large optical access for BECs and optical lattices. 1. Introduction The development of laser cooling and trapping techniques has enabled the creation of dense and ultracold atomic samples, thus opening the way for laser spectroscopic investigations in regimes not accessible with conventional techniques. A wide range of applications are associated with ultracold atoms in different configurations, in particular the use of atoms in optical lattices and the configuration of a single atom per lattice site: the Mott insulator phase of bosonic atoms [1]. Atoms prepared in this way are candidates for qubit elements in quantum computation. Crucial issues to be solved in order to realize this quantum computation configuration are the initialization and readout operations on a single site of the lattice. In addition, high detection sensitivity will be required to isolate the signal of single atoms. Ion detection is a very efficient tool, because the charge amplification associated with existing devices increases the small signal generated by just a single ion to a measurable size. Laser photoionization can create ions or electrons with nearly unity probability using short and intense laser pulses. Ion detection efficiency for single ion with channel electron multipliers (CEM) may reach up to 80-90 percent, provided the § Permanent address: Institute of Semiconductor Physics, Pr. Lavrentyeva 13, 630090 Novosibirsk, Russia ‖ To whom correspondence should be addressed ([email protected])
-
Upload
independent -
Category
Documents
-
view
3 -
download
0
Transcript of Ion detection in the photoionization of a Rb Bose–Einstein condensate

arX
iv:1
002.
0212
v1 [
phys
ics.
atom
-ph]
1 F
eb 2
010
Ion detection in the photoionization of a Rb
Bose-Einstein condensate
M. Viteau†, J. Radogostowicz†, A. Chotia+, M. G. Bason+,
N. Malossi†, F. Fuso†, D. Ciampini†, O. Morsch+,
I. I. Ryabtsev+§, E. Arimondo†.+‖† CNISM UdR Pisa, Dipartimento di Fisica E. Fermi, Universita di Pisa, Largo
Pontecorvo 3, I-56127 Pisa, Italy+ CNR-INO, Dipartimento di Fisica E. Fermi, Universita di Pisa, Largo Pontecorvo
3, I-56127 Pisa, Italy
PACS numbers: 03.65.Xp, 03.75.Lm
Abstract. Two-photon ionization of Rubidium atoms in a magneto-optical trap
and a Bose-Einstein condensate (BEC) is experimentally investigated. Using 100 ns
laser pulses, we detect single ions photoionized from the condenstate with a 35(10)%
efficiency. The measurements are performed using a quartz cell with external
electrodes, allowing large optical access for BECs and optical lattices.
1. Introduction
The development of laser cooling and trapping techniques has enabled the creation
of dense and ultracold atomic samples, thus opening the way for laser spectroscopic
investigations in regimes not accessible with conventional techniques. A wide range of
applications are associated with ultracold atoms in different configurations, in particular
the use of atoms in optical lattices and the configuration of a single atom per lattice
site: the Mott insulator phase of bosonic atoms [1]. Atoms prepared in this way are
candidates for qubit elements in quantum computation. Crucial issues to be solved
in order to realize this quantum computation configuration are the initialization and
readout operations on a single site of the lattice. In addition, high detection sensitivity
will be required to isolate the signal of single atoms.
Ion detection is a very efficient tool, because the charge amplification associated
with existing devices increases the small signal generated by just a single ion to a
measurable size. Laser photoionization can create ions or electrons with nearly unity
probability using short and intense laser pulses. Ion detection efficiency for single ion
with channel electron multipliers (CEM) may reach up to 80-90 percent, provided the
§ Permanent address: Institute of Semiconductor Physics, Pr. Lavrentyeva 13, 630090 Novosibirsk,
Russia‖ To whom correspondence should be addressed ([email protected])
Ions in MOT/BEC photonization 2
ion energy is high enough (3-5 keV). Thus, ion detection is an efficient tool for detecting
a few atoms while not destroying the whole sample.
The investigation of photoionization of a cold cloud trapped in a MOT was first
studied by Dinneen et al [2] using rubidium atoms, and later applied to other alkalis
and alkaline-earth atoms. Using trap loss spectroscopy the two-photon ionization cross-
section of rubidium ground state atoms in a MOT was measured [3, 4]. These works
used the 6P3/2 state as a near resonant intermediate state. Subsequent theoretical
calculations of ionization cross-sections, stimulated by these cold atom measurements,
are reported in references [3, 5].
In comparison with cold atoms in a MOT, the photoionization rate of a Bose-
Einstein condensate (BEC) should be reduced by a Pauli blockade process because the
single-energy products, ions and electrons, obey Fermi-Dirac statistics [6]. However this
predicted behavior is inhibited by the fast thermalization of electrons [7]. Theoretical
analyses predict that the interactions between a BEC and a positively charged alkali-
metal ion should lead to the rapid formation of mesoscopically large molecular ions
and an excess number (positive or negative) of atoms around an ion created within the
condensate [8, 9]. A comparison of photoionization losses from atoms in a MOT or a
BEC confined by a magnetic trap indicated larger losses for the BEC [10].
Rydberg-Rydberg collisions mediated by dipole-dipole interactions lie at the heart
of several schemes of quantum information processing [11, 12]. Electron/ion collection is
a basic technique for the detection of Rydberg states created by exciting cold or ultracold
atoms. Ion detection efficiency plays an important role in the spectroscopy of resonant
collisions of a few Rydberg atoms, as discussed initially by Cubel Liebisch et al [13] and
later by Ryabtsev et al [14]. Such efficiencies are not always precisely known, making
interpretation of experimental data more difficult. Detailed characterisations of ion
detection efficiencies are thus worthwhile. As an example using cold atoms in a MOT,
an estimation of electron detection efficiency yielded 1.5% [15]. Reference [14] describes
a method to determine the ion detection efficiency and mean number of Rydberg
atoms excited per laser pulse, and reports an initial efficiency of 13(1.5)%, increased
to 65(5)% by a detection system properly designed for the MOT [16, 17]. More complex
configurations, such as those with a double detector for electrons and ions have also been
explored [18]. The research group of Zimmerman use Rb photoionization as a technique
for the sensitive detection of atoms in the condensate [19, 20]. For a MOT created
on an atomic chip, the same research group recently reported single Rb atom counting
rates of up to several MHz, with 67(12)% efficiency using three-photon ionization and
subsequent ion detection with a CEM [21]. A high ion detection efficiency allowed the
observation of sub-Poissonian statistics for ions produced by Rydberg excitation [13].
This work examines rubidium BEC photoionization within an apparatus
incorporating a quartz cell with large optical access. Such cells are useful for Rydberg
atomic excitation and optical lattice confinement. As the electrodes are located outside
the cell, some shielding of the electric field is seen. Care must also be taken not to charge
the cell due to prolonged exposure to high voltages. Despite these limitations, collection
Ions in MOT/BEC photonization 3
and detection of ions is still efficient. We report measurements of both atom number
losses and ion generation resulting from photoionization. A systematic comparison of the
photoionization products originating from the MOT or BEC allows the characterization
of the processes of ion production and detection. From this analysis we deduce a large
detection efficiency, T , in our apparatus of 35(10)%. Our results demonstrate that ion
creation represents a powerful tool towards the target of single atom detection within a
condensate.
Section 2 describes the experimental apparatus used to produce BECs, atomic
ionization and charge collection. The experimental results and their analyses for two
different photoionization schemes are detailed in section 3. Following the absorption
of laser pulses with long, the ultracold atoms in the BEC recoil due to spontaneous
emission. This effect, along with two-photon ionization spectra of the BEC, are
presented. Calibration of the ion detection efficiency and the Poisson distribution
associated with the ion collection process are also detailed. The photoionization rates
of MOT atoms for two photoionization schemes are compared to those measured in a
BEC. Section 5 presents our conclusions. An appendix recalls the theoretical approach
introduced in reference [3] and used to extract the photoionization atomic parameters
from the atom loss measurements.
2. Set-up
The BEC apparatus uses two quartz cells, called collection and science cells respectively,
horizontally mounted on a central metallic structure. In the collection cell, 87Rb atoms
are captured and cooled in a 2D MOT, producing a continuous flux of atoms from the
collection to the science cell. Within the science cell, the lifetime of the atoms in the 3D
MOT is around two minutes. The 3D MOT runs in two configurations to give different
sizes, around 1 mm when the fluorescent signal is monitored and around 100–200 µm
during ion detection. A small MOT with a low number of cold atoms avoids saturation of
the charge collection and allows uniform illumination of the atoms by the ionizing laser
beams. To produce a BEC, atoms are first evaporatively cooled in a TOP magnetic trap,
until the phase space density reach a value around 0.1. Then the atoms are loaded into
an optical dipole trap created by two crossed beams derived from a 1030 nm Yb:YAG
with 3 W cw power, focussed to a waist of 70 µm. Using a PID lock to regulate the laser
power ensures high stability of the potential in the dipole trap. Evaporative cooling
in the dipole trap yields pure condensates of around 105 atoms. Absorption imaging
after a 6.3 ms time-of-flight (TOF) is used to monitor the MOT/BEC before and after
ionization.
To generate ions, two different schemes are used, as shown in figures 1(a) and (b). In
the first scheme, the 6P3/2 level lying 421 nm from the 5S1/2(F = 2) ground state is used
as a resonant intermediate state for two-photon absorption. The ionization threshold
can thus be crossed from the 6P state by absorbing a second 421 nm or a 1002 nm
photon. The second scheme is based on the atomic excitation to the 5P3/2 state by

Ions in MOT/BEC photonization 4
the cooling lasers followed by absorption of 421 nm radiation, as shown in figure 1(b).
For this scheme in order to attain higher intensities, the 421 nm beam is focussed to
a waist, w, of 70 µm larger than the BEC size. This arrangement maintains the BEC
cloud within the beam waist in the presence of fluctuations in the spatial position of
the condensate, less than 10 µm. The ionizing laser beams are pulsed with duration
τpul, between 0.3 and 1.2 µs, with a gaussian rise time τrise ∼ 0.08 µs controlled by an
acousto-optic modulator.
By doubling a MOPA laser (TOPTICA TA 100, output power 700 mW) with a
TOPTICA cavity, 60 mW of 421 nm radiation is generated. An infrared laser tuned
between 1000 and 1030 nm allows ionization or spectroscopic resolved excitation to states
from n = 30 quantum number to the continuum. A combination of power and stability
of the infrared radiation is achieved by injecting a Sacher diode (output power 40 mW)
into a Sacher TIGER laser (output power 250 mW) where the grating is replaced by a
mirror. Both laser systems, having a line-width smaller than 1 MHz, are locked using a
Fabry Perot interferometer where a 780 nm laser locked to the Rb resonance acts as a
reference [22, 23].
Figure 1. In (a) and (b) the atomic levels involved in the two photoionization
schemes are presented. A schematic of the ion collection system produced by the
MOT/BEC ionization within the vacuum quartz cell is shown in (c). The laser beams
are superimposed so as to excite atoms within the same volume. The configuration
with plates on the front and sides of the cell, grid and CEM to the rear is shown.
Electrons or ions are collected depending on the signs of the applied voltages. In (d)
a typical ion measurement shows the arrival of 4 ions .
The electron/ion detection scheme is shown in figure 1(c). A CEM is located around
15 cm from the cell centre, close to the exit of the graphite tube between the collection
and science cells. A grid at a high voltage and located 10 cm from the ultracold atomic
cloud guides the emitted ions/electrons. High voltage plates placed outside the cell on
the front and to the side guide the charges produced at the centre of the science cell

Ions in MOT/BEC photonization 5
to the CEM. The ions are collected through a sequence of short electric pulses which
typically have a rise time of a few ns. In the initial configuration, the high voltages were
applied only to the front plates (3 kV for 5 µs) and the grid (-1 kV for 25 µs).¶ To
improve the detection efficiency a +3 kV pulse was applied to the front plates for 5 µs and
simultaneously a -1.5 kV pulse was applied to the lateral plates. Afterwards, a -1.2 kV
pulse was applied to the grid. The length of all the applied electric fields are kept short
to avoid charging the quartz cell. This configuration ensures a more efficient attraction
of positive ions toward the CEM. Ion collection was chosen in order to realize a temporal
separation between the collected charge signal and the spurious signal induced by the
electric field switch on the CEM output. The detection efficiency, T , represents a global
efficiency taking into account both the fraction of produced charges transported to the
detector and the CEM conversion efficiency. Its value, under both field arrangements,
is reported in section 4. The sensitivity of the apparatus allows the monitoring of single
ion signals, as can be seen in figure 1(d). Depending on the number of produced ions
and their arrival time spread, ion counting or signal integration by a boxcar is used.
From the histogram of the collected ion pulse areas, a conversion between output signal
and that due to a single ion is derived.
Figure 2. (In colour on line) In (a), the Pph photoionization probability per laser pulse
and in (b), the S(2) unitary flux photoionization rate versus the blue laser intensity
Iblue at Iir = 2000 W/cm2, and different pulse lengths, green circles τpulse = 1 µs, blue
triangles 0.5 µs and red squares 0.25 µs, having 80 ns rise and fall times. The continuous
lines represent theoretical predictions for those different pulse lengths, green, blue and
red, respectively.
¶ Rydberg spectroscopy indicates that the electric field acting on the atoms is roughly ten times smaller
than that applied to the outside of the cell. This is due to partial shielding by the 2 mm thick, quartz
walls.

Ions in MOT/BEC photonization 6
3. Results
3.1. Two-photon MOT population losses
Initially the 421+1002 nm ionization of the MOT atoms was measured through atom
losses, as described in appendix A. The photoionization probability per pulse, Pph, and
the unitary flux photoionization rate, S(2) introduced in that appendix are plotted as a
function of Iblue and τpulse in figure 2(a) and (b). Both plots are in good agreement with
theory, confirming the excellent control over photoionization, and also the importance
of the pulse rise/fall times. The influence of saturation and shifts on the intermediate
level is manifested in the change of S(2) with pulse length and laser intensity.
MOT losses for the case of two-photon ionization via the 5P3/2 level using the
cooling laser at 780 nm and the 421 nm laser are presented in figure 3. For the
range of intensities explored, Iblue= 2-100 W/cm2, the MOT ionization rate is strictly
proportional to the product of the laser intensities. Because the large laser intensity is
applied to the transition from an excited state to the continuum, shifts and widths of the
intermediate states and optical pumping were not important for the ionization process.
The resultant photoionization probability is plotted in figure 3(a) versus the blue laser
intensity and in figure 3(b) versus the pulse duration at fixed blue laser intensity, the
continuous lines report the theoretical predictions. To properly analyse the MOT atom
losses, the modification of the atomic cloud volume following ionization losses is taken
into account. For this correction, it is assumed that the MOT operates in the constant
density regime [24].
Figure 3. In (a), 780 + 421 nm photoionization probability Pph per µs versus blue
laser intensity Iblue, τpulse =1 µs. While (b) shows the photoionization probability
per laser pulse, Pph versus the pulse duration τpulse for Iblue = 44.2 W/cm2. These
same data are reported on the left plot applying a linear temporal scaling. In both
plots, the 780 nm laser intensity is 0.15 W/cm2and has detuning -16.8 MHz from the
5S1/2 (F = 2) → 5P3/2 (F ′ = 3) resonance. The continuous lines represent theoretical
predictions.

Ions in MOT/BEC photonization 7
25
20
15
10
5
0
<N
ions
>T
-60 -40 -20 0 20 40 60
Blue laser detuning (MHz)
20
15
10
5
0
Pph (x10
-3)
3
2
1
0
p rec/
(hν bl
ue/c
)
-150 -100 -50 0 50
Blue laser detuning (MHz)
(b)(a)
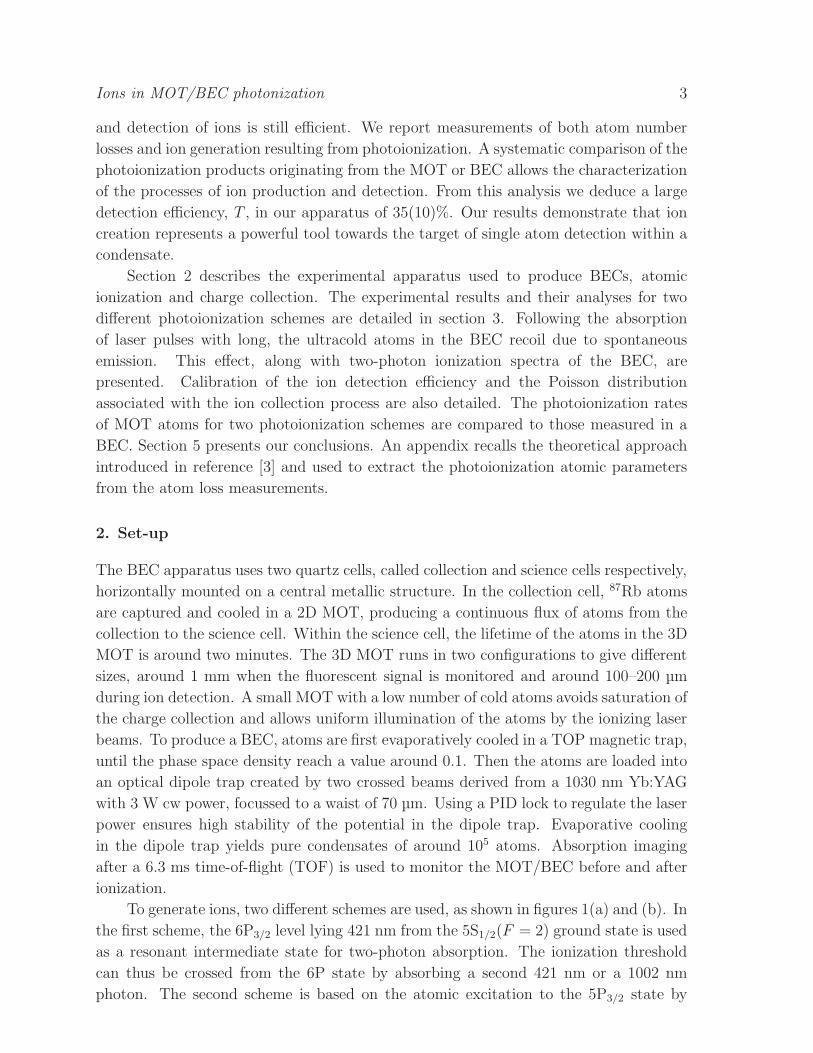
Figure 4. In (a) ion spectra produced by BEC photoionization using 421+1002 nm
laser beams versus blue laser detuning, at constant IR laser power are shown. The
number of BEC atoms is around 1×10⁵. The number of collected ions is calculated from
the output voltage, minus the average background, divided by the output voltage per
ion as derived from the pulse histogram. Each data point is produced by a laser pulse
with Iblue= 0.12 W/cm2. The continuous line shows the calculated photoionization
probability Pph (right scale). Spectra observed on the prec recoil of the ultracold
cloud, derived from the displacement of the thermal cloud centre, versus the blue
laser frequency at Iblue = 4 W/cm2 are shown in (b). The continuous line shows the
calculated recoil momentum prec, again measured in units of the photon momentum
hνblue/c. Zero detuning corresponds to the 5S1/2(F = 2) → 6P3/2(F′ = 3) transition.
The resonant peaks correspond to the excitation of the upper F ′=1, 2, 3 hyperfine
states. In both spectra Iir = 2000 W/cm2 and τpulse = 0.5 µs.
3.2. Ions produced from BEC
Both photoionization schemes are also investigated using BEC atoms. One target of the
investigation was to verify whether or not photoionization of a BEC leads to different
processes from those occurring in a MOT. By observing atom losses and ion creation,
for the same laser parameters, no differences between the BEC and those measured on
the cold atoms in the MOT are seen. However, the analysis of BEC atom losses should
carefully consider the creation of thermal atoms following spontaneous emission from
the excited state, as presented in section 3.2.
Figure 4(a) shows the average collected ion number < Nions > T in the BEC as
a function of the 421 nm laser detuning with fixed 1002 nm laser wavelength. Here,
< Nions > is the average number of ions produced. During this experiment, the
integrated ion signal is measured: by comparing this number to that produced by a
single ion, < Nions > T is calibrated. These data are compared to the solutions of the
time evolution of the density matrix under the action of two photoionizing laser fields.
The theoretical photoionization probability Pph per pulse is plotted as a continuous line
in figure 4(a), with the right hand side vertical scale chosen to match the ion signal.
The comparison between experimental and theoretical results indicates that the blue
laser frequency scanning introduces a 3 MHz broadening of the laser linewidth. The

Ions in MOT/BEC photonization 8
quantitative comparison between the theoretical predictions and the measured number
of ions allows the derivation of the detection efficiency discussed in section 3.4.
Figure 5. In (a) an absorption image, after 6.3 ms time-of-flight, for a BEC cloud
with initial trap dimensions of 14×14 µm is shown. The vertical lines indicate the
centre of the unperturbed BEC and the centre of the displaced thermal cloud. An
absorption image of the ultracold atomic cloud irradiated by a 0.3 µs blue laser pulse
with intensity Iblue = 0.7 W/cm2 is shown in (b). The x and z integrated profiles of
the clouds are not shown to scale, but as a guide. The cloud displacement is due to the
momentum imparted by blue photon absorption. In addition, the spatial distribution
of the ultracold atoms increases along the horizontal blue laser propagation direction,
x, and also in the transverse direction z.
3.3. Photoinduced deformation of the BEC
The image of a BEC cloud before laser ionization shown in figure 5 (a), reflects the
momentum distribution of the BEC cloud. An image of the ultracold atomic cloud
after a 0.3 µs laser pulse composed of 421 + 1002 nm beams is shown in figure 5(b).
Comparing the absorption image with and without ionization indicates that 421 nm
irradiation strongly modifies the ultracold atomic cloud.
Following the absorption of blue laser running wave photons, a variable fraction of
the condensate atoms recoil with momentum, prec, and are subsequently converted into
a thermal cloud. The centre of this thermal cloud is displaced along the propagation
direction of the blue photons, the x axis. Observing TOF images verifies that the
momentum transfered by IR photons is negligible compared to that due to the blue
photons.
The density matrix equation model of photoionization mentioned in appendix is
used to calculate the momentum transfered from the blue photons to the condensed

Ions in MOT/BEC photonization 9
atoms excited to the 6P3/2 level. For the data of figure 4(b), the calculated atomic
cloud recoil is shown as a continuous line, in excellent agreement with the experimental
results. The long lifetime of the 6P3/2 excited state, compared to the 5P3/2 state, limits
the number of spontaneous emission processes and therefore the momentum transferred
to the atoms.
Figure 6. Spatial widths σx and σz (in µm) of the atomic thermal cloud created by
the blue laser absorption versus the prec recoil imparted to the ultracold cloud. These
data are derived from the measurements of figure 4(b). A typical error bar is shown.
The widths are fitted by a square root dependence on prec, including a convolution
with the initial BEC spatial width.
The absorption of blue photons and the resultant spontaneous emission broaden the
spatial distribution of the atomic cloud along the laser propagation direction and also
orthogonally. This broadening is seen in figure 5(b). The atomic spatial distribution
is composed of contributions from the broad thermal cloud and condensed fraction.
The thermal cloud broadening is proportional to the square root of the atomic recoil,
see figure 6. Such a spread in momentum, as expected for a random walk, is due to
the spontaneous emission diffusion. The spread increases with the square root of the
number of the spontaneous emission processes, as described by two-level laser cooling
theory [25, 26]. Such treatment predicts equal diffusion in each direction, as we observed
following excitation of a condensate by 780 nm photons resonant with the 5P3/2 state.
In these measurements the momentum diffusion in perpendicular directions is in a ratio
of ≈√3:1. Rather than a single decay channel, the 6P3/2 decay paths include the 4D, 6S
and 5P levels [4]. The balance of spontaneous emission into different spatial directions
thus governs the shape of the cloud. The exact role of the intermediate states would
require an analysis of the generalised optical Bloch equations [27].

Ions in MOT/BEC photonization 10
3.4. Charge detection
Given the determination of the MOT/BEC photoionization losses, the average number
of ions collected by the CEM is measured as a function of 421 nm laser intensity and
frequency. An example of these signals is given by the spectrum of figure 4(a). Such
data allows the calibration of charge detection efficiency in the following manner. Using
MOT depletion, the photoionization probability for a laser pulse is measured, as in
Figure 2(a). Secondly, this probability is used to calculate the number of ions produced
by a photoionization pulse with the parameters of figure 4(a). Finally, this number
is compared to the number of ions detected by the CEM, < Nions > T , reported in
figure 4(a), and thus T is obtained. During this calibration the experiment operates at
a low number of collected charges, which avoids saturating the CEM output.
Ideally one would like to operate with large ionization losses in the MOT, so that
the decay is measurably faster than the decay due to all other processes. This, however,
would result in the production of a large number of ions to the point that the detection
saturates as the setup is optimised for a low number of detected ions.
The calibration of the average number of ions detected has been applied to the
photoionization scheme 780 + 420 nm using a statistical analysis of the number
distribution of the ion pulses at the CEM output (counted by a discriminator and a gated
counter). The ion distribution shown in figure 7, where various pulse durations are used,
is Poissonian, analogous to the ion distribution produced by Rydberg excitation [14].
The mean number < Nions > T of ionization events extracted from these distributions
was again compared the expected one, derived using the MOT decay measurements of
Figure 3(a). This led to a value for the efficiency T in very good agreement with all
different measurements.
The spectrum of figure 4(a) was obtained using the configuration with electrodes on
only the front of the science cell. A maximum global detection efficiency of T = 3(1)%
was measured. The Poisson distributions of figure 7 were obtained in the configuration
with electrodes on the front and side walls, resulting in an efficiency of T = 35(10)%.
The BEC measurements demonstrated that T is independent of the position of the
degerate gas within the laser beam waist.
4. Conclusions
A new BEC experimental configuration for ionization and charge collection has
been described and characterised. Ionization investigations were facilitated by a
421 + 1002 nm excitation scheme via the 6P3/2 level. This laser combination also allows
the excitation to Rydberg states by tuning the infrared laser to around 1020 nm. Later
the 780 + 421 nm ionization scheme via the 5P3/2 level was applied. Ultracold atoms
experience a recoil due to spontaneous emission from the excited level following photon
absorption in the first step. The recoil may be decreased by applying the ionization lasers
in a standing wave configuration, using shorter duration laser pulses, or by detuning

Ions in MOT/BEC photonization 11
Figure 7. Probability P of detecting NionsT ions at the CEM output for different
pulse durations, τpulse, in the 780 nm + 421 nm photoionization configuration. From
(a) to (d) τpulse = 30, 100, 150, 200 ns respectively. The 780 nm laser has intensity,
0.15 W/cm2 and detuning –16.8 MHz while the 412 nm laser has an intensity of
45 W/cm2. Lines connect the values of the Poissonian fit to the data. Measured
average value < Nions > T of the collected ions 0.8(1), 2.9(3), 3.7(4) and 3.9(4),
respectively from (a)–(d). The corresponding values determined from a fit with a
Poisson distribution are 0.70(4), 3.0(2), 3.8(3) and 4.1(3).
further from the intermediate resonant state. To compensate for a decrease in the
ionization probability in these last two cases, a small beam waist, slightly larger than
the BEC dimension was used. Detuning from the intermediate state, ion production is
close to being non-destructive. The losses from the atom cloud result from either ion
creation or the scattering of photons. For a 1 µs light pulse detuned +500 MHz from
the 6P3/2 state, the probability of losing one atom from a condensate of ∼105 atoms
due to absorption of a photon is approximately 1%.
Ionization spectra produced from a BEC have been presented. Using electrodes
external to a quartz cell, electric fields guide charges towards a CEM detector. This
scheme has been tested for the generation and guiding of ions originating from Rydberg
excitation. The signal to noise ratio is high enough to detect the signal produced by
a single ion. The large detection efficiency allows the reliable observation of the signal
produced by the ionization of as few as three atoms. A next-generation design of the
set-up, with reduced CEM to BEC separation should further increase the collection
efficiency. Using single ion detection with a photoionization probability Pph equal to 1,
possible with short and intense laser pulses, would allow the monitoring of the signal
produced by a single atom in a single measurement. Combining single-site addressing
techniques and the ion detection approach discussed should enable the readout of single
atom states in optical lattices. We have not yet reached this high efficiency goal, but our
progress represents an important step to realising such a target within a BEC apparatus
where optical access for loading a BEC into an optical lattice is available.

Ions in MOT/BEC photonization 12
5. Acknowledgments
Financial support was provided by the European Commission through the NAME-
QUAM STREP Project and the EMALI Network, by the CNISM through “Progetto
Innesco 2007”, by the MIUR through PRIN-2007 Program, by the Einstein Italy-
Russia collaboration, by the COGITO partnership between the Universit Paris Sud
and the University of Pisa. I.R. thanks the support by the Russian Foundation for
Basic Research within the EINSTEIN Consortium-RFBR bilateral project “Nonlinear
dynamic resonances in collective interactions of cold atoms” The authors gratefully
acknowledge the contribution by A. Zenesini to the initial photoionization measurements
and the remarks by P. Lambropoulos on the photoionization analysis.
6. Appendix A: Cold atom photoionization
The dynamics of the number of trapped atoms in a MOT, with the trap loading shut
off and in the constant density regime, is described by an exponential decay with a
time constant 1/γ. In the presence of ionization, additional losses accelerate the atom
number decay. The evolution of the ground state atomic number, N , in the MOT is
given by the following decay law [2]:
dN
dt= −(γ + Γ)N . (1)
Where the two-photon ionization rate Γ, produced by the 421 nm blue laser with
frequency νblue, intensity Iblue and by the 1002 nm infrared laser with frequency νir,
intensity Iir can be written as
Γ = g(2)S(2) Ibluehνblue
Iirhνir
. (2)
S(2), with dimensions L4T, determining the two-photon ionization rate for unitary fluxes
of the two lasers, is explained later. The geometrical correction coefficient g(2) introduced
in reference [10] represents the ratio between the volume excited by the photoionization
lasers and the volume occupied by the atomic cloud. By describing the MOT spatial
distribution as a Gaussian with dimensions dx = dy and dz, g(2) is given by [10]
g(2) =1
√
1 + 2(
dxw
)2√
1 + 2(
dyw
)2. (3)
At constant g(2), Eq. (2) leads to a dependence of the photoionization rate, Γ, on the
product of the laser intensities. That dependence is valid only at weak laser intensities
when the shifts and widths of the intermediate states near resonance for the two-photon
process are not important [28]. When these conditions are not met, S(2) is interpreted
as a generalized two-photon cross-section. A formula similar to Eq. 2 describes the
ionization produced by the 780 nm + 421 nm sequence via the 5P3/2 level.
Without ground state depletion the photoionization probability per pulse Pph,
integrated over τpulse, the pulse duration, is given by Pph ∼ τpulseΓ. Pph and/or the

Ions in MOT/BEC photonization 13
unitary flux photoionization rate S(2), may be determined by measuring the temporal
decay, γ, of the MOT number in the absence of photoionization and the γ +Γ decay in
the presence of photoionization.
A theoretical determination of Pph is obtained from the time evolution of the
density matrix equations for atoms interacting with two photoionizing laser pulses.
The theoretical model developed in reference [3] takes into account not only the three
states directly coupled by laser radiation, but also all the atomic states involved in
the spontaneous emission cascade from the 6P to the 5S state. In addition, that
model considers optical pumping into the 5S1/2(F = 1) state modifying the ionization
probability for excitation nearly resonant with the intermediate state. The present
analysis is based on the ionization cross-sections determined in [3], the key ones being
12.4 Mbarn for the 421 nm ionization of the 5P3/2 level, 4.7 Mbarn for that of the 6P3/2
level, and 16.4 Mbarn for the 1002 nm ionization of the 6P3/2 level.
References
[1] I. Bloch, Nature 453 1016 (2008).
[2] T. P. Dinneen, C. D. Wallace, K. N. Tan, and P. L. Gould, Opt. Lett. 17, 1706 (1992).
[3] M. Anderlini, E. Courtade, D. Ciampini, J.H. Muller, O. Morsch, and E. Arimondo, J. Opt.
Soc. Amer. B 21, 480 (2004).
[4] E Courtade, M Anderlini, D Ciampini, J H Muller, O Morsch, E Arimondo, M Aymar and E J
Robinson, J. Phys. B: At. Mol. Opt. Phys. 37, 967 (2004).
[5] R.M. Potvliege and C. S. Adams, NJP 8, 163 (2006).
[6] I.E. Mazets, Quantum Semiclass. Opt. 10, 675 (1999).
[7] T. C. Killian, T. Pattard, T. Pohl, and J.M. Rost, Phys. Rep. 449, 77 (2007).
[8] R. Cote, V. Kharchenko, and M. D. Lukin, Phys. Rev. Lett. 89, 093001 (2002).
[9] P. Massignan, C. J. Pethick, and H. Smith, Phys. Rev. A 71, 023606 (2005).
[10] D. Ciampini, M. Anderlini, J. H. Muller, F. Fuso, O. Morsch, J. W. Thomsen, and E. Arimondo,
Phys. Rev. A 66, 043409 (2002).
[11] D. Jaksch, J. I. Cirac, and P. Zoller, S. L. Rolston, R. Cote and M. D. Lukin, Phys. Rev. Lett. 85,
2208 (2000).
[12] M. D. Lukin, M. Fleischhauer, and R. Cote, L. M. Duan, D. Jaksch, J. I. Cirac, and P. Zoller
Phys. Rev. Lett. 87, 037901 (2001).
[13] T. Cubel Liebisch, A. Reinhard, P. R. Berman, and G. Raithel, Phys. Rev. Lett. 95, 253002 (2005),
ibidem 98, 109903 (2007)
[14] I. I. Ryabtsev, D. B. Tretyakov, I. I. Beterov, and V. M. Entin, Phys. Rev. A 76, 012722 (2007);
ibidem 76, 049902E (2007).
[15] B. K. Teo, D. Feldbaum, T. Cubel, J. R. Guest, P. R. Berman, and G. Raithel, Phys. Rev. A 68
053407 (2003).
[16] D.B.Tretyakov, I.I.Beterov, V.M.Entin, I.I.Ryabtsev, P.L.Chapovsky, JETP 108, 347 (2009).
[17] I.I.Ryabtsev, D.B.Tretyakov, I.I.Beterov, V.M.Entin, arXiv:0909.3239 (2009).
[18] R. Low, U. Raitzsch, R. Heidemann, V. Bendkowsky, B. Butscher, A. Grabowski, and T. Pfau,
arXiv:0706.2639.
[19] A. Stibor, S. Kraft, T. Campey, D. Komma, A. Gunther, J. Fortgh, C. J. Vale, H. Rubinsztein-
Dunlop, and C. Zimmermann, Phys. Rev. A 76 033614 (2007).
[20] S. Kraft, A. Gunther, J. Fortagh, and C. Zimmermann, Phys. Rev. A 75 063605 (2007).
[21] A. Gunther, H. Bender, A. Stibor, J. Fortagh, and C. Zimmermann, Phys. Rev. A 80 011604
(2009).

Ions in MOT/BEC photonization 14
[22] W. Z. Zhao, J. E. Simsarian, L. A. Orozco, and G. D. Sprouse, Rev. Sci. Instrum. 69, 3737 (1998).
[23] A. Rossi, V. Biancalana, B. Moi, and L. Tomassetti, Rev. Sci. Instrum. 73, 2544 (2002).
[24] T. Walker and D. Sesko and C. Wieman, Phys. Rev. Lett. 64, 408 (1990).
[25] S. Stenholm, Rev. Mod. Phys. 58, 699 (1986).
[26] P. Lett, W.D. Phillips, S.L. Rolston, C.E. Tanner, R.N. Watts, and C.J. Westbrook, J. Opt. Soc.
Am. B 6, 2084 (1989).
[27] A. Aspect, E. Arimondo, R. Kaiser, N. Vansteenkiste and C. Cohen-Tannoudji, J. Opt. Soc. Am.
B 6, 2112 (1989).
[28] P. Lambropoulos, Phys. Rev. A 9, 1992 (1974).