Investing in sustainable development - AnnualReports.com
150
Annual report • 2017 Investing in sustainable development
-
Upload
khangminh22 -
Category
Documents
-
view
0 -
download
0
Transcript of Investing in sustainable development - AnnualReports.com

Annual report • 2017
Investing in sustainable development

56
58586266 87 9497
100103105108108 128 132147
4
Market overview
Metals in electric car productionNickelCopperPalladiumPlatinum
30
32 34404450
3
Corporate governance
Deputy Chairman’s letterCorporate governance frameworkBoard of DirectorsPresident and Management BoardRemunerationRisk management and internal controlsIndependent audit
160
162165 170 185193195203
5
Information for shareholders
Authorised capitalSecuritiesDividends Shareholder rightsTransparency
204
206206 210213214
6
Appendixes
Consolidated financial statementsThe Group structureHistory of production indicatorsMinerals resources and reserves Report on compliance with principles and recommendations set forth in the Corporate Governance CodeGlossary Metric conversion table and currency exchange ratesСontacts
218
220267268270 272
292294
295
7
Online report is avaiballe on website https://ar2017.nornickel.com/
Business overview
The Group business Mineral base Geological exploration Production assets and activities Key investment projects Gas and energy assets Transportation assets Products and sales Research and development Supply management
Corporate responsibility HR and social policy Occupational safety Environment
Financial overview (MD&A)
2017 ANNUAL REPORTPJSC “MMC “NORILSK NICKEL”
Reporting period from 1 January 2017
to 31 December 2017
The 2017 annual report of PJSC “MMC “Norilsk
Nickel” (MMC Norilsk Nickel, Nornickel,
the Company) incorporates the results
of MMC Norilsk Nickel and other operations
of the Norilsk Nickel Group (the Group).
For the purposes of this annual report, the
Norilsk Nickel Group shall refer to a group
of companies that includes MMC Norilsk Nickel
and its subsidiaries. The largest subsidiaries
of the Norilsk Nickel Group and their shares
in the capital of MMC Norilsk Nickel are
presented in the 2017 consolidated IFRS
financial statements.
The accuracy of information contained in this
report was confirmed by the Audit Commission
and approved by the Company’s Board
of Directors and Annual General Meeting
of Shareholders.
Vladimir PotaninPresident,
Chairman of the Management Board
PJSC “MMC “Norilsk Nickel”
Values
Reliability an ability to address any challenges to ensure success for the business.
Growth effective production ramp-up and upgrade, leverage of groundbreaking technologies and development of our people.
Efficiency delivering against our targets in due time and at minimum costs.
Responsibility a desire to honour our commitments and take on responsibility for our decisions.
Professionalism a sustainably strong performance.
Collaboration an ability and desire to achieve goals through team work.
Company mission
Through the efficient use of natural resources and equity, we supply mankind with non-ferrous metals, which make the world a more reliable place to live in and help people realise their aspirations for development and technological progress.
Sergey Malyshev Senior Vice President,
Chief Financial Officer
PJSC “MMC “Norilsk Nickel”
• Preliminarily approved
by the Board of Directors of MMC Norilsk Nickel
(Minutes No. GMK/18-pr-bd of 24 May 2018)
• Accuracy of information confirmed
by the Audit Commission of MMC Norilsk Nickel
(Opinion of 16 May 2018)
• Approved by the Annual General Meeting
of Shareholders of MMC Norilsk Nickel
(Minutes No. 1 of 28 June 2018)
CONTENTS
Company overview
Company profileKey highlightsBusiness modelChairman’s letterPresident’s letter
02
04060810 12
1
Strategy overview
2Environmental programme
Key investments
Shaping growth areas
Efficiency improvement programme
16
20
22
26
28
1
4
5
6
7
2
3

COMPANY OVERVIEW
Company profile
Key highlights
Business model
Chairman’s letter
President’s letter
04
06
08
10
12

Russia. Core businesses in Russia are vertically integrated and include Polar Division, Kola MMC and Bystrinsky GOK.
Finland. In Finland, Norilsk Nickel operates Norilsk Nickel Harjavalta, a nickel refining facility that became part of the Group after its acquisition in 2007. The plant is fully integrated into the Group’s production chain.
South Africa. In South Africa, the Company owns 50% of Nkomati, a nickel mine developed jointly with African Rainbow Minerals.
Australia. In Australia, The Company holds a licence to develop the Honeymoon Well Project.
Company profile
The Company’s position in the global industry
The Group’s production assets
EBITDA margin in 2017 // % Dividend yield in 2017 // %
Strong EBITDA margin ranking among the highest in the global metals and mining industry
The Company offers the highest dividend yield in the industry
Company No.1
Company No.1
Company No.2 Company
No.2Company No.3
Company No.3
Company No.5
Company No.5
Company No.4
Company No.4
NornickelNornickel
52 7.246 6.245 6.028 2.934 3.044 4.1
The Norilsk Nickel Group (the Group) includes PJSC MMC Norilsk Nickel (Nornickel, the Company) and its subsidiaries. MMC Norilsk Nickel is the core (parent) company of the Norilsk Nickel Group, having the biggest share in the subsidiaries’ authorised capital.
For more details on the Company’s reserves and resources
p. 58
For more details on the Company’s position in the industry
p. 30
For more details on the Group’s structure
p. 267
For more details of sales network
p. 100
1 The Company’s reserves and resources as at 31 December 2017, including wholly owned overseas assets and excluding deposits in Zabaykalsky Krai are reported according to JORC standards.
The Norilsk Nickel Group’s core operations
The Norilsk Nickel Group is Russia’s leading metals and mining company, the largest palladium and refined nickel producer in the world, and one of the biggest platinum producers. In addition, the Group produces copper, cobalt, rhodium, silver, gold, iridium, ruthenium, selenium, tellurium, and sulphur.
EXPLORATION
MINING AND PROCESSING OF MINERALS
SALES OF NON-FERROUS AND PRECIOUS METALS
The Company supplying its products to
34 countries
Mineral resources1
Nornickel operates the unique Talnakh Ore Field on the Taimyr Peninsula. Its sheer size and remarkably high content of metals in the ore make the field’s resource base key contributor to the Company’s long-term sustainable growth.
In addition to the production facilities, the Company owns:
a global sales network,
fuel and energy assets,
a wide range of R&D units,
river transport, port terminals, a unique Arctic cargo fleet.
Proven and probable reserves
Measured and indicated resources
Market share
No. 13No. 4 No. 5No. 1No. 1palladium producer
40%
producer of platinum
11%
high-grade nickel producer
22%
cobalt producer
5%
copper producer
2%
815 mt Ore
12.4 mt Copper 23.8 mt Copper
7.1 mt Nickel 15.5 mt Nickel
3.9 kt PGM (125 mln oz)
8.3 kt PGM (264.7 mln oz)
2,220 mt Ore
Company overview
Com
pany overview
Strategy o
verviewM
arket overview
Business o
verview
Co
rpo
rate go
vernanceInfo
rmatio
n for shareho
lders
Ap
pend
ixes
Annual Report • 2017
• 4 • • 5 •

Key highlights
2015 2016 2017
1.7 1.72.0
2015 2016 2017
2.01
1.881.79
2015 2016 2017
4.24.5
8.2
1.0х
1.2х
2.1х
Russia Other countries
2017
2016
2015
98.8%
98.9%
97.6%
1.2%
1.1%
2.4%
78.95
82.01
83.62
2015 2016 2017
1.7
2.5
2.1
2015 2016 2017
18.1
7.8
18.8
14.0
7.3 7.2
2015 2016 2017
4.33.9 4.0
50
4744
2015 2016 2017
40 36 38
From the Company's own Russian feedstock
2017
2016
2015
217
236
266
97%
83%
83%
From the Company's own Russian feedstock
98%
96%
96%
2017
2016
2015
2,780
2,618
2,689
From the Company's own Russian feedstock
99%
96%
96%
2017
2016
2015
401
360
369
From the Company's own Russian feedstock
97%
95%
93%
2017
2016
2015
670
644
656
After completion of the main of production reconfiguration programme Talnakh Concentrator reached its design capacity and achieved target recovery rates in 2017. This also led to the normalisation of the work-in-progress inventory levels and helped Nornickel to increase output of all key metals from the Company’s own Russian feedstock and meet the production targets for 2017. In addition, the Company substantially decreased low-margin processing of purchased from third parties.
In 2017, EBITDA increased by 2% mainly due to higher metal prices. Strong EBITDA margin remains among the highest in the global industry.
Nornickel’s investment programme for 2018–2020 includes several large-scale energy projects aimed at modernizing the Company’s captive hydroelectric power plants and enchancing the use of renewable energy sources.
CAPEX increased in 2017 due to the active construction phase of Bystrinsky GOK and upgrade of refining capacities at Kola MMC.
In 2017, sulphur dioxide emissions decreased by 11% from 2015. The decline came as a result of the Nickel Plant shutdown, upgrade of Talnakh Concentrator and the transition to hot briquetting technology at Kola MMC. The emissions within Norilsk city limits dropped by 30–35%.
An increase in net debt by 31 December 2017 was caused by dividend payments in the amount of USD 3 bn and one-off changes in the net working capital. The net debt to EBITDA ratio used to calculate final dividends for 2017 was at 1.88х.
The 2017 LTIFR (Lost Time Injury Frequency Rate (non-fatal LTIs) / total number of hours worked•1,000,000) is in line with the industry average. The number of fatal injuries decreased by 46% thanks to the implementation of new safety standards and launch of the Risk Control project. The number of accidents among the contractors’ employees also declined.
In 2017, Nornickel’s net profit amounted to USD 2.1 bn.
The Company paid the highest dividend yield in the global metals and mining industry.
The decrease in headcount in 2017 resulted from the disposal of noncore assets, implementation of a programme to improve labour productivity, and cost optimisation.
EBITDA margin // %EBITDA // USD bn
Use of renewable energy // %
CAPEX // USD bn
Sulphur dioxide emissions // mt
Net profit // USD bn Dividend yield1 // %Dividends paid in the reporting period // USD per share
2015 2016 2017
0.12 0.110.06
0.62
0.35 0.43
LTIFR FIFR
Net debt / EBITDA ratioNet debt // USD bn
Average headcount // thousand of people
PRODUCTION RESULTS
Nickel // kt Palladium // kozCopper // kt Platinum // koz
Financial stability
High level of social responsibility
Operating efficiency
1 Dividend yield was calculated based on the amount of dividends recommended by the Board of Directors and the average ADR price sourced from Bloomberg for the calendar year.p. 147, 220
For more details on financial results, please see the Financial Results (MD&A) section and IFRS Financial Statements
p. 268
For more details on historical production
For more details on production outlook, please see the Strategy Day presentation (slide 26) available on the Company’s website
2015 2016 2017
Lost-time injuries
Fatalities
Among the contractors' employees
74
4351
14 13 719 18 15
Injury rates // accidents
– 8%2017/2016
+ 6%2017/2016
+ 11%2017/2016
+ 4%2017/2016
Company overview
Com
pany overview
Strategy o
verviewM
arket overview
Business o
verview
Co
rpo
rate go
vernanceInfo
rmatio
n for shareho
lders
Ap
pend
ixes
Annual Report • 2017
• 6 • • 7 •

Business modelKola MMC
Bystrinsky GOK
Product applications
Metal sales geography
Krasnoyarsk Precious Metals Refinery (100% state-owned)
Electric cars with a new type of batteries
7.114.3
12.423.8
94.4197.4
25.0
mt
USD bn USD bn USD bn USD bn USD bn
Other
217
2.3 1.62.3 2.3 0.6
mt
401
moz
2,780
mt~25
moz
kt kt koz koz670
55.8
CuNi Pd PtNorilsk Nickel
Harjavalta
Proven and probable reserves
Measured and indicated resources
Ore
min
edPr
oduc
tion
Reso
urce
s and
rese
rves
InvestmentsNet profit
USD bn2.1
USD bn2.0
Rev
enue
USD bn
9.1
In 2018–2022, Nornickel will become 'greener' and help others to 'get greener'.
Vladimir Potanin
Production asset upgrade
projects
Sulphur Project
Shipments to end
consumers
!
25.2%
24.9%25.7%
6.8%
17.4%
Polar Division Operations
Mining
Concentration
Smelting
Refining
Logistics
Production assets structure
p. 66
p. 100
p. 149
Catalysts in exhaust gas treatment systems
R&D
AustraliaHoneymoon Well (licence)
South AfricaNkomati
Foreign assets
Positive environmental
impact
Electronics Coins
Pipes
Medicine
Wire Jewellery
Batteries
Stainless steel
Ni, Co, Mo, Fe
NI, Au, Ag, PGM
Catalysts
Coatings
Ni, Au, Ag
PGM
Ni, Cu, Co,Mo, Fe
Cu, Au, Ag
Cu Au, Ag, PGM
NI, Cu, PGM, Au, Ag
The Group's own global sales network spans over
countries34
p. 32
p. 87
p. 46
Aid to nature reserves
p. 141 p. 90
p. 103
Company overview
Com
pany overview
Strategy o
verviewM
arket overview
Business o
verview
Co
rpo
rate go
vernanceInfo
rmatio
n for shareho
lders
Ap
pend
ixes
Annual Report • 2017
• 8 • • 9 •

Chairman’s letter
that these investments may not generate immediate financial returns, but firmly believe that our efforts will pay off and contribute to the growth of shareholder value in the long run. We are witnessing the growing environmental awareness of the global investor community which chooses long-term sustainable development to short-term gains, and hence supports our strategic initiatives.
A year of major decisions will now be followed by the systematic implementation of the measures initiated, with a positive impact on our operations. To ensure the delivery of improved results and higher returns to shareholders, the Board will continue to be deeply involved in oversight of performance, risk and financial efficiency and will keep a constant scrutiny on safety. We have a bold vision for the future — an invigorated sense of what we can accomplish as one team, one Nornickel.
Dear Shareholders,
Year 2017 was rough and volatile from both macroeconomic and operating perspective, but it nonetheless became a year of significant achievements and major decisions for our Company.
Thanks to the hard work, commitment and professionalism of our 79,000 employees, we continued to expand our leadership position by delivering on operating and financial results, upgrading our assets, and enhancing safety, while generating significant value for shareholders.
In the second half of 2017, synchronised global economic growth and optimism returned to the metals and mining sector, positively affecting the price of our metal basket. With this tailwind, we generated solid revenues of USD 9.1 billion and strong EBITDA of USD 4.0 billion with a strong margin of 44%.
To allow you, as shareholders, to benefit from our robust cashflow generation, we continued paying dividends with an industry-leading yield. I would like to highlight that the flexibility of our dividend policy allowed us to maintain a proper balance between a conservative level of financial leverage and attractive cash returns, while still investing in sustainable development and future growth.
During the year, we continued to deliver on our value-accretive investment agenda as the expansion and modernisation of concentrating, smelting and refining facilities were largely completed, allowing us to beat initial production guidance and minimize the low-margin processing of third-party feed. Another big achievement was the launch of the Bystrinsky greenfield project, which we have been actively investing in for the last few years. This is positioned to provide a significant boost to our copper and gold output starting from 2018.
With regard to important decisions, I would like to highlight our announcement of a new investment programme focused on environmental and large-scale infra-structural expenditures that are crucial pre-requisites for long-term sustainable growth. The Company is committed to allocating USD 2.5 billion to reduce sulfur dioxide emissions in the Polar division by four times by 2023, in order to improve dramatically the quality of life in Norilsk. During 2018-2022, we also plan to invest over USD 1 billion in renewal of infrastructure including a gas transportation system, power generation and logistics. We understand
Gareth Peter PennyChairman of the Board of Directors MMC Norilsk Nickel
2.5 USD bnCAPEX to Sulphur Project
9.1 USD bnRevenue in 2017
+11%
Company overview
Com
pany overview
Strategy o
verviewM
arket overview
Business o
verview
Co
rpo
rate go
vernanceInfo
rmatio
n for shareho
lders
Ap
pend
ixes
Annual Report • 2017
• 10 • • 11 •

President’s letter
Dear shareholders,
It was half a decade ago, back in 2013, when the Company’s new management team launched a five-year strategic programme, so in addition to the last 12 months of 2017, I would also like to speak about the performance over the last five years.
When we took the reins in 2013, we had our work cut out for us. We had to whip the Company into shape, and we started by shoring up the budget and investment discipline, reconfiguring our production chains, upgrading smelting capacities and preparing integrated solutions for multiple environmental problems.
Today, I can say that we have followed through on each of these targets, even despite the constant metal price fluctuations, capital markets uncertainty and geopolitical challenges. Our operations were not the only field where we excelled: thanks to consistently strong financial performance and well-organised dialogue with the investment community, we were able to lock in a substantial dividend yield of more than 60% over the last five years.
Completion of polar assets reconfiguration and new launchesIn 2017, we completed a number of key development projects that were started back in 2013–2014. Talnakh Concentrator reached full design capacity, marking a milestone in Nornickel’s major investment project to upgrade equipment and reconfigure processing capacities. Improved concentrate quality and expanded processing capacities at Nadezhda Metallurgical Plant and the Kola MMC refining facilities fully offset the discontinued smelting capacities following the shutdown of Nickel Plant. As a result, the output of all our key metals from own feedstock grew by 7–15% compared to 2016.
In late October 2017, we launched Bystrinsky GOK in Zabaykalsky Krai, which was the largest Russian greenfield project of the last decade. For us, Bystrinsky GOK is not just another new asset, which is going to be outputting 70 kt of copper and 250 koz of gold annually, but a platform to implement the most advanced technologies and practices, both in the sphere of production, social policy, environment protection and HR management.
Financial highlights
Inspired by the synchronised global expansion, investors showed renewed interest in commodities, which supported the recovery of the non-ferrous and platinum group metals prices in 2H 2017. As a result, Nornickel’s revenue grew by 11% to USD 9.1 bn, while EBITDA stood at USD 4 bn with the margin of 44%. CAPEX amounted to USD 2 bn, the bulk of which was spent on continuing the production capacity reconfiguration programme, executing high-margin mining projects and completing Bystrinsky GOK.
+7–15%increased production from own feedstock
2 USD bnCAPEX
Continued overleaf
Company overview
Com
pany overview
Strategy o
verviewM
arket overview
Business o
verview
Co
rpo
rate go
vernanceInfo
rmatio
n for shareho
lders
Ap
pend
ixes
Annual Report • 2017
• 12 • • 13 •

Thanks to the favourable global market environment and historically low interest rates, we were able to decrease the cost of our debt. During the last year, we repaid high interest rate rouble loans in the amount of RUB 60 bn, placed two Eurobond issues for USD 1.5 bn with record-low coupon rates for Nornickel, made a downward revision to the rates on our existing credit facilities for a total amount of USD 2.5 bn, and raised a syndicated loan of USD 2.5 bn from a pool on international banks at an unprecedentedly low interest rate for a Russian company. Together, these achievements helped drive down the future interest payments by over USD 100 mln.
Occupational safety and social responsibilityThe life and health of its employees remain Nornickel’s top priority. The Company has put in place a large-scale programme for prevention of workplace injuries and accidents, carried out behaviour audits and workplace certification, and implemented the latest occupational safety standards. We also started the digitisation of production processes at underground mines. Despite the human factor still causing some work-related fatalities, we were able to almost halve their number. No matter how small, that number is unacceptable for us, and we are going to do all we can to achieve a zero fatality rate.
The Company’s social work is not limited to its production facilities. Across all regions of its operation, Nornickel strives to better the urban environment, improve living conditions, and support public initiatives in the respective areas. Since 2014, the Company has been hosting a grant competition of social projects, which aims to support public initiatives and facilitate sustainable development. Over the last three years, the competition drew 1,087 bids, out of which 294 were selected for funding, with the total of RUB 265.5 mln allocated by the Company.
Volunteering is becoming increasingly more popular among Nornickel’s employees. For example, the Let’s Do It environmental marathon, which seeks to promote careful and responsible attitudes to the regions of operation and ecology on the whole among the Company’s staff, has become a corporate tradition. In 2017, it saw participation from thousands of Nornickel employees, who are also part of the Plant of Goodness corporate volunteer programme.
Another important development of 2017 was the end of the fibre optic communication line construction, which finally gave Norilsk residents access to high-speed internet. It will make it faster and easier for us to introduce IT solutions at the production sites while also improving the community’s living standard.
New strategic cycle’s priorities – green Nornickel and investments in growthDespite the achievements of the last five years, we realise there is still a lot of work ahead of us and do not hesitate to set even more ambitious targets. The absolute priority for us is the material improvement of the environmental conditions in the Norilsk Industrial District and the Kola Peninsula. Last year, we initiated the so-called Sulphur Project, which will enable the Company to cut Polar Division’s sulphur dioxide emissions by 75% by 2023. This truly massive project will involve the construction of major sulphuric acid production capacities with subsequent neutralisation capabilities and will cost up to USD 2.5 bn. We will continue work on the Kola MMC production chain upgrade, which will allow us to shut down part of the smelting capacities and thus achieve a twofold decrease in emissions.
We aim to make Nornickel a truly “green” company, which will include not only decreasing the harmful footprint of our facilities, but also promoting our products as a means of ensuring environmentally-friendly development of the humankind. Nornickel is already recognised as the largest global producer of metals used in manufacturing of automotive catalysts, which help improve urban air quality across many countries. High-quality nickel is an indispensable component of batteries for electric cars, which will dominate our planet’s roads in the future.
–75% cut is targeted for Polar Division’s SO2 emissions by 2023
2.5 USD bnCAPEX of Sulphur Project
Vladimir PotaninPresident,Chairman of the Management Board MMC Norilsk Nickel
To maintain Nornickel’s status of the industry powerhouse long into the future, we are putting together a portfolio of growth projects that include development of the Southern Cluster (potential to ramp up production from 2 to 6 mt of ore), expansion of Talnakh Concentrator, and a project to develop disseminated ore fields in the southern part of the Norilsk Industrial District.
We are certain that successful execution against our targets over the next five-year period will ensure exponential growth of Nornickel and lay the groundwork for generating long-term shareholder value.
>100 USD mlnreduction of interest payments
1,087 bidswere received at a grant competition for social projects over three years
Company overview
Com
pany overview
Strategy o
verviewM
arket overview
Business o
verview
Co
rpo
rate go
vernanceInfo
rmatio
n for shareho
lders
Ap
pend
ixes
Annual Report • 2017
• 14 • • 15 •

STRATEGY OVERVIEW
Environmental programme
Key investments
Shaping growth areas
Efficiency improvement programme
20
22
26
28

Nornickel’s strategy
President’s priorities
The 2023 development programme is designed to renew all production capacities and, ultimately, make Nornickel one of the most advanced and environmentally responsible companies in the industry.”
Vladimir Potanin
„
The Company has embarked on a new investment cycle to secure its sustainable development and establish a platform for future growth. President’s priorities include implementing the second stage of the unprecedented environmental programme, completing the production reconfiguration project, developing the Company’s mining assets, reaching target performance levels for the Chita project, and delivering on the extensive infrastructure renewal programme, which, together with comprehensive efficiency improvement efforts, is helping to lay foundation for sustainable shareholder value growth.
Environmental programme
• Implementing environmental projects that lead to a many-fold decrease in SO2 emissions across the Company’s footprint
• Working with the “green” industries, including by manufacturing catalysts and electric transport
Mining development and the new asset replacement cycle
• Consistently renewing the infrastructure and key production facilities
• Upgrading and refurbishing the production assets (reconfiguration project)
• Developing the Talnakh ores and maintaining a stable production level
• Comprehensive cost reduction and efficiency improvement programme
• Introducing ERP / automated control systems• Introducing industrial automation systems
2018–2020 key strategic investments
USD 4.4–4.8 bn
THE MAP TO ADVANCED, EFFICIENT, AND ENVIRONMENTALLY FRIENDLY PRODUCTION
Shaping growth areas
2
Consistent process efficiency improvement
1
USD 1.4–1.6 bn
1 Excluding Chita Project.
USD 0.3–0.5 bn
Average annual investment // USD bn p.a.
8
7 9
2013–20171 2018–2020
1.5
2.0–2.5
Potential growth projects
Framework investment programme
Polar Division
Chita
6
9 8 7Kola MMC5 4 3 21
Strategy overview
Co
mp
any overview
Strateg
y overviewM
arket overview
Business o
verview
Co
rpo
rate go
vernanceInfo
rmatio
n for shareho
lders
Ap
pend
ixes
• 18 • • 19 •
Annual report • 2017
Efficiency improvement initiatives covering IT, automation, R&D, machinery productivity
3 Infrastructure development and maintenance
4 Intensive development of the Talnakh ore mining base
6 Chita Project
5 Completion of the current reconfiguration programme
Greenfield PGM production project in the Norilsk Industrial District
Development of the Southern Cluster
Potential construction of the third stage of Talnakh Concentrator
Search for new growth areas in other Russian regions
Implementing the comprehensive environmental programme
Optimising the smelting shop capacity utilisation rates to decrease SO2 emissions

Environmental programme
We are launching the second stage of our environmental programme, the Sulphur Project, on a scale that is unprecedented not only in Russia but worldwide.”
Vladimir Potanin
„
The integrated environmental programme expected to receive ca. USD 2.5 bn in investments by 2023 is one of the priority focus areas of Nornickel’s strategy. The programme is designed to decrease SO2 emissions by 75% in the Norilsk Industrial District and by 50% on the Kola Peninsula.
–50% target reduction of SO2 emissions in the settlement of Nickel (Kola MMC) by 2019
–75% target reduction of SO2 emissions in the Norilsk Industrial District by 2023
Taimyr Peninsula, Polar Division
Objective
Cut sulphur dioxide emissions by 75% (as compered to 2015) by 2023 leveraging the most effective technological solution
The programme includes two stages Stage 1 was completed in 2016 as a part of the downstream reconfiguration programme that included upgrade of concentrating and smeltting capacities as well as the shutdown of Nickel Plant, the oldest and least environmentally friendly site in the Polar Division, to substantially reduce emissions in the residential area of Norilsk. At present, the Company is working to achieve Stage 2 goals.
Goals (Stage 2)
Copper plant • Reconstruct copper production chain, including
the shutdown of environmentally harmful conversion operations
• Expand and upgrade the existing sulphur production
Nadezhda Metallurgical Plant• Launch a new continuous copper matte
converting facility• Implement a comprehensive SO2 capture
solution including production of sulphuric acid and its subsequent neutralisation with natural limestone
Environmental programme 2.0
Kola Peninsula Kola MMC
Objective
Cut emissions in the Kola Peninsula by 50%
Goal
Optimise the smelting shop capacity utilisation rates in the settlement of Nickel by separating the concentrate produced at Kola Concentrator
More details on the Sulphur Project
p. 90
More details
p. 34
More details
p. 44
Improvement of environmental conditions across Russian operations and globally
Investing in pure metal
Providing the growing electric vehicle industry with critically important metals
Ni, Cu, Co
Providing catalyst producers with critically important metals
Pt, Pd
Sulphur Project
Strategy overview
Co
mp
any overview
Strateg
y overviewM
arket overview
Business o
verview
Co
rpo
rate go
vernanceInfo
rmatio
n for shareho
lders
Ap
pend
ixes
Annual report • 2017
• 20 • • 21 •

Over the next three years, we will be going through a higher CAPEX stage which will allow us to both maintain stable production levels and establish a strong foundation for new high-potential projects.”
Vladimir Potanin
„
The framework investment programme provides for large-scale modernisation and expansion of the production capacities, consistent renovation and upgrade of the infrastructure, development of the Talnakh ores, and maintaining a stable production level. The Chita project, one of the largest greenfield projects in Russia’s mining industry, is also part of the framework investment programme.
Chita Project GRK Bystrinskoye
Achieving target financial indicators is one of the MMC’s key priorities
• Hot commissioning started in November 2017.• Planned processing capacity post-2021 – 10 mt.• Target metal output in concentrates:
~70–75 kt of copper,
~250–260 koz of gold,
~2,900 kt of magnetite concentrate.• Life of the project – over 30 years.
Mining projects
Development project
Production volumes at Talnakh Ore Cluster // mt
Production without additional investmentProduction growth at Skalistaya mineProduction growth driven by other Talnakh projects
2020
2017
2014
11.3
13.7
13.5
2.3
1.8
1.0
1.8
USD 4.4–4.8 bn Investments in core projects, 2018–2020
Taimyr Peninsula Polar Division
In the mid-term, the investment programme will ensure a stable level of production
• Increased rich ore production at Skalistaya mine will preserve metal content in commercial ore at the current level.
• The resource base of the Talnakh Ore Cluster has a strong potential for further development. In 2018–2019, the Company will make decisions on expanding the production capacities at the Oktyabrskoye and Talnakhskoye Fields.Key
investments
Large-scale asset modernization and development of the mining base
295 t
2.3 mt
73 mt
The reserves are estimated at
Au
Cu
Fe
Project investments
~USD 1.7 bn
USD 1.5 bn investments in Talnakh mines development in 2018–2020
More details on the project
p. 93
336 mt of ore
Strategy overview
Co
mp
any overview
Strateg
y overviewM
arket overview
Business o
verview
Co
rpo
rate go
vernanceInfo
rmatio
n for shareho
lders
Ap
pend
ixes
Annual report • 2017
• 22 • • 23 •

Infrastructure upgrades
Project highlights
As part of its strategy, Nornickel will allocate USD 1.1–1.2 bn to infrastructure renewal and upgrades during 2018–2020. The projects include a large-scale infrastructure renewal: renovation of worn out gas transportation and hydropower facilities, replacement of power units, and reconstruction of critical production assets, transport infrastructure, and power grid.
six power units with the total capacity of
550 MW
Scheduled for replacement in 2018–2022 are:
a power line with the total length of
30 km
gas distribution networks with the total length of
111 km
Reconfiguration of the processing capacities
Kola Peninsula Kola MMC
Establishment of a nickel refining hub at Severonickel Plant
Works are underway to expand nickel refining capacities from 165 ktpa to 190 ktpa and to switch nickel electrolysis shop-2 to a new chlorine leaching technology.
Taimyr Peninsula Polar Division
Upgrade and ramp-up of Talnakh Concentrator
The capacity of Talnakh Concentrator increased from 7.5 mtpa in 2015 to 10.2 mtpa in 2018. Nickel content in nickel-pyrrhotite concentrate increased by more than 60%.
Upgrade of the flagship Nadezhda Metallurgical Plant
We have upgraded and ramped up smelting capacities of Nadezhda Metallurgical Plant, which has become the smelting hub for all nickel feedstock of Polar Division. Compared to 2014, the capacity grew by 26%.
Nickel Plant shutdown
In August 2016, the Company shut down Nickel Plant, which had been in operation since 1942. The shutdown involved providing strong social guarantees to the plant workers. The project resulted in 30–35% reduction of SO2 emissions in the residential area of Norilsk.
+25 ktpanickel refining capacity expansion at Kola MMC
+2,7 mtconcentration capacity expansion at Talnakh Concentrator by 2018
USD 1.1–1.2 bninvestments in infrastructure projects, 2018–2020
Power supply • Gradual replacement of six retiring
power units with the total capacity of 550 MW
Transport infrastructure• Reconstruction of critical facilities
(airport, seaport, oil depot, warehouses, etc.)
Auxiliary operations• Replacing the required resources,
including construction of a new limestone quarry
Power and utilities• Parts of the comprehensive programmes:
power line replacement (30 km), gas distribution networks (111 km), drinking water supply to Dudinka, etc.
Core operations • Replacing core types of equipment to
enhance its overall performance• Transition to new rock bolting systems
to improve safety
2018–2022 targets
More on gas and power assets
p. 94
Strategy overview
Co
mp
any overview
Strateg
y overviewM
arket overview
Business o
verview
Co
rpo
rate go
vernanceInfo
rmatio
n for shareho
lders
Ap
pend
ixes
Annual report • 2017
• 25 •• 24 •

Shaping growth areas
Development driven by Tier 1 assets is the Company’s long-term strategic goal.
What are Tier 1 assets?
Optional projects
We believe in stronger demand for our products going forward and deem it necessary to put together a portfolio of growth projects. During the next few years, we will be exploring potential development of the Southern Cluster, further expansion of Talnakh Concentrator, and the joint project with Russian Platinum to develop disseminated ore fields in the southern part of the Norilsk Industrial District.”
Vladimir Potanin
„Boosting Tier I asset potential
More details on the project
p. 87
Talnakh Concentrator–3Investment decision – 2018
• Efficient disseminated ore processing technologies deliver greater metal recovery rates.
• Opportunity to utilise the economies of scale by using several existing facilities of Talnakh Concentrator.
• Opportunity to optimise costs of transporting Talnakh ores to Norilsk Concentrator.
Southern ClusterInvestment decision – 2018
• Potential to become a Top 5 global PGM producer.
• Optimal capacity utilisation at Norilsk Concentrator (post Talnakh Concentrator–3).
• Potential to raise project financing.
Target PGM output of the new JV
70–100mtpa
Russian Far East
Looking for Tier 1 assets for long-term development in the Far East, a poorly developed region with a vast resource potential and proximity to Asian markets.
Potentially, growth areas will be centred around the existing assets of Polar Division, with a possibility of initiating a new copper project in Russia’s Far East.
Talnakh
Norilsk
Southern part Norilsk-1
Northern part Norilsk-1
Maslovskoye Field
Chernogorskoye Field
Fields made part of the new JV
Talnakh Concentrator–3
Target annual revenue
Reserves-to-production ratio
EBITDA margin
>20 years40%>USD 1 bn
Strategic partnership with Russian PlatinumThe southern part of the Norilsk Industrial District
Nornickel is considering a strategic joint venture with Russian Platinum, of a calibre comparable to Polar Division in terms of scale of PGM production. The joint venture is set to become one of the largest global PGM producers.
Strategy overview
Co
mp
any overview
Strateg
y overviewM
arket overview
Business o
verview
Co
rpo
rate go
vernanceInfo
rmatio
n for shareho
lders
Ap
pend
ixes
Annual report • 2017
• 26 • • 27 •

Efficiency improvement programme
We must ensure that all our process chains are built in the most efficient manner aligned with our objectives.”
Vladimir Potanin
„ Shaping a comprehensive cost reduction ecosystem
Upgrading production assets
Developing and integrating new production processes and standards
Reconfiguring and shutting down outdated production facilities
Introducing ERP / automated control systems
Introducing industrial automation systems
Introducing new approaches to management
The comprehensive programme was enabled by the platform created in the past, including industrial automation and automated control systems, ongoing ERP deployment, and new production processes and standards.
Target outcome – costs reduced, since 2020, by
USD 200–300 m
SAP ERP deployment• Pilot project completed• 2017 –Chita project, 2018 – Polar Division
Underground radio communications and positioning systems at the mines• 369 km of optic fibre cable• 1,052 Wi-Fi spots• Real-time control of mining personnel and
machinery
New DCP architecture• Upgraded server infrastructure and data storage
systems according to the Company’s needs• Upgraded data network
MES layer (Manufacturing Execution System)• Machinery control system pilot project in Norilsk• Completed 3D modelling of one mine’s shafts;
now the system is rolled out to other mines• Talnakh Concentrator successfully piloted the
metal balance project; the system is rolled out to other plants and mines
Optic fibre line to Norilsk• The 956 km 40 Gbps line is now live• Unprecedentedly challenging line construction
environment• Enabling the use of advanced IT systems• Better living standards in Norilsk
Norilsk
Novy Urengoy
Faber cable956 KM
IT infrastructure upgrade as a tool for achieveing operational excellence
More details on the project
p. 119
Base programmes
Strategy overview
Co
mp
any overview
Strateg
y overviewM
arket overview
Business o
verview
Co
rpo
rate go
vernanceInfo
rmatio
n for shareho
lders
Ap
pend
ixes
Annual report • 2017
• 28 • • 29 •

MARKET OVERVIEW
Metals in electric car production
Nickel
Copper
Palladium
Platinum
32
34
40
44
50

Market overview
• 32 • • 33 •
In July 2017, Nornickel signed a memorandum with BASF and began negotiations on a project to increase sales to manufacturers of batteries for electric vehicles.
This is a pilot project. If it is successful, we can launch commercial production by 2020.”
“Today, markets are taking a new look at our products. The demand for palladium is growing. Cobalt and nickel are also benefitting from a positive trend supported by the production of batteries for electric vehicles. Accordingly, we are considering ways to increase shareholder value by adjusting our product portfolio to the requirements of new industries and new demand. We see current market expectations as somewhat inflated and do not commit ourselves to large-scale investments. Still, we are trying to be proactive in our marketing policy and proceed with what we call fine-tuning of our product lines.”
“We are an industrial company, not a venture one. For us, a responsible decision is to invest in successful technologies only.”
Vladimir PotaninPresident of Nornickel
Metals in electric car production
For the Company, this project is an opportunity to carve a niche in the attractive and rapidly growing market for rechargeable battery materials. Cooperation with BASF is part of Nornickel’s strategy to develop environmentally-friendly technologies and make an active contribution towards improving the environment globally. Today, the Company provides manufacturers of automotive catalysts with essential chemicals capable of capturing dangerous exhaust fumes generated by petrol engines. By expanding the supply of metals for the automotive industry with its strong potential, the Company makes another step towards sustainable development.
KEY TREND IN THE GLOBAL AUTOMOTIVE INDUSTRY
NORNICKEL’S POSITION
USE OF NORNICKEL METALS IN ELECTRIC VEHICLE MANUFACTURING
The electric vehicle industry is clearly facing a period of intensive growth, which will boost long-term demand for key metals. However, so far experts have not come to a consensus on market growth projections. Sales forecasts for electric and hybrid cars vary from 2 mln cars to 11 mln cars per year by 2025.
Market outlook for 2035 is much more optimistic. BP projects the total number of EV and hybrids to grow to at least 100 mln globally. According to analysts from Carbon Tracker Initiative and Imperial College London, electric vehicles are expected to account for one third of the automotive market by 2035 and for more than a half by 2040. One of the most likely drivers of EV expansion will be government policy in many developed countries committed to introducing a broad range of incentives to promote the production of green cars, up to imposing an ultimate ban on the sale of cars with internal combustion engines. Still, this is unlikely to happen before 2025.
Over a short-term horizon, the Company is not planning any investments in large-scale production of materials for the electric vehicle industry, as the EV technology is still in the development phase. However, the Company is prepared to reconsider its position should the trend change.
Nornickel expects demand for nickel from manufacturers of rechargeable batteries for EV production to increase dramatically in the mid-term, but this will not be the case before 2020, when the automotive industry is ready to shift to electric vehicles. By 2025, the Company forecasts the demand for nickel in the EV market to grow to 420 kt from the current 43 kt, in addition to demand from stainless steel manufacturers, historically the largest consumers of nickel. In the mid-term, the key trend in the EV market will also be the production of hybrid vehicles that rely on both an internal combustion engine (ICE) and an electric engine. Per unit PGM consumption in hybrid cars is higher than in traditional vehicles with the same ICE volume; accordingly, we expect palladium consumption to increase by 3 mln oz by 2025.
As compared to petrol and diesel engines, the consumption of metals produced by Nornickel in the manufacturing of EV engines is much more intensive. The process requires 2 to 27 times more of nickel, 2 to 4 times more of copper, and 12 to 17 times more of PGM (the latter are particularly important for fuel cell vehicles).
Consensus in Bullish on Long-term Outlook of Electric Vehicle Sales
Incremental average annual output by powertrain, 2017–2025 // m units
The demand for nickel in the EV market // t
Annual report • 2017Market overview
Market Share2
Gasoline ● Ni 3–4 kg ● Cu 20–25 kg ● PGM 2–5 g
Diesel ● Ni 3–4 kg ● Cu 20–25 kg ● PGM 3–6 g
Hybrid ● Ni 5–15 kg ● Cu 45–50 kg ● PGM 2–6 g
BEV ● Ni 30–110 kg ● Cu 75–801 kg
FCEV ● Ni 2–3 kg ● Cu 70–75 kg ● PGM 25–35 g
68%
17%
9%
1%
3%
By 2025, the demand for nickel in the EV market to grow to
to 420 kt
x10
Source: Company estimates,
LMC Automotive, Bloomberg.
1 Excluding additional infrastructure demand of 1–8 kg per charger.2 Expected market share in 2025 based on production.
• 32 • • 33 •
BEV HDD ICE-onlyHybrids PHEV
1.2
0.7
0.40.2
–0.1
+36%
+0%
348
255
106
106
Palladium
Platinum
2025Е
2016
2025Е
2016
Total BEVs consensus forecast
0
5
10
2016 2020E 2025SE
Total Hybrids consensus forecast
Range of forecasts (BEV)
2
4
8
25
2017 MILESTONE
„

Annual report • 2017Market overview
• 34 • • 35 •
Nickel
2013 2015 2017 01.01 01.02 01.03 01.04 01.05 01.06 01.07 01.08 01.09 01.10 01.11 01.122014 2016
15,004
16,867
11,807
9,60910,411
6,000
9,000
12,000
15,000
2017Market deficit widened; demand increased in line with higher production
of stainless steel in China and Indonesia and cathode materials for Li-
ion batteries; production slightly went up driven by NPI output growth
in Indonesia and China, which was almost entirely offset by declining
production of high grade nickel.
Outlook: cautiously optimistic. In 2018, the market deficit may go down a result of a much greater availability
of high grade lateritic nickel ore.
Nickel
Source: LME, Company data
Key industry developments and nickel price // USD/t
1 Leaked data on possible easing of the ban to export ore from Indonesia and uncertainty in the Philippines after environmental audits of the mining industry;
2 Lower stainless steel output in China;
3 Permit issued by the Indonesian government to PT Antam to export up to 2.7 million wet tonnes of unprocessed nickel ore;
4 R. Lopez’s failure to be re-appointed as Secretary of the Philippines' Department of Environment and Natural Resources;
5 Permits by the Indonesian government issued to Fajar Bhakti Lintas Nusantara to export up to 1.06 million wet tonnes of unprocessed nickel ore;
6 Relaunch of Delong's stainless steel plant (China);
7 Launch of a stainless steel production line at Tsingshan plant (Indonesia):
8 Recovery of stainless steel output in China;
9 LME Week that aroused investor interest in nickel on the back of the expected electric car market growth.
NiChinaOther AsiaEurope and AfricaAmericas
2.15mt
Tsingshan GroupJinchuanGlencore
Sumitomo MMXinhai
SherrittAnglo American
BHP BillitonOther
13%
10%9%
7%7%
5%4%
3%3%3%
36%
in nickel market
No.2Vale
Nornickel
55%
20%
17%
8%
Primary nickel consumption by region
Source: Company data
Key trends in the nickel market
In Q1 2017, the nickel price was highly volatile in the range of USD 9,380–11,045 per tonne reflecting a mixed news background from Indonesia and the Philippines. In early Q2 2017, it started to decline after the Indonesian government issued permits for the export of unprocessed nickel ore and Regina Lopez, Secretary of Environment and Natural Resources of the Philippines, was not re-appointed for a new term of office, which challenged the decisions made after the environmental audit of the country’s mining industry. This trend was intensified by a reduction in stainless steel output in China. However, starting Q3 2017, prices began to recover backed by the news about the growth of stainless steel production in China and the launch of a large stainless steel plant in Indonesia. Early Q4 2017 saw a positive price performance amid considerable enthusiasm of the investment community about the potential increase in nickel consumption in electric cars, peaking at USD 12,830 per tonne – the highest level since June 2015. However, by the year-end 2017, there was a price correction to USD 12 thousand per tonne.
Market balance
Following several years of surplus, the nickel market recovered the balance in 2016, with consumption outstripping production by 20 kt. In 2017, nickel shortage went up to 108 kt. The demand was mainly driven a 7% y-o-y increase in metal consumption primarily attributable to the Asian producers of stainless steel and batteries. In turn, primary nickel output gained as little as 2%. High grade nickel
2017
2016
–108
–20
Source: Company data
Surplus/deficit in the nickel market // kt
+7% growth of consumption of primary nickel
+2% growth of primary nickel output in 2017
production declined by 6% (60 kt) largely triggered by the reconfiguration of the Company’s production facilities, shutdown of sulphide ore mines in Canada, and the shortage of hydrometallurgy semi-products and sulphide concentrates on the market after the closure of loss-making mines in 2015–2017, with the Ravensthorpe shutdown coming as the last of those. Only nickel production from lateritic ore was on the rise. In 2017, low grade nickel production increased by 11%, or 100 kt y-o-y, mainly due to the Chinese and Indonesian NPI output growth.
During the year, total exchange warehouse stocks at the LME and the SHFE decreased by 55 kt to 411 kt, which is about 10 weeks of global consumption.
1
23 4
56
7
8
9
Co
mp
any overview
Strategy o
verviewM
arket overviewB
usiness overview
C
orp
orate g
overnance
Inform
ation fo
r sharehold
ersA
pp
endixes

Annual report • 2017Market overview
• 36 • • 37 •
Nickel
Consumption
Primary nickel consumption in 2017 by industry // %
Nickel consumption is predominantly driven by the stainless steel industry (over 70% in 2017).
Source: Company data
Stainless steel comes to the market in various grades from all over the world, whereas its smelting structure ultimately determines the primary nickel consumption patterns.
Austenitic stainless steel comprising the 200 series and 300 series steel is the most widespread type of that product (over three quarters of the global production).
The 300 series steel has a higher nickel content (normally 8–12%, or up to 20% in a number of select grades). Nickel added in this proportion improves the steel’s corrosion resistance and robustness in a wide range of temperature conditions, boosts its ductility and durability in aggressive environments, and enhances its non-magnetic properties. This series enjoys the highest demand, as it is applied in various industries, including construction, food and chemicals manufacturing, energy, transportation, etc.
The 200 series steel cannot serve as a full substitute for the high nickel content grades, as it has a lower nickel content due to the addition of manganese. The 200 series steels are susceptible to surface (pitting) corrosion and non-resistant to heat and aggressive environments. Due to the lower price, this steel grade is often used in the production of consumer goods, such as home appliances. China and India account for over 90% of the total 200 series steel output.
Austenitic-ferritic (duplex) stainless steels also use nickel and are characterised by a higher content of chromium (18–25%) and molybdenum (1–4%), but they account only for 1–2% of the global smelting output. For statistical purposes, these steels are usually grouped with the 300 series.
Ferritic and martensite stainless steels (400 series) usually do not contain nickel, while their properties are similar to those of low-carbon and highly corrosion-resistant steels. However, their mechanical properties are inferior to those of austenitic stainless steels. These steels are mainly used to manufacture automotive exhaust systems, cargo container frames, water heaters, washing machines, utensils and cutlery, kitchenware, home decor items and razor blades.
Except for Europe, where stainless steel smelting stayed flat, nickel consumption in stainless steel making was steadily growing in 2017 across all regions. The USA was leading the charge in this segment with an 8% rise, according to our estimates.
Consumption of primary nickel by the global stainless steel producers rose by 7% to 1.57 mt as a result of an increase in the 300 series and 200 series global output by 7% and 5%, respectively, and a flat share in the use of scrap y-o-y. However, the use of high grade nickel in stainless steel smelting has not changed vs 2016 mostly due to the growing availability of low-grade nickel.
Nearly all types of nickel feedstock are used in stainless steel production (except for a number of specific products, including nickel powder and compounds). Since the quality of nickel barely affects the quality of conventional stainless steel grades, the manufacturers opt for the cheapest nickel feedstock, turning to high grade nickel as their last resort. This is the reason why high grade nickel share has been declining in the structure of nickel units consumed in stainless steel production in recent years with higher volumes of NPI, ferronickel and metallised products with a lower nickel content.
In 2017, primary nickel consumption in alloy production increased by 2%, which was mainly attributable to the recovery of demand from the oil and gas industry, and high demand from the aerospace industry.
Primary nickel consumption in 2017 // mt
Nickel is widely used in decorative and protective platings with their thickness ranging from 1 to 100 microns. Nickel electroplating is highly corrosion-resistant, hard and pleasing aesthetically. It is used for corrosion protection, and as an alternative to chromium plating. In 2017, primary nickel consumption in the electroplating industry grew by 5% (4 kt), mainly due to demand in Asia. In recent years, China has been the leading manufacturer of nickel electroplating products. Since 2012, though, the electroplating industry has started to develop in other Asian countries, and the Chinese businesses are now transferring their production to achieve cost savings.
The battery industry uses nickel as a major component of the active material for battery cells. The extent of nickel utilisation depends on the battery type.
Except for Europe nickel consumption in stainless steel making was steadily growing in 2017 across all regions.
Source: Company data
Source: Company data
Stainless steel production by grade series // mt
+7%2017
2016
2.14
2.02
48
45
300 series 200 series 400 series
2017
2016
26.5
24.7
10.1
9.6
11.2
10.8
In 2017, the total stainless steel output increased by 6% and hit a record high of 48 mt.
China (with a share of over 50% of the global output) and Indonesia accounted for the most part of production growth. Smelting output growth in China ensued from the re-launch of Delong’s capacities (over 1.1 mtpa) previously suspended after more stringent environmental controls had been imposed. Indonesia is a new steel market player with a robust growth outlook, sufficient reserves of high grade lateritic ore, growing NPI capacities and, hence, low cash cost of austenitic stainless steel.
2017
2016
Alloys
8
Special steels
7
Electroplating
7
Batteries
5
1
Stainless steel
73
Other industries
48 mtrecord stainless steel output in 2017
+6%
Co
mp
any overview
Strategy o
verviewM
arket overviewB
usiness overview
C
orp
orate g
overnance
Inform
ation fo
r sharehold
ersA
pp
endixes

Annual report • 2017Market overview
• 38 • • 39 •
Nickel
Battery
Nickel-cadmiumNi-Cd
The first nickel-cadmium batteries were developed in 1899. Currently, their use is restricted, since cadmium is prohibited as a toxic substance under the EU ban.
Nickel-metal hydride Ni-MH
Ni-MH batteries were developed in 1989 as a substitute for Ni-Cd batteries to avoid using cadmium. Producers use nickel to manufacture this type of batteries. Currently, though, the nickel-metal hydride battery market is growing at a slow pace (with hybrid vehicles being its only growth driver) and faces considerable competition from the lithium-ion batteries.
Lithium-ionLi-Ion
Li-Ion batteries were first commercially released in 1991 and became fairly widespread due to their high energy capacity and reliability (capacity is retained after many recharge cycles).
The key driver behind Li-Ion battery growth is electric vehicles gaining ground. Since 2014, CAGR of electric cars (hybrid and battery electric cars) has been around 46%.
The key factors driving electrification of the transport system are:• incentives offered by the state; • transformation of the consumer mindset; • improved technical specifications of batterie.
For instance, Norway (where electric cars account for 30% of all sales) grants tax exemptions (one-off registration tax and VAT) to buyers. Also, annual electric car tax is six times lower than that for a car powered by an internal combustion engine. Buyers of electric cars in a number of other European countries, including Belgium, Germany, the UK and France, enjoy considerable subsidies (ranging from EUR 4,000 to EUR 10,000) and fiscal incentives.
2015
Jan Feb March Apr May Jun Jul Aug Sept. Oct Nov Dec
2016 2017
0
1
2
3
4
5
6
561
453
415
489
China Indonesia
2017
2016
2015
2014
388
366
386
489
173
87
29
+2%1.0
1.05
1.05
0.95
High grade nickel Low grade nickel
2017
2016
2.04
2.0
Primary nickel production // mt
NPI production // kt
Nickel ore and concentrate imports to China // mt
Production
Primary nickel can be split into two major groups:
High grade nickel (cathodes, briquettes, carbonyl nickel and compounds) is produced from both sulphide and lateritic nickel ore. In 2017, the major high grade nickel producers included Nornickel, Vale, Jinchuan, Glencore and Sumitomo Metal Mining.
Low grade nickel (ferronickel, NPI and nickel oxide) is only produced from lateritic ore. In 2017, the major low grade nickel producers included Chinese and Indonesian NPI companies and also ferronickel producers: Eramet, Anglo American, South 32, Pamco and Posco (SNNC).
In 2017, primary nickel production grew by 2%, or 48 kt y-o-y, driven only by an increase in low grade nickel output, which more than offset the decline in high grade nickel production that continued into 2017.
In 2017, high grade nickel output dropped by 5%, with production cuts coming from the following producers: • Vale's Canadian refining operations after the
shutdown of its Birchtree (Thompson) and Stobie (Sudbury) mines;
• Nornickel due to ongoing capacity reconfiguration;• Chinese refined nickel producers as a result of nickel
feedstock shortage following the closure of loss-making mines in 2016–2017;
• Ambatovy (Madagascar).
Production of nickel forms for cathode use saw a substantial decline, which entailed their shortage in the market.
This was coupled with greater output of nickel sulphate that serves as a key feedstock for the precursors of the cathode material in Li-Ion batteries.
In 2017, low grade nickel production gained 10% globally. This was driven by NPI output increase in China and Indonesia, along with ferronickel in all major regions except Europe.
The key driver behind NPI production growth was the easing of the ban on exports of unprocessed nickel ore from Indonesia in March 2017 contributing to the availability of rich nickel ore.
There are several types of lithium-ion batteries depending on the cathode materials: LCO, LFP, LMO, NCM, NCA.
LCO is largely used in portable devices. This type of the cathode material is not applied in electric cars as a result of high cobalt prices, limited capacity, and technical issues of making a high-capacity battery safe for operation. However, other types of Li-Ion batteries are widely applied in the industry. LFP and LMO tend to be replaced with other Li-Ion battery types containing nickel as a result of a higher gravimetric and volumetric capacity of NCM and NCA. It helps to increase mileage and shrink battery volume and weight. The share of nickel compounds in the total cathode material output used in Li-Ion batteries went up from 32% in 2012 to 51% in 2017.
Growing nickel consumption in Li-Ion batteries comes not only on the back of increasing share of NCM/NCA containing nickel, but also higher average nickel content in the cathode material triggered by the need to substitute expensive cobalt units. While in 2016 NCM 1:1:1 (with nickel mass fraction of 20%) accounted for the lion share of nickel-magnesium compounds of the cathode material, in 2017 Li-Ion batteries with NCM cathodes 6:2:2 (with nickel mass fraction of 36%) and NCM 5:3:2 (30%) took the lead. Going forward, batteries are expected to switch to NCM 8:1:1 (with the nickel mass fraction of 48%), and some producers announce plans to launch commercial production of LNO, a nickel-based cathode material.
Further development of the automotive industry, the growing popularity of electric and hybrid cars, along with the evolution of the cathode technology towards nickel-intensive NCM lay the groundwork for major expansion of primary nickel consumption in this industry in the long run.
The total amount of Chinese ore imports reached the level of 2015 and exceeded 35 million wet tonnes, considering that the total nickel ore export quota issued by the Government of Indonesia exceeded 24 million wet tonnes by the end of 2017. In 2018, a major growth of NPI output is expected in China.
Source: Company data
Source: Company data
Source: Company data
LFP
Lithium Iron Phosphate LiFePO4
LMO
Lithium Manganese Oxide LiMn2O4
LCO
Lithium Cobaltite LiCoO2
NCA
Niсkel Cobalt Aluminium LiNixCoyAlnO2
(49–54% Ni)
NCM
Niсkel Manganese Cobalt LiNixCoyMnnO2
(20–48% Ni)
Co
mp
any overview
Strategy o
verviewM
arket overviewB
usiness overview
C
orp
orate g
overnance
Inform
ation fo
r sharehold
ersA
pp
endixes

Annual report • 2017Market overview
• 40 • • 41 •
Copper
Source: LME (settlement)
Key trends in the copper market
Early 2017 saw a strike at the largest Chilean mine Escondida and a ban on copper concentrate exports from Indonesia driving copper prices up to USD 6,145 per tonne as at mid-February.
By early May, they plunged to USD 5,470 per tonne as a result of growing exchange inventories, data on decreased copper imports to China and the end of the strike, with the bounce-back starting in mid-May.
Despite the short-term correction in mid-September and late November, copper prices peaked at USD 7,216 per tonne by year-end, the highest since February 2014.
The price growth was supported by the analytical agencies forecasting the copper market deficit in 2018 due to reduced production along with a high demand for copper coming from the booming sector of electric vehicles and EV infrastructure, as well as the upward trend in the construction industry.
In 2017, the average copper price stood at USD 6,166 per tonne (up 27% y-o-y).
CopperCuChinaEuropeOther AsiaAmericasAfrica and Oceania
CodelcoFreeport
BHP Billiton Glencore
Southern Copper Antofagasta
KGHM MMG
Anglo American First Quantum
Rio Tinto Vale
9%9%
7%6%
4%3%3%3%3%3%
2%2%
2%44%
in copper market
No.13
48%
18%
21%
12%
1%
23mt
Nornickel
Others
Source: Company data
Cu
2017The prices surged in the second half of the year with copper trading well
above the cost curve due to a slump in production triggered by strikes along
with a steady demand from the automotive and construction industries.
Outlook: neutral. In the mid-term, the market will remain balanced; the upcoming wage talks
in Chile and Peru may lead to a short-term uptick in copper prices.
Refined copper consumption by region
Market balance
In 2017, the refined copper market that had been somewhat oversupplied for the past six years moved into a slight deficit. It stood at as little as 0.2% of the total market volume, or 50 kt vs a 220 kt surplus in 2016.
Total exchange warehouse stocks remained virtually unchanged from late 2016 at 544 kt (548 kt as at the end of 2016), or nine days of global consumption, with off-exchange inventories going slightly down.
1 Outset of a strike at the Escondida mine;
2 Ban on the concentrate exports from Indonesia;
3 Strike at the Cerro Verde mine (Peru);
4 End of a strike at the Escondida mine;
5 Permit to export copper from Indonesia issued to Freeport;
6 Data on production cuts by BHP and Anglo American;
7 WBMS reporting the market's shift to a deficit.
Key industry developments and copper price // USD/t
2013 2015 2017 01.01 01.02 01.03 01.04 01.05 01.06 01.07 01.08 01.09 01.10 01.11 01.122014 2016
7,3226,862
5,495
4,863
6,166
5,000
6,000
7,000
8,000
1
23
4 56
7
2017
2016
–50
220
Source: Company data
Surplus/deficit in the copper market // kt +27%
6,166 USD per tonnethe average copper price in 2017
7,216 USDcopper prices peaked by year-end, the highest since February 2014
Co
mp
any overview
Strategy o
verviewM
arket overviewB
usiness overview
C
orp
orate g
overnance
Inform
ation fo
r sharehold
ersA
pp
endixes

Annual report • 2017Market overview
• 42 • • 43 •
Copper
Consumption
Source: Company data, Wood Mackenzie
Given its high electrical and thermal conductivity, ductility and corrosion resistance, copper is widely used in various industries. Some three quarters of refined copper produced globally are used for manufacturing electrical conductors, including various types of cable and wire. Key copper-consuming industries include construction, electrical and electronic equipment manufacturing, power supply, transport, engineering, machine building and consumer goods production.
In 2017, global consumption of refined copper totalled 23.0 mt (up 2.0%, or 0.46 mt y-o-y), primarily owing to stronger demand from cable and wire manufacturers. Consumption in pipe, flat rolled products and billet production segments saw moderate growth.
China remains the key copper consumer globally, with its market share reaching 48% in 2017 due to the demand growth of 3.2%, or 0.3 mt. During the year, it kept cutting imports of refined copper while bringing in more copper feedstock. In 2017, Chinese refined copper imports dropped by 5% to 4.7 mt, while copper concentrate and scrap imports went up by 2% and 6% to 17.4 mt and 3.6 mt, respectively. China’s growing consumption needs were mainly met through the local production ramp-up.
The demand for copper in developed economies saw only a slight increase in 2017, with Europe up (the Company’s key market for copper cathodes) by 0.2%, North America by 0.7%, and Asia (excluding China) by 2.3%. Russian domestic copper cathode consumption in 2017 was moderately down.
In the rest of Asia (excluding China), production growth was 1.4% (going slightly up in India and South Korea along with a slump in Japan). In North America, it shrank by 5.8% (marginally up in Mexico and down in the USA and Canada) and in South America – by 8.6% due to lower output in Chile. In Europe, copper production soared by 4.6% with Germany, Bulgaria and Sweden acting as the main contributors. According to preliminary estimates, Russia saw its production grow by 4% in 2017 after a 2% drop in 2016.
In 2017, global copper mine production slipped by 1.5% to 19.8 mt.
Some 3.1 mt of refined copper was produced from accumulated concentrate stockpiles and scrap on the back of higher scarp collection driven by higher copper prices.
The decline in copper production came as a result of Chilean strikes and technical issues experienced by the US producers.
In Peru, production was below the expectations due to strikes at the Cerro Verde, Cuajone and Toquepala mines in early 2017. However, higher copper output at the new Las Bambas mine operated by China's MMG drove Peruvian production up by 3%.
Changes in refined copper consumption in 2017 by industry // mt
China, which is currently developing smaller mines, saw its production grow by 6% to 1.5 mt. In Kazakhstan, commissioning of the new Bozshakol and Aktogay mines by KAZ Minerals drove the output up by 15%. A 4% growth in African production was mainly backed by Kolwezi mine in the Democratic Republic of the Congo and Sentinel mine in Zambia.
Chile, the top global supplier of copper, saw a drop in production due to a 1.5-month strike at BHP’s Escondida, the world’s largest copper mine, causing over 100 kt of production losses from February to March, coupled with lower output by the state-owned Codelco driven by declining copper content at its oldest fields.
In North America, production dropped by 4% due to some technical issues at the US and Canadian mines. Australia reported reduced output at the Mount Isa and Olympic Dam mines. Indonesia saw its copper output shrink by 7% following a ban on copper concentrate exports at the beginning of 2017, which made Freeport limit its operations at the Grasberg mine.
Russian copper production grew marginally in 2017.
The actual refined copper production was above the analyst forecasts issued early in 2017 thanks to the production surge in the second half of the year. It was also backed by the increased use of scrap. At the same time, consumption growth was slightly above the expectations driving the global deficit down by 0.1 mt as compared to the initial estimates.
+2%
Pipe BilletsWire rod Flat rolled products
21
23
2016 2017
22.5
0.33 0.04 0.07
0.03 23.0
Production
In 2017, global production of refined copper increased by 0.8%, or 0.19 mt, compared to 2016, totalling 22.9 mt. China remains the key driver behind that growth, with the national government firmly committed to the expansion of domestic smelting and refining capacities. In 2017, refined copper production in China grew by 8% to 8.9 mt, while its share in global output was 36%. Only 20% of Chinese production is local extraction, with another 80% coming from imported copper concentrates and scrap.
23.0 mttotal global consumption of refined copper in 2017
End product
First use product
Copper production // mt
–1.5%
25
Peru ChileDR Congo AustraliaKazakhstan USA Indonesia Other
18,5
20,5
2016 2017
20.1 0.09 0.080.07
–0.16–0.08
–0.07 –0.05 –0.18
19.8
Source: Company data, Wood Mackenzie
19.8 mtglobal copper mine production in 2017
–1.5%
22.9 mtrefined copper production in 2017
+0.8% +2.0%
Heavy engineering
10
Transport
11
Billets
4
Pipe
10
Wire rod
74
Consumer goods and equipment
24Power grids
24
Construction
31
Rolled products
12
Refined copper consumption by industry // %
Source: Company data, Wood Mackenzie
Co
mp
any overview
Strategy o
verviewM
arket overviewB
usiness overview
C
orp
orate g
overnance
Inform
ation fo
r sharehold
ersA
pp
endixes

Annual report • 2017Market overview
• 44 • • 45 •
Palladium
Key industry developments and palladium price // USD/oz
1 On 23 December 2016, China’s government released the plan to implement the China 6 emission standard, one of the most stringent regulations among those in place or planned to be introduced;
2 South African producers announced a potential decline in PGM output; poor production data came from Canadian assets; Volkswagen revealed plans to switch from small diesel engines to mild hybrids;
3 City administrations of London and Paris announced plans to step up measures to control exhaust emissions into the air;
4 Demand for risky assets is up; palladium market sees strong backwardation settle in; prices enter correction as the markets wait for new PGM statistics and the results of the Platinum Week in London;
5 South Africa’s Minister of Mineral Resources said that the country is planning to raise the target for black ownership in mining companies to 30%
6 China moved the deadline for quotas on electric cars to 2019;
7 South Africa’s Bokoni mine will be mothballed;
8 Lonmin announced plans to raise cash from selling surplus processing capacity;
9 Chancellor Angela Merkel announced Germany’s plans to support the EU initiative to ban internal combustion engine cars;
10 US Fed Chair Jannet Yellen said the regulator was planning gradual increases in its key interest rate until the end of 2017;
11 Palladium markets tested a major price level of USD 1,000 per oz;
12 South Africa’s Maseve mine will be put on care and maintenance;
13 US released strong car production data;
14 Additional demand for cars came in the aftermath of the Irma and Harvey hurricanes;
15 US Federal Reserve increased the interest rate; Sibanye-Stillwater announced a takeover offer for Lonmin.
Key trends in the palladium market
In 2017, palladium prices went up by a staggering 42%, hitting a 16-year high of USD 1,058 per oz by the end of the year. For FY 2017, palladium was one of the strongest performing commodities in terms of price appreciation. In late September, palladium became more expensive than platinum for the first time in 16 years, with the premium reaching as much as 17% by the end of 2017.
During the year, palladium prices were primarily driven by fundamentals, including the sustaining market deficit that saw palladium production lagging behind consumption. This was due to the expansion in global car-marking (the key consumer industry) as primary production and recycled output grew only moderately.
Along with the fundamental factors, palladium prices were supported by the environment on trading exchanges, which in 2017 were lacking in palladium available for spot purchases. In the futures market, backwardation settled in, with leasing rates strongly up. On the Chicago Mercantile Exchange (CME), palladium inventories were going down.
Throughout the year, prices were also driven by the weak USD against other currencies and the challenging geopolitical environment, including concerns around North Korea’s nuclear programme.
Given the favourable trends described above, the average annual palladium price for 2017 was at its all-time high of USD 869 per oz.
Market balance
Since 2010, there has been a sustained undersupply in the palladium market covered by the consumption of accumulated reserves. In the reporting period, the imbalance was partially offset by the outflow from ETFs, which, however, slowed down almost twice compared to 2016.
Palladium Pd
Anglo Platinum Impala Platinum
Sibanye-StillwaterLonmin
ValeNAP
Others
40%24%
13%6%
5%3%3%
6%
in palladium market
No.1Nornickel
North AmericaChinaEuropeJapanOther
28%
24%
21%
14%
13%
331t
Source: Company data
2017Impressive price growth on the back of strong demand from consumers and
limited supply.
Outlook: positive. Market deficit is expected to persist amid stable production volumes and
upward trend in industrial consumption.
Industrial consumption of palladium by region
–37 Palladium production and consumption balance
Destocking
ETF outflows
Palladium production and consumption balance
Reserve accumulation
Outflow from ETFs and retail investments
20
8
–9
–26
14
–15
–27 Demand and supply balance
Demand and supply balance
2016 2017
Source: Company data
Palladium market balance // t
Source: LBMA, Company data
725
803
691
613
869
600
800
1,000
1,200
2013 2015 2017 01.01 01.02 01.03 01.04 01.05 01.06 01.07 01.08 01.09 01.10 01.11 01.122014 2016
1
23
7 8 96
10
11
12 13 14
15
+2.4% the expansion in global car-marking
45
Co
mp
any overview
Strategy o
verviewM
arket overviewB
usiness overview
C
orp
orate g
overnance
Inform
ation fo
r sharehold
ersA
pp
endixes

Annual report • 2017Market overview
• 46 • • 47 •
Palladium
+2.8%
250
335
2016 Electronics MedicineAutocatalysts 2017
322
8.0
–0.4 –0.6
3.5
–0.7
Jewellery Chemicals Other
–0.4 331
Consumption
In 2017, industrial consumption of palladium increased by 9 t (+3%) compared to the previous year, hitting a new all-time high of 331 t.
Exhaust treatment systems account for nearly 80% of total palladium consumption. In this sector, palladium is used in catalytic converters to detoxify exhaust fumes. In most countries, such converters are legally required to be installed on all cars.
Due to its unique catalytic properties ensuring effective chemical reactions throughout the entire vehicle life cycle (at least 150,000 miles in the US), palladium has almost no substitutes except for platinum, which is used mostly in diesel cars, and rhodium. Given the significant share of already produced vehicles and small market size (global production stands at only 24 t annually), rhodium suffers from high price volatility and the risk of physical metal deficit.
In 2017, palladium consumption by the car-making industry went up by 8 t and reached a new record of 263 t. This was driven by three groups of factors:
1) Strong growth of global car production.Last year, car production around the world expanded by 3% vs the previous year. The strongest performers were China (+3%), Europe (+3%), Japan (+5%), and India (+6%), with Russia (+20%) and Brazil (+25%) also demonstrating a healthy recovery. A major contraction was seen in the US market (-8%), mainly on the back of a natural slowdown (following the
record-high performance of 2016) that was the result of high leverage among consumers, rising interest rates, strong discounts previously secured by car manufacturers, and weak demand from car rental companies. The decline mostly affected passenger cars; by contrast, production of SUVs and small trucks (which are more reliant on PGM) is on the rise. The optimistic economic environment in the US gives hope that the domestic car market will soon recover ground.
2) Changes in the transport structure.The key markets for diesel cars (Western Europe and India) are replacing light diesel vehicles with petrol cars and hybrids (combining petrol and electric engines), which make greater use of palladium-based catalytic converters for exhaust gases.
Palladium consumption by application area // t
3) Tougher regulations on pollutant emissions.The marked increase in palladium consumption by the car-making industry in China came on the back of toughened environmental requirements as part of the China 5 rollout across the country starting from the end of 2017, followed by transition to China 6 in 2019 and beyond. China 6 regulations are based on best practices in emission control as developed in the US and EU, and in some aspects also add new enhanced requirements. In the US, 2017 marked the rollout of the Tier 3 standards designed to more than halve the fleet-average NO
x emissions. The EU nations are phasing in Real Driving Emissions (RDE) tests for cars and also made particulate filters mandatory for petrol engines, which additionally helps to expand the use of palladium in exhaust treatment systems.
Source: Company data
331 tIndustrial consumption of palladium in 2017 (a new all-time high)
+3%
Source: Company data
869 USD per ozthe average annual palladium price for 2017
+42%
Palladium consumption in 2017 by industry // %
Chemical catalysts
5 Dental alloys
4
Other
1
Jewellery
2
Electronics
8
Automobile exhaust systems
80
Co
mp
any overview
Strategy o
verviewM
arket overviewB
usiness overview
C
orp
orate g
overnance
Inform
ation fo
r sharehold
ersA
pp
endixes

Annual report • 2017Market overview
• 48 • • 49 •
Palladium
Palladium consumption in the electronics industry continued a moderate downward trend in 2017 (-0.6 t): lower use of palladium in multi-layer ceramic capacitors was partially offset by an absolute increase in their production and increased use of palladium in the connectors and lead frames.
The use of palladium in chemical catalysts went up by 3.5 t (+26%) in 2017 as a result of China’s new basic polymer capacities coming on stream. The trend was also supported by additional purchases of palladium by chemical businesses, which had to move away from the leasing model following price growth amid backwardation.
In the healthcare sector, palladium demand continued declining on the back of transition to alternative composites and dental scrap processing.
While palladium has a number of advantages for jewellery manufacturing, its consumption in the industry dropped by 0.4 t (5%) in 2017 because it does not have a strong brand as a jewellery metal. Today, palladium is used mainly in white gold alloys
or for wedding rings (in its pure form), mainly in the European and US markets. Recently, palladium has seen expanded use as a metal for electroplating (in luxury accessories, clothing, car interior, furniture fittings, etc.), but the overall negative trend still persists.
Investment demand for palladium kept shrinking in 2017, albeit at a slower pace compared to 2016. Withdrawals from ETFs totalled 12 t. This reduction resulted from the profit taking that followed a significant price surge, coupled with investor migration to stocks and to more attractive palladium-linked futures (net long positions in palladium on the Chicago Mercantile Exchange rose by 72% last year, reaching 2.6 moz).
Retail demand for palladium coins and bars was negative in 2017 (-2 t) as a result of profit taking by retail investors, above all in the US, as prices went up. The unfavourable trend was partially offset by the US Mint issuing its first ever palladium bullion coin, a move that confirmed strong investor interest for this instrument.
+3%
200
220
2016 Russia USASouth Africa 2017
207
3.70.7
5.7
–2.9
0.4
Zimbabwe Canada Other
–0.5 214
Annual primary palladium output // t
Source: Company data
0.55 mozNornickel’s Global Palladium Fund (GPF) Pd reserves in 2017
263 tpalladium consumption by the car-making industry in 2017
+3% Production
In 2017, primary palladium production expanded by 3% against the previous year (214 t vs 207 t).
Russia, the metal’s major producer, saw a rise in output driven by the processing of copper concentrate purchased by the Company from the state-controlled Rostec corporation. Other factors at play included using up work-in-progress inventories at Polar Division and the reduction in the work-in-progress materials in transit following the now completed reconfiguration of production facilities.
South Africa, the world’s No. 2 palladium producer, demonstrated a strong rise in volumes in 2017. Despite the challenging market conditions and a considerable number of unprofitable facilities, 2017 delivered a moderate rise in primary palladium production. The bulk of the growth came from Anglo American Platinum, which among other things boasted a 13% rise in palladium production at its Mogalakwena mine in the northern limb of the Bushveld Complex, which is richer in palladium compared to the western and eastern limbs. South Africa’s refined palladium production was under pressure from the temporary closure of the Mototolo concentrator in August to December 2017, furnace maintenance at Impala Platinum’s mines, and challenges in accessing the ore body at Northam Platinum’s Zondereinde mine.
In Zimbabwe, production was marginally up, driven by the Zimplats and Mimosa mines. However, planned maintenance at the Unki concentrator in Q4 2017 brought the overall performance slightly down.
Primary palladium production in Canada declined by 3 t as a result of dwindling output at the mines of Vale and Glencore, mainly due to depletion. The negative performance was to some extent offset by the growth posted by North American Palladium. In the US, production remained virtually flat compared to 2016 (launched in 2017, the Blitz project is expected to deliver volume growth starting from 2018).
The main sources of recycled palladium are used exhaust gas autocatalysts, as well as jewellery and electronic scrap. In 2017, recycled output increased by 13 t, up to 91 t, primarily due to growing collections of electronic scrap on the back of higher palladium prices, recovery in steel prices, and also implications of the Irma and Harvey hurricanes that wiped out more than 1 mln cars in the US. Jewellery and electronic scrap volumes remained flat.
The sources of previously accumulated palladium stockpiles include trading companies, financial institutions, government reserves, and surplus inventories of consumers. In the 1990s and 2000s, Russia's palladium supply came primarily from the country’s government stockpiles. In recent years, Russian stockpiles ceased to be part of the palladium supply, which points to their depletion and marks the transition towards a palladium market that is completely market-driven.
In 2017, Nornickel’s Global Palladium Fund (GPF) built Pd reserves of around 0.55 moz through purchases from third parties and the Company
Co
mp
any overview
Strategy o
verviewM
arket overviewB
usiness overview
C
orp
orate g
overnance
Inform
ation fo
r sharehold
ersA
pp
endixes

Annual report • 2017Market overview
• 50 • • 51 •
Platinum
Key trends in the platinum market
In 2017, platinum prices were trending sideways. Despite several spikes to above USD 1,000 per oz during the year, by the end of the reporting period the metal’s price reverted to its starting point of USD 930 per oz.
The changes in platinum and gold prices in 2017 mostly occurred in sync, indicative of platinum prices being highly dependent on macroeconomic trends, which were largely positive during the year. The weak US dollar against other currencies and the challenging geopolitical environment, including concerns around North Korea’s nuclear programme, supported precious metal prices. At the same time, they faced certain pressure due to the rally in the US stock market, which resulted in some investors migrating from metals to equities.
In March–April and September, the platinum to gold price spread was increasing, with platinum dragging. The platinum price was 20% weaker compared to gold at the year’s outset, and that became 30% by the end of 2017, driven by the platinum market’s fundamentals as well as by speculation.
The main fundamental drivers included a drop in platinum consumption by the automotive industry due to reduced share of diesel passenger cars in the key markets of Western Europe and India, no awaited recovery in demand from Chinese jewellers, and primary production not being too receptive to low
prices. Speculation was another big negative factor, with investors betting on a downward metal price trend. They took twice as many short positions in platinum (amounting to 2 mln oz) on the Chicago Mercantile Exchange (CME) as the year before, while the number of long positions increased only by a third.
The largely negative sentiment drove the average annual platinum price for 2017 below the last year’s level to its twelve-year low of USD 949 per oz.
Market balance
The platinum market was balanced in 2017. Production of primary and recycled metal exceeded industrial and jewellery consumption, but the surplus was accumulated by ETFs and private investors in the physical market.
Platinum PtEuropeChinaNorth AmericaJapanOther
29%
24%
14%
13%
20%
243t
Anglo Platinum Impala Platinum
Lonmin
Northam Others
40%25%
11%
11%4%
9%
in platinum market
No.4Nornickel
Source: Company data
2017The market was balanced on the back of decreasing consumption by
the automotive and jewellery industries, upward investor demand and
consumption trends in other industries, and primary production growth
fuelled by low prices.
Outlook: neutral. In 2018, the market is expected to remain more or less balanced, with a
moderate recovery in demand and stable supply as the decrease in primary
production would be offset by higher recycling volumes.
Platinum consumption by regionKey industry developments and platinum price // USD/oz
1 On 23 December 2016, China’s government released the plan to implement the China 6 emission standard, one of the most stringent regulations among those in place or planned to be introduced;
2 South African producers announced a potential decline in PGM output; poor production data came from Canadian assets; Volkswagen revealed plans to switch from small diesel engines to mild hybrids;
3 City administrations of London and Paris announced plans to step up measures to control exhaust emissions into the air;
4 US released weak statistics on car production; South Africa’s Minister of Mineral Resources said that the country is planning to raise the target for black ownership in mining companies to 30%;
5 China moved the deadline for quotas on electric cars to 2019;
6 South Africa’s Bokoni mine will be mothballed;
7 Lonmin announced plans to raise cash from selling surplus processing capacity;
8 Chancellor Angela Merkel announced Germany’s plans to support the EU initiative to ban internal combustion engine cars;
9 South Africa’s Maseve mine will be put on care and maintenance;
10 US released strong car production data; additional demand for cars came in the aftermath of the Irma and Harvey hurricanes;
11 Sibanye-Stillwater announced a takeover offer for Lonmin
1 Platinum production and consumption balance
Destocking
Demand and supply balance
Demand and supply balance
Outflow from ETFs and retail investments
Platinum production and consumption balance
Inflow from ETFs and retail investments
–13
1
–11
10
–9
1
2016 2017
Source: Company data
Platinum market balance // t
Source: LBMA price, Company data
1,486 1,385
1,053 989
949
2013 2015 2017 01.01 01.02 01.03 01.04 01.05 01.06 01.07 01.08 01.09 01.10 01.11 01.122014 2016
800
1,000
1,200
1
2 3
45 6
7
8 9
1011
Co
mp
any overview
Strategy o
verviewM
arket overviewB
usiness overview
C
orp
orate g
overnance
Inform
ation fo
r sharehold
ersA
pp
endixes

Annual report • 2017Market overview
• 52 • • 53 •
Platinum
Consumption
Industrial consumption of platinum in 2017 compared to the previous year rose slightly (by 1 t, or 0.5%) and reached 243 t.
The automotive industry is the main consumer of platinum. Over 70% of platinum in this industry is used to manufacture exhaust gas catalysts for diesel vehicles.
In 2017, platinum consumption in the automotive sector decreased y-o-y by 0.9 t, or 1%, which mainly had to do with a decreased share of diesel vehicles in their key market – Europe. By December 2017, the share of diesel sales in Germany dropped from 46% to 39% y-o-y, having hit its minimum level since 2009 at 36% in September. France also saw a continued decline in diesel vehicle sales, which amounted to 47% compared to 52% in the previous year. Five years ago, that share was three quarters of the market.
India, which is a key market that had been viewed as a bastion for diesel vehicle production, was also on the decline over the recent years, with the share of diesel sales in the country’s car market having decreased twofold (from 47% to 23%) during 2012–2017.
Diesel engines are giving way to petrol-based solutions, and more expensive vehicles utilise hybrids (combining petrol and electric engines). Petrol engine being a component of a hybrid necessitates wide use of palladium-based catalysts. Having the same displacement as the internal combustion engine, the hybrid uses more of the metal than a traditional petrol engine due to more frequent cold starts.
Lower platinum consumption by passenger car producers was partially offset by increased manufacturing of heavy-duty vehicles, catalytic devices of which still rely on this metal. Diesel engines, together with hybrids, are the key and most cost-efficient solutions to achieve the EU’s targets for reducing CO2 emissions to 95 g/km by 2020. New diesel cars comply with the existing environmental requirements, but the Volkswagen emissions scandal served to ingrain the public’s and authorities’ negative attitudes towards diesel transport, especially in the EU, where many cities are now planning to introduce a ban on old diesel cars. This gives reason to expect further declines in the share of passenger diesel cars. However, in absolute terms manufacturing of this type of vehicles will continue to show a positive trend in the near term thanks to overall growth of the automotive industry.
Platinum consumption by application area // t
The second biggest platinum consumer is the jewellery industry, accounting for a third of the demand. The reporting period saw a sustained declining trend of platinum consumption in the industry that set in during the previous year, albeit with a lower rate (1.7 t less, or 2%). The decrease was primarily driven by lower jewellery demand in China due to consumers switching to other forms of investing. Still, China retains its high potential, especially when it comes to sales in cities with populations ranging from 150 thousand to 3 mln people.
Source: Company data
243 tPlatinum consumption in 2017
+0.5%
>70% of platinum in automotive industry is used to manufacture exhaust gas catalysts for diesel vehicles.
Platinum consumption in 2017 by industry // %
Source: Company data
Glass
4
Electronics
39
Chemical catalysts
9
Catalytic converters for exhaust gases
45Jewellery
30
Other
+0.5%
200
245
2016 Electronics ChemicalsAutocatalysts 2017
242
–0.9–1.7
0.91.9 0.5
Jewellery Glass Other
0.6 243
Co
mp
any overview
Strategy o
verviewM
arket overviewB
usiness overview
C
orp
orate g
overnance
Inform
ation fo
r sharehold
ersA
pp
endixes
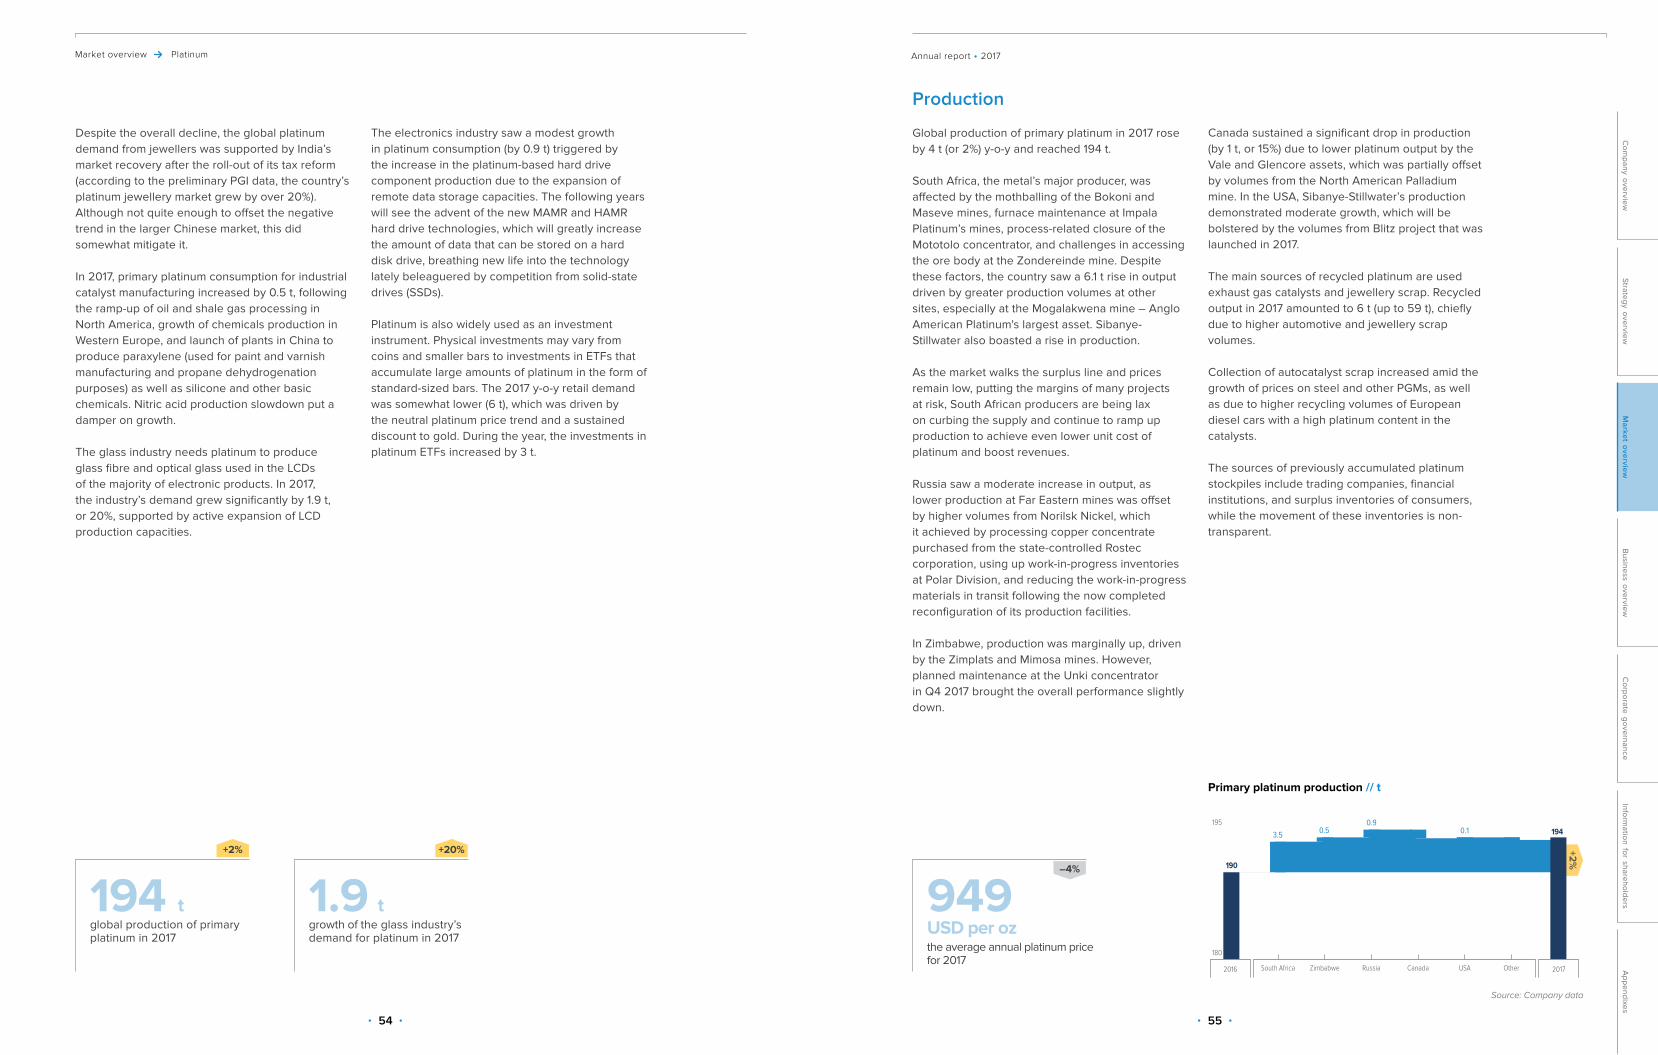
Annual report • 2017Market overview
• 54 • • 55 •
Platinum
Despite the overall decline, the global platinum demand from jewellers was supported by India’s market recovery after the roll-out of its tax reform (according to the preliminary PGI data, the country’s platinum jewellery market grew by over 20%). Although not quite enough to offset the negative trend in the larger Chinese market, this did somewhat mitigate it.
In 2017, primary platinum consumption for industrial catalyst manufacturing increased by 0.5 t, following the ramp-up of oil and shale gas processing in North America, growth of chemicals production in Western Europe, and launch of plants in China to produce paraxylene (used for paint and varnish manufacturing and propane dehydrogenation purposes) as well as silicone and other basic chemicals. Nitric acid production slowdown put a damper on growth.
The glass industry needs platinum to produce glass fibre and optical glass used in the LCDs of the majority of electronic products. In 2017, the industry’s demand grew significantly by 1.9 t, or 20%, supported by active expansion of LCD production capacities.
Production
Global production of primary platinum in 2017 rose by 4 t (or 2%) y-o-y and reached 194 t.
South Africa, the metal’s major producer, was affected by the mothballing of the Bokoni and Maseve mines, furnace maintenance at Impala Platinum’s mines, process-related closure of the Mototolo concentrator, and challenges in accessing the ore body at the Zondereinde mine. Despite these factors, the country saw a 6.1 t rise in output driven by greater production volumes at other sites, especially at the Mogalakwena mine – Anglo American Platinum's largest asset. Sibanye-Stillwater also boasted a rise in production.
As the market walks the surplus line and prices remain low, putting the margins of many projects at risk, South African producers are being lax on curbing the supply and continue to ramp up production to achieve even lower unit cost of platinum and boost revenues.
Russia saw a moderate increase in output, as lower production at Far Eastern mines was offset by higher volumes from Norilsk Nickel, which it achieved by processing copper concentrate purchased from the state-controlled Rostec corporation, using up work-in-progress inventories at Polar Division, and reducing the work-in-progress materials in transit following the now completed reconfiguration of its production facilities.
In Zimbabwe, production was marginally up, driven by the Zimplats and Mimosa mines. However, planned maintenance at the Unki concentrator in Q4 2017 brought the overall performance slightly down.
The electronics industry saw a modest growth in platinum consumption (by 0.9 t) triggered by the increase in the platinum-based hard drive component production due to the expansion of remote data storage capacities. The following years will see the advent of the new MAMR and HAMR hard drive technologies, which will greatly increase the amount of data that can be stored on a hard disk drive, breathing new life into the technology lately beleaguered by competition from solid-state drives (SSDs).
Platinum is also widely used as an investment instrument. Physical investments may vary from coins and smaller bars to investments in ETFs that accumulate large amounts of platinum in the form of standard-sized bars. The 2017 y-o-y retail demand was somewhat lower (6 t), which was driven by the neutral platinum price trend and a sustained discount to gold. During the year, the investments in platinum ETFs increased by 3 t.
Canada sustained a significant drop in production (by 1 t, or 15%) due to lower platinum output by the Vale and Glencore assets, which was partially offset by volumes from the North American Palladium mine. In the USA, Sibanye-Stillwater’s production demonstrated moderate growth, which will be bolstered by the volumes from Blitz project that was launched in 2017.
The main sources of recycled platinum are used exhaust gas catalysts and jewellery scrap. Recycled output in 2017 amounted to 6 t (up to 59 t), chiefly due to higher automotive and jewellery scrap volumes.
Collection of autocatalyst scrap increased amid the growth of prices on steel and other PGMs, as well as due to higher recycling volumes of European diesel cars with a high platinum content in the catalysts.
The sources of previously accumulated platinum stockpiles include trading companies, financial institutions, and surplus inventories of consumers, while the movement of these inventories is non-transparent.
Source: Company data
1.9 tgrowth of the glass industry’s demand for platinum in 2017
+20%
949 USD per ozthe average annual platinum price for 2017
194 tglobal production of primary platinum in 2017
+2% +2%
180
195
2016 Russia USASouth Africa 2017
190
3.5 0.50.9
–1.0
0.1
Zimbabwe Canada Other
–0.3
194
Primary platinum production // t
–4%
Co
mp
any overview
Strategy o
verviewM
arket overviewB
usiness overview
C
orp
orate g
overnance
Inform
ation fo
r sharehold
ersA
pp
endixes

BUSINESS OVERVIEW
The Group business
Mineral base Geological exploration Production assets and activities Key investment projects Gas and energy assets Transportation assets Products and sales Research and development Supply management
Corporate responsibility
HR and social policy Occupational safety Environment
Financial overview (MD&A)
58
5862 66 87 9497
100103105
108
108 128 132
147

Annual report • 2017Business overview
• 58 • • 59 •
The Group business Mineral base
Nornickel boasts a unique mineral resource base due to its Tier 1 assets on Russia's Taimyr and Kola Peninsulas, in Zabaykalsky Krai. The continued expansion of the resource base secures the Company’s long-term development.
1 The Company’s reserves and resources as at 31 December 2017, including wholly owned overseas assets and excluding fields in Zabaykalsky Krai. Data regarding the mineral resources and ore reserves of the deposits of the Taimyr and Kola peninsulas were classified according to the Australasian Code for Reporting of Mineral Resources and Ore Reserves (JORC code), created by the Australasian Institute of Mining and Metallurgy, the Australian Institute of Geoscientists, and the Minerals Council of Australia, subject to the terminology recommended by the Russian Code for Public Reporting of Exploration Results, Mineral Resources, Mineral Reserves (NAEN Code). The six platinum group metals (PGMs) are platinum, palladium, rhodium, ruthenium, osmium, and iridium.
Proven and probable reserves
815 mt
Ni 7.1 mt
Cu 12.4 mt
PGM 3.9 kt
(125 mln oz)
Ni 15.5 mt
Cu 23.8 mt
PGM 8.3 kt
(265.1 mln oz) Geography of metals produced by Norilsk Nickel
Taimyr Peninsula Ni, Cu, Au, Pt, Pd, Rh, Ru, Os, Ur, Co
Kola Peninsula Ni, Cu, Au, Pt, Pd, Rh, Ru, Os, Ur, Co
Zabaykalsky Krai Cu, Au, Ag, Fe
AustraliaNi
South Africa Ni, Cu, Co, Rh, Ru, Os, Ur, Pt, Pd
Taimyr Peninsula (Polar Division and Medvezhy Ruchey)
Norilsk Nickel’s Polar Division develops copper-nickel sulphide deposits at the Talnakhskoye and Oktyabrskoye Fields (the Talnakh Ore Cluster). Medvezhy Ruchey develops copper-nickel sulphide deposits at the Norilsk-1 Field (part of the Norilsk Ore Cluster).
The Company has a strong potential to maintain the high level of ore reserves given the significant mineral resources available within the existing mining operations. The depleted rich and cuprous
ore reserves at the existing mines are mainly replaced through inferred resources on the flanks of the fields under exploitation. The Company plans to ramp up its mining operations by tapping into new rich ore deposits and focusing on the gradual and active development of disseminated and cuprous ore horizons. The Company will leverage the approved projects to develop new deposits and horizons in the Talnakh Ore Cluster and promising geological exploration data to ensure a sustainable mineral resource base going forward.
Kola Peninsula (Kola MMC)
Kola MMC develops copper-nickel sulphide deposits at the Zhdanovskoye, Zapolyarnoye, Tundrovoye, Kotselvaara-Kammikivi and Semiletka Fields as part of Pechenga ore fields. In addition to those,
Pechenga ore fields include the Sputnik, Bystrinskoye and Verkhneye Fields, and Kola MMC also holds an exploration and mining licence for them.
2 Clusters (A + В + С1 + С2).3 Operational and follow-up exploration, and re-estimation of reserves within the boundaries of the fields under exploitation.4 Operational exploration.
Balance reserves of the Talnakh and Norilsk Ore2
Proven and probable ore reserves
Measured and indicated mineral resources
2,160 mt
Ni 15.8 mt
Cu 30.4 mt
PGM 10.7 kt
690 mt
Ni 6.4 mt
Cu 12.07 mt
PGM 3.9 kt (124.8 mln oz)
1,714 mt
Ni 12.0 mt
Cu 22.7 mt
PGM 8,2 kt (over 264.2 mln oz)
Depletion of balance metal reserves
Additional balance reserves3
5.4 mt Average metal content Ni — 2.87%, Cu — 7.02%, PGM — 17.04 g/t
15.0 mt
Ni — 250.5 kt, Cu — 434.5 kt, PGM — 0.138 kt
Balance reserves of Pechenga ore fields2
Proven and probable ore reserves
Measured and indicated mineral resources
470.4 mt
Ni 3.16 mt
Cu 1.54 mt
125 mt
Ni 0.7 mt
Cu 0.36 mt
333 mt
Ni 2.3 mt
Cu 1.1 mt
Depletion of balance metal reserves
Conversion of balance reserves4
6.7 mt
average metal content Ni — 0.63%, Cu — 0.27%
6.86 mt
Ni — 43.6 kt, Cu — 18.7 kt
RESERVES AND RESOURCES1
Measured and indicated resources
2,220 mt
The Group businessMineral base
Co
mp
any overview
Strategy o
verviewM
arket overview
Business overview
C
orp
orate g
overnance
Inform
ation fo
r sharehold
ersA
pp
endixes

Annual report • 2017Business overview
• 60 • • 61 •
The Group business Mineral base
Zabaykalsky Krai (GRK Bystrinskoye and Bugdainsky Mine)
Bystrinskoye Field
GRK Bystrinskoye develops deposits of gold- iron-copper ores at the Bystrinskoye Field.
Bugdainskoye Field
Bugdainsky Mine holds an exploration and mining licence for the Bugdainskoye Field.
The exploration of the field resulted in B + С1 + C2 mineral reserves entered into the government books in 2007. 2013 saw the launch of a development project at the Bugdainskoye Field in accordance with the duly approved design documents. In 2014, due to the low international molybdenum prices, the subsoil user suspended its right to develop the Bugdainskoye Field for three years. In 2017, the suspension of the right to develop the field was extended for another five years, until 31 December 2022.
Depletion of balance ore reserves in 2017
5.2 mt
Balance reserves of the Bystrinskoye Field (В + С1 + С2)
333 Ore, mt
Cu 2.27 mt
Au 9,265 koz
Ag 39,763 koz
Fe1 76 mt
Balance reserves of the Bugdainskoye Field (В + С1 + С2)
812 Ore, mt
Mo 600 kt
Au 360 koz
Ag 6,221 koz
Pb 41 kt
The total measured and indicated mineral resources of the Honeymoon Well Project are estimated at
173 mt of ore
Average nickel: Ni — 0.68%
Australia (Norilsk Nickel Cawse)
The Group holds a licence to develop the Honeymoon Well Project including:• fields with disseminated nickel sulphide ores
(Hannibals, Harrier, Corella and Harakka);• the Wedgetail Field hosting solid and vein ores.
South Africa (Nkomati)
Nkomati is a 50/50 joint venture of the Norilsk Nickel Group and African Rainbow Minerals. Nkomati's performance is reflected in financial results using proportional consolidation according to our stake and not reflected in other totals.
The Nkomati disseminated copper-nickel sulphide ore deposit constitutes part of the Bushveld Complex. Nkomati is comprised of several ore
bodies, the key ones being a solid sulphide ore body (rich nickel ore) and the Main Mineral Zone (MMZ). The field also contains a Peridotite Chromite Mineralisation Zone (PCMZ) with a lower metal content vs MMZ.
The proven and probable ore reserves as at the end of 1H 2017
Proven average content and probable ore reserves2
88.6 mt of ore
Average content: Ni — 0.31%
Cu — 0.11%
Co — 0.02%
PGM — 0.88 g/t
Measured and indicated mineral resources2
182.4 mt of ore
Average content: Ni — 0.35%
Cu — 0.14%
Co — 0.02%
PGM — 0.95 g/t
2 At the end of 1H 2017.1 Magnetite iron.
Co
mp
any overview
Strategy o
verviewM
arket overview
Business overview
C
orp
orate g
overnance
Inform
ation fo
r sharehold
ersA
pp
endixes

Annual report • 2017Business overview
• 62 • • 63 •
The Group business Geological exploration
Geological explorationTaimyr Peninsula (Polar Division)
Exploration and follow-up exploration of copper-nickel sulphide ores are underway at the Maslovskoye Field and deep horizons and flanks of the Oktyabrskoye and Talnakhskoye Fields pertaining to the Norilsk Industrial District. Exploration of the Mokulaevskoye Field's industrial limestone deposits has been completed.
Prospecting of sulphide ores in the Norilsk Industrial District is in progress on the western flank of the Oktyabrskoye Field and in the Lebyazhninskaya Area, 20 km north-west of Norilsk, as well as in the Razvedochnaya, Mogenskaya, Khalilskaya, Nizhne-Khalilskaya and Nirungdinskaya Areas, 150 km south-east of Norilsk.
Maslovskoye Field
Ni Cu Pt
The field is located in the Norilsk Industrial District, 12 km south of the Norilsk-1 Field.
The Maslovskoye Field boasts some of the largest reserves in the world.
The licence to explore and mine copper-nickel sulphide ores at the Maslovskoye Field was obtained by the Company in 2015 following its discovery.
The Maslovskoye exploration project was reviewed and approved by the authorised expert bodies in 2016. A feasibility study of permanent exploratory standards is now in progress. In early February 2018, Nornickel and Russian Platinum signed a memorandum of intent to set up a joint venture for further development of disseminated ore deposits in the Norilsk Industrial District. The memorandum provides for the parity of JV partners, with Nornickel and Russian Platinum set to hold a 50% interest each. The partners’ contributions to the authorised capital of the JV will come in the form of a licence to develop the Maslovskoye Field held by Nornickel and a licence to develop the southern part of the Norilsk-1 Field and the Chernogorskoye Field held by Russian Platinum.
Flanks and deep horizons of the Talnakhsky Ore
Ni Cu
The Group’s geological exploration of the unregistered reserves at the Oktyabrskoye and Talnakhskoye Fields focuses on the follow-up exploration of rich and cuprous ores.
Geological exploration (follow-up exploration) is underway on the flanks of the Oktyabrskoye Field, southern flanks of the Talnakhskoye Field and the southern flank of Mayak mine to properly assess the boundaries of producing deposits and convert С2 reserves to the С1 category. Exploration on the eastern flanks of Skalisty mine and the flanks of the Severnaya 3 deposit has been completed. Following the re-assessment of the Severnaya 4 deposit copper and nickel ore reserves, 7,704.2 kt of rich and cuprous ores were entered in the government books.
In 2017, thanks to the follow-up exploration at the Severnaya 4 deposit, part of the Talnakh Ore Cluster, the Company registered additional balance reserves of copper-nickel ores.
Field boasts some of the largest reserves in the world.
Balance reserves of the Maslovskoye Field С1 + С2 mineral reserves
Reserves of the Severnaya 4 deposit (Oktyabrskoye Field) were re-entered in the government books in 2017
215 Ore, mt
Pd 32,262 koz
Pt 12,479 koz
Ni 728 kt
Cu 1,122 kt
Co 34 kt
Au 1,304 koz
Metal content in ore
Pd 4.56 g/t
Pt 1.78 g/t
Ni 0.33%
Cu 0.51%
Co 0.016%
Au 0.19 g/t
GROWTH POINTS: TALNAKH OUTLOOK
Maintaining a stable level of production at the Talnakh Ore Cluster is a mid-term priority of Norilisk Nickel’s new investment cycle launched in 2017 to secure The Company’s sustainable development.
In 2018–2020, the Talnakh mines are going to see investment of
USD 1.5 bn
Ore mining at the Talnakh cluster // mt
Ore mining without additional investmentSkalisty mine ramp-upTalnakh brownfields under construction
2020
2017
2014
11.3
13.9
13.5
2.3
1.8
1.0
15.4
15.7
14.5
1.81 .2 Ore, mt
Ni 45.5 kt
Cu 223.8 kt
Pt 11.4 t
Pd 33.9 t
Rich:
0.2 Ore, mt
Ni 0.7 kt
Cu 7.5 kt
Pt 0.4 t
Pd 1.5 t
Cuprous:
р. Заполярный
Ore-bearing intrusivesNorilsk
The northern part of the Norilsk-1 Field
Maslovskoye Field
The southern part of the Norilsk-1 Field
Norilsk
Talnakh
Mokulaevskoye Field
Oktyabrskoye Field
Eastern flank of the Oktyabrskoye Field
Talnakhskoye Field
Ore-bearing intrusivesRich ore depositsTalnakh Region and Talnakh ConcentratorGeological exploration of copper-nickel ores
Co
mp
any overview
Strategy o
verviewM
arket overview
Business overview
C
orp
orate g
overnance
Inform
ation fo
r sharehold
ersA
pp
endixes
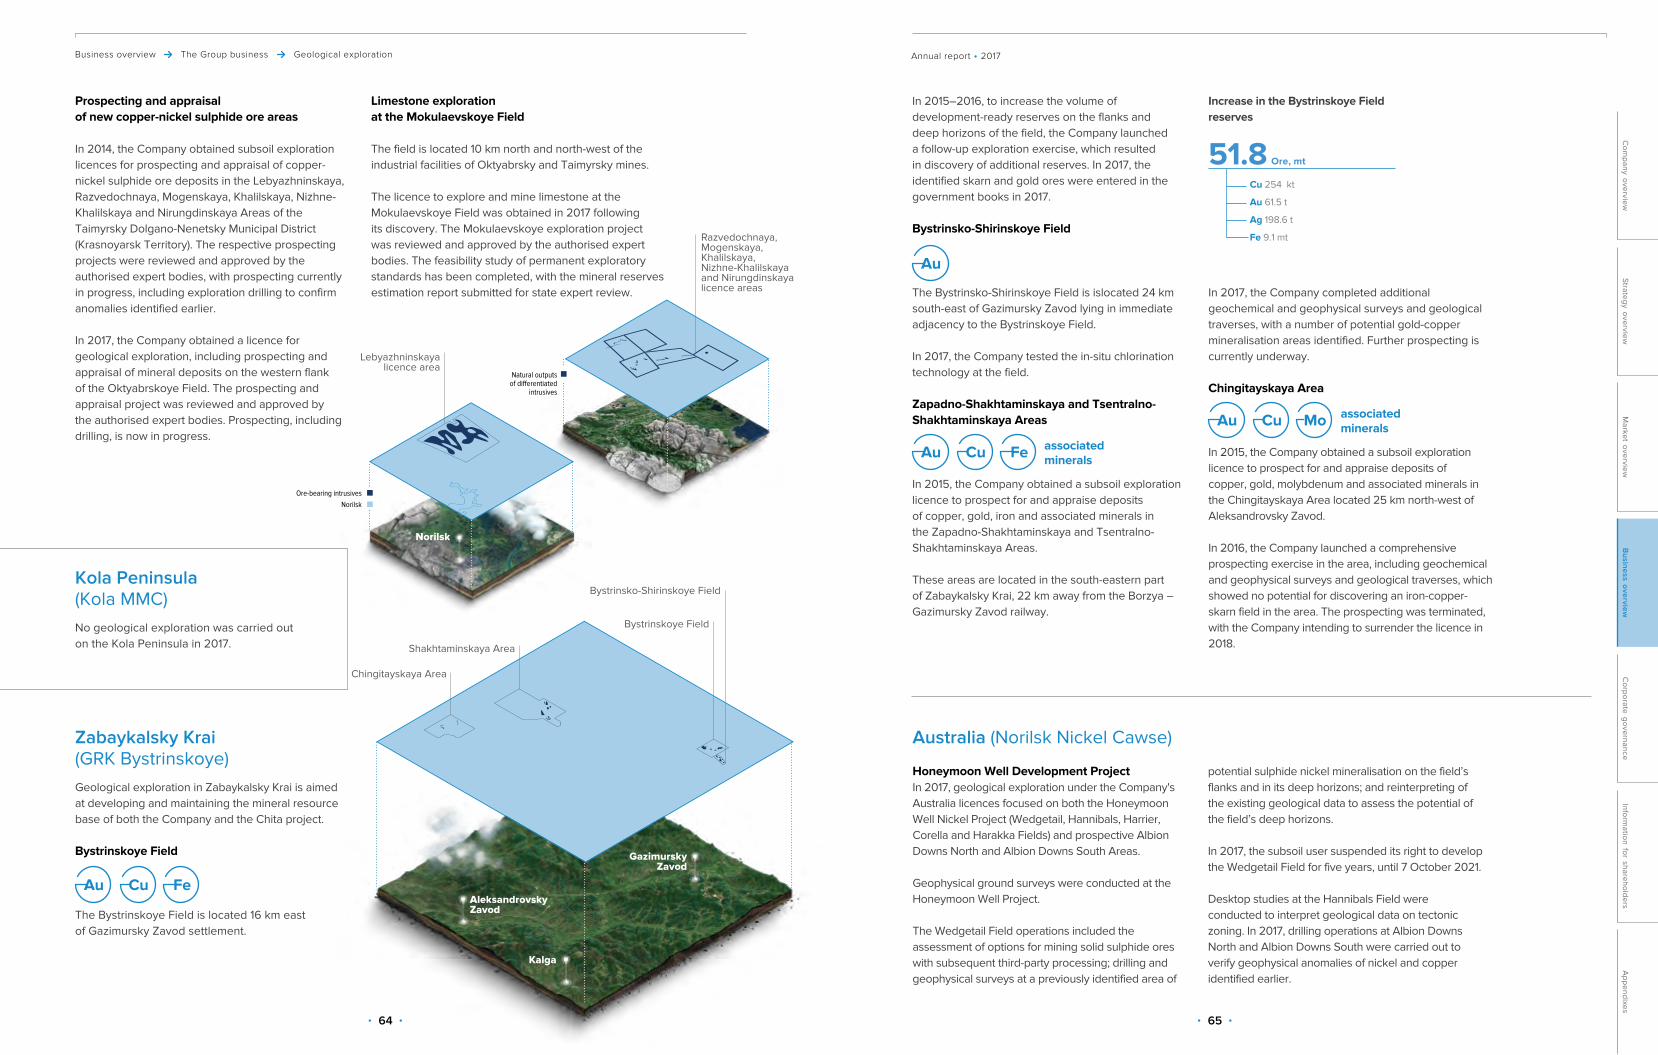
Annual report • 2017Business overview
• 64 • • 65 •
The Group business Geological exploration
Prospecting and appraisal of new copper-nickel sulphide ore areas
In 2014, the Company obtained subsoil exploration licences for prospecting and appraisal of copper-nickel sulphide ore deposits in the Lebyazhninskaya, Razvedochnaya, Mogenskaya, Khalilskaya, Nizhne-Khalilskaya and Nirungdinskaya Areas of the Taimyrsky Dolgano-Nenetsky Municipal District (Krasnoyarsk Territory). The respective prospecting projects were reviewed and approved by the authorised expert bodies, with prospecting currently in progress, including exploration drilling to confirm anomalies identified earlier.
In 2017, the Company obtained a licence for geological exploration, including prospecting and appraisal of mineral deposits on the western flank of the Oktyabrskoye Field. The prospecting and appraisal project was reviewed and approved by the authorised expert bodies. Prospecting, including drilling, is now in progress.
Limestone exploration at the Mokulaevskoye Field
The field is located 10 km north and north-west of the industrial facilities of Oktyabrsky and Taimyrsky mines.
The licence to explore and mine limestone at the Mokulaevskoye Field was obtained in 2017 following its discovery. The Mokulaevskoye exploration project was reviewed and approved by the authorised expert bodies. The feasibility study of permanent exploratory standards has been completed, with the mineral reserves estimation report submitted for state expert review.
Kola Peninsula (Kola MMC)No geological exploration was carried out on the Kola Peninsula in 2017.
Zabaykalsky Krai (GRK Bystrinskoye)Geological exploration in Zabaykalsky Krai is aimed at developing and maintaining the mineral resource base of both the Company and the Chita project.
Bystrinskoye Field
Au Cu Fe
The Bystrinskoye Field is located 16 km east of Gazimursky Zavod settlement.
In 2015–2016, to increase the volume of development-ready reserves on the flanks and deep horizons of the field, the Company launched a follow-up exploration exercise, which resulted in discovery of additional reserves. In 2017, the identified skarn and gold ores were entered in the government books in 2017.
Bystrinsko-Shirinskoye Field
Au
The Bystrinsko-Shirinskoye Field is islocated 24 km south-east of Gazimursky Zavod lying in immediate adjacency to the Bystrinskoye Field.
In 2017, the Company tested the in-situ chlorination technology at the field.
Zapadno-Shakhtaminskaya and Tsentralno-Shakhtaminskaya Areas
Au Cu Fe associated minerals
In 2015, the Company obtained a subsoil exploration licence to prospect for and appraise deposits of copper, gold, iron and associated minerals in the Zapadno-Shakhtaminskaya and Tsentralno-Shakhtaminskaya Areas.
These areas are located in the south-eastern part of Zabaykalsky Krai, 22 km away from the Borzya – Gazimursky Zavod railway.
In 2017, the Company completed additional geochemical and geophysical surveys and geological traverses, with a number of potential gold-copper mineralisation areas identified. Further prospecting is currently underway.
Chingitayskaya Area
Au Cu Mo associated minerals
In 2015, the Company obtained a subsoil exploration licence to prospect for and appraise deposits of copper, gold, molybdenum and associated minerals in the Chingitayskaya Area located 25 km north-west of Aleksandrovsky Zavod.
In 2016, the Company launched a comprehensive prospecting exercise in the area, including geochemical and geophysical surveys and geological traverses, which showed no potential for discovering an iron-copper-skarn field in the area. The prospecting was terminated, with the Company intending to surrender the licence in 2018.
Increase in the Bystrinskoye Field reserves
51.8 Ore, mt
Сu 254 kt
Au 61.5 t
Ag 198.6 t
Fe 9.1 mt
Australia (Norilsk Nickel Cawse)
Honeymoon Well Development ProjectIn 2017, geological exploration under the Company's Australia licences focused on both the Honeymoon Well Nickel Project (Wedgetail, Hannibals, Harrier, Corella and Harakka Fields) and prospective Albion Downs North and Albion Downs South Areas.
Geophysical ground surveys were conducted at the Honeymoon Well Project.
The Wedgetail Field operations included the assessment of options for mining solid sulphide ores with subsequent third-party processing; drilling and geophysical surveys at a previously identified area of
potential sulphide nickel mineralisation on the field’s flanks and in its deep horizons; and reinterpreting of the existing geological data to assess the potential of the field’s deep horizons.
In 2017, the subsoil user suspended its right to develop the Wedgetail Field for five years, until 7 October 2021.
Desktop studies at the Hannibals Field were conducted to interpret geological data on tectonic zoning. In 2017, drilling operations at Albion Downs North and Albion Downs South were carried out to verify geophysical anomalies of nickel and copper identified earlier.
р. Заполярный
Bystrinskoye Field
Shakhtaminskaya Area
Chingitayskaya Area
Bystrinsko-Shirinskoye Field
Aleksandrovsky Zavod
Kalga
Gazimursky Zavod
Natural outputs of di�erentiated
intrusives
Razvedochnaya, Mogenskaya, Khalilskaya, Nizhne-Khalilskaya and Nirungdinskaya licence areas
Ore-bearing intrusivesNorilsk
Lebyazhninskaya licence area
Norilsk
Co
mp
any overview
Strategy o
verviewM
arket overview
Business overview
C
orp
orate g
overnance
Inform
ation fo
r sharehold
ersA
pp
endixes

Annual report • 2017Business overview
• 66 • • 67 •
The Group business Production assets and activities
Production assets and activities
Talnakh Concentrator reached the target operating rates set by the upgrade project. Its capacity increased by over 30% from 7.6 to 10.2 mtpa of ore. Metal losses in tailings were reduced, and target nickel and copper content in the collective concentrate and target quality of nickel-pyrrhotite and copper concentrates were met.
A new tank-house section is being built at Kola MMC. Deployment of the highly efficient electrowinning technology will see the smelting of nickel anodes phased out. It will enable Nornickel to cut operating costs, drive down metal losses in the production process and improve the quality of products.
In October, Bystrinsky GOK was launched in Zabaykalsky Krai, with hot commissioning progressing as scheduled. The facility will be developing the Bystrinskoye Field, a polymetallic deposit in the Gazimuro-Zavodsky District, and the Bugdainskoye Field, a molybdenum deposit in the Alexandrovo-Zavodsky District.
p. 87
For more details, please see Key investment projects
With the key stage of our reconfiguration effort completed, Talnakh Concentrator delivered stronger recovery rates and reached its design capacity while work-in-progress inventory levels normalised, allowing us to meet production targets for 2017. Our own feedstock metals production increased by 7–15% vs 2016, with copper and platinum output beating targets by 4% and 6%, respectively. In 2018, Kola MMC will adopt chlorine leaching, with the refining capacities upgrade and expansion entering the active phase. Copper production is also expected to increase during the year, driven by both Bystrinsky GOK and the existing capacities.”
Sergey DyachenkoFirst Vice President – Chief Operating Officer at Nornickel
Ore mined across Russian assets // mt Metals production in 2017 – breakdown by asset // % from the overall Group production
2017 MILESTONES
Mining Production Products
Mines
• Taimyrky• Oktyabrsky• Komsomolsky• Zapolyarny• Mayak
Concentration Norilsk Concentrator
Concentration Bystrinsky GOK
Concentration Talnakh Concentrator
Smelting Cu Cooper Plant
Disseminated and cupriferous ore
High grade and cupriferous ore
slime from the tank-house
third-party feedstock
Pyrrhotite concentrate1
concentrateNi
concentrateNi+Po
concentrateCu
concentrateCu
• Precious metall concentrates
• Technical selenium
• Fe,Cu: saelble concentrate• Au: concentrate for processing
blisterCu
Cu refining Cooper Plant
Smelting Ni Nadezhda Metallurgical Plant
converter matte
Metallurgical Shop Cooper Plant
• Cu: cathodes • Commercial
lump sulphur• Sulphuric acid
1 Pyrrhotite concentrate from Kayerkansky Open Pit Coal Mine
Ores for processing
• Ni: cathodes, briquettes, salts, solutions
• Сo: sulphates, solutions
• Cu: saleable cake
Nickel refining Nickel refinery in Finland
• Ni: cathodes, carbonyl, saleable concentrate
• Cu: cathodes, saleable concentrate
• Co: electrolytic concentrate• Precious metall concentrates• Sulphuric acid
converter matte
Mines
• Severny• Kaula-Kotselvaara
Concentration Zapolyarny Concentrator
Smelting Ni Smelting Shop
Disseminated ore
third-party feedstock
concentrateCu, Ni
Ni & Cu refining Monchegorsk
Briquettes Ni
matte/converter matte from third parties
Ni
Open pits
• Verkhneildikansky (launch in 2018)
• Bystrinsky-2 (launch in 2018)
• Medny Chainik (planned)
• Yuzhno-Rodstvenny (planned)
matte/crushed converter matte
Ni
Nor
ilsk
Nic
kel H
arja
valta
Polar Division and Medvezhy Ruchey Kola MMC
2017
2016
2015
17.4
17.2
17.3
7.6
7.6
8.0
25.0
24.8
25.3
Polar Division Kola MMC Norilsk Nickel Harjavalta
Ni72
28
Cu77
20
3
PGM35
63
2
„
Co
mp
any overview
Strategy o
verviewM
arket overview
Business overview
C
orp
orate g
overnance
Inform
ation fo
r sharehold
ersA
pp
endixes
Kol
a M
MC
Po
lar D
ivis
ion
and
Med
vezh
y R
uche
y G
RK
Bys
trin
skoy
e

Annual report • 2017Business overview
• 68 • • 69 •
The Group business Production assets and activities
Operating performance for 2017
Ore mined across the Group // mt
Asset 2015 2016
2017
Russia
Polar Division and Medvezhy Ruchey 17.3 17.2 17.4
Kola MMC 8.0 7.6 7.6
Total 25.3 24.8 25.0
South africa
Nkomati (50%)1 4.2 2.8 3.5
Average metal content
Asset
Nickel, % Copper, % PGM2, g/t
2015 2016 2017 2015 2016 2017 2015 2016 2017
Russia
Polar Division and Medvezhy Ruchey 1.27 1.23 1.29 2.06 2.09 2.17 6.85 6.81 6.83
Kola MMC 0.62 0.53 0.54 0.25 0.22 0.23 0.07 0.08 0.07
South Africa
Nkomati 0.34 0.36 0.31 0.14 0.13 0.12 – – –
Metals recovery in concentration // %
Asset
Nickel Copper PGM
2015 2016 2017 2015 2016 2017 2015 2016 2017
Russia
Polar Division and Medvezhy Ruchey (ore to concentrate)
81.3 77.1 82.4 95.5 94.2 95.5 79.3 77.7 81.5
Kola MMC (ore to concentrate)
72.7 69.0 69.8 76.0 73.6 75.4 – – –
South Africa
Nkomati(ore to concentrate) 74.1 70.6 70.7 86.1 89.5 90.9 – – –
Metals recovery in smelting // %
Asset
Nickel Copper PGM
2015 2016 2017 2015 2016 2017 2015 2016 2017
Russia
Polar Division and Medvezhy Ruchey 93.1 93.4 93.9 94.2 94.1 94.0 93.8 95.0 95.6
Kola MMC (up to converter matte)
96.5 96.8 96.5 96.3 96.6 96.2 – – –
Kola MMC (in refining)
97.8 98.2 98.2 97.3 97.1 97.4 96.3 93.4 96.7
Finland
Harjavalta 97.8 98.3 98.5 99.6 99.7 99.7 99.6 99.4 99.3
Saleable metals production across the Group
Metal 2015 2016
2017
Group total
Nickel, t 266,406 235,749 217,112
from own Russian feed 220,675 196,809 210,131
Copper, t 369,425 360,217 401,081
from own Russian feed 352,766 344,482 397,774
Palladium, koz 2,689 2,618 2,780
from own Russian feed 2,575 2,526 2,728
Platinum, koz 656 644 670
from own Russian feed 610 610 650
Russia
Nickel, t 222,016 182,095 157,396
Copper, t 355,706 350,619 387,640
Palladium, koz 2,606 2,554 2,738
Platinum, koz 622 622 660
Finland
Nickel, t 43,479 53,654 59,716
Copper, t 13,048 9,598 13,441
Palladium, koz 78 64 42
Platinum, koz 33 22 10
South Africa3
Nickel, t 11,350 8,486 8,006
Copper, t 5,301 4,007 4,504
Palladium, koz 53 40 46
Platinum, koz 20 15 20
1 Volumes based on the 50% ownership (not included in the totals).2 The five following metals are included: palladium, platinum, rhodium, ruthenium and iridium.
3 Saleable concentrate production based on the 50% ownership (not included in the totals).
Co
mp
any overview
Strategy o
verviewM
arket overview
Business overview
C
orp
orate g
overnance
Inform
ation fo
r sharehold
ersA
pp
endixes

Annual report • 2017Business overview
• 70 • • 71 •
The Group business Production assets and activities
Briquetting of copper-nickel concentrate (mechanical pressing of feedstock with a binder material) replaced the obsolete pelletisation and roasting technology (using heat to remove significant portions of sulphur from the concentrate). The introduction of the new feedstock preparation technology helped substantially reduce sulphur dioxide emissions (by 35 -40 ktpa at Polar Division alone). As briquettes have a higher sulphur content than pellets, during conversion the smelting shop produces gases that are richer in sulphur dioxide and are therefore easier to capture and recycle.
NEW TECHNOLOGIES
Tailings to be transported to the tailing dump
Сoncentrate to be used in nickel production
Ni
Сoncentrate to be used in copper production
Cu
● Crushing
● Ore dressing
● Grinding
● Screening
● Sizing
● Thickening
● Flotation
Production chain
Automation and improvement of production processes, including through the introduction of simulation modelling for underground mining planning at Polar Division, helps boost output in the real-time mode and reduce costs.
NEW TECHNOLOGIES
Mining Concentration
Ore to be transported to the concentrators
● Stripping Provides access from the surface to the deposit through underground workings used to transport mined ore, people, etc.
● Development workingsThe deposit is divided into separate sections, including mining levels, blocks, sublevels, stoops, etc.
● Stoping • separation of ore from the rock;• delivery of ore from the mine face to the
haulage level;• maintenance of the excavated area.
● Rock mass removal Ore is removed by load-haul dumpers and delivered to the surface by conveyor, railway and motor vehicles, or through skip shafts.
Mine
Ore body setting profile
Inclined shaft
Ramp
Crosscut
Skip shaft
Cage shaft
Haul roadway
Ventilation shaft
2
2
4
4
7
7
6
6
1
1
3
3
5
5
8
8
9
9
Co
mp
any overview
Strategy o
verviewM
arket overview
Business overview
C
orp
orate g
overnance
Inform
ation fo
r sharehold
ersA
pp
endixes

Annual report • 2017Business overview
• 72 • • 73 •
The Group business Production assets and activities
Nickel production
Ni
Production chain (continued)
Saline effluent disposal process at the tank house
Saline effluent is a by-product of nickel refining operations that has to be disposed of. In Monchegorsk, the process is designed in the form of a closed cycle. The steam and condensate resulting from evaporation are then reused in the tank-house to heat solutions and operate heat exchangers.
The treatment facility for saline effluents also ensured a more advanced treatment of industrial discharges, with chemical agents, specifically boric acid, flowing back to the production circuit. Now, instead of having to deal with harmful waste, the Company produces additional saleable goods - sodium sulphate and chloride. Those are widely used by the chemical industry (production of synthetic detergents) and utility companies (as de-icing agents).
State-of-the-art electrowinning technology
The technology has been piloted at Kola MMC and is to be rolled out across the Group. Removal of the anode electric arc furnace from the production chain will help reduce emissions. Nickel powder produced in tube furnaces is used as the feedstock. This technology is less labour-intensive (the cells no longer need to be taken offline and cleaned after each loading cycle thanks to the use of insoluble anodes) and ensures zero losses of both precious and non-ferrous metals. On top of that, the resulting metal has maximum purity.
NEW TECHNOLOGIES
● Flash smelter ● Basic oxygen furnace
● Basic oxygen furnace
● Casting mould
● Casting mould
● Concentrate drying
● Flotation
● Grinding
● Ore-thermal furnace
Pellets and briquets production
Slime to be used in precious metals production
Pt, Pd, Au, Ag
Nickel cathodes for sale
Nickel slame to Polar Division
Copper concentrate to Copper shop
● Concentrate drying
● Filtration
● Thickening
● Concentrate ● Matte smelting
● Smelting of matte
● Conversion
● Conversion
● Preparation of high-grate matte
● Preparation of high-grate matte
● Separation of high-grade matte
Polar Division
Kol
a M
MC
Matte High-grade matte to Kola MMC
Cu, Ni
Nic
kel m
elt
● Anode smelting
● Electrolysis baths
● Casting wheel ● Anode electric furnace
● Fruid-bed furnace
Nic
kel c
once
ntra
te
● Electrolysis
Co
mp
any overview
Strategy o
verviewM
arket overview
Business overview
C
orp
orate g
overnance
Inform
ation fo
r sharehold
ersA
pp
endixes

Annual report • 2017Business overview
• 74 • • 75 •
The Group business Production assets and activities
● Concentrate drying
● Filtration
● Concentrate ● Electrolysis
● Thickening
Copper production
Cu
Production chain (continued)
Сontinuous converting technology
The technology is being rolled out at NMP's continuous copper matte converting facility (as part of two Vanyukov furnaces – the basic oxygen and slag cleaning ones) to improve its blister copper production cycle. The new process uses a cutting-edge technology to dispose of smelting gases, with sulphur being taken into a continuous stream of highly concentrated gases ready for disposal.
NEW TECHNOLOGIES
This technology will help reduce sulphur-rich gas emissions by at least
30%
● Conversion
● Basic oxygen furnace
Nickel slag to Nadezhda Metallurgical Plant for nickel production
Copper slame to Polar Division
Slime to be used in precious metals production
Pt, Pd, Au, Ag
Copper cathodes for sale
Copper-nickel alloy
Blister copper
Gas
GasMatte
Matte
Coal
Waste slag
Polar Division Polar Division
● Vanyukov furnace ● Smelting of matte
● Anode smelting
Kola MMC
Slug to dump
Blister copper
Cop
per a
node
s
Copper matte
Copper matte
● Reverberatory furnace
● Anode electric furnace
● Casting wheel
● End product
● Electrolysis baths
Co
mp
any overview
Strategy o
verviewM
arket overview
Business overview
C
orp
orate g
overnance
Inform
ation fo
r sharehold
ersA
pp
endixes

Annual report • 2017Business overview
• 76 • • 77 •
The Group business Production assets and activities
Taimyr Peninsula (Polar Division and Medvezhy Ruchey)
In 2H 2017, Nornickel established Medvezhy Ruchey, a subsidiary that operates part of the assets of Polar Division, including Zapolyarny mine, Norilsk Concentrator, tailings pit No. 1 and Lebyazhye tailing pit. The carve-out was done to create separate Talnakh and Medvezhy Ruchey sites with a view to ramping up the new unit’s capacities by raising investments.
2017 MILESTONE
Polar Division and Medvezhy Ruchey are the Group’s flagship subsidiaries featuring a full metals production cycle that embraces operations ranging from ore mining to the shipment of end products to customers. Operating the Company’s largest fields, they mine ca. 17 mtpa of ore. In 2017, Polar Division and Medvezhy Ruchey accounted for 77% and 35% of copper and PGM output, respectively.
They are located beyond the Arctic Circle on the Taimyr Peninsula in the north of the Krasnoyarsk Territory, Russia. The sites are linked to other regions by the Yenisey River, the Northern Sea Route and by air.
The Talnakhskoye and Oktyabrskoye Fields are developed by Taimyrsky, Oktyabrsky, Komsomolsky (including Komsomolskaya and Skalistaya mines) and Mayak mines. Ores are extracted through slicing and chamber mining with flowable backfilling.
The Norilsk-1 Field is developed by Zapolyarny mine through open-pit and underground mining. Underground mining is carried out through level caving using single-stage excavation and front ore passes.
1 High grade ores are characterised by a higher content of non-ferrous and precious metals; cupriferous ores are characterised by a higher copper content vs nickel; disseminated ores are characterised by a lower metal content.
2 In 2010, the Talnakh Mining Administration was transformed into Komsomolsky mine consisting of Komsomolskaya, Skalistaya and Mayak mines.
3 In 2015, Mayak mine was spun off from Komsomolsky mine (consisting of Komsomolskaya, Skalistaya and Mayak mines) to become an independent operation. Komsomolsky mine was left with Komsomolskaya and Skalistaya mines.
4 Komsomolskaya mine is responsible for the development of the Talnakhskoye Field and the eastern part of the Oktyabrskoye Field.
5 In 2013–2014, part of Komsomolsky mine.6 In 2010, the Norilsk-1 Mining Administration was transformed
into Zapolyarny mine. Medvezhy Ruchey mine was integrated into Zapolyarny mine as Zapolyarny open pit. On 14 July 2017, Zapolyarny mine became a standalone unit of Medvezhy Ruchey.
Mining facilities
Field/mine Mine type Ores1
Oktyabrskoye Field copper-nickel sulphide
Oktyabrsky mine underground high grade, cupriferous and disseminated
Taimyrsky mine underground high grade
Talnakhskoye Field copper-nickel sulphide
Komsomolsky mine2,3, including
Komsomolskaya mine4 underground cupriferous and disseminated
Skalistaya mine underground high grade
Mayak mine5 underground high grade and disseminated
Norilsk-1 Field copper-nickel sulphide
Zapolyarny mine6, including
Zapolyarny open pit open pit disseminated
Zapolyarnaya mine underground disseminated
Mining
Ore mined // t
Ore type 2015 2016
2017
High grade 6,541,541 6,191,831 6,593,208
Cupriferous 5,403,755 7,080,627 7,165,500
Disseminated 5,382,273 3,971,752 3,618,576
TOTAL 17,327,569 17,244,210 17,377,284
In 2017, Polar Division’s total ore output stood at 17.4 mt, up 133 kt, or 0.8% y-o-y. The production of high grade and cupriferous ores increased by 6.5% and 1.2% y-o-y, respectively, driven by the performance of Taimyrsky mine and Skalistaya mine demonstrating a 40% growth y-o-y. Cupriferous ore production was higher thanks to Oktyabrsky mine’s results. In 2017, disseminated ore production was down by 9% – primarily due to lower output at Zapolyarny mine. The change in the volumes of ore mined was in line with the annual production plan.
Ore mined – breakdown by mine // %
Ore mined – breakdown by metal // %
17.4 mtPolar Division and Medvezhy Ruchey total ore output in 2017
+0.8%
Oktyabrsky Taimyrsky
Komsomolsky Mayak
Zapolyarny
2017
2016
2015
30.0
30.9
30.0
33.5
31.0
29.0
6.1
5.7
6.0
9.4
11.8
14.0
21.0
20.6
21.0
OktyabrskyTaimyrsky
Komsomolsky Mayak
Zapolyarny
Nickel
Copper
PGM
25.8
42.4
38.4
31.8
27.2
32.2
2.2
2.8
3.3
1.6
1.4
7.8
39.6
26.2
18.3
Yenisei River
Lake Pyasino
Dudinka
Kayerkan
Norilsk
Talnakh
Alykel airport
Nadezhda Metallurgical Plant
Copper Plant
Talnakh Concentrator
Norilsk Concentrator
6
1
2
3
54
123
456
Taimyrsky mineOktyabrsky mineKomsomolskaya mine
Mayak mineSkalistaya mineZapolyarnaya mine
Medvezhy Ruchey
Co
mp
any overview
Strategy o
verviewM
arket overview
Business overview
C
orp
orate g
overnance
Inform
ation fo
r sharehold
ersA
pp
endixes

Annual report • 2017Business overview
• 78 • • 79 •
The Group business Production assets and activities
Concentration Smelting
Concentration facilities
• Talnakh Concentrator• Norilsk Concentrator (now part of Medvezhy Ruchey)
Talnakh Concentrator processes high grade and cupriferous ores from the Oktyabrskoye Field to produce nickel-pyrrhotite and copper concentrates and metal bearing products. The key processing stages include crushing, breaking, flotation and thickening.
Norilsk Concentrator processes cupriferous and all disseminated ores from the Talnakhskoye and Oktyabrskoye Fields and Copper Plant’s low grade ores to produce nickel and copper concentrates. The key processing stages include crushing, breaking, gravitation and flotation enrichment, and thickening.
Thickened concentrates are transported via a pipeline from Talnakh and Norilsk Concentrators to smelting facilities for further processing.
In 2017, Polar Division’s Production Association of Concentrators processed a total of 18 mt of feedstock (including high grade, cupriferous and disseminated ores).
Smelting facilities
• Nadezhda Metallurgical Plant• Copper Plant (CP)• PGM Concentrator (part of Copper Plant)
Nadezhda Metallurgical Plant produces converter matte and elemental sulphur from the following:• Talnakh Concentrator’s nickel-pyrrhotite concentrate
and metal bearing products;• Norilsk Concentrator’s nickel concentrate;• pyrrhotite concentrate previously stored at
Kayerkansky Open Pit Coal Mine (KUR-1).
18.0 mtof feedstock (including high grade, cupriferous and disseminated ores) was processed by Polar Division’s Production Association of Concentrators in 2017
In 1H 2017, Talnakh Concentrator operated against the backdrop of implementing and fine-tuning a new technology, moving on to reach the design capacity in 2H 2017 and beat the 2016 ores processing volume by 1.5 mt in the full year (10.0 mt vs 8.6 mt). Nickel recovered into collective flotation concentrate from ore processed increased by 2.2% y-o-y (81.7% vs 79.5%).
In 2017, volumes of ore processed at Norilsk Concentrator were 0.6 mt lower (7.5 mt vs 8.1 mt in 2016) – in line with the mining plan. Nickel recovered into collective concentrate was 0.8% higher (71.7% vs 70.9% in 2016). During the year, the facility processed significant volumes of Copper Plant’s low grade ores.
Sulphide ore processed // mt Sulphide ore processed // mt
Nickel recovery // % Nickel recovery // %
Talnakh Concentrator Norilsk Concentrator
+15.5%2017
2016
10.0
8.6
+2.2p. p.
2017
2016
81.7
79.5
–7.4%12017
2016
7.5
8.1
+0.8p. p.
2017
2016
71.7
70.9
Pyrrhotite concentrate from Talnakh Concentrator and stored pyrrhotite concentrate from Kayerkansky Open Pit Coal Mine is further leached in Hydrometallurgical Shop to produce steam cured sulphide concentrate. Concentrate from Talnakh Concentrator, steam cured sulphide concentrate and stored pyrrhotite concentrate from Kayerkansky Open Pit Coal Mine are delivered to the flash smelting furnaces. The matte is then blown into high grade converter matte.
Copper Plant processed all of the copper concentrate from Norilsk and Talnakh Concentrators, as well as third-party feedstock, to obtain copper cathodes, elemental sulphur and sulphuric acid for production needs of Polar Division.
PGM Concentrator (part of Copper Plant) recycles sludge from the tank-house to produce concentrates of precious metals and technical selenium.
Precious metals produced by Polar Division are refined at Krasnoyarsk Precious Metals Refinery under a tolling agreement.
At Polar Division, metals are produced from its own feedstock. Since Q4 2016, all nickel converter matte from Nadezhda Metallurgical Plant has been processed at Kola MMC due to the Nickel Plant shutdown.
• copper cathodes;• nickel converter matte for Kola MMC;• precious metal concentrate;• commercial lump sulphur;• technical selenium.
Product offering:
Metals output
Metal 2015 2016
2017
Nickel, t 96,916 50,860 0
Copper, t 292,632 280,347 306,859
Palladium, koz 1,935 1,703 956
Platinum, koz 488 449 259
1 In 2017, volumes of ore processed decreased in line with the mining plan.
In 2017, Polar Division and Medvezhy Ruchey accounted for1:
77%Cu
35%PGM
1 % from the overall Group production.
Co
mp
any overview
Strategy o
verviewM
arket overview
Business overview
C
orp
orate g
overnance
Inform
ation fo
r sharehold
ersA
pp
endixes

Annual report • 2017Business overview
• 80 • • 81 •
The Group business Production assets and activities
The Barents Sea
Norway
Murmansk
Zapolyarny
Nickel
Monchegorsk
Briquetting section
Enrichment Plant
Severny mine
Smelting Shop
Refining Shop
Kola Peninsula (Kola MMC)
Kola Mining and Metallurgical Company (Kola MMC) is Norilsk Nickel's 100% subsidiary and an important production asset.
Located on the Kola Peninsula in Russia's Murmansk Region, Kola MMC is fully integrated into the transport infrastructure of the Northwestern Federal District.
In 2017, Kola MMC accounted for1:
72%Ni
20%Cu
63%PGM
Mining
Mining assets
Field / mine (section) Mine type Ores
Zhdanovskoye Field Copper-nickel sulphide
Severny underground section Underground Disseminated
Zapolyarnoye Field Copper-nickel sulphide
Severny underground section Underground Disseminated
Kotselvaara and Semiletka Fields Copper-nickel sulphide
Kaula-Kotselvaara mine2 Underground Disseminated
2 In December 2013, Kaula-Kotselvaara mine was merged with Severny mine and incorporated therein.
Kola MMC is currently developing the Zhdanovskoye, Zapolyarnoye, Kotselvaara and Semiletka Fields.
Severny mine (including Kaula-Kotselvaara mine) produces disseminated sulphide ores containing nickel, copper and other saleable components. Severny mine leverages various ore mining methods:• the Zhdanovskoye Field uses sublevel longwall
caving with front ore passes, block caving (limited scope of application), and open-pit mining (at Yuzhny open pit) methods;
• the Kotselvaara and Semiletka Fields primarily use stoping from sublevel drifts and sublevel caving, as well as room-and-pillar short-hole and long-hole stoping (limited scope of application).
7.6 mtKola MMC’s total ore output in 2017
+0.4%
Ore mined // t
Ore type 2015 2016
2017
Disseminated 7,962,226 7,615,518 7,643,224
Concentration
Concentration facilities
• Zapolyarny Concentrator
The Concentrator produces briquetted copper-nickel concentrate. Nkomati concentrate also undergoes briquetting. Briquettes are delivered to the Smelting Shop to produce converter matte.
In 2017, Kola MMC's Concentrator processed 7,600 mt of ore, up 32 kt y-o-y.
In 2017, the rate of metals recovery in bulk concentrate was above the 2016 level due to a lower content of hard-to-process and talcose ores in the ore mixture.
Breakdown of ore production at Severny mine // %
Ore production at Severny mine in 2017 – breakdown by metals // %
Severny open-pit section (o�-balance ores) Severny underground section (Zhdanovskoe Field) Severny underground (Zapolyarnoye Field) Kaula-Kotselvaara mine
Nickel
Copper
PGM
1.5
1.8
2.3
2.5
9.8
9.3
11.0
21.1
86.9
84.7
69.4
Severny open-pit section (o�-balance ores) Severny underground section (Zhdanovskoe Field) Severny underground (Zapolyarnoye Field) Kaula-Kotselvaara mine
2017
2016
2015
3.4
6.0
7.0
1.8
1.8
6.2
9.1
9.3
9.2
85.7
82.9
77.6
1 % from the overall Group production.
Kola MMC’s total ore output amounted to 7.6 mt, up 0.4% (28 kt) y-o-y owing to the development of flank deposits at the Zhdanovskoye Field.
The change in the volumes of ore mined was in line with the annual production plan.
Co
mp
any overview
Strategy o
verviewM
arket overview
Business overview
C
orp
orate g
overnance
Inform
ation fo
r sharehold
ersA
pp
endixes

Annual report • 2017Business overview
• 82 • • 83 •
The Group business Production assets and activities
MongoliaChina
Chita
Sretensk
Borzya
AleksandrovskyZavod
Gazimursky Zavod
Bystrinsky project
Smelting facilities:
• Smelting Shop (Nickel)• Briquetting section (Zapolyarny)• PGM Concentrator (Monchegorsk)• Refining Shop (Monchegorsk)• Tank-Houses 1 and 2 (Monchegorsk)
In 2017, Kola MMC continued improving production processes and proceeded with the maintenance of key production equipment at its smelting facilities.
In Q1 2017, it commissioned a disposal facility for saline effluent from nickel refining operations at Tank-House 2. Tank-House 2 saw further implementation of the project for Nickel Electrowinning from Chlorine
Dissolved Tube Furnace Nickel Powder with the Production Volume of 145 ktpa of Electrolytic Nickel.
Kola MMC’s refining facilities in Monchegorsk process converter matte from Nickel's Smelting Shop and Polar Division.
Precious metals produced by Kola MMC are refined at Krasnoyarsk Precious Metals Refinery under a tolling agreement.
In 2017, Kola MMC achieved a higher metal output compared to 2016. The growth was primarily driven by larger converter matte supplies from Polar Division after production reconfiguration.
Smelting
Metals output
Metal 2015 2016
2017
Nickel, t 125,100 131,235 157,396
including from the Company's Russian feedstock
123,335 126,937 155,110
Copper, t 63,075 70,272 80,781
including from the Company's Russian feedstock
60,134 63,542 78,586
Palladium, koz 671 851 1,782
including from the Company's Russian feedstock
640 815 1,731
Platinum, koz 134 173 401
including from the Company's Russian feedstock 122 159 385
2 -foldIn 2017, palladium and platinum output increased in Kola MMC
+ 20% Increased nickel production in Kola MMC in 2017
+ 15% Increased copper production in Kola MMC in 2017
• nickel cathodes; • carbonyl nickel;• saleable nickel concentrate;• copper cathodes;• electrolytic cobalt;• cobalt concentrate;• precious metal concentrates;• sulphuric acid;• crushed converter matte for Harjavalta;• saleable copper concentrate.
Product offering:
Zabaykalsky Krai (GRK Bystrinskoye)
GRK Bystrinskoye (Bystrinsky GOK) is the Company’s 50.01% subsidiary.
The construction of Bystrinsky GOK started in 2013. In October 2017, the Company embarked on the pre-commissioning phase. The facility is expected to switch to normal operation by the end of 2018 reaching its design capacity after 2021.
Bystrinsky GOK is located in the Gazimuro-Zavodsky District of Zabaykalsky Krai, south-east of Gazimursky Zavod in the Ildikan valley (350
This new Nornickel project is the largest in the metals industry in Russia, as its operations include ore mining, concentration and shipment of end products to customers. The volume of ore mined and processed is expected to exceed 10.0 mtpa.
km from Chita). The closest residential areas are Novoshirokinsky, 14 km north-east of the facility, and Gazimursky Zavod, a district capital 25 km to the north-west.
The Naryn – Gazimursky Zavod rail line was built to facilitate mining in the south-east of Zabaykalsky Krai. In 2012, the railway became operational, allowing traffic to Gazimursky Zavod.
Mining facilities
Field/mine Mine type Ores
Bystrinskoye Field Gold-copper-iron
Verkhneildikansky open-pit mine Open pit Gold-copper-iron
Bystrinsky-2 open-pit mine Open pit
Medny Chainik open pit mine Open pit
Yuzhno-Rodstvenny open pit mine Open pit
Mining
Bystrinsky GOK leverages the vast copper, gold and iron ore reserves of the Bystrinskoye Field.
333 mtore reserves at the Bystrinskoye Field
10 mtpaBystrinsky GOK’s planned ore processing capacity
Co
mp
any overview
Strategy o
verviewM
arket overview
Business overview
C
orp
orate g
overnance
Inform
ation fo
r sharehold
ersA
pp
endixes

Annual report • 2017Business overview
• 84 • • 85 •
The Group business Production assets and activities
Concentration
Concentration facilities
• Concentrator
The construction began in 2015. The Concentrator is intended to process rich and cupriferous ores of the Bystrinskoye Field to produce copper, magnetite, and gold concentrates. The key processing stages include crushing, grinding, flotation, thickening, filtration and packaging.
The Concentrator is designed to have two separate processing streams. The first stream is now at the pre-commissioning stage. Its launch will enable the facility to reach 50% of its design capacity.
In 2018, the second stream will be commissioned for the Concentrator to unlock its full design capacity.
Copper concentrate is expected to be exported to China, while magnetite and gold concentrates will be delivered to the Company’s other facilities for further processing.
Сu
25–31 ktThe 2018 production targets for the Chita project
Au
90–110 koz
• copper concentrate;• gold concentrate;• magnetite concentrate;• silver.
Product offering:
Finland (Norilsk Nickel Harjavalta)
Norilsk Nickel Harjavalta became part of the Group in 2007. It focuses on processing the Company's Russian feedstock and nickel-bearing raw materials sourced from third-party suppliers.
Norilsk Nickel Harjavalta has a total nickel processing capacity of 66 ktpa.
The facility uses sulphuric acid leaching, the world best-in-industry solution with the metal recovery rates of above 98%.
Founded in 1960, Harjavalta is the only nickel refinery in Finland and one of the largest similar facilities in Europe.
In 2017 Harjavalta accounted for1
Olderferey Holdings Ltd1
UC Rusal Plc1
Crispian Investments LtdПрочие акционеры
28%Ni
3%Cu
2%PGM
Process flowsheet of Norilsk Nickel Harjavalta
NORILSK NICKEL HARJAVALTA REFINERYRussian nickel-bearing feedstock from Kola MMC
Nickel-bearing feedstock from other companies
Matte/ converter Cu
cakes (semi-product) for Kola MMC and third parties
Co
sulphate
solutions (semi-product) for Kokkola (Finland)
Ni
cathodes
briquet
salts
solutions
Utilisation of refining capacities // % of max
Breakdown of saleable nickel produced at Harjavalta // %
+8 p. p.
2017
2016
2015
91
83
67
In Q2 2017, the refining facilities in Monchegorsk (Russia) started to gradually increase their nickel feedstock supplies to Harjavalta in line with the nickel production reconfiguration strategy. Third-party feedstock supplies included matte and converter matte from Boliden Harjavalta (Finland) (sourced in Q1 only) and nickel salts from other companies (sourced throughout 2017).
Nickel and copper recovery rates improved on the back of a drop in losses of nickel and copper with ferrous cakes.
In 2017, Norilsk Nickel Harjavalta produced 59.7 kt of saleable nickel, up 11% y-o-y. The growth was driven by the reconfiguration of refining facilities and increased nickel feedstock supplies from Kola MMC.
The third party sales of copper in copper cake totalled 13.4 kt, up 40% y-o-y. This was mainly due to the increased processing of Russian feedstock under the production reconfiguration programme.
The production of saleable palladium and platinum in copper cake dropped by 34% and 55% y-o-y, respectively, after imported feedstock had been replaced with Russian raw materials with a lower content of precious metals.
BriquettesCathodesSalts and solutionsPowder
59.7kt
59
24
14
2
Process flowsheet of Norilsk Nickel Harjavalta
Metal 2015 2016
2017
Saleable nickel, t 43,479 53,654 59,716
including from the Company's Russian feedstock 424 19,012 55,021
Copper in copper cake, t 13,048 9,598 13,441
including from the Company's Russian feedstock 0 593 12,329
Palladium in copper cake, koz 78 64 42
including from the Company's Russian feedstock 0 8 35
Platinum in copper cake, koz 33 22 10
including from the Company's Russian feedstock 0 2 6
Finland
Baltic Seathe Gulf
of Finland
St. Petersburg
Helsinki
Harjavalta Plant
1 % from the overall Group production.
Co
mp
any overview
Strategy o
verviewM
arket overview
Business overview
C
orp
orate g
overnance
Inform
ation fo
r sharehold
ersA
pp
endixes

Annual report • 2017Business overview
• 86 • • 87 •
The Group business Production assets and activities
Indian Ocean
Botswana
South Africa
Nkomati Plant
Mine
Johannesburg
South Africa (Nkomati)
Nkomati is a 50/50 joint venture of the Norilsk Nickel Group and African Rainbow Minerals. Nkomati's performance is reflected in financial results using proportional consolidation according to our stake and not reflected in other totals.
Nkomati is located 300 km east of Johannesburg, Mpumalanga Province, South Africa.
It is the only South African company to produce nickel concentrate, which also contains copper, cobalt, chrome and PGM.
Mining
Nkomati has a substantial resource base represented by disseminated copper-nickel sulphide ores with several major ore bodies. The Main Mineral Zone (MMZ) is comprised of a solid sulphide ore body with a relatively high nickel content. The field also contains a Peridotite Chromite Mineralization Zone with a lower metal content vs MMZ and a relatively high chromium content.
The feedstock produced by open-pit and underground mining operations is processed at concentrators using sulphide floatation. The produced concentrates are then further processed at Kola MMC and third-party companies.
In 2017, total ore mined by Nkomati reached 3.5 mt (attributable to the Group’s 50% shareholding) with an average nickel content of 0.31%.
Concentration
Concentration facilities
• MMZ Concentrator with installed capacity of 375 ktpm.
• PCMZ Concentrator with installed capacity of 250 ktpm.
The Norilsk Nickel Group accounted for 8.0 kt of nickel concentrate produced, which is lower than a year ago owing to reduced mining volumes and nickel content in ore processed.
Output at Nkomati1
Metal 2015 2016
2017
Nickel, t 11,350 8,486 8,006
Copper, t 5,301 4,007 4,504
Palladium, koz 53 40 46
Platinum, koz 20 15 20
Key investment projects
PROJECT
SCHEDULE
● 2015
Launch and
commissioning of
Stage 1
● 2016
ͽ Launch of Stage 2
ͽ Pilot-launched of
new tailings pit
● 2017
ͽ Full commissioning
of Stage 2
ͽ 2017 CAPEX of
total project of ca.
RUB 5.2 bn (USD
89 mln)
● 2018
ͽ Decision on
commissioning
Stage 3
ͽ Output of key
assets of new
tailings pit (first
phase)
CAPACITY UPGRADE AND RAMP-UP AT TALNAKH CONCENTRATOR
Norilsk Industrial District, Krasnoyarsk Territory (Polar Division)
Highlights
In April 2014, massive reconstruction of Talnakh Concentrator entered its main stage. In January 2015, Stage 1 was commissioned, followed by the launch of Stage 2 in May 2016. Decision on launching Stage 3 will be made in 1H 2018.
Stage 1 Stage 2 Stage 3
ͽ Maintaining existing capacity at 7.5
mtpa;
ͽ Reconstructing existing floatation
capacities and replacing flotation
machines tha are beyond their
useful lives and building a new
tailings pit (first phase)
ͽ Ramping up capacity from 7.5 mtpa
to 10.2 mtpa
ͽ Upgrading equipment;
ͽ Increasing nickel content in nickel-
pyrrhotite concentrate from 5.8%
to 9.5%;
ͽ Total CAPEX of ca. RUB 33.7 bn
(USD 671 mln)
ͽ Ramping up capacity from 10.2 mtpa
to 18 mtpa;
ͽ Building the second phase of the
tailings pit.
ͽ Investment decision on launching
Stage 3 expected in 1H 2018.
1 Metal in concentrate for sale assuming 50% ownership
Co
mp
any overview
Strategy o
verviewM
arket overview
Business overview
C
orp
orate g
overnance
Inform
ation fo
r sharehold
ersA
pp
endixes

Annual report • 2017Business overview
• 88 • • 89 •
The Group business Production assets and activities
PROJECT SCHEDULE
● 2017
ͽ Production ramp-up to 1.75 mt
ͽ 152 m sinking of ventilation shaft–10 (total of 1.9 km out of 2.1 km)
ͽ 322 m sinking of skip-cage shaft–1 (total of 1.7 km out of 2.1 km)
ͽ Drifting of 4,519 m
● 2018
ͽ 500 kt capacity commissioning
ͽ Completion of ventilation shaft
● 2019
Completion of skip-cage shaft–1 construction
● 2020
Completion of infrastructure construction
● 2024
Production ramp-up to 2.4 mt
Skalistaya mine
Norilsk Industrial District, Krasnoyarsk Territory (Polar Division)
Increasing ore production from 1.8 mtpa to 2.2 mtpa in 2018 and to 2.4 mtpa by 2024 by stripping and extracting rich cupriferous ore reserves of the Talnakhskoye and Oktyabrskoye Fields.
Ore reserves 65.9 mt
2017 CAPEX of ca. RUB 13 bn
(USD 216 mln)
2018–2024 CAPEX of ca.RUB 65 bn (USD 1.1 bn)
Highlights
Average metal content
2.7%Ni Cu 3.1% PGM 8.0 g/t
PROJECT SCHEDULE
● 2017
ͽ 7 km of underground workings completed,
ͽ Capacity ramped up by 250 kt of disseminated ore and 100 kt of
rich ore
● 2019
Capacity commissioning (150 kt of rich ore and 700 kt of сupriferous
disseminated ore)
● 2020–2025
Capacity commissioning (300 kt of сupriferous ore)
Oktyabrsky mine
Norilsk Industrial District, Krasnoyarsk Territory (Polar Division)
Increasing ore production to 5.2 mtpa by 2023 by stripping high-grade, disseminated and сupriferous ores at the Oktyabrskoye Field.
Ore reserves of 96 mt
2017 CAPEX of ca.RUB 4 bn
ca. USD 69 mln
2018–2025 CAPEX of ca.RUB 6.0 bn
(ca. USD 95 mln)
Highlights
Average metal content
1,0%Ni Cu 3,1% PGM 7,6 g/t
PROJECT SCHEDULE
● 2016
300 kt capacity commissioning
● 2017
1.8 km of underground workings completed and 100 kt of new
capacity completed
● 2018
ͽ Capacity commissioning (500 kt of rich ore)
ͽ Upgrading the hoist system at skip shaft No. 3
● 2019
Capacity commissioning (200 kt of rich ore)
● 2020
Capacity ramp-up to 3.8 mt
● 2021
Capacity commissioning (400 kt of rich ore)
Taimyrsky mine
Norilsk Industrial District, Krasnoyarsk Territory (Polar Division)
Increasing ore production from 3.6 mtpa to 3.8 mtpa by 2020 by stripping rich copper-nickel ores at the Oktyabrskoye Field.
Ore reserves of 63.0 mt
2017 CAPEX of ca.RUB 5.4 bn
(ca. USD 93 mln)
2018–2023 CAPEX of over RUB 22 bn
(ca. USD 371 mln)
Highlights
Average metal content
2,3%Ni Cu 3,5% PGM 7.3 g/t
PROJECT SCHEDULE
● 2017
ͽ Power supply system completed at the southern ventilation shaft
ͽ Сa. 3 km of underground workings completed
ͽ 100 kt of rich ore capacity commissioned
● 2018
ͽ Completion of the western backfilling shaft reconstruction
ͽ capacity commissioning (200 kt of сupriferous ore)
● 2019
ͽ Capacity commissioning (175 kt of rich ore)
● 2020
Capacity commissioning (225 kt of rich ore and 200 kt of
disseminated ore)
Komsomolsky mine1
Norilsk Industrial District, Krasnoyarsk Territory (Polar Division)
Increasing ore production to 3.8–4.0 mtpa before 2020.
Ore reserves of 22.9 mt
2017 CAPEX of ca.RUB 1.2 bn
(ca. USD 18 mln)
2018–2022 CAPEX of overRUB 14 bn
(ca. USD 234 mln)
Highlights
Average metal content
1,5%Ni Cu 1,8% PGM 5,5 g/t
MINING PROJECTS
1 excluding Skalistaya mine.
Co
mp
any overview
Strategy o
verviewM
arket overview
Business overview
C
orp
orate g
overnance
Inform
ation fo
r sharehold
ersA
pp
endixes

Annual report • 2017Business overview
• 90 • • 91 •
The Group business Production assets and activities
SULPHUR PROJECT
Copper Plant and Nadezhda Metallurgical Plant (NMP), Norilsk Industrial District, Krasnoyarsk Territory
The Sulphur Project is the umbrella name for an environmental programme to achieve a reduction in aggregate sulphur dioxide emissions across Polar Division by 75% by 2023 vs 2015
2017 CAPEX of ca. RUB 2.2 bn
(ca. USD 37 mln)
Less sulphur dioxide emissions 75% by 2023
Estimated project costs of ca.(according to the feasibility study) USD 2.6 bn
Completion scheduled for 2022
Highlights
1Nadezhda Metallurgical Plant will have new facilities capturing sulphur-rich gases, while sulphur acid will be neutralised with natural limestone, with waste gypsum produced as a result. In addition, a revolutionary continuous copper matte converting unit will be built. Its emissions will also be used to produce sulphur acid.
Nadezhda Metallurgical Plant
2Meanwhile, Copper Plant will see its elemental sulphur production capacities ramped up and the entire converter section shut down.
Copper Plant
Video about the Sulphur Project
Developed by a Russian engineering company and based on domestically produced equipment and technologies
PROJECT STATUS
● 2016–2017
Nadezhda Metallurgical Plant:
ͽ design specifications developed and approved, feasibility
study prepared and approved;
ͽ first long lead equipment arrangements made;
ͽ design documents developed under a contract with
Kazgiprotsvetmet
Copper Plant:
ͽ design specifications developed, feasibility study prepared;
ͽ engineering surveys required to develop key technical
solutions to bring project up to date completed.
New volume of the Maximum Permissible Emission Rates
for the period until 2023 approved. Project approved and
presented at Strategy Day in November 2017.
● 2018 targets:
Nadezhda Metallurgical Plant:
ͽ launching the Implementation stage to prepare engineering
documents;
ͽ obtaining the State Expert Review Board's approval for the
project;
ͽ start tender procedures for long lead equipment and select
an EPC contractor for the project.
Copper Plant:
ͽ Gipronickel Institute preparing engineering documents for
non-standardised equipment;
ͽ launching the Implementation stage to prepare engineering
documents;
ͽ arranging a tender to select a contractor for further
implementation of the project, with on-site preparations.
Continuous copper converting facility:
ͽ Obtaining the State Expert Review Board’s approval for
the NMP project; launching the Implementation stage to
prepare engineering documents, start tender procedures
for long lead equipment and select an EPC contractor for
the NMP project.
The method of double contacting (double absorption)
Sulfuric acid preparation
Sulfuric acid neutralization
A
B
Washing towerSulphur dioxide content in feed gases of 25–30%.
Venturi deviceOxidation of sulphur dioxide to sulphur trioxide over catalyst, and absorption of sulphur trioxide to produce sulphuric acid
Primary cleaning
Fine cleaning
Reduction of SO2 concentration to 12–14%
Feeding sulphuric acid to the lime slurryThe resulting gypsum slurry is then vacuum-filtered
Wet gypsum is disposed of to waste dumps
Limestone grinding
Co
mp
any overview
Strategy o
verviewM
arket overview
Business overview
C
orp
orate g
overnance
Inform
ation fo
r sharehold
ersA
pp
endixes
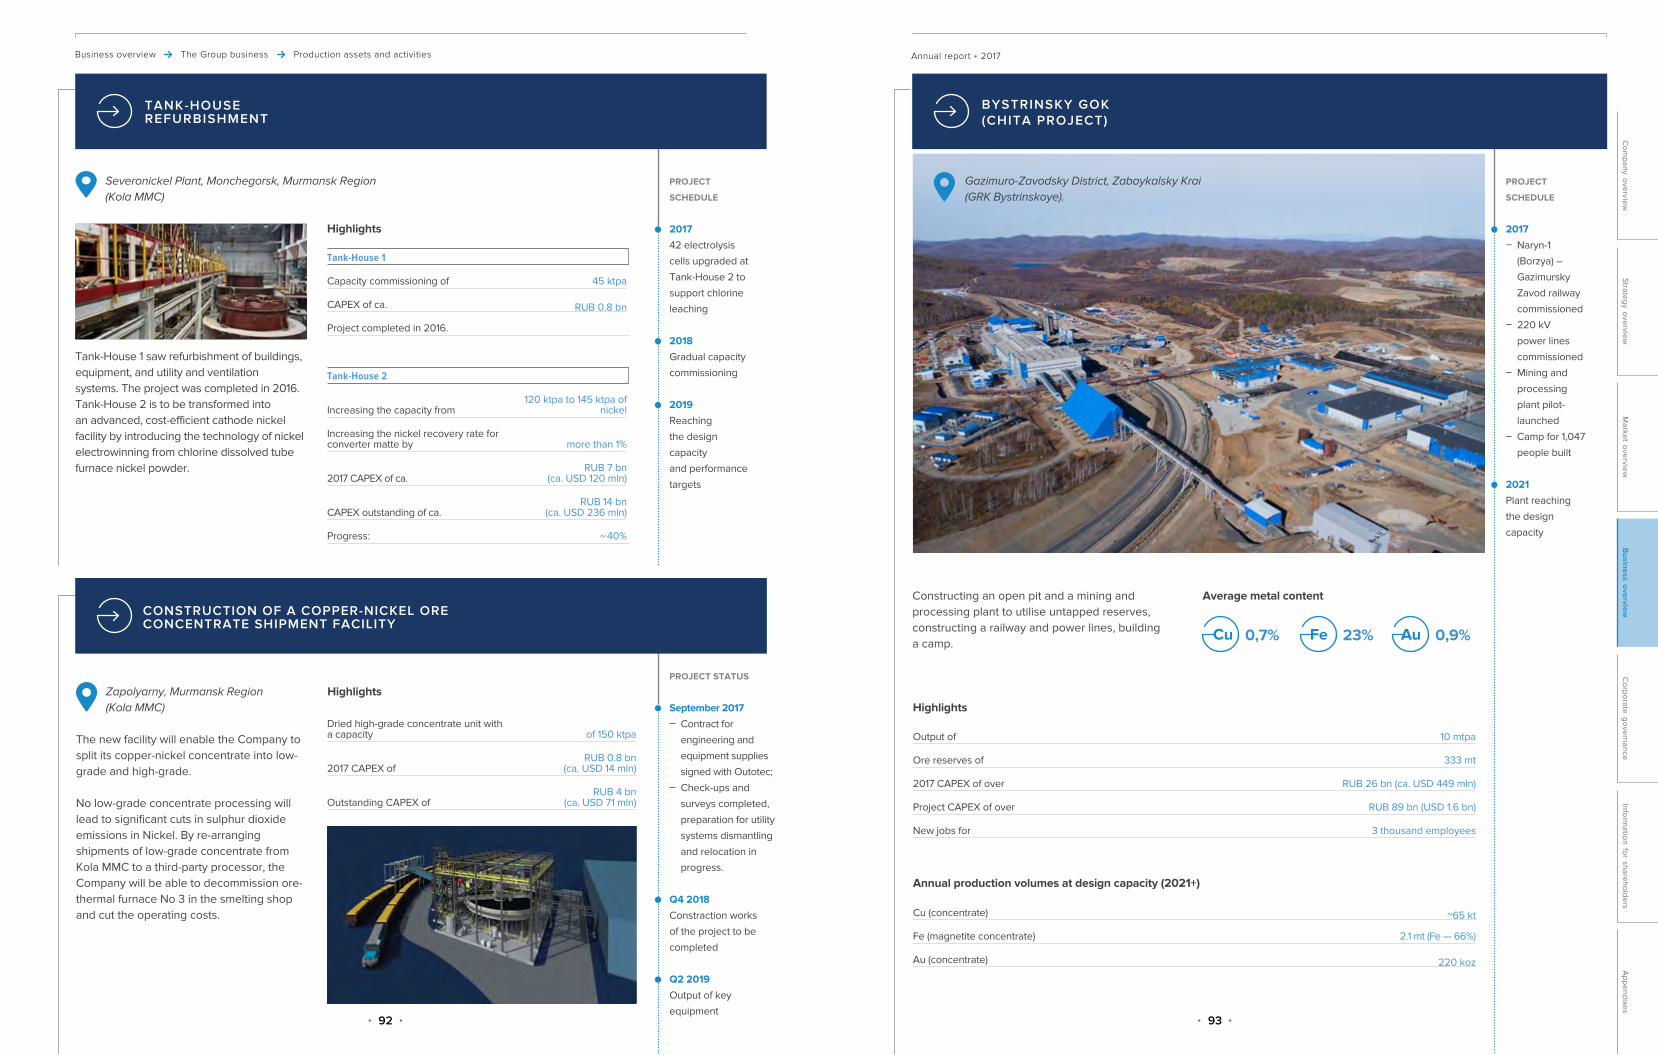
Annual report • 2017Business overview
• 92 • • 93 •
The Group business Production assets and activities
PROJECT
SCHEDULE
● 2017
ͽ Naryn-1
(Borzya) –
Gazimursky
Zavod railway
commissioned
ͽ 220 kV
power lines
commissioned
ͽ Mining and
processing
plant pilot-
launched
ͽ Camp for 1,047
people built
● 2021
Plant reaching
the design
capacity
BYSTRINSKY GOK (CHITA PROJECT)
Gazimuro-Zavodsky District, Zabaykalsky Krai (GRK Bystrinskoye).
Highlights
Constructing an open pit and a mining and processing plant to utilise untapped reserves, constructing a railway and power lines, building a camp.
Output of 10 mtpa
Ore reserves of 333 mt
2017 CAPEX of over RUB 26 bn (ca. USD 449 mln)
Project CAPEX of over RUB 89 bn (USD 1.6 bn)
New jobs for 3 thousand employees
Annual production volumes at design capacity (2021+)
Cu (concentrate) ~65 kt
Fe (magnetite concentrate) 2.1 mt (Fe — 66%)
Au (concentrate) 220 koz
Average metal content
0,7%Cu Fe 23% Au 0,9%
PROJECT
SCHEDULE
● 2017
42 electrolysis
cells upgraded at
Tank-House 2 to
support chlorine
leaching
● 2018
Gradual capacity
commissioning
● 2019
Reaching
the design
capacity
and performance
targets
Severonickel Plant, Monchegorsk, Murmansk Region (Kola MMC)
Tank-House 1
Capacity commissioning of 45 ktpa
CAPEX of ca. RUB 0.8 bn
Project completed in 2016.
Tank-House 2
Increasing the capacity from 120 ktpa to 145 ktpa of
nickel
Increasing the nickel recovery rate for converter matte by more than 1%
2017 CAPEX of ca.RUB 7 bn
(ca. USD 120 mln)
CAPEX outstanding of ca.RUB 14 bn
(ca. USD 236 mln)
Progress: ~ 40%
Highlights
PROJECT STATUS
● September 2017
ͽ Contract for
engineering and
equipment supplies
signed with Outotec;
ͽ Check-ups and
surveys completed,
preparation for utility
systems dismantling
and relocation in
progress.
● Q4 2018
Constraction works
of the project to be
completed
● Q2 2019
Output of key
equipment
TANK-HOUSE REFURBISHMENT
Zapolyarny, Murmansk Region (Kola MMC)
Dried high-grade concentrate unit with a capacity of 150 ktpa
2017 CAPEX of RUB 0.8 bn
(ca. USD 14 mln)
Outstanding CAPEX of RUB 4 bn
(ca. USD 71 mln)
Highlights
CONSTRUCTION OF A COPPER-NICKEL ORE CONCENTRATE SHIPMENT FACILITY
Tank-House 1 saw refurbishment of buildings, equipment, and utility and ventilation systems. The project was completed in 2016. Tank-House 2 is to be transformed into an advanced, cost-efficient cathode nickel facility by introducing the technology of nickel electrowinning from chlorine dissolved tube furnace nickel powder.
The new facility will enable the Company to split its copper-nickel concentrate into low-grade and high-grade.
No low-grade concentrate processing will lead to significant cuts in sulphur dioxide emissions in Nickel. By re-arranging shipments of low-grade concentrate from Kola MMC to a third-party processor, the Company will be able to decommission ore-thermal furnace No 3 in the smelting shop and cut the operating costs.
Co
mp
any overview
Strategy o
verviewM
arket overview
Business overview
C
orp
orate g
overnance
Inform
ation fo
r sharehold
ersA
pp
endixes

Annual report • 2017Business overview
• 94 • • 95 •
The Group business Gas and energy assets
2
1
4
3
Power line
Norilsk
Dudinka
1234
Pelyatkinskoye Gas Condensate FieldSevero-Soleninskoye Gas Condensate FieldYuzhno-Soleninskoye Gas Condensate FieldMessoyakhskoye Gas Field
CHPP-1CHPP-3
Oil storage depot
Ust-Khantayskaya HPP
Kureyskaya HPP
CHPP-2
Gas and energy assets
Norilskgazprom and Taimyrgaz (Nornickel’s gas producers) completed an investment project to build 12 production wells at the Pelyatkinskoye Gas Condensate Field. When commissioned, the wells will fully cover the peak demand for natural gas from the Norilsk Industrial District in winter.
At Ust-Khantayskaya hydropower plant (HPP), a new hydroelectric unit was put in operation as part of the third phase of an extensive programme to replace hydroelectric equipment. In 2012, Nornickel made a decision to replace seven adjustable blade hydroelectric units that had been operating for over 40 years. Improved reliability and service life of at least 50 years are among the key advantages of the new machinery. The first phase of the replacement programme was completed in November 2015, followed by the second phase in January 2016 and the third phase in August 2017, a month ahead of schedule.
2017 MILESTONES
Gas assets
The Company's gas assets operate as a stand-alone business unit focusing on sustainable development of the entire Norilsk Industrial District.
Taimyrgaz
Taimyrgaz operates the Pelyatkinskoye Field, which has Taimyr's largest hydrocarbon reserves. Currently, it is a primary source of natural gas fully covering the needs of the Norilsk Industrial District.
In 2017, Taimyrgaz worked on expanding its gas and gas condensate production and treatment capacity while improving the reliability of its core equipment:• drilling of sidetracks No. 410, 411 and 846
completed;• wells and a gas gathering system constructed and
put in operation at well pad No. 4 followed by an increase in gas output by 1.2 mcm per day;
• well pads No. 5 and 6 installation completed and automatic controls introduced at wells No. 100 and 102 of the Pelyatkinskoye Field to remotely monitor their performance; additional equipment went online to protect the system against pressure drops;
• fire alarm and protection system designed for the Pelyatkinskoye Gas Condensate Field.
Norilskgazprom
Norilskgazprom operates the Messoyakhskoye Gas Field and Yuzhno-Soleninskoye and Severo-Soleninskoye Gas Condensate Fields.
In 2017, the company focused on expanding its gas and gas condensate production and treatment capacity while improving the reliability of its core equipment:• construction of a gas distribution compressor
station completed in Tukhard; the facility will be later handed over to Norilsktransgaz;
• condensate and methanol storage tanks and bunding around them repaired at the Messoyakhskoye Gas Field and Severo-Soleninskoye Gas Condensate Field;
• technical inspections and industrial safety assessments performed, with over 150 machinery units, buildings and structures certified as safe.
Norilsktransgaz
Norilsktransgaz transports natural gas and condensate to consumers in the Norilsk Industrial District.
The company was established as a result of Norilskgazprom's reorganisation in 2016 through the spin-off of the gas transportation system. In 2017, Taimyrtransgaz was liquidated, with its gas transportation assets and personnel transferred to Norilsktransgaz.
Taimyrgaz Norilskgazprom
2017
2016
2015
2014
2013
2,086
2,408
2,164
928
994
1 100
3,014
3,402
3,264
Taimyrgaz Norilskgazprom
2017
2016
2015
2014
2013
98
113
109
2
2
2
100
115
111
Natural gas production // mcm
Gas condensate production // kt
Field
Residual hydrocarbon reserves at licence blocks (A+B categories)
Free gas, bcm
Recoverable condensate, mln t
Norilskgazprom
Messoyakhskoye Gas Field 6.807 –
Yuzhno-Soleninskoye Gas Condensate Field 52.8 0.5
Severo-Soleninskoye Gas Condensate Field 44.0 0.5
Taimyrgaz
Pelyatkinskoye Gas Condensate Field 185.7 6.8
Total residual reserves 289.3 7.9
Natural gas and gas condensate reserves as at 31 December 2017
Co
mp
any overview
Strategy o
verviewM
arket overview
Business overview
C
orp
orate g
overnance
Inform
ation fo
r sharehold
ersA
pp
endixes

Annual report • 2017Business overview
• 96 • • 97 •
The Group business Gas and energy assets
Murmansk
Dudinka port
Murmansk Transport Division
Arkhangelsk Transport Division
Polar Transport Division
Norilsk Airport (100% stake)
Krasnoyarsk River Port (88,77% stake) and Krasnoyarsk Transport Division
Bystrinsky Transport Division
6 heavy-duty ice-class vessels6
aircrafts15
container flatcars118
Lesosibirsk Port (51% stake)
Yenisey River Shipping Company (81,99% stake)
river vessels555
helicopters18
Yermak electric locomotivediesel locomotive
1
Energy assets
NTEK (Norilsk-Taimyr Energy Company)
NTEK engages in power and heat generation, transmission and distribution using the facilities of Norilskenergo (MMC Norilsk Nickel’s branch) and Taimyrenergo. The energy sources include renewables (hydropower) and gaseous hydrocarbons (natural gas).
NTEK supplies electric power, heat and water to Norilsk and all facilities in the Norilsk Industrial District. By its location and operational mode, the local power grid is isolated from the national grid (Unified Energy System of Russia), which means stricter reliability requirements. The company operates five generating facilities: three thermal power plants (TPP-1, TPP-2 and TPP-3) and two hydropower plants. Installed electricity generation capacity of the thermal power plants is 1,205 MW, while the total installed capacity of all the plants is 2,246 MW.
In 2017, thermal power plants generated 4,360 million kWh of power; hydropower plants produced 3,069 million kWh, up 139.5 million kWh against 2016. NTEK managed to bring headwater levels in the water storage reservoirs of its hydropower plants to their multi-year average to match the peak loads during the 2017–2018 heating season.
Ust-Khantayskaya and Kureyskaya HPPs (441 MW and 600 MW of installed capacity, respectively) are the two renewable power generation facilities operated by NTEK.
In 2017, renewables accounted for 38% of total power consumed by the Norilsk Nickel Group and 44% of power consumption in the Norilsk Industrial District.
Power generation in the Norilsk Industrial District in 2017 // %
The investment programme of the Norilsk Nickel Group includes several large-scale priority projects to fully unlock the potential of renewable power sources:• replacement of obsolete hydroelectric units at Ust-
Khantayskaya HPP to make better use of water resources, increase total power output, and improve the reliability of energy supplies to the Norilsk Industrial District;
• retrofitting at TPP-2 units 1 and 2;• replacement of wooden poles with steel poles (a 5 km
section at the plant's phase 1);• introduction of an automated dispatch system at Ust-
Khantayskaya HPP;• construction of a hydrogen generation unit at TPP-2.
In 2017, extensive efforts were invested in improving energy efficiency. As a result, NTEK achieved savings of 100,116 tonnes of reference fuel (units), 44.9 million kWh of electricity and 177,732 Gcal of heat against plan. With 49 initiatives introduced to save on fuel and energy, fuel consumption at the thermal power plants decreased to 281.4 g/kWh in 2017, down by 13.9 g/kWh against plan and 27.7 g/kWh year-on-year.
Bystrinsk Electric Grid Company
Bystrinsk Electric Grid Company was established in 2015 as a construction management business to carry out the investment project of building overhead Kharanorskaya GRES – Bugdainskaya – Bystrinskaya 220 kV power line from the 220 kV Bystrinskaya substation.
In 2017, the company:• completed construction and installation activities;• performed individual and integrated systems tests; • obtained commissioning certificates;• registered title to the facilities.
In late 2017, the overhead line and substation were formally transferred to FGC UES in accordance with the contract for the sale of power grid facilities.
Hydrocarbons (natural gas)Renewable energy sources (hydropower)
56
44
Nornickel Group increased its stake in Krasnoyarsk River Port to 88.77% of the company’s shares. The transactions were part of the strategy of Nornickel’s transportation and logistics function, which focuses on boosting the efficiency and streamlining the management of the Group's transportation assets.
In March 2017, the second berth was put in operation at the transfer terminal in Murmansk, taking its container handling capacity to 1.5 mtpa. According to Marina Kovtun, Governor of the Murmansk Region, “one and a half million tonnes is a large transshipment volume that contributes to new jobs and the overall development of Murmansk Sea Port, helping to attract investors to the region and enhancing Murmansk's position as a key port in the Arctic Zone”.
In late 2017, MMC Norilsk Nickel’s Board of Directors decided to establish Bystrinsky Transport Division to deliver products from, and supplies to, Bystrinsky GOK. The new unit will be operating a 227 km private railway line, which was built under a public private partnership to connect Naryn (Borzya) and Gazimursky Zavod.
2017 MILESTONES
Transportation assets
Transportation and logistics assets
Co
mp
any overview
Strategy o
verviewM
arket overview
Business overview
C
orp
orate g
overnance
Inform
ation fo
r sharehold
ersA
pp
endixes

Annual report • 2017Business overview
• 98 • • 99 •
The Group business Transportation assets
Capitalising on their reliability and sophistication, the Company is well-positioned to address the most difficult tasks in freight deliveries and to ensure undisrupted operations across its facilities.
Nornickel's transportation and logistics assets use various means of transportation and freight forwarding services, responding to freight logistics challenges faced by the Company and its customers.
The Company has a unique Arctic fleet comprising five Norilsk Nickel container vessels and one Yenisei heavy-duty ice-class tanker (ARC 7 under the PMPC classification). The vessels are able to break through 1.5 m thick Arctic ice without icebreaker support.
The Yenisey tanker is used to transport gas condensate from the Pelyatkinskoye Gas Condensate Field to European ports and other destinations. The Company's dry cargo fleet provides year-round freight shipping services between Dudinka, Murmansk, Arkhangelsk, Rotterdam, and Hamburg sea ports while also covering other destinations. In 2017, 66 voyages were made from Dudinka (vs 69 voyages in 2016), including 12 direct voyages to European ports (vs 11 voyages in 2016).
In the reporting year, waterway cargo traffic at the Dudinka port saw a decline, mainly on the back of lower river sand shipments. In 2018, cargo volumes are expected to remain flat at the 2017 level.
Waterway cargo traffic at the Company's transfer terminal in Murmansk (Murmansk Transport Division) was 1.1 mt (vs 0.9 mt in 2016), with 162 vessels handled (vs 139 vessels in 2016), including 113 vessels on coastal voyages (vs 91 vessels in 2016) and 49 vessels on export and import voyages (vs 48 vessels in 2016). The increase in cargo traffic at the transfer terminal is driven by the changes in transshipment volumes of raw materials and end products after Polar Division's Nickel Plant was shut down. In 2018, the upward trend is expected to persist.
In 2017, the Company's own rail car and locomotive fleet carried 526.2 kt of cargo (vs 456.7 kt in 2016). In the reporting period, the terminal handled 14.3 thousand rail cars (vs 12.8 thousand in 2016) and 10.7 thousand road vehicles (vs 10.9 thousand in 2016). The increase in freight transportation by the Company's own rail car and locomotive fleet was due to the growing volumes of converter matte and, consequently, return traffic of empty cars.
During the upgrade of the Norilsk Airport in the summer of 2017, NordStar Airlines managed to ensure uninterrupted air services to passengers in the Norilsk Industrial District. Thanks to a professional and structured approach to the airport modernisation, the air carrier:• organised transfer of passengers and their baggage;• introduced a ticketing scheme to minimise anti-trust,
transportation and social risks;• developed a pricing methodology to make multi-
flight air transportation with light aircraft more affordable to passengers.
Norilsk Avia responds to industrial and social needs of the Norilsk Industrial District and the Dolgano-Nenets Municipal District of the Taimyr Peninsula. The company provides air transportation services related to operations of the Norilsk Nickel Group, emergency air medical services, search-and-rescue operations, and local passenger traffic..
NordStar Airlines is a rapidly developing aviation project launched on 17 December 2008, when the Board of Directors of Taimyr Air Company (a wholly owned subsidiary of MMC Norilsk Nickel) resolved to establish Moscow Branch of Taimyr Air Company along with the NordStar Airlines brand.
The company's fleet comprises 15 aircraft: nine Boeings 737-800, one Boeing 737-300 and five ATRs 42-500. With passenger traffic in excess of 1 million people per year, NordStar Airlines annually reaffirms its status of a major air carrier in the Siberian Federal District and nationwide. The air company's current route network covers over 30 cities in Russia and the CIS. Each year, NordStar operates seasonal charter flights from Moscow, St Petersburg and other cities.
The cost growth in 2017 was driven by investments in the modernisation of the Norilsk Airport as part of a nationwide target programme, acquisition of a portal crane for Polar Transport Division and machinery for the modernised terminal in Murmansk, along with scheduled repairs of sea vessels in Murmansk Transport Division and helicopters operated by Norilsk Avia.
Investments in transportation and logistics assetsThe cost growth in 2017 was driven by investments in the modernisation of the Norilsk Airport as part of a nationwide target programme, acquisition of a portal crane for Polar Transport Division and machinery for the modernised terminal in Murmansk, along with scheduled repairs of sea vessels in Murmansk Transport Division and helicopters operated by Norilsk Avia.
In 2017, Murmansk Transport Division completed the reconstruction of its transfer terminal. The programme provided for capital repairs of Berth No. 1, which are to be completed in 2018. Its scope also covers construction and fit-out of safety facilities to be continued in 2018. The Company purchased new cargo handling equipment and hoisting gear and also retrofitted some of its vessels. Solvo.TOS, a new process control system, was commissioned to optimise container handling procedures at the terminal. An information system for automation was also introduced to manage repairs of port machinery and equipment. Murmansk Transport Division plans to continue its IT improvement programme in 2018. Cargo transportation in 2017
Dry cargo transportation by the Company's fleet // mtpa
Nornickel
Third-party customers Всего
2017
2016
2015
2014
2013
1.1
1.1
1.0
0.2
0.1
0.1
1.3
1.2
1.1
Nornickel
Third-party customers Всего
2017
2016
2015
2014
2013
102
115
114
60
80
49
162
195
163
Transportation by Yenisey tanker // ktpa
Northern Sea Route Yenisey
2017
2016
1.2
1.2
2.0
2.73.2
3.9
Waterway cargo traffic at Dudinka port // mtpa
2017
2016
1.1
0.9
Waterway cargo traffic at Murmansk terminal // mtpa+15% traffic growth of the Company's own rail car and locomotive fleet in 2017
Cost item
2016
2017
USD mln RUB bn USD mln RUB bn
Investments in transportation and logistics assets, including:
34.3 2.3 46.2 2.7
Capital construction 17.9 1.2 22.2 1.3
New equipment 10.4 0.7 15.4 0.9
Other costs 6.0 0.4 8.6 0.5
Investments in transportation and logistics assets
Given the exceptional location of our production facilities in relation to key supply bases and distribution markets, transport infrastructure and freight logistics are a primary focus for Nornickel. C
om
pany o
verviewStrateg
y overview
Market o
verviewB
usiness overview
Co
rpo
rate go
vernanceInfo
rmatio
n for shareho
lders
Ap
pend
ixes

Annual report • 2017Business overview
• 100 • • 101 •
The Group business Production and sales
At Polar Transport Division (Dudinka port), the Company completed the first phase of repairs at Berths No. 4 and 5 and engineering surveys for the repair of Berth No. 3 in 2017. The repair programme to prevent the moorage wall destruction is scheduled to be completed in 2018. The Company modernised a fire water line at the log yard and introduced an integrated safeguarding system at port facilities. Additionally, two Liebherr mobile cranes and a mobile crane boom were repaired, two Liebherr crane booms were purchased for replacement in 2018, and a hangar was acquired to repair mobile cranes. The Company also purchased 10 units of road vehicles and cargo handling equipment.
In 2017, Yenisey River Shipping Company continued working on shipbuilding at Krasnoyarsk Ship Repair Yard and engineering design of new shipbuilding facilities. The project was launched in 2017 to provide the Company with its own river vessels to replace
One of the Company’s objectives is to make sure its product range is in line with the current and prospective metals demand.
Over the last three years, Nornickel increased nickel supplies to segments other than stainless steel production by 32% (the 2017 supplies exceeded 100 kt of nickel), which was achieved by leveraging a focus strategy to boost sales to Chinese and Russian alloy and special steels makers, as well as by strengthening positions on China's electroplating market through the product range optimisation and extensive customer training. The Company also fostered cooperation with world-leading companies in the batteries segment.
Norilsk Nickel Harjavalta is considered one of world’s foremost producers of nickel used to make precursors (semi-products essential for manufacturing the cathode material that forms part of batteries). Norilsk Nickel Harjavalta is uniquely flexible when it comes to manufacturing, which enables it to factor in consumer preferences in developing its product portfolio.
retiring ships. The USD 3.4–5.1 mln (RUB 0.2–0.3 bn) project is expected to be completed in 2019. An automatic fire extinguishing sprinkler system was installed in the administrative building. The work is ongoing to improve onshore infrastructural facilities and increase the level of traffic safety by installing CCTV and fuel monitoring systems on vessels.
In 2017, the Company continued improving logistics processes in its transportation facilities and units. For Krasnoyarsk River Port and Lesosibirsk Port, it was the first navigation period to use the Automated Cargo Logistics Management System (ACLMS) as a master management system. Despite certain challenges, the introduction of ACLMS improved coordination between transshipment ports, carriers and end customers and provided a single reporting platform for freight transportation by river. These efforts will continue.
Norilsk Nickel Harjavalta's nickel sulphate is rightly considered the industry benchmark and is widely used in battery manufacturing. The Company plans to proactively market briquettes, which are traditionally supplied to stainless steel manufacturers, among battery and precursor producers.
In response to strong growth of demand by battery manufacturers, the Company is upgrading its nickel powder packaging capacities in order to broaden the range of packages and create individual solutions based on consumer preferences.
The Company considers joint ventures to produce nickel- and cobalt-bearing value-added products for the battery segment to be a promising direction for expanding the product range and increasing production volumes.
Production and salesIn 2017, Nornickel maintained its reputation as a reliable supplier of high quality products. The integrated index of customer satisfaction with the Company's products and services matched the criterion for positive performance.
Product range
Ni
Co Cu 4Na2SO
NaCl
H2SO4 Ni Co
Pt
Pd Rh
Ir
Ru
Ag
Au
Asia AmericasEuropeRussia
Cu Se
Te
S
1 Refining of precious metals manufactured from Polar Division's and Kola MMC's feedstock under a tolling agreement
Polar Division Kola MMC
Norilsk Nickel Harjavalta Oy
Gulidov Krasnoyarsk Non-Ferrous Metals 1
End product manufacturing
Key consumer industries
Types of products
Sales markets
Construction: Cu
Transport: Cu
Heavy engineering: Cu
Production of steel and non-ferrous metal alloys: Te, Ni, Co
Stainless steel (200 and 300 series): Ni
Non-ferrous metallurgy: Te, Na2SO4, NaCl
Power grids: Cu
Electronics manufacturing: Pt, Pd, Ru, Ag
Electrical engineering: Se, Co, Rh, Ir, Ag
● Copper ● Tellurium, Selenium ● Sulfur ● Nickel, Cobalt ● Copper ● Sodium sulfate and chloride ● Sulfuric acid ● Nickel ● Cobalt ● Platinum, Palladium ● Iridium, Rhodium ● Ruthenium ● Silver, Gold
Electroplating: Ni, Co
Li-ion/Ni-MH batteries: Ni, Co
Additives and catalysts: Co
Rubber vulcanising: S
Spark plugs: Ir
Pharmacology: Na2SO4, NaCl
Medicine equipment: Pt
Jewellery manufacturing: Pt, Pd
Machine building and consumer goods production: Cu
Investments: Au
Photovoltaics and thermoelectrical materials: Te
Rubber industry: Te
Animal feed and fertilisers: Se, S, H2SO4
Glass industry: Se, Te, Rh
Synthetic detergents production: Na2SO4, NaCl
Pulp and paper, textile, leather industry: Na2SO4, NaCl
Chemical industry: Se, S, Co, H2SO4, Pt, Pd, Rh, Ir, Ru
Co
mp
any overview
Strategy o
verviewM
arket overview
Business overview
C
orp
orate g
overnance
Inform
ation fo
r sharehold
ersA
pp
endixes

Annual report • 2017Business overview
• 102 • • 103 •
The Group business Production and sales
Sales strategy
Sales, along with production, have traditionally been a key value adding line of Nornickel’s business.
When it comes to nickel products, the sales strategy focuses on achieving a balance between supplies to stainless steel manufacturers and to other industries.
As the world’s largest producer of palladium, the Company continues to implement the strategy of entering into direct long-term contracts with end consumers to ensure sustainable and strong demand for platinum group metals.
One of Nornickel’s priorities is stable supply amid the growing demand for PGM:• The Company refused to launch a marketing
programme aimed at promotion of palladium in jewellery manufacturing in order to make it clear to the market that it intends to focus on supplying palladium for the automotive industry;
• In 2016, the Company established the Global Palladium Fund (GPF). In 2017, the GPF built Pd reserves of around 0.55 mln oz to safeguard supplies for the increasing demand from key consumers that are the Company’s customers in 2018 and onwards (mostly from the automotive industry). The reserves were formed from purchases
of metal from third parties and the Company itself in accordance with consumer requirements to the product range.
To boost sales premiums and liquidity, Norilsk Nickel registers its products on the world’s major exchanges, including the London Metal Exchange and Shanghai Futures Exchange.
Customers in Russia and the CIS
Customers in Europe
Customers in Asia
Customers in China
Customers in the USA
NORMETIMPEX, Russia
Norilsk Nickel Harjavalta Oy Finland
Metal Trade Overseas AG Switzerland
Polar Division of MMC Norilsk Nickel Russia
Kola MMC, Russia
Norilsk Nickel Asia, Hong Kong
Norilsk Nickel Metals Trading,КНР
Norilsk Nickel USA, USA
EuropeAsiaNorth and South AmericaRussia and CIS
56
23
14
7
Sales by region // %
Research and development
Nornickel is one of the smartest companies in Russia. It ranked first among the Top 15 Russian companies by value of intellectual capital (USD 22.4 bn), according to the Baker Tilly accounting and consulting firm.
2017 MILESTONE
The Group's main R&D facility is Gipronickel Institute, one of Russia's largest research and engineering hubs for mining, metallurgy, concentration and processing of minerals that develops a wide range of research and technology products.
In 2017, in addition to Gipronickel Institute, the Company used over 35 domestic and foreign research and engineering companies and also Russian universities, including: IPKON (Moscow), Siberian Federal University (Krasnoyarsk), VNIMI (St Petersburg), Outotec (St Petersburg), Norilsk State Industrial Institute (Norilsk), Mekhanobr Engineering (St Petersburg), NPO Atmosfera (Perm), VNIIR (Kazan), MIPT (Moscow), Institute of Chemistry and Technology of Rare Elements and Mineral Raw Materials (Apatity), SPb-Giproshakht (St Petersburg), St Petersburg Mining University (St Petersburg), Uralmekhanobr (Yekaterinburg), RZD Logistics (St Petersburg), etc.
Nornickel's R&D activities mainly focused on research, technological development, and feasibility studies under the Company's updated strategic development plan.
The Company also carried out its operating efficiency programme for 2015–2017 aimed at finding unique solutions to streamline the mining planning process, increase overall recovery rates for nickel, copper, cobalt and PGM, re-process secondary resources (tailings, copper slags, and nickel bearing pyrrhotite with a low nickel content), and optimise the work-in-progress inventory levels. Other programmes included upgrade of nickel and cobalt production technologies at Kola MMC, improvement of product quality and optimisation of production costs.
R&D and feasibility studies financing // USD mln
2017
2016
2015
2014
2013
4.5
4.1
3.0
+9.8%
The Company supplies its products to
34 countries
Company Sales
Co
mp
any overview
Strategy o
verviewM
arket overview
Business overview
C
orp
orate g
overnance
Inform
ation fo
r sharehold
ersA
pp
endixes

Annual report • 2017Business overview
• 104 • • 105 •
The Group business Research and development
Supply management
The Company's supply management units are tasked with ensuring timely, adequate and comprehensive supplies as required for uninterrupted operations, which means procurement on the best possible terms.
With its diverse businesses (from construction of Bystrinsky GOK to reconstruction of Norilsk Airport in the Far North) and geography of operations, the Company faces many challenges it has to address in terms of procurement.
The procurement plan covers 48 aggregated categories – from construction and installation services and equipment to food supplies. For purchases of general-purpose industrial machinery and equipment only, the Group has set up some 200 sub-categories.
The supplies are shipped along the Yenisey River and the Northern Sea Route using the Company’s own fleet during the navigation season, as well as by air. There is no railway or motorway connection between the Taimyr Peninsula and mainland Russia, which makes delivery by land to the Norilsk Industrial District impossible.
Supply management operations include:• requirements planning and supply management; • procurement.
Requirements planning and supply managementAccurate planning and availability of stock are key to uninterrupted operations at Nornickel. At the same time, the Company needs to focus on optimising inventory, to minimise its working capital. Idle inventory, if any, is assessed based on production needs. Depending on the results, the Company decides whether it is going to be:• used in production as and when needed; • sold; • written off and disposed of.
Overall, 2017 saw the Company implement a set of optimisation measures with respect to requirements planning and meeting the needs of its key productions sites. Changes in the structure of production assets had an impact on the volume and composition of the Company’s inventory. At the same time, Polar Division and Kola MMC, the Company's major productions sites, decreased their inventory for core operations by 3.06% to an absolute level of USD 380 mln (RUB 22.2 bn), while also fully meeting the needs of their production, repair and other units.
The Company needs to focus on optimising inventory, to minimise its working capital. Idle inventory.
• feasibility study to choose the optimal design for the Company’s copper refining facilities (stage 2);
• operating procedures for a feasibility study on refining non-ferrous and precious metals.
Results in key R&D areas in 2017
In 2017, Nornickel became Company of the Year in competitive procurement and won the Grand Prix at the Procurement Leaders Awards, with its project for an end-to-end transformation of the procurement function receiving the highest commendation from the expert community. Supply management is going to play the key role as the Company’s 2020 Programme for Improving Performance and Reducing Per Unit Costs unfolds.
KEY DEVELOPMENTS IN 2017Company Development Strategy
Production
Environmental protection
Mining:• adjusted design documents at the mines;• feasibility study on building an underground crushing section at Skalistaya
mine;• audit of mechanical earth models of Polar Division mines (stage 1);• feasibility study on using tailings for backfilling on Talnakh mines and on
providing Polar Division with limestone and cement.
Concentration:• project on producing high-grade and low-grade concentrate at Kola MMC’s
concentrator and organising shipments of the high-grade concentrate to be accepted and processed at Nadezhda Metallurgical Plant of the Company's Polar Division;
• adjusted operating procedures for ore enrichment at the Bystrinskoye Field;• adjusted operating procedures for simultaneous processing of disseminated
and cuprous ore mixture at Stage 3 of the Talnakh Concentrator.
Smelting:• adjusted operating procedures to design nickel production facilities at Kola
MMC based on the chlorine leaching technology, which will improve the tank-house-2 capacity to 145 ktpa of cathode nickel;
• adjusted operating procedures to design continuous converting facilities at Nadezhda Metallurgical Plant;
• development of operating procedures to design the upgrade of copper production based on the new roast–leach–electrowin technology at Kola MMC;
• development of operating procedures and feasibility study for the process to neutralise sulphuric acid with natural limestone.
• development of operating procedures and feasibility study to produce elemental sulphur;
• inventory of air emissions and development of draft limits for maximum permissible emission at Polar Division’s core production facilities;
• comparison of the technology for producing sulphuric acid and neutralising it with natural limestone vs elemental sulphur production technology used at Nadezhda Metallurgical Plant.
Co
mp
any overview
Strategy o
verviewM
arket overview
Business overview
C
orp
orate g
overnance
Inform
ation fo
r sharehold
ersA
pp
endixes

Annual report • 2017Business overview
• 106 • • 107 •
The Group business Supply management
Despite an increase in production assets, the Group's inventory as per the RAS statements also dropped by 3.5% y-o-y to USD 701 mln (RUB 42.5 bn).
At the planning stage, the Company defines health, safety and environment, as well as other mandatory and optional product requirements, including availability of certificates, permits, and licenses. Further on, when procurement procedures are under way, suppliers’ proposals are checked for compliance with the Company's requirements.
Procurement
All procurement activities in the Company rely on the regulated procedures and policies and are in full compliance with Federal Law No. 223-FZ On Procurement of Goods, Work and Services By Certain Types of Legal Entities dated 18 July 2011, as well as Business Ethics Code, Anti-Corruption Policy, Regulation on the Product Procurement Procedure, as amended in 2016, and other regulatory documents of the Company.
The Company develops procurement policies for select materials and supplies that establish binding principles and approaches to procurement in specific product groups. In 2017, the Company purchased ca. 33% of supplies for core operations based on category procurement policies (24% in 2016, 17% in 2015).
Procurement activities can be either centralised or organised independently by the Head Office, branches or Group enterprises. Depending on the expected purchase price, procurement can be organised either as a bidding procedure (tender), simple procurement, or simplified procurement.
Procurement procedures may involve collective procurement bodies, such as the tender committee, tender commissions of the Head Office, procurement and tender commissions of the branches and Group companies. In 2017, the tender committee and tender commissions of the Head Office that are in charge of the most expensive procurement items, full-cycle projects and IT products, carried out procurement for over USD 325 mln (RUB 19 bn). The Company’s tender committee focuses on improving procedures for identifying reliable suppliers of quality products at a fair market value.
Nornickel provides support to tenders run by the Company's Russian subsidiaries and branches. In 2017, the Company oversaw tender procedures to purchase services for over USD 343 mln (RUB 20 bn).
In 2017, the Company signed over 4,000 contracts for centralised procurement of materials and equipment worth around USD 1.6 bn, with a total price decrease of 5%, which is below the levels recorded by the Federal State Statistics Service.
At Nornickel, the procurement process is certified for compliance with ISO 9001 and ISO 14001.
In the reporting year efforts focused on developing and implementing procurement guidelines, and harmonising the regulatory procurement framework across Russian subsidiaries and branches, including services procurement, were continued.
701
USD mlnthe Group's inventory in 2017
–5%total price decrease in the procurement of materials and equipment
Procurement automation and stronger competitionNornickel has put in place SAP SRM, an automated solution for supplier relationship management. The Company also widely uses independent bidding platforms, such as Fabrikant.Ru or B2B-Centre. These solutions help improve the supplier selection transparency and competitive environment when procurement procedures are under way.
Nornickel pays close attention to fostering ties with reliable domestic suppliers and contractors. Foreign suppliers are mainly engaged for delivering unique equipment or systems that do not have Russian alternatives.
As at the end of 2017, domestic suppliers outnumbered foreign ones by 14 to 1.
Preventing corruption and other misconductNornickel’s Corporate Security Unit evaluates the business reputation, reliability and solvency of potential counterparties to mitigate risks.
To prevent potential procurement misconduct and secure maximum benefit through unbiased selection of the best proposal, Nornickel adheres to the following rules:• procurement relies on the role allocation principle
(procurement owner, customer and secretary of a collective procurement body);
• business or technical and business proposals of qualified suppliers are compared based on objective and measurable criteria approved prior to the request of proposals stage;
• the results of the qualification-based selection and the winner are approved by the collective procurement body comprising representatives from various functional units of the Company.
The purchases made by certain subsidiaries of Nornickel are subject to Federal Law No. 223-FZ On Procurement of Goods, Work and Services By Certain Types of Legal Entities dated 18 July 2011. As part of anti-corruption efforts undertaken by the Company, these subsidiaries must disclose additional details in the unified information system, including:• annual volume the customer is required to procure
from small and medium businesses; and• the number and total price of contracts awarded
to small and medium businesses.
Number of the Company's suppliers and contractors
domestic
foreign
Всего
2017
2016
2015
2014
2013
513
540
505
37
38
40
–3.5%
Co
mp
any overview
Strategy o
verviewM
arket overview
Business overview
C
orp
orate g
overnance
Inform
ation fo
r sharehold
ersA
pp
endixes

Annual report • 2017Business overview Corporate resposibility HR and social policy
• 108 • • 109 •
Co
mp
any overview
Strategy o
verviewM
arket overview
Business o
verview
Co
rpo
rate go
vernanceInfo
rmatio
n for shareho
lders
Ap
pend
ixes
HR and social policy
2017 MILESTONE
In its rating HeadHunter recognised Nornickel as Russia’s top employer in the metals and mining industry. This high ranking came as a result of the Company's efforts to build a strong team of professionals.
On top of that, MMC Norilsk Nickel was named the fourth most popular employer with job seekers.
In 2017, more than 3,500 managers, specialists and workers from the Group's 60 facilities took part in the corporate culture development training sessions and forums designed and organised by the Social Policy Department. The Company established working groups to develop and roll out business initiatives on improving systems and processes. In 2018, the programmes are set to have a wider coverage.
In the reporting year, the Company launched a series of personnel engagement management initiatives, which included: • providing employees with an opportunity
to maintain an ongoing dialogue with the management;
• assessing the staff motivation to achieve targets and approving changes in the business processes and working conditions based on objective data;
• identifying tools to enhance the competitive edge in human resources and boost the Company's appeal as an employer.
Over 73,000 employees from the Company's 32 facilities and Russian subsidiaries took part in the personnel engagement survey.
Our social and HR policy prioritises social stability of the workforce deployed across the Group’s companies and geography.
Manifesto of our values
Staff composition
In 2017, the Norilsk Nickel Group's average headcount totalled 78,000 people in Russia and 1,000 people abroad.
Most of the Russia-based employees (69%) work in Norilsk and the Taimyrsky Dolgano-Nenetsky Municipal District. Another 17% of the Group's Russian headcount work on the Kola Peninsula.
Evolution of the Norilsk Nickel Group’s average headcount
Region/country of operation 2015 2016
2017
Russia 81,637 81,081 77,991
Africa 1 650 586 605
Europe 307 311 326
Asia 14 13 13
North America 10 10 10
Australia 6 5 5
Total 83,624 82,006 78,950
A decrease in the average headcount in 2017 was due to the disposal of non-core assets and implementation of a programme to improve labour productivity and reduce costs.
Gender breakdown across Russian operations // %
Corporate resposibility
Strategic focus
One of the Company’s focus areas is to nurture corporate culture aimed at boosting employee performance and commitment to delivering against targets.
We view our people as the Company's key asset and keep investing in their professional and personal development to make sure we are on track with the accomplishment of our mission.
To further increase the efficiency of the corporate culture development programme, we integrated our values into the key HR management processes: • recruitment (we used values to set targets
and train the managers and HR staff in job interviewing);
• assessment (we launched a 360-degree review for top executives involved in value-based management);
• development (we developed an Our values training module, Program of the Workshop on the Application of the White Paper1 and conducted a number of value assignment business games and a hands-on training session in Value-Based Management);
• succession planning (we aligned the training programme with our values).
„Our key value is reliability. Throughout the Company's history, we have delivered on our commitments in production and social areas. Today, Nornickel is working hard to develop social infrastructure and digital economy, provide support to indigenous peoples and national minorities of the North, and markedly improve the environment across its footprint – from Taimyr to the Kola Peninsula and Zabaykalsky Krai. We joined forces with local authorities and communities to support the volunteer movement, provide grants to socially important projects, and aide charitable foundations, sports organisations and artistic associations. Over the last years, the unique expertise and know-how we have acquired have gained wide recognition from the Russian expert community. I hope that this annual report will help us share this experience with the industry and contribute to the enhancement of best domestic practices in corporate social responsibility”.
Larisa ZelkovaSenior Vice President for HR, Social Policy and Public Relations
MaleFemale
71
29
Taimyr PeninsulaKola PeninsulaKrasnoyarsk Territory (excl. Taimyr Peninsula)Zabaykalsky KraiMoscow and other Russian regions
69
17
5 4 5
Headcount breakdown by Russian operations // %
73 thousand of employeesfrom the Company's 32 facilities and Russian subsidiaries took part in the personnel engagement survey
1 The White Paper is a corporate publication that tells us what kind of culture we are building; what our common values are and what do they mean; how we achieve our goals. It is a desk assistant to the Company's management, a basic guide to corporate culture, a collection of techniques and practices, motivating examples.

Annual report • 2017Business overview Corporate resposibility HR and social policy
• 110 • • 111 •
Co
mp
any overview
Strategy o
verviewM
arket overview
Business o
verview
Co
rpo
rate go
vernanceInfo
rmatio
n for shareho
lders
Ap
pend
ixes
Recruitment
In 2017, the Company focused mainly on increasing its visibility as an employer and staffing GRK Bystrinskoye.
GRK Bystrinskoye, Russia's largest mining and processing facility, successfully completed its ambitious recruitment exercise.
As part of the large-scale recruiting campaign, we informed over 9 million people from 26 Russian regions about the launch of GRK Bystrinskoye providing advice on the working conditions and available jobs. To stay in touch with the job seekers, the Company set up a dedicated toll-free hotline. In nine months, we hired 1,900 highly qualified workers, engineering service officers (ESOs) and managers.
Partnerships with universities
To make jobs in the metals and mining industry more attractive for young people and help develop skills in personnel, Nornickel pays special attention to collaboration with Russia universities. In 2017, the Company invited 400 students from dedicated universities to take part in its Career Start-Up programme. Nornickel was the first company in the Russian mining industry to engage students and graduates in solving real business tasks.
The students obtained practical skills as part of their apprenticeship at the Company's major facilities along, while also gaining unique knowledge by taking part in the Conquerors of the North business game. In the span of two summer months, the programme participants were offered to take a hands-on training experience and compete in a multi-stage business game with a focus on team work to try and tackle some of the Company’ real tasks. The Company engaged 20 of its top experts to provide mentorship support to the participants.
Nornickel places a strong emphasis on engineering education in Russia and partakes in the promotion of relevant professions among school graduates and university students. In 2017, we supported Cup MISIS Case and Cup Technical, case-solving championships among students of Russian technical universities. During the contest, students dealt with cases related to Nornickel's operations gaining insights into the Company's business processes.
Assistance programme
Due to the remote location of MMC Norilsk Nickel's industrial sites, the Company is actively engaging employees from other Russian regions. To help them settle in faster, we launched a programme called Assistance to New Employees in Adapting to the New Place of Residence in Norilsk and the Taimyrsky Dolgano-Nenetsky Municipal District. The programme does not only target highly qualified specialists and managers, but also focuses on attracting young talents and skilled workers to fill positions on the skills shortage list. Today, the programme covers 1,715 of the Company's employees, including 267 new participants who joined in 2017. With this programme the Company seeks to provide comfortable living conditions for the invited employees and reimburse their relocation and resettlement costs.
In order to identify and recruit the best candidates to fill open vacancies and reduce staff turnover, in 2017, the Company started using the latest methods of employee evaluation and capacity assessment. Those help measure abilities and risk appetite of each individual, which are important in recruiting candidates to positions with a high level of exposure to occupational hazards. They are also helpful in obtaining information about each employee’s motivating and demotivating factors. The project was first piloted at GRK Bystrinskoye where 100% of new employees (all the way up from workers to managers) were recruited following successful assessment. The Company selected candidates based on their learning curve, teamwork skills and low risk appetite, which are essential for all staff categories, from top management to workers. Experience shows that this method helps reduce onboarding time for employees and minimise occupational safety risks.
Personnel development
Respect for employees and their rights lies at the heart of Nornickel's business. The protection of human rights is reflected in a number of the Company's documents, including Business Ethics Code, Personal Data Policy, Anti-Embezzlement Regulation and Human Rights Policy.
Talent pool
In 2017, the Company continued rolling out its talent pool management system to include the process of recruiting lower and middle line managers. The relevant approaches are set out in the Talent Pool Regulation of MMC Norilsk Nickel. In 2017, the Company primarily focused on designing and implementing training and development programme for the talent pool and their mentors, with 99 mentors fully trained during the year. Also, the Company set up a new programme for the talent pool. The comprehensive training system offers a combination of classroom and online sessions to enable transition from easy-to-follow on-the-job programmes to a free choice of resources for professional development.
In 2017, the Company started assessing the capacity, current performance and development prospects of its middle and top managers, with 81 managers from Kola MMC, Pechengastroy, Norilsknickelremont and Norilsk Support Complex listed as those with a high career growth potential in 2017.
To define priority development areas for its management, at the end of 2017, the Company ran a 360-degree competency review using an updated competency model built around values and management competencies. Based on the review results and relevant feedback, each participant could choose the right path for development and select required tools and methods using a dedicated roadmap for development activities. In 2018, the training programme for the Head Office’s managers will be based on their individual development plans.
Financing under the Assistance programme // USD mln
2017
2016
2015
2014
2013
5.1
4.3
3.3
+18.6%
The reporting year saw the Company complete its project to assess professional competencies of managers in the Power and Mechanics functional units. As part of the assessment, 250 managers took specially designed tests that helped identify areas for their professional development.
In 2018, Nornickel will partner with Russia’s leading universities and institutions to organise training for all unit managers giving them an opportunity to learn more about the cutting-edge technologies and best practices. The training programmes will enable managers to enhance their managerial and professional competencies at the leading business schools.
In 2017, we proceeded with our project to automate talent pool management using SAP HCM. The new system will help standardise talent pool management methods across the Company's operations, consolidate relevant data into a shared database, boost efficiency and streamline approaches to talent pool building. Its other advantages include:
• reduced labour input required to collect and consolidate data and control talent pool building across our key production assets;
• reduced labour input required to timely identify and recruit candidates to fill positions with the highest priority in succession planning;
• standardised talent pool building process at Russian subsidiaries, an option to transfer the process to the shared service centre, procedure compliance control within the system;
• full and reliable information available at every stage of the talent pool building cycle;
• engagement of mentors and unit heads, streamlined talent pool assessment and data collection procedure;
• shared information environment for all stakeholders, additional feedback opportunities for employees;
• timely planning of talent pool development, increased hiring from the talent pool.

Annual report • 2017Business overview Corporate resposibility HR and social policy
• 112 • • 113 •
Co
mp
any overview
Strategy o
verviewM
arket overview
Business o
verview
Co
rpo
rate go
vernanceInfo
rmatio
n for shareho
lders
Ap
pend
ixes
The operating efficiency training
In September 2017, 55 managers embarked on the operating efficiency training at Moscow's Skolkovo School of Management. The project seeks to develop key management competencies with a focus on operating efficiency, a new approach to production management, better understanding of business and business environment, wider planning horizon, enhanced vision of the Company's prospects, analysis of the latest technologies, approaches and best practices in production management, and also their possible use and roll-out across the Group. At the end of the session, the trainees will have to come up with target strategic projects to boost operating efficiency of the Company's facilities.
Enhancing professional excellence
With our reconfigured production cycle, modernised operations, new technologies and approaches, and a rapidly changing operational environment, we need to make sure our employees meet the new expertise, skill and competency requirements. The corporate training framework must provide employees with a quick and easy access to new knowledge, helping them master new professional skills and receive training and development support for horizontal and vertical job rotation.
In 2017, we proceeded with the diagnostics and management of professional skill development across our mining facilities, building a professional competency model for lower and middle line mine managers, defining knowledge and skills requirements for each position, and developing a set of test questions to assess professional competencies of line managers at mining facilities. This year, we will carry on with this work.
In 2017, we completed a large-scale programme to retrain over 94,600 employees of the Group, including more than 24,000 people aged below 30. Over 52,000 employees were trained in corporate training centres.
An area of special attention is the introduction of modern technologies to assist in the training of various personnel categories. In 2017, we developed interactive training in occupational safety.
Social partnership
Russian operations of Norilsk Nickel have established a social partnership framework aimed at reconciling the interests of employees and employers on matters pertaining to the regulation of social and labour relations.
The Company meets all obligations under the Labour Code of the Russian Federation, collective bargaining agreements and joint resolutions.
Trade union organizations
Trade unions of the companies located in Norilsk and on the Taimyr Peninsula form a single Trade Union Organisation of PJSC MMC Norilsk Nickel, its Subsidiaries and Affiliates. Trade unions of the companies operating in the Murmansk Region are joined under two umbrella trade union organisations – Regional Trade Union Organisation of Kola MMC Employees and Primary Trade Union Organisation of Kola Mining and Metallurgical Company.
As at the end of 2017, 10.9% of employees engaged in Norilsk Nickel’s Russian operations were members of trade union organisations.
Trade union organisations of Nornickel and its subsidiaries, Kola MMC and its subsidiaries, GRK Bystrinskoye, NordStar Airlines and Zapolyarye Health Resort are all members of the Trade Union of MMC Norilsk Nickel Employees, an interregional trade union organisation. In the reporting year, the relationship between the employer and the Trade Union was governed by the Social Partnership Agreement signed in 2014 to formalise implementation procedures for joint initiatives ensuring sustainable performance, operating and financial excellence, employee welfare, health and safety, and enhancement of social benefits.
Social and labour councils
The Group's companies located in the Norilsk Industrial District, Taimyrsky Dolgano-Nenetsky Municipal District and Murmansk Region established social and labour councils back in 2006 to represent the interests of employees who are not members of trade unions. Chairs of the local councils make up the Social and Labour Council of MMC Norilsk Nickel and the Social and Labour Council of Kola MMC. To ensure regulation of social and labour relations, negotiation, drafting and signing of collective bargaining agreements, holding of bilateral consultations, respect of the employees' labour rights and participation of employee and employer representatives in out-of-court settlements, the Russian companies of Nornickel set up the following collective decision-making bodies: collective bargaining commissions, labour dispute commissions, social benefits commissions/committees, social insurance commissions, health and safety commissions/committees, social and labour relations committees, etc.
In 2017, the share of employees represented by social and labour councils across the Norilsk Nickel Group stood at 82%.
Collective bargaining agreements
The collective bargaining agreements of Nornickel’s Russian companies comply with the applicable laws and meet the majority of employee expectations.
11%of employees engaged in Norilsk Nickel’s Russian operations were members of trade union organisations at the end of 2017
In regulating labour relations, employee interests are represented by trade unions and social and labour councils.
Social partnership framework
82%of employees represented by social and labour councils across the Norilsk Nickel Group
Trade union organizations
Social and labour councils
Employees of Norilsk Nickel’s Russian operations
Social partnership
Employer
Company
Employees
enrolled in trade unions
Gipronickel Institute 15
Group’s operations in the Norilsk Industrial District
8
GRK Bystrinskoye 15
Kola MMC and subsidiaries 15
NordStar Airlines 17
Zapolyarye Health Resort 30
Lesosibirsk Port 38
Yenisey River Shipping Company 55
Krasnoyarsk River Port 62
Membership in trade unions // %

Annual report • 2017Business overview Corporate resposibility HR and social policy
• 114 • • 115 •
Co
mp
any overview
Strategy o
verviewM
arket overview
Business o
verview
Co
rpo
rate go
vernanceInfo
rmatio
n for shareho
lders
Ap
pend
ixes
The underlying principles of the remuneration policy include:• internal equity – remuneration management based
on HAY Group job description and evaluation methodology;
• external competitiveness – remuneration level determined based on the labour market data, with adjustments made for the company's focus area, business location and job grades;
• performance-based incentives – changes in the pay level subject to the annual performance assessment outcome;
• simplicity of the remuneration system – pay level calculation and review procedures are clear for every employee.
In addition to salaries, the Company’s employees enjoy a variety of benefits. Reimbursements of vacation travel expenses (round trip travel expenses and baggage fees) for employees living in the Far North and their families, and provision of discounted tours for health resort treatment account for 69% of total employee benefits.
Efficiency improvement programmes
The Company implemented its employee performance management system back in 2014, with assessment relying on a variety of key performance indicators (KPIs), including occupational safety, operating efficiency and capital management. In 2017, some 4,326 people (employees of the Company’s Head Office, branches and subsidiaries) took part in the KPI-based assessment. The new system helped develop uniform criteria for the evaluation of employee performance enabling the management and employees to align the current year's priorities with performance indicators of the Company/branches/subsidiaries and join their forces to find a path for delivering on the tasks in hand. Moreover, this system makes it possible to link an employee's performance to his/her pay level.
In 2018, we will continue the roll-out with a focus on SAP HCM-based performance assessment automation across the Company's operations. In 2017, the automated SAP Human Capital Management system was implemented at Medvezhy Ruchey, Nornickel – Shared Services Centre, NORMETIMPEX and Bystrinsky Transport Division of MMC Norilsk Nickel. On top of that, 2017 saw the roll-out of the Talent Pool and Performance Assessment automated management subsystems at Polar Division, Kola MMC, Pechengastroy and GRK Bystrinskoye. The performance assessment results are also used to nominate employees for awards.
In 2017, many of the Group’s Russian companies entered into new collective bargaining agreements or extended the expired ones. Collective bargaining commissions also amended some of the agreements during the reporting year. The need to make those amendments was mostly related to adjustments in wage rates arising from legislative changes, organisational structure transformation and introduction of a new automated HR management system. One of the key changes was the review of the payroll system, which led to an increase in the fixed (guaranteed) part of the salary. The payroll adjustments were made in strict compliance with the applicable laws subject to the consent of every given employee. As a result, the Collective Bargaining Commission of MMC Norilsk Nickel reviewed old wage rates and salaries and approved the new ones which came into effect on 1 April 2017.
There were no social or labour disputes during the reporting period.
In 2017, the share of employees covered by collective bargaining agreements stood at 80%.1.
Social programmes for employees
Health improvement programmes for employees
The harsh climate of the Far North and the heavy working conditions of the mining facilities require that the Company make an extra effort to protect its employees’ health. Hence, health improvement and health resort treatment programmes for employees and their families are a key priority of the Company’s social policy.
In 2017, more than 9,200 employees and their families received recreational treatment in Zapolyarye Health Resort (Sochi) owned by the Company. Some 15,500 people spent their vacations in other health resorts, including approximately 5,000 employees who travelled to Bulgarian resorts and over 2,000 staff members who went to Hainan (China).
The health resort treatment programme is designed to prevent the development of chronic diseases among the employees' children and give them an opportunity to take full advantage of their summer vacations. As part of this programme, some 1,500 children spent their holidays in Anapa and Loutraki (Greece).
80% the share of employees covered by collective bargaining agreements
1 Including entities that have no collective bargaining agreements in place but have approved local regulations that make MMC Norilsk Nickel's Collective Bargaining Agreement effective at these entities, including foreign assets.
2 based on the average annual USD/RUB exchange rates of 58.3529 in 2017, 67.0349 in 2016 and 60.9579 in 2015.
Average monthly salary across the Group’s Russian operations
Currency 2015 2016
2017
USD2 1,393 1,405 1,784
RUB ’000 84.9 94.2 104.1
Company's expenses on employee benefits across the Group's Russian operations // USD '000
Indicators 2015 2016
2017
Total expenses on employee benefits across the Group's Russian operations
102,000 103,000 122,539
including the amount spent per employee 1,300 1,300 1,571
Internal awardsAwards from regional and municipal authoritiesCorporate awardsAwards from ministries and agenciesGovernment awards
1,160
37
245
223
1,924
Company's expenses // % Employee's expenses // %
2017
2016
2015
2014
2013
85
86
84
15
14
16
39.6
35.3
31.7
Объем финансирования программ санаторно-курортного лечения и отдыха работников и членов их семей, млн долл. СШАAwards for outstanding operational achievements,
long track record and work commitmentFinancing of health resort treatment and vacation programmes for employees and their families // USD mln
Health improvement and health resort treatment programmes for employees and their families are a key priority of the Company’s social policy.
Incentive programmes
Remuneration system
Nornickel's remuneration policy aims to:• attract and retain employees; • promote higher labour productivity; • ensure administrative efficiency and streamlining;• enforce compliance with legal requirements.
The remuneration package consists of the fixed and variable components (70% and 30%, respectively) paid based on the Company's operating performance and achievement of relevant KPIs.

Annual report • 2017Business overview Corporate resposibility HR and social policy
• 116 • • 117 •
Co
mp
any overview
Strategy o
verviewM
arket overview
Business o
verview
Co
rpo
rate go
vernanceInfo
rmatio
n for shareho
lders
Ap
pend
ixes
Sports programmes
Sports programmes aim to promote a healthy lifestyle, foster corporate solidarity, and develop corporate culture.
The Company pays special attention to corporate competitions, including in such popular sports as futsal, volleyball, basketball, alpine skiing, snowboarding and swimming. Family sports contests are yet another focus area. In 2017, hockey became the latest addition to that long list.
To ensure further development of amateur hockey across the Company's footprint, the region of Norilsk was included in Conference North of the Night Hockey League in December 2017.
In July 2017, Nornickel staged its first corporate team competition under the Hero Race franchise. Some 4,000 people (76 teams), including residents of the Norilsk Industrial District and Murmansk Region, took part in the race.
Events for local communities include annual Spartakiads. In Norilsk, there are 14 sports on Nornickel's Spartakiad list, with some 4,800 people participating in the competition. In the Murmansk Region, the Spartakiad of Kola MMC includes 16 sports ensuring participation of approximately 3,300 people.
One of Nornickel’s social policy highlights is the support of amateur sports. In 2017, over 25,000 employees and local residents took part in Nornickel's corporate mass sports events.
Housing programmes
In 2017, the Company adopted a Housing Programme Policy putting in place a single pool of principles and approaches to developing, approving and implementing housing programmes for employees with the highest qualifications and most relevant expertise as a way to boost long-term staff retention across the Group's operations.
In the reporting period, the Company continued implementing its Our Home and My Home corporate social programmes launched back in 2010 and 2011, respectively.
Our Home programme is intended for the employees of Polar Division, Polar Transport Division and Kola MMC. My Home programme covers 14 subsidiary-owned facilities operating in Norilsk, the Taimyrsky Dolgano-Nenetsky Municipal District and Murmansk Region. Since the start of the programme, 3,397 apartments have been granted to the Company’s employees. In total, the Company has purchased 3,826 ready-for-living housing units, including 422 apartments in 2017.
As part of the programmes, the Company purchases ready-for-living apartments in various Russian regions at its own expense, and provides them to eligible employees under co-financing agreements. The Company pays up to half the cost of the apartment (but in any case no more than USD 35,000), with the rest paid by the employee within a certain period of employment with the Norilsk Nickel Group (from five to ten years). The cost of housing remains unchanged for the entire period of the employee’s participation in the programmes. Ownership rights are registered at the end of the programmes, but the employee may move in immediately after receiving the apartment.
2.8 USD mln financing of sports programmes in 2017
+87%
2017
2016
2015
2014
2013
2.8
1.5
1.4
Financing of sports programmes // USD mln
In total 3,826 apartmentshave been purchased under the housing programme since 2010
200 employeeshave already taken part in the pilot housing programme
In 2014–2017, the apartments were purchased in the Moscow and Tver Regions, as well as the Krasnodar Territory, with the Company seeking to buy properties located in close proximity to enhance the employees' living standards by developing additional infrastructure and optimising the scope of maintenance tasks assigned to the property management company.
To boost the appeal of housing programmes for employees and, consequently, increase the Group's retention rate, Nornickel launched a new housing programme based on mortgage subsidies – Temporary Assistance Programme for Employees of Polar Division and Kola MMC in Acquiring Residential Property, in 2016–2017. The programme is designed to provide a wider choice of residential locations, with employees entitled to an interest-free loan to make a down payment and partial reimbursement of the mortgage interest. The programme has proved efficient in retaining highly qualified specialists. Some 200 employees have already taken part in the pilot, with over 110 people tapping into the allocated funds. Hence, a decision was taken to roll out the programme on an ongoing basis and transform it into Corporate Social Subsidised Loan Programme for Employees of Nornickel and its Russian Subsidiaries. The launch of the programme is scheduled for Q1 2018.
Pension plans
Nornickel offers its employees non-governmental pension plans.
Under the Co-Funded Pension Plan, the Company and its employees make equal contributions to the plan.
The Complementary Corporate Pension Plan provides incentives for pre-retirement employees with considerable job achievements and an extensive employment record.
2017
2016
2015
2014
2013
8.6
7.8
8.9
8,581
15,700
8,484
718
Financing // USD '000
Co-Funded Pension Plan
Complementary Corporate Pension Plan
Participants // people
Pension plans in 2017
Financing of Co-Funded Pension Plan // USD mln

Annual report • 2017Business overview Corporate resposibility HR and social policy
• 118 • • 119 •
Co
mp
any overview
Strategy o
verviewM
arket overview
Business o
verview
Co
rpo
rate go
vernanceInfo
rmatio
n for shareho
lders
Ap
pend
ixes
Social investments
In September 2017, Nornickel built a 40 Gbps broadband internet network in Norilsk, with the project costs amounting to USD 43 mln (RUB 2.5 bn). The network is strong enough to support operations of the Norilsk Nickel Group, as well as local mobile operators, government bodies and municipal authorities.
Nornickel and Zabaykalsky Krai governmemt entered into a cooperation agreement providing for the local government support of Nornickel’s investment projects, including Bystrinsky GOK. On its part, Nornickel undertakes to allocate at least RUB 3.29 bn by 1 January 2027 to finance social projects of Zabaykalsky Krai's government and municipalities.
Development of social entrepreneurship is among the focus areas of Nornickel’s World of New Opportunities charitable programme. In 2017 alone, the Company allocated some RUB 11.5 mln for five business projects focusing on the regional social issues. The funds were provided in the form of interest-free loans for a period of two years.
For more details, please see World of New Opportunities
p. 120
Relocation programme
In 2017, the Company and the Government continued joint implementation of a long-term target programme to relocate people living in Norilsk and Dudinka (Krasnoyarsk Territory) to Russian regions with more favourable climatic conditions. Introduced in 2011, this ten-year programme provides for 11,265 families residing in Norilsk and Dudinka to be relocated from these municipalities as entitled to housing subsidies under Federal Law No. 125-FZ On Housing Subsidies for Citizens Migrating from the Far North Regions and Equated Territories dated 25 October 2002. The Company acts as a programme sponsor.
In 2017, the programme budget totalled RUB 8.3 bn. Since the programme launch, the Company has transferred to the local budget a total of USD 169 mln (RUB 6.2 bn), including USD 14.2 mln (RUB 830 mln) in 2017. In 2011–2017, 6,515 families purchased new homes on the “mainland” and moved there, including 5,458 families from Norilsk and 1,057 families from Dudinka.
6,515familiespurchased new homes on the “mainland” and moved there in 2011–2017
169USD mlnthe Company's contribution to the relocation programme since 2011
Relocation programme results
2011 2012 2013 2014 2015 2016 2017
Company contribution // USD mln Total apartments purchased
1,1371,013
1,012 1,038
718 778 729
3928 27 26 22
14 14
2017 MILESTONES
1.5 USD mlnwill be invested to construct 2,500 sq m of housing in the Tukhard settlement
in various competitions. To that end, the Company purchases items that enjoy the greatest popularity among locals, including tents, gasoline power generators, household equipment, outboard motors, inflatable boats, GPS navigators, sleeping bags, binoculars, etc. The Company also offers regular financial help to public Taimyr-based organisations.
To ensure the sustainable development of the Taimyr region, the Company provides assistance to indigenous peoples of the North, including by helping to organise air transportation and supplying construction materials and diesel fuel.
Children of reindeer herders in the Tukhard tundra are provided with comprehensive meals as part of the Food Programme carried out in association with the Dudinka Department of Education. In line with the effective agreements, foods for the local hospital and primary school are supplied by Norilskgazprom’s Procurement Unit at below-market prices.
Infrastructure development. Nornickel is actively involved in the development and renovation of social infrastructure across its footprint, looking to create accessible and comfortable environments for work and life.
In September 2017, the Company completed the construction of a fibre optic communication line running through a permafrost zone between Novy Urengoy and Norilsk to secure internet connection for local businesses, institutions and individuals. The line is 960 km long, with its most technically challenging section laid under the Yenisey River bed. Along with the Norilsk residents, people living in Dudinka also got access to the broadband internet service. The communication line will run in a pilot mode until Q2 2018 when all the tests are completed and the line is put into commercial operation.
In 2017 alone, Krasnoyarsk Territory's Ministry of Construction, Housing and Utilities issued 685 home purchase certificates under the applicable housing quota.
Local development
The Company makes a significant contribution to the development of local communities by implementing a series of social programmes targeting current and potential issues in its key regions of operation, including the Krasnoyarsk Territory, Kola Peninsula and Zabaykalsky Krai.
Support of indigenous peoples. Nornickel recognises the right of indigenous peoples to preserve their traditional way of life, stick to the age-old environmental management practices and have decent living conditions. The Company adopted the Indigenous Rights Policy that defines Nornickel’s key commitments towards the rights of indigenous peoples. In 2017, there was no record of the Company violating the rights of indigenous minorities.
For several years now, the Company has been supporting initiatives to improve living standards of the Taimyr Peninsula's indigenous people.
One of such initiatives is the Comfortable Taimyr project launched in 2017. Under this ambitious programme, the Company will invest USD 1.5 mln to construct 2,500 sq m of housing in the Tukhard settlement, where indigenous people live. A trilateral agreement to this effect was signed between the Company, Taimyr Administration and Yenisey United Bank in April 2017 during the Krasnoyarsk Economic Forum.
In an attempt to preserve national traditions and culture of indigenous Northern minorities, the Company participates in staging annual professional festivals for tundra inhabitants on the occasion of the Reindeer Herder's Day and the Fisherman's Day and provides presents and prizes for the winners
For more details, please see Infrastructure development
p. 119

Annual report • 2017Business overview Corporate resposibility HR and social policy
• 120 • • 121 •
Co
mp
any overview
Strategy o
verviewM
arket overview
Business o
verview
Co
rpo
rate go
vernanceInfo
rmatio
n for shareho
lders
Ap
pend
ixes
As part of a public-private partnership, the Company continues its work to upgrade the civil section of Norilsk Airport in accordance with the memorandum of intent signed by MMC Norilsk Nickel and the Federal Air Transport Agency under the Russian Transport Development Federal Programme for 2014–2018. The Company will allocate over USD 50 mln (RUB 3 bn) to finance the project. The works are spread out over three construction seasons to avoid airport closure. In 2016–2017, the focus was on the runway upgrade, which is expected to be completed in 2018. In the same year, we will achieve significant progress in repairs of the apron for civil aircraft. The works will be completed in 2019 and will not affect the flight schedule.
Our support for sports is becoming more consistent. It is not limited to the financing of occasional sports events, as Nornickel strives to develop a more comprehensive approach by investing in sports facilities, new schools, sports grounds and mass events promoting sports and healthy lifestyles.
In 2017, the Company allocated USD 343,000 (RUB 20 mln) to finance the construction of a sports facility in Monchegorsk (a prefab structure with a football pitch). Its commissioning is scheduled for March 2018.
Another project of Nornickel, which is supported by the Krasnoyarsk Territory Government, is to build a unique golf field in the northern city of Krasnoyarsk to drum up people’s interest in the game of golf.
Nornickel is also helping Krasnoyarsk authorities to put in place new smart bus stops. They are planned to be installed in 2018 and will be fitted out with safety and surveillance systems, mobile chargers, wi-fi hotspots and other options. The Company allocated some USD 120,000 (RUB 7 mln) to finance the project.
World of New Opportunities. The Company launched its World of New Opportunities charity programme to encourage and promote sustainable development of local communities, with the programme primarily aiming to develop soft skills in local communities, demonstrate and introduce new social technologies, support and promote public initiatives, and encourage cross-sector partnerships. In 2017, after the commissioning of Bystrinsky GOK in Zabaykalsky Krai, the World of New Opportunities footprint expanded to cover local municipalities. In Chita, the Company launched its Socially Responsible Initiatives Competition, Arctic.PRO R&D marathon, and School of Urban Competencies.
The World of New Opportunities programme has three focus areas – Partnership, Innovations and Development.
The Norilsk residents and people living in Dudinka got access to the broadband internet service.
the Company completed the construction of
960 km longa fibre optic communication line running through a permafrost zone between Novy Urengoy and Norilsk. The project investments amounting to USD 43 mln.
>50 USD mlnallocated to reconstruct the civilian part of Norilsk Airport
>2 USD mlnallocated as grant funding of the Socially Responsible Initiatives Competition
489 bidssubmitted, 116 projects approved for funding
PARTNERSHIP
In spring 2017, the Company initiated the We Are the City! social technologies forum in Norilsk (Krasnoyarsk Territory) and Zapolyarny (Murmansk Region) to bring together local communities and tell them about new trends and best practices in charity and volunteering, and also share successes in solving social issues. In the lead-up to the forum, locals got a chance to meet a wide range of experts who shared their ideas on upbringing children, finding a way in life, personal development, etc. The forum venues were attended by a total of 1,910 people.
The Company seeks to broaden local knowledge and skills contributing to the build-up of regional expertise. For the third year running, Nornickel organised a three-day ‘social engineering’ workshop for local activists that combined theoretical and practical aspects of generating and implementing ideas. In three days, 138 participants from Norilsk, Dudinka, Monchegorsk and Zapolyarny developed and staged 12 city events reaching out to over 2,500 local residents.
On the Company Day, Nornickel traditionally stages the We Are the City! PicNick event in Norilsk, Monchegorsk and Zapolyarny. PicNick is a festival "for a good cause" organised by local activists and participants of the World of New Opportunities programme (winners of the Socially Responsible Initiatives Competition and socially minded entrepreneurs) and Plant of Goodness corporate volunteer programme. In 2017, it was staged as a street festival with a projects fair, workshops, training sessions, etc.
All events organised by the Company served to raise charity awareness in local communities and encourage public-private partnerships. In 2017, the Socially Responsible Initiatives Competition, which aims to support public initiatives, received 489 project bids, 116 of which were approved for funding. Grant funding amounted to over USD 2 mln (RUB 125 mln).
This area focuses on supporting volunteer initiatives of local activists, fostering new skills and developing local expertise.
Key Partnership initiatives comprise:• Academy for Social Partnership and Development (a series of
workshops on social project development, expertise building, assessment of projects/programmes and monetisation of social projects);
• Socially Responsible Initiatives Competition;• Social Technologies Forum;• Social Engineering Workshop;• We Are the City! PicNick.
2017
2016
2015
2014
2013
115
78.3
60.7
Благотворительная программа «Мир новых возможностей»Расходы на благотворительность, млн долл. США
2017
2016
2015
2014
2013
64.9
45.8
83.7
Financing of Charity Programmes // USD mln
Financing of Development and Renovation of Social Infrastructure // USD mln

Annual report • 2017Business overview Corporate resposibility HR and social policy
• 122 • • 123 •
Co
mp
any overview
Strategy o
verviewM
arket overview
Business o
verview
Co
rpo
rate go
vernanceInfo
rmatio
n for shareho
lders
Ap
pend
ixes
INNOVATIONS DEVELOPMENT
In autumn 2017, the Company staged Arctic Wave R&D festivals in Norilsk and Monchegorsk to promote research and development among the youth, support creative engineering and innovative thinking among schoolchildren, and demonstrate the latest scientific achievements. Interactive sessions, contests and scientific experiments of the largest R&D event in the Polar Region were held under the motto "Augment Reality". The festivals were attended by 4,500 children and adults.
For the fourth year in a row, the Company organised the Arctic.PRO R&D marathon aiming to encourage R&D creativity, innovations in engineering and thirst for knowledge among children and young people. 1,300 students aged 12 to 15 took part in the marathon. 20 more children attended the Winter R&D School in Kazan.
For the third year running, the Company was a general partner of the All-Russian Science Festival held by Lomonosov Moscow State University. In Krasnoyarsk, the festival took place in December 2017. It was the first festival to feature the City of Discoveries. City of Professions programme giving Krasnoyarsk high school students an opportunity to take a career guidance test, have their interests and skills analysed, and receive career recommendations.
One of the Company's initiatives was to provide training in Social Entrepreneurship. With assistance and guidance from experienced coaches (active businessmen), trainees are expected to develop business plans and present them at the Investment Session.
In 2017, Norilsk hosted the first Convention of Social Entrepreneurs from the North, which provided a platform to discuss trends, prospects and measures to support social entrepreneurship in the Polar regions and analyse relevant national and international best practices. In the lead-up to the Convention, experts and participants from other regions had an opportunity to take part in the Entrepreneurial Norilsk quest to learn more about social entrepreneurship in Norilsk.
This area focuses on facilitating the implementation of advanced technologies, fostering R&D potential and encouraging innovation in engineering. Its target audience are schoolchildren, university students and adult activists interested in science and frontier technologies.
This area focuses on engaging active citizens and SMEs to address social issues of local communities using available business technologies.
Key Innovations initiatives comprise:• Arctic.PRO R&D marathon;• Arctic Wave festival of R&D discoveries;• FabLab R&D creativity laboratory;• School of Urban Competencies.
The career guidance programme was built around several areas of interest, including Biological Engineering, Medicine and Healthcare, Taiga, Digitalisation in Humanities, IT, Communications and Aerospace Engineering, and Energy, Engineering and Architecture, each featuring interactive presentations made by local universities and businesses and dedicated lectures enabling students to tap into real-life experience, learn more from professionals, and choose a personal development path for the next 5–10 years. About 15,000 students attended the two-day festival.
In 2017, Nornickel’s School of Urban Competencies won the first prize as the Best Charity Promotion Programme (Project) at the 2017 Leaders of Corporate Charity contest held by the Association of Sponsoring Organisations. The School of Urban Competencies aims to develop key social competencies in schoolchildren, including in the realms of housing, finance and career. Each year, at least 500 children living in the Polar regions take part in the School’s workshops and events.
Ist
prizeas the Best Charity Promotion Programme (Project)
RUB 11.5 mlnallocated in 2017 for social business projects
The Company interacts with federal legislative and executive authorities, and civil society institutions. The Company is represented and expresses its interests in 26 committees, councils, commissions, expert teams, and working groups established by government bodies in association with the business community, thus supporting socially important projects. Currently, the Company mainly cooperates with the working groups and councils of the State Commission for Arctic Development and the Government Commission on the Use of Natural Resources and Environmental Protection. The Company also actively participates in the activities of regional authorities’ expert boards across its geographies, including the Governor’s Council for Strategic Development and Priority Projects of the Krasnoyarsk Territory.
Representatives of the Company take part in parliamentary sessions and round table discussions organised by the Federation Council and State Duma of the Federal Assembly of the Russian Federation, Government of the Russian Federation, Russian Union of Industrialists and Entrepreneurs, Chamber of Commerce and Industry of the Russian Federation, Association of Managers (an interregional public organisation), etc.
The Company's experts participate in draft regulation discussions held by the Open Government and by community councils of the federal executive bodies, as well as in anti-corruption due diligence and regulatory impact assessments. All of that helps maintain a constructive dialogue with the government, cut administrative red tape and improve the nation’s business climate.
Government relations

Annual report • 2017Business overview Corporate resposibility HR and social policy
• 124 • • 125 •
Co
mp
any overview
Strategy o
verviewM
arket overview
Business o
verview
Co
rpo
rate go
vernanceInfo
rmatio
n for shareho
lders
Ap
pend
ixes
Sponsorship
Rosa Khutor Ski Resort
Russian Olympic Committee
Football Union of Russia and Russia's national football team
XXIX International Winter Universiade in Krasnoyarsk
CSKA professional basketball club
develop new ski pistes and lifts and build new recreational and sports facilities. By way of consideration, Nornickel was granted a minority stake in the Rosa Khutor project.
Another area of cooperation between the Company and the Russian Olympic Committee is the inclusion of Nornickel’s regions of operation in the pan-Russian Olympic Patrol project. In 2017, the Olympic Patrol visited Krasnoyarsk and Norilsk, giving local children a chance to meet renowned athletes who shared their personal Olympic experiences, took part in autograph and photo sessions, and held workshops and fitness tests.
volunteering associations from over 90 FISU member states, as well as university sports delegations and officials. The forum was held in the run-up to the 2019 Winter Universiade to facilitate communication between volunteers and national university sports federations, and share knowledge and experience in organising large international sports events.
In 2017, CSKA came out as a winner in the VTB United League and took part in the EuroLeague's Final Four.
healthy lifestyles and mass sports, and enhance living standards in the region.
According to current estimates, the Company will spend nearly RUB 2 bn on the preparation and holding of the 2019 Winter Universiade.
One of the major commitments made by the Company for the Universiade was to prepare the Bobrovy Log Fun Park for alpine competitions.
The Company is also an exclusive partner of Russia’s Football Union in the metals sector.
International University Sports Federation
In 2016–2019, Nornickel is going to invest USD 250.5 mln in the development of Rosa Khutor ski resort as part of Russia’s Mass Sports Support Programme. These funds will be used to transform Olympic facilities into a year-round tourist attraction,
As a Partner of the Russian Olympic Committee and the Russian Olympic team, Nornickel allocated over RUB 1 bn to support youth and high performance sports, including the implementation of Olympic educational programmes developed by the Russian International Olympic University.
In line with the sponsorship agreement, Nornickel remains an official partner of the Football Union of Russia and Russia's national football team.
The Company will remain a Partner of the International University Sports Federation (FISU) until May 2019 and will continue to support the development of international university sports movement. The first-ever international forum of the Federation – FISU Volunteer Leaders Academy – was organised in July 2017 with the backing from Nornickel and was attended by leaders of
Nornickel continues to provide support to Russia’s most successful and well-known basketball club.
As a General Partner of the 2019 International Winter Universiade in Krasnoyarsk, the Company keeps on track with preparations for this upcoming international sports event in accordance with the agreement signed in 2015.
Promotion of the XXIX Winter Universiade will bring about improvements in the local sports infrastructure and the international image of the Krasnoyarsk Territory and its capital, increase popularity of
2017
2016
2015
2014
2013
21.9
21.0
17.1
СпонсорствоОбъем финансирования спортивных проектов, млн долл. США
Financing of Sporting Projects // USD mln

Annual report • 2017Business overview Corporate resposibility HR and social policy
• 126 • • 127 •
Co
mp
any overview
Strategy o
verviewM
arket overview
Business o
verview
Co
rpo
rate go
vernanceInfo
rmatio
n for shareho
lders
Ap
pend
ixes
In 2017, Nornickel proceeded with the construction of a new athletic training facility equipped with a broadcasting system, expansion of the ski pistes, development of an integrated security system, upgrade of the artificial snow machinery, and preparation of an ambulance helicopter pad.
In addition to the Bobrovy Log Fun Park, the Company plans to establish a park along the Bazaikha River with sports and playgrounds, walkways, bike lanes, recreation areas, and a foot and bike bridge across the Bazaikha to make the park accessible for people with limited mobility. An agreement to this effect was signed between the Company and Krasnoyarsk municipal authorities.
With the backing from Nornickel, the Russian International Olympic University and the Siberian Federal University organised training for mid-level and top-level managers and leaders of volunteer teams involved in the Winter Universiade.
On top of that, a volunteer team was formed by employees of the Company and members of their families. A dedicated training programme developed by the Siberian Federal University was completed by 95 volunteers who will seek to maximise popular engagement in the run-up to the event.
As a General Partner of the 2019 Winter Universiade, Nornickel strives to ensure extensive promotion to inform the public about the event.
In 2017, three NordStar aircraft were redesigned to feature the symbols of the Universiade. They made nearly 2,000 flights during the year and carried over 265,000 passengers who learnt about the upcoming event while on board. Information about the Universiade is also available in the NordStar inflight magazine.
Branded pavilions of the Company were constructed in Moscow parks, with over 15,000 visitors receiving
Norilsk Nickel Futsal Club
and MMC Norilsk Nickel work closely to ensure the success of the Futsal to Polar Region Schools project. As part of this nationwide initiative, the Club's futsal players hold master classes for schoolchildren and special workshops for trainers.
All Russian Federation of DanceSport and Acrobatic Rock'n'Roll
One of the partnership's objectives is to establish a corporate acrobatic rock’n’roll club in Norilsk.
XIX World Festival of Youth and Students
venue which turned into a major point of attraction during the Festival. The venue was divided into two zones, the 2019 Winter Universiade General Partner Pavilion and the CSKA streetball ground. The Company's contribution to the Festival was highly appreciated by the Russian President Vladimir Putin.
In 2016, the team and administrative personnel of Norilsk Nickel Futsal Club moved to Norilsk. The team takes part in the Russian Super League Championship and Russian Futsal Cup. Relocation of the club gave a powerful boost to the development of futsal in the local community. The Russian Futsal Association
In 2017, Nornickel and the All Russian Federation of DanceSport and Acrobatic Rock'n'Roll started cooperation to support and promote these sports.
Large international events should be viewed as important milestones in the Russian tradition of sponsorship and public-private partnerships. As part of the 2017 World Festival of Youth and Students (attended by nearly 25,000 people from 188 countries), the Company set up an Athletic Nornickel
information about the Universiade, Bobrovy Log Fun Park and other sports-related projects through games and interactive presentations. The pavilions also served as a platform for cultural, educational and sports events involving famous athletes, sports workshops, flash mobs, and prize-winning competitions for park visitors.
The Company also sponsored the 500 Days until Universiade event that linked two cities – Krasnoyarsk (Bobrovy Log Fun Park) and Moscow (Lomonosov Moscow State University) – via a teleconference.
U-Laika, the mascot of the upcoming university games, travelled with the Russian cosmonauts to the international space station and addressed the audience of the Universiade from the orbit.

Annual report • 2017Business overview Corporate resposibility Occupational safety
• 128 • • 129 •
Co
mp
any overview
Strategy o
verviewM
arket overview
Business o
verview
Co
rpo
rate go
vernanceInfo
rmatio
n for shareho
lders
Ap
pend
ixes
Occupational safety
Bystrinsky GOK implemented an advanced system for monitoring mining machinery and personnel positioning designed to improve mining operations safety, ensure better coordination of rescue teams in emergencies, and enhance production process management. Occupational safety is one of the core aspects of the Company’s corporate social responsibility, with Nornickel seeking to ensure zero workplace fatalities and reduce its lost time injury frequency rate.
The Company’s Occupational Health and Safety Policy gives precedence to the life and health of employees over operational performance while also demonstrating the management’s commitment to creating a safe and healthy environment and fostering sustainable employee motivation for safe workplace behaviour.
The Board’s Audit and Sustainable Development Committee oversees occupational health and safety matters, reviewing relevant reports by the management on a quarterly basis. First Vice-President – Chief Operating Officer is responsible for the development of an action plan and enforcement of compliance with the applicable occupational safety requirements.
He also chairs the Company’s Health, Safety and Environment Committee (HSE Committee) charged with:• improving health and safety performance at
the Company and its subsidiaries in Russia;• toughening responsibility of Nornickel’s executives
for ensuring operational health and safety.
In 2017, the committee was engaged in considering improvements to the existing health and safety management system, as well as monitoring the implementation of the scheduled activities aimed at reducing injury rates and enhancing the system’s effectiveness. To that end, a series of video conferences and meetings were held with representatives of the Company's branches and Russian subsidiaries.
All the production facilities have job- and operation-specific regulations and guidelines containing dedicated health and safety sections. Moreover, Nornickel's collective bargaining agreements also have occupational health and safety provisions. The Company and most of its subsidiaries have joint health and safety committees made up of management, employee and trade union representatives.
As all maintenance and construction operations at the existing production facilities are classified as high-hazard, the contractors’ workers are required to attend induction and target briefings on health and safety prior to the commencement of works. Work permits also contain information on occupational safety requirements to be followed during the performance of works or in the immediate run-up to them.
Corporate standards
The Company keeps improving its occupational health and safety management system, including by developing and implementing corporate standards.
The HSE Department monitors the implementation of the standards across Nornickel’s branches and Russian subsidiaries, including through second-party audits. In 2017, a total of 38 audits were held in accordance with the approved schedule.
As part of the Risk Control project (launched in 2016 to implement the STO KISM 121-211-2014 occupational health and safety management standard), 2017 saw further adjustments to the risk registers to be piloted directly at the production sites, risk register-based employee briefings, and drafting of data sheets for high and material risks.
In 2017, Nornickel's Board of Directors approved the Working Conditions Policy available on the Company's corporate website
HSE certifications
Kola MMC and Norilsk Nickel Harjavalta – OHSAS 18001 (international certificate)
Polar Division and Pechengastroy – GOST R 54934-2012 (Russian standard identical to OHSAS 18001)
Norilsknickelremont – GOST 12.0.230-2007 (interstate standard identical to ILO-OSH 2001)
2017 MILESTONE
Expenses on occupational safety initiatives // USD mln
2015 2016 2017
2.21.6
2.0
176
127149
Expenses per employee // USD '000
Expenses on occupational safety initiatives
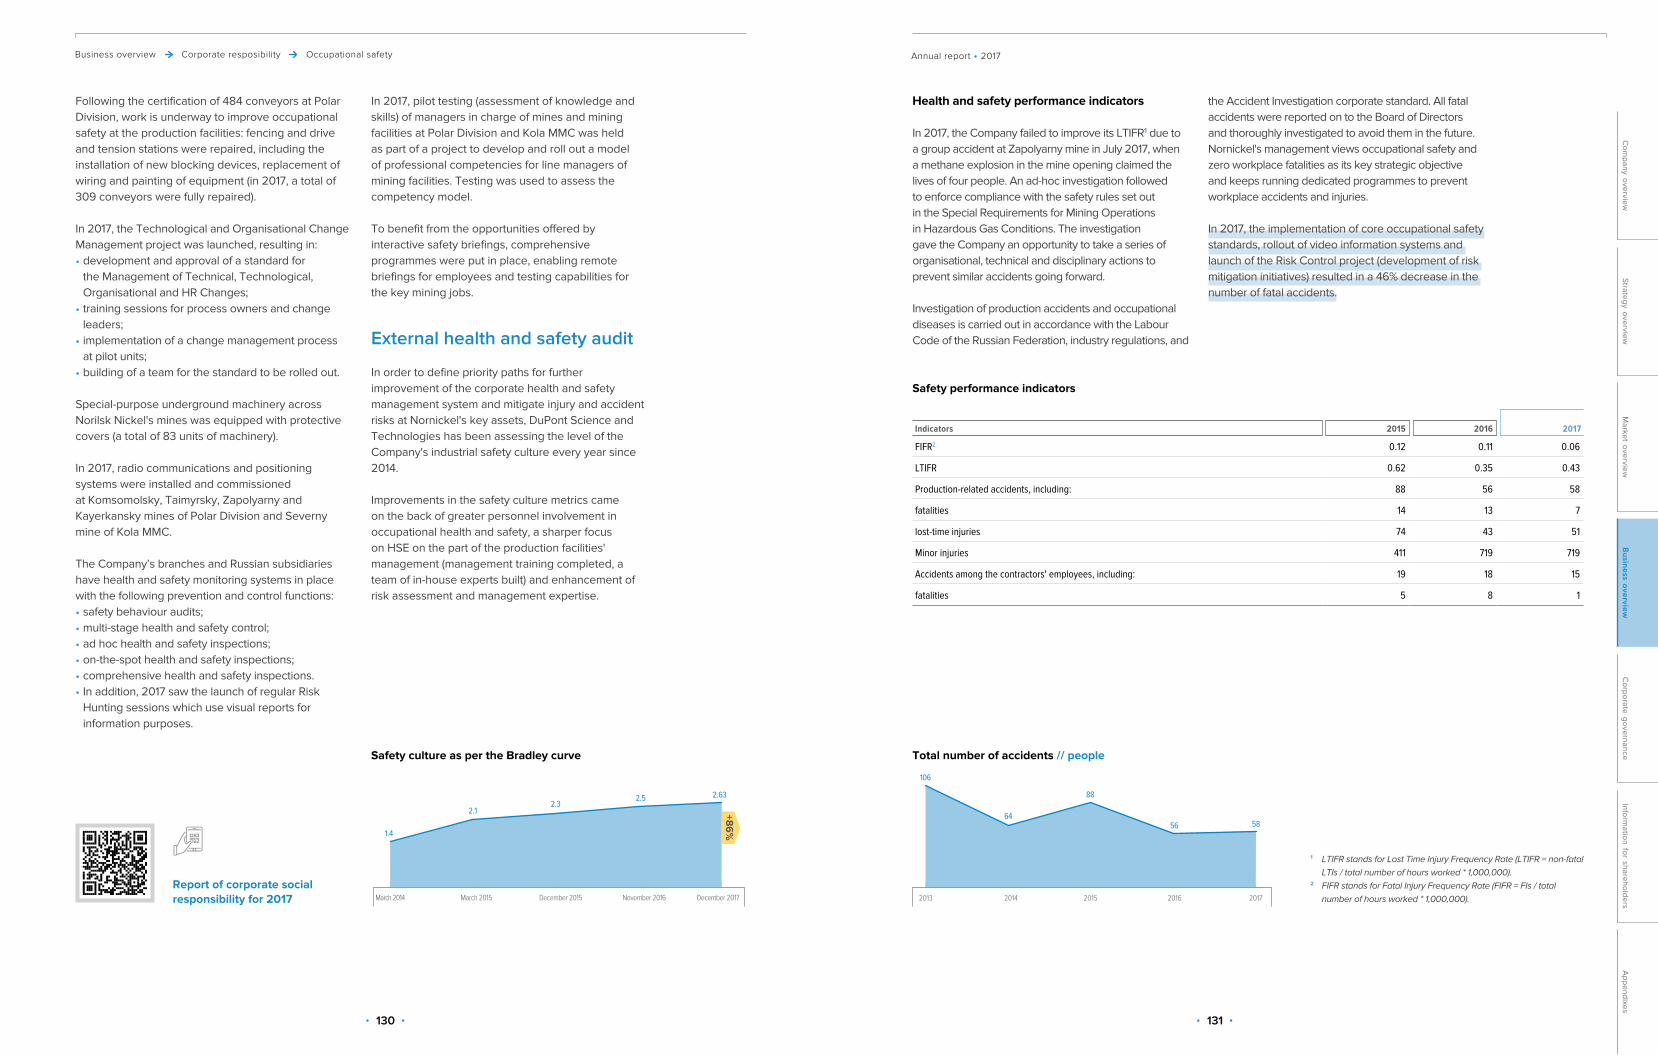
Annual report • 2017Business overview Corporate resposibility Occupational safety
• 130 • • 131 •
Co
mp
any overview
Strategy o
verviewM
arket overview
Business o
verview
Co
rpo
rate go
vernanceInfo
rmatio
n for shareho
lders
Ap
pend
ixes
Following the certification of 484 conveyors at Polar Division, work is underway to improve occupational safety at the production facilities: fencing and drive and tension stations were repaired, including the installation of new blocking devices, replacement of wiring and painting of equipment (in 2017, a total of 309 conveyors were fully repaired).
In 2017, the Technological and Organisational Change Management project was launched, resulting in:• development and approval of a standard for
the Management of Technical, Technological, Organisational and HR Changes;
• training sessions for process owners and change leaders;
• implementation of a change management process at pilot units;
• building of a team for the standard to be rolled out.
Special-purpose underground machinery across Norilsk Nickel's mines was equipped with protective covers (a total of 83 units of machinery).
In 2017, radio communications and positioning systems were installed and commissioned at Komsomolsky, Taimyrsky, Zapolyarny and Kayerkansky mines of Polar Division and Severny mine of Kola MMC.
The Company’s branches and Russian subsidiaries have health and safety monitoring systems in place with the following prevention and control functions:• safety behaviour audits;• multi-stage health and safety control;• ad hoc health and safety inspections; • on-the-spot health and safety inspections;• comprehensive health and safety inspections.• In addition, 2017 saw the launch of regular Risk
Hunting sessions which use visual reports for information purposes.
In 2017, pilot testing (assessment of knowledge and skills) of managers in charge of mines and mining facilities at Polar Division and Kola MMC was held as part of a project to develop and roll out a model of professional competencies for line managers of mining facilities. Testing was used to assess the competency model.
To benefit from the opportunities offered by interactive safety briefings, comprehensive programmes were put in place, enabling remote briefings for employees and testing capabilities for the key mining jobs.
March 2014 March 2015 December 2015 November 2016 December 2017
1.4
+86%
2.12.3
2.5 2.63
2013 2014 2015 2016 2017
106
64
88
56 58
1 LTIFR stands for Lost Time Injury Frequency Rate (LTIFR = non-fatal LTIs / total number of hours worked * 1,000,000).
2 FIFR stands for Fatal Injury Frequency Rate (FIFR = FIs / total number of hours worked * 1,000,000).
the Accident Investigation corporate standard. All fatal accidents were reported on to the Board of Directors and thoroughly investigated to avoid them in the future. Nornickel's management views occupational safety and zero workplace fatalities as its key strategic objective and keeps running dedicated programmes to prevent workplace accidents and injuries.
In 2017, the implementation of core occupational safety standards, rollout of video information systems and launch of the Risk Control project (development of risk mitigation initiatives) resulted in a 46% decrease in the number of fatal accidents.
Safety performance indicators
Indicators 2015 2016
2017
FIFR2 0.12 0.11 0.06
LTIFR 0.62 0.35 0.43
Production-related accidents, including: 88 56 58
fatalities 14 13 7
lost-time injuries 74 43 51
Minor injuries 411 719 719
Accidents among the contractors' employees, including: 19 18 15
fatalities 5 8 1
Total number of accidents // people
Health and safety performance indicators
In 2017, the Company failed to improve its LTIFR1 due to a group accident at Zapolyarny mine in July 2017, when a methane explosion in the mine opening claimed the lives of four people. An ad-hoc investigation followed to enforce compliance with the safety rules set out in the Special Requirements for Mining Operations in Hazardous Gas Conditions. The investigation gave the Company an opportunity to take a series of organisational, technical and disciplinary actions to prevent similar accidents going forward.
Investigation of production accidents and occupational diseases is carried out in accordance with the Labour Code of the Russian Federation, industry regulations, and
Report of corporate social responsibility for 2017
Safety culture as per the Bradley curve
External health and safety audit
In order to define priority paths for further improvement of the corporate health and safety management system and mitigate injury and accident risks at Nornickel's key assets, DuPont Science and Technologies has been assessing the level of the Company's industrial safety culture every year since 2014.
Improvements in the safety culture metrics came on the back of greater personnel involvement in occupational health and safety, a sharper focus on HSE on the part of the production facilities' management (management training completed, a team of in-house experts built) and enhancement of risk assessment and management expertise.

Annual report • 2017Business overview Corporate resposibility Environment
• 132 • • 133 •
Co
mp
any overview
Strategy o
verviewM
arket overview
Business o
verview
Co
rpo
rate go
vernanceInfo
rmatio
n for shareho
lders
Ap
pend
ixes
In 2017, the Company completed the first stage of its environmental programme, with Talnakh Concentrator reaching the design processing capacity and recovery rates. According to our estimates, in 2017, given the Nickel Plant shutdown in 2016, the total sulphur dioxide emissions reduced by 5% across Polar Division and by 30–35% within the city of Norilsk. Last year we announced the launch of the second stage of our environmental programme, which includes the Sulphur Project in Norilsk and optimisation of the smelting capacity at Kola MMC. As a result, we plan to cut the sulphur dioxide emissions by 75% in Norilsk by 2023 and by 50% at Kola MMC as soon as in 2019”.
Sergey DyachenkoFirst Vice President and Chief Operating Officer of Nornickel
At the end of 2017, Nornickel’s Polar Division completed a project to redirect emissions from slag and matte mixers and other aspiration gases from low-height sources to Copper Plant’s flue-gas stack DT-1. This created better conditions for the dispersion of emissions and reduced ground-level concentrations of pollutants in the residential area of Norilsk.
Nornickel successfully passed an independent recertification audit of its Corporate Integrated Quality and Environmental Management System (CIMS). The auditors of Bureau Veritas Certification confirmed CISM compliance with the ISO 14001:2015 and ISO 9001:2015 requirements and praised its strengths.
Kola MMC completed a project designed to dispose of saline effluent from nickel refining operations in Monchegorsk preventing liquid nickel production waste from polluting the environment.
As 2017 marked the Year of Environment in Russia and 100th Anniversary of the Russian Nature Reserves, Nornickel launched Let’s Do It, an environmental marathon organised across the Company’s footprint as a corporate volunteering project.
Nornickel’s management team considers environmental protection an integral part of the production process. The Company complies with the applicable laws and international agreements and is committed to reducing emissions, on a phased basis, and sustainable use of natural resources.
Nornickel’s environmental policy focuses on the following priorities:• phased reduction of pollutant air emissions,
primarily sulphur dioxide and solids;• consistent reduction of wastewater discharges
into water bodies;• development of waste disposal sites to reduce
human impact on the environment;• zero pollution in maritime cargo transportation
and vessel operation;• sustainable use of natural resources and
introduction of eco-friendly technologies;• involvement with environmental public-private
partnership projects;• conserving biodiversity across geographies of
our production operations.
Nornickel’s management team considers environmental protection an integral part of the production process.
18 EMS internal auditswere held at the Company’s Head Office in 2017
–30%reduction of sulfur dioxide emissions within the city of Norilsk in 2017
Environment
Throughout 2017, the Company carried out internal audits as part of the CIMS. In line with international standards and Norilsk Nickel’s by-laws, internal audits were conducted by specially trained and competent personnel:• 18 EMS internal audits were held at the Company’s
Head Office (as part of the CIMS internal audits);• 66 internal audits were held at Polar Division, Polar
Transport Division and Murmansk Transport Division (17, 25 and 24 audits, respectively);
• 40 EMS internal audits were held at Kola MMC (as part of the CIMS internal audits).
To confirm compliance of the EMS with ISO 14001, the Company engages Bureau Veritas Certification (BVC) to conduct surveillance audits once a year and recertification audits once every three years. In November 2017, an EMS recertification audit was held as part of the CIMS at the Company’s Head Office in Moscow, Polar Division's production sites in Norilsk, Polar Transport Division (Dudinka) and Murmansk Transport Divisions (Murmansk).
2017 MILESTONES
Environmental Management SystemIn 2017, the environmental management system (EMS) continued to operate as part of the Corporate Integrated Quality and Environmental Management System (CIMS). This enabled the Company to harmonise environmental and quality management initiatives with the operations of other functions (such as production management, finance, health and safety). With this approach, the Company is better fit to streamline its environmental efforts and enhance overall performance.
With the EMS, Nornickel benefits from:• secured priority funding for environmental initiatives;• higher environmental awareness among employees;• better public perception;• stronger competitive edge in the domestic and
international markets;• demonstrating a global standard of environmental
compliance to customers and other stakeholders, and winning the trust of customers who require the supplier to have an effective EMS;
• additional opportunities for recognition in the international context and in global markets;
• improved investment case.
„
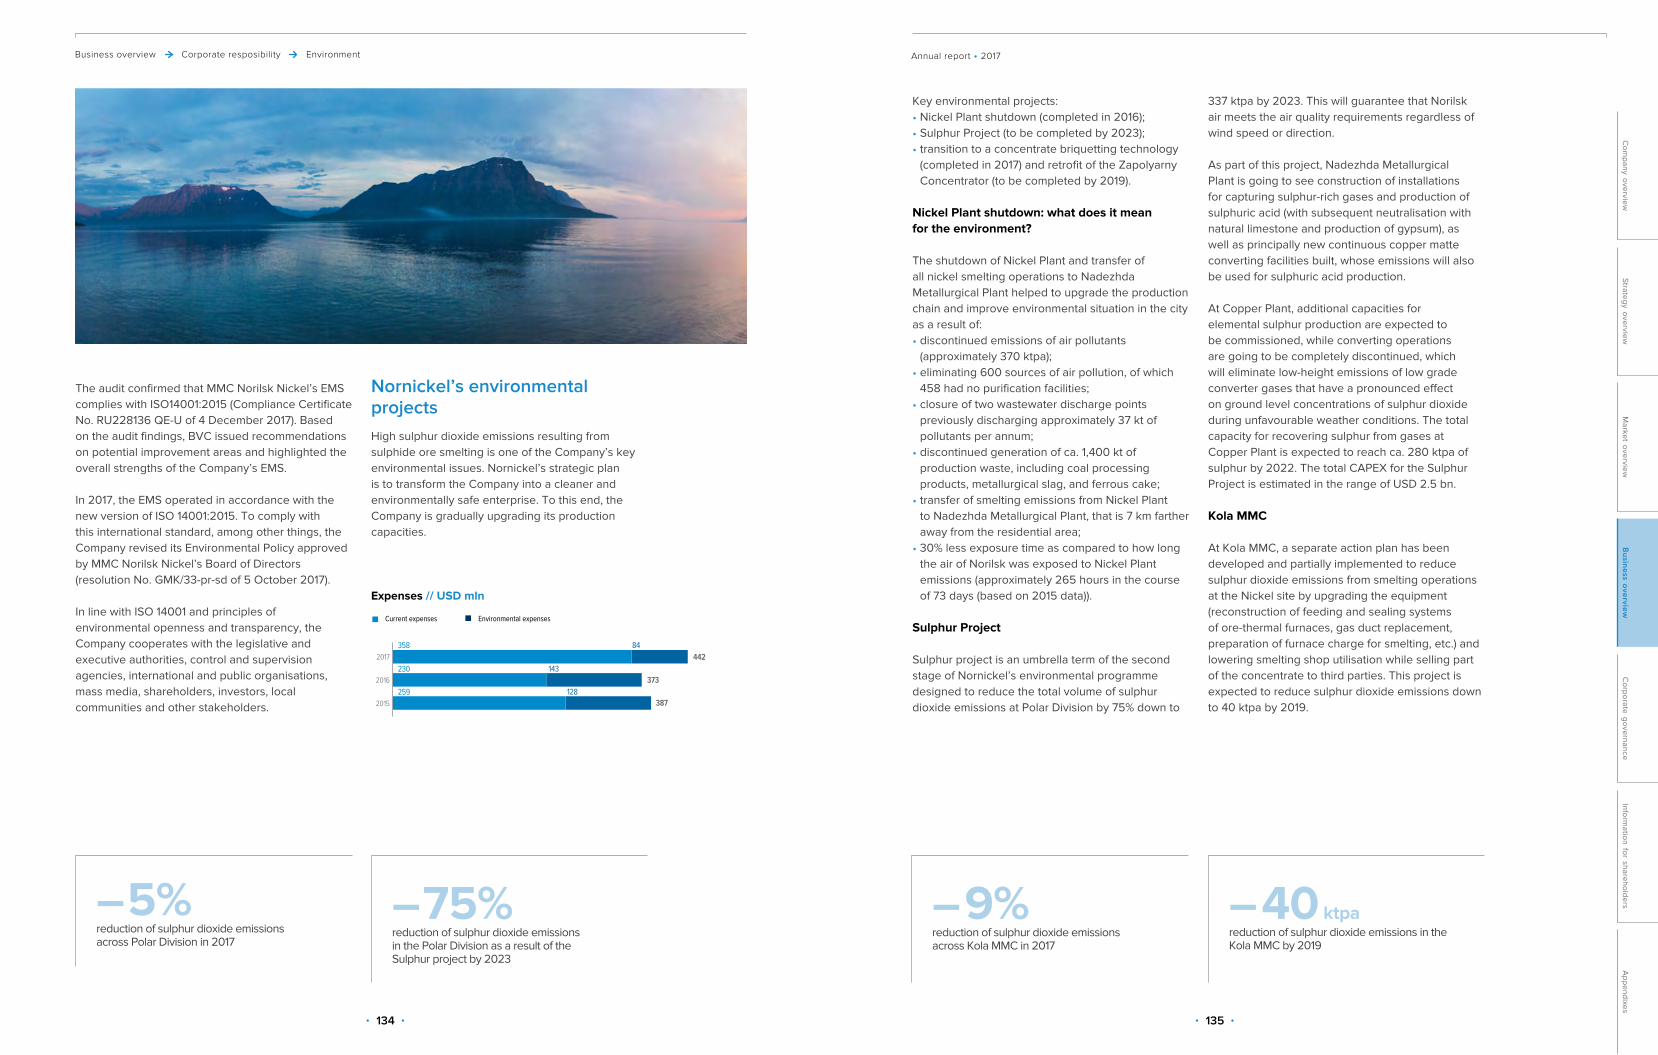
Annual report • 2017Business overview Corporate resposibility Environment
• 134 • • 135 •
Co
mp
any overview
Strategy o
verviewM
arket overview
Business o
verview
Co
rpo
rate go
vernanceInfo
rmatio
n for shareho
lders
Ap
pend
ixes
The audit confirmed that MMC Norilsk Nickel’s EMS complies with ISO14001:2015 (Compliance Certificate No. RU228136 QE-U of 4 December 2017). Based on the audit findings, BVC issued recommendations on potential improvement areas and highlighted the overall strengths of the Company’s EMS.
In 2017, the EMS operated in accordance with the new version of ISO 14001:2015. To comply with this international standard, among other things, the Company revised its Environmental Policy approved by MMC Norilsk Nickel’s Board of Directors (resolution No. GMK/33-pr-sd of 5 October 2017).
In line with ISO 14001 and principles of environmental openness and transparency, the Company cooperates with the legislative and executive authorities, control and supervision agencies, international and public organisations, mass media, shareholders, investors, local communities and other stakeholders.
Current expenses
Environmental expenses
2017
2016
2015
2014
2013
358
230
259
84
143
128
442
373
387
Расходы, млн долл. США
Key environmental projects:• Nickel Plant shutdown (completed in 2016);• Sulphur Project (to be completed by 2023);• transition to a concentrate briquetting technology
(completed in 2017) and retrofit of the Zapolyarny Concentrator (to be completed by 2019).
Nickel Plant shutdown: what does it mean for the environment?
The shutdown of Nickel Plant and transfer of all nickel smelting operations to Nadezhda Metallurgical Plant helped to upgrade the production chain and improve environmental situation in the city as a result of:• discontinued emissions of air pollutants
(approximately 370 ktpa);• eliminating 600 sources of air pollution, of which
458 had no purification facilities;• closure of two wastewater discharge points
previously discharging approximately 37 kt of pollutants per annum;
• discontinued generation of ca. 1,400 kt of production waste, including coal processing products, metallurgical slag, and ferrous cake;
• transfer of smelting emissions from Nickel Plant to Nadezhda Metallurgical Plant, that is 7 km farther away from the residential area;
• 30% less exposure time as compared to how long the air of Norilsk was exposed to Nickel Plant emissions (approximately 265 hours in the course of 73 days (based on 2015 data)).
Sulphur Project
Sulphur project is an umbrella term of the second stage of Nornickel’s environmental programme designed to reduce the total volume of sulphur dioxide emissions at Polar Division by 75% down to
Expenses // USD mln
Nornickel’s environmental projectsHigh sulphur dioxide emissions resulting from sulphide ore smelting is one of the Company’s key environmental issues. Nornickel’s strategic plan is to transform the Company into a cleaner and environmentally safe enterprise. To this end, the Company is gradually upgrading its production capacities.
337 ktpa by 2023. This will guarantee that Norilsk air meets the air quality requirements regardless of wind speed or direction.
As part of this project, Nadezhda Metallurgical Plant is going to see construction of installations for capturing sulphur-rich gases and production of sulphuric acid (with subsequent neutralisation with natural limestone and production of gypsum), as well as principally new continuous copper matte converting facilities built, whose emissions will also be used for sulphuric acid production.
At Copper Plant, additional capacities for elemental sulphur production are expected to be commissioned, while converting operations are going to be completely discontinued, which will eliminate low-height emissions of low grade converter gases that have a pronounced effect on ground level concentrations of sulphur dioxide during unfavourable weather conditions. The total capacity for recovering sulphur from gases at Copper Plant is expected to reach ca. 280 ktpa of sulphur by 2022. The total CAPEX for the Sulphur Project is estimated in the range of USD 2.5 bn.
Kola MMC
At Kola MMC, a separate action plan has been developed and partially implemented to reduce sulphur dioxide emissions from smelting operations at the Nickel site by upgrading the equipment (reconstruction of feeding and sealing systems of ore-thermal furnaces, gas duct replacement, preparation of furnace charge for smelting, etc.) and lowering smelting shop utilisation while selling part of the concentrate to third parties. This project is expected to reduce sulphur dioxide emissions down to 40 ktpa by 2019.
– 5% reduction of sulphur dioxide emissions across Polar Division in 2017
– 75% reduction of sulphur dioxide emissions in the Polar Division as a result of the Sulphur project by 2023
– 9% reduction of sulphur dioxide emissions across Kola MMC in 2017
– 40 ktpareduction of sulphur dioxide emissions in the Kola MMC by 2019

Annual report • 2017Business overview Corporate resposibility Environment
• 136 • • 137 •
Co
mp
any overview
Strategy o
verviewM
arket overview
Business o
verview
Co
rpo
rate go
vernanceInfo
rmatio
n for shareho
lders
Ap
pend
ixes
Environmental impact across Norilsk Nickel’s Russian operations
Air
Air pollutant emissions across the Group // kt
Item 2015 2016
2017
Amount of pollutants, across the Group, including: 2,063.5 1,936.4 1,846.8
Sulphur dioxide (SO2) 2,009.1 1,878.0 1,785.0
Nitrogen oxide (NОx) 9.8 10.1 11.5
Solids 20.7 14.3 14.0
Other 23.9 34.1 36.3
Amount of pollutants, total for Polar Division, including: 1,883.2 1,787.6 1,705.0
Sulphur dioxide (SO2) 1,853.9 1,758.2 1,675.9
Nitrogen oxide (NОx) 1.6 1.5 1.6
Solids 9.0 6.2 6.1
Other 18.7 21.7 21.5
Amount of pollutants, total for Kola MMC, including: 169.8 132.9 121.9
Sulphur dioxide (SO2) 155.1 119.7 109.1
Nitrogen oxide (NОx) 1.2 1.1 1.2
Solids 10.6 7.4 6.9
Other 2.9 4.7 4.7
Amount of pollutants, total for other branches and subsidiaries, including: 10.5 16.0 19.9
Sulphur dioxide (SO2) 0.1 0.1 0.1
Nitrogen oxide (NОx) 7.0 7.5 8.7
Solids 1.1 0.7 1.1
Other 2.2 7.7 10.0
Sulphur dioxide emissions // kt
2,033 –5.0%
–11.2%
1,948 2,0091,878
1,785
2013 2014 2015 2016 2017
20.6
23.1
20.7
14.3 14.0
–2.0%
2013 2014 2015 2016 2017
Solid emissions // ktIn 2017, gross emissions of Norilsk Nickel’s Russian operations exceeded 1,847 kt, which is 90 kt lower than in 2016 (–4.6% y-o-y). The reduction was due to lower sulphur dioxide emissions (down 5.0%) primarily resulting from the liquidated emission sources at Nickel Plant and discontinued pellet production at the pelletisation and roasting section of Kola MMC's Zapolyarny site and other initiatives.
With the launch of a unit to produce sulphite/bisulphite reagents in 2017, the Company is now able to produce this reagent at a new facility using state-of-the-art technologies. Besides, recycling of off-gases helped to reduce sulphur dioxide emissions by another 11.5 ktpa.
as solid (dust) emissions dropping by 480 t (down 6.5%). Lower pollutant emissions as compared to 2016 are attributable mainly to the discontinued pellet production at the Zapolyarny site, along with increased production of sulphuric acid and decreased content of sulphur in the products used for smelting purposes.
Nornickel controls emissions during unfavourable weather conditions to lower concentration of pollutants in residential areas based on timely weather forecasts. In the reporting period, a total of 182 emission control cases were held at Polar Division’s metallurgical operations. To inform the local community of the environmental impact of its metallurgical operations on the quality of air in Norilsk, the Company maintains an automatic toll-free enquiry service line offering environmental forecasts for the city area to anyone dialling 007 or 420 007.
At the moment, Russian legislators are working to introduce statutory requirements for greenhouse gas (GHG) emissions reporting. The Company is monitoring all legislative developments on this front to ensure compliance with the regulations.
In accordance with the applicable guidelines and regulations, Nornickel has assessed its GHG emissions. Based on the current estimates, the Company emits around 10 mtpa of GHG1 (10,031 kt in 2016). In addition, in 2017, the Company reported, on a voluntary basis, its GHG emissions to the Russian Ministry of Natural Resources and Environment.
For more details, please see Key investment projects.
p. 90
In 2017, gross emissions of harmful pollutants in general across Polar Division have dropped by 82.6 kt (down 4.6% y-o-y) mostly as a result of a reduction in sulphur dioxide emissions by 82.3 kt (down 4.7%). Lower sulphur dioxide emissions are attributable to the shutdown of Nickel Plant and migration of smelting operations to modern technologies of Nadezhda Metallurgical Plant.
Analysis of actual emissions for 2017 demonstrated that pollutant emissions at Polar Division as a whole are 160,998 kt (down 8.6%) below the permitted level (with NO rebased to NO2), including sulphur dioxide emissions that are below the statutory maximum as temporarily approved at 149 kt (down 8.2%).
In 2017, further steps were taken to reduce air emissions with a view to gradually achieving maximum permissible emission rates. The sulphur projects rolled out at Copper Plant and Nadezhda Metallurgical Plant are at different completion stages.
At Kola MMC's Zapolyarny site, a cold briquetting technology was introduced in recent years instead of pellet roasting. Two new briquetting lines are now in operation, and the briquetting technology is being fine-tuned to meet the required quality standards. Sulphur dioxide emissions generated by the production processes reduced from 4.8 kt in 2016 to 1.6 kt in 2017.
In Monchegorsk, we are implementing the project – Electrowinning of Chlorine Dissolved Tube Furnace Nickel Powder for the Production Volume of 145 ktpa of Electrolytic Nickel. The project includes reconstruction of cathode nickel facilities in the tank-house to replace the existing electrorefining technology (using soluble anodes) with electrowinning of nickel from chlorine solutions. The new technology will help to reduce air emissions thanks to elimination of anode smelting.
Nornickel has completed its project to produce 3,000 t of electrolytic cobalt fully replacing flame-synthesised cobalt production at the shut down Nickel Plant in Norilsk.
In 2017, gross pollutant emissions from Kola MMC amounted to 121.9 kt, which is 11 kt lower than in 2016 (down 8.3% y-o-y). Sulphur dioxide emissions also reduced by almost 11 kt (down 8.9%), as well

Annual report • 2017Business overview Corporate resposibility Environment
• 138 • • 139 •
Co
mp
any overview
Strategy o
verviewM
arket overview
Business o
verview
Co
rpo
rate go
vernanceInfo
rmatio
n for shareho
lders
Ap
pend
ixes
Nornickel uses a closed water circuit at its mining and metals operations. In general, 85% of all water used by the Company is recycled and reused.
All sources of water used by the Company are subject to government-approved surveillance programmes for water and water protection zones.
Pollutants discharged in wastewater amounted to 217 kt, which is 24 kt more than in 2016 (up 12%). The increase was caused by a natural inflow of snow melt and rain water, large-scale processing of metal-containing feedstock and ramping up of pyrometallurgical capacities at Nadezhda Metallurgical Plant after the shutdown of Nickel Plant.
In 2017, the Company continued to work on reducing discharges by gradually achieving the approved limits on the back of: • optimised water cycle at Polar Division's
concentration facilities; • efforts made to purify production wastewater in
the combined storm water collector and utility tunnel of Nadezhda Metallurgical Plant, as well as production wastewater from Lebyazhye tailings pit at Norilsk Concentrator;
• technologies developed to treat mine water at some mines;
• completion of pre-commissioning stage at the cement plant to implement a closed water circuit and local treatment facilities.
1 The Group's direct GHG emissions were stated based on the earlier estimates (ca. 10 mt of CO2 equivalent) made as part of a project to pilot the Guidelines and Instructions approved by Order of the Russian Ministry of Natural Resources No. 300 dated 30 June 2016. The quantitative estimates include carbon dioxide (CO2 ) and methane (СН4 ) emissions only. Pursuant to the above guidelines and instructions, reporting of other types of GHG emitted by the Company's facilities is not required. Indirect energy-related GHG emissions were not assessed by the Company. There are currently no binding legal requirements in place on reporting GHG emissions, including the indirect energy-related ones.
2013 2014 2015 2016 2017
Water used // m cu m Water re-used // %
1,348
92 9386 85
1,418 1,421 1,4641,342
92
Standard cleanTreated to standard qualityUntreatedInsu�ciently treated
2017
2016
2015
2014
201330
31
30
30
28
26
26
30
27
34
2
4
6
5
7
88
84
77
82
79
146
146
140
144
148
Monchegorsk site received a treatment facility for saline effluent from nickel refining operations for a more integrated treatment of industrial effluents. This technology is unique for Russia, as chemical agents, specifically boric acid, flow back to the production circuit. So the Company produces sodium sulphate and chloride instead of harmful waste. The resulting steam and condensate are then reused in the nickel tank-house to heat solutions, operate heat exchangers. At Zapolyarny site, work is in progress to design a mining water treatment plant for Severny-Gluboky Mine.
In 2017, Kola MMC received a treatment facility for saline effluent.
For more details on the modernization of the Kola MMC
For more details in an interview with the General Director of Kola MMC
Norilsk Nickel’s waste management efforts seek to ensure the repeated use of waste in its production cycle along with meeting statutory waste disposal limits. In 2017, the Company generated approximately 32 mt of production and consumption waste, and around 96% of such waste is deemed virtually non-hazardous for the environment and classified as hazard class 5 waste. This is mostly waste from the mining and smelting operations (rock and overburden, tailings, and metallurgical slags). Nearly 65% of all waste generated across the Company’s operations in 2017 was reused, with the rest of waste disposed of at special facilities.
For safe waste disposal, the Company completed the construction of a new tailings pit for Talnakh Concentrator, 6 km farther to the north-west of the Talnakh District. The facility was built using the most advanced technologies to reduce environmental impact.
Nornickel has designed a new waste dump for industrial waste generated by Polar Division that leverages environmentally safe technologies to
dispose of waste of hazard classes 3–5. The site selected for the waste dump is located 2 km south of Nadezhda Metallurgical Plant site, at a significant distance from the residential areas of Norilsk.
The Company continues reusing waste for preparation of compounds to fill mined-out spaces (granulated slag from melting of non-ferrous metals, overburden and hard rocks, mill tailings) and as flux for melting of metal in smelting furnaces.
In 2017, the Company’s waste disposal did not exceed the limits. Waste is mostly reused in the processes related to the extraction of ore mineral resources, including crushing, backfilling of mined-out areas and pits, and construction and strengthening of tailings pits.
The Company’s waste management efforts are focused on the following:• development of waste disposal sites to reduce
human impact on the environment;• waste reuse maximisation;• reclamation of disturbed areas;• landscaping and improvement projects.
Waste generation by hazard class // kt
Hazard class 2016
2017
Hazard class 5 32,118.4 30,721.8
Hazard class 4 1,113.5 1,189.9
Hazard class 3 29.9 12.7
Hazard class 2 5.8 2.4
Hazard class 1 0.07 0.06
Total 33,267.7 31,926.9
Water
Production waste
Wastewater discharges // mln cubic meters
Water consumption

Annual report • 2017Business overview Corporate resposibility Environment
• 140 • • 141 •
Co
mp
any overview
Strategy o
verviewM
arket overview
Business o
verview
Co
rpo
rate go
vernanceInfo
rmatio
n for shareho
lders
Ap
pend
ixes
Environmental impact metrics of Norilsk Nickel Harjavalta
Item 2015 2016
2017
Industrial wastewater, '000 cu m 728 771 899
Pollutants in industrial wastewater, t
Ni 0.4 0.4 0.5
SO42– 20,051 22,457 25,853
NH4+ (rebased to nitrogen) 36.0 49.5 60.3
Total water consumption, mln cubic meters 10.4 10 11.1
Total air pollutant emissions, t
Ni 1.7 1.6 1.7
NH3 70 70 69
Waste generation, kt 16.5 7.0 5.5
Waste disposal, kt 15.7 0.8 0.8
Norilsk Nickel Nkomati
The company is required to comply with both national environmental regulations and Norilsk Nickel Group's corporate standards. Norilsk Nickel Nkomati pays close attention to environmental safety, is certified and regularly audited for compliance with ISO 14001.
Environmental impact metrics of Norilsk Nickel Nkomati
Item 2015 2016
2017
Total water consumption, mln cubic meters 0.088 0.3327 0.0636
Waste generation, t 1,386 921 431
Waste disposal, t 634 1,611 845
Environmental expenditures, USD mln 0.57 0.42 0.27
The main reasons behind significantly lower consumption of fresh water in 2017 was the use of collected rain water. Waste generation reduced due to the disposal of industrial rubber items and scrap metals.
Environmental impact across Norilsk Nickel’s foreign operations
Norilsk Nickel Harjavalta
Norilsk Nickel Harjavalta has all the necessary environmental permits and operates a certified integrated management system that meets the requirements of ISO 9001, ISO 14001 and OHSAS 18001.
Norilsk Nickel Harjavalta’s main environmental impact consists in the emissions of ammonia (NH3) and nickel (Ni), and discharges of nickel, sulphates (SO4
2–) and ammonia ions (NH4+). In 2017, Norilsk
Nickel Harjavalta met all permit requirements for emissions, discharges and waste disposal volumes. Lower (by 1.5 kt) waste volumes are a result of switching to the Company’s feedstock that is less contaminated with impurities as compared to third party materials.
Biodiversity conservation
Nornickel acquired 235,000 salmon fingerlings and released them into the Umba River together with the Basin Authority for Fisheries and Conservation of Aquatic Biological Resources (Glavrybvod). By helping to recover the population of the Atlantic salmon, the Company makes up for its environmental impact. In addition to that, Nornickel provided assistance in releasing 316,000 sturgeon fingerlings into the Yenisei River. This was the largest project on releasing valuable fish species in the Company’s history.
As part of the Year of the Environment, Nornickel has signed the Cooperation Agreement with the Murmansk Region to support a number of projects in the nature park of the Rybachy and Sredny Peninsulas. The Company will allocate over RUB 7.5 mln to create nature trails and buy security equipment.
Zabaykalsky Krai Government and Nornickel signed the Cooperation Agreement to develop the Relict Oaks State Reserve located in the region. The amount of funding for the project stands at RUB 10 mln.
Nornickel annually provided hundreds of millions of roubles to the nature reserves.
Cooperation with nature reserves
For over a decade now, Nornickel annually provided hundreds of millions of roubles to the nature reserves adjacent to the Company’s production facilities on the Taimyr and Kola Peninsulas for the purpose of preserving the unique Arctic environment.
This is in line with Nornickel’s strategy set to embrace green technologies in the next five years through a new investment cycle to secure sustainable development.
Kola MMC’s sites are only 10–15 km away from the Pasvik and the Lapland Nature Reserves (Murmansk Region). The Company’s Polar Division is located some 80–100 km away from the buffer zone of the Putoransky Reserve (Krasnoyarsk Territory).
2017 MILESTONES
Experts keep monitoring the environmental impact of Nornickel’s production sites on the nature reserves’ ecosystems. Long-term observation results show that environmental conditions are improving each year. “Scientists report growing populations of plants and animals along with the emergence of new species,” said Alexander Tyukin, head of Kola MMC’s R&D and Environmental Safety Department. – We have just discovered a rare plant species, a northern orchid that has not been seen since 2005. It speaks for itself.”

Annual report • 2017Business overview Corporate resposibility Environment
• 142 • • 143 •
Co
mp
any overview
Strategy o
verviewM
arket overview
Business o
verview
Co
rpo
rate go
vernanceInfo
rmatio
n for shareho
lders
Ap
pend
ixes
In 2017, the Putoransky State Nature Reserve kept implementing projects selected under Nornickel’s World of New Opportunities charitable programme.
Norilsk Lakes to Norilsk People
Norilsk Lakes to Norilsk People project implemented since 2013 seeks to preserve the Big Norilsk Lakes, a unique ecosystem of subarctic mountains. During that time, Nornickel provided funding for the recreational fisheries in the upper part of the Pyasina River basin, tourist and trekking infrastructure, construction of a camping station at Lama Lake and a base station at Sobachye Lake. In 2017, as part of the project, the Company allocated over USD 17,000 (around RUB 1 mln) to finance an environmental and educational summer camp at Lake Lama for students of the volunteer school.
THE PUTORANSKY STATE NATURE RESERVE (Taimyr Peninsula)
Save the Bighorn Together
An ambitious programme to protect the endangered species of the bighorn found in the Putoranа Plateau only and listed on Russia’s Red Data Book. The Company provides funding for volunteer training at the Surveillance School, ground research to collect data on the bighorn population, and Putorany. Bighorn. People festival of friends. The project’s funding totals some USD 86,000 (RUB 4.99 mln).
Norilsk
1,887 thousand ha
Area
Visitor centre for tourists and researchers
The visitor centre of the Pasvik Reserve featuring a permanent environmental exposition was officially opened in January 2017 in the settlement of Nickel, Pechengsky District. The visitor centre hosts ecological seminars and conferences, serving as a modern platform for discussing international cooperation issues. In 2011–2016, the Company allocated over USD 1.3 mln (RUB 77 mln) to the project. The visitor centre currently hosts ecological lessons for schoolchildren, exhibitions, lectures, discussions, and forums of various international organisations.
Young scientist training course
Over the last ten years, the reserve serves as a base for a summer camp for schoolchildren involved in various research projects (study of soil and water composition, bird ringing, etc.). The project’s annual funding is over USD 17,000 (some RUB 1 mln).
THE PASVIK NATURE RESERVE (Kola Peninsula)
The Pasvik Nature Reserve is home to rare species listed on the international and Russia’s Red Data Books. Since 2006, as part of the contract signed with Kola MMC, the Pasvik Nature Reserve has been carrying out an ecological assessment of the natural environment in the area of Pechenganickel Plant (Zapolyarny, Nickel and their suburbs, including the Pasvik State Nature Reserve), and developing a long-term environmental monitoring programme.
Nornickel supports scientific research carried out by the nature reserve, its efforts to protect natural and cultural heritage, promote tourism and environmental education. The Company helps establish an international natural historical open-air museum on the Varlam island. Nornickel sponsored the book called The Varlam Island – the Pearl of Pasvik.
Nickel
14.6 thousand ha
Area
Key projects of the Paskvik Nature Reserve supported by Nornickel
For more details on other projects of World of New Opportunities programme
p. 120

Annual report • 2017Business overview Corporate resposibility Environment
• 144 • • 145 •
Co
mp
any overview
Strategy o
verviewM
arket overview
Business o
verview
Co
rpo
rate go
vernanceInfo
rmatio
n for shareho
lders
Ap
pend
ixes
The Lapland State Nature Biosphere Reserve is one of the largest protected areas in Europe covering 278,000 ha. Established to save the wild reindeer from extinction, it now boasts over 1,000 reindeer, the largest reindeer herd in the Northern Europe. The European beaver population has also been successfully restored. Since 2002, the Lapland Biosphere Reserve has entered into contracts to reclaim disturbed natural environment in the areas affected by multi-year emissions from Severonickel Plant, and monitor areas adjacent to Monchegorsk
THE LAPLAND STATE NATURE BIOSPHERE RESERVE (Kola Peninsula)
site and the Lapland Biosphere Reserve. The data obtained during a scientific research provided a basis for the subsequent contractual work to reclaim disturbed lands, and bring about sanitary and fire protection improvements in the forest areas. The Company also provided financial aid for the Lapland Biosphere Reserve to make a new nature trail and publish books about Oleg Semyonov-Tyan-Shansky and Herman Kreps, the reserve founders. In 2017, the total funding of the nature reserve projects exceeded USD 195,000 (RUB 11.4 mln).
Monchegorsk
278 thousand ha
Area
Aquatic bioresources
In 2017, to compensate for the damage done to water bodies of the Yenisey River during the implementation of the Talnakh Concentrator upgrade and retrofit project and sand production at the Seredysh Island deposit, the Company grew and released over 316,000 Siberian sturgeon fingerlings into the Yenisey River. To compensate for damage to water bodies during the construction of a transfer terminal in Murmansk, in 2017, Nornickel released over 235,000 salmon fingerlings into the Northern Fishery Basin.
Landscaping
In 2017, Nornickel launched a pilot project utilising new landscaping technologies to establish sustainable grass cover in the disturbed areas. Perennial grasses and mixed grass crops were planted on the experimental 1 ha land plot close toNadezhda Metallurgical Plant using a hydroseeding technology and complex additives adapted to northern conditions. The project’s financing amounted to some USD 43,000 (RUB 2.5 mln).
Hydroseeding has a number of advantages over traditional planting method, namely quick landscaping and the possibility to cover remote locations, which is especially useful for slopes and hard-to-reach areas. Grass can be sown on virtually any surface featuring a difficult terrain. Experiments proved successful even for such technogenic surfaces as slag and concrete.
The Company regularly allocates funds for landscaping in the regions of operation. Since 2003, Kola MMC, upon recommendation from the nature reserves, has rehabilitated 100 ha of area in Monchegorsk, Zapolyarny towns and Nickel settlement. Kola MMC has had approximately one million trees and bushes planted, including
a pilot project to restore damaged land adjacent to the Company’s site together with the Kola Science Centre of the Russian Academy of Sciences. In 2017, the value of the contract signed with the Lapland Biosphere Reserve was some USD 60,000 (RUB 3.5 mln).
In summer 2017, the Company joined in the Norilsk municipal authorities’ effort to revamp the city’s public spaces doing some urban greening and sanitary improvements. The Company also contributed to the roadside clean-up, water body protection, waterfront landscaping and facelift of several camping sites.
Sanitary clean-up
In 2017, Nornickel carried out a clean-up, land improvement, revamp of warehouses, and improvement of territories assigned to the Company by the order of the Dudinka Administration. Nornickel also carried out post-flooding recovery to clean the coasts and water protection zones along the water bodies.
Environmental education
Other environmental developments in 2016 included the Ecological Marathon launched by the Company in Norilsk as part of its Plant of Goodness corporate volunteer programme.
In 2017, Norilsk Nickel’s total expenditure in this area exceeded USD 7,000. The Company’s volunteer teams polled over 900 respondents about their ecological habits, produced about 50 items from recycled materials, designed 26 environmental education posters, implemented clean-up initiatives in the tundra and Dolgoye Lake, and ran a campaign to care about trees planted in 2016 at the Zapolyarnik stadium. Twelve nest boxes were put up on trees during the trip to Lake Lama.
Environmental recovery programmes
Intermediate energy consumption by the Group
Indicator 2015 2015, % 2016 2016, %
2017
2017, %
Electric power, TJ, including: 42,943 56 32,530 50 32,355 52
Electric power generated by the Company’s enterprises from renewable energy sources (HPPs), TJ
17,027 40 11,856 36 12,175 38
Heating and cooling energy, TJ 25,721 33 29,888 46 24,101 39
Steam, low-grade heat, TJ 8,692 11 2,803 4 5,507 9
Total 77,356 100 65,221 100 61,963 100

Annual report • 2017
• 147 •
Co
mp
any overview
Strategy o
verviewM
arket overview
Business o
verview
Co
rpo
rate go
vernanceInfo
rmatio
n for shareho
lders
Ap
pend
ixes
Business overview Corporate resposibility Environment
• 146 • • 147 •
In October 2017, Nornickel initiated a seminar for citizens on environmental volunteering under the Plant of Goodness programme. The seminar provided valuable ideas on how to plan an environmental campaign, gain investor support and join volunteering events.
Energy efficiency
Nornickel’s major production assets are located beyond the Arctic Circle where the winter lasts eight months a year. It is therefore critical for the Group to ensure reliable and high-quality power supply to its enterprises and population in the regions where it operates.
In 2017, the Company implemented a number of organisational arrangements and upgrades of its key power equipment as part of the Energy Saving and Energy Efficiency Programme.
These initiatives helped achieve savings of 100,116 tonnes of reference fuel (units) for CHPPs, 44.867 mln kWh of electricity for internal needs and 177,732 Gcal of heat against the targets.
In 2017, per unit fuel consumption at CHPPs decreased to 281.4 g/kWh, down by 13.9 g/kWh against the annual budget targets, 27.7 g/kWh vs 2016 and 9.7 g/kWh vs 2015.
Gas producers saved 17.574 mln cubic meters of natural gas in 2017 by cutting gas consumption for own technological needs and reducing technological losses during transportation.
The Company also generates electric power from renewable energy sources at NTEK’s Ust-Khantayskaya and Kureyskaya HPPs (installed capacity of 441 MW and 600 MW, respectively).
In 2017, the share of renewable energy stood at 38% for Nornickel and 44% for its Polar Division.
In 2018–2020, the Company will continue to renovate and upgrade the main power equipment and transmission devices along with waste water treatment systems.
Energy consumption by Norilsk Nickel1
Type of energy resource
2016
2017
Consumption
in volume terms
Consumption,
RUB ’000
Consumption
in volume terms
Consumption,
RUB ’000
Heat power, Gcal 5,587,849 4,702,584 4,737,249 4,393,019
Electric power, thousand kWh 5,158,974 5,272,779 4,489,188 4,854,566
Motor fuel, t 344 17,797 268 15,348
Diesel fuel, t 58,671 2,657,599 52,684 2,730,795
Heating oil, t 40,479 582,489 40,360 566,985
Natural gas, thousand cubic meters 545,712 1,363,718 497,141 1,458,756
Coal, t 49,760 20,612 17,359 4,204
Kerosene and aviation fuel, t 115 5,008 124 6,122
1 No other types of energy resources were used besides those specified in the table
38% the share of renewable energy in 2017
2017 Highlights
• Consolidated revenue increased 11% y-o-y to USD 9.1 billion on the back of higher realized metal prices;
• EBITDA was up 2% y-o-y to a robust USD 4 billion owing to higher metal revenue that was partly negatively offset by RUB appreciation against USD, one-off increase in social-related expenses and accumulation of palladium stock to deliver under the 2018 contracts;
• EBITDA margin amounted to an industry-leading level of 44%;• CAPEX increased by 17% y-o-y to USD 2 billion as Bystrynsky copper
project (Chita) was in its final construction stage and the Bystrinsky concentrator was launched into hot commissioning at the end of 2017, while the upgrade of nickel refining facilities at Kola entered into active construction;
• Reported net debt/EBITDA ratio increased to 2.1x as of the end of 2017 driven mostly by the payment of dividend for 2016 and interim dividend for 2017 and one-off increase of working capital;
• Net debt/EBITDA ratio for the purposes of calculating final dividend for 2017 amounted to 1.88x;
• Major refinancing activities were completed in 2017, with new funding raised at record low interest rates, enabling a reduction of interest cost by over USD 150 million;
• In October 2017, the Company paid interim dividend for 1H2017 in the amount of RUB 224.2 per ordinary share (approximately USD 3.8 per ADR);
• In December 2017, Nornickel signed a 5-year USD 2.5 billion syndicated facility agreement with a group of international banks at Libor +1.5%.
Recent Developments
On January 30, 2018 Moody’s rating agency has raised Nornickel credit rating to the investment grade level “Baa3” and changed the outlook from “Stable” to “Positive”. Therefore, Nornickel currently has investment grade credit ratings from all three international rating agencies Fitch, Moody’s and S&P Global.
In 2017, Nornickel delivered excellent financial results, with revenue increasing by 11% to USD 9 bn and EBITDA margin holding at 44%, one of the best results among global mining peers. On top of that, we succeeded in significantly improving the Company's debt profile and raising debt financing at record low interest rates, which will help us save over USD 150 mln per annum in interest expenses.
In 2017, we launched highly ambitious programmes to improve labour productivity. Furthermore, automation of our IT and production processes continues at a fast pace, while all the support functions are currently being transferred to and consolidated under the Shared Services Centre in Saratov. Also, we commissioned a fibre optic communication line in Norilsk, which will enable us to smoothly implement SAP ERP systems, while also providing the city’s residents with access to high-speed internet.
In 2018, we plan to release over USD 1 bn of our working capital and reduce our leverage (net debt to EBITDA ratio) to below 1.5x by the year-end. We also confirm our CAPEX guidance at ca. RUB 2 bn, including USD 200 mln of investments to complete the construction of Bystrinsky GOK.”
Sergey MalyshevThe Company's Senior Vice President and Chief
Financial Officer
Financial overview (MD&A)
„

Annual report • 2017Business overview Financial overview (MD&A)
• 148 • • 149 •
Co
mp
any overview
Strategy o
verviewM
arket overview
Business overview
C
orp
orate g
overnance
Inform
ation fo
r sharehold
ersA
pp
endixes
Key Corporate Highlights
Cash operating costs
2017 2016 Change,%
Revenue 9,146 8,259 11%
EBITDA¹ 3,995 3,899 2%
EBITDA margin 44% 47% (3 p.p.)
Net profit 2,123 2,531 (16%)
Capital expenditures 2,002 1,714 17%
Free cash flow² (173) 1,591 (111%)
Net working capital² 2,149 455 5x
Net debt² 8,201 4530 81%
Net debt, normalized for the purpose of dividend calculation3 7,495 n.a. n.a.
Net debt/12M EBITDA 2.1x 1.2x 0.9x
Net debt/12M EBITDA for dividends calculation 1.88x n.a. n.a.
Dividends paid per share (USD)4 18.8 7.8 141%
Key Segmental Highlights5
USD million (unless stated otherwise)
2017 2016 Change,%
Revenue 9,146 8,259 11%
Group GMK 7,671 6,194 24%
Group KGMK 888 664 34%
NN Harjavalta 840 727 16%
Other metallurgical 141 84 68%
Other non-metallurgical 1,266 1,699 (25%)
Eliminations (1,660) (1,109) 50%
Consolidated EBITDA 3,995 3,899 2%
Group GMK 4,701 3,883 21%
Group KGMK 169 117 44%
NN Harjavalta 84 45 87%
Other metallurgical (53) (11) 5x
Other non-metallurgical 114 119 (4%)
Eliminations (377) 112 n.a.
Unallocated (643) (366) 76%
EBITDA margin 44% 47% (3 p.p.)
Group GMK 61% 63% (2 p.p.)
Group KGMK 19% 18% 1 p.p.
NN Harjavalta 10% 6% 4 p.p.
Other metallurgical (38%) (13%) (25 p.p.)
Other non-metallurgical 9% 7% 2 p.p.
1 A non-IFRS measure, for the calculation see the notes below.2 A non-IFRS measure, for the calculation see an analytical review document ("Data book") available in conjunction with Consolidated IFRS Financial Results on the
Company’s web site.3 Normalized on interim dividends and deposits with maturity of more than 90 days.4 Paid during the current period.5 Segments are defined in the consolidated financial statements.
RevenueIn 2017, revenue of Group GMK segment increased by 24% to USD 7,671 million. This was primarily driven by higher realized metal prices and transition of NN Harjavalta to the Company’s own Russian feed. This positive effect was partly compensated by lower sales volume in 2017 owing to accumulation of palladium in 2017 and release of stock in 2016.
The revenue of Group KGMK segment increased by 34% to USD 888 million mainly due to the increase in revenue from processing of the feed coming from Polar division.
Revenue of NN Harjavalta increased by 16% to USD 840 million. This was primarily driven by higher realized metal prices and increased metal production from the Company’s own Russian feed.
Revenue of Other metallurgical segment increased by 68% to USD 141 million. This was primarily driven by higher realized metal prices.
Revenue of Other non-metallurgical segment decreased by 25% to USD 1,266 million. This was driven primarily by changes of inter-segment revenue streams driven by transition to Group’s own Russian feed and accumulation of metal stock in 2017.
In 2017, EBITDA of Group GMK segment increased by 21% to USD 4,701 million owing primarily to higher realized metal prices partly offset by lower sales volume in 2017 owing to accumulation of stock in 2017 due to Palladium fund activities and higher base effect of release of stock in 2016 as well as increased cash costs on the back of the Russian rouble appreciation against US Dollar.
EBITDA of Group KGMK segment increased by 44% to USD 169 million primarily owing to the increased sales volume and higher margin of tolling operations.
EBITDA of NN Harjavalta increased by 87% to USD 84 million primarily due to higher revenue and processing the Company’s own Russian feed instead of low-margin third parties feed.
EBITDA of Other metallurgical segment decreased five times to negative USD 53 million primarily due to one-off expenses.
EBITDA of Other non-metallurgical segment decreased by USD 5 million to USD 114 million.
EBITDA of Unallocated segment decreased by 76% to negative USD 643 million primarily due to increased social expenses of the Group.
Cash Operating Costs
2017 2016 Change,%
METAL SALES
Group
Nickel, thousand tons1 215 271 (21%)
from own Russian feed 206 229 (10%)
from 3d parties feed 9 42 (79%)
Copper, thousand tons1 368 374 (2%)
from own Russian feed 365 369 (1%)
from 3d parties feed 3 5 (40%)
Palladium, koz1 2,405 2,779 (13%)
from own Russian feed 2,353 2,758 (15%)
from 3d parties feed 52 21 148%
Platinum, koz1 657 669 (2%)
from own Russian feed 639 661 (3%)
from 3d parties feed 18 8 125%

Annual report • 2017Business overview Financial overview (MD&A)
• 150 • • 151 •
Co
mp
any overview
Strategy o
verviewM
arket overview
Business overview
C
orp
orate g
overnance
Inform
ation fo
r sharehold
ersA
pp
endixes
1 All information is reported on the 100% basis, excluding sales of metals purchased from third parties.2 Metal volumes represent metals contained in semi-products.
2017 2016 Change,%
Gold, koz1 141 155 (9%)
Rhodium, koz1 68 85 (20%)
Cobalt, thousand tons1 3 5 (40%)
Silver, koz1 2,469 2,565 (4%)
Semi-products, nickel, thousand tons2 17 13 31%
Semi-products, copper, thousand tons2 28 15 87%
Semi-products, palladium, koz2 138 115 20%
Semi-products, platinum, koz2 48 43 12%
Semi-products, gold, koz2 8 9 (11%)
Semi-products, silver, koz2 528 148 4x
AVERAGE REALIZED PRICES OF METALS PRODUCED BY NORILSK NICKEL
Nickel (USD per tonne) 10,704 9,701 10%
Copper (USD per tonne) 6,202 4,911 26%
Palladium (USD per oz) 858 614 40%
Platinum (USD per oz) 949 977 (3%)
Cobalt (USD per tonne) 41,977 22,962 83%
Gold (USD per oz) 1,259 1,254 0%
Rhodium (USD per oz) 1,085 668 62%
Revenue, USD million
Nickel 2,304 2,625 (12%)
Copper 2,281 1,839 24%
Palladium 2,346 1,888 24%
Platinum 623 654 (5%)
Semi-products 424 216 96%
Other metals 437 424 3%
Revenue from metal sales 8,415 7,646 10%
Revenue from other sales 731 613 19%
Total revenue 9,146 8,259 11%
Revenue from metals
Ni Nickel
Nickel sales accounted for 27% of the Group’s total metal revenue in 2017 down from 34% in 2016. The decrease by 7 p.p. was driven by the reduction of sales volumes following a decrease of metal production from third party feed and stronger performance of palladium and copper relative to nickel price.
In 2017, nickel revenue decreased by 12% (or USD 321 million) to USD 2,304 million primarily due to lower sales volumes (USD 593 million) owing to decrease of Nickel production from third parties feed and the higher base effect as temporary metal stock was sold in 2016, which was partly offset positively by higher nickel price (USD 267 million).
Additional USD 5 million to nickel revenue in 2017 was contributed by the re-sale of purchased metal to fulfil the Company’s contractual obligations.
The average realized nickel price increased 10% to USD 10,704 per tonne in 2017 from USD 9,701 per tonne in 2016.
Sales volume of nickel produced by the Company from its own Russian feed decreased by 10% (or 23 thousand tons) to 206 thousand tons. The decrease was primarily driven by the sale of metal from a temporary stock in 2016.
Sales volume of nickel produced from third parties feed decreased by 79% in 2017 to 9 thousand tons as Harjavalta started the processing of the Company’s own Russian feed.
Cu Copper
In 2017, copper sales accounted for 27% of the Group's total metal sales, increasing 24% (or USD 442 million) to USD 2,281 million primarily owing to higher realized copper price (USD 483 million) that was partly negatively offset by the decrease in sales volume (USD 41 million).
The average realized copper price increased 26% from USD 4,911 in 2016 to USD 6,202 per tonne in 2017.
Physical volume of copper sales from the Company’s own Russian feed decreased by 1% (or 4 thousand tons) to 365 thousand tons. The decrease owing to the higher base effect as copper from temporary metal stock was sold in 2016 was partly positively offset by the copper sales, produced from concentrate purchased from Rostec.
The volume of copper sales from purchased semi-products decreased by 2 thousand tons to 3 thousand tons in 2017.
Pd Palladium
In 2017, palladium became the largest contributor to the Group’s revenue, accounting for 28% of the Group’s total metal revenue, up by 3 p.p. The palladium revenue increased 24% (or USD 458 million) to USD 2,346 million. The positive impact of higher realized price (USD 681 million) was partly negatively offset by the reduction of sales volume (USD 324 million) mainly owing to the higher base effect as temporary metal stock was sold in 2016 and stock accumulation in 2017 in Palladium fund.
Additional USD 285 million to palladium revenue in 2017 was contributed by the re-sale of purchased metal to fulfil the Company’s contractual obligations (vs USD 184 million in 2016).
Pt Platinum
In 2017, platinum sales accounted for 7% of the Group’s total metal revenue and decreased by 5% (or USD 31 million) to USD 623 million due to lower volumes of platinum sales owing to the higher base effect as metal stock was sold in 2016 (USD 11 million) and lower realized platinum price (USD 20 million) down 3% from USD 977 per oz in 2016 to USD 949 per oz in 2017.
Other metals
In 2017, revenue from other metals increasing 3% (or USD 13 million) to USD 437 million owing to the increase in rhodium (up 30%) and cobalt (up 8%) sales which was partly negatively offset by lower gold (down 9%) and silver (down 5%) revenue.

Annual report • 2017Business overview Financial overview (MD&A)
• 152 • • 153 •
Co
mp
any overview
Strategy o
verviewM
arket overview
Business overview
C
orp
orate g
overnance
Inform
ation fo
r sharehold
ersA
pp
endixes
Semi-products
In 2017, semi-products revenue (primarily copper cake and nickel concentrate) increased by USD 208 million (or 96%) to USD 424 million, and accounted for 5% of the Group’s total metal revenue. This increase was mainly driven by higher physical sales to third parties instead of processing these semis at the Company’s own refineries.
Other sales
In 2017, other sales were up by 19% or USD 731 million primarily owing to the Russian rouble appreciation (USD 80 million) and revenue increase in real terms driven by the increase of prices for services provided to third parties (USD 13 million), and higher revenue from transport and consumer services subsidiaries of the Group, which was partly offset negatively by the divestiture of non-core assets.
Cost of Metal Sales
Cost of metals sales
In 2017, the cost of metal sales increased by 9% (or USD 335 million) to USD 3,968 million owing to:• Increase in cash operating costs by 33%
(USD 965 million);• Increase in depreciation charges by 38%
(USD 174 million);• Change in metal inventories y-o-y (cost of metal
sales decrease by USD 804 million).
Cash operating costs
In 2017, total cash operating costs increased by 33% (or USD 965 million) to USD 3,852 million.
The negative effect of currencies appreciation (RUB and ZAR) amounted to USD 312 million.
The inflationary growth of cash operating costs by USD 115 million was exacerbated by an increase in metal purchase costs (USD 346 million) and increase of the mineral extraction tax (USD 83 million) resulting from the change in legislation in 2017. Mineral extraction tax increased following the cancellation of PGM export duties in September, 2016.
Cash operating costs structure in 2017 and 2016 was affected by consolidation of 50% of Nkomati joint operation.
Cash operating costs
USD million
2017 2016 Change,%
Labour 1,377 1,145 20%
Purchases of metals for resale 530 184 188%
Purchases of raw materials and semi-products 297 292 2%
Materials and supplies 703 520 35%
Mineral extraction tax and other levies 221 122 81%
Third-party services 204 170 20%
Electricity and heat energy 132 101 31%
Fuel 81 60 35%
Production costs related to joint operation 93 79 18%
Transportation expenses 64 71 (10%)
Sundry costs 150 143 5%
Total cash operating costs 3,852 2,887 33%
Depreciation and amortisation 630 456 38%
(Increase)/decrease of metal inventories (514) 290 n.a.
Total cost of metal sales 3,968 3,633 9%
Labour
In 2017, labour costs increased by 20% (or USD 231 million) to USD 1,377 million amounting to 36% of the Group’s total cash operating costs driven by the following:• USD 162 million – cost increase owing to the Russian
rouble appreciation against US Dollar;• USD 50 million – cost decrease following the
decrease of production staff headcount owing primarily to the Nickel pant closure and ongoing downstream reconfiguration program.
• USD 119 million – other increase in real terms primarily driven by the indexation of RUB-denominated salaries and wages.
Purchases of metals for resale
In 2017, expenses on the purchase of metals for resale increased 3 times (or by USD 346 million) to USD 530 million. Metal purchase increase is primarily due to piling up metal stocks to meet additional demand of the Company’s key clients, primarily palladium.
Purchases of raw materials and semi-products
In 2017, expenses on the purchase of raw materials and semi-products increased by 2% (or by USD 5 million) to USD 297 million driven by the following:• USD 58 million – cost increase owing to higher semi-
products prices; • USD 140 million – cost increase owing to the
processing of copper concentrate purchased from Rostec;
• USD 82 million – cost increase owing to purchase of semi-products from Nkomati for further resale to third parties;
• USD 275 million – cost reduction resulting from the decrease of purchased semi-products from third parties for processing at NN Harjavalta as part of ongoing downstream reconfiguration program.
Materials and supplies
In 2017, materials and supplies expenses increased by 35% (or USD 183 million) to USD 703 million driven by the following:• USD 62 million – negative effect of the Russian
rouble appreciation;• USD 11 million – inflationary growth in materials and
supplies;• USD 110 million – cost increase in line with the
ongoing downstream reconfiguration program.
Third-party services
In 2017, cost of third party services increased by 20% (or USD 34 million) to USD 204 million.
The negative effect of the Russian rouble appreciation amounted to USD 18 million.
The cost increase owing to higher volumes of repairs, tolling services, and other production services (USD 37 million) was mostly offset by cost decrease due to the termination of Nkomati concentrate processing (USD 21 million).
Mineral extraction tax and other levies
In 2017, mineral extraction tax and other levies increased by 81% (or USD 99 million) to USD 221 million.
The negative effect of the Russian rouble appreciation amounted to USD 18 million.
Cash cost increase in real terms by USD 81 million was primarily driven by the higher mineral extraction tax resulting from the change in legislation (USD 83 million), resulting from cancellation of PGM export duties in 2016 for metals, produced by the Company.
Сhange in mineral extraction tax rate in January 2017 was mostly compensated by cancellation of PGM export duties in September 2016.
Electricity and heat energy
In 2017, electricity and heat energy expenses increased by 31% (or USD 31 million) to USD 132 million driven by the following:• USD 10 million – negative effect of the Russian
rouble appreciation;• USD 22 million – increase in expenses owing to
higher consumption of energy due to the ongoing downstream reconfiguration program (Polar division feed processing at Kola MMC, which purchases electricity from third parties) and energy tariffs inflationary growth.
Fuel
In 2017, fuel expenses increased by 35% (or USD 21 million) to USD 81 million driven by the following:• USD 8 million – negative effect of the Russian rouble
appreciation;• USD 15 million – higher fuel oil and other oil products
prices.

Annual report • 2017Business overview Financial overview (MD&A)
• 154 • • 155 •
Co
mp
any overview
Strategy o
verviewM
arket overview
Business overview
C
orp
orate g
overnance
Inform
ation fo
r sharehold
ersA
pp
endixes
Transportation expenses
In 2017, transportation expenses decreased by 10% (or USD 7 million) to USD 64 million driven by the following:• USD 7 million – negative effect of the Russian rouble
appreciation;• USD 14 million – costs decrease driven by
transportation of Nkomati concentrate to third parties instead of NN Harjavalta production facilities.
Sundry costs
In 2017, sundry costs increased by 5% (or USD 7 million) to USD 150 million, driven by the following:• USD 19 million – negative effect of the Russian rouble
appreciation;• USD 12 million – decrease in insurance expenses
owing to the renegotiation of property insurance agreements on the same insurance cover terms.
Production costs related to joint operation
In 2017, production costs related to joint operation increased by 18% (or USD 14 million) to USD 93 million, driven by the following:• USD 8 million – negative effect of the South African
rand appreciation;• USD 6 million – increase in expenses owing to the
higher sales volume of Nkomati concentrates..
Depreciation and amortisation
In 2017, depreciation and amortisation increased by 38% (or USD 174 million) to USD 630 million.
Russian rouble appreciation amounted to depreciation and amortisation increase by USD 62 million.
Depreciation charges increased in real terms by USD 112 million mainly due to additions to production assets at the Company’s operating subsidiaries in Russia in 2H2016 and in 2017.
(Increase)/decrease of metal inventories
In 2017, comparative effect of change in metal inventory amounted to USD 804 million resulting in a decrease in cost of metal sales, driven by the following:• USD 729 million – sale of metal from temporary stock
in 2016 as part of reconfiguration programme, as well as a built-up of palladium stock and accumulation of metal stock in 2017 to meet additional demand of the Company’s key customers.
• USD 75 million – comparative effect of change in work-in-progress, primarily due to higher accumulation of work-in-progress at Russian subsidiaries of the Group in 2017 as part of ongoing downstream reconfiguration program and due to start of Rostec copper concentrate processing in 2017.
Сost of Other Sales
In 2017, cost of other sales increased by 24% (or USD 124 million) to USD 632 million.
Russian rouble appreciation amounted to cost of other sales increase by USD 72 million.
Cost of other sales increased in real terms by USD 52 million comprised of USD 96 million increase in expenses resulting from higher transportation services, indexation of RUB-denominated salaries and wages and growth of other services, which were partly offset positively by the sale of non-core assets resulting in a cost reduction of USD 44 million.
Selling and Distribution Expenses
Selling and distribution expenses decreased 32% (or USD 36 million) to USD 75 million due to the cancellation of PGM export duties in September 2016 as part of Russian Federation’s WTO membership terms (USD 60 million cost reduction), which was partly negatively offset by increase of transportation expenses primarily due to increase of semi-product sales.
USD million
2017 2016 Change,%
Transportation expenses 38 23 65%
Staff costs 13 13 0%
Marketing expenses 14 7 100%
Export duties 1 61 (98%)
Other 9 7 29%
Total 75 111 (32%)
General and Administrative Expenses
USD million
2017 2016 Change,%
Staff costs 478 376 27%
Taxes other than mineral extraction tax and income tax 79 58 36%
Third party services 72 55 31%
Depreciation and amortisation 32 20 60%
Rent expenses 25 19 32%
Transportation expenses 8 6 33%
Other 65 47 38%
Total 759 581 31%
In 2017, general and administrative expenses increased by 31% (or USD 178 million) to USD 759 million. Rouble appreciation contributed to USD 71 million cost increase. General and administrative expenses increased in real terms due to the following:• USD 38 million – increase in staff costs mainly due
to salaries indexation;
• USD 30 million – increase of costs, resulting from the automatization of production processes and roll out of new IT systems, including USD 17 million of staff costs;
• USD 20 million –higher property tax and amortisation charges.
Other Net Operating Expenses
USD million
2017 2016 Change,%
Social expenses 303 111 173%
Change in allowance for doubtful debts 19 14 36%
Change in allowaOce for obsolete and slow-moving inventory 11 (2) n.a.
Change in provision for reconfiguration of production facilities (4) (33) (88%)
Other 33 (6) n.a.
Total 362 84 4x
In 2017, other net operating expenses increased by USD 278 million to USD 362 million owing to one-off social expenses including an estimated provisional cost of long-term social agreement with the government of Zabaikalsky Krai and expenses attributed to the development of skiing resort in Sochi.
Other increase of other net operating expenses was primarily driven by change in allowances for doubtful debts, obsolete and slow-moving inventory and other current assets in line with annual stock counts as well as reversal of provision for reconfiguration of production facilities in 2016.
Finance Costs
USD million
2017 2016 Change,%
Interest expense on borrowings net of amounts capitalized 386 403 (4%)
Unwinding of discount on provisions and payables 133 46 189%
Other 16 4 4x
Total 535 453 18%

Annual report • 2017Business overview Financial overview (MD&A)
• 156 • • 157 •
Co
mp
any overview
Strategy o
verviewM
arket overview
Business overview
C
orp
orate g
overnance
Inform
ation fo
r sharehold
ersA
pp
endixes
Increase in finance costs by 18% y-o-y to USD 535 million was mainly driven by increase of Unwinding of discount on provisions and payables.
In 2017, the Company reduced the average cost of debt to the level of 4.6% as of year-end 2017 from 5.1% as of year-end 2016 due to the consistent implementation of financial policy targets that enabled to partially offset the multiple increase of base rates (Libor) in the current period.
Major factors of the decrease of the average cost of debt:• Reduction of funding cost of more expensive
Rouble denominated debt in credit portfolio by its substitution by Dollar denominated debt in 1H2017, together with the reduction of interest rate of the bilateral Rouble denominated credit line in the amount of RUB 60 billion in October 2017.
• Partial refinancing of more expensive bilateral credit lines by proceeds of 5-year syndicated facility in the amount of USD 2.5 billion under which Nornickel has achieved one of the lowest interest rates of Libor 1M+1.50% per annum available for Russian corporates on international syndicated market since 2008 for the transactions of such size and term. In addition, Nornickel managed to reduce interest rates under the rest Dollar denominated bilateral credit lines within the Group’s portfolio.
• In July 2017, the Company reached an agreement with PJSC Sberbank to reduce interest rate under GRK Bystrinskoye LLC project financing by issuing guarantee on behalf of PJSC MMC Norilsk Nickel to secure performance obligations of GRK Bystrinskoye LLC.
Income Tax Expense
In 2017 income tax expense decreased by 3% to USD 719 million driven mostly by the decrease of taxable profit, partly offset by Russian rouble appreciation against US Dollar in 2017.
Income Tax Expense
USD million
2017 2016 Change,%
Current income tax expense 686 686 0%
Deferred tax expense 35 59 (41%)
Total 721 745 (3%)
The breakdown of the current income tax expense by tax jurisdictions
USD million
2017 2016 Change,%
Russian Federation 672 679 (1%)
Finland 8 5 60%
Rest of the world 6 2 3x
Total 686 686 0%
The effective income tax rate in 2017 of 25.3% was above the Russian statutory tax rate of 20%, which was primarily driven by non-deductible social expenses, as well as an increase in provisions for impairment of property, plant and equipment.
EBITDA
USD million
2017 2016 Change,%
Operating profit 3,123 3,281 (5%)
Depreciation and amortisation 645 557 16%
Impairment of non-financial assets 227 61 4x
EBITDA 3,995 3,899 2%
EBITDA margin 44% 47% (3 p.p.)
In 2017, EBITDА increased by 2% (or USD 96 million) to USD 3,995 million with the EBITDA margin amounting to 44% (down from 47% in 2016). Increase in metal prices was almost offset by lower sales volume in 2017 owing to accumulation of stock in 2017 and release of temporary metal stock in 2016 as well as increased cash costs on the back of the Russian rouble appreciation against US Dollar and one-off increase in social expenses.
Net Profit Before Non-Cash Write-Offs and Foreign Exchange Differences USD million
2017 2016 Change,%
Net profit 2,123 2,531 (16%)
Impairment of non-financial assets 227 214 6%
Foreign exchange gain (159) (491) (68%)
(Gain)/loss from disposal of subsidiaries and assets classified as held for sale (20) 4 n.a.
Net profit before non-cash write-offs and foreign exchange differences 2,171 2,258 (4%)
Statement of Cash FlowsUSD million
2017 2016 Change,%
Cash generated from operations before changes in working capital and income tax 4,103 3,958 4%
Movements in working capital (1,670) 83 n.a.
Income tax paid (670) (530) 26%
Net cash generated from operating activities 1,763 3,511 (50%)
Capital expenditure (2,002) (1,714) 17%
Other investing activities 66 (206) (132%)
Net cash used in investing activities (1,936) (1,920) 1%
Net cash used in financing activities (2,237) (2,399) (7%)
Effects of foreign exchange differences on balances of cash and cash equivalents (63) 35 n.a.
Net decrease in cash and cash equivalents (2,473) (773) 3x
In 2017, net cash generated from operating activities decreased by 50% y-o-y to USD 1.8 billion primarily driven by the increase in working capital in 2017 following the optimisation of trade financing terms, partial payment of payables due to Rostec and increase of metal stock.
Reconciliation of the net working capital changes between the balance sheet and cash flow statement is presented below.

Annual report • 2017Business overview Financial overview (MD&A)
• 158 • • 159 •
Co
mp
any overview
Strategy o
verviewM
arket overview
Business overview
C
orp
orate g
overnance
Inform
ation fo
r sharehold
ersA
pp
endixes
Change of the net working capital
USD million
2017 2016
Change of the net working capital in the balance sheet (1,694) 575
Foreign exchange differences 115 38
Change in income tax payable (7) (161)
Other changes, including reserves (84) (369)¹
Change of working capital per cash flow (1,670) 83
Capital investments breakdown by projects
USD million
2017 2016 Change,%
Polar Division, including: 860 884 (3%)
Skalisty mine 216 153 41%
Taymirsky mine 93 68 37%
Komsomolsky mine 18 40 (55%)
Oktyabrsky mine 69 59 17%
Talnakh Concentrator 89 253 (65%)
Reconstruction/modernisation of production facilities related to closing of Nickel plant 11 24 (54%)
Kola MMC 228 89 156%
Chita (Bystrinsky) project 449 269 67%
Other production projects 391 421 (7%)
Other non-production assets 12 4 3x
Intangible assets 62 47 32%
Total 2,002 1,714 17%
1 Includes one-off effect of copper concentrate purchase from Rostec.
Debt and Liquidity Management USD million
As of 31 December 2017
As of 31 December 2016Change,
USD million
Change, %
Long-term 8,236 7,276 960 13%
Short-term 817 579 238 41%
Total debt 9,053 7,855 1,198 15%
Cash and cash equivalents 852 3,325 (2,473) (74%)
Net debt 8,201 4,530 3,671 81%
Net debt /12M EBITDA 2.1x 1.2x 0.9x –
Net debt /12M EBITDA for dividend payments 1.88x n.a. n.a. –
In 2017, CAPEX increased by 17% to USD 2.0 billion. The growth was mainly due to the completion of construction and start of hot commissioning of Bystrinsky mining and concentration complex
(Bystrinsky project) in Zabaykalsky region, as well as to the ramp-up of projects related to the modernisation of nickel refining facilities at Kola MMC in line with the Company’s reconfiguration program.
As of December 31, 2017, the Company’s total debt amounted to USD 9,053 million which represents 15% increase (USD 1,198 million) compared to year-end 2016. The Company’s debt portfolio remains predominantly long-term. As of December 31, 2017, the share of long-term debt in the total debt portfolio amounted to 91% (or USD 8,236 million) as compared to 93% (or USD 7,276 million) as of the year-end 2016.
Net debt/EBITDA ratio increased to 2.1x as of the year-end 2017 from 1.2x as of year-end 2016. Such increase was caused by the growth of Net debt by 81% to USD 8,201 million as a result of 74% decrease in Cash and cash equivalents to USD 852 million. Substantial decrease of Cash and cash equivalents was mainly caused by the increase of working capital, in particular due to the early repayment of advances from off-takers in the amount of USD 650 million, as the margin under these advances at the end of the year was twice as higher than the one under the bank loans available for the Company. By the beginning of 2018 the Company reached agreements with a number of its off-takers on new terms of the advances. In February 2018, Nornickel entered into a new advance transaction for the amount of USD 300 million with one of its counterparties. The Company also continues to balance its liquidity cushion with more flexible and cost efficient financial instruments such as committed reserved credit lines. As of December 31, 2017, the Group maintained additional liquidity sources in form of committed reserved credit lines in the total amount of more than USD 3 billion.
In 2017, Nornickel continued to optimize its debt portfolio in order to improve its profile, further reduce average cost of debt and maintain its average maturity profile in line with the year-end 2016.
In 2017 Nornickel reduced the share of more expensive Rouble denominated debt in its portfolio from 29% as of the year-end 2016 to 15% as of
December 31, 2017, by prepayment of Rouble denominated credit facilities in the amount of RUB 60 billion and successful placement of two Eurobond issues totaling USD 1.5 billion. In April 2017, Nornickel issued USD 1 billion Eurobond maturing in 2023 with an annual coupon rate of 4.10% that was inside the Company’s outstanding Eurobonds’ curve. In June 2017, the Group closed a USD 500 million Eurobond offering maturing in 2022 with an annual coupon rate of 3.849%. The coupon was fixed at the lowest level ever for the Company’s issuances on international debt capital markets.
In December 2017, the Company signed a 5-year syndicated facility in the amount of USD 2.5 billon with 15 international banks from America, Europe and Asia. The funds were used to partially refinance the existing bilateral credit lines and provide for liquidity reserve to address the Company’s funding needs in 1H2018, in particular for repayment of Eurobond issue maturing in April 2018. Such strategy enabled the Company to eliminate refinancing risks for the next two years in 2018-2019.
In 2017, the Company’s credit ratings assigned by S&P Global and Fitch remained at investment grade level of “BBB-“ with “Stable” outlooks. As of the year-end 2017, the Company’s credit rating assigned by Moody’s remained at the level of “Ba1” with “Stable” outlook capped by Russia’s sovereign country celling. On January 29, 2018, Moody’s rating agency raised Nornickel credit rating to the investment grade level “Baa3” with “Positive” outlook following the change of Russia's country ceiling for foreign currency debt to “Baa3” and the outlook on sovereign rating to “Positive” from “Stable”. Therefore, currently Nornickel has investment grade credit ratings from all three international rating agencies Fitch, Moody’s and S&P Global.

CORPORATE GOVERNANCE
Deputy Chairman’s letter
Corporate governance framework
Board of Directors
President and Management Board
Remuneration
Risk management and internal controls
Independent audit
162
165
170
185
193
195
203

Deputy Chairman’s letter
Corporate governance is key to the success of MMC Norilsk Nickel as a public company. The Corporate Governance, Nomination and Remuneration Committee works hard alongside the Board of Directors to implement best corporate governance practices and procedures across the Company.
its committees, strengthening of the internal audit function, enhanced transparency and disclosure levels.
Throughout 2017, the Audit and Sustainable Development Committee reviewed reports on key strategic and operational risks and also the current status of the Company’s risk management framework. As part of its assessment of internal controls, the committee engaged in regular analysis of reports prepared by the Internal Control Department. Health, safety, and environment remained a priority for us. On a quarterly basis, the Audit and Sustainable Development Committee reviewed reports on the Company’s progress in pursuing its health and safety strategy, along with environmental projects and initiatives.
Environmental matters (primarily the Sulphur Project aiming to cut sulphur dioxide emissions in Polar Division) were at the centre of attention for the Board’s Strategy Committee. The committee was heavily involved in developing recommendations for directors when drafting the Company’s updated strategy (showcased at the Strategy Day in November 2017) and a number of functional strategies (on project management, construction, repairs, long-term production planning, exploration and prospecting, sales, marketing and IT). Another focus area were the matters directly linked to our operations. Those included progress of major investment projects, production reconfiguration, Technology Breakthrough initiative, and programme on efficiency improvement and cost reduction.
This goes beyond the pragmatics of investor appeal and shareholder confidence, and becomes an essential tool to improve the efficiency of our operations and maintain our competitive edge. In 2017, we approved the new version of the Company’s Charter while also introducing a number of by-laws (regulations and policies) to make sure we are aligned with global best practices and retain our leadership in the global market to enhance trust with our shareholders and investors.
The Corporate Governance Excellence Programme launched by the Corporate Governance, Nomination and Remuneration Committee has been in place since 2014. In line with that programme, in 2014–2017, the Board of Directors approved several by-laws designed to improve
our corporate governance. Those included: Code of Conduct and Ethics for Members of Board of Directors, Professional Development Policy for Members of Board of Directors, Performance Evaluation Policy for Board of Directors, Policy on Development and Approval of Vote Recommendations on Candidates Nominated to Board of Directors, Dividend Policy, and new versions of regulations on the Board committees.
In 2017, the Company continued to enhance its corporate governance framework following the standards set out in the Corporate Governance Code, which was endorsed by the Bank of Russia. Special focus was given to planning and implementing sustainable development and corporate social responsibility initiatives, greater efficiency of the Board of Directors and
Annual report • 2017Corporate governance Deputy Chairman’s letter
• 162 • • 163 •
Co
mp
any overview
Strategy o
verviewM
arket overview
Business o
verview
Corp
orate governance
Inform
ation fo
r sharehold
ersA
pp
endixes

In 2018, the Audit and Sustainable Development Committee will continue its hard work to promote independence and avoid bias in the Company’s internal and external audits while also fostering the reliability and enhancing performance of the corporate risk management universe. The committee will also go on with the programme to instil a culture of occupational safety and prevent irresponsible work practices that can potentially lead to accidents.
In 2017, the Corporate Governance, Nomination and Remuneration Committee prioritised matters related to long-term projects under the programme to enhance corporate governance. The committee reviewed progress of initiatives that are part of the Human Capital Development Programme, along with the Company’s mid-term Charity Policy. On top of that, the Board of Directors approved a number of by-laws covering corporate and social matters, including Human Rights Policy, Freedom of Association Policy, Equal Opportunities Programme, Working Conditions Policy, Local Community Relations Policy, Environmental Policy, Quality Policy, and Renewable Energy Sources Policy. Also, as a way to strengthen corporate efforts aimed at fighting corruption and ensuring compliance with antitrust regulations, in 2017, the Board of Directors approved the Anti-Corruption Policy and Antitrust Compliance Policy.
In its relations with shareholders and investors, we seek to ensure compliance with applicable laws and principles of openness and transparency. With a view to improving its transparency and enhancing information security and confidentiality, the Company approved the amended version of the Information Policy Regulations of PJSC MMC Norilsk Nickel. The new Regulations expand the Company’s disclosure commitments and provide further guidance on the mandatory disclosure required by regulators.
We will remain committed to continuous improvement of our corporate governance practices in 2018. The Board of Directors and its committees and the management are well aware of the areas where we can excel further, and recognise the importance of these efforts.
Corporate governance frameworkLetter from the Board of Directors
The Board of Directors views compliance with key principles and recommendations of the Corporate Governance Code as an efficient tool to improve corporate governance and ensure long-term sustainable growth.
Nornickel's corporate governance framework relies on the following principles: • equitable and fair treatment of every shareholder;• professionalism and leadership of the Board of
Directors;• accountability of the Board of Directors and
executive bodies;• corporate social responsibility; • transparent and timely disclosure;• anti-corruption measures.
These principles are reflected in Nornickel’s official documents available on its website. Those include the Charter, Regulations on the Board of Directors, Information Policy Regulations, and Anti-Corruption Policy.
Principles
Nornickel's corporate governance framework is designed to take into account and balance the interests of shareholders, the Board of Directors, managers and employees, as well as other stakeholders.
Nornickel is guided by the applicable laws of the Russian Federation and principles set forth in the Corporate Governance Code that has become a key source of information for the development of the Company's internal regulations and a guidance to nurture best corporate governance practices.
The Company’s improvements in environmental protection, social responsibility and governance (ESG) were recognised by independent agencies, with MSCI ESG upgrading Nornickel’s rating from CCC to B and the score by Sustainalytics going up from 49 to 58 (compared to 46 in 2015).
In line with best practices, the Board of Directors of MMC Norilsk Nickel reaffirms the Company’s commitment to the highest corporate governance standards, and confirms its compliance with key material principles of the Corporate Governance Code as recommended by the Bank of Russia.
Internal Documents and PoliciesAndrey BougrovSenior Vice-President,Deputy Chairman of the Board of Directors,MMC Norilsk Nickel
Annual report • 2017Corporate governance Deputy Chairman’s letter
• 164 • • 165 •
Co
mp
any overview
Strategy o
verviewM
arket overview
Business o
verview
Corp
orate governance
Inform
ation fo
r sharehold
ersA
pp
endixes

Governance structure
General Meeting of Shareholders
This is the supreme corporate body of the Company.
Its authority includes:• amending and restating the Charter;• approving the revised Charter;• restructuring and liquidating the Company;• increasing and/or decreasing the authorised capital;
The General Meeting of Shareholders is convened on an annual basis. It takes place no sooner than three and no later than six months following the end of the preceding financial year.
Extraordinary General Meetings of Shareholders may be convened by the Board of Directors or at the request of the Audit Commission, the Company’s auditor or shareholders owning at least 10% of the Company’s voting shares.
Except for the cumulative voting to elect members of the Board of Directors, each voting share is counted as one vote at the General Meeting of Shareholders.
Board of Directors
This is a collegial governance body in charge of strategic management of the Company and oversight of its executive bodies' activities.
Pursuant to the Charter, the Board consists of 13 directors.
Members of the Board are elected at the Annual General Meeting of Shareholders for a period extending until the next Annual General Meeting of Shareholders.
Independent directors
Independent directors are directors having sufficient professional skills, experience and independence to act on their own and make impartial and reasonable decisions that are not influenced by the Company's executive bodies, particular groups of shareholders or other stakeholders.
The Company adheres to international standards and recommendations set out in the Corporate Governance Code of the Bank of Russia relating to the required number of independent directors. As at 31 December 2017, four of the Company's Board members (i.e. 30.8%) met the director’s independence criteria as defined by the Moscow Exchange.
Committees of the Board of Directors
Committees are ancillary bodies set up by the Board of Directors. Their function is to provide preliminary review of critical matters and advise the Board on relevant decisions.
The Board of Directors has set up four committees:• Audit and Sustainable Development Committee;• Strategy Committee; • Budget Committee;• Corporate Governance, Nomination and Remuneration
Committee.
President
The President is the sole executive body in charge of the day-to-day operations of the Company. The President is elected at a General Meeting of Shareholders for an indefinite period and acts as the Chairman of the Management Board.
The President reports to the Board of Directors and the General Meeting of Shareholders.
Since 2015, this position has been held by Vladimir Potanin (CEO of the Company in 2012–2015).
For more details on members of the Chairman of the Board
of Directors.
p. 170
For more details on members of the Independent directors.
p. 171
For more details on members of the Committees
p. 181
For more details on members of the President.
p. 185
• splitting and/or consolidating the Company's shares;• electing the Company's President and members of
the Board of Directors and Audit Commission; • approving the Company’s auditor; • approving annual reports, accounting/financial
statements, and by-laws on the Company's corporate bodies;
• distributing annual profit;• paying dividends.
Chairman of the Board of Directors
The Chairman is responsible for day-to-day operation of the Board of Directors, convening and chairing its meetings, making arrangements for minute-taking, and chairing the General Meetings of Shareholders.
For the last four years, the Board has been chaired by Gareth Peter Penny, an independent director.
President — Chairman of the Management Board
Corporate Secretary
Corporate Governance, Nomination and Remuneration Committee
Audit and Sustainable Development Committee
Budget CommitteeStrategy Committee
Management Board
Internal Audit Department
Approval
Provision of a statement
Election
Election
Reporting
Reporting
Elec
tion
Elec
tion
App
oint
men
t
Rep
ortin
g
Rep
ortin
g
Elec
tion
Rep
ortin
g
Rep
ortin
g
App
oint
men
t of
the
head
Rep
ortin
g
Rep
ortin
g
•
•
•
•
Independent Auditor
Internal Control and Risk Management Unit
Audit Commission
General Meeting of Shareholders
Board of Directors
For more details on members of the Board of Directors.
p. 175
Annual report • 2017Corporate governance Corporate governance framework
• 166 • • 167 •
Co
mp
any overview
Strategy o
verviewM
arket overview
Business o
verview
Corp
orate governance
Inform
ation fo
r sharehold
ersA
pp
endixes

Management Board
This is a collegial executive body in charge of the day-to-day management of the Company within its scope of authority as set out in the Charter and the implementation of resolutions approved by the General Meeting of Shareholders and the Board of Directors.
Members of the Management Board are elected by the Board of Directors for an indefinite period. As at 31 December 2017, the Management Board consisted of 13 members.
Corporate Secretary
This is a corporate officer whose duties include managing shareholder relations, making the necessary arrangements to protect their rights and interests, and providing efficient operating support to the Board of Directors. The Corporate Secretary reports to the Board of Directors.
Pursuant to the Charter, the Corporate Secretary is appointed by the Board of Directors for a three-year term.
Since 2011, this position has been held by Pavel Platov.
Audit Commission
The Audit Commission controls the Company's financial and business transactions.
It performs annual internal audits of the Company’s financial and business operations, as well as other internal audits as it may see fit or as requested by the General Meeting of Shareholders, the Board of Directors or any shareholders owning at least 10% of the Company’s stock.
Members of the Audit Commission are elected at an Annual General Meeting of Shareholders for a period extending until the next Annual General Meeting of Shareholders. Members of the Audit Commission shall
not simultaneously serve on the Company’s Board of Directors or hold other positions in the Company's corporate bodies.
Independent Auditor
This is an audit firm commissioned to audit accounting/financial statements of the Company and provide an independent opinion regarding their accuracy.
The auditor is approved by the Annual General Meeting of Shareholders.
In 2017, the Annual General Meeting of Shareholders approved JSC KPMG as the Company's auditor for both IFRS and Russian accounting standards.
Corporate governance improvementsNornickel continuously improves its corporate governance framework to enhance efficiency and ensure compliance with global best practices. The Company adheres to recommendations set out in the Corporate Governance Code of the Bank of Russia.
Our Corporate Governance Framework Improvement Programme was approved and adopted by the Corporate Governance, Nomination and Remuneration Committee back in December 2013. In 2017, the Programme was enhanced with a set of initiatives aimed at improving performance of the Board and its committees. Some of the key corporate governance improvement initiatives in 2017 included: • approving the revised Charter;• approving the revised Regulation on Audit and
Sustainable Development Committee of the Board of Directors;
• approving the revised Information Policy Regulations;• approving the revised Anti-Corruption Policy.
The ESG analysts welcomed our new/updated environmental and social responsibility policies, boosting the Company's position in the rankings provided by the leading global agencies. MSCI ESG upgraded our rating from ССС to B, while Sustainalytics raised our score from 49 to 58 (industry average).
In 2018, the Company plans to gradually implement the principles and procedures set out in the approved regulations in order to improve the performance of the Company’s Board of Directors and its committees.
For more details on members of the Management Board
p. 185
For more details on members of the Independent Auditor.
p. 203
For more details on members of the Internal Control and Risk
Management Unit.
p. 195
For more details on members of the Internal Audit Department
p. 195
For more details on members of the Corporate Secretary
p. 184
For more details on members of the Audit Commission.
p. 200
Achieving excellence in corporate governance
For more details on compliance with the Corporate Governance
Code of the Bank of Russia
p. 272
Corporate governance assessment Nornickel introduced annual performance assessments of the Board of Directors in 2014 in order to improve its corporate governance framework. All directors must fill out an online questionnaire following a schedule approved by the Board of Directors. The questionnaire contains 76 questions, divided into three parts and 15 sections. All questions are graded on a scale from 1 to 10. For each question there is a text field where directors may enter additional comments. Answering all questions is mandatory.
Such evaluation of the Board of Directors helps us identify gaps, their root causes and opportunities for improvement.
Internal Control and Risk Management Unit
This unit is in charge of improving the risk management and internal control framework, detecting and preventing any waste, misuse or misappropriation of funds or assets of the Company and its subsidiaries, as well as any other wrongdoings and theft, ensuring accuracy of metrics and measurement standards and combating illegal activities, such as money laundering and terrorism financing.
Internal Audit Department
This department is in charge of independent audits, including assessment of the risk management and internal control framework of the Company and its subsidiaries.
Annual report • 2017Corporate governance Corporate governance framework
• 168 • • 169 •
Co
mp
any overview
Strategy o
verviewM
arket overview
Business o
verview
Corp
orate governance
Inform
ation fo
r sharehold
ersA
pp
endixes

Board of Directors Functions of the Board of Directors
Meetings of the Board of Directors (in person or in absentia) are held as and when required, but at least once every six weeks. The procedure for convening and holding meetings of the Board of Directors is specified in the Company’s Regulation on the Board of Directors.
The Board of Directors sets the fundamental principles of business conduct and is responsible for nurturing our business and social culture.
The scope of powers of the Board of Directors includes:• setting priority goals and defining Company’s
development strategy;
• approving the Company’s Dividend Policy and providing recommendations on dividend per share;
• approving the internal control system and procedures, identifying key risks associated with the Company’s operation, and implementing risk management initiatives and procedures;
• approving, electing and terminating powers of members of the Management Board, setting remuneration payable to the Company’s President, members of the Management Board, Corporate Secretary, and Head of Internal Audit;
• acting on other matters as provided for by the Federal Law No. 208-FZ On Joint Stock Companies dated 26 December 1995, and the Company’s Charter.
Chairman of the Board of Directors
The Chairman of the Board of Directors is elected among the members of the Board of Directors by themselves by a majority vote from the total number of members of the Company’s Board of Directors. The Board of Directors is entitled to elect a new Chairman of the Board of Directors at any time. When the Chairman of the Board of Directors is unavailable, the respective responsibilities are assumed by a member of the Board of Directors appointed by the Board of Directors.
The key goal of the Chairman of the Board of Directors is to ensure high levels of trust at Board meeting and constructive cooperation between the members of the Board and corporate management.
Pursuant to the Regulation on the Board of Directors approved by the Annual General Meeting of Shareholders of MMC Norilsk Nickel held on 30 June 2009, the key responsibilities of the Chairman of the Board of Directors are as follows:• ensuring high efficiency of the Board of Directors and
its committees;• convening the Board of Directors meetings and
preparing their agendas;
• chairing the Board of Directors meetings or organising absentee voting;
• making arrangements for minutes to be taken at meetings of the Board of Directors and signing the same;
• preparing reports of the Board of Directors for the year to be included in the Company’s Annual Report.
Since March 2013, the Board of Directors has been chaired by independent non-executive director Gareth Peter Penny. The Company believes that to fully meet the best global practices. The independent Chairman of the Board of Directors of the Company ensures the most efficient interaction between the Board of Directors, shareholders and other stakeholders. During the year the Board, under his leadership, approved several crucial resolutions dealing with the Company’s growth strategy, long-term production planning, marketing and sales strategy, strategic health and safety issues, environmental projects and human capital development, and took steps to preserve the Company's competitive edge. Simultaneous participation of the Chairman of the Board of Directors in other companies’ boards of directors did not affect his performance in respect of the Board of Directors of MMC Norilsk Nickel.
Independent directors
In accordance with global corporate governance practices and recommendations of the Bank of Russia’s Corporate Governance Code, no less than one third of the Board of Directors should consist of independent directors. Moreover, the Company believes that independent directors are key to efficient operation of the Board of Directors and thoughtful decision-making.
All independent directors meet the independence criteria recommended by the Corporate Governance Code and requirements established by the current version of the Listing Rules of the Moscow Exchange, which state that an independent director is one who is not related to:• the Company;• any of the substantial shareholders of the Company;• any of the substantial counterparties
of the Company;• any competitor of the Company;• federal (Russian Federation or its constituent entities)
and regional governments or municipal entities.
The Company sees independent directors as very valuable contributors to the efficiency of the Board, in particular, in terms of ensuring that the matters on the agenda of the Board are treated fairly, and reinforcing shareholders’ and investors’ confidence in actions taken by the Board of Directors.
In the lead-up to the Annual General Meeting of Shareholders in April 2017, the Corporate Governance, Nomination and Remuneration Committee of MMC Norilsk Nickel’s Board of Directors reviewed the compliance of nominees to the Board of Directors with independence criteria. The current directors on the Board were elected in the annual general meeting on 9 June 2017. As at the end of 2017, four (30.8%) out of 13 directors were recognised as independent.
Directors’ liability insurance
Since 2003, the Company has had its directors’ liability insured. The insurance aims to cover potential damages arising from unintended erroneous actions of the Company's directors in their management activities.
The terms and conditions of the agreement, as welas the amount of insurance coverage, are consistent with the worid’s best practices for such risks.
30.8% Share of Independent directors in the Board of Directors
Annual report • 2017Corporate governance Board of Directors
• 170 • • 171 •
Co
mp
any overview
Strategy o
verviewM
arket overview
Business o
verview
Corp
orate governance
Inform
ation fo
r sharehold
ersA
pp
endixes

Number of Board of Directors meetings
Performance of the Board of Directors
For MMC Norilsk Nickel, 2017 was the year of sustainable and rapid growth that helped us deliver strong results and reinforce our leadership both domestically and globally. Tight cooperation between the Board of Directors and the Company’s management enabled us to achieve target KPIs.
To support shareholder value and ensure comprehensive protection of shareholder rights and interests in the reporting period, the Company kept working on the strategy and priority areas of business, improving corporate governance and boosting social responsibility.
In 2017, we approved the new version of the Company’s Charter while also introducing a number of by-laws (regulations and policies) to make sure we are aligned with global best practices and retain our leadership in the global market to enhance trust with our shareholders and investors.
In the reporting period, the Company also focused on driving innovations and the use of new technology to achieve operating excellence. As part of the dedicated programme, we took steps to improve production
efficiency and cut operating costs, and implemented a number of security and health and safety initiatives across our footprint. An effective strategy and an in-depth market analysis helped us achieve an entirely new level of efficiency and confirm our status as a company with one of the most compelling investment cases in Russia.
Over the last three years, the Company has been conducting an internal assessment of the Board of Directors’ performance, with the methodology developed with assistance of an independent consultant and the best global practices. An external assessment is planned to be organised following 2018.
In 2017, the Board of Directors held 42 meetings, including 7 in person, and considered a total of 199 matters.
A reduction in the number of matters considered by the Board of Directors is due to the amendments to the Federal Law On Joint-Stock Companies effective from 1 January 2017 and pertaining to the regulation of major and related-party transactions
Directors’ participation in meetings of the Board of Directors and its committees
Full name
Title
Meetings of the Board of Directors
Strategy Committee
Budget Committee
Audit and Sustainable
Development Committee
Corporate Governance,
Nomination and Remuneration Committee
Participation / number of meetings
Gareth Peter Penny
Independent director / Chairman
42/42 8/10 – – –
Gerhardus Prinsloo
Independent director / Chairman of the Audit and Sustainable Development Committee
42/42 10/10 5/5 10/10 15/15
Robert Edwards Independent director 42/42 – – 10/10 15/15
Sergey Bratukhin Independent director / Chairman of the Corporate Governance, Nomination and Remuneration Committee
42/42 10/10 5/5 10/10 15/15
Sergey Skvortsov Non-executive director 24/42 – – – –
Andrey Bougrov Executive director 42/42 – – – –
Marianna Zakharova
Executive director 42/42 – – – –
Sergey Barbashev Non-executive director 42/42 – 5/5 – 15/15
Alexey Bashkirov
Non-executive director / Chairman of the Budget Committee 42/42 9/10 5/5 10/10 –
Maxim Sokov Non-executive director / Chairman of the Strategy Committee
42/42 10/10 – – –
Vladislav Soloviev Non-executive director 42/42 – – – –
Stalbek Mishakov Non-executive director 42/42 – 5/5 – 15/15
Rushan Bogaudinov Non-executive director 42/42 – – 10/10 –
In absentia
In person Всего
2017
2016
2015
2014
2013
35
43
38
7
7
9
42
50
47
2017
2016
2015
2014
2013
199
1,024
864
Number of matters considered
96.7% attendance of Board meetings
>90% of meetings of the Committee of the BoD were held with 100% turnout
Annual report • 2017Corporate governance Board of Directors
• 172 • • 173 •
Co
mp
any overview
Strategy o
verviewM
arket overview
Business o
verview
Corp
orate governance
Inform
ation fo
r sharehold
ersA
pp
endixes

Composition of the Board of Directors
Composition of the Board of Directors // %
85
Non-executive directorsIndependent directorsExecutive directors
Неисполнительные директораИсполнительные директораНезависимые директора
53.8
30.8
15.4
> 3 years1–3 years
85
1553.8
85
40-60 years oldbelow 40 years oldabove 60 years old
69
23
8
Breakdown by years served on the Board of Directors // %
Breakdown by age // %
Key competencies of the Board of Directors
Name
Years on the Board of Directors
Track record as a member of the Board of Directors
Strategy
Law and corporate governance
Finance and audit
Mining and engineering
International economic relations
Gareth Peter Penny
4 years Since 2013 + + +
Gerhardus Prinsloo
5 years Since 2012 + + + +
Robert Edwards 4 years Since 2013 + + +
Sergey Bratukhin 4 years Since 2013 + + + +
Sergey Skvortsov 2 years 2014–2015 Since 2017 + +
Andrey Bougrov 15 years Since 2002 + + +
Marianna Zakharova
7 years Since 2010 + +
Sergey Barbashev
6 years Since 2011 +
Alexey Bashkirov 4 years Since 2013 + + +
Maxim Sokov 9 years Since 2008 + + + +
Vladislav Soloviev
7 years 2008–2011 Since 2013 + +
Stalbek Mishakov
5 years Since 2012 + + +
Rushan Bogaudinov
2 years Since 2015 + +
Total 6 9 6 10 6
As at 31 of December 2017 the Board of Directors was made up of 13 members, including four independent, seven non-executive and two executive directors. Following the Annual General Meeting of
Shareholders held on 9 June 2017, Sergey Skvortsov was elected to the Board of Directors, replacing Andrey Korobov.
Biographies of members of the Board of Directors
BOUGROV Andrey
Born in: 1952Nationality: RussiaDeputy Chairman of the Board of Directors since 2013Executive director (2002-2013 member of the Board of Directors)Member of the Management Board since 2002Share in the Company’s authorised capital: 0%Share in the common stock: 0%
PENNY Gareth Peter
Born in: 1962Nationality: UKChairman of the Board of Directors since 2013Independent directorMember of the Strategy CommitteeShare in the Company’s authorised capital: 0%Share in the common stock: 0%
Education: Bishops Diocesan College, Cape Town Eton College, UK Oxford, Rhodes Scholar, UKMaster of Arts in Philosophy, Politics and Economics
Track record:2007–present: Non-Executive Director at Julius Bär Holding Ltd2012–2016: Executive Chairman at New World Resources plc, Executive Director at New World Resources NV2012–2016: member of the Board of Directors at OKD2016–present: Non-Executive Chairman of the Board of Directors at Pangolin Diamonds Corp.2017–present: Non-Executive Chairman of the Board of Directors at Edcon Holdings Limited2017–present: Director at Amulet Diamond Corporation
Education: Moscow State Institute of International Relations (MGIMO), degree in International Economic Relations PhD in Economics
Track record:2002–present: member of the non-governmental Council on Foreign and Defence Policy2006–present: member of the Management Board of the Russian Union of Industrialists and Entrepreneurs2010–2013: member of the Management Board and Deputy CEO at Interros Holding Company2011–2013: Chairman of the Board of Directors at MMC Norilsk Nickel2013–2014: member of the Board of Directors of the Federal Hydro-Generating Company RusHydro2013–present: Vice President at Interros Holding Company LLC (Interros Holding Company CJSC until 2015)2013–2015: member of the Management Board, Deputy Chairman of the Board of Directors, Deputy CEO at MMC Norilsk Nickel
2013–present: Vice President of the Russian Union of Industrialists and Entrepreneurs2014–present: member of the Board of Directors at Inter RAO UES PJSC (Inter RAO UES OJSC until 2015)2014–present: member of the Expert Committee of the Russian President’s Anticorruption Office2015–present: member of the Management Board, Deputy Chairman of the Board of Directors at MMC Norilsk Nickel2015–2016: member of the Investment Committee at the Federal Hydro-Generating Company RusHydro2015–present: Senior Vice President at MMC Norilsk Nickel (formerly Vice President until 2016)2016–present: member of the Expert Council on Corporate Governance at the Bank of Russia2016–present: Chairman of the Issuer Committee at the Moscow Exchange2018 – present: Chairman of the Board of non-financial reporting at RUIE, vice-present and member of the Management Board at RUIE
Annual report • 2017Corporate governance Board of Directors
• 174 • • 175 •
Co
mp
any overview
Strategy o
verviewM
arket overview
Business o
verview
Corp
orate governance
Inform
ation fo
r sharehold
ersA
pp
endixes

BARBASHEV Sergey
Born in: 1962 Nationality: RussiaMember of the Board of Directors since 2011 Non-executive directorMember of the Corporate Governance, Nomination and Remuneration CommitteeShare in the Company’s authorised capital: 0.0%1
Share in the common stock: 0.0%1
Education: Moscow Higher School of Militia of the Ministry of Internal Affairs of the USSR, degree in Law
Track record:2008–present: CEO and Chairman of the Management Board at Interros Holding Company LLC (Interros Holding Company CJSC until 2015)
2008–present: member of the Board at the Vladimir Potanin Charitable Foundation2011–present: Chairman of the Board of Directors of Rosa Khutor Ski Resort Development Company2015–present: Branch Director at Olderfrey Holdings Ltd.2016–present: member of the Board of Endowment for Education, Science and Culture2016–present: Director at Olderfrey Holdings Ltd.
BASHKIROV Alexey
Born in: 1977 Nationality: RussiaMember of the Board of Directors since 2013Non-executive directorChairman of the Budget Committee, member of the Audit and Sustainable Development Committee and the Strategy Committee Share in the Company's authorised capital: 0%Share in the common stock: 0%
Education: Moscow State Institute of International Relations (MGIMO), degree in International Economic Relations
Track record:2009–2015: Executive Director, Head of the Investment Department, Deputy CEO for Investments at Interros Holding Company2009–2013: member of the Board of Directors at Rosa Khutor Ski Resort Development Company2009–2014: member of the Board of Directors at Prof-Media Management2011–2015: member of the Management Board at Interros Holding Company
2012–2014: member of the Board of Directors at SP Holding, Cinema Park2014–present: member of the Board of Directors at Petrovax Pharm and Zaodno2015–present: member of the Management Board, Deputy CEO for Investments at Interros Holding Company2016–present: trustee of the Night Time Hockey League, a non-profit amateur hockey foundation2016–present: member of the Board of Directors at iGlass Technology Inc.2016–present: Managing Director at Winter Capital Advisors2016–present: CEO at Translaininvest
BOGAUDINOV Rushan
Born in: 1977 Nationality: RussiaMember of the Board of Directors since 2015 Non-executive directorMember of the Audit and Sustainable Development CommitteeShare in the Company’s authorised capital: 0%Share in the common stock: 0%
BRATUKHIN Sergey
Born in: 1971 Nationality: RussiaMember of the Board of Directors since 2013 Independent directorChairman of the Corporate Governance, Nomination and Remuneration Committee, member of the Strategy Committee, the Budget Committee and the Audit and Sustainable Development CommitteeShare in the Company's authorised capital: 0%Share in the common stock: 0%
Education:Moscow State Technological University “Stankin”, degree in Engineering
Track record:2010–present: member of the Institute of Internal Auditors (IIA)2012–2015: Head of the Control and Audit Department at RUSAL Global Management B. V.2012–2016: member of the Board of Directors at Aughinish Alumina Ltd2012–2016: member of the Board of Directors at Limerick Alumina Refining Ltd2015–present: Function Head at RUSAL Global Management B. V.
Education: Mendeleev University of Chemical Technology of Russia, degree in Engineering;Finance Academy under the Government of the Russian Federation, degree in Banking and Insurance;Warwick Business School, degree in Business Management
Track record:2007–2017: member of the Board of Directors at Dallesprom2007–2014: member of the Board of Directors at Amur Shipping Company2011–present: President at Invest AG (CIS Investment Advisers LLC)2014–2016: member of the Board of Directors at AKB International Financial Club
1 On 10 April 2017, Mr Sokov's share in the Company's authorised capital changed from 0.000088% to 0% following the gift of his stake.
Annual report • 2017Corporate governance Board of Directors
• 176 • • 177 •
Co
mp
any overview
Strategy o
verviewM
arket overview
Business o
verview
Corp
orate governance
Inform
ation fo
r sharehold
ersA
pp
endixes

ZAKHAROVA Marianna
Born in: 1976Nationality: RussiaMember of the Board of Directors since 2010Executive directorMember of the Management Board since 2016Share in the Company’s authorised capital: 0%Share in the common stock: 0%
Education:Peoples’ Friendship University of Russia (RUDN), Master’s degree in Law
Track record:2010–2015: member of the Management Board, Deputy CEO for Legal Affairs at Interros Holding Company (Interros Holding Company CJSC until 2015)2010–2015: member of the Board of Directors at ProfEstate2015–present: First Vice President for Corporate Governance, Asset Management and Legal Affairs at MMC Norilsk Nickel
MISHAKOV Stalbek
Born in: 1970Nationality: RussiaMember of the Board of Directors since 2012 Non-executive directorMember of the Corporate Governance, Nomination and Remuneration Committee and the Budget CommitteeShare in the Company’s authorised capital: 0%Share in the common stock: 0%
Education: Moscow State Institute of International Relations (MGIMO), degree in International Law; University of Notre Dame (USA), Master’s degree; Diplomatic Academy of the Russian Foreign Ministry, PhD in Economics
Track record:2010–present: advisor to the CEO at RUSAL Global Management B. V.2013–2016: member of the Board of Directors at United Company RUSAL Plc2013–present: deputy CEO at EN+ Management
PRINSLOO Gerhardus
Born in: 1965Nationality: Germany Member of the Board of Directors since 2012Independent directorChairman of the Audit and Sustainable Development Committee, member of the Strategy Committee, Budget Committee, and the Corporate Governance, Nomination and Remuneration CommitteeShare in the Company’s authorised capital: 0%Share in the common stock: 0%
SOKOV Maxim
Born in: 1979 Nationality: RussiaMember of the Board of Directors since 2008 Non-executive directorChairman of the Strategy Committee Share in the Company’s authorised capital: 0.0011%Share in the common stock: 0.0011%
Education:University of Pretoria (South Africa), Bachelor of Commerce
Track record:2012–present: CEO of Natural Resource Partnership
Education: Russian State Tax Academy under the Russian Ministry of Taxes, degree in Law; New York University, Master's degree in Law, lawyer (USA)
Track record:2008–2013: CEO of OK RUSAL – Investment Management2012–present: member of the Board of Directors at United Company RUSAL Plc2012–2013: Director of Strategic Investment Management at RUSAL Global Management B. V.
2013–2014: Advisor on Strategic Investment Management at RUSAL Global Management B. V. and First Deputy CEO at En+ Group Ltd2013–present: CEO at En+ Management2013–2017: member of the Board of Directors at En+ Group Limited and Eurosib Energo Plc2014–2017: CEO at En+ Group Limited2017–present: CEO and member of the Board of Directors at En+ Group Plc2017–present: member of the Board of Directors at FESCO2017–2018: CEO at En+ Group Plc2018–present: president at En+ Group Plc
Annual report • 2017Corporate governance Board of Directors
• 178 • • 179 •
Co
mp
any overview
Strategy o
verviewM
arket overview
Business o
verview
Corp
orate governance
Inform
ation fo
r sharehold
ersA
pp
endixes

SKVORTSOV Sergey
Born in: 1964Nationality: RussiaMember of the Board of Directors in 2014–2015 and since 2017Non-Executive directorShare in the Company’s authorised capital: 0%Share in the common stock: 0%
Education: Moscow State Institute of International Relations (MGIMO), degree in International Economic Relations, PhD in Economics
Track record:2006–present: member of the Board of Directors at KAMAZ2008–2016: member of the Board of Directors at AVTOVAZ2009–2013: Managing Director at CJSC CIB Financial Broker2013–2014: Managing Director for Investments at Rostec State Corporation2014–2016: Deputy CEO at Rostec State Corporation2014–2017: member of the Board of Directors at OPK Oboronprom2014–present: member of the Board of Directors at Russian Helicopters
2014–2015: member of the Board of Directors at OJSC MMC Norilsk Nickel2014–present: Non-Executive Chairman of the Board of Directors at RT-Invest JSC (formely, until 2017, RT-Invest LLC)2016–2017: Adviser to CEO at Rostec State Corporation2016–present: member of the Association of Russian Automakers, non-profit partnership2016–present: Chairman of the Board of Directors at PJSC AVTOVAZ2016–present: member of the Board of Directors at Alliance Rostec Auto B.V.
SOLOVIEV Vladislav
Born in: 1973Nationality: RussiaMember of the Board of Directors in 2008–2011 and since 2013 Non-executive directorShare in the Company’s authorised capital: 0%Share in the common stock: 0%
Education: Graduate School of Management of the State Academy of Management; Moscow State Technological University “Stankin”; University МВА
Track record:2007–present: member of the Board of Directors at United Company RUSAL Plc
2008–2015: member of the Board of Directors at En+ Group Limited2010–2014: First Deputy Director at CJSC RUSAL Global Management B. V.2014–2018: CEO of CJSC RUSAL Global Management B. V. and United Company RUSAL Plc2018–present: member of the Board of Directors and CEO at En+ Group2018–present: president at United Company RUSAL Plc and CJSC RUSAL Global Management B. V.
EDWARDS Robert
Born in: 1966Nationality: UKMember of the Board of Directors since 2013Independent directorMember of the Corporate Governance, Nomination and Remuneration Committee, and the Audit and Sustainable Development CommitteeShare in the Company’s authorised capital: 0%Share in the common stock: 0%
Education: Camborne School of Mines, degree in Mining Engineering
Track record:2013–2014: Senior Advisor at Royal Bank of Canada (Europe) Capital Markets2013–present: CEO at Highcross Resources Ltd2014–2018: Non-Executive Director at GB Minerals Ltd2016–2016: Non-Executive Chairman at Sierra Rutile Limited (SRX)
Committees of the Board of Directors
Committees established by the Board of Directors are in charge of review of the most important matters and preparation of recommendations to the Board of Directors.
To ensure efficiency and proper fulfilment of their functions, the committees may discuss matters with the Company's management bodies and seek opinions of external consultants. The Company set up four committees of the Board of Directors, each made up of five persons:• Audit and Sustainable Development Committee,• Strategy Committee, • Budget Committee,• Corporate Governance, Nomination and Remuneration
Committee.
Audit and Sustainable Development CommitteeAs per the resolution of the Board of Directors dated 16 October 2017 (Minutes No. GMK/34-pr-sd), the Board of Directors’ Audit Committee is renamed as the Audit and Sustainable Development Committee. The Board of Directors also approved the new version of the Regulation on Audit and Sustainable Development Committee of the Board of Directors.
The Audit and Sustainable Development Committee deals with matters related to financial statements, risk management and internal controls, internal and external audits, prevention of wrongdoings by employees and third parties, as well as matters related to the environment and health and safety.
In the reporting year, the committee held ten meetings, including eight in person and two joint meetings (joint meetings of the Audit and Sustainable Development Committee and the Budget Committee on 14 March 2017 and 14 August 2017).
Annual report • 2017Corporate governance Board of Directors
• 180 • • 181 •
Co
mp
any overview
Strategy o
verviewM
arket overview
Business o
verview
Corp
orate governance
Inform
ation fo
r sharehold
ersA
pp
endixes

1 In 2017, there were no changes to the committee’s composition.2 In 2017, there were no changes to the committee’s composition.
The committee is made up of five directors, three of which are independent, including its Chairman. No executive directors are members of the Audit and Sustainable Development Committee. On average, members of the Audit and Sustainable Development Committee of the Company’s Board of Directors have more than 10 years of experience in finance.
Members of the Audit and Sustainable Development Committee in 20171
Gerhardus Prinsloo (Chairman, independent director)
Robert Edwards (independent director)
Alexey Bashkirov
Rushan Bogaudinov
Sergey Bratukhin (independent director)
The Audit and Sustainable Development Committee plays an important role when it comes to controls and accountability and has become an effective interface between the Board of Directors, the Audit Commission, independent auditor, the Internal Audit Department and management of the Company.
During the reporting year, the committee has developed for the Board of Directors a number of recommendations dealing with the accuracy, completeness and validity of the Company's financials, health, safety and environment, improvement of accounting for metal bearing products, and approval of the Company’s auditors. The Audit and Sustainable Development Committee also considered and took note of the results achieved in identifying, assessing and managing technical and production risks across the Norilsk Nickel Group’s operations and assets, and results of audits conducted by the Internal Audit Department.
Strategy Committee
The Strategy Committee was established to support the Board of Directors by conducting preliminary reviews of the matters pertaining to sustainable business development, investment planning, business restructuring, and interaction with capital markets and government authorities.
In the reporting year, the committee held ten meetings, including six in person, one in absentia, two joint meetings (one with the Corporate Governance, Nomination and Remuneration Committee on 17 May 2017, and the other with the Budget Committee on 6 December 2017), and one conference call.
The Strategy Committee is made up of five directors, including three independent directors. All directors are recognised as non-executive.
Members of the Strategy Committee in 20172
Maxim Sokov (Chairman)
Gerhardus Prinsloo (independent director)
Alexey Bashkirov
Gareth Peter Penny (independent director)
Sergey Bratukhin (independent director)
The Strategy Committee’s focus is on supporting the Board of Directors in developing, implementing and revising the corporate strategy and preparing recommended updates thereto. During the year, the Strategy Committee issued recommendations to the Board of Directors to facilitate decision-making on updating the Company’s development strategy, along with fuel and energy and sales strategies. The committee reviewed the updates on the progress and status of major investment projects, prepared a progress report on production reconfiguration, and noted the relevant management efforts in implementing the Technology Breakthrough initiative. For strategic planning purposes, the Committee reviewed production reports and results of the programme designed to improve production efficiency and reduce operating costs.
1 In 2017, there were no changes to the committee’s composition.2 In 2017, there were no changes to the committee’s composition.
Budget Committee
The Budget Committee is in charge of preliminary review and issue of recommendations pertaining to finance, budgeting, business plans and monitoring of their implementation.
In the reporting year, the committee held five meetings, including two in absentia and three joint meetings (two with the Audit and Sustainable Development Committee on 14 March 2017 and 14 August 2017, and one with the Strategy Committee on 6 December 2017).
The Budget Committee is made up of five directors, including two independent director. All directors are recognised as non-executive.
Members of the Budget Committee in 20171
Alexey Bashkirov (Chairman)
Sergey Barbashev
Sergey Bratukhin (independent director)
Gerhardus Prinsloo (independent director)
Stalbek Mishakov
The key role of the Budget Committee throughout the year was to issue recommendations to the Board of Directors in order to facilitate decision-making on the amount of dividends and the record date to be suggested by the Board of Directors. The Budget Committee also prepared information on cobalt sales policy and, following the discussion with the management, issued recommendations to further develop the same. The committee approved the Company’s 2018 budget and recommended the continuation of the capital expenditure reduction initiatives.
Corporate Governance, Nomination and Remuneration Committee
The Corporate Governance, Nomination and Remuneration Committee supports the Board of Directors by way of:• assessing, controlling and improving the Company's
corporate governance framework;• ensuring succession planning for the Board of
Directors and the Management Board of the Company;
• providing incentives, assessing the performance of the Company's Board of Directors, Management Board, President and Corporate Secretary, and setting applicable remuneration policies;
• supervising the development and implementation of the Company's information policy.
In the reporting year, the committee held 15 meetings, including 14 meetings in absentia and one joint meeting (on 17 May 2017, with the Strategy Committee).
The committee is made up of five directors, including three independent directors, one of whom chairs the committee. All directors are recognised as non-executive.
Members of the Corporate Governance, Nomination and Remuneration Committee in 20172
Sergey Bratukhin (Chairman, independent director)
Sergey Barbashev
Stalbek Mishakov
Robert Edwards (independent director)
Gerhardus Prinsloo (independent director)
The committee issued recommendations to the Board of Directors in order to facilitate decision-making on the convocation, preparation and running of annual and extraordinary general meetings of shareholders, and on the matters reserved to the General Meeting of Shareholders (remuneration and reimbursement of expenses of the members of the Board of Directors and the Audit Commission, liability insurance and indemnification of the members of the Board of Directors and the Management Board).
Annual report • 2017Corporate governance Board of Directors
• 182 • • 183 •
Co
mp
any overview
Strategy o
verviewM
arket overview
Business o
verview
Corp
orate governance
Inform
ation fo
r sharehold
ersA
pp
endixes

PLATOV Pavel
Born in: 1975Nationality: RussiaCorporate Secretary since 2011Share in the Company’s authorised capital: 0%Share in the common stock: 0%
Additionally, the Corporate Governance, Nomination and Remuneration Committee approved the revised Regulation on Audit and Sustainable Development Committee of the Board of Directors and advised the Board of Directors on approval of the Company's policies and regulations, and evaluation of directors’ performance in 2017. The committee reviewed
management updates on implementation of the Our Home and My Home programmes, corporate social subsidised loan programme, and the charitable policy of the Company, and noted the management's achievements in implementing the Human Capital Development Programme.
Corporate Secretary
In the reporting year, the Company Secretary was renamed Corporate Secretary as per the new version of the Charter approved by the Annual General Meeting of Shareholders (Minutes No. 1 of 9 June 2017) and the resolution of the Board of Directors (Minutes No. GMK/24-pr-sd of 14 July 2017).
The mission of the Corporate Secretary is to ensure compliance with the procedures for the protection of shareholders’ rights and legitimate interests, as prescribed by the applicable laws and the Company’s by-laws, and to monitor such compliance.
Pursuant to the Charter, the Corporate Secretary is appointed by the Board of Directors for a three-year term. The Board of Directors may terminate the powers of the Corporate Secretary prior to their expiration.
The Corporate Secretary is responsible for:• preparation and running of the General Meeting of
Shareholders as provided for by the applicable Russian laws, the Company's Charter and by-laws,
• making arrangements for and running meetings of the Board of Directors and its committees as provided for by the applicable Russian laws, Company’s Charter and by-laws;
• providing ongoing support and assistance to the Board of Directors, its committees and members;
• contributing to the improvement of the Company's corporate governance framework and practices;
• managing the operations of the Secretariat;• other functions as per the Company's by-laws.
In accordance with the Regulation on the Corporate Secretary of MMC Norilsk Nickel approved by the Board of Directors on 20 April 2015 (Minutes No. GMK/14-pr-sd), the Company’s Corporate Secretary has an administrative reporting line to the President and is accountable to the Board of Directors.
At this time, the Corporate Secretary is Mr. Pavel Platov.
President and Management Board The President and the Management Board are executive bodies in charge of day-to-day operations. The President serves as the Chairman of the Management Board.
The executive bodies are a key element in the Company’s management system ensuring enactment of resolutions adopted by the Board of Directors and the General Meetings of Shareholders and implementation of Nornickel's core corporate plans and programmes, and maintaining the efficiency of risk management and internal control functions.
The President and members of the Management Board are elected for an indefinite period. The Board of Directors may at any time dismiss any member of the Management Board. Since 1 July 2016, the General Meeting of Shareholders has the authority to elect and dismiss the President.
Responsibilities of the President:• acting on behalf of the Company without the power
of attorney, including by: – representing the Company’s interests; – executing transactions; – approving staff profiles; – issuing orders and instructions that are binding on
all of the Company’s employees; – approving the Company’s by-laws on production,
technology, finance, accounting, business, HR, social support, health, safety and document management;
– resolving on any other operational matters which, pursuant to the Company's Charter, are not reserved to the remit of the General Meeting of Shareholders, Board of Directors or Management Board.
Responsibilities of the Management Board:• conducting a preliminary review of materials
prepared for the meetings of the Board of Directors focusing on definition of the Company’s business priorities, determination of its development concept and strategy, and approval of plans and budgets;
• drafting proposals on amendments to the Company’s Charter;
• drafting proposals on transactions that require approval by the General Meeting of Shareholders or the Board of Directors;
• analysing and assessing the Company’s financial and business performance;
• drafting proposals on the Company’s reserve fund;• resolving on other matters as stipulated by
the Company’s Charter.
Management Board in 2017
In 2017, the Management Board held 35 meetings in absentia and one joint meeting.
Participation in Management Board meetings in 2017
Vladimir Potanin 36
Elena Bezdenezhnykh 34
Sergey Batekhin 36
Larisa Zelkova 36
Nina Plastinina 36
Alexander Ryumin 35
Sergey Malyshev 33
Onik Aznauryan 35
Andrey Bougrov 36
Sergey Dyachenko 36
Vladislav Gasumyanov 36
Elena Kondratova 36
Marianna Zakharova 36
Education: Dobrolyubov Linguistics University of Nizhny Novgorod, Russian Presidential Academy of National Economy and Public Administration
Track record:2011–present: Corporate Secretary at MMC Norilsk Nickel (formerly, until 2015, JSC Norilsk Nickel)
Annual report • 2017
• 185 •
Co
mp
any overview
Strategy o
verviewM
arket overview
Business o
verview
Corp
orate governance
Inform
ation fo
r sharehold
ersA
pp
endixes
Corporate governance Board of Directors
• 184 • • 185 •

In 2017, the composition of the Company’s Management Board remained unchanged. The last change in the membership was approved by the Board of Directors on 27 April 2016.
POTANIN Vladimir
Born in: 1961Nationality: RussiaThe Company’s President since 2015 (the Company’s CEO in 2012– 2015)Chairman of the Management Board since 2012Share in the Company’s authorised capital: 0%Share in the common stock: 0%
Education: Moscow State Institute of International Relations (MGIMO), degree in International Economics
Track record 1995–present: member of the Presidium of the International Foundation for the Unity of Orthodox Christian Nations2000–present: member of the Bureau and Management Board of the Russian Union of Industrialists and Entrepreneurs2001–present: member of the Board of Trustees of the Solomon R. Guggenheim Foundation (New York) 2003–present: Chairman of the Board of Trustees of the State Hermitage Museum2004–present: Chairman and member of the Presidium of the National Council on Corporate Governance 2005–present: member of the Council of Trustees and the Board of the Russian Olympians Foundation2006–present: Deputy Chairman of the Board of Trustees of the Moscow State Institute of International Relations (MGIMO), member of the Board of Trustees of the Graduate School of Management (St Petersburg University), and member of the Bureau of the All-Russian Association of Employers (Russian Union of Industrialists and Entrepreneurs)2007–present: member of the Board of Trustees of St Petersburg State University and Deputy Chairman of the Board of Trustees of the MGIMO Endowment Fund
2007–2014: member of the Supervisory Board of the Sochi 2014 Steering Committee2008–present: member of the Board of Vladimir Potanin Charitable Foundation2009–2016: Chairman of the Supervisory Board of the Russian International Olympic University2009–present: Deputy Chairman of the Board of Trustees of the Russian International Olympic University2010–present: member of the Board of Trustees of the Russian Geographical Society2011–present: member of the Board of Trustees of the State Hermitage Museum Endowment Fund and the Moscow Church Construction Foundation2012–2015: CEO and Chairman of the Management Board of OJSC MMC Norilsk Nickel2013–2014: member of the Board of Directors of OJSC Inter RAO UES2013–2015: President of CJSC Interros Holding Company2014–present: Chairman of the Board of Trustees of the ROZA Club for Sport Development and Support2015–present: President of LLC Interros Holding Company2016–present: member of the Board of the Endowment Fund for Education, Science and Culture, and Chairman of the Board of Trustees of the Night Hockey Foundation for the Development of Amateur Hockey2017–present: Chairman of the Supervisory Board of the Norilsk Development Agency
DYACHENKO SergeyBorn in: 1962Nationality: RussiaMember of the Management Board since 2013Share in the Company’s authorised capital: 0%Share in the common stock: 0%
Education: Plekhanov Leningrad Mining Institute, degree in Mining Engineering;University of Pretoria (South Africa), master’s degree
Track record2010–2013: COO at Kazakhmys Group2013–2014: Deputy CEO and Head of Operations at OJSC MMC Norilsk Nickel2014–2015: First Deputy CEO and COO at OJSC MMC Norilsk Nickel
2015–present: First Vice President and COO at PJSC MMC Norilsk Nickel2016–present: member of the Board of the Non-Profit Russian Mining Council Partnership2017–present: member of the Board of Directors at MPI Nickel Pty Ltd, Norilsk Nickel Cawse Pty Ltd, Norilsk Nickel Avalon Pty Ltd, Norilsk Nickel Wildara Pty Ltd, Norilsk Nickel Harjavalta Oy, Norilsk Nickel Africa (Pty) Ltd, Norilsk Nickel Mauritius, and also member of the Executive Committee at Nkomati
ZAKHAROVA Marianna
Born in: 1976Nationality: RussiaMember of the Management Board since 2016Member of the Board of Directors since 2010Executive DirectorShare in the Company’s authorised capital: 0%Share in the common stock: 0%
Education:Peoples’ Friendship University of Russia (RUDN), master’s degree in Law
Track record2010–2015: member of the Management Board and Deputy CEO for Legal Affairs at LLC Interros Holding Company (CJSC Interros Holding Company until 2015)2010–2015: member of the Board of Directors at ProfEstate2015–present: First Vice President for Corporate Governance, Shareholdings and Legal Affairs at PJSC MMC Norilsk Nickel
On 12 February 2018, the Board of Directors resolved (Minutes No. GMK/5-pr-sd) to dismiss Alexander Ryumin, member of the Management Board, and terminate his employment contract, while also approving the new Management Board made up of 12 members starting from 13 February 2018.
Biographies of the Management Board members
Composition of the Management Board
Annual report • 2017Corporate governance President and Management Board
• 186 • • 187 •
Co
mp
any overview
Strategy o
verviewM
arket overview
Business o
verview
Corp
orate governance
Inform
ation fo
r sharehold
ersA
pp
endixes

AZNAURYAN Onik
Born in: 1970 Nationality: RussiaMember of the Management Board since 2013Share in the Company’s authorised capital: 0%Share in the common stock: 0%
Education: Yerevan State Polytechnic University;University of Pittsburgh (USA), Master of Business Administration
Track record2013–2013: member of the Board of Directors at OJSC Norilskgazprom2013–2016: Chairman of the Board of Directors at OJSC Norilskgazprom
2013–2015: Deputy CEO for Non-Industrial Assets and Energy at OJSC MMC Norilsk Nickel and Head (on a part-time basis) of Norilskenergo, branch of OJSC MMC Norilsk Nickel2015–present: Senior Vice President, Head of Non-Industrial Assets and Energy at PJSC MMC Norilsk Nickel (Vice President until 2016), and Head (on a part-time basis) of Norilskenergo, branch of PJSC MMC Norilsk Nickel
BATEKHIN Sergey
Born in: 1965 Nationality: RussiaMember of the Management Board since 2013Share in the Company’s authorised capital: 0%Share in the common stock: 0%
Education: Krasnoznamenny Military Institute of the USSR Ministry of Defence, degree in Foreign Languages; Plekhanov Russian Academy of Economics, degree in Finance and Credit; Moscow International Higher Business School (MIRBIS), Master of Business Administration
Track record 2009–2015: member of the Board of Directors of the Continental Hockey League2010–2013: Vice President of CJSC Interros Holding Company2012–2015: Chairman of the Board of Directors at Interport Management Company
2013–2015: member of the Management Board, Deputy CEO, Head of Sales, Commerce and Logistics at MMC Norilsk Nickel, and member of the Board of Directors at Metal Trade Overseas Sa and Norilsk Nickel Marketing (Shanghai) Co., Ltd2013–2014: member of the Board of Directors, Chairman of the Board of Directors at Yenisey River Shipping Company and member of the Board of Directors at Norilsk Nickel (Asia) Ltd2015–present: Senior Vice President, Head of Sales, Commerce and Logistics at MMC Norilsk Nickel (Vice President until 2016)
BOUGROV Andrey
Born in: 1952Nationality: RussiaMember of the Management Board since 2002Deputy Chairman of the Board of Directors since 2013Executive DirectorShare in the Company’s authorised capital: 0%Share in the common stock: 0%
Education: Moscow State Institute of International Relations (MGIMO), PhD in Economics
Track record2002–present: member of the Public Council on Foreign and Defence Policy2006–present: member of the Management Board of the Russian Union of Industrialists and Entrepreneurs2010–2013: member of the Management Board and Deputy CEO of CJSC Interros Holding Company2011–2013: Chairman of the Board of Directors of OJSC MMC Norilsk Nickel2013–2014: member of the Board of Directors of RusHydro Federal Hydroelectric Generating Company2013–present: Vice President at LLC Interros Holding Company (CJSC Interros Holding Company until 2015)2013–2015: member of the Management Board, Deputy Chairman of the Board of Directors, and Deputy CEO at OJSC MMC Norilsk Nickel
2013–present: Vice President of the Russian Union of Industrialists and Entrepreneurs2014–present: member of the Board of Directors at PJSC Inter RAO UES (OJSC Inter RAO UES until 2015)2014–present: member of the Expert Committee of the Russian President’s Anticorruption Office2015–present: member of the Management Board and Deputy Chairman of the Board of Directors at PJSC MMC Norilsk Nickel2015–2016: member of the Investment Committee at RusHydro Federal Hydroelectric Generating Company2015–present: Senior Vice President at PJSC MMC Norilsk Nickel (Vice President until 2016)2016–present: member of the Board of Experts on Corporate Governance at the Bank of Russia2016–present: Chairman of the Issuer Committee at the PJSC Moscow Exchange2018–present: Chairman of the Board of non-financial reporting at RUIE, vice-present and member of the Management Board at RUIE
RYUMIN Alexander1
Born in: 1956Nationality: RussiaMember of the Management Board from 2013 to February 2018Share in the Company’s authorised capital: 0.003%Share in the common stock: 0.003%
Education: Kirov Urals Polytechnic Institute, degree in Metallurgical Engineering
Track record 2008–2012: Director of Production Management Department at MMC Norilsk Nickel2012-2015: CEO of Polar Division at MMC Norilsk Nickel2015–2018: Vice President, CEO of Polar Division at MMC Norilsk Nickel2017–present: member of the Supervisory Board of the Norilsk Development Agency
1 On 12 February 2018, the Board of Directors resolved to terminate his employment contract
Annual report • 2017Corporate governance President and Management Board
• 188 • • 189 •
Co
mp
any overview
Strategy o
verviewM
arket overview
Business o
verview
Corp
orate governance
Inform
ation fo
r sharehold
ersA
pp
endixes

ZELKOVA Larisa
Born in: 1969Nationality: RussiaMember of the Management Board since 2013Share in the Company’s authorised capital: 0%Share in the common stock: 0%
Education:Moscow State University, degree in Journalism
Track record 1998–2013: Deputy CEO and PR Director at CJSC Interros Holding Company1999–2014: CEO of Vladimir Potanin Charitable Foundation2007–present: member of the Presidium of the MGIMO Endowment Fund2009–present: member of the Board of Trustees at Pavlovsk Gymnasium Private Non-Profit School2010–2013: member of the Management Board at CJSC Interros Holding Company2011–2013: Chair of the Board of Directors at Prof-Media Management, member of the Board of Directors at OJSC MMC Norilsk Nickel2011–present: member of the Board of Directors at LLC Rosa Khutor Ski Resort Development Company, Chair of the Management Board at the State Hermitage Museum Endowment Fund2011–2016: member of the Supervisory Board at the Russian International Olympic University
2012–present: member of the Russian Presidential Council for Culture and Art2013–2014: member of the Board of Directors at Prof-Media Management LLC2013–2015: member of the Management Board and Deputy CEO for Social Policy and Public Relations at OJSC MMC Norilsk Nickel2014–present: President, Chair of the Board at Vladimir Potanin Charitable Foundation2015–present: member of the Board of Trustees at the Hermitage Foundation UK and member of the Board of Trustees at the Russian Federal Public Academy of Education2015–present: Senior Vice President for HR, Social Policy and Public Relations at PJSC MMC Norilsk Nickel (Vice President until 2016)2016–present: member of the Board of Trustees at the Endowment Fund for Education, Science and Culture2017–present: member of the Supervisory and Management Boards of the Norilsk Development Agency
MALYSHEV Sergey
Born in: 1969 Nationality: RussiaMember of the Management Board since 2013Share in the Company’s authorised capital: 0%Share in the common stock: 0%
Education: Finance Academy under the Government of the Russian Federation, degree in Finance and Credit; Russian Presidential Academy of National Economy and Public Administration, degree in Public and Municipal Administration;A.N. Kosygin Russian State University, degree in Mechanical Engineering
Track record1998–2009: Deputy CEO for Economics and Finance at CJSC LUKOIL-Neftekhim, managing company for domestic and international petrochemical assets of OJSC LUKOIL2009–2013: Deputy CEO for Economics and Finance, First Deputy CEO at OJSC Energostroyinvest-Holding2013–2015: Deputy CEO, Head of Economics and Finance at OJSC MMC Norilsk Nickel.2015–2016: Senior Vice President, Head of Economics and Finance at PJSC MMC Norilsk Nickel (Vice President until 2016)2016–present: Senior Vice President and CFO at PJSC MMC Norilsk Nickel
BEZDENEZHNYKH Elena
Born in: 1973Nationality: RussiaMember of the Management Board since 2012Share in the Company’s authorised capital: 0.0011%1
Share in the common stock: 0.0011%1
Education:Krasnoyarsk State University, degree in Law
Track record 2011–2013: member of the Board of Directors at the Sport Projects Management Company, LLC2012–2013: Chair of the Board at Norilsk Nickel Non-State Pension Fund and Chair of the Board of Directors at OJSC RAO Norilsk Nickel2012–2015: Deputy CEO and Head of Corporate Governance, Asset Management and Legal Affairs at OJSC MMC Norilsk Nickel
2015: Vice President for Corporate Governance, Asset Management and Legal Affairs at PJSC MMC Norilsk Nickel2015–present: Vice President / State Secretary, Head of Government Relations at PJSC MMC Norilsk Nickel2016–present: member of the Supervisory Board at the Siberian Federal University (independent public college)2017–present: member of the Board of Trustees of the Charitable Foundation for Support of Indigenous Peoples of the North, Siberia and Far East
GASUMYANOV Vladislav
Born in: 1959 Nationality: RussiaMember of the Management Board since 2014 Share in the Company’s authorised capital: 0%Share in the common stock: 0%
Education: Kiev Civil Aviation Engineering Institute; North-West Academy of Public Administration
Track record2012–2015: Director of Corporate Security and Head of Security at OJSC MMC Norilsk Nickel2014–2015: member of the Management Board at OJSC MMC Norilsk Nickel2014–2016: member of the Board of Directors at OJSC Yenisey River Shipping Company2015–2015: Vice President, Director of Corporate Security and Head of Security at PJSC MMC Norilsk Nickel
2015–present: Vice President, Head of Corporate Security at PJSC MMC Norilsk Nickel2017–present: member of the Board of Directors of Dynamo Moscow Football Club2017–present: Head of the Department of Corporate Security at MGIMO's International Institute of Energy Policy and Diplomacy (MIEP MGIMO)2017–present: member of the Board of Directors at Norilsk Nickel Africa (Pty) Ltd and Norilsk Nickel Mauritius, and member of the Executive Committee at Nkomati
1 On 4 December 2017, Ms Bezdenezhnykh increased her share in MMC Norilsk Nickel’s authorised capital from 0.0010% to 0.0011% after coming into possession of an inheritance
Annual report • 2017Corporate governance President and Management Board
• 190 • • 191 •
Co
mp
any overview
Strategy o
verviewM
arket overview
Business o
verview
Corp
orate governance
Inform
ation fo
r sharehold
ersA
pp
endixes

KONDRATOVA Elena
Born in: 1972Nationality: RussiaMember of the Management Board since 2014Share in the Company’s authorised capital: 0%Share in the common stock: 0%
Education: Moscow Pedagogical State University, degree in Psychology
Track record 2009–2013: Head of the President’s Office at CJSC Interros Holding Company2013–2015: Chief of Staff at OJSC MMC Norilsk Nickel, Advisor to the President of CJSC Interros Holding Company (on a part-time basis)
2014–2015: member of the Management Board at OJSC MMC Norilsk Nickel2015–2015: Chief of Staff at PJSC MMC Norilsk Nickel2015–present: Vice President and Chief of Staff at PJSC MMC Norilsk Nickel, Advisor to the President of LLC Interros Holding Company (on a part-time basis)
PLASTININA Nina
Born in: 1961 Nationality: RussiaMember of the Management Board since 2013Share in the Company’s authorised capital: 0%Share in the common stock: 0%
Education: Moscow Chemical Machinery Construction Institute, degree in Mechanical Engineering;Bauman Moscow Technical Institute, degree in Economics and Production Management
Track record2008–2013: Director of Financial Department at CJSC Interros Holding Company2013–2015: Director of Internal Control Department at OJSC MMC Norilsk Nickel2015-2016: Vice President for Internal Audit at PJSC MMC Norilsk Nickel2016–present: Vice President for Internal Controls and Risk Management at PJSC MMC Norilsk Nickel
RemunerationKey performance indicators
The key performance indicators adopted by Nornickel serve to build a transparent incentive and performance assessment system. The Company believes that the remuneration framework put in place has proved its efficiency. KPIs are linked to performance metrics approved for different types of jobs, with employees consistently exceeding the targets. The Company's KPIs embrace achievements in social responsibility, occupational safety, operating efficiency and capital management.
The Company's President approved an Implementation Plan for the Employee Performance Management System at Nornickel providing for:• review and approval of documents governing
employee performance assessment procedures;• approval of individual KPIs;• preparation of individual development plans;• assessment of performance by team and individual
KPIs.
To improve performance at the Head Office, the CEO issued an order approving the Procedure for Assessing Head Office Employee Performance and the Regulation on Annual Performance Bonuses for Head Office Employees.
The Procedure primarily seeks to align the results of performance assessment with remuneration, development, and promotion of employees, whereas the Regulation on Annual Performance Bonuses for Head Office Employees is used to assess employee performance in the reporting period based on team and individual KPIs.
To boost employee performance across its Russian subsidiaries, the Company has developed the Procedure for Assessing Performance of the Group’s Management. The Procedure prescribes that management performance be managed by establishing KPIs and assessing achievement thereof.
Remuneration of governance bodiesPrinciples and mechanics of remunerations (reimbursements) due to executives are set out in the Charter, Regulations on the Management Board, and other by-laws of the Company. The system of remunerations applicable in the Company is continuously and directly monitored by the Board of Directors. Responsibilities of the Corporate Governance, Nomination and Remuneration Committee include development, supervision over adoption, implementation and regular revision of the Remuneration Policy for the Company's Board of Directors, Management Board and the Company's President.
In 2014, the Remuneration Policy for Members of the Board of Directors was approved by the General Meeting of Shareholders and published on the Company’s website
Annual report • 2017
• 193 •
Co
mp
any overview
Strategy o
verviewM
arket overview
Business o
verview
Corp
orate governance
Inform
ation fo
r sharehold
ersA
pp
endixes
Corporate governance President and Management Board
• 192 • • 193 •

The Remuneration Policy for Members of the Board of Directors sets forth the following annual remuneration for non-executive directors:• base remuneration of USD 120,000 for the Board
membership;• additional remuneration of USD 50,000 for
membership in a committee of the Board of Directors;• additional remuneration of USD 150,000 for chairing
a committee of the Board of Directors;• reimbursement of expenses incurred by directors
while discharging their duties.
The base remuneration for the Chairman of the Board of Directors is USD 1 mln. Subject to a special resolution adopted by the General Meeting of Shareholders, the Chairman of the Board of Directors may be entitled to additional remuneration and benefits.
To clearly differentiate the principles and structure of remuneration payable to non-executive and executive directors, the following items are excluded from the remuneration payable to non-executive directors:• bonuses linked to the Company’s operating results;• stock options;• additional benefits, including all forms of insurance
other than directors' liability insurance;• severance pay and any payments related to the
change of ownership;• pension plans and schemes.
As an additional benefit, directors are entitled to certain insurance protections, such as: • liability insurance;• reimbursement of losses incurred due to the election
to the Board of Directors.
As per the Company's Charter, decisions on remuneration and reimbursement payable to the Company’s President and members of the Management Board are reserved to the Board of Directors. The total remuneration of the President and members of the Management Board consists of the base salary and bonuses (a variable part of the remuneration). Bonuses are linked to the Company’s performance, including both financial metrics (EBITDA, free cash flow) and non-financial indicators (lower workplace injury rates, stakeholder involvement, etc.).
The variable part of the remuneration payable to the members of the Management Board is based on key performance indicators updated and approved annually by the Corporate Governance, Nomination and Remuneration Committee of the Board of Directors. The dismissal policy for top executives does not differ from that for other employees.
The remuneration paid to the members of governance bodies in 2017 including salaries, bonuses, commissions, benefits and reimbursement of expenses totalled USD 90.1 mln (RUB 5.3 bn)1.
1 The amount of remuneration is different from that specified in the 2017 consolidated IFRS financial statements as it excludes non-cash remuneration (insurance and VHI payments, and annual remuneration liabilities as at 31 December 2017). The remuneration accrued to the members of governance bodies in 2017 under IFRS totalled USD 103 mln (RUB 6.039 bn).
Board of Directors remuneration in 2017
Remuneration types RUB mln USD mln
Remuneration for membership in a governance body 228.1 3.9
Salary 0 0
Bonus 0 0
Commissions 0 0
Benefits 0 0
Reimbursement 0.3 0.004
Other types of remuneration 0 0
Total 228.3 3.9
Management Board remuneration in 2017
Remuneration types RUB mln USD mln
Remuneration for membership in a governance body 2.3 0.04
Salary 2,444.7 41.9
Bonus 2,583.8 44.3
Commissions 0 0
Benefits 0 0
Reimbursement 0 0
Other types of remuneration 0 0
Total 5,030.9 86.2
Risk management and internal controls
The Company continuously manages risks that affect its strategic and operational goals. These efforts include identification and assessment of external and internal risks in terms of their impact on key financial and non-financial metrics, along with the development and implementation of response and minimisation measures.
The Company has developed and adopted all relevant risk management documents, including:• Corporate Risk Management Policy,• Corporate Risk Management Framework
Regulations,• Risk Management Regulations,• Investment Project Risk Management Regulations,• risk management regulations for specific processes
(management of tax, health and safety and market risks).
Risk management embraces all business areas and governance levels:• strategic risks are managed by the Board of Directors
and the Company's senior management;• key operational risks are managed by the Company's
senior management;• other material operational risks are managed by
heads of business units and subunits.
The Corporate Risk Management Policy sets out the following key risk management objectives:• increase the likelihood of achieving the Company's
goals;• improve the resource allocation efficiency; and• boost the Company's investment case
and shareholder value.
The risk management framework relies on the principles and requirements of Russian and international laws, and professional standards, including the Corporate Governance Code recommended by the Bank of Russia, ISO 31000 (Risk Management) and COSO ERM (Enterprise Risk Management – Integrated Framework).
To manage catastrophic production risks, the Company develops and approves business continuity plans that in case of emergency set out:• interaction procedure for business units; • operations support or resumption plan;• rehabilitation or reconstruction plan for affected
assets.
The corporate risk management framework (CRMF) implementation and improvement initiatives are spearheaded by the Company’s Vice President and Head of Internal Controls and Risk Management and its Risk Management Service.
Risk management framework
In 2018, key initiatives aimed at improving the CRMF will include:• continued integration of risk management practices
into strategic, budget and investment planning, setting KPIs for the management and assessing their achievement;
• deployment of risk management automation tools;• improvement of technical and production risk
management, broadening of the analysis perimeter, evaluation of technical and production risk impact on human health and safety, and environment;
• introduction of quantitative assessment methods and modelling to analyse technical and production risks and risks associated with investment projects.
Insurance
Insurance is one of the most important tools for managing risks and finances and protecting the assets of the Company and its shareholders against any unforeseen losses related to our operations, including due to external hazards.
Nornickel has centralised its insurance function to consistently implement uniform policies and standards supporting a comprehensive approach to managing insurance policies and fully covering every risk at all times. The Company annually approves a comprehensive insurance programme that defines key parameters by insurance type and key project.
Annual report • 2017Corporate governance Remuneration
• 194 • • 195 •
Co
mp
any overview
Strategy o
verviewM
arket overview
Business o
verview
Corp
orate governance
Inform
ation fo
r sharehold
ersA
pp
endixes

As part of our risk mitigation initiatives, we have implemented a corporate insurance programme that covers assets, equipment failures and business interruptions across the Group. Our corporate insurance policies are issued by major Russian insurers in cooperation with an international broker. This helps the Company make sure that its risks are underwritten by highly reputable international re-insurers.
Key risks, risk factors and mitigants
Risk type Mitigants
WORKPLACE INJURY RISK
Failure to comply with the Group’s health and safety rules may result in threats to the employee's health and life, temporary suspension of operations, and property damage.
Key risk factors• Unsatisfactory organisation and control of work safety
Pursuant to the Occupational Health and Safety Policy approved by the Company's Board of Directors, the Company undertakes to:• ensure continued control over compliance with the health and safety requirements;• improve the working conditions for employees of the Company and its contractors deployed at the
Company's production facilities, including by implementing new technologies and labour saving solutions, and enhancing industrial safety at production facilities;
• provide staff with certified state-of-the-art personal protective equipment;• carry out preventive and therapeutic interventions to reduce the potential impact of hazardous and
dangerous production factors;• regularly train and instruct employees and assess their health and safety performance, and conduct
corporate workshops, including by deploying special simulator units;• enhance methodological support for health and safety functions, including through the development
and implementation of corporate health and safety standards;• improve the risk assessment and management framework at the Group’s companies and production
facilities as part of the Risk Control project;• analyse the competencies of line managers at the Company’s production facilities, develop health and
safety training programmes and arrange relevant training sessions;• provide training for managers under the programme to determine root causes of accidents using the best
international practices (“Tree of Causes and Hazards”, 5-why, etc.);• provide information about the circumstances and causes of an accident to all employees of the Company,
conduct ad hoc instruction sessions.• introduce a framework to manage technical, technological, organisational and HR changes.
INFORMATION SECURITY RISKS
Potential cyber crimes may result in an unauthorised transfer, modification or destruction of information assets, disruption or lower efficiency of IT services, business, technological and production processes of the Company.
Key risk factors• Growing external threats;• unfair competition;• rapid development and automation of IT infrastructure,
technological and business processes;• employee and third party wrongdoing.
To manage this risk, the Company undertakes to:• develop the Information Security Strategy and Programme, define roles and responsibilities in information
security at a corporate level;• draft information security rules and regulations;• comply with Russian laws and regulations with respect to personal data and trade secret protection,
insider information, and critical information infrastructure;• categorise information assets and assess information security risks;• raise awareness in information security;• use technical means to ensure information security of assets;• manage access to information assets and information security incidents;• ensure information security of the process control system;• monitor threats to information security and use technical protection means, including vulnerability
analysis, penetration testing, cryptographic protection of communication channels, controlled access to removable media, protection from confidential data leakages, mobile device management;
• set up and certify the Information Security Management System.
Risk type Mitigants
PRICE RISK
Potential decrease in revenues due to lower prices for metals (nickel, copper, platinum, palladium, etc.) subject to the actual or potential changes in demand and supply on certain metal markets, global macroeconomic trends, and the financial community's interest in speculative/investment transactions in the commodity markets.
Key risk factors• Lower demand;• inventory liquidation by market participants;• speculative price decrease.
To manage this risk, the Company is continuously monitoring metal price (market) forecasts.Should the risk materialise, the Company will consider cutting capital expenditures (revising the investment programme for projects that do not have a material impact on the Company’s development strategy) as part of the budget process.
FX RISK
USD depreciation against RUB, including due to changes in the Russian economy and the policy of the Bank of Russia, may adversely affect the Company's financial performance, as most of its revenues are denominated in USD, while most of its expenses are denominated in RUB.
Key risk factors• Increase in Russia’s balance of payments, higher oil
exchange prices and lower imports;• improved country macroeconomics; • change in ratings;• lower volatility in financial markets of Russia and other
developing countries.
To manage this risk, the Company undertakes to:• maintain a balanced debt portfolio where USD-denominated borrowings prevail to ensure a natural
hedge;• implement regulations that limit fixing of prices in foreign currencies in expenditure contracts.
The same principles of centralisation apply to our freight, construction and installation, aircraft and ship insurance arrangements. The Group, as well as its directors and officers, carry business and third-party liability insurance.
To optimise terms of coverage and better manage covered risks, we follow the best mining industry practices.
TECHNICAL AND PRODUCTION RISK
Technical, production, or natural phenomena, which, once materialised, could have a negative impact on the implementation of the production programme and cause technical incidents or reimbursable damage to third parties and the environment.
Key risk factors• Harsh weather and climatic conditions, including low
temperatures, storm winds, snow load;• unscheduled stoppages of key equipment;• release of explosive gases and flooding of mines;• collapse of buildings and structures;• infrastructure breakdowns.
To manage this risk, the Company undertakes to:• properly and safely operate its assets in line with the requirements of the technical documentation,
technical rules and regulations as prescribed by the local laws across the Company's footprint;• introduce ranking criteria and determine the criticality of key industrial assets;• timely replace its fixed assets to achieve production safety targets;• implement automated systems to control equipment's process flows;• improve the maintenance and repair system;• train and educate its employees both locally, on site, and centrally, through its corporate training centres;• systematically identify and assess technical and production risks. The Company has developed and is
implementing a programme of organisational and technical actions aimed at reducing these risks;• develop the technical and production risk management system, including by engaging independent
experts to assess the system efficiency and completeness of data;• engage, on an annual basis, independent surveyors to analyse the Company's exposure to disruptions
in the production and logistics chain and assess related risks. In 2017, key technical and production risks were insured as part of the property and business interruption (downtime) insurance programme, with emphasis laid on best risk management practices in the mining and metals industry. The programme aims to protect the assets of the Company and its shareholders against any catastrophic risks. In addition, the Company insured production assets at its facilities that make up the key production chain.
COMPLIANCE RISK
The risk of legal liability and/or legal sanctions, significant financial losses, suspension of production, revocation or suspension of a licence, loss of reputation, or other adverse effects arising from the Company’s non-compliance with the applicable regulations, instructions, rules, standards or codes of conduct.
Key risk factors• Сhanges in legislation and law enforcement practices;• discrepancies in rules and regulations;• considerable powers and a high degree of discretion
exercised by regulatory authorities;• potential violation of legal requirements by the
Company’s business units and Russian subsidiaries.
To manage this risk, the Company undertakes to:• make sure that the Company complies with the applicable laws;• defend the Company's interests during surveillance inspections or in administrative offence cases;• use pre-trial and trial remedies to defend the Company's interests;• include conditions defending the Company's interests in the contracts signed by the Company;• implement anti-corruption, anti-money laundering and counter-terrorist financing initiatives;• take actions to prevent unauthorised use of insider information and market manipulation;• ensure timely and reliable information disclosures as required by the applicable Russian and international
laws.In addition to ongoing measures, the following documents were developed and approved in 2017:the Norilsk Nickel Group's Legal Support Policy, Antitrust Compliance Policy (formalising interactions to ensure legal protection of the Norilsk Nickel Group's interests), Regulations on Interaction of MMC Norilsk Nickel's Business Units and Officers to Prevent Unlawful Use of Insider Information in Compliance with the Market Abuse Regulation of the European Parliament and of the Council No. 596/2014, amended version of MMC Norilsk Nickel's Information Policy Regulations (alignment with the applicable Russian and international information disclosure laws).
Annual report • 2017Corporate governance Risk management and internal controls
• 196 • • 197 •
Co
mp
any overview
Strategy o
verviewM
arket overview
Business o
verview
Corp
orate governance
Inform
ation fo
r sharehold
ersA
pp
endixes

Risk type Mitigants
RISKS RELATED TO CHANGES IN LEGISLATION AND LAW ENFORCEMENT PRACTICES
Adverse consequences arising from the Company’s non-compliance with the applicable regulations, instructions, rules, standards or codes of conduct.
Key risk factors• Unstable legal environment;• complicated geopolitical situation;• significant budget deficit (government agencies and
authorities seeking to boost revenues).
To manage this risk, the Company undertakes to:• continuously monitor changes in legislation and law enforcement practices in all business areas;• perform legal due diligence of draft regulations and amendments;• participate in discussions of draft regulations, both publicly and as part of the expert groups;• engage its employees in relevant professional and specialist training programmes, corporate workshops,
and conferences;• cooperate with government agencies to ensure that new laws and regulations take into account the
Company’s interests.
POWER BLACKOUTS AT PRODUCTION AND SOCIAL FACILITIES IN THE NORILSK INDUSTRIAL DISTRICT (NID)
The failure of key equipment at the generating facilities of fuel and energy companies and transmission networks may result in power, heat and water shortage at key production facilities of the Company’s Polar Division / Russian subsidiaries and social facilities in the NID.
Key risk factors• The isolation of the NID's power system from the
national grid (Unified Energy System of Russia);• harsh weather and climatic conditions, including low
temperatures, storm winds, snow load;• length of power, heat and gas transmission lines;• wear and tear of key production equipment and
infrastructure.
To manage this risk, the Company undertakes to:• operate and maintain generating and mining assets as required by the technical documentation, industry
rules, regulations, and laws;• timely construct and launch transformer facilities;• timely upgrade (replace) TPP and HPP power units' equipment;• timely replace transmission towers;• timely upgrade and renovate trunk gas and condensate pipelines and gas distribution networks.
SOCIAL RISKS
Escalating tensions among the workforce due to the deterioration of social and economic conditions in the Company's regions of operation.
Key risk factors• Headcount optimisation;• rejection of the Company’s values by some employees
and third parties;• limited ability to perform annual wage indexation;• dissemination of false and inaccurate information about
the Company’s plans and operations among the Group’s employees;
• lower spending on social programmes and charity.
To manage this risk, the Company undertakes to:• strictly abide by the collective bargaining agreements made between the Group's companies and employees;• actively interact with regional and local authorities, and civil society institutions;• fulfil its social obligations under public-private partnership agreements;• implement the World of New Opportunities charity programme aimed at supporting and promoting regional public
initiatives; • implement the Norilsk Upgrade project to introduce innovative solutions for sustainable social and economic
development of the region;• implement monitoring across the Group's operations;• conduct opinion polls among Norilsk's communities to learn more about their living standards, employment,
migration trends and general social sentiment, and identify major challenges;• implement social projects and programmes aimed at supporting employees and their families, as well as the
Company’s former employees;• coordinate, over the year, the joint efforts of various participants and promptly address any issues arising during
the reconstruction of Norilsk Airport's runway, at the meetings of the task force involving the representatives of the Norilsk Administration, regional and federal authorities, Norilsk Airport and NordStar Airlines;
• provide treatment at Chinese health resorts during winter (programme geography expansion) to compensate for fewer summer packages due to runway reconstruction at Norilsk Airport;
• engage in dialogues with stakeholders and conduct opinion polls while preparing public CSR reports.
Internal control frameworkThe Company has an internal control system in place intended to promote the achievement of the Company's goals and enhance investor confidence in its business and corporate bodies. The internal control system is aimed at improving the effectiveness and efficiency of activities, keeping reliable and accurate financial and management accounts, ensuring compliance with the requirements of applicable Russian laws and the Company's by-laws.
The Company has the Internal Control Policy in place adopted by resolution of the Board of Directors in 2016. In addition, internal control requirements, procedures, and processes are covered by the procedure for “Internal Control Processes at MMC Norilsk Nickel”, as well as by business unit regulations and other internal guidelines.
All internal control processes, principles, mechanisms, means, and procedures make up a system of elements: • control environment;• assessment of risks to business processes;• control procedures;• information and communications;• monitoring of the internal control system.
Entities that form the internal control system are structured on a number of levels, which comprise the Company’s and subsidiaries’ corporate bodies, business units and employees as well as dedicated control bodies:• Internal Control and Risk Management Unit, including
the Internal Control Department, Risk Management Service, and Financial Control Service,
• Internal Audit Department,• Audit and Sustainable Development Committee,• Audit Commission.
Internal Control Department
The Internal Control Department aims to create an efficient internal control framework that represents a combination of organisational processes, policies and guidelines, control procedures, corporate culture
principles and actions that the internal control entities perform to provide reasonable assurance that the Company will achieve its targets. The department's functions include:• developing and boosting efficiency of the internal
control framework;• ensuring a consistent approach to the design,
operation and development of the internal control framework;
• detecting and preventing any waste, misuse or misappropriation of funds or assets of the Company and its subsidiaries, wrongdoings and theft;
• ensuring accuracy of metrics and measurement standards for the control and accounting of metal bearing products;
• arranging and implementing internal controls so as to combat illegal activities, such as money laundering and terrorism financing;
• managing the Corporate Trust Service operations.
Also, the Company has set up the Financial Control Service that audits the financial and business operations of the Company and its subsidiaries to report and issue recommendations to the President and directors of the Company. The head of the Financial Control Service is appointed by a resolution adopted by the Company’s Board of Directors.
Corporate Trust Service
In February 2010, the Company launched its Corporate Trust Service, which helps the Company’s management to promptly respond to reports of abuses, embezzlement and other violations. Employees, shareholders and other stakeholders have an opportunity to report any actions that will or might result in financial damages or be detrimental to the business reputation of the Company. The key principles underlying the Corporate Trust Service include guaranteed confidentiality for whistleblowers, timely and unbiased consideration of all reports. In no circumstances does the Company impose sanctions (including dismissal, demotion, deprivation of a bonus) against the employee who submitted a report to the Corporate Trust Service.
Annual report • 2017Corporate governance Risk management and internal controls
• 198 • • 199 •
Co
mp
any overview
Strategy o
verviewM
arket overview
Business o
verview
Corp
orate governance
Inform
ation fo
r sharehold
ersA
pp
endixes
To make a report, anyone is invited to call a toll-free 24/7 hotline: +7 800 700-1941, +7 800 700-1945, or e-mail to [email protected].
Information on received and processed reports is disclosed annually by the Company as part of its CSR report.
Internal Audit Department
The Internal Audit Department is responsible for the Company's internal audit. It was established to assist the Board of Directors and executive bodies in enhancing the Company’s management efficiency and improving its financial and economic operations through a systematic and consistent approach to the analysis and evaluation of risk management and internal controls as tools to provide reasonable assurance that the Company will achieve its goals.
The Internal Audit Department conducts unbiased and independent audits, assessing how effective the internal controls and the risk management system are. Based on the audits, the department prepares reports and proposals for the management on how to improve internal controls, and monitors the development of action plans to eliminate violations.
In order to ensure independence and objectivity, the Internal Audit Department functionally reports to the Board of Directors through the Audit and Sustainable Development Committee and has an administrative reporting line to the Company's President. It continuously monitors the implementation of activities developed by the management. The Board of Directors’ Audit and Sustainable Development Committee regularly reviews the department's work plan, audit reports, and monitoring analytics.
In 2017, the Department conducted the following audits:• planning and control of process equipment repairs;• operation of motor vehicles;• IT;
• compliance with health and safety requirements;• technical and production risk management;• compliance with corporate standards and policies.
Based on these audits, the management developed action plans which provide for a range of activities aimed at improving internal control procedures and mitigating risks.
In 2018, the Internal Audit Department plans to conduct a comprehensive assessment of the risk management and internal control system and its performance, and submit the results to the Audit and Sustainable Development Committee for review.
Audit Commission
The Audit Commission is a corporate body which monitors the financial and business operations of the Company. The commission audits the Company’s financial and business operations on an annual basis and at any time as decided by the commission, resolutions of the General Meeting of Shareholders and the Board of Directors or as requested by shareholders who hold collectively at least 10% of the Company's voting shares. Following the review of financial and business results, the Audit Commission issues an opinion. Business operations were last audited in April–May 2017.
The Audit Commission works in the shareholders’ interests and reports to the General Meeting of Shareholders, which elects members of the Audit Commission until the next Annual General Meeting of Shareholders. The Audit Commission is independent from the officers of the Company’s governance bodies, and its members do not hold positions in the Company's governance bodies.
In the reporting year, the Audit Commission consisted of five people as prescribed by the resolution of the Annual General Meeting of Shareholders dated 9 June 2017.
Remuneration payable to the members of the Audit Commission was approved by the Annual General Meeting of Shareholders on 9 June 2017. Members of the Audit Commission employed by the Company are remunerated throughout the year as per their job description and employment terms.
Corruption control
The Company complies with Russian and international anti-corruption laws. In its interaction with government officials, the Company, as well as its employees and corporate bodies, comply with the applicable laws (including anti-corruption laws), thus boosting the Company's reputation and building up trust towards the Company from its shareholders, investors, business partners and other stakeholders.
As part of its effective anti-corruption combat, the Company has developed and approved the following anti-corruption regulations:• Business Ethics Code; • Code of Conduct and Ethics for Members of the
Board of Directors; • Anti-Corruption Policy; • Regulation on the Product Procurement Procedure
for MMC Norilsk Nickel's Enterprises; • standard anti-corruption agreement – appendix to
the employment contract; • Regulation on Information Security; • Regulation on the Prevention and Management of
Conflicts of Interest;• Regulation on Business Gifts;• Procedure for Anti-Corruption Due Diligence on
Internal Documents at the Head Office of MMC Norilsk Nickel;
• Regulation on the Conflict of Interest Commission;• Information Policy.
Having joined the Anti-Corruption Charter of the Russian Business, the Company implements dedicated anti-corruption measures based on the Charter and set forth in the Company's Anti-Corruption Policy.
In January 2018, the Company confirmed compliance with the Charter and secured its position on the Charter’s Register.
In November 2016, the Company joined the United Nations Global Compact, which aims to promote recognition and practical application of ten basic principles of human rights, labour, environment and anti-corruption by businesses worldwide.
The Company’s personnel receive ongoing training on anti-corruption matters. In December 2017, all new employees at the Head Office completed online
Remuneration of the Audit Commission members in 2017
Remuneration types thousand RUB thousand USD
Remuneration for the membership in a control body 7,200 123
Salary 4,620 79
Bonus 11,620 199
Commissions 0 0
Benefits 0 0
Compensation 0 0
Other types of remuneration 0 0
Total 23,440 402
anti-corruption training and testing. An important element of the Company's undertakings are corruption prevention measures aimed at making employees clearly aware of the possible consequences and the “inevitability of penalty” not only for those who engage in corruption, but also for those who become aware of corruption and do not report it. Starting in 2015, all of the Company employees sign an agreement setting out their obligations in the anti-corruption area. All of the Company's employees are familiarised with the corporate Anti-Corruption Policy and related regulations. The Company ensures functioning of the Preventing and Fighting Corruption page on the corporate website containing information on anti-corruption regulations adopted, measures taken, preventive procedures introduced, legal training sessions organised and law-abidance promotion efforts taken.
No. Name Primary employment and position
1. Vladimir Shilkov Chief Investment Officer at CIS Investment Advisers, Deputy Project Manager of the Financial Control Service at MMC Norilsk Nickel
2. Anna Masalova Chief Financial Officer, Moscow–McDonalds CJSC
3. Georgy Svanidze Head of Financial Department, member of the Management Board at Interros Holding Company
4. Elena Yanevitch Chief Executive Officer, Interpromleasing
5. Artur Arustamov Director of Price Control and Commercial Operations Department, En+ Management
Regulating the conflict of interestOne of the key anti-corruption measures is timely prevention and management of conflicts of interest. Procedures for assessing and settling conflicts of interest are set forth in the Regulation on the Prevention and Management of Conflicts of Interest at MMC Norilsk Nickel. As part of the regulation, the Company has approved the standard declaration form for reporting conflicts of interest, to be filled in by candidates applying for vacant positions or by the Company's employees whenever required.
On top of that, the Company has undertaken measures aimed at preventing potential conflict of interest involving governance bodies and key employees. From December 2016, members of the Company's governance bodies are required to annually submit information on relatives and family as per the approved form.
Annual report • 2017Corporate governance Risk management and internal controls
• 200 • • 201 •
Co
mp
any overview
Strategy o
verviewM
arket overview
Business o
verview
Corp
orate governance
Inform
ation fo
r sharehold
ersA
pp
endixes

Alongside with these measures, the Regulation on the Prevention and Management of Conflicts of Interest at MMC Norilsk Nickel extends to all employees of the Company. It sets forth key principles that include obligation of each employee to disclose a conflict of interest, as well as non-retaliation for reporting the conflict of interest.
The Company takes measures aimed at identifying related-party transactions. All measures combined, undertaken in order to identify and prevent conflicts of interest, minimise the probability of negative consequences for the Company.
Insider information
The Company implements initiatives to prevent unauthorised use of insider information. In accordance with Federal Law No. 224-FZ of 27 July 2010 On Prevention of Unlawful Use of Inside Information and Market Manipulation and on Amendments to Certain Legislative Acts of the Russian Federation, as well as the Market Abuse Regulation of the European Parliament and of the Council No. 596/2014 of 16 April 2014, the Company keeps a list of insiders, reviews by-laws and corporate events, to control implementation of measures as provided for in the Russian and international legislation, which includes disclosure of insider information. The Company also undertakes other measures aimed at preventing unlawful use of insider information.
Comprehensive security frameworkIn 2017, MMC Norilsk Nickel's corporate security operations focused on regular updates and the implementation of a comprehensive security system, which drew heavily on the ongoing analysis of the full range of the Company's modern-day challenges and threats in a rapidly changing operating environment. The ongoing implementation of the MBO (Management by Objectives) principles in the economic, corporate, information and physical security systems has enabled the Company to promptly and adequately respond to key risks, clamp down on embezzlement, implement initiatives to counter illicit trafficking of precious metals and metal bearing materials, and efficiently prevent in-house corruption.
The methodology boasts recognition from the international forensic community and is widely used not only for the Company's purposes, but also in examinations as requested by law enforcement authorities, to combat illicit trafficking of precious and non-ferrous metals.
A powerful tool to combat embezzlement and illicit trafficking of products containing precious metals is our Office for Chemical Forensic Analysis unprecedented among metals and mining and other industrial companies.
Its experts have developed an innovative comprehensive methodology for products containing precious metals, which can reliably trace their origin to the manufacturer, production shop and even section.
Office for Chemical Forensic Analysis
In an effort to take public-private partnership in the field of security to a new level of quality, cooperation was established with government law-enforcement authorities, also in the Company's regions of operations. This approach enables a balanced planning of corporate security measures set to be an integral part of the national economic security system. MMC Norilsk Nickel pays special attention to complying with anti-terrorism requirements and enhancing security of the Company's strategic power and transportation facilities. In 2017, the close cooperation with law enforcement authorities helped the Company protect these facilities from any potential unlawful intrusion.
The Company ensures 100% safety and confidentiality of the employee and counterparty personal data, taking steps to integrate information security processes with other group-wide business processes and novel IT solutions. It is also continuously upgrading its comprehensive security system aimed at preventing external cyber interference with production processes. This made it possible for the Company, among other things, to effectively neutralise WannaCry and Petya virus attacks.
On top of that, Nornickel initiated the adoption of the Information Security Charter for Critical Industrial Facilities which defines corporate principles and standards of safe cyber behaviour. Measures undertaken in 2017 ensure a reliable protection of the Company's IT infrastructure.
The Company has further fostered its international activity in the field of industry-specific business security. The Security Committee of the International Platinum Group Metals Association is chaired by the Company's representative who works together with the United Nations Interregional Crime and Justice Research Institute (UNICRI) to prepare and implement practical recommendations in order to strengthen
public-private partnerships aimed at fighting illicit transnational trafficking of precious metals. These initiatives received the support of world’s major metal producers.
The Institute for Modern Security Challenges, the Company's subsidiary, has been developing new corporate methods to protect the Company's legitimate interests focusing on the analysis of best international practices, introduction of acknowledged standards and practices of secure development of mining companies, expert reviews and preparation of analytical materials. Their practical implementation is aimed at optimising the Company's security costs and more efficient process management.
MMC Norilsk Nickel received an outstanding award at InfoSecurity Russia 2017: Global Initiatives in Industrial IT Security
Awards
Independent auditThe Company has approved the Procedure to Select an Auditor for MMC Norilk Nickel's RAS and IFRS Financial Statements, which requires first to establish a tender commission to produce a list of auditors who perform best in the Russian market of audit services. The auditor whose conditions are recognised to be the best following the procedure, is recommended to the Audit and Sustainable Development Committee which, in its turn, assesses the candidate for an independent auditor and provides recommendations to the Board of Directors. Under applicable laws and Clause 7.1.9 of the Company's Charter, the auditor shall be approved by an Annual General Meeting of Shareholders.
In June 2017, the General Meeting of Shareholders, following the recommendation of the Board of Directors, approved JSC KPMG as the Company’s auditor for RAS and IFRS 2017 accounts, as well as IFRS accounts for 1H 2018.
The auditor receives a fixed fee as determined in the technical and business proposal that sets out the audit procedure for all material audited facilities and calculates the labour input and travel expenses required to conduct the audit, based on the qualifications and hourly rates of experts engaged. In 2017, the auditor's fee amounted to USD 4.2 mln, including overhead charges and VAT. The share of non-audit services rendered to the Company stood at 24% of the total fee.
The auditor receives in 2017
Type of services mln RUB mln USD
Audit of consolidated IFRS financial statements for 2017 104.4 1.8
Audit of RAS financial statements for 2017 17.7 0.3
Review of interim IFRS financial statements for 6M 2017 26.6 0.5
Audit-Related Services 39.2 0.7
Non-audit services 58.8 1.0
Total 246.7 4.2
Annual report • 2017Corporate governance Risk management and internal controls
• 202 • • 203 •
Co
mp
any overview
Strategy o
verviewM
arket overview
Business o
verview
Corp
orate governance
Inform
ation fo
r sharehold
ersA
pp
endixes
INFORMATION FOR SHAREHOLDERS
Authorised capital
Securities
Dividends
Shareholder rights
Transparency
206
206
210
213
214

Annual report • 2017Information for shareholders
• 206 • • 207 •
Authorised capital
Holders of MMC Norilsk Nickel’s shares and American depositary receipts (ADRs)
Holders
Share in the authorised capital, %
31 December 2015 31 December 2016 31 December 2017
Olderfrey Holdings Ltd1 30.4 30.4 30.4
UC Rusal Plс1 27.8 27.8 27.8
Crispian Investments Ltd 5.5 4.2 4.2
Other 36.3 37.6 37.6
1 Indirect control via controlled entities.
SecuritiesStock exchanges trade in MMC Norilsk Nickel’s shares and ADRs.
As at 31 December 2017, the Company's capitalisation stood at USD 29.7 bn , up 12% y-o-y.
As at 31 December 2017, the authorised capital of MMC Norilsk Nickel comprised 158,245,476 ordinary shares with a par value of RUB 1 each.
The Company placed no preferred shares.
As at 31 December 2017, there were registered in the shareholder register:
39 473 persons
39,445 individuals 28 legal entities
3 nominal holders
Share capital structure, 31 December 2017 // %
Share and ADR split, 31 December 2017 // %
USD 29.7 bnNornickel's capitalisation
+12%
Average monthly capitalisation in 2017 // USD bn
The Company's ordinary shares have been trading on the Russian market since 2001.
They are included in the Moscow Exchange’s Blue Chip Index (ticker symbol: GMKN) and rank among liquid instruments in the Russian securities market.
MMC Norilsk Nickel’s registrar is Independent Registrar Company. The registrar provides a full scope of services to the Company’s shareholders. Shareholders (individuals and legal entities) listed in the Company's shareholder register have access to the Shareholder’s Personal Account, where they can:• view the number and price of their shares, • check dividends accrued and paid, • see the date of the upcoming General Meeting of
Shareholders,• participate in General Meetings of Shareholders
through e-voting.
Access to the personal account can be obtained at a branch of Independent Registrar Company.
Ordinary shares
Share price and trading volume on the Moscow Exchange in 2017
Share price and MOEX Index in 2017 // %
Source: Bloomberg
Source: Moscow Exchange
Share price and trading volume on the Moscow Exchange
Date
Share price, RUB
Volume, sharesMarket cap
at end of period, RUB bnMin Max End of period
2013 4,105 6,101 5,399 72,088,571 854
2014 5,150 10,805 8,080 75,215,906 1,279
2015 8,590 12,106 9,150 58,018,280 1,448
2016 8,050 11,070 10,122 48,275,360 1,602
2017, incl. 7,791 11,610 10,850 49,456,624 1,717
Q1 8,807 10,439 8,929 11,081,179 1,413
Q2 7,791 9,186 8,068 10,419,785 1,277
Q3 8,197 9,920 9,920 14,867,898 1,570
Q4 9,876 11,610 10,850 13,087,762 1,717
The Shareholder’s Personal Account
Olderferey Holdings Ltd1
UC Rusal Plc1
Crispian Investments LtdOther
158.2millionshares
30.4
27.84.2
37.6
SharesADRs
158.2millionshares
59.1
40.9
For more details on the registrator, please see the Contacts section.
Jan Feb Mar Ap May Jun Jul Aug Sep Oct Nov Dec
26.18 26.6324.70 24.73
23.3221.88
22.6524.28
26.50
28.91 29.8428.44
Disclosure of FY 2016 financial results
Recommendation on dividend payment for FY 2016
Disclosure of 1H 2017 financial results
Recommendation on dividend payment for 1H 2017
Jan Feb Mar Ap May Jun Jul Aug Sep Oct Nov Dec
Trading volume // RUB mln
0
10
20
30
40
50
60
0
4
8
12
Average share price // RUB (RHS)
Jan Feb Mar Ap May Jun Jul Aug Sep Oct Nov Dec
60
80
100
120
Nornickel shares MOEX Index
+6%
–8%
p. 295
Co
mp
any overview
Strategy o
verviewM
arket overview
Business o
verview
Co
rpo
rate go
vernanceInform
ation for shareholders
Ap
pend
ixes
Source: Bloomberg

Annual report • 2017Information for shareholders
• 208 • • 209 •
ADRs Bonds
In 2001, MMC Norilsk Nickel issued ADRs for its shares. Currently, shares are convertible into ADRs at a ratio of 1:10. Depositary services for ADR transactions are provided by the Bank of New York Mellon, and custody services are provided by VTB Bank.
ADRs are traded in the electronic trading system of OTC markets of the London Stock Exchange (ticker symbol: MNOD), on the US OTC market (ticker symbol: NILSY), and on many other exchanges.
As at 31 December 2017, the total number of ADRs issued against MMC Norilsk Nickel’s shares was 647,562,500, or 40.9% of the authorised capital. The number of ADRs traded on stock exchanges is not constant, and depositary receipt holders may convert their securities into shares and vice versa.
In 2017, the Company successfully placed two Eurobond issues for a total of USD 1.5 bn against a favourable market backdrop: April saw us close the offering of USD 1.0 bn Eurobonds due in 2023 with a coupon rate of 4.10% that was inside the Company's outstanding Eurobond curve, followed by a second USD 500 mln issue due in 2022 with a coupon rate of 3.849% (the lowest among the Company's outstanding bonds) placed in June.
In 2017, the Company had five Eurobond issues outstanding for a total amount of USD 4,250 mln with maturities in 2018, 2020, 2022 and 2023, and one issue of rouble exchange-traded bonds for RUB 15 bn due in 2026.
ADR price and trading volume on the London Stock Exchange in 2017
ADR price and global indices // %
Source: Bloomberg
Source: Bloomberg
ADR price and trading volume on the OTC market of the London Stock Exchange
Date
ADR price, USD
Volume, sharesMarket cap at end of
period,USD mlnMin Max End of period
2013 12.4 20.3 16.6 1,021,589,603 26,300
2014 14.2 21.5 14.2 1,162,822,466 22,503
2015 12.4 21.6 12.7 724,594,769 20,042
2016 10.4 18.2 16.8 647,017,484 26,569
2017, incl. 13.0 20.2 18.7 737,658,803 29,655
Q1 14.8 17.6 15.7 182,345,505 24,876
Q2 13.0 16.3 13.8 144,255,268 21,838
Q3 13.9 17.2 17.2 211,593,420 27,242
Q4 17.2 20.2 18.7 199,464,610 29,655
For more details on trading in the Company’s shares and ADRs, please see our website
Share and ADR trading volume by exchanges // %
Eurobonds
Instrument
Eurobonds 2018 (LPN)
Eurobonds 2020 (LPN)
Eurobonds 2022 (LPN)
Eurobonds 2022 (LPN)
Eurobonds 2023 (LPN)
Issuer MMC Finance D.A.C. MMC Finance D.A.C. MMC Finance D.A.C. MMC Finance D.A.C. MMC Finance D.A.C.
Issue size USD 750 mln USD 1,000 mln USD 500 mln USD 1,000 mln USD 1,000 mln
Coupon rate 4.375% 5.55% 3.849% 6.625% 4.10%
Offering date 30 April 2013 28 October 2013 8 June 2017 14 October 2015 11 April 2017
Maturity date 30 April 2018 28 October 2020 8 April 2022 14 October 2022 11 April 2023
Coupon dates 30 October / 30 April 28 October / 28 April 8 October / 8 April 14 October / 14 April 11 October / 11 April
Issue rating BBB-/Bаa3/BBB- BBB-/Bаa3/BBB- ВВВ-/ – /ВВВ- BBB-/Bаa3/BBB- ВВВ-/ – /ВВВ-
Rouble bonds
Instrument Exchange-traded bonds, BO-05
Issuer MMC Norilsk Nickel
ISIN RU000A0JW5C7
Offering date 19 February 2016
Maturity date 6 February 2026
Issue size RUB 15 bn
Coupon rate 11.60%
Coupon dates Each 182 days starting from the offering date
As at the end of 2017, the Company boasted credit ratings from three leading international rating agencies:
Fitch Ratings: BBB– / StableStandard & Poor's: BBB– / StableMoody's: Ba1 / Stable
On 30 January 2018, Moody's upgraded Nornickel's credit rating to Ваа3 (investment grade) and raised its outlook from stable to positive following an increase in Russia's country ceilings for foreign currency debt to the same Baa3 level and a change in the outlook on Russia’s rating from stable to positive. The Company's credit ratings from all the three rating agencies (Fitch, Moody’s and S&P Global) currently qualify as investment grade.
40
60
80
100
120
Jan Feb Mar Ap May Jun Jul Aug Sep Oct Nov Dec
+10%
–3%
+38%
Nornickel's ADRs RTS Index Euromoney global diversified index
Trading volume // USD mln
0
1
2
0
5
10
15
20
Average ADR price // USD (RHS)
Jan Feb Mar Ap May Jun Jul Aug Sep Oct Nov Dec
Moscow Exchange (shares)
London Stock Exchange (ADRs)
New York Stock Exchange (ADRs)
2017
2016
2015
2014
35
41
44
39
64
58
55
60
1
1
1
1
Co
mp
any overview
Strategy o
verviewM
arket overview
Business o
verview
Co
rpo
rate go
vernanceInform
ation for shareholders
Ap
pend
ixes

Annual report • 2017Information for shareholders
• 210 • • 211 •
DividendsDividend policy
MMC Norilsk Nickel’s Dividend Policy aims to balance the interests of the Company and its shareholders, enhance the Company's investment case and market capitalisation, and ensure respect of shareholder rights.
The Company has put in place the Regulations on the Dividend Policy to ensure transparency on how dividends are calculated and paid out.
Under the Company’s dividend policy, in determining the recommended dividend amount, the Board of Directors seeks to make sure that annual dividends on the Company’s shares make up at least 30% of the Group's consolidated EBITDA.
The decision to pay dividends is made by the General Meeting of Shareholders based on recommendations of the Board of Directors. The General Meeting of Shareholders also takes into account the Board’s recommendations to determine the dividend amount and record date, which shall be set not earlier than 10 days before and not later than 20 days after the General Meeting of Shareholders.
Dividends to a nominee shareholder listed on the shareholder register shall be paid within 10 business days, while dividends to other persons listed on the shareholder register shall be paid within 25 business days after the record date.
Key principles of Nornickel’s dividend policy:
• Legality: compliance with the Russian law, the Company's Charter and by-laws;
• Transparency: transparency on how dividends are calculated and paid out;
• Balance: dividend payouts to shareholders along with long-term business development and capitalisation growth for the Company;
• When calculating dividends, MMC Norilsk Nickel accounts for the cyclical nature of the metals market and for the need to maintain a high level of creditworthiness. As a result, the amount of dividends may change depending on the Company’s operating profit and leverage.
Dividend report
Dividends are paid to individuals/entities whose rights to shares are recorded in the shareholder register by Independent Registrar Company, MMC Norilsk Nickel’s registrar
Individuals/entities whose rights to shares are recorded by a nominee shareholder are paid dividends via their nominee shareholder.
In accordance with Clause 9 of Article 42 of Federal Law No. 208-FZ On Joint-Stock Companies dated 26 December 1995, any person who has not received the declared dividends due to the fact that their accurate address or banking details were not available to the company or the registrar as required, or due to any other delays on the part of the creditor, may request payment of such dividends (unpaid dividends) during the period of three years from the date of the resolution to pay the same.
On 24 May 2018 the Company's Board of Directors recommended that the General Meeting of Shareholders approve final dividends for FY 2017 in the amount of
RUB 607.98 per share (~ USD 9.87 at the RUB/USD exchange rate the Russian Central Bank as of May 24, 2018)
RUB 96.2 mln (~ USD 1,562 at the RUB/USD exchange rate the Russian Central Bank as of May 24, 2018)
Declared dividends per share1 // USD
Dividend yield2
1 Based on the total amount of dividends for 2017 recommended by the Board of Directors for approval by the General Meeting of Shareholders. Declared dividends based on the Bank of Russia's exchange rate as at the date of the Board of Directors’ meeting.
Dividends paid3
Period RUB mln USD mln
2017 176,246 2,971
2016 86,712 1,232
2015 154,227 2,859
2014 159,914 3,281
2 Dividend yield for the periods calculated based on the amount of dividends for the calendar year recommended by the Board of Directors and on the average ADR price by Bloomberg.
Committed to developing Tier-1 assets, Nornickel has been able to provide a consistently high dividend yield to its shareholders over the last five years. We expect the trend to continue.
Dividend history4
Period
Declared dividends5 Dividend per share/ADR
RUB mln USD mln RUB USD
Total for 2017 131,689 2,162 832 13.66
FY20176 96,210 1,562 608 9.87
6M 2017 35,479 600 224 3.79
Total for 2016 140,894 2,339 890 14.78
FY2016 70,593 1,239 446 7.83
9M 2016 70,301 1,100 444 6.95
Total for 2015 135,642 2,148 857 13.57
FY2015 36,419 548 230 3.46
9M 2015 50,947 800 322 5.06
6M 2015 48,276 800 305 5.06
Total for 2014 226,668 4,798 1,432 30.32
FY2014 106,031 2,018 670 12.75
9M 2014 120,637 2,780 762 17.57
3 Dividend paid during the above periods, excluding treasury shares.4 For dividend history covering earlier periods, please see our website.5 Calculated at the Bank of Russia's exchange rate as at the date of the Board of Directors’ meeting.6 On 24 May 2018, the Company's Board of Directors recommended that the General Meeting of Shareholders approve final dividends for 2017.
per share totalling
2017
2016
2015
2014
2013
13.7
14.8
13.6
30.3
13.9
Dividends per share paid for the reporting period // USD
2014 2015 2016 2017
20.7 18.1
7.8
18.8
13.6 147.3 7.2
Dividend yield // %
Co
mp
any overview
Strategy o
verviewM
arket overview
Business o
verview
Co
rpo
rate go
vernanceInform
ation for shareholders
Ap
pend
ixes

Annual report • 2017Information for shareholders
• 212 • • 213 •
TaxationIncome from securities is taxable pursuant to the applicable tax laws of the Russian Federation1.
Reduced tax rates or exemptions may apply to individuals and foreign entities who are not tax residents of Russia pursuant to international double tax treaties.
Starting from 1 January 2017, in order to apply for tax benefits under international double tax treaties, foreign organisations must confirm their permanent residence in a state which has a double tax treaty signed with Russia, and also provide the income paying tax agent with a document confirming the right of the organisation to receive such income (Clause 1, Article 312 of the Russian Tax Code).
Should the organisation fail to provide such confirmation by the date of the payout, the Russian tax agent shall withhold the tax at the standard rates stipulated by Clauses 2 and 3, Article 284 of the Russian Tax Code.
All shareholders, including minority and institutional shareholders, enjoy equal rights and treatment in their relations with the Company, in particular the rights to:• participate in General Meetings of Shareholders
and vote on all items within its competence;• receive dividends should the General Meeting of
Shareholders pass the relevant resolution;• receive part of the Company's property in case of
its liquidation;• have access to information about the Company's
operations.
The Company has the Regulations on the General Meeting of Shareholders in place that set forth procedures to convene, prepare and conduct its general meetings.
p. 295
For more details on the registrator, please see the Contacts section.
The Annual General Meeting of Shareholders is held on an annual basis not earlier than three months before and not later than six months after the end of the financial year. General meetings other than Annual General Meetings of Shareholders are defined as Extraordinary General Meetings of Shareholders and are held as per resolution of the Board of Directors at their discretion or at the request of the Audit Commission, the Company’s auditor, or shareholders who own at least 10% of the Company’s voting shares as at the date of the request.
The notice of a General Meeting of Shareholders is published in the Rossiyskaya Gazeta newspaper and the Taimyr newspaper and posted on the Company's website not later than 30 days prior to the date of the general meeting. If a general meeting is conducted in the form of absentee voting (by ballot), the notice is given in the above mentioned newspapers at least 30 days prior to the deadline set for the collection of ballot sheets.
Holders of MMC Norilsk Nickel's shares who are registered in the shareholder register receive a ballot from the Company and are entitled to exercise their voting right by sending the ballot sheet to the Company or by attending the General Meeting of Shareholders (in person or by proxy).
Holders of MMC Norilsk Nickel's shares who are clients of nominal holders can also participate in the General Meeting of Shareholders by instructing the nominal holders in accordance with the Russian securities law.
Holders of MMC Norilsk Nickel's shares (individuals and legal entities registered in the shareholder register and clients of nominal holders) can participate in the General Meeting of Shareholders through e-voting using the Shareholder’s Personal Account should such option be provided for by the Board of Directors in the process of general meeting preparation. Access to the personal account can be obtained at a branch of Independent Registrar Company.
ADR holders do not receive ballot sheets directly from the Company. According to the depository agreement, the Company notifies the depository, which as soon as possible, and provided it is not prohibited by the Russian law, notifies ADR holders about the general meeting and encloses voting materials and a document describing the voting procedure for ADR holders. To exercise their voting rights, ADR holders instruct the depository accordingly.
Tax treatment of income from securities // %
Item
Income from securities transactions
Interest income on securities
Dividend income on securities
Individuals
Residents 13 13 13
Non-residents 304 30 15
Legal entities
Russian companies 205 20 136
Non-resident companies 20 20 15
1 Chapter 23 (Personal Income Tax) and Chapter 25 (Corporate Income Tax) of the Russian Tax Code. 2 The formula is not applicable to dividends paid to foreign entities and/or individuals who are not tax residents of Russia.3 Excluding the dividend amount eligible for a zero tax rate pursuant to Subclause 1, Clause 3, Article 284 of the Russian Tax Code.4 If shares or other securities are sold in Russia.5 Or 0%, if shares (interests) of Russian entities acquired on or after 1 January 2011 are sold, provided that as at the date of their sale the shares (interests) have
been owned for over five years and subject to one of the conditions stipulated by Clause 2, Article 284.2 of the Russian Tax Code.6 Or 0%, if as at the date of the dividend payout resolution a Russian entity has been owning an interest of 50% (and more) in the authorised capital of the entity
paying dividends, for 365 days (and more).
AT — amount of tax to be withheld from the income of the recipient of dividends;
P — proportion of the dividend amount payable to one recipient to the total dividend amount to be distributed;
TR — tax rate for Russian entities (0% or 13%);
D1 — dividend amount to be distributed among all recipients;
D2 — dividend amount3, received by the entity paying dividends, provided that previously these amounts were not included in the taxable income.
Dividend tax formula2
AT=P×TR×(D1–D2)
Shareholder rights
For more details on the Regulations on the General Meeting of Shareholders, please see the Investor Relations section on the Company’s corporate website
Co
mp
any overview
Strategy o
verviewM
arket overview
Business o
verview
Co
rpo
rate go
vernanceInform
ation for shareholders
Ap
pend
ixes

Annual report • 2017Information for shareholders
• 214 • • 215 •
In 2017, the Company's Board of Directors approved the amended version of MMC Norilsk Nickel's Information Policy Regulation s, which primarily seeks to provide stakeholders with full and reliable information on the Company's operations and collect feedback.
In line with its key disclosure principles, the Company strives to provide any information on a regular and timely basis and make it available to stakeholders on the basis of equal rights and opportunities. We also work to ensure that the information is reliable and complete while maintaining a reasonable balance between transparent operations and business considerations. The Company provides updates in the media and on its corporate website at https://www.nornickel.ru/.
The Company’s disclosure procedures comply with the Russian law, the rules of the Moscow Exchanges and international regulations.
MMC Norilsk Nickel also seeks to improve transparency by releasing additional information in excess of that required by the law. The Company discloses information to shareholders and investors through the following channels: press releases, presentations, annual reports, CSR reports,
Transparency
2017 MILESTONE
In September 2017, Nornickel launched a new corporate website, now operating on two domains – www. nornickel.ru and www.nornickel.com for Russian and English speakers, respectively. The new website will help streamline interaction with stakeholders, tackle existing and potential business challenges and provide updates on key developments within the Company. Among other things, the website includes the new ESG Strategy subsection. To create the website, the Company leveraged best-in-class web technologies.
In 2017, the Company held
>350 meetings
with institutional investors
Nornickel corporate website
For more details on the events, please see the IR Calendar on the Company’s website
statements on material facts, disclosure feeds, and RNS. The Company makes a point of parallel disclosure in domestic and foreign markets.
The Company's quarterly disclosures include operating indicators, the issuer’s quarterly reports, RAS financial (accounting) statements, and affiliates lists. IFRS statements are disclosed on a semi-annual basis. The IFRS disclosures are followed by conference calls and webcasts of the Company’s senior management with analysts and investors for the purpose of providing the market with the required information and comments. In addition, to enhance transparency, the Company makes extensive use of all communication tools available, including participation of senior managers in conferences, speeches, presentations, investor days, and production site visits for investors
The Company engages in an ongoing dialogue with both existing shareholders and potential investors. During the past year, the Company maintained close interaction with the investor community and shareholders, organising over 350 meetings with institutional investors and an Investor Day in London followed by a road show in Europe and the US.
A General Meeting of Shareholders shall be considered properly convened (having a quorum) if the shareholders who own in aggregate more than 50% of the votes granted by the voting shares of the Company are present at the meeting.
Shareholders owning at least 2% of the Company’s voting shares may propose items to be included in the agenda of Annual General Meetings of Shareholders and may put forward candidates for election to the Board of Directors and Audit
Commission of the Company as and when prescribed by the Federal Law and the Company’s Charter.
Voting at the General Meeting of Shareholders is conducted in accordance with the "one share, one vote" rule, unless otherwise provided for in the Federal Law. Members of the Company’s Board of Directors are elected through cumulative voting, i.e. the number of votes held by each shareholder is multiplied by the number of persons to be elected to the Board of Directors.
Co
mp
any overview
Strategy o
verviewM
arket overview
Business o
verview
Co
rpo
rate go
vernanceInform
ation for shareholders
Ap
pend
ixes

Annual report • 2017Information for shareholders
• 216 • • 217 •
Internal documents and policies are available on website
ESG Strategy is available on website
The Company’s 2016 Annual Report won 10 awards and diplomas at prestigious Russian and foreign contests, including those hosted by the, Expert RA, Vision Awards LACP, ARC and Moscow Exchange. The report boasts eight LACP awards, including top platinum in the printed version and silver in the online annual reports in the mining category.
The Company’s 2016 Corporate Social Responsibility Report won four awards in the LACP's Vision Awards competition while also ranking among Top 40 non-financial reports globally and topping among CSR reports of Russian metals and mining companies. CSR report also received a special award at the Moscow Exchange.
Nornickel's website won the Moscow Exchange's award for the best design, navigation and disclosure, and ARFI’s IR-cases contest.
STAKEHOLDERS
INTERACTION
MECHANISMS
KEY INTERESTS
OF STAKEHOLDERS
KEY INTERACTION
EVENTS IN 2017
Stakeholder engagement
Shareholders and investors
Investment banks (brokers)
• Capitalisation growth• Dividend payments• Transparency of
information
• Transparency of information
• Stability
• One-on-one meetings • Conference calls• Phone calls• Emails• Site visits
• Meetings • Conference calls• Phone calls• Emails
• Investor Day in London• Conference calls and
a road show following the disclosure of IFRS financial statements
• Investor Day in London• Conference calls and
a road show following the disclosure of IFRS financial statements
Human rights policy Freedom of association policy Indigenous rights policy Local community relations policy Equal opportunities programme Working conditions policy Environmental policy (amended and supplemented) Biodiversity policy Environmental impact assessment policy Renewable energy sources policy Anti-corruption policy (amended and supplemented)
In 2017, the Company’s Board of Directors approved a number of social and environmental policies available on the Company's website, including:
Our key ESG achievements :
• In 2017, Nornickel earned a top position in the World Wildlife Fund’s Environmental Responsibility Rating of Metals and Mining Companies in Russia;
• In 2017, the Company moved up from the last year's 56th to the 35th position in Sustainalytics's ESG rating, with a score of 58 against 49 in 2016;
• In January 2018, MSCI ESG Research upgraded Nornickel's rating to a B level following a reduction in sulphur dioxide emissions by 6% compared to 2015, and strong anti-corruption commitment;
• In December 2016, Nornickel was included in the FTSE4Good Emerging Index, a leading CSR index;
• In November 2016, the Company joined the United Nations Global Compact, also becoming member of the Association “National Global Compact Network” in June 2017.
In recent years, the sustainable development agenda has been gaining ground, with an increasing number of investors and asset managers opting for responsible investment.
In 2017, the Company held around 20 target meetings with investors centred around environmental protection, social responsibility and corporate governance (ESG).
To improve interaction with investors and agencies engaged in assessing the Company against ESG criteria, Nornickel set up a dedicated section on its website that features all the required information: https://www.nornickel.com/investors/esg/
Also, it developed an ESG databook providing information on ESG indicators starting from 2010.
ESG: environmental protection, social responsibility and corporate governance
In 2017, the Company held around
20 target meetings with ESG investors
Co
mp
any overview
Strategy o
verviewM
arket overview
Business o
verview
Co
rpo
rate go
vernanceInform
ation for shareholders
Ap
pend
ixes

APPENDIXES
Consolidated financial statements
The Group structure
History of production indicators
Minerals resources and reserves
Report on compliance with principles and recommendations set forth in the Corporate Governance Code
Glossary
Metric conversion table and currency exchange rates
Сontacts
220
267
268
270
272
292
294
295

Annual report • 2017Appendixes Сonsolidated financial statements
220 221
Statement of management’s responsibilities for the preparation and approval of the consolidated financial statements for the year ended 31 December 2017The following statement, which should be read in conjunction with the auditors’ responsibilities stated in the auditors’ report set out on pages 222–224, is made with a view to distinguishing the respective responsibilities of management and those of the auditors in relation to the consolidated financial statements of Public Joint Stock Company “Mining and Metallurgical Company Norilsk Nickel” and its subsidiaries (the “Group”).
Management is responsible for the preparation of the consolidated financial statements that present fairly in all material aspects the consolidated financial position of the Group as at 31 December 2017 and consolidated statements of income, comprehensive income, cash flows and changes in equity for the year then ended, in accordance with International Financial Reporting Standards (“IFRS”).
In preparing the consolidated financial statements, management is responsible for:• selecting suitable accounting principles and applying them consistently;• making judgements and estimates that are reasonable and prudent;• stating whether IFRS have been followed, subject to any material departures disclosed and explained in the consolidated financial statements; and• preparing the consolidated financial statements on a going concern basis, unless it is inappropriate to presume that the Group will continue in business for
the foreseeable future.
Management, within its competencies, is also responsible for:• designing, implementing and maintaining an effective system of internal controls throughout the Group;• maintaining statutory accounting records in compliance with local legislation and accounting standards in the respective jurisdictions in which the Group
operates;• taking steps to safeguard the assets of the Group; and• detecting and preventing fraud and other irregularities.
The consolidated financial statements for the year ended 31 December 2017 were approved by:
Сonsolidated financial statements
PresidentV.O. Potanin
Senior Vice President – Chief Financial OfficerS.G. Malyshev
Moscow, Russia 6 March 2018
INDEX
Statement of management’s responsibilities for the preparation and approval of the consolidated financial statements for the year ended 31 December 2017
Independent Auditors’ report
Consolidated financial statements for the year ended 31 December 2017
Consolidated income statement Consolidated statement of comprehensive income Consolidated statement of financial position Consolidated statement of cash flows Consolidated statement of changes in equity Notes to the consolidated financial statements
221
222
225
225226227229231232
Co
mp
any overview
Strategy o
verviewM
arket overview
Business o
verview
Co
rpo
rate go
vernanceInfo
rmatio
n for shareho
lders
Ap
pend
ixes

Annual report • 2017Appendixes Сonsolidated financial statements
222 223
lndependent Auditors’ Report
То the Shareholders and Board of directors of PJSC “Mining and Metallurgical Company Norilsk Nickel”
Opinion
We have audited the consolidated financial statements of PJSC “Mining and Metallurgical Company Norilsk Nickel” (the “Company”) and its subsidiaries (the “Group”), which comprise the consolidated statement of financial position as at 31 December 2017, the consolidated income statement, the consolidated statements of comprehensive income, changes in equity and cash flows for the year then ended, and notes, comprising significant accounting policies and other explanatory information.
ln our opinion, the accompanying consolidated financial statements present fairly, in all material respects, the consolidated financial position of the Group as at 31 December 2017, and its consolidated financial performance and its consolidated cash flows for the year then ended in accordance with lnternational Financial Reporting Standards (IFRS).
Basis for Opinion
We conducted our audit in accordance with lnternational Standards on Auditing (ISAs). Our responsibilities under those standards are further described in the Auditors’ Responsibilities for the Audit of the Consolidated Financial Statements section of our report. We are independent of the Group in accordance with the independence requirements that are relevant to our audit of the consolidated financial statements in the Russian Federation and with the lnternational Ethics Standards Board for Accountants’ Code of Ethics for Professional Accountants (IESBA Code), and we have fulfilled our other ethical responsibilities in accordance with the requirements in the Russian Federation and the IESBA Code. We believe that the audit evidence we have obtained is sufficient and appropriate to provide а basis for our opinion.
Кеу Audit Matters
Key audit matters are those matters that, in our professional judgment, were of most significance in our audit of the consolidated financial statements of the current period. These matters were addressed in the context of our audit of the consolidated financial statements as a whole, and in forming our opinion thereon, and we do not provide a separate opinion on these matters.
Audited entity: PJSC “Mining and Metallurgical Company Norilsk Nickel”
Registration No. in the Unified State Register of Legal Entities 1028400000298
Dudinka, Krasnoyarsk Region, Russian Federation
Independent auditor: JSC “KPMG”, a company incorporated under the
Laws of the Russian Federation, a member firm of the KPMG network of
independent member firms affiliated with KPMG International Cooperative
(“KMPG International”), a Swiss entity.
Registration No. in the Unified State Register of Legal Entities
1027700125628.
Member of the Self-Regulated organization of auditors “Russian Union of
auditors” (Association). The Principal Registration Number of the Entry in
the Register of Auditors and Audit Organisations: No. 11603053203.
Nkomati Nickel Mine Measurement (losses from impairment of assets of Nkomati Nickel Mine)
Please refer to the Note 14 in the financial statements.
The Кеу Audit Matter How the matter was addressed in our audit
As at 31 December 2017 the Group has а 50% interest in the joint operation Nkomati Nickel Мinе (hereinafter “Nkomati”).As at 31 December 2017 the Group performed an impairment test of Nkomati property, plant and equipment and recognized an impairment loss for the excess of their carrying value over value in use.Given the value of property, plant and equipment and the significant judgment involved in preparation of discounted cash flows model of Nkomati, we consider the determination of recoverable amount to bе а key audit matter.
Our audit procedures included testing significant assumptions (metal prices and forecasts of exchange rate of South African rand to US dollar, as well as discount rate) and evaluating methodology used bу the Group. We involved KPMG valuation specialists to assist us in evaluating the methodology used bу the Group and analysis of key assumptions in terms of their reasonableness and relevance, taking into consideration current macroeconomic conditions,historic performance results and future plans. We compared:• forecast metal prices, inflation rates in South Africa and the USA with publicly available market information;• discount rate calculation to our own assessment of key components of discount rate calculation.ln addition, we analyzed forecast cash flows, bу comparing production volumes to reserves estimates and historical operating performance of Nkomati.We also assessed appropriateness and completeness of the disclosures in the financial statements in relation to significant assumptions used in determination of recoverable amount.
Other lnformation
Management is responsible for the other information. The other information comprises the Financial Overview (MD&A), but does not include the consolidated financial statements and our auditors’ report thereon, which we obtained prior to the date of this auditors’ report, and the information included in other sections of Annual report for 2017, which is expected to bе made available to us after that date.
Our opinion оn the consolidated financial statements does not cover the other information and we do not аnd will not express аnу form of assurance conclusion thereon.
ln connection with our audit of the consolidated financial statements, our responsibility is to read the other information identified above and, in doing so, consider whether the other information is materially inconsistent with the consolidated financial statements or our knowledge obtained in the audit, or otherwise appears to bе materially misstated.
lf, based оn the work we have performed оn the other information that we have obtained prior to the date of this auditors’ report, we conclude that there is а material misstatement of this other information, we are required to report that fact. We have nothing to report in this regard.
Responsibllities of Management and Those Charged with Governance for the Consolidated
Management is responsible for the preparation and fair presentation of the consolidated financial statements in accordance with IFRS, and for such internal control as management determines is necessary to еnаblе the preparation of consolidated financial statements that аrе free from material misstatement, whether due to fraud or error.
ln preparing the consolidated financial statements, management is responsible for assessing the Group’s ability to continue as а going concern, disclosing, as applicable, matters related to going concern and using the going concern basis of accounting unless management either intends to liquidate the Group or to cease operations, оr has nо realistic alternative but to do so.
Those charged with governance are responsible for overseeing the Group’s financial reporting process.
Co
mp
any overview
Strategy o
verviewM
arket overview
Business o
verview
Co
rpo
rate go
vernanceInfo
rmatio
n for shareho
lders
Ap
pend
ixes

Annual report • 2017Appendixes Сonsolidated financial statements
224 225
Auditors’ Responsibilities for the Audit of the Consolidated Financial Statements
Our objectives are to obtain reasonable assurance about whether the consolidated financial statements as а whole are free from material misstatement, whether due to fraud or error, and to issue аn auditors’ report that includes our opinion. Reasonable assurance is а high level of assurance, but is not а guarantee that аn audit conducted in accordance with ISAs will always detect а material misstatement when it exists. Misstatements саn arise from fraud or error and are considered material if, individually or in the aggregate, they could reasonably bе expected to influence the economic decisions of users taken оn the basis of these consolidated financial statements.
As part of аn audit in accordance with ISAs, we exercise professional judgment and maintain professional scepticism throughout the audit. We also:• ldentify and assess the risks of material misstatement of the consolidated financial statements, whether due to fraud or error, design and perform audit
procedures responsive to those risks, and оbtain audit evidence that is sufficient and appropriate to provide а basis for our opinion. The risk of not detecting а material misstatement resulting from fraud is higher than for оnе resulting from error, as fraud may involve collusion, forgery, intentional omissions, misrepresentations, or the override of internal control.
• Obtain an understanding of internal control relevant to the audit in order to design audit procedures that are appropriate in the circumstances, but not for the purpose of expressing an opinion оn the effectiveness of the Group’s internal control.
• Evaluate the appropriateness of accounting policies used and the reasonableness of accounting estimates and related disclosures made bу management.• Conclude оn the appropriateness of management’s use of the going concern basis of accounting and, based оn the audit evidence obtained, whether
а material uncertainty exists related to events or conditions that mау cast significant doubt оn the Group’s ability to continue as а going concern. lf we conclude that а material uncertainty exists, we are required to draw attention in our auditors’ report to the related disclosures in the consolidated financial statements or, if such disclosures are inadequate, to modify our opinion. Our conclusions are based оn the audit evidence obtained up to the date of our auditors’ report. However, future events or conditions may cause the Group to cease to continue as а going concern.
• Evaluate the overall presentation, structure and content of the consolidated financial statements, including the disclosures, and whether the consolidated financial statements represent the underlying transactions and events in а manner that achieves fair presentation.
• Оbtain sufficient appropriate audit evidence regarding the financial information of the entities or business activities within the Group to express аn opinion оn the consolidated financial statements. We are responsible for the direction, supervision and performance of the group audit. We remain solely responsible for our audit opinion.
We communicate with those charged with governance regarding, among other matters, the planned scope and timing of the audit and significant audit findings, including any significant deficiencies in internal control that we identify during our audit.
We also provide those charged with governance with а statement that we have complied with relevant ethical requirements regarding independence, and communicate with them all relationships and other matters that may reasonably bе thought to bear оn our independence, and where applicable, related safeguards.
From the matters communicated with those charged with governance, we determine those matters that were of most significance in the audit of the consolidated financial statements of the current period and are therefore the key audit matters. We describe these matters in our auditors’ report unless law or regulation precludes public disclosure about the matter or when, in extremely rare circumstances, we determine that а matter should not bе communicated in our report because the adverse consequences of doing so would reasonably bе expected to outweigh the public interest benefits of such communication.
The engagement partner оn the audit resulting in this independent auditors’ report is:
Andrey KimJSC “KPMG”Moscow, Russia6 March, 2018
Consolidated income statement for the year ended 31 December 2017
Consolidated income statement for the year ended 31 December 2017US Dollars million
Notes
For the year ended 31 December 2017 For the year ended 31 December 2016
Revenue
Metal sales 6 8,415 7,646
Other sales 731 613
Total revenue 9,146 8,259
Cost of metal sales 7 (3,968) (3,633)
Cost of other sales (632) (508)
Gross profit 4,546 4,118
General and administrative expenses 8 (759) (581)
Selling and distribution expenses 9 (75) (111)
Impairment of non-financial assets 14 (227) (61)
Other net operating expenses 10 (362) (84)
Operating profit 3,123 3,281
Foreign exchange gain, net 159 491
Finance costs 11 (535) (453)
Impairment of available-for-sale investments 15 – (153)
Gain/(loss) from disposal of subsidiaries and assets classified as held for sale 20 20 (4)
Income from investments, net 12 77 114
Profit before tax 2,844 3,276
Income tax expense 13 (721) (745)
Profit for the year 2,123 2,531
Attributable to:
Shareholders of the parent company 2,129 2,536
Non-controlling interests (6) (5)
2,123 2,531
EARNINGS PER SHARE
Basic and diluted earnings per share attributable to shareholders of the parent company (US Dollars per share) 21 13.5 16.1
The accompanying notes on pages 232–266 form an integral part of the consolidated financial statements
Co
mp
any overview
Strategy o
verviewM
arket overview
Business o
verview
Co
rpo
rate go
vernanceInfo
rmatio
n for shareho
lders
Ap
pend
ixes
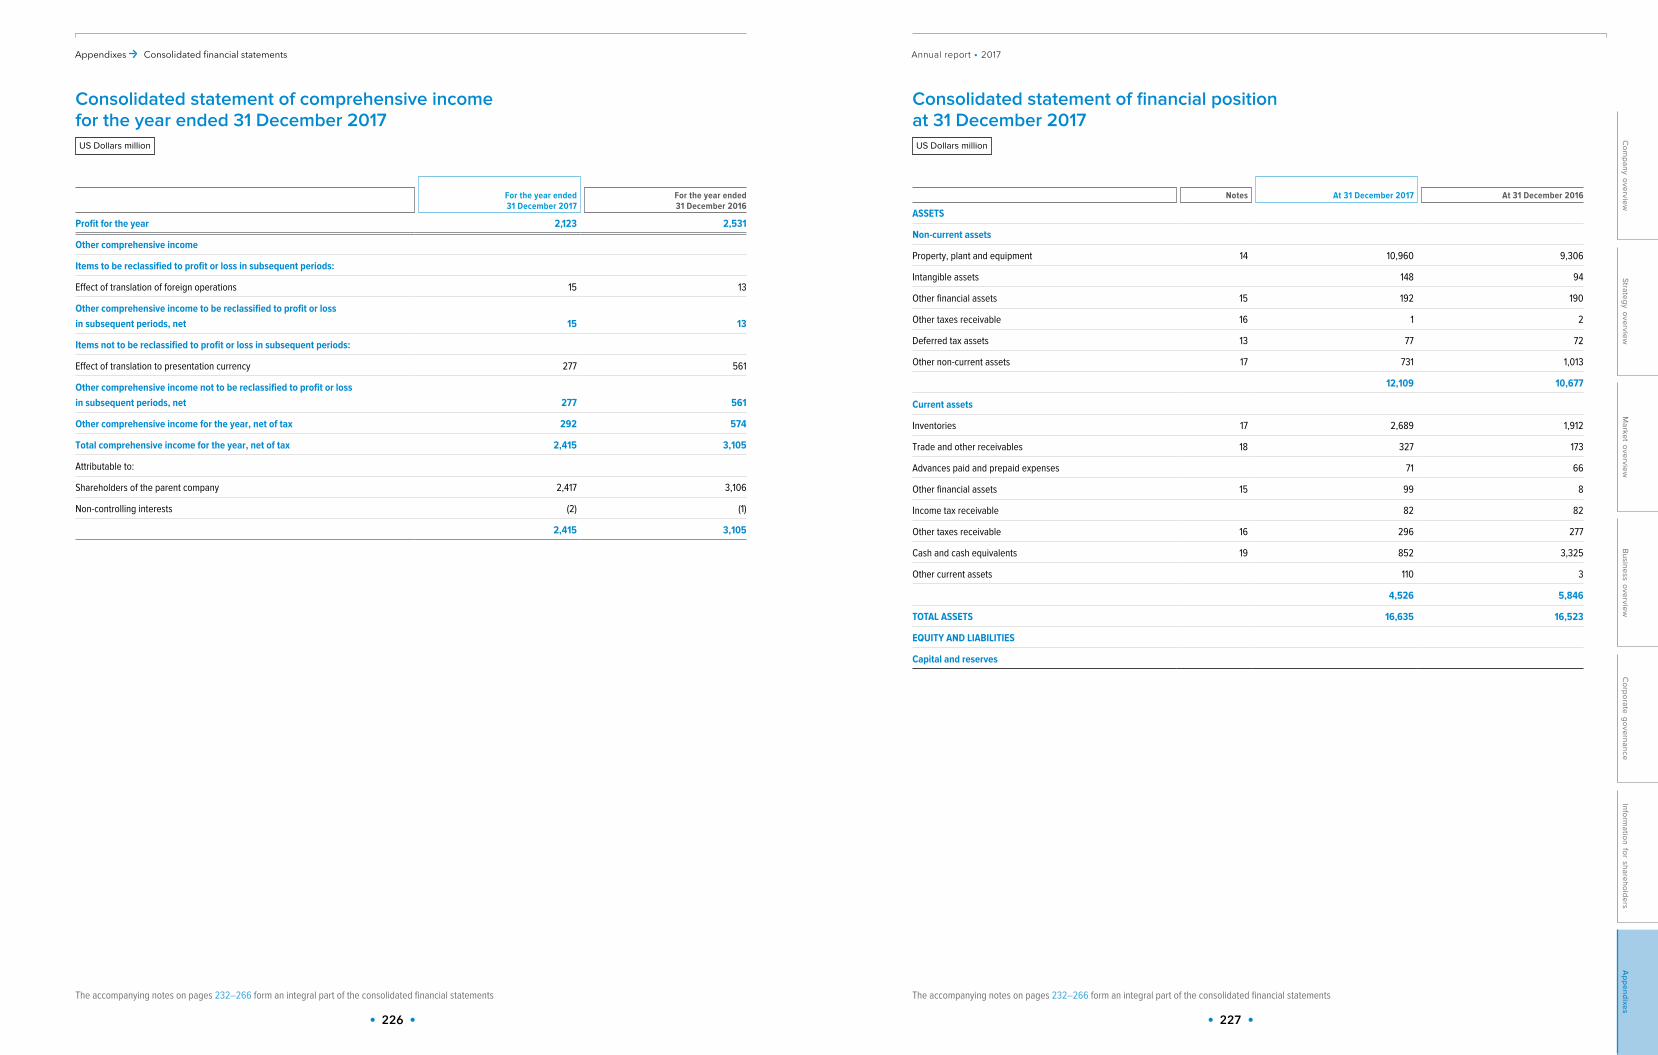
Annual report • 2017Appendixes Сonsolidated financial statements
226 227
Consolidated statement of comprehensive income for the year ended 31 December 2017US Dollars million
For the year ended 31 December 2017
For the year ended 31 December 2016
Profit for the year 2,123 2,531
Other comprehensive income
Items to be reclassified to profit or loss in subsequent periods:
Effect of translation of foreign operations 15 13
Other comprehensive income to be reclassified to profit or loss in subsequent periods, net 15 13
Items not to be reclassified to profit or loss in subsequent periods:
Effect of translation to presentation currency 277 561
Other comprehensive income not to be reclassified to profit or loss in subsequent periods, net 277 561
Other comprehensive income for the year, net of tax 292 574
Total comprehensive income for the year, net of tax 2,415 3,105
Attributable to:
Shareholders of the parent company 2,417 3,106
Non-controlling interests (2) (1)
2,415 3,105
The accompanying notes on pages 232–266 form an integral part of the consolidated financial statements
Consolidated statement of financial position at 31 December 2017US Dollars million
Notes
At 31 December 2017 At 31 December 2016
ASSETS
Non-current assets
Property, plant and equipment 14 10,960 9,306
Intangible assets 148 94
Other financial assets 15 192 190
Other taxes receivable 16 1 2
Deferred tax assets 13 77 72
Other non-current assets 17 731 1,013
12,109 10,677
Current assets
Inventories 17 2,689 1,912
Trade and other receivables 18 327 173
Advances paid and prepaid expenses 71 66
Other financial assets 15 99 8
Income tax receivable 82 82
Other taxes receivable 16 296 277
Cash and cash equivalents 19 852 3,325
Other current assets 110 3
4,526 5,846
TOTAL ASSETS 16,635 16,523
EQUITY AND LIABILITIES
Capital and reserves
The accompanying notes on pages 232–266 form an integral part of the consolidated financial statements
Co
mp
any overview
Strategy o
verviewM
arket overview
Business o
verview
Co
rpo
rate go
vernanceInfo
rmatio
n for shareho
lders
Ap
pend
ixes

Annual report • 2017Appendixes Сonsolidated financial statements
228 229
Notes
At 31 December 2017 At 31 December 2016
Share capital 21 6 6
Share premium 1,254 1,254
Translation reserve (4,490) (4,778)
Retained earnings 27 7,557 7,340
Equity attributable to shareholders of the parent company 4,327 3,822
Non-controlling interests 22 331 74
4,658 3,896
Non-current liabilities
Loans and borrowings 23 8,236 7,276
Provisions 25 464 441
Trade and other long-term payables 402 523
Deferred tax liabilities 13 407 355
Other long-term liabilities 116 50
9,625 8,645
Current liabilities
Loans and borrowings 23 817 579
Trade and other payables 26 783 1,613
Dividends payable 27 6 1,164
Employee benefit obligations 24 377 301
Provisions 25 189 183
Derivative financial instruments 24 1
Income tax payable 9 2
Other taxes payable 16 147 139
2,352 3,982
TOTAL LIABILITIES 11,977 12,627
TOTAL EQUITY AND LIABILITIES 16,635 16,523
The accompanying notes on pages 232–266 form an integral part of the consolidated financial statements
Consolidated statement of cash flows for the year ended 31 December 2017US Dollars million
For the year ended 31 December 2017 For the year ended 31 December 2016
OPERATING ACTIVITIES
Profit before tax 2,844 3,276
Adjustments for:
Depreciation and amortisation 645 557
Impairment of non-financial assets 227 61
Impairment of available for sale investments – 153
Loss on disposal of property, plant and equipment 9 16
(Gain)/loss from disposal of subsidiaries and assets classified as held for sale (20) 4
Change in provisions and allowances 41 13
Finance costs and income from investments, net 458 360
Foreign exchange gain, net (159) (491)
Other 58 9
4,103 3,958
Movements in working capital:
Inventories (346) (751)
Trade and other receivables (174) (3)
Advances paid and prepaid expenses 10 13
Other taxes receivable (5) (36)
Employee benefit obligations 9 44
Trade and other payables (1,118) 835
Provisions (48) (45)
Other taxes payable 2 26
Cash generated from operations 2,433 4,041
Income tax paid (670) (530)
Net cash generated from operating activities 1,763 3,511
INVESTING ACTIVITIES
The accompanying notes on pages 232–266 form an integral part of the consolidated financial statements
Co
mp
any overview
Strategy o
verviewM
arket overview
Business o
verview
Co
rpo
rate go
vernanceInfo
rmatio
n for shareho
lders
Ap
pend
ixes

Annual report • 2017Appendixes Сonsolidated financial statements
230 231
For the year ended 31 December 2017 For the year ended 31 December 2016
Purchase of property, plant and equipment (1,940) (1,667)
Purchase of other financial assets – (150)
Purchase of intangible assets (62) (47)
Purchase of other non-current assets (88) (31)
Loans issued (18) (103)
Proceeds from repayment of loans issued 48 –
Net change in deposits placed (80) (10)
Proceeds from sale of other financial assets 25 10
Proceeds from disposal of property, plant and equipment 29 1
Proceeds from disposal of subsidiaries and assets classified as held for sale 99 3
Interest received 51 74
Net cash used in investing activities (1,936) (1,920)
FINANCING ACTIVITIES
Proceeds from loans and borrowings 4,233 936
Repayments of loans and borrowings (3,140) (1,741)
Financial lease payments (10) (5)
Dividends paid (2,971) (1,232)
Dividends paid to non-controlling interest (1) –
Interest paid (642) (591)
Proceeds from sale of a non-controlling interest in a subsidiary 294 80
Sale of own shares from treasury stock – 154
Net cash used in financing activities (2,237) (2,399)
Net decrease in cash and cash equivalents (2,410) (808)
Cash and cash equivalents at the beginning of the year 3,325 4,098
Effects of foreign exchange differences on balances of cash and cash equivalents (63) 35
Cash and cash equivalents at the end of the year 852 3,325
The accompanying notes on pages 232–266 form an integral part of the consolidated financial statements
Consolidated statement of changes in equity for the year ended 31 December 2017US Dollars million
Notes
Equity attributable to shareholders of the parent company Non-
controlling interests
Total
Share capitalShare
premiumTreasury
sharesTranslation
reserveRetained earnings
Total
Balance at 1 January 2016 6 1,254 (196) (5,348) 6,523 2,239 22 2,261
Profit/(loss) for the year – – – – 2,536 2,536 (5) 2,531
Other comprehensive income – – – 570 – 570 4 574
Total comprehensive income/(loss) for the year – – – 570 2,536 3,106 (1) 3,105
Dividends 27 – – – – (1,708) (1,708) – (1,708)
Increase in non-controlling interest due to decrease in ownership of a subsidiary 22 – – – – 25 25 55 80
Sale of own shares from treasury stock – – 196 – (38) 158 – 158
Decrease in non-controlling interest due to increase in ownership of a subsidiary – – – – 2 2 (2) –
Balance at 31 December 2016 6 1,254 – (4,778) 7,340 3,822 74 3,896
Profit/(loss) for the year – – – – 2,129 2,129 (6) 2,123
Other comprehensive income – – – 288 – 288 4 292
Total comprehensive income/(loss) for the year – – – 288 2,129 2,417 (2) 2,415
Dividends 27 – – – – (1,846) (1,846) (1) (1,847)
Increase in non-controlling interest due to decrease in ownership of a subsidiary 22 – – – – 35 35 259 294
Other effects related to transactions with non-controlling interest owners – – – – (100) (100) – (100)
Decrease in non-controlling interest due to increase in ownership of a subsidiary – – – – (1) (1) 1 –
Balance at 31 December 2017 6 1,254 – (4,490) 7,557 4,327 331 4,658
The accompanying notes on pages 232–266 form an integral part of the consolidated financial statements
Co
mp
any overview
Strategy o
verviewM
arket overview
Business o
verview
Co
rpo
rate go
vernanceInfo
rmatio
n for shareho
lders
Ap
pend
ixes

Annual report • 2017Appendixes Сonsolidated financial statements
232 233
Notes to the consolidated financial statements for the year ended 31 December 2017US Dollars million
1. General information
Organisation and principal business activitiesPublic Joint-Stock Company “Mining and Metallurgical Company Norilsk Nickel” (the “Company” or “MMC Norilsk Nickel”) was incorporated in the Russian Federation on 4 July 1997. The principal activities of the Company and its subsidiaries (the “Group”) are exploration, extraction, refining of ore and nonmetallic minerals and sale of base and precious metals produced from ore. Further details regarding the nature of the business and structure of the Group are presented in note 33.
Major production facilities of the Group are located in Taimyr and Kola Peninsulas of the Russian Federation, and in Finland.
BASIS OF PREPARATION
Statement of complianceThe consolidated financial statements of the Group have been prepared in accordance with International Financial Reporting Standards (“IFRS”).
The entities of the Group maintain their accounting records in accordance with the laws, accounting and reporting regulations of the jurisdictions in which they are incorporated and registered. Accounting principles in certain jurisdictions may differ from those generally accepted under IFRS. Financial statements of such entities have been adjusted to ensure that the consolidated financial statements are presented in accordance with IFRS.
The Group issues a separate set of IFRS consolidated financial statements to comply with the requirements of Russian Federal Law No. 208 On consolidated financial statements (“208-FZ”) dated 27 July 2010.
Basis of measurementThe consolidated financial statements of the Group are prepared on the historical cost basis, except for:• mark-to-market valuation of by-products, in accordance with IAS 2 Inventories;• mark-to-market valuation of certain classes of financial instruments, in accordance with IAS 39 Financial Instruments: Recognition and Measurement.
2. Changes in accounting policies
ReclassificationInformation for the year ended 31 December 2016 was recasted in accordance with requirement of IFRS 5 Non-current Assets Held for Sale and Discontinued Operations since the criteria for classification of Nkomati as assets held for sale were no longer met as at 31 December 2017 (refer to note 20).
At 31 December 2017 management reassessed classification of some expenses of cost of metal sales and selling and distribution expenses in order to better align cost of sales structure with management accounts and reporting (refer to notes 7 and 9). Information for the year ended 31 December 2016 has been reclassified to conform with the current period presentation.
Standards and interpretations effective in the current yearIn the preparation of these consolidated financial statements the Group has adopted all new and revised International Financial Reporting Standards and Interpretations issued by International Financial Reporting Interpretations Committee (“IFRIC”) that are mandatory for adoption in annual periods beginning on 1 January 2017.
Adoption of amendments to the existing Standards detailed below did not have significant impact on the accounting policies, financial position or performance of the Group:• IFRS 12 Disclosure of Interests in Other Entities (amended);• IAS 7 Statement of Cash Flows (amended);• IAS 12 Income Taxes (amended).
Standards and interpretations in issue but not yet effectiveAt the date of authorisation of these consolidated financial statements, the following Standards and Interpretations or amendments to them were in issue but not yet effective and not early adopted:
Standards and Interpretations Effective for annual periods beginning on or after
IFRS 1 First-time Adoption of International Financial Reporting Standards (amended) 1 January 2018
IFRS 2 Share-based Payment (amended) 1 January 2018
IFRS 4 Insurance Contracts (amended) 1 January 2018
IFRS 9 Financial Instruments (amended) 1 January 2018
IFRS 15 Revenue from Contracts with Customers 1 January 2018
IAS 28 Investments in Associates and Joint Ventures (amended) 1 January 2018
IAS 40 Investment Property (amended) 1 January 2018
IFRIC 22 Foreign Currency Transactions and Advance Consideration 1 January 2018
IFRS 16 Leases 1 January 2019
IFRIC 23 Uncertainty over Income Tax Treatments 1 January 2019
IFRS 17 Insurance Contracts 1 January 2021
Management of the Group plans to adopt all of the above standards and interpretations in the Group’s consolidated financial statements for the respective periods.
IFRS 9 Financial Instruments (effective for annual periods beginning on or after 1 January 2018, early adoption is permitted) replaces IAS 39 Financial Instruments: Recognition and Measurement and introduces new classification and measurement, ‘expected losses’ impairment model for financial assets and new rules for hedge accounting. The standard will not materially affect the consolidated financial statements of the Group.
IFRS 15 Revenue from Contracts with Customers (effective for annual periods beginning on or after 1 January 2018, early adoption is permitted) establishes a comprehensive framework for accounting of revenue from customers. It replaces existing revenue recognition guidance, including IAS 18 Revenue, IAS 11 Construction Contracts and certain interpretations. The standard introduces 5-step model for revenue from contracts with customers. According to IFRS 15, revenue is measured in the amount of consideration to which an entity expects to be entitled in exchange for transferring promised goods or services to a customer. Based on the performed assessment, the new standard is not expected to affect significantly the Group’s consolidated financial statements.
3. Significant accounting policies
Basis of consolidationSubsidiariesThe consolidated financial statements incorporate financial statements of the Company and its subsidiaries, from the date that control effectively commenced until the date that control effectively ceased. Control is achieved where the Company is exposed to, or has rights to, variable returns from its involvement with the entity and has the ability to affect those returns through its power over the entity.
Non-controlling interests in the net assets (excluding goodwill) of consolidated subsidiaries are identified separately from the Group’s equity therein. Non-controlling interests include interests at the date of the original business combination and non-controlling share of changes in net assets since the date of the combination. Total comprehensive income must be attributed to the interest of the Group and to the non-controlling interests even if this results in the non-controlling interests having a deficit balance.
Non-controlling interests may be initially measured either at fair value or at the non-controlling interests’ proportionate share of the recognised amounts of the acquiree’s identifiable net assets. The choice of measurement basis is made on a transaction-by-transaction basis.
All intra-group balances, transactions and any unrealised profits or losses arising from intragroup transactions are eliminated in full on consolidation.
Changes in the Group’s ownership interest in a subsidiary that do not result in the Group losing control are accounted for within the equity.
When the Group loses control of a subsidiary it derecognises the assets and liabilities and related equity components of the former subsidiary. Any gain or loss is recognised in the consolidated income statement. Any investment retained in the former subsidiary is measured at its fair value at the date when control is lost.
Co
mp
any overview
Strategy o
verviewM
arket overview
Business o
verview
Co
rpo
rate go
vernanceInfo
rmatio
n for shareho
lders
Ap
pend
ixes

Annual report • 2017Appendixes Сonsolidated financial statements
234 235
Joint arrangementsInvestments in joint arrangements are classified as either joint operations or joint ventures. The classification depends on the contractual rights and obligations of each investor. The Group applies the following accounting to joint operations and joint ventures. The Group recognises in relation to its interest in a joint operation: its assets, including its share of any assets held jointly; its liabilities, including its share of any liabilities incurred jointly; its revenue from the sale of its share of the output arising from the joint operation; its share of the revenue from the sale of the output by the joint operation; and its expenses, including its share of any expenses incurred jointly. The Group accounts for joint ventures using the equity method.
Business combinationsAcquisitions of businesses are accounted for using the acquisition method. The consideration transferred in a business combination is measured at fair value, which is calculated as the sum of fair values of the assets transferred by the Group, liabilities incurred by the Group to the former owners of the acquiree and the equity interests issued by the Group at the date of acquisition in exchange for control of the acquiree.
Where an investment in a subsidiary or an associate is made, any excess of the sum of the consideration transferred, the amount of any non-controlling interests in the acquiree, and the fair value of the acquirer’s previously held equity interest in the acquiree (if any) over the fair value of the identifiable assets acquired and the liabilities assumed at the acquisition date is recognised as goodwill. Goodwill in respect of subsidiaries is disclosed separately and goodwill relating to associates is included in the carrying value of the investment in associates. Goodwill is reviewed for impairment at least annually. If impairment has occurred, it is recognised in the consolidated income statement during the period in which the circumstances are identified and is not subsequently reversed.
If, after reassessment, the net amounts of the identifiable assets acquired and liabilities assumed at the acquisition date exceeds the sum of the consideration transferred, the amount of any non-controlling interests in the acquiree and the fair value of the acquirer’s previously held interest in the acquiree (if any), the excess is recognised in the consolidated income statement immediately as a bargain purchase gain.
Acquisition-related costs are recognised in the consolidated income statement as incurred.
If the initial accounting for a business combination is incomplete by the end of the reporting period in which the combination occurs, the Group reports provisional amounts for the items for which the accounting is incomplete. Those provisional amounts are retrospectively adjusted during the measurement period (a maximum of twelve months from the date of acquisition), or additional assets or liabilities are recognised, to reflect new information obtained about facts and circumstances that existed at the acquisition date that, if known, would have affected the amounts recognised at that date.
Assets classified as held for saleNon-current assets and disposal groups are classified as held for sale if their carrying amount will be recovered primarily through a sale transaction rather than through continuing use. This condition is ordinarily regarded as met when sale is highly probable within one year from the date of classification and the asset or disposal group is available for immediate sale in its present condition and management has committed to the sale.
Non-current assets and disposal groups classified as held for sale are measured at the lower of their previous carrying amount and fair value less costs to sell.
Assets held for sale and related liabilities are presented in the consolidated statement of financial position separately from other assets and liabilities. Comparative information related to assets held for sale is not amended in the consolidated statement of financial position for the prior period.
If criteria of classification as held for sale are no longer met, the Group ceases to classify non-current assets and disposal groups as held for sale. Such non-current assets and disposal groups is measured at the lower of its carrying amount before the classification as held for sale, adjusted for any depreciation, amortisation or revaluations that would have been recognised had the non-current assets and disposal groups not been classified as held for sale, and its recoverable amount at the date of the subsequent decision not to sell. Financial statements for the periods since classification as held for sale shall be amended accordingly if the disposal group or non-current asset that ceases to be classified as held for sale is a subsidiary, joint operation, joint venture, associate, or a portion of an interest in a joint venture or an associate.
Functional and presentation currencyThe individual financial statements of each Group entity are presented in its functional currency.
The Russian Rouble (“RUB”) is the functional currency of the Company, all of its subsidiaries located in the Russian Federation and all foreign subsidiaries of the Group, except for the following subsidiaries operating with a significant degree of autonomy. The functional currency of Norilsk Nickel Harjavalta Oy is US Dollar, and the functional currency of Norilsk Nickel Africa Proprietary Limited is South African Rand.
The presentation currency of the consolidated financial statements of the Group is US Dollar (“USD”). Using USD as a presentation currency is common practice for global mining companies. In addition, USD is a more relevant presentation currency for international users of the consolidated financial statements of the Group. The Group also issues consolidated financial statements to comply with 208-FZ, which use the Russian Rouble as the presentation currency (refer to note 1).
The translation of components of the consolidated statement of financial position, consolidated income statement, consolidated statement of cash flows into presentation currency is made as follows:• all assets and liabilities, both monetary and non-monetary, in the consolidated statement of financial position are translated at the closing exchange rates at
the end of the respective reporting period;• income and expense are translated at the average exchange rates for each quarter (unless this average rate is not a reasonable approximation of the
cumulative effect of the rates prevailing on the transaction dates, in these cases income and expenses are translated at the dates of the transaction);• all equity items are translated at the historical exchange rates;• all resulting exchange differences are recognised as a separate component in other comprehensive income; and• in the consolidated statement of cash flows, cash balances at beginning and end of each period presented are translated at exchange rates at the respective
dates;• all cash flows are translated at the average exchange rates for each quarter with the exception of borrowings, dividends and advances received, gains and
losses from disposal of subsidiaries, which are translated using the prevailing exchange rates at the dates of the transactions; • resulting exchange differences are presented in the consolidated statement of cash flows as effects of foreign exchange differences on balances of cash and
cash equivalents.
Foreign currency transactionsTransactions in currencies other than the entity’s functional currency (foreign currencies) are recorded at the exchange rates prevailing at the date of transactions. All monetary assets and liabilities denominated in foreign currencies are translated at the exchange rates prevailing at each reporting date. Non-monetary items carried at historical cost are translated at the exchange rates prevailing at the date of transactions. Non-monetary items carried at fair value are translated at the exchange rate prevailing at the date on which the most recent fair value was determined. Exchange differences arising from changes in exchange rates are recognised in the consolidated income statement.
Exchange rates used in the preparation of the consolidated financial statements were as follows:
At 31 December 2017 At 31 December 2016
Russian Rouble/US Dollar
31 December 57.60 60.66
Average for the year ended 31 December 58.35 67.03
South African Rand/US Dollar
31 December 12.36 13.78
Average for the year ended 31 December 13.30 14.68
Australian Dollar/US Dollar
31 December 1.28 1.39
Average for the period ended 1.30 1.34
Hong Kong Dollar/US Dollar
31 December 7.81 7.75
Average for the year ended 31 December 7.79 7.76
Revenue recognitionMetal sales revenueRevenue from metal sales is recognised when the significant risks and rewards of ownership are transferred to the buyer and represents invoiced value of all metal products shipped to customers, net of value added tax.
Revenue from contracts that are entered into and continue to meet the Group’s expected sale requirements designated for that purpose at their inception, and are expected to be settled by physical delivery, are recognised in the consolidated financial statements as and when they are delivered.
Certain contracts are provisionally priced so that price is not settled until a predetermined future date based on the market price at that time. Revenue from these transactions is initially recognised at the current market price. Provisionally priced metal sales are marked-to-market at each reporting date using the forward price for the period equivalent to that outlined in the contract. This mark-to-market adjustment is recorded in revenue.
Co
mp
any overview
Strategy o
verviewM
arket overview
Business o
verview
Co
rpo
rate go
vernanceInfo
rmatio
n for shareho
lders
Ap
pend
ixes

Annual report • 2017Appendixes Сonsolidated financial statements
236 237
Other revenueRevenue from sale of goods, other than metals, is recognised when significant risks and rewards of ownership are transferred to the buyer in accordance with the shipping terms specified in the sales agreements.
Revenue from service contracts is recognised when the services are rendered and the outcome can be reliably measured.
Dividends and interest incomeDividends from investments are recognised when the Group’s right to receive payment has been established. Interest income is accrued based on effective interest method.
LeasesLeases under which the Group assumes substantially all the risks and rewards of ownership are classified as finance leases. Assets subject to finance leases are capitalised as property, plant and equipment at the lower of fair value or present value of future minimum lease payments at the date of acquisition. Simultaneously, related lease obligation is recognised at the same value. Assets held under finance leases are depreciated over their estimated economic useful lives or over the term of the lease, if shorter. If there is reasonable certainty that the lessee will obtain ownership at the end of the lease term, the period of expected use is the useful life of the asset.
Finance lease payments are allocated using the effective interest rate method, between the lease finance cost, which is included in finance costs, and the capital repayment, which reduces the related lease obligation to the lessor.
Leases where the lessor retains substantially all the risks and benefits of ownership of the asset are classified as operating leases. Operating lease payments are recognised as an expense in the consolidated income statement on a straight-line basis over the lease term, except where another systematic basis is more representative of the time pattern in which economic benefits from the leased asset are consumed. Contingent rentals arising under operating and finance leases are expensed in the period in which they are incurred.
Finance costsFinance costs mostly comprise interest expense on borrowings and unwinding of discount on decommissioning obligations.
Finance costs directly attributable to the acquisition, construction or production of qualifying assets, which are assets that necessarily take a substantial period of time to get ready for their intended use or sale, are added to the cost of those assets, until such time when the assets are substantially ready for their intended use or sale.
Investment income earned on the temporary investment of specific borrowings pending their expenditure on qualifying assets is deducted from the borrowing costs eligible for capitalisation.
Government grantsGovernment grants are recognised when there is reasonable assurance that the grant will be received and all conditions and requirements attaching to the grant will be met. Government grants related to assets are deducted from the cost of these assets in arriving at their carrying value.
Employee benefitsRemuneration to employees in respect of services rendered during a reporting period is recognised as an expense in that period. Long term employee benefits obligations are discounted to net present value.
Defined contribution plansThe Group contributes to the following major defined contribution plans:• Pension Fund of the Russian Federation;• Mutual accumulated pension plan.
The only obligation of the Group with respect to these and other defined contribution plans is to make specified contributions in the period in which they arise. These contributions are recognised in the consolidated income statement when employees have rendered services entitling them to the contribution.
Income tax expenseIncome tax expense represents the sum of the tax currently payable and deferred tax.
Income tax is recognised as an expense or income in the consolidated income statement, except when it relates to other items recognised directly in other comprehensive income, in which case the tax is also recognised directly in other comprehensive income. Where current or deferred tax arises from the initial accounting for a business combination, the tax effect is included in the accounting for the business combination.
Current taxCurrent tax is based on taxable profit for the year. Taxable profit differs from profit for the year as reported in the consolidated income statement because it excludes items of income or expense that are taxable or deductible in other years and it further excludes items that are never taxable or deductible.
Deferred taxDeferred tax is recognised on temporary differences between the carrying amounts of assets and liabilities in the financial statements and the corresponding tax bases used in computation of taxable profit. Deferred tax liabilities are recognised for all taxable temporary differences, and deferred tax assets are recognised for all deductible temporary differences to the extent that it is probable that taxable profits will be available against which those deductible temporary differences can be utilised. Such assets and liabilities are not recognised if a temporary difference arises from goodwill or from the initial recognition (other than in a business combination) of other assets and liabilities in a transaction that affects neither taxable profit nor accounting profit.
Deferred tax liabilities are recognised for taxable temporary differences associated with investments in subsidiaries, joint ventures and associates, except where the Group is able to control the reversal of the temporary difference and it is probable that the temporary difference will not reverse in the foreseeable future. Deferred tax assets arising from deductible temporary differences associated with such investments and interests are only recognised to the extent that it is probable that there will be sufficient taxable profits against which to utilise the benefits of the temporary differences and they are expected to reverse in the foreseeable future.
The carrying amount of deferred tax assets is reviewed at each statement of financial position date and adjusted to the extent that it is probable that sufficient taxable profits will be available to allow all or part of the asset to be recovered.
The measurement of deferred tax liabilities and assets reflects the tax consequences of the manner in which the Group expects at the reporting date to recover or settle the carrying amount of its assets and liabilities. Deferred tax assets and liabilities are offset when there is a legally enforceable right to set off current tax assets against current tax liabilities and when they relate to income taxes levied by the same taxation authority. The Group offsets deferred tax assets and liabilities for the subsidiaries which entered into the tax consolidation group.
Property, plant and equipment and mine development costsMining assetsMine development costs are capitalised and comprise expenditures directly related to:• acquiring mining and exploration licences;• developing new mining operations;• estimating revised content of minerals in the existing ore bodies; and• expanding capacity of a mine.
Mine development costs include interest capitalised during the construction period, when financed by borrowings.
Mine development costs are transferred to mining assets and start to be depreciated when a new mine reaches commercial production quantities.
Mining assets are recorded at cost less accumulated amortisation and impairment losses. Mining assets include cost of acquiring and developing mining properties, pre-production expenditure, mine infrastructure, plant and equipment that process extracted ore, mining and exploration licenses and present value of future decommissioning costs.
Depreciation of mining assets is charged from the date on which a new mine reaches commercial production quantities and is included in the cost of production. Carrying value of mining assets is depreciated on a straight-line basis over the lesser of their remaining economic useful lives or remaining life of mine that they relate to, calculated on the basis of the amount of commercial ore reserves. When determining the life of mine, assumptions valid at the time of estimation may change in case new information becomes available. Useful lives are in average varying from 2 to 45 years.
Non-mining assetsNon-mining assets include metallurgical processing plants, buildings, infrastructure, machinery and equipment and other non-mining assets. Non-mining assets are stated at cost less accumulated depreciation and impairment losses.
Non-mining assets are depreciated on a straight-line basis over their economic useful lives.
Depreciation is calculated over the following economic useful lives:• buildings, structures and utilities 5–50 years• machinery, equipment and transport 3–30 years• other non-mining assets 2–20 years
Co
mp
any overview
Strategy o
verviewM
arket overview
Business o
verview
Co
rpo
rate go
vernanceInfo
rmatio
n for shareho
lders
Ap
pend
ixes

Annual report • 2017Appendixes Сonsolidated financial statements
238 239
Capital construction-in-progressCapital construction-in-progress comprises costs directly related to construction of buildings, processing plant, infrastructure, machinery and equipment, including:• advances given for purchases of property, plant and equipment and materials acquired for construction of buildings, processing plant, infrastructure,
machinery and equipment;• irrevocable letters of credit opened for future fixed assets deliveries and secured with deposits placed in banks;• finance charges capitalised during construction period where such costs are financed by borrowings.
Depreciation of these assets commences when the assets are put into production.
Research and exploration expenditureResearch and exploration expenditure, including geophysical, topographical, geological and similar types of expenditure, is capitalised, if it is deemed that such expenditure will lead to an economically viable capital project, and begins to be amortised over the life of mine, when commercial viability of the project is proved. Otherwise it is expensed in the period in which it is incurred.
Research and exploration expenditure written-off before development and construction starts is not subsequently capitalised, even if a commercial discovery subsequently occurs.
Intangible assets, excluding goodwillIntangible assets are recorded at cost less accumulated amortisation and impairment losses. Intangible assets mainly include patents, licences, software and rights to use software and other intangible assets.
Amortisation of patents, licenses and software is charged on a straight-line basis over 1–10 years.
Impairment of tangible and intangible assets, excluding goodwillAt each reporting date, the Group analyses the triggers of impairment of its tangible and intangible assets to determine whether there is any indication that those assets have suffered an impairment loss. If any such indication exists, the recoverable amount of the asset is estimated in order to determine the extent of the impairment loss (if any). Where it is not practical to estimate the recoverable amount of an individual asset, the Group estimates the recoverable amount of the cash-generating unit to which the asset belongs.
Recoverable amount is the higher of fair value less cost to sell and value-in-use. In assessing value-in-use, the estimated future cash flows are discounted to their present value using a pre-tax discount rate that reflects current market assessments of the time value of money and the risks specific to the asset or cash-generating unit. If the recoverable amount of an asset (or cash-generating unit) is estimated to be less than its carrying amount, the carrying amount of the asset (or cash-generating unit) is reduced to its recoverable amount. An impairment loss is recognised in the consolidated income statement immediately.
Where an impairment loss subsequently reversed, the carrying amount of the asset (or cash-generating unit) is increased to the revised estimate of its recoverable amount, but only to the extent that the increased carrying amount does not exceed the original carrying amount that would have been determined had no impairment loss been recognised in prior periods. A reversal of an impairment loss is recognised in the consolidated income statement.
InventoriesRefined metalsMain produced metals include nickel, copper, palladium, platinum; by-products include gold, rhodium, silver and other minor metals. Main products are measured at the lower of net cost of production or net realisable value. The net cost of production of main products is determined as total production cost, allocated to each joint product by reference to their relative sales value. By-products are measured at net realisable value, through a mark-to-market valuation.
Work-in-processWork-in-process includes all costs incurred in the normal course of business including direct material and direct labour costs and allocation of production overheads, depreciation and amortisation and other costs, incurred for producing each product, given its stage of completion.
Materials and suppliesMaterials and supplies are valued at the weighted average cost less provision for obsolete and slow-moving items.
Financial assetsFinancial assets are recognised when the Group has become a party to the contractual arrangement of the instrument and are initially measured at fair value, plus transaction costs, except for those financial assets classified as at fair value through profit or loss, which are initially measured at fair value.
Financial assets are classified into the following specified categories:• financial assets at fair value through profit or loss• held-to-maturity investments;• available-for-sale financial assets;and• loans and receivables.
The classification depends on the nature and purpose of the financial assets and is determined at the time of initial recognition.
Effective interest methodThe effective interest method is a method of calculating the amortised cost of a financial asset and of allocating interest income over the relevant period. The effective interest rate is the rate that exactly discounts estimated future cash receipts (including transaction costs and other premiums or discounts) through the expected life of the financial asset, or, where appropriate, a shorter period.
Income is recognised on an effective interest basis for debt securities other than those financial assets designated as at fair value through profit or loss.
Financial assets at fair value through profit or lossFinancial assets are classified as at fair value through profit or loss where the financial asset is either held for trading or it is designated as at fair value through profit or loss.
A financial asset is classified as held for trading if:• it has been acquired principally for the purpose of selling in the near future; or• it is a part of an identified portfolio of financial instruments that the Group manages together and has a recent actual pattern of short-term profit-taking; or• it is a derivative.
Financial assets at fair value through profit or loss are stated at fair value, with any resultant gain or loss recognised in the consolidated income statement. The net gain or loss recognised in the consolidated income statement incorporates any dividend or interest earned on the financial asset.
Loans and receivablesTrade receivables, loans, and other receivables that have fixed or determinable payments which are not quoted in an active market are classified as loans and receivables. Loans and receivables are measured at amortised cost using the effective interest method, less any impairment. Interest income is recognised by applying the effective interest rate, except for short-term receivables when the recognition of interest would be immaterial.
Available-for-sale financial assetsAvailable-for-sale financial assets may include investments in listed and unlisted equity securities, that are not classified in other categories.
Listed equity securities held by the Group that are traded in an active market are measured at their market value. Gains and losses arising from changes in fair value are recognised in other comprehensive income in the investments revaluation reserve with the exception of impairment losses, interest calculated using the effective interest method and foreign exchange gains and losses on monetary assets, which are recognised directly in the consolidated income statement. Where an investment is disposed of or is determined to be impaired, the cumulative gain or loss previously recognised in the investment revaluation reserve is included in the consolidated income statement for the period.
Investments in unlisted equity securities that do not have a quoted market price in an active market are recorded at management’s estimate of fair value.
Impairment of financial assetsFinancial assets, other than those at fair value through profit or loss, are assessed for indicators of impairment at each statement of financial position date. Financial assets are impaired where there is objective evidence that, as a result of one or more events that occurred after the initial recognition of the financial asset, the estimated future cash flows of the investment have been negatively impacted.
The Group has fully provided for all trade and other receivables which were due in excess of 365 days. Trade and other receivables that are past due for less than 365 days are provided according to expected probability of repayment and the length of the overdue period.
Objective evidence of impairment for accounts receivable could include the Group’s past experience of collecting payments, an increase in the number of delayed payments as well as observable changes in economic conditions that correlate with defaults on receivables.
For financial assets carried at amortised cost, the amount of the impairment is the difference between the asset’s carrying amount and the present value of estimated future cash flows, discounted at the financial asset’s original effective interest rate.
Co
mp
any overview
Strategy o
verviewM
arket overview
Business o
verview
Co
rpo
rate go
vernanceInfo
rmatio
n for shareho
lders
Ap
pend
ixes

Annual report • 2017Appendixes Сonsolidated financial statements
240 241
The carrying amount of the financial asset is reduced by the impairment loss directly for all financial assets with the exception of trade and other receivables, where the carrying amount is reduced through the use of an provision for doubtful debts. When trade and other receivables are considered uncollectible, it is written off against the provision. Subsequent recoveries of amounts previously written off are credited against the provision. Changes in the provision are recognised in the consolidated income statement.
With the exception of available-for-sale debt and equity instruments, if, in a subsequent period, the amount of the impairment loss decreases and the decrease can be related objectively to an event occurring after the impairment was recognised, the previously recognised impairment loss is reversed through the consolidated income statement to the extent that the carrying amount of the investment at the date the impairment is reversed does not exceed what the amortised cost would have been had the impairment not been recognised.
When a decline in fair value of an available-for-sale investment has been recognised in other comprehensive income and there is objective evidence that investment is impaired, the cumulative loss that had been recognised in other comprehensive income is reclassified from other comprehensive income and recognised in the consolidated income statement even though the investment has not been derecognised. Impairment losses previously recognised through consolidated income statement are not reversed. Any increase in fair value subsequent to an impairment loss is recognised in other comprehensive income.
Derecognition of financial assetsThe Group derecognises a financial asset only when the contractual rights to the cash flows from the asset expire; or it transfers the financial asset and substantially all the risks and rewards of ownership of the asset to another entity. If the Group neither transfers nor retains substantially all the risks and rewards of ownership and continues to control the transferred asset, the Group recognises its retained interest in the asset and an associated liability for amounts it may have to pay. If the Group retains substantially all the risks and rewards of ownership of a transferred financial asset, the Group continues to recognise the financial asset and also recognises a collateralised borrowing for the proceeds received.
Financial liabilitiesThe Group classifies financial liabilities into loans and borrowings, trade and other payables. Such financial liabilities are recognised initially at fair value less any directly attributable transaction costs. Subsequent to initial recognition, these financial liabilities are measured at amortised cost using the effective interest method.
Effective interest methodThe effective interest method is a method of calculating the amortised cost of a financial liability and of allocating interest expense over the relevant period. The effective interest rate is the rate that exactly discounts estimated future cash payments through the expected life of the financial liability, or where appropriate, a shorter period.
Derecognition of financial liabilitiesThe Group derecognises financial liabilities when, and only when, the Group’s obligations are discharged, cancelled or they expire.
Cash and cash equivalentsCash and cash equivalents comprise cash balances, cash deposits in banks, brokers and other financial institutions and highly liquid investments with original maturities of three months or less and on demand deposits, which are readily convertible to known amounts of cash and are subject to an insignificant risk of changes in value.
ProvisionsProvisions are recognised when the Group has a legal or constructive obligation as a result of past events for which it is probable that an outflow of economic benefits will be required to settle the obligation, and the amount of the obligation can be reliably estimated.
The amount recognised as a provision is the best estimate of the consideration required to settle the present obligation at the reporting date, taking into account the risks and uncertainties surrounding the obligation. Where a provision is measured using the cash flows estimated to settle the present obligation, its carrying amount is the present value of those cash flows.
Decommissioning obligationsDecommissioning obligations include direct asset decommissioning costs as well as related land restoration costs.
Future decommissioning and other related obligations, discounted to net present value, are recognised at the moment when the legal or constructive obligation in relation to such costs arises (generally when the related asset is put into operation) and the future cost can be reliably estimated. This cost is capitalised as part of the initial cost of the related asset (i.e. a mine) and is depreciated over the useful life of the asset. The unwinding of the discount on decommissioning obligations is included in the consolidated income statement as finance costs. Decommissioning obligations are periodically reviewed in light of current laws and regulations, and adjustments are made as necessary.
4. Critical accounting judgements and key sources of estimation uncertainty
Preparation of the consolidated financial statements in accordance with IFRS requires the Group’s management to make estimates and assumptions that affect the reported amounts of assets and liabilities and disclosure of contingent assets and liabilities at the date of the consolidated financial statements, and the reported amounts of revenues and expenses during the reporting period. The determination of estimates requires judgements which are based on historical experience, current and expected economic conditions, and all other available information. Actual results could differ from these estimates.
The most significant areas requiring the use of management estimates and assumptions relate to:• useful economic lives of property, plant and equipment;• impairment of assets, including fair value of assets held for sale;• provisions;• decommissioning obligations;• income taxes; and• contingencies.
Useful economic lives of property, plant and equipmentCarrying value of the Group’s mining assets, classified within property, plant and equipment, is amortised on a straight-line basis over the lesser of their remaining economic useful lives or remaining life of mine. When determining the life of a mine, valid assumptions at the time of estimation may change in case of new information becomes available.
The factors that could affect the estimation of the life of mine include the following:• changes in proved and probable ore reserves;• the grade of mineral reserves varying significantly from time to time;• differences between actual commodity prices and commodity price assumptions used in the estimation and classification of ore reserves;• unforeseen operational issues at mine sites; and• changes in capital, operating, mining, processing and decommissioning costs, discount rates and foreign exchange rates could possibly adversely affect the
economic viability of ore reserves.
Any of these changes could affect prospective amortisation of mining assets. Useful economic lives of non-mining property, plant and equipment are reviewed by management periodically. The review is based on the current condition of the assets and the estimated period during which they will continue to bring economic benefit to the Group.
Impairment of assetsThe Group reviews the carrying amounts of its tangible and intangible assets to determine whether there is any indication that those assets are impaired or indication of reversal of impairment. In making the assessment for impairment, assets that do not generate independent cash flows are allocated to an appropriate cash-generating unit. Management necessarily applies its judgement in allocating assets that do not generate independent cash flows to appropriate cash-generating units, and also in estimating the timing and value of the underlying cash flows within the value-in-use calculation. Subsequent changes to the cash-generating unit allocation or to the timing of cash flows could impact the carrying value of the respective assets.
ProvisionsThe Group creates provision for doubtful debts to account for estimated losses resulting from the inability of customers to make the required payments. When evaluating the adequacy of a provision for doubtful debts, management bases its estimate on current overall economic conditions, ageing of the accounts receivable balances, historical write-off experience, customer creditworthiness and changes in payment terms. Changes in the economy, industry or specific customer conditions may require adjustments to the provision for doubtful debts recorded in the consolidated financial statements.
The Group also creates a provision for obsolete and slow-moving inventories. In addition, certain finished goods of the Group are carried at net realisable value. Estimates of net realisable value of inventories are based on the most reliable evidence available at the time the estimates are made. These estimates take into consideration fluctuations of price or cost directly relating to events occurring subsequent to the statement of financial position date to the extent that such events confirm conditions existing at the end of the period.
The Group creates a provision for social commitments. The provision represents present value of the best estimate of the future outflow of economic benefits to settle these obligations.
Co
mp
any overview
Strategy o
verviewM
arket overview
Business o
verview
Co
rpo
rate go
vernanceInfo
rmatio
n for shareho
lders
Ap
pend
ixes

Annual report • 2017Appendixes Сonsolidated financial statements
242 243
Decommissioning obligationsThe Group’s mining and exploration activities are subject to various environmental laws and regulations. The Group estimates decommissioning obligations based on management’s understanding of the current legal requirements in the various jurisdictions in which it operates, terms of the license agreements and internally generated engineering estimates. Provision is made, based on net present values, for decommissioning and land restoration costs as soon as the obligation arises. Actual costs incurred in future periods could differ materially from the amounts provided. Additionally, future changes to environmental laws and regulations, life of mine estimates and discount rates could affect the carrying amount of this provision.
Income taxesThe Group is subject to income taxes in numerous jurisdictions. Significant judgement is required in determining provision for income taxes due to the complexity of legislation in some jurisdictions. There are many transactions and calculations for which the ultimate tax determination is uncertain. The Group recognises provisions for anticipated tax audit issues based on estimates of whether additional taxes will be due. Where the final tax outcome of these matters is different from the amounts that were initially recorded, such differences will impact the income tax and deferred tax provisions in the period in which such determination is made.
Deferred tax assets are reviewed at each statement of financial position date and adjusted to the extent that it is probable that sufficient taxable income will be available to allow all or part of the deferred tax asset to be utilised. The estimation of that probability includes judgements based on the expected performance.
Various factors are considered to assess the probability of the future utilisation of deferred tax assets, including past operating results, operational plans, expiration of tax losses carried forward, and tax planning strategies. If actual results differ from these estimates or if these estimates must be adjusted in future periods, the financial position, results of operations and cash flows may be affected.
ContingenciesBy their nature, contingencies will only be resolved when one or more future events occur or fail to occur. The assessment of such contingencies inherently involves the exercise of significant judgement and estimates of the outcome of future events.
5. Segmental information
Operating segments are identified on the basis of internal reports on components of the Group that are regularly reviewed by the Management Board.
Management has determined the following operating segments:• “GMK Group” segment, which includes mining and metallurgy operations, transport services, energy, repair and maintenance services located at Taimyr
Peninsula;• “KGMK Group” segment, which includes mining and metallurgy operations, energy, exploration activities located at Kola Peninsula;• “NN Harjavalta” segment, which includes refinery operations located in Finland;• “Other metallurgical” segment, which includes operations of Bystrinskoye project, other metallurgy operations and exploration activities located in Russia and
abroad;• “Other non-metallurgical” segment, which includes metal and other trading, supply chain management, transport services, energy and utility, research and
other activities located in Russia and abroad.
Corporate activities of the Group do not represent an operating segment, include primarily headquarters’ general and administrative expenses and treasury operations of the Group and are presented as “Unallocated”.
The amounts in respect of reportable segments in the disclosure below are stated before intersegment eliminations, excluding:• balances of intercompany loans and borrowings and interest accruals;• intercompany investments;• accrual of intercompany dividends;• intercompany refined metal sales.
Amounts are measured on the same basis as those in the consolidated financial statements. Information for the year ended 31 December 2016 has been presented to conform with the current period presentation.
The following tables present revenue, measure of segment profit or loss (EBITDA) and other segmental information from continuing operations regarding the Group’s reportable segments for the year ended 31 December 2017 and 31 December 2016, respectively.
For the year ended 31 December 2017 GMK Group KGMK Group NN Harjavalta Other metallurgical Other non-metallurgical Eliminations Total
Revenue from external customers 7,064 357 840 34 851 – 9,146
Inter-segment revenue 607 531 – 107 415 (1,660) –
Total revenue 7,671 888 840 141 1,266 (1,660) 9,146
Segment EBITDA 4,701 169 84 (53) 114 (377) 4,638
Unallocated (643)
Consolidated EBITDA 3,995
Depreciation and amortisation (645)
Impairment of non-financial assets (227)
Finance costs (535)
Foreign exchange gain, net 159
Other income and expenses, net 97
Profit before tax 2,844
Other segmental information
Purchase of property, plant and equipment and intangible assets 1,225 228 16 469 64 – 2,002
Depreciation and amortisation 508 63 25 73 23 (47) 645
Impairment of non-financial assets 101 3 – 122 1 – 227
For the year ended 31 December 2016 GMK Group KGMK Group NN Harjavalta Other metallurgical Other non-metalurgical Eliminations Total
Revenue from external customers 5,981 465 727 7 1,079 – 8,259
Inter-segment revenue 213 199 – 77 620 (1,109) –
Total revenue 6,194 664 727 84 1,699 (1,109) 8,259
Segment EBITDA 3,883 117 45 (11) 119 112 4,265
Unallocated (366)
Consolidated EBITDA 3,899
Depreciation and amortisation (557)
Impairment of non-financial assets (61)
Finance costs (453)
Foreign exchange gain, net 491
Other income and expenses, net (43)
Profit before tax 3,276
Other segmental information
Purchase of property, plant and equipment and intangible assets 1,284 93 16 288 33 – 1,714
Depreciation and amortisation 435 41 28 – 23 30 557
Impairment of non-financial assets 50 2 – – 9 – 61
Co
mp
any overview
Strategy o
verviewM
arket overview
Business o
verview
Co
rpo
rate go
vernanceInfo
rmatio
n for shareho
lders
Ap
pend
ixes

Annual report • 2017Appendixes Сonsolidated financial statements
244 245
The following tables present assets and liabilities of the Group’s reportable segments at 31 December 2017 and 31 December 2016, respectively.
At 31 December 2017 GMK Group KGMK Group NN Harjavalta Other metallurgical Other non-metallurgical Eliminations Total
Inter-segment assets 346 207 172 11 54 (790) –
Segment assets 11,424 963 384 1,500 1,584 (425) 15,430
Total segment assets 11,770 1,170 556 1,511 1,638 (1,215) 15,430
Unallocated 1,205
Total assets 16,635
Inter-segment liabilities 89 135 124 43 399 (790) –
Segment liabilities 2,228 157 73 121 171 – 2,750
Total segment liabilities 2,317 292 197 164 570 (790) 2,750
Unallocated 9,227
Total liabilities 11,977
At 31 December 2016 GMK Group KGMK Group NN Harjavalta Other metallurgical Other non-metallurgical Eliminations Total
Inter-segment assets 296 79 160 35 49 (619) –
Segment assets 9,922 768 383 868 793 (111) 12,623
Total segment assets 10,218 847 543 903 842 (730) 12,623
Unallocated 3,900
Total assets 16,523
Inter-segment liabilities 113 87 77 27 315 (619) –
Segment liabilities 2,241 113 102 266 862 – 3,584
Total segment liabilities 2,354 200 179 293 1,177 (619) 3,584
Unallocated 9,043
Total liabilities 12,627
The Group’s non-current assets are primarily located in the Russian Federation and Finland.
6. Metal sales
The Group’s metal sales to external customers are detailed below (based on external customers’ locations):
Total Nickel Copper Palladium Platinum Semi-products Other metals
For the year ended 31 December 2017
Europe 4,753 1,067 2,098 736 441 85 326
Asia 1,939 709 6 762 97 331 34
North and South America 1,166 313 – 807 – – 46
Russian Federation and CIS 557 215 177 41 85 8 31
8,415 2,304 2,281 2,346 623 424 437
For the year ended 31 December 2016
Europe 4,394 1,143 1,544 821 420 123 343
Asia 1,723 1,104 1 478 26 92 22
North and South America 737 222 – 488 – 1 26
Russian Federation and CIS 792 156 294 101 208 – 33
7,646 2,625 1,839 1,888 654 216 424
7. Cost of metal sales
For the year ended 31 December 2017 For the year ended 31 December 2016
Cash operating costs
Labour 1,377 1,145
Materials and supplies 703 520
Purchases of metals for resale 530 184
Purchases of raw materials and semi-products 297 292
Mineral extraction tax and other levies 221 122
Third party services 204 170
Electricity and heat energy 132 101
Production costs related to the joint operation 93 79
Fuel 81 60
Transportation expenses 64 71
Sundry costs 150 143
Total cash operating costs 3,852 2,887
Depreciation and amortisation 630 456
(Increase)/decrease in metal inventories (514) 290
Total 3,968 3,633
8. General and administrative expenses
For the year ended 31 December 2017 For the year ended 31 December 2016
Staff costs 478 376
Taxes other than mineral extraction tax and income tax 79 58
Third party services 72 55
Depreciation and amortisation 32 20
Rent expenses 25 19
Transportation expenses 8 6
Other 65 47
Total 759 581
9. Selling and distribution expenses
For the year ended 31 December 2017 For the year ended 31 December 2016
Transportation expenses 38 23
Marketing expenses 14 7
Staff costs 13 13
Export duties 1 61
Other 9 7
Total 75 111
Co
mp
any overview
Strategy o
verviewM
arket overview
Business o
verview
Co
rpo
rate go
vernanceInfo
rmatio
n for shareho
lders
Ap
pend
ixes

Annual report • 2017Appendixes Сonsolidated financial statements
246 247
10. Other net operating expenses
For the year ended 31 December 2017 For the year ended 31 December 2016
Social expenses 303 111
Change in allowance for doubtful debts 19 14
Change in allowance for obsolete and slow-moving inventory 11 (2)
Change in provision for reconfiguration of production facilities (4) (33)
Other 33 (6)
Total 362 84
11. Finance costs
For the year ended 31 December 2017 For the year ended 31 December 2016
Interest expense on borrowings net of amounts capitalised 386 403
Unwinding of discount on provisions and payables 133 46
Other 16 4
Total 535 453
12. Income from investments, net
For the year ended 31 December 2017 For the year ended 31 December 2016
Interest income on bank deposits 39 78
Realised gain on disposal of investments 1 4
Other 37 32
Total 77 114
13. Income tax expense
For the year ended 31 December 2017 For the year ended 31 December 2016
Current income tax expense 686 686
Deferred tax expense 35 59
Total 721 745
A reconciliation of theoretic income tax, calculated at the statutory rate in the Russian Federation, the location of major production assets of the Group, to the amount of actual income tax expense recorded in the consolidated income statement is as follows:
For the year ended 31 December 2017 For the year ended 31 December 2016
Profit before tax 2,844 3,276
Income tax at statutory rate of 20% 569 655
Allowance for deferred tax assets 38 18
Non-deductible impairment of financial and non-financial assets 7 41
Non-deductible social expenses 73 31
Effect of different tax rates of subsidiaries operating in other jurisdictions 8 (27)
Tax effect of other permanent differences 26 27
Total 721 745
The corporate income tax rates in other countries where the Group has a taxable presence vary from 0% to 39%.
Deferred tax balances
At 31 December 2016
Recognised in income statement
Disposed on disposal of subsidiaries
Effect of translation to presentation currency
At 31 December 2017
Property, plant and equipment 350 2 (4) 20 368
Inventories 102 16 – 6 124
Trade and other receivables (12) 9 – – (3)
Decommissioning obligations (79) 16 – (6) (69)
Loans and borrowings, trade and other payables (33) (35) – (1) (69)
Other assets (10) 57 – (1) 46
Other liabilities 6 2 – – 8
Tax loss carried forward (41) (32) – (2) (75)
Net deferred tax liabilities 283 35 (4) 16 330
At 31 December 2015
Recognised in income statement
Disposed on disposal of subsidiaries
Effect of translation to presentation currency
At 31 December 2016
Property, plant and equipment 251 58 – 41 350
Inventories 91 (6) – 17 102
Trade and other receivables (6) (2) – (4) (12)
Decommissioning obligations (62) (4) – (13) (79)
Loans and borrowings, trade and other payables (16) (9) – (8) (33)
Other assets (10) (2) – 2 (10)
Other liabilities 4 – – 2 6
Tax loss carried forward (53) 24 – (12) (41)
Net deferred tax liabilities 199 59 – 25 283
Certain deferred tax assets and liabilities have been offset to the extent they relate to taxes levied on the Group’s entities which entered into the tax consolidation group. Deferred tax balances (after offset) presented in the consolidated statement of financial position were as follows:
At 31 December 2017 At 31 December 2016
Deferred tax liability 407 355
Deferred tax asset (77) (72)
Net deferred tax liabilities 330 283
Unrecognised deferred tax assetsDeferred tax assets have not been recognised as follows:
At 31 December 2017 At 31 December 2016
Deductible temporary differences 104 90
Tax loss carry-forwards 219 214
Total 323 304
Deferred tax assets have not been recognised in respect of these items because it is not probable that future taxable profit will be available against which the Group can utilise the benefits therefrom.
Co
mp
any overview
Strategy o
verviewM
arket overview
Business o
verview
Co
rpo
rate go
vernanceInfo
rmatio
n for shareho
lders
Ap
pend
ixes

Annual report • 2017Appendixes Сonsolidated financial statements
248 249
At 31 December 2017 deferred tax asset in amount of USD 175 million related to tax loss arising on disposal of OJSC “Third Generation Company of the Wholesale Electricity Market” (“OGK-3 (at 31 December 2016: USD 166 million) was not recognised as it was incurred by the Company prior to setting up of the tax consolidation group. This deferred tax asset can be utilised only if the Company exits the tax consolidation group without expiry.
Unrecognised deferred tax assets in the amount of USD 44 million related to other tax losses will not expire and can be utilised according to specific rules stated by art. 283 of the Tax code of the Russian Federation (31 December 2016: USD 48 million).
At 31 December 2017, the Group did not recognise a deferred tax liability in respect of taxable temporary differences of USD 1,459 million (31 December 2016: USD 1,104 million) associated with investments in subsidiaries, because management believes that it is in a position to control the timing of reversal of such differences and does not expect its reversal in foreseeable future.
14. Property, plant and equipment
Mining assets and mine development cost
Non-mining assets
TotalBuildings, structures
and utilitiesMachinery, equipment
and transport
OtherCapital
construction-in-progress
Cost
Balance at 1 January 2016 5,101 2,002 2,319 106 1,308 10,836
Additions 1,232 – – – 674 1,906
Transfers – 450 363 59 (872) –
Change in decommissioning provision (18) 5 – – – (13)
Disposals (59) (11) (100) (7) (31) (208)
Other (49) 7 (37) 26 53 –
Effect of translation to presentation currency 1,107 402 431 31 255 2,226
Balance at 31 December 2016 7,314 2,855 2,976 215 1,387 14,747
Additions 1,429 – – – 840 2,269
Transfers – 247 477 84 (808) –
Change in decommissioning provision (7) (13) – – – (20)
Disposals (124) (150) (90) (23) (12) (399)
Other (40) 42 (6) 2 2 –
Effect of translation to presentation currency 422 153 150 11 75 811
Balance at 31 December 2017 8,994 3,134 3,507 289 1,484 17,408
Accumulated depreciation and impairment
Balance at 1 January 2016 (1,588) (1,040) (1,277) (46) (244) (4,195)
Charge for the year (213) (97) (201) (14) – (525)
Disposals 47 7 90 3 19 166
Impairment loss (7) (70) (2) – 18 (61)
Other (11) 2 14 (5) – –
Effect of translation to presentation currency (318) (215) (242) (10) (41) (826)
Mining assets and mine development cost
Non-mining assets
TotalBuildings, structures
and utilitiesMachinery, equipment
and transport
OtherCapital
construction-in-progress
Balance at 31 December 2016 (2,090) (1,413) (1,618) (72) (248) (5,441)
Charge for the year (347) (97) (264) (24) – (732)
Disposals 107 56 79 5 4 251
Impairment loss (154) (87) (7) – 21 (227)
Other 4 (18) 16 (1) (1) –
Effect of translation to presentation currency (120) (78) (82) (4) (15) (299)
Balance at 31 December 2017 (2,600) (1,637) (1,876) (96) (239) (6,448)
Carrying value
At 31 December 2016 5,224 1,442 1,358 143 1,139 9,306
At 31 December 2017 6,394 1,497 1,631 193 1,245 10,960
At 31 December 2017 capital construction-in-progress included USD 225 million of irrevocable letters of credit opened for fixed assets purchases (31 December 2016: USD 87 million), representing security deposits placed in banks. For the year ended 31 December 2017 purchases of property, plant and equipment in the consolidated statement of cash flows include USD 210 million related to these irrevocable letters of credit (for the year ended 31 December 2016: USD 78 million).
Capitalised borrowing costs for the year ended 31 December 2017 amounted to USD 263 million (for the year ended 31 December 2016: USD 202 million). Capitalisation rate used to determine the amount of borrowing costs equals to 6.28% per annum (31 December 2016: 6.59%). At 31 December 2017 mining assets and mine development cost included USD 3,728 million of mining assets under development (31 December 2016: USD 2,994 million).
At 31 December 2017 non-mining assets included USD 55 million of investment property (31 December 2016: USD 136 million).
ImpairmentAt 31 December 2017 the Group reclassified Nkomati Nickel Mine from assets classified as held for sale and tested the assets for impairment. The value in use of USD 49 million was determined by the Group using a discounted cash flow model approach. The most significant estimates and assumptions used in determination of value in use are as follows:• Future cash flows were projected based on budgeted amounts, taking into account actual results for the previous years. Forecasts were assessed up to 2027.
Measurements were performed based on discounted cash flows expected to be generated by production assets.• Management estimates metal concentrates market prices based on adjusted commodity price forecast for metals. Commodities price forecast was based on
consensus forecast.• Production forecasts were primarily based on internal production reports available at the date of impairment test and management’s assumptions regarding
future production levels.• Inflation forecasts were sourced from Economist Intelligence Unit report. Inflation used was projected within 2–5%. Forecast for exchange rates was made
based on expected ZAR and USD inflation indices.• A pre-tax nominal ZAR discount rate of 21.6% was estimated by the reference to the weighted average cost of capital for the Group and reflects
management’s estimates of the risks specific to production units.
As a result, impairment loss in the amount of USD 129 million was recognised in impairment of non-financial assets in the consolidated income statement for the year ended 31 December 2017.
During the year ended 31 December 2015 the Group revised its intention on the further use of the gas extraction assets. As a result, these assets were assessed as a separate cash generating unit. The Group recognised impairment loss related to the gas extraction assets in the amount of USD 50 million in impairment of non-financial assets in the consolidated income statement for the year ended 31 December 2016.
Co
mp
any overview
Strategy o
verviewM
arket overview
Business o
verview
Co
rpo
rate go
vernanceInfo
rmatio
n for shareho
lders
Ap
pend
ixes
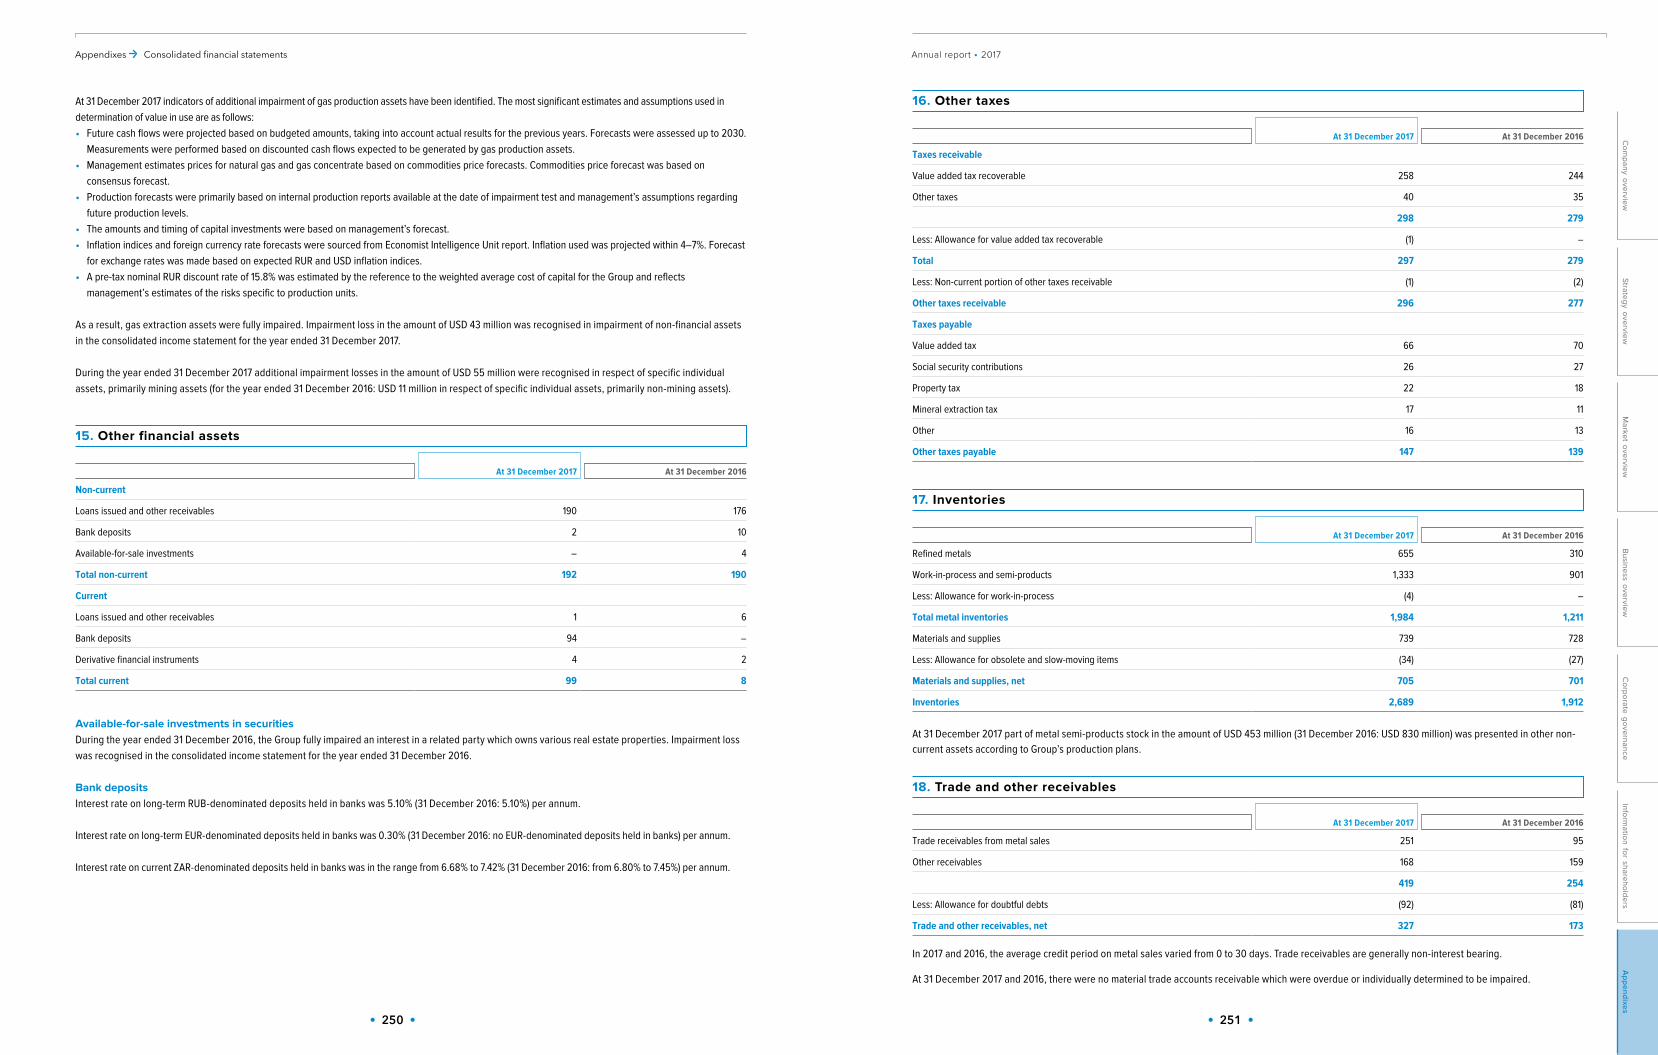
Annual report • 2017Appendixes Сonsolidated financial statements
250 251
At 31 December 2017 indicators of additional impairment of gas production assets have been identified. The most significant estimates and assumptions used in determination of value in use are as follows:• Future cash flows were projected based on budgeted amounts, taking into account actual results for the previous years. Forecasts were assessed up to 2030.
Measurements were performed based on discounted cash flows expected to be generated by gas production assets.• Management estimates prices for natural gas and gas concentrate based on commodities price forecasts. Commodities price forecast was based on
consensus forecast.• Production forecasts were primarily based on internal production reports available at the date of impairment test and management’s assumptions regarding
future production levels.• The amounts and timing of capital investments were based on management’s forecast.• Inflation indices and foreign currency rate forecasts were sourced from Economist Intelligence Unit report. Inflation used was projected within 4–7%. Forecast
for exchange rates was made based on expected RUR and USD inflation indices.• A pre-tax nominal RUR discount rate of 15.8% was estimated by the reference to the weighted average cost of capital for the Group and reflects
management’s estimates of the risks specific to production units.
As a result, gas extraction assets were fully impaired. Impairment loss in the amount of USD 43 million was recognised in impairment of non-financial assets in the consolidated income statement for the year ended 31 December 2017.
During the year ended 31 December 2017 additional impairment losses in the amount of USD 55 million were recognised in respect of specific individual assets, primarily mining assets (for the year ended 31 December 2016: USD 11 million in respect of specific individual assets, primarily non-mining assets).
15. Other financial assets
At 31 December 2017 At 31 December 2016
Non-current
Loans issued and other receivables 190 176
Bank deposits 2 10
Available-for-sale investments – 4
Total non-current 192 190
Current
Loans issued and other receivables 1 6
Bank deposits 94 –
Derivative financial instruments 4 2
Total current 99 8
Available-for-sale investments in securitiesDuring the year ended 31 December 2016, the Group fully impaired an interest in a related party which owns various real estate properties. Impairment loss was recognised in the consolidated income statement for the year ended 31 December 2016.
Bank depositsInterest rate on long-term RUB-denominated deposits held in banks was 5.10% (31 December 2016: 5.10%) per annum.
Interest rate on long-term EUR-denominated deposits held in banks was 0.30% (31 December 2016: no EUR-denominated deposits held in banks) per annum.
Interest rate on current ZAR-denominated deposits held in banks was in the range from 6.68% to 7.42% (31 December 2016: from 6.80% to 7.45%) per annum.
16. Other taxes
At 31 December 2017 At 31 December 2016
Taxes receivable
Value added tax recoverable 258 244
Other taxes 40 35
298 279
Less: Allowance for value added tax recoverable (1) –
Total 297 279
Less: Non-current portion of other taxes receivable (1) (2)
Other taxes receivable 296 277
Taxes payable
Value added tax 66 70
Social security contributions 26 27
Property tax 22 18
Mineral extraction tax 17 11
Other 16 13
Other taxes payable 147 139
17. Inventories
At 31 December 2017 At 31 December 2016
Refined metals 655 310
Work-in-process and semi-products 1,333 901
Less: Allowance for work-in-process (4) –
Total metal inventories 1,984 1,211
Materials and supplies 739 728
Less: Allowance for obsolete and slow-moving items (34) (27)
Materials and supplies, net 705 701
Inventories 2,689 1,912
At 31 December 2017 part of metal semi-products stock in the amount of USD 453 million (31 December 2016: USD 830 million) was presented in other non-current assets according to Group’s production plans.
18. Trade and other receivables
At 31 December 2017 At 31 December 2016
Trade receivables from metal sales 251 95
Other receivables 168 159
419 254
Less: Allowance for doubtful debts (92) (81)
Trade and other receivables, net 327 173
In 2017 and 2016, the average credit period on metal sales varied from 0 to 30 days. Trade receivables are generally non-interest bearing.
At 31 December 2017 and 2016, there were no material trade accounts receivable which were overdue or individually determined to be impaired.
Co
mp
any overview
Strategy o
verviewM
arket overview
Business o
verview
Co
rpo
rate go
vernanceInfo
rmatio
n for shareho
lders
Ap
pend
ixes

Annual report • 2017Appendixes Сonsolidated financial statements
252 253
The average credit period on sales of other products and services for the year ended 31 December 2017 was 33 days (2016: 32 days). No interest was charged on these receivables.
Included in the Group’s other receivables at 31 December 2017 were debtors with a carrying value of USD 34 million (31 December 2016: USD 45 million) that were past due but not impaired. Management of the Group believes that these amounts are recoverable in full.
The Group did not hold any collateral for accounts receivable balances.
Ageing of other receivables past due but not impaired was as follows:
At 31 December 2017 At 31 December 2016
Less than 180 days 25 41
180–365 days 9 4
34 45
Movement in the allowance for doubtful debts was as follows:
At 31 December 2017 At 31 December 2016
Balance at beginning of the year 81 54
Change in allowance 16 14
Accounts receivable written-off (9) (2)
Effect of translation to presentation currency 4 15
Balance at end of the year 92 81
19. Cash and cash equivalents
At 31 December 2017 At 31 December 2016
Current accounts
• foreign currencies 358 389
• RUB 76 58
Bank deposits
• foreign currencies 412 1,739
• RUB – 1,119
Restricted cash and cash equivalents 2 8
Other cash and cash equivalents 4 12
Total 852 3,325
20. Assets classified as held for sale and disposal of subsidiaries
On 17 October 2014, the Group entered into binding agreements to sell its assets in South Africa, comprising its 50% participation interest in Nkomati Nickel Mine (“Nkomati”) and its 85% stake in Tati Nickel Mining Company (together “African assets”) to BCL Investments (“BCL”). The total consideration for the assets amounted to USD 337 million subject to certain adjustments under agreement. Under the terms of the agreements, the buyer assumed all attributable decommissioning rehabilitation obligations related to the assets. On 2 April 2015, the Group sold its 85% stake in Tati Nickel Mining Company.
Finalisation of sale of Nkomati was subject to completion of conditions precedent, which was achieved in September 2016. However, BCL failed to meet its obligations according to the agreement and was put into a voluntary liquidation. The Group has filed legal claims against BCL in Botswana and LCIA to enforce sale of Nkomati.
Management believes that the criteria for held for sale are no longer met for Nkomati as at 31 December 2017. At 31 December 2017 Nkomati is presented as a joint operation and the Group recognises its share in assets, liabilities, income and expenses of Nkomati. Financial statements for the periods since classification of Nkomati as held for sale have been amended accordingly. After reclassification Nkomati assets were tested for impairment (refer to note 14).
Information for the year ended 31 December 2016 has been reclassified to conform with the current period presentation:
Adjustments to the consolidated statement of financial position
At 31 December 2016
As previously reported Reclassification Reclassified
Property, plant and equipment 9,099 207 9,306
Other non-current financial assets 187 3 190
Deferred tax assets 56 16 72
Inventories 1,895 17 1,912
Trade and other receivables 170 3 173
Advances paid and prepaid expenses 65 1 66
Other taxes receivable 276 1 277
Cash and cash equivalents 3,301 24 3,325
Assets classified as held for sale 206 (206) –
66
Non-current loans and borrowings 7,274 2 7,276
Non-current provisions 435 6 441
Deferred tax liabilities 303 52 355
Current loans and borrowings 578 1 579
Trade and other payables 1,609 4 1,613
Employee benefit obligations 299 2 301
Other taxes payable 138 1 139
Liabilities associated with assets classified as held for sale 2 (2) –
66
Adjustments to the consolidated income statement
For the year ended 31 December 2016
As previously reported Reclassification Reclassified
Foreign exchange gain, net 485 6 491
Share of profits of associates 6 (6) –
–
Adjustments to the consolidated statement of cash flows
For the year ended 31 December 2016
As previously reported Reclassification Reclassified
OPERATING ACTIVITIES
Adjustments to profit before tax for:
Foreign exchange gain, net (485) (6) (491)
Share of profits of associates (6) 6 –
–
Movements in working capital:
Trade and other payables 816 19 835
19
INVESTING ACTIVITIES
Purchase of property, plant and equipment (1,648) (19) (1,667)
(19)
Co
mp
any overview
Strategy o
verviewM
arket overview
Business o
verview
Co
rpo
rate go
vernanceInfo
rmatio
n for shareho
lders
Ap
pend
ixes

Annual report • 2017Appendixes Сonsolidated financial statements
254 255
On 6 April 2017, the Group sold its interest in a subsidiary which owns real estate for a consideration of USD 113 million. Proceeds from disposal of the subsidiary in the amount of USD 95 million were recognised in the consolidated statement of cash flows, net of disposed cash and cash equivalents of USD 16 million and transaction costs of USD 2 million. Gain on disposal in the amount of USD 16 million was recognised in the consolidated income statement.
On 29 November 2016, the Group sold its 74.8% share in OJSC “Arkhangelsk Sea Commercial Port”, a subsidiary of the Group located in the Russian Federation, for a consideration of USD 7 million. The carrying value of net assets at the date of disposal amounted to USD 8 million. Loss on disposal in the amount of USD 1 million was recognised in the consolidated income statement.
On 15 April 2016, the Group sold its aircompany assets comprising 96.8% share in CJSC “Nordavia – Regional Airlines” (“Nordavia”), a subsidiary of the Group located in the Russian Federation and related to Nordavia aircrafts and infrastructure, for a consideration of USD 10 million. The carrying value of net assets at the date of disposal amounted to USD 14 million. Loss on disposal in the amount of USD 4 million was recognised in the consolidated income statement.
21. Share capital
Authorised and issued ordinary shares
2017 2016
At 1 January 158,245,476 156,995,401
Sale of own shares from treasury stock – 1,250,075
At 31 December 158,245,476 158,245,476
During the year ended 31 December 2016, the Group sold 1,250,075 treasury shares for a cash consideration in the amount of USD 158 million.
Earnings per share
For the year ended 31 December 2017 For the year ended 31 December 2016
Basic earnings per share (US Dollars per share): 13.5 16.1
The earnings and weighted average number of shares used in the calculation of earnings per share are as follows:
For the year ended 31 December 2017 For the year ended 31 December 2016
Profit for the year attributable to shareholders of the parent company 2,129 2,536
For the year ended 31 December 2017 For the year ended 31 December 2016
Weighted average number of shares on issue 158,245,476 156,995,401
Effect of sale of own shares from treasury stock – 54,648
Weighted average number of issued common shares outstanding 158,245,476 157,050,049
As at 31 December 2017 and 31 December 2016, the Group had no securities, which would have a dilutive effect on earnings per share of ordinary stock.
22. Non-controlling interest
In July 2016 the Group sold a 10.67% share in Bystrinskoye project for USD 80 million to a Chinese investor Highland Fund. In May 2017 the Group sold a 2.66% share in Bystrinskoye project for USD 21 million to Highland Fund. In October 2017 the Group sold a 36.66% share in Bystrinskoye project for USD 275 million to a related party.
At 31 December 2017 and 31 December 2016 aggregate financial information relating to the subsidiary that has material non-controlling interest, before any intra-group eliminations, is presented below:
At 31 December 2017 At 31 December 2016
Non-current assets 1,281 741
Current assets 117 114
Non-current liabilities (593) (174)
Current liabilities (156) (105)
Net assets 649 576
Net assets attributable to non-controlling interest 325 61
For the year ended 31 December 2017 For the year ended 31 December 2016
Loss for the year (32) (5)
Other comprehensive income/(loss) for the year 31 82
Total comprehensive loss for the year (1) 77
Loss attributable to non-controlling interest (6) (1)
Other comprehensive income attributable to non-controlling interest 5 9
For the year ended 31 December 2017 For the year ended 31 December 2016
Cash flows used in operating activities (42) (63)
Cash flows used in investing activities (422) (163)
Cash flows from financing activities 459 239
Net (decrease)/increase in cash and cash equivalents (7) 13
23. Loans and borrowings
Currency
Fixed or floating interest rate
Average nominal rate during the year ended 31 December 2017, %
Maturity
At 31 December 2017
At 31 December 2016
Unsecured loans
USD floating 3.38% 2017–2023 2,898 2,707
RUB fixed 11.90% 2021 1,042 1,990
EUR floating 0.85% 2019–2028 4 –
Secured loans
USD floating 6.72% 2019–2024 582 165
RUB fixed 8.38% 2017–2022 34 –
Total loans 4,560 4,862
Corporate bonds
USD fixed 5.05% 2018–2023 4,206 2,715
RUB fixed 11.60% 2026 259 247
4,465 2,962
Finance leasing
EUR fixed 7.10% 2026 23 24
USD fixed 4.20% 2019 4 7
ZAR floating 12.19% 2017–2019 1 –
28 31
Total 9,053 7,855
Less: current portion due within twelve months and presented as short-term loans and borrowings (817) (579)
Long-term loans and borrowings 8,236 7,276
Co
mp
any overview
Strategy o
verviewM
arket overview
Business o
verview
Co
rpo
rate go
vernanceInfo
rmatio
n for shareho
lders
Ap
pend
ixes

Annual report • 2017Appendixes Сonsolidated financial statements
256 257
The Group is obliged to comply with a number of restrictive financial and other covenants, including maintaining certain financial ratios and restrictions on pledging and disposal of certain assets.
Changes in loans and borrowings, including interest, for the year ended 31 December 2017 consist of changes from financing cash flows in the amount of USD 441 million, effect of changes in foreign exchange rates of USD 103 million and other non-cash changes of USD 667 million (for the year ended 31 December 2016: changes from financing cash flows in the amount of USD (1,401) million, effect of changes in foreign exchange rates of USD 346 million and other non-cash changes of USD 697 million).
At 31 December 2017 loans were secured by property, plant and equipment with a carrying amount of USD 15 million (31 December 2016: USD 752 million). At 31 December 2017 and 31 December 2016 100% shares of the Group’s subsidiary LLC “GRK “Bystrinskoye” were under pledge.
24. Employee benefit obligations
At 31 December 2017 At 31 December 2016
Accrual for annual leave 203 179
Wages and salaries 168 148
Other 22 22
Total obligations 393 349
Less: non-current obligations (16) (48)
Current obligations 377 301
Defined contribution plansAmounts recognised within continuing operations in the consolidated income statement in respect of defined contribution plans were as follows:
For the year ended 31 December 2017 For the year ended 31 December 2016
Pension Fund of the Russian Federation 311 273
Mutual accumulated pension plan 8 7
Other 5 5
Total 324 285
25. Provisions
At 31 December 2017 At 31 December 2016
Current provisions
Tax provision 134 124
Provision for social commitments 28 19
Decommissioning obligations 26 –
Other provisions 1 40
Total current provisions 189 183
Non-current provisions
Decommissioning obligations 396 397
Provision for social commitments 68 43
Other long-term provisions – 1
Total non-current provisions 464 441
Total 653 624
Decommissioning Social commitments Tax Other Total
Balance at 1 January 2016 314 50 127 77 568
Provision accrued – 12 3 4 19
Settlements during the year – (16) (5) (30) (51)
Change in estimates (13) (1) – (27) (41)
Unwinding of discount 32 6 – 5 43
Effect of translation to presentation currency 64 11 (1) 12 86
Balance at 31 December 2016 397 62 124 41 624
Provision accrued 6 42 2 2 52
Settlements during the year – (21) (2) (41) (64)
Change in estimate (38) 4 – – (34)
Unwinding of discount 35 6 – – 41
Effect of translation to presentation currency 22 3 10 (1) 34
Balance at 31 December 2017 422 96 134 1 653
Decommissioning obligationsKey assumptions used in estimation of decommissioning obligations were as follows:
At 31 December 2017 At 31 December 2016
Discount rates Russian entities 6.9%9,1% 8.5%8.6%
Discount rates non-Russian entities 3%5% 3%5%
Expected closure date of mines up to 2071 up to 2059
Expected inflation over the period from 2018 to 2037 3.0%4.9% 3.1%4.7%
Expected inflation over the period from 2038 onwards 2.9% 2.9%
Present value of expected cost to be incurred for settlement of decommissioning obligations was as follows:
At 31 December 2017 At 31 December 2016
Due from second to fifth year 202 265
Due from sixth to tenth year 23 44
Due from eleventh to fifteenth year 39 10
Due from sixteenth to twentieth year 77 26
Due thereafter 55 52
Total 396 397
In 2015 the Group approved a programme for reconfiguration of production facilities located in the Taimyr Peninsula. The programme started in 2016 and also included activites related to closure of the Nickel plant. In 2016 changes in the provision estimates for the reconfiguration of production facilities were recognised in Other net operating expenses in the consolidated income statement.
Social commitmentsIn 2010 the Group entered into several multilateral agreements with the Government of the Russian Federation, the Krasnoyarsk and the Trans-Baikal Regional Governments for construction of pre-schools and other items of social infrastructure in Norilsk, Dudinka and Chita, and resettlement of families currently residing in these cities to other Russian regions with more favorable living conditions during 2015–2020. The provision represents present value of the best estimate of the future outflow of economic benefits to settle these obligations.
Co
mp
any overview
Strategy o
verviewM
arket overview
Business o
verview
Co
rpo
rate go
vernanceInfo
rmatio
n for shareho
lders
Ap
pend
ixes

Annual report • 2017Appendixes Сonsolidated financial statements
258 259
26. Trade and other payables
At 31 December 2017 At 31 December 2016
Financial liabilities
Trade payables 426 602
Payables for acquisition of property, plant and equipment 186 146
Other creditors 140 147
Total financial liabilities 752 895
Non-financial liabilities
Advances received 31 718
Total non-financial liabilities 31 718
Total 783 1,613
The maturity profile of the Group’s financial liabilities was as follows:
At 31 December 2017 At 31 December 2016
Due within one month 194 189
Due from one to three months 244 209
Due from three to twelve months 314 497
Total 752 895
27. Dividends
On 29 September 2017, the Extraordinary General shareholders’ meeting declared interim dividends in respect of the 6 months ended 30 June 2017 in the amount of RUB 224.20 (USD 3.84) per share with the total amount of USD 607 million. The dividends were paid to the shareholders in October 2017 in the amount of USD 610 million recognised in the consolidated statement of cash flows, using prevailing RUB/USD rates on the payment dates.
On 9 June 2017, the Annual General shareholders’ meeting declared dividends for the year ended 31 December 2016 in the amount of RUB 446.10 (USD 7.83) per share with the total amount of USD 1,239 million. The dividends were paid to the shareholders in July 2017 in the amount of USD 1,189 million recognised in the consolidated statement of cash flows, using prevailing RUB/USD rates on the payment dates.
On 16 December 2016, the Extraordinary General shareholders’ meeting declared interim dividends in respect of the 9 months ended 30 September 2016 in the amount of RUB 444.25 (USD 7.21) per share with the total amount of USD 1,141 million. The dividends were paid to the shareholders in January 2017 in the amount of USD 1,172 million recognised in the consolidated statement of cash flows, using prevailing RUB/USD rates on the payment dates.
On 10 June 2016, the Annual General shareholders’ meeting declared dividends for the year ended 31 December 2015 in the amount of RUB 230.14 (USD 3.61) per share with the total amount of USD 571 million (including USD 4 million in respect of Treasury shares). The dividends were paid to the shareholders in July 2016 in the amount of USD 567 million recognised in the consolidated statement of cash flows, using prevailing RUB/USD rates on the payment dates.
On 19 December 2015, the Extraordinary General shareholders’ meeting declared interim dividends in respect of the 9 months ended 30 September 2015 in the amount of RUB 321.95 (USD 4.51) per share with the total amount of USD 714 million (including USD 6 million in respect of Treasury shares). The dividends were paid to the shareholders in January 2016 in the amount of USD 665 million recognised in the consolidated statement of cash flows, using prevailing RUB/USD rates on the payment dates.
28. Related parties transactions and outstanding balances
Related parties include major shareholders, associates and entities under common ownership and control of the Group’s major shareholders and key management personnel. The Group defines major shareholders as shareholders, which have significant influence over the Group activities. The Company and its subsidiaries, in the ordinary course of their business, enter into various sale, purchase and service transactions with related parties. Transactions between the Company and its subsidiaries, which are related parties of the Company, have been eliminated on consolidation and are not disclosed in this note. Details of transactions between the Group and other related parties are disclosed below.
Transactions with related parties
Sale of goods and services and participating shares Purchase of assets and services and other operating expenses
For the year ended 31 December 2017
For the year ended 31 December 2016
For the year ended 1 December 2017
For the year ended 31 December 2016
Entities under ownership and control of the Group’s major shareholders 279 13 115 177
Joint operation of the Group 1 2 107 169
Total 280 15 222 346
Outstanding balances with related parties
Accounts receivable Accounts payable, loans and borrowings received
At 31 December 2017 At 31 December 2016 At 31 December 2017 At 31 December 2016
Entities under ownership and control of the Group’s major shareholders – – 2 2
Joint operation of the Group – 1 9 20
Total – 1 11 22
Terms and conditions of transactions with related partiesSales to and purchases from related parties of electricity, heat energy and natural gas supply were made at prices established by the Federal Tariff Service, government regulator responsible for establishing and monitoring prices on the utility and telecommunication markets in the Russian Federation.
Compensation of key management personnelKey management personnel of the Group consists of members of the Management Board and the Board of Directors. For the year ended 31 December 2017 remuneration of key management personnel of the Group included salary and performance bonuses amounted to USD 103 million (for the year ended 31 December 2016: USD 62 million).
29. Commitments
Capital commitmentsAt 31 December 2017, contractual capital commitments amounted to USD 801 million (31 December 2016: USD 1,138 million).
Operating leasesThe land plots in the Russian Federation where the Group’s production facilities are located are owned by the state. The Group leases land through operating lease agreements, which expire in various years through 2066. According to the terms of lease agreements the rent rate is revised annually subject to the decision of the relevant local authorities. The Group entities have a renewal option at the end of the lease period and an option to buy land at any time, at a price established by the local authorities.
Future minimum lease payments due under non-cancellable operating lease agreements for land and buildings were as follows:
At 31 December 2017 At 31 December 2016
Due within one year 36 29
From one to five years 103 78
Thereafter 138 109
Total 277 216
At 31 December 2017, ten aircraft lease agreements (31 December 2016: ten) were in effect. The lease agreements have an average life of seven (31 December 2016: five) years with a renewal option at the end of the term and place no restrictions upon lessees by entering into these agreements.
Co
mp
any overview
Strategy o
verviewM
arket overview
Business o
verview
Co
rpo
rate go
vernanceInfo
rmatio
n for shareho
lders
Ap
pend
ixes
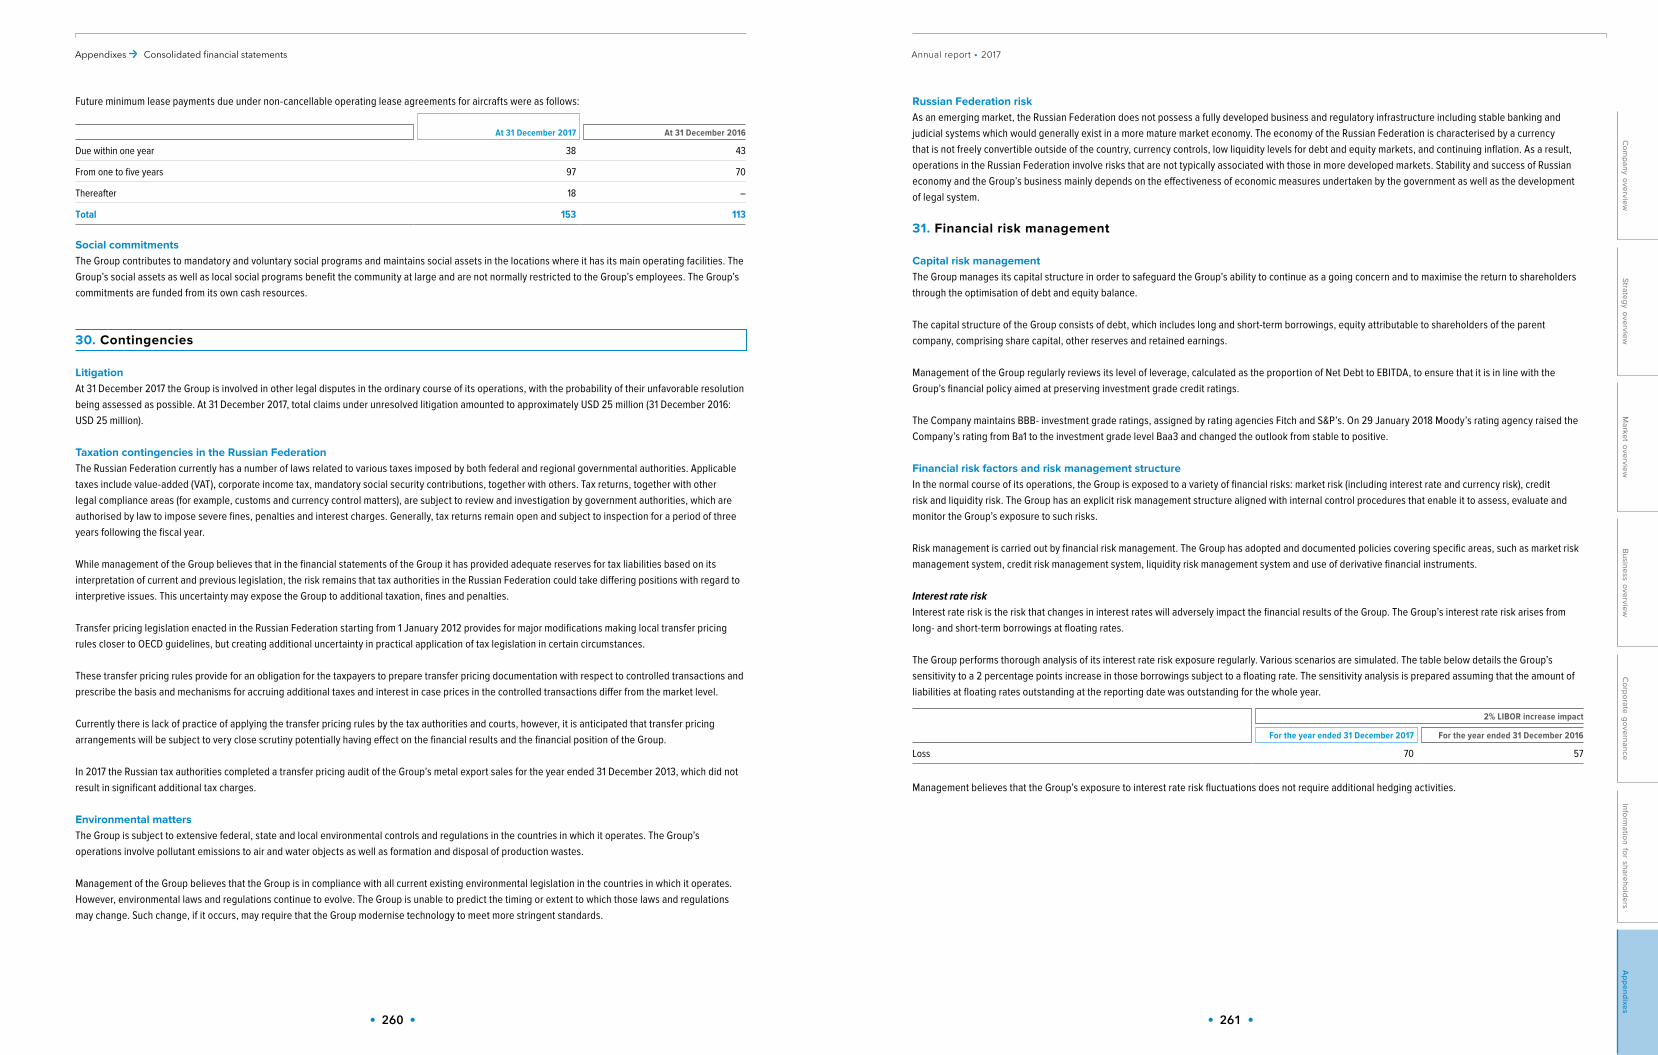
Annual report • 2017Appendixes Сonsolidated financial statements
260 261
Future minimum lease payments due under non-cancellable operating lease agreements for aircrafts were as follows:
At 31 December 2017 At 31 December 2016
Due within one year 38 43
From one to five years 97 70
Thereafter 18 –
Total 153 113
Social commitmentsThe Group contributes to mandatory and voluntary social programs and maintains social assets in the locations where it has its main operating facilities. The Group’s social assets as well as local social programs benefit the community at large and are not normally restricted to the Group’s employees. The Group’s commitments are funded from its own cash resources.
30. Contingencies
LitigationAt 31 December 2017 the Group is involved in other legal disputes in the ordinary course of its operations, with the probability of their unfavorable resolution being assessed as possible. At 31 December 2017, total claims under unresolved litigation amounted to approximately USD 25 million (31 December 2016: USD 25 million).
Taxation contingencies in the Russian FederationThe Russian Federation currently has a number of laws related to various taxes imposed by both federal and regional governmental authorities. Applicable taxes include value-added (VAT), corporate income tax, mandatory social security contributions, together with others. Tax returns, together with other legal compliance areas (for example, customs and currency control matters), are subject to review and investigation by government authorities, which are authorised by law to impose severe fines, penalties and interest charges. Generally, tax returns remain open and subject to inspection for a period of three years following the fiscal year.
While management of the Group believes that in the financial statements of the Group it has provided adequate reserves for tax liabilities based on its interpretation of current and previous legislation, the risk remains that tax authorities in the Russian Federation could take differing positions with regard to interpretive issues. This uncertainty may expose the Group to additional taxation, fines and penalties.
Transfer pricing legislation enacted in the Russian Federation starting from 1 January 2012 provides for major modifications making local transfer pricing rules closer to OECD guidelines, but creating additional uncertainty in practical application of tax legislation in certain circumstances.
These transfer pricing rules provide for an obligation for the taxpayers to prepare transfer pricing documentation with respect to controlled transactions and prescribe the basis and mechanisms for accruing additional taxes and interest in case prices in the controlled transactions differ from the market level.
Currently there is lack of practice of applying the transfer pricing rules by the tax authorities and courts, however, it is anticipated that transfer pricing arrangements will be subject to very close scrutiny potentially having effect on the financial results and the financial position of the Group.
In 2017 the Russian tax authorities completed a transfer pricing audit of the Group’s metal export sales for the year ended 31 December 2013, which did not result in significant additional tax charges.
Environmental mattersThe Group is subject to extensive federal, state and local environmental controls and regulations in the countries in which it operates. The Group’s operations involve pollutant emissions to air and water objects as well as formation and disposal of production wastes.
Management of the Group believes that the Group is in compliance with all current existing environmental legislation in the countries in which it operates. However, environmental laws and regulations continue to evolve. The Group is unable to predict the timing or extent to which those laws and regulations may change. Such change, if it occurs, may require that the Group modernise technology to meet more stringent standards.
Russian Federation riskAs an emerging market, the Russian Federation does not possess a fully developed business and regulatory infrastructure including stable banking and judicial systems which would generally exist in a more mature market economy. The economy of the Russian Federation is characterised by a currency that is not freely convertible outside of the country, currency controls, low liquidity levels for debt and equity markets, and continuing inflation. As a result, operations in the Russian Federation involve risks that are not typically associated with those in more developed markets. Stability and success of Russian economy and the Group’s business mainly depends on the effectiveness of economic measures undertaken by the government as well as the development of legal system.
31. Financial risk management
Capital risk managementThe Group manages its capital structure in order to safeguard the Group’s ability to continue as a going concern and to maximise the return to shareholders through the optimisation of debt and equity balance.
The capital structure of the Group consists of debt, which includes long and short-term borrowings, equity attributable to shareholders of the parent company, comprising share capital, other reserves and retained earnings.
Management of the Group regularly reviews its level of leverage, calculated as the proportion of Net Debt to EBITDA, to ensure that it is in line with the Group’s financial policy aimed at preserving investment grade credit ratings.
The Сompany maintains BBB- investment grade ratings, assigned by rating agencies Fitch and S&P’s. On 29 January 2018 Moody’s rating agency raised the Company’s rating from Ba1 to the investment grade level Baa3 and changed the outlook from stable to positive.
Financial risk factors and risk management structureIn the normal course of its operations, the Group is exposed to a variety of financial risks: market risk (including interest rate and currency risk), credit risk and liquidity risk. The Group has an explicit risk management structure aligned with internal control procedures that enable it to assess, evaluate and monitor the Group’s exposure to such risks.
Risk management is carried out by financial risk management. The Group has adopted and documented policies covering specific areas, such as market risk management system, credit risk management system, liquidity risk management system and use of derivative financial instruments.
Interest rate riskInterest rate risk is the risk that changes in interest rates will adversely impact the financial results of the Group. The Group’s interest rate risk arises from long- and short-term borrowings at floating rates.
The Group performs thorough analysis of its interest rate risk exposure regularly. Various scenarios are simulated. The table below details the Group’s sensitivity to a 2 percentage points increase in those borrowings subject to a floating rate. The sensitivity analysis is prepared assuming that the amount of liabilities at floating rates outstanding at the reporting date was outstanding for the whole year.
2% LIBOR increase impact
For the year ended 31 December 2017 For the year ended 31 December 2016
Loss 70 57
Management believes that the Group’s exposure to interest rate risk fluctuations does not require additional hedging activities.
Co
mp
any overview
Strategy o
verviewM
arket overview
Business o
verview
Co
rpo
rate go
vernanceInfo
rmatio
n for shareho
lders
Ap
pend
ixes

Annual report • 2017Appendixes Сonsolidated financial statements
262 263
Currency riskCurrency risk is the risk that the fair value or future cash flows of a financial instrument denominated in foreign currency will fluctuate because of changes in exchange rates.
The major part of the Group’s revenue and related trade accounts receivable are denominated in US dollars and therefore the Group is exposed primarily to USD currency risk. Foreign exchange risk arising from other currencies is assessed by management of the Group as immaterial.
The carrying amounts of monetary assets and liabilities denominated in foreign currencies other than functional currencies of the individual Group entities at 31 December 2017 and 31 December 2016 were as follows:
At 31 December 2017 At 31 December 2016
USD HKD Other currencies USD HKD Other currencies
Cash and cash equivalents 609 100 49 1,053 1,014 57
Trade and other receivables 384 – 8 163 – 7
Other assets 141 – 312 140 – 101
Total assets 1,134 100 369 1,356 1,014 165
Trade and other payables 290 – 94 263 – 74
Loans and borrowings 7,684 – 5 5,584 – –
Other liabilities 36 – 23 15 – 24
Total liabilities 8,010 – 122 5,862 – 98
Currency risk is monitored on a monthly basis utilising sensitivity analysis to assess if a risk for a potential loss is at an acceptable level. The Group calculates the financial impact of exchange rate fluctuations on USD-denominated monetary assets and liabilities in respect of the Group entities where functional currency is the Russian Rouble. The following table presents the decrease of the Group’s profit and equity before tax due to a 20% weakening of the Russian Rouble against USD.
US Dollar 20% strengthening
For the year ended 31 December 2017 For the year ended 31 December 2016
Loss 1,375 901
Given that the Group’s exposure to currency risk for the monetary assets and liabilities is offset by the revenue denominated in USD, management believes that the Group’s exposure to currency risk is acceptable. The Group does not apply hedge instruments.
Credit riskCredit risk refers to the risk that a counterparty will default on its contractual obligations resulting in a financial loss to the Group. Credit risk arises from cash and cash equivalents, bank deposits as well as credit exposures to customers, including outstanding uncollateralised trade and other receivables. The Group’s exposure to credit risk is continuously monitored and controlled.
Before dealing with a new counterparty, management assesses the creditworthiness of a potential customer or a financial institution. If the counterparty is rated by major independent credit-rating agencies, this rating is used to evaluate creditworthiness; otherwise it is evaluated using an analysis of the latest available financial statements of the counterparty and other publically available information.
The balances of ten major counterparties are presented below. The banks have a minimum of ВВ+ credit rating.
Outstanding balance
At 31 December 2017 At 31 December 2016
Cash and cash equivalents and bank deposits
Bank A 224 1,014
Bank B 143 653
Bank C 125 521
Bank D 102 381
Bank E 80 226
Total 674 2,795
Outstanding balance
At 31 December 2017 At 31 December 2016
Trade receivables
Company A 66 11
Company B 41 9
Company C 23 7
Company D 18 7
Company E 16 6
Total 164 40
The Group is not economically dependent on a limited number of customers because the majority of its products are highly liquid and traded on the world commodity markets. Metal and other sales to the Group’s customers are presented below:
For the year ended 31 December 2017 For the year ended 31 December 2016
Number of customers Turnover USD million % Number of customers Turnover USD million %
Largest customer 1 1,319 14 1 973 12
Next 9 largest customers 9 2,936 32 9 2,587 31
Total 10 4,255 46 10 3,560 43
Next 10 largest customers 10 1,494 16 10 1,154 14
Total 20 5,749 62 20 4,714 57
Remaining customers 3,397 38 3,545 43
Total 9,146 100 8,259 100
Management of the Group believes that with the exception of the bank balances indicated above there is no significant concentration of credit risk.
The following table provides information about the exposure to credit risk for cash and cash equivalents, loans, irrevocable letters of credit, bank deposits and trade and other receivables:
At 31 December 2017 At 31 December 2016
Cash and cash equivalents 852 3,325
Loans, trade and other receivables 518 355
Irrevocable letters of credit 248 101
Bank deposits 96 10
Liquidity riskLiquidity risk is the risk that the Group will not be able to settle all liabilities as they fall due.
The Group has a well-developed liquidity risk management system to exercise control over its short-, medium- and long-term funding. The Group manages liquidity risk by maintaining adequate reserves, committed and uncommitted banking facilities and reserve borrowing facilities. Management continuously monitors rolling cash flow forecasts and performs analysis of maturity profiles of financial assets and liabilities, and undertakes detailed annual and quarterly budgeting procedures.
Co
mp
any overview
Strategy o
verviewM
arket overview
Business o
verview
Co
rpo
rate go
vernanceInfo
rmatio
n for shareho
lders
Ap
pend
ixes

Annual report • 2017Appendixes Сonsolidated financial statements
264 265
The following table contains the maturity profile of the Group’s borrowings (maturity profiles for other liabilities are presented in note 26) based on contractual undiscounted payments, including interest:
At 31 December 2017
Total
Due within one month
Due from one to three months
Due from three to twelve months
Due in the second year
Due in the third year
Due in the fourth year
Due in the fifth year
Due there-after
Fixed rate bank loans and borrowings
Principal 5,586 1 1 766 6 988 1,049 1,506 1,269
Interest 1,189 – 36 239 258 257 188 106 105
6,775 1 37 1,005 264 1,245 1,237 1,612 1,374
Floating rate bank loans and borrowings
Principal 3,510 9 – 29 236 996 1,028 808 405
Interest 246 5 8 51 65 52 33 20 10
3,756 14 8 80 302 1,048 1,061 828 415
Total 10,531 15 45 1,085 566 2,293 2,298 2,440 1,789
At 31 December 2016
Total
Due within one month
Due from one to three months
Due from three to twelve months
Due in the second year
Due in the third year
Due in the fourth year
Due in the fifth year
Due there- after
Fixed rate bank loans and borrowings
Principal 4,996 – – 5 741 668 1,348 976 1,258
Interest 1,882 – 76 357 417 394 306 137 195
6,878 – 76 362 1,158 1,062 1,654 1,113 1,453
Floating rate bank loans and borrowings
Principal 2,902 11 134 431 445 556 222 609 494
Interest 419 4 18 71 83 73 63 43 64
3,321 15 152 502 528 629 285 652 558
Total 10,199 15 228 864 1,686 1,691 1,939 1,765 2,011
At 31 December 2017 the Group had available financing facilities for the management of its day to day liquidity requirements of USD 3,554 million (31 December 2016: USD 2,622 million).
32. Fair value of financial instruments
Management believes that the carrying value of financial instruments such as cash and cash equivalents (refer to note 19), short-term accounts receivable and payable approximates to their fair value.
Certain financial instruments such as other financial assets and finance leases obligations, were excluded from fair value analysis either due to their insignificance or due to the fact that assets were acquired or liabilities were assumed close to the reporting dates and management believes that their carrying value either approximates to their fair value or may not significantly differ from each other.
Financial instruments that are measured subsequent to initial recognition at fair value, grouped into Levels 1 to 3 based on the degree to which the fair value is observable as follows:• Level 1 fair value measurements are those derived from quoted prices (unadjusted) in active markets for identical assets or liabilities;• Level 2 fair value measurements are those derived from inputs other than quoted prices included within Level 1 that are observable for the assets or liability,
either directly or indirectly; and• Level 3 fair value measurements are those derived from valuation techniques that include inputs for the asset or liability that are not based on observable
market data.• The information presented below is about loans and borrowings, trade and other long-term payables, whose carrying values differ from their fair values.
At 31 December 2017 At 31 December 2016
Carrying value
Fair value Level 1 Carrying value
Fair value Level 1
Fixed rate corporate bonds 4,465 4,685 2,962 3,171
Total 4,465 4,685 2,962 3,171
Loans and borrowings, including: Carrying valueFair value
Level 2 Carrying valueFair value
Level 2
Floating rate loans and borrowings 3,484 3,439 2,872 2,734
Fixed rate loans and borrowings 1,076 1,055 1,990 2,121
Total 4,560 4,494 4,862 4,855
Carrying value Fair value
Level 2 Carrying value Fair value
Level 2
Trade and other long-term payables 402 440 523 523
Total 402 440 523 523
The fair value of financial liabilities presented in table above is determined as follows:• the fair value of corporate bonds was determined based on market quotations existing at the reporting dates; • the fair value of floating rate and fixed rate loans and borrowings at 31 December 2017 was calculated based on the present value of future cash flows
(principal and interest), discounted at the best management estimation of market rates, taking into consideration currency of the loan, expected maturity and risks attributable to the Group existing at the reporting date;
• the fair value of trade and other long-term payables at 31 December 2017 was calculated based on the present value of future cash flows, discounted at the best management estimation of market rates.
33. Investments in significant subsidiaries and associates
Subsidiaries by business segments
Country
Nature of business
Effective % held
At 31 December 2017 At 31 December 2016
Group GMK
JSC “Norilsky Kombinat” Russian Federation Rental of equipment 100 100
JSC “Taimyrgaz” Russian Federation Gas extraction 100 100
JSC “Norilskgazprom” Russian Federation Gas extraction 100 100
JSC “Taimyrenergo” Russian Federation Rental of equipment 100 100
JSC “NTEK” Russian FederationElectricity production and distribution 100 100
LLC “ZSC” Russian Federation Construction 100 100
LLC “Norilsknickelremont” Russian Federation Repairs 100 100
LLC “Norilskgeologiya” Russian Federation Geological works 100 100
LLC “Norilskyi obespechivaushyi complex” Russian Federation Production of spare parts 100 100
Group KGMK
JSC “Kolskaya GMK” Russian Federation Mining and Metallurgy 100 100
LLC “Pechengastroy” Russian Federation Repairs 100 100
Norilsk Nickel Harjavalta
Norilsk Nickel Harjavalta OY Finland Metallurgy 100 100
Other metallurgical
LLC “GRK “Bystrinskoye” Russian Federation Mining 50.01 89.33
Co
mp
any overview
Strategy o
verviewM
arket overview
Business o
verview
Co
rpo
rate go
vernanceInfo
rmatio
n for shareho
lders
Ap
pend
ixes

Annual report • 2017Appendixes Сonsolidated financial statements
266 267
Subsidiaries by business segments
Country
Nature of business
Effective % held
At 31 December 2017 At 31 December 2016
Other non-metallurgical
Metal Trade Overseas A.G. Switzerland Distribution 100 100
LLC “Institut Gypronickel” Russian Federation Research 100 100
JSC “TTK” Russian Federation Supplier of fuel 100 100
JSC “Enisey River Shipping Company” Russian Federation River shipping operations 100 100
LLC “Aeroport Norilsk” Russian Federation Airport 100 100
JSC “AK “NordStar” Russian Federation Aircompany 100 100
Joint operations by business segments
Country
Nature of business
Effective % held
At 31 December 2017 At 31 December 2016
Other metallurgical
Nkomati Nickel Mine Republic of South Africa Mining 50 50
34. Events subsequent to the reporting date
In January 2018 the Company borrowed the second tranche in the amount of USD 1,100 million under the USD 2,500 million syndicated loan, signed in December 2017 with the syndicate of international financial institutions. The existing facility has been fully drawn down.
In January 2018 the Company made an early repayment of USD 120 million under the bilateral credit facility with JSC “Nordea Bank” with the total credit limit of USD 220 million.
In February 2018 the Group signed metal sales agreement with Societe Generale under terms of USD 300 million prepayment.
During January and February 2018 the Company signed two confirmed credit lines with PJSC VTB Bank and JSC Gasprombank in the amount of RUB 30 billion and RUB 20 billion accordingly and an unconfirmed credit line facility with JSC Gasprombank in the amount of RUB 20 billion. At the publication date there was no draw-down under these facilities.
The Group Structure: main assets1
Mining and Metallurgical assets
Geological exploration assets
Energy assets
Transport assets
Research assets
Supporting business
Sales nd distribution assets
Polar DivisionNorilskgeologiya (100% stake) Norilskenergo Division PolarTransport Division
Institut Gypronickel (100% stake)
Norilskyi obespechivaushyi complex (100% stake)
NORMETIMPEX (100% stake)
Medvezhy Ruchey (100% stake)
Vostokgeologiya (100% stake)
Taimyrenergo (100% stake)
Murmansk Transport Division
ZSC (100% stake)
Metal Trade Overseas A. G. (Switzerland, 100% stake)
Kola MMC (100% stake)
NTEK (100% stake)
Arkhangelsk Transport Division
Norilsknickelremont (100% stake)
Norilsk Nickel Europe Limited (UK, 100% stake)
GRK “Bystrinskoye (50.01% stake)
Norilskgazprom (100% stake)
Krasnoyarsk Transport Division
Pechengastroy (100% stake)
Norilsk Nickel Asia (Hong Kong, 100% stake)
Norilsk Nickel Harjavalta (Finland, 100% stake)
Taimyrgaz (100% stake)
Bystrinsky Transport Division
Nornickel — Shared Services Centre (100% stake)
Norilsk Nickel USA Inc. (USA, 100% stake)
Nkomati Nickel Mine (SA, 50% stake)
TTK (100% stake)
Yenisey River Shipping Company (81,99% stake)
Norilsk Nickel Marketing (China, 100% stake)
Norilsktransgaz (100% stake)
Krasnoyarsk River Port (88,77% stake)
Arctic-Energo (100% stake)
Lesosibirsk Port (51% stake)
Norilsk Airport (100% stake)
NordStar Airlines (100% stake)
Norilsk Avia (100% stake)
1 Ownership in subsidiaries are indicated from the authorized capital
Co
mp
any overview
Strategy o
verviewM
arket overview
Business o
verview
Co
rpo
rate go
vernanceInfo
rmatio
n for shareho
lders
Ap
pend
ixes

268 269
Annual report • 2017
Co
mp
any overview
Strategy o
verviewM
arket overview
Business o
verview
Co
rpo
rate go
vernanceInfo
rmatio
n for shareho
lders
Ap
pend
ixes
Appendixes History of production indicators
History of production indicators Norilsk nickel Group saleable metals production
2008
2009
2010
2011
2012
2013
2014
2015
2016
2017
TOTAL METAL PRODUCTION
Nickel, t, 297,943 279,889 295,840 295,098 300,340 285,292 274,248 266,406 235,749 217,112
thereof from own Russian feed 230,550 232,813 235,518 234,906 223,153 219,273 223,224 220,675 196,809 210,131
thereof from 3d parties feed 67,393 47,076 60,322 60,192 77,187 66,019 51,024 45,731 38,940 6,981
Copper, t, 417,861 400,778 388,027 377,944 363,764 371,063 368,008 369,426 360,217 401,081
thereof from own Russian feed 400,344 382,443 365,698 362,854 344,226 345,737 345,897 352,766 344,482 397,774
thereof from 3d parties feed 17,517 18,335 22,329 15,090 19,538 25,326 22,111 16,660 15,735 3,307
Palladium, koz 2,807 2,794 2,855 2,806 2,732 2,662 2,752 2,689 2,618 2,780
thereof from own Russian feed 2,701 2,676 2,723 2,704 2,624 2,529 2,582 2,575 2,526 2,728
thereof from 3d parties feed 106 118 132 102 108 133 170 114 92 52
Platinum, koz 656 658 692 696 683 650 662 656 644 670
thereof from own Russian feed 632 636 663 672 658 604 595 610 610 650
thereof from 3d parties feed 24 22 29 24 25 46 67 46 34 20
Polar division and Kola MMC (Russia)
Nickel, t 232,302 232,813 235,518 237,227 233,632 231,798 228,438 222,016 182,095 157,396
Polar division 122,000 124,250 124,200 124,000 124,000 122,700 122,390 96,916 50,860 0
Kola MMC 110,302 108,563 111,318 113,227 109,632 109,098 106,048 125,100 131,235 157,396
thereof from own Russian feed 108,550 108,563 111,318 110,906 99,153 96,573 100,834 123,335 126,937 155,110
thereof from 3d parties feed 1,752 0 0 2,321 10,479 12,525 5,214 1,765 4,298 2 286
Copper, t 400,344 382,443 365,698 363,460 352,466 359,102 354,943 355,707 350,619 387,640
Polar division 338,511 323,705 309,320 303,940 295,610 296,760 297,552 292,632 280,347 306,859
Kola MMC 61,833 58,738 56,378 59,520 56,856 62,342 57,391 63,075 70,272 80,781
thereof from own Russian feed 61,833 58,738 56,378 58,914 48,616 48,977 48,345 60,134 63,542 78,586
thereof from 3d parties feed 0 0 0 606 8,240 13,365 9,046 2,941 6,730 2,195
Palladium, koz 2,701 2,676 2,723 2,704 2,628 2,580 2,660 2,606 2,554 2,738
Polar division 2,054 2,010 2,053 2,038 1,989 2,006 2,065 1,935 1,703 956
Kola MMC 647 666 670 666 639 574 595 671 851 1,782
thereof from own Russian feed 647 666 670 666 635 523 517 640 815 1,731
thereof from 3d parties feed 0 0 0 0 4 51 78 31 36 45
Norilsk nickel Group saleable metals production
2008
2009
2010
2011
2012
2013
2014
2015
2016
2017
Platinum, koz 632 636 663 672 660 627 627 622 622 660
Polar division 509 505 529 536 529 504 500 488 449 259
Kola MMC 123 131 134 136 131 123 127 134 173 401
thereof from own Russian feed 123 131 134 136 129 100 95 122 159 385
thereof from 3d parties feed 0 0 0 0 2 23 32 12 14 16
Norilsk Nickel Harjavalta (Finland)
Nickel, t, 29,344 28,452 49,159 48,525 45,518 44,252 42,603 43,479 53,654 59,716
thereof from own Russian feed 0 0 0 0 0 0 0 424 19,012 55,021
Copper, t, 4,220 4,983 11,279 5,681 1,006 6,549 10,629 13,048 9,598 13,441
thereof from own Russian feed 0 0 0 0 0 0 0 0 593 12,329
Palladium, koz 11 18 48 34 21 39 74 78 64 42
thereof from own Russian feed 0 0 0 0 0 0 0 0 8 35
Platinum, koz 5 5 15 12 9 16 31 33 22 10
thereof from own Russian feed 0 0 0 0 0 0 0 0 2 6
Norilsk Nickel Australia (Australia)
Nickel, t 15,528 1,223 0 0 8,975 2,826 0 0 0 0
Norilsk Nickel Tati (Botswana) 1
Nickel, t 20,769 17,401 11,163 9,346 12,215 6,416 3,207 911 0 0
Copper, t 13,297 13,352 11,050 8,803 10,292 5,412 2,436 671 0 0
Palladium, koz 95 100 84 68 83 43 18 5 0 0
Platinum, koz 19 17 14 12 14 7 4 1 0 0
Norilsk Nickel Nkomati (South Africa) 2
Nickel, t 2,642 3,005 5,528 5,815 9,624 11,920 11,359 11,350 8,486 8,006
Copper, t 1,347 1,436 3,082 2,927 4,594 5,034 4,938 5,301 4,007 4,504
Palladium, koz 13 11 23 24 32 46 48 53 40 46
Platinum, koz 5 3 7 9 12 20 19 20 15 20
1 The sale of the asset was closed on April 2, 2015.2 Metal in concentrate for sale assuming 50% ownership. Nkomati’s performance is reflected in financial results using proportional consolidation according
to our stake and not reflected in other totals.

270 271
Annual report • 2017
Co
mp
any overview
Strategy o
verviewM
arket overview
Business o
verview
Co
rpo
rate go
vernanceInfo
rmatio
n for shareho
lders
Ap
pend
ixes
Appendixes Minerals reserves and resources
Minerals reserves and resources
Region, deposit, ore type
Ore kt
Metal grade Contained metal
Ni %
Cu %
Pd g/t
Pt g/t
Au g/t
6 PGM g/t
Ni kt
Cu kt
Pd koz
Pt koz
Au koz
6 PGM koz
TOTAL RUSSIAN ASSETS AS AT 31.12.2017
Total proven and probable reserves 815,233 0.87 1.53 3.60 0.96 0.21 4.77 7,105 12,433 94,383 25,044 5,474 125,029
Total measured and indicated resources 2,047,304 0.70 1.16 3.00 0.85 0.18 4.03 14,271 23,766 197,416 55,829 11,853 265,113
Total inferred resources 583,144 0.81 1.41 3.25 0.84 0.19 4.27 4,725 8,217 60,836 15,761 3,637 79,865
AUSTRALIA (NORILSK NICKEL CAWSE)
Honeymoon Well (nickel sulfide ores)
Measured and indicated resources
173,300 0.68 0 0 0 0 0 1,180 0 0 0 0 0
Inferred resources 11,900 0.68 0 0 0 0 0 81 0 0 0 0 0
Honeymoon Well (nickel laterite ores)
Inferred resources 339,000 0.81 0 0 0 0 0 2,746 0 0 0 0 0
TOTAL RUSSIAN AND FOREIGN ASSETS AS AT 31.12.2017
Total proven and probable reserves 815,233 – – – – – – 7,105 12,433 94,383 25,044 5,474 125,029
Total measured and indicated resources 2,220,604 – – – – – – 15,451 23,766 197,416 55,829 11,853 265,113
Total inferred resources 934,044 – – – – – – 7,552 8,217 60,836 15,761 3,637 79,865
Region, ore type
Ore kt
Metal grade Contained metal
Ni %
Cu %
Co %
4 PGM g/t
Ni kt
Cu kt
Co kt
4 PGM koz
SOUTH AFRICA (NORILSK NICKEL NKOMATI) AS AT 30.06.2017
Proven and probable reserves 88,640 0.31 0.11 0.02 0.88 275 97 24 2,509
Measured and indicated resources 182,410 0.35 0.14 0.02 0.95 641 251 36 5,566
Inferred resources 46,350 0.40 0.13 0.00 0.97 185 61 0 1,446
Notes:1. Data regarding the mineral resources and ore reserves of the deposits of the Taimyr and Kola peninsulas were classified according to the Australasian Code for Reporting
of Mineral Resources and Ore Reserves (JORC code), created by the Australasian Institute of Mining and Metallurgy, the Australian Institute of Geoscientists, and the Minerals Council of Australia, subject to the terminology recommended by the Russian Code for Public Reporting of Exploration Results, Mineral Resources, Mineral Reserves (NAEN Code).
2. Data regarding the reserves and resources is based on the balance-sheet reserves of A, B, С1 and С2, categories (according to the terminology of the State Committee for Mineral Reserves) as of the end of the given calendar year.
3. Figures given as “Total” may differ from the sum of individual numbers due to rounding. Certain values may in some instances vary slightly from previously published values.
4. The six platinum group metals (PGMs) are platinum, palladium, rhodium, ruthenium, osmium, and iridium. The 4PGMs are rhodium, ruthenium, osmium, and iridium. Hereafter in the annual report, troy ounces are used as a weight measure for PGMS and gold.
5. Proven and probable ore reserves are included in mineral resources.6. Ore losses applied ranged from 1.6 % to 26% and dilution from 6% to 31.9%.7. Excluding fields in Zabaykalsky Krai.8. The Company owns 50% of Nkomati, a nickel mine developed jointly with African Rainbow Minerals. Nkomati’s performance is reflected in financial results using
proportional consolidation according to our stake and not reflected in other totals.
Region, deposit, ore type
Ore kt
Metal grade Contained metal
Ni %
Cu %
Pd g/t
Pt g/t
Au g/t
6 PGM g/t
Ni kt
Cu kt
Pd koz
Pt koz
Au koz
6 PGM koz
TAIMYR PENINSULA
Proven and probable reserves 689,980 0.92 1.75 4.25 1.13 0.24 5.54 6,375 12,074 94,260 24,956 5,432 124,810
Proven reserves
Talnakh ore field, including: 331,796 0.78 1.56 3.91 1.04 0.22 5.15 2,573 5,162 41,751 11,095 2,319 54,951
Rich 48,376 2.53 3.14 6.57 1.26 0.20 8.15 1,225 1,517 10,221 1,962 309 12,675
Cuprous 22,584 0.98 3.98 9.52 2.30 0.51 11.95 ,221 899 6,912 1,667 369 8,675
Disseminated 260,836 0.43 1.05 2.94 0.89 0.20 4.01 1,127 2,746 24,618 7,466 1,641 33,601
Norilsk-1 deposit (disseminated ore) 22,353 0.35 0.51 3.97 1.60 0.17 5.91 78 113 2,856 1,149 126 4,215
Probable reserves
Talnakh ore field 313,942 1.17 2.14 4.62 1.14 0.28 6.06 3,662 6,719 46,628 11,493 2,852 61,173
Rich 84,821 2.88 3.90 6.88 1.42 0.28 8.87 2,439 3,307 18,764 3,865 761 24,175
Cuprous 58,188 0.76 3.28 7.25 1.88 0.58 9.33 441 1,910 13,562 3,519 1,094 17,460
Disseminated 170,933 0.46 0.88 2.60 0.75 0.18 3.56 782 1,502 14,302 4,109 997 19,538
Norilsk-1 deposit (disseminated ore) 21,889 0.28 0.37 4.30 1.73 0.19 6.35 62 80 3,025 1,219 135 4,471
Measured and indicated resources 1,714,381 0.70 1.32 3.57 1.01 0.21 4.79 11,985 22,660 196,919 55,507 11,673 264,234
Talnakh ore field 1,566,469 0.74 1.41 3.56 0.97 0.22 4.73 11,545 22,096 179,339 48,652 10,942 238,382
Rich 115,466 3.23 3.90 7.96 1.60 0.29 10.12 3,733 4,917 29,537 5,939 1,092 37,550
Cuprous 68,345 1.00 4.24 9.61 2.43 0.69 12.27 685 2,898 21,116 5,349 1,510 26,957
Disseminated 1,382,658 0.52 1.03 2.89 0.84 0.19 3.91 7,127 14,281 128,686 37,364 8,340 173,875
Norilsk-1 deposit (disseminated ore) 147,912 0.30 0.38 3.70 1.44 0.15 5.44 440 564 17,580 6,855 731 25,852
Inferred resources 445,642 0.86 1.75 4.24 1.10 0.25 5.57 3,852 7,786 60,658 15,642 3,580 79,553
Talnakh ore field 444,574 0.87 1.75 4.24 1.09 0.25 5.57 3,850 7,783 60,531 15,592 3,576 79,286
Norilsk-1 deposit 1,068 0.23 0.32 3.69 1.46 0.13 7.78 2 3 127 50 4 267
KOLA PENINSULA (DISSEMINATED ORE)
Proven and probable reserves 125,253 0.58 0.29 0.02 0.03 0.01 0.05 730 359 123 88 42 219
Proven reserves 50,127 0.57 0.24 0.02 0.03 0.01 0.05 285 122 46 34 14 81
Probable reserves 75,126 0.59 0.32 0.02 0.03 0.01 0.06 445 237 77 54 28 138
Measured and indicated resources 332,923 0.69 0.33 0.03 0.05 0.02 0.08 2,286 1,106 497 322 180 879
Inferred resources 137,502 0.63 0.31 0.03 0.04 0.01 0.07 873 431 178 119 57 312

272 273
Annual report • 2017
Co
mp
any overview
Strategy o
verviewM
arket overview
Business o
verview
Co
rpo
rate go
vernanceInfo
rmatio
n for shareho
lders
Ap
pend
ixes
Appendixes Report on compliance with the principles and recommendations set forth in the corporate governance code
№
Corporate governance principles
Compliance assessment criteria
Compliance status2
Explanation of non-compliance3
1.1.3 In the lead-up to, and during, the general meeting, shareholders had timely and unrestricted access to the information about, and materials for, the meeting and had an opportunity to put questions to the company’s executive bodies and directors and communicate with each other.
1. In the reporting period, shareholders had an opportunity to put questions to the company’s executive bodies and directors before and during the annual general meeting.
2. The directors’ opinion (including dissenting opinions incorporated in the minutes) on each item on the agenda of the general meetings held in the reporting period was included in the materials for the respective general meeting.
3. The company provided the entitled shareholders with access to the list of persons who have the right to participate in the general meeting, starting from the date when such list was received by the company, for each general meeting held in the reporting period.
Compliant
1.1.4 No unnecessary difficulties prevented shareholders from exercising their rights to convene a general meeting, nominate candidates to executive bodies and propose items for the agenda of the general meeting.
1. In the reporting period, shareholders were able to propose items for the agenda of the annual general meeting during at least 60 days after the end of the relevant calendar year.
2. In the reporting period, the company did not decline proposals for the agenda or nominations for executive bodies for the reason of misprints or other minor faults in the shareholder’s proposal.
Compliant
1.1.5 Each shareholder had an unrestricted opportunity to exercise their voting right in the simplest and most convenient manner.
1. An internal document (corporate policy) of the company contains provisions enabling each shareholder present at the general meeting to request, before the end of such meeting, a copy of their voting ballot certified by the counting board.
Compliant
1.1.6 The procedure established by the company gives every shareholder present at the general meeting equal opportunities to express their opinions and ask questions.
1. When general meetings of shareholders in the reporting period were held as physical meetings (requiring joint attendance of shareholders), sufficient time was provided to report on, and discuss, items on the agenda.
2. Nominees to the company’s executive and control bodies were available for shareholders’ questions at the same general meeting at which such nominees were put to vote.
3. When deciding on the format of, and procedures for, the general meetings of shareholders, the board of directors considered the use of telecommunication channels to enable shareholders to remotely participate in general meetings held in the reporting period.
Partly compliant The Company is partly compliant with Criterion 2. In accordance with the Regulations on the General Meeting of Shareholders of MMC Norilsk Nickel approved by the General Meeting of Shareholders (Minutes No. 1 of 6 June 2014), nominees to the Board of Directors and the Audit Commission are invited to the meeting. Most nominees are present at the meeting. Questions are made in writing, and answers are sent to shareholders.
1.2 Shareholders are given an equal and fair opportunity to have a share in the company’s profits by receiving dividends.
1.2.1 The company developed and introduced a transparent and clear procedure to determine the amount of, and pay out, dividends.
1. The company has developed and disclosed its dividend policy approved by the board of directors.
2. If the dividend policy provides for the company’s performance indicators to be used in the calculation of dividends, relevant provisions of the dividend policy require the use of consolidated financial statements.
Compliant
Report on compliance with the principles and recommendations set forth in the corporate governance codeThis report on compliance with the principles and recommendations set forth in the Corporate Governance Code was reviewed by the Board of Directors of MMC Norilsk Nickel at the meeting held on May 24,2018 Munutes No. GMK/18-pr-bd.
The Board of Directors confirms that information in this report is a true and accurate reflection of the Company’s compliance with the principles and recommendations set forth in the Corporate Governance Code in 20171.
№
Corporate governance principles
Compliance assessment criteria
Compliance status2
Explanation of non-compliance3
1.1 The company shall ensure equitable and fair treatment of every shareholder exercising their rights of participation in managing the company.
1.1.1 The company provides its shareholders with maximum opportunities to participate in the general meeting, make grounded decisions, coordinate activities, and express opinions regarding items on the agenda of the general meeting.
1. Everyone has free access to an internal document that was approved by the general meeting of shareholders and sets out the procedure for holding such meetings.
2. The company provides its shareholders with multiple communication channels, including hotline, email and online forum, to express opinions and make questions about the agenda during the preparation for the general meeting. These channels were established in the lead-up to each general meeting held in the reporting period.
Compliant
1.1.2 The procedure for notifying shareholders of, and providing them with materials for, the general meeting enables shareholders to duly prepare for the same.
1. The notice of the general meeting of shareholders is published on the corporate website at least 30 days prior to the date of the meeting.
2. The notice of the general meeting of shareholders specifies the place of the meeting and documents required for access to the venue.
3. Shareholders are given access to the information about those who proposed the agenda and those who nominated candidates to the company’s board of directors and audit commission.
Compliant

274 275
Annual report • 2017
Co
mp
any overview
Strategy o
verviewM
arket overview
Business o
verview
Co
rpo
rate go
vernanceInfo
rmatio
n for shareho
lders
Ap
pend
ixes
Appendixes Report on compliance with the principles and recommendations set forth in the corporate governance code
№
Corporate governance principles
Compliance assessment criteria
Compliance status2
Explanation of non-compliance3
2.1 The board of directors is responsible for strategic management, defines key principles of, and approaches to, risk management and internal controls, exercises control over the company’s executive bodies, and performs other key functions.
2.1.1 The board of directors is responsible for making decisions on the appointment and dismissal of the company’s executives, including appointments and dismissals on the grounds of misconduct. The board of directors also supervises activities of executive bodies and ensures that they are compliant with the approved development strategy across core business lines of the company.
1. Powers that the board of directors has in respect of appointment and dismissal of, and terms of labour contracts with, the company’s executives are clearly defined in the charter.
2. The board of directors considered a report (reports) by the company’s sole executive body and collegial executive body on progress in the company’s strategy.
Partly compliant The Company is partly compliant with Criterion 1. According to the Company’s Charter, appointment of the President and termination of their powers require approval of the General Meeting of ShareholdersThe Company is partly compliant with Criterion 2.In the reporting period, the Board of Directors regularly considered reports of the Management Board on the Company’s most important lines of operations. In the lead-up to the Annual General Meeting of Shareholders, the Board of Directors also pre-approved a report (as part of the Annual Report) made by the President and Chairman of the Management Board on the Company’s performance.
2.1.2 The board of directors sets key long-term objectives, estimates and approves key performance indicators and business goals, assesses and approves the strategy and business plans for the company’s key lines of business.
1. In the reporting period, the board of directors reviewed matters related to implementing and updating the strategy, approving the financial plan (budget), and analysing performance criteria and indicators (including interim indicators) for the strategy and business plans of the company.
Compliant
2.1.3 The board of directors determines risk management and internal control principles and approaches of the company.
1. The board of directors defined principles of, and approaches to, the risk management and internal control framework in the company.
2. The board of directors assessed the risk management and internal control framework of the company during the reporting period.
Partly compliant The Company is partly compliant with Criterion 2.In the reporting period, the Audit Committee reviewed results of internal control tests carried out by an external auditor (KPMG). Results are presented in the Annual Report. In 2018, the Internal Audit Department plans to conduct a comprehensive assessment of the risk management and internal control framework and its performance, and submit the results to the Audit and Sustainable Development Committee for review.
№
Corporate governance principles
Compliance assessment criteria
Compliance status2
Explanation of non-compliance3
1.2.2 The company does not decide to pay dividends if, meeting formal requirements set out in the applicable laws, such decision is not economically feasible and can be misleading about the company’s financial performance.
1. The dividend policy of the company sets out clear instructions as to financial/economic circumstances when dividends should not be paid.
Compliant
1.2.3 The company ensures no deterioration of the dividend rights of its existing shareholders.
1. In the reporting period, the company made no steps that could result in any deterioration of the dividend rights of its existing shareholders.
Compliant
1.2.4 The company strives to rule out the possibility of shareholders receiving any income (profit) from the company other than dividends and liquidation value.
1. In order to rule out the possibility of shareholders receiving any income (profit) from the company other than dividends and liquidation value, internal documents introduce controls enabling the company to timely identify and properly approve transactions with persons affiliated with (related to) substantial shareholders (persons authorised to exercise voting rights granted by voting shares) when such transactions are not formally recognised as related-party transactions by the applicable law.
Compliant
1.3 Principles and practices of corporate governance in the company provide for equal conditions for all holders of the same category (type) of shares, including minority shareholders and foreign shareholders, and their equal treatment by the company.
1.3.1 The company has arranged for fair treatment of each shareholder by its executive and control bodies, including zero tolerance for abuse of rights by majority shareholders against minority shareholders.
1. In the reporting period, procedures to resolve potential conflicts of interest between substantial shareholders were effective, and the board of directors paid due attention to shareholder conflicts, if any.
Compliant
1.3.2 The company refrains from any actions that will or may result in artificial redistribution of corporate control.
1. Quasi-treasury shares did not exist or did not take part in voting procedures in the reporting period.
Compliant
1.4 Shareholders have reliable and effective ways to register their rights to shares and an opportunity to dispose of such shares freely and easily.
1.4.1 Shareholders have reliable and effective ways to register their rights to shares and an opportunity to dispose of such shares freely and easily.
1. The company and its shareholders are satisfied with the efficiency and reliability of securities register keeping activities of the company’s registrar.
Compliant

276 277
Annual report • 2017
Co
mp
any overview
Strategy o
verviewM
arket overview
Business o
verview
Co
rpo
rate go
vernanceInfo
rmatio
n for shareho
lders
Ap
pend
ixes
Appendixes Report on compliance with the principles and recommendations set forth in the corporate governance code
№
Corporate governance principles
Compliance assessment criteria
Compliance status2
Explanation of non-compliance3
2.3 The board of directors is an efficient and competent management body capable of making fair and independent judgements and decisions in line with the interests of the company and its shareholders.
2.3.1 The board of directors is composed solely of persons with an impeccable business and personal track record; directors have sufficient skills, expertise and experience to make decisions falling within the board’s remit and perform their responsibilities efficiently.
1. The procedure used in the company to assess performance of the board of directors includes assessment of professional qualifications of individual directors.
2. In the reporting period, the board of directors (or its nomination committee) assessed the board of directors’ nominees for the necessary experience, knowledge, business reputation, potential conflicts of interests, etc.
Compliant
2.3.2 Directors are elected in a transparent manner that provides shareholders with sufficient information on nominees to get a clear idea of their personal and professional skills.
1. At each general meeting of shareholders held in the reporting period and voting on nominees for the board of directors, the company provided shareholders with biographies of all nominees to the board of directors, results of their assessment performed by the board of directors (or its nomination committee), and information about the nominees’ compliance with independence criteria in accordance with Recommendations 102–107 of the Code, and written consents of the nominees to be elected to the board of directors.
Compliant
2.3.3 The board of directors is well balanced in terms of qualifications, experience, knowledge and business skills of its members, and is trusted by the company’s shareholders.
1. As part of the performance assessment of the board of directors in the reporting period, the board of directors analysed its needs for professional and business skills and experience.
Compliant
2.3.4 The number of directors on the board of directors makes it possible to organise its activities in the most efficient manner and form committees, and enables substantial minority shareholders to elect a director for whom they vote.
1. As part of the performance assessment of the board of directors in the reporting period, the board of directors analysed whether the number of directors is sufficient to meet the company’s goals and objectives and interests of the shareholders.
Compliant
2.4 The board of directors has a sufficient number of independent directors.
2.4.1 An independent director is a person with professional expertise, experience and independence sufficient to have their own opinions and make fair and unbiased judgements that are not influenced by the company’s executive bodies, shareholder groups, or other stakeholders. Nominees (elected director) related to the company, any of its substantial shareholders, counterparties or competitors or the government are not normally considered an independent director.
1. In the reporting period, all independent directors met all independence criteria specified in Recommendations 102–107 of the Code and were recognised as independent by the board of directors.
Compliant
№
Corporate governance principles
Compliance assessment criteria
Compliance status2
Explanation of non-compliance3
2.1.4 The board of directors defines a policy on remuneration and/or reimbursements (compensations) due to directors, executives, and other key managers of the company.
1. The board of directors approved and put into action a policy (policies) on remuneration and reimbursements (compensations) due to directors, executives, and other key managers of the company.
2. In the reporting period, the board of directors considered matters related to the above policy (policies) in its meetings.
Partly compliant The Company is partly compliant with Criterion 1. The Board of Directors approved and put into action the Remuneration Policy for Members of Board of Directors of MMC Norilsk Nickel. Principles and mechanics of remunerations (reimbursements) due to executives are set out in the Charter, Regulations on the Management Board, and other internal documents of the Company. The system (policy) of remunerations applicable in the Company is continuously and directly monitored by the Board of Directors.Responsibilities of the Corporate Governance, Nomination and Remuneration Committee include development, supervision over adoption, implementation and regular revision of the remuneration policy for the Company’s Board of Directors and Management Board and the Company’s President.The Company is partly compliant with Criterion 2.In the reporting period, the Board of Directors regularly reviewed matters related to the remuneration policy for the top management, including its updates, improvement, control over implementation and performance assessment.
2.1.5 The board of directors plays a key role in preventing, identifying and settling internal conflicts among the company’s bodies, shareholders and employees.
1. The board of directors plays a key role in preventing, identifying and settling internal conflicts.
2. The company introduced procedures to identify, and measures to settle, conflicts of interest.
Compliant
2.1.6 The board of directors plays a key role in ensuring transparency of the company’s operations, timely and accurate disclosures, and free access to the company’s documents by shareholders.
1. The board of directors approved an information policy regulation.
2. The company appointed persons responsible for putting the information policy into action.
Compliant
2.1.7 The board of directors supervises corporate governance practices and plays a key role in material corporate events.
1. In the reporting period, the board of directors considered the matter of corporate governance at the company.
Compliant
2.2 The board of directors is accountable to the company’s shareholders.
2.2.1 Information about the activities of the board of directors is disclosed to shareholders.
1. The company’s annual report includes information about attendance at the meetings of the board of directors and its committees in the reporting period.
2. The annual report contains information about key results of the board of directors’ assessment in the reporting period.
Compliant
2.2.2 The chairman of the board of directors is available to the company’s shareholders
1. The company established a transparent procedure for shareholders to contact the chairman of the board of directors with questions and to express their opinions.
Compliant

278 279
Annual report • 2017
Co
mp
any overview
Strategy o
verviewM
arket overview
Business o
verview
Co
rpo
rate go
vernanceInfo
rmatio
n for shareho
lders
Ap
pend
ixes
Appendixes Report on compliance with the principles and recommendations set forth in the corporate governance code
№
Corporate governance principles
Compliance assessment criteria
Compliance status2
Explanation of non-compliance3
2.6 Directors are sufficiently informed and act reasonably and in good faith in the interests of the company and its shareholders, prudently and with due care.
2.6.1 Directors of the company make decisions on the basis of all available information, subject to no conflict of interest, equal treatment of shareholders and usual business risk.
1. Internal documents of the company require that any director informs the board of directors if a conflict of interest arises with regard to any item on the agenda of the board of directors or its committee before discussion of such item begins.
2. Internal documents of the company require that a director who has a conflict of interest refrains from voting on the respective item.
3. The company has an established procedure for the board of directors to seek professional advice on the matters within its remit at the company’s expense.
Compliant
2.6.2 Rights and obligations of the directors are clearly set out in internal documents of the company.
1. The company approved and published an internal document clearly defining the directors’ rights and obligations.
Compliant
2.6.3 Directors are given sufficient time to perform their duties.
1. Individual attendance at the meeting of the board of directors and committees and time spent to prepare for such meetings were taken into account in the board of directors’ performance assessment during the reporting period.
2. In accordance with internal documents of the company, directors must inform the board of directors of their decision to be appointed to management bodies of other organisations (except for subsidiaries and affiliates of the company) and of such appointments.
Compliant
2.6.4 All directors have equal access to the documents and data of the company. Newly elected directors are provided with sufficient information about the company and activities of the board of directors within the shortest time possible.
1. In accordance with internal documents of the company, directors have the right to access documents and make request regarding the company and its subsidiaries, and executive bodies of the company must provide such information and documents.
2. The company has an established induction procedure for newly elected directors.
Compliant
2.7 Preparations for, and attendance at, the meetings of the board of directors ensure efficient operations of the board of directors.
2.7.1 Meetings of the board of directors are held when necessary, subject to the scale of operations and goals of the company in a certain period of time.
1. The board of directors held at least six meetings during the reporting period.
Compliant
№
Corporate governance principles
Compliance assessment criteria
Compliance status2
Explanation of non-compliance3
2.4.2 Nominees for the board of directors are assessed for compliance with independence criteria; compliance of the current independent directors is reviewed on a regular basis. Substance of such assessment should prevail over form.
1. In the reporting period, the board of directors (or its nomination committee) formed an opinion about the independence of each nominee to the board of directors and presented it to the company’s shareholders.
2. At least once in the reporting period, the board of directors (or its nomination committee) assessed independence of the current directors who were identified as independent in the annual report.
3. The company developed measures to be taken by directors who cease to be independent, including obligations to timely inform the board of directors of such change in their status.
Partly compliant The Company is partly compliant with Criterion 2.In the lead-up to the Annual General Meeting of Shareholders in April 2017, the Corporate Governance, Nomination and Remuneration Committee of MMC Norilsk Nickel’s Board of Directors reviewed the compliance of nominees to the Board of Directors with independence criteria. The current directors on the Board were elected during the Annual General Meeting on 9 June 2017. According to the Charter of the Company, “if after the election of an Independent Director to the Board of Directors such director ceases to be an independent director due to any changes or new circumstances, such director shall promptly notify the Board of Directors thereof (through the Corporate Secretary) in writing and give a detailed account of all such changes and new circumstances”.
2.4.3 Independent directors make up at least one third of the elected board members.
1. Independent directors make up at least one third of the board members.
Compliant
2.4.4 Independent directors play a key role in preventing internal conflicts and making material corporate actions by the company.
2. Independent directors (those who have no conflicts of interest) pre-estimate material corporate actions related to potential conflicts of interest, with the estimates then presented to the board of directors.
Compliant
2.5 The chairman of the board of directors arranges for its functions to be performed in the most efficient manner.
2.5.1 The elected chairman of the board of directors is an independent director, or independent directors have appointed a senior independent director who coordinates the work of independent directors and interacts with the chairman of the board of directors.
1. The chairman of the board of directors is an independent director, or independent directors have appointed a senior independent director4.
2. Functions, rights and responsibilities of the chairman of the board of directors (or the senior independent director, when applicable) are properly defined in internal documents of the company.
Compliant The Chairman of the Board of Directors is an independent director; the Company believes that to fully meet best global practices. The independent Chairman of the Board of Directors of the Company ensures the most efficient interaction between the Board of Directors, shareholders and other stakeholders.
2.5.2 The chairman of the board of directors ensures constructive debate at its meetings and free discussion of items on the agenda and supervises how decisions made by the board are put into action.
1. Performance of the chairman of the board of directors was assessed as part of the board of directors’ performance assessment in the reporting period.
Compliant
2.5.3 The chairman of the board of directors takes necessary measures to timely provide other directors with information required to make decisions on the agenda.
1. The responsibility of the chairman of the board of directors to timely provide other directors with information about the agenda items is set out in internal documents of the company.
Compliant

280 281
Annual report • 2017
Co
mp
any overview
Strategy o
verviewM
arket overview
Business o
verview
Co
rpo
rate go
vernanceInfo
rmatio
n for shareho
lders
Ap
pend
ixes
Appendixes Report on compliance with the principles and recommendations set forth in the corporate governance code
№
Corporate governance principles
Compliance assessment criteria
Compliance status2
Explanation of non-compliance3
2.8.2 A remuneration committee made up of independent directors and chaired by an independent director who is not chairman of the board of directors is set up for preliminary consideration of matters related to efficient and transparent remuneration practices.
1. The board of directors set up the remuneration committee made up of independent directors only.
2. The remuneration committee is chaired by an independent director who is not chairman of the board of directors.
3. Internal documents of the company define responsibilities of the remuneration committee, including the responsibilities described in Recommendation 180 of the Code.
Partly compliant The Company is partly compliant with Criterion 1.The functions of the remuneration committee and nominations committee are performed by the Board of Directors’ Corporate Governance, Nomination and Remuneration Committee. It is made up of three independent directors and two non-executive directors who are neither a sole executive body nor members of the collegial executive body of the Company. The Committee is chaired by an independent director. Board of Directors includes four independend directors. In accordance with internal documents, the Company set up four committees of the Board of Directors, each made up of five persons. According to the regulations on the committees, each committee should include independent directors. Therefore, if each committee is made up of independent directors only, their workload will be excessive.The Company is partly compliant with Criterion 3.The Regulations on the Corporate Governance, Nomination and Remuneration Committee of the Board of Directors of MMC Norilsk Nickel define the same responsibilities of the committee as listed in Recommendation 180 of the Code, except for Item 7 (preparing a report on the implementation of executive remuneration principles for inclusion in the Annual Report and other internal documents of the Company). In the reporting period, the Board of Directors regularly reviewed reports of the Corporate Governance, Nomination and Remuneration Committee on the remuneration policy for the top management, including its updates, improvement, control over implementation and performance assessment.
№
Corporate governance principles
Compliance assessment criteria
Compliance status2
Explanation of non-compliance3
2.7.2 The company’s internal documents stipulate the procedure to prepare for and hold meetings of the board of directors so that directors have an opportunity to make proper preparations.
1. The company approved an internal document setting out a procedure to prepare for and hold meetings of the board of directors, particularly a rule to notify directors, usually at least 5 days prior to the meeting.
Compliant
2.7.3 The format of each meeting depends on the importance of items on the agenda. The most important matters are discussed at meetings held in person.
1. The charter or another internal document of the company requires the most important matters (listed in Recommendation 168 of the Code) to be discussed at meetings of the board of directors held in person.
Partly compliant The Company is partly compliant with Criterion 1. The Regulations on the Board of Directors of MMC Norilsk Nickel contain the list of matters that should be discussed at board meetings held in person only.This list is substantially in line with the list given in Recommendation 168 of the Code and accounts for specific aspects of corporate governance in the Company.
2.7.4 Decisions on the most important matters of the company’s operations are made at the meetings of the board of directors either by qualified majority or by majority of all elected directors.
1. The charter of the company requires that decisions on the most important matters listed in Recommendation 170 of the Code are made at a meeting of the board of directors by qualified majority (at least three fourths of votes) or by majority of all elected directors.
Partly compliant The Company is partly compliant with Criterion 1.The Charter of the Company requires that decisions to increase the Company’s authorised capital by issuing new stock be made by the Board of Directors unanimously. Decisions on certain material matters are made by positive vote of at least ten (10) directors (which is equal to at least 3/4 of all directors’ votes). Such matters include proposals for the General Meeting of Shareholders to vote on amendments and addenda to the Charter, reduction of the authorised capital, approval of internal documents regulating activities of the Company’s bodies, approval of, and amendments to, the dividend policy, approval of the Company’s internal documents, except for internal documents referred by the federal law to the competence of the General Meeting of Shareholders, approval of, and amendments to, the sales strategy of the Company, approval of certain transactions, and other matters. No amendments are planned to be made to the Charter’s provisions that regulate decision-making at meetings of the Board of Directors.
2.8 The board of directors sets up committees for preliminary consideration of the most important matters of the company’s operations.
2.8.1 An audit committee made up of independent directors is set up for preliminary consideration of any matters related to the supervision of the company’s financial and business operations.
1. The board of directors set up the audit committee made up of independent directors only.
2. Internal documents of the company set out responsibilities of the audit committee, including the responsibilities described in Recommendation 172 of the Code.
3. At least one member of the audit committee who is an independent director has knowledge and experience in making, analysing, assessing and auditing accounting (financial) statements.
4. Meetings of the audit committee were held at least once every quarter during the reporting period.
Partly compliant The Company is partly compliant with Criterion 1.The Company set up the Audit and Sustainable Development Committee. It is made up of three independent directors and two non-executive directors who are neither a sole executive body nor members of the collegial executive body of the Company. The Committee is chaired by an independent director. Board of Directors includes four independend directors. In accordance with internal documents, the Company set up four committees of the Board of Directors, each made up of five persons. According to the regulations on the committees, each committee should include independent directors. Therefore, if each committee is made up of independent directors only, their workload will be excessive.

282 283
Annual report • 2017
Co
mp
any overview
Strategy o
verviewM
arket overview
Business o
verview
Co
rpo
rate go
vernanceInfo
rmatio
n for shareho
lders
Ap
pend
ixes
Appendixes Report on compliance with the principles and recommendations set forth in the corporate governance code
№
Corporate governance principles
Compliance assessment criteria
Compliance status2
Explanation of non-compliance3
2.8.4 Subject to the scale of operations and risk level, the board of directors made sure that its composition fully meets the goals and objectives of the company. Additional committees were either formed or recognised as unnecessary (strategy committee, corporate governance committee, ethics committee, risk management committee, budget committee, HSE committee, etc.).
1. In the reporting period, the board of directors analysed its composition to make sure that it fully meets the goals and objectives of the company. Additional committees were either formed or recognised as unnecessary.
Compliant The Company set up four committees of the Board of Directors6:• Audit and Sustainable Development Committee;• Corporate Governance, Nomination and Remuneration Committee• Budget Committee;• Strategy Committee.
2.8.5 The committees are made up so as to enable thorough discussion of the matters considered and take different opinions into account.
1. Committees of the board of directors are chaired by independent directors.
2. According to internal documents (policies) of the company, non-members may attend meetings of the audit committee, nomination committee and remuneration committee at the invitation of committee chairmen only.
Partly compliant The Company is partly compliant with Criterion 1.The Board of Directors of the Company includes four independent directors. The Company set up four committees of the Board of Directors, each made up of five persons. According to the regulations on the committees, each committee should include independent directors. If independent directors are elected Chairmen of all the committees, their workload will be excessive. For this reason, the Budget Committee and the Strategy Committee are chaired by non-executive directors. The Committees are made up of two independent directors and three non-executive directors.
2.8.6 Committee chairmen regularly inform the board of directors and its chairman of committee activities.
1. Committee chairmen provided the board of directors with regular reports on committee activities in the reporting period.
Compliant
2.9 The board of directors provides for assessing its own performance and the performance of its committees and individual members.
2.9.1 Assessment of the board of directors’ performance aims to estimate how effective the board of directors, its committees and individual directors are and whether their activities meet corporate goals; it is also designed to stimulate the work of the board of directors and identify areas of potential improvement.
1. Self-assessment and external assessment of the board of directors’ performance in the reporting period included performance assessment of board committees, individual directors and the board of directors in general.
2. Results of the self-assessment and external assessment of the board of directors’ performance in the reporting period were considered at the board meeting held in person.
Partly compliant The Company is partly compliant with Criterion 1.Performance of the Company’s Board of Directors was assessed in accordance the Performance Evaluation Policy for Board of Directors of MMC Norilsk Nickel (the policy was developed with assistance of an external consultant). In the reporting period, self-assessment of the Board of Directors, Committees and Chairman of the Board of Directors was performedby questionnaire.The Company does not believe it to be reasonable for the time being to assess the performance of individual directors.
№
Corporate governance principles
Compliance assessment criteria
Compliance status2
Explanation of non-compliance3
2.8.3 A nomination (appointment, HR) committee whose members are mostly independent directors is set up for preliminary consideration of any matters related to HR planning (succession planning), expertise and performance of the board of directors.
1. The board of directors set up a nomination committee (or its responsibilities specified in Recommendation 186 of the Code are performed by another committee*(5)), and most of its members are independent directors.
2. Internal documents of the company define responsibilities of the nomination committee (or another committee performing its functions), including the responsibilities described in Recommendation 186 of the Code.
Partly compliant The Company is partly compliant with Criterion 2.The Regulations on the Corporate Governance, Nomination and Remuneration Committee of the Board of Directors of MMC Norilsk Nickel defines the same responsibilities as listed in Recommendation 186 of the Code, except for Item 2 (relations with shareholders should not be restricted to major shareholders only in nominating candidates to the Board of Directors; such contacts should be aimed at forming a board that will most fully meet the goals and objectives of the Company) and Item 4 (definitions of individual responsibilities of the directors and Chairman of the Board of Directors, including time to be spent on operating matters both at and outside board meetings during scheduled and unscheduled activities; such definitions (separate for the directors and Chairman of the Board of Directors) should be approved by the Board of Directors and given for guidance to each new director and Chairman after their election).Key responsibilities of the directors (including Chairman of the Board of Directors) are defined in the Regulations on the Board of Directors;The composition of the Board of Directors is relatively stable, with each director having an established list of individual responsibilities;an introductory course was developed for newly elected directors, particularly to brief them on working procedures in the Board of Directors.Any additional definitions of directors’ responsibilities by the Committee would be excessively formal. The Company does not plan to include this task in the Committee’s responsibilities.

284 285
Annual report • 2017
Co
mp
any overview
Strategy o
verviewM
arket overview
Business o
verview
Co
rpo
rate go
vernanceInfo
rmatio
n for shareho
lders
Ap
pend
ixes
Appendixes Report on compliance with the principles and recommendations set forth in the corporate governance code
№
Corporate governance principles
Compliance assessment criteria
Compliance status2
Explanation of non-compliance3
4.1.2 The company’s remuneration policy was developed by the remuneration committee and approved by the board of directors of the company. The board of directors and its remuneration committee ensures that the remuneration policy is duly adopted and implemented in the company, as well as reviews and amends it where necessary.
1. In the reporting period, the remuneration committee reviewed the remuneration policy (policies) and its (their) implementation practices and, where necessary, recommended that the board of directors make amendments.
Partly compliant The Company is partly compliant with Criterion 1.The Corporate Governance, Nomination and Remuneration Committee of the Board of Directors monitored implementation of the remuneration policy (system) to make performance improvement proposals.
4.1.3 The company’s remuneration policy sets out transparent procedures to determine the amount of remuneration payable to directors, executives and other key managers of the company, and governs all types of payments, benefits and privileges available to the above persons.
1. The company’s remuneration policy (policies) sets (set) out transparent procedures to determine the amount of remuneration payable to directors, executives and other key managers of the company, and governs (govern) all types of payments, benefits and privileges available to the above persons.
Partly compliant The Company is partly compliant with Criterion 1. The remuneration system existing in the Company provides for the procedure to determine (calculate) the amount of remuneration payable to the directors and executives. The remuneration system in the Company meets general transparency criteria.The procedure to determine directors’ remuneration is set out in the Remuneration Policy for Members of Board of Directors of MMC Norilsk Nickel and is also approved by the General Meeting of Shareholders. The total remuneration of the President and members of the Management Board consists of the base salary and bonuses (a variable part of the remuneration). The variable part of the remuneration depends on the Company’s financial and operating performance.The variable part of the remuneration payable to the members of the Management Board is based on key performance indicators. Key performance indicators are updated and approved annually by the Corporate Governance, Nomination and Remuneration Committee of the Board of Directors.
4.1.4 The company has devised a reimbursement (compensation) policy specifying the list of reimbursable expenses and level of service available to the company’s directors, executives and other key managers. Such policy may be part of the company’s remuneration policy.
1. The remuneration policy (policies) or other internal documents of the company define rules of reimbursement for expenses incurred by directors, executives and other key managers of the company.
Partly compliant The Company is partly compliant with Criterion 1. The Remuneration Policy for Members of Board of Directors of MMC Norilsk Nickel contains rules of reimbursement for expenses incurred by the Company’s directors.Expenses of the Company’s executives are reimbursed in the same manner as established in internal documents of the Company and applicable law.
№
Corporate governance principles
Compliance assessment criteria
Compliance status2
Explanation of non-compliance3
2.9.2 Performance of the board of directors, committees and individual directors is assessed regularly, at least once a year. An external organisation (consultant) is engaged at least once every three years to assess the board’s performance on an independent basis.
1. An external organisation (consultant) was engaged at least once over the last three reporting periods to assess the board’s performance on an independent basis.
Not compliant The Company is not compliant with Criterion 1. Over the last three years, the Board of Directors’ performance has been assessed internally.The internal assessment procedure for the Board of Directors was developed with assistance of an independent consultant and best global practices. An external assessment is planned to be organised following 2018.
3.1 The corporate secretary is a corporate officer whose duties include managing shareholder relations, making necessary arrangements to protect their rights and interests, and providing efficient operating support to the board of directors.
3.1.1 The corporate secretary has skills, expertise and qualifications to perform their duties, has impeccable reputation, and is trusted by shareholders.
1. The company adopted and disclosed a corporate regulation on the corporate secretary.
2. The corporate website and annual report contain the corporate secretary’s biography as detailed as those of directors and corporate executives.
Compliant
3.1.2 The corporate secretary is sufficiently independent of the company’s executive bodies and has powers and resources necessary to perform their duties.
1. The board of directors approves the appointment and dismissal of, and additional remuneration for, the corporate secretary.
Compliant
4.1 Remuneration paid by the company is sufficient to recruit, motivate and retain employees with required competencies and qualifications. Remuneration to directors, executives and other key managers of the company is paid in accordance with the remuneration policy adopted by the company.
4.1.1 Remuneration paid by the company to its directors, executives and other key managers provides sufficient motivation for efficient performance, enabling the company to recruit and retain competent and skilled professionals. The company avoids higher-than-necessary remunerations and unreasonable gaps between remunerations of such corporate officers and rank-and-file employees of the company.
1. The company adopted an internal document (documents) – remuneration policy (policies) for directors, executives and other key managers – that clearly set out approaches to remuneration of such persons.
Partly compliant The Company is partly compliant with Criterion 1.The Board of Directors approved and put into action the Remuneration Policy for Members of Board of Directors of MMC Norilsk Nickel. Principles and mechanics of remunerations (reimbursements) due to executives are set out in the Charter, Regulations on the Management Board, and other internal documents of the Company. The system (policy) of remunerations applicable in the Company is continuously and directly monitored by the Board of Directors.Responsibilities of the Corporate Governance, Nomination and Remuneration Committee include development, supervision over adoption, implementation and regular revision of the remuneration policy for the Company’s Board of Directors and Management Board and the Company’s President.

286 287
Annual report • 2017
Co
mp
any overview
Strategy o
verviewM
arket overview
Business o
verview
Co
rpo
rate go
vernanceInfo
rmatio
n for shareho
lders
Ap
pend
ixes
Appendixes Report on compliance with the principles and recommendations set forth in the corporate governance code
№
Corporate governance principles
Compliance assessment criteria
Compliance status2
Explanation of non-compliance3
4.3 Remuneration of executives and other key managers is linked to the company’s performance and their personal contribution thereto.
4.3.1 Remuneration paid to executives and other key managers of the company consists of two reasonably balanced parts: a fixed part and variable part, which depends on the company’s performance and the employee’s personal (individual) contribution thereto.
1. Performance indicators approved by the board of directors were used in the reporting period to calculate the variable part of remuneration paid to executives and other key managers of the company.
2. During the last assessment of remuneration payable to executives and other key managers of the company, the board of directors (remuneration committee) made sure that fixed and variable parts of remuneration were effectively balanced.
3. The company established a procedure to claim bonuses wrongfully received by executives and other key managers of the company.
Partly compliant The Company is partly compliant with Criterion 1.Annual key performance indicators were used to calculate the variable part of remuneration paid to executives. These final (annual) indicators were preliminarily analysed, revised and approved by the Corporate Governance, Nomination and Remuneration Committee of the Board of Directors.The Company is partly compliant with Criterion 2.The Corporate Governance, Nomination and Remuneration Committee of the Board of Directors revises remuneration of the Company’s executives on an annual basis. Following the last revision, it was concluded that fixed and variable parts of remuneration payable in the Company were effectively balanced.The Company is partly compliant with Criterion 3.Applicable laws enable the Company to claim bonuses wrongfully received by employees (including executives) of the Company. This legal mechanism is effective enough and can be used regardless of whether it is included (by reference or otherwise) into internal documents of the Company.
4.3.2 The company adopted a long-term share-based incentive plan for its executives and other key managers (an option plan or another derivative plan with the company’s shares as an underlying asset).
1. The company adopted a long-term share-based incentive plan for its executives and other key managers (an incentive plan with the company’s shares as an underlying asset).
2. According to the long-term incentive plan for the company’s executives and other key managers, the right to sell shares or other derivatives used in this plan arises not earlier than in three years after such right is granted. The right to sell is also conditional on certain performance indicators.
Not compliant The Company is not compliant with Criterion 1.The Company considers the possibility of introducing an option plan as a long-term incentive for its executives. However, the possibility is restricted by the absence of specific provisions on corporate option plans and relevant matters in the Russian civil and corporate law.
4.3.3 Compensations (golden parachutes) paid by the company to its executives and other key managers in case of early termination of their powers at the company’s initiative (provided there was no fraud on their part) do not exceed two fixed parts of their annual remuneration.
1. Compensations (golden parachutes) paid by the company to its executives and other key managers in case of early termination of their powers at the company’s initiative (provided there was no fraud on their part) did not exceed two fixed parts of their annual remuneration in the reporting period.
Not applicable No such compensations were paid in the reporting period.
5.1 The company has an efficient risk management and internal control system in place to provide reasonable assurance that it will achieve the goals set by the management.
5.1.1 The board of directors defined principles of, and approaches to, the risk management and internal control system in the company.
1. Risk management and internal control functions of management bodies and corporate divisions are clearly set out in internal documents / relevant policies approved by the board of directors.
Compliant
№
Corporate governance principles
Compliance assessment criteria
Compliance status2
Explanation of non-compliance3
4.2 Remuneration payable to directors of the company aligns their financial interests with long-term financial interests of shareholders.
4.2.1 The company pays a fixed annual remuneration to its directors.The company does not remunerate directors for attending certain meetings of the board of directors or its committees.The company does not employ any means of short-term motivation or additional incentives to stimulate its directors.
1. The fixed annual remuneration was the only monetary remuneration paid to directors for sitting on the board in the reporting period.
Compliant
4.2.2 Long-term ownership of the company’s shares is the best tool to align financial interests of directors with long-term interests of shareholders. At the same time, the right to sell shares is not conditional on achieving certain performance indicators, and directors do not participate in stock option plans.
1. If an internal document (documents) – a remuneration policy (policies) – provides for the company’s shares to be granted to directors, clear rules should be established and disclosed as to how directors may hold shares and how to incentivise long-term ownership of such shares.
Compliant
4.2.3 The company offers no additional remunerations or reimbursements if directors’ powers are terminated early after the change of control over the company or for any other reason.
1. The company offers no additional remunerations or reimbursements if directors’ powers are terminated early after the change of control over the company or for any other reason.
Partly compliant The Company is partly compliant with Criterion 1. The remuneration policy (system) existing in the Company does not provide for any additional remunerations or reimbursements in case directors’ powers are terminated early after the change of control over the Company or for any other reason.The only exception is made for the current Chairman of the Board of Directors. The General Meeting of Shareholders decided to pay extra remuneration to the current Chairman of the Board of Directors if the above circumstances arise.This privilege is explained by exceptional business skills and professionalism of the current Chairman, who is one of the most experienced and highly qualified world class managers with an extensive expertise in the mining industry.

288 289
Annual report • 2017
Co
mp
any overview
Strategy o
verviewM
arket overview
Business o
verview
Co
rpo
rate go
vernanceInfo
rmatio
n for shareho
lders
Ap
pend
ixes
Appendixes Report on compliance with the principles and recommendations set forth in the corporate governance code
№
Corporate governance principles
Compliance assessment criteria
Compliance status2
Explanation of non-compliance3
5.2.2 The internal audit division assesses the efficiency of the internal control, risk management and corporate governance systems. The company applies generally accepted internal audit standards.
1. Efficiency of the internal control and risk management system was assessed in the reporting period as part of internal audit.
2. The company uses generally accepted approaches to internal control and risk management.
Partly compliant The Company is partly compliant with Criterion 1.The Internal Audit Department is guided by international professional standards of internal audit. In the reporting period, the Internal Audit Department assessed the efficiency of the internal control and risk management systems in certain processes and subsidiaries of the Company as part of the audit engagement. In 2018, the Internal Audit Department plans to conduct a comprehensive assessment of the risk management and internal control framework and its performance.
6.1 The company and its operations are transparent for shareholders, investors, and other stakeholders.
6.1.1 The company developed and adopted an information policy that ensures effective exchange of information between the company, its shareholders, investors, and other stakeholders.
1. The board of directors approved an information policy developed in accordance with recommendations of the Code.
2. The board of directors (or any of its committees) reviewed matters related to the company’s compliance with its information policy at least once in the reporting period.
Compliant
6.1.2 The company discloses information on its corporate governance, including details on its compliance with the principles and recommendations set out in the Code.
1. The company discloses information on its corporate governance practices and general principles of corporate governance, including by way of publications on the company’s website.
2. The company discloses information on its executive bodies, board of directors, directors’ independence, and membership in board committees (in accordance with the definitions contained in the Code).
3. If there is a person controlling the company, the company publishes a controlling person statement on the plans of such person regarding corporate governance in the company.
Compliant
6.2 The company timely discloses full, accurate and up-to-date information on the company to enable shareholders and investors to make grounded decisions.
6.2.1 The company discloses information in accordance with the principles of regularity, consistency, timeliness, accessibility, reliability, completeness and comparability of disclosed data.
1. The company’s information policy defines approaches to, and criteria of, identifying information that may have a material influence on the value of the company and its securities, as well as procedures ensuring timely disclosure of such information.
2. If the company’s securities are traded on foreign organised markets, disclosures of material information in Russia and such markets are made simultaneously and to the same extent.
3. If foreign shareholders hold a material share in the company, disclosures in the reporting period were made in Russian and also in one of the most widely used languages.
Compliant
6.2.2 The company avoids a formal approach to disclosures and discloses information about its operations even if such information is not required to be disclosed by law.
1. The company disclosed its annual and semi-annual IFRS financial statements in the reporting period. The annual report of the company incorporates annual IFRS financial statements and an audit opinion.
2. In accordance with Recommendation 290 of the Code, the company discloses full information about its capital structure in the annual report and on the company’s website.
Compliant
№
Corporate governance principles
Compliance assessment criteria
Compliance status2
Explanation of non-compliance3
5.1.2 Executive bodies of the company establish and maintain an efficient risk management and internal control system in the company.
1. Executive bodies of the company arranged for proper distribution of risk management and internal control functions and powers between employees and managers of business units / divisions.
Compliant
5.1.3 The risk management and internal control system gives accurate, fair and clear representation of the company’s current affairs and prospects, ensures integrity and transparency of financial statements, as well as rationality and acceptability of the company’s risk appetite.1
1. The company adopted an anti-corruption policy.2. The company established an easily accessible channel to
inform the board of directors or its audit committee about breaches of the law, internal procedures and ethics code of the company.
Compliant
5.1.4 The board of directors takes the steps required to make sure that the risk management and internal control system existing in the company meets principles and approaches approved by the board of directors and functions effectively.
1. In the reporting period, the board of directors or its audit committee assessed performance of the risk management and internal control system. Key results of this assessment are included in the annual report of the company.
Partly compliant The Company is partly compliant with Criterion 1. In the reporting period, the Audit Committee reviewed results of internal control tests carried out by an external auditor (KPMG). Results are presented in the Annual Report. In 2018, the Internal Audit Department plans to conduct a comprehensive assessment of the risk management and internal control framework and its performance, and submit the results to the Audit and Sustainable Development Committee for review.
5.2 An internal audit is performed regularly to conduct a comprehensive assessment of reliability and efficiency of the risk management and internal control system and corporate management practices.
5.2.1 A separate division is established in the company or an independent external organisation is hired to perform an internal audit.Functional and administrative accountabilities of the internal audit division are separated. The internal audit division is functionally accountable to the board of directors.
1. A separate division, which is functionally accountable to the board of directors or its audit committee, is established in the company or an independent external organisation with the same accountability is hired to perform an internal audit.
Compliant

290 291
Annual report • 2017
Co
mp
any overview
Strategy o
verviewM
arket overview
Business o
verview
Co
rpo
rate go
vernanceInfo
rmatio
n for shareho
lders
Ap
pend
ixes
Appendixes Report on compliance with the principles and recommendations set forth in the corporate governance code
№
Corporate governance principles
Compliance assessment criteria
Compliance status2
Explanation of non-compliance3
6.2.3 As one of the most important information channels for shareholders and other stakeholders, the annual report contains information enabling them to assess annual performance of the company.
1. The annual report contains information about key operations and financial performance of the company.
2. The annual report contains information about environmental and social aspects of the company’s operations.
Compliant
6.3 The company provides information and documents requested by its shareholders in accordance with the principle of equal and unhindered accessibility.
6.3.1 Access to information and documents requested by the company’s shareholders is provided in accordance with the principle of equal and unhindered accessibility.
1. The information policy of the company defines an unhindered procedure of accessing information by shareholders, including information about the company’s subsidiaries at the request of shareholders.
Compliant
6.3.2 When providing shareholders with information, the company maintains a reasonable balance between the interests of individual shareholders and the interests of the company as the latter strives to keep confidential any sensitive commercial information that may have a material influence on the company’s competitive position.
1. The company did not refuse to provide information request by shareholders in the reporting period, or such refusals were justified.
2. In certain situation defined in the company’s information policy, shareholders are properly informed that information is confidential and undertake to keep it confidential.
Compliant
7.1 Any actions that have or might have a significant influence on the shareholding structure and financial standing of the company and, consequently, on the position of shareholders (material corporate actions) are taken under fair conditions that ensure rights and interests of shareholders and other stakeholders.
7.1.1 Material corporate actions include reorganisation of the company, acquisition of at least 30% of the company’s voting shares (takeover), material transactions entered into by the company, increase or reduction in the company’s authorised capital, listing and delisting of the company’s shares, and other actions which may result in material changes in the rights of shareholders or be against their interests. The company’s charter includes the list (criteria) of transactions or other actions deemed to be material corporate actions and refer them to the remit of the board of directors.
1. The company’s charter includes the list of transactions or other actions deemed to be material corporate actions, and criteria of their identification. Decisions on material corporate actions are referred to the remit of the board of directors. If the law expressly refers such corporate actions to the remit of the general meeting of shareholders, the board of directors provides relevant guidelines to the shareholders.
2. Material corporate actions identified as such in the company’s charter include at least the following: reorganisation of the company, acquisition of at least 30% of the company’s voting shares (takeover), material transactions entered into by the company, increase or reduction in the company’s authorised capital, and listing or delisting of the company’s shares.
Partly compliant The Company is partly compliant with Criteria 1 and 2. The decision-making procedure recommended in the Code (decision-making by the Board of Directors or the General Meeting of Shareholders when required by the Charter or law) is followed in most material corporate actions identified as such in the Code.
№
Corporate governance principles
Compliance assessment criteria
Compliance status2
Explanation of non-compliance3
7.1.2 The board of directors plays a key role in making decisions or recommendations regarding material corporate actions, and relies on the opinion of independent directors.
1. The company established a procedure for independent directors to express their opinion on material corporate actions prior to approval.
Compliant
7.1.3 When taking material corporate actions affecting the rights and legal interests of shareholders, the company ensures equal conditions for all shareholders of the company and, when legal mechanisms protecting shareholders’ rights are insufficient, arranges for additional protection of rights and legal interests of shareholders. In doing so, the company is guided by both formal legal requirements and corporate governance principles specified in the Code.
1. Subject to specific operations of the company, its charter provides for more stringent criteria of identifying transactions as material corporate events than required by law.
2. All material corporate actions in the reporting period were approved before taken.
Compliant
7.2 The company arranges for material corporate actions to be taken in such a way that shareholders have access to full information about these actions, have an opportunity to influence these actions, and are guaranteed exercise and protection of their rights when these actions are taken.
7.2.1 Disclosed information about material corporate actions explains reasons, terms and conditions, and consequences of such actions.
1. In the reporting period, the company disclosed information about material corporate actions timely and accurately, including grounds for, and time frames of, such actions.
Compliant
7.2.2 Rules of, and procedures for, material corporate actions are set out in internal documents of the company.
1. Internal documents of the company provide for a procedure to hire an independent appraiser to estimate the value of property sold or acquired in a major transaction or related-party transaction.
2. Internal documents of the company provide for a procedure to hire an independent appraiser to estimate the value of the company’s shares to be acquired or bought back.
3. Internal documents of the company provide for an extended list of criteria for directors and other persons specified in the law to be recognised as interested in the company’s transactions.
Partly compliant The Company is partly compliant with Criteria 1 and 2. The Company hires an independent appraiser in each case provided for in the law. An independent appraiser may also be hired at the initiative of directors.The Company is not compliant with Criterion 3. Applicable laws provide for a sufficient list of criteria for directors and other persons specified in the law to be recognised as interested in the company’s transactions.
1 Please indicate the reporting year or, if the report on compliance with the principles and recommendations set forth in the Corporate Governance Code contains information for the period from the end of the reporting year until the date of this report, specify the date of this report.
2 The “compliant” status is indicated only if the company meets all compliance criteria for the relevant corporate governance principle. Otherwise a “partly compliant” or “non-compliant” status is indicated.
3 Explanations are provided for each corporate governance compliance criterion if the company is only compliant with some of the criteria or is not compliant with any of them. If the company indicates the “compliant” status, no explanation is needed.
4 Please specify which out of two options provided for in the principle is adopted in the company and explain reasons for selecting such option.5 If functions of the nomination committee are performed by another committee, indicate the name of the committee.6 Please specify the list of additional committees established.

293
Annual report • 2017
Co
mp
any overview
Strategy o
verviewM
arket overview
Business o
verview
Co
rpo
rate go
vernanceInfo
rmatio
n for shareho
lders
Ap
pend
ixes
292
Appendixes Glossary
GlossaryAcid leaching. Leaching with (solutions of) acids as reagents.
Agglomerate. Sintered ore produced as a result of the agglomeration process.
Agglomeration. A method for forming relatively large porous blocks (agglomerates) by sintering (roasting) fine or powder ore, where solid particles are joined together by solidifying fusible compounds.
Anode. Crude metal (nickel or copper) obtained from anode smelting and fed for electrolytic refining (electrolysis) whereby it is dissolved.
Cake. Solid residue from filtering pulp during leaching of ores, concentrates or metallurgical intermediates, and purification of processing solutions.
Cathode. Pure metal (nickel or copper) obtained as a result of electrolytic refining of anodes.
Concentrate. A product of ore concentration with a high grade of the extracted mineral, which gives its name to the concentrate (copper, nickel, etc.).
Concentration. Artificial improvement of metallurgical feedstock mineral grades by removal of a major portion of waste rock not containing any valuable minerals.
Conversion. An autogenous pyrometallurgical process where ferrous and other detrimental impurities are oxidised and removed as slag to produce blister copper (in copper concentrate smelting) or converter matte (in copper-nickel concentrate smelting).
Converter matte. A metallurgical intermediate produced as a result of matte conversion. Depending on the chemical composition, the following types of converter matte are distinguished: copper, nickel and copper-nickel.
Cuprous ores. Ores containing 20% to 70% sulphides, with the following metal grades: 0.2–2.5% for nickel, 1.0–15.0% for copper, 5–50 g/t for platinum group metals.
Disseminated ores. Ores containing 5% to 30% sulphides, with the following metal grades: 0.2–1.5% for nickel, 0.3–2% for copper, and 2–10 g/t for platinum group metals.
Drying. Removal of moisture from concentrates performed in designated drying furnaces (to a moisture level below 9%).
Electrolysis. A series of electrochemical reduction-oxidation reactions at electrodes immersed in an electrolyte as a result of passing of an electric current from an external source.
Filtration. The process of reducing the moisture level of the pulp by forcing it through a porous medium.
Flash smelter. An autogenous smelter for processing dry concentrates, where the smelted substance is finely ground feedstock mixed with a gaseous oxidiser (air, oxygen), which holds melted metal particles suspended. The heat from oxidation reactions is actively used in the process.
Flotation. A concentration process where specific mineral particles suspended within the pulp attach to air bubbles. Poorly wettable mineral particles attach to the air bubbles and rise through the suspension to the top of the pulp, producing foam, while well wettable mineral particles do not attach to the bubbles and remain in the pulp. This is how the minerals are separated.
Leaching. Selective dissolution of one or several components of the processed solid material in organic solvents or water solutions of inorganic substances.
Matte. Intermediate product in the form of an alloy of sulphides of iron and non-ferrous metals with a varying chemical composition. Matte is the main product accumulating precious metals and metal impurities the feedstock contains.
Metal extraction. The ratio between the quantity of a component extracted from the source material and its quantity in the source material (as a percentage or a fraction).
Metal grade. The ratio between the weight of metal in the dry material and the total dry weight of the material expressed as a percentage or grammes per tonne (g/t).
Mine. A mining location for extraction of ores.
Mineral deposit. A mass of naturally occurring mineral material (near to the surface or deeper underground) which is economically valuable in terms of quantity, quality and conditions.
Ore mixture. A mixture of materials in certain proportions needed to achieve the required chemical composition of the end product. The ore mixture for metallurgical production may include ores, ore concentrates and agglomerates, return slag, dust from dust collectors, and metals (mostly in the form of scrap).
Ore. Natural minerals containing metals or their compounds in economically valuable amounts and forms.
Oxide. A compound of a chemical element with oxygen.
Proven ore reserves. Estimated based on the economically mineable part of measured mineral resources, including possible dilution and losses during mining operations.
Probable ore reserves. Estimated based on the economically mineable part of indicated and, in some circumstances, measured mineral resources, including possible dilution and losses during mining operations.
Pulp. A mixture of finely ground rock with water or a water solution.
Pyrometallurgical processes. Metallurgical processes performed at high temperatures, including roasting, smelting and conversion, which are distinguished depending on their technological characteristics.
Refinement. The process of extracting high purity precious metals through their separation and removal of impurities.
Rich ores. Ores with high sulphide content (over 70%) and the following metal grades: 2–5% for nickel, 2–25% for copper, and 5–100 g/t for platinum group metals.
Roasting. The process of removing volatile components from and changing the chemical composition of materials (ores, concentrates, etc.) performed at elevated temperatures enabling various gas-solid reactions but insufficient to cause melting of the material’s solid compounds.
Shop area. A part of a (metallurgical) shop.
Slag. Melted or solid substance with a varying composition that covers the surface of a liquid product during metallurgical processes (resulting from ore mixture melting, melted intermediate processing and metal refining) and includes waste rock, fluxes, fuel ash, metal sulphides and oxides, and products of interaction between the processed materials and lining of melting units.
Sludge. Powder product containing precious metals settling during electrolysis of copper and other metals.
Smelting. A pyrometallurgical process performed at high temperatures enabling the complete melting of the processed material.
Sulphides. Compounds of metals and sulphur.
Tailings pit. A complex of hydraulic structures used to receive and store mineral waste / tailings.
Tailings. Waste materials left over after concentration processes and containing mostly waste rock with a minor amount of valuable minerals.
Thickening. Separation of liquid (water) and solid particles in dispersion systems (pulp, suspension, colloid) based on natural gravity settling of solid particles in settlers and thickeners, or centrifugal settling of solid particles in hydrocyclones.
Underground (subsurface) mining. A set of stripping, preparatory and stoping operations.
Vanyukov furnace. An autogenous smelter for processing concentrates, where smelting is performed in a bath of slag and matte, with intensive injection of air-oxygen mixture. The heat from oxidation reactions is actively used in the process.

294 295
Annual report • 2017
Co
mp
any overview
Strategy o
verviewM
arket overview
Business o
verview
Co
rpo
rate go
vernanceInfo
rmatio
n for shareho
lders
Ap
pend
ixes
Appendixes Metric conversion table and currency exchange rates
Metric conversion table and currency exchange ratesMetric conversion table
Length Area Weigth
1 km 0.6214 mi 1 sq m 10.7639 sq ft 1 kg 2.2046 lb
1 m 3.2808 ft 1 sq km 0.3861 sq mi 1 metric tonne 1,000 kg
1 cm 0.3937 in 1 ha 2.4710 acres 1 short tonne 907.18 kg
1 mi 1.609344 km 1 sq ft 0.09290304 sq m 1 troy ounce 31.1035 g
1 foot 0.3048 m 1 sq m 2.589988 sq km 1 lb 0.4535924 kg
1 in 2.54 cm 1 acre 0.4046873 ha 1 g 0.03215075 oz t
ContactsVladimir ZhukovVice President of the Investor Relations DepartmentE-mail: [email protected]
Mikhail Borovikov Head of the Investor Relations DepartmentE-mail: [email protected]: +7 (495) 786-83-20Fax: +7 (495) 797-86-13
Marina RaichenkoHead of Share Capital DivisionPhone: +7 (495) 797-82-44E-mail: [email protected]
Andrey KirpichnikovHead of PR DepartmentPhone: +7 (495) 785-58-00Fax: +7 (495) 785-58-08E-mail: [email protected]: 123100 Moscow, 1iy Krasnogvardeyskiy proezd, 15
RegistrarJSC “Computershare Registrar”Russian Federal Securities Commission license number 045-13954-000001, dated September 6,2002, valid indefinitelyWeb-site: www.nrcreg.ru
Head office:Address: 18 Stromunka Street, building 5B, Moscow, 107076, Russia, Tel.: +7 (495) 989-76-50Fax: +7 (495) 989-76-82E-mail: [email protected]
Norilsk BranchAddress: 8 Bordan Khmelnytskui, Norilsk, Krasnoyarsky Krai, 663305, RussiaTel.: +7 (3919) 46-28-17Helpdesk operating hours: Monday – Friday from 10:00 to 14:00
Krasnoyarsk branchAddress: office center “Voskresensky”, office 314, 94 Prospekt Mira, Krasnoyarsk, 660017 Russia Tel.: +7 (391) 216-51-01Fax: +7 (391) 216-57-27Helpdesk operating hours:Monday – Friday from 9:00 to 13:00
ADR depositaryThe Bank of New York MellonDepositary Receipts DivisionAddress: 101 Barclay Street, 22 nd Floor West, New York,NY 10286Tel.: +1 (212) 815-22-93Fax: +1 (212) 571-30-50Web-site: www.bnymellon.com
AuditorJSC “KPMG”Address: 3035, 18/1 Olympiysky prospekt, Moscow, 129110 Russia Post address: Naberezhnaya Tower Complex, Block C, 31st Floor, Presnenskaya Naberezhnaya Tel.: +7 (495) 937-44-77Fax: +7 (495) 937-44-99E-mail: [email protected]: www.kpmg.com
Currency exchange in 2013–2017
This appendix provides currency exchange rates used to convert expenses denominated in RUB to USD.
Russian Rouble / US Dollar 2013 2014 2015 2016
2017
Average rate for the year ended 31 December
31.85 38.42 60.96 67.03 58.35

DisclaimerThis annual report (Annual Report) has been prepared based on the information available to MMC Norilsk Nickel and its subsidiaries as at the issue date. The Company believes that the information provided in this Annual Report is complete and accurate as at the Annual Report publication date. However, the Company does not assert that this information will not be updated or corrected in the future.
This Annual Report may include certain forward-looking statements with respect to the Group’s operations, economic indicators, financial position, results of operating and production activities, its plans, projects and expected results, as well as trends related to commodity prices, production and consumption volumes, costs, estimated expenses, development prospects, useful lives of assets, reserve estimates and other similar factors and economic projections with respect to the industry and markets, start and completion dates of certain geological exploration and production projects, and liquidation or disposal of certain entities.
The Company neither confirms nor guarantees that the results indicated in the forward-looking statements will be achieved.
The Company accepts no responsibility for any losses that may be incurred by any individual or legal entity acting in reliance on the forward-looking statements.