Investigative Design, bypassing the city edge An analysis of ...
111
Investigative Design, bypassing the city edge An analysis of Kisumu, Kenya MASTER THESIS Lefever Luk Wouters Sofie
-
Upload
khangminh22 -
Category
Documents
-
view
0 -
download
0
Transcript of Investigative Design, bypassing the city edge An analysis of ...

Investigative Design, bypassing the city edge
An analysis of Kisumu, Kenya
MASTER THESIS Lefever Luk
WoutersSofie


Investigative Design, bypassing the city edge
Katholieke Universiteit LeuvenFaculteit IngenieurswetenschappenDepartement Architectuur, Stedenbouw en Ruimtelijke Ordening
Promotor: Prof. Han Verschure
Thesis presented to obtain the degree of Civil Engineer
in Architecture, 2007-2008
Lefever Luk_master in Urban Planning
Wouters Sofie_master in Architecture

G.Kasparov

This thesis handles about Kisumu, a postcolonial city at the
shores of Lake Victoria. The duality of the urban pattern is
bewildering, the aligned grid versus the informal peri-urban
areas, Kaparov’s chessboard versus Pollock’s dripping.
Recently plans for bypassing the city have been approved.
This thesis is a designerly investigation on the implications
of this bypass.
P.J.Pollock

It is necessary to point out some restrictions we endured
during working on this thesis.
Change of subject and time schedule
First of all our field of researchwas not Kisumuwhenwe
set of for fieldwork.We originally intended to work on a
small village –Kabondo- some 60 kilometres of Kisumu.
A small-scale orphanage with Belgium funds had already
invited tree Swedish students in architecture for some
research in 2006. In 2007 they applied at the KULeuven for
some thesis-students to complete the work of the Swedish
students. As this proposition was included in the list of
possible theses, we chose for a research in Kabondo for its
urgency and its practical outcome.
After two weeks of intensive fieldwork in Kabondo we
received an email from Belgium that explained we had
to do some research in Kisumu as well. Since we had no
preparation on Kisumu at all it was rather difficult to find
a subject that was able to combine a research in Kisumu
with our existing subject in Kabondo. After some advices
of Professor Erastus Abonyo of the University of Nairobi we
decided to focus on a historical evolution of the homestead
structures around Kisumu. Via e-mail, we agreed on this
subject with our Belgium promoters.
After 3 weeks of trying to grasp this evolution we had to
stakeoureffortsbecausewerealizeditwastoocomplicated
for our time schedule. We decided to focus on formal and
informal markets within Manyatta –since we had been
doing all our research within this area. By then we only had
onemonthlefttofinishourfieldwork.
The idea of focussing on the bypass only arose when we
were back in Belgium. We then tried to combine all our bits
offieldworkandimpressionsintoonefittingtotality.
Spatial observations and impressions
Since there have been no foregoing theses on Kisumu
and because of the reasons discussed above, our thesis
is more conceived as to be explorative. It is mainly based
on visual spatial observations, impressions during our
fieldworkandsmallinformaltalkswithlocals.Afterwards
we completed our fieldwork with (and have tested our
impressionsagainst)aerialphotographsandGIS-fileswe
receivedduringfieldwork.
Restrictions

Thanks to:
-Our promoter Han Verschure for giving us the opportunity
-Daan van Tassel for his advice and guidance through the year
-Bruno De Meulder for his throughout remarks on the analysis and his constructive design input
-Guido Geenen for his encouraging design guidance and inspiration
-Bruce Kimani for his meaningful advice
-Isaac Maina for his help and advice during our stay in Nairobi
-Erastus Abonyo for his counselling and guidance in Nairobi
-Mia and Johan for their hospitality and sincere care during our stay
-Mama Martha for her enthusiastic embracement
-Joseph Shitemi for his guidance through Kisumu and for introducing us to local Kisumu
-ARDHI House, with special attention to Newton Tosh for helping us to obtain some maps of Kisumu
-Pamoja Trust, with special attention to Erikson Sandi for his willing help
-the entire Town Planning Department of Kisumu
-Kosawo Social Hall and co-workers for guiding us through Manyatta
-SANA, with special attention to Viktor Achieng for his useful information
-UN-HABITAT, with special attention to Peter Donde and Ulrik Westman for their advice and help
-Moses Kola for his good input and advice during the last days
-Betty Okero for the useful information on NGO’s
and we would like to thank our parents for giving us the chance to study all those years and encouraging us
until the end. We would also like to thank Phebe, Koen and all of our friends for their indubitable support and
all the pleasant times we had together, making this year complete.
0
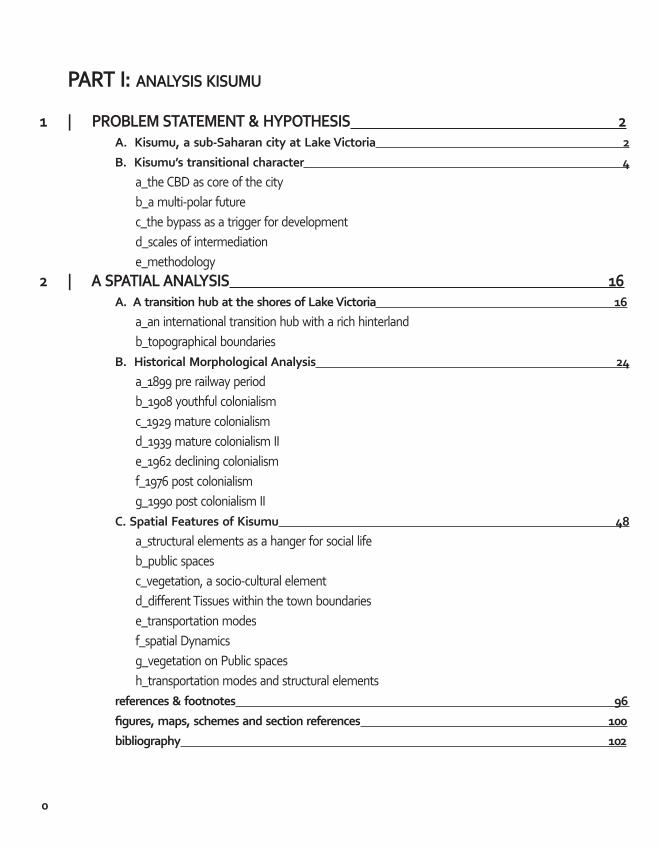
PART I: ANALYSIS KISUMU
1 | PROBLEM STATEMENT & HYPOTHESIS 2 A. Kisumu, a sub-Saharan city at Lake Victoria 2
B. Kisumu’s transitional character 4
a_the CBD as core of the city b_a multi-polar future c_the bypass as a trigger for development d_scales of intermediation e_methodology2 | A SPATIAL ANALYSIS 16 A. A transition hub at the shores of Lake Victoria 16
a_an international transition hub with a rich hinterland b_topographical boundaries B. Historical Morphological Analysis 24
a_1899 pre railway period b_1908 youthful colonialism c_1929 mature colonialism d_1939 mature colonialism II e_1962 declining colonialism f_1976 post colonialism g_1990 post colonialism II C. Spatial Features of Kisumu 48
a_structural elements as a hanger for social life b_public spaces c_vegetation, a socio-cultural element d_differentTissueswithinthetownboundaries e_transportation modes f_spatial Dynamics g_vegetation on Public spaces h_transportation modes and structural elements references & footnotes 96
figures,maps,schemesandsectionreferences 100
bibliography 102

1
PART II: DESIGN BYPASS
1 | SCOPE OF THE DESIGN2 | ANALYSIS3 | DESIGN
PART III: DESIGN PROTOTYPICAL NUCLEI1 | SCOPE OF THE DESIGN2 | ANALYSIS3 | DESIGN
2
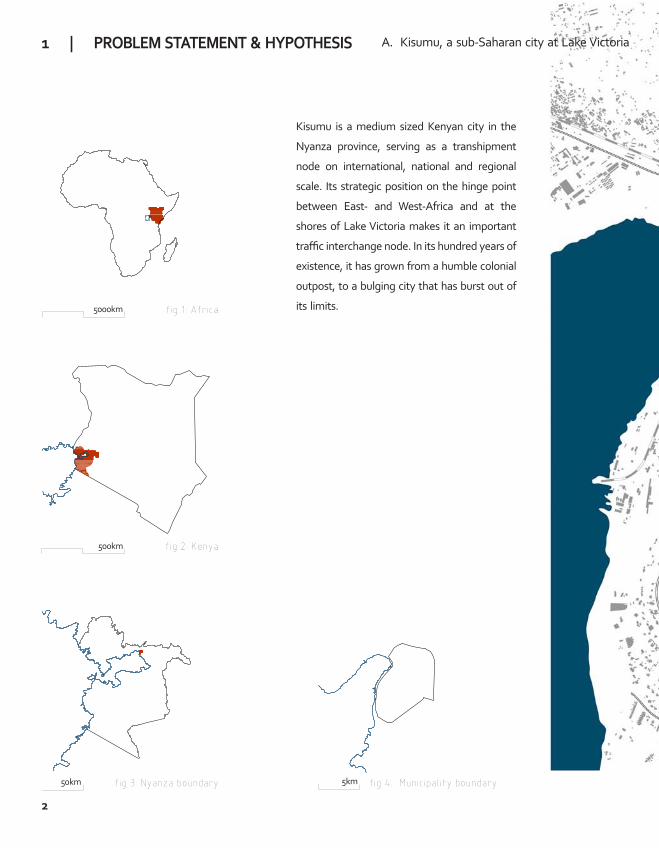
A. Kisumu, a sub-Saharan city at Lake Victoria1 | PROBLEM STATEMENT & HYPOTHESIS
fig 3: Nyanza boundary fig 4: Municipality boundary
fig 2: Kenya
fig 1: Africa5000km
500km
50km 5km
PROBLEM STATEMENT & HYPOTHESIS |
Kisumu is amedium sized Kenyan city in the
Nyanza province, serving as a transhipment
node on international, national and regional
scale. Its strategic position on the hinge point
between East- and West-Africa and at the
shores of Lake Victoria makes it an important
trafficinterchangenode.Initshundredyearsof
existence, it has grown from a humble colonial
outpost, to a bulging city that has burst out of
its limits.

3PROBLEM STATEMENT & HYPOTHESIS |
lake Victoria river railway important road
250m 1000m
map 1: map of Kisumu
4
B. Kisumu’s transitional character
a_the CBD as core of the city
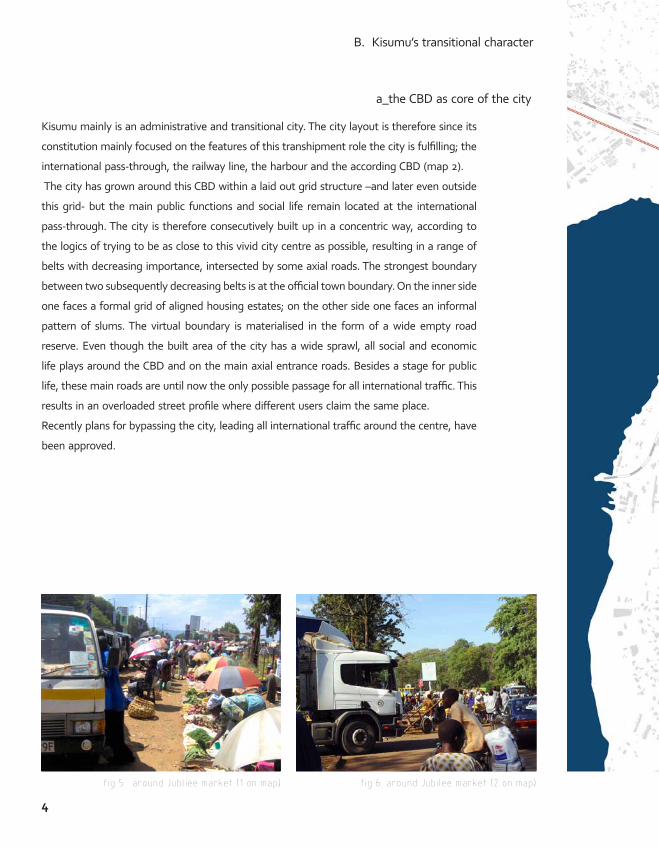
fig 6: around Jubilee market (2 on map)fig 5: around Jubliee market (1 on map)
PROBLEM STATEMENT & HYPOTHESIS |
Kisumu mainly is an administrative and transitional city. The city layout is therefore since its
constitutionmainlyfocusedonthefeaturesofthistranshipmentrolethecityisfulfilling;the
internationalpass-through,therailwayline,theharbourandtheaccordingCBD(map2).
The city has grown around this CBD within a laid out grid structure –and later even outside
this grid- but the main public functions and social life remain located at the international
pass-through. The city is therefore consecutively built up in a concentric way, according to
the logics of trying to be as close to this vivid city centre as possible, resulting in a range of
belts with decreasing importance, intersected by some axial roads. The strongest boundary
betweentwosubsequentlydecreasingbeltsisattheofficialtownboundary.Ontheinnerside
onefacesaformalgridofalignedhousingestates;ontheothersideonefacesan informal
pattern of slums. The virtual boundary is materialised in the form of a wide empty road
reserve. Even though the built area of the city has a wide sprawl, all social and economic
life plays around the CBD and on the main axial entrance roads. Besides a stage for public
life,thesemainroadsareuntilnowtheonlypossiblepassageforallinternationaltraffic.This
resultsinanoverloadedstreetprofilewheredifferentusersclaimthesameplace.
Recentlyplansforbypassingthecity,leadingallinternationaltrafficaroundthecentre,have
been approved.

5
map 2: the cbd as the core of the city
21
PROBLEM STATEMENT & HYPOTHESIS |
centre function international pass-through
250m 1000m
CBD
railway

6
b_a multi-polar future
PROBLEM STATEMENT & HYPOTHESIS |
This bypass is planned on the road reserve between the grid of aligned housing estates and
the belt of informal settlements. This radial connection will have strong impacts on the so
farconcentricandaxialcity;someconsiderationsshouldbemade.
Advantages and disadvantages of the planned bypass
The main focus of the bypass is to decrease traffic pressure on the CBD and to provide
a fluent traffic flow around the city. It thereby creates a change that has advantages and
disadvantages.
First of all, the main axial access roads will lose some of their importance, resulting in a
change of economic weight and leaving the CBD along a ‘dead-end street’. It will thus
restructure the city in a basic way. The bypass however will gain economic weight rapidly
and will attract many investors. This in his turn will have a strong impact on the small-scale
tissue currently surrounding the road-reserve. The informal settlements along the bypass
that nowadays face a backside of the city will suddenly become a front side of the city.
The bypass can be interpreted as a scar that enforces the strong division between the inner
city and the outer slum belt but at the same time, it can be seen as a linking element that
provides a frame for linking elements between those two entities. Its design should make it
topple over to the desired direction.
Nevertheless, the idea of a bypass is in its right place. A radial connection is needed and the
current empty gab of the road-reserve is an opportunity that should be taken.
Current plans for the bypass
The currently planned bypass foresees a two-lane avenue with several footbridges. This
addresses in some way the issue of linking the two tissues but one can question the actual
improvement of footbridges.
In the north of the city, this road-reserve widens up to some extent at Kondele, providing a
large empty gap where informal marketers have installed. With the planning of the bypass
this entire market –a large income generator for the adjacent slum dwellers- has radically
been removed.A flyover and roundabout have been planned at this point but the impact
on the environment and theweight of the investment is not in proportion to the specific
needs of this bypass.

7PROBLEM STATEMENT & HYPOTHESIS |
centre function international pass-through
250m 1000m
map 3: the multi-polar future of Kisumurailway
Kondele

8 PROBLEM STATEMENT & HYPOTHESIS |
Lying on the cross point of the bypass and an axial entrance road, this spot is nowadays
already an important traffic node in the urban tissue handling with all types of changing
between traffic modes. Nevertheless, the traffic interchange has not been taken into
account when it came to planning this space even though it is a complex situation. Matatus,
bodabodas, tuktuks, pedestrians, handcarts, sellers and buyers should all come together in
onefluentandlogicmotion.Ifthereisnoframeworkprovidedtocanalisethesemovements
the situation will result in an uncontrolled chaos.
Nowadays Kondele also serves as a centre for the adjacent informal settlements –a kind of
counterpartof the formalCBD in thecity centre.The formalizationof thisbypasswillonly
intensifythetrafficinterchangeandconsolidatethecentrefunction.
Different conditions should be pointed out aswell on this site.There is a large expansion
area for the hospital, the very small-scale tissue of the informal settlement and various
morphologies of aligned layouts at the concave side of the bypass. None of these have been
taken into consideration in the planned bypass even though the bypass will have a strong
impacthereontheexisting–verydifferent-realestate.
Conclusion
The implementation of the bypass will have throughout restructuring implications.
The informal centre, Kondele, will become a second centre or even the main centre. The
masterplanforthebypasscanhavepositiveinfluencesonacityscaleandespeciallyforthe
informal settlements along it. Its design should be detailed on an urban landscape scale as
well as on the small-scale tissue surrounding it.

9
fig 9 fig 8fig 7
PROBLEM STATEMENT & HYPOTHESIS |
Several possibilities can be taken into account;
-Kondele can become the main centre, while the CBD remains an adminis-
trativecentre(fig.7)
-Kondele can become a centre pole with an equal weight as the CBD,
resultinginabipolarcitystructure(fig.8)
-several focal points can grow along the bypass with an emphasis at Kondele,
resultinginamulti-polarcitystructure(fig.9)
Kondele
9

10 PROBLEM STATEMENT & HYPOTHESIS |
fig 10
Separated by a clearly distinguishable boundary, a wide
belt of informal settlements encircles Kisumu centre.
Nowadays this frontier, between inner city and slum
area, is a 30metres road reserve where the planned
bypass will be located. This bypass will become the
international pass-through, and hereby gain economic
and structural importance. More and more investors
will start planning and eventually building commercial
structures on this edge. The linkages between
the informal settlements and city centre, crossing
this 30metres road reserve, are nowadays marked
indistinctly. The coming bypass either can enforce this
inexplicitly or brighten these linkages.
Thisbypasswillaffectbothslumedgeandtheedgeof
the inner city. In this problem statement, we will focus
on the slum area because of its informal character;
with the coming of the bypass, we consider this part of
Kisumu to undergo the most changes.
Inside Manyatta, the slum area on the eastern side of Kisumu,
almost all parcels have been subdivided over time, leaving a
tremendous amount of houses, appearing randomly littered
over the area as a patchwork quilt, covering almost all land. The
subdividing of the parcels is a consequence of the high housing
demand and the resulting speculation practices. By selling or
renting land, the owner ensures or improves his livelihood. No
focal points, such as employment sites or public spaces, can be
found in this large tissue where almost no free land -for building
purposes- is left.
More than 70 per cent of the inhabitants of the Manyatta
neighbourhood are working in the informal self-employment
sector because of the low formal employment opportunities.
The employees of the formal sector, and thus the minority of the
inhabitants, are working in different working places downtown
outside the informal settlements and in the industrial areas1. Due
to the insufficient accessible mobility network several parts of
the informal settlements have a very poor connection with public
transportation -which increases the travel time from slum area to
thedifferentworkingplacesenormously.
Conclusion
The surrounding neighbourhoods will undergo an important
impact of the bypass. This impact can be twofold: or the bypass
will trigger the ‘curing’ of the slum area at the frontier and
enhance the income opportunities of the dwellers or the dwellers
will undergo a social displacement due to growing speculation
practices by investors. Only well-considered spatial interventions
will create a wining scenario for both slum inhabitants and
investors. The positive stimulus of the bypass can be canalised
in a direction to obtain a further upgrading of the whole slum
environment.
1 UNHABITAT, 2005, Situation analysis of informal settlements in Kisumu,
Cities without slums sub-regional programme for eastern and southern Africa,
KenyaSlumUpgradingProgramme(KENSUP),UN-HABITAT,Nairobi,p.4
c_the bypass as a trigger for development

11PROBLEM STATEMENT & HYPOTHESIS |
map 4: Bypass as a trigger for development

12
the city as a network at uniform scale
XL
d_ scales of intermediation
PROBLEM STATEMENT & HYPOTHESIS |
Different scopes and limitations have been set to make
an analysis. These scopes are conceived as a matter of
differentscales.
First of all we analyse the city on the XL scale, the
uniformity of the city as a whole, with its dynamical logics,
its tissues, vegetation, transportation modes, etc. This
general analysis forms the basis of the L scale in which we
try to capture the most important spatial dynamics around
the bypass, the important linkages, the surrounding tissues,
etc. The limitation of this scale is a virtual boundary we
have chosen in which we think the bypass will have a direct
spatial impact. This L scale will be analysed in detail in part
II and will directly precede the design of the bypass, with a
focus on Kondele.
Furthermore we make an analysis of the Manyatta area
–the informal settlement at the eastern boundary of the old
colonial town and the most yet-developed slum of the slum
belt. We call this the M scale. The same features of the XL
scale will be taken into account here. This analysis will be
thebasis for theSscale;a representativeeast-west stroke
taken out of Manyatta, a pars pro toto for the entire slum.
This S scale will be analysed in part III, and will precede
the design of some prototypical nuclei within this informal
tissue.

13
the city as a network at uniform scale
XL
part I.2
MManyatta area as an urban tissue in its own terms
the bypass along its longitudinal direction
L
part II & III
S a focus on three strategic ‘voids’ in an urban tissue
PROBLEM STATEMENT & HYPOTHESIS |

14
e_methodology
First of all we situate Kisumu within its international,
national and regional context to understand its importance
as a transhipment point. Kisumu has been a transactional
and administrative centre of great importance since its
constitution a century ago. We then consider topography
on the city scale to outline its expansion possibilities and
limitations.
In the historical morphological analysis we give a short
overview of the most important spatial evolutions on
a city scale. The different periods have been taken
from Anyumba’s ‘History of the built form, planning and
environment: 1890-1990’. For each period we link spatial
developments to the most relevant historical events to get
a grip on understanding the city layout.
Inthelastchapterwedepictsomedifferentspatialfeatures
of Kisumu as it is nowadays to grasp the functioning of the
currentcitylayout.Wefirstconsiderdifferentaspectsofthe
cityscape separately, interpret their spatial differentiation
and make some considerations towards relevant issues.
Afterwards we combine some relevant features that are
clearly related to each other.

15

16
2 | A SPATIAL ANALYSIS A. A transition hub at the shores of Lake Victoria
TO K
AM
PALA
A SPATIAL ANALYSIS |
BUTE
RE
a_an international transition hub with a rich hinterland
map 1: Nyanza Province and environs
KISU
MU
NA
IRO
BI
MO
MBA
SA
UGANDA
TANZANIA
NYANZA PROVINCE
LAKE VICTORIA
17
TO M
OM
BASA
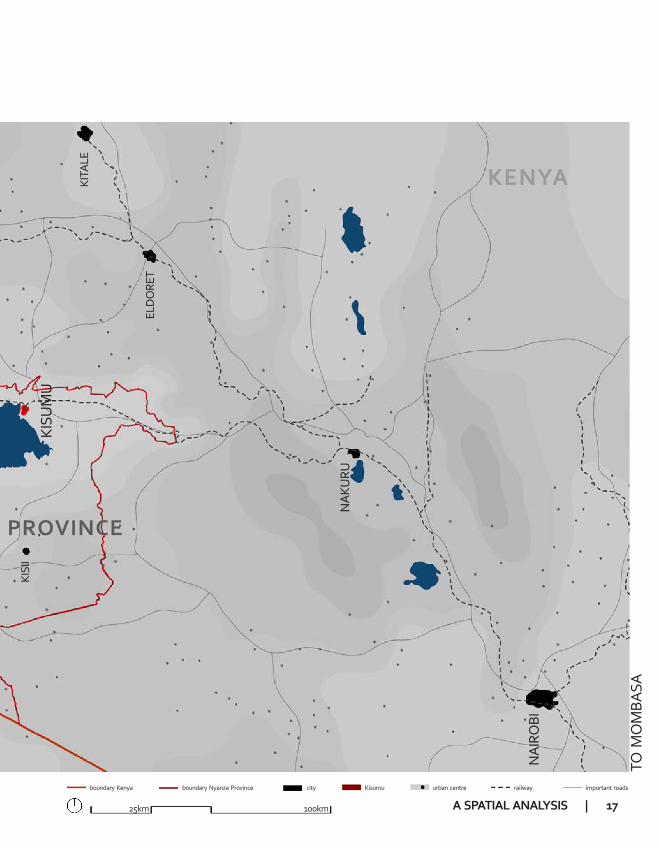
A SPATIAL ANALYSIS |boundary Kenya boundaryNyanzaProvince city Kisumu urban centre railway important roads
25km 100km
NA
IRO
BI
KISU
MU
NA
KURU
ELD
ORE
T
KISI
I
KITA
LE
TANZANIA
NYANZA PROVINCE
KENYA

18
The Republic of Kenya is located on the eastern part of the vast
continent of Africa and forms an important part of East Africa.
Kenya is bordered in the south-east by the Indian Ocean, which
is an important outlet and means of sea contact. This contact
is focused on Mombasa, Kenya’s main gateway to and from
the sea. BothUganda and northernTanzania are also served by
Mombasa.
Kenya falls into provincial units for administrative purposes.
The most south-western one is Nyanza of which Kisumu is
the provincial capital. It is part of the Lake Victoria catchment,
invariablycalledtheLakeVictoriaBasin;anareawherepopulation
density is above the national average. This is because of a softer
climate , more fertile soils around the lake, supply of water, etc.
The lake also provides potential for transportation, fisheries,
tourism, agriculture, power, industries, etc.
The spatial distribution of Kenya’s population is highly uneven;
a clear correlation exists between annual precipitation and
altitude on the one hand and population density on the other.
Almost 20million Kenyans depend directly on agriculture for
their livelihood. However, only 18 percent of the total land area
is classified as medium or high potential agricultural land on
the basis of annual precipitation and altitude -among which the
Nyanza province. Kenya, therefore, has one of the highest rural
population densities in the world.
But there is a strong cultural dimension that degrades the
environmental richness of this region; the dictates of cultural
practices of sons inheriting their fathers’ land and wives owning
land to cultivate are reinforcing the need to subdivide land into
small units which are uneconomical for meaningful farming. Such
practices continue to generate a population of landless youth who
must migrate elsewhere to earn a living.
A SPATIAL ANALYSIS |

19
Kisumu is a name derived from a Luo word, “kisuma” –meaning a
placewherethehungrygetsustenance;thiscouldhavebeendue
to its role as a regional centre for barter trade. This role continues
to this day, with Kisumu acting as a commercial and transpor-
tation hub for the Lake Basin region.
Kisumu is the third largest city of Kenya, after the capital Nairobi
and Mombasa and was originally constituted as the railway
terminus for the Great East African Railway. The railway allowed
goods to be exported and allowed heavy equipment to be
transported far inland with relative ease. Kisumu’s position on
the hinge-point between East and West Africa, its unique role as
a rail- road- and sea line interchange node made it a fast growing
urban complex in an unexploited green area. Later on a new main
line was constructed from Nakuru on a more northerly route,
around the head of the lake, linking Mombasa with Kampala and
thereby leaving Kisumu only on a branch line. Despite this shift in
economical importance, Kisumu remained an important transpor-
tation hub and economic centre, triggering a massive rural-urban
migrationoverthepast40years.
Kisumu serves as a depot for the distribution of imported goods
as well as a depot for exported raw materials gathered from
periodic markets in its rich hinterland. This hinterland mainly
exists of gentle green slopes with natural vegetation alternated
by cultivated land –of which the problems have been cited above
(fig.1&2).Within this green land one finds several focal points;
small centres with a periodical local market that serves a wider
environment(fig.3).
A SPATIAL ANALYSIS |

20
fig 1: view of Kisumu's green hinterland (Kabondo District)
fig 2: view of Kisumu's green hinterland (Sondu River)
A SPATIAL ANALYSIS |

21
fig 3: view of a focal point in Kisumu's green hinterland (Misambi)
A SPATIAL ANALYSIS |
22
b_topographical boundaries
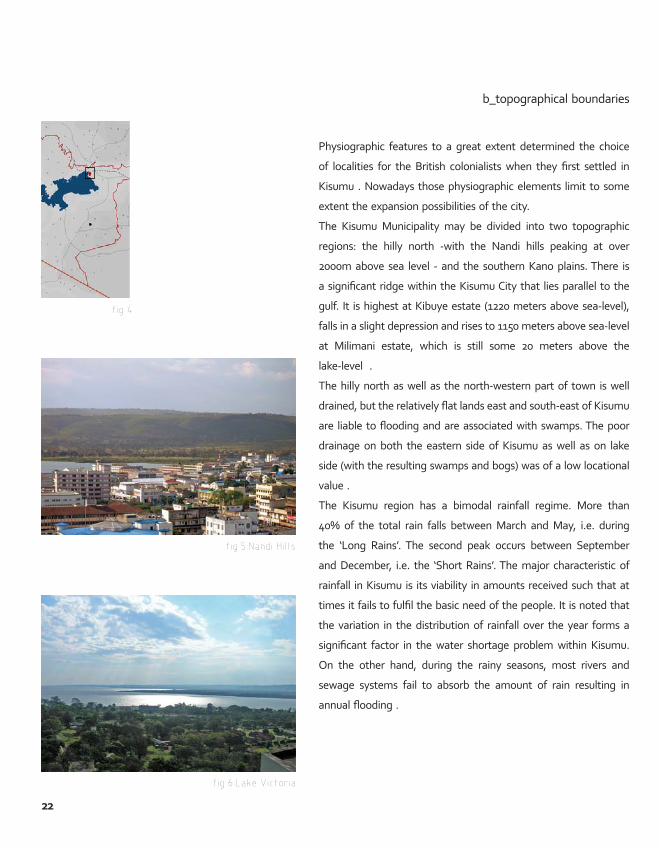
fig 6:Lake Victoria
fig 5:Nandi Hills
fig 4
A SPATIAL ANALYSIS |
Physiographic features to a great extent determined the choice
of localities for the British colonialists when they first settled in
Kisumu . Nowadays those physiographic elements limit to some
extent the expansion possibilities of the city.
The Kisumu Municipality may be divided into two topographic
regions: the hilly north -with the Nandi hills peaking at over
2000m above sea level - and the southern Kano plains. There is
asignificant ridgewithin theKisumuCity that liesparallel to the
gulf. It ishighestatKibuyeestate (1220metersabovesea-level),
falls in a slight depression and rises to 1150 meters above sea-level
at Milimani estate, which is still some 20 meters above the
lake-level .
The hilly north as well as the north-western part of town is well
drained,buttherelativelyflatlandseastandsouth-eastofKisumu
are liable toflooding andare associatedwith swamps.Thepoor
drainage on both the eastern side of Kisumu as well as on lake
side(withtheresultingswampsandbogs)wasofalowlocational
value .
The Kisumu region has a bimodal rainfall regime. More than
40% of the total rain falls between March and May, i.e. during
the ‘Long Rains’. The second peak occurs between September
and December, i.e. the ‘Short Rains’. The major characteristic of
rainfall in Kisumu is its viability in amounts received such that at
timesitfailstofulfilthebasicneedofthepeople.It isnotedthat
the variation in the distribution of rainfall over the year forms a
significant factor in the water shortage problemwithin Kisumu.
On the other hand, during the rainy seasons, most rivers and
sewage systems fail to absorb the amount of rain resulting in
annualflooding.

23
NANDI HILLS
KANO PLAINS
A SPATIAL ANALYSIS |
river swamp railway important road lake Victoria
500m 2000m
LAKE VICTORIA
map 2: topographical boundaries
KIBUYE AREA
MILIMANI AREA

24
The structure of the Kisumu countryside in the pre-railway era
consisted of a landscape of large areas in their natural state,
where the land forms and vegetation had some imprint of man
(cultivation) or his domestic animals (grazing).Some homestead
settlements displayed a scattered formation in the landscape
along the lake shore, with local variations to account for favourable
topography,sitesandaspects(fig.7).Themapisareconstruction,
to approximate scale, of Kisumu’s villages and market during the
pre-railway era. The villages and permanent settlements have
been built on the higher flood-free ground, leaving the vast
grassland to provide pasture for the cattle1.
It is known that there was already an operating periodical market
forbartertradeinKisumuatthattime(fig.8).
a_1899 pre railway period
fig 7:northern shore in 1899
fig 8:indigenous market for local traders at 'Kisuma'
B. Historical Morphological Analysis
A SPATIAL ANALYSIS |

25A SPATIAL ANALYSIS |
topographic lines river homestead
500m 2000m
map 3: 1899

26
b_1908 youthful colonialism
fig 9:eastern shore in 1902
fig 10:railway line reaching Kisumu in 1901
A SPATIAL ANALYSIS |
Arrival of the railway line
The Uganda Railway was built by order of the British Government
during the period when Britain maintained colonial control of the
region known as British East Africa, covering roughly the area of
present-day Kenya, to ensure economic development and possible
military supervision. Despite being dubbed ‘the Lunatic Line’ by
its detractors, the railway was a huge logistical achievement and
became strategically and economically vital for both Uganda and
Kenya.2
The railway was originally intended to link directly with the
Ugandan capital Kampala and the route had already been
surveyed. However political and economic pressure meant that a
quicker and cheaper alternative had to be found. A new route was
surveyed from Nakuru to the nearest point on Lake Victoria. The
line built to this nearest point was actually an interim solution. The
railway line eventually reached the shores of Lake Victoria at a
place called Port Florence, later renamed to Kisumu. Construction
of the line started at the port city Mombasa in 1896 and seven
years later the first train steamed into Port Florence Station
(fig.10).3
From 1903, the development of Kisumu was not only reinforced
by the fact that several stations were established within her
hinterland, but also by the fact that several ports were established
in Kisumu’s foreland (the term ‘foreland’ indicates ‘those
areas which are connected with that port by means of ocean
carriers’).4
Inception of the city layout
Between 1901 and 1909 part of the grid structure that determined
to a large extent the shape of the colonial town was put in place.
It was essentially a north-east, south-west grid, running at right
angles to Kisumu’s contours. Milimani, the European sector, was
located here at a high part of the ridge near the lake. This portion

27A SPATIAL ANALYSIS |
colonial town boundary railway new structuring element new development
500m 2000m
map 4: 1908
RAILWAY RESERVE
MILIMANI (european quarter)
(railwayworkers quarter)

28 A SPATIAL ANALYSIS |
satisfied the basic requirements of the British.5
The Railway Reserve –coming from Nairobi- entered the township
from the North and expanded in area to include the pier, the
station and accommodation for railway officers. To accommodate
the indent caused by the ‘bulging’ of the Railway Reserve from
the pier, a triangular section was inserted.
At the southern end of Milimani, the grid was adopted to run
along the ridge.
From this initial layout would develop an overall grid system,
which in turn was separated by the formation of race-specific
sectors.
The physical morphology of the township was thus determined
by the topographical features of the site which generated the
longitudinal direction of the orthogonal grid, and by cultural
segregation, which can be perceived as an independent layer over
these developments.
The overall grid structure of the town was already divided into two
distinct sections, namely the railway and colonial section. Each
had its own administration (Uganda Railways and Government
administration) and its own centre. This duality in administrative
structure forms the nucleus of the colonially segregated character
of Kisumu6. The Uganda Railways sector was mainly inhabited
by native Africans while the Government administration mainly
consisted of Europeans. There were even ‘strict colour bars in
residential accommodation’7. This duality has lived for many years
in Kisumu and has had a great influence on the overall layout of
the city structure.

29A SPATIAL ANALYSIS |
30
c_1929 mature colonialism
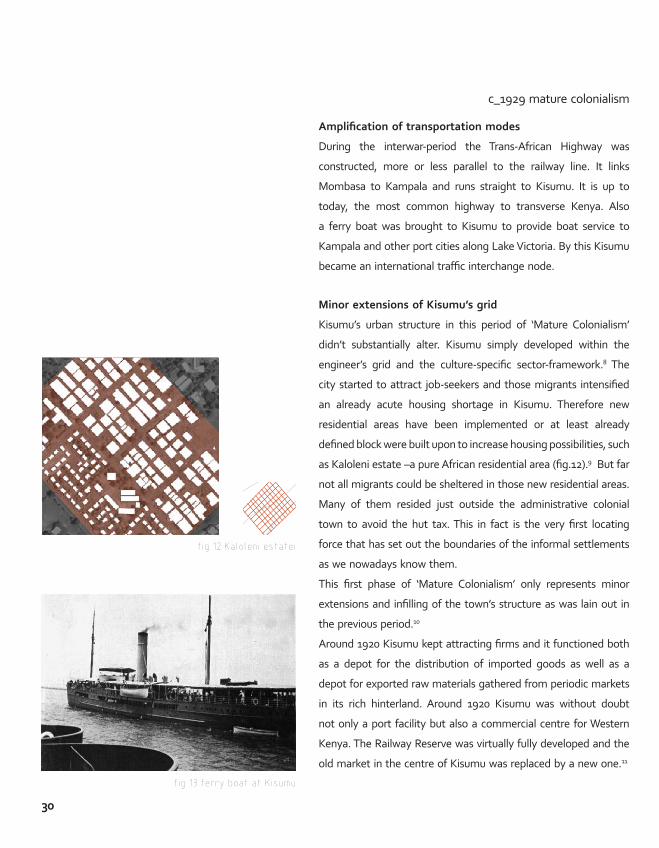
fig 12:Kaloleni estatei
fig 13:ferry boat at Kisumu
A SPATIAL ANALYSIS |
Amplification of transportation modes
During the interwar-period the Trans-African Highway was
constructed, more or less parallel to the railway line. It links
Mombasa to Kampala and runs straight to Kisumu. It is up to
today, the most common highway to transverse Kenya. Also
a ferry boat was brought to Kisumu to provide boat service to
Kampala and other port cities along Lake Victoria. By this Kisumu
became an international traffic interchange node.
Minor extensions of Kisumu’s grid
Kisumu’s urban structure in this period of ‘Mature Colonialism’
didn’t substantially alter. Kisumu simply developed within the
engineer’s grid and the culture-specific sector-framework.8 The
city started to attract job-seekers and those migrants intensified
an already acute housing shortage in Kisumu. Therefore new
residential areas have been implemented or at least already
defined block were built upon to increase housing possibilities, such
as Kaloleni estate –a pure African residential area (fig.12).9 But far
not all migrants could be sheltered in those new residential areas.
Many of them resided just outside the administrative colonial
town to avoid the hut tax. This in fact is the very first locating
force that has set out the boundaries of the informal settlements
as we nowadays know them.
This first phase of ‘Mature Colonialism’ only represents minor
extensions and infilling of the town’s structure as was lain out in
the previous period.10
Around 1920 Kisumu kept attracting firms and it functioned both
as a depot for the distribution of imported goods as well as a
depot for exported raw materials gathered from periodic markets
in its rich hinterland. Around 1920 Kisumu was without doubt
not only a port facility but also a commercial centre for Western
Kenya. The Railway Reserve was virtually fully developed and the
old market in the centre of Kisumu was replaced by a new one.11

31A SPATIAL ANALYSIS |
colonial town boundary railway existing structure new structuring element new development
500m 2000m
KALOLENI ESTATE
TRANS AFRICANHIGHWAY
map 5: 1929

32
d_1939 mature colonialism II
fig 15:homestead structures
fig 14:industrial sites
fig 16:Oginga Odinga road
A SPATIAL ANALYSIS |
A slight economic boom
The decade 1921-1931 can be characterized as a railway expansion
period in Western Kenya12. After World War I a new main line was
constructed from Nakuru on the original, more northerly route
around the head of the lake which eventually reached Kampala
in 1931. It reduced Kisumu to a branch line in the Uganda Railway
system. One year later the railway from Kisumu was extended
to Butere, a Kenyan town some 50 kilometres north-west of
Kisumu.
Despite some economic difficulties (as this railway expansion and
the Great Depression) people continued to migrate to Kisumu
town in order to trade in markets, look for jobs and a better place
to live. Around 1937 an anti-malaria campaign affected a larger
growth rate than expected. Two factors amplified this tendency,
namely the fact that gold was discovered in Western Kenya and
the fact that very prosperous sugar cane farming and refining
industries were in full swing in the neighbouring towns. The
growth of the town was also boosted by the fact that its airport
became a major link in the African air routes. Thus Kisumu was
becoming increasingly important as a modern commercial centre
in Western Kenya. This of course resulted in even a larger urban
movement.13
Further urbanisation
This urban movement also effected an increase in housing
demand. Outward additions took place in eastern-Milimani, Kibuye
residential area, the Artisan residential area and Nubian Village.
Colonial power relationships (race-specific neighbourhoods and
segregation on an environmental health basis), one can explain
the considerable distances between Milimani and Kibuye or
the Nubian Village (both approximately 2,5kilometers) and the
intervening open spaces in between.14

33A SPATIAL ANALYSIS |
colonial town boundary existing structural element existing structure new structuring element new development
500m 2000m
MILIMANI ESTATE
NUBIAN VILLAGE
KIBUYE ESTATE
ARTISANAREA
map 6: 1939
NYALENDA AREA

34 A SPATIAL ANALYSIS |
At this point a first concentration of homesteads has been noted
outside the town boundaries, at African Nyalenda.15
In colonial towns as Kisumu, the African inhabitants were usually
located in leeward, low-lying areas. Five African housing complexes
were established within the township boundary during this phase,
in a virtual belt around the existing structures. The ‘Nubian village’
(fig.11) is the only one that has not been dismantled in later
years because of health hazards.16 They nevertheless all had a
strong impact on the current layout of the city. Those areas with
African villages have been less developed during the colonial era,
eventually resulting in a development-gap between the colonial
core and the peripheral areas (the exact location of the other four
villages is unknown).
In response to the economic growth and to attract more
commercial activities to the town, a new periodic market called
Jubilee was erected at the cross point of Nairobi road and the
Jomo Kenyatta Highway. It nowadays still is the only market for
citizens who live in the centre of Kisumu.
In the northern part of town some factory sites were implemented
in the armpit of the railway lines entering Kisumu, completing the
industrial zone at the eastern shore of Lake Victoria. Later on, this
industrial area will spread towards the other side of the gulf.fig 11:Nubian village

35A SPATIAL ANALYSIS |
36
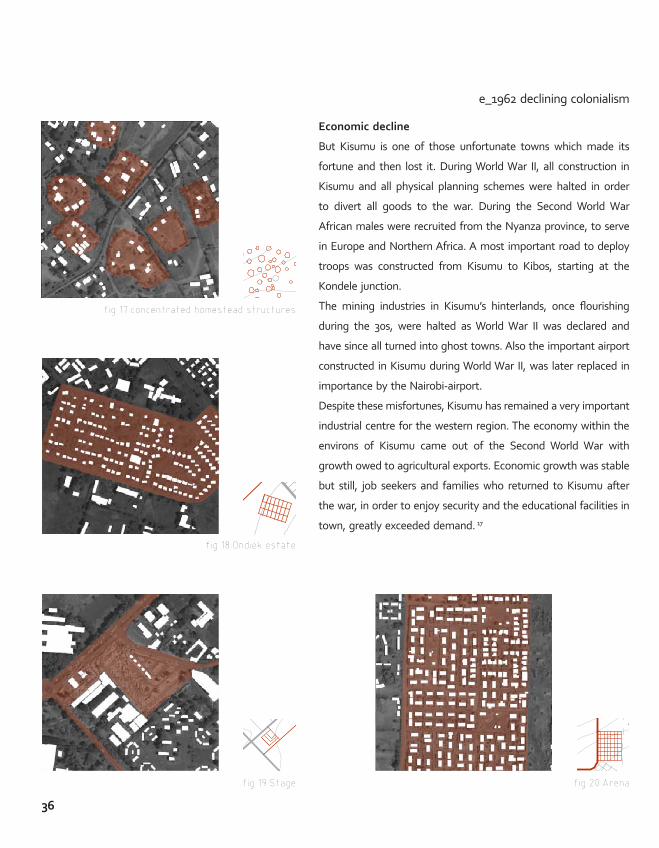
e_1962 declining colonialism
fig 17:concentrated homestead structures
fig 18:Ondiek estate
fig 19:Stage fig 20:Arena
A SPATIAL ANALYSIS |
Economic decline
But Kisumu is one of those unfortunate towns which made its
fortune and then lost it. During World War II, all construction in
Kisumu and all physical planning schemes were halted in order
to divert all goods to the war. During the Second World War
African males were recruited from the Nyanza province, to serve
in Europe and Northern Africa. A most important road to deploy
troops was constructed from Kisumu to Kibos, starting at the
Kondele junction.
The mining industries in Kisumu’s hinterlands, once flourishing
during the 30s, were halted as World War II was declared and
have since all turned into ghost towns. Also the important airport
constructed in Kisumu during World War II, was later replaced in
importance by the Nairobi-airport.
Despite these misfortunes, Kisumu has remained a very important
industrial centre for the western region. The economy within the
environs of Kisumu came out of the Second World War with
growth owed to agricultural exports. Economic growth was stable
but still, job seekers and families who returned to Kisumu after
the war, in order to enjoy security and the educational facilities in
town, greatly exceeded demand. 17

37
MANYATTA AREA
A SPATIAL ANALYSIS |
colonial town boundary existing structural element existing structure new structuring element new development
500m 2000m
map 7: 1962

38 A SPATIAL ANALYSIS |
The urge of housing projects
In the first national population census of 1948, Kisumu had a
population of approximately 10 000. In 1960 this number doubled
and half of them lived in the peri-urban environment by then.18
New housing was urgently needed and several town developments
took place. But Kisumu had a unique problem: the tenant
purchase scheme of houses within the city could not compete
successfully with the cheaper accommodations that already
existed in the peripheral areas of Kisumu. It was stated by the DC
of Central Nyanza that ‘no African Housing in Kisumu town would
be a possibility until the development of peri-urban dwelling came
under control.’19
This is the first time that the slum-area20 is indicated as a problem
area, here because of its cheaper alternative and thus, in a kind
of indirect gentrification process, keeping the poorer segments of
population out of town, only allowing the more wealthy.
Unfortunately, despite the physical planning and construction
that took place within Kisumu’s colonial town boundary, septic
systems in the peri-urban areas remained totally unregulated.
This was because the two local governments (the municipality of
Kisumu and the ADC of Nyanza) failed to pool their resources to
combat this common problem. Instead, they referred the matter
to a third party, the Ministry of Lands and Settlements.21
As before, the urban pattern of scattered developments within
the grid system continued. Only in these days one started also
to build housing projects for Africans. Several housing projects
were established in the north-eastern part of the colonial city
(e.g. in Kaloleni, Ondiek (fig.18), Arena (fig.20), under which site
and service schemes only providing basic supplies and a plot,
tenant-purchase houses and three-roomed houses for rental only
to Africans).22 Still those projects failed in quantity to solve the
inflow of the rural-urban migration.

39A SPATIAL ANALYSIS |
At Milimani the urban pattern grew steadily and slowly, still
keeping a 900 meters wide sanitary zone between the European
quarter and the African Nyalenda.
On the junction between Nairobi road and Jomo Kenyatta highway
behind the Jubilee market, a parking spot has been prevailed. It is
nowadays still the most important traffic node in the city, as well
for international, interregional and intern traffic (fig.19).
Forming of an informal centre
During this phase the peripheral zones encompassing the colonial
centre still had a typical ‘compound’ morphology, with a slight
concentration at the southern Nyalenda and the north-eastern
Manyatta (fig.17).
Many of the Africans that migrated to Kisumu settled in Nyalenda
during the colonial eras to work in Milimani as domestic servants.
Nyalenda has therefore always been a nucleus of growth because
it was the nearest location to the wealthy Milimani without
hut-taxes.
Since the decline of colonialism other locating forces started to
work on the job seekers. One wanted to start working in the
centre, in a self-subsistence manner or in a larger company.
Therefore it was necessary to have easy access into the city. The
new junction in the north of the town provided such accessibility.
It also provided enough “movement” to start self-subsistent
informal activities, such as hawking and small scale commerce.
The latest housing projects in the east of the colonial boundaries
also reduced the ‘empty-land’ gap between the vivid colonial
centre and this peri-urban zone. It since only grew as a favourable
spot for self supporting marketers and jobseekers to settle.
So while in the city centre Jubilee became a hotspot for interna-
tional traffic and commerce on the city scale, Kondele in the north
became an informal contra-pole, a hotspot for informal marketers
and local traffic.

40
f_1976 post colonialism
fig 21: informal settlement
A SPATIAL ANALYSIS |
Facing autonomy
The republic of Kenya became independent in 1963. With the end
of colonialism and the departure of the British, the former political
relationships were reversed, and decision making was in the power
of Africans for the first time since the founding of modern Kisumu
Town. In the first years of independency Kisumu suffered under
a regime of diminishing local authority power –and finances-
while still under an increasing population pressure coupled with a
slow pace of industrial development. Later the breakdown in the
functioning efficiency of the town planning machinery contributed
significantly in Kisumu’s present deteriorated infrastructure and
poor environmental conditions.23 Local authorities did not have
enough authority to handle the increasing flow of immigrants
appropriately. These settled in a most informal way between the
saturated homestead-tissue, increasing the density enormously
(fig.21). These tissues lack every form of basic sewage, water
supply or accessibility.
However, the post-colonial period was not totally without its
gains. The administrative border of the municipality was enlarged
almost twenty times in area in order to plan for a vastly increased
population and accommodate future urban land requirements
(map.9). Kisumu was chosen by the World Bank for experiments
in peri-urban housing and environmental upgrading.
Kisumu’s public housing policies followed closely the national
trend, inviting UN experts to study the situation and make
recommendations.
In 1972 some 30 000 people lived within the old colonial town
boundaries, another 53 000 -who worked in the old town- lived
in the peripheral areas where accommodation is not up to the
standard of living required.24

41A SPATIAL ANALYSIS |
colonial town boundary existing structural element existing structure new structuring element new development
500m 2000m
ARENA II
KONDELE
NYALENDA
map 8: 1976

42 A SPATIAL ANALYSIS |
Saturation of the periphery
The cooperation with the UN resulted in the some social housing
estates in the east of the old colonial town, such as Shauri Moyo
and Arena II. The wealthier Milimani has further developed until it
has reached the ‘boundary’ of the old colonial town.
Where in 1962 one only noticed a concentration of homesteads
in the periphery, an aerial photograph of 1976 clearly indicates
a ‘dispersed blob’ around Kondele and at Nyalenda, signifying
the uncontrolled densification between the original homesteads
(fig.22).25
map 9: enlarged municipal boundary

43
fig 22:aerial photograph of 1976
A SPATIAL ANALYSIS |

44
g_1990 post colonialism II
fig 23:Migosi estate
fig 24:Manyatta Upgrading Project
A SPATIAL ANALYSIS |
Informal settlements on the international agenda
The informal settlements have become an urgent point on the
political agenda and first attempts to restore urban qualities have
been made.
Three urban projects have been implemented from 1975 till
1985, as a collaborative effort between the World Bank and
the Government of Kenya, to meet the needs of low-income
housing population of Kenya. Those development projects aimed
at benefiting the poor, by the ‘basic needs approach’ which
dominated the international thinking in the 1970s. The First
Urban Project mainly concentrated on Nairobi, the second project
situated itself at Nairobi, Mombasa and Kisumu, the third and last
covered five secondary towns in Kenya.
The Second Urban Project focused in Kisumu on ‘Site and Service
schemes’ in Migosi (fig.23) and on the ‘Manyatta Upgrading
Project’ (fig.24).26
Upgrading schemes of the informal settlements
Around the late 1970’s the Migosi Site and Service schemes were
launched by World Bank and the Kenyan government to provide
adequate land for low-income housing development. Plots (“site”)
were serviced (“service”) with water reticulation, sewerage and
roads, and were targeted at low-income groups. In the event,
most low-income beneficiaries sold their plots, most of which
ended up being developed by medium- and high-income groups.
These “site and service” schemes have not met the objective of
providing space for the urban poor; instead, the schemes effectively
continued to marginalize the poor to areas with inadequate spatial
accessibility. People with higher incomes have moved into these
areas and inflated the rent market. Development for the urban
map 10: 1990 post colonialism II

45A SPATIAL ANALYSIS |
colonial town boundary existing structural element existing structure new structuring element new development
500m 2000m

46 A SPATIAL ANALYSIS |
wealthier thus leapfrogged the slum belt.27
Initially the Upgrading Projects for Manyatta -as a new road
layout- were meant to be implemented in most of the slum belt
areas. Due to financial and political reasons only the Manyatta
area received a new road layout. Unfortunately those roads,
engineered at the 1970’s, were worn out by 1990 because of poor
construction standards.28
Planning devices
In the planning of post-colonial Kisumu two documents were of
great importance; the ‘Short Term Development Plan’ of 1969 (that
dealt with the long term planning of Kisumu up to the year 2000,
map.12) and the ‘Kisumu Structure Plan 1983-2013’ (that provided
a framework on which the future short-term development plans
can be based, map.11).
This Structure Plan has been replaced by a new one several years
ago.
The structural similarities between the two plans were the
envisaged expansion northward and westwards along the northern
lake shore.

47A SPATIAL ANALYSIS |
map 12: Short Term Development Plan
map 11: Kisumu Structure Plan 1983-2013

48
C. Spatial Features of Kisumu
A SPATIAL ANALYSIS |

49250m 1000m A SPATIAL ANALYSIS | 49
fig 25: aerial photograph
50
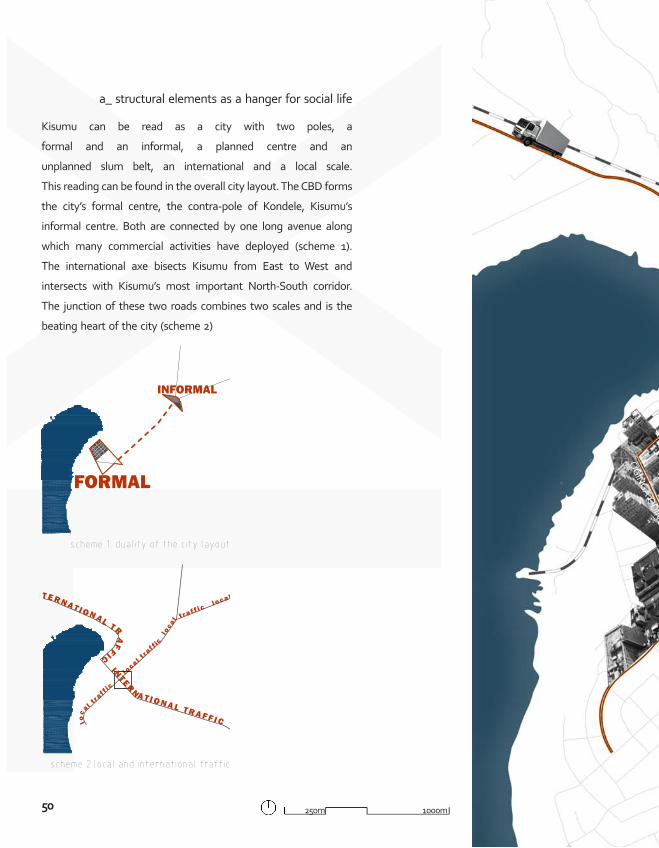
XL a_ structural elements as a hanger for social life
OGIN
GA ODIN
GA ROAD
FORMAL
INFORMAL
scheme 1: duality of the city layout
lo
c al t
raf f ic
l o
ca l tra f f i c
loca l t ra f f ic l oca l t ra f f ic
I N T E R N A T I O N A L T R
AFFIC I N TERN A T I O N A L T R A F F I C I N
TERN
AT IO
NA
L
scheme 2:local and international traffic
250m 1000m
Kisumu can be read as a city with two poles, a
formal and an informal, a planned centre and an
unplanned slum belt, an international and a local scale.
This reading can be found in the overall city layout. The CBD forms
the city’s formal centre, the contra-pole of Kondele, Kisumu’s
informal centre. Both are connected by one long avenue along
which many commercial activities have deployed (scheme 1).
The international axe bisects Kisumu from East to West and
intersects with Kisumu’s most important North-South corridor.
The junction of these two roads combines two scales and is the
beating heart of the city (scheme 2)

51
JOMO KENYATTA AVENUEOTIENO OYOO STREET
NAIROBI ROAD
OGIN
GA ODIN
GA ROAD
KIBOS ROAD
BUSIA ROAD
KAKA
MEG
A R
OA
D
A SPATIAL ANALYSIS |
1
2
3
51
map 13: structural elements

52
fig 28: Kibuye open air market (2 on map)
fig 26: unloading of a bus at buspark
Kisumu’s physical layout has a heavy colonial input and is strongly
related to its mainly transactional character.
Until today the borders of the colonial centre are still clearly distin-
guishable. The majority of the shores of Lake Victoria is taken by
the railway station and harbour and has always been an industrial
zone characterized by its low public accessibility and diffusion
possibilities towards the lake.
Next to this industrial area lays Kisumu’s main commercial and
administrative centre. This CBD (Central Business District) is more
or less confined by the two main avenues crossing Kisumu; a
North-South corridor (Jomo Kenyatta Avenue) and an East-West
corridor (Otieno Oyoo Street) which is a direct extension from
the Nairobi road. These are by far the two most important roads
in the whole of Kisumu Town and are also the main entrances
of the city. At the cross point of these two roads one finds the
most important parking place where all traffic in town converges,
namely Buspark (fig.26). It lies directly next to Jubilee market
(fig.27) which is the biggest formal market in town. Along the
Jomo Kenyatta one also finds Kibuye (fig.28) –the second largest
open air wholesale market in Kenya – and Kondele (fig.29)–a large
informal market where slum dwellers come to purchase goods.
It is on these large roads and in the CBD that almost all social
life is taking place: working, meeting, resting, selling and buying,
waiting for a matatu, entertainment, etc.
fig 27: Jubilee market (1 on map)

53
fig 29: Kondele (3 on map)
fig 30: Jomo Kenyatta Avenue
2,5m 10mA SPATIAL ANALYSIS |
On the Jomo Kenyatta Avenue (fig.30 & section 1) one can also
find some other bigger functions, such as the town hall, major
markets, a central park, hotels, petrol stations and a shopping
mall. This road is the most vivid one in the whole of Kisumu.
Smaller handlers and hawkers sell their goods at the roadside of
the Jomo Kenyatta and bodabodas wait here for passengers.
At Kondele, the Jomo Kenyatta Avenue branches into two roads
going to different satellite towns namely Kibos and Kakamega.
This junction is located at Kondele, on the boundary between the
inner city and the slum area. This crossroad, a major interface of
different transport modes, is nowadays encroached by informal
marketers selling their goods to passer-bys.
section 1: Jomo Kenyatta Avenue.
53

54
fig 32: Busia Road
The Nairobi Road (fig.31), one of the main entrances of the city, is
a 6metres wide road and the primary transport road for goods in
and out the city to Nairobi and Mombasa. On this road different
large functions are located. A major mall - with movie-theatres,
shops and a petrol station- is one of the key objects on this road
along hotels and a museum. The high-income classes come here
for recreation and purchasing goods.
The Busia road (fig.32), another important access road, goes all
the way from Kisumu to Busia -Uganda- passing Kisumu’s airport.
It is mainly used for transporting goods to and from Kisumu. Along
this road, the main industrial sites are located making it one of the
largest formal employment sites in Kisumu.
fig 31: Naïrobi Road

55
fig 33: Oginga Odinga Road
fig 34: End of Oginga Odinga Rd opening up to the lake
A SPATIAL ANALYSIS |
Another vivid and important passage is the spacious Oginga
Odinga Road (fig.33), limiting the CBD at the Eastern side. One
can find various shopping malls here, several supermarkets,
different banks, hotels, bookshops, hardware stores... It is the
only road in Kisumu where you can find such a high density of
shops. It is also the only road where almost every matatu, riding
in Kisumu, drives on. This more or less indicates its importance
on a city scale. Because of its gravity, the Oginga Odinga Road
has attracted a lot of informal commercial activities. Most of it
has settled under the sheds on the footpath, occupying more
than half of it (section 2).
At the end of this road (fig.34), one catches a glimpse of the
lake where the Oginga Odinga Road turns into the Busia Road.
To reach this part of the lakeshore -which is the only recreational
waterside in the whole of Kisumu- one must cross the railway
first. Here, small scale hotels are located, restaurants are serving
fresh tilapia and drivers come to wash their cars, busses or
trucks.
2,5m 10m
section 2: Oginga Odinga Road
55

M56
fig 35: road reserve for bypass in the west
fig 36: Kibos road in the north
fig 37: Koyango road in the east
100m 400m A SPATIAL ANALYSIS |
Manyatta area is mainly confined by two passages namely the
Kibos Road (fig.36) -which is a spin-off from the Jomo Kenyatta
Avenue- and a 30meters road reserve (fig.35). This road reserve is
the harsh demarcation area between the planned centre and the
arbitrary formed informal settlements. A less explicit boundary
is the Koyango Road (fig.37), a bigger non-asphalted road with
a more rural character from where the density of the slums
decreases, sprawling out towards Kisumu’s hinterland.
Corner Legio Manyatta Primary School Manyatta market31 2

57A SPATIAL ANALYSIS |
KIBOS ROAD
ROAD
RESERVE
KOYA
NG
O RO
AD
TARMAC RO
AD
1
2
3
Manyatta market
57
map 14: structural elements

582,5m 10m
section 3: Kibos Road
The Kibos Road is a vibrant avenue with a couple of large
timber-yards for wood working, big hardware stores, hotels, small
shopping malls, plenty of informal side road shops like barbers,
butchers and vegetables vendors and hawkers. The actual
building-line lies some meters further than the roadside, leaving
a rather large non-asphalted piece of ‘free’ land consumed by
different users (section 3). Informal side road shops have room in
abundance to encroach this site and also the permanent shops are
taking their share of this open space. They use it as workspace or
as an open air gallery for their merchandise. While their shop, the
actual structure standing at the building-line, is generally merely
used as storage (fig.38).
To pick up or drop off passengers, the matatu driver simple halts
on this piece of ‘open’ land. The lack of designated compulsory
stops leads to congestion or dangerous traffic situations. On
the road itself one can also find another confrontation between
different users with a different velocity. There is no division in
road-ways forcing all matatus, bodabodas and handcarts on the
same asphalted roadside. This leads to a conflict in speed and in
that way leads to congestion, dangerous cross manoeuvres and
difficult traffic situations (fig.39).
fig 38: working at the roadside
fig 39: road conflict

59A SPATIAL ANALYSIS |2,5m 10m
section 4: Tarmac Road
fig 40: Tarmac Road through Manyatta
fig 41: Corner Legio
There is a tarmac road (fig.40 and section 4) going all the way
from the Kibos Road through Manyatta area to the 30meters
road reserve, making Manyatta the most and best accessible
slum area in the whole of Kisumu. At Corner Legio (fig.41)-the
junction between the Kibos Road and this tarmac road- a small
informal market has invaded the open space in front of the
permanent shops. On the tarmac road one can find several
schools –from which Manyatta Primary School is the largest, a
social hall called Kosawo, some churches, Manyatta Market and
small informal side road shops accumulated at other secondary
junctions.
The 30meters non-asphalted road reserve –which is to become
the bypass- is not a very busy road nowadays. Some trucks are
using this sandy pass-through, but most ones prefer driving
through the city centre with its good asphalted roads. Nowadays
this piece of no-man’s-land is primary used by bicycles and
pedestrians. At the roadside one can find mainly residential
buildings, a mosque and some small shops.
59
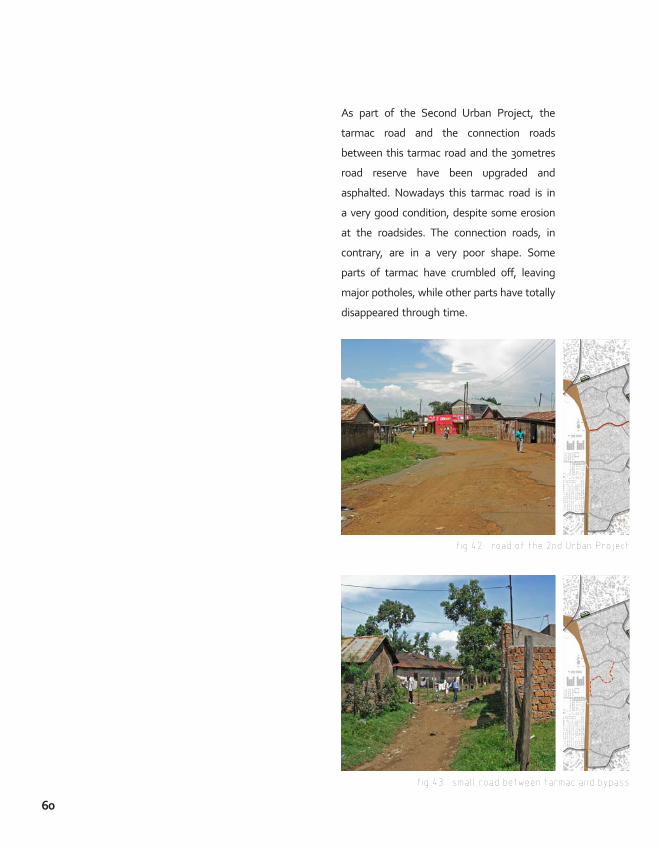
60 A SPATIAL ANALYSIS |
As part of the Second Urban Project, the
tarmac road and the connection roads
between this tarmac road and the 30metres
road reserve have been upgraded and
asphalted. Nowadays this tarmac road is in
a very good condition, despite some erosion
at the roadsides. The connection roads, in
contrary, are in a very poor shape. Some
parts of tarmac have crumbled off, leaving
major potholes, while other parts have totally
disappeared through time.
fig 42: road of the 2nd Urban Project
fig 43: small road between tarmac and bypass

61A SPATIAL ANALYSIS |
At the other side of the tarmac road, the
roads -connecting it to Koyango Road and
Kisumu’s hinterland- were not asphalted at
all. Nowadays these sandy roads are merely
pathways and motorised traffic is almost
impossible due to the bad road condition.
Koyango Road, a narrow sandy connection
between the Kibos Road and the lower
part of the tarmac road, is not accessible
by matatu or car. The main transportation
modes used here are the bicycle, handcart
or walking. On this road one can find several
schools, some churches, a small formal
market –Koyango Market- surrounded by
informal encroachments and grain mills.
Crossing Koyango Road, some large rural
roads are connecting the slums to Kisumu’s
hinterland.
fig 44: road between tarmac and Koyango
fig 45: small road between tarmac and Koyango fig 47: small rural road
fig 46: large rural road

62
XL
250m 1000mA SPATIAL ANALYSIS |
official open public space formal markets taken public space
b_ public spaces
In Kisumu one can distinguish three types of public places.
One can find formal open spaces planned by the municipality,
formal markets which have a strong ‘public space character’ and
encroached sites on which the everyday life plays. Those three
types are closely correlated to the social status of the surrounding
inhabitants.

63A SPATIAL ANALYSIS |
1
2
3
4
9
8
7
6
5
63
map 15: public spaces

64
fig 49: African part of town (2 on map)
fig 48: Sportsground (1 on map)
A SPATIAL ANALYSIS |
Formal public space as recreation
In the richer city centre one can find mainly officially planned
public space, of which Sportsground –located in the middle of the
CBD- is the most attractive (fig.48).
It is an open piece of land with a dense green border in the vivid
city centre where several crusades, festival, happenings, sport
matches, etc. can take place. The trees offer shadow and thereby
it is a perfect resting, meeting and eating place. During the day
one can find a lot of people lying in the grass, sitting on a bench,
walking in the park or buying popsicles from a hawker.
In the African residential areas in the north and the north-south
of the city one can find several open spaces (fig.49) in between
the patchwork of housing estates. Those open spaces rarely have
trees and are not visited as frequently as Sportsground. They more
serve as focal points for the surrounding plots, as “neighbourhood
squares”.

65
fig 50: Jubilee market (3 on map)
fig 51: Kibuye market (4 on map)
fig 52: Manyatta market (5 on map)
A SPATIAL ANALYSIS |
The market as a meeting place
The second type of public space we distinguish are markets.
They serve as focal points on a large scale and due to the African
tradition of “going to the market” they are always very crowded.
People just like to hang around and join the enjoyable turmoil.
The two most important markets inside the town boundary
are Jubilee market (fig.50) and Kibuye market (fig.51). While
Jubilee market mainly consists of a permanent structure,
crammed with people selling their goods, the major part
of Kibuye market consists of temporary structures or
people sitting on the ground using umbrellas for shadow.
Within the slum area one can find another meaningful market,
namely Manyatta market (fig.52) which is the only formal market
in Manyatta. During our fieldwork in Kisumu, the municipality
was, in cooperation with UN-HABITAT, building a permanent
structure to house the marketers of the old open-air market.

66
fig 53: road side shops
fig 54: Kondele (6 on map)
A SPATIAL ANALYSIS |
Encroached open space for everyday life
The last form of public place is a more smeared one and aims at
open spaces in the urban tissue occupied by informal marketers
–but were not originally meant as a public place.
The largest space consumers are several side
road shops, informal restaurants and hawkers
that have settled on important streets (fig.53).
The most striking example is Kondele (fig.54) where an entire
informal market has settled on a road-reserve (in preparation of
the bypass the informal market has completely been torn down).
Because it is the only open space in an area where little official
public space is foreseen, it has become a vivid public space.
Its strategic position –on a major junction along the boundary
between the inner city and the slum area- only enforces the
weight of this public space, since it is the only exchange point
between these two different tissues. Nowadays it works for the
slums as the CBD works for the city, it is the informal opposite
pole of the formal CBD. It is a meeting place, a major informal
employment site, used for crusades and musical performing,
a resting place and an important traffic interchange node.

67
fig 55: Corner Legio (7on map)
fig 56: Carwash (8 on map)
fig 57: Koyango market (9 on map)
A SPATIAL ANALYSIS |
Inside the slum area one can find also smaller informal sites
where people have encroached the public space. Most traders
are seated at major cross roads or at roadsides whit a lot of
passer-bys. Corner Legio (fig.55) and Carwash (fig.56) are two
examples. They are located on important cross points between
the Kibos Road and roads entering Manyatta. Koyango market
(fig.57) is a small informal market in the slum area with a more
rural character.

68
XL c_Vegetation, a socio-cultural element
A SPATIAL ANALYSIS |250m 1000m
When we look at a map of the vegetation in Kisumu’s urban
structure and its surroundings, we notice some different patterns.
When one projects this map of vegetation on a map of social
groups and their respective status on the social ranking, one can
already understand a great deal of the implantation.
inaccessible green areastrees casting private shadowtrees casting public shadow green area in urban tissue
1
8

69A SPATIAL ANALYSIS |
2
3
4
5
6
7
9
10
69
map 16: vegetation

70 A SPATIAL ANALYSIS |
fig 59: Arena Estate (2 on map)
fig 60: Mosque public housing estate (3 on map)
Milimani & Tom Mboya Estate
First of all, we notice an important density of trees in
the wealthier areas of Kisumu, namely Milimani and Tom
Mboya Estate. Those are also the areas with the highest
concentration of older and thus larger trees, especially in
Milimani (fig.58), which is the oldest part of town. Since
these areas are more modelled to European standards,
one can find broad avenues ornamented with rows of
trees. One can strongly feel the Western mentality here
and nearly all families have cars. Their daily curriculum
goes from the carport, through the avenues, up to the
parking of the mall or the hospital, straight to their work,
back home along the broad avenues and directly into the
carport. In those area’s one finds little social life on the
streets and everything is organized in ‘capsules’29. The
trees on those avenues thus mainly fulfil an ornamental
and aesthetic function, apart from the few pedestrian
who can take advantage of their shadow. Inside the plots
though, one notices an abundance of trees, but those are
for private use only.
Public Housing estates
In the area with mainly public housing estates (in the
north and in the east of the city) one has planted trees
with a much more sparing hand (fig.59 & fig.60). Publicly
planted trees were not a primary issue when this area was
developed through the years. As a result much less trees
are found on public places, even though most social life
for the middle-income class plays on this public places.
Social interaction is concentrated around several gathering
places; open spaces foreseen in the maze of different plot
systems. The majority of trees stands on private plots and
public ‘squares’ are little provided with the blessing shade
fig 58: Milimani Estate (1 on map)

71A SPATIAL ANALYSIS |
fig 61: Manyatta informal settlement (4 on map)
fig 62: Obunga informal settlement (5 on map)
of trees.
Peri-Urban areas
In the peri-urban areas one can distinct two ways of
tree usage. The first one is mainly noticeable within the
belt of informal settlements. One notices a scattered
pattern of trees looking randomly planted in between
the highly dense tissue of small-scale houses. All of them
are on private land since there is hardly any official public
domain left in these areas -public roads are the only public
available land here, the rest is private. But this is only a
formal way of looking. In reality most of the ‘private plots’
are not clearly distinguishable from the ‘public domain’.
The closer to the major roads, the more one has fenced
his domain, but deeper into the informal settlement,
public and private form one continuum without any clear
boundaries. One can go nearly everywhere he wants even
if it is on ‘private land’ and thus trees –and the wanted
shade- have become a common good. In these areas the
‘African tradition’ is more vivid than within the colonial
town, which means trees are gathering places, places
where the villagers come together to discuss important
matters and where
“the bride marries the brume”(fig.61 & fig.62). It was
clearly noticeable that trees in the slum area played a
different role than within the town boundaries. In these
areas with great job-insecurity trees are also a matter of

72 A SPATIAL ANALYSIS |
fig 63: sisal demarcating a homestead (6 on map)
fig 65: Green area along the lake shore (8 on map)
fig 64: Sportsground (7 on map)
self subsistence or used as income generators, which we
noticed during our fieldwork.
The second pattern to be observed outside the town
boundary is that of the original homesteads. One can
clearly distinguish the circular or semi-circular patterns
in the rural landscape. This is an indigenous inheritance
-ordered by unwritten cultural norms- originally realized
with sharp edged vegetation to protect one’s homestead
against predators and hostile clans. It was also a means of
demarcating one’s possession in the early days when there
were no official demarcations. Therefore it was usually
done with sisal, a plant with rather deep-going roots and
thus not easily removable (fig.63). Those sisals were used
for rope making. There was only one major entrance to
the homestead, to avoid unwanted escape of the cattle or
unwanted entrance of others. The cattle used to be kept in
the middle of the circle in a kraal, so originally the middle
of the ‘circle’ was kept free of trees to avoid unnecessary
obstacles. Nowadays, many households within the Munici-
pality of Kisumu have abandoned cattle-keeping and the
empty space in the middle is used for tree planting -not
only for shade but also as a mean of food and income
generator.
Exceptions
Within these four major patterns there are some concen-
trated irregularities. One for instance is the main public
square in the colonial town centre, namely Sportsgrounds
(see fig.64). A combination of sports grounds at one side,
an empty public square at the other side with a café-res-
taurant in the middle that strikes a bit colonial encompassed
with an explosion of green. This is one of the few green
public spaces in the city (the other one is at the other
side of the Jomo Kenyatta avenue) and is very frequently

73A SPATIAL ANALYSIS |
fig 66: Kibuye open air market (9 on map)
fig 67: trees along a main axial road (10 on map)
used. People come here to lie in the grass and enjoy the
refreshing shade of large trees. Unlike Europeans, Africans
are truly comfortable with having a little nap in the shade
on a public place. These rare green spots in the city-centre
are thus a great attraction pole to all classes.
Another irregularity is the Colonial Square within Milimani,
also a rather green spot but less frequently used because
of the preceding argumentations. It has also lost its centre
function since it is mostly surrounded by residential
functions these days.
A last irregularity to be mentioned are the two strokes of
dense green along the lake shores (the northern and the
eastern shore). Those areas have low entrance possibilities
and are not for a specific use (fig.65).
When we look at the main public places where, as we
stated, most ‘public life’ engages, we notice that only
Sportsgrounds has a real green character. Kibuye, the large
open air market, is nearly without any form of vegetation.
Shadow is provided through small sheds but the majority
of marketers have to help themselves with unhandy
umbrellas (fig.66).
Kondele used to have some trees within its market, but
also very little. These days all trees have been torn down
off course in preparation of the bypass.
The main axial roads have some trees along them and
those shaded spots are obviously more frequently taken
to settle one’s business (fig.67). Some of those trees are
purposely planted on those broader avenues but very

74
XL d_Different Tissues within the town boundaries
A SPATIAL ANALYSIS |
One glance at the aerial photograph of Kisumu is enough to
notice the perfectly sharp edge between two strikingly different
urban tissues; the old colonial city centre with its aligned layout
and the band of informal settlements, only separated by a thirty
meters wide no-man’s land. This alienated environment is the
result of half a century colonial policies, which is described in the
historical morphological analysis.
The physical appearance of this harsh boundary changes over its
length. Down in the south a single road and a stroke of a rather
open tissue with a large urban grain on the ‘colonial’ side make
the boundary. The boundary at the eastern side of town is the
only one that has been softened a bit by two crossroads, which
are linking the two totally different tissues in some way. Mostly
the two adjacent tissues have no cross-links at all, which enforces
the spatial and mental ‘gap’ between them. Up in the north the
‘colonial’ tissue has turned its back entirely against the informal
settlement opposing it. The no-man’s land and the backside of the
‘colonial’ tissue make the boundary.
When we take a closer look at the different tissues within Kisumu
we notice 3 large fractions. The first one consists of the commercial
and industrial areas. The second one is the combination of all
aligned residential areas within the colonial town boundaries. A
last one is the clearly distinguishable peri urban area.
250m 1000m

75A SPATIAL ANALYSIS | 75
map 17: different tissues

76
The first one is the industrial area and the adjacent central
business district (CBD) (fig.68). The CBD lies in the armpit
of the axial road system according to the logics of Kisumu’s
constitution –the administrative and transitional centre.
The northern industrial tissue, which mainly consists of
the primary sector –storage of natural resources and first
changing into primary products- has logically grown between
the international highway and the railway lands.
The southeastern ‘light industrial’ area, which mainly
embodies the tertiary sector -the provision of services to
businesses as well as final consumers- dates from a later era.
During colonial times, this piece of land was kept empty as
a buffer between the European residential quarters and the
peri-urban African settlement. After colonialism, this vacuum
was filled in with large plots for the tertiary sector, resulting
in a rather impersonal and empty streetscape.
fig 68: main industrial sites & CBD
fig 70: industrial site
fig 69: CBD
light industrial area
industrial area
CBD commercial area

77A SPATIAL ANALYSIS |
The second major fraction encloses the residential areas
whithin the town boundaries (fig.71).
Milimani -the former European quarter (fig.72)- lies next to
the city centre on the gentle slopes of the lakeshore with a
sight on Lake Victoria. It has a pattern of broad avenues and
large plots –with a very low density- according to the ‘garden
city model’ to which many colonial cities have been shaped.
In the northern part of town, one can find a similar pattern
in Tom Mboya Estate and along the Jomo Kenyatta Avenue
–more or less the former Indian residential quarters.
These high-standard estates differ strongly from the
low-standard ones -the African estates- which form the
last major component within the boundaries of the colonial
centre.
As we have outlined during the historical morphological
analysis, the African residential parts lie in the eastern quarter
of the town (after independence in 1963 also a small part of
social housing projects was erected between Tom Mboya and
the industrial zone). These parts of town have a small-scale
tissue with a rational rectangular street pattern, according to
the logics of a public housing estate.
These blocks have been partitioned into small plots, enclosed
by an orthogonal raster of small streets (fig.73). Each plot
bears one single-family dwelling. The density of these blocks
is much higher than the density in the high-standard areas,
but nevertheless it remains rather low because it are all single-
family dwellings–a space consuming concept. Social housing
in the form of building blocks is rarely used in Kisumu even
though the demand for housing was very high.
These separate housing estates form a patchwork of networks
linked to each other by a couple of asphalted roads. Although
these are the main enclosure roads through this patchwork,
pedestrians often take the smaller and more direct unpaved
roads to reach their destination.
fig 71: residential sites
fig 72: Milimani Estate
fig 73: public housing estates
100m
high income residential
low income residential

78
fig 74: peri-urban areas
Outside the town boundaries one can distinct a third major
fractions. It embodies two different tissues; one is the highly
dense informal settlements and the second is the low density
rural extensions (fig.74). There is no clear boundary between
these two tissues but the farther from the colonial city
centre, the more the one tissue sprawls out making room
for the other.
The first component is characterized by its low accessi-
bility, high density and deteriorated environs. It has
grown through the years from the indigenous homestead
structures, outlined in the historical morphological analysis.
The second component, which consists of rural homestead
structures, is clearly noticeable on the aerial photograph.
The circular or semi-circular shapes are recognizable figures
in the landscape of Kisumu’s hinterland, which is described in
chapter of vegetation.
informal settlements
rural area
fig 75: informal settlements
fig 76: rural extensions
A SPATIAL ANALYSIS |

79A SPATIAL ANALYSIS |

M80 100m 400m A SPATIAL ANALYSIS |
One glance at Manyatta’s figure ground is enough to notice the
huge density range inside Manyatta area. What used to be privately
owned homestead structures have developed into an enormous
tissue of arbitrary placed tenant configurations. Because buying or
hiring a structure in the city centre is a very expensive effort, most
people tend to live inside the slum area, for it is much cheaper
and yet as close to this vivid centre as possible.
As a huge amount of people are passing Kondele and the Kibos
Road, these sites have gained economic importance through
time. It is here that most of the shops –formal and informal- are
located, making this very dens tissue almost not permeable with
the exception of some major roads.

81A SPATIAL ANALYSIS |
KIBOS ROAD
ROAD
RESERVE
KOYA
NG
O RO
AD
TARMAC RO
AD
81
map 18: different tissues

82
fig 77: very dens tissue
fig 78: dens tissue with voids
fig 79: widely spread houses
A SPATIAL ANALYSIS |
Another very dens tissue is the one between the 30metres road
reserve and the tarmac road. It is a bit more permeable for there
are several major roads separating big parts of land (fig.77). A
network of different smaller paths is subdividing this tissue into
smaller plots where numerous structures are erected. Most of
the small plots don’t have a real front- or backside because the
buildings are clustered together leaving almost no free space in
between.
The middle part, between the tarmac road and the Koyango
Road is less densely built (fig.78. Although the structures are still
standing very close to one another, they are grouped around a
courtyard. These courtyards are little ‘gardens’ or green areas
where inhabitants cook or are hanging clothes to dry. Several
large pathways are dividing this tissue into large portions but
because of the more spread structures, there are less narrow
paths retraceable in this area. There is almost no free land left
and the pieces of open land that one can notice here, mostly are
over-proportioned playfields for schools.
Between the Koyango Road and Kisumu’s hinterland the structures
are spread in their green environment and are mostly standing
by themselves (fig.79). Small and narrow pathways between the
grass and trees link these structures to the major roads, which
in their turn are linking this part to the Manyatta area. On the
aerial photograph only this large passages are visible in between
the green open space.

83A SPATIAL ANALYSIS |
fig 80: neighbouring compounds
fig 81: Koyango school
fig 82: rural area

84
XL e_Transportation modes
Accessibility of places, and thus transportation and movements,
is a very important issue in relation to the economical and social
life in Kisumu. Markets designated on good accessible places
are more numerously attended, because of the larger number
of passer-bys in contrary to the less reachable ones. It is also in
this prospective that informal activities start to flourish at major
junctions and roads.
Public transportation is very commonly used in Kisumu as it is
a cheap way to cover a distance too far for walking. Going to
neighbouring towns or village’s one takes the bus but in the inner
city, the matatu is the primary used transportation mode.
250m 1000m A SPATIAL ANALYSIS |

85A SPATIAL ANALYSIS |
1
2
3
4
JOMO KENYATTA AVENUE
KIBOS ROAD
ROA
D RESERVE
KOYA
NG
O RO
AD
KAKA
MEG
A R
OA
D5
6
7
8
9
85
map 19: transportation modes

86
A matatu (fig.83) is a minivan that, legally, can carry up to 14
passengers (although they, most of the time, cram up to 22
passengers in their van) and costs 10 to 15shilling (or bob as it
is popularly called) for the normal trip. Every day the matatu
drivers have to obtain a legal document and place it at their
front window. This is an approval to drive, transport people
and especially to park at the official stopping-places. Most
matatu-drivers use a lot of non-designated, and thus illegal,
drop offs at different locations, they simply halt at the roadside,
performing dangerous manoeuvres and creating congestion.
The matatus, driving in the city, are using the Jomo Kenyatta
Avenue to get to and from Manyatta slum area. Coming from
Manyatta and driving through the city centre, the matatu makes
a small loop around Sportsground (1 on map) to rejoin the Jomo
Kenyatta. When the matatus reaches inside the slum area, they
do not establish a complete tour but they make a stop and turn.
For example: after driving in at Carwash (2 on map) and reaching
Migosi Market (3 on map), the matatu stops and drives back
instead of completing a possible tour of joining the Kakamega
Road.
A more striking example is the stop and turn in the heart of
Manyatta area: at Corner Legio (4 on map), the matatu drives
into Manyatta where he stops at Manyatta Market (5 on map) and
turns back. By this the eastern part of the city is not accessible
by matatu and one has to take another transportation mode to
reach or cross this part of town. It would be much shorter and
faster if the matatu would make a complete loop for example
from Sportsground, passing Kondele, into Manyatta area en then
driving through Arena Estate (6 on map) back to the city centre.
Instead it is now making a complete detour. People willing to go
from Manyatta market to the city centre or vice versa are now
forced to walk or take a bicycle taxi, a bodaboda, to cross this
fig 83: matatu
A SPATIAL ANALYSIS |

87
distance.
A lot of inhabitants of Manyatta visit or sell at Kibuye market
(7 on map) and therefore they have to cross the 30metres road
reserve to infiltrate the town centre via small roads. It is much
cheaper and shorter to walk via this shortcut instead of taking
the matatu all the way to the major market and therefore most
inhabitants are attending this route.
A SPATIAL ANALYSIS |

88
The bodaboda (fig.84) is another frequently used mean of
conveyance. It’s a single bike that can carry an extra passenger
at the back and costs between 10 and 40 shilling, depending on
the distance one has to cover. Every bodaboda needs an official
number plate as approval to transport people and at the back, the
bicycle has to be furnished with a cushion, a handle and two bars
to support the passenger’s feet. Waiting at important junctions
and roadsides, the bodabodas pick up passengers and bring them
wherever they want and return back to their fixed waiting place.
Because no bicycle tracks are foreseen in Kisumu, the bodabodas
are forced on the same roads as all motorised traffic, sometimes
leading to dangerous situations. In Tom Mboya Estate ( 8 on map)
there are no matatu tracks foreseen and the people living there
use a bodaboda for moving through the calm roads of the estate.
Also on the Koyango Road a lot of people take the bicycle to
move from one place to another.
Taxis or tuktuks (fig.85) are a less used means of conveyance due
to their higher price but they are preferred by the higher class.
A tuktuk is a motorized tricycle with a waterproof shed. It easily
costs more than 100shilling for a not to far drive. They pick up and
drop off wherever one wants.
For transporting heavy goods, one can hire a delivery van or a
handcart (fig.86). The handcart is the cheapest way for transporting
and thereby the most frequently used inside the slum area. In this
slum area, a lot of handcarts are transporting water because of
the lack of water pipes.
fig 85: tuktuk
fig 86: handcart
fig 84: bodaboda
A SPATIAL ANALYSIS |

89
At Kondele (9 on map), a major transportation node, a lot of
people are switching means of conveyance to reach further or
other places in Kisumu. It is the pre-eminent place for matatus,
handcarts and bodabodas to wait for new passengers. People
getting off the matatu take a bodaboda or walk to reach
their destination. The 30metres wide road reserve is used by
pedestrians (fig.87) and bodaboda as shortcut to cover distance
before infiltrating the slums.
fig 87: pedestrians at the bypass
A SPATIAL ANALYSIS |

90
XL f_ Spatial Dynamics
A SPATIAL ANALYSIS |
The main spatial (development) dynamics in Kisumu have happened along its major
axial entrance roads. The densest area of town –the CBD- lies in the armpit of these
axial roads. Stressed between the lakeshore and the Busia Road (the main axial entrance
road towards the west –to Uganda) lies the industrial area. This area is characterized
by its low public accessibility and diffusion possibilities towards the lake. The industrial
grounds are more or less fully developed and have no further expansion possibilities
here. A possible alternative location is at the other side of the lake where fabrics have
already been erected.
Furthermore, we notice that most public facilities (such as schools, hotels, court...)
have graft upon the axial roads, enforcing their importance. At the Nyalenda Road,
one also finds larger entities that serve the community (such as a water company,
electricity distributor ...) but that need less public accessibility. Along the Nyerere Road
one finds a similar process but on a much smaller scale. Different car mechanics have
settled along this road making this a parallel and informal equivalent of the larger
Jomo Kenyatta Highway.
The main spatial (movement) dynamics in Kisumu also happen along these axial
entrance-roads. The most vibrant part of town lies, as to be expected, in the centre
of the city where all axial roads converge. It is here that all movement starts, ends or
passes. These axial roads are the only means of crossing the city.
When we look at the different means of entering the city from inside the slum belt we
notice tree different intermediary mechanisms. In the north –where Obunga faces Tom
Mboya estate- there is only one single entrance possibility that gives out on Nyerere
Road. Tom Mboya forms a strong boundary that forces all pedestrians either first to
go to Kondele before entering the city or to use this one single passage. In the east
–where Manyatta faces different public housing estates- there is a high permeability
towards the city centre. There are two asphalted roads that link these tissues and
in between there are several non-asphalted roads that provide a good accessibility.
In the southeast –where Nyalenda faces Milimani estate- there are several entrance
possibilities but they are not often used by pedestrians. One reason is an assumed
‘mental boundary’ between the very high- and very low-income inhabitants. The other
one is the fact that there is very little ‘public life’ in the streets of Milimani, by which
there is no specific need of penetrating this area.

91A SPATIAL ANALYSIS | 91
map 20: spatial dynamics

92
XL g_ Vegetation on public spaces
250m 1000m
official open public space formal markets taken public spacetrees casting private shadowtrees casting public shadow
Shade on formal public spaces
When we impose the map of vegetation on the map with public
space one notices immediately the large density of trees in the
south-western formal public spaces. Sportsground (1 on map),
the Colonial Square (2 on map) in Milimani Estate and the public
square on the eastern side of the Jomo Kenyatta Avenue (3 on
map) are overwhelmed with trees. The public squares in the
northern and eastern part of town have nearly no trees.
Markets
Kibuye Market (4 on map), Jubilee Market (5 on map) as well as
the smaller markets in the informal settlements have nearly any
form of vegetation. The marketers shelter underneath roofed
structures or provide their own shadow by using umbrellas, as
mentioned earlier.
Shaded encroached open space
Within the city centre one can find ‘public shade’ along the major
roads. Marketers selling their goods at these roadsides are thus
using the shade of these trees. The Jomo Kenyatta Avenue and
the green triangle between Sportsground and Jubilee market are
overwhelmed with trees. The many people passing by these two
sites in combination with the abundance of trees makes them the
ideal places for erecting informal businesses.
At Kondele (6 on map), the few trees have been removed in
preparation for the bypass, leaving a large empty void without
any form of shadow.
In the informal settlements, many people are making use of
shadow casted by the few trees standing there. The people
encroaching the public space at important intersections are mostly
erecting their business in favour of the casted shadow.
2
A SPATIAL ANALYSIS |

9393
1
3
4
5
6
JOMO KENYATTA AVENUE
A SPATIAL ANALYSIS |
map 21: vegetation on public spaces

94
XL
A SPATIAL ANALYSIS |
h_ Transportation modes and the structural elements
250m 1000m
Several conclusions can be made when we combine the map of
transportation and structural elements of Kisumu.
The major roads of Kisumu are the ones most used by motorised
traffic. At the cross point between the Jomo Kenyatta Avenue
and the Otieno Oyoo Street trucks, cars, matatus, bodabodas and
pedestrians are crossing each other making it a very congested
place. With the coming of the bypass, not all traffic will be obliged
to pass the city centre as it is now. This will descend the pressure
on this junction.
At Kondele (1 on map) one can find larger infrastructure than in
the rest of the slum belt due to its good location and connection
with the inner city. Many people pass here and change means of
transportation, creating a vivid place as discussed earlier.
When one takes a closer look at the slum area, one notices that
Obunga (2 on map) has a poor connection with the inner city or
with other parts of the informal settlements. People therefore have
to walk or take a bodaboda to reach Kondele or the city centre.
In Manyatta (3 on map), the matatu drives all the way into the
heart of the slum, making this the best accessible one. Still, many
parts of Manyatta are not accessible for motorised traffic obliging
people to walk or take a bodaboda.

95A SPATIAL ANALYSIS | 95
1
2
3
JOMO KENYATTA AVENUE
OTIENO OYOO STREET
map 22: transportation modes and structural elements

96
references & notes
A SPATIAL ANALYSIS |
1 OJANY, FF, OGENDO, RB, 1973, Kenya: A Study in Physical and Human Geography, Longman Kenya Ltd, Nairobi, p.1
2 Lake Victoria is a major climate modulator in this area
3 ONG’ANGA, O, 2005, Lake Victoria and its Environs, Resources, Opportunities, and Challenges, Series: OSIENALA Series on Lake Victoria (Friends
of Lake Victoria) 2nd edition, OSIENALA, Kisumu, p.19
4 ONG’ANGA, O, 2005, Lake Victoria and its Environs, Resources, Opportunities, and Challenges, Series: OSIENALA Series on Lake Victoria (Friends
of Lake Victoria) 2nd edition, OSIENALA, Kisumu, p.20
5 The Luo are the third largest ethnic group in Kenya, after the Kikuyu and Luhya, who inhabit an area including southern Sudan, northern and
eastern Uganda, northern Tanzania and western Kenya.
6 UNHABITAT, 2005, Situation analysis of informal settlements in Kisumu, Cities without slums sub-regional programme for eastern and southern
Africa, Kenya Slum Upgrading Programme (KENSUP), UN-HABITAT, Nairobi, p.13
7 ANYUMBA, G 1995, Kisumu Town: history of the built form, planning and environment: 1890-1990, Series: Housing and urban policy studies,
Delft university press, Delft, p.55
8 ANYUMBA, G 1995, Kisumu Town: history of the built form, planning and environment: 1890-1990, Series: Housing and urban policy studies,
Delft university press, Delft, p.52
9 ANYUMBA, G 1995, Kisumu Town: history of the built form, planning and environment: 1890-1990, Series: Housing and urban policy studies,
Delft university press, Delft, p.55
10 ANYUMBA, G 1995, Kisumu Town: history of the built form, planning and environment: 1890-1990, Series: Housing and urban policy studies,
Delft university press, Delft, p.57
References:
http://www.riftvalleyrailways.com (museum of rift valley railways)
http://www.eac.int/ (East African Community)
2 | A SPATIAL ANALYSIS
A. A transition hub at the shores of Lake Victoria

97
1 ANYUMBA, G 1995, Kisumu Town: history of the built form, planning and environment: 1890-1990, Series: Housing and urban policy studies,
Delft university press, Delft, p.68-70
2 ANYUMBA, G 1995, Kisumu Town: history of the built form, planning and environment: 1890-1990, Series: Housing and urban policy studies,
Delft university press, Delft, p.100
3 ANYUMBA, G 1995, Kisumu Town: history of the built form, planning and environment: 1890-1990, Series: Housing and urban policy studies,
Delft university press, Delft, p.100
4 OBUDHO, RA, WALLER, PP, 1976, Periodic markets, Urbanization, Regional Planning, A Case Study from Western Kenya, Greenwood Press, X
(Westport?), p. 83
5 ANYUMBA, G 1995, Kisumu Town: history of the built form, planning and environment: 1890-1990, Series: Housing and urban policy studies,
Delft university press, Delft, p.100
6 ANYUMBA, G 1995, Kisumu Town: history of the built form, planning and environment: 1890-1990, Series: Housing and urban policy studies,
Delft university press, Delft, p.102
7 ANYUMBA, G 1995, Kisumu Town: history of the built form, planning and environment: 1890-1990, Series: Housing and urban policy studies,
Delft university press, Delft, p.102
8 ANYUMBA, G 1995, Kisumu Town: history of the built form, planning and environment: 1890-1990, Series: Housing and urban policy studies,
Delft university press, Delft, p.137
9 OBUDHO, RA, WALLER, PP, 1976, Periodic markets, Urbanization, Regional Planning, A Case Study from Western Kenya, Greenwood Press, X
(Westport?), p. 88-91
10 ANYUMBA, G 1995, Kisumu Town: history of the built form, planning and environment: 1890-1990, Series: Housing and urban policy studies,
Delft university press, Delft, p.137
11 ANYUMBA, G 1995, Kisumu Town: history of the built form, planning and environment: 1890-1990, Series: Housing and urban policy studies,
Delft university press, Delft, p.117-121
12 OBUDHO, RA, WALLER, PP, 1976, Periodic markets, Urbanization, Regional Planning, A Case Study from Western Kenya, Greenwood Press, X
(Westport?), p. 88
13 OBUDHO, RA, WALLER, PP, 1976, Periodic markets, Urbanization, Regional Planning, A Case Study from Western Kenya, Greenwood Press, X
(Westport?), p. 93
A SPATIAL ANALYSIS |
2 | A SPATIAL ANALYSIS
B. Historical Morphological Analysis
C. Spatial Features of Kisumu

98 A SPATIAL ANALYSIS |
14 ANYUMBA, G 1995, Kisumu Town: history of the built form, planning and environment: 1890-1990, Series: Housing and urban policy studies,
Delft university press, Delft, p.176-177
15 ANYUMBA, G 1995, Kisumu Town: history of the built form, planning and environment: 1890-1990, Series: Housing and urban policy studies,
Delft university press, Delft, p.167
16 OBUDHO, RA, WALLER, PP, 1976, Periodic markets, Urbanization, Regional Planning, A Case Study from Western Kenya, Greenwood Press, X
(Westport?), p. 93
17 OBUDHO, RA, WALLER, PP, 1976, Periodic markets, Urbanization, Regional Planning, A Case Study from Western Kenya, Greenwood Press, X
(Westport?), p. 94-97
18 OBUDHO, RA, WALLER, PP, 1976, Periodic markets, Urbanization, Regional Planning, A Case Study from Western Kenya, Greenwood Press, X
(Westport?), p. 96
19 OBUDHO, RA, WALLER, PP, 1976, Periodic markets, Urbanization, Regional Planning, A Case Study from Western Kenya, Greenwood Press, X
(Westport?), p. 96
20 Here we indicate the slum belt encircling Kisumu, as we nowadays know them
21 ANYUMBA, G 1995, Kisumu Town: history of the built form, planning and environment: 1890-1990, Series: Housing and urban policy studies,
Delft university press, Delft, p.193
22 ANYUMBA, G 1995, Kisumu Town: history of the built form, planning and environment: 1890-1990, Series: Housing and urban policy studies,
Delft university press, Delft, p.217
23 ANYUMBA, G 1995, Kisumu Town: history of the built form, planning and environment: 1890-1990, Series: Housing and urban policy studies,
Delft university press, Delft, p.231
24 ANYUMBA, G 1995, Kisumu Town: history of the built form, planning and environment: 1890-1990, Series: Housing and urban policy studies,
Delft university press, Delft, p.245
25 Survey of Kenya,1976, Nairobi
26 SYAGGA, PM, p.13-19
27 UNHABITAT, 2005, Situation analysis of informal settlements in Kisumu, Cities without slums sub-regional programme for eastern and southern
Africa, Kenya Slum Upgrading Programme (KENSUP), UN-HABITAT, Nairobi, p.45
28 ANYUMBA, G 1995, Kisumu Town: history of the built form, planning and environment: 1890-1990, Series: Housing and urban policy studies,
Delft university press, Delft, p.255
29. A term out: DE CAUTER, L, 2005, De capsulaire beschaving, Over de stad in het tijdperk van de angst, NAi Uitgevers, Rotterdam, p81

99A SPATIAL ANALYSIS |

100
Figures:
1-3: figure based on Google earth map, 2003
4, 7-10: figure based on GIS-file received from the Municipality of Kisumu in Jul-Oct 2007 (GIS-file based on aerial photograph Kisumu, 2003)
5-6. UNHABITAT, 2006, Kisumu Urban Sector Profile, Rapid Urban Sector Profiling for Sustainability (RUSP), UN-HABITAT, Nairobi
Maps:
1-4. map based on GIS-file received from the Municipality of Kisumu in Jul-Oct 2007 (GIS-file based on aerial photograph Kisumu, 2003)
1 | PROBLEM STATEMENT & HYPOTHESIS
figures, maps, schemes and section references

101
Figures:
1-3, 5-6, 26-47, 49-63, 65-67, 80-87: picture taken during fieldwork, Jul-Oct 2007
4: figure based on Google earth map, 2003
7-10, 13, 16: figure out: MWAMBURI, W and ADOLWA, P, powerpoint: Urbanization of Kisumu, Case Study on how Urbanization has Impacted on
Kisumu and How Related challenges are Being Addressed by the Municipal Council & Other Stakeholders, received from Betty Okero in jul-oct 2007
11-12, 14-15, 17-21, 23-25: figure based on the aerial photograph of Kisumu, 2003, received from the Municipality of Kisumu in Jul-Oct 2007
22: figure out: ANYUMBA, G 1995, Kisumu Town: history of the built form, planning and environment: 1890-1990, Series: Housing and urban policy
studies, Delft university press, Delft
48, 64: figure out: UNHABITAT, 2003, Kisumu city development Strategy, Lake Victoria Region City Development Strategy for Improved Urban
Environment and Poverty Reduction, UN-HABITAT, Nairobi
68, 71, 74: figure based on fieldwork in Jul-Oct 2007 and GIS-file received from the Municipality of Kisumu in Jul-Oct 2007 (GIS-file based on aerial
photograph Kisumu, 2003)
69-70, 72-73, 75-79: figure based on GIS-file received from the Municipality of Kisumu in Jul-Oct 2007 (GIS-file based on aerial photograph Kisumu,
2003)
Maps:
1: map based on Google earth map, 2003
2: map based on GIS-file received from the Municipality of Kisumu in Jul-Oct 2007 (GIS-file based on aerial photograph Kisumu, 2003)
3-12: map based on ANYUMBA, G ,1995, Kisumu Town: history of the built form, planning and environment: 1890-1990, Series: Housing and urban
policy studies, Delft university press, Delft
13-22: map based on fieldwork in Jul-Oct 2007 and GIS-file received from the Municipality of Kisumu in Jul-Oct 2007 (GIS-file based on aerial
photograph Kisumu, 2003)
Schemes:
1-2: scheme based on GIS-file received from the Municipality of Kisumu in Jul-Oct 2007 (GIS-file based on aerial photograph Kisumu, 2003)
Sections:
1-4: section based on photographs and fieldwork, Jul-Oct 2007
2 | A SPATIAL ANALYSIS
A. A transition hub at the shores of Lake Victoria
B. Historical Morphological Analysis
C. Spatial Features of Kisumu

102
KISUMU CITY, 2004, Consultation on Sustainable Urban Mobility (SUM), Kisumu City Council, Kisumu, p.1-41
KISUMU CITY COUNCIL and UN-HABITAT, 2004, The Kisumu City Environmental Profile on Sustainable Urban Mobility,
UN-HABITAT, X, p.1-56
MUNICIPAL COUNCIL OF KISUMU, 1981, Migosi Site and Service Scheme, Housing Department, Kisumu, p1-12
MUNICIPAL COUNCIL OF KISUMU, 2006, City Development Strategies (CDS) Guidelines, Experts Group Meeting, Lake
Victoria City Development Strategies for Improved Urban Environment and Poverty Reduction, Centre for Development &
Planning Management (CDPM), Municipal Council of Kisumu, Kisumu, p.1-9
MINISTERY OF ECONOMIC PLANNING AND COMMUNITY AFFAIRS, 1978, A Review Of Land Use Changes, Agricultural
census of large, Central Bureau of Statistics, X, p1-42
MINISTRY OF LANDS AND SETTLEMENT, 2002, Physical Planning Handbook, Ministry of Lands and Settlement, X,
p.1-83
MINISTRY OF LANDS AND SETTLEMENT and PHYSICAL PLANNING DEPARTMENT, 1978, Human Settlements in
Kenya, A Strategy for Urban and Rural Development, Ministry of Lands and Settlement and Physical Planning Department,
X, p.1-177
ONG’ANGA, O, 2002, Poverty and Wealth of fisher folks in the Lake Victoria Basin of Kenya, Series: OSIENALA Series on
Lake Victoria (Friends of Lake Victoria), OSIENALA, Kisumu, p1-123
SANA INTERNATIONAL, 2007, Citizen’s Report Card on Urban Water, Sanitation and Solid Waste Services in Kenya, summary
of results from Kisumu, SANA international, Kisumu, p. 1-38
bibliography
103
SANA INTERNATIONAL, 2007, Citizens’ Report Card on urban water, sanitation and solid waste services in Kenya, Summary
of results from Nairobi, Kisumu and Mombasa, SANA international, X, p. 1-41
THE INTERMINISTRIAL TASK FORCE, MINISTRY OF LANDS AND HOUSING, MINISTRY OF LOCAL GOVERNMENT
and MINISTRY OF HEALTH, 1993, Building By-Laws and planning Regulations Review, A Strategy for Disseminating and
Implementing the Revised Building Code s it applies to Low Cost Housing, X,X, p1-65
UN-HABITAT, 2006, Kisumu Urban Sector Profile, United Nations Human Settlements Programme, Regional Office for Africa
and the Arab States, Rapid Urban Sector Profiling for Sustainability (RUSPS), UN-HABITAT, Nairobi, p.1-32
UN-HABITAT, 2006, Analytical Perspective of Pro-poor Slum Upgrading Frameworks, UN-HABITAT, Nairobi, p.1-71
UN-HABITAT, 2006, Sustainable Cities Programme/Localising Agenda 21 Programme, UNHABITAT, Nairobi, p.1-87