Investigation on the feasibility of integration of high temperature solar energy in a textile...
13
Investigation on the feasibility of integration of high temperature solar energy in a textile factory Ennio A. Carnevale, Lorenzo Ferrari * , Simone Paganelli Department of Energy Engineering “Sergio Stecco”, University of Florence, Via S. Marta 3, 50129 Florence, Italy article info Article history: Received 18 September 2009 Accepted 2 June 2011 Available online 24 June 2011 Keywords: Parabolic solar panel Solar integration High temperature Textile factory abstract Thermal energy production from fossil fuels is very common in many applications, especially in indus- trial processes. In a global context where great attention is being focused on reducing pollution and greenhouse gas production, the integration of renewable energy in industrial applications is very interesting. This is even more important considering that greenhouse gas emission for industrial processes is a great portion of their total emission. Considering the above, it appears that the integration of high temperature solar panels in industrial processes is quite an attractive prospect. The working temperatures of parabolic solar collectors are, for example, generally close to those of the thermal fluids used in many industrial processes, and parabolic solar collectors are a well known technology with several applications primarily used in electric production systems. Nonetheless, only a few examples of industrial integration have been studied or built. In this study, the integration of a concentrating solar thermal plant in a textile factory has been examined both from the thermodynamic and economic point of view. An existing textile factory was chosen as a case study and its annual consumption of thermal energy characterized. A model of the plant with solar energy integration was developed and simulated with TRNSYS over a one year time period. The plant was simulated considering the panel characteristics provided by the manufacturer and the local irradiation data. The influence of several plant parameters has been investigated in order to estimate their importance on performance and plant suitability. Ó 2011 Elsevier Ltd. All rights reserved. 1. Introduction Reduction of greenhouse gas emissions due to fossil fuel consumption for energy conversion is one of the most important environmental topics of the moment. With the Kyoto Protocol, many industrialized countries agreed to reduce their collective greenhouse gas emissions in respect to those of 1990. One of the greatest sources of equivalent carbon dioxide emission is the production of energy for the industrial processes. Possible solutions in this context can involve the use of cogeneration plants, but the electric-thermal balance of industrial consumption makes these plants suitable only rarely. While the emissions due to electric energy production can be reduced only by considering an improvement of grid production efficiency, for those processes where thermal energy is needed a great benefit would be achieved by using local integration of solar energy [1]. In particular, high temperature solar energy collected by parabolic mirrors could be used as an augmentation to industrial boilers, thus reducing the consumption of fossil fuel. Parabolic solar collectors seem to be the most suitable tech- nology for these applications since they allow the collection of solar energy at temperatures which are compatible with those typical of several industrial processes (above 200 C) [2]. Currently many applications of these devices can be found in the literature [3], but they are generally limited to electric energy production. One example is the Solar Electric Generating Systems (SEGS) in Southern California (354 MWe) [4]. Other applications of parabolic solar collectors are reported by Bakos et al. [5] for elec- tricity generation and A. Thomas [6] and Kalogirou et al. [7] and [8] for low temperature steam generation, but the applications of inte- grated systems to industrial processes are few [9,10]. Other uses of parabolic solar collectors can also be found in the sea-water desali- nation applications [11,12]. Other examples are related to the study of concentrating photovoltaic/thermal solar collectors [13]. Italy, like other Mediterranean area countries, has very favorable climatic conditions for these applications with an annual averaged solar radiation of about 1400 kWh/m 2 Abbreviations: ET100, EuroTrough100; FrTan, Collector optical efficiency; FrUl, Slope of collector efficiency curve [W/m 2 K]; NPV, Net Present Value [V]; PBP, Pay Back Period [years]. * Corresponding author. Tel.: þ39 055 4796 570; fax: þ39 055 4796 342. E-mail address: [email protected]fi.it (L. Ferrari). URL: http://vega.de.unifi.it Contents lists available at ScienceDirect Renewable Energy journal homepage: www.elsevier.com/locate/renene 0960-1481/$ e see front matter Ó 2011 Elsevier Ltd. All rights reserved. doi:10.1016/j.renene.2011.06.001 Renewable Energy 36 (2011) 3517e3529
Transcript of Investigation on the feasibility of integration of high temperature solar energy in a textile...
lable at ScienceDirect
Renewable Energy 36 (2011) 3517e3529
Contents lists avai
Renewable Energy
journal homepage: www.elsevier .com/locate/renene
Investigation on the feasibility of integration of high temperature solar energyin a textile factory
Ennio A. Carnevale, Lorenzo Ferrari*, Simone PaganelliDepartment of Energy Engineering “Sergio Stecco”, University of Florence, Via S. Marta 3, 50129 Florence, Italy
a r t i c l e i n f o
Article history:Received 18 September 2009Accepted 2 June 2011Available online 24 June 2011
Keywords:Parabolic solar panelSolar integrationHigh temperatureTextile factory
Abbreviations: ET100, EuroTrough100; FrTan, CollSlope of collector efficiency curve [W/m2 K]; NPV, NeBack Period [years].* Corresponding author. Tel.: þ39 055 4796 570; fa
E-mail address: [email protected] (L. Ferrari)URL: http://vega.de.unifi.it
0960-1481/$ e see front matter � 2011 Elsevier Ltd.doi:10.1016/j.renene.2011.06.001
a b s t r a c t
Thermal energy production from fossil fuels is very common in many applications, especially in indus-trial processes. In a global context where great attention is being focused on reducing pollution andgreenhouse gas production, the integration of renewable energy in industrial applications is veryinteresting. This is even more important considering that greenhouse gas emission for industrialprocesses is a great portion of their total emission. Considering the above, it appears that the integrationof high temperature solar panels in industrial processes is quite an attractive prospect. The workingtemperatures of parabolic solar collectors are, for example, generally close to those of the thermal fluidsused in many industrial processes, and parabolic solar collectors are a well known technology withseveral applications primarily used in electric production systems. Nonetheless, only a few examples ofindustrial integration have been studied or built. In this study, the integration of a concentrating solarthermal plant in a textile factory has been examined both from the thermodynamic and economic pointof view. An existing textile factory was chosen as a case study and its annual consumption of thermalenergy characterized. A model of the plant with solar energy integration was developed and simulatedwith TRNSYS over a one year time period. The plant was simulated considering the panel characteristicsprovided by the manufacturer and the local irradiation data. The influence of several plant parametershas been investigated in order to estimate their importance on performance and plant suitability.
� 2011 Elsevier Ltd. All rights reserved.
1. Introduction
Reduction of greenhouse gas emissions due to fossil fuelconsumption for energy conversion is one of the most importantenvironmental topics of the moment. With the Kyoto Protocol,many industrialized countries agreed to reduce their collectivegreenhouse gas emissions in respect to those of 1990. One of thegreatest sources of equivalent carbon dioxide emission is theproduction of energy for the industrial processes. Possible solutionsin this context can involve the use of cogeneration plants, but theelectric-thermal balance of industrial consumption makes theseplants suitable only rarely. While the emissions due to electricenergy production can be reduced only by considering animprovement of grid production efficiency, for those processeswhere thermal energy is needed a great benefit would be achieved
ector optical efficiency; FrUl,t Present Value [V]; PBP, Pay
x: þ39 055 4796 342..
All rights reserved.
by using local integration of solar energy [1]. In particular, hightemperature solar energy collected by parabolic mirrors could beused as an augmentation to industrial boilers, thus reducing theconsumption of fossil fuel.
Parabolic solar collectors seem to be the most suitable tech-nology for these applications since they allow the collection of solarenergy at temperatures which are compatible with those typical ofseveral industrial processes (above 200 �C) [2].
Currently many applications of these devices can be found in theliterature [3], but they are generally limited to electric energyproduction. One example is the Solar Electric Generating Systems(SEGS) in Southern California (354 MWe) [4]. Other applications ofparabolic solar collectors are reported by Bakos et al. [5] for elec-tricity generation and A. Thomas [6] and Kalogirou et al. [7] and [8]for low temperature steam generation, but the applications of inte-grated systems to industrial processes are few [9,10]. Other uses ofparabolic solar collectors can also be found in the sea-water desali-nation applications [11,12]. Other examples are related to the study ofconcentrating photovoltaic/thermal solar collectors [13].
Italy, like other Mediterranean area countries, has very favorableclimatic conditions for these applications with an annual averagedsolar radiation of about 1400 kWh/m2
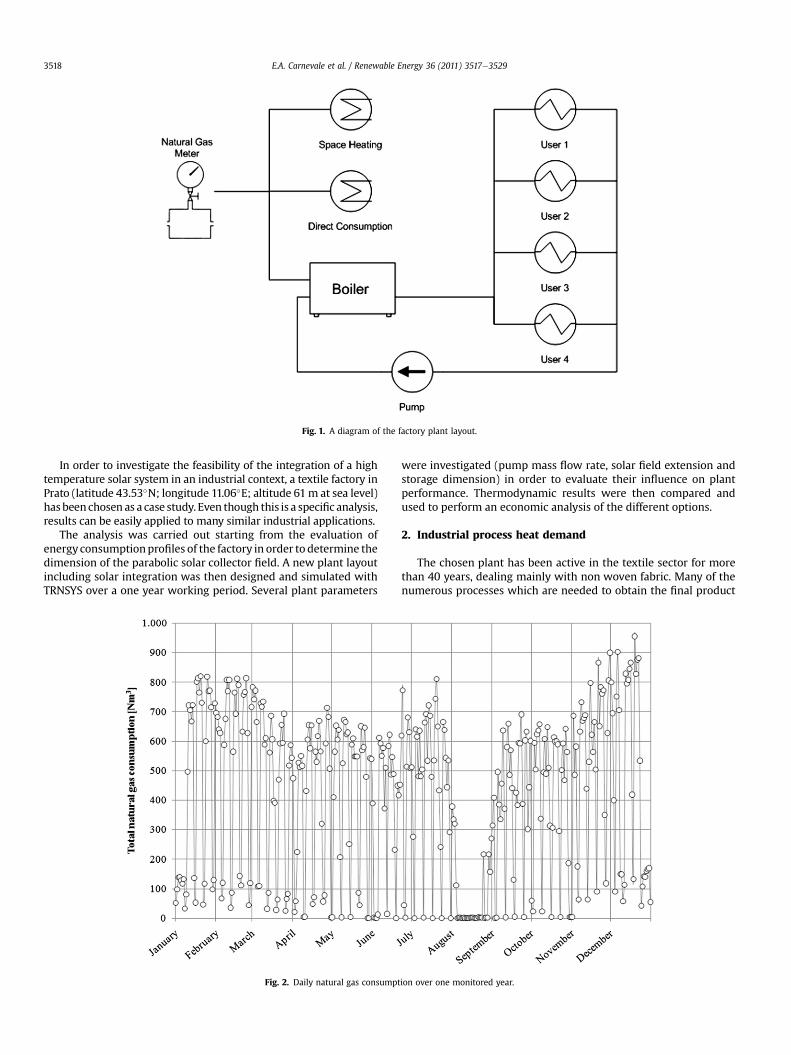
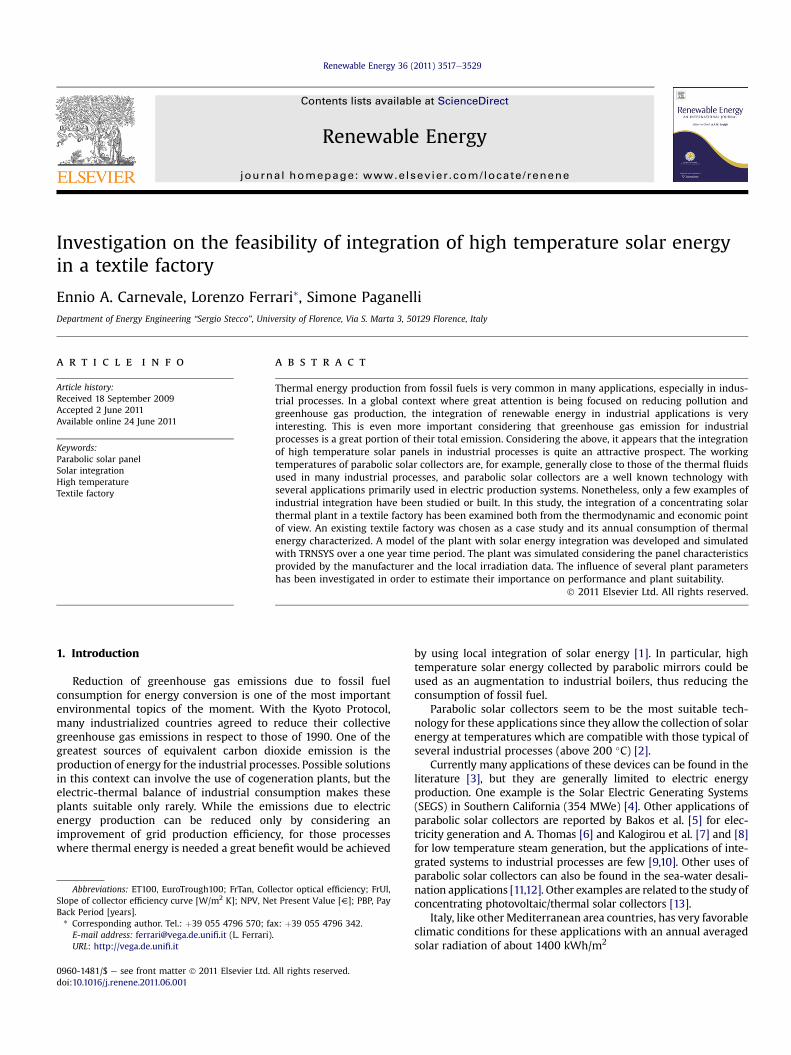
Fig. 1. A diagram of the factory plant layout.
E.A. Carnevale et al. / Renewable Energy 36 (2011) 3517e35293518
In order to investigate the feasibility of the integration of a hightemperature solar system in an industrial context, a textile factory inPrato (latitude 43.53�N; longitude 11.06�E; altitude 61m at sea level)hasbeenchosen as a case study. Even though this is a specific analysis,results can be easily applied to many similar industrial applications.
The analysis was carried out starting from the evaluation ofenergy consumptionprofiles of the factory in order to determine thedimension of the parabolic solar collector field. A new plant layoutincluding solar integration was then designed and simulated withTRNSYS over a one year working period. Several plant parameters
Fig. 2. Daily natural gas consumpt
were investigated (pump mass flow rate, solar field extension andstorage dimension) in order to evaluate their influence on plantperformance. Thermodynamic results were then compared andused to perform an economic analysis of the different options.
2. Industrial process heat demand
The chosen plant has been active in the textile sector for morethan 40 years, dealing mainly with non woven fabric. Many of thenumerous processes which are needed to obtain the final product
ion over one monitored year.
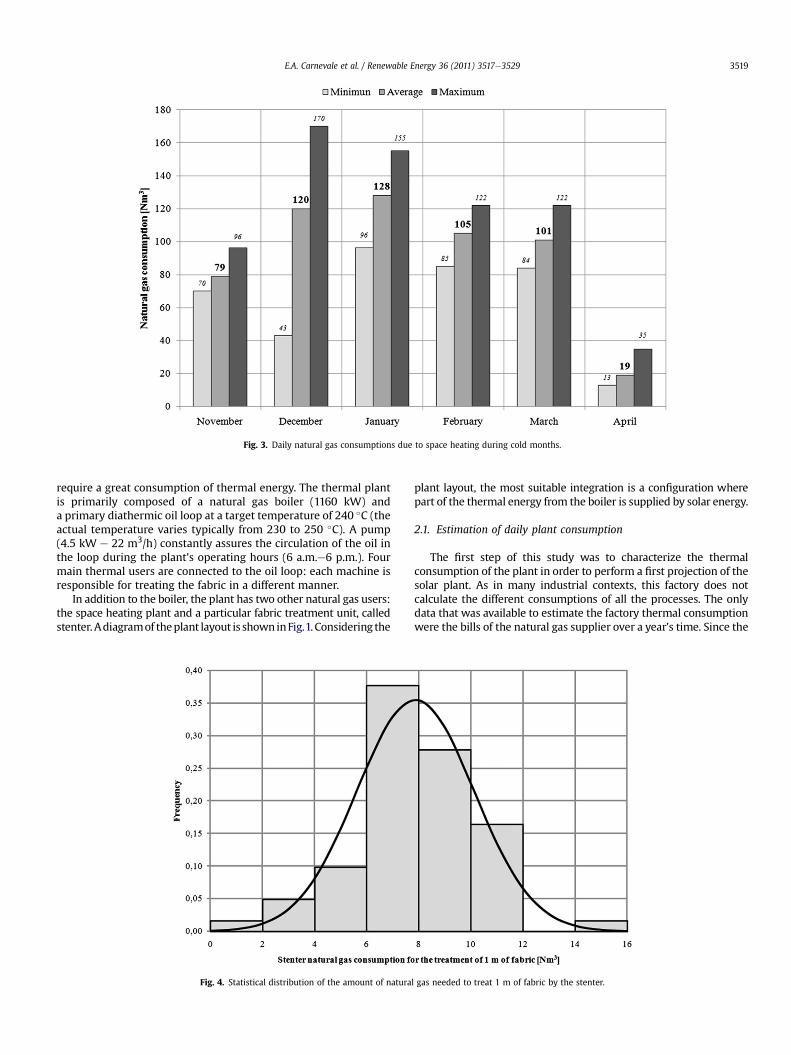
Fig. 3. Daily natural gas consumptions due to space heating during cold months.
E.A. Carnevale et al. / Renewable Energy 36 (2011) 3517e3529 3519
require a great consumption of thermal energy. The thermal plantis primarily composed of a natural gas boiler (1160 kW) anda primary diathermic oil loop at a target temperature of 240 �C (theactual temperature varies typically from 230 to 250 �C). A pump(4.5 kW e 22 m3/h) constantly assures the circulation of the oil inthe loop during the plant’s operating hours (6 a.m.e6 p.m.). Fourmain thermal users are connected to the oil loop: each machine isresponsible for treating the fabric in a different manner.
In addition to the boiler, the plant has two other natural gas users:the space heating plant and a particular fabric treatment unit, calledstenter.Adiagramof theplant layout is showninFig.1.Considering the
Fig. 4. Statistical distribution of the amount of natura
plant layout, the most suitable integration is a configuration wherepart of the thermal energy from the boiler is supplied by solar energy.
2.1. Estimation of daily plant consumption
The first step of this study was to characterize the thermalconsumption of the plant in order to perform a first projection of thesolar plant. As in many industrial contexts, this factory does notcalculate the different consumptions of all the processes. The onlydata that was available to estimate the factory thermal consumptionwere the bills of the natural gas supplier over a year’s time. Since the
l gas needed to treat 1 m of fabric by the stenter.
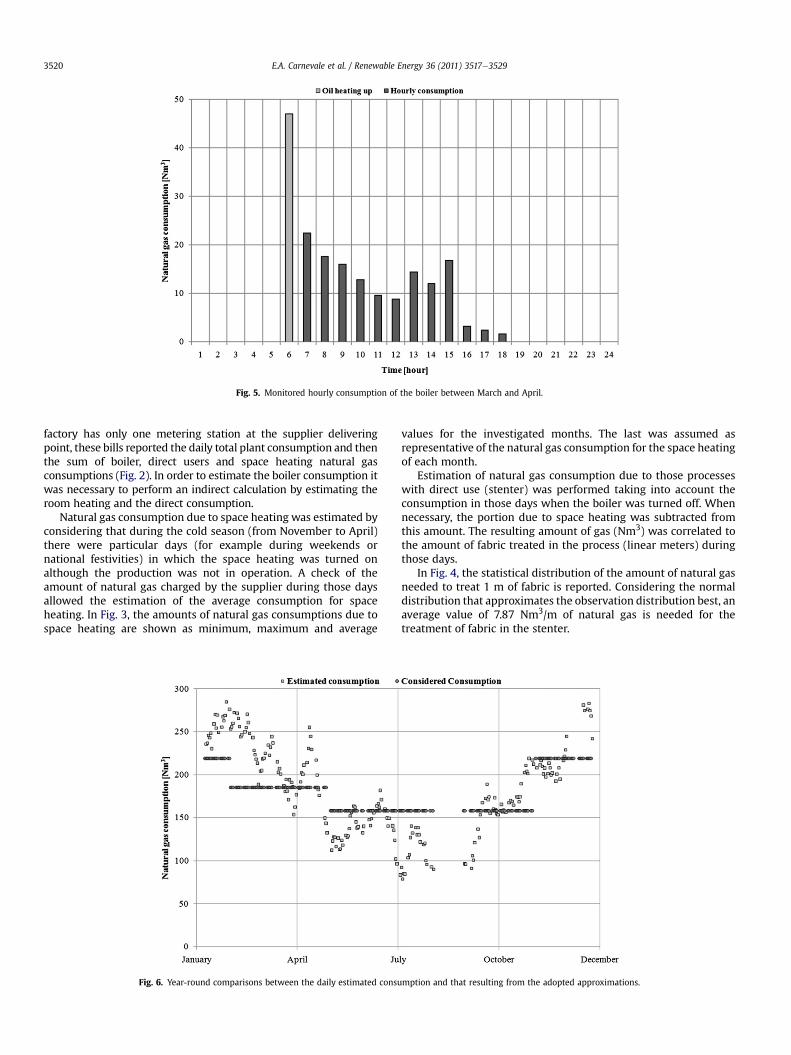
Fig. 5. Monitored hourly consumption of the boiler between March and April.
E.A. Carnevale et al. / Renewable Energy 36 (2011) 3517e35293520
factory has only one metering station at the supplier deliveringpoint, these bills reported the daily total plant consumption and thenthe sum of boiler, direct users and space heating natural gasconsumptions (Fig. 2). In order to estimate the boiler consumption itwas necessary to perform an indirect calculation by estimating theroom heating and the direct consumption.
Natural gas consumption due to space heating was estimated byconsidering that during the cold season (from November to April)there were particular days (for example during weekends ornational festivities) in which the space heating was turned onalthough the production was not in operation. A check of theamount of natural gas charged by the supplier during those daysallowed the estimation of the average consumption for spaceheating. In Fig. 3, the amounts of natural gas consumptions due tospace heating are shown as minimum, maximum and average
Fig. 6. Year-round comparisons between the daily estimated consu
values for the investigated months. The last was assumed asrepresentative of the natural gas consumption for the space heatingof each month.
Estimation of natural gas consumption due to those processeswith direct use (stenter) was performed taking into account theconsumption in those days when the boiler was turned off. Whennecessary, the portion due to space heating was subtracted fromthis amount. The resulting amount of gas (Nm3) was correlated tothe amount of fabric treated in the process (linear meters) duringthose days.
In Fig. 4, the statistical distribution of the amount of natural gasneeded to treat 1 m of fabric is reported. Considering the normaldistribution that approximates the observation distribution best, anaverage value of 7.87 Nm3/m of natural gas is needed for thetreatment of fabric in the stenter.
mption and that resulting from the adopted approximations.
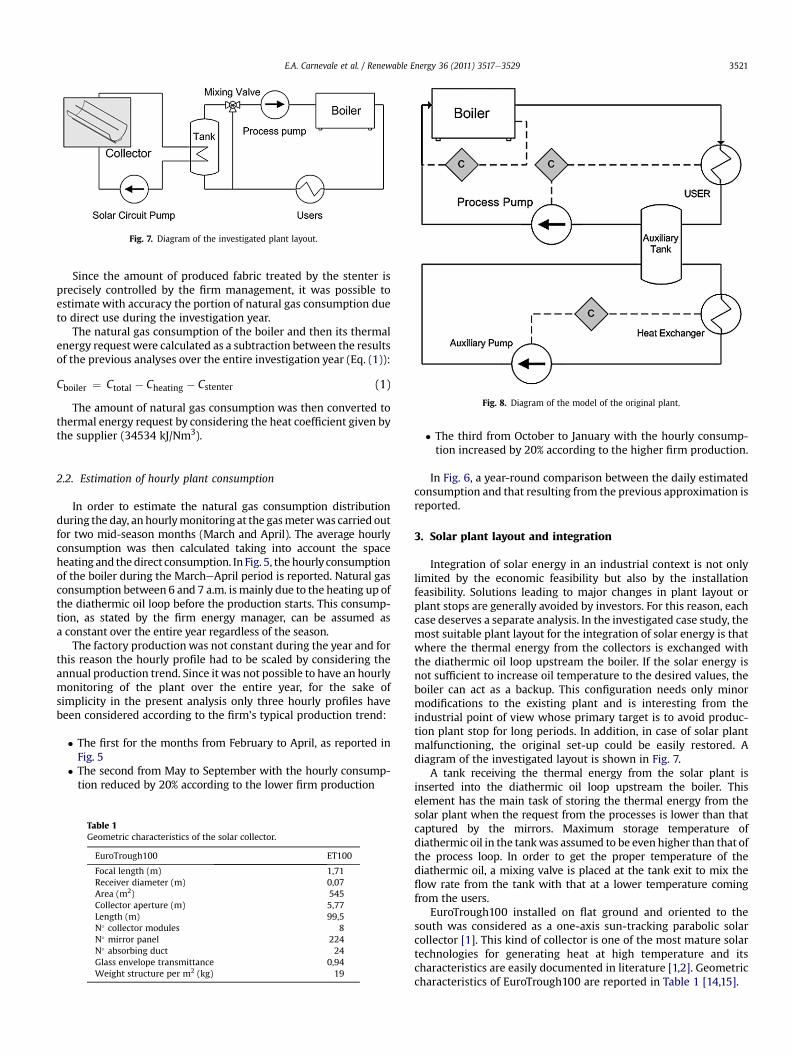
Fig. 7. Diagram of the investigated plant layout.
Fig. 8. Diagram of the model of the original plant.
E.A. Carnevale et al. / Renewable Energy 36 (2011) 3517e3529 3521
Since the amount of produced fabric treated by the stenter isprecisely controlled by the firm management, it was possible toestimate with accuracy the portion of natural gas consumption dueto direct use during the investigation year.
The natural gas consumption of the boiler and then its thermalenergy request were calculated as a subtraction between the resultsof the previous analyses over the entire investigation year (Eq. (1)):
Cboiler ¼ Ctotal � Cheating � Cstenter (1)
The amount of natural gas consumption was then converted tothermal energy request by considering the heat coefficient given bythe supplier (34534 kJ/Nm3).
2.2. Estimation of hourly plant consumption
In order to estimate the natural gas consumption distributionduring the day, an hourlymonitoring at the gasmeterwas carried outfor two mid-season months (March and April). The average hourlyconsumption was then calculated taking into account the spaceheating and thedirect consumption. In Fig. 5, the hourly consumptionof the boiler during the MarcheApril period is reported. Natural gasconsumption between 6 and 7 a.m. ismainly due to the heating up ofthe diathermic oil loop before the production starts. This consump-tion, as stated by the firm energy manager, can be assumed asa constant over the entire year regardless of the season.
The factory production was not constant during the year and forthis reason the hourly profile had to be scaled by considering theannual production trend. Since it was not possible to have an hourlymonitoring of the plant over the entire year, for the sake ofsimplicity in the present analysis only three hourly profiles havebeen considered according to the firm’s typical production trend:
� The first for the months from February to April, as reported inFig. 5
� The second from May to September with the hourly consump-tion reduced by 20% according to the lower firm production
Table 1Geometric characteristics of the solar collector.
EuroTrough100 ET100
Focal length (m) 1,71Receiver diameter (m) 0,07Area (m2) 545Collector aperture (m) 5,77Length (m) 99,5N� collector modules 8N� mirror panel 224N� absorbing duct 24Glass envelope transmittance 0,94Weight structure per m2 (kg) 19
� The third from October to January with the hourly consump-tion increased by 20% according to the higher firm production.
In Fig. 6, a year-round comparison between the daily estimatedconsumption and that resulting from the previous approximation isreported.
3. Solar plant layout and integration
Integration of solar energy in an industrial context is not onlylimited by the economic feasibility but also by the installationfeasibility. Solutions leading to major changes in plant layout orplant stops are generally avoided by investors. For this reason, eachcase deserves a separate analysis. In the investigated case study, themost suitable plant layout for the integration of solar energy is thatwhere the thermal energy from the collectors is exchanged withthe diathermic oil loop upstream the boiler. If the solar energy isnot sufficient to increase oil temperature to the desired values, theboiler can act as a backup. This configuration needs only minormodifications to the existing plant and is interesting from theindustrial point of view whose primary target is to avoid produc-tion plant stop for long periods. In addition, in case of solar plantmalfunctioning, the original set-up could be easily restored. Adiagram of the investigated layout is shown in Fig. 7.
A tank receiving the thermal energy from the solar plant isinserted into the diathermic oil loop upstream the boiler. Thiselement has the main task of storing the thermal energy from thesolar plant when the request from the processes is lower than thatcaptured by the mirrors. Maximum storage temperature ofdiathermic oil in the tankwas assumed to be even higher than that ofthe process loop. In order to get the proper temperature of thediathermic oil, a mixing valve is placed at the tank exit to mix theflow rate from the tank with that at a lower temperature comingfrom the users.
EuroTrough100 installed on flat ground and oriented to thesouth was considered as a one-axis sun-tracking parabolic solarcollector [1]. This kind of collector is one of the most mature solartechnologies for generating heat at high temperature and itscharacteristics are easily documented in literature [1,2]. Geometriccharacteristics of EuroTrough100 are reported in Table 1 [14,15].
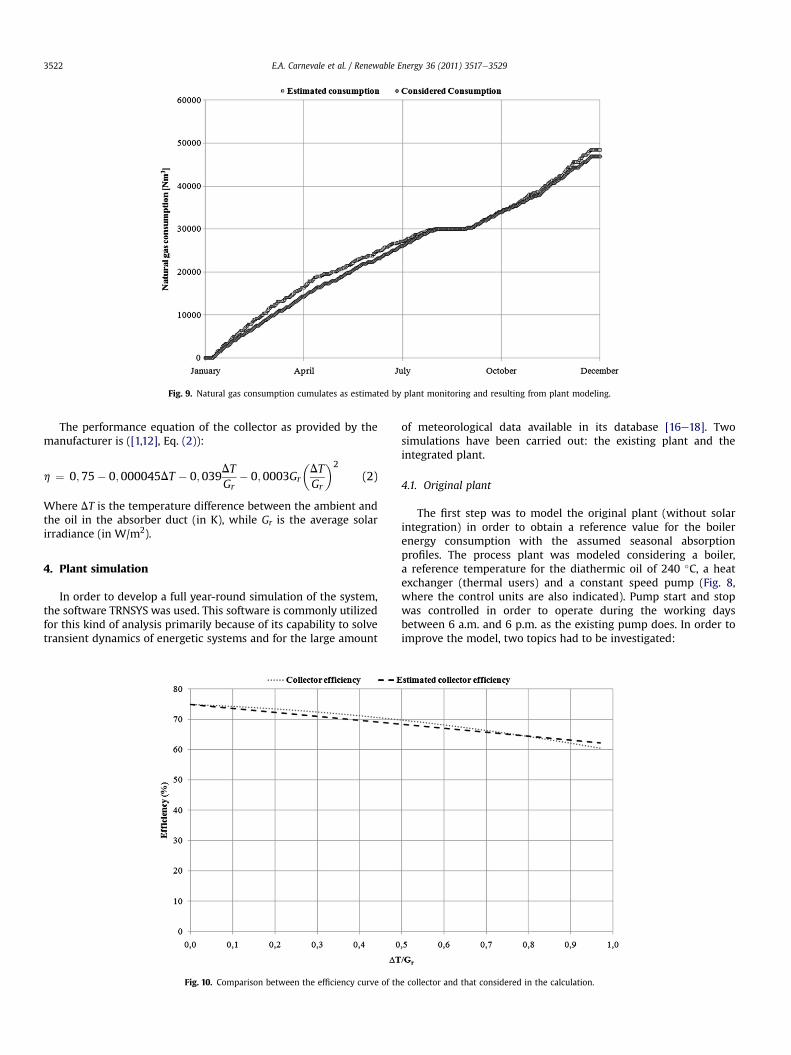
Fig. 9. Natural gas consumption cumulates as estimated by plant monitoring and resulting from plant modeling.
E.A. Carnevale et al. / Renewable Energy 36 (2011) 3517e35293522
The performance equation of the collector as provided by themanufacturer is ([1,12], Eq. (2)):
h ¼ 0;75� 0;000045DT � 0;039DTGr
� 0;0003Gr
�DTGr
�2
(2)
Where DT is the temperature difference between the ambient andthe oil in the absorber duct (in K), while Gr is the average solarirradiance (in W/m2).
4. Plant simulation
In order to develop a full year-round simulation of the system,the software TRNSYS was used. This software is commonly utilizedfor this kind of analysis primarily because of its capability to solvetransient dynamics of energetic systems and for the large amount
Fig. 10. Comparison between the efficiency curve of th
of meteorological data available in its database [16e18]. Twosimulations have been carried out: the existing plant and theintegrated plant.
4.1. Original plant
The first step was to model the original plant (without solarintegration) in order to obtain a reference value for the boilerenergy consumption with the assumed seasonal absorptionprofiles. The process plant was modeled considering a boiler,a reference temperature for the diathermic oil of 240 �C, a heatexchanger (thermal users) and a constant speed pump (Fig. 8,where the control units are also indicated). Pump start and stopwas controlled in order to operate during the working daysbetween 6 a.m. and 6 p.m. as the existing pump does. In order toimprove the model, two topics had to be investigated:
e collector and that considered in the calculation.
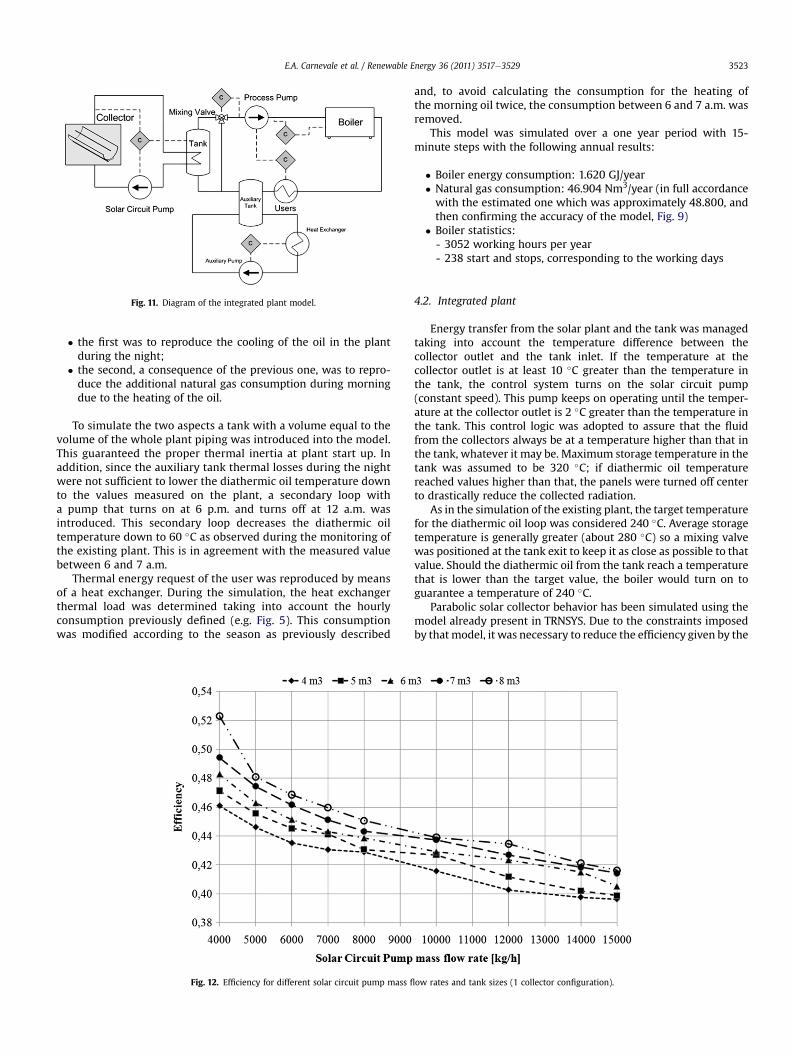
Fig. 11. Diagram of the integrated plant model.
E.A. Carnevale et al. / Renewable Energy 36 (2011) 3517e3529 3523
� the first was to reproduce the cooling of the oil in the plantduring the night;
� the second, a consequence of the previous one, was to repro-duce the additional natural gas consumption during morningdue to the heating of the oil.
To simulate the two aspects a tank with a volume equal to thevolume of the whole plant piping was introduced into the model.This guaranteed the proper thermal inertia at plant start up. Inaddition, since the auxiliary tank thermal losses during the nightwere not sufficient to lower the diathermic oil temperature downto the values measured on the plant, a secondary loop witha pump that turns on at 6 p.m. and turns off at 12 a.m. wasintroduced. This secondary loop decreases the diathermic oiltemperature down to 60 �C as observed during the monitoring ofthe existing plant. This is in agreement with the measured valuebetween 6 and 7 a.m.
Thermal energy request of the user was reproduced by meansof a heat exchanger. During the simulation, the heat exchangerthermal load was determined taking into account the hourlyconsumption previously defined (e.g. Fig. 5). This consumptionwas modified according to the season as previously described
Fig. 12. Efficiency for different solar circuit pump mass fl
and, to avoid calculating the consumption for the heating ofthe morning oil twice, the consumption between 6 and 7 a.m. wasremoved.
This model was simulated over a one year period with 15-minute steps with the following annual results:
� Boiler energy consumption: 1.620 GJ/year� Natural gas consumption: 46.904 Nm3/year (in full accordancewith the estimated one which was approximately 48.800, andthen confirming the accuracy of the model, Fig. 9)
� Boiler statistics:- 3052 working hours per year- 238 start and stops, corresponding to the working days
4.2. Integrated plant
Energy transfer from the solar plant and the tank was managedtaking into account the temperature difference between thecollector outlet and the tank inlet. If the temperature at thecollector outlet is at least 10 �C greater than the temperature inthe tank, the control system turns on the solar circuit pump(constant speed). This pump keeps on operating until the temper-ature at the collector outlet is 2 �C greater than the temperature inthe tank. This control logic was adopted to assure that the fluidfrom the collectors always be at a temperature higher than that inthe tank, whatever it may be. Maximum storage temperature in thetank was assumed to be 320 �C; if diathermic oil temperaturereached values higher than that, the panels were turned off centerto drastically reduce the collected radiation.
As in the simulation of the existing plant, the target temperaturefor the diathermic oil loop was considered 240 �C. Average storagetemperature is generally greater (about 280 �C) so a mixing valvewas positioned at the tank exit to keep it as close as possible to thatvalue. Should the diathermic oil from the tank reach a temperaturethat is lower than the target value, the boiler would turn on toguarantee a temperature of 240 �C.
Parabolic solar collector behavior has been simulated using themodel already present in TRNSYS. Due to the constraints imposedby thatmodel, it was necessary to reduce the efficiency given by the
ow rates and tank sizes (1 collector configuration).
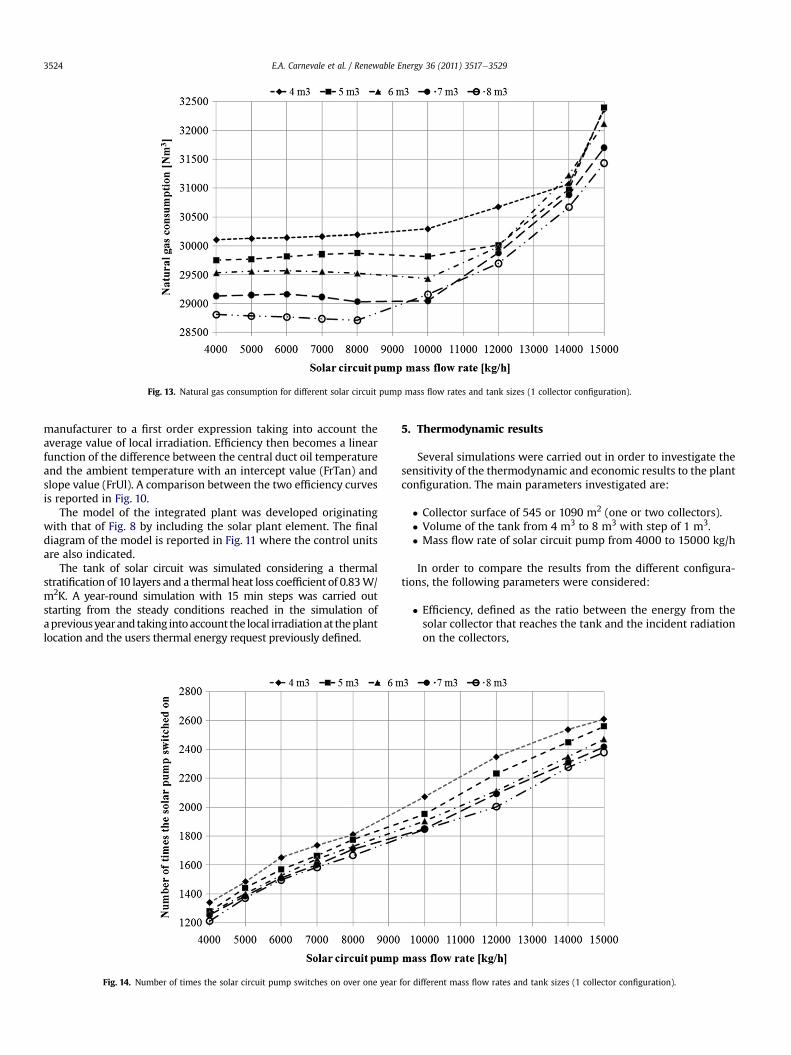
Fig. 13. Natural gas consumption for different solar circuit pump mass flow rates and tank sizes (1 collector configuration).
E.A. Carnevale et al. / Renewable Energy 36 (2011) 3517e35293524
manufacturer to a first order expression taking into account theaverage value of local irradiation. Efficiency then becomes a linearfunction of the difference between the central duct oil temperatureand the ambient temperature with an intercept value (FrTan) andslope value (FrUl). A comparison between the two efficiency curvesis reported in Fig. 10.
The model of the integrated plant was developed originatingwith that of Fig. 8 by including the solar plant element. The finaldiagram of the model is reported in Fig. 11 where the control unitsare also indicated.
The tank of solar circuit was simulated considering a thermalstratification of 10 layers and a thermal heat loss coefficient of 0.83W/m2K. A year-round simulation with 15 min steps was carried outstarting from the steady conditions reached in the simulation ofapreviousyearandtaking intoaccount the local irradiationat theplantlocation and the users thermal energy request previously defined.
Fig. 14. Number of times the solar circuit pump switches on over one year
5. Thermodynamic results
Several simulations were carried out in order to investigate thesensitivity of the thermodynamic and economic results to the plantconfiguration. The main parameters investigated are:
� Collector surface of 545 or 1090 m2 (one or two collectors).� Volume of the tank from 4 m3 to 8 m3 with step of 1 m3.� Mass flow rate of solar circuit pump from 4000 to 15000 kg/h
In order to compare the results from the different configura-tions, the following parameters were considered:
� Efficiency, defined as the ratio between the energy from thesolar collector that reaches the tank and the incident radiationon the collectors,
for different mass flow rates and tank sizes (1 collector configuration).
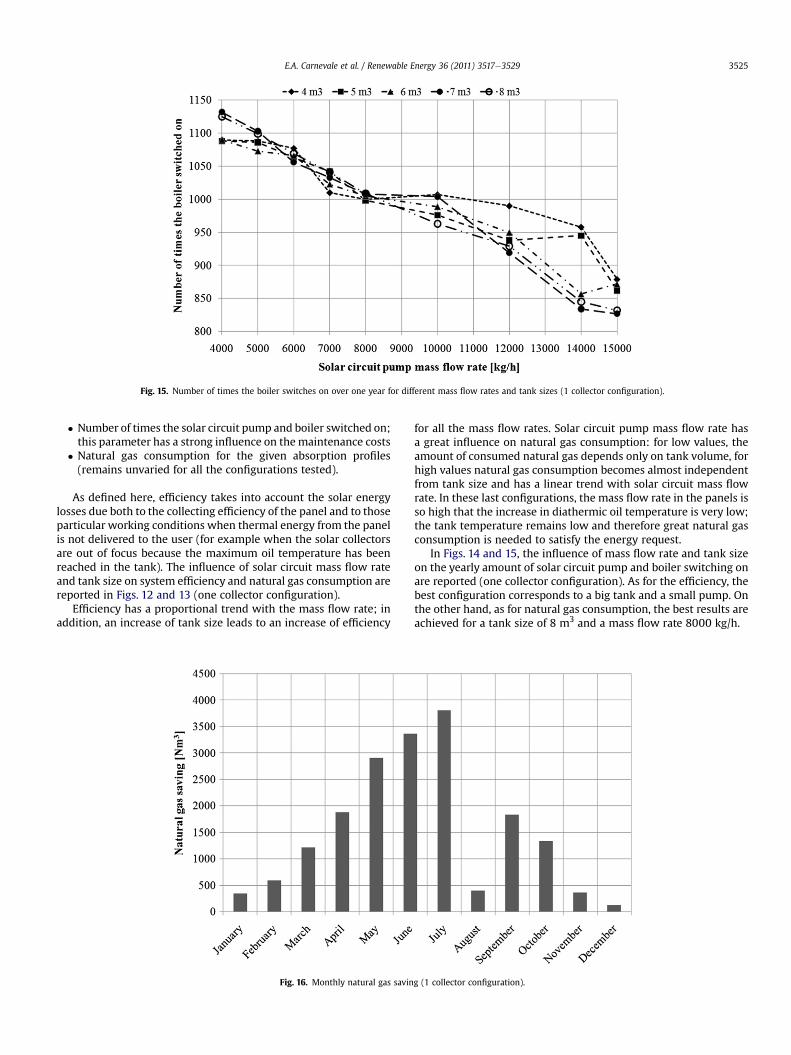
Fig. 15. Number of times the boiler switches on over one year for different mass flow rates and tank sizes (1 collector configuration).
E.A. Carnevale et al. / Renewable Energy 36 (2011) 3517e3529 3525
� Number of times the solar circuit pump and boiler switched on;this parameter has a strong influence on themaintenance costs
� Natural gas consumption for the given absorption profiles(remains unvaried for all the configurations tested).
As defined here, efficiency takes into account the solar energylosses due both to the collecting efficiency of the panel and to thoseparticular working conditions when thermal energy from the panelis not delivered to the user (for example when the solar collectorsare out of focus because the maximum oil temperature has beenreached in the tank). The influence of solar circuit mass flow rateand tank size on system efficiency and natural gas consumption arereported in Figs. 12 and 13 (one collector configuration).
Efficiency has a proportional trend with the mass flow rate; inaddition, an increase of tank size leads to an increase of efficiency
Fig. 16. Monthly natural gas savin
for all the mass flow rates. Solar circuit pump mass flow rate hasa great influence on natural gas consumption: for low values, theamount of consumed natural gas depends only on tank volume, forhigh values natural gas consumption becomes almost independentfrom tank size and has a linear trend with solar circuit mass flowrate. In these last configurations, the mass flow rate in the panels isso high that the increase in diathermic oil temperature is very low;the tank temperature remains low and therefore great natural gasconsumption is needed to satisfy the energy request.
In Figs. 14 and 15, the influence of mass flow rate and tank sizeon the yearly amount of solar circuit pump and boiler switching onare reported (one collector configuration). As for the efficiency, thebest configuration corresponds to a big tank and a small pump. Onthe other hand, as for natural gas consumption, the best results areachieved for a tank size of 8 m3 and a mass flow rate 8000 kg/h.
g (1 collector configuration).
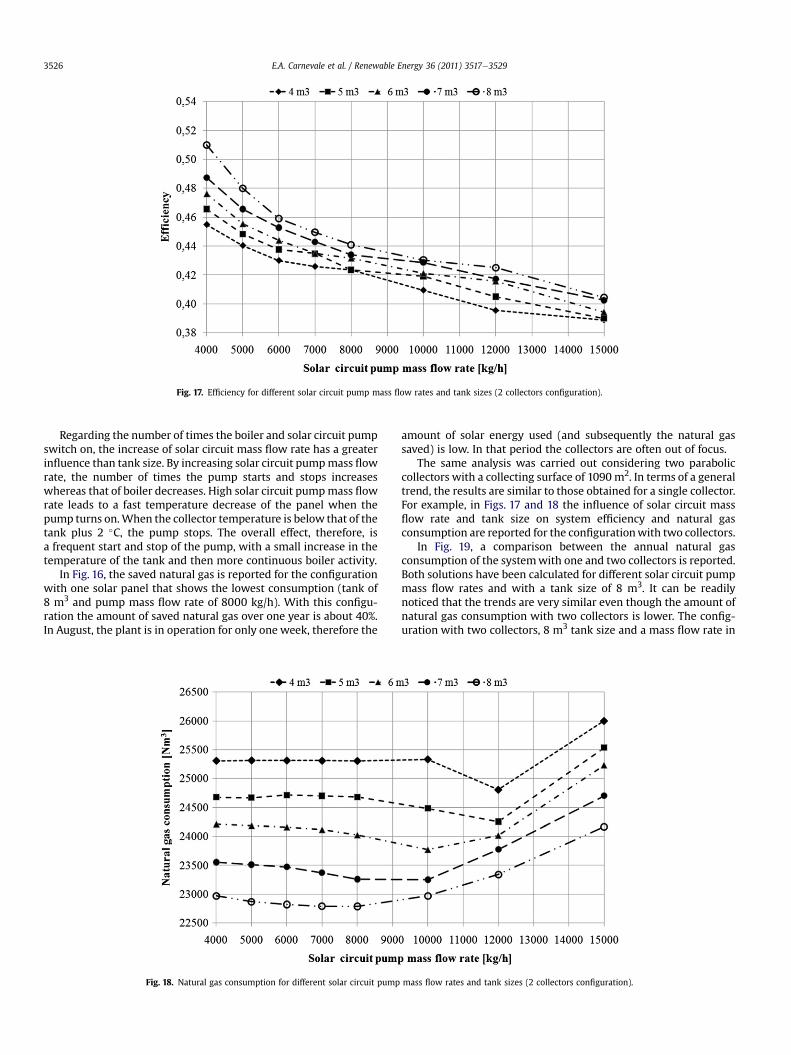
Fig. 17. Efficiency for different solar circuit pump mass flow rates and tank sizes (2 collectors configuration).
E.A. Carnevale et al. / Renewable Energy 36 (2011) 3517e35293526
Regarding the number of times the boiler and solar circuit pumpswitch on, the increase of solar circuit mass flow rate has a greaterinfluence than tank size. By increasing solar circuit pumpmass flowrate, the number of times the pump starts and stops increaseswhereas that of boiler decreases. High solar circuit pumpmass flowrate leads to a fast temperature decrease of the panel when thepump turns on.When the collector temperature is below that of thetank plus 2 �C, the pump stops. The overall effect, therefore, isa frequent start and stop of the pump, with a small increase in thetemperature of the tank and then more continuous boiler activity.
In Fig. 16, the saved natural gas is reported for the configurationwith one solar panel that shows the lowest consumption (tank of8 m3 and pump mass flow rate of 8000 kg/h). With this configu-ration the amount of saved natural gas over one year is about 40%.In August, the plant is in operation for only one week, therefore the
Fig. 18. Natural gas consumption for different solar circuit pump
amount of solar energy used (and subsequently the natural gassaved) is low. In that period the collectors are often out of focus.
The same analysis was carried out considering two paraboliccollectors with a collecting surface of 1090 m2. In terms of a generaltrend, the results are similar to those obtained for a single collector.For example, in Figs. 17 and 18 the influence of solar circuit massflow rate and tank size on system efficiency and natural gasconsumption are reported for the configurationwith two collectors.
In Fig. 19, a comparison between the annual natural gasconsumption of the systemwith one and two collectors is reported.Both solutions have been calculated for different solar circuit pumpmass flow rates and with a tank size of 8 m3. It can be readilynoticed that the trends are very similar even though the amount ofnatural gas consumption with two collectors is lower. The config-uration with two collectors, 8 m3 tank size and a mass flow rate in
mass flow rates and tank sizes (2 collectors configuration).
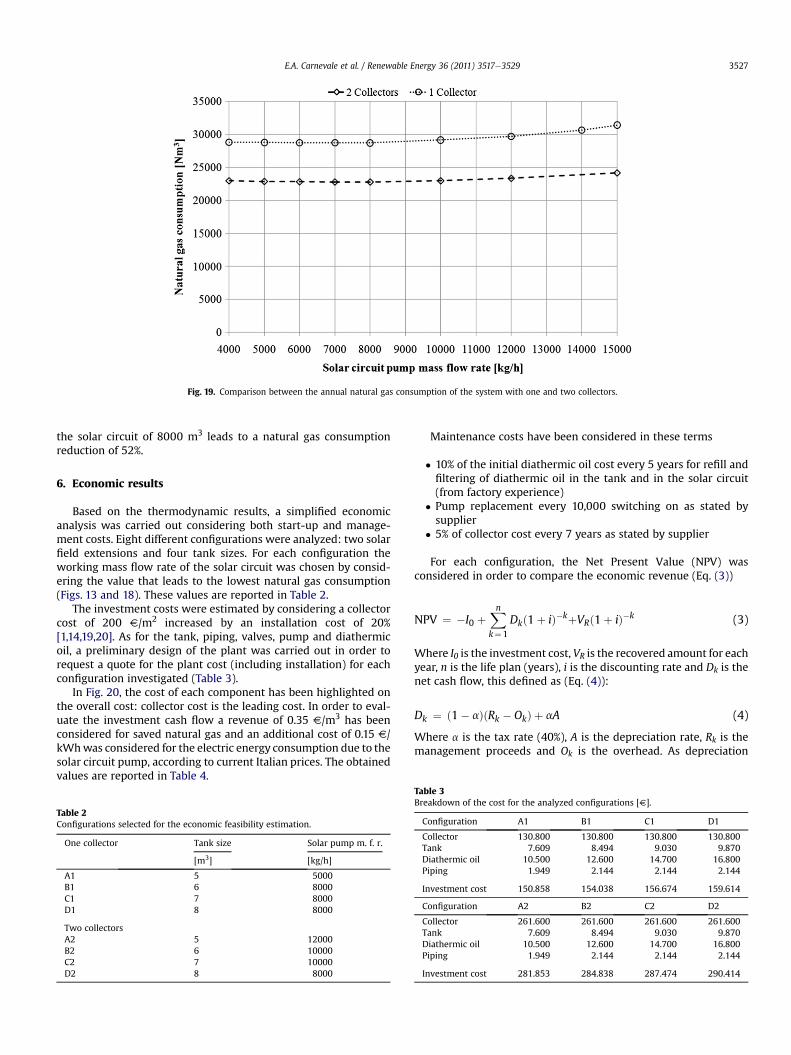
Fig. 19. Comparison between the annual natural gas consumption of the system with one and two collectors.
E.A. Carnevale et al. / Renewable Energy 36 (2011) 3517e3529 3527
the solar circuit of 8000 m3 leads to a natural gas consumptionreduction of 52%.
6. Economic results
Based on the thermodynamic results, a simplified economicanalysis was carried out considering both start-up and manage-ment costs. Eight different configurations were analyzed: two solarfield extensions and four tank sizes. For each configuration theworking mass flow rate of the solar circuit was chosen by consid-ering the value that leads to the lowest natural gas consumption(Figs. 13 and 18). These values are reported in Table 2.
The investment costs were estimated by considering a collectorcost of 200 V/m2 increased by an installation cost of 20%[1,14,19,20]. As for the tank, piping, valves, pump and diathermicoil, a preliminary design of the plant was carried out in order torequest a quote for the plant cost (including installation) for eachconfiguration investigated (Table 3).
In Fig. 20, the cost of each component has been highlighted onthe overall cost: collector cost is the leading cost. In order to eval-uate the investment cash flow a revenue of 0.35 V/m3 has beenconsidered for saved natural gas and an additional cost of 0.15 V/kWhwas considered for the electric energy consumption due to thesolar circuit pump, according to current Italian prices. The obtainedvalues are reported in Table 4.
Table 2Configurations selected for the economic feasibility estimation.
One collector Tank size Solar pump m. f. r.
[m3] [kg/h]
A1 5 5000B1 6 8000C1 7 8000D1 8 8000
Two collectorsA2 5 12000B2 6 10000C2 7 10000D2 8 8000
Maintenance costs have been considered in these terms
� 10% of the initial diathermic oil cost every 5 years for refill andfiltering of diathermic oil in the tank and in the solar circuit(from factory experience)
� Pump replacement every 10,000 switching on as stated bysupplier
� 5% of collector cost every 7 years as stated by supplier
For each configuration, the Net Present Value (NPV) wasconsidered in order to compare the economic revenue (Eq. (3))
NPV ¼ �I0 þXnk¼1
Dkð1þ iÞ�kþVRð1þ iÞ�k (3)
Where I0 is the investment cost, VR is the recovered amount for eachyear, n is the life plan (years), i is the discounting rate and Dk is thenet cash flow, this defined as (Eq. (4)):
Dk ¼ ð1� aÞðRk � OkÞ þ aA (4)
Where a is the tax rate (40%), A is the depreciation rate, Rk is themanagement proceeds and Ok is the overhead. As depreciation
Table 3Breakdown of the cost for the analyzed configurations [V].
Configuration A1 B1 C1 D1
Collector 130.800 130.800 130.800 130.800Tank 7.609 8.494 9.030 9.870Diathermic oil 10.500 12.600 14.700 16.800Piping 1.949 2.144 2.144 2.144
Investment cost 150.858 154.038 156.674 159.614
Configuration A2 B2 C2 D2
Collector 261.600 261.600 261.600 261.600Tank 7.609 8.494 9.030 9.870Diathermic oil 10.500 12.600 14.700 16.800Piping 1.949 2.144 2.144 2.144
Investment cost 281.853 284.838 287.474 290.414
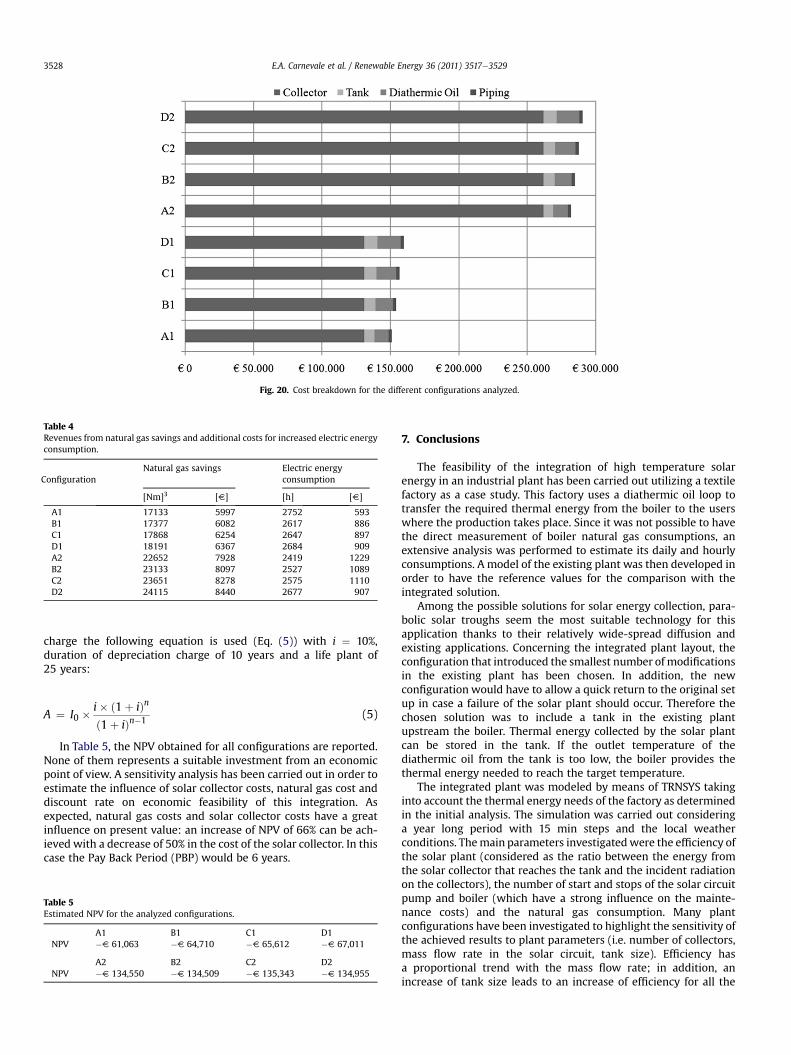
Fig. 20. Cost breakdown for the different configurations analyzed.
Table 4Revenues from natural gas savings and additional costs for increased electric energyconsumption.
ConfigurationNatural gas savings Electric energy
consumption
[Nm]3 [V] [h] [V]
A1 17133 5997 2752 593B1 17377 6082 2617 886C1 17868 6254 2647 897D1 18191 6367 2684 909A2 22652 7928 2419 1229B2 23133 8097 2527 1089C2 23651 8278 2575 1110D2 24115 8440 2677 907
E.A. Carnevale et al. / Renewable Energy 36 (2011) 3517e35293528
charge the following equation is used (Eq. (5)) with i ¼ 10%,duration of depreciation charge of 10 years and a life plant of25 years:
A ¼ I0 �i� ð1þ iÞnð1þ iÞn�1 (5)
In Table 5, the NPV obtained for all configurations are reported.None of them represents a suitable investment from an economicpoint of view. A sensitivity analysis has been carried out in order toestimate the influence of solar collector costs, natural gas cost anddiscount rate on economic feasibility of this integration. Asexpected, natural gas costs and solar collector costs have a greatinfluence on present value: an increase of NPV of 66% can be ach-ieved with a decrease of 50% in the cost of the solar collector. In thiscase the Pay Back Period (PBP) would be 6 years.
Table 5Estimated NPV for the analyzed configurations.
A1 B1 C1 D1NPV �V 61,063 �V 64,710 �V 65,612 �V 67,011
A2 B2 C2 D2NPV �V 134,550 �V 134,509 �V 135,343 �V 134,955
7. Conclusions
The feasibility of the integration of high temperature solarenergy in an industrial plant has been carried out utilizing a textilefactory as a case study. This factory uses a diathermic oil loop totransfer the required thermal energy from the boiler to the userswhere the production takes place. Since it was not possible to havethe direct measurement of boiler natural gas consumptions, anextensive analysis was performed to estimate its daily and hourlyconsumptions. A model of the existing plant was then developed inorder to have the reference values for the comparison with theintegrated solution.
Among the possible solutions for solar energy collection, para-bolic solar troughs seem the most suitable technology for thisapplication thanks to their relatively wide-spread diffusion andexisting applications. Concerning the integrated plant layout, theconfiguration that introduced the smallest number of modificationsin the existing plant has been chosen. In addition, the newconfiguration would have to allow a quick return to the original setup in case a failure of the solar plant should occur. Therefore thechosen solution was to include a tank in the existing plantupstream the boiler. Thermal energy collected by the solar plantcan be stored in the tank. If the outlet temperature of thediathermic oil from the tank is too low, the boiler provides thethermal energy needed to reach the target temperature.
The integrated plant was modeled by means of TRNSYS takinginto account the thermal energy needs of the factory as determinedin the initial analysis. The simulation was carried out consideringa year long period with 15 min steps and the local weatherconditions. Themain parameters investigatedwere the efficiency ofthe solar plant (considered as the ratio between the energy fromthe solar collector that reaches the tank and the incident radiationon the collectors), the number of start and stops of the solar circuitpump and boiler (which have a strong influence on the mainte-nance costs) and the natural gas consumption. Many plantconfigurations have been investigated to highlight the sensitivity ofthe achieved results to plant parameters (i.e. number of collectors,mass flow rate in the solar circuit, tank size). Efficiency hasa proportional trend with the mass flow rate; in addition, anincrease of tank size leads to an increase of efficiency for all the

E.A. Carnevale et al. / Renewable Energy 36 (2011) 3517e3529 3529
mass flow rates. Solar circuit pump mass flow rate has a greatinfluence on natural gas consumption: for low values, the amountof consumed natural gas depends only on tank volume, for highvalues, natural gas consumption becomes almost independentfrom tank size and has a linear trend with solar circuit mass flowrate. Regarding boiler and solar circuit pump start and stops, theincrease of solar circuit mass flow rate has a greater influence thantank size. By increasing solar circuit pump mass flow rate, thenumber of times the pump switches on increases whereas that ofboiler decreases. The trend is similar when considering one or twocollectors even though the natural gas consumptions are greatlyreduced in the second configuration. The thermodynamic resultsshow that the integration can lead to an annual natural gas savingsof 40% with one collector and about 52% with two collectors.
Based on the thermodynamic results, an economic analysis wascarried out considering both the installation and the managementcosts. These costs were gathered from a market survey and by con-tacting the principal manufacturers. The revenues were estimatedconsidering the annual natural gas savings. The main results of thisanalysis showed that even if the annual natural gas savings wasnoteworthy, it was not sufficient to repay the high installation costsof the plant and, in particular, of the collectors. Solar collector costshave a great influence on net present value: an increase of NPV of66% can be achieved with a decrease of 50% in the cost of the solarcollector. In this case the PBPwould be 6 years. A greater diffusion ofthis product would surely lead to a cost reduction; the diffusion ofstate incentives that promote the solar integration in industrialprocesseswould also be a desirable prospect. Futuredevelopment ofthe activity involves the realization of a small solar concentratingplant by the textile factory in order to experiment its functionality.
Acknowledgments
Thanksaredue toEng. SamueleMazzei for theefforts spentandhiscontribution to theactivityand toTessiltoschie Industrie Tessili S.p.A.for its precious collaboration to the development of this research.
References
[1] Kalogirou SA. The potential of solar industrial process heat applications.Applied Energy 2003;76:337e61.
[2] Kalogirou SA. Solar thermal collectors and applications. Progress in Energyand Combustion Science 2004;30:231e95.
[3] Li J. Scaling up concentrating solar thermal technology in China. Renewableand Sustainable Energy Reviews 2009;13:2051e60.
[4] Kearney DW, Price HW. Solar thermal plantsdLUZ concept (Current status ofthe SEGS plants). In: Proceedings of the 2nd renewable energy congress, vol. 2.Reading UK: Pergamon Press; 1992. 582e588.
[5] Bakos GC, Adamopoulos D, Tsagas NF, Soursos M. Design and construction ofa line-focus parabolic trough solar concentrator for electricity generation. In:Proceedings of ISES solar world congress. ISES, Jerusalem, Israel; 1999.
[6] Thomas A. Solar steam generating systems using parabolic trough concen-trators. Energy Conversion Management 1996;vol. 37(2):215e45.
[7] Kalogirou SA. Parabolic trough collector system for low temperature steamgeneration: design and performance characteristics. Applied Energy 1996;55(1):1e19.
[8] Kalogirou SA, Lloyd S, Ward J. Modeling, optimization and performanceevaluation of a parabolic trough solar collector steam generation system. SolarEnergy 1997;vol. 60(I):49e59.
[9] Kalogirou SA. Parabolic trough collectors for industrial process heat in Cyprus.Energy 2002;27:813e30.
[10] Maxoulisa CN, Kalogirou SA. Cyprus energy policy: the road to the 2006world renewable energy congress trophy. Renewable Energy 2008;33:355e65.
[11] Kalogirou SA. Use of parabolic trough solar energy collectors for sea-waterdesalination. Applied Energy 1998;60:65e88.
[12] Blanco J, Alarcon D, Sanchez B, Malato S, Maldonado MI, Hublitz A, et al.Technical comparison of different solar-assisted heat Supply system fora multi-effect seawater distillation unit; 2003. ISES solar world congress 2003.Solar Energy for a Sustainable Future. Göteborg Sweden.
[13] Coventry JS. Performance of a concentrating photovoltaic/thermal solarcollector. Solar Energy 2005;78:211e22.
[14] Geyer M, Lüpfert E, Osuna R, Esteban A, Schiel W, Schweitzer A, et al. Euro-Trough e parabolic trough collector developed for cost efficient solar powergeneration. In: Proceedings of the 11th SolarPACES International Symposium,Zurich, Switzerland; 4e6 September 2002.
[15] Fernández-García A, Zarza E, Valenzuela L, Pérez M. Parabolic-trough solarcollectors and their applications. Renewable and Sustainable Energy Reviews2010;14:1695e721.
[16] TRNSYS Program Manual. Madison, USA: University of Wisconsin; 1996. SolarEnergy Laboratory.
[17] Kalogirou SA. Use of TRNSYS for modeling and simulation of a hybridpvethermal solar system for Cyprus. Renewable Energy 2001;23:247e60.
[18] Hobby A, Siddiqui K. Optimal design of a forced circulation solar water heatingsystem for a residential unit in cold climate using TRNSYS. Solar Energy 2009;83:700e14.
[19] Brown H, Hewett R, Walker A, Gee R, May K. Performance contracting forparabolic trough solar thermal systems. Energy Engineering 1997;94(6):33e44.
[20] Sargent & Lundy LLC Consulting Group, Chicago, Illinois. Assessment ofparabolic trough and power tower solar technology cost and performanceforecasts; October 2003. NREL/SR-550e34440.
Glossary
A: depreciation charge [V]Cboiler: boiler natural gas consumption [Nm3]Cheating: space heating natural gas consumption [Nm3]Cstenter: stenter natural gas consumption [Nm3]Ctotal: overall natural gas consumption [Nm3]Dk: net cash flow (year k) [V]Gr: average solar irradiance [W/m2]i: discount rateI0: investment cost [V]n: life plan [years]Ok: overhead (year k) [V]Rk: management proceeds (year k) [V]VR: recovered amount for each year [V]
Greeksa: tax rateh: efficiencyΔT: temperature difference [K]