Investigation of spectral gain narrowing in quantum cascade lasers using terahertz time domain...
16
1 Investigation of spectral gain narrowing in quantum cascade lasers using terahertz time domain spectroscopy N. Jukam, S. S. Dhillon, D. Oustinov, Z.-Y. Zhao, S. Hameau, and J. Tignon Laboratoire Pierre Aigrain, Ecole Normale Supérieure, 75231 Paris Cedex 05, France. S. Barbieri, A.Vasanelli, P. Filloux, and C. Sirtori Matériaux et Phénomènes Quantiques, Université Paris 7, 75251 Paris Cedex 05, France. X. Marcadet Thales Research and Technology, Domaine de Corbeville, 91404 Orsay cedex, France. hal-00288345, version 1 - 16 Jun 2008 Author manuscript, published in "Applied Physics Letters 93 (2008) 101115"
-
Upload
independent -
Category
Documents
-
view
4 -
download
0
Transcript of Investigation of spectral gain narrowing in quantum cascade lasers using terahertz time domain...
1
Investigation of spectral gain narrowing in quantum cascade
lasers using terahertz time domain spectroscopy
N. Jukam, S. S. Dhillon, D. Oustinov, Z.-Y. Zhao, S. Hameau, and J. Tignon
Laboratoire Pierre Aigrain, Ecole Normale Supérieure, 75231 Paris Cedex 05, France.
S. Barbieri, A.Vasanelli, P. Filloux, and C. Sirtori
Matériaux et Phénomènes Quantiques, Université Paris 7, 75251 Paris Cedex 05, France.
X. Marcadet
Thales Research and Technology, Domaine de Corbeville, 91404 Orsay cedex, France.
hal-0
0288
345,
ver
sion
1 -
16 J
un 2
008
Author manuscript, published in "Applied Physics Letters 93 (2008) 101115"
2
Abstract
The spectral gain of bound-to-continuum terahertz quantum cascade lasers (QCLs) is
measured as a function of current density using terahertz time-domain spectroscopy.
During lasing action the full width at half maximum (FWHM) of the gain is found to
monotonically decrease with increasing current density until lasing action stops at which
point the FWHM reaches a minimum (0.22THz for a laser operating at 2.1THz).
Bandstructure calculations show that the spectral gain narrowing is due to the alignment
and misalignment of the injector with the active region as a function of the applied bias
field.
hal-0
0288
345,
ver
sion
1 -
16 J
un 2
008
3
Important progress on terahertz quantum cascade lasers (QCLs) has been
achieved in the last few years leading to long wavelength1, high power2, low current
operation3, and working temperatures up to 178K4. In order to realize further
improvements, a better understanding of the gain formation mechanism, and its limiting
factors are needed. To this end it is necessary to perform detailed measurements of the
gain including its spectral shape. Previous studies have been performed for mid-infrared
QCLs. For these measurements, electro-luminescence from a non-lasing cavity is coupled
into an adjacent cavity that shows laser action.5 However, in the terahertz regime such
electro-luminescence based studies are difficult, because of the reduced spontaneous
emission at longer wavelengths. Electro-luminescence from the laser cavity has also been
used to provide information on upper state lifetimes of terahertz QCLs.6 In this case to
avoid the effect of laser emission, the electro-luminescence from the laser cavity must be
collected from a cleaved edge running though the middle of the laser.7 Multiple probe
pulses coupled into the QCL’s end facets can also be used to investigate the temporal
dynamics of the gain. Coherent population transfer and gain saturation have been
observed with this technique at mid-infrared frequencies.8,9 Recently, terahertz time-
domain spectroscopy (TDS) has been shown to be a powerful technique to measure the
gain spectra in terahertz QCLs.10,11,12 Here, a broadband terahertz probe pulse is coupled
into the QCL, and the electric field of the transmitted pulses is measured using electro-
optic sampling.13
In this letter terahertz TDS is used to investigate the line-width of the spectral gain
as a function of current density. Two terahertz QCLs lasers with different bound-to-
continuum designs are studied. One laser emits at 2.1THz14 and the other emits at
2.9THz.15 For both devices, as the current density is increased from threshold, we observe
a monotonic decrease of the full width at half maximum (FWHM) of the gain. After the
hal-0
0288
345,
ver
sion
1 -
16 J
un 2
008
4
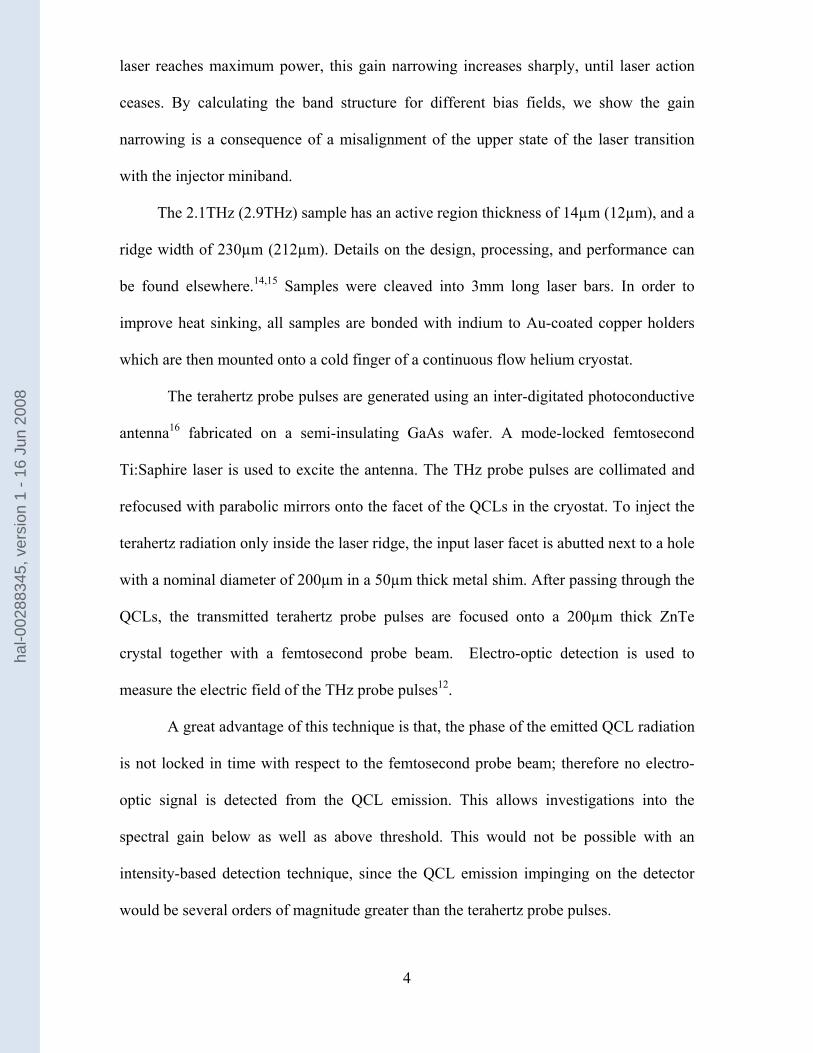
laser reaches maximum power, this gain narrowing increases sharply, until laser action
ceases. By calculating the band structure for different bias fields, we show the gain
narrowing is a consequence of a misalignment of the upper state of the laser transition
with the injector miniband.
The 2.1THz (2.9THz) sample has an active region thickness of 14µm (12µm), and a
ridge width of 230µm (212µm). Details on the design, processing, and performance can
be found elsewhere.14,15 Samples were cleaved into 3mm long laser bars. In order to
improve heat sinking, all samples are bonded with indium to Au-coated copper holders
which are then mounted onto a cold finger of a continuous flow helium cryostat.
The terahertz probe pulses are generated using an inter-digitated photoconductive
antenna16 fabricated on a semi-insulating GaAs wafer. A mode-locked femtosecond
Ti:Saphire laser is used to excite the antenna. The THz probe pulses are collimated and
refocused with parabolic mirrors onto the facet of the QCLs in the cryostat. To inject the
terahertz radiation only inside the laser ridge, the input laser facet is abutted next to a hole
with a nominal diameter of 200µm in a 50µm thick metal shim. After passing through the
QCLs, the transmitted terahertz probe pulses are focused onto a 200µm thick ZnTe
crystal together with a femtosecond probe beam. Electro-optic detection is used to
measure the electric field of the THz probe pulses12.
A great advantage of this technique is that, the phase of the emitted QCL radiation
is not locked in time with respect to the femtosecond probe beam; therefore no electro-
optic signal is detected from the QCL emission. This allows investigations into the
spectral gain below as well as above threshold. This would not be possible with an
intensity-based detection technique, since the QCL emission impinging on the detector
would be several orders of magnitude greater than the terahertz probe pulses.
hal-0
0288
345,
ver
sion
1 -
16 J
un 2
008

5
The QCL is modulated with 10µs electrical pulses with a period of 40µs. The
inter-digitated antenna is modulated with 10µs electrical pulses with a period of 20µs,
such that the QCL was on and then off for every other antenna pulse. This allows the
difference between the THz electric fields with the QCL on and off (the difference field),
to be measured. The gain spectra can then be derived using the difference field and a
reference field.12
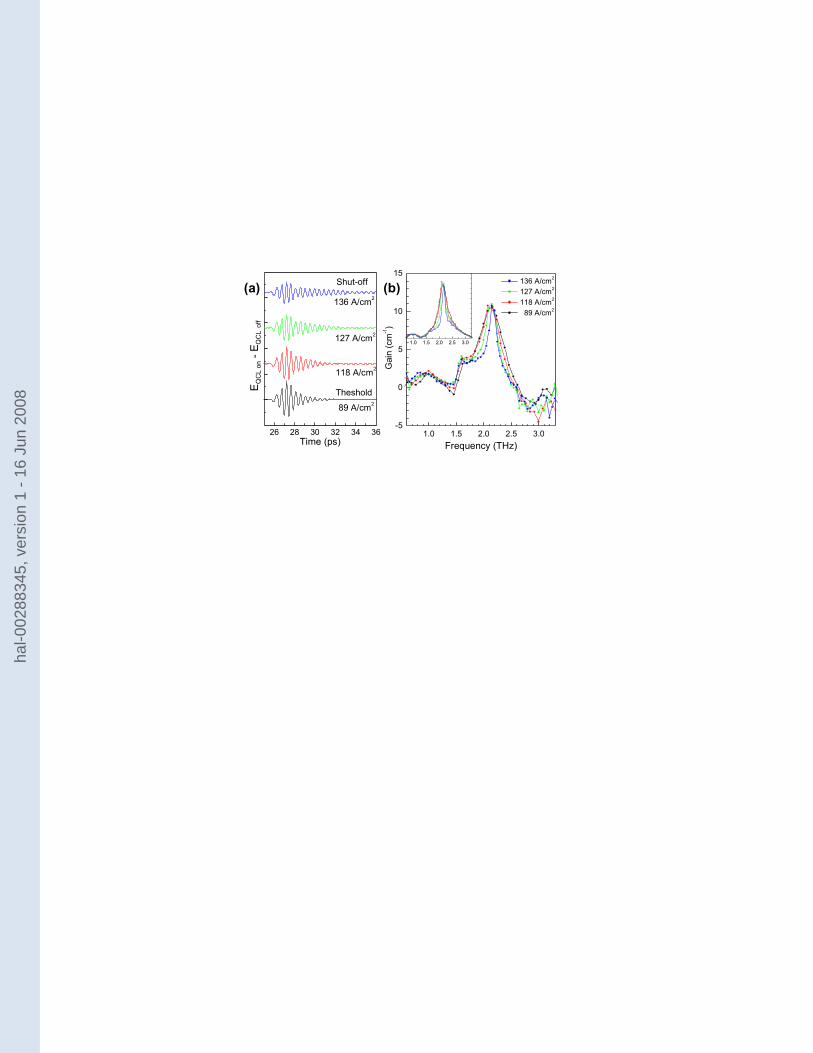
Figure 1a shows the transmitted difference field for various current densities for
the 2.1THz QCL. Oscillations of the electric field are observed, that are due to the
amplification of the input pulse at the QCL gain. At the threshold current (Jth=89A/cm2)
the field oscillations die out quickly. However as the current density (and hence the bias
field) is increased more and longer lasting oscillations are observed. At the laser shut-off
current (136 A/cm2), the field oscillations last almost twice as long as at threshold,
indicating a reduction in the spectral width. The gain spectra of the 2.1THz device is
shown in figure 1b, clearly showing peak gain at 2.1THz i.e. at the emission frequency of
the QCL. As the applied bias is increased the linewidth of the main peak at 2.1THz
decreases. This can also be seen in the inset of figure 1b) which shows the Fourier
transform of the difference field. Besides the main peak at 2.1THz, a shoulder near 1.6-
1.7THz is present. It appears to be an artifact of a small dip in the reference pulse near
1.6THz. A broad absorption feature for frequencies greater then 2.5THz is also present.
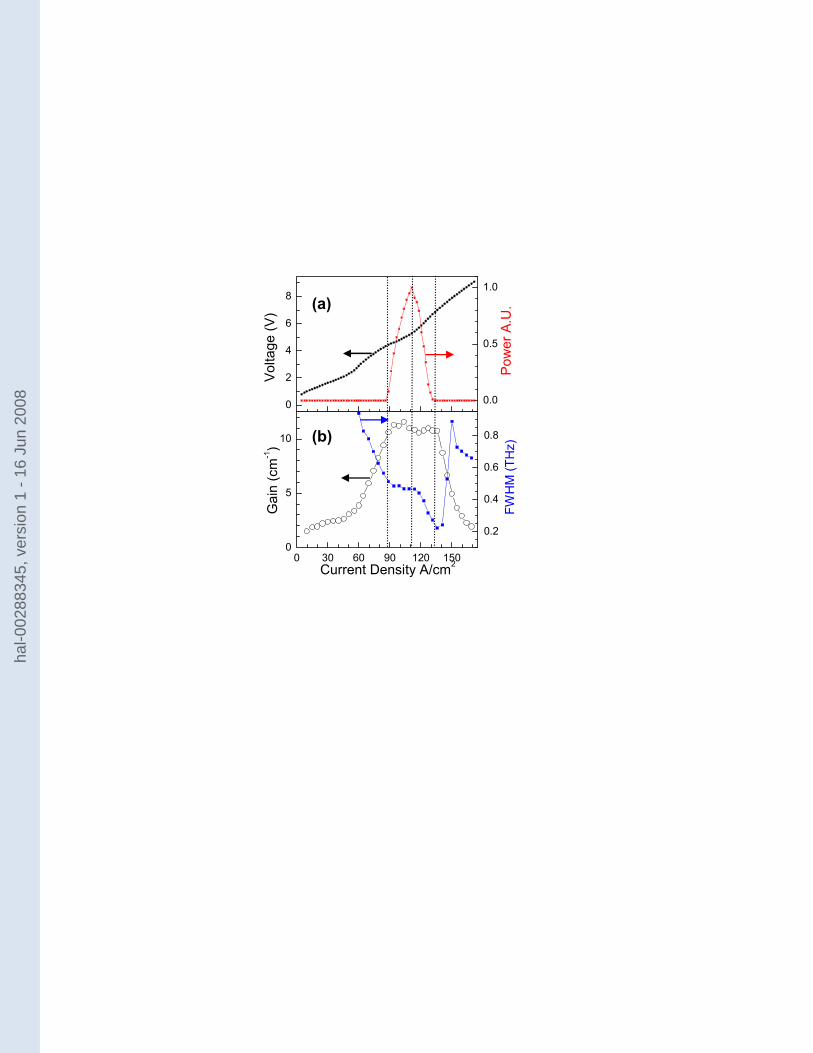
Figure 2a shows the V-I and L-I curves of the 2.1 THz laser. Below, figure 2b
shows the gain at the laser frequency and the FWHM of the gain as a function of current
density. Below threshold the gain of the laser increases sharply after 60A/cm2 as the
structure begins to align. The measured gain clamps near threshold (93 A/cm2) at 11cm-1
due to laser action. The gain remains constant until approximately 136A/cm2 (where laser
action ceases) after which it decreases rapidly.
hal-0
0288
345,
ver
sion
1 -
16 J
un 2
008
6
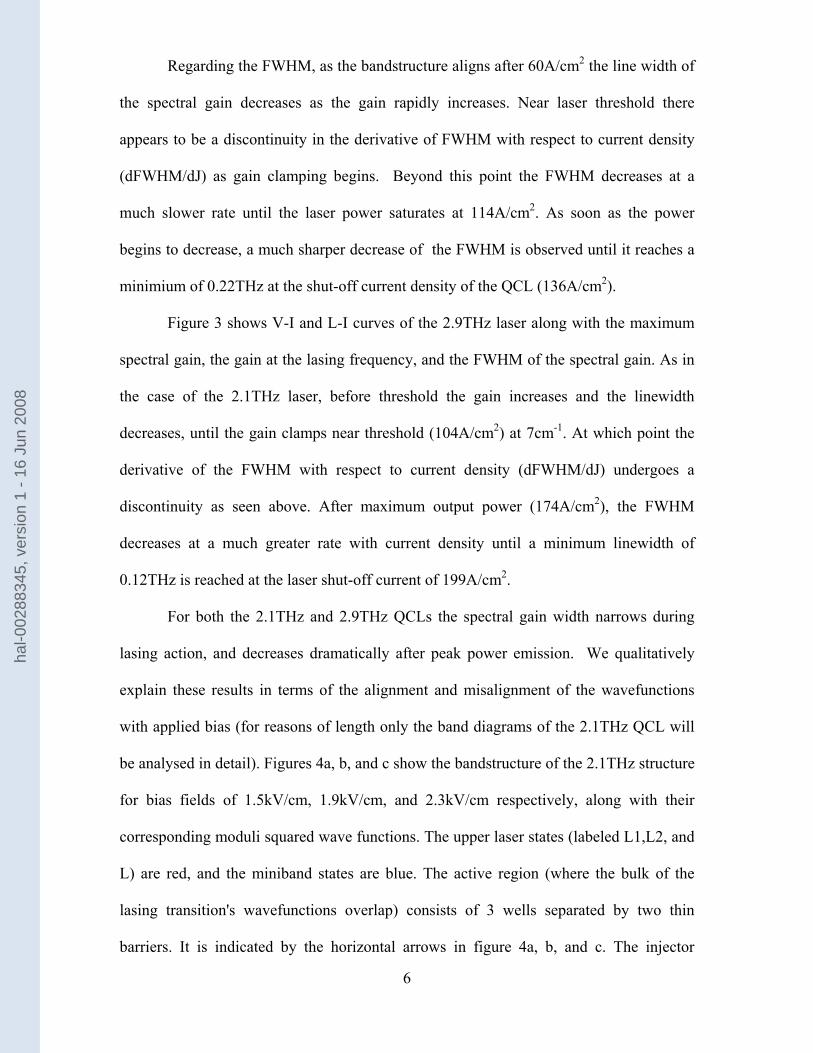
Regarding the FWHM, as the bandstructure aligns after 60A/cm2 the line width of
the spectral gain decreases as the gain rapidly increases. Near laser threshold there
appears to be a discontinuity in the derivative of FWHM with respect to current density
(dFWHM/dJ) as gain clamping begins. Beyond this point the FWHM decreases at a
much slower rate until the laser power saturates at 114A/cm2. As soon as the power
begins to decrease, a much sharper decrease of the FWHM is observed until it reaches a
minimium of 0.22THz at the shut-off current density of the QCL (136A/cm2).
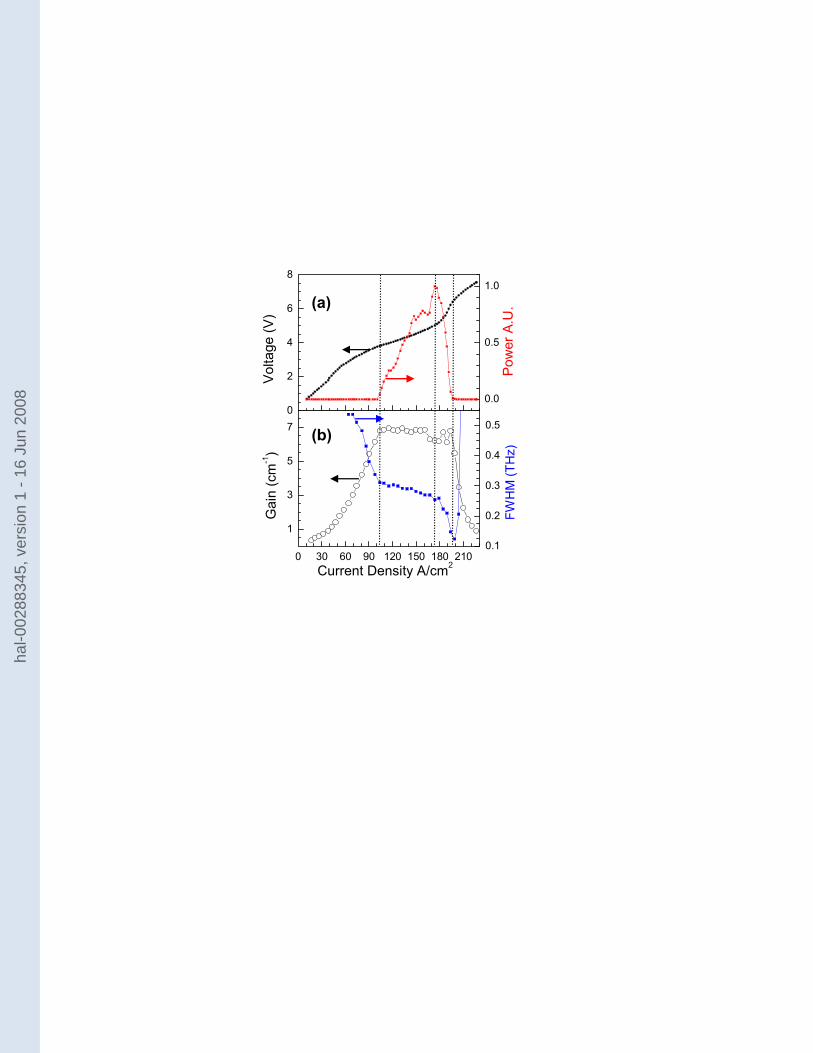
Figure 3 shows V-I and L-I curves of the 2.9THz laser along with the maximum
spectral gain, the gain at the lasing frequency, and the FWHM of the spectral gain. As in
the case of the 2.1THz laser, before threshold the gain increases and the linewidth
decreases, until the gain clamps near threshold (104A/cm2) at 7cm-1. At which point the
derivative of the FWHM with respect to current density (dFWHM/dJ) undergoes a
discontinuity as seen above. After maximum output power (174A/cm2), the FWHM
decreases at a much greater rate with current density until a minimum linewidth of
0.12THz is reached at the laser shut-off current of 199A/cm2.
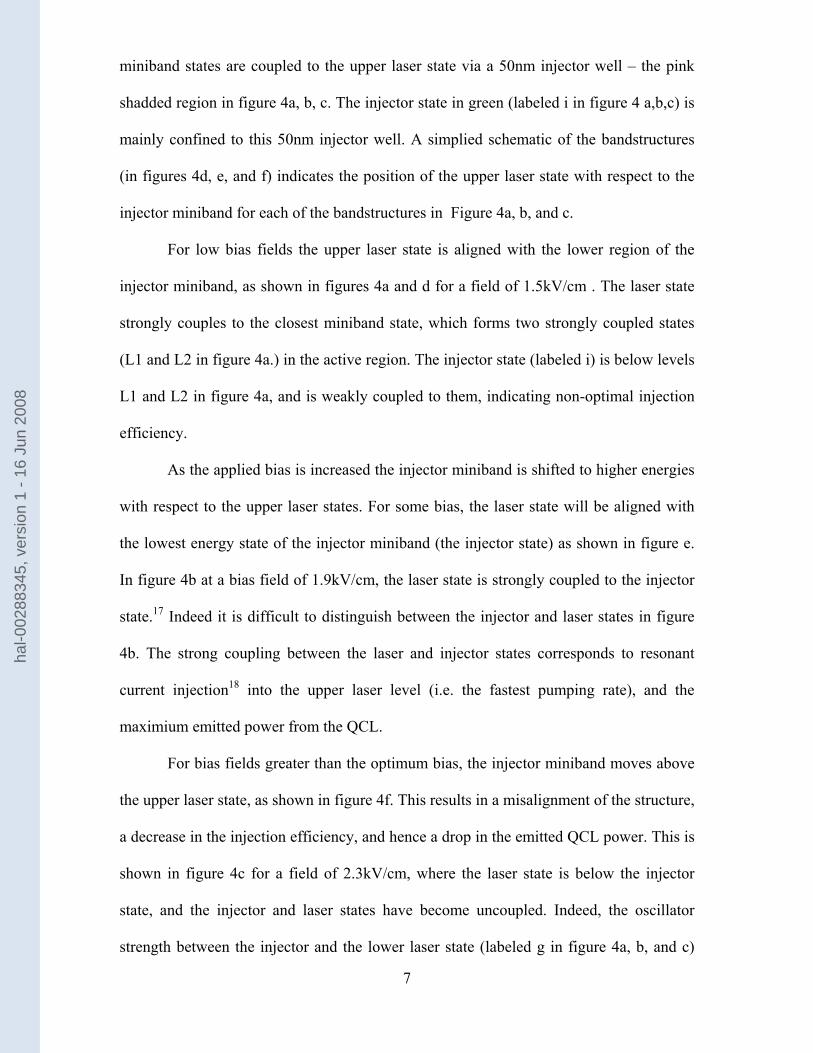
For both the 2.1THz and 2.9THz QCLs the spectral gain width narrows during
lasing action, and decreases dramatically after peak power emission. We qualitatively
explain these results in terms of the alignment and misalignment of the wavefunctions
with applied bias (for reasons of length only the band diagrams of the 2.1THz QCL will
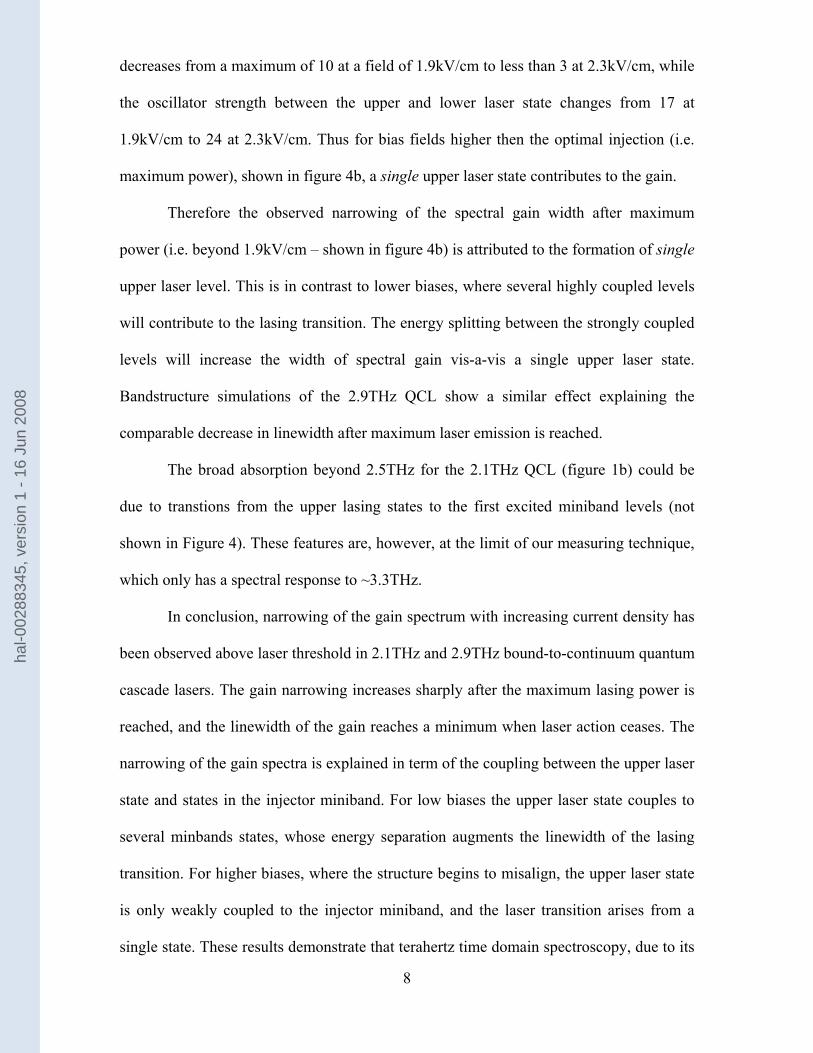
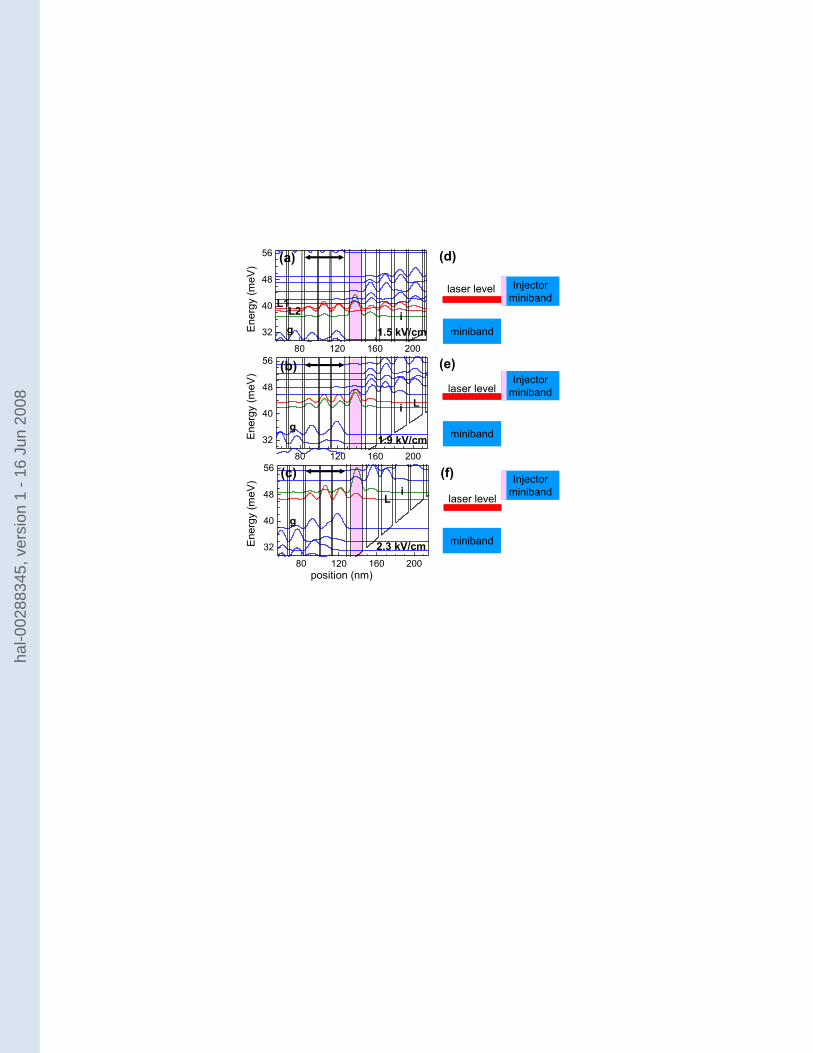
be analysed in detail). Figures 4a, b, and c show the bandstructure of the 2.1THz structure
for bias fields of 1.5kV/cm, 1.9kV/cm, and 2.3kV/cm respectively, along with their
corresponding moduli squared wave functions. The upper laser states (labeled L1,L2, and
L) are red, and the miniband states are blue. The active region (where the bulk of the
lasing transition's wavefunctions overlap) consists of 3 wells separated by two thin
barriers. It is indicated by the horizontal arrows in figure 4a, b, and c. The injector
hal-0
0288
345,
ver
sion
1 -
16 J
un 2
008
7
miniband states are coupled to the upper laser state via a 50nm injector well – the pink
shadded region in figure 4a, b, c. The injector state in green (labeled i in figure 4 a,b,c) is
mainly confined to this 50nm injector well. A simplied schematic of the bandstructures
(in figures 4d, e, and f) indicates the position of the upper laser state with respect to the
injector miniband for each of the bandstructures in Figure 4a, b, and c.
For low bias fields the upper laser state is aligned with the lower region of the
injector miniband, as shown in figures 4a and d for a field of 1.5kV/cm . The laser state
strongly couples to the closest miniband state, which forms two strongly coupled states
(L1 and L2 in figure 4a.) in the active region. The injector state (labeled i) is below levels
L1 and L2 in figure 4a, and is weakly coupled to them, indicating non-optimal injection
efficiency.
As the applied bias is increased the injector miniband is shifted to higher energies
with respect to the upper laser states. For some bias, the laser state will be aligned with
the lowest energy state of the injector miniband (the injector state) as shown in figure e.
In figure 4b at a bias field of 1.9kV/cm, the laser state is strongly coupled to the injector
state.17 Indeed it is difficult to distinguish between the injector and laser states in figure
4b. The strong coupling between the laser and injector states corresponds to resonant
current injection18 into the upper laser level (i.e. the fastest pumping rate), and the
maximium emitted power from the QCL.
For bias fields greater than the optimum bias, the injector miniband moves above
the upper laser state, as shown in figure 4f. This results in a misalignment of the structure,
a decrease in the injection efficiency, and hence a drop in the emitted QCL power. This is
shown in figure 4c for a field of 2.3kV/cm, where the laser state is below the injector
state, and the injector and laser states have become uncoupled. Indeed, the oscillator
strength between the injector and the lower laser state (labeled g in figure 4a, b, and c)
hal-0
0288
345,
ver
sion
1 -
16 J
un 2
008
8
decreases from a maximum of 10 at a field of 1.9kV/cm to less than 3 at 2.3kV/cm, while
the oscillator strength between the upper and lower laser state changes from 17 at
1.9kV/cm to 24 at 2.3kV/cm. Thus for bias fields higher then the optimal injection (i.e.
maximum power), shown in figure 4b, a single upper laser state contributes to the gain.
Therefore the observed narrowing of the spectral gain width after maximum
power (i.e. beyond 1.9kV/cm – shown in figure 4b) is attributed to the formation of single
upper laser level. This is in contrast to lower biases, where several highly coupled levels
will contribute to the lasing transition. The energy splitting between the strongly coupled
levels will increase the width of spectral gain vis-a-vis a single upper laser state.
Bandstructure simulations of the 2.9THz QCL show a similar effect explaining the
comparable decrease in linewidth after maximum laser emission is reached.
The broad absorption beyond 2.5THz for the 2.1THz QCL (figure 1b) could be
due to transtions from the upper lasing states to the first excited miniband levels (not
shown in Figure 4). These features are, however, at the limit of our measuring technique,
which only has a spectral response to ~3.3THz.
In conclusion, narrowing of the gain spectrum with increasing current density has
been observed above laser threshold in 2.1THz and 2.9THz bound-to-continuum quantum
cascade lasers. The gain narrowing increases sharply after the maximum lasing power is
reached, and the linewidth of the gain reaches a minimum when laser action ceases. The
narrowing of the gain spectra is explained in term of the coupling between the upper laser
state and states in the injector miniband. For low biases the upper laser state couples to
several minbands states, whose energy separation augments the linewidth of the lasing
transition. For higher biases, where the structure begins to misalign, the upper laser state
is only weakly coupled to the injector miniband, and the laser transition arises from a
single state. These results demonstrate that terahertz time domain spectroscopy, due to its
hal-0
0288
345,
ver
sion
1 -
16 J
un 2
008
9
insensitivity to the laser emission, is a powerful tool for investigating the internal
bandstructure alignment of QCLs. These investigations should have an impact on future
QCL designs as well as an increased understanding of the injector-laser state coupling.
Acknowledgements
This work was financially supported by the Délégation Générale pour l’Armement
(DGA), Region Ile de France and the Agence Nationale pour la Recherche (ANR). The
Laboratoire Pierre Aigrain of the ENS is a "Unité Mixte de Recherche Associée au CNRS
UMR8551 et aux Universités Paris 6 et 7".
hal-0
0288
345,
ver
sion
1 -
16 J
un 2
008
10
Figure Captions
Figure 1: (Color online) a) Difference electric fields (EQCL ON – EQCL OFF) of the 2.1THz
QCL for various current densities. 89A/cm2 and 136A/cm2 correspond to the laser
threshold and the laser shut-off point. b) Measured spectral gain of the 2.1THz QCL for
various current densities. The insert shows the Fourier transform of the difference fields
of figure 1a.
Figure 2: (Color online) a) V-I and L-I curves of the 2.1THz laser at 4.2K b) Spectral
gain at the laser frequency, and FWHM of the gain as a function of current density at
4.2K. The vertical dashed lines correspond, from left to right, laser threshold, peak power
output and laser shut-off.
Figure 3: (Color online) a) The V-I and L-I curves of the 2.9THz laser at 10K. b)
Spectral gain at the laser frequency and FWHM of the gain as a function of current
density at 10K. The vertical dashed lines correspond, from left to right, laser threshold,
peak power output and laser shut-off.
Figure 4: a, b, and c) Square modulus of the wave functions, with the injector well
(shaded pink) for biases of 1.5, 1.9 and 2.3kV/cm. The upper laser states (red) are labeled
L1, L2 and L. The lower laser state is labeled g. The miniband states are in blue. The
injector well state (labeled i) is in green. d, e, and f) Schematic of upper laser state and
injector miniband alignment corresponding to figures 4a, b, and c respectively.
hal-0
0288
345,
ver
sion
1 -
16 J
un 2
008
11
References
1) C. Walther, M. Fischer, G. Scalari, R. Terazzi, N. Hoyler and J. Faist, Appl. Phys.
Lett. 91, 131122 (2007).
2) B.S. Williams, S. Kumar, Q. Hu and J.L. Reno, Elect Lett. 42, 89 (2006).
3) S. Dhillon, J. Alton, S. Barbieri and C. Sirtori, Appl. Phys. Lett. 87, 071107 (2005).
4) M. A. Belkin, J. A. Fan, S. Hormoz, F. Capasso, S.P. Khanna, M. Lachab, A. G.
Davies, and E. H. Linfield, Opt. Express 16, 3242 (2008); B.S. Williams, S. Kumar,
Q. Hu and J. L. Reno, Opt. Express 13, 3331 (2005).
5) S. Barbieri, C. Sirtori, H. Page, M. Beck, J. Faist and J. Nagle, IEEE J. Quant. Elect.
36, 736 (2000).
6) G. Scalari, L. Ajili, J. Faist, H. Beere, E. Linfield, D. Ritchie and G. Davies, Appl.
Phys. Lett. 23, 3165 (2003).
7) R. Colombelli, F. Capasso, C. Gmachl, A. Tredicucci, A. M. Sergent, A. L.
Hutchinson, D. L. Sivco and A. Y. Cho, Appl. Phys. Lett. 77, 3893 (2000).
8) F. Eickemeyer, K. Reimann, M. Woerner, and T. Elsaesser, S. Barbieri, C. Sirtori,
G. Strasser, T. Muller, R. Bratschixch, and K. Unterrainer, Phys. Rev. Lett. 89,
047402 (2002).
9) H. Choi, T. B. Norris, T. Gresch, M. Girovannini, J. Faist, L. Diehl and F. Capasso,
Appl. Phys. Lett 92, 122114 (2008).
10) J. Kröll, J. Darmo, S. S. Dhillon, X. Marcadet, M. Calligaro, C. Sirtori and K.
Unterrainer, Nature 449, 698 (2007).
11) J. Kröll, J. Darmo, K. Unterrainer, S. S. Dhillon, C. Sirtori, X. Marcadet and M.
Calligaro, Appl. Phys. Lett. 91, 161108 (2007).
hal-0
0288
345,
ver
sion
1 -
16 J
un 2
008
12
12) N. Jukam , S. S. Dhillon, Z. Y. Zhao, G. Duerr, J. Armijo, N. Sirmons, S. Hameau, S.
Barbieri, P. Filloux, C. Sirtori, X. Marcadet and J. Tignon, IEEE J. Selected Topics in
Quantum Electronics 14, 436 (2008).
13) Q. Wu and X. C. Zhang, Appl. Phys. Lett., 68, 1604 (1996).
14) C. Worrall, J. Alton, M. Houghton, S. Barbieri, H. E. Beere, D. A. Ritchie and C.
Sirtori, Optics Express 14, 171 (2006).
15) S. Barbieri, J. Alton, H. E. Beere, J. Fowler, E. H. Linfield and D. A. Ritchie, Appl.
Phys. Lett., 85, 1674 (2004).
16) A. Dreyhaupt, S. Winnerl, T. Dekorsy and M. Helm, Appl. Phys. Lett. 86, 121114
(2005).
17) The energy splitting between the upper laser state and the injector state is a local
minimum at 1.9kV/cm which indicates that maximium coupling between the states.
18) C. Sirtori, F. Capasso, J. Faist, A. L. Hutchinson, D. L. Sivco and A.Y. Cho, IEEE J.
Quant. Elect. 34, 1722 (1998).
hal-0
0288
345,
ver
sion
1 -
16 J
un 2
008
1.0 1.5 2.0 2.5 3.0-5
0
5
10
15
1.0 1.5 2.0 2.5 3.0
136 A/cm2
127 A/cm2
118 A/cm2
89 A/cm2
Gai
n (c
m-1)
Frequency (THz)
26 28 30 32 34 36
136 A/cm2
127 A/cm2
118 A/cm2
89 A/cm2
Time (ps)
Shut-off
Theshold
(a) (b)
EQ
CL
on-E
QC
Lof
f
hal-0
0288
345,
ver
sion
1 -
16 J
un 2
008
0
2
4
6
8
0.0
0.5
1.0
0 30 60 90 120 1500
5
10
0.2
0.4
0.6
0.8
Volta
ge (V
)
Pow
er A
.U.
Current Density A/cm2
Gai
n (c
m-1)
FWH
M (T
Hz)
(a)
(b)
hal-0
0288
345,
ver
sion
1 -
16 J
un 2
008
(a)
(b)0
2
4
6
8
0.0
0.5
1.0
0 30 60 90 120 150 180 210
1
3
5
7
0.1
0.2
0.3
0.4
0.5
Vol
tage
(V)
Pow
er A
.U.
Current Density A/cm2
Gai
n (c
m-1)
FWH
M (T
Hz)
hal-0
0288
345,
ver
sion
1 -
16 J
un 2
008
Injectorminiband
80 120 160 200
32
40
48
56
80 120 160 200
32
40
48
56
80 120 160 200
32
40
48
56
position (nm)
Ene
rgy
(meV
)E
nerg
y (m
eV)
Ene
rgy
(meV
)
(c)
(b)
(a)
(f)
(e)
(d)
iL
g
Injectorminiband
miniband
laser level
miniband
laser level
Injectorminiband
miniband
laser level
i
i
g
gL2
L1
L
1.5 kV/cm
1.9 kV/cm
2.3 kV/cm
hal-0
0288
345,
ver
sion
1 -
16 J
un 2
008