Navigating the Financial Market - LASERS
69
2016 Annual Investment Report LASERS Navigating the Financial Market
-
Upload
khangminh22 -
Category
Documents
-
view
1 -
download
0
Transcript of Navigating the Financial Market - LASERS

2016
Annual Investment Report
LASERS Navigating the Financial Market

can be a challenge. Dense woods, choppy waters, bumpy roads, and
cloudy skies – all of these are encountered when traveling in Louisiana. To some, these are
viewed as infuriating road blocks, slowing us in reaching the ultimate destination. Yet to
others, these are viewed as minor obstacles, little things to deal with while en route. And yet
still there are those who see these as necessary encounters, for without them the journey
would not be rewarding. Navigating the financial markets can be viewed in a similar context.
Slowing growth, volatility, and negative returns are real challenges faced by financial markets
in recent years. It would be unrealistic to rationally expect ever-pleasant encounters – in
traveling as well as in investing. Therefore, LASERS uses a focused approach to understand
the markets, set appropriate asset allocations and achieve sound long-term returns in order
to provide our members with retirement stability.
CONTENTS
Board of Trustees…………………………………………………………..2
By the Numbers…………………………………………………………….4
CIO Message………………………………………………………………….5
Total Fund Review………………………………………………………..7
Public Equity……………………………………………………………….15
Fixed Income………………………………………………………………23
Alternatives…………………………………………………………………31
Global Asset Allocation……………………………………………..37
Supplemental Information………………………………………..41
1
Navigating

Thomas Bickham Department of Public Safety & Corrections
Virginia Burton Retired from Department of Revenue
Beverly Hodges Department of Natural Resources
Judge William Kleinpeter Board Chair
City Court of Port Allen
Commissioner Jay Dardenne Commissioner of Administration
State Treasurer John Kennedy Department of the Treasury
Active Member Retired Member
Ex Officio Member
BOARD OF TRUSTEES
2

Janice Lansing Coastal Protection & Restoration Authority
Lorry Trotter Retired from Louisiana State University
Lori Pierce Active Member
Department of the
Treasury
Shannon Templet House of Representatives
Senator Barrow Peacock Senate Retirement
Committee Chair
Representative Kevin Pearson House Retirement Committee Chair
Kathy Singleton Retired from Department of Social Services
Lori Pierce Department of
the Treasury
3

$116.8 MILLION
LOUISIANA INVESTMENTS $10.0 BILLION
MARKET VALUE
$25.4 THOUSAND
AVERAGE ANNUAL BENEFIT RANK-AND-FILE RETIREES
$3.2 BILLION
INTERNALLY MANAGED ASSETS
145.8 THOUSAND
TOTAL MEMBERS
$1.2 BILLION
BENEFITS PAID 8.1PERCENT
30-YEAR ACTUARIAL ANNUAL RETURN
4

We have experienced another volatile fiscal year
due to global concerns in financial markets.
Again, international equities, most notably
emerging market equities, had the largest
impact on performance. For the fiscal year
ending June 30, 2016, LASERS investment
portfolio realized a market rate of return on
investment assets of -2.4%. This year’s
actuarial rate of return was 5.4%.
LASERS compares itself against other public
pension plans with market values greater than
$1 billion in the Trust Universe Comparison
Service (TUCS) with a focus on long-term
results. In extended time periods, LASERS
ranked at the median for both the seven-and
ten-year periods. While this is LASERS stated
goal, the Plan seeks to beat that, and has
traditionally done so during more normal
market periods.
As always, LASERS maintains its
commitment to a broadly diversified portfolio
and achieving its actuarial target rate of return
of 7.75% with the least possible amount of risk.
Carefully underwritten and conservative
assumptions for future expected returns have
been adopted, and the investment portfolio is
structured to optimize the risk/return trade-off.
D e a r M e m b e r s
During the fiscal year, LASERS continued to
work toward its ongoing goal of
comprehensively monitoring the plan’s
investments in relation to current market
environments. Changes to the plan’s asset
allocation were approved at the beginning of the
fiscal year and implemented throughout the
year. Those changes included tweaking the
overall equity allocation, and moving out of
both opportunistic credit and real assets, while
entering the Global Multi-Sector fixed income
asset class.
The Investment Division continuously seeks to
be a premier pension plan by creating,
implementing, and evaluating its strategic
goals and objectives. We strive to be a plan that
is forward thinking, disciplined, and efficient.
This includes continuously looking to lower
overall investment costs while maintaining a
high degree of expertise.
Going forward, we are committed to improving
upon what we have already achieved and
diligently working toward the future. We
continue to believe that LASERS is well
positioned to meet its long-term goals and
objectives.
Sincerely,
Robert W. Beale, CFA, CAIA
Chief Investment Officer
5

This page intentionally left blank.
6

2 3
4
7

This page intentionally left blank.
8

As of June 30, 2016, the Total Plan had a market value of assets of $10,047.4 million. The gross of fee return for fiscal year end was
-2.4%. The three- and five-year annualized returns were 5.6% and 5.9%, respectively. The total portfolio has grown nearly $3 billion
over the last decade.
Asset Allocation
LASERS target allocation is determined after a comprehensive annual study that is conducted by internal staff in conjunction with
LASERS external investment consultant, NEPC. Key inputs into the study include historical returns, relative value, and the likelihood
of mean reversion. Risk budgeting and scenario analysis are tools used in the study. The primary focus of the asset allocation is to
maintain a broadly diversified portfolio while achieving the target rate of return with the least possible amount of risk. Changes to
the plan’s asset allocation were approved at the beginning of the fiscal year and implemented throughout the year. Those changes
included tweaking the overall equity allocation, and moving out of both opportunistic credit and real assets, while entering the
global multi-sector fixed income asset class.
An
nu
al R
ep
ort
20
16
TOTAL FUND REVIEW
Total Equity
Target 57% / Actual 56.1%
Total Fixed Income
Target 14% / Actual 13.1%
Total Alternatives
Target 22% / Actual 22.9%
Total Global Asset Allocation
Target 7% / Actual 7.4%
Total Cash
Target 0% / Actual 0.5%
9

Asset Allocation Detail
Market Value ($millions)
Percent of Total Plan
Equity
Domestic Equity $2,527.0 25.2%
International Equity 3,105.5 30.9%
Total Equity $5,632.5 56.1%
Fixed Income
Domestic Fixed 821.3 8.2%
Emerging Market Debt 150.8 1.5%
Global Multi-Sector 342.1 3.4%
Total Fixed Income $1,314.2 13.1%
Alternatives
Private Equity 1,365.4 13.6%
Absolute Return 935.5 9.3%
Total Alternatives* $2,308.4 23.0%
Total Global Asset Allocation $739.7 7.4%
Total Cash $41.9 0.4%
Total Funds Allocated** $10,047.4 100.0% *Includes $7.4m of Real Asset allocation that is in liquidation status **Includes $10.9m in Harbor police Funds
LASERS has embarked on a long-term strategic planning process with the main goal focused on increasing returns and reducing
costs. To this end, LASERS has continued to utilize passive (index) management in both the domestic and international equity asset
classes.
An
nu
al R
ep
ort
20
16
TOTAL FUND REVIEW
10

Management Style
At fiscal year end 2016, LASERS staff managed nearly one-third of the plan assets within five funds – three domestic equity (S&P 500,
S&P 400, and S&P 600) and two international equity (MSCI World Ex-USA and Terror-Free) portfolios. These index funds are
representative of the U.S. domestic equity market and the core international equity market. The Terror-Free fund was created in
response to LA R.S. 11:316 and is representative of the international large cap market but refrains from holding companies that have
facilities in a prohibited nation (Iran, North Korea, Sudan, or Syria as defined by LA R.S. 11:312).
The benefits of internally managing these index funds are two-fold: LASERS can efficiently gain exposure to the asset class while
saving millions of dollars in investment management fees. During the fiscal year, LASERS was able to save over $9 million through
this cost-saving method.
Total Plan
Active 68%
Passive 32%
Domestic Equity
Active 24%
Passive 76%
International Equity
Active 59%
Passive 41%
11
Market Overview
The volatility which prevailed during the previous fiscal year continued throughout the current fiscal year due to global concerns in
financial markets. Again this year, international equities, most notably emerging market equities, had the largest impact on
performance. The MSCI Emerging Markets Index fell 11.7% for the one-year period ending June 30, 2016, and the MSCI World Ex-
USA Index saw a decline of 9.4%. Domestic equities and fixed income posted modest positive returns for the period, with the S&P
500 Index returning 3.4% and the Barclay’s Aggregate posting 6.0%. The Federal Reserve Bank held interest rates near zero but
announced the objective of a gradual rise to approximately 2% by 2018. This was driven by further growth in the labor market,
wage growth, declining resource supplies and anticipated increases in energy prices.
The fiscal year opened with concerns around a potential “Grexit”, Greece exiting from the Eurozone, as well as a slow-down in
China’s import growth that caused ripple effects in both emerging and developed markets. January through mid-February was
marked by sharp declines in part due to low oil prices and a steep slow-down in merger and acquisition activity. And then came
“Brexit”, the United Kingdom’s decision by vote on June 23 to leave the European Union. This triggered a $3 trillion loss in global
markets over two trading days. Stocks bounced back by the third trading day as investors were taking advantage of the ability to
buy cheaply. The fiscal year closed with the consensus agreeing that volatility would continue as “Brexit” further developed.
Performance
For the fiscal year ending June 30, 2016, the total plan returned -2.4%. Domestic fixed income and global asset allocation produced
positive returns, while domestic equity was flat. Both alternatives and international equity yielded negative returns.
LASERS aims to have the total plan meet or exceed the Allocation Index return and the Policy Index return. The Allocation Index
return measures the success of the Plan’s current allocation, or active management, whereas the Policy Index return measures the
success of the plan’s target allocation. LASERS accomplished this goal for the five-year time period but fell short in both the one- and
three-year time periods, given the high level of volatility present during the last two fiscal years.
To that regard, the Sortino ratio is used to analyze the volatility in LASERS portfolio. The Sortino ratio measures the risk-adjusted
return of an individual portfolio by calculating excess return per unit of risk, with downside volatility as the measure of risk. As of
fiscal year end 2016, LASERS ten-year Sortino ranked above median, suggesting that the Plan has over time achieved an appropriate
risk/return profile.
An
nu
al R
ep
ort
20
16
TOTAL FUND REVIEW
12

Major Indices – Fiscal Year Performance LASERS Asset Classes – Fiscal Year End Returns
Ranking Against Peers
LASERS uses Trust Universe Comparison Services (TUCS) rankings to compare itself to a universe of large pension plans to help gauge
performance. TUCS provides a universe comparison of market returns for the larger public pension plans in the United States. The
-2.4% return for the 2015-2016 fiscal year placed LASERS ranking in the ninety-sixth percentile of other plans with assets exceeding
$1 billion. LASERS larger allocation to international equity and zero allocation to real estate contributed to this ranking. However,
in the more meaningful, longer-term seven- and ten-year periods, LASERS ranked at the median. While this is LASERS stated goal,
the Plan seeks to beat that, and has traditionally done so during more normal market periods.
-15.0%
-10.0%
-5.0%
0.0%
5.0%
10.0%
15.0%
S&P 500 MSCI World Ex-USA
BC US Aggregate Bond JPM GBI-EM Global Diversified
MSCI Emerging Markets
0.0%
-9.2%
3.2%
-4.7%
0.6%
10.3%
2.0%
5.0% 5.1% 4.4%
11.1%
0.7%
6.6%5.4% 5.7%
-15.0%
-10.0%
-5.0%
0.0%
5.0%
10.0%
15.0%
DomesticEquity
InternationalEquity
DomesticFixed
Alternatives GAA
FYTD 3 Years 5 Years
13

This page intentionally left blank.
14

5
6
7
15

This page intentionally left blank.
16

As of June 30, 2016, the Public Equity portfolio had a market value of $5,632.5 million, representing 56.1% of the Total Plan. Within
the Public Equity Program, $2,527.0 million, or 25.2% of the Total Plan, was allocated to domestic equity, and $3,105.5 million, or
30.9% of the Total Plan, was allocated to international equity.
Equity Allocation
Domestic Equity Market Overview
The fiscal year ended 2016 was a story of two very different markets: a severe market correction from June 30, 2015 through
February 11, 2016, followed by a powerful rally off of the February bottom through fiscal year end. A bull market remained intact
for the seventh straight year, although several long-standing worries lingered. Nervousness about the number and frequency of
future rate hikes, collapsing oil prices, terrorism, global economic slowing (particularly in China), and stretched equity valuations
(especially in Health Care and Social Media) provided the perfect backdrop for a first fiscal quarter drop. Stocks in the Energy sector,
followed by Materials, Health Care, and Industrials led the decline. Encouraged by better-than-feared earnings and some apparent
stabilization in commodity prices, the second fiscal quarter recovered part of Q1 losses. In mid-December, despite weakness in GDP
growth, the Federal Reserve increased rates a nominal 0.25%, signaling confidence in the U.S. economic position. While the market
An
nu
al R
ep
ort
20
16
PUBLIC EQUITY
Domestic Equity
45% Allocation
International Equity
55% Allocation
17

seemed to take the long-anticipated rate hike in stride, the calm did not last long. Entering January, the market rolled over hard as
investors worried that the Federal Reserve had raised rates just when the global slowdown was dragging down the domestic
economy. Coincident with this concern was the continuation of a massive correction in Health Care. Then, on February 11, equity
markets shot upward dramatically, led by Energy, Industrials, and Health Care, much of the same group that had previously dragged
it down. The surprise Brexit vote occurred at the end of June and shook the market for two days but that was nearly erased by fiscal
year end.
Domestic Equity During Fiscal Year
Domestic Equity Results
At the beginning of the fiscal year, the domestic equity target allocation was 27%, consisting of 15% to Large Cap and 12% to
Small/Mid Cap. The allocations to both Large Cap and Small Cap were lowered by 1% at the beginning of the fiscal year, making
the total allocation to domestic equity 25%. The internally-managed (passive) domestic equity program totaled $1,911.8 million, and
represented nearly 76% of the domestic equity portfolio at the end of the fiscal year. There are three domestic equity portfolios that
are actively managed by external managers.
The total domestic equity allocation was flat for the fiscal year. The top three performing sectors were Financials, Information
Technology, and Industrials.
-8.0%
-6.0%
-4.0%
-2.0%
0.0%
2.0%
4.0%
6.0%
8.0%
10.0%
S&P 500 S&P 400 S&P 600
An
nu
al R
ep
ort
20
16
PUBLIC EQUITY
18

Domestic Equity – Allocation & Returns Domestic Equity Managers
Domestic Equity – Top Holdings Domestic Equity – Sector Diversification
Manager
Mkt Value ($M)
Benchmark
Aronson Johnson & Ortiz 214.0 S&P 500 Value
Large Cap Value $214.0
Rice Hall James 256.5 S&P 600 Growth
Small Cap Growth $256.5
LSV Asset Management 144.7 S&P 600 Value
Small Cap Value $144.7
LASERS S&P 400 Index LASERS S&P 500 Index LASERS S&P 600 Index
403.2 1,207.6
301.0
S&P 400 S&P 500 S&P 600
Index Funds $1,911.8
TOTAL DOMESTIC EQUITY $2,527.0
Target Allocation
Actual Allocation
FYTD Return
Large Cap 14.0% 14.1% 2.3%
Mid Cap 4.0% 4.0% 1.6%
Small Cap 7.0% 7.0% -4.9%
TOTAL 25.0% 25.1% 0.0%
Security Name Market Value
Apple Inc $34,358,640.00
Exxon Mobil Corp 30,474,874.00
Johnson & Johnson 29,107,148.00
Microsoft Corp 27,550,235.02
JP Morgan Chase & Co 23,537,762.04
AT&T Inc 21,778,833.83
Verizon Communications 21,208,646.24
Pfizer Inc 19,366,063.36
General Electric 18,995,032.00
Amazon.com Inc 18,176,748.00
TOTAL $244,553,982.49
19.7%
14.8%
13.4%
13.1%
13.0%
6.9%
6.1%
5.8%
5.3%
2.0%
Financials
Information Technology
Industrials
Consumer Discretionary
Health Care
Consumer Staples
Utilities
Energy
Materials
Telecommunications
19

International Equity – Market Overview
It was a tough twelve months for international equity. The MSCI World Ex-USA Index fell 9.4%, and the MSCI Emerging Markets
Index fell 11.3%. The fiscal year opened with markets weakening significantly in the third quarter of 2015 after the implications of
unexpected Chinese renminbi devaluation reverberated across asset classes, sparking fears over global economic growth and
indiscriminate selling in equities. After a partial recovery in non-commodity-linked sectors in the fourth quarter, markets again
weakened in the first quarter of 2016 driven by further Chinese renminbi devaluation and the surprise Bank of Japan decision to
introduce negative interest rates. However, as expectations for a Federal Reserve rate hike were pushed out further, the US dollar
weakened in March 2016 which supported a partial rebound in commodity prices and emerging markets. In June 2016, the
unexpected UK referendum result in favor of leaving the European Union triggered a fall in international equities at the end of a
volatile quarter. Eurozone markets and the financials sector registered the most significant losses as investors worried about the
potential economic and political repercussions.
International Equity During Fiscal Year
-15.0%
-10.0%
-5.0%
0.0%
5.0%
10.0%
15.0%
MSCI World Ex-USA MSCI World Ex-USA Small Cap
MSCI Emerging Markets
An
nu
al R
ep
ort
20
16
PUBLIC EQUITY
20

International Equity – Results
At the beginning of the fiscal year, the international equity target allocation was 30%, consisting of 15% to Large Cap, 3% to Small
Cap, and 12% to Emerging Markets. The Small Cap allocation was increased by 2% at the beginning of the fiscal year, making the
total allocation to international equity 32%. The internally-managed (passive) international equity program totaled $1,270.1 million
and represented 40.9% of the international equity portfolio at the end of the fiscal year. A new external manager was hired to meet
the increased Small Cap allocation, bringing the fiscal year end status to five external managers actively managing seven portfolios.
The total international equity return was -9.2% for the fiscal year, with all areas of the space contributing negative returns. The top
three countries in LASERS international developed markets portfolio were Japan, the United Kingdom, and Switzerland. Within the
emerging markets portfolio, South Korea, Taiwan, and Hong Kong were the top three countries.
International Equity – Allocation & Returns International Equity Managers
Target Allocation
Actual Allocation
FYTD Return
Large Cap 15.0% 14.7% -8.7%
Small Cap 5.0% 5.0% -1.9%
Emerging Markets 12.0% 11.3% -11.3%
TOTAL 32.0% 31.0% -9.2%
Manager
Market Value ($M)
Benchmark
Mondrian 204.9 MSCI World Ex-USA
Large Cap Value $204.9
LASERS MSCI World Ex-USA Index 1,238.8 MSCI World Ex-USA
Large Cap Growth $1,238.8
LASERS Terror-Free Index 31.3 MSCI World Ex-USA
Terror-Free $31.3
Mondrian Goldman Sachs
204.6 294.8
MSCI World Ex-USA
Small Cap
Small Cap $499.4
City of London LSV Asset Mgmt (2 portfolios) Westwood Global
324.6 588.2 218.3
MSCI World Emerging Markets
Emerging Markets $1,131.1
TOTAL $3,105.5
21

Top 10 Developed Holdings Top Countries
Security Name Market Value
Nestle SA 31,176,141.80
Novartis AG 24,141,012.16
Glaxosmithkline Plc 18,214,882.42
BP Plc 18,046,064.35
Roche Holdings 17,691,983.16
Sanofi 17,143,372.07
SAP SE 14,210,039.96
Toyota Motor Corp 13,305,882.01
British America Tobacco 12,445,917.64
Abb Ltd 11,448,585.74
TOTAL $177,823,881.31
Developed Markets Emerging Markets
Japan South Korea
United Kingdom Taiwan
Switzerland Hong Kong
Canada India
Germany China
France Brazil
Australia South Africa
Netherlands Thailand
Sweden Mexico
Spain Indonesia
An
nu
al R
ep
ort
20
16
PUBLIC EQUITY
22

8
9
10
23

This page intentionally left blank.
24

As of June 30, 2016, the Fixed Income portfolio had a market value of assets of $1,314.1 million, representing 13.1% of the total
plan. Within the Fixed Income program, $821.3 million, or 8.2% of the total plan, was allocated to domestic fixed income; $150.8
million, or 1.5% of the total plan, was allocated to emerging market debt; and $342.1 million, or 3.4% was allocated to the newly
funded global multi-sector allocation.
Fixed Income Allocation
Domestic Fixed Income Market Overview
The beginning of the fiscal year was marked by significant volatility across all financial markets for varied reasons. There was evidence
of slowing growth, particularly in China, contraction in the Energy sector, lower commodity prices and ugly payroll reports, which
led to a weak third quarter for all asset classes. In December, the Federal Reserve increased the Fed Funds rate by 25 basis points,
but with the muddled economic environment, this move caused Treasuries to rally and Corporate Bond spreads to widen
substantially, creating the worst excess returns for the sector in five years. Entering 2016, interest rates began to drop sharply as a
weak global economy drove investors further into the safe haven of the U.S. Treasury market. However, favorable data on domestic
An
nu
al R
ep
ort
20
16
FIXED INCOME
Domestic Fixed Income
63% Allocation
Emerging Market Debt
11% Allocation
Global Multi-Sector
26% Allocation
25

labor markets and improving consumer sentiment pushed corporate spreads tighter in March. Then, in late June, the Brexit vote
and its aftermath brought about another flight to quality and increased volatility. Lower interest rates across the curve coupled with
the continued improvement in credit spreads, resulted in stronger positive returns in all sectors of the fixed income markets to end
the fiscal year.
Domestic Fixed Income During Fiscal Year
Domestic Fixed Income Results
At the beginning of the fiscal year, the domestic fixed income target allocation was 10%, consisting of 4% to investment grade, 4%
to high yield, and 2% to opportunistic credit. The allocation to opportunistic credit was removed at the beginning of the fiscal year,
making the total allocation to domestic fixed income 8%. There were four domestic fixed income managers actively managing four
portfolios.
An
nu
al R
ep
ort
20
16
FIXED INCOME
-6.0%
-3.0%
0.0%
3.0%
6.0%
Barclay's Aggregate Credit Suisse High Yield
26
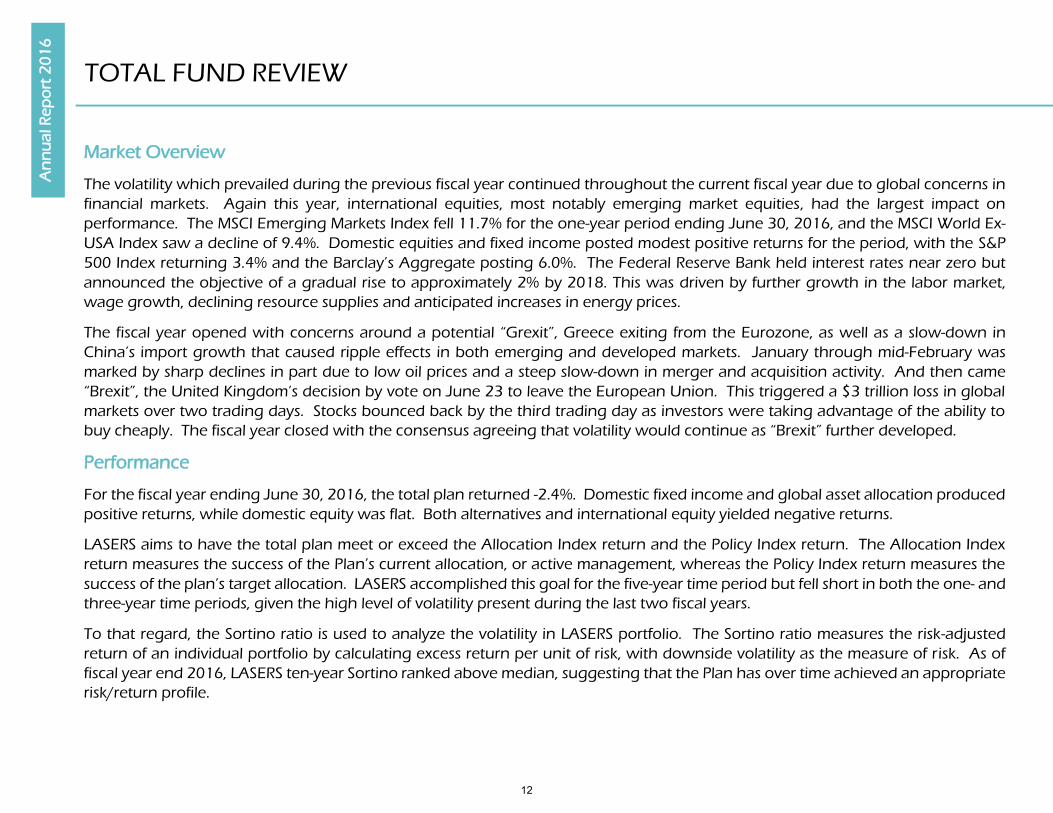
Domestic Fixed Income – Allocation & Returns Domestic Fixed Income Managers
Quality Allocation Maturity Allocation
Manager
Mkt Value ($M)
Benchmark
Loomis Sayles & Co Orleans Capital
224.8 172.7
BC Aggregate
Investment Grade $397.5
J.P. Morgan Nomura Asset Mgmt
210.8 213.0
Credit Suisse High Yield
High Yield $423.8
TOTAL $821.3
Target Allocation
Actual Allocation
FYTD Return
Investment Grade
4.0% 4.0% 5.2%
High Yield 4.0% 4.2% 2.0%
TOTAL 8.0% 8.2% 3.2%
Aaa14.71%
Aa1-Aa30.62%
A1-A39.24%
Baa1-Baa313.69%
Ba1-Ba319.98%
B1-B321.84%
Caa1-Caa3
10.29%
Ca0.18%
Other9.43%
< 1 Yr 8.44%
1-3 Yrs13.73%
3-5 Yrs25.16%
5-7 Yrs20.51%
7-10 Yrs17.74%
10-15 Yrs2.01%
15-20 Yrs2.37%
> 20 Yrs9.81%
27

Domestic Fixed Income – Top Holdings
Security Name Market Value
TBA – FNMA Pools, 3.5% 8/1/2046 $11,456,001.70
US Treasuries, 1.375% 2/15/2044 8,190,615.36
TBA – FNMA Pools, 4.0% 8/1/2046 5,918,490.50
US Treasuries, 0.75% 2/15/2045 5,478,350.79
US Treasuries, 0.875% 3/31/2018 5,442,183.25
US Treasuries, 0.125% 7/15/2024 4,832,074.27
Amazon.com Inc, 3.80% 12/5/2024 4,478,459.48
Georgia Power Co, 4.30% 3/15/2042 4,392,177.72
Ford Motor Credti Co, 4.375% 8/6/2023 4,342,670.88
JP Morgan Chase & Co, 3.90% 7/15/2025 4,316,724.84
TOTAL $58,847,748.79
Emerging Market Debt – Market Overview
From the start of the fiscal year until February 2016, emerging markets were weighed down by negative sentiment around global
growth expectations, which led to weak market technicals and deteriorating returns. These growth concerns combined with the
strengthening US dollar, kept pressure on all sectors of emerging markets. Local currency markets, in particular, faced strong
headwinds due to the reversal of capital flows.
In contrast, sentiment towards risk assets improved in late February and the outlook for emerging market debt began to brighten.
This dynamic helped by a strong recovery in core bond markets and an unwind of January’s general risk aversion moves in global
markets. For much of the first half of 2016, over-hanging risks from the end of 2015 began to show signs of fading: Concerns
around Chinese growth and capital flight related to the devaluation of the yuan subsided given stronger growth data from China.
The US Federal Reserve postured a more dovish stance and stressed that the pace of rate increases would likely be very gradual
given the current global environment of lower growth. Volatility in commodities prices declined, and oil prices managed to record
four consecutive months of gains by end of June. At the same time, the concerns around a potential (and eventual) exit of the UK
from the European Union continued to rise, and the possible negative outcomes, including a weakened UK economy, put pressure
on peripheral European bond markets. As a result, global economic and political uncertainty weighed on risk markets.
An
nu
al R
ep
ort
20
16
FIXED INCOME
28
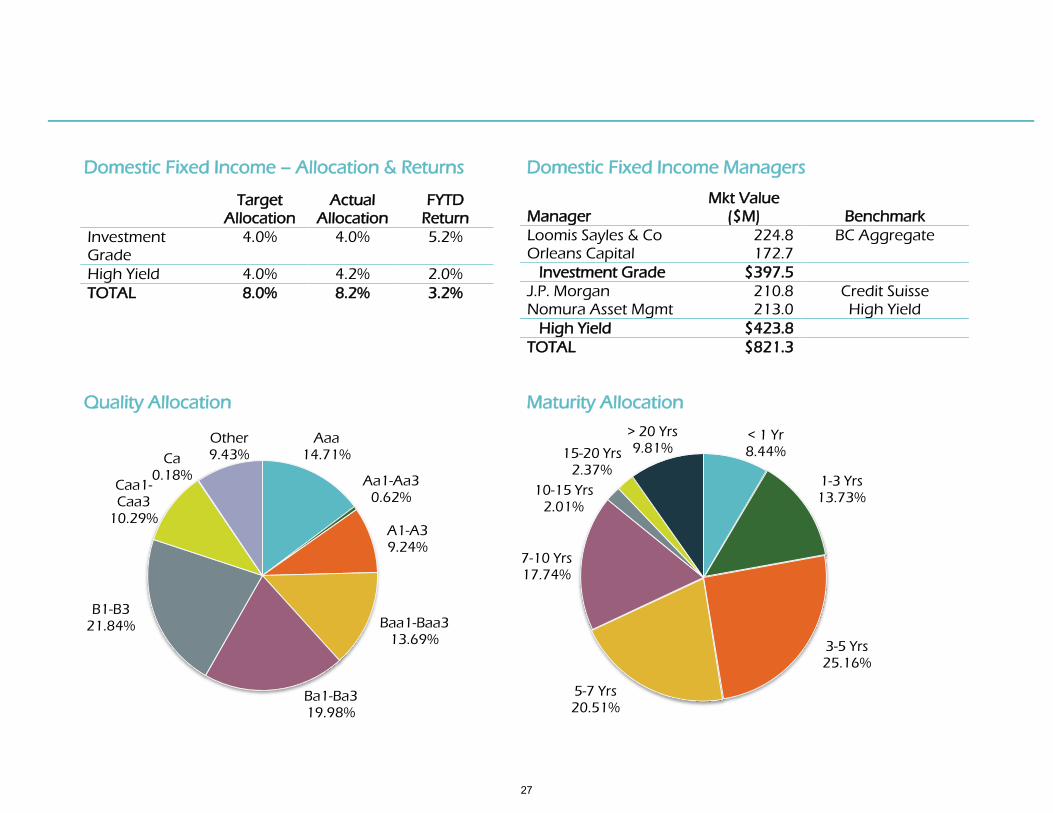
EMD During Fiscal Year
Emerging Market Debt – Results EMD – Top Holdings
The emerging market debt allocation remained unchanged at 2%
during the 2015-2016 fiscal year. The allocation is managed by
Stone Harbor and is benchmarked to the J.P. Morgan GBI-EM
Global Diversified Index. As of June 30, 2016, it had a market
value of $150.8 million. The portfolio had an actual allocation of
1.5% and returned 1.3% for the fiscal year.
Security Name Market Value
South Africa Govt Bonds, 10.5% 12/21/2026 $6,584,230.32
Poland Govt Bonds, 3.25% 7/25/2025 5,897,089.05
Indonesia Treasury Bond, 8.375% 3/15/2024 5,835,931.68
Mexican Bonos, 10.0% 12/5/2024 5,752,780.14
Colombian Tes, 7.5% 8/26/2026 4,671,947.24
Brazil Notas Do Tesouro, 10.0% 1/1/2025 4,636,764.08
Brazil Letras Do Tesouro, 0.0% 1/1/2019 4,387,882.25
Russian Federal Bond – OFZ, 7.6% 4/14/2021 3,983,557.11
Indonesia Treasury Bonds, 5.625% 5/15/2023 3,906,516.18
Brazil Letras Do Tesouro, 0.0% 7/1/2018 3,451,132.00
TOTAL $49,107,830.05
-9.0%
-6.0%
-3.0%
0.0%
3.0%
6.0%
9.0%
12.0%
JPM GBI-EM Global Diversified
29

This page intentionally left blank.
30

11
12
13
31

This page intentionally left blank.
32
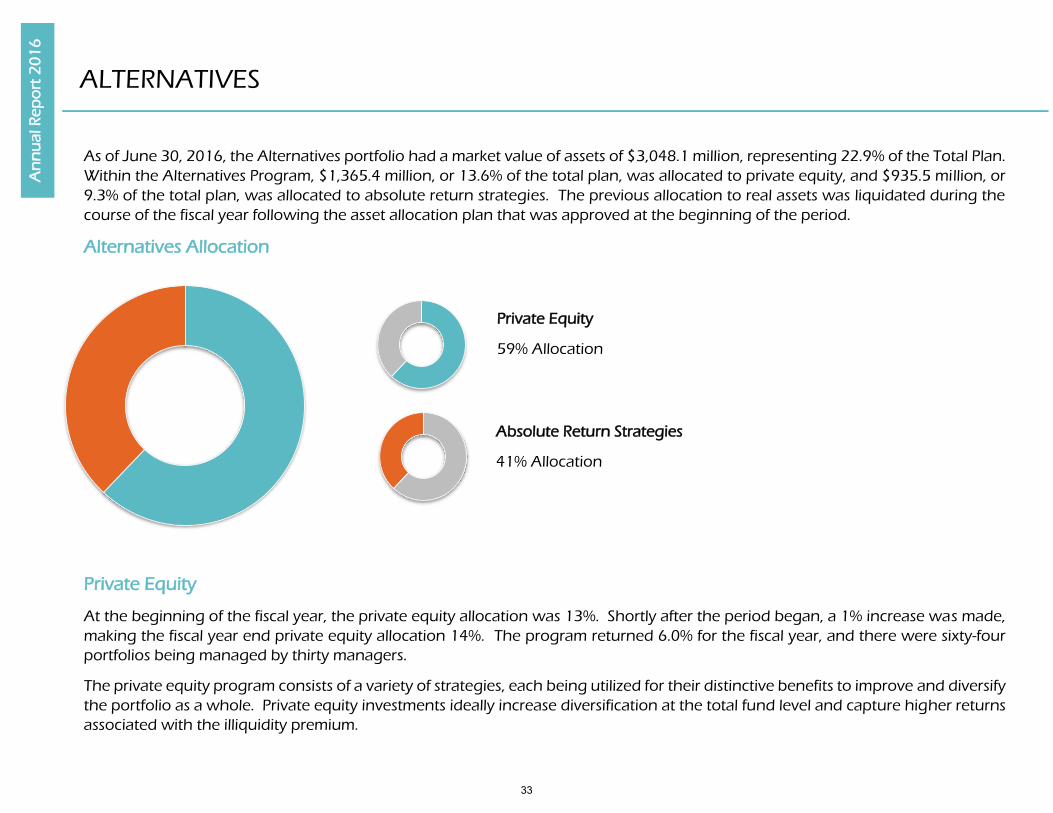
As of June 30, 2016, the Alternatives portfolio had a market value of assets of $3,048.1 million, representing 22.9% of the Total Plan.
Within the Alternatives Program, $1,365.4 million, or 13.6% of the total plan, was allocated to private equity, and $935.5 million, or
9.3% of the total plan, was allocated to absolute return strategies. The previous allocation to real assets was liquidated during the
course of the fiscal year following the asset allocation plan that was approved at the beginning of the period.
Alternatives Allocation
Private Equity
At the beginning of the fiscal year, the private equity allocation was 13%. Shortly after the period began, a 1% increase was made,
making the fiscal year end private equity allocation 14%. The program returned 6.0% for the fiscal year, and there were sixty-four
portfolios being managed by thirty managers.
The private equity program consists of a variety of strategies, each being utilized for their distinctive benefits to improve and diversify
the portfolio as a whole. Private equity investments ideally increase diversification at the total fund level and capture higher returns
associated with the illiquidity premium.
An
nu
al R
ep
ort
20
16
ALTERNATIVES
Private Equity
59% Allocation
Absolute Return Strategies
41% Allocation
33

Private Equity Managers
Manager
Market Value ($M)
% of PE Portfolio
Manager
Market Value ($M)
% of PE Portfolio
Adams Street 105.5 7.7% Louisiana Growth Funds 24.3 0.8%
AEA Investors 3.2 0.2% Marathon 30.2 1.8%
Apollo 25.3 9.6% Mesirow 106.9 2.2%
ArcLight Energy 16.0 1.9% Newstone Capital 18.3 7.8%
Bernhard Capital 10.4 1.2% Oaktree 40.9 1.3%
Brinson 12.5 0.8% Pantheon Ventures 88.4 3.0%
Brookfield Capital 35.3 0.9% Private Advisors 58.7 6.5%
CCMP Capital 76.9 2.6% Q-BLK 76.1 4.3%
Coller International 5.0 5.6% Siguler Guff 103.9 5.6%
Drug Royalty 25.6 0.4% Stepstone 56.2 7.6%
EIG Energy 21.2 1.9% Sterling Partners 24.3 4.1%
GTCR 21.3 1.6% TCW Energy 32.6 1.8%
Goldman Sachs 47.4 1.6% Vista Equity 115.3 2.4%
Hancock Pathway 0.6 3.5% Williams Capital 11.7 0.9%
Harbourvest 29.1 0.0%
Huff Alternative 10.4 2.1% TOTAL $1,365.4 100.0%
Since LASERS began investing in private equity, commitments totaling over $3.3 billion have been made. Cumulatively, over $2.5
billion, or 76% of total commitments, have been invested and $2.4 billion has been distributed back to LASERS.
An
nu
al R
ep
ort
20
16
ALTERNATIVES
34

Private Equity Commitments and Contributions
Absolute Return Strategies
The absolute return strategy allocation remained unchanged at 8% during the 2015-2016 fiscal year. The actual allocation on June
30, 2016 was 9.3%, and the program returned -7.1% for the period. There were seven portfolios, two of which are in liquidation,
being managed by six managers.
These strategies provide LASERS with diversification and potential for increased long-term returns due to the lower correlation with
the major market indices. LASERS fund of funds and multi-strategy investments allow access to top tier funds; a reduction in individual
fund and manager risk; and provide industry, style, and geographic diversification.
90%
73%
32%
29%
67%
97%
22%
53%
41%
33%
77%
73%
85%
37%
100% 98%
64%
102%
100%
89%
78%
60%
88%
57%
99%
68%
100%
47%
102%
0%
20%
40%
60%
80%
100%
120%
0
50
100
150
200
250
300
350
400
Mill
ion
s
Commitments Contributions % Drawn Down
35

During the fiscal year, the transition to a more concentrated/best ideas portfolio, which began four years ago, continued.
Restructuring the portfolio consisted of full redemption requests to three managers near the end of the 2011-2012 fiscal year. As of
June 30, 2016, one of those was completed and the two remaining had a market value of assets of $6.6 million, less than 1% of the
absolute return portfolio.
Absolute Return Managers Absolute Return Allocation
Manager Market Value ($M)
% of Portfolio
Bridgewater 338.7 36.2%
Entrust Capital 183.9 19.7%
K2 Advisors* 1.7 0.2%
PAAMCO 181.9 19.4%
Prisma Capital 224.7 24.0%
Stark Investments* 4.9 0.5%
TOTAL $935.8 100.0%
* In redemption status
An
nu
al R
ep
ort
20
16
ALTERNATIVES
36.45%
5.79%
8.96%4.18%
5.57%
21.40%
3.70%
6.53%
1.21% 1.45%
0.97% 3.79%
Global Macro Event Driven
Long Short Credit Fixed Income Relative Value
Long Short Equity Opportunistic
Distressed Niche
Managed Futures Equity Market Neutral
Convertible Bond Hedging Cash/Other
36

14
15
16
37

This page intentionally left blank.
38

As of June 30, 2016, the Global Asset Allocation portfolio had a market value of assets of $739.7 million, representing 7.4% of the
Total Plan. The allocation remained unchanged at 7% during the fiscal year. Bridgewater Associates manages the entire allocation
in their All-Weather product, and the program returned -0.1% for the year ending June 30, 2016.
The global asset allocation strategy utilizes an optimal strategic allocation mix that aims to provide favorable risk-adjusted returns.
The strategy’s goal is to avoid being biased to any one market environment, thus producing a more balanced return stream. Below
is a monthly breakdown of returns and assets in the All-Weather portfolio during the fiscal year.
Monthly Returns and Assets
An
nu
al R
ep
ort
20
16
GLOBAL ASSET ALLOCATION
732.0
702.3 688.9
711.7
701.0682.3 674.6
678.0 698.5
711.2 713.6
739.7
640.0
660.0
680.0
700.0
720.0
740.0
760.0
-6.0%
-4.0%
-2.0%
0.0%
2.0%
4.0%
6.0%
Ass
ets
($
Mill
ion
s)
Re
turn
Period Return Ending Assets (Millions)
39

This page intentionally left blank.
40

17
18
19
41

Below is a schedule of commissions for the fiscal year ending June 30, 2016. The table includes the brokerage firms utilized by
LASERS equity managers and total commissions paid to each.
Commission Summary
Brokerage Firm Commission Brokerage Firm Commission
Instinet $64,375.76 Needham and Company $14,273.58
Stephens 59,239.54 Sanford C Bernstein 13,474.53
Robert W. Barid & Co 43,265.78 SG Americas 12,576.41
Deutsche Bank 41,751.39 Credit Suisse 11,526.55
Barclays Capital 40,699.71 Suntrust Capital Markets 10,818.92
Merrill Lynch 40,408.11 Arqaam Securties 9,551.06
Goldman Sachs & Co 39,554.19 Guzman & Company 9,007.03
UBS Equities 38,870.09 Piper Jaffray & Co 8,059.16
Jonestrading 35,317.43 Credit Lyonnais 7,683.96
Raymond James 34,486.52 JNK 6,922.49
J P Morgan 30,455.08 Themis Trading 6,857.31
Citigroup 28,221.77 Morgan Stanley 6,358.48
Keybanc Capital Markets 26,704.76 Wedbush Morgan 6,242.04
Stifel Nicolaus 22,526.30 Other (42) 103,461.00
Exane 14,698.01 Total $787,387.00
An
nu
al R
ep
ort
20
16
Trading
42

LASERS is committed to monitoring and analyzing execution costs, with the ultimate goal of ensuring best execution. We conduct a
thorough annual review of total execution costs that our managers incur, which includes commissions, market impact, and timing costs.
Trading activity and costs are also monitored on an ongoing basis, including a quarterly review of each manager. To oversee our
trading activity, LASERS staff compiles and analyzes trade data internally, in addition to using the services of an outside consultant, Zeno
Consulting Group.
Zeno Consulting Group: The Zeno Consulting Group analysis involves capturing and analyzing the entire trading process, from security
selection through completed execution. Benchmarks and peer group universes are then used as a tool to evaluate the relative
execution quality of both investment managers and brokers.
Soft Dollar Commissions: Soft dollars refer to the direction of client brokerage or commissions by investment managers to brokers in
return for products and services. Eliminating the use of soft dollars by our investment managers has been a focus of LASERS for a
number of years. We have successfully worked with our investment managers to eliminate the generation of soft dollars on behalf of
LASERS.
Foreign Exchange: Just as in the trading of securities, LASERS is focused on obtaining best execution when trading foreign currencies.
LASERS uses a process to receive and trade based on live, competitive quotes. By trading based on quotes from multiple institutions,
internal staff is able to ensure LASERS is receiving fair quotes and best execution at any given time for any given trade.
43

During the fiscal year 2015-2016, LASERS generated $4,668,010 in revenue through its securities lending program. The lending
agreement between LASERS and BNY Mellon incorporates an 80/20 split on the first $2,500,000 and 85/15 split thereafter, which
LASERS reached in February of 2016. Although lendable volume was down slightly, on-loan volume saw a slight uptick year-over-
year. Securities lending revenue increased $764,345 for fiscal year-end. The volume on loan increased from an average of $1.0 billion
in 2015 to $1.1 billion in 2016. The weighted average total spread was 50 basis points as compared to the Fed Funds Target Rate of
25 basis points.
In the fiscal year 2015-2016, the average market value of lendable securities was $5.5 billion, which is a decrease of approximately $431 million over the previous year. The average return on available assets for lending was 8.6 basis points, and the return on loaned assets was 40.2 basis points.
An
nu
al R
ep
ort
20
16
0
10
20
30
40
50
60
70
80
$0
$200,000,000
$400,000,000
$600,000,000
$800,000,000
$1,000,000,000
$1,200,000,000
Ba
sis
Po
ints
Average Loan Volume Spreads
Volumes/Spreads
SECURITIES LENDING
$0
$100,000
$200,000
$300,000
$400,000
$500,000
$600,000
US Corporates US Governments US Equities Intl Equities
Lending Revenue
44

Program Average Lendable Assets
(Millions)
Return from Lending Income (Basis Points)
Lending Income (Thousands)
Treasuries $29 3 $7
Agencies $4 16 $5
MBS $63 0 $0
US Corporates $675 11 $588
US Equities $2,654 14 $3,045
Non-US Equities $1,963 6 $1,019
Non-US Fixed Income $74 1 $5
Lending Statistics
45

The Board of Trustees of LASERS exercises its right to vote as a shareholder in companies held within investment portfolios as an
important method to participate in the corporate governance process. As a fiduciary, LASERS is compelled to exercise this right in
the best interest of the System’s participants and beneficiaries. This is accomplished by voting for shareholders’ resolutions that are
likely to enhance shareholder value and by opposing resolutions that are likely to dilute or diminish the value.
Guidelines have been developed to describe how LASERS intends to vote on commonly raised and potentially contentious issues.
These guidelines have been developed to encourage companies to take actions that are in the long-term best economic interest of
shareholders. They are applied to help determine whether to support or oppose a proposal by a corporation (or shareholder), and
are used by LASERS proxy voting agent to vote in accordance with the best interest of LASERS plan participants.
LASERS recognizes that certain proposals, if approved, may have a substantial impact on the market valuation of portfolio securities;
therefore, the right to vote is viewed as an asset to be accorded the same fiduciary care and responsibility as our investments.
LASERS generally votes against proposals that may have a negative effect on the stock price and/or reduce shareholder rights.
Conditions are imposed on voting for elections of directors, and LASERS may withhold votes from directors based on board and
committee independence, performance of the board, failure to respond to high shareholder withhold/against votes and poor long-
term corporate performance relative to peers. Several factors are also considered before approving executive and director
compensation. LASERS questions the role of compensation in incentivizing inappropriate or excessive risk-taking behavior and has
little patience for “pay for failure.” LASERS believes that pay programs should be fair, competitive, reasonable, and that pay for
performance should be a central tenet in compensation philosophy.
During the fiscal year July 1, 2015, to June 30, 2016, LASERS voted over 31,000 proposals on a variety of issues including
capitalization, compensation, and corporate governance issues. Votes were cast on proxy issues at over 2,700 meetings during the
12-month period.
An
nu
al R
ep
ort
20
16
CORPORATE GOVERNANCE
46

Category Proposals For Against Other
Management Proposals
Routine/Business 5,747 4,419 1,319 9
Director Related 18,668 10.513 8,130 25
Capitalization 1,967 1,519 448 0
Reorganizations & Mergers 458 425 32 1
Non-Salary Compensation 3,286 2,188 1,066 32*
Antitakeover Related 323 268 53 2
Other/Miscellaneous 37 21 16 0
Shareholder Proposals
Routine/Business 93 50 43 0
Director Related 269 168 73 28
Corporate Governance 57 25 32 0
Compensation 55 44 11 0
Health/Environmental 113 65 48 0
Social/Human Rights 17 10 7 0
Other/Miscellaneous 229 77 152 0
Total 31,319 19,792 11,430 97
Proxy Activity
*26 votes – frequency of Say When on Pay 47

To assess risk, investment division staff assembles the holdings of all managed portfolios to create an aggregate view of LASERS
assets and utilizes multiple software systems. Supported by powerful multi-factor models and extensive databases, these software
systems assist in quantifying various metrics at the asset level up to the aggregated portfolio level. These tools allow the investment
staff to decompose the risk by source and monitor the overall risk in the portfolio based on the manager or asset class that is
contributing that risk. Decomposing risks at an aggregated level and at the individual manager level allows the investment staff to
better understand and manage the sources of risk in LASERS portfolio.
Risk characteristics of the portfolio, including manager tracking error and value-at-risk (VaR) data, are gathered by the investment
staff to quantify the risks inherent in the LASERS portfolio. Value-at-risk reports identify the minimum amount a fund might lose at
a given confidence level over a given time period. Tracking error gives an indication of how similar a portfolio is to its respective
benchmark.
The scenario analysis can be extended to “stress” the portfolio under different scenarios, historically based and ad hoc, to view how
the portfolio would perform under extreme economic and market conditions. For example, staff is able to test the performance of
fixed income assets based on a change in interest rates.
VaR and Tracking Error Report
Assets Market Value Weight (%) Total Risk Tracking Error Value-At-Risk (%)
Fixed Income Managers 2,158 $936,708,315 100%
Loomis Inv. Grade 285 $224,775,553 24.00% 9.23% 9.19% 15.53%
Orleans Inv. Grade 127 $150,316,752 16.05% 3.13% 1.25% 4.89%
JPMorgan High Yield 849 $201,553,325 21.52% 6.56% 0.41% 6.89%
Nomura High Yield 785 $209,304,342 22.34% 7.60% 1.28% 7.78%
Stone Harbor 112 $150,758,343 16.09% 17.38% 2.09% 22.93%
An
nu
al R
ep
ort
20
16
Risk Management
48

VaR and Tracking Error Report (continued)
Assets Market Value Weight (%) Total Risk Tracking Error Value-At-Risk (%)
Equity Managers 4,288 $5,576,021,936 100%
AJO 90 $213,937,051 3.84% 14.45% 3.04% 26.29%
LASERS S&P 500 507 $1,206,591,967 21.64% 13.05% 0.02% 23.98%
LASERS S&P 400 401 $402,877,863 7.23% 14.57% 0.04% 25.44%
Rice Hall James 57 $254,338,793 4.56% 16.01% 3.83% 28.07%
LSV Small Cap 207 $144,595,481 2.59% 15.98% 2.73% 27.78%
LASERS S&P 600 601 $300,406,938 5.39% 15.94% 0.16% 28.08%
Mondrian Large Cap 43 $202,881,761 3.64% 19.03% 4.66% 30.11%
LASERS MSCI World Ex-US 841 $1,232,661,779 22.11% 18.42% 0.25% 28.62%
LASERS MSCI Terror Free 321 $31,031,377 0.56% 18.17% 0.97% 28.29%
Mondrian Small Cap 82 $204,327,371 3.66% 14.48% 5.11% 22.92%
Goldman Sachs 400 $288,397,767 5.17% 16.25% 11.45% 24.21%
City of London 73 $299,571,273 5.37% 14.41% 5.17% 22.16%
LSV Emerging Markets 309 $388,966,186 6.98% 18.53% 2.81% 27.30%
LSV Custom Emerging Markets 165 $192,987,933 3.46% 16.46% 3.67% 24.18%
Westwood Global 33 $212,448,396 3.81% 20.46% 6.26% 30.81%
Scenario Analysis by Fixed Income Manager
+ 200 BPs +100 BPs -100 BPs -200 BPs
Lehman Default 2008
Debt Ceiling Crisis 2011
Loomis Inv. Grade -3.4% -1.5% +1.1% +1.8% -12.0% -0.8%
Orleans Inv. Grade -7.2% -3.6% +3.6% +7.3% -10.5% 1.8%
JPMorgan High Yield -7.4% -3.7% +3.6% +7.1% -16.3% -2.9%
Nomura High Yield -5.8% -2.9% +2.9% +5.7% -14.6% -2.4%
Stone Harbor -27.3% -13.6% +13.6% +27.2% -11.9% -2.2%
49
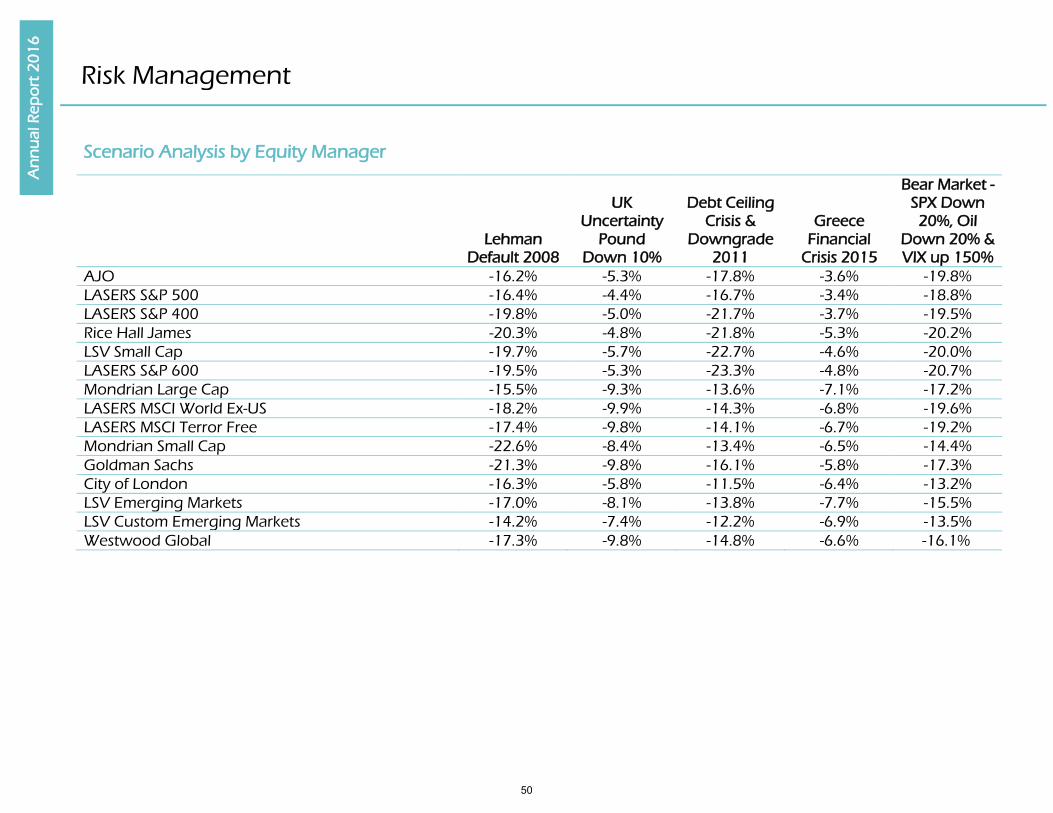
Scenario Analysis by Equity Manager
Lehman
Default 2008
UK Uncertainty
Pound Down 10%
Debt Ceiling Crisis &
Downgrade 2011
Greece Financial
Crisis 2015
Bear Market - SPX Down 20%, Oil
Down 20% & VIX up 150%
AJO -16.2% -5.3% -17.8% -3.6% -19.8%
LASERS S&P 500 -16.4% -4.4% -16.7% -3.4% -18.8%
LASERS S&P 400 -19.8% -5.0% -21.7% -3.7% -19.5%
Rice Hall James -20.3% -4.8% -21.8% -5.3% -20.2%
LSV Small Cap -19.7% -5.7% -22.7% -4.6% -20.0%
LASERS S&P 600 -19.5% -5.3% -23.3% -4.8% -20.7%
Mondrian Large Cap -15.5% -9.3% -13.6% -7.1% -17.2%
LASERS MSCI World Ex-US -18.2% -9.9% -14.3% -6.8% -19.6%
LASERS MSCI Terror Free -17.4% -9.8% -14.1% -6.7% -19.2%
Mondrian Small Cap -22.6% -8.4% -13.4% -6.5% -14.4%
Goldman Sachs -21.3% -9.8% -16.1% -5.8% -17.3%
City of London -16.3% -5.8% -11.5% -6.4% -13.2%
LSV Emerging Markets -17.0% -8.1% -13.8% -7.7% -15.5%
LSV Custom Emerging Markets -14.2% -7.4% -12.2% -6.9% -13.5%
Westwood Global -17.3% -9.8% -14.8% -6.6% -16.1%
An
nu
al R
ep
ort
20
16
Risk Management
50
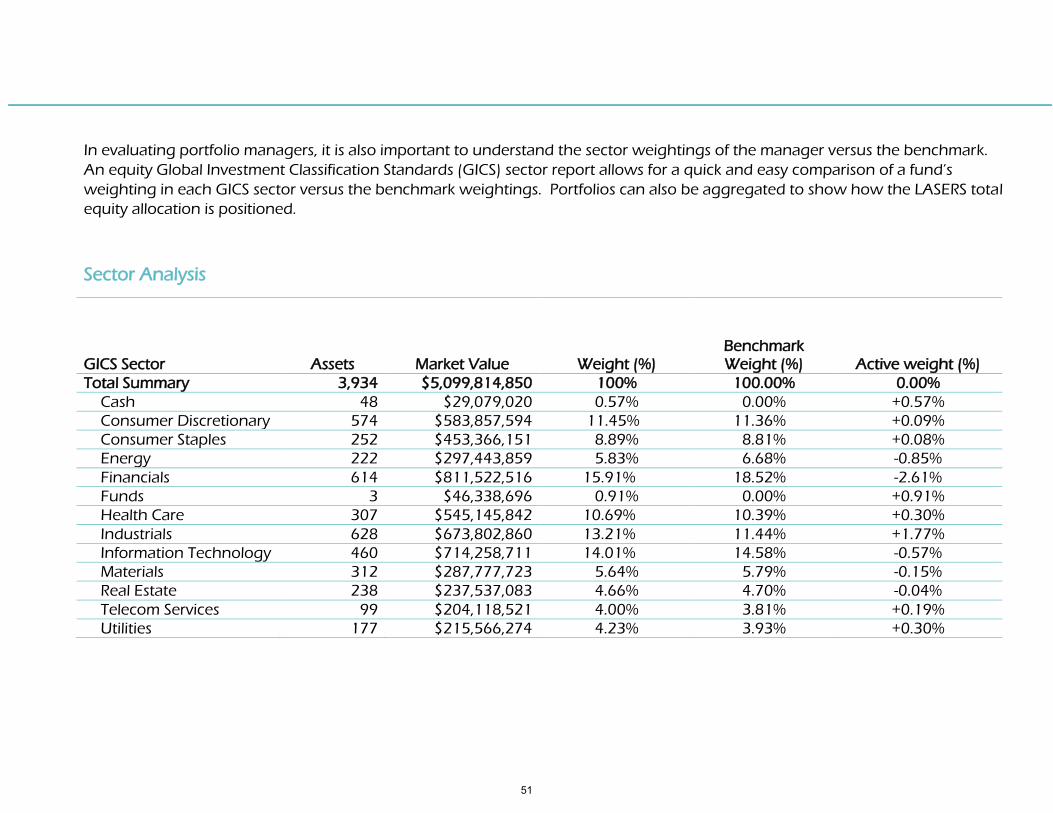
In evaluating portfolio managers, it is also important to understand the sector weightings of the manager versus the benchmark.
An equity Global Investment Classification Standards (GICS) sector report allows for a quick and easy comparison of a fund’s
weighting in each GICS sector versus the benchmark weightings. Portfolios can also be aggregated to show how the LASERS total
equity allocation is positioned.
Sector Analysis
GICS Sector Assets Market Value Weight (%) Benchmark Weight (%) Active weight (%)
Total Summary 3,934 $5,099,814,850 100% 100.00% 0.00%
Cash 48 $29,079,020 0.57% 0.00% +0.57%
Consumer Discretionary 574 $583,857,594 11.45% 11.36% +0.09%
Consumer Staples 252 $453,366,151 8.89% 8.81% +0.08%
Energy 222 $297,443,859 5.83% 6.68% -0.85%
Financials 614 $811,522,516 15.91% 18.52% -2.61%
Funds 3 $46,338,696 0.91% 0.00% +0.91%
Health Care 307 $545,145,842 10.69% 10.39% +0.30%
Industrials 628 $673,802,860 13.21% 11.44% +1.77%
Information Technology 460 $714,258,711 14.01% 14.58% -0.57%
Materials 312 $287,777,723 5.64% 5.79% -0.15%
Real Estate 238 $237,537,083 4.66% 4.70% -0.04%
Telecom Services 99 $204,118,521 4.00% 3.81% +0.19%
Utilities 177 $215,566,274 4.23% 3.93% +0.30%
51

An
nu
al R
ep
ort
20
16
INVESTMENT POLICY STATEMENT
INTRODUCTION The Louisiana State Employees’ Retirement System (LASERS) was established by the state legislature in 1946 (R.S. 11:401). LASERS is a qualified pension and retirement plan under section 401(a) of the Internal Revenue Code and was created to provide retirement allowances and other benefits for state officers and employees and their beneficiaries. Benefits are funded by three sources: employer contributions, employee contributions and earnings from trust fund investments.
The System is governed by a 13 member Board of Trustees (Board). State law designates members of the Board as follows: six elected active members, three elected retired members and four ex-officio members, which consist of the Chairman of the House & Senate Retirement Committees, State Treasurer and Commissioner of Administration, or their designees, in accordance with applicable law.
STATEMENT OF PURPOSE This document specifically outlines the investment philosophy and practices of LASERS and has been developed to serve as a framework for the management of the System’s defined benefit plan. The Board has established the investment guidelines set forth herein, to formalize investment objectives, policies and procedures and to define the duties and responsibilities of the various entities involved in the investment process. All policy decisions shall include liquidity and risk considerations that are prudent and reasonable under the circumstances that exist over time. The policies will evolve as the internal conditions of the fund and the capital markets environment changes. Any resulting material changes will be communicated to all affected parties.
CONTROLLING STATUTES AND REGULATION Investments of the Louisiana State Employees’ Retirement System shall be made in full accordance with Louisiana Revised Statutes, applicable legislation or regulation as well as LASERS internal policies and procedures.
Principal Statutory Investment Provisions LASERS shall operate under the “Prudent Man” rule, used herein meaning, that when investing, the Board shall exercise the care, skill, prudence, and diligence under the circumstances then prevailing that a prudent institutional investor acting in a like capacity and familiar with such matters would use in the conduct of an enterprise of a like character and with like aims. (R.S. 11:263) LASERS will apply this standard to the entire fund portfolio, and as part of an overall investment strategy. This will include an asset allocation study and a plan for implementation which will incorporate risk and return objectives reasonably suitable to the fund. The following types of risk are to be examined: market value, credit, interest rate, inflation, counterparty and concentration. The study and implementation of such plan will be designed to preserve and enhance principal over the long term, provide adequate liquidity and cash flow for the system, and minimize the risk of loss unless it is clearly prudent not to do so. (R.S. 11:263.C)
52

With respect to fiduciary duty, the following shall be deemed to have a fiduciary relationship: (1) any person who exercises any type of discretionary authority or discretionary control with respect to the management of system funds or assets; and (2) any person who renders investment advice or services for compensation, directly or indirectly, with respect to the system funds or assets. (R.S. 11:264)
Other Statutory Provisions When contemplating any investment, action or asset allocation the Board shall consider the following factors:
The availability of public pricing to value each investment
The ability to liquidate each investment at a fair market price within a reasonable time frame for the size of investment that is being considered
The degree of transparency that accompanies each investment
The risk of fluctuations in currency that may accompany each investment
The experience of the professionals who will manage each investment and the financial soundness of the business entity employing such professionals
The degree of diversification which exists within each investment and that such investment itself may provide relative to the other existing investments in the portfolio
Whether leverage is involved
The potential for unrelated business taxable income as defined in Section 512 of the Internal Revenue Code
The jurisdiction of the laws that govern each investment
The net return that is expected relative to the risk that is associated with each investment (R.S. 11:263.D)
LASERS is subject to a legislative limit restricting the fund so that no more than 65% of its total assets are invested in publicly traded equities. Should LASERS have more than 55% of its total assets invested in publicly traded equities, at least 10% of those equities must be invested in one or more index funds. Alternative assets are not considered to be equities when calculating LASERS equity exposure. LASERS will take steps to rebalance if, at the end of its fiscal year, its exposure to publicly traded equities is above 65%. LASERS is aware that markets will fluctuate, and any rebalancing will appropriately consider market conditions and any other relevant factors. (R.S. 11:263.D)
When requesting proposals for investment advisory services, fees are required to be quoted on a fixed, market value of assets or performance basis. (R.S. 11:265)
53

An
nu
al R
ep
ort
20
16
INVESTMENT POLICY STATEMENT
Investment performance reports by investment managers and advisors shall be in compliance with the current Global Investment Performance Standards (GIPS) as amended and published by the CFA Institute (formally known as Association for Investment Management and Research). This is not required for limited partnerships, limited liability partnerships, private placements or natural resource portfolios. (R.S. 11:266)
Consultants and money managers shall provide full disclosure of conflicts of interest, including non-pension sponsor sources of revenue. Consultants also shall provide full disclosure of any payments they receive from money managers. (R.S. 11:269)
Details for this reporting requirement are listed under the Semi-Annual Reporting Requirements under the Conflicts of Interest Report in Section XII of these guidelines.
LASERS shall report to the legislature and other Louisiana state and statewide retirement systems on a quarterly basis investment returns and expenses on a total fund and asset class basis for the quarter, fiscal year-to-date, one year, three year, five year, and ten year periods. This will include at a minimum, the following:
Investment returns net of fees and expenses expressed as a percentage return and dollar amount
Administrative expenses
Board-approved target/current asset allocation (R.S. 11:263.G) LASERS shall report to the legislature on a semiannual basis investment in any company having facilities or employees or both located in a prohibited nation. A prohibited nation is considered to be one of the following: Iran, North Korea, Sudan or Syria. (R.S. 11:312) Details for this reporting requirement are listed under the Semi-Annual Reporting Requirements under the Prohibited Nations Report in Section XII of these guidelines.
LASERS shall have a corporate governance strategy of constructive engagement with each company in which it has direct and indirect ownership that has facilities or employees or both located in a prohibited nation. This strategy shall contain a plan of action to cause any such company to remove facilities, employees or both from any prohibited nation. This excludes private equity and hedge funds. (R.S. 11:314 & 315) LASERS is required to invest a portion of funds in an international terror-free index fund which identifies and excludes from the fund companies having facilities or employees or both in a prohibited nation. (R.S. 11:316)
54

LASERS shall report to the legislature on a quarterly and annual basis its use of Louisiana broker dealers on specified transactions. (R.S. 11:266.1) Details for this reporting requirement are listed under the Quarterly Reporting Requirements under the Broker-Dealer Information in Section XII of these guidelines.
ROLES AND RESPONSIBILITIES The following section outlines the roles and responsibilities for each of the parties involved with executing the policy. In addition to the activities described below, each person involved with the policy serves as a fiduciary and will adhere to the “Prudent Man” rule as described in State Statute, which is outlined under the Principal Statutory Investment Provisions found in these guidelines.
Board of Trustees The Board of Trustees is responsible for the total investment program. The Board shall approve the investment policy and provide overall direction to the administrative staff in the execution of the investment policy.
Formal Review Schedule - the Board will conduct formal annual evaluations of the administrative staff, investment consultant and custodian.
Investment Committee The Investment Committee was established by the Board to assist in oversight of the investment program; it will consist of not less than seven members of the Board. The Committee reviews and makes recommendation to the Board on investment actions including, but not limited to the following:
1. Asset Allocation a) Establishing the asset allocation policy for the portfolio, including target percentages and ranges. b) Approving asset classes for inclusion in the portfolio. c) Establishing the structure of the portfolio, including the funds to be allocated to active/passive portfolios and
internal/external managers.
2. Asset Management a) Hiring, retaining or terminating investment managers, consultants, custodians and securities lending agents based on
established evaluation processes.
55
An
nu
al R
ep
ort
20
16
INVESTMENT POLICY STATEMENT
3. Risk Control
a) Ensuring that appropriate investment policies are in place, along with compliance of policies and directives. b) Continue to be aware of information on compliance with Securities and Exchange Commission (SEC) rules on pay to play
practices.
4. Monitoring a) Establishing performance benchmarks and expectations. b) Monitoring the performance of investments.
Chief Investment Officer The Chief Investment Officer (CIO) shall assist the Board in developing and modifying policy objectives and guidelines, including the development of liability-driven asset allocation strategies and recommendations on long-term asset allocation and the appropriate mix of investment manager styles and strategies. Choosing appropriate manager styles and strategies will include assisting the Board in evaluating the use of index funds as an alternative to active management. Additionally, the CIO shall provide assistance in manager searches and selection, investment performance calculation and evaluation, and any other analysis associated with the proper execution of the Board’s directives.
The CIO shall also communicate the decisions of the Investment Committee to investment managers, custodian bank(s), actuary, and consultant. The CIO provides oversight of the investment consultant, investment service providers and personnel of LASERS investment division.
Investment Consultant The Investment Consultant works under direction of the Board, offering a third party perspective and providing an additional level of oversight to the System’s investment program. The Consultant’s normal functions shall include assisting the Board and the CIO in developing and modifying policy objectives and guidelines, including the development of a liability-driven asset allocation strategy and recommendations on the appropriate mix of investment manager styles, strategies and funding levels.
Additionally, the Consultant shall provide education and training and assist in manager searches and selection, investment performance evaluation, and assist both the Board and CIO in the use of index funds as an alternative to active management. The Consultant shall provide timely information, written and/or oral, on investment strategies, instruments, managers and other related issues, as requested by the Board, the Investment Committee, or the CIO.
56

Investment Managers The duties and responsibilities of each of the investment managers retained by the Board include, but may not be limited to, the following:
Investing the assets under its management in accordance with the policy guidelines and objectives expressed herein
Meeting or exceeding the manager-specific benchmarks, net of all fees and expenses, expressed herein over various and appropriately measured time periods
Exercising investment discretion within the guidelines and objectives stated herein. Such discretion includes decisions to buy, hold or sell securities in amounts and proportions reflective of the manager’s current investment strategy and compatible with the investment objectives
Complying with all provisions pertaining to the investment manager’s duties and responsibilities as a fiduciary
Complying with the CFA Institute’s Code of Ethics & Standards of Professional Conduct and Global Investment Performance Standards (GIPS)
Disclosing all conflicts and potential conflicts of interest
Ensuring that all portfolio transactions are made on a “best execution” basis
Exercising ownership rights, where applicable
Meeting with the Board as needed upon request of the Board, and timely submitting all required reports
Promptly informing the Board regarding all significant matters pertaining to the investment of the fund assets, for example: o Changes in investment strategy, portfolio structure and market value of managed assets o Changes in the ownership affiliations, organizational structure, financial condition, professional personnel staffing and
clientele of the investment management organization o Any material changes in the liquidity of the securities they hold in the LASERS portfolio o Campaign contributions made by executives or employees to elected officials who can influence selection decisions
Initiating written communication with the Board when the manager believes that this Investment Policy is inhibiting performance and/or should be altered for any valid reason. No deviation from the guidelines and objectives established in the Policy is permitted until after such communication has occurred and the Board has approved such deviation in writing
Reconciling performance, holdings and security pricing data with the Fund’s custodian bank. If the Fund’s custodian bank shows a significantly different price for a given security, the manager should work with the custodian bank to resolve pricing differences. Managers shall provide to LASERS staff a summary of reconciled holdings both in hard copy and the electronic format of LASERS choosing
Any other duties included in the contract
57

An
nu
al R
ep
ort
20
16
INVESTMENT POLICY STATEMENT
Custodian Bank The Custodian is responsible for the safekeeping of System assets and serves as the official book of record. It is understood that investments that are held in partnerships, commingled accounts or unique asset classes are unable to be held by the System’s custodian bank.
The Custodian will be responsible for performing the following functions:
Holding System assets directly, through its agents, its sub-custodians, or designated clearing systems
Registration of System assets in good delivery form, collection of income generated by those assets, and any corporate action notification
Delivery and receipt of securities
Disbursement of all income or principal cash balances as directed
Providing daily cash sweep of idle principal and income cash balances. Dividends, interest, proceeds from sales, new contributions and all other monies are to be invested or reinvested promptly
Providing online records and reports
Providing monthly statements by investment managers’ accounts and a consolidated statement of all assets
Providing monthly performance reports and quarterly performance analysis reports
Notifying appropriate entities of proxies
Accepting daily instructions from designated investment staff
Resolving any problems that staff may have relating to the custodial account
Providing a dedicated account representative and back up to assist the LASERS staff in all needs relating to the custody and accountability of the Fund's assets
Managing the securities lending program (if applicable)
Overseeing securities class actions on behalf of the System
Providing a compliance monitoring system
Any other duties and services included in the contract
58

INVESTMENT OBJECTIVES
Nominal Return Requirements The investment program shall be structured to preserve and enhance principal over the long term, in both real and nominal terms. For this purpose, short-term fluctuations in values will be considered secondary to long-term investment results. The investments of the Fund shall be diversified to minimize the risk of significant losses. Total return, which includes realized and unrealized gains, plus income less expenses, is the primary goal of LASERS.
The actuarially expected total rate of return for the Fund is 7.75% annually. However, LASERS seeks to achieve returns greater than 8.0%.
Relative Return Requirements LASERS seeks to have total returns rank in the top half of the appropriate public fund universe, reflecting similar circumstances to the Fund. The total fund return should, over time, exceed the Policy and Allocation Indices (see Section VI for a description of how the Policy and Allocation Indices are calculated.) Returns for LASERS managers should exceed their respective benchmarks, as well as rank in the top half of the appropriate universe of managers adhering to the same investment strategy.
The Board further recognizes that the return targets described herein may not be achieved in any single year. A longer-term horizon of 5-7 years shall be used in measuring the long-term success of the Fund. While the Board expects that returns will vary over time, LASERS has a risk tolerance consistent with that of other funds created for similar purposes, and the assets of the Fund shall be invested accordingly. PERFORMANCE BENCHMARKS Total Fund Return The Total Fund return shall be compared against other public pension plans. LASERS will compare its returns against other funds of similar size and circumstances. LASERS Total Fund return should meet or exceed the Allocation Index return and the Policy Index return, which are each described below.
Allocation Index The Allocation Index return shall measure the success of the Fund’s current allocation. It shall be calculated by using index rates of return for each asset class invested in by the Fund multiplied by the actual percent allocated to each asset class. The difference between the Allocation Index return and the Total Fund return measures the effect of active management. If the Total Fund return
59
An
nu
al R
ep
ort
20
16
INVESTMENT POLICY STATEMENT
is greater than the Allocation Index return, then active management has in aggregate added value. If the Total Fund return is less than the Allocation Index return, then active management has not added value.
Policy Index The Policy Index return shall measure the success of the Fund’s target allocation. It shall be calculated by using index rates of return for each asset class invested in by the Fund multiplied by the percent targeted to each asset class. The difference between the Allocation Index return and the Policy Index return measures the effects of deviating from the target allocation. If the Allocation Index return is greater than the Policy Index return, then deviating from the target allocation has added value. If the Allocation Index return is less than the Policy Index return, then deviating has not added value.
Manager Benchmarks LASERS Investment Managers shall be compared to a combination of passively managed index returns matching the managers’ specific investment styles, as well as the median manager in their appropriate peer group universe. Specific benchmarks and peer groups are described for each manager in Section B of the Investment Policy Statement.
ASSET ALLOCATION The foundation of the System’s strength and stability rests upon the diversification of plan assets. The following section outlines the current asset allocation, which was designed to achieve the required return objectives of the System, given certain risk considerations. This is to be pursued by LASERS on a long-term basis, but will be revised if significant changes occur within the economic and/or capital market environment. Changes in liability structure, funded status, or long-term investment prospects should trigger a revision of the asset allocation.
Asset Classes The current allocation includes the following asset classes: Traditional Assets Non-Traditional Assets Domestic Equity Private Equity Fund of Funds - Domestic and International International Equity Private Equity Direct Funds - Domestic and International Emerging Market Equity Absolute Return - Fund of Funds Domestic Fixed Income Absolute Return - Direct Funds Global Multi-Sector Fixed Income Global Asset Allocation Emerging Market Debt
60
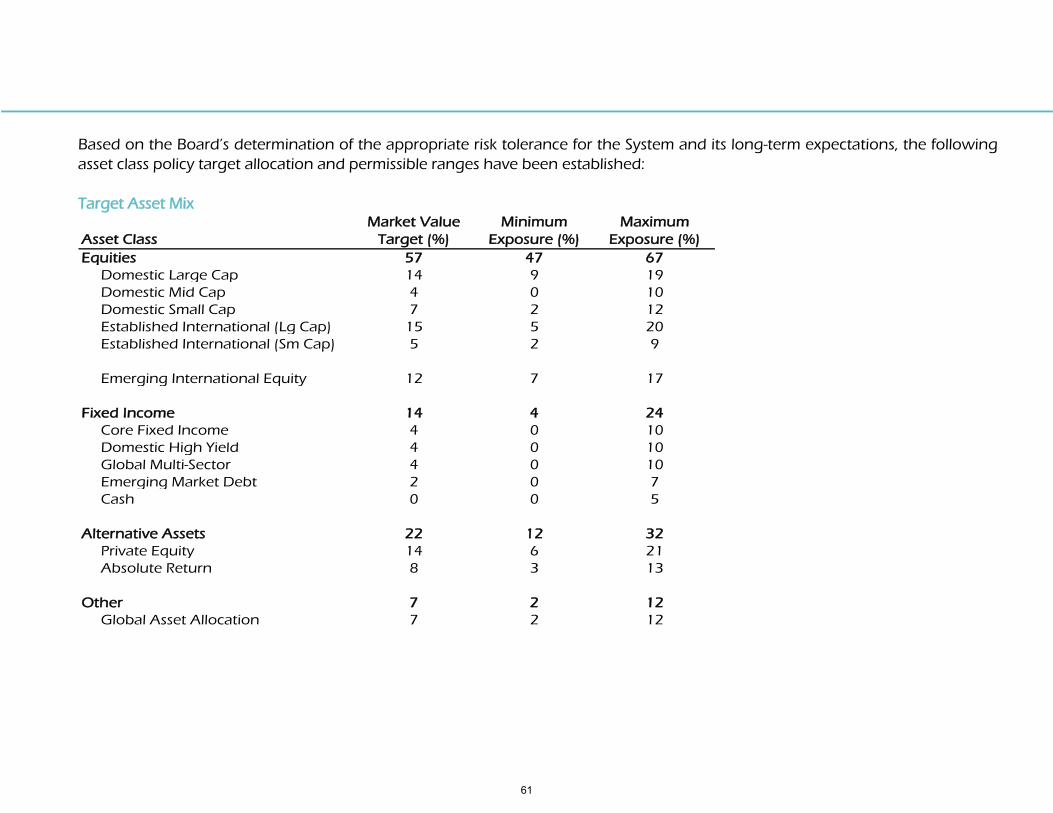
Based on the Board’s determination of the appropriate risk tolerance for the System and its long-term expectations, the following
asset class policy target allocation and permissible ranges have been established:
Target Asset Mix
Asset Class
Market Value
Target (%)
Minimum
Exposure (%)
Maximum
Exposure (%)
Equities 57 47 67
Domestic Large Cap 14 9 19
Domestic Mid Cap 4 0 10
Domestic Small Cap 7 2 12
Established International (Lg Cap) 15 5 20
Established International (Sm Cap) 5 2 9
Emerging International Equity 12 7 17
Fixed Income 14 4 24
Core Fixed Income 4 0 10
Domestic High Yield 4 0 10
Global Multi-Sector 4 0 10
Emerging Market Debt 2 0 7
Cash 0 0 5
Alternative Assets 22 12 32
Private Equity 14 6 21
Absolute Return 8 3 13
Other 7 2 12
Global Asset Allocation 7 2 12
61

An
nu
al R
ep
ort
20
16
INVESTMENT POLICY STATEMENT
Implementation
LASERS recognizes that special expertise is required to properly invest the majority of the assets described above. However, certain
highly efficient passively managed investment strategies lend themselves to internal management, resulting in lower management
fees for the Fund as a whole. Where appropriate, LASERS will manage these assets internally, so long as the same level of care,
prudence and oversight is maintained that an outside professional investment advisor would typically provide.
Style Allocation
LASERS shall strive to maintain a neutral bias with respect to style allocation (growth versus value) in its equity investments, unless
deemed advantageous to implement a style bias. LASERS recognizes that over the long run, returns from growth and value
investing tend to approximate each other; over shorter periods, however, differences in returns can be significant. The CIO, as part
of the normal rebalancing responsibilities, shall use appropriate judgment and care when rebalancing style-biased portfolios.
Active/Passive Mix
LASERS shall make use of passive strategies only where passive management, after all fees and expenses, can effectively compete
with actively managed portfolios in terms of returns and variability of returns.
Rebalancing
The CIO will review LASERS asset allocation at least quarterly to determine if it is consistent with the exposure ranges established for
LASERS described herein. The CIO will direct staff and investment managers to transfer funds to rebalance the asset allocation as
necessary. The CIO will consider market conditions and transaction costs, as well as any other relevant factors when rebalancing.
RISK MANAGEMENT
It is recognized that risk issues permeate the entire investment process, and risk is considered throughout the investment process
from asset allocation to performance evaluation. Ongoing monitoring will be accomplished through a “mosaic” approach, in which
various forms of analysis and reporting contribute to the total picture. Inspection of levels of diversification, nominal risk exposures,
risk/return plots, sortino ratio, Value at Risk, tracking error, and worst case scenarios modeling form the core of the monitoring
process.
62

This page intentionally left blank.
63

to our members for navigating our state and submitting the beautiful photographs used in this report:
1 – “Enchanted Forest” by Robin Stevens features the Mandeville/Covington area. Robin is an active member employed
by the Louisiana Workforce Commission.
2 – “Tanker” by Jeanie Rhea a ship channel near Cameron. Jeanie is a retired member from the Department of Children
and Family Services.
3 – “Bayou Dreaming” by Robin Stevens features scenery on a swamp boat tour in the Slidell area. See Robin’s bio in “1”
above.
4 – “Twin Span Bridge” by Robin Stevens features the I-10 Twin Span Bridge across Lake Pontchartrain. See Robin’s bio in
“1” above.
5 – “Lake Lone Tree” by Juanita Miller features Lake Killarney at Angola. Juanita is an active member employed by the
Louisiana State Penitentiary at Angola.
6 – “Alleyway Near River Road Plantation” by Theresa Mullins Low features an alleyway on the side of Evergreen
Plantation on River Road. Theresa is a retired member from the Department of Children and Family Services.
7 – “Mandeville Sunset” by Robin Stevens features Lake Pontchartrain near Mandeville. See Robin’s bio in “1” above.
8 – “Ariel Pilot” by James Shaw features a small plane over the skies in southeast Louisiana. James is an active member
employed by the Department of Agriculture and Forestry.
9 – “Locomotive” by Dave Redman features a train passing a railroad signal in Reserve. Dave is the spouse of Mary Lou
Redman whom is an active member employed by the Louisiana Supreme Court.
10 – “Audubon Bridge” by Theresa Mullins Low features the John James Audubon Bridge near St. Francisville and New
Roads. See Theresa’s bio in “6” above.
11 – “City Scape Structures” by Mark Fradella features the Riverboat Natchez with Canal Street in the background. Mark is
an active member employed by the Department of Corrections.
12 – “Bayou Highway” by Robin Stevens features the Mandeville/Convington area. See Robin’s bio in “1” above.
13 – “Shrimping in Cocodrie” by Theresa Mullins Low features a shrimping boat in Cocodrie. See Theresa’s bio in “6”
above.
64

(photo credits continued)
14 – “Horace Wilkinson Bridge” by Mark Steudlein features the bridge across the Mississipppi River in Baton Rouge. Mark
is an active member employed by the Division of Administration Office of Technology Services.
15 – “Steamboat Natchez” by Theresa Mullins Low features the Steamboat Natchez in New Orleans. See Theresa’s bio in
“6” above.
16 – “Into the Unknown” by Robin Stevens features a Louisiana swamp near Slidell. See Robin’s bio in “1” above.
17 – “Mississippi River Navigation” by Malcolm Dales Behrnes features a tug boat on the Mississippi River. Malcom is a
retired member from the Louisiana Workforce Commission.
18 – “Black Lake” by Jolene Ardoin features Black Lake near Monroe. Jolene is an active member employed by the
Division of Administration Office of Technology Services.
19 – “Steam Boat” by Mark Steudlein features a classic steam boat navigating the Mississippi River. See Mark’s bio in “14”
above.
20 – “Alligator Alley” by Robin Stevens features the Mandeville/Covington area. See Robin’s bio in “1” above.
20
65

This page intentionally left blank.

Management Team
Cynthia Rougeou – Executive Director
Maris LeBlanc - Deputy Director & Chief Operating Officer
Bernard “Trey” Boudreaux, III – Assistant Director & Chief Administrative Officer
Robert Beale, CFA, CAIA – Chief Investment Officer
Tina Vicari Grant – Executive Council
Investment Team
Robert Beale, CFA, CAIA – Chief Investment Officer
Darren Fournerat, CFA, CAIA – Assistant Chief Investment Officer
Laney Sanders, CFA, CAIA, CTP – Assistant Chief Investment Officer
Celeste Funderburk, CCM – Director of Public Markets
Jacques Brousseau, CFA, CAIA – Director of Private Markets
Alisa Lacombe – Manager of Operations
Reeves Pearce, CAIA – Manager of Alternative Assets
Caye Weaver – Administrative Assistant
Investment Consultant
Rhett Humphrey’s, CFA – Lead Consultant
Custodian Bank
Bank of New York Mellon
This public document was published at a total cost of $244.13. Thirty-five copies of this public document were published in this first printing at
a cost of $244.13. The total cost of all printings of this document, including reprints is $244.13. This document was published by the Louisiana
State Employees Retirement System, P.O. Box 44213, Baton Rouge, LA 70809, to disseminate plan benefit information to its members and to
Louisiana policymakers under authority of La. R.S. 11:511. This material was printed in accordance with the standards for printing by state
agencies established pursuant to La. R.S. 43:31.

Contact Information Location: 8401 United Plaza Blvd. • Baton Rouge, LA 70809
Mail: P.O. Box 44213 • Baton Rouge, LA 70804-4213 Phone: (toll-free) 800.256.3000 • (local) 225.922.0600
Web: www.lasersonline.org