NAVIGATING CHANGE - Maritime Charities Group
224
NAVIGATING CHANGE A REVIEW OF THE UK MARITIME WELFARE CHARITY SECTOR FULL REPORT October 2017 Dr. Catherine Walker and Deborah Fairclough © Crown Images
-
Upload
khangminh22 -
Category
Documents
-
view
1 -
download
0
Transcript of NAVIGATING CHANGE - Maritime Charities Group

NAVIGATING CHANGE A REVIEW OF THE UK MARITIME WELFARE CHARITY SECTOR
FULL REPORT
October 2017
Dr. Catherine Walker and Deborah Fairclough
© C
row
n Im
age
s


Navigating Change: A Review of the UK Maritime Welfare Charity Sector | 2017 3
CONTENTS
Foreword 5
Introduction 7
Executive Summary 13
Section 1: A changing population – the demographics of the maritime community 2005-2050 21
Section 2: The needs and aspirations of the seafaring community – an update 33
Section 3: The maritime support network (focusing on maritime welfare charities) 55
Section 4: A decade of change – the maritime welfare charity sector 2005-2015. Surviving global recession, austerity measures and increasing demand 77
Section 5: The financial health and sustainability of the maritime welfare charity sector 95
Section 6: A roof over their heads – housing and social care provision 115
Section 7: A hand out or a hand up? The role and relevance of benevolent grant-making 137
Section 8: Measuring impact – what, why and how 155
Section 9: Challenging times: how the sector is responding to changing needs 167
Chapter 10: Stronger together? The future of the MWC sector in a challenging world 191
Methodology 205
Appendices 211
Bibliography 217

Navigating Change: A Review of the UK Maritime Welfare Charity Sector | 2017 4

Navigating Change: A Review of the UK Maritime Welfare Charity Sector | 2017 5
FOREWORDfrom the Maritime Charities Group
Ten years on from the publication of the ground breaking report “Supporting Seafarers and Their Families” the Maritime Charities Group (MCG) had the ambition once again to get out its nautical crystal ball and look into the future for our maritime charities and their beneficiaries. We wanted to examine the likely numbers of beneficiaries against existing and expected resources in a world of continuing austerity, and take account of evolving best practice in the wider UK third sector.
This report, written by The Researchery (Dr Catherine Walker) and Deborah Fairclough, is the product of extensive primary research and analysis of other investigations commissioned by the MCG since 2007. I commend them both for undertaking such a huge task and for producing a report that is comprehensive in its coverage and presents the challenges for the maritime charity sector in an accessible way. This independent assessment of the maritime charity sector and its conclusions will doubtless confirm what some have suspected, while making challenging reading for others.
The researchers undertook extensive consultation with maritime charities and also with our sister charities that serve the wider Armed Forces community. The comments and opinions of those charities are integrated into the report and make fascinating reading. Clearly, there is a considerable degree of reflection going on amongst our charity colleagues about the future and how we can meet some of the challenges that lie ahead.
There are some big changes ahead of us: by 2050 the research estimates that our seafaring community will decrease by 52%. However, we must also anticipate significant spikes in the numbers of Merchant Navy and Fishing Fleet seafarers aged over 85 from 2015 to 2035. The report outlines some very clear challenges for us in terms of the needs of an ageing population. Older seafarers continue to report higher than average levels of poor health. Loneliness and isolation are increasing issues for our older seafarers and their families. The report clearly indicates that our sector has to think more strategically about the challenges of meeting future housing and social care provision.
Despite the 2007 financial crisis and the ensuing years of austerity, the report indicates that the overall financial health of our maritime charity sector is reasonably sound in comparison to the wider third sector. Generating income and issues around financial sustainability are still a challenge for some, however. The research highlights the imbalance in overall resources within our maritime charity sector and suggests that, where appropriate, greater investment might be made in services for Merchant Navy and Fishing Fleet beneficiaries. None of this means that Royal Navy and Royal Marines beneficiaries don’t have extensive needs, but it does suggest that more work needs to be done to ensure that MCG members and others are able to develop effective responses to other emerging needs.
Finally and on behalf of the MCG, may I tender my sincere thanks to our research colleagues from The Researchery, The Institute of Public Care, and Opinion Research Services, as well as the many individuals who have helped in so many different ways to make this report possible.
Commodore Barry Bryant FCIPD CVO RN
Chairman, Maritime Charities Group
October 2017

Navigating Change: A Review of the UK Maritime Welfare Charity Sector | 2017 6

Navigating Change: A Review of the UK Maritime Welfare Charity Sector | 2017 7
INT
RO
DU
CT
ION

Navigating Change: A Review of the UK Maritime Welfare Charity Sector | 2017 8
INTRODUCTIONThe last ten years have seen large upheavals in UK society. Economic recession and austerity measures have impacted the level of provision of state-sponsored support for individuals in need, increasing the pressure on charities via reduced funding and increased demand. At the same time, Strategic Defence Reviews and changes in global trade and UK fishing have also impacted maritime workforces and their families.
In recent years, much research has been carried out into the needs of the Armed Forces community1, and while this body of research has covered the Royal Navy and Royal Marines these currently make up just 19.5% of the UK’s Armed Forces2. Very few studies have attempted to bring together research on the needs of the maritime sector as a whole, covering the Royal Navy and Royal Marines, Merchant Navy and Fishing Fleets.
THE COMMISSION
In 2005 the Maritime Charities Group3 (MCG) members agreed that there was a need to examine the support provided by maritime welfare charities matched against potential future needs. To achieve this, members jointly funded and managed a major research project covering the Royal Navy, Merchant Navy and Fishing Fleet, published in 2007:
‘Supporting Seafarers and their families: Challenges for the Future’. The report of the Maritime Charities Funding Group research programme on the needs of the UK seafaring community. May 2007.
The research concluded that existing maritime charity practices were, in many respects, inadequate to meet the current and future needs of the seafaring community, and included a large number of recommendations which were intended to inform the development of new working methods and standards in the planning and provision of services for seafarers and their families.
Ten years on, the MCG wished to understand how the landscape and predictions for the future have changed in the light of those previous findings and recommendations. A further set of research projects was therefore commissioned. Three projects aimed at describing the changes in demographics and needs of the maritime beneficiary population, particularly for older seafarers, who the 2007 research identified as having the greatest needs of all beneficiaries; and dependants and families of seafarers, about whom less was known.
1. Institute of Public Care (2015) ‘UK Seafarers’ Demographic Profile’. This study used official statistics, expert opinion and statistical modelling to describe and predict the maritime workforce and their dependants 2015-2050.
2. Opinion Research Services (2016) ‘Older Seafarers’ Needs’. This study used surveys of and telephone interviews with older seafarers and their dependants and carers to build a picture of the current and potential future needs of this group.
3. Institute of Public Care (2016) ‘The needs and aspirations of the dependants and families of seafarers under retirement age’. This study involved face-to-face and telephone interviews with key stakeholders and an electronic survey of families and dependants of seafarers under retirement age to describe the current and future needs of this group.
These reports are available separately, but their key findings are also summarised within this report for context (see Methodology section for further details of sampling, etc.)
1 See e.g. The Royal British Legion’s work (http://www.britishlegion.org.uk/get-involved/campaign/public-policy-and-research/research-and-reports/); the work of the King’s Centre for Military Health Research (http://www.kcl.ac.uk/kcmhr/publications/Index.aspx); the Anglia Ruskin University Veterans and Families Institute (http://ww2.anglia.ac.uk/ruskin/en/home/microsites/veterans_and_families_institute.html); and the growing body of work funded by the Forces in Mind Trust (http://www.fim-trust.org/reports/) including the recent Pozo and Walker (2014) UK Armed Forces Charities – a overview and analysis (http://www.fim-trust.org/wp-content/uploads/2015/01/DSCFiMTSectorInsightNov2014.pdf).
2 MoD (2016)3 Formerly the Maritime Charities Funding Group, the MCG is a working group made up of maritime charities that make grants to support organisations. The current
members are: Greenwich Hospital, the Merchant Navy Welfare Board, Nautilus Welfare Fund, the Royal Navy and Royal Marines Charity, Seafarers UK, Seafarers Hospital Society, Trinity House and ITF Seafarers Trust.

Navigating Change: A Review of the UK Maritime Welfare Charity Sector | 2017 9
A fourth, and larger, project was commissioned from The Researchery, an independent research consultancy for the voluntary sector, and aimed to understand the supply side of the maritime equation – the maritime welfare charities which support maritime beneficiaries – and how well this meets the demand. This programme of work was aimed at assessing whether the UK Maritime Welfare Charity sector is:
a. Currently fit for purpose (i.e. answering the needs of its beneficiary population today);
b. Flexible and adaptive to the changing needs of its beneficiary population (i.e. has it adapted to changing needs over the last ten years, and is it capable of adapting to changes in needs over the next twenty years);
c. Operating at the forefront of innovation and good practice, in particular with regard to the delivery of benevolence and housing, and in measuring impact (in comparison to the rest of the third sector and particularly with reference to other occupational sub-sectors).
This programme involved:
• 7 face-to-face interviews with representatives of charities which are currently members of the Maritime Charities Group (MCG);
• 30 in-depth telephone interviews with a quota sample of maritime welfare charities, selected to ensure broad representation by workforce (Naval Service / Merchant Navy / Fishing Fleet), organisation size and geographical location, and organisation focus: beneficiaries / services;
• An online survey of maritime welfare charities and tri-Service (Armed Forces) charities which achieved responses from 46 maritime welfare charities and 20 tri-Service (Armed Forces) charities;
• Identification of the Maritime Welfare Charity (MWC) sector, whose primary focus is on providing welfare support to maritime beneficiaries; analysis of MWC accounts over ten years (2005-2015, where available); in-depth quantitative analysis of the finances of the largest MWCs (with an income of over £500,000); comparison with both the wider third sector and other occupational benevolent sectors sharing similar characteristics.
This report summarises the results of all of the above-mentioned research.

Navigating Change: A Review of the UK Maritime Welfare Charity Sector | 2017 10
FROM THE OBSERVATION DECK
In a Foreword to the 2007 research, the then Charity Commissioner commented that: ‘Your beneficiaries are among the least visible people in our society and this report shows how often this leads to patchy service provision for those in the greatest need… Working together, maritime charities now have the evidence to raise the profile of their beneficiaries’ needs and place them higher in the public policy debate’4.
A lot can change in ten years, but some things remain the same. Seafarers are still among the least visible of UK workforces, and continue to face many needs unique to their occupation as well as many needs shared by other individuals in UK society. This report sets out to understand how these needs are being met by maritime welfare charities both now and in planning for the future.
It is important to understand that not all seafarers require support. The 2007 research estimated that around half of the UK seafaring community would have needs that maritime welfare charities could meet or alleviate, in addition to the foreign seafarers visiting UK ports. Of those seafarers that do require support, some groups will require more support than others.
On this point, it should also be noted that, due to the breadth of the study, this report focusses mainly on the greatest needs / unmet needs of seafaring beneficiaries and how to meet these. As previously mentioned, there already exists a body of work on the needs of the Armed Forces, veterans and their families, and despite Royal Navy and Royal Marines (RNRM) beneficiaries accounting for a majority of seafarers, this report follows the evidence to give greater weight to the less publicised needs of Merchant Navy (MN) and Fishing Fleet (FF) seafarers, ex-seafarers and their families. This is not to say that RNRM seafarers and their dependants do not have needs which require support, but that the focus of support which maritime welfare charities can offer may, where possible, need to shift in the light of the findings presented here, from RNRM to MN and FF.
The findings from the updated research programme provide a new picture of the current and future landscapes, against which maritime charities can assess their priorities, and plan their services and future financial commitments. The report concludes with some suggestions for future working in the context of the challenges facing the sector. Chief amongst these echoes the words of the Charity Commissioner ten years ago: ‘I urge you to consider still greater collaborative endeavour with others in your sector and beyond. Your beneficiaries have everything to gain.’
4 Maritime Charities Funding Group (2007).

Navigating Change: A Review of the UK Maritime Welfare Charity Sector | 2017 11
DEFINITIONS, INCLUSIONS AND EXCLUSIONS
For the purposes of this research, and in line with the previous research5, the UK seafaring community is defined as comprising:
• current seafarers – people who normally work at sea in the maritime workforces and who are either normally resident in, or visiting, the UK as a serving seafarer;
• former seafarers – people who used to work in the maritime workforces and are normally resident in the UK;
• the dependants and families of working or former seafarers;
• young people involved with maritime youth groups.
Aside from the young people, the other groups share a ‘seafaring lifestyle’ which affects both working and retired seafarers and their families.
The maritime workforces are defined as comprising current and former seafarers and their dependants from:
• the Naval Service, including the Royal Marines, Queen Alexandra’s Royal Naval Nursing Service (QARNNS) and associated Reserve Forces;
• the Merchant Navy, including the Royal Fleet Auxiliary, British seafarers working on UK and foreign-flagged vessels and large yachts;
• all sea fishing activities;
• directly-related industries which employ seafarers (including pilots, marine surveyors, marine managers and those employed on large yachts).
GLOSSARY OF TERMS AND ABBREVIATIONS USED
For brevity we have used a number of abbreviations throughout this report:
RNRM – Royal Navy and/or Royal Marines
MN – Merchant Navy
FF – Fishing Fleet
MWC – Maritime Welfare Charity (a charity whose primary focus is on the welfare of maritime beneficiaries (those who work or have worked primarily at sea in any of the above categories of RNRM, MN or FF, and their families))
Beneficiaries - this is used throughout the report as a shorthand term to refer to both existing beneficiaries and potential beneficiaries, who may be in need, but have yet to access MWC support
5 Maritime Charities Funding Group (2007)

Navigating Change: A Review of the UK Maritime Welfare Charity Sector | 2017 12

Navigating Change: A Review of the UK Maritime Welfare Charity Sector | 2017 13
SU
MM
AR
Y

Navigating Change: A Review of the UK Maritime Welfare Charity Sector | 2017 14
EXECUTIVE SUMMARYSECTION 1 of the report explores the changing demography of maritime beneficiaries and shows that the population of seafarers and their families is currently larger and declining more slowly than previously thought, particularly in some areas of the beneficiary population. In fact, the population of potential beneficiaries is predicted to fall to just over half (52%) by 2050.
While Royal Navy and Royal Marines (RNRM) seafarers, former seafarers and their families continue to dominate the seafaring community in terms of numbers (58% in 2015), there are significantly more serving and former Merchant Navy (MN) and (especially) Fishing Fleet (FF) seafarers and their families currently, and projected into the future, than previous estimates allowed (particularly older dependent adults and children). Crucially, older MN and FF aged 85 and over (those most likely to require care and support) are projected to increase by around 220% between now and their peak in the 2030s; while in the RNRM the number of former seafarers aged 85 and above has already peaked and is now declining.
New populations of maritime workers are coming on stream, including relatively large numbers of professional yacht and cruise ship crews, as well as smaller workboats servicing the offshore energy tapestry. These are a growing, younger workforce with different needs and aspirations, which the maritime charity sector needs to engage with. In the youth sector, nearly 20,000 young people are currently involved in Sea Cadets, Naval Cadets and Sea Scouts, meaning a fairly healthy population of younger people interested in seafaring.
These changing demographics point to a need for Maritime Welfare Charities (MWCs) to reassess their potential beneficiary population, in light of the updated demographics and emerging new segments within the maritime sector, and then establish whether support reflects demand. Without doubt, relatively more support will need to be focused on older MN/FF in the next 10-20 years.
SECTION 2 summarises the needs profiles of different groups of maritime beneficiaries, how these have changed in the last ten years, and how they are projected to change in future. This section shows that while the overall picture of seafarers’ needs remains similar to ten years ago, some groups of beneficiaries require greater support and may have more complex needs – particularly older Merchant Navy and Fishing Fleet ex-seafarers and their dependants.
In wider UK society, those aged 65-74 are 1.7 times as likely to need support as someone aged 45 – 64, while those aged 75-84 require 2.5 times and those aged over 85 around three times as much primary care, so the increasing numbers of older seafarers is a significant factor for care and support providers long into the future.
The number of older former seafarers with longstanding illness, limitations with activities of daily living and dementia are all set to rise in older MN/FF and fall for RNRM. For these older individuals, loneliness and isolation remains a big problem, particularly amongst those from the Fishing Fleet. At the same time, over the last ten years, the proportion of all older seafarers who find it difficult to make ends meet financially has remained at similar levels, but there has been a sharp fall in the level of savings, potentially leaving individuals in a more vulnerable position.
In general, and particularly in later life, seafarers from the Fishing Fleet have more and greater needs, followed by MN seafarers and their families, with those from the RNRM reporting the fewest issues requiring support from MWCs. Support, advice and assistance relating to finances and housing remain the most important services requested by all seafarers and their families. To some extent, increasingly complex beneficiary needs may offset the decline in beneficiaries in terms of MWC spend.
Such changes indicate that more support will be needed in the next 10-20 years around financial issues, loneliness and isolation, dementia, limitations with daily living and longstanding illness, with older MN/FF beneficiaries in particular having greater need than previously predicted.

Navigating Change: A Review of the UK Maritime Welfare Charity Sector | 2017 15
SECTION 3 addresses the supply side – the maritime charities providing support to beneficiaries in need, and finds that the maritime charity sector is diverse, loosely defined and unevenly spread across different seafarer groups with the result that some beneficiary groups have more support than others.
There are 81 registered maritime welfare charities (MWCs) focussed specifically on the maritime sector and providing relief-in-need to seafarers and their families (excluding tri-Service Armed Forces charities) – 36 MWCs primarily serve MN and FF, 19 primarily serve RNRM and 26 serve all three maritime sectors. These 81 form the focus of the report. Maritime welfare charities (excluding tri-Service Armed Forces charities) receive over £111 million and spend over £105 million per annum on providing welfare support to the seafaring community. Since the maritime welfare charity sector is dominated by large grant-makers which fund MWCs there is some double-counting in these total figures. Indeed, some £19 million is given by MWC grant-makers largely to other MWCs, which is translated into the various types of support given to individual beneficiaries, including £9.6 million which is given out in benevolent grants to individual beneficiaries.
When tri-Service Armed Forces charities are included, RNRM seafarers and their families seeking support have four times as many charities supporting them than either MN or FF. Over £40 million is primarily spent on supporting RNRM by MWCs (plus an estimated £81 million by tri-Service Armed Forces charities) compared to £27 million primarily spent on MN and FF.
The array of support offered by MWCs is fairly comprehensive, however MWCs surveyed feel that the sector needs better health rehabilitation services, emotional support for seafarers and their families, services with an emphasis on social isolation, information about minority ethnic seafarers, and suitable accommodation for retired seafarers.
The MWC sector provides a huge amount of support to maritime beneficiaries, but could still improve in some areas, particularly with regard to more poorly served groups. Having an acknowledged MWC ‘sector’ and tighter bonds between organisations could be beneficial for both charities and beneficiaries in managing and delivering such changes in emphasis.
SECTION 4 describes the changing landscape of maritime welfare charities over the last ten years, and how the MWC sector fared during the economic recession and other tumultuous events of the last decade. The research shows that overall the MWC sector streamlined in numbers and stalled financially during the recession, while larger MWCs and those serving RNRM beneficiaries survived and thrived best. Looking at the sector as a whole, funds held in reserve were not utilised to augment spending to any significant degree.
Two-thirds of MWCs report increased demand over the last five years, especially FF MWCs, while others struggled to find beneficiaries as the maritime population declines. During the global recession, the sector’s overall income flattened out, and while overall spending increased in the first couple of years of the recession, keeping pace with demand, it then fell in 2010, only picking up again from 2014 onwards.
The level of total funds also dipped during the recession due to the high reliance on investments which fell prey to stock market oscillations, and this may have scared some charities into holding on to their money. Indeed, the level of funds held in reserve by the largest MWCs increased slightly during the global recession, suggesting that at least some MWCs decided on a path of caution during these years – curbing spending and maintaining/building up funds for the next rainy day.
This aggregated view hides a more complex picture however, with a number of individual MWCs drawing down on their investments at some point in the last 5 years to maintain higher levels of spending. The experience of the last decade has been different for different charities, such that larger charities, those providing accommodation and grants to other charities and those serving the RNRM fared best over the last decade; and smaller charities, those providing benevolent grants to individuals, and those serving MN/FF fared less well over the last decade.
The imbalance in the sector towards relatively greater support for RNRM beneficiaries has been exacerbated over the last decade making it even more important to address now. With hindsight, the sector could have spent more of its funds held in reserve during this difficult period, and not doing so may have stored up greater problems for the future as far as beneficiary needs are concerned.

Navigating Change: A Review of the UK Maritime Welfare Charity Sector | 2017 16
SECTION 5 looks at the financial health and sustainability of the maritime welfare charity sector, finding that overall, the maritime welfare charity sector has a healthy bank balance with plenty in reserve, but some MWCs are still facing challenges around future sustainability.
Since the global recession times are still hard across the MWC sector, with income levels barely exceeding pre-recession levels. While funds are enjoying stronger growth again, spending is only slowly increasing. Recent income growth has been propped up largely by an influx of LIBOR money and ‘new’ charities (primarily in the RNRM sector) as well as some exceptional grants to single charities, meaning that income is still an issue for some MWCs (especially those primarily supporting MN/FF beneficiaries).
The MWC sector faces a number of ongoing challenges in raising income, including ‘sea-blindness’ (low awareness of seafarers and their needs); increased competition between RNRM, MN and FF charities, particularly following efficiencies and growth in the RNRM sector; a declining legacy base; adverse charity publicity; fluctuating investment markets and difficulties in securing timely and core cost or revenue grants.
The MWC sector runs a fairly tight ship with good returns on money spent on raising funds through fundraising and trading and low cost ratios on spending (although investment ratios could be better). Overall, the MWC sector has a healthy bank balance, thanks mainly to its large, and currently expanding, investment portfolio (over £1 billion), but this varies dramatically amongst different charities, and without the top three (Greenwich Hospital, Trinity House Maritime Charity, and the RNRMC) the sector holds £388.5 million of assets.
Nearly half of the total funds of the sector lie in charities which primarily serve the RNRM community, with a further third lying in tri-maritime charities which serve all maritime workforces and less than one fifth lying in charities primarily serving the MN or FF community. Overall, the sector has enough funds held in reserve to cover 3.3 years (39.6 months), although this varies for individual charities from 0 to 13.7 years. This compares with 5.7 months for charities in the wider third sector. If Greenwich Hospital’s outlying funds held in reserve of £63.8M are removed, the sector’s overall level of reserves decreases to 2.8 years or 33.6 months. It should be noted that a large proportion of these funds are invested to provide long-term independent and sustainable income for the MWC sector.
A re-evaluation of the sector’s financial position may now be in order, assessing what level of funds held in reserve, income and spending are required to provide the necessary support for beneficiaries in the short and long term. A big question remains over whether funds held in reserve should be invested to provide a degree of self-sufficiency in long-term funding or spent to provide more services for beneficiaries now?
SECTION 6 investigates housing and accommodation provision for seafarers and their families, finding that much seafarer accommodation and social care provision is outdated and, whilst providing ‘the essentials’, meeting future beneficiary needs and aspirations will prove challenging.
There is a reticence amongst older seafarers and their dependants to live in specialist ‘senior’ residential accommodation, preferring to remain in their own homes as long as possible. Despite this reticence, an anticipated increase in older, frailer individuals with more complex health needs will demand more specialist ‘senior’ accommodation – the existing provision of care beds looks too low to cope with this.
Given that the maritime beneficiary population is ultimately reducing, accommodation charities need to ‘future proof’ their offer either by flexing the type of support provided (e.g. in-home care/financial support packages; step-down beds; extra-care) or by reviewing their beneficiary criteria (e.g. non-traditional seafaring roles and/or non-seafarers).
Any new ‘bricks and mortar’ would need to demonstrate real return on investment (ROI); such capital investment may be better spent in partnership with non-maritime organisations to avoid the risk of empty ‘seafarer-specific’ facilities. Similarly, an increasing need for dementia and Alzheimer’s care may be best met through partnerships/funding agreements with specialist mainstream providers.
Accommodation and social care provision needs to reflect a ‘life-cycle’ of care, looking beyond the essentials to ensure that evolving needs are met. A crucial part of meeting future housing and social care needs will be collaboration and co-operation across the maritime sector and beyond, as well as adapting existing provision.

Navigating Change: A Review of the UK Maritime Welfare Charity Sector | 2017 17
SECTION 7 describes the role and relevance of benevolent grant-making, finding that whilst a relatively high proportion of maritime welfare charities provide direct financial assistance to individuals, in many cases this now forms just one part of a wider ‘benevolent’ support solution.
Just under half of maritime welfare charities which deal directly with individual beneficiaries provide financial assistance, and their ongoing support will prove vital as austerity measures continue to bite. One third agree that monetary grants given directly to individuals are ‘the most effective benevolence channel’, with many believing that such monies need to form part of a wider support solution. Many MWCs are now looking at preventative or ‘upstream’ solutions to address issues before they become a problem, and believe that increased lobbying of government and other industry bodies to improve seafarers’ working conditions would be beneficial in this respect.
Case-working is widely used, although its implementation – from purely financial to wide-ranging, professional assessments – is inconsistent across the sector. In addition, the development of information and advice services such as SAIL (the Seafarers’ Advice and Information Line), has resulted in beneficiaries being advised on statutory entitlements, rather than defaulting to charity ‘hand-outs’, whilst improved sector networks have led to more collaboration and sign-posting to provide beneficiaries with a rounded solution. Inconsistent beneficiary eligibility criteria can still present challenges for sign-posting and collaboration.
Much can, and should, be done to initiate preventative measures to try to reduce future beneficiary need. However, direct monetary assistance, particularly for emergency relief, will always be needed, and maritime welfare charities should make suitable provision for this. An increased use of professional case-workers and multiple-charity support packages is likely to encourage longer-term financial independence for beneficiaries.
SECTION 8 explores impact assessment amongst maritime welfare charities, discovering that while most MWCs receive feedback from beneficiaries, structured impact assessment is limited.
Few maritime welfare charities feel that the sector is good at measuring and demonstrating their impact, with many capturing outputs rather than outcomes or impact. Masses of performance related information is captured – informal ‘thank-you’ communications, ‘foot-fall’ metrics, beneficiary surveys, case-working reports, CQC/Ofsted/DfE assessments – which could potentially be re-purposed to assist with impact measurement.
Many maritime welfare charities would welcome guidance on how to measure impact, particularly given the transient lives of seafaring beneficiaries, the less tangible nature of some of the pastoral support given, and the limited resources available. Fundraising challenges and heightened ‘evidence’ requirements from sector funders mean that an ability to prove impact will become ever more important in future.
Maritime welfare charities would do well to embrace impact measurement more fully. It can lead to increased operational efficiency, provide a more informed understanding of beneficiary need, and help to raise the profile of a charity or cause through the telling of engaging success stories – all outcomes that the maritime welfare charity sector would benefit from.

Navigating Change: A Review of the UK Maritime Welfare Charity Sector | 2017 18
SECTION 9 looks into the future and predicts that significant changes to seafaring and the ‘sea-family’ may require many maritime welfare charities to reconsider their offer, both to address challenges and capitalise on opportunities.
An overall reduction in beneficiary numbers and profile changes will mean that some MWCs may want to amend their qualifying criteria, supporting those from different ranks, other segments of the sector or those with less time at sea if they are to meet the greatest need. Changes in the maritime industry, such as the reduction in British flagged Merchant Navy ships and an increase in international crews, may also mean that the maritime welfare charity sector needs to start looking beyond UK beneficiaries.
General societal changes are impacting on beneficiaries, for example, an ageing population, and an increase in those with financial problems due to government austerity measures/funding cuts. As a result, beneficiary issues are increasingly complex and may necessitate more case-working, as well as specialist financial advisors (in debt and pensions) and emotional counsellors. In addition, technological advances both on-board and ashore have the potential to be a game-changer, with both positive and negative impacts that maritime welfare charities will need to address.
If left unchecked, ‘sea-blindness’ – the perceived invisibility of the maritime (charity) sector – combined with the reducing ‘sea-family’ will impact negatively on future fundraising, volunteering and beneficiary contact levels. Inconsistent interpretation and implementation of regulatory and governance requirements in areas such as fundraising, data protection and safe-guarding, could hinder sector collaboration. And whilst the majority of maritime welfare charities surveyed anticipate an increase in demand over the next 5 years, only a quarter believe that the sector is in ‘a good position’ to respond.
It can no longer be ‘business as usual’ – the seismic shifts in the maritime world and society at large cannot fail to impact on maritime welfare charities and the support they provide. Maritime welfare charities will need to review the fundamentals of ‘who, what, where, when and how’ they serve, if they are to maximise their future impact.
SECTION 10 rounds off the report with a look at the top ten issues currently facing maritime welfare charities (and their beneficiaries), the top ten issues which they might face in the future, and suggests how the MWC sector might rise to the challenge.
The top 10 challenges currently facing MWCs (as voted for by the charities themselves):
1. Raising awareness of our charity / cause2. Generating income / achieving financial sustainability3= Identifying / finding beneficiaries3= Securing new Trustees / Chairman 5. Measuring and demonstrating impact6. Increasing costs7. New technology – online / mobile solutions for giving, communicating or service delivery8. Remaining true to our original mission / avoiding mission drift10= Meeting demand for services10= Insufficient resources10= Securing volunteer engagement

Navigating Change: A Review of the UK Maritime Welfare Charity Sector | 2017 19
Based on this research, knowledge of the wider third sector, the Armed Forces charity sector and other research, the researchers suggest that the top 10 challenges facing the MWC sector in the next ten to twenty years (in no particular order) are likely to be:
1. Resource issues
2. Changing beneficiary demographic / needs profile
3. Increasing demand (in need, if not numbers)
4. An ageing population
5. Awareness raising (sea-blindness) and finding beneficiaries
6. Decreased public trust and confidence in charities
7. Good governance
8. New technology and the digital divide
9. Political and economic uncertainty
10. Increasing imbalance in the sector
RISING TO THE CHALLENGE
In assessing whether the maritime welfare charity sector is currently fit for purpose, and also whether the sector is flexible and adaptive to changing needs, this research finds that while many maritime beneficiaries are adequately supported, and many innovations have been implemented, it has been difficult for the sector to deal with all of the changes thrown at it by the demographic, economic and societal upheaval of the last decade. This means that some groups of beneficiaries require further support from the MWC sector, particularly MN and FF beneficiaries and their dependants. In some areas, the MWC sector appears to be operating at the forefront of innovation and good practice, while in other areas it lags behind the wider third sector and other occupational benevolent sub-sectors.
Now the sector needs to overcome a number of challenges to put itself in a better position going forward. In coming to grips with possible solutions it is important to understand that the challenges faced will be different for different MWCs depending on their size, the workforce they serve and the support they offer, and therefore solutions will also not be ‘one size fits all’. Section 10 outlines a number of suggestions for action, largely based on solutions which other third sector and occupational benevolent charities have employed.
Chief amongst these is what we term ‘a whole sector approach’. In order for the MWC sector to future-proof itself, some of the solutions to those issues outlined above might be undertaken by individual charities. However, there are a number of areas where the sector acting as a whole might be stronger. One such area is greater co-operation and collaboration - both across the sector and beyond – which could be key to unlocking a better shared future for maritime welfare charities. This includes sharing information and best-practice, and co-ordinating responses (e.g. via partnership working). In this way, better support for beneficiaries might be achieved and the MWC sector become more future-proofed. On the basis of the research it seems likely that the sector could be ‘stronger together’.
Time is moving on, and maritime welfare charities now need to face some of the fundamental questions raised by this report (and indeed, the 2007 Supporting Seafarers report)– addressing them with a cohesive and co-ordinated strategy - before changes in the maritime world and beneficiary population force the sector’s hand. Such things cannot wait another ten years.

Navigating Change: A Review of the UK Maritime Welfare Charity Sector | 2017 20

Navigating Change: A Review of the UK Maritime Welfare Charity Sector | 2017 21
ON
E

Navigating Change: A Review of the UK Maritime Welfare Charity Sector | 2017 22
1. A CHANGING POPULATION The demographics of the maritime community 2005- 2050
Royal Navy and Royal Marines (RNRM) seafarers, former seafarers and their families dominate the seafaring community in terms of numbers (58% in 2015), although this is a smaller proportion than estimated in 2007
The total seafaring population is currently declining more slowly than estimated in 2007
The total seafaring population is predicted to fall to just over half (52%) by 2050
THE POPULATION OF
SEAFARERS AND THEIR
FAMILIES IS CURRENTLY
LARGER AND DECLINING MORE
SLOWLY THAN PREVIOUSLY
THOUGHT, PARTICULARLY
IN SOME AREAS OF THE
BENEFICIARY POPULATION
KEY POINT 1 Numbers of older RNRM dependent adults and children are higher than previously estimated and the fall in these groups will not be as steep as predicted
There are significantly more serving and former Merchant Navy (MN) and (especially) Fishing Fleet (FF) seafarers and their families currently, and projected into the future, than previous estimates allowed (particularly older dependent adults and children)
Higher than predicted numbers of older former MN and (particularly under-estimated) FF seafarers aged 65 and over will peak in 2020 and only start reducing noticeably after 2025
Crucially, older MN and FF aged 85 and over (those most likely to require care and support) are projected to increase by around 220% between now and their peak in the 2030s, and in 2050 there will still be more former MN over 85 than today; while for RNRM, the number of former seafarers aged 85 and above has already peaked and is now declining
New populations of maritime workers are coming on stream, including relatively large numbers of professional yacht and cruise ship crews, as well as smaller workboats servicing the offshore energy tapestry. These are a growing, younger workforce with different needs and aspirations, which the maritime charity sector needs to engage with
There are nearly 20,000 young people involved in Sea Cadets, Naval Cadets and Sea Scouts, and the numbers are growing in contrast to other cadets, meaning a fairly healthy population of younger people interested in seafaring

Navigating Change: A Review of the UK Maritime Welfare Charity Sector | 2017 23
These changing demographics point to a need for Maritime Welfare Charities (MWCs) to reassess their potential beneficiary population in light of the updated demographics and emerging new segments within the maritime sector, and then establish whether support reflects demand. Without doubt, relatively more support will need to be focused on older MN/FF in the next 10-20 years

Navigating Change: A Review of the UK Maritime Welfare Charity Sector | 2017 24
1.1 THE SEAFARING COMMUNITY 2005-2050 6
In 2005, it was estimated that there were around 1.5 million people in the UK seafaring community7, comprising:
• 940-997,000 from the RNRM sector
• 270-294,000 from the MN sector
• 123-140,000 from the FF sector
• 13,000 sea cadets
These estimates, published in Supporting Seafarers (2007) projected that the seafaring population would decline by 22%-24% in the following decade to 2015, and a further 15%-16% between 2015 and 2020 (Figure 1.1).
FIGURE 1.1Estimates of the total seafaring community (serving, former and dependants of RNRM, MN and FF) 2005-2020, showing lower and upper limits of estimates (‘Supporting Seafarers’, 2007)
However, updated figures now available suggest that these original estimates were too low (particularly for MN and FF communities)
In 2015 there were 1.35 million people in the UK seafaring community, comprising:
• 74,800 working seafarers
• 258,000 former seafarers of working age
• 357,000 former seafarers over 65 (including 67,000 over 85)
• 662,000 dependants (including 191,000 children) of seafarers; 298,000 of which are older adults
• 13,710 Sea Cadets and 5,460 cadets in the Naval Service of the Combined Cadet Force
See Tables 11.1 and 11.2 and Figure 11.1 in Appendix 1 for full figures8.
Revised figures show that the total seafaring population is currently declining more gradually than predicted, by just 3% between 2005 and 20159, then by approximately 12% every five years to 2050 (Figure 1.2.).
6 Unlessotherwisestated,thefiguresinthissectionaretakenfromIPC(2015)withthefollowingproviso:‘The collection and analysis of demographic data on the serving and former seafaring population and their dependants is constrained by gaps in the data and issues of quality and reliability in relation to some aspects of these populations.’ This is particularly true for Merchant Navy and Fishing Fleet populations where estimates are likely to be less reliable. Therefore, caution should be exercised when using thefigures.SeeMethodologyforfurtherdetails
7 Maritime Charities Funding Group (2007)8 The MCFG ‘Supporting Seafarers’ 2007 report acknowledged the need for better and more consistent data, and that should better data become available it would be
importanttorefinetheoriginalprojections.NewestimatesprovidedmainlybyIPC(2015)exceptwhereotherwisestated9 Thisislargelyduetobetterdatabeingavailablein2015.Theseprojectionsusefiguresfor2005fromMCFG‘SupportingSeafarers’(2007)asthebaseline,whichinsome
areas are now considered to have been too low
1 .1
1 .2
1 .3
1,344,000 1,137,000 1,021,000
858,000
1,431,000
1,231,000 1,118,000
955,000
0
200,000
400,000
600,000
800,000
1,000,000
1,200,000
1,400,000
1,600,000
2005 2010 2015 2020
Total seafaring community (range), 2005 - 2020, SS07
Total (lower limit) Total (upper limit)
1,350,920 1,194,620
1,045,990 823,930
653,190
2015 2020 2025 2035 2050
N
year
1 .1
1 .2
1 .3
1,344,000 1,137,000 1,021,000
858,000
1,431,000
1,231,000 1,118,000
955,000
0
200,000
400,000
600,000
800,000
1,000,000
1,200,000
1,400,000
1,600,000
2005 2010 2015 2020
Total seafaring community (range), 2005 - 2020, SS07
Total (lower limit) Total (upper limit)
1,350,920 1,194,620
1,045,990 823,930
653,190
2015 2020 2025 2035 2050

Navigating Change: A Review of the UK Maritime Welfare Charity Sector | 2017 25
FIGURE 1.2Revised estimates of the total seafaring community (serving, former and dependants of RNRM, MN and FF) 2015-2050 (IPC, 2015)
Revised projections show that the entire seafaring community will decrease by just over half (52%) between 2015 and 2050, from 1.35 million in 2015 to around 653,000 in 2050. These decreases will be seen across all three industry sectors (Figure 1.3).
FIGURE 1.3Revised projections for the total seafaring community 2015-2050 by industry sector10
In terms of numbers of serving and former seafarers and their dependants, those from the Royal Navy and Royal Marines (RNRM) dominate the seafaring community, although this domination is not so great as it appeared in 2005 (Figure 1.4). In 2015, those from the RNRM sector comprise 58% of the seafaring community overall, followed by those from the Merchant Navy (MN) at 26% and those from the Fishing Fleet (FF) at 16%. These proportions are now estimated to remain similar between 2015 and 205011.
10 SeeTables11.1and11.2andFigure11.1inAppendix1forfullfigures.11 Within the limitations imposed by such forward-looking estimates
1 .1
1 .2
1 .3
1,344,000 1,137,000 1,021,000
858,000
1,431,000
1,231,000 1,118,000
955,000
0
200,000
400,000
600,000
800,000
1,000,000
1,200,000
1,400,000
1,600,000
2005 2010 2015 2020
Total seafaring community (range), 2005 - 2020, SS07
Total (lower limit) Total (upper limit)
1,350,920 1,194,620
1,045,990 823,930
653,190
2015 2020 2025 2035 2050
1 .4
0
200,000
400,000
600,000
800,000
1,000,000
1,200,000
1,400,000
1,600,000
2015 2020 2025 2035 2050
TOTAL Royal Navy Merchant Navy Fishing Fleet
70%
20%
10%
2005
Royal Navy Merchant Navy Fishing Fleet
N
year
N
year
1 .4
0
200,000
400,000
600,000
800,000
1,000,000
1,200,000
1,400,000
1,600,000
2015 2020 2025 2035 2050
TOTAL Royal Navy Merchant Navy Fishing Fleet
70%
20%
10%
2005
Royal Navy Merchant Navy Fishing Fleet
Royal Navy and Royal Marines
1 .4
0
200,000
400,000
600,000
800,000
1,000,000
1,200,000
1,400,000
1,600,000
2015 2020 2025 2035 2050
TOTAL Royal Navy Merchant Navy Fishing Fleet
70%
20%
10%
2005
Royal Navy Merchant Navy Fishing Fleet

Navigating Change: A Review of the UK Maritime Welfare Charity Sector | 2017 26
FIGURE 1.4
The seafaring community by industry sector, 2005-205012
2005 2015 2050
In the last decade numbers in the Royal Navy and Royal Marines have decreased as a result of the government’s Strategic Defence and Security Reviews in 2010 and 2015. At the same time, there has been a slight rise in recruitment to the Merchant Navy, while numbers in the Fishing Fleet have stabilised and are expected to remain so indefinitely; although future changes in, for example, defence spending, world trading patterns, and fishing quotas could change this picture dramatically.
The number of non-UK MN seafarers is increasing13, posing a question for UK maritime welfare charities about how much, if any, support they should provide to these international workers. New seafaring populations are also emerging, with figures reporting that global superyacht crews currently number over 100,000, with three-quarters being non-UK nationals14. In addition, roles such as off-shore workboats that service windfarms and cruise-ship personnel could swell seafaring numbers moving forward.
12 2005figuresbasedonaveragevaluesreportedinMCGF‘Supporting Seafarers’ (2007), 2050 values based on estimates provided by IPC (2015)13 Ithasbeenestimatedthatonly41%ofofficersand28%ofratingsworkingintheUKshippingindustryin2015arefromtheUK,with25%/16%beingfromtheEEAand
34%/60%beingfromtherestoftheworld.OxfordEconomics(2016)14 Bluewater (2017)
1 .4
0
200,000
400,000
600,000
800,000
1,000,000
1,200,000
1,400,000
1,600,000
2015 2020 2025 2035 2050
TOTAL Royal Navy Merchant Navy Fishing Fleet
70%
20%
10%
2005
Royal Navy Merchant Navy Fishing Fleet
58% 26%
16%
2015
Royal Navy Merchant Navy Fishing Fleet
59% 26%
15%
2050
Royal Navy Merchant Navy Fishing Fleet
58% 26%
16%
2015
Royal Navy Merchant Navy Fishing Fleet
59% 26%
15%
2050
Royal Navy Merchant Navy Fishing Fleet
1 .4
0
200,000
400,000
600,000
800,000
1,000,000
1,200,000
1,400,000
1,600,000
2015 2020 2025 2035 2050
TOTAL Royal Navy Merchant Navy Fishing Fleet
70%
20%
10%
2005
Royal Navy Merchant Navy Fishing Fleet
and Royal Marines
1 .4
0
200,000
400,000
600,000
800,000
1,000,000
1,200,000
1,400,000
1,600,000
2015 2020 2025 2035 2050
TOTAL Royal Navy Merchant Navy Fishing Fleet
70%
20%
10%
2005
Royal Navy Merchant Navy Fishing Fleet

Navigating Change: A Review of the UK Maritime Welfare Charity Sector | 2017 27
1.1 .1 ROYAL NAVY AND ROYAL MARINES
1 .1 .1 .1 SERVING RNRM
Numbers of serving RNRM seafarers have been falling since the end of the second world war in 1945. Recent National Strategic Defence and Security Reviews (SDSR 2010 and 2015) outlined further cuts to a force of 30,450 by 202015. In 2015 there were 32,520 serving personnel in the RNRM16.
RNRM seafarers tend to spend least time in service, with survey data indicating that more than half (56%) of older seafarers had been a seafarer for less than 15 years17, and this may have declined further for current RNRM seafarers since previous research identified a trend in the Naval Service towards shorter periods of engagement18. Many leave service while still relatively young and go on to pursue other jobs. A peak for officers’ outflow is around 50; while outflow for other ranks peaks between 20 and 29 with a second peak around 4019. This has a knock-on effect on the potential beneficiary population of former RN personnel as many will go on to work in other industries with different, usually lower, risk factors and further provision of occupational support (71% of older respondents left the service in the 1970s or earlier20).
Consequently, the age profile of serving RNRM seafarers has risen over the last seven years, with 22% aged 40 or above in 2015. There are more officers than forty years ago (20% vs 14%)21 and more female and Black, Asian and Minority Ethnic (BAME) RNRM seafarers: Females currently make up 9.2% of RN Regular Forces22 (12.8% of officers and 9.6% of other ranks), while BAME representation comprised 3.5% of RNRM Regular Forces in 201523.
Eight-in-ten (79%) older RNRM seafarers reported supporting military operations, the majority having done so for less than five years24.
The great majority of serving RN personnel are in the South-West, South-East and Scotland25.
1 .1 .1 .2 FORMER RNRM
The number of former RNRM seafarers is set to fall from 368,000 in 2015 to 159,000 in 2050.
Currently, more than half of naval veterans (55%) are aged 65 or above, more than one-third are aged 75 and above, and 15% are aged 85 or above, reflecting the larger numbers of naval veterans in previous decades. Right now, the proportion of RNRM veterans aged 85+ (over 55,000) is more than seven times that in the general population, but this number is already in decline, and will fall to 44,000 in 2020; 30,000 in 2025; 20,000 in 2035 and 13,000 in 2050, contrary to previous estimates that this age group would peak in 201526. The number of former RN widows is projected to drop to about one-third of the current number between now and 2050.
The highest concentrations of former RNRM are in: Portsmouth, Plymouth, Glasgow, Bath, Exeter, Kirkcaldy, Southampton, Newcastle, Nottingham, Liverpool, Cardiff, Dorchester, Gosport and Birmingham27. This appears to indicate that a significant proportion of former RN personnel remain close to the locations where they have been stationed.
1 .1 .1 .3 RNRM DEPENDANTS
There are currently more older28 dependent RNRM adults and children29 than estimated by ‘Supporting Seafarers’ (2007) – nearly 170,000 rather than 115,000 adults, and 118,000 rather than 85,000 children in 2015 – and the fall in numbers in these groups will not be as steep as that projected previously30. By 2050 it is estimated that there will be around 56,000 older RNRM adults and 77,000 dependent children31.
15 HM Government, UK (2015)16 MOD (2015d) quoted in IPC (2015) 17 ORS (2016) Survey of 5,000 older seafarers (valid responses – 872)18 Maritime Charities Funding Group (2007)19 IPC (2015)20 ORS (2016)21 IPC (2015)22 MOD (2015d)23 Ibid24 ORS (2016)25 IPC (2015)26 Maritime Charities Funding Group (2007)27 Data provided by the Royal Naval Association of members of their Shipmates campaign and an analysis of SSAFA applications between 2010-2013 (IPC, 2015)28 Definedas65+throughoutunlessotherwisestated29 Childrenaredefinedasages0-17inclusiveaspertheOfficeforNationalStatisticsstandard30 IPC (2015)31 Ibid

Navigating Change: A Review of the UK Maritime Welfare Charity Sector | 2017 28
1.1 .2 MERCHANT NAVY
1 .1 .2 .1 SERVING MN
The UK commercial shipping fleet grew strongly between 2000 and 2009 following the introduction of tonnage tax, but has since declined between 2009 and 2015 reflecting increasingly strong global maritime trade competition.
Numbers of Merchant Navy personnel are harder to track than the RNRM, partly due to differing definitions of what and who constitutes the Merchant Navy32, the numbers of seafarers from overseas, and seafarers employed through manning agents sailing under various flags and conditions, who are not always captured by government statistics. There are also many MN seafarers working ashore in maritime-related employment (14,120, or 32% of the total MN workforce recorded in 201533).
There were an estimated 30,000 serving MN seafarers in 2015. This is much higher than the 16-18,000 projected in ‘Supporting Seafarers’ (2007), and the projected future decrease in numbers is more gradual34. The expansion probably reflects a slight increase in recruitment to the Merchant Navy. This number includes the Royal Fleet Auxiliary which currently numbers around 2,000.
There has also been an influx of new groups of commercial seafarers - cruise ship staff and non-standard vessels such as superyachts. In 2017, it was estimated that there were over 24,000 superyacht crew from the UK (with crews globally totalling nearly 105,000)35. These numbers are set to increase quickly, with an estimated 6,500 new jobs by 202036. In addition to this, there are some 25,000 Royal Yachting Association (RYA) qualified commercially endorsed seafarers currently estimated to be working on small commercial vessels or workboats, with an estimated 16,000 of these being UK-based37.
Under the relatively recent Maritime Labour Convention 2006 definition of a ‘seafarer’ (which includes, for instance, cruise ship on-board entertainers), numbers have risen quite sharply, but there is no indication, as yet, what this will mean in terms of eventual charitable need. In many cases, these people will not accrue sufficient seafaring service to qualify for support from many MWCs (see Section 7.3.1).
The non-hospitality Merchant Navy (excluding cruise ships and superyachts) is an ageing population with 60% of serving MN seafarers aged 40 or above. The majority of MN seafarers treat it as a long-term career, with more than half (51%) having spent 30 years or more in service38. The average retirement age for Merchant Navy seafarers is 6239; however, the projections for the MN workforce overall indicate a younger workforce in future, likely including more hospitality-working seafarers (many of whom are also more likely to be female).
The number of female MN seafarers continues to grow, with 21% of ratings and 7% of officers being women in 201540.
The number of overseas MN seafarers continues to grow with estimates showing that more than half of deck and engine officers (57%) in the UK shipping industry are non-UK personnel, and nearly three-quarters (73%) of deck and engine ratings are non-UK personnel41. Despite this, there are no data available on the proportion of Black, Asian and Minority Ethnic (BAME) seafarers working within the UK Merchant Navy.
32 TheILOMaritimeLabourConvention2006,effectiveintheUKfromAugust2014,definesamerchantseafareras ‘any person who is employed or engaged or works in any capacity on board a ship to which this Convention applies where a ship means a ship other than one which navigates exclusively in inland waters or waters within, or closely adjacent to, sheltered waters or areas where port regulations apply’.ThisdefinitiondoesnotincludemembersoftheRoyalFleetAuxiliary.TheMerchantNavyWelfareBoard has provided some internal guidelines, for others to use, to define a British Merchant Navy seafarer as any person, of UK nationality (which includes CrownDependencies - the Channel Isles and Isle of Man - and British Overseas Territories (e.g. Gibraltar, Falkland Islands), or living in the UK and who is serving, or has served, at sea in any capacity aboard a merchant vessel irrespective of the country of registry or ownership. This includes, but is not limited to, passenger liners, ferries, container ships, tankers, bulk carriers, and refrigerated cargo ships, Royal Fleet Auxiliaries (or their equivalent), coasters, specialist ships (e.g. deep-sea tugs, salvage vessels, oil support vessels, lighthouse tenders etc.), plus large charter yachts with paid crew members. (IPC, 2015)
33 IPC(2015);OxfordEconomics(2016)34 ArecentstudyofDepartmentforTransportfiguresonMNseafarers,whicharebasedonUKChamberofShippingmembershipsurveys,byDeloitte/OxfordEconomic
(2011)foundthatthesefigureswerenotfullycomprehensiveandhasscaledupestimatestoyieldhighernumbers,quotedinIPC(2015)35 Bluewater (2017) 36 Ibid37 Royal Yachting Association (http://www.rya.org.uk)38 ORS (2016)39 IPC (2015)40 Ibid41 Deloitte/OxfordEconomics(2011)citedinIPC(2015)

Navigating Change: A Review of the UK Maritime Welfare Charity Sector | 2017 29
Numbers of serving MN are projected to continue to decline for some years42 before stabilising in the 2030s, while the numbers of ex-seafarers in onshore maritime-related employment is projected to increase43.
Around one quarter (26%) of older MN seafarers report having supported military operations, although nearly all of these (23%) spent less than five years doing so44.
1 .1 .2 .2 FORMER MN
There are estimated to be nearly 57,000 former MN aged under 65, and over 94,000 aged 65 and above. This is higher than the projections reported in ‘Supporting Seafarers’ (2007) (151,000 compared with 115-125,000)45.
Unlike former RN, the number of former MN seafarers aged 65 and over will peak around 2020, and fall sharply from 2025. Crucially, the numbers of former MN aged 85 and over are projected to increase by 220% between 2015 and their peak in 2035. Many in this group are likely to need high levels of care and support.
The main areas where former MN live are: Hull, Aberdeen, Doncaster, Liverpool, Newcastle, and Norwich. Followed by smaller but significant numbers from: Blackpool, Plymouth, Cardiff, Glasgow, Chester, Inverness, Paisley, East London, Belfast, Torquay, Truro, and York46.
There is very little information on former BAME MN, although it is known that there are communities of Somali origin who elected to remain in the UK after they were unemployed in the late 1970s and early 1980s in East London, Cardiff, Liverpool and Tyneside47.
1 .1 .2 .3 MN DEPENDANTS
The numbers of children and particularly of older adult MN dependants are higher than the figures reported in ‘Supporting Seafarers’ (2007) – 47,000 rather than 25-28,000 children, and 79,000 rather than 33-36,000 older adults. And whilst the 2007 research postulated a flattening out in these groups between 2015 and 2020, the updated estimates show a small rise in older MN dependent adults to just under 81,500 in 2020. The number of dependent children is projected to decline to the year 2035 before starting to increase gradually.
In recent years, the number of widows and widowers has declined steadily reflecting wider, national trends in the decline of marriage, while numbers of partnerships are unlikely to have changed48.
42 WhiledemandforBritishMNofficersisexpectedtoremainhighoverthecomingyears;thedeclineinthenumberofratingsisanticipatedtocontinue,reflectingtherelative ease with which they can be substituted by cheaper foreign workers, despite the boost to the UK sector of the introduction of Tonnage Tax in 2000 (Deloitte/OxfordEconomics(2011))
43 Deloitte/OxfordEconomic(2011)citedinIPC(2015)44 ORS (2016)45 This is largely due to assuming a higher proportion of former MN outside the existing pensions schemes than allowed for in the model reported in MCFG ‘Supporting
Seafarers’ (2007), IPC (2015)46 Source:MerchantNavyWelfareBoardgrantsbetween2008and2013;postcodeswillcoverwiderareasthantheposttowninthepostcodeandsomebeneficiariesmay
come from other seafaring groups. IPC (2015)47 MNWB (2017a) 48 The number of MN dependants has been estimated based on national household data and pensions data as well as maritime pension funds and grant giving
organisations, IPC (2015)

Navigating Change: A Review of the UK Maritime Welfare Charity Sector | 2017 30
1.1 .3 FISHING FLEET
1 .1 .3 .1 SERVING FF
Data on the number of people working in the Fishing Fleet (FF) are limited49. Many fishermen work only occasionally and intermittently, 17% work part-time50. The Fishermen’s Mission considers that there are significant numbers of casual and seasonal fishermen that are not captured by the official statistics51. Notwithstanding, the Marine Management Organisation (MMO) estimates that numbers of fishermen52 in the UK have declined from nearly 50,000 in 1948 to 12,830 in 2005 after which point numbers stabilised53.
The original estimates made in 2007 are therefore now considered to be far too low. IPC (2015) estimates that in 2015 there were between 12-13,000 serving FF seafarers (rather than the 6-7,000 projected in 2007), and rather than declining as first thought, this population is now estimated to remain relatively stable projecting forward to 2050.
The majority of FF seafarers treat it as a long-term career, with more than half (60%) having spent 30 years or more at sea by the time of their retirement54. Half (50%) of current fishermen are aged 40 or over (this compares with 70% of MN and 22% of RNRM). There are no estimates of BAME fishermen numbers although a survey amongst Scottish fishing crews55 found that 7.7% of the total workforce was from non-UK EU countries and 19.6% from outside the EU. Correspondingly, there are UK FF seafarers working on overseas boats, particularly American and Canadian boats.
Five percent of older FF seafarers report that they had supported military operations during their careers56.
In terms of geographical spread, according to the MMO, in 2012, 5,900 serving FF seafarers were based in England, 1,000 in Wales, 4,700 in Scotland and 800 in Northern Ireland57. The Northern Ireland workforce is the only one to have expanded in the last fifteen years. The key ports in terms of fishermen numbers by administration port are: England: Plymouth, Poole, Newlyn; Wales: Milford Haven; Scotland: Fraserburgh, Ayr, Lerwick; Northern Ireland: Belfast.
1 .1 .3 .2 FORMER FF
There are no recent data available on former FF seafarers, therefore estimates are based on historic data and assumptions based on the knowledge of maritime charities dealing with beneficiaries from these populations58. Again, these estimates are much higher than those projected in 2007: IPC (2015) figures show there to be over 95,000 former FF (rather than the 48-52,000 estimated in 2007), while the ensuing decrease is slightly more gradual than first thought.
63% of former FF seafarers are aged over 65, numbering 60,000 in 2015, rather than the 33-35,000 predicted in ‘Supporting Seafarers’ (2007). And these numbers are projected to continue increasing slightly up to 2020 before declining more steeply from the 2020s to an estimated total of about 19,300 in 2050.
The number of former FF seafarers aged 85 and over is expected to increase continuously from an estimate of 4,550 in 2015 to a peak of 9,880 in 2030, before starting to decline. Although absolute numbers are small in comparison with the former RN, this increase of 217% in the 85 plus age group up to 2030 is striking and will put significant demands on support for former FF seafarers and their dependants.
49 TheInternationalLabourOrganization’sdefinitionofafisherincludes‘everypersonemployedorengagedinanycapacityorcarryingoutanoccupationonboardanyfishingvessel,includingpersonsworkingonboardwhoarepaidonthebasisofashareofthecatchbutexcludingpilots,navalpersonnel,otherpersonsinthepermanentserviceofagovernment,shore-basedpersonscarryingoutworkaboardafishingvesselandfisheriesobservers’.ILO(C188)
50 IPC (2015)51 IPC (2015)52 Thenumberofwomeninfishingisunderstoodtobeverysmall53 UKfisheriesadministrationsoperatedfourdecommissioningexercisesbetween2001and2009.Thedecommissioningexercisesaimedtowithdrawsomecapacityand
effortfromUKfisheriestohelpensureasustainablefuture,andtoallowvesselownerstotakeabusinessdecisiononwhethertoremaininthefisheryindustryunderthetermsoffisherymanagementplans.IPC(2015)
54 IPC (2015)55 MarineAnalyticalUnit(2014)ScottishSeaFisheriesEmployment,2013,MarineScotlandScience.CitedinIPC(2015)56 ORS (2016)57 IPC (2015)58 TheFishermen’sMissionexpectsthatnumbersofbeneficiarieswillincreaseoverthenext10years,andthendeclinesteeplytoleveloutatamorestablepopulation.The
Shipwrecked Mariners’ Society also anticipate a steady increase in numbers for another 10 to 15 years before numbers start to decline, based on the work they are doing withactuarieslookingatcurrentnumbersofbeneficiariesandassumptionsaboutthefuture(IPC,2015)

Navigating Change: A Review of the UK Maritime Welfare Charity Sector | 2017 31
1 .1 .3 .3 FF DEPENDANTS
The number of older adult FF dependants was hugely under-estimated in 200759. Updated figures show that there were over 50,000 older adults FF dependants in 2015 (rather than 15-17,000). Revised estimates also show that this population will increase slightly to 2020 (from 50,400 to 50,760), rather than decreasing as previous figures showed.
The number of dependent FF children was likewise under-estimated and in 2015 stood at nearly 26,000 (rather than the 10-12,000 estimated in 2007). Numbers of dependent children are projected to decline until 2035 before rising gradually to 205060.
1.1 .4 YOUNG PEOPLE IN MARITIME YOUTH ORGANISATIONS
The Ministry of Defence sponsors and supports four Cadet Forces: the community cadets (Sea Cadet Corps, Army Cadet Force and Air Training Corps) and the school-based Combined Cadet Force (containing one or more sections from the Royal Navy, Royal Marines, Army or Royal Air Force).
Numbers of Cadets in the Combined Cadet Forces Naval Service increased slightly, from 5,250 in 2005 to 5,460 in 2015 (from a high of 5,660 in 2010)61.
In 2015, the total number of Sea Cadets in the Community Cadet Forces had increased by 1,430 since 2005 to a total of 13,710 in 2015. The rate of growth increased from 3.6% between 2005 and 2010 to 7.8% between 2010 and 2015. A total of 5,230 adult instructional volunteers, plus 2,510 unit trustees and 1,610 unit assistants helped to maintain the Sea Cadet Force in 201562.
In 2011, the Marine Society and Sea Cadets charity carried out a wide-ranging review into their future direction. The result was a vision and five-year strategy for the period 2012-17, including aims such as ‘enriching the Sea Cadet experience’ by making it ‘more attractive and accessible’, better ‘supporting volunteers’ and ‘growing seafarer learning opportunities’63.
In reviewing this strategy, MSSC also looked closely at Government policy in respect of local communities (‘Big Society’) and youth (‘Positive for Youth’), together with Ministerial reviews (‘A vision for youth social action by 2020’) and the MOD ‘Youth Engagement Review’.
The Marine Society and Sea Cadets charity is currently engaged in three Government programmes to help inspire young people:
• Social Inclusion Plan - Working with the Department for Communities and Local Government to add 1,136 Sea Cadets and 244 volunteers in 40 units in priority areas.
• Safer London Foundation - This Mayor of London initiative aims to increase young people and community volunteers engaged in structured youth activity, with a target of adding 100 volunteers and 370 cadets in London units.
• Cadet Expansion Programme - Working with the Department for Education and Ministry of Defence to open 100 cadet units in state schools across England.
Sea Cadet numbers have shown positive growth over the last five years in contrast to the Army Cadets, Air Cadets and the Combined Cadet Forces.
In the United Kingdom, there are approximately 400 Sea Scout Groups, of which about 25% (101 Groups) are recognised by the Royal Navy.
59 Due to a lack of available data at that time60 IPC (2015). See Methodology for further details on data assumptions made in these estimates61 MoD(2015a).Dataoncadetsarederivedfromthe‘WESTIMINISTER’managementinformationsystem.62 Personal communication from MSSC, May 201763 MSSC Annual Report and Accounts 2016

Navigating Change: A Review of the UK Maritime Welfare Charity Sector | 2017 32
1.2 CONCLUSIONS
The revised demographics suggest that the projected increase in numbers of older MN and FF groups (particularly the over-75s and over-85s) will put extra strain on support services as this age group generally require more care.
This implies the need for a shift in focus for the maritime charity sector away from the spotlight on veterans from the Naval Service who have been the focus of support since the World Wars, and towards the Merchant Navy and Fishing Fleet groups. This is not to say that RNRM seafarers and dependants do not have needs to be met, but more that the focus of support which maritime welfare charities can offer may, where possible, need to shift in the light of the changing demographics, from RNRM to MN and FF. This may be easier for those charities with a remit and focus across the whole maritime sector and supporting beneficiaries from across the RNRM, MN and FF spectrum.
The focus of charitable support will also need to adapt to the changing demographics of working seafarers, including the increasing numbers of international MN seafarers, and superyacht and cruise ship staff.
Based on numbers alone, the overall level of need for care and support will decline considerably between 2015 and 2050, although with increases in specific groups prior to this. However, other changes in the wider economy and society, for example in terms of statutory services and welfare, may contribute to a growing need for care and support among a reduced population.
Continuing increases in longevity will expand the size of all the older ex-seafarer populations. And while further changes in pension age could reduce the need for support in old age if healthy workers are able to keep earning longer, this might also increase the need for support for those unable to benefit from such an amendment. Other changes in health and social care policy and provision will also affect levels and type of need in unknown ways64. The potential support required from maritime welfare charities is dealt with in the next section of the report.
The future holds a great many unknowns, just one example of which is Brexit, which may have untold impact on UK defence, shipping and fishing and which will require flexibility and agility in adapting support provision to fit.
The maritime charity sector needs to be prepared for the changing demographics of the seafaring community, and establish whether the support they offer reflects these demands.
64 IPC (2015)

Navigating Change: A Review of the UK Maritime Welfare Charity Sector | 2017 33
TW
O

Navigating Change: A Review of the UK Maritime Welfare Charity Sector | 2017 34
2. THE NEEDS AND ASPIRATIONS OF THE SEAFARING COMMUNITY An update
Former, older seafarers and their dependants are likely to remain the group with the highest needs (particularly those from MN/FF who are set to increase in number)
In wider UK society, those aged 65-74 are 1.7 times as likely to need support as someone aged 45–64, while those aged 75-84 require 2.5 times and those aged over 85 around three times as much primary care, so the increasing numbers of olderseafarersisasignificantfactorforcareandsupport providers long into the future
Demographically, the numbers of older former seafarers with longstanding illness, limitations with activities of daily living and dementia are expected to rise in older MN/FF and fall for RNRM
In general, particularly in later life, seafarers from the Fishing Fleet have more and greater needs, followed by MN seafarers and their families, with those from the RNRM reporting the fewest issues requiring support from MWCs
Loneliness and isolation are a greater problem in 2015 than in 2007, and particularly amongst older seafarers and dependants, and those from the Fishing Fleet
Since 2007, the proportion of older seafarers and theirdependantswhofinditdifficulttomakeendsmeetfinanciallyhasremainedatsimilarlevels,butthere has been a sharp fall in the level of savings, potentially leaving individuals in a more vulnerable position
Support,adviceandassistancerelatingtofinancesand housing remain the most important services requested by older seafarers and their families
WHILE THE OVERALL PICTURE OF SEAFARERS’ NEEDS REMAINS SIMILAR TO TEN YEARS AGO, SOME GROUPS OF BENEFICIARIES REQUIRE GREATER SUPPORT AND MAY HAVE MORE COMPLEX NEEDS – PARTICULARLY OLDER MN/FF SEAFARERS AND THEIR DEPENDANTS
KEY POINT 2

Navigating Change: A Review of the UK Maritime Welfare Charity Sector | 2017 35
More support will be needed in the next 10-20 years around financial issues, loneliness and isolation, dementia, limitations with daily living and longstanding illness, with older MN/FF beneficiaries in particular having greater need than previously predicted

Navigating Change: A Review of the UK Maritime Welfare Charity Sector | 2017 36
There was a consensus among most interviewees that seafaring was not a healthy way of life, with the main lifestyle hazards being: alcohol, smoking, drugs, lack of exercise and poor fitness, poor diet, isolation, loneliness and boredom. Research shows that prolonged absence from home causes problems in maintaining family relationships, and that relationship breakdowns may be higher for seafarers.
Thomas, M., Seafarers International Research Centre, ‘Lost at sea and lost at home. The predicament of seafaring families’, 2003
Not all seafarers and their dependants require charitable support. ‘Supporting Seafarers’ (2007) estimated that around half of the UK seafaring community would have needs that maritime welfare charities could meet or alleviate, in addition to the foreign seafarers visiting UK ports. Some groups of seafarers will be much more likely to require support than others; including the elderly, and particularly those from the MN and FF workforce sectors.
The 2007 research identified a number of specific needs in the seafaring community which differ from other occupational communities. Broadly these were:
• Health and wellbeing
o greater isolation
o a higher incidence of ill-health
o a higher incidence of bereavement and need for support, especially among younger dependants and families
o a greater need for support with family or relationship issues, especially among younger adults
• Money
o lower incomes
o poor pension provision
o a higher incidence of debt, especially among younger people
o a higher incidence of poverty among older people, families and children
• Housing
o a lack of access to long-term housing/accommodation, especially for single seafarers
o the need for seafarer-specific housing for older seafarers
While these needs have remained broadly the same, it is likely that over the last decade the needs of seafarers (both working age and older), their dependants and families, will have been affected by a huge array of factors. These include occupational, demographic and societal changes, and the upheaval wrought by the economic downturn, public sector austerity measures, welfare reform, and other policy changes in health, housing, education and social care.
Ten years on, updated research in 2015/16 focussed on the two groups felt to have the greatest and least well understood needs: former and older seafarers, and seafarers’ dependants and families (both working age and over retirement)65.
65 ORS (2016), IPC (2016)

Navigating Change: A Review of the UK Maritime Welfare Charity Sector | 2017 37
Broadly, these studies found (compared to ten years ago):
• Similar levels of long-term illness and limitations with Activities of Daily Living66 (ADL) amongst seafarers and dependants
• Increasing levels of social isolation and dementia in line with the general population
• Varying levels of individual and household poverty (with FF, female seafarers and female dependants of seafarers faring worst, and RNRM faring best)
• A similar level of sheltered housing occupation and a growing desire amongst seafarers and their dependants to remain in their own homes
• Lower levels of need relating to home help, medical support, community alarm services and mobility support, but similar levels of need for social support
• Similar low levels of awareness of maritime charities and a desire for more information about the services and support on offer
• Increased use of the internet amongst working age seafarers and dependants, but not for older
generations who still rely on more traditional methods.
2.1 HEALTH AND WELLBEING
Working at sea is one of the most hazardous occupations, presenting specific health and safety concerns for working seafarers that are often long term and also affect their families67, including:
• Long and unsociable working hours
• Exposure to toxic and carcinogenic materials that are responsible for many chronic illnesses
• Physical hazards on board ship include noise, vibration, excessive heat and cold and harmful radiation from the sun; and seafarers are particularly prone to back injuries, affected by the motion of the ship
• An unhealthy lifestyle, including: alcohol, smoking, drugs, lack of exercise and poor fitness, poor diet, isolation, loneliness and boredom
• Mental health problems related to the conditions of on-board life, as well as prolonged absence from home, and high levels of stress associated with poor sleep quality, noise and workload
Research found that the main health and welfare issues for older seafarers and their dependants were loneliness and isolation, alcohol dependency, longstanding illness and limitations with Activities of Daily Living, and dementia.
66 Definedasroutineactivitiesthatpeopletendtobeabletoperformunaided:eating,bathing,dressing,toileting,walkingandcontinence67 Mackay and Wright (2008)

Navigating Change: A Review of the UK Maritime Welfare Charity Sector | 2017 38
2.1 .1 LONELINESS AND ISOLATION
Social isolation is as potent a cause of early death as smoking 15 cigarettes a day; loneliness, research suggests, is twice as deadly as obesity. Dementia, high blood pressure, alcoholism and accidents – all these, like depression, paranoia, anxiety and suicide, become more prevalent when connections are cut. We cannot cope alone.
George Monbiot, The Guardian, 2014
Social isolation is becoming a factor of modern living in the UK which is experienced even more keenly by seafarers and their families. The research shows that dependants of working age seafarers feel that they lack companionship even more than the individual seafarers themselves68.
In older age, seafarers may feel greater isolation after leaving work at sea, and receive less support from family carers than older people in other occupational groups69. Many recently retired seafarers report missing
the close companionship they experienced during service at sea70.
Older former seafarers and their dependants feel more isolated than ten years ago, with a fifth or more of older seafarers and their dependants feeling that they lack companionship (30%), feel left out (22%) and isolated (20%) at least some of the time, compared with 20% a decade ago71 who felt more isolated after they retired. Although there was little difference between age groups, those who suffer from long-term illnesses/disabilities, are separated or divorced and who are in social rented and sheltered accommodation are all more likely to experience feelings of loneliness and isolation.
Older former FF feel more lonely and isolated than MN and RNRM72. This stands in contradiction to the findings of the 2007 research which found that older fishermen felt less isolated and found the transition to retirement less difficult than other seafarers. This is likely due to the wider dispersal of fishing and the decline of longstanding fishing ports, as well as the increased likelihood of feeling a lack of adequate social support found in more deprived areas where FF families are more likely to live73.
The isolation felt by older people in the seafaring community is comparable with levels in wider society - Age UK found that 10% of people aged 65 and over felt lonely always or often74, compared to the 10% of dependants in this age group who lack companionship (10%), feel left out (7%) and isolated (6%) always or often75.
68 ORS (2016)69 Maritime Charities Funding Group (2007)70 ORS (2016)71 Ibid72 Ibid73 PublicHealthEngland(PHE,2015),TheMarmotReviewTeam(2010)74 Age UK (2014) in ORS (2016)75 ORS (2016)
You feel like you’ve got no friends and nobody wants to know you. We did go to Stroke club but (my husband) didn’t want to go to the meetings… We do go out for meals and we have a little social drink with friends - but I don’t think I can go out of a night time.
Wife and full-time carer of Fishing Fleet Crewman who suffered a severe stroke, (ORS, 2016)
It’s difficult when you come home and the people you were quite close to are miles away. You actually don’t end up with much male friendship or companionship. I don’t know about individual companies, but mine – it was very good to work for – but when you retire, the contact with them is finished. No further dealings with them … They have no reason to get in touch with you.
Merchant Navy Officer (ORS,2016)

Navigating Change: A Review of the UK Maritime Welfare Charity Sector | 2017 39
KEEPING IN TOUCH
Naturally, being able to keep in touch with others, particularly in the seafaring community, has an impact on the levels of isolation felt. The 2007 research recommended that maritime charities should consider how best to support practical initiatives that may facilitate social inclusion and contact with and between former and older seafarers, including the development of ‘befriending’ schemes, use of internet-based approaches, support for social events or reunions and the provision of services that are specific or sensitive to seafarers.
The updated research76 found little support for a telephone befriending scheme except amongst a minority of non-white older seafarers and their dependants, those providing unpaid care and those aged between 60-64. This is despite, or perhaps because of, the success of the Seafarers’ Link scheme run by Community Network and funded by Seafarers UK and Greenwich Hospital. The Seafarers’ Link scheme was set up in response to the 2007 findings, in 200877. ‘Talking Communities telephone friendship groups’ allow isolated former seafarers aged over 50, and their dependants, to connect or reconnect with others who have had seafaring lifestyles. An evaluation of the service in 2014/15 found that: ‘The groups recreated a sense of team spirit that was reminiscent of life on board, as well as reflecting critically about working conditions and hardships they had experienced.’ The ‘talking support’ was felt to have ‘undoubted health benefits’ for participants in creating a sense of wellbeing and companionship, and providing a space for reciprocal airing of health concerns78. The ORS (2016) survey findings perhaps reflect the conundrum voiced in the evaluation around the difficulty of reaching isolated individuals.
While 54% of all older seafarers and their dependants access the internet, this is higher amongst former RNRM (82%), compared with 57% of MN and just 32% of former FF, meaning that any support targeted at this latter group should not be primarily internet-based. For comparison, 32% of all UK adults aged 65 and over
have never used the internet79 compared to 49% in the survey sample.
The 2007 research also recommended that social inclusion initiatives should be targeted at older MN and RNRM seafarers, based on the demographic projections and findings at that time. The updated research suggests that this focus needs to be directed more at MN and FF. Participants in the research suggested that maritime charities might help to train people in computer use and/or help them to purchase computers so that they can become more connected and informed80.
Getting out and about under your own steam can also provide vital links with a community, and while more former seafarers are able to do this using their own car in 2015 (70%) compared to 2006 (56%), the majority of these are RNRM (85%), with 76% of MN and just 57% of FF being able to do so. Former FF are more likely to have to rely on buses, taxis, bicycles or boats to get around81. As seafarers get older, they are increasingly unlikely to drive themselves. Transport has been found to be a vital link in keeping communities together, especially for older age groups82.
76 ORS (2016)77 Maritime Charities Funding Group (2007)78 Rance and Westlake (2015)79 ONS (2015b)80 ORS (2016)81 Ibid82 See e.g. Walker (2016)
Being aware that there is this body of retired seafarers who lead quite lonely lives… I think there should be a recognition of this … Using some contact or at least a package of information from the HR department, which charities could use to establish some sort of communication … The only thing I can think of is the Nautical Institute, which is a professional body – they have an office and some people get interested in that.
Merchant Navy Officer (ORS, 2016)

Navigating Change: A Review of the UK Maritime Welfare Charity Sector | 2017 40
2.1 .2 ALCOHOL AND DRUG DEPENDENCY
Alcohol use has often been seen as an issue for seafaring populations, with an occupational propensity for seafarers to be mostly dry at sea, but tending to excess while ashore83. In fact, binge drinking has been identified as being more prevalent in the RN than in the general population84, while MN seafarers have been found to have higher mortality from cancers, cirrhosis, pancreatic and other alcohol-related diseases than the general population85. There is some evidence that drug dependency is also a problem among some fishing communities in Scotland86. While some feel that these habits have changed in recent years, a new study of alcohol usage in the UK Armed Forces by the Ministry of Defence87 found significantly higher risk of alcohol related harm in the Naval Service, with 64% of the sample potentially at increasing or higher risk, compared to 61% in the RAF and 56% in the Army.
Projected figures using general population prevalence rates estimate that, in line with the seafaring population forecast, the number of over 65 former MN and FF seafarers with alcohol-related issues is set to rise to a peak in 2020 before falling (whilst RNRM has already peaked)88.
FIGURE 2.1Predicted numbers of seafarers with alcohol dependency issues, 2013-2050
83 Henderson, Langston and Greenberg, KCL (2009)84 Ibid85 Mackay and Wright (2008) 86 Williams, R. (2008) quoted in IPC (2015)87 Ministry of Defence (2017). Sample of 109,459 Regular Armed Forces personnel (74% of all Service personnel)88 IPC (2015)
2.1
0
5,000
10,000
15,000
20,000
25,000
30,000
35,000
2015 2020 2025 2030 2035 2040 2045 2050
RNRM
Under 65 65+ Total
0
2,000
4,000
6,000
8,000
10,000
12,000
14,000
16,000
2015 2020 2025 2030 2035 2040 2045 2050
MN
Under 65 65+ Total
0
2,000
4,000
6,000
8,000
10,000
2015 2020 2025 2030 2035 2040 2045 2050
FF
Under 65 65+ Total
N
year
2.1
0
5,000
10,000
15,000
20,000
25,000
30,000
35,000
2015 2020 2025 2030 2035 2040 2045 2050
RNRM
Under 65 65+ Total
0
2,000
4,000
6,000
8,000
10,000
12,000
14,000
16,000
2015 2020 2025 2030 2035 2040 2045 2050
MN
Under 65 65+ Total
0
2,000
4,000
6,000
8,000
10,000
2015 2020 2025 2030 2035 2040 2045 2050
FF
Under 65 65+ Total
N
year

Navigating Change: A Review of the UK Maritime Welfare Charity Sector | 2017 41
FIGURE 2.1 CONT.
TABLE 2.1Proportion of seafarers with self-reported alcohol dependancy issues compared with population estimates
Royal Navy / Royal Marines
Merchant Navy
Fishing Fleet
Predicted proportion according to general population estimates
9% 9% 9%
Proportion of beneficiary population reporting issues
2% <1% 1%
A recent survey of the beneficiary population has shown however that the proportion of former seafarers reporting an alcohol problem is lower than the population estimates predict (see Table 2.1)89
2.1 .3 ISSUES RELATED TO AGEING
The UK has an ageing population profile: 11.6 million people (17.8% of the population) were over 65 and 1.5 million (2.3%) were over 85 in mid-201590. Since mid-2005, the UK population aged 65 and over has increased by 21%, and the population aged 85 and over has increased by 31%, with more older males (54% increase) than females (21% increase)91. The population is projected to continue ageing: by mid-2039, more than 1 in 12 of the population is projected to be aged 80 or over92.
In addition, as the section on demographics has shown, the numbers of former and older MN and FF are going to increase over the next twenty years meaning that greater care and support will be needed for issues which affect these groups disproportionately, e.g. longstanding ill-health, limitations with ADL, in addition to the increasing prevalence of dementia across the general population, including seafarers. The primary care GP workload in the general UK population incurred by those aged over 85 is around three times that of the 45-64 age group (for those aged 75-84 it is nearly 2.5 times greater and for those aged 65-75 it is 1.7 times greater)93. While over twice as much is spent per head in the general population on mental health issues for the over 80s as for those in their 50s or 60s94.
89 ORS(2016).Notethattherelativemeritsoftargeted(althoughnotrepresentative)surveydatawiththebeneficiarypopulationandestimatescalculatedfromprevalenceratesobservedinthegeneralpopulationareupfordebate,andtherealfiguresprobablyliesomewherebetweenthetwo(possiblynearerthesurveyfigure).Thesediscrepanciesmaypointtorealdifferencesbetweentheseafaringbeneficiarypopulationandthegeneralpublicatlarge
90 ONS (2015a)91 Ibid92 ONS (2014)93 Department of Health (2011). Table 12.94 Department of Health (2011). Table 4.
2.1
0
5,000
10,000
15,000
20,000
25,000
30,000
35,000
2015 2020 2025 2030 2035 2040 2045 2050
RNRM
Under 65 65+ Total
0
2,000
4,000
6,000
8,000
10,000
12,000
14,000
16,000
2015 2020 2025 2030 2035 2040 2045 2050
MN
Under 65 65+ Total
0
2,000
4,000
6,000
8,000
10,000
2015 2020 2025 2030 2035 2040 2045 2050
FF
Under 65 65+ Total
N
year
2.1
0
5,000
10,000
15,000
20,000
25,000
30,000
35,000
2015 2020 2025 2030 2035 2040 2045 2050
RNRM
Under 65 65+ Total
0
2,000
4,000
6,000
8,000
10,000
12,000
14,000
16,000
2015 2020 2025 2030 2035 2040 2045 2050
MN
Under 65 65+ Total
0
2,000
4,000
6,000
8,000
10,000
2015 2020 2025 2030 2035 2040 2045 2050
FF
Under 65 65+ Total

Navigating Change: A Review of the UK Maritime Welfare Charity Sector | 2017 42
2.1 .4 LONG-STANDING ILLNESS AND LIMITATIONS WITH ACTIVITIES OF DAILY LIVING (ADL)
In 2015, one quarter (25%) of all dependants of working age seafarers had either themselves or a child with a long-standing illness, disability or infirmity that had troubled them over a period of at least 12 months95. Among those who had ever applied to a maritime charity for support or help, this proportion rose to 46%. The research found that this figure is about four times higher than the proportion of people receiving the care element of Disability Living Allowance (DLA) indicating that there may be scope to increase the claiming of disability benefits by beneficiaries and potential beneficiaries96.
The research with older former seafarers and their dependants97 has found that the three most common illnesses among respondents are heart, blood pressure or blood circulation problems (54%), muscular or skeletal conditions (41%) and poor hearing or deafness (28%).
Seafarers from the Merchant Navy were slightly more likely to report better health out of the three services, with a larger proportion stating that they do not have any illnesses or disabilities (21% vs 16% RNRM and 8% FF). Conversely, those from the Fishing Fleets were in the poorest health, and were more likely to have five of the 15 illnesses listed than those from the other two seafaring groups. Older seafarers, aged 80 or over, and their dependants have more disabilities and long-term illnesses than other age groups.
As a broad, indicative comparison with the general population, the ONS 2011 census shows that just over half (52%) of those aged 65 and over have a long-term health problem or disability which limits their daily activities98. The percentage of older seafarers and dependants with mobility and/or dexterity problems has increased markedly over the last decade (58% in 2015 vs 38% in 2006); the percentage with depression and neurological or other mental health disorders have also increased (14% vs 9%); while the proportion with poor eyesight or hearing loss had decreased compared with ten years ago99.
Using total English population prevalence rates, it has been estimated that there were nearly 110,000 former RNRM personnel, over 34,500 former MN seafarers and over 22,100 estimated former FF seafarers aged 65 and above with a limiting long-standing illness in 2013/14100. The projected trajectories of these three populations are very different however, with former RNRM seafarers with longstanding illnesses reducing by more than 40% by 2030, while numbers of former MN and FF aged over 65 are projected to rise to a peak in 2020, those aged over 75 will peak in 2025, and those aged 85 and over are projected to peak in the 2030s before declining more gradually - see Figure 2.2.
There is a similar story with the estimated numbers of former seafarers over 65 experiencing limitations with activities of daily living, with former RNRM estimated at over 66,000 in 2015 (with more than half of these aged 80 and over), over 20,500 MN, and over 29,000 FF. Again, in line with overall population projections, the numbers of RNRM with ADL limitations have already peaked, whilst MN and FF aged over 65 with ADL limitations will peak in the 2020s, those aged over 75 will peak in 2025 and those aged 85 plus with ADL limitations will peak in the 2030s.
95 IPC (2016)96 Ibid97 ORS (2016). 922 older seafarers (over 60) and dependants took part by means of 872 completed postal questionnaires and 50 telephone interviews. 81% of survey
respondentsand60%(30/50)ofthetelephoneintervieweeswereseafarers.Itshouldbenotedthatfouroutofthefivemajorseafaringcharities/organisationswereresponsible for distributing their own questionnaires to an unknown sample of their members, therefore it is important to recognise that the results will not necessarily provide a representative cross-section of views. Comparisons are made with a similar survey carried out by ORS in 2006 for MCFG ‘Supporting Seafarers’ (2007); changes inresponsesbetweenthisyear’ssurveyandprevioussurveys,andbetweendifferentgroups,areindicativeonly(i.e.differencesarenotstatisticallysignificant)
98 ONS (2001) quoted in ORS (2016)99 ORS (2016)100 There are no available estimates of former seafarers with longstanding illness, therefore IPC (2015) estimates use projected distribution according to the English
Longitudinal Study of Ageing (wave 5). Figures are likely to be slight under-estimates due to using the prevalence rates for men (women have higher prevalence of limitinglong-standingillnesses,andformaround9%ofthecurrentRNRMworkforce).Baselinefiguresrelateto2014forRNRMand2013forMNandFF

Navigating Change: A Review of the UK Maritime Welfare Charity Sector | 2017 43
FIGURE 2.2Projected estimates of numbers of former and older seafarers with longstanding illness and limitations with activities of daily living (ADL)
Royal Navy / Royal Marines
Merchant Navy
2.2
0
20,000
40,000
60,000
80,000
100,000
120,000
2015 2020 2025 2030 2035 2040 2045 2050
RNRM long-standing illness
65+ 75+ 85+ Total
0
10,000
20,000
30,000
40,000
50,000
60,000
70,000
2015 2020 2025 2030 2035 2040 2045 2050
RNRM ADL limitations
65+ 75+ 85+ Total
0
10,000
20,000
30,000
40,000
50,000
2015 2020 2025 2030 2035 2040 2045 2050
MN long-standing illness
65+ 75+ 85+ Total
0
5,000
10,000
15,000
20,000
25,000
30,000
2015 2020 2025 2030 2035 2040 2045 2050
MN ADL limitations
65+ 75+ 85+ Total
0
5,000
10,000
15,000
20,000
25,000
30,000
35,000
2015 2020 2025 2030 2035 2040 2045 2050
FF long-standing illness
65+ 75+ 85+ Total
0 2,000 4,000 6,000 8,000
10,000 12,000 14,000 16,000 18,000
2015 2020 2025 2030 2035 2040 2045 2050
FF ADL limitations
65+ 75+ 85+ Total
2.2
0
20,000
40,000
60,000
80,000
100,000
120,000
2015 2020 2025 2030 2035 2040 2045 2050
RNRM long-standing illness
65+ 75+ 85+ Total
0
10,000
20,000
30,000
40,000
50,000
60,000
70,000
2015 2020 2025 2030 2035 2040 2045 2050
RNRM ADL limitations
65+ 75+ 85+ Total
0
10,000
20,000
30,000
40,000
50,000
2015 2020 2025 2030 2035 2040 2045 2050
MN long-standing illness
65+ 75+ 85+ Total
N
year
2.2
0
20,000
40,000
60,000
80,000
100,000
120,000
2015 2020 2025 2030 2035 2040 2045 2050
RNRM long-standing illness
65+ 75+ 85+ Total
0
10,000
20,000
30,000
40,000
50,000
60,000
70,000
2015 2020 2025 2030 2035 2040 2045 2050
RNRM ADL limitations
65+ 75+ 85+ Total
0
10,000
20,000
30,000
40,000
50,000
2015 2020 2025 2030 2035 2040 2045 2050
MN long-standing illness
65+ 75+ 85+ Total
N
year
N
year
N
year
0
5,000
10,000
15,000
20,000
25,000
30,000
2015 2020 2025 2030 2035 2040 2045 2050
MN ADL limitations
65+ 75+ 85+ Total
0
5,000
10,000
15,000
20,000
25,000
30,000
35,000
2015 2020 2025 2030 2035 2040 2045 2050
FF long-standing illness
65+ 75+ 85+ Total
0 2,000 4,000 6,000 8,000
10,000 12,000 14,000 16,000 18,000
2015 2020 2025 2030 2035 2040 2045 2050
FF ADL limitations
65+ 75+ 85+ Total
0
5,000
10,000
15,000
20,000
25,000
30,000
2015 2020 2025 2030 2035 2040 2045 2050
MN ADL limitations
65+ 75+ 85+ Total
0
5,000
10,000
15,000
20,000
25,000
30,000
35,000
2015 2020 2025 2030 2035 2040 2045 2050
FF long-standing illness
65+ 75+ 85+ Total
0 2,000 4,000 6,000 8,000
10,000 12,000 14,000 16,000 18,000
2015 2020 2025 2030 2035 2040 2045 2050
FF ADL limitations
65+ 75+ 85+ Total

Navigating Change: A Review of the UK Maritime Welfare Charity Sector | 2017 44
FIGURE 2.2 CONT.
Fishing Fleet
However, these numbers may be under-estimates. Survey research with the beneficiary population has found that 84% of RNRM respondents aged 60 and over report that they are currently living with at least one illness or disability that affects their everyday life101, compared with the population prevalence rate estimates above (which predict 40% have longstanding illness and 25% with ADL limitations). Similarly, the survey finds that 79% of MN and 92% of FF aged over 60 reported that they are currently living with at least one illness or disability that affects their everyday life, compared to the population estimates (37% of MN and FF predicted to have longstanding illness and 22% of MN and FF predicted to have ADL limitations)102.
2.1 .5 DEMENTIA
One of the issues that an ageing population brings is increasing rates of dementia: over 850,000 people in the UK currently have some form of dementia, with numbers set to rise to over 1 million by 2021, and soaring to 1.7 million by 2050. Dementia is one of the main causes of disability later in life, ahead of cancer, cardiovascular disease and stroke. Dementia affects 1 in every 14 people over 65 (1 in 25 aged 70-79 and 1 in 6 people aged over 80)103. In the last decade (2007-2015) the number of people with dementia has increased by 166,000 (24%)104.
There are an estimated 23,500 former RNRM seafarers, 5,300 former MN seafarers and 3,400 former FF seafarers with dementia in 2013/14105. Due to the differing demographic profiles of the three different workforces, numbers of former RNRM with dementia have already peaked while numbers of former MN and FF are set to peak in 2025, with those aged over 75 peaking in 2030, and those aged over 85 peaking in 2035.
101 ORS (2016). Including limitations with Activities of Daily Living. A previous survey in 2006 asking the same question resulted in 88% of respondents reporting living with at leastoneillnessordisabilitythataffectstheireverydaylife
102 Ibid.103 Alzheimer’s Research Trust and The Dementia Stats Hub (accessed 2/5/2017)104 Alzheimer’s Society (2014)105 IPC(2015).Therearenoavailableestimatesofformerseafarerswithdementia,thereforeIPC(2015)estimatesarebasedontheage-specificratesfromtheEuropean
CommunityConcertedActionontheEpidemiologyandPreventionofDementia(EURODEM)study.Theratesformenhavebeenused.Baselinefiguresrelateto2014forRNRM and 2013 for MN and FF
0
5,000
10,000
15,000
20,000
25,000
30,000
2015 2020 2025 2030 2035 2040 2045 2050
MN ADL limitations
65+ 75+ 85+ Total
0
5,000
10,000
15,000
20,000
25,000
30,000
35,000
2015 2020 2025 2030 2035 2040 2045 2050
FF long-standing illness
65+ 75+ 85+ Total
0 2,000 4,000 6,000 8,000
10,000 12,000 14,000 16,000 18,000
2015 2020 2025 2030 2035 2040 2045 2050
FF ADL limitations
65+ 75+ 85+ Total
0
5,000
10,000
15,000
20,000
25,000
30,000
2015 2020 2025 2030 2035 2040 2045 2050
MN ADL limitations
65+ 75+ 85+ Total
0
5,000
10,000
15,000
20,000
25,000
30,000
35,000
2015 2020 2025 2030 2035 2040 2045 2050
FF long-standing illness
65+ 75+ 85+ Total
0 2,000 4,000 6,000 8,000
10,000 12,000 14,000 16,000 18,000
2015 2020 2025 2030 2035 2040 2045 2050
FF ADL limitations
65+ 75+ 85+ Total
N
year
N
year
0
5,000
10,000
15,000
20,000
25,000
30,000
2015 2020 2025 2030 2035 2040 2045 2050
MN ADL limitations
65+ 75+ 85+ Total
0
5,000
10,000
15,000
20,000
25,000
30,000
35,000
2015 2020 2025 2030 2035 2040 2045 2050
FF long-standing illness
65+ 75+ 85+ Total
0 2,000 4,000 6,000 8,000
10,000 12,000 14,000 16,000 18,000
2015 2020 2025 2030 2035 2040 2045 2050
FF ADL limitations
65+ 75+ 85+ Total
0
5,000
10,000
15,000
20,000
25,000
30,000
2015 2020 2025 2030 2035 2040 2045 2050
MN ADL limitations
65+ 75+ 85+ Total
0
5,000
10,000
15,000
20,000
25,000
30,000
35,000
2015 2020 2025 2030 2035 2040 2045 2050
FF long-standing illness
65+ 75+ 85+ Total
0 2,000 4,000 6,000 8,000
10,000 12,000 14,000 16,000 18,000
2015 2020 2025 2030 2035 2040 2045 2050
FF ADL limitations
65+ 75+ 85+ Total

Navigating Change: A Review of the UK Maritime Welfare Charity Sector | 2017 45
The total number of former MN with dementia is projected to peak in 2025 at nearly 7,500 (nearly 40% above the current level), before falling to 3,100 in 2050 (while the number of former MN seafarers with dementia aged 85 and over is projected to peak in 2035 at 3,700 before falling to less than 2,100 in 2050, reflecting the passage of the cohort through time). Similarly, the total number of former FF with dementia is projected to peak in 2025 at around 4,700, before falling steeply to just below 2,000 in 2050, (while the numbers of former FF seafarers with dementia aged 85 and over is projected to continue increasing steadily to 2030-35 to over 2,200 before falling to less than half that number in 2050).
FIGURE 2.3Projected estimates of numbers of former older seafarers with dementia2.3
0
5,000
10,000
15,000
20,000
25,000
2015 2020 2025 2030 2035 2040 2045 2050
RNRM
75+ 85+ Total
0
1,000
2,000
3,000
4,000
5,000
6,000
7,000
8,000
2015 2020 2025 2030 2035 2040 2045 2050
MN
75+ 85+ Total
0
1000
2000
3000
4000
5000
2015 2020 2025 2030 2035 2040 2045 2050
FF
75+ 85+ Total
2.3
0
5,000
10,000
15,000
20,000
25,000
2015 2020 2025 2030 2035 2040 2045 2050
RNRM
75+ 85+ Total
0
1,000
2,000
3,000
4,000
5,000
6,000
7,000
8,000
2015 2020 2025 2030 2035 2040 2045 2050
MN
75+ 85+ Total
0
1000
2000
3000
4000
5000
2015 2020 2025 2030 2035 2040 2045 2050
FF
75+ 85+ Total
2.3
0
5,000
10,000
15,000
20,000
25,000
2015 2020 2025 2030 2035 2040 2045 2050
RNRM
75+ 85+ Total
0
1,000
2,000
3,000
4,000
5,000
6,000
7,000
8,000
2015 2020 2025 2030 2035 2040 2045 2050
MN
75+ 85+ Total
0
1000
2000
3000
4000
5000
2015 2020 2025 2030 2035 2040 2045 2050
FF
75+ 85+ Total
N
year
2.3
0
5,000
10,000
15,000
20,000
25,000
2015 2020 2025 2030 2035 2040 2045 2050
RNRM
75+ 85+ Total
0
1,000
2,000
3,000
4,000
5,000
6,000
7,000
8,000
2015 2020 2025 2030 2035 2040 2045 2050
MN
75+ 85+ Total
0
1000
2000
3000
4000
5000
2015 2020 2025 2030 2035 2040 2045 2050
FF
75+ 85+ Total
2.3
0
5,000
10,000
15,000
20,000
25,000
2015 2020 2025 2030 2035 2040 2045 2050
RNRM
75+ 85+ Total
0
1,000
2,000
3,000
4,000
5,000
6,000
7,000
8,000
2015 2020 2025 2030 2035 2040 2045 2050
MN
75+ 85+ Total
0
1000
2000
3000
4000
5000
2015 2020 2025 2030 2035 2040 2045 2050
FF
75+ 85+ Total
2.3
0
5,000
10,000
15,000
20,000
25,000
2015 2020 2025 2030 2035 2040 2045 2050
RNRM
75+ 85+ Total
0
1,000
2,000
3,000
4,000
5,000
6,000
7,000
8,000
2015 2020 2025 2030 2035 2040 2045 2050
MN
75+ 85+ Total
0
1000
2000
3000
4000
5000
2015 2020 2025 2030 2035 2040 2045 2050
FF
75+ 85+ Total
N
year
N
year
2.3
0
5,000
10,000
15,000
20,000
25,000
2015 2020 2025 2030 2035 2040 2045 2050
RNRM
75+ 85+ Total
0
1,000
2,000
3,000
4,000
5,000
6,000
7,000
8,000
2015 2020 2025 2030 2035 2040 2045 2050
MN
75+ 85+ Total
0
1000
2000
3000
4000
5000
2015 2020 2025 2030 2035 2040 2045 2050
FF
75+ 85+ Total
2.3
0
5,000
10,000
15,000
20,000
25,000
2015 2020 2025 2030 2035 2040 2045 2050
RNRM
75+ 85+ Total
0
1,000
2,000
3,000
4,000
5,000
6,000
7,000
8,000
2015 2020 2025 2030 2035 2040 2045 2050
MN
75+ 85+ Total
0
1000
2000
3000
4000
5000
2015 2020 2025 2030 2035 2040 2045 2050
FF
75+ 85+ Total
2.3
0
5,000
10,000
15,000
20,000
25,000
2015 2020 2025 2030 2035 2040 2045 2050
RNRM
75+ 85+ Total
0
1,000
2,000
3,000
4,000
5,000
6,000
7,000
8,000
2015 2020 2025 2030 2035 2040 2045 2050
MN
75+ 85+ Total
0
1000
2000
3000
4000
5000
2015 2020 2025 2030 2035 2040 2045 2050
FF
75+ 85+ Total
2.3
0
5,000
10,000
15,000
20,000
25,000
2015 2020 2025 2030 2035 2040 2045 2050
RNRM
75+ 85+ Total
0
1,000
2,000
3,000
4,000
5,000
6,000
7,000
8,000
2015 2020 2025 2030 2035 2040 2045 2050
MN
75+ 85+ Total
0
1000
2000
3000
4000
5000
2015 2020 2025 2030 2035 2040 2045 2050
FF
75+ 85+ Total
2.3
0
5,000
10,000
15,000
20,000
25,000
2015 2020 2025 2030 2035 2040 2045 2050
RNRM
75+ 85+ Total
0
1,000
2,000
3,000
4,000
5,000
6,000
7,000
8,000
2015 2020 2025 2030 2035 2040 2045 2050
MN
75+ 85+ Total
0
1000
2000
3000
4000
5000
2015 2020 2025 2030 2035 2040 2045 2050
FF
75+ 85+ Total
2.3
0
5,000
10,000
15,000
20,000
25,000
2015 2020 2025 2030 2035 2040 2045 2050
RNRM
75+ 85+ Total
0
1,000
2,000
3,000
4,000
5,000
6,000
7,000
8,000
2015 2020 2025 2030 2035 2040 2045 2050
MN
75+ 85+ Total
0
1000
2000
3000
4000
5000
2015 2020 2025 2030 2035 2040 2045 2050
FF
75+ 85+ Total

Navigating Change: A Review of the UK Maritime Welfare Charity Sector | 2017 46
TABLE 2.2
Proportion of seafarers with self-reported dementia compared with population estimates
Royal Navy / Royal Marines
Merchant Navy
Fishing Fleet
Predicted proportion according to general population estimates
11% 6% 6%
Proportion of beneficiary population reporting issues
4% 4% 8%
Again, the figures may be over or under-estimates, as the survey of the beneficiary population found slight differences in reported rates of dementia which might affect these figures; specifically there may be fewer RNRM and MN, and more FF with dementia than predicted106.
2.1 .6 CARERS
The trend in full-time care at home in the UK is increasing, with an estimated 1.6 million people currently providing care for 50 hours or more per week – up 33% since 2001107. About 10% of all dependants of working age seafarers stated that they had caring responsibilities for infirm or elderly adults108, while 15% of older seafarers and their dependants currently provide unpaid care for a family member or friend109. These are similar levels to those in the general UK population. Leaving work to care puts pressure on carers’ day-to-day finances and can also affect their long-term financial independence and security.
Seafarers’ carers highlighted the stresses, strains and often relentless hard work of caring, along with the failure in some cases for services to provide much-needed support. Carers felt isolated and worried about money110.
2.2 MONEY
2.2.1 INCOME
There is a prevalence of low pay in maritime jobs, and many seafarers working from UK ports survive on low incomes. Research in 2008111 identified that one in three seafarers had an income of under £10,000 a year and over two-thirds had salaries of under £30,000. Fishermen have the least satisfactory pay situation, with many reporting real falls in income in recent years. UK ratings were less satisfied than were officers with the pay they could earn and this was particularly the case for those with families. In January 2016, Crewtoo’s ‘Seafarers Happiness Index’ showed a decline in happiness with wages, with ‘reports from offshore workers of salaries slashed by up to 40%. Some respondents claimed that this is the worst time they can remember for salaries’112.
106 ORS (2016)107 IPC (2016)108 Ibid109 ORS (2016)110 Ibid.111 Mackay and Wright (2008)112 Crewtoo (2016)

Navigating Change: A Review of the UK Maritime Welfare Charity Sector | 2017 47
Nine out of ten (90%) older former seafarers and their dependants have retired from all paid work (whether at sea or in another industry), the highest proportion being FF (94%) and the lowest RNRM (87%). The research found, however, that the proportion of older seafarers and their dependants aged between 60 and 64 who are still in some form of paid employment (39%) has increased by 18% since 2006113, which probably reflects changes in pension provision and demographics. In comparison, 17% of all UK pensioners were in receipt of earnings in 2015/16114.
In 2015, the proportion of older seafarers and their dependants finding things difficult financially has remained at similar levels (23% vs 24% in 2007)115; with FF, BAME, those separated or divorced, and in social rented property more likely to find things difficult.
In contrast, since 2007 the proportion of older seafarers and their dependants who find it easy to make ends meet has increased (43% v 34% in 2007) and there has been a large drop in the percentage claiming Income Support, except among older FF seafarers and their dependants116.
Women may need more monetary help than men: just under 18% of SSAFA applicants aged 65 and over are female. This probably reflects the lower lifetime earnings of women, and therefore greater likelihood of needing financial or other support in old age117. This also applies to the dependants and families of seafarers, for example, the dependants of working age FF were less likely to be employed full-time (30%) than those of RNRM (46%) and MN (47%) seafarers.
2.2.2 PENSIONS
Many seafarers, particularly former FF and some former MN, will have limited or no occupational pension provision118. A 2015 membership survey by Nautilus International (the trade union for maritime professionals largely in the Merchant Navy) found that 60% of its members were not in a company pension scheme. In 2010, the same membership survey found that 75% of members had pension plans compared to 89% in 2001. Such falls are likely to have implications for future needs119. In addition, there has been no discretionary increase in pension payments for some time, and some seafarers will not have accrued much overall due to limited length of service, particularly ratings120. With MN officers now employed on shorter-term contracts, and the influx of younger hospitality seafarers in a similar position, this situation may worsen in future. The new industry-wide defined contribution pension scheme Ensign Retirement Plan (ERP), introduced in 2015, aims to provide an attractive option for current seafarers and raise take-up rates.
In the recent survey of former and older seafarers and their dependants, 83% received a state pension or pension credits, and just 52% received a pension from a former employer121. Since 2006 the proportion of older seafarers and their dependants who receive a pension from a former employer and earnings from employment or self-employment has increased slightly122. Despite this, more than half of older seafarers and their dependants do not have a Merchant Navy (56%) or occupational (54%) pension123. Those from the Fishing Fleets are less likely to have either of these pensions compared with MN and RNRM seafarers, as are widows and those in social rented accommodation. Just 7% of older FF seafarers report having an occupational pension, compared with 50% of MN and 81% of RNRM124. In comparison, 20% of working age people in the UK do not qualify for a Basic State Pension125.
113 ORS (2016)114 DWP (2017)115 ORS (2016)116 Ibid117 IPC (2015)118 Ibid119 Nautilus International (2010), and Nautilus International (2015). See https://nautilusint.org/en/what-we-say/nautilus-news/nautilus-takes-seafarers-views-on-pensions-to-ilo/ 120 IPC (2015)121 ORS (2016)122 Ibid123 IPC (2015)124 ORS (2016)125 Pensions Policy Institute (2017). PPI estimates derived from DWP (2013) Tabulation Tool and apply to 2011

Navigating Change: A Review of the UK Maritime Welfare Charity Sector | 2017 48
2.2.3 SAVINGS AND DEBTS
Just under two thirds (63%) of older seafarers and their dependants currently have some savings or investments (excluding the value of their property)126. There has been a sharp fall in the level of savings, however. In 2007 64% of older seafarers and their dependants had savings or investments of £6,000 or over, compared to only 44% of older seafarers and their dependants in 2015 – a markedly large decrease over ten years. Only just over two fifths (43%) of those from the Fishing Fleets have any savings or investments compared with around four fifths (81%) of those from the RNRM127. Having money saved to pay for their own funeral is a concern to some older seafarers and their dependants128.
Only 14% of older seafarers and their dependants are reported to have significant debts – the same proportion as reported in 2006 - with those from the Fishing Fleets as well as older seafarers and their dependants aged between 60 and 64, separated or divorced, and in socially rented property being more likely to have debts.
2.3 HOUSINGIn 2015, the majority of older seafarers and their dependants (53%) owned their home outright, while only 7% have a mortgage. The most popular method of renting is through a Housing Association (16%), followed by the Council (13%), private landlord (5%) and maritime charity/Almshouse Association (3%). However, there were variations between the different types of seafarers: almost 7 in 10 of RNRM own their own homes outright, while this was the case for just over half (54%) of MN and only around a third (32%) of FF129. There has been little change since 2006.
Only 10% of older former seafarers and their dependants are currently in sheltered accommodation – a similar proportion to those in 2006 (11%). This is more likely to be the case for females and those who are separated/divorced, and less likely for RNRM. A higher proportion of dependants of older seafarers report being in sheltered housing (14%) than former seafarers themselves (9%)130.
While more than four fifths of older seafarers and their dependants do not want to live in care homes (91%), almshouses (84%) and extra care housing (82%), almost two fifths (37%) would consider moving into a sheltered flat or bungalow. There was, however, little awareness of seafarers’ housing schemes.
Housing issues are examined more closely in Section 6.
126 ORS (2016)127 Ibid128 Ibid129 Ibid130 Ibid
One thing that is bothering me a little bit is funeral expenses … I’ve looked at the Age Concern offer but I don’t have the spare cash to save for this.
Merchant Navy Officer (ORS, 2016)

Navigating Change: A Review of the UK Maritime Welfare Charity Sector | 2017 49
2.4 SOURCES OF SUPPORTThere is more support available for serving RNRM seafarers than for the other two workforces (MN and FF). Serving RNRM benefit from Ministry of Defence (MOD) support and numerous Naval Service Funds131 as well as large, well-funded tri-Service charities such as The Royal British Legion and SSAFA132. This has been backed up with a large amount of money allocated to charities from fines on banks for attempting to fix the London InterBank Offered Rate (LIBOR)133.
Serving MN seafarers are protected by the Maritime Labour Convention 2006 which safeguards their welfare. Widely known as the ‘seafarers’ bill of rights’, MLC 2006 puts in place seafarers’ rights to decent conditions of work in almost every aspect of their working and living conditions on more than 90 per cent of the world’s gross tonnage of ships134. MN personnel also benefit from a priority NHS medical service provided by the Dreadnought Medical Service135.
The International Labour Organization (ILO) is also working to achieve sign up to the Work in Fishing Convention, 2007 (ILO C188) which provides similar welfare protection to working fishermen to provide decent working and living conditions. ILO C188 has now been ratified by ten countries, which is the trigger-point for UK ratification, and this is likely to occur in early 2018136.
2.4.1 SUPPORT FROM MARITIME CHARITIES
Maritime welfare charities provide a wide range of support to serving and former seafarers and their dependants (see Section 3). The most important forms of support are seen as: information on services (86%), regular payments (84%) and legal advice (84%), while spiritual support was considered relatively less important (56%) by older seafarers and their dependants.
FIGURE 2.4 Importance of services offered by maritime charities rated by older seafarers and their dependants (ORS, 2016), %137
131 Service funds exist to promote the efficiency of theArmed Forces via the provision of facilities, services and/or grants to improve the morale, social and physicalwellbeing of active Service personnel and their dependants (Pozo and Walker (2014))
132 While many tri-Service charities’ services are also open to Merchant Navy seafarers and sometimes their dependants, these are a minority, and seafarers from the Fishing Fleet are seldom supported.
133 Estimatesputthecurrenttotalataround£450millioninthefirstinstance(including£35million(plus£10millionperyearoverthenext25years)paidintotheArmedForcesCovenantLIBORfund,anewgrant-makingbodyoverseenbytheCovenantReferenceGroup,and£25millionintotheAgedVeterans’Fundwhichwillpayoutoverthenext 5 years. Source: Walker (2017)
134 International Labour Organization (ILO – website accessed 12/5/2017)135 http://seahospital.org.uk/dreadnought-medical/136 MNWB (2017b)137 Throughout the report, charts may over or under add to 100% as a result of rounding
28
33
38
40
46
50
46
47
46
47
47
56
48
28
33
35
35
32
31
34
34
35
34
36
28
38
32
26
23
20
16
14
15
16
16
15
13
12
12
6
4
3
2
2
2
2
6
4
2
3
3
3
3
2
3
2
2
2
2
0 10 20 30 40 50 60 70 80 90 100
Spiritual support
Social events / reunions
Counselling
One-off payments
Housing
Care homes
Sheltered / extra care housing
Financial advice
Health care
Information on rights
Legal advice
Regular payments
Information on services
Very important Fairly important Neither important nor unimportant Fairly unimportant Very unimportant
%
28
33
38
40
46
50
46
47
46
47
47
56
48
28
33
35
35
32
31
34
34
35
34
36
28
38
32
26
23
20
16
14
15
16
16
15
13
12
12
6
4
3
2
2
2
2
6
4
2
3
3
3
3
2
3
2
2
2
2
0 10 20 30 40 50 60 70 80 90 100
Spiritual support
Social events / reunions
Counselling
One-off payments
Housing
Care homes
Sheltered / extra care housing
Financial advice
Health care
Information on rights
Legal advice
Regular payments
Information on services
Very important Fairly important Neither important nor unimportant Fairly unimportant Very unimportant
28
33
38
40
46
50
46
47
46
47
47
56
48
28
33
35
35
32
31
34
34
35
34
36
28
38
32
26
23
20
16
14
15
16
16
15
13
12
12
6
4
3
2
2
2
2
6
4
2
3
3
3
3
2
3
2
2
2
2
0 10 20 30 40 50 60 70 80 90 100
Spiritual support
Social events / reunions
Counselling
One-off payments
Housing
Care homes
Sheltered / extra care housing
Financial advice
Health care
Information on rights
Legal advice
Regular payments
Information on services
Very important Fairly important Neither important nor unimportant Fairly unimportant Very unimportant

Navigating Change: A Review of the UK Maritime Welfare Charity Sector | 2017 50
Half (50%) of the dependants and families of working age Fishing Fleet seafarers report having applied for help from maritime charities, compared with around a quarter of MN and RNRM dependants (23% and 27% respectively)138. This rose to 54% amongst older seafarers and their dependants with a FF connection.
More than half (55%) of the dependants of working age seafarers applying for help to maritime charities had applied for financial help, this proportion being particularly high amongst dependants of FF seafarers (69% vs 58% MN and 51% RNRM).
Just under two fifths (37%) of former and older seafarers and their dependants report having received money as a beneficiary of a maritime charity at some point during their lives – a decrease of 4 percentage points since 2006 (41%) – most of which (83%) has been in the form of regular payments139. A much higher proportion of Fishing Fleet older seafarers and their dependants (74%) have received money in this way, in contrast to the very low proportion in the RNRM (6%). While these proportions had not changed much since 2007 (72% of FF and 6% of RN), more older seafarers and their dependants from the MN (29% v 20%) now receive income in this way.
It is interesting to note that regular payments were seen as much more important to older seafarers and their dependants than one off payments. Benevolence is examined in more detail in Section 7.
Similar to the 2006 findings, support, assistance and advice in the way of both finance and housing were mentioned most frequently by older seafarers and their dependants as the most helpful ways in which maritime welfare charities could assist them in future; with many explaining that they would appreciate more help and guidance with care homes, sheltered accommodation and how to cope in their current homes. More generally, many simply stated that they required more information about what is available from maritime charities.
The updated research shows that awareness of maritime charities’ support is still poor. Only 2.3% of working age seafarers’ dependants mentioned maritime charities as the most useful place to find advice or support
on family issues (9% of FF, 4% MN and 1% RNRM)140.
2.5 NEEDS SPECIFIC TO RNRM, MN AND FF The ‘Supporting Seafarers’ (2007) research concluded that former RNRM personnel have fewer and lesser needs than those in either the MN or FF141. The results of the updated research largely confirm that this is still the case, particularly in later life.. Besides this, each workforce engenders specific conditions and needs for the respective seafarers and their dependants.
2.5.1 RNRM
For RNRM families and dependants of working age seafarers, the specific needs are related to the naval lifestyle with long deployments and frequent moves around the country. Evidence suggests that long periods of deployment have a negative effect on family relationships142. Working age seafarer dependants highlight the need for emotional and practical support to help them and their children cope with the consequences of separation and moving to a new area.
Deployment to conflict areas and humanitarian disasters brings its own challenges, both mental and physical; and while the Royal Navy and Royal Marines tend to suffer numerically fewer physical traumas than other branches of the Armed Forces, growing evidence suggests that we may see an increase in the level of support needed by this particular group of beneficiaries, as well as for the ‘invisible wounds’ sustained143.
Older seafarers in the RNRM spent the least time in service (more than half (56%) had not spent more than
138 IPC (2016)139 ORS (2016)140 IPC (2016) 141 MaritimeCharitiesFundingGroup(2007).SeeIPC(2016)forfurtherdetailsofthespecificneedsofdependantsandfamiliesofworkingageRNRM,whichtendtocentre
around housing, parental support and childcare.142 Centre for Social Justice (2016) quoted in IPC (2016)143 https://www.rt.com/uk/333768-afghan-war-injury-statistics/

Navigating Change: A Review of the UK Maritime Welfare Charity Sector | 2017 51
15 years working in the RNRM), and were much more likely to have retired from the service early, and since pursued other careers (RNRM have the highest proportion of seafarers still in any paid employment (13%)). These factors are likely to have led to greater resilience and fewer needs as a direct result of seafaring service for most. On the other hand, four fifths (79%) of older RNRM respondents had supported military operations (in the main for 5 years or less) which may have given rise to greater needs for some. For example, mental and behavioural disorders are the second most common cause of medical discharges in the Naval Service (11%), including depression (4%) and PTSD (2% of all cause coded medical discharges)144.
2.5.2 MN
Around one quarter (26%) of MN have supported military operations145 which might raise their needs for support and care, although 23% spent less than five years doing so. Specific health and safety concerns for serving MN personnel have been identified146, including:
• high death rates for accidents at work in the merchant fleet (although the number of serious incidents declined between 2013 and 2015147, in 2009 death rates were between seven and 20 times greater than for shore-based workers even in the safest national fleets)148
• high mortality from cancers, cirrhosis, pancreatic and other alcohol-related diseases149
• obesity150
For MN families and dependants, financial, emotional and practical support were the main areas of need. Help with the costs of education seemed to be a particular concern among this group. MN dependants had an older age profile and, as the most geographically dispersed group, often remaining in their established neighbourhoods, it seems possible that their needs are closer to those of the wider population than the other two maritime sectors151.
2.5.3 FF
It is well-established that commercial fishing is Britain’s most hazardous occupation152. These jobs mean that seafarers face physical and mental hardships and hazards. All seafarers face the additional and opposite occupational hazard of a rather sedentary lifestyle when not on active duty, with access in some cases to offshore duty-free alcohol and tobacco products, and/or frequent binge-drinking during shore leave153.
Specific health concerns for FF seafarers154, include:
• Fatal accident rates, which among UK deep-sea trawlermen were found to be 20 times greater than for coal miners155, partly due to extreme fatigue156
• Occupational illnesses, including: gastrointestinal, respiratory and skin diseases, psychiatric or neurological conditions, with acute depression the most common, and some were alcohol-related157
• Higher rates of smoking, poorer diets and poorer health knowledge than the general population158
Fishing Fleet families and dependants seem to experience greater financial insecurity with lower incomes, as reflected by the greater proportion on benefits among the respondents159.
144 MOD (2015c)145 According to survey data of former MN seafarers (ORS, 2016)146 Mackay and Wright (2008)147 http://seafarersrights.org/seafarers-subjects/deaths-and-injuries-at-sea/148 Roberts, S. (2000) as quoted in Mackay and Wright (2008)149 International Labour Organization (ILO, 2004)150 Leonard, J.F. (2003) quoted in Mackay and Wright (2008) 151 IPC (2016)152 Althoughfishingisbecomingsafer,therewere118recordedaccidentsonUKfishingvesselsin2015,resultingin35injuriesand7fatalities.153 IPC (2015) 154 Mackay and Wright (2008) 155 Matheson,C.,Morrison,S.,Murphy,E.,Lawrie,T.,Ritchie,L.andBond,C.(2001)156 Allen, P., Wellens, B. and Smith, A., International Maritime Health (2010) 157 Matheson,C.,Morrison,S.,Murphy,E.,Lawrie,T.,Ritchie,L.andBond,C.(2001)158 Lawrie,T.,Matheson,C.,Ritchie,L.,Murphy,E.andBond,C.(2004)159 IPC (2016)

Navigating Change: A Review of the UK Maritime Welfare Charity Sector | 2017 52
2.6 DEPENDANTS AND FAMILIESWhile many maritime charities consider that the needs of seafarers’ families are very similar to those of the general population, only heightened by the periods of separation and uncertainty created by life at sea, many dependants themselves believe there to be important differences between their needs and those of most families. Research carried out by Parentline Plus into the parenting needs of seafaring families found that emotional support was a clear unmet need and, for many struggling alone, had become normalised; and while their attitude does not appear to be so different from that of a substantial section of the population not associated with seafarers, it would appear that the personal attributes and coping style of this cohort has to some extent impeded individuals’ willingness to seek out or access sources of support. Most were keen to access support for their children, or to know how they might better support them. In addition, the naval context does appear to create some specific parenting issues for naval families160.
Those working age dependants with family connections to the RNRM and MN highlighted the differences for seafaring families’ children, while those linked to the Fishing Fleet highlighted the financial insecurity for families161.
The demographics of dependants and families are changing. The fact that women are having children later, means that childcare and the care and support needs of older relatives are more likely to coincide. Children are also likely to stay at home longer into adulthood than in the past. The number of young adults aged 20-34 living with their parents increased by 25% between 1996 and 2013, despite the number of people in the population aged 20-34 being largely the same162.
160 McFarlane, H., Parentline Plus (2009) 161 IPC (2016) 162 Ibid
© C
rown Im
age
s

Navigating Change: A Review of the UK Maritime Welfare Charity Sector | 2017 53
2.7 CONCLUSIONSIn 2007 the ‘Supporting Seafarers’ research found six priority areas of need:
• poverty - including problems with debt, benefits, pensions, low incomes and social exclusion
• isolation - including the need for seafarer-sensitive and seafarer-specific services
• information and advice - on finding and using available services and resources to meet needs
• healthcare - including access to diagnosis, care and treatment, and preventative initiatives to reduce the likelihood or impact of ill-health
• emotional and parenting support - for families and dependants
• housing for seafarers who are single - long-term housing of a high standard for single seafarers of all ages.
These remain key issues for seafarers in 2015 and beyond, with an added emphasis on the needs of an ageing population of former seafarers and their dependants, including increased isolation, physical and mental ill-health, particularly dementia, with support and care provision needing to take these issues into account in areas such as housing.
The overall numbers of adult and child dependants is predicted to decline steadily across all three seafaring groups over the next twenty years. In contrast, levels of need are likely to increase, at least up to 2020, as the impact of austerity measures, welfare changes, and increasing pressures on social provision are felt around the country163, especially for increased numbers of MN and FF older seafarers and their dependants.
Many current beneficiaries have commented on the value of the understanding that maritime welfare charities have of the pressures of seafaring life and its impact on partners and children. It was felt that maritime welfare charities could do more to raise awareness of their work to statutory and other service providers, as well as working with them to understand the impact of the seafaring lifestyle on families and dependants164.
A report by The Royal British Legion in 2011165 concluded that the long-reaching effects of the global recession and austerity measures would put greater pressures on charities such that current gaps in meeting social need will widen, necessitating more collaboration between charities to meet the increasingly complex needs of, particularly older, veterans.
163 IPC (2016)164 Ibid165 Centre for Future Studies (2011)

Navigating Change: A Review of the UK Maritime Welfare Charity Sector | 2017 54

Navigating Change: A Review of the UK Maritime Welfare Charity Sector | 2017 55
TH
RE
E

Navigating Change: A Review of the UK Maritime Welfare Charity Sector | 2017 56
When tri-Service Armed Forces charities are included, RNRM seafarers and their families seeking support have four times as many charities supporting them than either MN or FF. Over £40 million is primarily spent on RNRM by MWCs (plus an estimated £81 million by tri-Service charities) compared to £27 million primarily spent on MN and FF166
While there is relatively widespread coverage throughout the UK in terms of where maritime welfare charities are headquartered, there is more of a Southern bias than the demographics of the neediest beneficiaries might warrant. While many charities have regional branches some seafarers feel isolated from sources of support
Very few organisations see the support network for seafarers and their families as a defined ‘maritime charity sector’ - many consider there to be a division particularly between those charities serving RNRM and those serving MN/FF based on beneficiary need, a ‘military vs. commercial’ outlook, and the differing levels of support/funding available
The array of support offered by MWCs is fairly comprehensive, however maritime welfare charities surveyed believe that there is inadequate provision within the sector of: health rehabilitation services for working age seafarers, emotional support for seafarers and their families, services with an emphasis on social isolation, information about minority ethnic seafarers, and suitable accommodation for retired seafarers
While half of MWCs surveyed feel that maritime charities collaborate effectively with one another, having improved markedly over the last ten years, some barriers to a more cohesive sector still exist, including cross-sector information sharing and sign-posting. If there is a desire to propagate a more joined-up and holistic maritime charity sector, with greater co-ordination of beneficiary support, then further efforts will need to be made
166 These figures use total income and expenditure.The largest MWCs spent76% of their total expenditure on charitable activities.
3. THE MARITIME SUPPORT NETWORK (Focusing on maritime welfare charities)
THE MARITIME CHARITY SECTOR IS DIVERSE, LOOSELY DEFINED AND UNEVENLY SPREAD ACROSS DIFFERENT SEAFARER GROUPS WITH THE RESULT THAT SOME BENEFICIARY GROUPS HAVE MORE SUPPORT THAN OTHERS
KEY POINT 3
There are 81 registered maritime welfare charities (MWCs) focussed specifically on the maritime sector and providing relief-in-need to seafarers and their families (excluding tri-Service Armed Forces charities) – 36 MWCs primarily serve MN and FF, 19 primarily serve RNRM and 26 serve all three maritime sectors
Maritime welfare charities (excluding tri-Service Armed Forces charities) receive over £111 million and spend over £105 million per annum providing welfare support to the seafaring community. This makes the sector one-quarter the size of the Armed Forces charity sector (expenditure by tri-Service Armed Forces charities on the maritime community probably adds around £81 million to these totals). The maritime welfare charity sector is dominated by large grant-makers which fund MWCs. Indeed some £19 million is given by MWC grant-makers largely to other MWCs, which is translated into the various types of support given to individual beneficiaries, including £9.6 million which is given out in benevolent grants to individual beneficiaries

Navigating Change: A Review of the UK Maritime Welfare Charity Sector | 2017 57
The maritime welfare charity sector provides a huge amount of support to beneficiaries, but could still improve in some areas, particularly with regard to more poorly served groups. Having an acknowledged MWC ‘sector’ and tighter bonds between organisations could be beneficial for both charities and beneficiaries in managing and delivering such changes in emphasis
© C
row
n Im
age
s

Navigating Change: A Review of the UK Maritime Welfare Charity Sector | 2017 58
3.1 THE NETWORK OF SUPPORT FOR SEAFARERS IS DIVERSE AND LOOSELY DEFINED
The maritime support universe is large and diverse, from statutory bodies such as the Ministry of Defence (MOD), mainstream public services such as the National Health Service (NHS)167, the shipping industry, Port Welfare Committees, Unions such as the RMT and Nautilus International, registered charities of many varieties, advice lines and websites, right down to community organisations such as breakfast clubs and sailing clubs. All of these organisations look to provide some element of support for the welfare and wellbeing of seafarers and/or their families.
FIGURE 3.1
Organisations with a purview on the seafaring community
For seafaring youth there are educational establishments (such as the Royal Hospital School), Sea Cadets and Naval Cadet units, Sea Scouts and various sailing training centres which encourage young people to enter the working seafaring community.
FIGURE 3.2
Maritime charities providing welfare168
It could be argued that registered charities are at the heart of this support network. The network of non-profit organisations which support the seafaring community can be seen in Figure 3.2169.
167 Particularly the Dreadnought Medical Service (see case study) 168 UpwardsoffiftyServiceFundsfunctiontoimprovethemoralandwellbeingofRNRMServicepersonnelandtheirfamilies.ThevastmajorityofServiceFundmoneyis
spentonsocialandrecreationalactivitiessuchasofficers’,warrantofficers’andsergeants’messes,andareasdiverseasrifleandbibleassociations.ServiceFundsalsoprovide funding for nurseries and playgroups for Service families (see Pozo and Walker (2014) for further details on the functioning of Service Funds). Upwards of 30 ArmedForcesmemorialandheritageassociationsareaffiliatedwiththeRNRMcommunity.Theseincludemuseums,memorialsandpreservationtruststohonourandremember historical events involving the Armed Forces.
169 FollowingtheclassificationsystemusedtoanalysetheArmedForcescharitiesinPozoandWalker(2014)andbywww.armedforcescharities.org.uk.
3.1
NHS and other
mainstream public
services
Ministry of Defence (serving
Armed Forces personnel)
Registered maritime charities
(providing welfare and
other services)
Non-registered
community organisations
e.g. breakfast clubs, Federation of Naval Families
General charities
also offering services to seafarers
The shipping industry, Port
Welfare Committees,
etc.
Other bodies e.g. Chamber of
Shipping, Unions
Seafaring youth
organisations
3.2
General charities
which also offer welfare to seafarers
Tri-Service charities (serving
Armed Forces personel past
or present)
Dedicated seafarer welfare
registered charities
(including Associations)
Community welfare
organisations (e.g. breakfast
clubs, Federation of
Naval Families)
Memorial and heritage
charities Service Funds
Other organisations
(e.g. Dreadnought / Greenwich
Hospital)

Navigating Change: A Review of the UK Maritime Welfare Charity Sector | 2017 59
Tri-Service Armed Forces welfare charities170 play an integral part in maritime welfare, with large organisations such as SSAFA, the Royal British Legion and Help for Heroes playing a pivotal role in providing welfare services to ex-Service personnel mainly from the RNRM, but also to some MN171.
In our survey of 20 of the leading tri-Service Armed Forces charities, three-fifths (12) offered services to MN seafarers (although these represented only 8.5% of their beneficiaries on average)172. These 12 tri-Service Armed Forces charities predominately offered support to MN ‘veterans’ (defined as those in the Royal Fleet Auxiliary or those who have served in commercial vessels supporting the UK Armed Forces during military operations); just two charities in the survey also provided support for MN seafarers who were not veterans. Five per cent also offer support to seafarers in the Fishing Fleet.
FIGURE 3.3
In addition to the Armed Forces, does your organisation also serve any of the following groups?173
The boundaries of the support network for the maritime community are not clear-cut. There are large numbers of general charities working in the UK which also provide support to seafarers. For example, The Charity for Civil Servants, Tancred’s Charity for Pensioners, The Wilton Memorial Almshouses, The RNLI, the National Coastwatch Institution, Alabare and the UK Sailing Academy (youth and cadets) to name but a few.
The total number of charities which deliver welfare in a wider sense to seafarers is therefore upwards of 400 (including tri-Service Armed Forces charities, Service Funds, Memorial and Heritage charities and primarily-welfare-focussed (non-tri-Service Armed Forces) charities). Our research amongst maritime welfare charities found a split in opinion over whether there are too many charities operating within the maritime welfare sector, with 37% agreeing, and 34% disagreeing174.
170 In2014,PozoandWalkeridentified197registered(withtheCharityCommissionofEnglandandWales)tri-Servicearmedforceswelfarecharities(providingservicesandsupporttoveteransfromtheBritishArmy,RoyalNavyandRoyalMarinesandtheRoyalAirForce)withacombinedincomeof£412millionin2012.ColeandTraynor(2016)identified91ArmedForceswelfarecharitiesregisteredwiththeOfficeoftheScottishCharityRegulator(OSCR),ofwhich5focussedontheRNRMpopulation.
171 There are also a number of tri-Service charities open to the general public, but priority is given to ex-Service personnel (including RNRM): The Chasely Trust, Christ’s Hospital Foundation, HCPT – The Pilgrimage Trust, the Gwennili Trust.
172 Responses given range from 1% to 35%. Online survey (all tri-Service providing support to MN, n=12) 173 Some tri-Service Armed Forces charities responding provide assistance to more than one other maritime group, and so percentages in Figure 3.3 total more than 100%174 22% neither agreed nor disagreed, whilst 7% answered ‘don’t know’. Online survey and tele-depth interviews (all Maritime charities responding, n=59)
3.3
3.4
40% 5% 5% 5% 60%
None of these Other non-maritime/non-military
Other maritime related Fishing Fleet
Merchant Navy
17% 83% MN beneficiaries served
All Merchant Navy - Veterans & Other Seafarers Other Merchant Navy Merchant Navy Veterans only
£110,9 £105,3
£0
£20,000,000
£40,000,000
£60,000,000
£80,000,000
£100,000,000
£120,000,000
Total income Total expenditure

Navigating Change: A Review of the UK Maritime Welfare Charity Sector | 2017 60
At the centre of the support network for the seafaring community are registered charities providing focussed welfare services. Welfare is defined as ‘relief-in-need’ (e.g. the provision of grants and/or services to alleviate need, hardship or distress caused by poverty, unemployment, homelessness, ill-health, disability, old age or other personal circumstances) in line with usual charitable practice175.
3.2 MARITIME WELFARE CHARITIES
The research has identified 81 registered charities which are primarily focused on the welfare of the seafaring community (RNRM, MN and FF seafarers and their dependants). These are analysed in detail below and form the maritime welfare charities (MWC) sector described in this report176.
A number of maritime welfare charities have local branches, funds, affiliated, subsidiary and linked charities. Only the main parent charity has been included in this analysis where the subsidiary is not financially independent (i.e. where the branch or associated charity does not have its own accounts)177.
There are also some special cases which deserve mention:
• Dreadnought Medical Service – a priority medical service for commercial seafarers (MN and FF) provided by the NHS, funded by Lambeth, Southwark and Lewisham Clinical Commissioning Groups, and supported by the Seafarers Hospital Society. DMS is not a charity and is therefore excluded from the main part of the analysis (see case study)
• SAIL: Seafarers’ Advice and Information Line – this is a service operated by Greenwich Citizens Advice Bureau on behalf of the Seafarers Hospital Society, with co-funding from Seafarers UK and Greenwich Hospital (for the purposes of this analysis SAIL is treated as though it were a separate organisation and its finances have been annexed from Greenwich CAB where possible)
• Greenwich Hospital – not a registered charity but operates very like one, therefore for the purposes of this analysis Greenwich Hospital is included (with the exclusion of the income and expenditure of the Royal Hospital School except for charitable bursaries for seafarers dependants) (see case study)
175 See Pozo and Walker (2014) 176 Theseregisteredcharitiessharealargenumberofcharacteristicswhichallowthemtobeconsidereda‘sector’,particularlywithregardtofinancialaccounting.177 Forexample,theMerchantNavyFundisacollaborativeinitiativebytheMerchantNavyWelfareBoardandSeafarersUK(forfinancialpurposesitisasubsidiaryfundof
Seafarer’s UK); the Naval Service Benevolent Fund (NSBF) and Naval Service Dependants’ Fund (NSDF) are both subsidiary funds of the Royal Navy and Royal Marines Charity (RNRMC)
OTHER CHARITIES WORKING WITH SEAFARERS
Homeless charity Alabaré’s Homes for Veterans provide temporary accommodation to British Armed Forces Veterans who are homeless or at risk of becoming homeless. They currently operate 24 Homes for Veterans across England and Wales which provide 110 bedspaces.
Aggie’s (Dame Agnes Weston’s Royal Sailors’ Rests) teamed up with award-winning small charity Storybook Dads, originally aimed at children whose fathers are in prison, to create Storybook Waves which helps members of the Royal Navy and Royal Marines maintain the link with their children by recording a bedtime story for them to listen to when a parent is serving away from home.

Navigating Change: A Review of the UK Maritime Welfare Charity Sector | 2017 61
3.3 THE FINANCES OF THE MARITIME WELFARE CHARITY SECTOR
In 2015178 the total income of the 81 maritime welfare charities179 was £111 million and their total expenditure was £105 million. That makes the Maritime Welfare Charity Sector one-quarter the size of the Armed Forces welfare charity sector180. It should be noted that, as with Armed Forces charities (see Pozo and Walker (2014)) a considerable number of maritime welfare charities award grants to other maritime welfare charities resulting in some double-counting of income and expenditure181. Indeed, some £19 million is given by MWC grant-makers largely to other maritime charities, many of which are MWCs.
For example, Greenwich Hospital partners with RNRMC to distribute the bulk of its grants (£2.456 million, or 86% of its total grants in 2014/15, and 30% of RNRMC’s total grants)182; RNRMC in turn then makes a block grant to the Royal Naval Benevolent Trust (RNBT) (£1 million in 2015) and a substantial grant to the Royal Navy and Royal Marines Children’s Fund (£720,000 in 2015); Trinity House Maritime Charity gave major grants worth £868,000 to MWCs; while Seafarers UK gave over £1.7 million to MWCs in 2015. Between them the ‘in-sector’ grants of these three major grant-makers (RNRMC, Trinity House and Seafarers UK) account for at least 5% of the total income of the MWC sector.
178 Due to availability, 1 set of accounts was 2014 and 4 were 2016.179 ExcludingtheDreadnoughtMedicalService(notaregisteredcharityandthereforenotoneofthe81)AlsoexcludingtheRoyalHospitalSchoolfromGreenwichHospital
accounts on the grounds that its sizeable income and expenditure is not for the charitable welfare purposes of the maritime sector, although charitable bursaries are awardedtothechildrenofsomeseafarersandthesehavebeenincluded(£2.175millionin2015).In2015,incomefromtheRoyalHospitalSchoolwas£12.5millionandexpenditurewas£16million.
180 Thiscalculationusesexpenditurefiguresfrom2012publishedinPozoandWalker(2014).Thedifferenceinexpenditurein2015wouldverylikelybeevengreater.181 Theexactfigureisdifficulttoestimateascharities’accountsrarelyprovideacomprehensivelistofgrantrecipientsandcorrespondinggrantamounts.182 For this reason this high proportion of Greenwich Hospital grants distributed via RNRMC have been excluded from analyses of grant levels.
DREADNOUGHT MEDICAL SERVICE
Dreadnought Medical Service is a specialist medical service for seafarers based at Guy’s & St. Thomas’ NHS Foundation Trust Hospital and is the successor to the Seamen’s Hospital in Greenwich and the original hospital function of the Seafarers Hospital Society. Its principal aim is to enable serving seafarers to return to work as soon as possible by providing treatment in a shorter timescale than might normally be offered at a local NHS hospital. Dreadnought Medical Service receives dedicated funding from the NHS and therefore there is no charge for UK resident seafarers. Assistance with transport and travel costs may be available through the hospital’s patient transport service or in certain cases, from Seafarers Hospital Society which provides grants for eligible seafarers and their dependants. Dreadnought Medical Service had an annual budget of £2.05m (in 2015/16) and treated around 500 new medical and surgical patients and around 1,000 dental patients in 2014/15.
GREENWICH HOSPITAL
The Royal Hospital for Seamen (currently known as Greenwich Hospital) was established by Royal Charter in 1694 as a home for retired seamen of the Royal Navy, to provide support for seamen’s widows, education for their children, and for the improvement of navigation. It now comprises the Royal Hospital School, sheltered housing for elderly seafarers and their spouses, and a charity team which leads support for those who serve, and have served, in the RNRM and their dependants. It focuses on education and pre-emptive support. It supports individuals and organisations, funding is either direct or via other Naval charities: RNRMC, RNBT and the RNA.
The Royal Hospital School is a leading independent co¬educational boarding and day school in East Anglia. There are a limited number of means-tested bursaries and discounts awarded each year for boarding pupils (£2.175 million in 2014/15).

Navigating Change: A Review of the UK Maritime Welfare Charity Sector | 2017 62
FIGURE 3.4
Total income and expenditure of maritime welfare charities in 2015 (£M) 183
The sector is predominantly made up of ‘medium’ sized charities with an income between £100K-£1 million; and ‘small’ charities with an income between £10K-£100K184. These make up 70% of the sector. A further quarter (23%) of the sector is made up of ‘large’ charities with an income between £1M-£10M. Just 3 MWCs (4%) have an income of less than £10,000 per annum; and just 3 MWCs (4%) have an income between £10 million and £100 million (Figure 3.5).
FIGURE 3.5
The composition of the sector by size of charity (income), 2015
Compared to the third sector at large in the UK, the maritime charity sector has a much more balanced distribution of charities by size (whereas 84% of the wider third sector charities are ‘small’ with incomes between £10K-£100K)185.
While the MWC sector has a wide spread of different sizes of organisations, the majority of the income and therefore spending power of the sector (as with the wider third sector) is concentrated in the largest charities. The top three MWCs account for nearly one quarter (23%) of the total sector income and one fifth (20%) of its expenditure; while 29 large MWCs with incomes of over £500K in 2015 account for 95% of the total income of the sector and 94% of its expenditure.
183 It should be noted that the MWC sector includes several charities which work internationally, e.g. The ITF Seafarers Trust, Mission to Seafarers, Sailors’ Society, The InternationalChristianMaritimeAssociationandISWAN,forwhichonlyaproportionoftheirexpenditurewillbespentonUKbeneficiaries,although ithasnotbeenpossible to calculate how much this represents.
184 Excludingtri-ServiceArmedForcescharitieshereandthroughouttheanalysisunlessotherwisestated.185 Althoughitshouldbenotedthatwehaveexcludedforthepurposesofthefinancialanalysisalargenumberofregionalbranches,fundsandseacadetunitswhose
financesaremanagedcentrally,buttheexistenceofwhichwouldboostthenumberofmicroandsmallercharities.
3.3
3.4
40% 5% 5% 5% 60%
None of these Other non-maritime/non-military
Other maritime related Fishing Fleet
Merchant Navy
17% 83% MN beneficiaries served
All Merchant Navy - Veterans & Other Seafarers Other Merchant Navy Merchant Navy Veterans only
£110,9 £105,3
£0
£20,000,000
£40,000,000
£60,000,000
£80,000,000
£100,000,000
£120,000,000
Total income Total expenditure
3.5
3.6
4%
32%
38%
23%
4% 0%
0%
5%
10%
15%
20%
25%
30%
35%
40%
£0
£2
£4
£6
£8
£10
£12
£14
£16
£18
1 21 41 61
1. MSSC - £16.7 million
2. RNRMC - £16.1 million
3. Greenwich Hospital - £13 million
£120
£100
£80
£60
£40
£20
£0Total income Total expenditure
% o
f M
WC
s
size
Micro
<£10
K
Small
£10K-£
100K
Mediu
m £1
00K-£1M
Large £1
M-£
10M
Majo
r £10
M-£
100M
Super majo
r >£1
00M

Navigating Change: A Review of the UK Maritime Welfare Charity Sector | 2017 63
FIGURE 3.6
The income spread of the maritime welfare charities, 2015 (£M)
These large charities dominate the sector’s finances, but it must not be forgotten that 63% of the sector is
made up of smaller charities.
TABLE 3.1
The top ten maritime welfare charities by income, 2015 (£M)
Maritime welfare charity Accounts year Total income Total
spending
The Marine Society and Sea Cadets (MSSC) 2015 £16.676 £14.313
The Royal Navy and Royal Marines Charity (RNRMC) 2015 £16.098 £12.101
Greenwich Hospital 2015 £13.032 £12.571
Trinity House Maritime Charity 2015 £6.841 £6.323
The Royal Naval Benevolent Trust (Grand Fleet and Kindred Funds) (RNBT)
2015 £5.993 £5.249
The Mission to Seafarers 2015 £4.441 £4.892
Sailors’ Society 2015 £3.768 £4.950
The Royal National Mission to Deep Sea Fishermen (Fishermen's Mission)
2015 £3.597 £2.584
Royal Alfred Seafarers’ Society 2015 £3.506 £3.371
Nautilus Welfare Fund 2015 £2.884 £2.939
186 TheMSSCworksacrosstwofields:SeaCadets:withamissiontogiveyoungpeoplethebestpossibleheadstartinlifethroughnauticaladventureandfun;andMarineSociety:withamissiontobethefirstinlearningandpersonaldevelopmentforseafarers.
187 The Greenwich Hospital income and expenditure totals exclude the Royal Hospital School from Greenwich Hospital accounts (see footnote 180). The total expenditure alsoincludes£1.633millioncoveringHeadquartersadministration,interestonpensionliabilityandfinancecosts.
188 TheMissiontoSeafarersandSailors’Societyarebothinternationalmaritimewelfarecharitiesand,assuch,onlyaportionoftheirexpenditurebenefitsUKbeneficiaries.
3.5
3.6
4%
32%
38%
23%
4% 0%
0%
5%
10%
15%
20%
25%
30%
35%
40%
£0
£2
£4
£6
£8
£10
£12
£14
£16
£18
1 21 41 61
1. MSSC - £16.7 million
2. RNRMC - £16.1 million
3. Greenwich Hospital - £13 million
188
186
187
N

Navigating Change: A Review of the UK Maritime Welfare Charity Sector | 2017 64
3.4 BENEFICIARIES SERVED (3 SEAFARING WORKFORCES)
With around 200189 tri-Service Armed Forces charities providing some support to RNRM, plus 44 dedicated RNRM welfare charities, seafarers from the Royal Navy and Royal Marines have the greatest number of charities offering support should they need it. In fact, RNRM seafarers have four times as many charities supporting them than either MN (58) or FF (48) seafarers190; and while RNRM beneficiaries do form a majority (58%) as seen in Section 1, this constitutes a relative over-supply of support in comparison with MN and FF.
FIGURE 3.7
Number of charities supporting seafarers and dependants from the three seafaring workforces, including tri-Service Armed Forces charities
The picture alters when we look at the primary beneficiaries served by MWCs. Figure 3.8 illustrates that a majority (36) of MWCs primarily serve MN and FF seafarers and their dependants, nearly one third (26) work across all three workforces and 19 primarily support RNRM seafarers and their dependants.
FIGURE 3.8
Number of dedicated maritime welfare charities with a primary focus on supporting seafarers and dependants from a particular seafaring workforce (excluding tri-Service Armed Forces charities)191
This picture changes again when the money spent on each workforce is taken into account192. Figure 3.9 shows that more money is spent on providing welfare support by charities which primarily focus on RNRM (£40 million) than on MN and FF (£27 million); while £37.9 million is spent on providing welfare support for all three seafaring workforces and their dependants.
189 Pozo and Walker (2014) 190 Thesenumbersindicatemaritimecharitieswhichofferanysupporttobeneficiariesfromeachworkforcementionedandthereforedonotsumto81.Categorisations
taken from MNWB Welfare Guide.191 Categorisations made in light of the analysis and in discussion with MNWB. 192 It’sextremelydifficulttoaccuratelygaugehowmuchmoneyisbeingspentonsupportingeachbeneficiarygroup,sinceannualreportsdon’tincludethisinformation,
andthepicturetendstoshiftfromyeartoyear.Thisanalysisisbasedontotalexpenditureallocatedentirelytotheprimarybeneficiarygroup.Inreality,thisisnotthecaseand therefore is only indicative.
3.7
3.8
3.9
1
48
58
241
0 100 200 300
Other (Special Forces)
Fishing Fleet
Merchant Navy
Royal Navy or Royal Marines (including tri-Service)
36
19
26 MN/FF
RN/RM
Tri-Maritime
3.7
3.8
3.9
1
48
58
241
0 100 200 300
Other (Special Forces)
Fishing Fleet
Merchant Navy
Royal Navy or Royal Marines (including tri-Service)
36
19
26 MN/FF
RN/RM
Tri-Maritime
N
MN/FF
RNRM
Tri-Maritime

Navigating Change: A Review of the UK Maritime Welfare Charity Sector | 2017 65
FIGURE 3.9
Total income and expenditure allocated to the ‘primary beneficiaries’ of each maritime charity (£M)
Additionally, the support provide by tri-Service Armed Forces welfare charities to RNRM needs to be taken into consideration. In 2012, the (largest 32) tri-Service Armed Forces welfare charities had a charitable expenditure of £278 million, around £81 million of which can be considered as additional to the RNRM pot in real-terms193. (In our survey of 20 tri-Service Armed Forces charities, an average of 21% of their beneficiaries were RNRM.194)
Many charities in the sector see a delineation or split between charities supporting RNRM and those supporting MN/FF195. A few see this as being driven by a military affinity, whereby those in the Royal Navy and Royal Marines are more akin to soldiers and airmen, than the more ‘commercially’ focused merchant seafarers and fishermen.
I think the Royal Navy side of things sits almost more naturally with the military charities than with the maritime charities. I just think the public from whom the donations come would tend to relate the Armed Forces as one group, people who put their lives on the line in conflict for the defence of the country
[RNRM, £1M-£5M]
Many more consider the division to lie in the level of finances and support available, particularly by those working within the Merchant Navy and Fishing Fleets, who perceive the Naval Service to be better funded and supported. This view is corroborated by the online survey, whereby those working in the maritime welfare charity sector (excluding tri-Service Armed Forces charities), are more likely to consider Naval Service support and resources to be ‘abundant’ (see Figure 3.10)196. Of those with Merchant Navy beneficiaries, 60% believe support and resources to be inadequate, compared to 50% for FF and 11% for RNRM197. Amongst tri-Service Armed Forces charities, 11% consider maritime support and resources for RNRM beneficiaries to be adequate, whilst 17% consider it inadequate198.
193 As a rough guide 19% of Britain’s Armed Forces are made up of RNRM seafarers so if expenditure is proportional to representation then around 19% of this money is probably spent on providing welfare support to RNRM seafarers and their dependants.
194 6% were MN and less than 1% were FF. It should also be noted that SSAFA, one of the largest tri-Service charities (which did not take part in the online survey) have reportedthat12%oftheirapplicationsareRNRM,sotheoverallrealfiguremaybeslightlylowerthanreportedhere.
195 Tele-depth interviews (all Maritime charities responding, n=30) 196 Online survey (all Maritime charities responding, n=30/31/33) 197 Onlinesurvey,Maritimecharitiesmayservemorethanonebeneficiarygroup,andsotheirresponseswillappearineachofthesegmentsserved(allMaritimecharities
responding, RNRM=18, MN=20, FF=14) 198 Online survey (all tri-Service charities responding, n=18)
3.10
3.11
£25
£46
£40
.3
£27
£40
.2
£37
£0.00
£10,000,000.00
£20,000,000.00
£30,000,000.00
£40,000,000.00
£50,000,000.00
MN/FF RN/RM Tri-Maritime
Income Expenditure
42%
32%
37%
30%
39%
7%
24%
23%
27%
3%
6%
30%
Fishing Fleet and their dependants
Merchant Navy and their dependants
Royal Navy, Royal Marines and their dependants
Don't know Inadequate Adequate Abundant
£50
£40
£30
£20
£10
£0
3.10
3.11
£25
£46
£40
.3
£27
£40
.2
£37
£0.00
£10,000,000.00
£20,000,000.00
£30,000,000.00
£40,000,000.00
£50,000,000.00
MN/FF RN/RM Tri-Maritime
Income Expenditure
42%
32%
37%
30%
39%
7%
24%
23%
27%
3%
6%
30%
Fishing Fleet and their dependants
Merchant Navy and their dependants
Royal Navy, Royal Marines and their dependants
Don't know Inadequate Adequate Abundant
MN/FF RNRM Tri-Maritime

Navigating Change: A Review of the UK Maritime Welfare Charity Sector | 2017 66
FIGURE 3.10
Do you think that the level of support and resources available across the maritime sector are adequate or not to meet the needs of each of the following groups…?
There is some agreement that the ‘maritime charities sector’ is indeed diverse, loosely defined and unevenly spread, with over half (57%) of maritime welfare charities interviewed viewing the maritime charity sector as a ‘fragmented / disparate’ entity, rather than a holistic charity sector.
FIGURE 3.11
Do you see the maritime charity sector, incorporating the Naval Service, Merchant Navy and Fishing Fleet, as a single charity sector, or is it more disparate?199
Amongst the maritime welare charities responding to the online survey, there is reasonably strong disagreement that ‘seafarers’ needs are the same regardless of whether they’ve served in the Naval Service, Merchant Navy or Fishing Fleet’. At an overall level, six in ten (61%) disagree, rising to seven in ten amongst those serving Fishing Fleet beneficiaries200. Tri-Service Armed Forces charities are more likely to consider all seafarers needs to be the same, with over a quarter (28%) agreeing, although two-fifths (39%) still disagree201.
FIGURE 3.12
How strongly do you agree or disagree that ‘seafarers’ needs are the same regardless of whether they’ve served in the Naval Service, the Merchant Navy or the Fishing Fleet’?
199 Tele-depth interviews (all Maritime charities responding, n=30) 200 Online survey, (all Maritime charities responding, n=44 / all Fishing Fleet charities responding, n=20) 201 Online survey, (all tri-Service charities responding, n=18)
3.10
3.11
£25
£46
£40
.3
£27
£40
.2
£37
£0.00
£10,000,000.00
£20,000,000.00
£30,000,000.00
£40,000,000.00
£50,000,000.00
MN/FF RN/RM Tri-Maritime
Income Expenditure
42%
32%
37%
30%
39%
7%
24%
23%
27%
3%
6%
30%
Fishing Fleet and their dependants
Merchant Navy and their dependants
Royal Navy, Royal Marines and their dependants
Don't know Inadequate Adequate Abundant
3.12
3.13
17%
57%
26%
Single sector / Holistic
Fragmented / Disparate
Don't know / No response
9% 32% 30% 16% 5% 9%
Don't know 1-2 (Completely Disagree) 3-4 5-6 7-8 9-10 (Completely Agree)
12
12
51
58
60
61
0 10 20 30 40 50 60 70
Reserves
Youth
Widows / partners
Serving
Dependents
Retired / former seafarers
14%
% Agree (7-10)
% Disagree (1-4)
61%
3.12
3.13
17%
57%
26%
Single sector / Holistic
Fragmented / Disparate
Don't know / No response
9% 32% 30% 16% 5% 9%
Don't know 1-2 (Completely Disagree) 3-4 5-6 7-8 9-10 (Completely Agree)
12
12
51
58
60
61
0 10 20 30 40 50 60 70
Reserves
Youth
Widows / partners
Serving
Dependents
Retired / former seafarers

Navigating Change: A Review of the UK Maritime Welfare Charity Sector | 2017 67
3.5 BENEFICIARIES SERVED (AGE AND STATUS)
There are roughly equal proportions of MWCs offering services and support to serving (61), retired (60) and dependants (58)202. Over half (51) offer support to widows/partners, while 12 offer support to Reserves, and another 12 offer support to youth (e.g. sea cadets).
FIGURE 3.13
Number of charities supporting seafarers and dependants according to their status and age203
Whilst not all of those responding to the online survey had a view on support levels for all beneficiary groups, those commenting generally believed the level of support to be inadequate. The one exception to this being serving seafarers, where over three-fifths (63%) consider support to be at least adequate, and one-in-ten deem it ‘abundant’. Support and resource is felt to be least adequate for working age seafarers who are no longer at sea204.
FIGURE 3.14
Do you think that the level of support and resources available across the maritime sector are adequate or not to meet the needs of each of the following groups…?
202 There is an overlap of support to these groups such that the numbers do not sum to 100%.203 Categorisations taken from MNWB Welfare Guide.204 Online survey (all Maritime charities responding per group, as shown on chart)
3.12
3.13
17%
57%
26%
Single sector / Holistic
Fragmented / Disparate
Don't know / No response
9% 32% 30% 16% 5% 9%
Don't know 1-2 (Completely Disagree) 3-4 5-6 7-8 9-10 (Completely Agree)
12
12
51
58
60
61
0 10 20 30 40 50 60 70
Reserves
Youth
Widows / partners
Serving
Dependents
Retired / former seafarers
3.14
3.16
56%
53%
52%
50%
50%
38%
38%
33%
38%
40%
20%
52%
6%
13%
10%
10%
30%
10%
Seafarers no longer at sea, working age (n=16)
Dependant children (n=15)
Spouses, partners, widows, widowers (n=21)
Seafarers no longer at sea, retired (n=20)
Youth, such as Sea Cadets (n=10)
Serving seafarers (n=21)
Inadequate Adequate Abundant
1
1
1
1
2
2
2
2
14
14
15
26
0 5 10 15 20 25 30
THROUGHOUT ENGLAND
More than one local authority area in Scotland
A local area in Wales
NATIONAL AND COMMONWEALTH
THROUGHOUT ENGLAND AND WALES, & …
Scotland and other parts of the UK
A local area in Scotland
THROUGHOUT ENGLAND AND WALES, …
THROUGHOUT ENGLAND AND WALES
NATIONAL (UK)
NATIONAL AND OVERSEAS
A local area in England
Dependants
Dependent

Navigating Change: A Review of the UK Maritime Welfare Charity Sector | 2017 68
3.6 GEOGRAPHY OF MARITIME CHARITIES
While there is relatively widespread coverage throughout the UK, in terms of where maritime welfare charities are headquartered, there is more of a Southern bias than the demographics of the neediest beneficiaries (mainly MN and FF) might warrant.
Figure 3.15 shows both the location of MN and FF seafarers, and where each of the maritime welfare charities is headquartered across the UK205. Similar to the wider third sector, a majority of maritime welfare charities (22) are headquartered in London; although a large preponderance (17) are also based in or around Portsmouth, and so are likely to be mainly RNRM charities. Scotland, in particular, is poorly served by main charity offices. This reinforces a point made in Section 2 around the limited presence of maritime charities in certain areas of the country, and is a potential concern since many higher-needs beneficiaries can be found in the North-East of England and in Scotland.
FIGURE 3.15
Geographical location of MN and FF seafarers206 (left) and the location of the headquarters of maritime
welfare charities (right)207
Where a charity is headquartered does not determine its reach, and while a majority of MWCs (26) state that they give benefit to ‘a local area in England’, 14 give benefit ‘throughout England and Wales and another 14 give benefit nationally (throughout the UK) - see Figure 3.16.
205 IncludesGreenwichHospital,TheDreadnoughtMedicalServicesandSirGabrielWood’sMariners’Home(heldintrustbySailors’Societybutoperatinginadifferentgeographical location)
206 Maritime Charities Funding Group (2007). The map has not been updated since 2007 due to a certain lack of data around where MN seafarers and their families can be found.AnupdatedmapofwherefishermencanbefoundispublishedbytheMarineManagementOrganisation‘UKSeaFisheriesStatistics2015’,andthisshowsthatthegeographicdistributionoffishermenhasnotchangeddramaticallyinthelasttenyears.
207 Mapping courtesy of free online data tool: MapsData.co.uk

Navigating Change: A Review of the UK Maritime Welfare Charity Sector | 2017 69
FIGURE 3.16
Where maritime charities offer support208
It should be noted that many maritime welfare charities also operate local branches and offices in different parts of the country to where they are headquartered, for example The Fishermen’s Mission has 23 regional centres, including ten in Scotland and two in Northern Ireland. Despite this, it might be argued that a head office located near beneficiaries may indicate a better understanding of local conditions and needs combined with greater power to provide support.
208 BasedmainlyonstatedAreaofBenefit(AOB)registeredwiththeCharityCommission;however,inmanycasesAOBisnotdefined(31/81)sowherepossible,theAOBhasbeenimputedfromthecharity’swebsiteorentryonCCEW(insomecasesAOOhasbeenusedwherethiswasnotpossible)
3.14
3.16
56%
53%
52%
50%
50%
38%
38%
33%
38%
40%
20%
52%
6%
13%
10%
10%
30%
10%
Seafarers no longer at sea, working age (n=16)
Dependant children (n=15)
Spouses, partners, widows, widowers (n=21)
Seafarers no longer at sea, retired (n=20)
Youth, such as Sea Cadets (n=10)
Serving seafarers (n=21)
Inadequate Adequate Abundant
1
1
1
1
2
2
2
2
14
14
15
26
0 5 10 15 20 25 30
THROUGHOUT ENGLAND
More than one local authority area in Scotland
A local area in Wales
NATIONAL AND COMMONWEALTH
THROUGHOUT ENGLAND AND WALES, & …
Scotland and other parts of the UK
A local area in Scotland
THROUGHOUT ENGLAND AND WALES, …
THROUGHOUT ENGLAND AND WALES
NATIONAL (UK)
NATIONAL AND OVERSEAS
A local area in England A local area in England
Throughout England
National and overseas
National (UK)
Throughout England and Wales
Throughout England and Wales, Scotland & overseas
A local area in Scotland
Scotland and other parts of the UK
Throughout England and Wales, & Scotland
National and Commonwealth
A local area in Wales
More than one local authority area in Scotland

Navigating Change: A Review of the UK Maritime Welfare Charity Sector | 2017 70
3.7 SUPPORT OFFERED BY MARITIME WELFARE CHARITIES
The majority of maritime welfare charities (MWCs) offer multiple support services to seafarers and their dependants. Over half (45) of MWCs provide financial assistance in the form of grants to individuals or to other organisations, whilst 43 provide ‘other’ services, e.g. support for international seafarers, Seafarer Centres or education / training (see Figure 3.17 and 3.18). Just under half (38) provide ‘support’ (e.g. social/fellowship events, spiritual support or bereavement counselling); and two-fifths (31) provide ‘advice’ (e.g. welfare and benefits advice, employment and legal advice). One third (27) provide accommodation (including sheltered housing and care homes, hostels and holiday accommodation).
FIGURE 3.17
The number of maritime welfare charities offering different types of support services to the seafaring community (total number = 81)209
209 ThesecategorisationsarebasedontheMNWBWelfareGuide.MWCsoftenoffermorethanonekindofsupportthereforenumbersdonotsumto81.
3.17
3.18
27
31
38
43
45
0 10 20 30 40 50
ACCOMMODATION
ADVICE
SUPPORT
OTHER (e.g. seafarer centres, international, training)
FINANCIAL ASSISTANCE / GRANT-MAKING
10
16
39
0 10 20 30 40 50
Both
Grants to organisations
Grants for individuals
Grants (45)
6
9
10
12
15
18
0 5 10 15 20
Community centres
Associations
Education/Training
Projects / research
Seafarer Centres
International Seafarers
Other (43)
Financial assistance / grant-making
Other (e.g. Seafarer Centres, international, training)
Support
Advice
Accommodation
N

Navigating Change: A Review of the UK Maritime Welfare Charity Sector | 2017 71
FIGURE 3.18
An in-depth look at the support provided by maritime welfare charities (Number of charities within each sub-section offering services)210
The sector has a higher proportion of grant-makers compared with the third sector at large (but comparable to the Armed Forces sector211). Within the grant-making charities, the vast majority (39) make grants to individuals, while one third (16) make grants to other organisations (usually other maritime welfare charities); nearly one quarter (10) do both. This compares with 53% of wider third sector grants going to other voluntary sector organisations, while only 4% goes to individuals212. In terms of finances, grants to other organisations make up 21% of total expenditure (£19M), while grants to individuals make up 11% of total expenditure (£9.6M).
Maritime welfare charities responding to the online survey were asked how strongly they agreed or disagreed that support is ‘adequate’ for seafarers in a number of different areas (see Table 3.2). Some categories received a very high level of ‘don’t know’ responses, which is perhaps another indication that the maritime
210 See Sections 6 and 7 for more detail on housing and benevolence provision.211 See Pozo and Walker (2014) 212 42% goes to government bodies and universities.
3.17
3.18
27
31
38
43
45
0 10 20 30 40 50
ACCOMMODATION
ADVICE
SUPPORT
OTHER (e.g. seafarer centres, international, training)
FINANCIAL ASSISTANCE / GRANT-MAKING
10
16
39
0 10 20 30 40 50
Both
Grants to organisations
Grants for individuals
Grants (45)
6
9
10
12
15
18
0 5 10 15 20
Community centres
Associations
Education/Training
Projects / research
Seafarer Centres
International Seafarers
Other (43)
2
6
11
13
15
15
23
0 5 10 15 20 25
Medical
Disability
Families
Emergency
Spiritual
Bereavement
Social / Fellowship
Support (38)
2
2
3
3
4
26
0 10 20 30
Debt management
Benefits
Pensions
Legal
Employment
Welfare
Advice (31)
3
5
6
19
0 5 10 15 20
Hostels
Care homes
Holidays
Sheltered Housing
Accommodation (27)
2
6
11
13
15
15
23
0 5 10 15 20 25
Medical
Disability
Families
Emergency
Spiritual
Bereavement
Social / Fellowship
Support (38)
2
2
3
3
4
26
0 10 20 30
Debt management
Benefits
Pensions
Legal
Employment
Welfare
Advice (31)
3
5
6
19
0 5 10 15 20
Hostels
Care homes
Holidays
Sheltered Housing
Accommodation (27)
3.17
3.18
27
31
38
43
45
0 10 20 30 40 50
ACCOMMODATION
ADVICE
SUPPORT
OTHER (e.g. seafarer centres, international, training)
FINANCIAL ASSISTANCE / GRANT-MAKING
10
16
39
0 10 20 30 40 50
Both
Grants to organisations
Grants for individuals
Grants (45)
6
9
10
12
15
18
0 5 10 15 20
Community centres
Associations
Education/Training
Projects / research
Seafarer Centres
International Seafarers
Other (43)
2
6
11
13
15
15
23
0 5 10 15 20 25
Medical
Disability
Families
Emergency
Spiritual
Bereavement
Social / Fellowship
Support (38)
2
2
3
3
4
26
0 10 20 30
Debt management
Benefits
Pensions
Legal
Employment
Welfare
Advice (31)
3
5
6
19
0 5 10 15 20
Hostels
Care homes
Holidays
Sheltered Housing
Accommodation (27)
NN
N N
N
Projects/Research
Sheltered housing

Navigating Change: A Review of the UK Maritime Welfare Charity Sector | 2017 72
welfare charity sector is a diverse and disparate rather than holistic entity, with many charities very focused on their own sphere of operation rather than ‘the bigger picture’.
Regarding the provision of services, maritime charities surveyed are more likely to feel that there is adequate provision of money and debt advice services. The development of services offered by SAIL since the 2007 study is no doubt contributing to the perception of better provision in this respect.
Maritime welfare charities surveyed feel that there is inadequate provision of: health rehabilitation services, emotional support for seafarers and their families, services with an emphasis on social isolation, information about minority ethnic seafarers, and suitable accommodation for retired seafarers213.
TABLE 3.2
How strongly do you agree or disagree that there is adequate…214
Agree/Disagree whether there is ADEQUATE….
Base
(all giving a rating)
Disagree (1-4)
Agree (7-10)
Net Agree
Money and debt advice for seafarers 36 31% 42% 11
Use of internet-based technology to support seafarers and their dependants
36 39% 19% -20
Provision of emotional support for seafarers and their families
35 40% 17% -23
Emphasis on addressing social isolation 36 47% 14% -33
Encouragement and support for young people wishing to pursue careers in the maritime sector
27 63% 11% -52
Information available on minority ethnic workers in the maritime sector
17 65% 6% -59
Health rehabilitation services for working seafarers to return to work
17 76% 6% -70
213 Only 16% of maritime welfare charities agree that ‘current accommodation for retired seafarers is adequate for their needs’. Online survey (all Maritime charities responding, n=43)
214 Online survey (all Maritime charities responding, as shown in table)

Navigating Change: A Review of the UK Maritime Welfare Charity Sector | 2017 73
3.8 AN INSIDE VIEW OF THE MARITIME WELFARE CHARITY SECTOR
While almost half of MWCs surveyed feel that maritime welfare charities collaborate ‘effectively with one another’ (47% vs 23% who disagree), interview respondents highlight some barriers to a more cohesive sector as being cross-sector information sharing and sign-posting. Whilst many highlight how this has improved markedly since the 2007 ‘Supporting Seafarers’ report, through channels such as the MNWB Working Groups, Port Welfare Committees, SAIL, MCG and Cobseo, it is felt that further improvement is required.
Almost two-fifths agree that ‘maritime charities are good at sharing best practice’ (37%), and that there is ‘adequate signposting within the maritime sector’ (39%), a third (32%) also disagree with each statement.
FIGURE 3.19
How strongly do you agree or disagree with each of these statements about the Maritime Charity Sector?215
Some comment how information and best practice sharing has improved markedly since 2007:
I think there is [adequate signposting] now. Organisations like SAIL and the Merchant Navy Welfare Board are far more proficient. SAIL is a fairly recent organisation – certainly, years ago, we didn’t have anything, but now people are much more savvy and much more aware
[MN, Under £100K]
However, some feel that the existing forums are too broad to be truly effective, with a need to focus more specifically on support provision or beneficiary type.
The MNWB working group [is] quite a large group of folk, almost too large, with many disparate interests…it’s hard to get any in-depth discussion about particular issues...It tends to be a bit superficial, the discussion…It’s quite hard to get a community of shared interests
[MN, £1M-£5M]
215 Online survey and tele-depth interviews (all Maritime charities responding, n=59)
% Agree (7-10)
% Disagree
(1-4)
32% 37%
39%32%
3.19
3%
3%
8%
5%
24%
27%
25%
27%
32%
34%
7%
3%
There is adequate signposting within the maritime sector pointing beneficiaries
towards the right charity or service to meet their needs
Maritime charities are good at sharing information and best practice
Don't know 1-2 (Completely Disagree) 3-4 5-6 7-8 9-10 (Completely Agree)

Navigating Change: A Review of the UK Maritime Welfare Charity Sector | 2017 74
For me, there was the cost of getting up to London, going to a meeting and not hearing anything of any interest and then leaving – it was all very nice seeing people, but that’s not what the point is. That’s what worries me, that it’s something that is a social talking shop
[MN, £100K-£500K]
Similarly, sign-posting across the sector requires improved efforts. Whilst some issues derive from awareness amongst the beneficiary population itself (see Section 9), some believe that maritime welfare charities need
to do much more in this respect.
When women or dependants come to us, they can’t find us direct, they try lots of other charities and they don’t seem to get any luck with them, and they don’t point them to us. The direction from one charity to another, unaware of the charity next door, so ‘we can’t help you, but there’s a good charity next door that could help you’, this type of approach
[MN/FF, Under £100K]
A concern was also raised that the sector understanding which facilitates sign-posting between individual maritime charities often lies with the Chief Executive, and that as individuals move on, such knowledge may be lost.
Half (47%) of the maritime charities surveyed agree that ‘maritime charities collaborate with each other effectively’216. Of those anticipating a change in beneficiary demand, 50% have already or intend to collaborate or partner with another organisation in the next 12 months in response217. As context, eight-in-ten of those responding to the Association of Charitable Organisations’ 2017 membership survey ‘work collaboratively’218.
In some of the more focused areas of support, collaboration appears – anecdotally at least – to be particularly well established and effective. For example, there are instances of different accommodation providers moving residents between their facilities – from independent living to nursing home – when the former is no longer suitable. Similarly, those supporting serving seafarers within port have open channels of communication, such as the ‘Partners in Mission’ forum and the Port Welfare Committees.
We had an elderly couple here, who would have stayed here, but because the accommodation couldn’t meet their needs they had to move elsewhere, so they moved to another maritime provider that could provide that
[RNRM/MN/FF, £500K-£1M]
We’ve had someone that’s not quite a fit with us, we’ve passed their details to one of the other [accommodation providers] and said, maybe you ought to do that, and vice versa. So, there’s always been an element of it, it’s just that through those particular groups - the Maritime Charities Funding Group, as it was, working groups, Cobseo has a cluster on elderly care - and continual conferences, where every year I rub shoulders with…my compatriots…around the maritime charity world, and we’re getting to know each other much better
[RNRM/MN/FF, £1M-£5M]
216 Online survey and tele-depth interviews (all Maritime charities responding, n=56) 217 Onlinesurvey(allMaritimecharitiesanticipatingachangeinbeneficiarydemandresponding,n=34)218 Association of Charitable Organisations is the national UK umbrella body for Trusts and Foundations that give grants and welfare support to individuals in need. ACO
(2017)

Navigating Change: A Review of the UK Maritime Welfare Charity Sector | 2017 75
In terms of the welfare charities, the face-to-face ones, which are the main players on that level, we do talk together, we do try and work together in local ports, we do try and ensure that we’re pulling in the same direction…In the UK, we have this thing called ‘Partners in Mission’ where the main faith-based societies meet together, the leaders talk together about their issues, particularly with regard to work in the UK, and try to maintain joined-up thinking
[MN/FF, £1M-£5M]
However, if there is a desire to propagate a more joined-up and holistic maritime welfare charity sector, with greater co-ordination of beneficiary support, then further efforts will need to be made.
Everyone talks about working in partnership, but I think it is actually coming to do it, walking the walk rather than talking the talk, I think that’s one of the main challenges of how we do actually work in partnership
[MN, £100K-£500K]
I have heard the charities described as a bunch of card players holding their cards to themselves and only occasionally putting one down for others
[MN/FF, £1M-£5M]

Navigating Change: A Review of the UK Maritime Welfare Charity Sector | 2017 76
3.9 CONCLUSIONS
The maritime welfare charity sector described in this chapter is heavily weighted towards provision for RNRM beneficiaries while fewer resources at present are primarily directed towards MN and FF beneficiaries. While there are a higher number of RNRM beneficiaries (58%), in general these are likely to have fewer needs (particularly in later life), and more support from other sources also caters to this group.
And while some feel that there is more in common between all seafarers than that which differentiates them, many see the sector as ‘fragmented’ and ‘disparate’ – not working together as one; with a split between those catering primarily for RNRM and those catering primarily for MN and FF. In our survey of maritime welfare charities, however, 64% felt that seafarers’ needs are such that they require specialist maritime welfare charities outside of mainstream services219. Whilst it is perhaps understandable that this is thought necessary, given that our research sample is comprised largely of specialist maritime welfare charities, it is supported by the beneficiaries themselves, with many commenting on the value of the understanding that maritime welfare charities have about the pressures of seafaring life and its impact on partners and children. There is also a strongly held belief amongst working age seafarers and their families that their lives are different to those of other families: 86% agree that ‘seafarers’ families have different needs from most families’220. This thereby underlines the value of a specialised maritime welfare charity sector.
Having an acknowledged identity and tighter bonds between organisations in the maritime welfare charity sector could be beneficial for both charities and beneficiaries. For example, having a defined ‘sector’ might engender more co-operation and support amongst maritime welfare charities making the whole stronger than the sum of its parts; while greater coordination of support for beneficiaries should increase their wellbeing.
This could potentially involve tri-maritime charities (those providing support for RNRM, MN and FF) offering more support to MN and FF beneficiaries and, where possible, filling in some gaps; greater coordination amongst MN/FF organisations to ‘mirror’ the available support network for RNRM beneficiaries; and potentially more help for smaller charities from larger ones where their unique services are recognised and supported.
219 Online survey and tele-depth interviews (all Maritime charities responding, n=58) 220 IPC (2016)

Navigating Change: A Review of the UK Maritime Welfare Charity Sector | 2017 77
FO
UR

Navigating Change: A Review of the UK Maritime Welfare Charity Sector | 2017 78
The level of total funds also dipped during the recession due to the high reliance on investments which fell prey to stock market oscillations and this may have scared some charities into holding on to their money
The level of funds held in reserve of the largest MWCs increased slightly during the global recession, suggesting that at least some MWCs decided on a path of caution during these years – curbing spending and maintaining/building up funds held in reserve for the next rainy day
However, this aggregated view hides a more complex picture, with a number of individual MWCs drawing down on their investments at some point in the last 5 years to maintain higher levels of spending despite lower income
The experience of the last decade has been different for different charities, such that larger charities, those providing accommodation and grants to other charities and those serving the RNRM fared best over the last decade; and smaller charities, those providing benevolent grants to individuals, and those serving MN/FF fared less well over the last decade
Two-thirds of MWCs experienced increased demand over the last five years, while others struggled to find beneficiaries as the maritime population declines. The greatest increase in demand was reported by MWCs with FF beneficiaries
On the whole, MWCs performed similarly to the wider third sector and other benevolent charities through the turbulence of the last decade, employing many similar strategies – but more lessons could still be learned
4. A DECADE OF CHANGE – THE MARITIME WELFARE CHARITY SECTOR 2005-2015
Surviving global recession, austerity measures and increasing demand
The maritime welfare charity sector has streamlined over the last decade, shrinking in numbers, largely reflecting amalgamations and efficiencies in the RNRM section
During the global recession, the sector’s overall income flattened out, only picking up from 2013 onwards
While overall spending increased in the first couple of years of the recession keeping pace with demand, it fell in 2010, only picking up again from 2014 onwards
THE MWC SECTOR OVERALL STREAMLINED IN NUMBERS AND STALLED FINANCIALLY DURING THE RECESSION; WHILE LARGER MWCS AND THOSE SERVING RNRM BENEFICIARIES SURVIVED AND THRIVED BEST. LOOKING AT THE SECTOR AS A WHOLE, FUNDS HELD IN RESERVE WERE NOT UTILISED TO AUGMENT SPENDING TO ANY SIGNIFICANT DEGREE
KEY POINT 4

Navigating Change: A Review of the UK Maritime Welfare Charity Sector | 2017 79
The imbalance in the sector towards relatively greater support for RNRM beneficiaries has been exacerbated over the last decade making it even more important to address now. With hindsight, the sector could have spent more of its funds held in reserve during this difficult period, and not doing so may have stored up greater problems for the future as far as beneficiary needs are concerned

Navigating Change: A Review of the UK Maritime Welfare Charity Sector | 2017 80
4.1 THE GLOBAL RECESSION, AUSTERITY MEASURES AND INCREASING DEMAND
The last ten years have seen massive upheavals in the UK economy and third sector. The credit crunch, followed by global recession, followed by austerity measures and cuts in government funding for social support have all contributed to increased need and demand for support by the more vulnerable in society.
For charities this has meant a big squeeze – more demand and less funding.
4.1 .1 A CHANGE IN DEMAND
Despite an overall decline in the beneficiary population, many maritime welfare charities (MWCs) experienced increased demand during the last decade (whether in sheer numbers or depth and complexity of need). In fact, almost two-thirds (63%) of those MWCs responding to the online survey experienced an increase in demand for their services over the last 5 years221. It seems likely that at least some of this increase was due to the multiple effects of the global recession and austerity measures impacting seafarers. Those charities supporting the Fishing Fleet (FF) are most likely to have seen an increase in demand, 72% compared to 70% of those supporting Merchant Navy (MN) seafarers and 64% amongst those supporting Royal Navy and Royal Marines (RNRM)222.
This lower rate of increased demand among RNRM beneficiaries is echoed in the tri-Service charities surveyed, just under half (47%) of which reported an increase in demand over the last 5 years. This may also
be as a result of a fall-off in the numbers seeing active service since the drawdown in Iraq and Afghanistan223.
FIGURE 4.1Over the last 12 months / 5 years, has demand for your services/support from your end beneficiaries increased or decreased224?
One quarter (24%) of MWCs and 18% of tri-Service charities surveyed experienced a decrease in demand over the last 5 years, in keeping with a declining beneficiary population, which, for some, has
led to a decrease in spending.
221 Online survey (all Maritime charities responding, n=41 / all tri-Service charities responding, n=17) 222 Ibid,Maritimecharitiesmayservemorethanonebeneficiarygroup,andsotheirresponseswillappearineachofthesegmentsserved(allMaritimecharities
responding, RNRM=22, MN=27, FF=18) 223 Ibid (all tri-Service charities responding, n=17) 224 Ibid, (all Maritime charities responding, n=44)
4.1
4.2
4.3
2%
2%
22%
10%
12%
36%
34%
24%
29%
29%
Over the last 5 years (n=41)
Over the last 12 months (n=42)
Decrease a lot Decrease a little Remain the same Increase a little Increase a lot
2005 2006 2007 2008 2009 2010 2011 2012 2013 2014 2015
Maritime welfare charities
Income (real-terms) Extra income (real-terms)
Third sector at large
% Decreased
% Increased
12% 52%
63%24%
Expenditure on grants decreased reflecting the ongoing decline in beneficiaries
[MN/FF, £1M-£5M]
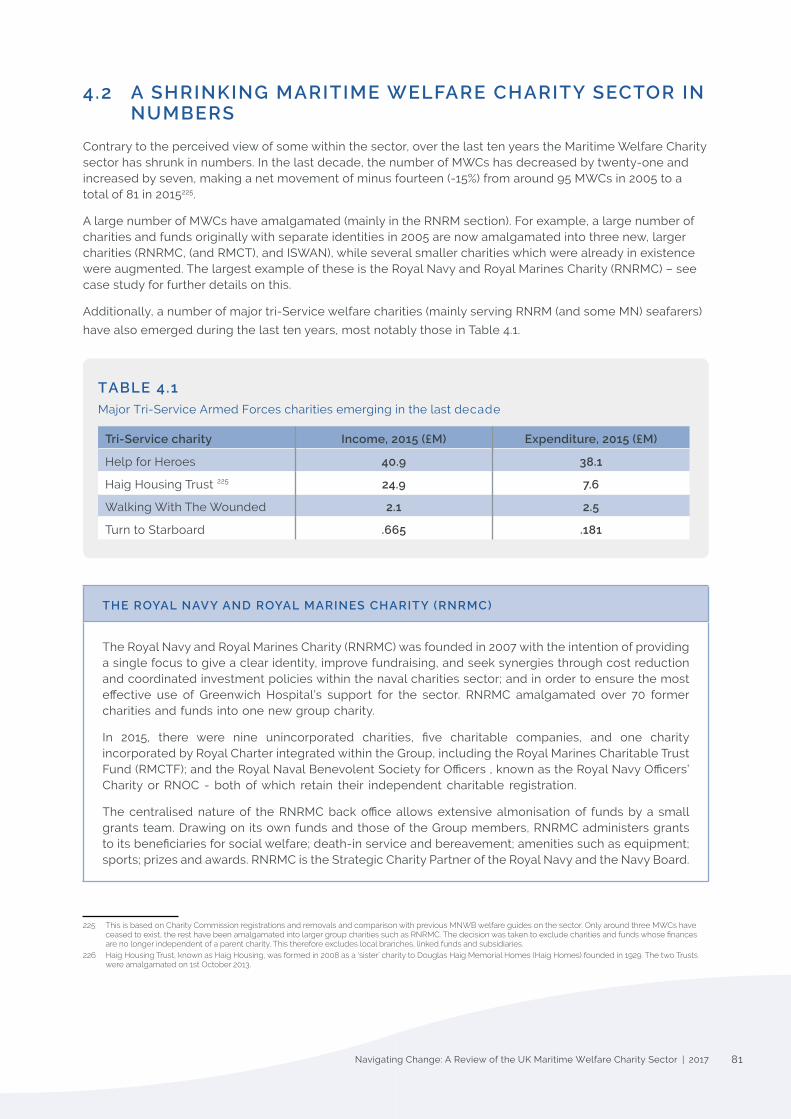
Navigating Change: A Review of the UK Maritime Welfare Charity Sector | 2017 81
4.2 A SHRINKING MARITIME WELFARE CHARITY SECTOR IN NUMBERS
Contrary to the perceived view of some within the sector, over the last ten years the Maritime Welfare Charity sector has shrunk in numbers. In the last decade, the number of MWCs has decreased by twenty-one and increased by seven, making a net movement of minus fourteen (-15%) from around 95 MWCs in 2005 to a total of 81 in 2015225.
A large number of MWCs have amalgamated (mainly in the RNRM section). For example, a large number of charities and funds originally with separate identities in 2005 are now amalgamated into three new, larger charities (RNRMC, (and RMCT), and ISWAN), while several smaller charities which were already in existence were augmented. The largest example of these is the Royal Navy and Royal Marines Charity (RNRMC) – see case study for further details on this.
Additionally, a number of major tri-Service welfare charities (mainly serving RNRM (and some MN) seafarers)
have also emerged during the last ten years, most notably those in Table 4.1.
TABLE 4.1Major Tri-Service Armed Forces charities emerging in the last decade
Tri-Service charity Income, 2015 (£M) Expenditure, 2015 (£M)
Help for Heroes 40.9 38.1
Haig Housing Trust 24.9 7.6
Walking With The Wounded 2.1 2.5
Turn to Starboard .665 .181
225 This is based on Charity Commission registrations and removals and comparison with previous MNWB welfare guides on the sector. Only around three MWCs have ceasedtoexist,theresthavebeenamalgamatedintolargergroupcharitiessuchasRNRMC.Thedecisionwastakentoexcludecharitiesandfundswhosefinancesare no longer independent of a parent charity. This therefore excludes local branches, linked funds and subsidiaries.
226 Haig Housing Trust, known as Haig Housing, was formed in 2008 as a ‘sister’ charity to Douglas Haig Memorial Homes (Haig Homes) founded in 1929. The two Trusts were amalgamated on 1st October 2013.
225
THE ROYAL NAVY AND ROYAL MARINES CHARITY (RNRMC)
The Royal Navy and Royal Marines Charity (RNRMC) was founded in 2007 with the intention of providing a single focus to give a clear identity, improve fundraising, and seek synergies through cost reduction and coordinated investment policies within the naval charities sector; and in order to ensure the most effective use of Greenwich Hospital’s support for the sector. RNRMC amalgamated over 70 former charities and funds into one new group charity.
In 2015, there were nine unincorporated charities, five charitable companies, and one charity incorporated by Royal Charter integrated within the Group, including the Royal Marines Charitable Trust Fund (RMCTF); and the Royal Naval Benevolent Society for Officers , known as the Royal Navy Officers’ Charity or RNOC - both of which retain their independent charitable registration.
The centralised nature of the RNRMC back office allows extensive almonisation of funds by a small grants team. Drawing on its own funds and those of the Group members, RNRMC administers grants to its beneficiaries for social welfare; death-in service and bereavement; amenities such as equipment; sports; prizes and awards. RNRMC is the Strategic Charity Partner of the Royal Navy and the Navy Board.

Navigating Change: A Review of the UK Maritime Welfare Charity Sector | 2017 82
4.3 INCOME 2005-2015
Total income stagnated during the recession years (2008-2012) only recovering in the last three years due to exceptional income for a small number of charities227 - shown in grey in Figure 4.2.
FIGURE 4.2
Total income of maritime welfare charities compared with the third sector at large, 2005-2015 (real-terms, £M)228
The overall pattern of income for the maritime welfare charity sector largely resembles the characteristic effect of the global recession seen in the wider third sector where 2008 forms the high point of the pre-recession years, following several years of robust growth, followed by a fall in 2009 and 2010, and finally recovery from 2013 onwards.
In 2008, the maritime welfare charities generally experienced an uplift, although there was also exceptional income of £4 million which is shown in grey229. Likewise, the uplift in 2013/14/15 has been partly due to
227 Largely ITF Seafarers Trust and LIBOR money which went to several RNRM charities – see footnotes 229 and 231.228 The maritime welfare charity chart shows data from 48/81 MWCs which provided data for all ten years, covering approximately 47% of the total sector’s income in 2015,
and therefore should be considered indicative only. 229 In2008theRNBSOandARNOCharitableTrustmergedandarenowknownbytheworkingtitleoftheRoyalNavyOfficers’Charity(RNOC)–thisaddedaround£4
million in exceptional income in this year. It should be noted, however, that part of the uplift in 2008 was accounted for by a few MWCs which had notable years for income (income in 2008 exceeded income for both 2007 and 2009):• TheNautilusWelfareFund(£2.4Mcomparedwith£2Mthepreviousyear)• TheRoyalNationalMissiontoDeepSeaFishermen(£3.6Mcomparedwith£2.8mthepreviousyear)• TheSailor’sSociety(£3.7Mcomparedwith£2.2Mthepreviousyear)• TheITFSeafarersTrust(£3.7Mcomparedwith£2.1M)• TheMarineSocietyandSeaCadets(£13.2Mcomparedwith£11.3M)
4.1
4.2
4.3
2%
2%
22%
10%
12%
36%
34%
24%
29%
29%
Over the last 5 years (n=41)
Over the last 12 months (n=42)
Decrease a lot Decrease a little Remain the same Increase a little Increase a lot
2005 2006 2007 2008 2009 2010 2011 2012 2013 2014 2015
Maritime welfare charities
Income (real-terms) Extra income (real-terms)
Third sector at large
year
£M
year
£M
4.1
4.2
4.3
2%
2%
22%
10%
12%
36%
34%
24%
29%
29%
Over the last 5 years (n=41)
Over the last 12 months (n=42)
Decrease a lot Decrease a little Remain the same Increase a little Increase a lot
2005 2006 2007 2008 2009 2010 2011 2012 2013 2014 2015
Maritime welfare charities
Income (real-terms) Extra income (real-terms)
Third sector at large

Navigating Change: A Review of the UK Maritime Welfare Charity Sector | 2017 83
exceptional income230, and partly due to exceptional grants awarded to charities out of money paid in fines by banks for fixing the London Inter-Bank Offered Rate (LIBOR).
Over £450 million from LIBOR fines had been made available to charities supporting Armed Forces veterans by 2015231. In our online survey of 46 maritime charities, ten (22%) reported receiving LIBOR grants. All of these ten charities serve RNRM beneficiaries, five also support MN and four FF. It is estimated that around 70% of the LIBOR money awarded to these charities was spent specifically on maritime beneficiaries. While much LIBOR money is restricted to Forces ‘veterans’, some MN and FF have supported military operations (see the recent successful bid by Seafarers UK in 2017) and other bids around seafarers might be supported in future.
While it is difficult to calculate exactly how much LIBOR money has been awarded to MWCs over the last three years as it is not always declared separately in accounts, some £6 million has been identified in 2015 accounts, representing 5% of the 2015 total income figures232. A much larger amount of LIBOR money went to tri-Service charities and those supporting the other branches of the Armed Forces233.
When the exceptional income of ITF Seafarers Trust and the LIBOR money (2015) is excluded, the sector’s income has grown by just 9% over the period (compared with 23% when the exceptional income is included).
230 ITFSeafarersTrustreceivedanexceptionalgiftof£5.99millionin2013and£10millionin2014fromtheInternationalTransportWorkers’Federation(ITF)to‘allowtheTrust’s annual expenditure to be increased in the period 2015-2018. The Trustees intend to continue support to several previous grantees, to perform more research into the needs of maritime workers and their families, and aim to become more proactive in grant making…’
231 MoD (2015b) 232 Thelargestgrantbyfarwas£4.9millionawardedtoRNRMCfortherefurbishmentorrebuildingoftheDrumforkClubinHelensburgh,arefurbishmentoftheWO8Senior
RatesMessonHMSSultanandthedevelopmentof3self-containedfamilyflatsforsoleuseofServicePersonnelatNavyMews.RNRMCreceivedafurther£1Min2014.233 Forexample,HelpforHeroesreceived£3Min2015fortheirrecoveryservices;RoyalBritishLegionreceived£3Mforanewveteran’smobilityscheme;Alabarereceived
£3.5MforhousingandSSAFAreceived£60Kin2015forShortBreaks,MutualSupport,MentalHealthFirstAidandMentoring.
© C
row
n Im
age
s
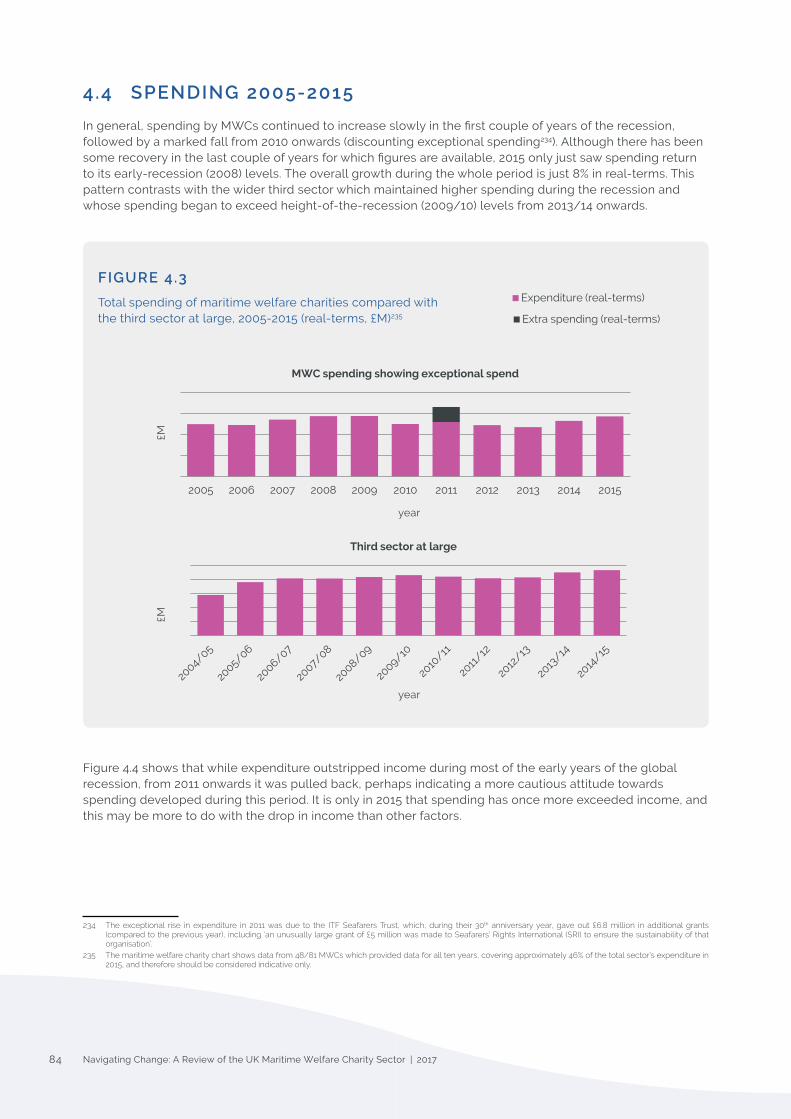
Navigating Change: A Review of the UK Maritime Welfare Charity Sector | 2017 84
4.4 SPENDING 2005-2015
In general, spending by MWCs continued to increase slowly in the first couple of years of the recession, followed by a marked fall from 2010 onwards (discounting exceptional spending234). Although there has been some recovery in the last couple of years for which figures are available, 2015 only just saw spending return to its early-recession (2008) levels. The overall growth during the whole period is just 8% in real-terms. This pattern contrasts with the wider third sector which maintained higher spending during the recession and whose spending began to exceed height-of-the-recession (2009/10) levels from 2013/14 onwards.
FIGURE 4.3
Total spending of maritime welfare charities compared with the third sector at large, 2005-2015 (real-terms, £M)235
Figure 4.4 shows that while expenditure outstripped income during most of the early years of the global recession, from 2011 onwards it was pulled back, perhaps indicating a more cautious attitude towards spending developed during this period. It is only in 2015 that spending has once more exceeded income, and this may be more to do with the drop in income than other factors.
234 The exceptional rise in expenditure in 2011 was due to the ITF Seafarers Trust, which, during their 30th anniversary year, gave out £6.8 million in additional grants(comparedtothepreviousyear), including‘anunusuallylargegrantof£5millionwasmadetoSeafarers’RightsInternational(SRI)toensurethesustainabilityofthatorganisation’.
235 The maritime welfare charity chart shows data from 48/81 MWCs which provided data for all ten years, covering approximately 46% of the total sector’s expenditure in 2015, and therefore should be considered indicative only.
4.4
4.5
2005 2006 2007 2008 2009 2010 2011 2012 2013 2014 2015
MWC spending showing exceptional spend
Expenditure (real-terms) Extra spending (real-terms)
Third sector at large
£30,000,000 £35,000,000 £40,000,000 £45,000,000 £50,000,000 £55,000,000
2005 2006 2007 2008 2009 2010 2011 2012 2013 2014 2015
Income (real-terms) Expenditure (real-terms)
year
£M
4.4
4.5
2005 2006 2007 2008 2009 2010 2011 2012 2013 2014 2015
MWC spending showing exceptional spend
Expenditure (real-terms) Extra spending (real-terms)
Third sector at large
£30,000,000 £35,000,000 £40,000,000 £45,000,000 £50,000,000 £55,000,000
2005 2006 2007 2008 2009 2010 2011 2012 2013 2014 2015
Income (real-terms) Expenditure (real-terms)
year
£M

Navigating Change: A Review of the UK Maritime Welfare Charity Sector | 2017 85
FIGURE 4.4
Income and expenditure of the maritime welfare charities 2005-2015, real-terms236
The experience of the last decade has been different for different groups of maritime welfare charities (according to size, type of support offered and the workforce they primarily serve), such that larger charities, those providing accommodation and grants to other charities, and those serving the RNRM performed best over the last decade; and smaller charities, those providing benevolent grants to individuals, and those serving MN/FF performed less well over the last decade. These findings do not apply to each individual charity of course but give an indication of how groups of charities have fared overall.
4.4.1 THE LAST DECADE, BY THE WORKFORCE PRIMARILY SERVED
Figures 4.5 and 4.6 show the total income and expenditure of a sample of maritime welfare charities between 2005-2015 in real-terms. The analysis shows that the income and spending of MWCs primarily serving:
• MN/FF beneficiaries fell by -4% and -5% respectively
• RNRM beneficiaries increased by 49% in both cases
• All three workforces (tri-maritime) rose by 34% and 11% respectively
FIGURE 4.5
Income of charities primarily supporting each of the three seafaring workforces, 2005-2015 (real-terms)237
236 Excludingexceptionalincomeandexpenditure.237 Analysis based on the 47/81 charities which provided long-term data covering all ten years (21 MN/FF, 13 RNRM, 13 tri-maritime (all 3 workforces)). Note that ITF Seafarers
Trust was excluded from this analysis as its exceptional income in 2013/14 made it an outlier which skewed the data, and the exceptional income of RNBSO in 2008 was also excluded. Figures show linear trend lines.
4.4
4.5
2005 2006 2007 2008 2009 2010 2011 2012 2013 2014 2015
MWC spending showing exceptional spend
Expenditure (real-terms) Extra spending (real-terms)
Third sector at large
£30,000,000 £35,000,000 £40,000,000 £45,000,000 £50,000,000 £55,000,000
2005 2006 2007 2008 2009 2010 2011 2012 2013 2014 2015
Income (real-terms) Expenditure (real-terms)
4.6
4.7
2004 2006 2008 2010 2012 2014 2016
Income MN/FF (real-terms) Income RN/RM (real-terms) Income Tri-M (real-terms)
2004 2006 2008 2010 2012 2014 2016
Exp MN/FF (real-terms) Exp RN/RM (real-terms) Exp Tri-M (real-terms)
year£M
4.4
4.5
2005 2006 2007 2008 2009 2010 2011 2012 2013 2014 2015
MWC spending showing exceptional spend
Expenditure (real-terms) Extra spending (real-terms)
Third sector at large
£30,000,000 £35,000,000 £40,000,000 £45,000,000 £50,000,000 £55,000,000
2005 2006 2007 2008 2009 2010 2011 2012 2013 2014 2015
Income (real-terms) Expenditure (real-terms)
year
£M
4.6
4.7
2004 2006 2008 2010 2012 2014 2016
Income MN/FF (real-terms) Income RN/RM (real-terms) Income Tri-M (real-terms)
2004 2006 2008 2010 2012 2014 2016
Exp MN/FF (real-terms) Exp RN/RM (real-terms) Exp Tri-M (real-terms)
4.6
4.7
2004 2006 2008 2010 2012 2014 2016
Income MN/FF (real-terms) Income RN/RM (real-terms) Income Tri-M (real-terms)
2004 2006 2008 2010 2012 2014 2016
Exp MN/FF (real-terms) Exp RN/RM (real-terms) Exp Tri-M (real-terms)
4.6
4.7
2004 2006 2008 2010 2012 2014 2016
Income MN/FF (real-terms) Income RN/RM (real-terms) Income Tri-M (real-terms)
2004 2006 2008 2010 2012 2014 2016
Exp MN/FF (real-terms) Exp RN/RM (real-terms) Exp Tri-M (real-terms)
Income Tri-M (real-terms)
Income MN/FF (real-terms)
Income RNRM (real-terms)

Navigating Change: A Review of the UK Maritime Welfare Charity Sector | 2017 86
FIGURE 4.6
Expenditure of charities primarily supporting each of the three seafaring workforces, 2005-2015 (real-terms)238
4.4.2 BY SIZE
Small MWCs’ income and spending was more volatile over the last decade than medium or large charities. They experienced an overall fall in income of nearly one-fifth in real-terms (-17%) between 2005 and 2015, and while their expenditure mirrored their income quite closely, they finished the decade with expenditure up by 6.3% in real-terms. During the worst years of the recession smaller MWCs spent more than they received.
Medium-sized MWCs also experienced a real-terms fall in income of nearly one-fifth (-17%) over the decade, but while they also spent marginally more between 2006-2012 during the worst of the recession, they experienced an overall decline in total expenditure of -4% between 2005-2015.
For large MWCs income rose strongly over the period, seemingly untroubled by the recession, increasing by more than one third (38%) in real-terms. While expenditure appears to have kept pace, in real-terms it increased by less than one-fifth (17%) over the period (and a large part of this growth has been in the last 3 years analysed).
FIGURE 4.7
Small, Medium and Large MWCs’ fortunes over the last decade (real-terms)239
238 Analysis based on the 47/81 charities which provided long-term data covering all ten years (21 MN/FF, 13 RNRM, 13 tri-maritime (all 3 workforces)). Note that ITF Seafarers Trust was excluded from this analysis as its exceptional income in 2013/14 made it an outlier which skewed the data.
239 Analysisbasedonthe43/81charitieswhichprovidedlong-termdatacoveringalltenyears(15small,17medium,and11large).‘Small’=incomeoflessthan£100Kperannum;‘Medium’=incomebetween£100K-£1million;‘Large’=incomeofover£1million.
4.6
4.7
2004 2006 2008 2010 2012 2014 2016
Income MN/FF (real-terms) Income RN/RM (real-terms) Income Tri-M (real-terms)
2004 2006 2008 2010 2012 2014 2016
Exp MN/FF (real-terms) Exp RN/RM (real-terms) Exp Tri-M (real-terms)
2004 2006 2008 2010 2012 2014 2016
Small MWCs
INCOME (real-terms)
EXPENDITURE (real-terms)
2004 2006 2008 2010 2012 2014 2016
Medium MWCs
INCOME (real-terms)
EXPENDITURE (real-terms)
2004 2006 2008 2010 2012 2014 2016
Large MWCs
INCOME (real-terms)
EXPENDITURE (real-terms)
2004 2006 2008 2010 2012 2014 2016
Small MWCs
INCOME (real-terms)
EXPENDITURE (real-terms)
2004 2006 2008 2010 2012 2014 2016
Medium MWCs
INCOME (real-terms)
EXPENDITURE (real-terms)
2004 2006 2008 2010 2012 2014 2016
Large MWCs
INCOME (real-terms)
EXPENDITURE (real-terms)
4.6
4.7
2004 2006 2008 2010 2012 2014 2016
Income MN/FF (real-terms) Income RN/RM (real-terms) Income Tri-M (real-terms)
2004 2006 2008 2010 2012 2014 2016
Exp MN/FF (real-terms) Exp RN/RM (real-terms) Exp Tri-M (real-terms)
4.6
4.7
2004 2006 2008 2010 2012 2014 2016
Income MN/FF (real-terms) Income RN/RM (real-terms) Income Tri-M (real-terms)
2004 2006 2008 2010 2012 2014 2016
Exp MN/FF (real-terms) Exp RN/RM (real-terms) Exp Tri-M (real-terms)
4.6
4.7
2004 2006 2008 2010 2012 2014 2016
Income MN/FF (real-terms) Income RN/RM (real-terms) Income Tri-M (real-terms)
2004 2006 2008 2010 2012 2014 2016
Exp MN/FF (real-terms) Exp RN/RM (real-terms) Exp Tri-M (real-terms)
Expenditure Tri-M (real-terms)
Expenditure MN/FF (real-terms)
Expenditure RNRM (real-terms)
year
£M
Income (real-terms)
Expenditure (real-terms)
year
£M

Navigating Change: A Review of the UK Maritime Welfare Charity Sector | 2017 87
FIGURE 4.7 CONT.
It is also worth noting that while there is a good spread of different size charities serving each seafaring workforce, there are notably more large charities serving RNRM seafarers and dependants (35%) than those serving MN/FF (19%). It is also these larger charities which have mainly benefitted from the LIBOR money coming into the sector. Meaning that once again, charities supporting RNRM are relatively better served financially.
4.4.3 BY TYPE OF SUPPORT OFFERED
While spending on grant-making, benevolence and accommodation fell slightly in real-terms during the recession years (2007-2012), a strong recovery since then has seen spending in all three categories increase (by 8% for benevolence, 25% for accommodation and 27% for grant-making). Spending on benevolence has only just exceeded 2005 levels in 2015.
FIGURE 4.8
Expenditure over last decade by type of MWC support provided, real-terms240241
Amongst the sector’s grant-makers surveyed, around half suggest that the number of grants given and the average amount given per grant has remained largely the same over the last five years (58% and 50% respectively), with the remainder claiming an increase in both number and level of grants provided242.
240 The raised GM expenditure in 2011 is almost entirely due to ITF Seafarers Trust additional spending during their 30thanniversaryyear,astheygaveout£6.8millioninadditionalgrants,including:‘anunusuallylargegrantof£5million…madetoSeafarers’RightsInternational(SRI)toensurethesustainabilityofthatorganisation’
241 Analysis based on the 48/81 charitieswhich provided long-term data covering all tenyears. Sample includes thevast majority of the top benevolent charities butexcludes two of the very largest GMs (RNRMC and Trinity House)
242 Online survey (all Maritime funders responding, n=12)
2004 2006 2008 2010 2012 2014 2016
Small MWCs
INCOME (real-terms)
EXPENDITURE (real-terms)
2004 2006 2008 2010 2012 2014 2016
Medium MWCs
INCOME (real-terms)
EXPENDITURE (real-terms)
2004 2006 2008 2010 2012 2014 2016
Large MWCs
INCOME (real-terms)
EXPENDITURE (real-terms)
2004 2006 2008 2010 2012 2014 2016
Small MWCs
INCOME (real-terms)
EXPENDITURE (real-terms)
2004 2006 2008 2010 2012 2014 2016
Medium MWCs
INCOME (real-terms)
EXPENDITURE (real-terms)
2004 2006 2008 2010 2012 2014 2016
Large MWCs
INCOME (real-terms)
EXPENDITURE (real-terms)
4.8
4.9
4.10
£10,000,000 2005 2006 2007 2008 2009 2010 2011 2012 2013 2014 2015
GM EXPENDITURE (real-terms) Benevolence Accommodation
£0
£200,000,000
£400,000,000
£600,000,000
£800,000,000
Fixed Investments Assets (real-terms) funds_total (real-terms) Unrestricted funds (real-terms) Reserves (real-terms)
-0.1
-0.05
0
0.05
0.1
0.15
£300,000,000
£400,000,000
£500,000,000
£600,000,000
£700,000,000
Total funds (real-terms)
Year-on-year growth (%, real-terms)
2004 2006 2008 2010 2012 2014 2016
Small MWCs
INCOME (real-terms)
EXPENDITURE (real-terms)
2004 2006 2008 2010 2012 2014 2016
Medium MWCs
INCOME (real-terms)
EXPENDITURE (real-terms)
2004 2006 2008 2010 2012 2014 2016
Large MWCs
INCOME (real-terms)
EXPENDITURE (real-terms)
Income (real-terms)
Expenditure (real-terms)
year
£M
year
£M
year
£M
4.8
4.9
4.10
£10,000,000 2005 2006 2007 2008 2009 2010 2011 2012 2013 2014 2015
GM EXPENDITURE (real-terms) Benevolence Accommodation
£0
£200,000,000
£400,000,000
£600,000,000
£800,000,000
Fixed Investments Assets (real-terms) funds_total (real-terms) Unrestricted funds (real-terms) Reserves (real-terms)
-0.1
-0.05
0
0.05
0.1
0.15
£300,000,000
£400,000,000
£500,000,000
£600,000,000
£700,000,000
Total funds (real-terms)
Year-on-year growth (%, real-terms)
Grant-making BenevolenceAccommodation

Navigating Change: A Review of the UK Maritime Welfare Charity Sector | 2017 88
4.5 FUNDS AND RESERVES
FIGURE 4.9
Total funds and growth 2005-2015, real-terms243
The level of net assets of the MWC sector has fluctuated over the last ten years (see Figure 4.9), noticeably faltering during the global recession and only really recovering during the last three years (2013-2015) to grow strongly by over one-third (35%) in real-terms as the economy and the third sector climbs out of the global recession. This pattern is largely due to fluctuations in the investment market since fixed investment assets form 80% of the sector’s total funds244 (see Figures 4.10 and 4.11). Unrestricted funds and funds held in reserve follow a similar pattern.
FIGURE 4.10
Total funds, fixed investments and unrestricted funds levels, 2007-2015 (real-terms)
A slowdown in income growth from investments may also reflect the increased adoption by some charities of a total returns policy towards investments.
243 Analysis based on 22 MWCs providing Part B accounts for 2006/07-2014/15 which account for 71% of both the total income and expenditure of the MWC sector, and 64% of the total funds of the top 29 MWCs, and should therefore be considered as indicative only.
244 A99.8%correlationwasobtainedbetweenthefluctuationsoffixedinvestmentassetsandtotalfundsduringthisperiod.
4.8
4.9
4.10
£10,000,000 2005 2006 2007 2008 2009 2010 2011 2012 2013 2014 2015
GM EXPENDITURE (real-terms) Benevolence Accommodation
£0
£200,000,000
£400,000,000
£600,000,000
£800,000,000
Fixed Investments Assets (real-terms) funds_total (real-terms) Unrestricted funds (real-terms) Reserves (real-terms)
-0.1
-0.05
0
0.05
0.1
0.15
£300,000,000
£400,000,000
£500,000,000
£600,000,000
£700,000,000
Total funds (real-terms)
Year-on-year growth (%, real-terms)
£M
year
20072008
20092010
20112012
20132014
2015
£M
year
20072008
20092010
20112012
20132014
2015
4.8
4.9
4.10
£10,000,000 2005 2006 2007 2008 2009 2010 2011 2012 2013 2014 2015
GM EXPENDITURE (real-terms) Benevolence Accommodation
£0
£200,000,000
£400,000,000
£600,000,000
£800,000,000
Fixed Investments Assets (real-terms) funds_total (real-terms) Unrestricted funds (real-terms) Reserves (real-terms)
-0.1
-0.05
0
0.05
0.1
0.15
£300,000,000
£400,000,000
£500,000,000
£600,000,000
£700,000,000
Total funds (real-terms)
Year-on-year growth (%, real-terms)
Fixed Investments Assets (real-terms)
Unrestricted funds (real-terms)
Total funds (real-terms)
Reserves (real-terms)
4.8
4.9
4.10
£10,000,000 2005 2006 2007 2008 2009 2010 2011 2012 2013 2014 2015
GM EXPENDITURE (real-terms) Benevolence Accommodation
£0
£200,000,000
£400,000,000
£600,000,000
£800,000,000
Fixed Investments Assets (real-terms) funds_total (real-terms) Unrestricted funds (real-terms) Reserves (real-terms)
-0.1
-0.05
0
0.05
0.1
0.15
£300,000,000
£400,000,000
£500,000,000
£600,000,000
£700,000,000
Total funds (real-terms)
Year-on-year growth (%, real-terms)

Navigating Change: A Review of the UK Maritime Welfare Charity Sector | 2017 89
FIGURE 4.11
Investment gains and investment income 2005-2015 (real-terms)
Over the last ten years the overall level of reserves (or funds held in reserve) has increased by 33% in real-terms, although most of this comes from the strong growth from 2013 onwards. It is noticeable however that the sector increased its funds held in reserve during the worst years of the recession. Alongside the underlying investment fluctuations driving the level of funds up and down, this suggests that the MWC sector overall did not draw down on its reserves during this ‘rainy day’.
FIGURE 4.12
Level of funds held in reserve held 2005-2015, real-terms245
But this aggregated view hides a more complex picture, particularly for small and medium-sized charities not represented in the analysis. In our online survey of maritime welfare charities half (53%) of the charities who have financial investments from which they generate interest and receive an income stated that they have drawn down on their investments at some point in the last 5 years246.
FIGURE 4.13
Some charities have financial investments from which they generate interest and receive an income. In times of need, charities may draw down on the capital invested – have you done this in the last 5 years?
245 Analysis based on 22 MWCs providing Part B accounts for 2006/07-2014/15. Trend line = moving average over 2 periods.246 Onlinesurvey(allMaritimecharitiesresponding,n=41/allwithfinancialinvestments,n=32)
4.11
4.12
4.13
-£40,000,000
-£20,000,000
£0
£20,000,000
£40,000,000
£60,000,000
Investment gain (real-terms) Investment income (real-terms)
£0
£50,000,000
£100,000,000
£150,000,000
£200,000,000
Reserves (real-terms) 2 per. Mov. Avg. (Reserves (real-terms))
78%
22%
Have financial investments
Don't have financial investments
53% 47%
Have drawn down in last 5 yrs Haven't drawn down in last 5yrs
£M
year
20072008
20092010
20112012
20132014
2015
4.11
4.12
4.13
-£40,000,000
-£20,000,000
£0
£20,000,000
£40,000,000
£60,000,000
Investment gain (real-terms) Investment income (real-terms)
£0
£50,000,000
£100,000,000
£150,000,000
£200,000,000
Reserves (real-terms) 2 per. Mov. Avg. (Reserves (real-terms))
78%
22%
Have financial investments
Don't have financial investments
53% 47%
Have drawn down in last 5 yrs Haven't drawn down in last 5yrs
£M
year
20072008
20092010
20112012
20132014
2015

Navigating Change: A Review of the UK Maritime Welfare Charity Sector | 2017 90
Individual charities responded differently. Some charities spent much more during the recession in order to meet increased need, despite the fact that their income had decreased. For example, Seafarers UK – one of the largest grant-makers in the sector spent more than they received from 2009 onwards.
‘[W]e believe that by taking calculated risks, recognising the present and very real need of our beneficiaries…Seafarers UK stayed well ahead of the game. The decision to maintain our annual grants total at £2.5M was not taken lightly. Given the uncertain and volatile annual receipts from legacies…and the presently equally uncertain income from our investments… we could not be certain that our surplus would adequately meet the essential need. We therefore agreed that in these uncertain times we would draw down from our reserves the amount necessary to maintain the £2.5M figure, thus enabling our larger and long-standing beneficiary charities to plan ahead with some confidence yet also letting us pursue emerging areas of need.’
Commodore Barry Bryant RN, Director General Seafarers UK247
For the Merchant Navy Welfare Board it was a similar story of spending more than they received during the recession.
‘2011 continued to be a challenging year for charitable fundraising, especially for those who, like ourselves, are heavily reliant on investment income. I am pleased to report however that our position remains strong. The Board, of course, is not immune from wider repercussions, but we would very much like to be able to increase the funds available to support services and grants to our Constituent charities. We will continue to explore, with our members, possible ways to achieve this.’
MNWB Annual Report and Accounts 2011248
As the sector began to climb out of the recession, some MWCs started to strategically plan for the future. For example, the Sailors’ Society viewed 2013 as a ‘year of investment and planning, laying the groundwork for growth over the next 5 years’. Surplus on a sale of functional fixed assets supplied a one-off exceptional uplift of £672k, plus an uplift in donations and grants of 76%249 allowed Sailors’ Society in 2014 to invest in programmes, both domestically and internationally, ‘spending funds raised and drawing down on reserves to support increased charitable activity’250. Subsidiary, Sir Gabriel Wood’s Mariners’ Home, also managed to increase its income by increased fee revenue from short-term stays for respite care, following a reduction in occupancy of full-time residents in 2012.
247 Seafarers UK (2011) 248 MNWB (2011) 249 £149,000ofthisincreaserelatestocorporateandtrustdonationsand£128,000inrelationtotheHaiyanTyphoonAppeal. 250 Sailors Society (2014)
year
year

Navigating Change: A Review of the UK Maritime Welfare Charity Sector | 2017 91
4.6 A COMPARISON WITH THE WIDER THIRD SECTOR AND OTHER OCCUPATIONAL BENEVOLENT CHARITIES
The experience of the MWC sector during the last decade mirrors very closely the experience of the wider charitable sector and other occupational benevolent charities. Charities employed a diverse set of strategies to cope with funding changes.
A Charity Commission survey in 2010 found that 19% of charities surveyed were experiencing an increase in demand for services during the last 12 months251.
Their coping strategies included:
• Drawing on their reserves (12% of charities surveyed (22% of large charities and 23% of the largest charities))
• Reducing costs internally / increasing efficiency e.g. staff redundancies and reducing staff hours (22% of charities surveyed had tried to do this252; charities in the income band £100K–£500K also nearly halved the proportion of their spending that went towards staff costs253)
• Diversifying income sources e.g. increasing earned income through fundraising and/or charitable trading (Between 2008/09 and 2012/13 small and medium-sized organisations increased their earned income by up to 60%)254
• Decreasing overall spending / reducing services to core activities
• Increasing the amount spent on generating funds
• Increasing partnerships and joint ventures with other voluntary organisations
• Mergers and takeovers255
Amongst other benevolent charities, the reaction to the global recession and ensuing government cuts has been very similar256. As in the wider and maritime welfare charity sectors, larger benevolents have been more able to respond to these circumstances than others. The organisations that are struggling most with income growth and deficit-running are those with an income of £50–£100K.
There are a number of occupational benevolent charity sectors which bear some similarities with the maritime charity sector in terms of a declining beneficiary population and relatively dangerous occupations, e.g. mining, firefighting and farming. An analysis of these three sectors found that, similar to the maritime charity sector, all of these are experiencing an increase in demand for their services combined with stretched financial resources.
Their responses have been very similar to those of the third sector as a whole, listed above.
For example, working in partnership - the Royal Agricultural Benevolent Institution (RABI) set up partnerships with organisations who could provide the support services for beneficiaries they could no longer provide themselves, including one with IAGSA, the Institute of Agricultural Secretaries and Administrators, where a qualified representative is sent to work with farmers on getting their paperwork in order so that the farmer can submit their accounts themselves; and with Farm Community Network - an organisation that RABI believe to be better placed to provide farmers with emotional support and may also connect them to other local services that they might benefit from
Mergers – A number of smaller mining charities in neighbouring areas merged in order to reduce costs and preserve services
251 CharityCommission(2010).Sampleof1010drawnforarepresentativesampleof10,000registeredcharitiesinEnglandandWales.252 Ibid 253 NCVO and Lloyds Bank Foundation (2016). Sample = small and medium-sized charities.254 Ibid 255 Ibid 256 Belai, J., Association of Charitable Organisations (2013)

Navigating Change: A Review of the UK Maritime Welfare Charity Sector | 2017 92
The largest of all three occupational benevolent sectors undertook strategic reviews during this time to reprioritise, cut costs and increase efficiencies where possible. For example, the Coal Industry Welfare Organisation (CISWO) implemented a new system known as the Organisation’s Personal Welfare Service with greater use being made of Information Technology for both data processing and communications with staff.
Several, including RABI and CISWO, have decided to adopt more holistic approaches to welfare, which might be described as funder plus approaches, which are designed to augment purely financial help (palliative) with more preventative measures which may be less costly and arguably more beneficial.
‘We have to consider how best to help when the same people keep returning to us time after time. We need to do something that’s more proactive, which helps people to help themselves.’
Welfare Team, R.A.B.I.
The Firefighters Charity, facing unprecedented demand from its beneficiaries, undertook a wholesale strategic review and constructed a 4-year strategic plan implementing a multi-strand solution (see case study):
- A triage system to sort urgent need from those who might be re-signposted to other services- A new fundraising campaign to boost regular income- Boosting their trading income via a trading subsidiary and shop- Introducing a new CRM system for a coordinated approach to beneficiaries, supporters, donors,
volunteers and partners
THE FIREFIGHTERS CHARITY
The Firefighters Charity celebrated its 70th anniversary in 2013, and its number one challenge remains generating sufficient funds to provide the necessary support services to its beneficiaries in the face of increasing demand:
“The demand for the Charity’s services has increased, with more people becoming aware of how we can help and support them when they need us. This in itself is a trend that we would never want to change.”
The Firefighters Charity Impact Report 2015/16
Like many charities during the recession, the FFC called on its reserves to cope with increased demand following a marked drop in income from its regular givers. In the face of these circumstances the Firefighters Charity instigated a triage system with clearer recuperation criteria which allowed the Charity to direct applicants to the rehabilitation programme or alternative support, whichever is more appropriate.
‘We have become victims of our own success and … the Charity must therefore be much more direct in its approach to asking for money. People need to know how costly it is to run our services and how we can only do so with their support and their donations, whether serving or retired.’
Ken Seager, Chair, The Firefighters Charity Annual Report 2015/16
At the same time, the Charity formed a new Income Generation and Engagement Strategy Team and launched an ambitious new fundraising campaign to boost regular income. Alongside this, the Charity’s trading subsidiary recorded record sales and continues to play a crucial role in the income generation strategy for helping to offset the downturn. The Charity also cut costs and increased efficiency of service by introducing a new customer relationship management and database system across all areas for a joined-up approach to beneficiaries, supporters, donors, volunteers and partners.
‘We knew that we were going to invest in services and we did it at a time when surpluses were reasonable. What we couldn’t legislate for was the change in the environment in regards to the austerity agenda and many more pressures on the pound in everyone’s pocket, which means people are less likely to give to the Charity.’
Dr Jill Tolfrey, CEO, The Firefighters Charity Annual Report 2015/16
Navigating Change: A Review of the UK Maritime Welfare Charity Sector | 2017 93
4.7 CONCLUSIONS
The last decade has been a difficult one for all charities, and the MWC sector is no exception. Income has been squeezed, and demand, in some cases, has become more acute.
Over this period the MWC sector underwent some major changes with the large-scale consolidation of the RNRM section and the rise of major new charities such as RNRMC.
The experience of the last decade has varied hugely for different MWCs such that larger charities, those providing accommodation and grants to other charities and those serving the RNRM fared best over the last decade; and smaller charities, those providing benevolent grants to individuals, and those serving MN/FF fared less well over the last decade. This has further skewed the imbalance in the sector in favour of charities serving RNRM seafarers; and while RNRM do make up a majority (58%) of maritime beneficiaries the indications are that numbers of MN and FF beneficiaries in need will become greater in future, making it even more important to address resource issues now.
Overall, spending was depressed over the last ten years in contrast to the wider third sector which increased its spending; and levels of funds held in reserve were maintained and even added to, suggesting a cautious and long-termist outlook in the MWC sector.
For many, it is a question of how long the effects of austerity will linger and indeed if they will possibly deepen. Whilst some may be weathering the storm sufficiently well, others are working with increasingly limited resources and the impending threat of growing financial difficulty.

Navigating Change: A Review of the UK Maritime Welfare Charity Sector | 2017 94

Navigating Change: A Review of the UK Maritime Welfare Charity Sector | 2017 95
FIV
E

Navigating Change: A Review of the UK Maritime Welfare Charity Sector | 2017 96
Since the global recession times are still hard across the maritime welfare charity sector, with income levels barely exceeding pre-recession levels, and while funds are enjoying stronger growth again, spending is only slowly increasing
Recent income growth has been propped up largely by LIBOR money and ‘new’ charities (primarily in the RNRM sector) as well as some exceptional grants to single charities, meaning that income is still an issue for some MWCs (especially those primarily supporting MN/FF beneficiaries)
5. THE FINANCIAL HEALTH AND SUSTAINABILITY OF THE MARITIME WELFARE CHARITY SECTOR
OVERALL, THE MARITIME
WELFARE CHARITY SECTOR
HAS A HEALTHY BANK
BALANCE WITH PLENTY
IN RESERVE, BUT SOME
MWCS ARE STILL FACING
CHALLENGES AROUND FUTURE
SUSTAINABILITY
KEY POINT 5 The sector faces a number of ongoing challenges in raising income, including ‘sea-blindness’ (low awareness of seafarer need); increased competition between RNRM, MN and FF charities, particularly following efficiencies and growth in the RNRM sector; a declining legacy base; adverse charity publicity; fluctuating investment markets and difficulties in securing timely and core cost or revenue grants
The MWC sector runs a fairly tight ship with good returns on money spent on raising funds through fundraising and trading and low cost ratios on spending (although investment ratios could be better)
Overall, the MWC sector has a healthy bank balance, thanks mainly to its large, and currently expanding, investment portfolio (over £1 billion), but this varies dramatically amongst different charities, and without the top three (Greenwich Hospital, Trinity House Maritime Charity, and the RNRMC) the sector holds £388.5 million of assets
Nearly half of the total funds of the sector lie in charities which primarily serve the RNRM community, with a further third lying in tri-maritime charities which serve all maritime workforces. Less than one fifth of the sector’s reserves lie in charities primarily serving the MN or FF community
Overall, the sector has enough funds held in reserve to last for 3.3 years (39.6 months) or 2.8 years (33.6 months) if Greenwich Hospital is excluded. This varies for individual charities from 0 to 13.7 years, and compares with 5.7 months for charities in the wider third sector
A large proportion of these funds are invested to provide long-term independent and sustainable income for the MWC sector

Navigating Change: A Review of the UK Maritime Welfare Charity Sector | 2017 97
A re-evaluation of the sector’s financial position may now be in order, assessing what level of funds held in reserve, income and spending are required to provide the necessary support for beneficiaries in the short and long term. A big question remains over whether funds held in reserve should be invested to provide a degree of self-sufficiency in long-term funding or spent to provide more services for beneficiaries now?

Navigating Change: A Review of the UK Maritime Welfare Charity Sector | 2017 98
5.1 CHALLENGES PRESENTED BY THE GLOBAL RECESSION, AUSTERITY AND A DECADE OF CHANGE
It has been a long, hard decade for many charities. Financial concerns for maritime welfare charities stem from a myriad of challenges including: government austerity driving reductions in statutory funding and Local Authority payments, increasing operational costs, lower interest rates impacting investments,
fundraising difficulties, and the worry of securing grants.
Austerity measures and cut-backs in central and local government funding isn’t a great help. There’s obviously been an impact on some funders’ financial portfolios, so there’s been less funding available
[RNRM/MN/FF, £500K-£1M]
Resource constraints, money has been tight, partly because fundraising has been very difficult, and partly because with very low interest rates anything that charities have in their endowments are not earning as much money as they used to, and so a number of them are having to eat into capital
[RNRM, Under £100K]
The sector now faces a number of challenges in surviving and thriving in the ‘new normal’.
5.1 .1 GOVERNMENT AUSTERITY
One in seven (15%) of the maritime welfare charities surveyed highlight ‘a reduction in public / government funding’ as one of the most pressing challenges facing their organisation257. Some of those providing financial support to individuals find that they are now often delivering services that may have previously been provided by government.
I’ve certainly seen a change over the last five years... in terms of the types of requests coming through for assistance – things like high-low chairs, self-raising chairs – things that… would have been readily provided by the local authority
[MN, £1M-£5M]
Similarly, there are examples of community projects relying more on charitable resources.
The local council…could not have met some of the provision without approaching charities like mine to facilitate it. What we’re basically doing is subsidising the local county council
[RNRM, Under £100K]
Some of those feeling the government financial squeeze most keenly are those providing accommodation and social care to seafarers. Most receive Local Authority payments for resident housing and care, levels of which have been cut, and now fail to keep pace with inflation and the reality of operational costs.
257 Online survey (all Maritime charities responding, n=46)
She has carers three times a day, but they’ve cut back from an hour in the morning to half an hour. She has half an hour at tea-time and at bedtime.
Carer of Royal Navy Rating (ORS, 2016)

Navigating Change: A Review of the UK Maritime Welfare Charity Sector | 2017 99
The two things really are the increasing cost of social care and the reduction in the Local Authorities’ capacity to fund it, therefore, the wider funding gap
[RNRM, £100K-£500K]
5.1 .2 CHALLENGES IN RAISING DONATIONS
5.1 .2 .1 FUNDRAISING CHALLENGES
Fundraising is felt to be increasingly challenging. Low awareness of the maritime sector and the needs seafarers have for charitable support is a key issue (see Section 9.6), but more general issues impacting the third sector such as charity scandals and resultant regulation changes, as well as the large numbers of charities competing for funds also make fundraising increasingly problematic.
I think there are enhanced fundraising challenges…The tightening up of the rules around fundraising, …the vast number of charities, the low profile of seafarers in the public eye, and the fact that we are not likely to be a cause which is high on the giving priorities of many potential givers
[MN/FF, £1M-£5M]
Analysis of MWC accounts suggests that some increased their spending on fundraising over the last five years, although for many this has not yet paid off.
5.1 .2 .2 DIMINISHING LEGACIES
Legacy income is highly unpredictable so cannot be relied on. Legacies are generally used to provide additional funds either for specific projects that might otherwise require a grant-maker’s support, or to
bolster investment portfolios and so generate income.
If we get a particularly good year for legacies, we’ll invest that legacy, rather than increase our output to spend the legacy, which is effectively time-proofing ourselves
[RNRM, £1M-£5M]
It is widely understood that legacies will naturally decline as current beneficiaries pass on, and because the seafaring community has reduced overall. And whilst not relied upon, their absence may still cause a gap in
funding.
Legacies, I think we’re all aware that they are going to diminish, because the number of people who knew somebody connected to the Merchant Navy in particular, or maybe the Royal Navy, but have an affinity with people at sea, is just quite steadily and dramatically diminishing
[MN/FF, £1M-£5M]
We are struggling currently, because we’ve seen a huge downturn in legacy income, just across the piece
[RNRM/MN/FF, £500K-£1M]

Navigating Change: A Review of the UK Maritime Welfare Charity Sector | 2017 100
5.1 .3 CHALLENGES IN SECURING GRANTS
A few MWCs highlight difficulties in securing core cost funding, with the perception that the large grant-makers are more inclined towards specific project funding. It is felt that such a stance may become more problematic in the future, particularly if operational costs continue to increase.
One of the key problems is that grant-givers like things that are project based...Nobody likes anything better than to build a nice new sports centre and stick their grant-giving organisation’s badge on it, but actually, the most difficult thing to get money for is salaries, and if you’re going to provide persistent presence, then what you need is money for salaries
[RNRM, £1M-£5M]
On the other hand, indications from maritime grant-makers are that core funding is still very much available. Three-quarters indicate that they currently provide ‘unrestricted funding’ whereby money can be spent on whatever the charity sees fit, whilst half state that they currently provide ‘core cost funding’258. However, nearly three-fifths of grant-makers surveyed currently support ‘project funding’, a slightly higher level than those providing ‘core cost funding’, which may feed the perception of a preference259.
Charities also report finding it difficult to secure grants that extend beyond a year’s provision which would assist with strategic planning.
It’s trying to get 3-year or longer grants, so that we can plan a bit more in terms of developing new services...I think it’s always been difficult… Seafarers UK will only do annual grants, and we get a fair amount of funding from them now for core costs and also for projects…[But] it would be better if we got 3-year grants from them
[MN/FF, £100K-£500K]
Some MWCs also mentioned issues around lead times involved in securing grants being too long; both block grants given by funders and individual grants given to beneficiaries. There is some evidence of the sector grant-makers understanding the ‘need for speed’, with a quarter of maritime funders responding to the online survey having either introduced/increased ‘emergency funding’ levels in the last 5 years, or intending to do so in the next 5 years260.
The RNRMC have woken up to this, because they had one, at most two, bidding rounds per year and they’ve now moved to four meetings a year to allow the people who just missed that deadline, they need money, and they won’t now have to wait for another year. What I think is frustrating for people…is to bid into the system and then have to wait three months for an answer
[RNRM, Over£5M]
258 Online survey (all Maritime charity funders responding, n=12) 259 Ibid 260 Ibid

Navigating Change: A Review of the UK Maritime Welfare Charity Sector | 2017 101
5.1 .4 INCREASING OPERATIONAL COSTS
To compound cuts in government spending, operational costs are also increasing for many. Just over a quarter (26%) of maritime charities surveyed highlight ‘increasing costs’ as one of the most pressing challenges facing their organisation. Tri-Service charities are more likely to cite ‘increasing costs’ as an issue, with three-fifths highlighting it, making it their top concern261.
Examples of increasing costs include salary increases being driven by the minimum/living wage, and also by the need to employ specialist staff or re-train existing staff to handle the more complex beneficiary issues such as debt or mental/emotional well-being which are coming to the fore (see Section 9.5).
The living wage strategy is in train now, and…as those increases move up towards the £9 mark, there then becomes an issue of paying for the differentials between staff … so, you get to a point that to maintain the value of people’s training and qualifications overall within the service [you have to pay everyone more], it’s the snowballing effect, that’s a big pressure for us
[MN, £1M-£5M]
Some highlight how cost efficiencies have had to be made, with staff working longer for no extra pay, and a number also pointing to a continued (and increasing) reliance on volunteers.
Certainly, financially we’ve just had to tighten our belts and basically rely on the good will of the staff to ensure we provide the services. We’ve maintained the same level of service, but we just haven’t had the same resources to provide it, so it means that we’ve all been working harder
[RNRM/MN/FF, £550K-£1M]
We, like so many other charities, depend heavily on volunteers to deliver our outcomes and without them, our staff costs would have to be much higher to deliver the same outcomes
[FF, £1M-£5M]
All of the challenges thrown up in the last decade of change remain issues for the maritime charity sector going forward, so it’s important to understand what state the sector is currently in to face these challenges.
261 Online survey (all Maritime charities responding, n=46 / all tri-Service charities responding, n=20)

Navigating Change: A Review of the UK Maritime Welfare Charity Sector | 2017 102
5.2 THE STATE OF THE SECTOR POST-RECESSION
On the face of things, the last four years of recovery from the global recession have brought a noticeable growth in income for the MWC sector in 2013 and 2014, followed by a slight fall in 2015. There were some small signs of recovery for some maritime welfare charities262, however things are not quite as they appear, since a large portion of this growth can be accounted for by three exceptional factors:
1. Two exceptional grants to a single charity in 2013 and 2014263
2. LIBOR funding264
3. Income concentrated in ‘new charities’ (see below)
FIGURE 5.1
The income and expenditure of the MWC sector showing the exceptional income of the last few years (£M)
Over the last decade a number of new and amalgamated charities have entered the MWC sector (see Section 3 for more details). By 2015 there were seven ‘new’ MWCs265 which accounted for 21% of the total income of the sector. The ‘new’ charities are dominated by RNRMC which accounts for 84% of the ‘new’ income and expenditure in 2015, and along with the Royal Marines Charitable Trust Fund (now The Royal Marines Charity266), account for 18% and 15% of total income and expenditure of the largest MWCs267 in 2015.
While not all of this money can be considered totally ‘new’ due to many parts of the amalgamated charities existing before the mergers, it is generally accepted that RNRMC in particular has grown beyond the sum of its previous parts and is now a major player in the fundraising and grant-making landscape of the MWC sector.
These factors taken together mean that the MWC sector is in a similar position to the Armed Forces charitable sector, whose income growth is largely being maintained by an influx of new tri-Service charities while the income of more established charities is experiencing a slowdown in growth268. For the majority of the MWC sector income growth has not really recovered after the global recession and may be slowing down. Therefore, testing times are still ahead for many.
It also means that resource growth in the sector is largely happening in charities which primarily serve RNRM beneficiaries.
262 NautilusWelfareFund,RNBSO,theJohnWilliamSlaterMemorialFundandSailors’Societyallpostedhigherincomesin2013,includinggrantstotalling£1.888million(includingnearly£1.6millionfromTrinityHouse)forinvestmentinnewaccommodationatMarinersParkforNautilusWelfareFund.
263 ITF Seafarers Trust – see Section 4.3 for further detail.264 SeeSection4formoredetailsonthis;insummaryatleast£6millionofLIBORfundingwasgiventotheMWCsectorin2015,mainlytocharitiesprimarilyservingRNRM
beneficiaries.265 Including RNRMC, The Honourable Company of Master Mariners and Howard Leopold Davis Charity, The Royal Marines Charity, Go Commando, Human Rights at Sea,
and Help our Wounded Royal Marines and Supporting Arms. 266 With C Group’ The Royal Marines Charity forms part of the RNRMC Group of charities.267 Top29MWCswithincomeover£500,000whichaccountfor95%oftheincomeand94%oftheexpenditureoftheMWCsector.268 Pozo and Walker (2014)
5.1
5.2
£65,000,000
£70,000,000
£75,000,000
£80,000,000
£85,000,000
£90,000,000
£0
£20,000,000
£40,000,000
£60,000,000
£80,000,000
£100,000,000
£120,000,000
2011 2012 2013 2014 2015
Income of traditional MWCs Income of new MWCs Exceptional income from grants and LIBOR Total expenditure
34% 28% 27%
10%
1%
Voluntary income
Investment Income
Income from Charitable Activities
Income from activities
generating funds (trading,
etc.)
Other income
£120
£100
£80
£60
£40
£20
£0
year

Navigating Change: A Review of the UK Maritime Welfare Charity Sector | 2017 103
5.3 A HEALTHY INCOME?
The MWC sector269 is largely reliant on three different types of income:
• Voluntary income (grants, donations and legacies) makes up just over one third (£35.7M, 34%) of total income; legacies make up 13% (£4.6M) of voluntary income. This proportion of voluntary income is similar to the wider third sector (38%)
• Investment income makes up a further 28% (£16.2M) of total income. This is markedly higher than for the wider third sector (7%), at least partly because the maritime welfare sector is dominated by a number of large grant-makers which derive more of their income from investments270
• Income from charitable activities (fees and charges for support services) makes up a further 27% (£28.3M) of total income. This is considerably less than the wider third sector (45%).
FIGURE 5.2
Income sources of the
largest MWCs
The MWC sector receives 10% of its total income from activities for generating funds, e.g. trading (£10.5M). This is the same proportion as the wider third sector.
5.3.1 INCOME OF SMALL, MEDIUM AND LARGE MWCS
The financial health of the sector varies considerably, mainly according to the size of the organisation271. In the main, the largest MWCs are in a healthier position than smaller MWCs.
Voluntary income is most important to medium and large MWCs, forming nearly half of their total income, while small charities receive a much smaller proportion. Small MWCs rely proportionately most heavily on investment income which forms over two-fifths of their total income (medium-sized MWCs also rely on investment income for one quarter of their total income). This reliance of small charities on investment income is mirrored in the wider third sector, and has made smaller charities particularly vulnerable to the
fluctuations of the stock market during the global recession.
269 Analysis refers to the top 29 MWCs.270 The investment landscape of the MWC sector is dominated by two large organisations - Greenwich Hospital and Trinity House Maritime Charity - which between
them account for 60% of the total investment income of the sector, three-quarters (76%) of which comes from investment properties. Without these two portfolios the investment income of the sector would reduce from 28% to 15% (still more than double the proportion earned by the wider third sector (7%))
271 Analysis is of the sample of 27 charities previously mentioned, large (9), medium (11) and small (7). The analysis is therefore only indicative rather than fully representative of the MWC sector.
5.1
5.2
£65,000,000
£70,000,000
£75,000,000
£80,000,000
£85,000,000
£90,000,000
£0
£20,000,000
£40,000,000
£60,000,000
£80,000,000
£100,000,000
£120,000,000
2011 2012 2013 2014 2015
Income of traditional MWCs Income of new MWCs Exceptional income from grants and LIBOR Total expenditure
34% 28% 27%
10%
1%
Voluntary income
Investment Income
Income from Charitable Activities
Income from activities
generating funds (trading,
etc.)
Other income income
Income from Activities
Generating Funds

Navigating Change: A Review of the UK Maritime Welfare Charity Sector | 2017 104
FIGURE 5.3
Income of small, medium and large MWCs272
Large Medium Small
5 .4 SPENDING EFFECTIVELY AND EFFICIENTLY?
On average, expenditure across the MWC sector is 92% of income in 2015, which is very close to the 94% of the wider third sector273. Spending as a proportion of income varies by the size of charity, with larger organisations spending less (77% for major charities with an income between £10M - £100M) compared to smaller organisations which are currently over-spending their income (by as much as 119% for micro charities with an income of less than £10K). This means that while larger charities are spending within their means, smaller ones (with fewer funds held in reserve to fall back on) are sailing closer to the wind – such a pattern of expenditure over income is unsustainable in the long-term.
FIGURE 5.4
Expenditure as a proportion of income, by size of charity
272 Incomesourcesdonotsumto100%as‘otherincome’hasbeenomittedfromthisanalysisasinmostcasesitcountsforlessthan1%.Largecharity=incomeover£1million,medium=incomebetween£100K-£1million,small=incomeoflessthan£100Kperannum.Latestaccountsused(mainly2015)
273 NCVO (2016)
Small MWCs also rely more on income from activities to generate funds (e.g. trading, membership, etc.) which provide one-fifth of their total income.
5.3
45%
5%
36%
12%
Large
Voluntary income
Activities generating funds (trading, membership, etc.)
Income from Charitable Activities
Investment income
46%
2%
21%
24%
Medium
Voluntary income
Activities generating funds (trading, membership, etc.)
Income from Charitable Activities
Investment income
5.3
45%
5%
36%
12%
Large
Voluntary income
Activities generating funds (trading, membership, etc.)
Income from Charitable Activities
Investment income
46%
2%
21%
24%
Medium
Voluntary income
Activities generating funds (trading, membership, etc.)
Income from Charitable Activities
Investment income
5.4
5.5
10%
21%
5%
42%
Small
Voluntary income
Activities generating funds (trading, membership, etc.)
Income from Charitable Activities
Investment income
119%
100% 112%
99%
77%
0%
20%
40%
60%
80%
100%
120%
140%
Micro <£10k Small £10k-£100k
Medium £100k-£1m
Large £1m-£10m
Major £10m-£100m
£5.22 £3.97
£2.19 £3
£4.20 £3.84
£1.15
£7.50
£0.00
£2.00
£4.00
£6.00
£8.00
Voluntary income ROI
Fundraising ratio Fundraising trading ROI
Total investment income ROI
ROI
MWCs Third sector (large charities)
5.3
45%
5%
36%
12%
Large
Voluntary income
Activities generating funds (trading, membership, etc.)
Income from Charitable Activities
Investment income
46%
2%
21%
24%
Medium
Voluntary income
Activities generating funds (trading, membership, etc.)
Income from Charitable Activities
Investment income
5.3
45%
5%
36%
12%
Large
Voluntary income
Activities generating funds (trading, membership, etc.)
Income from Charitable Activities
Investment income
46%
2%
21%
24%
Medium
Voluntary income
Activities generating funds (trading, membership, etc.)
Income from Charitable Activities
Investment income
5.3
45%
5%
36%
12%
Large
Voluntary income
Activities generating funds (trading, membership, etc.)
Income from Charitable Activities
Investment income
46%
2%
21%
24%
Medium
Voluntary income
Activities generating funds (trading, membership, etc.)
Income from Charitable Activities
Investment income
5.4
5.5
10%
21%
5%
42%
Small
Voluntary income
Activities generating funds (trading, membership, etc.)
Income from Charitable Activities
Investment income
119%
100% 112%
99%
77%
0%
20%
40%
60%
80%
100%
120%
140%
Micro <£10k Small £10k-£100k
Medium £100k-£1m
Large £1m-£10m
Major £10m-£100m
£5.22 £3.97
£2.19 £3
£4.20 £3.84
£1.15
£7.50
£0.00
£2.00
£4.00
£6.00
£8.00
Voluntary income ROI
Fundraising ratio Fundraising trading ROI
Total investment income ROI
ROI
MWCs Third sector (large charities)
Micro <£10K Small £10K-£100K
Medium £100K-£1M
Large £1M-£10M
Major £10M-£100M
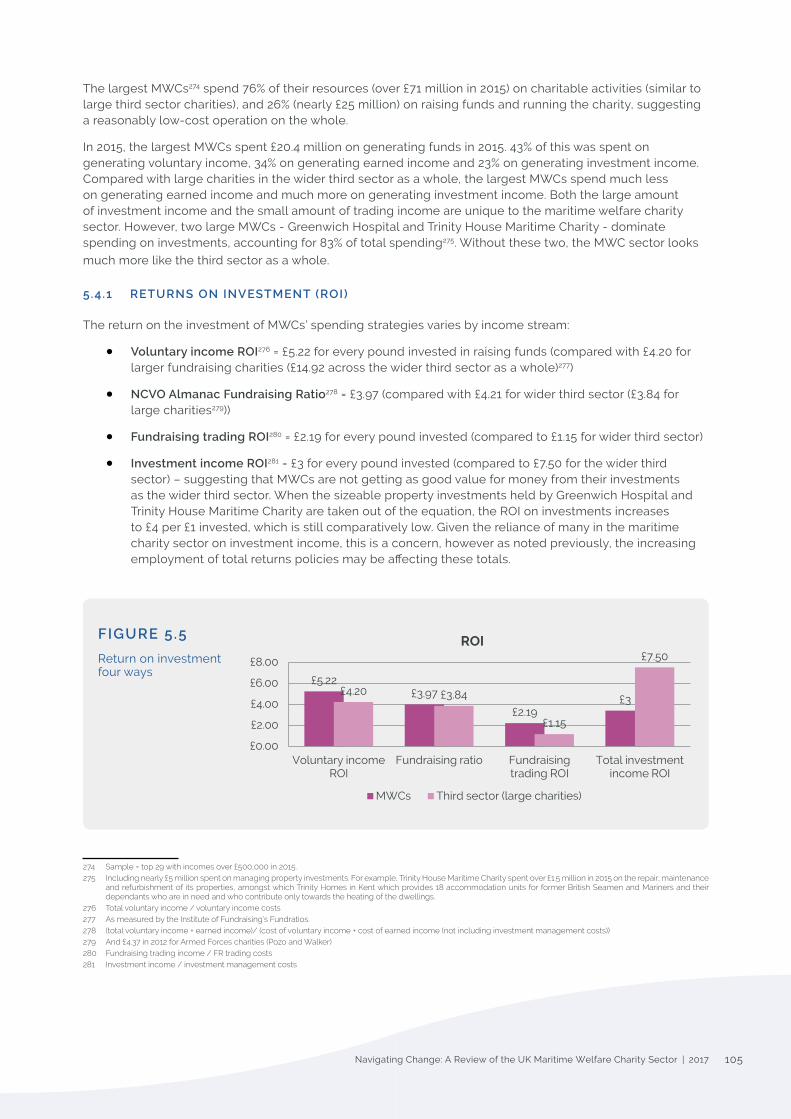
Navigating Change: A Review of the UK Maritime Welfare Charity Sector | 2017 105
The largest MWCs274 spend 76% of their resources (over £71 million in 2015) on charitable activities (similar to large third sector charities), and 26% (nearly £25 million) on raising funds and running the charity, suggesting a reasonably low-cost operation on the whole.
In 2015, the largest MWCs spent £20.4 million on generating funds in 2015. 43% of this was spent on generating voluntary income, 34% on generating earned income and 23% on generating investment income. Compared with large charities in the wider third sector as a whole, the largest MWCs spend much less on generating earned income and much more on generating investment income. Both the large amount of investment income and the small amount of trading income are unique to the maritime welfare charity sector. However, two large MWCs - Greenwich Hospital and Trinity House Maritime Charity - dominate spending on investments, accounting for 83% of total spending275. Without these two, the MWC sector looks
much more like the third sector as a whole.
5.4.1 RETURNS ON INVESTMENT (ROI)
The return on the investment of MWCs’ spending strategies varies by income stream:
• Voluntary income ROI276 = £5.22 for every pound invested in raising funds (compared with £4.20 for larger fundraising charities (£14.92 across the wider third sector as a whole)277)
• NCVO Almanac Fundraising Ratio278 = £3.97 (compared with £4.21 for wider third sector (£3.84 for large charities279))
• Fundraising trading ROI280 = £2.19 for every pound invested (compared to £1.15 for wider third sector)
• Investment income ROI281 = £3 for every pound invested (compared to £7.50 for the wider third sector) – suggesting that MWCs are not getting as good value for money from their investments as the wider third sector. When the sizeable property investments held by Greenwich Hospital and Trinity House Maritime Charity are taken out of the equation, the ROI on investments increases to £4 per £1 invested, which is still comparatively low. Given the reliance of many in the maritime charity sector on investment income, this is a concern, however as noted previously, the increasing employment of total returns policies may be affecting these totals.
FIGURE 5.5
Return on investment four ways
274 Sample=top29withincomesover£500,000in2015.275 Includingnearly£5millionspentonmanagingpropertyinvestments.Forexample,TrinityHouseMaritimeCharityspentover£1.5millionin2015ontherepair,maintenance
and refurbishment of its properties, amongst which Trinity Homes in Kent which provides 18 accommodation units for former British Seamen and Mariners and their dependants who are in need and who contribute only towards the heating of the dwellings.
276 Total voluntary income / voluntary income costs277 As measured by the Institute of Fundraising’s Fundratios.278 (totalvoluntaryincome+earnedincome)/(costofvoluntaryincome+costofearnedincome(notincludinginvestmentmanagementcosts))279 And£4.37in2012forArmedForcescharities(PozoandWalker)280 Fundraising trading income / FR trading costs 281 Investment income / investment management costs
5.4
5.5
10%
21%
5%
42%
Small
Voluntary income
Activities generating funds (trading, membership, etc.)
Income from Charitable Activities
Investment income
119%
100% 112%
99%
77%
0%
20%
40%
60%
80%
100%
120%
140%
Micro <£10k Small £10k-£100k
Medium £100k-£1m
Large £1m-£10m
Major £10m-£100m
£5.22 £3.97
£2.19 £3
£4.20 £3.84
£1.15
£7.50
£0.00
£2.00
£4.00
£6.00
£8.00
Voluntary income ROI
Fundraising ratio Fundraising trading ROI
Total investment income ROI
ROI
MWCs Third sector (large charities)

Navigating Change: A Review of the UK Maritime Welfare Charity Sector | 2017 106
5.5 ASSETS – WHAT’S LEFT IN THE TANK?
The MWC sector had over £1 billion in assets in 2015. More than half (53%) of these assets, however, belong to Greenwich Hospital and Trinity House Maritime Charity, with the next nearest charity – the RNRMC – holding nearly four times less. Without these three, the sector holds £388.5 million of assets.
Since Greenwich Hospital and RNRMC serve the RNRM sector, and Trinity House is tri-maritime, Figure 5.6 shows that nearly half (46%) of the total funds of the sector lie in charities which primarily serve the RNRM community, with a further third (37%) lying in tri-maritime charities which serve all maritime workforces and less than one fifth (17%) lying in charities primarily serving the MN or FF community.
However, if Greenwich Hospital and Trinity House Maritime Charity are excluded (on the grounds that a large part of their funds are tied up in investment properties) then the picture alters to be slightly less skewed, with 48% of funds available to tri-maritime charities, 26% available to those serving RNRM and 25% available to MN/FF.
FIGURE 5.6
Total funds split by the maritime workforce primarily served, 2015
For the wider third sector, total assets are approximately two and half times the annual expenditure of the sector282. For the maritime sector, total net assets were 11 times the amount of total annual expenditure in 2015, (6 times if GH and TH are excluded). This level of assets is a large buffer for the sector (at least for some charities).
5.5.1 RESTRICTED, UNRESTRICTED AND ENDOWMENT FUNDS, AND LIABILITIES
The largest MWCs hold 80% (£665.3M) of their funds as unrestricted (compared to 61.5% in the wider third sector); 10% (£84.7M) as restricted funds (compared to 22% in the wider third sector); and 10% (£81.7M) as endowment funds283 (compared to 23% in the wider third sector).
Just 3% of the largest MWCs’ total funds are liabilities, compared with 15% in the wider third sector, although the level of liabilities has grown considerably over the period. The highest growth over the last decade is in long-term creditors provision which has grown by 204% (in real-terms) and stood at -£4.5M in 2015284, while pension liabilities have also increased by 129% (in real-terms) and stood at -£1.6M in 2015285. This is a concern for some MWCs.
282 NCVO(2016),financialyear2013/14.283 Thisexcludesthe£226.7millionendowmentfundsheldbyTrinityHouseMaritimeCharitywhichotherwiseskewtheresults.284 DiscountingGreenwichHospitalwhichhadlong-termliabilitiesof£3.5millionin2015.285 DiscountingGreenwichHospitalwhosepensionliabilitieswereover£25millionin2015.
5.6
5.7
17%
46%
37%
All MWCs
MN/FF
RN/RM
Tri-Maritime
25%
26%
48%
Minus Greenwich Hospital and Trinity House Maritime Charity investment
property
MN/FF
RN/RM
Tri-Maritime
13.7
12
.8
12.8
11
.8
11.1
9
.4
9.1
7.
6
7.3
6.1
5.
7 4.
5 4.
4 3.
8
3.4
3.2
3.1
2.7
2.4
1.4
1.2
0.3
0
.3
0.2
0
.1
0.1
0
.0
0.0
0
.0
0.0 2.0 4.0 6.0 8.0
10.0 12.0 14.0 16.0
1 2 3 4 5 6 7 8 9 10 11 12 13 14 15 16 17 18 19 20 21 22 23 24 25 26 27 28 29
Minus Greenwich Hospital and Trinity House Maritime Charity investmentAll MWCs
RNRM

Navigating Change: A Review of the UK Maritime Welfare Charity Sector | 2017 107
5.5.2 THE RIGHT LEVEL OF RESERVES
There are some real issues with defining ‘reserves’ and the levels of reserves in the third sector, and the MWC sector is no exception here. Guidance from the Charity Commission is that reserves stated in annual reports and accounts should follow the formula: unrestricted funds minus tangible assets, designated funds and programme-related investments286. This is the formula we have followed in this analysis to define what we call ‘funds held in reserve’287. Guidance also states that all charities should have a reserves policy which explains the level of reserves they hold, and that: “When making this decision [to hold reserves], trustees of unincorporated charities should weigh it against the general trust law principle that funds received as income should be spent within a reasonable period of receipt of the funds.288”.
Unless a charity has the power in their governing documents to hold capital in endowment funds (which only a small number do) then income cannot be accumulated as an endowment and should be treated as unrestricted income funds (i.e. ‘reserves’ or ‘funds held in reserve’) and reported as such in the annual report289. This is not to say that a portion of these funds held in reserve cannot be invested, but that these should not be treated as permanent or expendable endowments if they are not legally defined as such. Investing funds held in reserve is discussed further in Section 5.5.2.2.
The funds held in reserve of the MWC sector formed 29% of total funds in 2015290. Across the whole sector, on average, this level of funds held in reserve is sufficient to fund 3.3 years’ worth of expenditure (39.6 months) compared with an average of 5.7 months in the third sector at large (13 months amongst grant-makers and a median of 3 months amongst larger charities). If Greenwich Hospital’s outlying funds held in reserve of £63.8M are removed this decreases to 2.8 years or 33.6 months291.
286 Charity Commission (2016) 287 This formula is also used by the National Council for Voluntary Organisations (NCVO) in their annual publication ‘The Civil Society Almanac’ which is used for comparison
with the wider third sector.288 Charity Commission (2016) 289 Ibid 290 Sample=top29MWCs,reservesfigurefrompublishedaccounts.291 Stated outliers are removed to prevent skewing the data when talking about averages.
Guidance around levels of reserves for charities has come under scrutiny recently due to a number of high-profile cases. Firstly, the recent Kids Company charity failure due to a complete lack of reserves led to calls for charities to maintain more reserves along the lines of the long-held view in the sector that: Good practice is to hold several months’ operating costs in reserve.
Secondly, the recent Lords Scrutiny Committee (2017) heard evidence that many charities were struggling to maintain reserves following the global recession, since many had and/or were now drawing down on reserves to maintain services. Localgiving reported that 42% of the groups they had surveyed had used their reserves in the last 12 months. Academics from the Bristol Business School stated that: “Compounding the challenge is the notion that holding reserves within the charity sector has been considered taboo by significant regularity bodies and advisors to the sector.”
The review concluded that in some circumstances it would be better for charities to close rather than to cling onto reserves, and recommended that better governance should ensure that charities get it right on reserves.
‘[T]he primary measure of a charity’s success is not the sheer volume of funds and assets it holds, but its ability to deliver value to its beneficiaries.’
The Charity Commission RS13 (2006)
There is no single level, or even a range of, reserves that is right for all charities. Any target set by trustees for the level of reserves to be held should reflect the particular circumstances of the individual charity.
Charity Commission Guidance (2016)

Navigating Change: A Review of the UK Maritime Welfare Charity Sector | 2017 108
The amount varies between individual MWCs as Figure 5.7 shows. Larger MWCs have up to 13.7 years’ worth of funds held in reserve292, others have none.
FIGURE 5.7
Number of years’ running costs in funds held in reserve
5.5 .2 .1 RESERVES POLICIES
An analysis of 30 MWCs across a range of sizes, services and fields revealed a diversity of reserves policies in operation, with only two having no official reserves policy in place. The most frequently cited reasons for holding reserves (mentioned by more than one MWC) included:
• As a guarantee of expenditure/operational commitments
• As maintenance and repair funds for buildings providing accommodation
• To provide a backstop against irregular patterns of income
Half the sample (15 MWCs) stated a specific time period which reserves should cover (ranging from 3 months to 2 years) (see Figure 5.8), however, many held reserves which far exceeded their stated needs.
FIGURE 5.8
The period of time reserves should cover according to reserves policies293
292 Total reserves divided by total expenditure.293 Sample = 30 MWCs chosen as a structured sample according to size and type.
5.6
5.7
17%
46%
37%
All MWCs
MN/FF
RN/RM
Tri-Maritime
25%
26%
48%
Minus Greenwich Hospital and Trinity House Maritime Charity investment
property
MN/FF
RN/RM
Tri-Maritime
13.7
12
.8
12.8
11
.8
11.1
9
.4
9.1
7.
6
7.3
6.1
5.
7 4.
5 4.
4 3.
8
3.4
3.2
3.1
2.7
2.4
1.4
1.2
0.3
0
.3
0.2
0
.1
0.1
0
.0
0.0
0
.0
0.0 2.0 4.0 6.0 8.0
10.0 12.0 14.0 16.0
1 2 3 4 5 6 7 8 9 10 11 12 13 14 15 16 17 18 19 20 21 22 23 24 25 26 27 28 29
5.8
5.9
5.10
2
3
1
3
1
4
1
0
1
2
3
4
5
3 months 3-6 months 4 months 6 months 6-12 months
12 months 2 years
3% 20% 23% 53%
Don't know 1-2 (Completely Disagree) 3-4 5-6 7-8 9-10 (Completely Agree)
84%
13%
3%
Large
Medium
Small
51%
25%
24%
MN/FF
RN/RM
Tri-Maritime
Individual MWCs
N y
ear
s
N M
WC
s1614121086420

Navigating Change: A Review of the UK Maritime Welfare Charity Sector | 2017 109
Other charities’ reserves policies are more vague (stating no specific time periods at all) or incredibly
ambitious:
‘...to cover grants payable and administration costs for the foreseeable future’
‘The Trustees take the view that…they are the temporary custodians of these reserves and it is essential that they leave the [charity] in a state where it can continue for as long as seafarers need it as there is no sign of this need diminishing’
This might appear to be in contravention of Charity Commission guidance to spend incoming resources ‘within a reasonable period’, but many MWCs, particularly grant-makers, believe that they have a moral duty to maintain a ‘high’ level of funds held in reserve to provide an adequate safety net and the ability to continue operating and supporting beneficiaries in the event that other funding ceases. Indeed, grant-makers generally need to hold larger reserves not only in consideration of the needs of their own beneficiaries, but also of their beneficiaries’ beneficiaries.
We certainly don’t want to be running down the reserves, because they provide a valuable source of investment income to go towards the ongoing activities…I’d actually prefer more…If you say that each family we support for up to about 5 years generally, and we’ve only got coverage for between 2.5 and 3 years, then our reserves don’t equal our moral liability at the moment
[RNRM/MN/FF, £55K-£1M]
Many MWCs, like other charities, have invested a large part of their funds held in reserve in order to generate independent income.
Powers to accumulate and to transfer to reserves or designated funds may all therefore be exercised to create retained funds within a charity. Trustees must, however, satisfy themselves that the proposed retention of funds is in the best interests of carrying out their charitable purposes, which requires consideration of current and future charitable needs. As these funds are expendable at the discretion of the trustees, their retention should be kept under review.
Ann Phillips, Partner, Charities and Education Team, Stone King LLP Solicitors. Coalition for Efficiency (2011)
‘...based on mortality rates of the members over the next 50 years’

Navigating Change: A Review of the UK Maritime Welfare Charity Sector | 2017 110
5.5 .2 .2 INVESTED FUNDS HELD IN RESERVE AS A SOURCE OF SELF-SUSTAINING INCOME
Charities are allowed to invest funds held in reserve to generate an income so long as they satisfy certain conditions, including broadly the need to be able to relatively quickly liquidate these funds if needed. There
is a bit of a loophole here:
‘In some cases, trustees hold historic funds built up from informal accumulation of unspent income and capital growth. Under the general rule that unrestricted funds should be applied within a reasonable period of receipt, these funds are available for spending. Recognising, however, that these funds may provide a stable source of income supporting a charity’s activities, the Charity Commission takes a pragmatic approach stating, “the Commission would not expect trustees to expend the unexpended funds in a short period simply in order to comply with the general rule.”294 The Commission does, however, require that trustees frame their reserves policies to cover these funds and that, if need arises for substantial capital expenditure, the trustees should consider applying historic unexpended funds before making a new appeal.’295
Ann Phillips, Partner, Charities and Education Team, Stone King LLP Solicitors. Coalition for Efficiency (2011)
Nearly eight in ten (78%) of the maritime charities completing the online survey hold financial investments from which they generate interest and receive an income. Amongst those that do hold investments, over three-quarters agree that they are an ‘important source of independent income which we try to preserve at all costs’.
FIGURE 5.9
How strongly do you agree or disagree that ‘Investments are an important source of independent income which we try to preserve at all costs’?296
For some charities, this means a dilemma when reporting their level of funds held in reserve, both from the
point of view of charity regulation and fundraising.
I think there’s a misunderstanding about reserves. They’re not free reserves in the sense that we’ll just do what we want. A lot of people would just look at our reserves and say ‘well, you’ve probably got too much’. They in fact, generate a significant amount of income, and if they didn’t exist to generate that income, we would have to start much more actively fundraising and therefore, we would start cutting across the bows of people like Seafarers UK
[MN/FF, £1M-£5M]
We’re coming to a position now, where we have good investments, but they only generate £55-60,000 a year, but we’ve now got [more] beneficiaries and we need £70-75,000 a year, we can’t eat into our reserves, as once we start selling capital, we won’t even be able to service the beneficiaries that we have
[MN/FF, Under £100K]
294 See NHS Charities Guidance at F.2.3. concerning historic accumulation of NHS charity funds (Oct 2009), www.charitycommission.gov.uk/Charity_requirements_guidance/Specialist_guidance/NHS_charities/nhsguidance.aspxInCoalitionforEfficiency(2011)
295 AnnPhillips,Partner,CharitiesandEducationTeam,StoneKingLLPSolicitors.InCoalitionforEfficiency(2011) 296 Online survey (all Maritime charities with investments responding, n=30)
5.8
5.9
5.10
2
3
1
3
1
4
1
0
1
2
3
4
5
3 months 3-6 months 4 months 6 months 6-12 months
12 months 2 years
3% 20% 23% 53%
Don't know 1-2 (Completely Disagree) 3-4 5-6 7-8 9-10 (Completely Agree)
84%
13%
3%
Large
Medium
Small
51%
25%
24%
MN/FF
RN/RM
Tri-Maritime
% Disagree (1-4)
3% 77%
% Agree (7-10)
5.8
5.9
5.10
2
3
1
3
1
4
1
0
1
2
3
4
5
3 months 3-6 months 4 months 6 months 6-12 months
12 months 2 years
3% 20% 23% 53%
Don't know 1-2 (Completely Disagree) 3-4 5-6 7-8 9-10 (Completely Agree)
84%
13%
3%
Large
Medium
Small
51%
25%
24%
MN/FF
RN/RM
Tri-Maritime

Navigating Change: A Review of the UK Maritime Welfare Charity Sector | 2017 111
The in-depth interviews highlight that many charities rely heavily on investment income to fund their activities, particularly in relation to covering operational costs and salaries for which it can be more difficult to secure alternative financing (see Section 5.1.3).
Many are conscious, however, that funders are looking more closely at reserve levels prior to approving grants. Some impose restrictions such as not grant-funding charities with funds held in reserve of over one year. Indeed, a third of the block grant-makers completing the online survey confirm that the requirement for recipient organisations to demonstrate need via annual accounts (especially level of funds held in reserve) has ‘increased or intensified’ in the last 5 years297.
And a number of respondents do voice concern over the high level of funds held in reserve across the maritime sector, particularly in light of the reducing beneficiary population.
Actions as well as beliefs about reserves vary considerably across the sector. Several MWCs have spent some of their funds held in reserve coping with the increased demands of the recent global recession and are looking to ‘balance the books’ again, worried that they don’t have sufficient funds held in reserve to meet future demand. Amongst those who anticipate a change in demand from seafaring beneficiaries, over a third (35%) have already used charity funds held in reserve to cover income shortfalls to meet this change, whilst a further 12% believe it will be necessary to do this at some point in the future298. Others are attempting to reduce their level of funds held in reserve.
Given the scenario that a lot of charities, like ourselves, have got investments, and are now thinking, well, what is the plan for the next 25-30 years – do we need to start managing those down, because the numbers are not going to be there?
[MN, £1M-£5M]
Our reserves increased in recent years, mainly due to receipt of a few large legacies. Our reserves policy used to talk about having enough in reserves to keep the charity going for 12 months if all income streams dried up – clearly, we’ve got more than that now in our reserves, so we feel we need to be a lot clearer on how we can draw down on those reserves over a given period of time – so, there is a plan
[MN, £1M-£5M]
297 Online survey (all Maritime charity funders responding, n=12) 298 AllMaritimecharitiesanticipatingachangeinbeneficiarydemandresponding,n=34.
Getting revenue funding is very difficult, and fundraising for revenue is very difficult too. So, that is very important to us, the reserves generating that sizeable part of our annual revenue
[FF, £1M-£5M]
I think grant funders take more particular attention now to your reserves and how you use your reserves and I know that they’re not interested, nor should they be, in giving a grant to an organisation just to then increase its level of reserves
[MN/FF, £1M-£5M]
Where I wouldn’t want us to be, if we roll the clock forward five or ten years, is awash with money and no one to give it to
[FF, £1M-£5M]
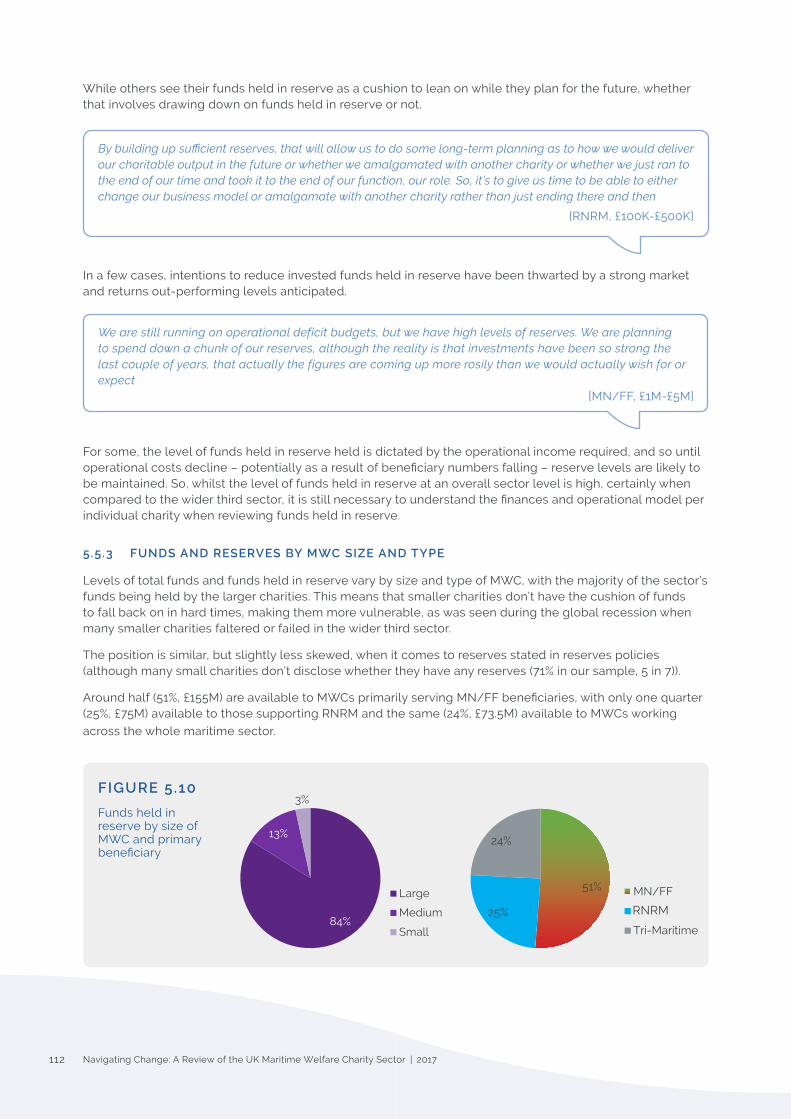
Navigating Change: A Review of the UK Maritime Welfare Charity Sector | 2017 112
While others see their funds held in reserve as a cushion to lean on while they plan for the future, whether that involves drawing down on funds held in reserve or not.
By building up sufficient reserves, that will allow us to do some long-term planning as to how we would deliver our charitable output in the future or whether we amalgamated with another charity or whether we just ran to the end of our time and took it to the end of our function, our role. So, it’s to give us time to be able to either change our business model or amalgamate with another charity rather than just ending there and then
[RNRM, £100K-£500K]
In a few cases, intentions to reduce invested funds held in reserve have been thwarted by a strong market and returns out-performing levels anticipated.
We are still running on operational deficit budgets, but we have high levels of reserves. We are planning to spend down a chunk of our reserves, although the reality is that investments have been so strong the last couple of years, that actually the figures are coming up more rosily than we would actually wish for or expect
[MN/FF, £1M-£5M]
For some, the level of funds held in reserve held is dictated by the operational income required, and so until operational costs decline – potentially as a result of beneficiary numbers falling – reserve levels are likely to be maintained. So, whilst the level of funds held in reserve at an overall sector level is high, certainly when compared to the wider third sector, it is still necessary to understand the finances and operational model per individual charity when reviewing funds held in reserve.
5.5.3 FUNDS AND RESERVES BY MWC SIZE AND TYPE
Levels of total funds and funds held in reserve vary by size and type of MWC, with the majority of the sector’s funds being held by the larger charities. This means that smaller charities don’t have the cushion of funds to fall back on in hard times, making them more vulnerable, as was seen during the global recession when many smaller charities faltered or failed in the wider third sector.
The position is similar, but slightly less skewed, when it comes to reserves stated in reserves policies (although many small charities don’t disclose whether they have any reserves (71% in our sample, 5 in 7)).
Around half (51%, £155M) are available to MWCs primarily serving MN/FF beneficiaries, with only one quarter (25%, £75M) available to those supporting RNRM and the same (24%, £73.5M) available to MWCs working
across the whole maritime sector.
FIGURE 5.10
Funds held in reserve by size of MWC and primary beneficiary
5.8
5.9
5.10
2
3
1
3
1
4
1
0
1
2
3
4
5
3 months 3-6 months 4 months 6 months 6-12 months
12 months 2 years
3% 20% 23% 53%
Don't know 1-2 (Completely Disagree) 3-4 5-6 7-8 9-10 (Completely Agree)
84%
13%
3%
Large
Medium
Small
51%
25%
24%
MN/FF
RN/RM
Tri-Maritime
5.8
5.9
5.10
2
3
1
3
1
4
1
0
1
2
3
4
5
3 months 3-6 months 4 months 6 months 6-12 months
12 months 2 years
3% 20% 23% 53%
Don't know 1-2 (Completely Disagree) 3-4 5-6 7-8 9-10 (Completely Agree)
84%
13%
3%
Large
Medium
Small
51%
25%
24%
MN/FF
RN/RM
Tri-Maritime
5.8
5.9
5.10
2
3
1
3
1
4
1
0
1
2
3
4
5
3 months 3-6 months 4 months 6 months 6-12 months
12 months 2 years
3% 20% 23% 53%
Don't know 1-2 (Completely Disagree) 3-4 5-6 7-8 9-10 (Completely Agree)
84%
13%
3%
Large
Medium
Small
51%
25%
24%
MN/FF
RN/RM
Tri-Maritime
5.8
5.9
5.10
2
3
1
3
1
4
1
0
1
2
3
4
5
3 months 3-6 months 4 months 6 months 6-12 months
12 months 2 years
3% 20% 23% 53%
Don't know 1-2 (Completely Disagree) 3-4 5-6 7-8 9-10 (Completely Agree)
84%
13%
3%
Large
Medium
Small
51%
25%
24%
MN/FF
RN/RM
Tri-Maritime
RNRM

Navigating Change: A Review of the UK Maritime Welfare Charity Sector | 2017 113
Grant-makers have the largest funds held in reserve (42%) followed by those making benevolent grants (22%) and those providing accommodation (22%).
FIGURE 5.11
Funds held in reserve by type of MWC
5.6 ENSURING FINANCIAL SUSTAINABILITY
Over two-fifths (43%) of the maritime charities participating in the online survey highlight ‘generating income and achieving financial sustainability’ as one of the most pressing challenges facing their organisation, second only to ‘raising awareness of our charity or cause’299. This is slightly below levels recorded across the wider third sector, whereby 57% of CEOs questioned in a Charities Aid Foundation/ACEVO study considered generating income and achieving financial sustainability as one of their ‘top three’ challenges300.
There is evidence that maritime charities are reviewing their finances with a view to achieving future sustainability following the gruelling last decade. Amongst those maritime charities who anticipate a change in demand from seafaring beneficiaries in the future, a quarter (24%) have already diversified their funding streams, with a further quarter (24%) aiming to do so in the next 12 months. Nine percent have already arranged a financial loan, whilst over a third (35%) have used charity reserves to cover income shortfalls301.
A few of those participating in the depth interviews have already disposed of assets in order to generate investment capital, or intend to do so in the near future.
We’re asset rich and cash poor, everything that has been invested has been invested into the land, we are extremely asset rich at the moment...At the present time, we’re going through a process of putting a planning application on a lump of land to sell it for development, which would potentially raise a significant amount of money, which would then mean that we wouldn’t be in a position where we would need to borrow money again. Then we would potentially have an investment portfolio
[RNRM/MN/FF, £500K-£1M]
As the online survey results show, a number of charities are drawing down on their invested funds held in reserve. It is, however, a delicate balancing act, whereby investment capital could fall below a level that secures the required interest income to cover core costs. Were this to happen, charities would look to supplement incomes from other sources, either funding from grant-makers or direct fundraising.
299 Online survey (all Maritime charties responding, n=46) 300 CharitiesAidFoundation(2017).Surveyof156CEOsincharitableorganisations.301 Onlinesurvey(allMaritimecharitiesanticipatingachangeinbeneficiarydemandresponding,n=34)
5.11
42%
22% 22%
14%
0.4% 0.3%
GM Benevolence Accommodation Pastoral Social Fellowship Grant-making
Navigating Change: A Review of the UK Maritime Welfare Charity Sector | 2017 114
5.7 CONCLUSIONS
The MWC sector as a whole is looking remarkably healthy following a turbulent decade, with strong income growth and a healthy bank balance. However, this picture changes dramatically when looking at different types of individual maritime welfare charity. Small and medium-sized charities (particularly those primarily serving MN and FF beneficiaries) are not doing so well and some are struggling. This is a situation mirrored across the wider third sector.
Fluctuations and slow growth are of course less troublesome for those with multiple sources of income and a level of funds held in reserve to allow the riding out of hard times: Over-reliance on any one form of income can spell problems. Diversifying income streams has long been held to be a wise financial strategy for charities, and while many have or are trying to do this, it can be more difficult for some.
The sector faces a number of challenges going forward in order to regain and maintain financial sustainability, including government austerity, increasing operational costs, lower interest rates impacting investments, fundraising difficulties, and the worry of securing grants.
MWCs see the need for:
• Quicker grant processes
• Emergency funding provision
• Continued (and increased) availability of core-cost funding
• Increased consideration for longer grant periods (3-years) to aid strategic planning
In terms of total funds held, the sector is relatively asset rich and the question needs to be asked: What level of funds held in reserve is right for MWCs? MWCs, like other charities, are having to walk a difficult tightrope between not holding too much in reserves lest they appear to be too ‘wealthy’ for funders and regulators, and having enough funds held in reserve to maintain the level of services and support beneficiaries require – for as long as they require it. Commentators in the wider third sector warn against the ‘autopilot approach’ of Trustees in accumulating capital as a result of undue cautiousness and the assumption that endowments and other retained funds will naturally bring greater security to charities302.Some feel that more funds held in reserve could have been drawn down during the difficult time engendered by the global recession in order to provide more support for beneficiaries enduring increased suffering during that period. Others feel that it was right to hold onto funds held in reserve in order to be able to keep providing support in the longer-term, partly through the generation of income from invested funds held in reserve. There are no hard and fast rules or answers to this issue and it is something which the sector will need to find its own solutions to.
One of the parts of this solution comes from having better data around projected beneficiary numbers and needs in future so that MWCs can plan strategically what, and what level of, support they will need to supply.
This research aims to provide part of that answer.
302 CoalitionforEfficiency(2011)
Those charities (both grant-makers and operating charities) with access to high levels of retained funds are under a particular onus to consider whether spending from those funds is a possibility, with strategic benefits not only for their beneficiaries but for the voluntary sector as a whole.
The Coalition for Efficiency (2011)
The public (and some funders) are suspicious of charities that appear to ‘hoard’ reserves, rather than spend their money directly on beneficiaries. Yet if organisations themselves are not clear about why they need reserves or how much they need, they will be unable to allay fears that they are not using their money wisely.
The NCVO Funding Commission (2010)
We are beginning to eat into our cash reserves and then obviously, after that we’ll need to go into the capital. We are aware that there are many other charities that we could probably apply to, to hopefully secure further funding. I think that day is coming, and probably coming quite soon in fact
[MN/FF, Under £100K]

Navigating Change: A Review of the UK Maritime Welfare Charity Sector | 2017 115
SIX

Navigating Change: A Review of the UK Maritime Welfare Charity Sector | 2017 116
There is a reticence amongst older seafarers and their dependants to live in specialist ‘senior’ residential accommodation, preferring to remain in their own homes as long as possible
Despite this reticence, an anticipated increase in older, frailer individuals with more complex health needs will demand more specialist ‘senior’ accommodation – the existing provision of care beds looks too low to cope with this
Giventhatthemaritimebeneficiarypopulationis ultimately reducing, accommodation charities needto‘futureproof’theiroffereitherbyflexingthe type of support provided (e.g. in-home care/financialsupportpackages;step-downbeds;extra-care)orbyreviewingtheirbeneficiarycriteria(e.g. non-traditional seafaring roles and/or non-seafarers)
Any new ‘bricks and mortar’ would need to demonstrate real return on investment (ROI); such capital investment may be better spent in partnership with non-maritime organisations to avoidtheriskofempty‘seafarer-specific’facilities.Similarly, an increasing need for dementia and Alzheimer’s care may be best met through partnerships/funding agreements with specialist mainstream providers
Societal changes and evolving needs mean that housing requirements are continually changing. New initiatives such as co-housing, communal living, multi-generational living and collaborative caring may provide maritime accommodation charities with transformative future options
6. A ROOF OVER THEIR HEADS Housing and social care provision
MUCH SEAFARER ACCOMMODATION AND SOCIAL CARE PROVISION IS OUTDATED AND, WHILST PROVIDING ‘THE ESSENTIALS’, MEETING FUTURE BENEFICIARY NEEDS AND ASPIRATIONS WILL PROVE CHALLENGING
KEY POINT 6

Navigating Change: A Review of the UK Maritime Welfare Charity Sector | 2017 117
Accommodation and social care provision needs to reflect a ‘life-cycle’ of care, looking beyond the essentials to ensure that evolving needs are met. A crucial part of meeting future housing and social care needs will be collaboration and co-operation across the maritime sector and beyond, as well as adapting existing provision

Navigating Change: A Review of the UK Maritime Welfare Charity Sector | 2017 118
6.1 EXTENT OF CHARITABLE ACCOMMODATION PROVISION
Following recommendations around housing made in the 2007 research ‘Supporting Seafarers’, the Institute of Public Care (IPC) developed an Accommodation, Care and Support Strategy for Older Seafarers and Their Dependants. This provided a set of objective standards against which providers could assess their current provision, chart improvements and plan for the future. In 2011 IPC303 analysed 47 accommodation providers catering for seafarers and their dependants, between them supplying nearly 3,800 housing units and 1,000 care beds. Many of these providers did not focus primarily on seafarers however, being either general providers or focussed on ex-Services veterans (e.g. Haig Housing, Erskine, Sir Oswald Stoll), and removing these, the numbers dropped to 643 and 175 care beds for the primary use of seafarers and their families.
A re-analysis in 2017304 found that the number of housing units has remained fairly static at 3,852 while the number of care beds increased to nearly 1,200. Looking at those providers focused primarily on seafarers and their families, the number of housing units has increased to 686 while the number of care beds has remained similar at 168.
The total number of sheltered housing units in 2011 was 1,423, declining to 1,082 in 2017; while the number of sheltered housing units specifically for seafarers and their dependants remained stable at 448 in 2011 and 450 in 2017. However, it is important to note the addition by 2017 of 54 specialist dementia-care units, primarily provided by Nautilus Welfare Fund at Mariners’ Park in Wallasey, and Royal Alfred Seafarers’ Society in Banstead, Surrey.
Our analysis suggests that a third of Maritime Welfare Charities offer accommodation provision to beneficiaries, with seven in ten of these offering sheltered housing305.
FIGURE 6.1
Types of facilities offered by Maritime Welfare Charities providing accommodation
Amongst the frontline maritime welfare charities participating in the research, just over a third (35%) offer ‘accommodation (including alms-houses, nursing homes, care homes, hostels and holiday homes)’, the same proportion as the frontline tri-Service charities responding306.
303 IPC (2011) 304 Information gleaned from annual reports and websites. In some cases, updated numbers were not available. In such cases original numbers have been used.305 Quantitative analysis based on MNWB Welfare Guide.306 Whilst sample sizes are relatively small in absolute terms (In total, 24 accommodation providers participated across the research programme (17 Maritime and 7 tri-
Service).Ofthese,20(14Maritimeand6tri-Service)offer‘livein’housingoptionssuchasshelteredhousing,almshouses,nursinghomes,etc.ratherthanfacilitiessuchasholidayhomes).Theresearchcovered17Maritimecharitiesprovidinganyformofaccommodation,whichequatesto63%ofthe27accommodationcharitiesidentifiedwithintheMWCsector,asdefinedusingMNWBdefinitions.
6.1
6.2
11%
19%
22%
70%
Hostels
Care Homes
Holidays
Sheltered Housing
0%
66%
0%
17%
17%
17%
17%
17%
0%
33%
17%
67%
0%
10%
10%
20%
20%
30%
30%
30%
30%
40%
50%
60%
Independent living accommodation to purchase
Accommodation for non-maritime residents
Extra care housing, independent living with 24/7 staffing
Financial support to allow people to remain in own home
Specialist Dementia / Alzheimer's care provision
Nursing homes, with comprehensive medical care
Care support to enable people to remain in own home
Hospice / end of life care
Residential care homes
Respite care facilities
Holistic care, provided in-house
Independent living accommodation for rent
Maritime Charities (n=10)
Tri-Service Charities (n=6)
Holiday Acommodation

Navigating Change: A Review of the UK Maritime Welfare Charity Sector | 2017 119
6.2 HOUSING FOR WORKING AGE SEAFARERS AND THEIR FAMILIES
6.2.1 CURRENT HOUSING PROVISION
In 2007, 56% of working age seafarers interviewed owned their own homes, whether outright or with a mortgage - this was lower than the national average. Those from the Naval Service were most likely to be home owners (78%), whilst Merchant Navy ratings were least likely (36%), with around half of fishermen being home owners307.
Regular Armed Forces personnel can currently benefit from a £200 million scheme to help them get on the property ladder. The Forces Help to Buy scheme enables service men and women to borrow up to 50% of their salary, interest free, to buy their first home or move to another property on assignment or as their families’ needs change. The pilot scheme, which will run for 3 years, aims to address the low rate of home ownership in the Armed Forces308. In 2017, 7% of Royal Navy personnel report using the Forces Help to Buy scheme to purchase their own home in the last year309.
The Department for Communities and Local Government [DCLG] has introduced various measures to improve access to social housing for the Armed Forces community, including a change in the law to ensure seriously injured Service personnel and veterans with urgent housing needs are always given priority for social housing by local authorities. In addition, £40 million from LIBOR banking fines in 2014-2015 was used to specifically target housing under the Veterans Accommodation Fund. This included charity projects providing long-term and temporary accommodation to veterans and their families, including support accommodation for vulnerable and disabled veterans310.
The 2007 research noted that single seafarers (UK and non-UK) valued good short-term accommodation such as hostels, missions or centres, which they could use when between contracts or on shore leave311.
Our analysis shows a significant change in this type of provision, with data showing a fall from 396 beds in 2011 to 211 in 2017312. There may be a number of reasons, particularly impacting the Merchant Navy, as to why provision of such accommodation may be in decline:
• a contraction in the home-registered Merchant fleet means fewer UK seafarers overall
• the Merchant Navy previously had a high proportion of male ratings with no permanent home ashore, meaning a higher demand for hostel accommodation. Now almost all employed merchant seafarers have a home in the UK or abroad
• the significant reduction in turnaround time in ports means less demand for short stay overnight accommodation313
Reflecting such changes, Queen Victoria Seaman’s Rest – a facility offering over 170 rooms for short/long term stays – estimates that around half of its beneficiaries are now non-maritime/non-military, and Dame Agnes Weston’s Royal Sailors’ Rest no longer provides such accommodation at all.
6.2.2 HOUSING CONCERNS
As with many other people, working age seafarers and their families are impacted by the UK housing shortage. However, some seafarers are likely to have been hit harder as their incomes and/or dislocated lifestyles make buying a home more difficult.
307 Maritime Charities Funding Group (2007) 308 See https://www.gov.uk/government/news/forces-help-to-buy-scheme309 MOD (2017b) 310 MOD (2017c) 311 Maritime Charities Funding Group (2007)312 2011 information from IPC (2011); 2017 information gleaned from annual reports and websites. In some cases, updated numbers were not available. In such cases original
numbers have been used.313 IPC (2016)

Navigating Change: A Review of the UK Maritime Welfare Charity Sector | 2017 120
The availability of affordable housing has been affected by changes to housing benefits, the continuing erosion of social housing through Right to Buy, and low rates of housebuilding over several decades. In addition, many local authorities have made significant reductions to their housing related support budgets which may affect some particularly vulnerable groups, for example, people with mental health problems, those at risk of domestic violence, and people with disabilities.
Despite the issues highlighted, housing concerns amongst working age seafarers appear to be relatively low level. In 2007, only 5% of working age MN and 14% FF raised housing and accommodation as an issue. In 2016, when asked what help the families of seafarers need most from charities, financial and emotional support, and advice (legal and welfare) come through most strongly. Whilst it is likely that a proportion of the financial and general advice required will relate to housing, it is less of a major concern in and of itself314.
However, when asked what kind of help and support maritime charities should provide in the future, housing is more commonly mentioned, although after issues relating to children, childcare and education315. Families of RNRM are particularly focused on this, as their transient life means a greater need for help in the peripheral accoutrements of moving, specifically practical help such as information relating to new schools and local facilities, and also assistance with integration, such as meeting other families in the area.
A number of working age MN seafarers mention a need for increased respite care and family holiday facilities, whilst FF raise the issue of financial difficulties impacting on housing, ‘support in times of bad weather, when no money is being earned so mortgage payments don’t get missed’316.
Thus, maritime welfare charities need to continue to assist working age seafarers and their families by providing information on housing, including both financial (housing benefits, mortgage advice, etc.) and practical advice (moving and integration advice, locating short-term rentals, tenant advice). Financial support in times of need will also be required.
As with ‘The Forces Help to Buy’ scheme, accommodation charities working with MN and FF beneficiaries could investigate longer-term housing solutions, such as loans for mortgage deposits, shared ownership schemes, or partnerships with housing associations.
There is a shortage of accommodation in the UK total anyway, but that includes a percentage of the maritime sector, so there needs to be a good look at better quality provision of accommodation and more of it, and that options are made available to seafarers as to whether they want to rent or whether they want to buy or whatever – I think there should be a wider opportunity for them
[RNRM, £500K-£1M]
Other innovative solutions include co-housing, which is an area gathering momentum for senior accommodation (see Section 6.6.2.2), and communal living, which is also emerging as an option for younger people and may provide another potential housing solution for single seafarers.
314 IPC (2016)315 Ibid316 Ibid
The Collective opened a site in North London in 2016 with capacity for 500 people, in studios, one and two bedroom flats. The monthly rental charge covers standard bills as well as additional services such as cleaning and WiFi. ‘Luxury’ facilities include a cinema, three dining rooms, a laundrette, a spa, a games room, a library, roof terrace and garden. The Collective is aiming to address a societal shift “People marry later…technology has allowed us to work from anywhere…but there is an isolation that comes with this tech revolution”. In New York at least two communes have started, Pure House and Node, both hoping to establish sites in the UK – “We are commoditising community”
As reported in The Times, 03/06/17

Navigating Change: A Review of the UK Maritime Welfare Charity Sector | 2017 121
6.3 HOUSING FOR OLDER SEAFARERS AND THEIR DEPENDANTS
Reflecting where the greatest need lies, the majority of accommodation providers within the maritime welfare charity sector provide ‘live-in’ accommodation to older seafarers and their dependants.
6.3.1 CURRENT HOUSING PROVISION
Just over half (53%) of older seafarers and their dependants own their homes outright, although there are variations between different types of seafarers, with seven in ten RNRM owning their own homes, compared to 54% of MN and only 32% of FF.
The vast majority (93%) of older seafarers and their dependants do not currently live in any seafarer’s housing schemes, but of the 7% who do, 4% are in a sheltered flat or bungalow, 2% an almshouse and 1% in a care home. Compared with older seafarers and their dependants from the MN and RNRM, a higher proportion of those from the FF live in almshouses317.
6.3.2 TYPES OF ACCOMMODATION SUPPORT PROVIDED
There is a trend in wider society towards more older people desiring to remain in their own homes, with support where necessary. This is mirrored in the maritime sector beneficiaries.
Of those charities surveyed who offer accommodation, the most common provision is for ‘independent living accommodation for rent’, with 60% of maritime and 67% of tri-Service charities providing such facilities to seafarers (see Figure 6.2) - although none currently offer such housing to buy.
‘In-house holistic care packages’, taking into account a person’s social and psychological well-being as well as their physical health, are offered by half of maritime accommodation providers responding.
Just under a third (30%) of maritime accommodation charities report providing ‘care support packages to enable people to remain within their own homes’. Whilst the prevalence of ‘financial support packages’ is lower (20%), this may reflect that such provision falls within the realms of those charities providing financial assistance to beneficiaries (see Section 7).
The two-thirds of tri-Service accommodation providers offering services to ‘non-maritime’ residents is a reflection that facilities tend to be all Armed Forces combined, rather than Naval Service specific.
317 ORS (2016)

Navigating Change: A Review of the UK Maritime Welfare Charity Sector | 2017 122
FIGURE 6.2
Types of support currently offered by ‘live-in’ accommodation providers surveyed318
6.3.3 CHANGES IN PROVISION
Over the last five years, the most commonly introduced or increased types of accommodation support are reported to be holistic care packages, support packages to allow people to stay within their own homes, respite care facilities, hospice/end of life care and specialist dementia / Alzheimer’s care provision.
Demand for older seafarer accommodation is on the rise. Half of the maritime accommodation providers surveyed note an increase in demand over the last five years and, even when considering the fifth who report a decline, the net result indicates a notable uplift in recent years319.
This picture is confirmed by accommodation providers participating in the depth interviews, with nearly all running at capacity and some even having waiting lists.
318 Online survey, (‘live in’ accommodation providers responding, n=16) 319 Online survey, (Maritime ‘live in’ accommodation providers responding, n=10)
6.1
6.2
11%
19%
22%
70%
Hostels
Care Homes
Holidays
Sheltered Housing
0%
66%
0%
17%
17%
17%
17%
17%
0%
33%
17%
67%
0%
10%
10%
20%
20%
30%
30%
30%
30%
40%
50%
60%
Independent living accommodation to purchase
Accommodation for non-maritime residents
Extra care housing, independent living with 24/7 staffing
Financial support to allow people to remain in own home
Specialist Dementia / Alzheimer's care provision
Nursing homes, with comprehensive medical care
Care support to enable people to remain in own home
Hospice / end of life care
Residential care homes
Respite care facilities
Holistic care, provided in-house
Independent living accommodation for rent
Maritime Charities (n=10)
Tri-Service Charities (n=6)
Our care home was 96.5% occupancy average over the year
[RNRM/MN/FF, £1M-£5M]
Independent living accommodation for rent
Holistic care, provided in-house
Respite care facilities
Residential care homes
Hospice / end of life care
Care support to enable people to remain in own home
Nursing homes, with comprehensive medical care
Specialist dementia / Alzheimer’s care provision
Financial support to allow people to remain in own home
Extra care housing, independent living with 24/7 staffing
Accommodation for non-maritime residents
Independent living accommodation to purchase

Navigating Change: A Review of the UK Maritime Welfare Charity Sector | 2017 123
6.4 CHALLENGES FACED
6.4.1 AN AGEING POPULATION
Amongst those participating in the depth interviews, the ageing population was highlighted as one of the key challenges that the maritime charity sector has faced over the last ten years, and will continue to face over the next ten years and beyond.
An ageing population brings with it significant additional challenges for those providing accommodation and social care solutions, and not just in terms of the increasing numbers requiring assistance, although the pressure this brings to services is clearly a key concern.
It is worth repeating that whilst the maritime beneficiary population is known to be declining, the latest demographic projections show that the numbers of MN and FF aged 65 and over will only peak in 2020, with any noticeable reduction occurring after 2025. In terms of those MN and FF aged 85 and over, numbers are projected to increase by around 220% between 2015 and the peaks of 2035 and 2030 respectively. Given this, the need, particularly amongst those likely to require senior housing, social care and support, is set to continue, and even increase, over the short to medium term.
6.4.1 .1 AGEING AND HEALTH
An older population results in more complex health problems, and an increase in ‘frailty’, defined as those with an ‘elevated risk of catastrophic declines in health and function’. Frailty is commonly associated with increased age, poverty, a history of chronic illness, poor living conditions, smoking, obesity and loneliness320 – all factors which seafarers can be particularly exposed to (see Section 2).
People are living longer, so they stay at home longer, but then come to us older ready for care, so the average age of our residents has gone up and, therefore, they are more frail when they come to us eventually – that’s been a challenge to meet that
[RNRM/MN/FF, £1M-£5M]
Generic age-related health issues will be further compounded by those that affect older MN and FF disproportionately, such as long-standing ill-health and limitations with Activities of Daily Living (ADL), in addition to the increasing prevalence of dementia across the general population, including seafarers. Only 21% of older seafarers from the MN report having no illnesses or disabilities, reducing to 16% for RNRM and only 8% amongst the FF321.
Mariners…health tends to be equivalent to those that have worked in heavy industry, such as the coal industry or the steel industry, their life at sea has brought with it certain problems – bad knees from years of being on rolling ships…things like skin cancer, the idea of putting sunscreen on just didn’t exist
[MN, £1M-£5M]
6.4.1 .2 DEMENTIA AND ALZHEIMER’S CARE
One of the other issues that an ageing population brings is increasing rates of dementia: over 850,000 people in the UK currently have some form of dementia, with numbers set to rise to over 1 million by 2021322. In line with maritime population projections, the total number of former MN and FF with dementia is projected to peak in 2025, whilst RNRM has already peaked.
320 Beth Johnson Foundation (2016) 321 ORS (2016) 322 Alzheimer’s Research Trust and The Dementia Stats Hub [https://www.dementiastatistics.org/].

Navigating Change: A Review of the UK Maritime Welfare Charity Sector | 2017 124
Four-fifths (80%) of people living in care homes in the UK have a form of dementia or severe memory problems323. Maritime accommodation providers appear to be making provision for dementia care - as highlighted earlier, our 2017 analysis shows an addition of 54 accommodation places offering specialist dementia care for seafarers since 2011.
However, the question remains whether existing facilities will be sufficient to meet the forthcoming level of need.
The prime challenge really has been making sure we look after those seafarers with dementia…We built a dementia unit…and filled it almost immediately, and it’s been full ever since. We saw that there was a need, but in a way, we underestimated the need
[RNRM/MN/FF, £1M-£5M]
6.4.1 .3 IMPACT ON THE FAMILY UNIT
An older population will also result in more single seafarers. Whilst 72% of households aged 65-69 live as a couple, this falls to 45% for those aged 80 and older324. This is compounded further amongst the seafaring population, which has a higher incidence of divorce and separation.
There’s some evidence that mariners are less likely to marry, are more likely to divorce if they do marry, so that means that people are more likely to be on their own in old age...If there’s a couple and someone’s got a problem, the other individual can sometimes compensate for that, but of course, if you live on your own that’s less likely, and…the costs of living on your own are higher than if you’re living as a couple
[MN, £1M-£5M]
Societal changes mean that older people are now less likely to have children to care for them, whilst any children that they do have, are more likely to live further away325.
As people live longer, their children also grow older, and may have succumbed to illness or dementia themselves and be in no position to offer help.
We have found that the children are already in care themselves, and their money is being subsumed for their care costs…It’s not just the cost of the care, it’s the fact that there won’t always be family support for people when they get to their later 80s and 90s…particularly if it’s some form of dementia
[RNRM, £100K-£500K]
323 Alzheimer’s Research Trust and The Dementia Stats Hub [https://www.dementiastatistics.org/]324 ONS (2014), as cited in Davies, B., IPPR North (2014) 325 McNeil and Hunter, IPPR (2014)
Family structures have changed significantly over the past few decades, with there being more generations in each family, but with fewer people in each generation.
Similarly, the number of older people without adult children may have implications for support and care at a time when central Government is insisting on families, especially adult children, to do more.
Beth Johnson Foundation, ‘Ageing in the UK Now’, October 2016

Navigating Change: A Review of the UK Maritime Welfare Charity Sector | 2017 125
6.4.2 FINANCING
Accommodation providers are feeling the pinch of government austerity measures. To compound general rises in operational costs caused by inflation and increased staffing costs, Local Authority payments for resident housing and care are failing to keep pace with the reality of provision costs.
Between a quarter and a third of our residents are Local Authority funded and not self-funding and, as we well know because it’s pretty much in the papers most days, is that Local Authority funding is woefully inadequate, so we end up with a bit of a hole in covering the cost of care
[RNRM/MN/FF, £1M-£5M]
The future of social care funding remains very much in the spotlight, with debates ongoing as to the extent that an individual’s own assets (including property) should be used to fund residential accommodation and care in older age. Whilst any policy changes will naturally impact on accommodation providers within the maritime welfare charity sector, it should be remembered that the relatively lower incomes, pensions, savings and home ownership amongst seafarers (particularly FF) are likely to mean that some reliance on
statutory funding will remain.
6.4.3 EVOLVING EXPECTATIONS
Expectations of old-age and senior housing are changing – ‘specialist housing for older people is no longer going to meet the expectations of the next generation of older adults’326. Maritime housing providers are already starting to experience this, but as many facilities are based in older, sometimes historic or listed buildings, it may be a struggle to meet the future expectations of residents.
We were looking towards expectations getting higher. It’s not necessarily the older people that come in and say ‘right, I need my own shower’, it’s the grandchildren for example, who say ‘grandad, you must have a room with your own shower’, whether he needs it or not, that’s the expectation
[RNRM/MN/FF, £1M-£5M]
I would say that our accommodation is not fully up to standard – it’s suitable at this present moment in time, but in 4, 5, 6 years’ time, as our population grows older and they need better accommodation to meet that need, we wouldn’t be able to fit that remit
[RNRM/MN/FF, £500K-£1M]
326 Beth Johnson Foundation (2016)

Navigating Change: A Review of the UK Maritime Welfare Charity Sector | 2017 126
WHAT DO PEOPLE WANT FROM THEIR HOUSING AS THEY AGE?
6.4.3 .1 COMMUNITY
Of most importance to older seafarers and their dependants is ‘staying in the local community’ (81%) and ‘being near family’ (80%)327. This aligns with wider research into the UK’s ageing population: a recent report ‘Ageing in the UK Now’ asserts that ‘most people want to remain in the neighbourhood they currently live in’328.
Some older seafarers and their dependants would only consider moving to a seafarers’ housing scheme if available within their current locality. A few participants suggest that seafarers’ housing schemes should be developed within communities rather than being isolated from other people and community amenities329. Obviously, for existing maritime facilities, location is already set.
One of our problems is [we] are stuck a little bit out in the country, the local Doctor’s surgery has closed…the bus company no longer runs a service to the village, so if anybody needs to get out and doesn’t have their own car, they have to take a taxi…I think social isolation could be a problem in the future
[RNRM, Under £100K]
6.4.3 .2 STAYING AT HOME
A 2014 report on housing by policy think-tank IPPR North, highlighted how ‘most people want to live independent lives and to stay in their own home as they age’330.
To answer the desire of many older seafarers to stay within their existing properties as long as possible, greater efforts may be needed to make existing homes ‘fit for purpose’. The Decent Home standard first set in 2000, has four key measures of accessibility which assess people’s ability to move around and so stay in their own home - only 5 per cent of English houses meet all four measures, and a quarter meet none331.
The Beth Johnson Foundation asserts that ‘there has been considerable investment in adaptive and assisted technology to help older people remain in their homes, but so far this has not translated into mass take up by individual older people’.332
6.4.3 .3 AN APPROPRIATE ALTERNATIVE TO HOME
Whilst people generally assert that they would want to stay in their own home when older, the reality of ageing often leads to an acceptance that this might not be possible. Indeed, in some cases, a smaller, more
manageable property, with on-site assistance can become increasingly attractive.
A study by NPI for Shelter and Joseph Rowntree identified factors that might make moving more attractive to older people, which included ‘living somewhere with dedicated on-site facilities (i.e. healthcare services and social activities)’333.
327 ORS (2016)328 Beth Johnson Foundation (2016)329 ORS (2016)330 Davies, B., IPPR North (2014)331 DCLG (2014) 332 Beth Johnson Foundation (2016)333 Pannell, Aldridge and Kenway, NPI for Shelter and the Joseph Rowntree Foundation (2012), as cited in Davies, B., IPPR North (2014)
A third of older people would like to downsize or have considered it, but have found that either there is not a suitable property for them to move in to or that the psychological and physical barriers are too difficult to overcome on their own and the support they need to overcome them is not available
Beth Johnson Foundation, ‘Ageing in the UK Now’, October 2016

Navigating Change: A Review of the UK Maritime Welfare Charity Sector | 2017 127
IPPR North observe that across various studies, there are several preferences that arise repeatedly334:
• A desire for space – with at least 2 bedrooms, to support sleeping separately when preferred / if it becomes a medical necessity, having relatives and friends stay, or for storage
• Access – both to convenient local services and transport links, but also in terms of the ability to move easily around the house and have assisted technology installed as and when necessary
• Outdoor space / a garden – to relax and spend time in, and as a way of keeping fit
Age UK reiterates the space requirement, and identifies this as a problem for the specialist housing sector; ‘most older people want a home with at least two bedrooms, but most specialist provision has only one’335. IPPR North observes that ‘the limited supply of specialist housing, combined with its failure to provide the space that older people expect and often require is a clear problem if…[wishing] to encourage older people to live in places where they can support themselves for longer’336.
Whilst some two-bedroom apartments, houses and bungalows are available as part of the maritime charitable housing provision, accommodation providers will need to remain alert to the continually changing needs and aspirations of their potential beneficiaries in this and many other respects.
We need to ensure that the standard of housing is…fit for purpose, so it’s got to be built…to life-time home standards, you’ve got to consider all those other, non-maritime reports that are being put out there in regard to accommodation and older people’s services to ensure that we get it right
[RNRM/MN/FF, £500K-£1M]
6.5 RESIDENTIAL ACCOMMODATION FOR OLDER SEAFARERS
Older seafarers and their dependants seem reluctant to consider residential accommodation: 91% do not want to live in care homes, 84% do not want to live in almshouses and 82% do not want to live in extra care housing337. Older seafarers and their dependants who are single or separated / divorced and in privately rented accommodation are more likely to be interested in almshouses and sheltered flats/bungalows. A higher proportion of those with depression, neurological or other mental disorders would also consider living in almshouses, while those with muscular/skeletal conditions and/or other mobility and/or dexterity problems are more likely to show interest in sheltered flats or bungalows. This demonstrates the extra care needed for those entering maritime housing.
Reticence about residential accommodation may be driven, at least in part, by people’s somewhat blinkered attitude towards their own ageing – as asserted by the Beth Johnson Foundation ‘planning for later life so that people are prepared for ageing is emerging as a significant priority for both older adults and people working in the field of ageing’338.
There are often negative connotations associated with residential accommodation and care, whereby people ‘don’t wish to go to a ‘home’, to be put somewhere to wait for God’339. Another contributory factor may be the widely reported care home abuse scandals and the patchy quality of care home provision. A 2013 YouGov poll for the Alzheimer’s Society found seven in ten people would be ‘scared’ of moving into a residential care home340.
334 Davies, B., IPPR North (2014)335 Age UK (2014)336 Davies, B., IPPR North (2014)337 ORS (2016)338 Beth Johnson Foundation (2016)339 Tele-depthinterview,RNRM,Under£100K340 Alzheimer’s Society (2013)

Navigating Change: A Review of the UK Maritime Welfare Charity Sector | 2017 128
Sheltered housing in the form of bungalows or flats appears more agreeable to older seafarers, with almost two-fifths (37%) prepared to consider such accommodation. It is likely that this is perceived to be an ‘independent living’ option, and so may be more palatable when considering the future. Half of respondents (53%) rate ‘living on one level’ as important, which may also contribute to the greater preference for sheltered flats and bungalows (although it should be noted that the importance of one level living has declined notably since 2007, when it was 64%).
There is relatively low awareness of seafarers’ housing schemes amongst the target audience – 26% of the older seafarers and their dependants questioned had never heard of any341. As well as raising awareness of what is available, accommodation providers might also consider addressing any negative associations seafarers may hold about residential care.
6.5.1 DEDICATED SEAFARER VS. WIDER COMMUNITY FACILITIES
Over half (55%) of the maritime accommodation providers surveyed agree that ‘seafarers are better living in a dedicated facility for those who have been at sea, rather than a mixed community facility’, whilst just under a fifth disagree (see Figure 6.3). Tri-Service charities are much more likely to disagree than maritime charities (60% cf. 18%), again this reflects that provision tends to be all Armed Forces combined, rather than Naval Service specific.
FIGURE 6.3How strongly do you agree or disagree that ‘seafarers are better living in a dedicated facility for those who have been to sea, rather than a mixed community facility’?342
Accommodation providers that disagree with dedicated facilities, point to a desire to integrate seafarers in the wider community ‘because seafarers and their families are ‘normal’ people that could easily integrate in a mixed community. They do not need to live in a ghetto’343. Those who agree with dedicated facilities believe that the ‘common bond’ of having been at sea generates a greater sense of security and community amongst residents.
Interestingly, when older seafarers and dependants are themselves asked about the most important factors regarding the location of their home, ‘being near to other seafarers’ is considered the least imperative factor, with only two-fifths (43%) rating it as important. Fishermen consider all of the factors to be more important, including ‘being near other seafarers’, than those older seafarers from RNRM or MN (76% FF, 36% RN, 34% MN).
341 ORS (2016)342 Online survey, (‘live in’ accommodation providers responding, n=16)343 Online survey, comment from Maritime charity respondent
6.3
9%
6%
60%
9%
25%
20%
27%
25%
20%
27%
25%
27%
19%
Tri-Service (n=5)
Maritime (n=11)
Total (n=16)
No response/Don't know 1-2 (Completely Disagree) 3-4 5-6 7-8 9-10 (Completely Agree)
44%
55%
20%
31%
18%
60%
% Agree (7-10)
% Disagree
(1-4)
6.3
9%
6%
60%
9%
25%
20%
27%
25%
20%
27%
25%
27%
19%
Tri-Service (n=5)
Maritime (n=11)
Total (n=16)
No response/Don't know 1-2 (Completely Disagree) 3-4 5-6 7-8 9-10 (Completely Agree)

Navigating Change: A Review of the UK Maritime Welfare Charity Sector | 2017 129
TABLE 6.1
Important factors in location of housing, by longest service served in344
Factors % saying ‘important’
Overall Fishing FleetsMerchant
NavyRoyal Navy
Staying in the local community 81% 92% 73% 81%
Being near family 80% 91% 74% 75%
Being by the sea 54% 83% 48% 38%
Living on one level 53% 73% 48% 39%
Being near other seafarers 43% 76% 34% 36%
6.6 FUTURE PROVISION
As outlined in Section 6.1, the number of care beds dedicated to seafarers and their dependants remains low. As the demographics point towards increased need for older seafarers (particularly MN and FF) over the next 10-15 years at least, then these numbers are worrying.
In our survey, accommodation providers acknowledge future need, with over half (53%) anticipating an increase in demand for their services over the next 5 years, and just 18% anticipating a decline345. It is also worth noting, that this anticipated increase is based on current experience, but were more done to advertise the maritime welfare charity sector to beneficiaries, and so raise awareness of the accommodation support available, then additional unforeseen demand may be generated.
A concern is what might happen if seafarer need increases over the next ten or so years as predicted and existing accommodation is already full. Similarly, if accommodation providers fail to meet the needs of an older and frailer population, seafarers risk being ‘moved on’ to an unknown place when they reach a critical point.
6.6.1 BUILDING NEW FACILITIES
The building of any new facilities for the express use of seafarers may not be financially justifiable, given that such buildings would have a life extending beyond the time when it is known that the seafaring population will begin to decline.
If new facilities are to be established, then they will need to be ‘future-proofed’, extending beyond maritime beneficiaries. As already highlighted, mixed community facilities do not appear to be a ‘deal-breaker’ for seafarers themselves. Charities may require a change in existing objects in order to support non-seafarers, and some
accommodation providers have already taken this path.
344 ORS (2016)345 Online survey, (‘live in’ accommodation providers responding, n=16)
We changed our constitution…[we] felt that there were plenty of people that needed our help, where there wasn’t a mariner, we could bring in a non-mariner to support
[RNRM/MN/FF, £1M-£5M]

Navigating Change: A Review of the UK Maritime Welfare Charity Sector | 2017 130
As highlighted in the 2007 report, one option would be to collaborate with non-maritime organisations, such as housing associations and other social housing providers to build joint facilities, with a proportional allocation for seafarers that could evolve over time to reflect beneficiary levels. Nautilus Welfare Fund’s proposed redevelopment of the Gibson House site adjoining the Mariners’ Park Estate in Wallasey adopts another approach where, by using existing land assets and forming a partnership with a private developer, a mixed-use site will be created, including allocated accommodation for older seafarers.
6.6.2 OTHER POTENTIAL INITIATIVES
Despite the great building initiatives seen at Wallasey346, and the acknowledgement that further new facilities may still need to be built, the increasing numbers of older seafarers likely to require accommodation support over the next 15-20 years, will exceed capacity. Other housing initiatives, with the potential to help a greater number of seafarers within a more immediate timeframe, will need to be adopted to meet this short to medium term need.
One of the questions that the sector needs to look at is…does it continue to support purpose built homes – an accommodation centre that offers sheltered accommodation plus, all the way up to full nursing or whether it does it in a different way…Rather than providing care homes and all the other bits and pieces, maybe we should be providing grants to individuals to go out and get their own stuff or support what they can get from the National Health Service or the wider social support network
[RNRM, £100K-£500K]
6.6.2 .1 REMODELLING EXISTING HOMES
IPPR North’s 2014 report points to Japan as a potential template for innovative housing solutions for the elderly given that the country has been dealing with an ageing population for many years – the number of Japanese people aged 65 years or older has nearly quadrupled over the last forty years, to 33 million in 2014, accounting for 26% of Japan’s population347.
One solution they have adopted is to adapt and re-model existing properties so that individuals can stay within their own homes. In Japan, ‘48.7 per cent of general housing is…equipped for older persons, while 15.7 per cent of dwellings owned by the occupants…were remodelled between 2004 and 2008 to accommodate the older occupant’s needs’348.
Many maritime welfare charities already provide generous financial grants for the installation of stair-lifts and other mobility and accessibility adaptions (see Section 7). It may be that in the future, increased consideration will need to be given to larger-scale remodelling works, such as widening doors, building ramps, lowering work surfaces, installing wet rooms, etc.
346 Comprising the creation of the Trinity House Hub, Seafarers UK Centenary Wing, and the proposed redevelopment of the Gibson House site at Mariners’ Park, Nautilus Welfare Fund
347 Japan’sMinistryofInternalAffairsandCommunication,StatisticsBureau(2016),ascitedinDavies,B.,IPPRNorth(2014)348 Davies, B., IPPR North (2014)
GIBSON HOUSE, NAUTILUS WELFARE FUND
Under an agreement between Nautilus Welfare Fund, Wirral Council and the developer Prospect Capital, the council and the charity will sell land to the company to create a larger and more viable site for development. As well as seeing Gibson House refurbished into apartments, retaining the existing structure, the plan will include the construction of between 26 and 28 new apartments for Nautilus Welfare Fund beneficiaries.
(The Housing Association or was it the Council?) have added adaptations to the flat – steps at the back; put a shower in the bathroom, they got a mattress for him.
Carer, Fishing Fleet (ORS, 2016)

Navigating Change: A Review of the UK Maritime Welfare Charity Sector | 2017 131
Simply providing information and advice about what adaptive and assisted technology is available may also be a service that could prove beneficial to elderly seafarers and their dependants.
In addition to providing financial grants for adaptive and assisted technology within seafarers’ own homes, maritime welfare charities could facilitate ‘care and repair’ services - ‘handyperson programmes to provide advice and some support to vulnerable, disabled and older people seeking small adjustments to their properties or help with assembling furniture or putting up shelves’349. ‘Care and repair’ received a positive review by academics at York University, who highlighted strong returns on often small investments in services350. Indeed, the Royal British Legion (RBL) already offers such a service through its ‘Poppy Calls’ provision, a fleet of vans operated by experienced handy-people covering 21 UK counties which help ex-Service people and their families with small household repairs and minor adaptations. RBL also partners with other organisations such as Age UK to offer the same help in counties not covered by their own handy-van fleet.
6.6.2 .2 CROSS-GENERATIONAL LIVING, COLLABORATIVE COMMUNITIES AND CO-HOUSING
In Germany, Mehrgenerationenhäuser (multigenerational housing) developments provide a system of mutual support for everyone living there, young and old alike. They aim to provide low-cost childcare, tackle loneliness and enhance community cohesion by giving older people a clear and significant role in childcare.
The model is delivered through community buildings that simultaneously act as community centres, day-care centres and the equivalent of a retirement home’s communal areas – offering company for older people, and affordable childcare for local parents351. In the UK, the first instance of a children’s nursery and elderly care home being located on the same site has recently been established at Nightingale House in Clapham, London352. Clearly, such communities may not be appropriate for the very elderly or frail, and some older people may prefer a quieter retirement without the presence of children, but the principle behind multi-generational housing schemes might have a place within the maritime sector, with older seafarers offering support to the wives and partners of serving seafarers through community centres or other schemes.
Similar thinking of putting different people together to support each other is behind the ‘Shared Lives’ model that has emerged throughout England. For those maritime charities providing assisted housing and social care support, it is possible that some form of ‘Shared Lives’ approach could help reduce care costs, while simultaneously addressing the social isolation prevalent within the seafaring community.
349 Davies, B., IPPR North (2014) 350 Croucher, Lowson and Fountain, York University for DCLG (2012), as cited in Davies, B., IPPR North (2014)351 Davies, B., IPPR North (2014) citing McNeil and Hunter, IPPR (2014)352 As reported by Hurst, G. in The Times (1/07/2017)
The Shared Lives model works by introducing the vulnerable or elderly person to an intended carer, through a system which matches the needs of the individual and the support capacities of the carer. The would-be carer’s accommodation will be checked to see whether it can be adapted to the needs of the individual, and, if the arrangement suits both people involved, then the individual will move into the carer’s home.
IPPR North, ‘For Future Living: Innovative Approaches to Joining Up Housing and Health’, 2014
The front of my house is damaged… so Care and Repair told me to be patient and they will be trying to do something for me…Say it cost £10,000; they said they’ll pay for it, and they’ll take a charge on your house for that £10,000. I thought that was quite a good thing … there’s someone there trying to help you. It does make me feel a bit better.
Merchant Navy Officer caring for his disabled wife (ORS, 2016)

Navigating Change: A Review of the UK Maritime Welfare Charity Sector | 2017 132
Senior co-housing is another initiative which is starting to build momentum in the UK. The Older Women’s Co-Housing Project (OWCH) created a community for women over fifty in a new purpose-built block of flats in North London. The complex has 17 leasehold flats and 8 for social rent, with a shared common room, guest suite, garden and laundry. The group ‘see co-housing as a way of living as co-operative, friendly neighbours’ that ‘could enrich the last years of many, and reduce pressures on health and care services’.353
The London Countryside Co-Housing Group has started work on a similar scheme in Cannock Mill Colchester, with the hope that it will ‘eliminate the social isolation that threatens many today, especially in later life, and recreate the neighbourly support of the past’. Again, the intention is to include some shared facilities, including a nod to the potential need for care services in later life: ‘We can share gardening, cars, skills, carers in old age’354.
The fundamentals of such schemes are similar to Nautilus Welfare Fund’s Trinity House Hub, which comprises self-contained flats, but with communal areas including a gym, café, resident lounges and gardens in which to socialise as desired. It may be that this approach could be taken a step further in terms of creating shared ownership schemes with those seafarers or their dependants wishing to create a co-housing community.
Initiatives such as those outlined above which rely on more ‘informal’ or ‘collaborative’ caring, may become even more pertinent in light of a potential staffing crisis facing social care. As highlighted in the report ‘Ageing in the UK Now’:
• the NHS workforce is ageing, with 47% aged over 50, and with a chronic shortage of nurses
• 1 in 5 of the adult social care workforce (18.4%) in England was born outside of the UK, which may have implications following Brexit
• nearly 1 in 20 (4.8%) of positions in adult social care in England are currently vacant – nearly twice the vacancy rate in the UK’s labour force as a whole (2.6%)355
6.6.2 .3 ADAPTING THE TYPE OF CARE OFFERED
In terms of the type of care offered, IPPR North once again points to Japan as an example, with its ‘strong emphasis on institutional rehabilitation services’ which are aimed at helping people recently discharged from hospital who require rehabilitation prior to being able to return to their home. In the UK, there is some limited availability of ‘step-down’ accommodation to gradually transition people back to their homes, although a 2013 audit of intermediate care estimated that capacity was around half the level of demand356. One maritime accommodation provider participating in the depth interviews, highlighted how this service was already part of their offer.
[The Government] doesn’t see a care home as long term, they see it as a short-term fix, a rehabilitation for what we call ‘step-up, step-down beds’ where they are not quite ready to get back to their own home and they need some extra care before they do that…so rather than keep them in the hospital…they try to filter them out into care homes. Our facility here has had to adapt to all of that
[RNRM/MN/FF, £1M-£5M]
353 www.owch.org.uk354 http://cannockmillcohousingcolchester.co.uk/355 Beth Johnson Foundation (2016)356 NHS Benchmarking Network (2013)
There is an increased focus on co-housing or collaborative housing from older people, housing providers and local government. More specifically, as family structures and society has changed, co-housing is being seen as a way to recreate a local community.
IPPR North, ‘For Future Living: Innovative Approaches to Joining Up Housing and Health’, 2014

Navigating Change: A Review of the UK Maritime Welfare Charity Sector | 2017 133
With increasing numbers of older people staying within their own homes longer, the need for domiciliary care services is likely to increase. One maritime charity providing domiciliary care, notes that ‘over a 10-year period, we’ve gone from 1 in 50 households having some help in their home to 1 in 4 households’357. Insurance firm Bupa has predicted that by 2020 there will be a shortage of 100,000 places in adult social care, a consequence of declining provision and fiscal tightening358. Maritime accommodation providers already have extensive experience in adult social care, and so could potentially develop services to meet such demand in the wider community.
Increased provision of extra-care housing may also be a consideration for the maritime sector. Extra-care housing allows for a broader spectrum of support to be offered to residents than is generally possible in retirement housing, serving to bridge the gap between retirement housing and care homes359. As the population ages and residents become frailer with more complex health issues, extra-care housing could allow them to stay within an existing facility, rather than have to move to one with more comprehensive nursing support.
Thus, as the maritime beneficiary population reduces and the spectrum of need evolves, the type of support offered, as well as who it is offered to, may need to be flexed.
6.6.2 .4 COLLABORATION AND CO-OPERATION
Critical to the future effectiveness of housing and social care provision for seafarers is the ability of the maritime welfare charity sector to co-ordinate, co-operate and collaborate. There is a clear ‘life-cycle of care’ for older seafarers in this area, ranging from financial and practical support to help people stay in their own homes to providing specialist residential and nursing facilities.
On the whole, charities tend to focus on just one or two stages of this life-cycle. Whilst this isn’t an issue in itself, communication and collaboration between organisations is essential to ensure beneficiaries receive the care appropriate to their needs at each point of the cycle.
Collaboration amongst accommodation providers in the maritime sector appears to be reasonably well-established, with specific examples of residents being moved between facilities as their needs change. There is some desire to further strengthen such arrangements in the future.
We are looking to develop a closer relationship [with another accommodation provider] …They have a nursing wing for people who are no longer able to look after themselves…and that might be a natural channel for some of our residents when they get to that stage…The problem is when they do need proper nursing care, where do they go, because their families can’t afford anything
[RNRM, Under £100K]
To better meet the needs of each individual, it may be beneficial for all facilities to operate at an overall maritime sector level, welcoming beneficiaries from any of RNRM, MN or FF. In reality, the majority of facilities already operate on this basis, but having a comprehensive sector view of all of the various types of accommodation and care places available for seafarers would allow individuals a better chance of having their needs met somewhere.
Furthermore, the imminent increase in demand, particularly in specialist care areas such as dementia and Alzheimer’s may mean looking beyond the maritime welfare charity sector and forging partnerships with organisations specialising in these areas, and potentially just funding places for seafarers within mainstream facilities.
357 Tele-depthinterview,MN,£1M-£5M358 Bupa (2011) 359 Davies, B., IPPR North (2014)
By not having the extra care housing offer available, some people would perhaps be propelled into long term care a little bit sooner than they really and truly needed it
[MN, £1M-£5M]

Navigating Change: A Review of the UK Maritime Welfare Charity Sector | 2017 134
In regards specialist accommodation to deal with mental health issues such as Alzheimer’s or dementia, that could be anywhere, it could be at a specific hub provided by the maritime sector, or it could be funding that’s put into a mainstream facility in partnership with somebody else
[RNRM/MN/FF, £500K-£1M]
Collaboration with non-accommodation providers – both within and outside of the maritime sector – could also be encouraged. Maritime welfare charities providing financial assistance may be the first port of call for older seafarers who wish to stay in their homes, in order to secure grants for adaptive and assistive technology. The creation of ‘holistic care packages’ or ‘financial care packages’ to support individuals to stay within their own homes could be something that a number of different maritime charities contribute to.
These charities, particularly if conducting ongoing case-working or annual beneficiary assessments, would be in a position to highlight to older seafarers when they may need to consider alternative housing, providing information to the individual or flagging their case to an appropriate accommodation charity. Those contacting SAIL for housing advice could also be sign-posted to maritime accommodation providers, as and when appropriate.
Mainstream charities such as Age UK, Dementia UK and the Alzheimer’s Society, as well as other community groups such as the WI or UK Men’s Sheds Association, can potentially offer services to benefit older seafarers and their dependants. Such activities could help to reduce social isolation, and bring a greater sense of being part of the wider community.
I think that there’s a lot out there in the mainstream that we could tap into…I still believe that seafarers are [better] looked after by those that understand them, and they do need that community of understanding, but at the same time, there are services out there within the mainstream, mainly voluntary, that can be tapped into as well to further support them
[RNRM/MN/FF, £500K-£1M]

Navigating Change: A Review of the UK Maritime Welfare Charity Sector | 2017 135
6.7 CONCLUSIONS
Accommodation providers face a challenging time ahead, with reduced government funding for rents and social care, increasing operational and staffing costs, and a potential increase in beneficiaries with more complex needs (at least in the short to medium term). No one single initiative can meet the challenges faced, instead the MWC sector needs to adopt a number of complimentary activities to provide seafarers with a ‘life-cycle of care’.
Sector-wide co-ordination and collaboration will be essential – amongst accommodation providers to ensure that beneficiaries are housed in the facility most appropriate to their needs, but also amongst those providing financial assistance, so that adaptive and assisted technology allowing seafarers to stay within their own homes for longer can be funded.
It is also important to look beyond the maritime sector, to partner with mainstream accommodation and social care providers, particularly for specialist dementia and Alzheimer’s care. In some cases, it may be more cost effective for maritime accommodation providers to pay for mainstream facilities to house seafarers rather than offering a service themselves.
Maritime accommodation charities may need to expand their beneficiary eligibility criteria – extending to all seafarers regardless of RNRM/MN/FF, and potentially to non-seafarers – in order to future-proof their facilities against what is ultimately a declining seafaring population. Similarly, the type of support offered may need to be flexed to meet the growing demand for ‘step-down rehabilitation’, domiciliary care and extra-care housing.
In order to meet the aspirations and expectations of future beneficiaries, maritime charities need to consider longer term ‘transformative’ housing solutions, such as shared ownership schemes; partnerships with housing associations/commercial property developers to create new affordable housing; co-housing, communal living and cross-generational schemes; and informal, collaborative caring solutions, all of which could offer real benefits to seafarers, both those of working age and retired. There is also evidence that these can be achieved cost-effectively360.
360 Harflett,Pitts,GreigandBown,NDTi(2017)

Navigating Change: A Review of the UK Maritime Welfare Charity Sector | 2017 136

Navigating Change: A Review of the UK Maritime Welfare Charity Sector | 2017 137
SE
VE
N

Navigating Change: A Review of the UK Maritime Welfare Charity Sector | 2017 138
7. A HAND OUT OR A HAND UP? The role and relevance of benevolent grant-making
WHILST A RELATIVELY HIGH
PROPORTION OF MARITIME
WELFARE CHARITIES PROVIDE
DIRECT FINANCIAL ASSISTANCE
TO INDIVIDUALS, IN MANY
CASES THIS NOW FORMS
JUST ONE PART OF A WIDER
‘BENEVOLENT’ SUPPORT
SOLUTION
KEY POINT 7 Just under half of maritime welfare charities which deal directly with individual beneficiaries provide financial assistance, and their ongoing support will prove vital as austerity measures continue to bite
One third agree that monetary grants given directly to individuals are ‘the most effective benevolence channel’, with many believing that such monies need to form part of a wider support solution
Case-working is widely used, although its implementation – from purely financial to wide-ranging, professional assessments – is inconsistent across the sector
The development of information and advice services such as SAIL361, has resulted in beneficiaries being advised on statutory entitlements, rather than defaulting to charity ‘hand-outs’, whilst improved sector networks have led to more collaboration and signposting to provide beneficiaries with a rounded solution
Inconsistent beneficiary eligibility criteria can still present challenges for sign-posting and collaboration
Many charities are now looking at preventative or ‘upstream’ solutions to address issues before they become a problem, and believe that increased lobbying of government and other industry bodies to improve seafarers’ working conditions would be beneficial in this respect
361 Seafarers’ Advice and Information Line (http://sailine.org.uk)

Navigating Change: A Review of the UK Maritime Welfare Charity Sector | 2017 139
Much can, and should, be done to initiate preventative measures to try to reduce future beneficiary need. However, direct monetary assistance, particularly for emergency relief, will always be needed, and maritime welfare charities should make suitable provision for this. An increased use of professional case-workers and multiple-charity support packages is likely to encourage longer-term financial independence for beneficiaries

Navigating Change: A Review of the UK Maritime Welfare Charity Sector | 2017 140
7.1
7.2
7.3
7.4
20%
8%
36%
40%
48%
48%
52%
64%
84%
Other types of financial support
Loans to individuals
Household goods provided to individuals via suppliers
Educational / school grants
Funeral grants
Regular financial payments to individuals
Purchase of specialist equipment / mobility aids
Emergency grants
One-off / ad hoc payments to individuals
8% 14% 20% 27% 22% 8% Monetary grants given directly to
the individual are the most effective benevolence channel
Don't know 1-2 (Completely Disagree) 3-4 5-6 7-8 9-10 (Completely Agree)
28% 7% 30% 26% 9% Maritime charities employ a
common/standard set of tools for needs assessment
Don't know 1-2 (Completely Disagree) 3-4 5-6 7-8 9-10 (Completely Agree)
Household repairs
Medical costs
Fuel / transport
Clothing
Care home top up fees
7.1 EXTENT OF FINANCIAL ASSISTANCE
Our analysis suggests that 48% of Maritime Welfare Charities provide financial grants to individuals362.
7.1 .1 TYPES OF FINANCIAL ASSISTANCE
The updated survey amongst former and older seafarers and their dependants found that just under two-fifths (37%) had, at some point, received money as a beneficiary of a maritime charity363.
More than half (55%) of the dependants of working age seafarers applying for help to maritime charities had applied for financial help, with this highest amongst FF seafarers (69% FF, 58% MN and 51% RNRM). Other types of help that were widely applied for included: clothing/uniform (23%), white goods/furniture (17%), IT equipment (17%), housing (17%) and respite/short breaks (17%)364.
Amongst those maritime welfare charities surveyed which provide financial assistance, support is most commonly provided through one-off payments (84%, see Figure 7.1)365. However, maritime welfare charities tend to offer multiple types of financial support: eight in ten of those giving regular grants also provide assistance through one-off ad hoc payments to individuals366.
FIGURE 7.1
What type of financial support and items does your organisation provide to end beneficiaries?
7.1 .1 .1 ONE-OFF AD HOC PAYMENTS
Of those maritime welfare charities that provide financial assistance to individuals, the proportion conferring one-off, ad hoc grants (84%), appears similar to levels found across the wider third sector. In 2014, a Turn2us/ACO survey of grant-giving charities recorded 79% providing one-off ad hoc grants to individual beneficiaries367.
362 QuantitativeanalysisbasedonMNWBdefinitions363 ORS (2016)364 IPC (2016)365 Onlinesurvey,(allMaritimecharitiesprovidingfinancialassistance,n=25)366 Online survey, (all Maritime charities providing regular grants, n=12)367 nfpSynergy for Turn2us/ACO (2014)

Navigating Change: A Review of the UK Maritime Welfare Charity Sector | 2017 141
Of those surveyed maritime welfare charities that provide one-off ad hoc payments to individuals (n=21), two-thirds (67%) have increased their use of this benevolence channel over the last 5 years. These grants respond to a wide gamut of need, and are likely to include those grants also shown separately for household goods, mobility aids, funeral costs, educational costs, as well as others for transport, medical provision and debt assistance.
Almost a quarter (23%) of maritime welfare charities ‘purchasing specialist equipment and mobility aids’ for beneficiaries have noted an increase in the need for this type of support over the last 5 years368. In the depth interviews, charities highlight how an ageing population combined with reduced government provision is driving this increased demand.
Medical aids…are definitely a postcode lottery area, and you could be dead in certain parts of this country before you get a stair-lift. We’ve had two 87 years olds, two years ago, who desperately needed a stair-lift, and were told yes by their Local Authority, they could have one and their names were on the waiting list and they were told it was an 18-month list. That is ridiculous
[RNRM, £100K-£500K]
Feedback during the depth interviews suggests that requests for grants to help clear debts are also on the increase. Whilst austerity measures and other financial pressures are driving this, some also highlight the generational shift whereby credit use is increasingly prevalent amongst the beneficiary population – something which has not been the case historically.
The current generation of our older beneficiaries…doesn’t use credit cards, because they know that credit cards lead to debt, but also, they were not part of the working population when credit became a standard way of financing activities…What concerns me is seeing more and more people entering retirement needing our assistance, and part of that is because they’ve got credit card debts
[MN/FF, £1M-£5M]
A couple of respondents in the depth interviews highlight funeral costs as an area of increasing need, with seafarers themselves failing, or unable, to make sufficient provision. In the online survey, a third of those providing funeral costs claim an increase in such support over the last 5 years369. This is borne out across society generally with UK councils reporting a 50 per cent rise over the last four years in the number of burials and cremations they have had to fund370.
When we started in post, the average, no frills funeral cost was about £2,500, the average cost is now £3,700 and people think the State will help. The State helps very few people and the grant that they give has either been frozen or reduced
[RNRM, £100K-£500K]
7.1 .1 .2 EMERGENCY GRANTS
Almost two-thirds (64%) of those charities providing financial assistance to individual beneficiaries, offer emergency grants371. This appears to be a much higher level than recorded in the Turn2us/ACO survey which found just 30% of grant-giving charities offering emergency assistance372. The differential may simply be due to an inconsistency in the definition of what constitutes ‘emergency’ funding (relating to either the purpose of the grant and/or the speed with which it needs to be conferred), but could also reflect the dangers inherent in jobs in the maritime sector which often require an immediate response.
368 Onlinesurvey,(allMaritimecharitiespurchasingspecialistequipment/mobilityaidsforbeneficiaries,n=13)369 Online survey, (all Maritime charities providing funeral costs, n=12)370 As reported by Morris, N. in the ‘i’ newspaper, 16/04/17371 Onlinesurvey,(allMaritimecharitiesprovidingfinancialassistance,n=25)372 nfpSynergy for Turn2us/ACO (2014)

Navigating Change: A Review of the UK Maritime Welfare Charity Sector | 2017 142
Of those maritime welfare charities surveyed that provide emergency grants (n=16), over half (56%) have increased such support over
the last 5 years.
7.1 .1 .3 REGULAR GRANTS
Half of the maritime welfare charities surveyed who provide financial assistance do so in the form of regular grants (48%). Grants are provided at different intervals – monthly, quarterly, twice a year – but when reported allocations are averaged to a monthly level, payments range from £15 to £230, with a mean of £96.
A number of charities participating in the depth interviews mention making additional payments to their regular grant recipients, most commonly at Christmas, but also at Easter or to reflect a specific point in their beneficiaries’ year, for example, to purchase school uniform ahead of a new school year.
7.2 FINANCIAL GRANTS GIVEN TO INDIVIDUALS - AN EFFECTIVE BENEVOLENCE CHANNEL?
Despite over half (54%) of the maritime welfare charities in our sample providing financial benevolence, only a third actively agree that ‘monetary grants given directly to the individual are the most effective benevolence channel’, with a similar proportion disagreeing that this is the case. In contrast, less than a fifth (17%) of tri-Service charities agree that monetary grants are the most effective benevolence channel, whilst three-fifths (61%) disagree373.
FIGURE 7.2
How strongly do you agree or disagree that ‘monetary grants given directly to the individual are the most effective benevolence channel’?
The depth interviews help to inform the view on monetary grants amongst maritime welfare charities. A few respondents believe that such awards can often fail to address the root cause of a beneficiary’s issues, acting merely as a ‘band-aid solution’.
373 Online survey and tele-depth interviews (all Maritime charities responding, n=59 / all tri-Service charities responding, n=18)
Sadly, a lot of these are driven by catastrophes at sea, so if there’s been a bad year out in the North Sea or there’s been a number of fishing accidents then…beneficiaries tend to increase
[MN/FF, Under £100K]
% Disagree
(1-4)
% Agree (7-10)
34% 31%
7.1
7.2
7.3
7.4
20%
8%
36%
40%
48%
48%
52%
64%
84%
Other types of financial support
Loans to individuals
Household goods provided to individuals via suppliers
Educational / school grants
Funeral grants
Regular financial payments to individuals
Purchase of specialist equipment / mobility aids
Emergency grants
One-off / ad hoc payments to individuals
8% 14% 20% 27% 22% 8% Monetary grants given directly to
the individual are the most effective benevolence channel
Don't know 1-2 (Completely Disagree) 3-4 5-6 7-8 9-10 (Completely Agree)
28% 7% 30% 26% 9% Maritime charities employ a
common/standard set of tools for needs assessment
Don't know 1-2 (Completely Disagree) 3-4 5-6 7-8 9-10 (Completely Agree)
There’s all sorts of different ways that you can help and in some respects, with some individuals, monetary grants typically cover over the cracks, which can then reappear later on
[RNRM, Under £100K]
It’s a half-way solution typically. Most people have a reason why they’re in poverty and it’s the underlying causes…which we would all do better to understand and therefore, try to counteract
[RNRM, Over £5M]

Navigating Change: A Review of the UK Maritime Welfare Charity Sector | 2017 143
Even those who are more convinced about the benefits of monetary grants, highlight how they need to be given with due consideration and to, ideally, form part of a wider support solution.
We have a duty of care to make sure that we’re not fuelling other problems in that household, by simply making these payments without any questions asked
[MN/FF, £100K-£500K]
Just over a third (36%) of those surveyed that provide financial support, choose to do so by purchasing household goods and services for beneficiaries through a third-party supplier (see Figure 7.1). In the depth interviews, a number of respondents talk about providing financial assistance via partner organisations, so that money is not being given directly to an individual – this is often used as a safety-net to ensure that the aid is being spent as intended.
One respondent points to the difficulties of proving how charitable donations are being spent, particularly if giving cash to individuals.
As charities, we have to be very good in accounting for the way in which all of the charitable income that people donate to us…is accounted for…If we give it in cash…then we can’t do that
[RNRM, Over £5M]
Despite such concerns, monetary benevolence paid directly to individuals still forms the lion’s share of financial assistance given to beneficiaries, providing a vital lifeline for many seafarers, now and in the future. A more pertinent question may be whether ongoing regular grants remain an appropriate and cost-effective benevolence channel.
The Merchant Navy Welfare Board (MNWB)’s ‘Older seafarers and families working group’ highlights in its 2017 report how ‘the issue of regular grants has been a subject of debate over many years. Some take the view that it is better to use funds for one-off grants that can make a real impact on people’s lives. Others consider that the current maximum state pension of £150 per week is totally inadequate…regular grants amount to around 10% on top of the pension, and it is difficult to argue that this cannot be justified’374.
The report also highlights that Nautilus Welfare Fund has ‘discontinued regular grants to new applicants and withdrawn them from those existing beneficiaries who it was felt would not be adversely affected’. In reviewing existing beneficiaries, Nautilus found that many no longer needed regular grants due to increases in statutory benefits or changed financial circumstances – a good argument for conducting a thorough needs assessment ahead of providing any monetary aid (see Section 7.3).
Amongst beneficiaries themselves, regular grants are very much valued. Amongst the dependants of working age seafarers, more than half (54%) of applications to maritime charities were for one-off support, whilst a
374 MNWB (2017a)
An individual who is constantly in debt may not always be the best person to give the money to, to help them get out of debt…I think it’s a case-by-case decision, sometimes better actually to deal with another authority that can provide a type of support, rather than give it to that individual
[RNRM, £100K-£500K]
We assisted with debts…but we did it carefully and we did it through the Mission to Seafarers by arranging through them to give vouchers [to] be used in Asda or Tesco, we didn’t give cash
[MN, Under £100K]
Navigating Change: A Review of the UK Maritime Welfare Charity Sector | 2017 144
higher proportion (62%) received ongoing help, support or advice. In the previous survey, 29% of beneficiaries had applied for one-off grants and 41% regular grants375.
More than eight in ten older seafarers and their dependants think that the giving of regular payments by maritime charities is important - indeed, they consider it more important for maritime charities to provide regular grants than one-off payments (84% and 75% respectively). It may be, however, that a greater familiarity with regular grants, rather than, say, what case-working or financial advice may be able to achieve, has some influence on perceived importance376.
Whilst some regular grants are made primarily to ease ongoing financial hardship, others aim to achieve a specific goal for that beneficiary, for example, educational success. In addition, regular grants can have a secondary benefit of establishing an ongoing relationship between the charity and beneficiary. Not only can this ensure that other problems are captured as and when they arise, but it may also provide a route through which to reach other potential beneficiaries – a key issue for the sector, particularly amongst MN and FF, as discussed in Section 9.
7.2.1 A CONTINUING NEED FOR FINANCIAL ASSISTANCE?
The updated reports on seafarers’ needs suggest that a lower level of Income Support is claimed by seafarers now than in 2007, excluding older fishermen and their dependants, and that there has also been an increase in those finding it easy to make ends meet (43% compared to 34% in 2007)377. The proportion of seafarers aged 60-64 who are still in some form of paid employment has increased since the 2007 report (39% in 2017, 18% in 2007)378, although this may not result in ‘extra’ money, instead off-setting changes in pension/benefits provision and cost of living increases.
In the depth interviews, some maritime charities note that the level of ‘acute’ need is perhaps not as high as it was due to: the safety net of government benefits (particularly when case-working / SAIL can help to unlock these funds), provision of better Naval pensions and because, for those still serving in the Merchant Navy, working conditions are finally felt to be improving.
375 IPC (2016)376 ORS (2016) - 55% of older seafarers and dependants are aware of regular grants being provided by maritime charities,vs. only 18% being aware of financial advice
provision377 ORS (2016)378 IPC (2016)
By and large, these days people tend to have pensions, widows’ pensions and things like that, so actually they’re not really in ‘distress’ in the same way…People tend to have better provision, partly because when the Service changed the pension arrangement for Officers…most people bought back into half a pension, so that’s enough to keep the wolf from the door
[RNRM, Under £100K]
The implementation of MLC 2006 [is] starting now to impact, so standards on-board the vessel are improving, some have grasped the nettle and are way above what’s expected, others are still working towards
[MN/FF, £100K-£500K]

Navigating Change: A Review of the UK Maritime Welfare Charity Sector | 2017 145
Even if Income Support claimant levels have reduced amongst seafarers, a recent report by IPPR makes the point that an income crisis is not merely an issue for those receiving benefits or with the lowest incomes (see boxed text below).
As highlighted in Section 2, research in 2008 identified that one in three seafarers had an income of under £10,000 a year, and over two-thirds earned under £30,000379.
The effects of government austerity measures detailed earlier will continue to adversely affect some seafarers and their dependants, and as such, the need for maritime welfare charities to meet the financial shortfall is likely to continue, at least in the short-term.
In the wider third sector, the Association of Charitable Organisations notes how the effects of austerity are having a twofold impact on benevolent grant-makers – their work and operational methods, and the beneficiary. Benevolent grant-makers are responding in a variety of ways: 36% have already reduced or are currently reducing overheads and 18% plan to increase grant levels. Seven in ten (71%) said that the economic downturn had made ‘no change’ to tightening their eligibility criteria380. In contrast, research by the Directory of Social Change showed that during the recession some grant-makers did tighten their eligibility criteria381.
Of those maritime welfare charities surveyed that are providing financial assistance, 76% anticipate a change in demand from their beneficiaries382. Of these, a quarter (26%) have already increased the amount of financial aid given to their existing beneficiaries, with a further 31% intending to do so in the future, whilst one in ten (11%) have decreased the amount of financial aid given383.
In the depth interviews, charities point to the need for inflationary rises in grants, and to align with other statutory income benefits that beneficiaries might be receiving.
We’ve reviewed the levels of assessment, we have increased those...They hadn’t been reviewed for a good many years… it had never changed in the ten-year period, which was leaving the threshold very low, and I don’t think anybody would have met the threshold when you look at what income support levels are
[MN/FF, £100K-£500K]
379 Mackay and Wright (2008)380 Belai, J., Association of Charitable Organisations (ACO), (2013) 381 ElizabethFinnCare(2012)382 Onlinesurvey,(allMaritimecharitiesprovidingfinancialassistance,n=25)383 Onlinesurvey,(allMaritimecharitiesprovidingfinancialassistanceandanticipatingachangeinbeneficiarydemandresponding,n=19)
For many, the safety net is not working. Between 2014 and 2015, approximately 950,000 households were in ‘income crisis’. This means that they were unable to pay two or more essential bills –mortgage or rent, energy bills, water rates or council tax – at any one time.
Income crisis is associated with those who are economically precarious, yet it should not be thought of as a problem that only effects those on benefits or with the lowest incomes. The majority of households in income crisis have at least one adult in work. Many own their own homes and more than half contain children.
IPPR, ‘The ‘not quite managings’: the depth of income crisis in the UK’, April 2017

Navigating Change: A Review of the UK Maritime Welfare Charity Sector | 2017 146
7.3 ASSESSING NEEDS: FINANCIAL AND BEYOND
The online survey results suggest a lack of consistency in beneficiary needs assessment: whilst just over a quarter feel unable to comment, 37% disagree that ‘maritime charities employ a common/standard set of tools for needs assessment’.
FIGURE 7.3
How strongly do you agree or disagree that ‘maritime charities employ a common/standard set of tools for needs assessment’?384
The 2007 report pointed to the ‘Matching Needs and Services (MNS)’ audit which suggested that ‘if maritime charities used comprehensive assessment of needs, rather than just concentrating solely on financial needs…they would make a much more positive impact’385.
For many maritime welfare charities, case-working is one way to ensure that beneficiaries are receiving all monies due and, in some cases, to also extend the focus beyond the purely financial. Of those frontline maritime charities surveyed online, seven in ten (73%) use some form of case-working in order to tackle welfare issues, rising to 83% amongst those that provide financial assistance386.
FIGURE 7.4
Do you use case-workers as part of the way you tackle welfare issue?
384 Online survey, (all Maritime charities responding, n=43)385 Maritime Charities Funding Group (2007)386 Onlinesurvey,(allMaritimecharitiesprovidingsupportdirecttoendbeneficiaries,n=33)
% Disagree
(1-4)
% Agree (7-10)
37% 9%
7.1
7.2
7.3
7.4
20%
8%
36%
40%
48%
48%
52%
64%
84%
Other types of financial support
Loans to individuals
Household goods provided to individuals via suppliers
Educational / school grants
Funeral grants
Regular financial payments to individuals
Purchase of specialist equipment / mobility aids
Emergency grants
One-off / ad hoc payments to individuals
8% 14% 20% 27% 22% 8% Monetary grants given directly to
the individual are the most effective benevolence channel
Don't know 1-2 (Completely Disagree) 3-4 5-6 7-8 9-10 (Completely Agree)
28% 7% 30% 26% 9% Maritime charities employ a
common/standard set of tools for needs assessment
Don't know 1-2 (Completely Disagree) 3-4 5-6 7-8 9-10 (Completely Agree)
7.5
12%
15%
36%
9%
27%
Yes, own caseworkers
Yes, another organisation's caseworkers
Yes, both own & another organisation's
Yes, another arrangement
Don't use caseworkers Which organisation’s case-workers do you use? All using third-party case-workers (n=17)
SSAFA Royal Brit ish Legion The Mission to Seafarers The Fishermen’s Mission RNRM Welfare Apostleship of the Sea Sailors’ Society Officers’ Association Royal Commonwealth
Ex-Services League
Plus single mentions for a further ten organisations
Highest mention

Navigating Change: A Review of the UK Maritime Welfare Charity Sector | 2017 147
As with the Armed Forces charity sector387, case-workers from the tri-Service charities SSAFA and The Royal British Legion are key parts of the benevolent landscape. In most instances, the case-worker will identify the needs of the individual and then help beneficiaries to access the right support for them, almonising monetary and other forms of support from a number of different sources, if necessary, to meet the diverse needs of each individual.
Of those maritime charities conducting case-working as part of their welfare support process, almost half (48%) use the central Case-work Management System [CMS], and a further fifth don’t use the system, but are aware of it. Those organisations that have RNRM beneficiaries are more likely to use CMS (63%) compared to those serving MN and FF (31% and 33% respectively)388.
Despite the high penetration of case-working across the maritime welfare sector, the in-depth interviews point to a lack of consistency in the type of case-working adopted, in both its form and focus. For some charities, ‘case-working’ is primarily a financial assessment, reviewing incomings and outgoings, conducted largely to establish whether to confer a financial grant or not.
Other maritime welfare charities have adopted a more wide-ranging or ‘holistic’ case-working approach (as proposed by the 2007 MNS audit), which seeks to understand an individual’s health and well-being as well as financial circumstances, to attempt to identify and address the root cause of issues.
You go because they’ve got this particular problem that they’ve mentioned on the phone, but when you get there, you actually discover that there’s not just that problem, they really need some home care, or their eyesight is poor and they haven’t seen an optician for the last eight years – and you start to sort out these things – they haven’t got a disabled parking badge, even though they’re eligible for one, because they don’t know how to approach the council and get the form filled in and so on and so forth
[MN, £1M-£5M]
However, only a fifth (19%) of the maritime charities surveyed agree that the sector currently ‘employs a holistic approach to understand the needs of seafarers and their dependants’, whilst a third disagree that this is the case.
FIGURE 7.5
How strongly do you agree or disagree that ‘maritime charities employ a holistic approach to understand the needs of seafarers and their dependants’?389
Some maritime welfare charities report an increasing complexity in beneficiary need, which may result in holistic case-working - reviewing all of an individual’s issues in the round – becoming even more of a necessity moving forward.
387 See Pozo and Walker (2014) for more details 388 Onlinesurvey,(allMaritimecharitiesusingcase-working,n=25).Maritimecharitiesmayservemorethanonebeneficiarygroup,andsotheirresponseswillappearineach
of the segments served (all Maritime charities conducting case-working, RNRM=16, MN=16, FF=12)389 Online survey, (all Maritime charities responding, n=43)
% Disagree
(1-4)
% Agree (7-10)
33% 19%
7.6
7.7
12% 9% 23% 37% 16% 2% Maritime charities employ a holistic approach to understand the needs
of seafarers & their dependants
Don't know 1-2 (Completely Disagree) 3-4 5-6 7-8 9-10 (Completely Agree)
33%
36%
9%
9%
12%
21%
27%
No other eligibility criteria apply
Other eligibility criteria apply
Maximum age limit
Already receiving government …
Minimum age limit
Minimum time spent at sea
Other financial means-testing
2% 9% 12% 45% 26% 7% Maritime charities should focus
their efforts on preventative rather than palliative work
Don't know 1-2 (Completely Disagree) 3-4 5-6 7-8 9-10 (Completely Agree)
Which organisation’s case-workers do you use? All using third-party case-workers (n=17)
SSAFA Royal Brit ish Legion The Mission to Seafarers The Fishermen’s Mission RNRM Welfare Apostleship of the Sea Sailors’ Society Officers’ Association Royal Commonwealth Ex-Services
League Plus single mentions for a further ten organisations
Highest mention

Navigating Change: A Review of the UK Maritime Welfare Charity Sector | 2017 148
Sometimes the actual needs don’t change that much, but we’re certainly dealing with more complex cases. When people needed assistance, often it just used to be one thing, now because of debt issues and so on, it can become a much more complex set of issues that we’re tackling
[RNRM, Over £5M]
The 2007 ‘Supporting Seafarers and their families’ report made a recommendation to ‘develop a greater role for SBAL’, which is now the Seafarers Advice and Information Line (SAIL). This has come to fruition, with SAIL now a central focus for the support of seafarers, the recent extension to cover Royal Navy and Royal Marines beneficiaries making it a sector-wide service.
The development of SAIL, along with other case-worker initiatives, ensures that seafarers are now being assisted in securing statutory entitlements, rather than defaulting to charity ‘hand-outs’. Indeed, some see providing such assistance as a much more effective way to spend funds and fulfil their charitable objects, than giving money directly to beneficiaries. In 2016, professional caseworkers employed by Nautilus Welfare Fund generated £610,000 of entitled income for its beneficiaries, against a cost of £75,000 to employ them – a rate of return of £8 for every £1 spent390. In terms of statutory benefits which individuals are entitled to, the Department for Work and Pensions estimates that across the benefits of pension credit, housing benefit, jobseeker’s allowance, income support and employment and support allowance, approximately £13bn goes unclaimed each year, with take-up levels as low as 50% for jobseeker’s allowance, 62% for pension credit and 79% for housing benefit391. Ensuring that seafaring beneficiaries are accessing all monies that they are entitled to could potentially release charitable funds for other purposes.
In addition to SAIL, improved sector networks such as the MCG, MNWB working groups, Port Welfare Committees, and Cobseo working groups, have resulted in more collaboration and sign-posting which can help in providing beneficiaries with a more rounded solution. It remains, however, an area which could improve still further (see Section 3.8).
7.3.1 BENEFICIARY ELIGIBILITY CRITERIA
Of those maritime welfare charities surveyed that provide services directly to end beneficiaries, two-thirds have additional eligibility criteria – other than being a seafarer, spouse/partner or dependant - which their beneficiaries must meet in order to receive welfare support.
390 As provided by Mick Howarth, Welfare Services Manager, Nautilus International391 https://www.gov.uk/government/statistics/income-related-benefits-estimates-of-take-up-financial-year-201415
The welfare officer from the Fishermen’s Mission got in touch with somebody from SAIL and this adviser – she was very, very helpful – got in touch with the tax people for me... The person from SAIL said this is what we’re here for; that we weren’t to worry about it. And then I was getting letters saying they were going to send bailiffs to my house and I got back in touch with SAIL about the bills and the bailiffs letters and she told them not to put pressure on me…I was panicking.
Carer, Fishing Fleet Crew (ORS, 2016)
She used to get the low-rate disability, and he (Social Services) said you shouldn’t be getting that, you should be getting high. She went through the medical things and within three weeks she had it. She should have had it years ago. No back payment – doesn’t work like that!
Royal Navy Rating caring for his wife (ORS, 2016)

Navigating Change: A Review of the UK Maritime Welfare Charity Sector | 2017 149
FIGURE 7.6
Other than being a seafarer, a dependant or spouse, do your end beneficiaries need to meet any other eligibility criteria to receive welfare support?392
In many cases, eligibility criteria help to describe a charity’s parameters, for example, those charities supporting dependent children often use an upper age or schooling limit to define a ‘child’.
However, one area which impacts the Merchant Navy and Fishing Fleets, and clearly lacks consistency, is the ‘time at sea’ a seafaring beneficiary is required to serve prior to being eligible for welfare support. Whilst the Naval Service defines ‘veterans’ as those that have served at least one day whether as a Regular or a Reservist and so they may also be considered potential beneficiaries for many RNRM charities, maritime welfare charities supporting MN and FF have no consistent ‘time served’, with examples from those interviewed ranging from no minimum service requirement to 20 years.
The Merchant Navy have a very complicated structure of who they’ll give support to, whereas the Royal Naval structure has always been ‘one day’s pay, a lifetime of support’, whereas I think in the Merchant Navy you have to have done five years or something…I know it’s far more complicated than ours
[RNRM, £100K-£500K]
Even amongst those working within the sector, inconsistency in eligibility criteria can cause confusion and sign-posting challenges and so it is reasonable to infer that beneficiaries may also find this eligibility landscape confusing.
Shipwrecked Mariners…have a policy, not a strict policy, of 8 years sea service - if the sea service is less and it’s because of medical discharge, that’s okay, that’ll be taken into account – but if someone has done 4 years only, I know Shipwrecked would not sponsor and support that application…The other one is, what is meant by ‘a spouse’…There are different organisations who will support different elements of funding, they’ve different criteria – and I didn’t fully understand their criteria
[MN, £100K-£500K]
It is likely that those charities with lengthy ‘sea service’ eligibility may need to relax this criteria in the future, not only due to the reducing beneficiary population, but also because seafaring careers tend to be more disrupted now than historically and sea-time can be difficult to assess.
392 Onlinesurvey,(allMaritimecharitiesprovidingsupportdirecttoendbeneficiaries,n=33)
7.6
7.7
12% 9% 23% 37% 16% 2% Maritime charities employ a holistic approach to understand the needs
of seafarers & their dependants
Don't know 1-2 (Completely Disagree) 3-4 5-6 7-8 9-10 (Completely Agree)
33%
36%
9%
9%
12%
21%
27%
No other eligibility criteria apply
Other eligibility criteria apply
Maximum age limit
Already receiving government …
Minimum age limit
Minimum time spent at sea
Other financial means-testing
2% 9% 12% 45% 26% 7% Maritime charities should focus
their efforts on preventative rather than palliative work
Don't know 1-2 (Completely Disagree) 3-4 5-6 7-8 9-10 (Completely Agree)
Which organisation’s case-workers do you use? All using third-party case-workers (n=17)
SSAFA Royal Brit ish Legion The Mission to Seafarers The Fishermen’s Mission RNRM Welfare Apostleship of the Sea Sailors’ Society Officers’ Association Royal Commonwealth Ex-Services
League Plus single mentions for a further ten organisations
Highest mention
• RNRM• In financial
distress• Nominated by
case-worker• Based in the UK
Already receiving government financial support

Navigating Change: A Review of the UK Maritime Welfare Charity Sector | 2017 150
It’s often difficult to tell between somebody who is a part-time taxi driver, who is a fisherman by trade, but he actually has to earn a crust…So, it can be quite tricky. I have come across another charity where one person in the charity said it’s a fisherman and another person said, no it’s not it’s a taxi-driver
[MN, £100K-£500K]
Indeed, the MNWB’s ‘Older seafarers and families working group’ identified how the increase in UK seafarers working on foreign flagged ships, all of which have different service recording processes, means that ‘it would become increasingly difficult for charities to prove service within the merchant shipping and fishing industries in the absence of written evidence’393.
Given this, sector-wide guidelines on time at sea and other beneficiary eligibility criteria might prove beneficial to reduce confusion and aid more effective sign-posting and collaboration. Although any such discussions should consider how sea-service balances against a beneficiary’s life ashore, where subsequent careers may also secure the help of specialist charities and targeted benevolence.
We tend to operate at a level of substantial sea-service of 20-years, that’s partly a way for us to manage the level of demand…so that we are genuinely supporting those individuals who have had a ‘career’ at sea, as opposed to ‘I worked at sea for 3 years, but I’ve been a lorry driver for the rest of my life’. So, all of the charities have got different criteria, and there’s never been any holistic attempt…to sit down and say ‘well, actually, what should we be doing’
[MN, £1M-£5M]
The MNWB’s ‘Older seafarers and families working group’ have already recommended that, following time at sea, all service in maritime related industry should be included when calculating eligibility and that all ex-seafarers, regardless of service length, should at least have access to signposting to appropriate sources of help394.
393 MNWB (2017a)394 Ibid

Navigating Change: A Review of the UK Maritime Welfare Charity Sector | 2017 151
7.4 PREVENTATIVE VS. PALLIATIVE SUPPORT
The 2007 report395 identified preventative healthcare measures as a priority area of need, and with a continually ageing population this is becoming even more urgent across many areas396. The current Government’s Five Year Forward View397 for the NHS calls for more integrated services and preventative spending, arguing that “the future health of millions of children, the sustainability of the NHS, and the economic prosperity of Britain all now depend on a radical upgrade in prevention and public health.” The report offers the hindsight that they were warned twelve years ago that “unless the country took prevention seriously we would be faced with a sharply rising burden of avoidable illness. That warning has not been heeded - and the NHS is on the hook for the consequences.” In this light, maritime welfare charities could make a valuable contribution to the future circumstances of seafarers through the implementation of preventative measures now.
A third of the maritime charities surveyed believe that ‘maritime charities should focus their efforts on preventative rather than palliative work’, whilst a fifth disagree with this approach.
FIGURE 7.7
How strongly do you agree or disagree that ‘maritime charities should focus their efforts on preventative rather than palliative work’?398
More telling perhaps is that almost half (45%) neither agree nor disagree, with the depth interviews confirming that it is not an ‘either/or’ situation, rather a ‘fifty-fifty’, with both approaches required in order to meet the complex needs of the seafaring community.
You need to meet the need as it’s presented and it’s no use saying ‘well, you just hang on in there chum and I’m going to sort out the root cause of this’ – it’s a 50:50 solution, that you need to help people when they’re desperate and we should be working towards addressing the cause of that desperation
[RNRM, Over £5M]
Preventative is brilliant, but you can never stop people requiring benevolence at some stage…You should invest as far upstream as you can, in terms of, as you say, preventative measures, but to say we should focus all our efforts on preventative would be a pipe dream
[RNRM, £100K-£500K]
395 Maritime Charities Funding Group (2007)396 e.g. ageing in general - Beth Johnson Foundation (2016); dementia – Parkin and Baker (2016), and dementia care in housing – Moore B., Pritchard-Wilkes V., Miles S.,
Sweeney R., Alzheimer’s Society (2017)397 NHS (2014)398 Online survey and tele-depth interviews (all Maritime charities responding, n=58)
% Disagree
(1-4)
% Agree (7-10)
21% 33%
7.6
7.7
12% 9% 23% 37% 16% 2% Maritime charities employ a holistic approach to understand the needs
of seafarers & their dependants
Don't know 1-2 (Completely Disagree) 3-4 5-6 7-8 9-10 (Completely Agree)
33%
36%
9%
9%
12%
21%
27%
No other eligibility criteria apply
Other eligibility criteria apply
Maximum age limit
Already receiving government …
Minimum age limit
Minimum time spent at sea
Other financial means-testing
2% 9% 12% 45% 26% 7% Maritime charities should focus
their efforts on preventative rather than palliative work
Don't know 1-2 (Completely Disagree) 3-4 5-6 7-8 9-10 (Completely Agree)
Which organisation’s case-workers do you use? All using third-party case-workers (n=17)
SSAFA Royal Brit ish Legion The Mission to Seafarers The Fishermen’s Mission RNRM Welfare Apostleship of the Sea Sailors’ Society Officers’ Association Royal Commonwealth Ex-Services
League Plus single mentions for a further ten organisations
Highest mention

Navigating Change: A Review of the UK Maritime Welfare Charity Sector | 2017 152
A number of respondents highlight how the nature of the work and the dangers experienced, result in situations that can only be addressed through immediate, palliative assistance.
We can’t stop Afghanistan happening…The other side we see – Dad gives up the sea to look after Mum and the family because Mum’s developed breast cancer – again, we can’t prevent that…The traumatic events that we’re dealing with, are significant and life-changing and we can’t prevent those
[RNRM/MN/FF, £500K-£1M]
However, there is a general belief that perhaps more could be done to try and reduce the extent of any problems developing in the future. There are many examples of ‘preventative’ work already underway across the maritime welfare charity sector, such as organisations:
• working with Relate to try and head-off marital problems and the break-down of the family unit
• promoting safety at sea amongst fishermen and providing life-saving equipment to reduce accidents / deaths at sea
• running health campaigns to reduce the proportion of seafarers that are ill and/or infirm in later life
• conducting education programmes on what seafarers can expect when they come ashore
Indications are that other maritime welfare charities are looking to develop services to address potential problems ‘upstream’ and so stem the need for future benevolence, with such preventative initiatives perceived to hold some favour with key sector funders.
Although not necessarily seen as their own charity’s responsibility, there is a sense that the sector as a whole should do more to lobby on behalf of seafarers, particularly regarding health and safety and working conditions, and to encourage seafarers to make better plans for retirement/coming ashore.
I feel in terms of areas of development, advocacy and policy work on behalf of merchant seafarers is an area where all of us in the Merchant Navy charity sector need to improve
[MN/FF, £1M-£5M]

Navigating Change: A Review of the UK Maritime Welfare Charity Sector | 2017 153
7.5 CONCLUSIONSDirect financial assistance is highly likely to continue to be a requirement for the maritime sector, particularly in ‘emergency’ situations, and maritime welfare charities need to make provision for this. It is important, however, that regular grants are not given simply as a matter of course. Ongoing assessment of the individual needs of each beneficiary, taking into account the ever-changing landscape of statutory support, is essential. It is important to ensure that beneficiaries are receiving all of the statutory benefits that they are entitled to before pulling on the charitable purse strings. Given the proven return on investment of using professional case-workers, increased use of this approach might be encouraged across the sector.
In line with any roll-out, best practice guidelines for case-working and needs assessment, plus increased awareness and use of the Case-work Management System, is likely to ensure a consistent approach is adopted across the sector, facilitating better sign-posting and collaboration.
Similarly, sector-wide guidelines on eligibility criteria, particularly ‘time at sea’ for MN/FF, but also definitions for ‘seafarer’, ‘spouse’, ‘dependent child’, etc. would help to reduce sign-posting confusion. Whilst appreciating that a single eligibility standard across the sector may not be possible, it appears that more needs to be done to clarify and communicate, potentially through better use and promotion of Seafarer Support/Maritime Charities Welfare Guide399.
It would seem advisable (for best outcomes in future) for maritime welfare charities to continue to seek opportunities for preventative or ‘upstream’ solutions to ensure that fewer seafarers reach crisis point, with lobbying of government, industry bodies and ship owners a vital component to this.
399 ‘Seafarer Support’ is an interactive website/telephone service managed by MNWB and funded by members of the MCG which lists all maritime charities, contact details and the support provided, based on the Maritime Charities Welfare Guide

Navigating Change: A Review of the UK Maritime Welfare Charity Sector | 2017 154

Navigating Change: A Review of the UK Maritime Welfare Charity Sector | 2017 155
EIG
HT
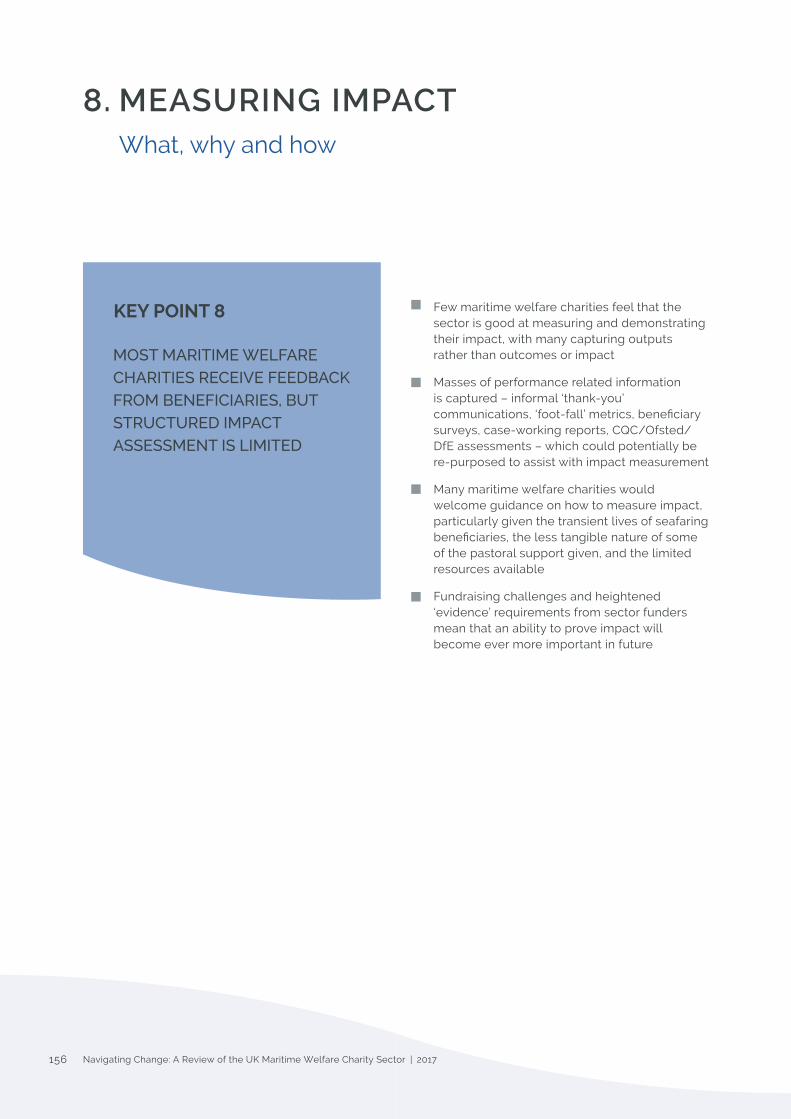
Navigating Change: A Review of the UK Maritime Welfare Charity Sector | 2017 156
8. MEASURING IMPACT What, why and how
MOST MARITIME WELFARE CHARITIES RECEIVE FEEDBACK FROM BENEFICIARIES, BUT STRUCTURED IMPACT ASSESSMENT IS LIMITED
KEY POINT 8 Few maritime welfare charities feel that the sector is good at measuring and demonstrating their impact, with many capturing outputs rather than outcomes or impact
Masses of performance related information is captured – informal ‘thank-you’ communications, ‘foot-fall’ metrics, beneficiary surveys, case-working reports, CQC/Ofsted/DfE assessments – which could potentially be re-purposed to assist with impact measurement
Many maritime welfare charities would welcome guidance on how to measure impact, particularly given the transient lives of seafaring beneficiaries, the less tangible nature of some of the pastoral support given, and the limited resources available
Fundraising challenges and heightened ‘evidence’ requirements from sector funders mean that an ability to prove impact will become ever more important in future

Navigating Change: A Review of the UK Maritime Welfare Charity Sector | 2017 157
Maritime welfare charities would do well to embrace impact measurement more fully. It can lead to increased operational efficiency, provide a more informed understanding of beneficiary need, and help to raise the profile of a charity or cause through the telling of engaging success stories – all outcomes that the maritime welfare charity sector would benefit from

Navigating Change: A Review of the UK Maritime Welfare Charity Sector | 2017 158
8.1 WHAT IS BEING MEASURED
At an overall sector level, maritime welfare charities surveyed tend not to agree that they are ‘good at measuring and demonstrating impact’: only a quarter actively agree by rating 7 or more out of 10400.
FIGURE 8.1
How strongly do you agree or disagree that ‘maritime charities are good at measuring and demonstrating their impact’?
The charities know they do a jolly good job, but I don’t think they measure it very clearly…Everybody knows they do good work, but proving it is sometimes different
[RNRM, Under £100K]
Despite this, nine in ten of those maritime welfare charities surveyed have tools or processes in place by which they broadly aim to assess the impact of the support and services provided to their seafaring beneficiaries (see Figure 8.2). All tri-Service charities responding have tools or processes in place401. The question does, however, allow for a relatively broad interpretation of impact assessment.
The most common channel is general feedback, often in the form of thank-you letters and emails. In some cases, this feedback may well provide insights into the changed circumstances of beneficiaries, although not in a structured or consistent format.
Almost two-thirds (63%) of maritime charities responding capture statistics on the number of individuals helped, 30% analyse data from grant application forms and 26% analyse the cost per grant given. These are essentially measures of ‘output’ rather than impact.
Half (50%) of organisations compile case studies to illustrate their impact, two-fifths (39%) undertake surveys with beneficiaries, around a quarter conduct in-depth interviews/home visits (26%) and/or track changes in beneficiary circumstances over time (24%). Such approaches, if implemented appropriately, are more likely to provide impact insights.
400 Online survey and tele-depth interviews, (all Maritime charities responding, n=59)401 Online survey, (all Maritime charities responding, n=46 / all tri-Service charities responding, n=20)
32% 25%
8.1
8.2
8.3
12% 5% 27% 31% 24% Maritime charities are good
at measuring and demonstrating their impact
Don't know 1-2 (Completely Disagree) 3-4 5-6 7-8 9-10 (Completely Agree)
13%
15%
15%
24%
26%
26%
30%
39%
50%
63%
74%
0% 10% 20% 30% 40% 50% 60% 70% 80%
We do not measure impact
Other form of assessment
Independent evaluation by third party
Tracking changes (in beneficiary well-being or circumstances) over time
Analysis of cost per grant given
In-depth interviews / home visits
Analysis of data from grant application forms
Beneficiary surveys
Case studies
Statistics showing no. of individuals helped
Feedback / thank you letter or email
13% 13% 20% 20% 35%
Don't measure impact Don't know whether we will produce a report or not No, and no intention to introduce Not currently, but intend to introduce Yes, currently produce impact assessment report
% Disagree
(1-4)
% Agree (7-10)
Impact can be thought of as the long-term results that your work has for your beneficiaries. Impact is too often confused with ‘outputs’. Most charities will be able to say how many people they help. They will probably be able to say how often or for what duration of time services are delivered, and what these services cost. This is not measuring impact. These are your outputs.
Kingston Smith, ‘Impact Measurement Toolkit for the Charity Sector’, 2013
We send out an annual, short questionnaire to ask for change in circumstances…and very often you’ll just get a little note in, thanking us for the payments
[MN, £100K-£500K]

Navigating Change: A Review of the UK Maritime Welfare Charity Sector | 2017 159
FIGURE 8.2
Tools and processes currently used to assess the impact of support / services on seafaring beneficiaries / recipients402
The depth interviews support the case that some structured impact measurement is being conducted across the maritime charity sector, particularly (although not exclusively) by those organisations that have more regular contact or an ongoing relationship with their beneficiaries, such as accommodation providers or those making regular financial grants to individuals.
As indicated by the online survey, a fair proportion of maritime welfare charities undertake surveys amongst their beneficiaries. Some focus purely on ‘satisfaction’ with the support received, others gauge the extent of any change experienced over-time in terms of circumstances and/or well-being, thereby attempting to produce a longitudinal view of each beneficiary’s individual experience or ‘journey’.
When the applications are being made, we will ask the sponsor, having visited the beneficiary, to provide us with the answer to ten questions where we’re looking to understand the wealth, the social standing, what they have, and their happiness, so that we can then see and determine what level of difference this payment would make…Their files are reviewed each year… what they are doing, and then an update on the impact report
[MN/FF, £100K-£500K]
402 Online survey, (all Maritime charities responding, n=46)
8.1
8.2
8.3
12% 5% 27% 31% 24% Maritime charities are good
at measuring and demonstrating their impact
Don't know 1-2 (Completely Disagree) 3-4 5-6 7-8 9-10 (Completely Agree)
13%
15%
15%
24%
26%
26%
30%
39%
50%
63%
74%
0% 10% 20% 30% 40% 50% 60% 70% 80%
We do not measure impact
Other form of assessment
Independent evaluation by third party
Tracking changes (in beneficiary well-being or circumstances) over time
Analysis of cost per grant given
In-depth interviews / home visits
Analysis of data from grant application forms
Beneficiary surveys
Case studies
Statistics showing no. of individuals helped
Feedback / thank you letter or email
13% 13% 20% 20% 35%
Don't measure impact Don't know whether we will produce a report or not No, and no intention to introduce Not currently, but intend to introduce Yes, currently produce impact assessment report
We do client surveys and publish the results on how people are feeling in terms of their emotional well-being, and indeed, their physical well-being, having spoken to us
[RNRM/MN/FF, £500K-£1M]
On the health and well-being programmes, we monitor how people were when they started with that particular project and where they are today, so you can see the benefits from that – we measure it
[RNRM/MN/FF, £500K-£1M]
Just through making grants, grant-makers are generating a dataset. You can ignore this data, or you can pick it up and say, “what can I do with this?”
Lucy Bernholtz, Stanford Center on Philanthropy and Civil Society (NPC (2016)

Navigating Change: A Review of the UK Maritime Welfare Charity Sector | 2017 160
We have defined not just the immediate benefit, but we’ve actually codified our long-term benefits for seafarers…It’s more difficult to get that information, but we’re currently engaged in research to mine data that already exists or indeed, conduct things like longitudinal surveys ourselves, so that we…also get the long-term benefits as well
[RNRM/MN/FF, Over £5M}
However, such approaches are by no means universal across the maritime welfare charity sector.
In 2012, a study by New Philanthropy Capital recorded a quarter of third sector charities not measuring impact, with the key reasons given for not doing so being a lack of resources and that it just wasn’t a priority403. Amongst the six maritime charities surveyed that are not currently capturing feedback, it appears that perceived obstacles, rather than indifference, are largely accountable:
• Lack of resource / small team 2 mentions
• Beneficiaries want anonymity single mention
• Difficult to measure due to the nature of the service provided single mention
• Unsure what tools or models to use single mention
• Believe that the charity’s money / time is better spent elsewhere single mention
The depth interviews expand upon these difficulties further, particularly in respect of how to measure the impact of less tangible elements, such as pastoral or spiritual support:
The nature of our work does make it quite difficult to demonstrate impact. When you’re meeting a seafarer on a one-off basis, your encounter with them may mean a lot to them, the conversation might be important, but you may never see that person again. We are desperately keen to find better ways of representing our work, and demonstrating impact…We’re conscious that we are not doing as well as we ought to be doing, and I’m sure others are the same, but finding a way forward is not always easy
[MN/FF, £1M-£5M]
The other area that mitigates against impact reporting is that a lot of our support is around psychological well-being, spiritual well-being, and it’s not as easy to measure. One of the things we need to give serious thought to is how can we better measure impact in those softer areas?
[MN/FF, £1M-£5M]
We haven’t worked out a decent way to measure [impact] across the piece, because some clients have an hour with us and…some clients can spend many days…We try to measure, if you like, time against an individual…It’s quite a challenge for a small charity and we’re not dealing with benevolence, so not dealing with something that’s automatically got a value or a figure against it, it’s always been a challenge and will continue to be so, because effectively all we’ve got to measure is how much we cost
[RNRM, £100K-£500K]
It may be particularly difficult for small charities which are more likely to lack the resources and skills to measure impact, 48% of which, in the wider charity sector, felt that this is the case404.
Over half (55%) of maritime welfare charities completing our online survey already produce a formal impact assessment report or intend to introduce one (see Figure 8.3)405. Three-quarters of third sector charity CEOs questioned in a Charities Aid Foundation (CAF)/ACEVO study have already or intend to introduce formal impact measurement406.
403 Ni Ogain, Lumley and Pritchard, New Philanthropy Capital (2012)404 The Foundation for Social Improvement (2017a)405 Online survey, (all Maritime charities responding, n=46)406 CharitiesAidFoundation/ACEVO(2017)

Navigating Change: A Review of the UK Maritime Welfare Charity Sector | 2017 161
FIGURE 8.3Whether organisation produces a formal impact assessment report
The CAF/ACEVO study also showed an increase in the proportion of third sector Chief Executives believing that ‘measuring and demonstrating impact’ is one of the top three challenges facing their organisation, rising from 10% in 2015 to 17% in 2016, whilst research from New Philanthropy Capital showed that between 2008 – 2012 nearly three-quarters (74%) of third sector charities increased the effort they put into measuring impact.407
Indeed, in our online survey, a third of maritime welfare charities identify ‘measuring and demonstrating impact’ as one of the most pressing challenges faced by their organisation – ranking as fifth out of the fifteen challenges presented, topped only by awareness raising, generating income, finding beneficiaries and securing new Trustees/Chairman (see Section 10)408.
407 Ni Ogain, Lumley and Pritchard, New Philanthropy Capital (2012)408 Online survey, (all Maritime charities responding, n=46)
8.1
8.2
8.3
12% 5% 27% 31% 24% Maritime charities are good
at measuring and demonstrating their impact
Don't know 1-2 (Completely Disagree) 3-4 5-6 7-8 9-10 (Completely Agree)
13%
15%
15%
24%
26%
26%
30%
39%
50%
63%
74%
0% 10% 20% 30% 40% 50% 60% 70% 80%
We do not measure impact
Other form of assessment
Independent evaluation by third party
Tracking changes (in beneficiary well-being or circumstances) over time
Analysis of cost per grant given
In-depth interviews / home visits
Analysis of data from grant application forms
Beneficiary surveys
Case studies
Statistics showing no. of individuals helped
Feedback / thank you letter or email
13% 13% 20% 20% 35%
Don't measure impact Don't know whether we will produce a report or not No, and no intention to introduce Not currently, but intend to introduce Yes, currently produce impact assessment report

Navigating Change: A Review of the UK Maritime Welfare Charity Sector | 2017 162
8.2 WHY MEASURE IMPACT?
In the NPC ‘Making an Impact’ study, the main reason given as to why third sector charities had increased their impact measurement efforts was a change in the requirement from funders409. Speaking with maritime charities confirms this view, with many highlighting an increased demand for ‘evidence’ from the main grant-makers in the sector both at the grant application stage, and in any project completion or outcome reporting.
Indeed, two-fifths (42%) of the block grant-makers completing the online survey confirm that their impact reporting requirements for recipient organisations have ‘increased or intensified’ in the last 5 years410. This can create difficulties for charities if they are required to be primarily accountable to the funders for their impact measures if different funders require different metrics.
The majority of charities interviewed understand why funders require such information - to fulfil governance requirements, report to the Charity Commission, support fundraising and, perhaps most importantly, to ensure that money is being spent wisely.
The funding charities…have a particular responsibility to carefully evaluate whether the organisations that are approaching them for funding are actually governed appropriately and are equipped to meet the needs of today’s fleet, not just simply that they happen to be run by people that we perceive to be ‘good guys’
[MN/FF, £1M-£5M]
I don’t think anyone should receive money without being able to justify why they’re doing it and then demonstrating it’s making an impact. Sometimes things are ongoing and funding doesn’t make instant changes...but as long as you can see that there’s progress being made, and the money’s been well spent
[RNRM/MN/FF, £100K-£500K]
A few believe that more needs to be done to explain why impact assessment is needed, and what it is used for.
Okay, you fill in this form and send it off, but you never hear anything further – what’s its purpose? Is it just something we think we should do – tick box in the Charity Commission, ‘yes, we do evaluate our efforts’. It would be good to have some outcomes, so if…all of the feedback is collated and then we have some update
[MN/FF, £100K-£500K]
While I do understand and I’m perfectly happy to provide testimonials and as much data as is asked for, I just wonder sometimes whether it’s data for the sake of data, but because I’m not in a block grant-making charity, I can’t really answer that – all I do is give them the data which they require, which seems to be increasing year-on-year
[RNRM, Over £5M]
409 Ni Ogain, Lumley and Pritchard, New Philanthropy Capital (2012)410 Online survey, (all Maritime charity funders responding, n=12)
Funders are increasingly looking for [impact evidence], particularly if big sums of money are being put in, understandably the funders want to see change
[MN/FF, £100K-£500K]

Navigating Change: A Review of the UK Maritime Welfare Charity Sector | 2017 163
Other maritime charities perceive some inconsistency in requests for evidence dependent on the individual funder and/or their existing knowledge of the recipient charity. Although there is a belief that the proposed universal grant application form may help to resolve this.
However, it would be wrong to suggest that impact measurement is only undertaken to support funding applications. In the first instance, not all maritime welfare charities receive grants, and so for these organisations the increasing need for evidence by funders does not drive a need for impact measurement. Rather these, and many other maritime charities, are striving to improve the services that they offer, with impact measurement helping to inform this.
We send out a feedback survey to all those that have completed a cycle of work with us…We ask them to comment on the service that they receive, and at the end of it we offer them a free-text piece which asks for any other offers…that you might want…We want to know…did we satisfy their initial query, was it done in a timely manner and then…was there anything else that you felt we could have helped with
[RNRM, £100K-£500K]
In their ‘Impact Measurement Toolkit’, accountancy firm and business advisers Kingston Smith state that one of the benefits of good impact measurement is that “effective communication of improvements and achievements can help the organisation raise its profile, which can in turn help create a point of difference from other organisations and attract funding in a heavily competitive and saturated marketplace”411.
An issue raised repeatedly by those maritime charities interviewed is that of ‘sea-blindness’, whereby the general public is perceived not to appreciate the contribution made by the seafaring community and the hardships that they can experience (see Section 9).
To combat this, some point to the need for impact evidence to move away from just statistical ‘foot-fall’ metrics, and focus on ‘stories’ by which to engage more with the general public.
Being better at telling the story – communicating with donors, with the maritime sector, what we do, and not just reeling off numbers in terms of…various activities that we might have engaged with, but actually sharing stories of how we’ve helped individuals or groups of seafarers. It’s really important to tell the stories, as that’s what brings this wonderful work to life – I think we need to be better at telling a story
[MN/FF, £1M-£5M]
411 Kingston Smith (2013)
Nearly 80% of all charities believe that measuring impact makes an organisation more efficient
‘Making an Impact’, NPC, 2012

Navigating Change: A Review of the UK Maritime Welfare Charity Sector | 2017 164
8.3 HOW TO MEASURE IMPACT
It is clear that many charities, not just within the maritime welfare sector, struggle with how to measure impact and what they are measuring. In 2012, NPC’s ‘Making an Impact’ study showed that whilst the vast majority of third sector charities measure outputs (84%), far fewer measure outcomes (59%)412.
Similarly, maritime welfare charities appear to capture significant amounts of information about their performance, whether operational metrics or feedback from the beneficiaries themselves. The trick is to make this information outcome - rather than output - focused.
Despite one in seven (15%) of the maritime welfare charities surveyed using ‘independent evaluation by a third-party organisation’413, few in the depth interviews mention specific measurement or evaluation practices, such as Triangle Consulting’s Outcomes Star414 a version of which was piloted by the Officers’ Association and subsequently adopted by both The Royal British Legion and Help for Heroes. A couple of maritime charity respondents do voice interest in such evaluation systems moving forward, and it may be that trials by tri-Service charities could help inform best practice for the maritime sector.
Use of the ‘independence star’ as a way of trying to measure where people were when we first encountered them, and then potentially at the end of our intervention with them, what that’s achieved in terms of looking at things like health, finance, housing, social activities and so on – that’s something that I think we’re going to embrace as a main tool to try and describe our impact in a more empirical way
[MN, £1M-£5M]
Given this, it may be that the sector would benefit from further information or best practice guidance on how to measure impact effectively. This is perhaps especially true for those charities offering less tangible charitable services, such as pastoral support, advice or educational provision, where an action (or cost)-benefit relationship is more difficult to establish.
412 Ni Ogain, Lumley and Pritchard, New Philanthropy Capital (2012)413 Online survey, (all Maritime charities responding, n=46)414 An‘IndependenceStar’wasdevelopedspecificallyforusefortheArmedForcescommunity-(seehttp://www.outcomesstar.org.uk/ and Triangle Consulting (2016)
We define impact as any effects arising from an intervention. This includes immediate short-term outcomes, as well as broader and longer-term effects. These can be positive or negative, planned or unforeseen. This means that ‘impact’ can be wide-ranging and subtle. It is rarely easy to see just how and when a particular activity…leads to a specific impact.
Big Lottery Fund UK
We have all this information, it’s actually trying to put it into a format that makes people realise that those grant monies that they’re giving us do make a difference to people’s lives and to the community as a whole
[MN/FF, £100K-£500K]
My feeling is that people talk about it a lot, but to actually measure impact isn’t easy. Where we put in an intervention, is there a causal relationship to an improvement? It’s not always easy to do
[MN/FF, £100K-£500K]
I don’t know whether what we do can even be measured…You can’t turn around and say, our money has enabled that family to do x or achieve y or whatever it is, we just can’t do that, because we don’t know in our case whether our beneficiaries would have achieved x or y in any case
[MN, £100K-£500K]
It’s very difficult to measure impact, and I think it’s something we need to collectively consider… I think we need to seek expert advice on how we can capture the value and impact of what we do
[MN/FF, £1M-£5M]

Navigating Change: A Review of the UK Maritime Welfare Charity Sector | 2017 165
It may even be possible to use existing feedback channels, such as satisfaction surveys or annual home visits, and simply add some questions or amend the process in order to make the feedback more outcome
focused.
We are aware of the work done by the Officers’ Association on their holistic star approach, and that’s fine for the OA, it’s a really good system and of course they have their own case-workers, so they can implement that quite easily. Unless SSAFA take that same approach on, it’s not something that we could directly do ourselves
[RNRM, £100K-£500K]
Similarly, many maritime welfare charities are compliant with a raft of regulatory bodies, each conducting different audits on the services provided. For example, if offering residential care – CQC, or if offering education – Ofsted. Could any of this information be harnessed to help charities prove their worth, and support their success stories?
We have a CQC inspection every year or two years…Every month I have an independent clinical consultant come here and [they do] a very thorough look at everything and give me a candid report…We’ve got the environmental health that comes and does spot checks on us…So, we’re doing that all the time, measuring what we’re achieving
[RNRM/MN/FF, £1M-£5M]
Any such efforts would certainly benefit from a sector-wide approach. Consistency in the approach adopted and data captured would provide a more complete picture of the good work of the maritime welfare charity sector and so potentially help to support more effective fundraising activities.
It may be that impact measurement is an area which would benefit from a sector-wide working group to share best practice and determine the most appropriate approach. It may also help smaller charities form collaborative partnerships through which to implement and/or fund measurement.
If someone is going to spend a week a year driving round…seeing all these people, it obviously becomes an expense. If you had some over-arching body that had that facility or capability in place do that for you…You’ve got to be quite a wealthy charity to fund something like that, or you jump on the back of other charities who are again doing different things within the shipping community…and have someone that does all that for lots of charities
[RNRM/MN/FF, Under £100K]
A number of tools already exist to help charities to measure impact. For example, the Inspiring Impact project, a cross-sector programme funded by the Office for Civil Society, which provides online tools for charities to help measure and report their effectiveness; and the Impact Management Programme run by New Philanthropy Capital, which helps charities with the practical challenges of data collection and analysis; as well as Triangle Consulting’s Outcomes Star programme mentioned earlier.
There’s been a lack of uniformity in the way in which that impact is both measured and also reported
[RNRM, Over £5M]

Navigating Change: A Review of the UK Maritime Welfare Charity Sector | 2017 166
8.4 CONCLUSIONSIn an increasingly crowded and competitive charity field, proving positive impact will become ever-more important: donors - be they individuals, businesses or grant-making charities - want to know that their money is being well spent.
The recent Lords Select Committee on Charities recommends that: “All charities should be seeking independent evaluation of their impact on their beneficiaries, in order to ensure that they are delivering for them and to demonstrate this to beneficiaries, funders and the public. The form of such evaluation may vary considerably, depending on the size of the charity and the type of work it is engaged in.” In addition, the Committee endorsed the suggestion in the Governance Code that: “charities should provide regular information to stakeholders that enables them to measure the charity’s success in achieving its purposes. Such activity ensures that the focus of the charity and its stakeholders is centred on the needs of and outcomes for beneficiaries.”
Whilst much good work is being achieved by maritime welfare charities, with many capturing evidence to demonstrate this, the sector would benefit from a co-ordinated initiative to understand how best to measure impact using one or more of the many models available, especially given the challenging beneficiary and service provision context.
Such an initiative could take the form of a sector-wide working group, or a sector funded third-party consultation to establish a consistent, best practice approach. Re-purposing and/or extending information captured already – by individual charities themselves, SSAFA, RBL, or SAIL - may offer a short-cut solution for some.
Consistent measurement would allow not only comparison between different working methods, but also an overall view of impact to be established, helping to tell a more compelling story of what can be achieved by the maritime welfare charity sector as a whole.

Navigating Change: A Review of the UK Maritime Welfare Charity Sector | 2017 167
NIN
E

Navigating Change: A Review of the UK Maritime Welfare Charity Sector | 2017 168
An overall reduction in beneficiary numbers and profile changes will mean that some maritime welfare charities may want to amend their qualifying criteria, supporting those from different ranks, other segments of the sector or those with less time at sea if they are to meet the greatest need
Changes in the maritime industry, such as the reduction in British flagged Merchant Navy ships and an increase in international crews, may mean that the maritime welfare charity sector needs to start looking beyond UK beneficiaries
Technological advances both on-board and ashore have the potential to be a game-changer, with both positive and negative impacts that maritime welfare charities will need to address
9. CHALLENGING TIMES How the sector is responding to changing needs
SIGNIFICANT CHANGES TO
SEAFARING AND THE ‘SEA-
FAMILY’ MAY REQUIRE MANY
MARITIME WELFARE CHARITIES
TO RECONSIDER THEIR
OFFER, BOTH TO ADDRESS
CHALLENGES AND CAPITALISE
ON OPPORTUNITIES
KEY POINT 9 General societal changes are impacting on beneficiaries, for example, an ageing population, and an increase in those with financial problems due to government austerity measures/funding cuts. As a result, beneficiary issues are increasingly complex and may necessitate case-working, as well as specialist financial advisors (in debt and pensions) and emotional counsellors
If left unchecked, ‘sea-blindness’ – the perceived invisibility of the maritime (charity) sector – combined with the reducing ‘sea-family’ may impact negatively on future fundraising, volunteering and beneficiary contact levels
While the internet has become an important source of information and social contact for working age seafarers and their families, it is still a niche activity for many in the older seafaring community, and so any communication needs to reflect age and abilities. Ultimately, existing beneficiaries may be one of the best conduits through which to ‘cascade locate’ other seafarers who may be in need
Inconsistent interpretation and implementation of regulatory and governance requirements in areas such as fundraising, data protection and safe-guarding, could hinder sector collaboration
In light of a shrinking sector and greater regulation, maritime welfare charities are increasingly concerned about their ability to recruit Trustees
Whilst the majority of maritime welfare charities surveyed anticipate an increase in demand over the next 5 years, only a quarter believe that the sector is in ‘a good position’ to respond

Navigating Change: A Review of the UK Maritime Welfare Charity Sector | 2017 169
It can no longer be ‘business as usual’ – the seismic shifts in the maritime industry and society at large cannot fail to impact on maritime welfare charities and the support they provide. Maritime welfare charities will need to review the fundamentals of ‘who, what, where, when and how’ they serve, if they are to maximise their future impact

Navigating Change: A Review of the UK Maritime Welfare Charity Sector | 2017 170
9.1 A REDUCING BENEFICIARY POPULATION
As highlighted in Section 1, the maritime beneficiary population is in decline, albeit more slowly than initially thought. Some charities have already noticed a fall-off in seafarers seeking support, with a quarter (24%) of maritime welfare charities (MWCs) surveyed reporting a decline in demand over the last 5 years415.
There are less people in that population now… the numbers are dropping significantly, so all charities have had to look at what they’re doing and how they’re doing it, and what they’re doing it for
[RNRM, £100K-£500K]
As a result of this fall in beneficiary numbers, some maritime welfare charities have reviewed their charitable objects and, in some cases, expanded the criteria for those they are prepared to support. Of those maritime welfare charities anticipating a change in demand from seafaring beneficiaries, just over a quarter (26%) have already ‘amended their beneficiary focus / eligibility criteria’416.
Because there are fewer, we are able to extend our criteria and make grants where we wouldn’t have made grants in the past…Previously, we only looked at people who were lost at sea, or were injured at sea, but now we’re looking at old age and helping people as they get older
[FF, Under £100K]
We’ve brought down our criteria, it started off that you had to have fifteen years’ sea service, and we were finding that we weren’t replacing beneficiaries who were passing because people weren’t going away to sea for as long, so we’ve brought it down to now ten, and possibly seven will be considered
[MN, £100K-£500K]
Whilst more could be done to raise awareness of maritime welfare charities (see Section 9.6), and so potentially increase beneficiary numbers, it is possible that, as the seafaring population declines, charities may need to extend their focus beyond those with traditional seafaring roles and even to non-seafarers, if they have excess funds to bestow or accommodation to fill. As outlined in Section 1, new seafaring communities such as those working on professional yachts and cruise ships, may require support from maritime welfare charities in the future.
A number of people are doing a lot of work ‘at sea’ on these off-shore rigs…The inclination is to classify that as sea-service, because the riggers are just as hard [working] out in the North Sea as they are on a ship
[MN, £100K-£500K]
We’ve become a community hub as well…we’re not necessarily just military based, we’re also community based…. [If] we were…just totally Naval and seafarers…we would have died a death
[RNRM/MN/FF, £1M-5M]
It is encouraging, given the greater need established, that a number of charities appear to be re-focusing their efforts on the Fishing Fleet.
415 Online survey, (all Maritime charities responding, n=41) 416 Onlinesurvey,(allMaritimecharitiesanticipatingachangeinbeneficiarydemandresponding,n=34)

Navigating Change: A Review of the UK Maritime Welfare Charity Sector | 2017 171
We are increasing our commitment to fishing, we don’t do that much with fishing, but obviously, we recognise that fishing is an acute need and we are looking much more closely at fishing now, and we are being proactive in developing some fishing related projects
[MN/FF, £1M-£5M]
There is a word of warning, however, that in re-focusing efforts, charities may need to keep an eye on potential duplication of effort. Some participants in the depth interviews already perceive a duplication of welfare support across the sector, with a few concerned that as the beneficiary population falls, charities may refine their objectives and so potentially risk overlap. Ensuring good communication and collaboration across the sector to establish effective partnerships would be a good way to mitigate any risk of direct duplication.
There are huge amounts of duplication. Across all three parts [of the maritime sector]…I think we need to be very much looking at working together as delivery organisations to take the duplication out. As funding gets tighter, it will get worse not better
[RNRM/MN/FF, £500K-£1M]
9.2 GLOBALISATION OF THE MARITIME INDUSTRY
Globalisation of the Merchant fleet continues apace, with a reduction in the number of UK-flagged ships, and an increase in international crews (see Section 1). Inconsistent working practices on-board international ships are felt to result in issues with working conditions and seafarers’ rights.
British shipping seems not to be in a good place at the moment, and more and more foreign companies are employing people on bad terms and conditions…the health and safety factor is not good
[MN, Under £100K]
The 2006 Maritime Labour Convention [MLC 2006] has now been ratified by at least 80 states, representing 87% of world shipping417. Whilst it is beginning to have a positive impact on seafarers’ rights and conditions, some charities highlight that problems still exist. One also made the point that the industry has already moved on since 2006 – and even since 2013 when the UK ratified MLC 2006 – and so a further update may be required.
The ILO C188 ‘Work in Fishing Convention, 2007’ has recently been ratified by the tenth country, which is the trigger-point for UK ratification. The Convention is considered “the biggest change to health, safety and welfare that has ever occurred in the UK fishing sector”, with all vessels requiring a management system for Health, Safety and Welfare, and the vessel owner holding ultimate responsibility for all crew members even if they are self-employed. Fishermen will require evidence of medical fitness and must receive sufficient rest when at sea418.
417 MNWB (2017b)418 Safety Folder, https://safetyfolder.co.uk/wifc.php
I can talk to you of lots of instances where MLC has not been met, and seafarers are suffering through it...MLC was all very good, [but] we’ve moved on now since 2006 when it was first drawn up, although I appreciate it only came into being in 2013, so it’s still very new, but there are parts of that that need to be revisited now
[MN, £100K-£500K]

Navigating Change: A Review of the UK Maritime Welfare Charity Sector | 2017 172
International ships with multi-lingual crews can also pose issues, with a potential reduction in on-board socialising and the increased chance for seafarers to feel lonely and isolated. In a recent study by Nautilus International, seven in ten (70%) of seafarers felt that ‘crew not speaking a common language’ had a high impact on social interaction419.
To compound these issues, the provision of welfare and charitable support for seafarers world-wide is inconsistent and, in some parts of the world, inadequate.
Reflecting this, some UK-based maritime welfare charities have reviewed the distribution of their support, re-focusing efforts on international ports where seafarer need is felt to be more acute.
It’s stepping back and looking at where needs are in the world. It is looking at the whole global fishing industry, there are a massive number of issues there – there’s more awareness of them, but still they go on - labour abuses, which still happen in the Merchant fleet as well, there are sub-standard ships, there are seafarers treated very badly, there are dangerous practices
[MN/FF, £100K-£500K]
As the numbers of UK seafaring beneficiaries decline, more UK-focused maritime welfare charities may need to consider whether to extend their support to international seafarers.
Of those maritime welfare charities anticipating a change in demand from seafaring beneficiaries, a fifth (21%) have already ‘changed their geographical coverage of activities’, with a further 12% intending to do so in the future420. In some of these cases, charities will have altered their
coverage within the UK, rather than internationally.
9.2.1 THE UK AND EUROPE
Brexit is likely to have significant implications for the maritime community, both in terms of defence/security measures impacting the Royal Navy and in commercial/trading agreements affecting the Merchant and Fishing Fleets. The government announced in early July 2017 that the UK was leaving the 1964 London Fisheries Convention, whereby vessels from France, Belgium, Germany, Ireland and the Netherlands will no longer be able to fish in waters between six and twelve miles off the British coast. Whilst the Government suggests that this and the withdrawal from the European Union and its Common Fisheries Policy will create a ‘sea of opportunity’421, the full extent of any changes and their potential impact on seafarers are currently unknown.
419 Nautilus International (2017)420 Onlinesurvey,(allMaritimecharitiesanticipatingachangeinbeneficiarydemandresponding,n=34)421 MichaelGove,EnvironmentSecretary,03/07/2017
Just because you’re a member of crew on-board a ship, it doesn’t mean to say that you’re with friends, you’re with colleagues…If you’ve got mixed nationalities as well on-board…sometimes it adds to the isolation and loneliness
[MN, £100K-£500K]
There’s something like seven thousand odd ports around the world, and there’s about 430 seafarer centres…if there’s not a centre there might be a ship visitor, so a presence in 600-700 ports, there’s still a lot of ports that need to be covered
[MN/FF, £100K-£500K]
Fishing is one of the most challenging and hazardous occupations [and] ILO is working to ensure decent work for all fishers. The C188 Work in Fishing Convention, 2007 addresses such matters as minimum age for work on a fishing vessel, medical standards, work agreements, occupational safety and health, and social security… and demonstrates the renewed commitment by the ILO to ensure decent work in fishing.
International Labour Organization
I think there are a lot of charities whose mission has become unclear as the maritime world has evolved from one dominated by a British and Commonwealth fleet to one that is truly global, and that’s why I think there are too many charities that are living in the past, to put it bluntly
[MN/FF, £1M-£5M]

Navigating Change: A Review of the UK Maritime Welfare Charity Sector | 2017 173
9.3 INCREASING PRESSURES ON SEAFARERS
Increasing commercial and resourcing pressures are resulting in ships’ crews being worked harder, with shorter turnaround times in port and reduced shore leave for seafarers.
Since 2008 or 2009, with the world recessions, seafarers have been squeezed, the ship owners are looking at their margins and how to cut costs and, broadly, a lot of that falls upon the seafarer in terms of more pressure on them to work longer, and have less downtime, less time ashore
[MN/FF, £100K-£500K]
ITF Seafarers’ Trust’s 2016 research reported that almost a third (30%) of seafarers responding to their survey had not taken shore leave in the previous 4 weeks, a further 35% had been ashore once, and 20% twice. Key reasons given for a lack of shore leave were work requirements on-board (60%), fast turnaround times (41%) and limited money to go ashore (33%).
In relation to fast turnaround times, 29% of seafarers had vessels with average turnaround times of less than 6 hours. In total, seven in ten (69%) reported turnaround times of under twenty-four hours, thereby limiting access to shore leave422. Even when shore leave can be taken, it tends to be of limited duration, MNWB’s recent research showed that shore leave when visiting a UK port was most commonly 2-4 hours long423.
The extent of shore leave has, and will continue to have, significant implications for those charities providing in-port support to serving seafarers, specifically Seafarers’ Centres (see Section 9.4.2) and on-board welfare services. Chaplaincy and port welfare services have evolved to reflect the reduced time seafarers have ashore, with an increase in on-board visits. Nine in ten seafarers consider it important that someone from the Seafarer Centre visits their ship when it arrives in port424.
The old model of welfare used to be that the seafarer got off their ship, went to the Seafarer Centre, they’re in port for 3 or 4 days, they can interface with the Chaplain or the welfare worker, they could relax, have a drink, but now container ships are in port for 8 hours or so, they can’t get off the ship…the model’s changed where the welfare worker is getting onto the ship, with internet, with phone cards, etc.
[MN, £100K-£500K]
422 ITF Seafarers’ Trust (2016)423 MNWB (2016b) 424 Ibid
FIGURE 9.1Shore leave access in last 4 weeks [ITF, 2016]
FIGURE 9.2Shore leave duration [MNWB, 2016]
9.1
9.2
15%
47%
21%
7% 10%
1-2 hours
2-4 hours
4-6 hours
6-8 hours
Over 8 hours
30%
35%
20%
6%
5% 4% Never
Once
Twice
Three times
Four times +
No response
9.1
9.2
15%
47%
21%
7% 10%
1-2 hours
2-4 hours
4-6 hours
6-8 hours
Over 8 hours
30%
35%
20%
6%
5% 4% Never
Once
Twice
Three times
Four times +
No response
9.1
9.2
15%
47%
21%
7% 10%
1-2 hours
2-4 hours
4-6 hours
6-8 hours
Over 8 hours
30%
35%
20%
6%
5% 4% Never
Once
Twice
Three times
Four times +
No response
9.1
9.2
15%
47%
21%
7% 10%
1-2 hours
2-4 hours
4-6 hours
6-8 hours
Over 8 hours
30%
35%
20%
6%
5% 4% Never
Once
Twice
Three times
Four times +
No response

Navigating Change: A Review of the UK Maritime Welfare Charity Sector | 2017 174
9.3.1 RNRM RESOURCING
In the last decade, numbers in the Royal Navy and Royal Marines have decreased as a result of the government’s Strategic Defence and Security Reviews in 2010 and 2015 (see Section 1). Whilst cuts in 2010 saw 12 vessels axed from the fleet and 5,000 jobs lost, the Royal Navy now faces a shortfall of around 2,000 sailors from across the fleet: “Last year’s defence review tried to make up for this by allowing 400 more sailors. It should have been 4,000”, Former First Sea Lord Admiral Lord West425.
Attempts to address resourcing issues have included deployment times for some vessels being increased from 6 months to 9 months, an increased use of civilian contractors particularly in engineering roles where the Royal Navy has a skills gap, and a push for more Merchant seafarers to serve in the Royal Fleet Auxiliary426.
The impact of lengthier deployments is clearly seen in the Armed Forces Continuous Attitudes Survey, where Royal Navy personnel are much more likely to consider deployments to be both too long and too frequent than other Service personnel.
FIGURE 9.3
Opinion of deployment periods, length and frequency, by Armed Forces personnel427
The Tri-Service Families Continuous Attitude Survey reports even higher levels, with 65% of the spouses / civil partners of Royal Navy personnel considering deployment periods to be too long and 44% too frequent (compared to the tri-Service averages of 54% and 40% respectively)428. Indeed, the Naval Service is the most deployed of the three Services, with an agreed figure of no more than 660 days away in a 36-month period, compared to no more than 415 days away over a 30-month period for the Army and no more than 280 days over a 24-month period for the RAF429.
In terms of work/life balance, the proportion of Royal Navy personnel reporting that they spend more than four months away has increased from 49% in 2016 to 56% in 2017. Satisfaction amongst Royal Navy non-officer ranks with ‘being able to take leave when they want’ and ‘the amount of leave they are able to take’ have both fallen significantly in 2017, with the reasons given for not taking leave being more often attributed to workload (49%, up 6 percentage points in 2017), under-manning (41%, up 5pp) and being on an operational tour (37%, up 7pp)430.
In relation to the Royal Marines, the proportion describing morale as low has increased by 15 percentage points in 2017. Overall satisfaction with Service life amongst non-officer Royal Marines has fallen by 11 percentage points, whilst the proportion who say they want to ‘stay serving for as long as they can’ has fallen from 40% in 2016 to 34% in 2017431.
425 AsreportedbyGiannangeli,M.inTheExpresson13/02/2017,http://www.express.co.uk/news/uk/766183/Royal-Navy-plug-staff-shortage-urgent-plea-ex-sailors426 Save the Royal Navy (2014) http://www.savetheroyalnavy.org/9-month-deployments-and-the-navys-sensible-response-to-manpower-crisis/427 MOD (2017b)428 MOD (2017a)429 As stipulated by the Service Harmony Guidelines for separated service levels430 MOD (2017b) 431 Ibid
9.3
9.4
9.5
9.6
27%
7%
11%
43%
21%
25%
8%
11%
33%
18%
RAF
Army
Royal Marines
Royal Navy
Tri-Service Total
% deployment too often
% deployment too long
16% 35% 40% 7% 2% There is adequate awareness of seafarers' needs outside of the
maritime sector
Don't know 1-2 (Completely Disagree) 3-4 5-6 7-8 9-10 (Completely Agree)
16%
6%
32%
22%
34%
28%
18%
44%
Maritime charities (n=38)
Our organisation (n=32)
1-2 (Completely Disagree) 3-4 5-6 7-8 9-10 (Completely Agree)

Navigating Change: A Review of the UK Maritime Welfare Charity Sector | 2017 175
9.4 TECHNOLOGYAcross society as a whole, technology has changed enormously in the last ten years – ‘the world is home to over 8.1 billion gadgets and they’re multiplying five times faster than we are’432. Technology is now integral to every-day life, from keeping in contact with friends and family through email and social media sites, to shopping online and organising finances via online banking.
Some maritime welfare charities have noticed an increasing trend towards online communications from beneficiaries, whilst the desire to engage more with a younger generation has led to others expanding their online presence.
We’ve got to move with the times. If you want to connect with people then you’ve got to use the mediums that they’re used to using, particularly the younger generation. In my case, if we want to connect with – and we do – the serving population, then we have to get into social media
[RNRM, Over £5M]
Against this background, it is perhaps unsurprising that a quarter (24%) of maritime welfare charities identify ‘new technology – online/mobile solutions for giving, communicating or service delivery’ as one of the most pressing challenges facing their organisation433. Of those maritime welfare charities anticipating a change in demand from seafaring beneficiaries, a fifth (21%) have already ‘invested in IT/new technology and online solutions’, with a further two-fifths (39%) intending to do so in the future434.
However, the ubiquity of an online ‘connected’ life juxtaposes markedly with the serving seafarer’s experience, where on-board connectivity – although improving - remains limited.
9.4.1 CONNECTIVITY ON-BOARD
On-board connectivity has become increasingly important to seafarers to counteract isolation caused by limited shore leave, longer contracts/deployment periods and increased time spent away from loved ones.
On-board communications appear to be improving, but remain limited. In a 2006 survey, only 16% of MN seafarers responding had access to email facilities on-board435, whilst a recent study by Nautilus International now records email access at 57%436. Even at this improved level, and with access to social media on-board at 34%, Nautilus highlights that ‘the primary features that seafarers would look for to be able to stay in contact with family and friends at home are still unavailable’.
It is difficult to establish an exact figure for on-board internet availability. The Nautilus study records internet access for personal use being available to 86% of seafarers surveyed, whilst the 2016 ITF ‘Port-based Welfare Service Survey’ reports 72% availability437. However, both surveys were conducted online and so it was a pre-requisite that seafarers had internet access in order to respond (whether that was on-board or whilst ashore is not known). As ITF asserts, it is possible therefore that these studies ‘do not take into consideration the most isolated and disconnected seafarers’.
Another study conducted by MNWB suggests 66% on-board internet access438 – this study was conducted through both an online survey and a paper questionnaire distributed at Seafarer Centres, and so is likely to include some seafarers who are specifically using the Centres to access the internet which is otherwise unavailable to them. A 2015 study by FutureNautics, utilising both online and paper survey methodologies, recorded internet access at 43% across its broader international sample439
432 GSMA Intelligence, real-time tracker: https://www.gsmaintelligence.com/433 Online survey (all Maritime charities responding, n=46)434 Onlinesurvey(allMaritimecharitiesanticipatingachangeinbeneficiarydemandresponding,n=34)435 Kahveci,E.,SIRC(2007)436 NautilusInternational(2017)–itispossiblethatdifferencesinthesurveymethodologies(paperin2006vs.onlinein2017)mayaccountforsomeofthisdifferential437 ITF Seafarers’ Trust (2016)438 MNWB (2016b)439 FutureNautics (2015)

Navigating Change: A Review of the UK Maritime Welfare Charity Sector | 2017 176
Whatever the exact level of internet availability, all studies agree that on-board access is often restricted. In the MNWB study, internet access was only available whilst at sea for 41% of seafarers responding, with only 25% having unrestricted access ‘anytime at sea and in port’440. In the Nautilus study, over a third (36%) were only able to access internet pages pre-approved by their employer, whilst a fifth reported time restrictions and having to pay for access (20% and 17% respectively). The most common restrictions applied to streaming (54%), video calling (41%) and downloading (36%).441.
In addition to this restricted access, charities interviewed highlight issues with internet speed and bandwidth, all of which can impact on the services maritime welfare charities are able to deliver to seafarers online.
It’s using technology, harnessing technology to better support our [beneficiaries’] needs. …It’s about trying to ensure much greater personal contact…which is difficult given their circumstances and the lack of technology, access to the internet to support that…That’s a massive issue for us
[RNRM, Over £5M]
In terms of the Royal Navy, Welfare Communications Everywhere (WelComE) provides all UK Service personnel on ‘welfare-entitled’ deployments with publicly funded calls (30 minutes per week), voicemail and internet access442. Electronic ‘e-blueys’ allow Service personnel with an internet connection to maintain a personal and private two-way communication with those at home443. Restrictions on electronic communications can occur for safety reasons or to maintain operational security, whilst the MOD also blocks some specific internet content. Use of personal mobile phones at sea is governed by two factors: whether there is a signal and if use is authorised by Command444. In the further advancement of connectivity, WiFi is being rolled out on all RN surface ships, with Greenwich Hospital now helping to fund hardware - so far, six RN ships, plus one RFA ship have been fitted445.
Whilst increasing internet availability at sea has many advantages, almost seven in ten (69%) of those MN seafarers responding to the Nautilus survey believe that ‘crew using personal devices / spending time alone in cabins’ has a considerable impact on social interaction on-board446, a view which is shared by at least one of the maritime charities interviewed.
It means that they don’t have to come off the ship…they’ve got their internet connection, they’re talking to family and friends, which is great, but then after that they start playing games, so it’s adding to the fatigue…I don’t think folk are looking at the negative. There’s one company I know that provides the internet, but only in one location on-board the vessel, which is excellent because it means they come together
[MN, £100K-£500K]
The Crewtoo ‘Seafarers Happiness Index’ reports a declining score of 6.19 out of 10 for how happy MN seafarers are with ‘interaction with other crew members on-board’, commenting that ‘still too many are on ships where crew retreat behind closed doors, and there is too little social cohesion’447. It is important, therefore, that whilst welfare support may need to move increasingly online, technology does not replace human interaction completely.
440 MNWB (2016b)441 Nautilus International (2017)442 https://www.mywelcome.co.uk/royal-navy/home.aspx443 https://nff.org.uk/staying-in-touch/444 http://www.royalnavy.mod.uk/welfare/keeping-in-touch445 AsadvisedbyGreenwichHospital–threeRNshipswerefittedwithWiFicapabilitypriortoGH’sinvolvement446 Nautilus International (2017)447 Crewtoo, (2016)
As everyone, including seafarers, retreat into the online world, it becomes even more important to have that human element
[MN/FF, £1M-£5M]

Navigating Change: A Review of the UK Maritime Welfare Charity Sector | 2017 177
9.4.2 CONNECTIVITY ASHORE
With a relatively high proportion of MN seafarers still without on-board internet access, it is unsurprising that the most important services for Seafarers’ Centres to offer are ‘free internet/WiFi access’ or even paid for access (rated ‘important’ by 83% and 82% respectively), followed by SIM cards and top-ups (75%)448. This is corroborated by the ITF study, where nine in ten rate internet access as important for port-based welfare services to provide, making it the top requirement. This study also found that half of seafarers (53%) ‘if given a choice while on shore leave’ would prefer to visit a seamen’s club with free WiFi over visiting a shopping mall or café449.
Whilst this may be the case, Seafarer Centres have seen a decline in revenues due to the communication changes experienced over the last ten years. Traditionally, income from the sales of phonecards helped to fund the Centres’ activities, and so the emergence of WiFi, on-board and in other locations ashore, has eroded this revenue stream, whilst at the same time there is an expectation from seafarers that the Centres will fund free WiFi. This, in combination with lower seafarer numbers and more limited shore leave, means that it has been difficult for a number of Seafarers’ Centres in terms of their long-term sustainability.
Seafarers in the past – probably only 10 years ago – were desperately seeking phonecards when they arrived in port, so that they could contact family and friends back home, and the income from the sale of those phonecards was quite a significant source of income for Seafarers’ Centres. As WiFi has become more readily available…so seafarers are no longer purchasing phonecards, and the drop in that income…is one of the main reasons why we’re seeing the closure of Seafarers’ Centres
[MN/FF, £1M-£5M]
Maritime welfare charities have already done much to develop their services to meet these new challenges, with a review of existing Seafarers’ Centres450, and the appropriate reframing of the offer, including the introduction of more unmanned centres, accessible 24/7. However, it is likely that more will need to be done to establish new funding streams in order to support manned Seafarers’ Centres in the future. There is also a suggestion that opening Seafarers’ Centres to all port personnel, rather than just seafarers, may be a way to
increase revenues451.
448 MNWB (2016b) 449 ITF Seafarers’ Trust (2016)450 In2016/7,MNWBundertookareviewofthejointlyownedSeafarerCentres451 MNWB (2017b)

Navigating Change: A Review of the UK Maritime Welfare Charity Sector | 2017 178
9.4.3 TECHNOLOGICAL ADVANCES IN SEAFARING
More technologically advanced ships require fewer seafarers to crew them, resulting in fewer jobs, a situation which may be exacerbated should the development of ‘marine robots’ come to fruition.
Recent headlines tell how the Royal Navy has tested Maritime Autonomous Systems [MAS] with a view that such unmanned boats and submarines could be used to protect our shores in the future452. With implications for the Merchant Navy, the company Automated Ships has announced its intention to build the world’s first unmanned and autonomous vessel, the Hrönn, whilst another Norwegian company is to build the world’s first fully electric and autonomous container ship, the Yara Birkeland.
Whilst, under international maritime law, crewless ships are currently illegal, the estimated cost savings of between 40-50 per cent for using drone vessels, may be sufficiently enticing for a change in law to be lobbied for. In March, a House of Lords report into all autonomous vehicles heard that the government was too focused on cars, ignoring areas such as marine and agriculture453, whilst the UK Marine Industries Alliances has established a MAS Regulatory Working Group to ‘identify the issues related to the operation of Maritime Autonomous Systems in all of the global designated maritime zones; from the high seas into internal waters, and formulate a regulatory framework that could be adopted’454.
452 As reported by Williams, R. in the ‘i’ newspaper, 15 October 2016453 As reported by Connett, D. in the ‘i’ newspaper, 3 June 2016454 http://www.ukmarinealliance.co.uk/MAS

Navigating Change: A Review of the UK Maritime Welfare Charity Sector | 2017 179
9.5 CHANGES IN SUPPORT PROVISION
There are a number of more general societal changes which will continue to have an impact on the maritime sector and the charitable support required by seafarers. An ageing UK population and its implications, particularly in respect of the accommodation and care of older seafarers and their dependants, are discussed in detail in Section 6.4.1. Similarly, the impact of ‘austerity Britain’ is discussed in relation to both the accommodation and the financial assistance provided by maritime welfare charities (Sections 6 and 7 respectively).
The increasing complexity of beneficiary issues caused by such societal changes is mentioned by several maritime charities who provide support and advice services, and this is likely to result in a need for specialist
assistance in areas such as debt, pensions and emotional counselling.
Debt is becoming an increasing issue for society as a whole, with cuts in statutory support and a lack of affordable credit challenging household finances. Despite the availability of credit unions for some segments of the maritime sector – offered by Nautilus and the RMT to their members, or through the British Armed Forces credit union for RN – many seafarers, especially MN and FF with their lower income levels, are particularly vulnerable financially.
We might have seen off the Wongas of this world, and the regulation is tighter, but many people need access to credit and if they can’t get it legally, then they become subject to door-step lenders
[MN/FF, £1M-£5M]
As a result, the need for debt management services and advice to support seafarers has increased in recent years, and is likely to continue to drive a need for more specialist debt advisors moving-forward.
If you’ve got somebody who’s got themselves into debt, because they can’t manage their money, then by directing them to SAIL, which is obviously in a much stronger position than it was in 2007, then they can do some budgeting on their behalf or encourage them to budget
[MN/FF, £1M-£5M]
Another financial area which may become increasing problematic – and again require specialist advice and assistance – is the area of pensions. As outlined in Section 2, the proportion of seafarers with occupational pensions fell between 2001 and 2010455. In the depth interviews, charities highlight pensions as an area for future concern, with seafarers – many of whom are either self-employed (FF) or on voyage contracts (MN) – likely to risk pension shortfalls in the future.
There are very few occupational pensions…Fishermen are self-employed, they share in the income of the boat…They have to be responsible for their own tax and so on
[FF, Under £100K]
Rises in pensionable age may cause issues for seafarers, as their health is often detrimentally affected by their work, and so many may not be able to continue working into very old age.
I think the increase in the state pension age is going to cause problems…If you’ve been a fisherman, there’s a good chance that in your late 50s-60s you’ll be suffering from arthritis, [and] you don’t have the short of transferable skills that easily mesh into a modern economy with IT call centres
[MN/FF, £1M-£5M]
455 Nautilus International (2010)

Navigating Change: A Review of the UK Maritime Welfare Charity Sector | 2017 180
Future government decisions in terms of pension allowances, such as whether to retain the ‘Triple Lock’ on pension increases, may also impact retired seafarers’ finances. The Beth Johnson Foundation asserts that whilst ‘it is difficult to foresee what will happen…it is likely many more people, particularly women, will not get a full state pension’ in the future456.
Another area which has come to the fore in recent years is the need for more mental health or emotional counselling. Whilst there has been much discussion about the levels of PTSD within the Armed Forces457, ‘well-being’ is a wider societal movement, with mental health issues being discussed more openly now than ten years ago, or even two years ago.
The awareness raising of mental health charities such as Mind, and campaigns such as Time to Change and the Heads Together initiative launched by the Duke and Duchess of Cambridge and Prince Harry in 2016 have been instrumental in bringing mental health care to the fore. This culminated in the Prime Minister’s announcement that government policy would aim to ‘change the way we view mental illness, so that striving to improve mental wellbeing is seen as just as natural, positive and good as striving to improve our physical wellbeing’458.
With the increased penetration of the internet…whereas before [seafarers] might not hear from home for six weeks…now they’re hearing the next day…if something happens at home, if their child is sick…or if their partner has gone off with someone else, they hear about it…so I think they need more support
[MN/FF, £1M-£5M]
We’ve had a large increase in domestic violence and PTSD due to active service. People talk about mental health much more than they used to, before it used to be very much ‘how are you’, ‘yes, I’m fine’, now it’s ‘how are you’, ‘well actually, I’m depressed on a Thursday and this is the reason for it’
[RNRM/FF/MN, £500K-£1M]
As a result, a number of the maritime charities participating in the depth interviews highlight how their services have evolved to meet this emerging need.
We’re looking at doing more, providing, not exactly counselling, but our team have had counselling training and counselling awareness training, and awareness of seafarers having issues, and perhaps feeling suicidal – definitely in the last 3 or 4 years there’s much more awareness of that
[MN/FF, £100K-£500K]
The skill-set of the team internally has needed to reflect and amend and grow skill-set-wise to meet those needs. If I look at the team 10 years ago as to our skill-sets and how we operate, and I look at how we all are now, we’ve moved on tremendously
[RNRM/FF/MN, £500K-£1M]
A further example is the June 2016 launch of an online mental health and wellbeing service for serving UK merchant seafarers, a joint venture between Seafarers Hospital Society and Big White Wall. The online portal, which can be accessed anonymously, provides information, self-help resources, a supportive community of like-minded people and one-to-one help from trained counsellors459, and from September 2017 is being
extended to support serving FF as well as MN.
456 Beth Johnson Foundation (2016)457 Hunt, Wessely, Jones, Rona and Greenberg, KCL – King’s Centre for Military Health Research (2014)458 Theresa May, Prime Minister, announcement on 9 January 2017459 http://seahospital.org.uk/mental-health-and-wellbeing/

Navigating Change: A Review of the UK Maritime Welfare Charity Sector | 2017 181
9.6 RAISING AWARENESS
Almost two-thirds (65%) of maritime welfare charities surveyed consider ‘raising awareness of our charity and cause’, their most pressing challenge (see Section 10)460. A lower proportion of tri-Service charities (40%) highlight this as an issue and in a study conducted across the wider third sector461, ‘raising awareness of our charity/cause’ was only the fourth most pressing challenge, illustrating the greater concern amongst the maritime sector in this respect.
9.6.1 PUBLIC AWARENESS OF THE MARITIME (CHARITY) SECTOR
An issue raised repeatedly by maritime charities participating in the depth interviews is that of ‘sea-blindness’, the belief that the general public fail to appreciate the contribution made by the seafaring community and the hardships that they can experience.
A recent poll by ComRes for the UK Chamber of Shipping reported that 84% of the public identified shipping as the principal mode of transport for moving international trade, although this fell to 73% amongst those aged 18-24462. In contrast, research by Seafarers UK in 2014 found that just four in ten people knew that the majority of food imported into the UK came by sea, 27% believing it came by air and 20% by road463.
Whilst awareness of the shipping industry as an entity may be relatively high, the question remains whether the general public are aware of the potential hardships seafarers can face and their resultant charitable needs.
Three-quarters (74%) of maritime welfare charities responding to the online survey disagree that ‘there is adequate awareness of seafarers’ needs outside the maritime sector’464.
FIGURE 9.4
How strongly do you agree or disagree that ‘there is adequate awareness of seafarers’ needs outside the maritime sector’?
As the seafaring population reduces, the ‘sea-family’ of those with any connection to seafaring also reduces. It is widely understood that a personal connection to a cause or direct experience of a charity is very often what drives charitable donations. In 2013, the Charities Aid Foundation’s ‘Why We Give’ study found that 75% of donors agree that they give because of ‘a particular belief that I have in a specific cause’, whilst 61% agree that giving was prompted by ‘a personal experience that I have had’465. A declining ‘sea-family’ is therefore a
real concern for the future fundraising abilities of the sector.
As the generation who lived through, or can recall, the days of a large British merchant fleet…die off, we have to…educate and inform the next generation about why it’s important that we support seafarers, that the UK remains a maritime nation
[MN/FF, £1M-5M]
460 Online survey, (all Maritime charities responding, n= 46 / all tri-Service charities responding, n=20)461 CharitiesAidFoundation/ACEVO(2017)462 UK Chamber of Shipping, (May 2017,), 2,026 interviews with the UK public conducted by ComRes463 Seafarers UK (2014), 1,000 interviews with the UK public464 Online survey, (all Maritime charities responding, n=43)465 Charities Aid Foundation (2013)
74% 2%
% Disagree
(1-4)
% Agree (7-10)
9.3
9.4
9.5
9.6
27%
7%
11%
43%
21%
25%
8%
11%
33%
18%
RAF
Army
Royal Marines
Royal Navy
Tri-Service Total
% deployment too often
% deployment too long
16% 35% 40% 7% 2% There is adequate awareness of seafarers' needs outside of the
maritime sector
Don't know 1-2 (Completely Disagree) 3-4 5-6 7-8 9-10 (Completely Agree)
16%
6%
32%
22%
34%
28%
18%
44%
Maritime charities (n=38)
Our organisation (n=32)
1-2 (Completely Disagree) 3-4 5-6 7-8 9-10 (Completely Agree)

Navigating Change: A Review of the UK Maritime Welfare Charity Sector | 2017 182
In addition to having an impact on fundraising, charitable ‘affinity’ also impacts on volunteering levels, with people more likely to give their time, as well as money, to charities that they have a personal connection to. One in six (17%) of the maritime welfare charities surveyed highlight ‘securing volunteer engagement’ as one of their top five most pressing challenges – whilst not highest on the list (see Section 10), it is clearly an area of concern for some466. Promotion of the varied volunteering roles available across the maritime charity sector (e.g. ship-visitor, case-worker, fundraiser, trustee), may assist maritime welfare charities in resourcing their activities moving forward.
To improve awareness of the maritime charity sector amongst the general public, charities suggest a coordinated promotional campaign (see Section 9.6.4). In this respect, Seafarers UK coordinates ‘Seafarers Awareness Week’ in June each year, to coincide with the International Maritime Organization’s global ‘Day of the Seafarer’, although some of the maritime charities interviewed queried its effectiveness and reach.
Others believe more tools need to be produced to help educate people about life at sea, for example, the wider dissemination of materials such as the animations created by Nautilus International, including ‘What have seafarers ever done for us?’ may help in this respect467.
What might be good is a public information film that could be shown, played through charities’ websites…something which could just be put in front of people to make them realise what is going on and the hardship that can fall upon families when things go wrong
[MN/FF, £100K-£500K]
The only answer is the Chinese water-torture approach to the thing – that you cannot stop telling people the importance to this nation of free-passage on the oceans of this world, because over 90% of our imports and exports come [and go] by sea – a matter of fact, and someone’s got to man it
[RNRM, Over £5M]
9.6.2 BENEFICIARY AWARENESS OF THE MARITIME CHARITY SECTOR
In 2007, research found that seafarers and their dependants clearly lacked awareness of available services, and needed information and advice on a range of issues. The updated research shows that awareness of maritime charities’ support is still poor.
Only 2% of working age seafarers’ dependants mention maritime charities as ‘the most useful place to find advice or support on family issues’ (9% of FF, 4% MN and 1% RNRM). Rather, research has consistently shown that for dependants of working age seafarers, the most useful information source is friends and family (49%), followed by website/internet (18%) and a CAB or other advice centre (5%). Eight per cent mentioned the RNRM Welfare Team, potentially reflecting that serving RNRM seafaring families have access to greater support through a more focused channel than available for either the Merchant Navy or Fishing Fleet468.
When working age seafarers’ dependants were asked which maritime charities they knew, in most cases, less than half were aware of each maritime charity relevant to their family connection (e.g. MN being aware of those charities supporting MN beneficiaries). Awareness of the charities offering support to them is generally highest amongst RNRM, and lowest amongst FF469.
Whilst there has been little real change in the awareness of the services provided by maritime charities since 2006, older seafarers and their dependants seem to know slightly more about what is on offer: of the ten charitable services respondents were prompted with, seven experienced marginal uplifts in awareness. In particular, they are more aware of social events / reunions, financial advice and counselling services, although they remain most aware of charities offering regular (55%) and one-off (33%) payments 470.
466 Online survey (all Maritime charities responding, n=46)467 https://nautilusint.org/en/what-we-say/nautilus-videos/468 IPC (2016)469 Ibid 470 ORS (2016)

Navigating Change: A Review of the UK Maritime Welfare Charity Sector | 2017 183
Some older seafarers and their dependants identified a number of barriers to accessing information about maritime charities: a belief that they would be ineligible for support; difficulties in accessing information from charities (online), a lack of awareness about the charities more generally, and the limited presence of maritime charities in certain areas of the country.
9.6.3 AWARENESS AMONGST SEAFARERS
Given that those interviewed in the updated 2016 studies included a good proportion of existing beneficiaries471, and yet awareness of maritime charities and the support they offer was relatively low, it is possible that awareness amongst the wider seafaring population is even lower.
Some maritime welfare charities highlight the potential for an ‘unknown’ or ‘missing’ beneficiary population, caused by this low awareness of maritime charities and what they can offer, and compounded by poor employment records, particularly for MM and FF, which make it difficult to proactively identify and locate those who might be eligible for assistance.
Merchant mariners [are] a relatively dispersed group of individuals, with no one holding a database of who works in the Merchant Navy, because all of these people have been employed by individual companies…We’re still concerned that however many people we are assisting, we are still just touching the top of the iceberg really, and that there’s many more mariners out there
[MN, £1M-£5M]
Despite the good work of Seafarer Support, I think that there are quite a lot more Merchant Navy people out there that we could assist, and they don’t know we exist, and we don’t know where they are
[MN, £1M-£5M]
Amongst those frontline maritime welfare charities directly supporting individual beneficiaries, over two-fifths (44%) believe that they are ‘successful in reaching all of the beneficiaries that they might be able to assist’. Agreement is marginally lower amongst those supporting FF, 40%, compared to 43% for MN and 45% for RNRM472. Just over a quarter (28%) believe that they are not successful in reaching all beneficiaries, with this fairly even across all three segments of the sector.
FIGURE 9.5
How strongly do you agree or disagree that ‘<Our organisation is / Maritime charities are> successful in reaching all of the beneficiaries that <we/they> might be able to assist’?
However, when considering the maritime charity sector as a whole, results are reversed, with less than a fifth (18%) agreeing that the maritime charity sector is successful in reaching all beneficiaries and nearly half (47%) disagreeing473. There is clearly a perception that ‘the sector’ needs to do more, whilst many frontline organisations believe they are doing all they can already.
471 37% of older seafarers and their dependants had received money from a maritime charity (ORS, 2016) / 28% of working age seafarers’ dependants and their families had applied for assistance to a maritime charity (IPC, 2016)
472 Onlinesurvey.Maritimecharitiesmayservemorethanonebeneficiarygroup,andsotheirresponseswillappearineachofthesegmentsserved(allfrontlineMaritimecharities responding, Total=32, RNRM=20, MN=21, FF=15)
473 Online survey (all Maritime charities responding, n=38)
28% 44%
% Disagree
(1-4)
% Agree (7-10)
47% 18%
9.3
9.4
9.5
9.6
27%
7%
11%
43%
21%
25%
8%
11%
33%
18%
RAF
Army
Royal Marines
Royal Navy
Tri-Service Total
% deployment too often
% deployment too long
16% 35% 40% 7% 2% There is adequate awareness of seafarers' needs outside of the
maritime sector
Don't know 1-2 (Completely Disagree) 3-4 5-6 7-8 9-10 (Completely Agree)
16%
6%
32%
22%
34%
28%
18%
44%
Maritime charities (n=38)
Our organisation (n=32)
1-2 (Completely Disagree) 3-4 5-6 7-8 9-10 (Completely Agree)
Navigating Change: A Review of the UK Maritime Welfare Charity Sector | 2017 184
9.6.4 IMPROVING AWARENESS
One of the key issues is how to raise awareness of maritime welfare charities and the services that they provide, particularly amongst a transient and difficult to reach beneficiary population.
Clearly, as much information as possible needs to be provided when seafarers are actually serving - at this point they are ‘known’ and relatively accessible – and maritime welfare charities need to maximise this opportunity to try and get their message across. While this is relatively successful in the RNRM sector, there is some concern that the globalisation of the Merchant fleet has made getting the charitable message ‘on-board’ much more challenging now than historically.
If you look back over the years, the big companies like ESSO, Shell…Chevron, [maritime charities] had a relationship with these organisations, and they would publicise on their behalf, but there are so many, smaller foreign owned companies now…that there isn’t that two-way conversation anymore. It’s difficult to know how to get that foot in the door
[MN, Under £100K]
It is also true that for many seafarers there can be a lengthy period between when they were at sea, and when they may require assistance. During this interval, they may have had other careers, moved location and so lost their seafaring contacts and networks - information that they were provided with during their sea-service is no longer top-of-mind.
Many believe that sign-posting within the sector has improved in recent years, particularly with the further development of SAIL and the creation of Seafarer Support474, although more could still be done. Almost two-fifths of maritime welfare charities surveyed agree that there is ‘adequate signposting within the maritime sector’ (39%), whilst a third (32%) disagree475. However, the more pressing concern is how to get seafarers aware of and into the system in the first instance.
It’s very difficult, I think there is a lot [of support] out there, but it’s whether or not the people that it’s being targeted at understand it, and actually how to access it – that’s where it falls down. There’s a great attempt to try and deliver the message, it’s just how it’s being received
[RNRM/MN/FF, £500K-£1M]
Maritime welfare charities are attempting to address the issue, with nine in ten surveyed undertaking some form of advertising or ‘awareness raising’ activities476. Of those maritime welfare charities anticipating a change in beneficiary demand, a quarter (26%) have already ‘increased promotion, advertising or marketing of the charity’, whilst a further two-fifths (41%) aim to do so in the next 12 months477.
With so many maritime welfare charities planning individual marketing activities, it raises the question as to whether it may be more effective to combine advertising budgets to fund a co-ordinated campaign at an overall sector level.
In undertaking any awareness rising activity, the maritime charity sector will also need to be confident that it can meet any additional beneficiary demand generated.
474 ‘SAIL’ is the Seafarers Advice and Information Line. / ‘Seafarer Support’ is managed by MNWB and funded by the MCG, it provides an interactive website and telephone helplinetohelpidentifyappropriatemaritimecharitiestomeetabeneficiary’sspecificneed
475 Online survey and tele-depth interviews (all Maritime charities responding, n=59)476 Online survey (all Maritime charities responding, n=46)477 Onlinesurvey(allMaritimecharitiesanticipatingachangeinbeneficiarydemandresponding,n=34)
You need a central focus, sending out an advert ‘calling all seafarers…if you’ve served, you need to ring this number’…make a concerted and continual effort to get our message out
[RNRM/MN/FF, £1M-£5M]

Navigating Change: A Review of the UK Maritime Welfare Charity Sector | 2017 185
9.6.5 COMMUNICATION CHANNELS
Around one in six (18%) of working age seafarers’ dependants consider online to be the most useful source of information or support on family issues, a channel which was not mentioned ten years ago. RNRM and MN dependants are much more likely to use the internet for advice or support on family issues than FF dependants, indicating relatively limited use or access to the internet in this group478.
While working age seafarers’ dependants contact maritime charities through a broad range of methods, including phone, email, Twitter and Facebook, the older generation of seafarers and their dependants tend to use more traditional methods. Word-of-mouth from friends, relations and acquaintances or charity contacts and local support groups; via newsletters, direct mail or emails from charities and via the internet, remained the most frequent ways former and older seafarers and their dependants found out about services and support from maritime charities. For older FF seafarers and their dependants, their main point of contact for all information on care and support was The Fishermen’s Mission479.
So, while the use of social media as a means of communication between maritime charities and their potential beneficiaries of working age emerged as a significant development since the previous study was carried out480, maritime charities wishing to work with older seafarers and their dependants need to continue to promote themselves and the support they offer through local people and organisations in touch with older seafarers481.
Reflecting this, the most commonly used channel to raise awareness is ‘word of mouth’, with three-quarters of maritime welfare charities surveyed relying on this, at least in part, to advertise their presence482.
Advertising is a complete waste of time and resource. The best way is to be out there and telling everybody what you do…It’s just having folk like myself out in the field, getting alongside them somehow…talking to individuals
[MN/FF, £100K-£500K]
Seven in ten of the maritime welfare charities responding raise awareness via their own website, whilst around half use social media and/or mailings and newsletters (54% and 50% respectively).
Older seafarers and their dependants offered various suggestions as to how charities could reach people in need including: featuring information more prominently in newsletters and in the mass media; through the RNRM and Merchant Navy companies distributing charity information to seafarers on their retirement; via statutory service providers; by cross promoting and networking with other charities and distributing information through community based services483.
9.6.6 COMMUNICATION MESSAGES
For some seafarers and their dependants, pride can still be a huge barrier to asking for help - “I don’t want to go cap in hand to anybody. I’ve got a certain amount of pride left”484. Maritime charities also raise the issue of ‘charity stigma’ as a barrier to potential beneficiaries coming forward.
One idea proffered by the dependants of working age seafarers to try and reduce the stigma of applying to a charity is to rebrand them as a ‘resource provider’485, and the 2007 ‘Supporting Seafarers’ report suggested emphasising ‘support’ rather than ‘charity’ in any communications.
478 IPC (2016)479 ORS (2016)480 IPC (2016)481 ORS (2016)482 Online survey, (all Maritime charities responding, n=46)483 ORS (2016)484 Ibid,commentfromaMerchantNavyOfficer485 IPC (2016)
The Merchant Navy beneficiaries…they’re a very proud group of folk who will not come and ask for support …I can think of half a dozen people at the moment, who I’ve been told about, but they will not make that contact because they’re so proud
[MN/FF, £100K-£500K]

Navigating Change: A Review of the UK Maritime Welfare Charity Sector | 2017 186
There is some concern amongst those charities supporting MN and FF, that communicating the charitable need of what the general public understand to be a ‘commercial’ industry may be too challenging. The belief being that donors may reasonably expect the industry - shipping companies, unions, etc. – to be looking after the needs of its (former) employees.
9.7 GOVERNANCE
In terms of the most pressing challenges facing the sector, ‘Securing new Trustees / Chairman’ is rated fourth, by just over a third (35%) of the maritime welfare charities surveyed486. The difficulty of securing Trustees or a new Chairman was mentioned by a number of those charities completing the depth interviews. Problems were attributed to the reduced seafaring population resulting in a smaller pool of individuals from which to draw, as well as increased governance requirements for Trustees being a barrier to uptake.
Generating effective governance will be an increasing problem. Creeping legislation which perhaps discourages people to come forward, for people to volunteer their time as Trustees
[RNRM, Over £5M]
Whilst only 15% of maritime welfare charities highlight ‘new government legislation /regulation’ as a key challenge, respondents in the depth interviews did highlight concerns with wider regulation, such as that imposed by the Charity Commission in relation to fundraising practices, data protection regulations, as well as safe-guarding guidance. It is felt that charities within the sector are currently approaching these issues in an inconsistent manner.
At the moment, we’re hurriedly doing our own data protection audits and coming up with various solutions…There’s this huge piecemeal jigsaw going on, and some organisations are choosing to ignore it and others are going 100% at it
[RNRM/MN/FF, £550K-£1M]
486 Online survey, (all Maritime charities responding, n=46)

Navigating Change: A Review of the UK Maritime Welfare Charity Sector | 2017 187
9.8 FUTURE DEMAND
Almost two-thirds (63%) of those maritime welfare charities responding to the online survey, anticipate an increase in demand for their services over the next 12 months, with only seven per cent anticipating a decline. Even across the next five years, when some might have expected beneficiary numbers to start declining, only one in six maritime welfare charities (18%) anticipate a fall in demand487.
FIGURE 9.6
Over the next 12 months / 5 years, do you anticipate that demand for your services/support from your end beneficiaries will increase or decrease?
Those charities supporting the Merchant Navy are most likely to anticipate an increase in demand over the next 12 months, 70% compared to 61% amongst those serving the Fishing Fleet and 59% amongst RNRM charities488.
Over the next five years, almost a quarter (24%) of those charities supporting fishermen anticipate a decline in demand, compared to 15% of MN and 14% of RNRM charities. However, this decline is off-set by the majority of maritime welfare charities, across all three segments of the sector, still anticipating an increase in need over the next five years (69% MN, 65% FF, 62% RNRM)489.
Any anticipated change in demand can only be based on current experience and expectations about the maritime sector, but it is highly likely that circumstances will change. Brexit may impact on UK defence, shipping and fishing in currently unforeseen ways. Efforts to improve the visibility of maritime welfare charities and the support they provide may boost the numbers seeking assistance, as may the continuing bite of austerity measures on household finances. Emerging ‘non-traditional’ seafaring populations may not only swell beneficiary numbers, but bring different needs to the fore: the growth of the superyacht market is anticipated to create an additional 6,500 jobs at sea by 2020490, whilst by 2026 the global demand for Officers in the Merchant Navy is expected to increase to almost 1.1M and 865,000 for Ratings491 – presenting potential growth opportunities for the UK maritime sector, and so beneficiary numbers.
487 Online survey, (all Maritime charities responding, n=41)488 Onlinesurvey,Maritimecharitiesmayservemorethanonebeneficiarygroup,andsotheirresponseswillappearineachofthesegmentsserved(allMaritimecharities
responding, RNRM=22, MN=27, FF=18)489 Online survey, (all Maritime charities responding, RNRM=21, MN=26, FF=17)490 Bluewater (2017)491 DfT (2017)
7% 63%
% Decrease
% Increase
18% 63%
9.7
5%
2%
13%
5%
20%
29%
35%
41%
28%
22%
Over the next 5 years (n=40)
Over the next 12 months (n=41)
Decrease a lot Decrease a little Remain the same Increase a little Increase a lot
11% 5% 14% 43% 18% 9% Maritime charities are in a
good position to respond to all future beneficiary needs
Don't know 1-2 (Completely Disagree) 3-4 5-6 7-8 9-10 (Completely Agree)

Navigating Change: A Review of the UK Maritime Welfare Charity Sector | 2017 188
9.8.1 MEETING DEMAND
In terms of meeting future beneficiary need, just over a quarter (27%) agree that ‘maritime charities are in a good position to respond to all future beneficiary needs’, with almost a fifth (18%) disagreeing492. Agreement is lowest amongst those maritime welfare charities supporting MN seafarers, with only a fifth believing that they are in a good position to respond to future beneficiary need (21%, compared to 25% FF and 33% RNRM)493.
FIGURE 9.7
How strongly do you agree or disagree that ‘maritime charities are in a good position to respond to all future beneficiary needs’?
492 Online survey (all Maritime charities responding, n=44)493 Ibid, Maritime charities may serve more than one beneficiary group, and so their responses will appear in each of the segments served (all Maritime responding,
RNRM=24, MN=29, FF=20)
18% 27%
% Disagree
(1-4)
% Agree (7-10)
9.7
5%
2%
13%
5%
20%
29%
35%
41%
28%
22%
Over the next 5 years (n=40)
Over the next 12 months (n=41)
Decrease a lot Decrease a little Remain the same Increase a little Increase a lot
11% 5% 14% 43% 18% 9% Maritime charities are in a
good position to respond to all future beneficiary needs
Don't know 1-2 (Completely Disagree) 3-4 5-6 7-8 9-10 (Completely Agree)

Navigating Change: A Review of the UK Maritime Welfare Charity Sector | 2017 189
9.9 CONCLUSIONS
External forces, across industry, government and society in general, are transforming the sphere in which maritime welfare charities operate. MWCs would do well to review their remit in light of these changing times, ensuring that charitable objects, beneficiary eligibility criteria, and geographical coverage allow them to maximise their impact. Services and support offered may also need to be altered to reflect the changing environment in which seafarers find themselves, with a greater need for specialist advice and counselling, and accessible ship/port-based welfare.
The maritime welfare charity sector needs to reach out to other organisations that influence seafarer well-being – industry representative bodies, government, port authorities, commercial shipping companies – to educate and engage them in better welfare support, be it through financial contribution and/or (lobbying for) improved legislation. Initiatives across the maritime welfare charity sector to address regulatory requirements for fundraising, data protection and safe-guarding would ensure consistent implementation and so facilitate improved collaboration.
Embracing technological advances will become increasingly important for maritime welfare charities. As on-board internet access improves, opportunities exist for maritime welfare charities to reach out to seafarers whilst at sea, to maintain more constant relationships through ‘digital chaplaincy’ or to offer more educational and support services online. Some maritime welfare charities could also benefit from an improved digital presence, using websites and social media as channels to reach out to potential beneficiaries and supporters alike. It is possible that maritime welfare charities may need to employ more tech-savvy staff or third-parties to help deliver such services. It is important to recognise, however, that not all seafarers are online and that digital services should augment not replace personal interaction.
More needs to be done to raise awareness of the maritime charitable sector amongst seafarers and beyond. Some maritime welfare charities point to the need for a co-ordinated sector-wide/funded promotional campaign using ‘above the line’ advertising channels (i.e. TV or radio). The potential effectiveness or return on investment of such an approach would need to be explored fully, especially in the light of existing sector-wide activities such as Seafarers Awareness Week. In reality, other channels such as online campaigns, information provided via employers or mainstream charities (e.g. Age UK, Alzheimer’s Society, CAB, etc.) and/or traditional print materials may be more appropriate and effective given the individual target audiences across the sector. Similarly, having a visible presence in areas where seafarers in need might be located, whether that takes the form of case-working, outreach services or Seafarer Centres remains essential. Indeed, existing beneficiaries may be one of the best conduits through which to ‘cascade locate’ other seafarers who may be in need.
Whatever the communication channels used, the overall message imparted in all promotional materials needs to be consistent, as does the language used (e.g. ‘support’ not ‘charity’) and any contact point referenced (e.g. SAIL), so as to repeatedly drive home the message and how to reach help.

Navigating Change: A Review of the UK Maritime Welfare Charity Sector | 2017 190

Navigating Change: A Review of the UK Maritime Welfare Charity Sector | 2017 191
TE
N

Navigating Change: A Review of the UK Maritime Welfare Charity Sector | 2017 192
10. STRONGER TOGETHER? The future of the MWC sector in a challenging world
The MWC sector is facing a number of challenges both currently and in the future. Many of these challenges have been described in the previous sections. In most cases, the sector is already aware of these challenges, although that awareness may not spread to all parts of the sector evenly

Navigating Change: A Review of the UK Maritime Welfare Charity Sector | 2017 193
10.1 CURRENT CHALLENGES FOR MARITIME WELFARE CHARITIES
Our survey asked maritime welfare charities (MWCs), and tri-Service (Armed Forces) charities, what they felt were the five most pressing challenges facing their organisation, and the results are shown in Figure 10.1.
FIGURE 10.1
Most pressing challenges currently facing your organisation (select up to a maximum of five)494
The results of the survey show a clear front-runner in terms of the concerns of MWCs, and that the order of challenges facing the tri-Service (Armed Forces) charities are rather different.
494 Online survey (all Maritime charities responding, n=46 / all tri-Service charities responding, n=20)
10.1
10.2
35%
5%
20%
20%
10%
25%
50%
5%
25%
60%
30%
0%
30%
45%
40%
11%
15%
15%
15%
17%
17%
17%
20%
24%
26%
33%
35%
35%
43%
65%
Changing beneficiary profile / needs
Lack of appropriately skilled staff
New government legislation/regulation
Reduction in public / gov. funding
Securing volunteer engagement
Insufficient resource
Meeting demand for services
Remaining true to our mission
New tech - online/mobile solutions
Increasing costs
Measuring & demonstrating impact
Securing new Trustees / Chairman
Identifying / finding beneficiaries
Generating income / sustainability
Raising awareness about charity / cause
Maritime Charities (n=46)
Tri-Service Charities (n=20)
25% 18% 23% 35% Familiarity with 'Supporting
Seafarers' 2007
Not at all familiar Not very familiar Familiar Very familiar

Navigating Change: A Review of the UK Maritime Welfare Charity Sector | 2017 194
The top 10 challenges currently facing MWCs:
1. Raising awareness of our charity / cause
2. Generating income / achieving financial sustainability
=3. Identifying / finding beneficiaries
=3. Securing new Trustees / Chairman
5. Measuring and demonstrating impact
6. Increasing costs
7. New technology – online / mobile solutions for giving, communicating or service delivery
8. Remaining true to our original mission / avoiding mission drift
=10. Meeting demand for services
=10. Insufficient resources
=10. Securing volunteer engagement
The top 5 challenges currently facing tri-Service (Armed Forces) charities:
1. Increasing costs
2. Meeting demand for services
3. Generating income / achieving financial sustainability
4. Raising awareness of our charity / cause
5. Changing beneficiary profile /needs
For a majority of MWCs, the most pressing challenge facing them is raising awareness of the charitable cause and/or the specific charity, which 65% identify as a key issue. From the depth interviews, we know that low awareness of the maritime welfare charity sector is felt to be an issue for both the seafaring beneficiary population, and the general public. For the tri-Service (Armed Forces) charities surveyed, ‘raising awareness’ is rated as the fourth highest priority, with 40% agreeing that this was their most pressing challenge.
This highlights one of the major differences between the issues facing Armed Forces charities versus maritime welfare charities: while there is a fear of loss of awareness for Armed Forces charities following the drawdown from Iraq and Afghanistan, etc495, the maritime sector already has a much lower profile and its diversity makes raising this more challenging.
It’s also worth pointing out that while identifying / finding beneficiaries is rated as one of the joint third most pressing challenges for MWCs496, changing beneficiary profile /needs is rated lowest (ranking 15/15), with only 11% placing it in their top five. While this may indicate that other challenges, such as financial constraints, are currently more urgent, this research has clearly shown that this issue is one which will certainly become more pressing in the near future, and the sector will need to adapt to these changes. It is interesting to note that tri-Service (Armed Forces) charities rate this as their fifth highest challenge, above such issues as insufficient resources.
495 See Pozo and Walker (2014) for further details 496 This is rather a unique problem which is only shared with a few other occupational benevolent charity sectors

Navigating Change: A Review of the UK Maritime Welfare Charity Sector | 2017 195
10.2 FUTURE CHALLENGES FOR MARITIME WELFARE CHARITIES
It is extremely hard to look into the future and say with any certainty what may happen – the global recession is proof of this if any were needed. Nevertheless, there are indications of some of the types of issues which may arise in the evidence gathered in this report and in what is happening in the wider third sector. The future landscape is a challenging one for many charities.
The top 10 challenges (in no particular order) facing the MWC sector in the next ten to twenty years are likely
to be:
1. Resource issues – an unpredictable economy and decreasing awareness of the maritime (charity) sector (sea-blindness) amongst the general public are likely to contribute to income scarcity. At the same time, operating costs are likely to continue to increase at least in the short-term, meaning a squeeze on resources. With income growth being propped up by new charities and LIBOR funding, it is important to look beyond this ‘artificial growth’ picture and understand how the rest of the maritime charity sector is doing. In the wider charitable sector, donation stagnation has been predicted in the short-term497 with the general public reluctant to give to charities due to the uncertainty of the times, a reduction in ‘disposable’ income and the increased mistrust of charities (see point 6). NCVO has predicted a £4.6 billion annual shortfall in the wider third sector’s income over the next five years if current levels of spending are to be maintained498. This may hit small charities hardest, with some commentators even suggesting that a hard ceiling in public giving has been reached499. This could mean that charitable giving has now reached a stalemate, where increased giving to one charity or cause means decreased giving to another, increasing the competition between charities. Whether the maritime welfare charity sector continues to shore up its reserves for the longer-term or spend more now will become a key issue. Charities which have already been drawing down on funds held in reserve in order to keep pace with demand will not be able to do so indefinitely, and smaller charities which do so risk becoming financially unviable.
2. Changing beneficiary demographics / needs profile – the sector needs to be more adaptable and flexible to cater to the changing shape of its beneficiary population. Some groups (e.g. older MN and FF) are going to need a much greater proportion of resources devoted to them in order to fulfil the sector’s promises to its beneficiaries. These demographic changes have time-specific crunch points (between 2020 and 2035) which need to be planned for in advance. At the same time, the sector needs to be ready for unplanned increases in beneficiary need as a continued consequence of the global recession and instability in the economy as Brexit unfolds. The seafaring beneficiary population is projected to fall by around half by 2050 – is the sector prepared for both the short-term and the long-term?
3. Increasing demand - it will be up to individual charities to understand their own beneficiary group better and to try to anticipate demand levels and match them with the correct supply of support and services. For example, in the wider economy, measures to reduce the government deficit are also affecting services for children and families, such as the closure of some Sure Start Children’s Centres, funding cuts in youth work, and growing pressure on child and adolescent mental health services. These changes are likely to increase the need for maritime welfare charities to support dependants and families of seafarers500. Continued government austerity measures and welfare reform means cutbacks for many local and national welfare services, putting increased demand on charities to pick up the pieces. Some beneficiaries are likely to face worsening outcomes as a result of these processes, particularly the most vulnerable and those facing multiple disadvantages. Charities need to be up to speed on welfare reforms and how best to react and adapt to them. The Institute for Fiscal Studies estimates that planned cuts to welfare benefits and tax credits between 2016 and 2020 will mean no growth in the incomes of poorer households on average501. This is likely to affect a significant number of seafarers’ families, especially those with children502.
497 NCVO (2017a) 498 Ibid 499 The Foundation for Social Improvement (2017b); Ainsworth (2017b) 500 IPC (2016) 501 Institute for Fiscal Studies (IFS) (2015) 502 Roberts,R.,asreportedinTheIndependent(2017),200,000childrenfromthepooresthouseholdshitbybenefitcap

Navigating Change: A Review of the UK Maritime Welfare Charity Sector | 2017 196
4. An ageing population - pressure on health service budgets is likely to continue in the foreseeable future due to the ageing population and the growing number of people with long-term conditions, along with developments in medical treatments and technologies. Again, charities will probably have to take up some of the slack here, and/or will see worse issues in the long-term as people receive less support in the short-term. An ageing population will further compound challenges 1 to 3. An increase in incidences of dementia will necessitate a more focussed approach to elderly care services, and MWCs and other charities will need to be mindful of new legislation and guidelines around dementia care such as the National Dementia Declaration503.
5. Awareness raising (sea-blindness) and finding beneficiaries – unmet need in potential beneficiaries is very hard to quantify, but low awareness of maritime welfare charities amongst the seafaring population suggests that further efforts to alert potential beneficiaries to the support available may need to be made if the sector is to wholly fulfil its remit. The MWC sector will need to be in a position to cater for any increased need generated through heightened beneficiary awareness.
6. Decreased public trust and confidence in charities - charity scandals and bad publicity have led to a decline in public trust in charities generally, and this is likely to have long-lasting consequences. In the wake of these charity scandals there have been changes to fundraising regulations. A new fundraising regulatory regime was introduced in 2015504- the Public Fundraising Regulatory Association (PFRA) – which introduced stricter data protection (General Data Protection Regulation (GDPR)), controls regarding how charities can approach donors, and around sharing donor data with others. In addition, the new Charities Act, which received Royal Assent on 16th March 2016 and came into force by degrees during 2016, gives wide-ranging powers to the Charity Commission, including the power to remove Trustees and others following an inquiry, the power to direct winding up, the power to direct property to be applied to another charity and reserve powers to control fundraising. In order to stay on the right side of these new powers, charities need to be on the ball even more. Research suggests that this is not currently the case, with one fifth feeling ‘significantly unprepared’ for changes such as GDPR505.
7. Good governance – is fundamental to regaining trust in charities following the last few years of scandals. MWCs identified attracting good Trustees and Chairpersons as a pressing challenge and this is central to this issue. In order to steer the sector through the turbulence of the next few years, strong leadership from a strong Board will be essential. A new Governance Code has recently been released (for larger and smaller charities506) which outlines seven principles of good practice: Organisational purpose; Leadership; Integrity; Decision-making, risk and control; Board effectiveness; Diversity; and
Openness and accountability. These seven principles lie at the heart of all charities’ future effectiveness. Impact measurement should be part of good governance and will become increasingly important with the possibility that charities may in future be required by law to report their impact to the Charity Commission507. Good governance will also be key to securing future volunteer engagement which is an issue facing the wider third sector in the wake of publicity scandals, and may apply even more to the maritime charity sector due to increasing ‘sea-blindness’.
8. New technology and the digital divide – Maritime Autonomous Systems (MAS), and advances in digital and mobile technology are a double-edged sword for the maritime sector as elsewhere. Increased online connectivity can also lead to increased personal isolation. The digital divide is likely to increase as new technologies come into play, especially amongst older people and those with less formal education. Charities too can be left behind, and need to create a bridge between useful new technologies and less able beneficiaries. And while all charities are encouraged to have an online presence and to use social media, there need to be clear aims and objectives for these potentially resource-intensive activities.
503 http://www.dementiaaction.org.uk/nationaldementiadeclaration 504 The Review of Fundraising Self-regulation (2015) 505 Charity Finance and Fundraising Magazine survey available to subscribers only. Results summarised in Civil Society Magazine - Weakley, K. (2017) 506 Charity Governance Code Steering Group (2017a and b) 507 This was suggested to the Lords Select Committee on Charities 2017 but at this point in time reporting impact annually (to the general public) is recommended rather
than mandated

Navigating Change: A Review of the UK Maritime Welfare Charity Sector | 2017 197
9. Political and economic uncertainty – in the last ten years there have been two hung parliaments, and a divisive EU Referendum (or Brexit vote), which have opened up increased social divides, community incohesion and feelings of isolation in British society508. With changes of government come switches in the government/third sector relationship. The concept of ‘Big Society’ came and went. Local government spending on services is likely to face further cuts at least in the short-term, leading to increased likelihood of charities being expected to step into the void. Adding to the uncertainty in British society is the actual process of Brexit – the UK is currently on track to leave the EU in 2019. This is likely to lead to upheaval in many areas. The economy might be subject to significant turbulence dependent on the new trade deals secured with the EU and beyond. This could have very wide-ranging effects on the maritime sector – especially the Merchant Navy. Fishing quotas and other arrangements are already being affected as Britain has withdrawn from an agreement (the London Fisheries Convention) which allowed some foreign vessels to fish in British waters509. The impact of rising inflation also needs to be factored in to future financial planning.
10. Increasing imbalance in the sector – resources are unevenly spread across the maritime charity sector such that large charities and those primarily serving RNRM are richer, while smaller charities and those primarily serving MN and FF are poorer. Additionally, smaller charities everywhere (in the wider third sector) are facing ‘a hurricane of change’ and are less able to deal with it510. Small charities often deliver vital services at a community level and this crucial piece of the jigsaw could be lost if smaller charities are not better supported. In the wider third sector, the rise of ‘super major’ charities with incomes of over £100 million has been a phenomenon witnessed in the last few years. This concentration of resources in a very few giants inevitably skews the charitable provision landscape.
508 Ainsworth (2017a) 509 https://www.gov.uk/government/news/uk-takes-key-step-towards-fair-new-fishing-policy-after-brexit510 EvidentialConsulting(2017)

Navigating Change: A Review of the UK Maritime Welfare Charity Sector | 2017 198
10.3 RISING TO THE CHALLENGE
Section 9 highlighted how, while many maritime welfare charities are anticipating an increase in demand over the next 5 years, only a quarter believe that the sector is in ‘a good position’ to respond. Maritime charities are not alone in this, with almost one fifth of third sector charity chief executives claiming that their organisations are struggling to survive511. So, what can the MWC sector do to put itself in a better position going forward?
In coming to grips with possible solutions, it is important to understand that the challenges faced will be different for different MWCs depending on their size, the workforce they serve and the support they offer, and therefore solutions will also not be ‘one size fits all’.
1. Resource issues – there are a number of things maritime welfare charities can do in this area:
a. In order to guarantee financial sustainability, charities need to understand the marketplace and how funding sources are evolving.
b. Ideally charities need to have diversified income streams. This has long been true, but in the uncertain times we now find ourselves it is even more important. There are many examples of how income can be diversified, including:
i. by applying for funding grants outside of the sector,
ii. applying for LIBOR funding (which may be starting to be more available to the wider maritime sector following a successful bid by Seafarers UK in 2017),
iii. starting or increasing trading activities (which is the number one way in which the wider third sector has coped in the last decade)512 although entrepreneurial activity is easier for some charities than others (being particularly difficult for many smaller charities). 38% of charities in the wider third sector have diversified their income streams in the last twelve months, and 31% intend to do so in the next twelve months513.
c. Charities need to be sure that they are claiming all the tax reliefs they are entitled to.
d. If new income streams can’t easily be found, then existing income streams could be increased, for example by charging more for services. In the wider third sector, this has driven the growth in income over the last five years, although in the longer term it may become unsustainable.
e. The most important factors in larger fundraising charities successfully riding out the recession were identified as investment in regular donors and major giving and pro-active, innovative fundraising approaches responsive to public mood and including new media use514.
f. Using funds held in reserve ‘wisely’ - either saving or spending according to predicted need (see Sections 4 and 5). Assets and liabilities need to be mapped and factored into financial planning515. ‘Prudent oversight entails balancing the demands of current and future beneficiaries against the current and future asset base of the Fund and ought to be reviewed by Trustees on an annual basis.516’
g. Increased volunteer engagement - volunteers can help carry the burden when staff resources are stretched, but they need to be appropriately skilled and well managed.
h. Consolidation - mergers and acquisitions might be appropriate in response to increased demand, and should be considered according to the Charity Governance Code if charities are doing similar work to each other517. Equally, charities should consider winding up if other charities are fulfilling their remit more effectively518. Planning ahead can avert such situations or make them easier, rather than merging as a response to financial distress, as many charities have done in recent years519. Done properly, mergers have been proven to add value for many organisations520. On the other hand, there is often strength in diversity and a balance must be achieved between these two options to create the most effective MWC sector.
511 CharitiesAidFoundation(2017).Thisnumberrisestooneinfouramongstsmallercharitieswithincomesoflessthan£1million512 NCVO (2017a) 513 Charities Aid Foundation (2017) 514 Pharoah, C (2017)515 NCVO (2017b)516 Belai, J. Association of Charitable Organisations (ACO) (2013)517 Charity Governance Code https://www.charitygovernancecode.org/en 518 Ibid 519 Gutch,R.,ProspectusandEastside(2012)520 Ibid

Navigating Change: A Review of the UK Maritime Welfare Charity Sector | 2017 199
2. Changing beneficiary demographics / needs profile – we’ve seen in Sections 1 and 9 how new groups of seafarers are coming into play, and MWCs will have to decide whether they need to rethink eligibility criteria for support to include these new groups such as international seafarers, offshore workers and support ship crews, and cruise ship staff. In fact, it could be time to revisit such fundamentals as charitable objects and geographical remit in order to maximise impact. More individualised packages of support are also likely to be needed in future, including specialist advice and counselling and more accessible on-board and port-based welfare.
3. Increasing demand – with more pressure on resources, grant-makers will need to become increasingly adept at stretching support. One approach adopted in the wider third sector, as well as the MWC sector, is a Funder Plus approach whereby funders also help grantees to access other sources of help and/or using matched funding, and pooled funding. More holistic solutions which other occupational benevolent charities have utilised (outlined in Section 4) include signposting to other (non-financial) help, engaging with more upstream solutions, and collaborating with other organisations to offer a more comprehensive package of care at no extra cost. Another solution for grant-makers would be the introduction of more
rigorous needs assessment - many MWCs and other occupational benevolent charities use Minimum Income Standards and other formal assessment tools to determine eligibility. These may need to be adapted to changing circumstances and new groups of potential beneficiaries. Charities should also consider how to assess unmet need521. Better planning can also lead to more collaboration522. The concentration of resources in the large grant-makers in the MWC sector, compared with dwindling income from other sources, means that they are more strategically important and should consider their position as enablers of the sector, driving forward change in collaboration and co-operation with others.
4. An ageing population – as many people living longer will have increasingly complex needs, more specialist care is going to be needed, whether that’s through grants for healthcare equipment and support or through accommodation provision. No one single initiative can meet the challenges faced, instead the MWC sector needs to adopt a number of complimentary activities to provide seafarers with a ‘life-cycle of care’. Rather than building more seafarer-specific accommodation, beneficiaries may be better served by other housing initiatives with the potential to help a greater number of seafarers, within a more immediate timeframe, for example, re-purposing existing facilities, flexing the type of support services offered, and working with other mainstream specialist housing providers to meet the anticipated short to medium term escalation in need.
5. Awareness raising (sea-blindness) and finding beneficiaries - ‘sea-blindness’ is perceived to be a huge threat to the sector both now and in future and there needs to be a co-ordinated plan to deal with this (see Section 9). Consideration could be given to a sector-wide /funded ‘above the line’ TV or radio promotional campaign, potentially building upon existing activities such as Seafarers Awareness Week. In the last twelve months, more charities in the wider third sector have increased their social media presence, activity and/or campaigns than any other operational measure523. In this light, online campaigns, information provided via employers or mainstream charities (e.g. Age UK, Alzheimer’s Society, CAB, etc.) and/or traditional print materials may be more appropriate and effective than ‘above the line’ advertising given the individual target audiences across the maritime sector. Similarly, having a visible presence in areas where seafarers in need might be located, and word-of-mouth, remain essential advertising tools.
6. Decreased public trust and confidence in charities - the good news is that the maritime sector may be able to piggy-back on the trust that the general public place in their sister sector, the Armed Forces. A
recent poll found that 70% of people trusted the Armed Forces a great deal or quite a lot, compared to the 64% that trusted charities in this way524. In the same way, increased association with charities such as the RNLI which are popular with the general public (currently the sixth most popular UK charity525),
could help to engender more trust in and a higher profile for the maritime sector.
521 Belai, J. Association of Charitable Organisations (ACO) (2013) 522 Belai, J. Association of Charitable Organisations (ACO) (2013) found that 55% of members surveyed reviewed their strategy annually and 54% had entered into a
collaboration or partnership 523 CharitiesAidFoundation(2017).67%ofCEOsreporteddoingthisinthelast12monthsand18%intendtodosoinnexttwelvemonths524 nfpSynergy (2017) 525 Pharoah, C. (2017)

Navigating Change: A Review of the UK Maritime Welfare Charity Sector | 2017 200
7. Good governance – strategic reviewing and planning is a big part of good governance, and can potentially help charities to access new funding and develop their key objectives526. The Charity Commission regards the ability to plan ahead the critical factor in enabling charities with financial difficulties to recover527. Understanding their operating model, how dependent they are on each income stream and what their end goals are is a crucial first step in moving forward more effectively. Impact measurement may be a legal requirement in future, so it will be just as well for charities to get their heads round it now as it seems unlikely to go away. It may be that sectoral guidance and a relatively uniform approach could help comparability across the maritime sector in the same way that the Independence Star has been developed for the Armed Forces charity sector. An overall MWC sector approach could particularly help smaller charities which have fewer resources to devote to developing their own metrics and need more support from e.g. infrastructure bodies528. Mapping the charity’s capabilities and capacities can help the Board to understand where investment may need to be made in order to enable better sustainability.
8. New technology and the digital divide – investing in new technologies / IT and online solutions will clearly be necessary in some areas, and advisable in others. More than half of charities in the wider third sector have invested in new technology in the last twelve months529. Charities will also need to invest in training for staff to operate new IT and online systems. New technology well implemented can increase giving as well as reaching more beneficiaries. Many MWCs have already invested in IT, but more investment may be necessary in the future.
9. Political and economic uncertainty – being prepared is the best way to handle future uncertainty in this domain, which includes good governance and wise use of resources. Pro-actively lobbying government with one voice might also put the maritime sector in a stronger position.
10. Increasing imbalance in the sector – clearly the MWC sector needs to refocus on the needs of MN and FF in order to avoid a significant shortfall in support for these seafarers. For example, those organisations which have a purview across RNRM, MN and FF could realign some resources in favour of MN/FF. There may also be a duty of care by larger charities in the MWC sector towards smaller ones. While larger charities are more able to take pro-active, responsive and innovative approaches to hard times530 smaller charities may struggle to do so, and so a ‘whole sector’ response to issues may bring further strength to all maritime charities. A recent review of wider third sector small and medium charities concluded that government, funders and large charities must change the way they operate, and stop competing with small charities, in order to encourage and support a more diverse sector531. Many believe that small charities can be much more effective and innovative in the community and that working with, rather than against, small charities would create a stronger sector.
526 Niven, R., The Guardian (2012)527 EvidentialConsulting(2017)528 NAVCA (2016) 529 57% have done so in the last twelve months and 22% intend to do so in the next twelve months, Charities Aid Foundation (2017) 530 Pharoah, C. (2017) 531 EvidentialConsulting(2017)

Navigating Change: A Review of the UK Maritime Welfare Charity Sector | 2017 201
10.4 A WHOLE SECTOR APPROACH
A review of the available evidence suggests that the wider third sector in general seems to be further ahead of the curve than the maritime charity sector in reacting to the changing environment and the ‘new normal’ following the upheaval of the last decade. In order for the MWC sector to catch up, a number of the actions outlined above might be undertaken by individual charities. However, there are a number of areas where the sector acting as a whole might be stronger.
One such area is greater co-operation and collaboration - both across the maritime sector and beyond – which could be key to unlocking a better shared future for maritime welfare charities. This includes sharing information and best-practice, and co-ordinating responses (e.g. via partnership working). In this way, better support for beneficiaries might be achieved and the MWC sector might become more future-proofed. In the wider third sector, 61% of charities have collaborated or partnered with another not-for-profit organisation in the last twelve months, and 15% intend to do so in the next twelve months. Amongst other benevolent grant-makers, 55% have streamlined their grant-making process through collaboration with other funds532. The examples of collaboration between other occupational benevolent charities in Section 4 show how effective this approach can be in creating synergies, making scarce resources go further and even finding innovative solutions to issues.
Collaboration can take many forms, including sharing facilities such as office space and functions, training, IT support, case-work and sharing of best practice, learning and fundraising. ACO notes that: ‘real synergies are garnered through the pooling together of expertise and key resources that complement each other as opposed to mirroring each other’533.
The MWC sector is not alone in this. A recent review of how the wider third sector is responding to the global recession and austerity measures found that ‘one of the biggest gaps in how the sector has responded to funding cuts is in the sharing of knowledge, ideas and best practice on how to respond’534. The review suggested that the sector should ‘create bodies to represent specific sectors’, pointing out that, among the interviewees, those organisations which had a sector body representing their specific needs appeared to be better able to campaign against cuts or ameliorate their impact535.
TEN YEARS ON…
It is ten years since the then Maritime Charities Funding Group (now the Maritime Charities Group) undertook the ground-breaking review into the needs and aspirations of the UK seafaring community, ‘Supporting Seafarers and Their Families: challenges for the future’. The 2007 review made over forty individual recommendations for the development of services and policies within the UK Maritime Charity Sector. Many of these recommendations have been tackled in part or in whole by individual charities and/or by working groups. Some of these recommendations pertained specifically to youth services and were taken forward by appropriate organisations such as the Marine Society and Sea Cadets. Over the last ten years, thirty-two recommendations have been reviewed by the MNWB Working Groups on ‘Older Seafarers and their Families’ and ‘Serving Seafarers’, with progress against each outlined in their recent reports536. Much has already been achieved, but much remains to be done.
Several key initiatives have resulted from the 2007 research recommendations, including the establishment of ‘Seafarer Support’537, demographic reviews of the seafarer population and research into seafarer needs, further development of SAIL538, the introduction of more ‘holistic’ case-working, and the alignment of
532 Belai, J. Association of Charitable Organisations (ACO) (2013)533 Ibid534 nfpSynergy (2016) 535 Ibid536 MNWB (2017a and b) 537 ‘Seafarer Support’ is an interactive website/telephone service managed by MNWB and funded by members of the MCG which lists all maritime charities, contact details
and the support provided, based on the Maritime Charities Welfare Guide538 SAIL is the Seafarers’ Advice and Information Line

Navigating Change: A Review of the UK Maritime Welfare Charity Sector | 2017 202
grant-making processes across sector funders539. However, other recommendations - around impact measurement, awareness raising and the continued roll-out of case-working - require more progress. As highlighted previously, increased communication and collaboration, both within the maritime charity sector and beyond, may be key to further developments in these and other areas of future concern.
In assessing whether the maritime welfare charity sector is currently fit for purpose, and also whether the sector is flexible and adaptive to changing needs, this research finds that while many maritime beneficiaries are adequately supported, and many innovations have been implemented, it has been difficult for the sector to deal with all of the changes thrown at it by the demographic, economic and societal upheaval of the last decade. This means that some groups of beneficiaries require further support from the MWC sector, particularly MN and FF beneficiaries and their dependants. In some areas, the MWC sector appears to be operating at the forefront of innovation and good practice, while in other areas it lags behind the wider third sector and other occupational benevolent sub-sectors.
Nearly three-fifths (58%) of the maritime charities participating in this research programme in 2017 were familiar with the 2007 ‘Supporting Seafarers and their Families’ report, whilst two-fifths (42%) were unfamiliar540. Familiarity is lowest amongst smaller charities; a third (35%) of charities with an income below £100,000 are familiar with ‘Supporting Seafarers’ compared to over nine in ten (94%) of charities with an income of over £1million541. There is little variation in familiarity by seafarer group served, with 58% MN, 60% RNRM and 61% FF charities542.
FIGURE 10.2
How familiar are you with the 2007 ‘Supporting Seafarers’ review and resultant report?
A few respondents highlight how not all MWCs chose to take the report’s recommendations on-board.
Some of the other charities, I’m not sure if you’d taken a snapshot ten years ago, and taken a snapshot today, whether they would look much different, if indeed, they’re any different at all. They may have changed the amount of money that they give in regular grants or one-off grants, but they’re still doing what they’ve always done
[MN, £1M-£5M]
Despite a 10-year interval, many of the issues raised throughout this report will be familiar to readers of the 2007 ‘Supporting Seafarers’ report. Time is moving on, and maritime welfare charities now need to face some of the fundamental questions raised by both reports – addressing them with a cohesive and co-ordinated strategy - before changes in the maritime world and beneficiary population force the sector’s hand. Such things cannot wait another ten years.
539 A full account of progress on the 2007 Supporting Seafarer recommendations has been produced by MNWB and can be found in the Working Group 2017 reports located at: http://www.mnwb.org/Publications
540 Online and tele-depth interviews (all Maritime charities responding, n=57)541 Ibid,(allMaritimecharitieswithastatedincomeof:lessthan£100,000,n=17/morethan£1million,n=17–itshouldbenotedthatthisgroupcontainsfourMCGmember
organisations, although even when excluding them, familiarity remains high at 92%)542 Ibid,Maritimecharitiesmayservemorethanonebeneficiarygroup,andsotheirresponseswillappearineachofthesegmentsserved(allMaritimecharities
responding, RNRM=30, MN=41, FF=31)
10.1
10.2
35%
5%
20%
20%
10%
25%
50%
5%
25%
60%
30%
0%
30%
45%
40%
11%
15%
15%
15%
17%
17%
17%
20%
24%
26%
33%
35%
35%
43%
65%
Changing beneficiary profile / needs
Lack of appropriately skilled staff
New government legislation/regulation
Reduction in public / gov. funding
Securing volunteer engagement
Insufficient resource
Meeting demand for services
Remaining true to our mission
New tech - online/mobile solutions
Increasing costs
Measuring & demonstrating impact
Securing new Trustees / Chairman
Identifying / finding beneficiaries
Generating income / sustainability
Raising awareness about charity / cause
Maritime Charities (n=46)
Tri-Service Charities (n=20)
25% 18% 23% 35% Familiarity with 'Supporting
Seafarers' 2007
Not at all familiar Not very familiar Familiar Very familiar
42% 58%
% Unfamiliar
% Familiar
Familiarity with ‘Supporting Seafarers’ 2007

Navigating Change: A Review of the UK Maritime Welfare Charity Sector | 2017 203
Time is moving on, and maritime
welfare charities now need to face some of the fundamental questions
raised... such things cannot wait another ten years

Navigating Change: A Review of the UK Maritime Welfare Charity Sector | 2017 204

Navigating Change: A Review of the UK Maritime Welfare Charity Sector | 2017 205
ME
TH
OD
OL
OG
Y

Navigating Change: A Review of the UK Maritime Welfare Charity Sector | 2017 206
METHODOLOGYIn producing Navigating Change: A Review of the UK Maritime Welfare Charity Sector, The Researchery adopted three main approaches:
1. Desk research
2. Quantitative data analysis
3. Fieldwork and qualitative analysis
1. DESK RESEARCH
Our report aims to bring together the breadth of information available about the maritime charity sector, and the charitable needs of seafarers. As part of this, an extensive desk-research exercise was undertaken, with the research team amassing, sorting and assessing the information available, including research studies conducted by individual charities and over-arching third sector bodies, as well as government information and statistics.
A full list of the numerous studies and information sources reviewed and included as supporting evidence within this report can be found in the Bibliography.
The report references in some detail three other projects commissioned by the Maritime Charities Group to identify demographic changes in the maritime beneficiary population and to establish seafarers’ needs:
• Institute of Public Care (2015) ‘UK Seafarers’ Demographic Profile’. This study used official statistics, expert opinion and statistical modelling to describe and predict the maritime workforce and their dependants 1945-2050. The research comprised:
- Initial scoping: conversations with experts in the field on future trends in the maritime workforce in the UK to help develop thinking about potential numbers between now and 2050 across the three workforce groups (RNRM, MN, FF) in the UK. These interviews also helped to identify additional sources of relevant data.
- Data sources and analysis: a review of the earlier 2007 MCFG demographic analysis produced to support the ‘Supporting Seafarers’ report and other relevant literature, including published reports and surveys, activity and pension data. Where there were gaps in the data, national data were used instead, for example: on life expectancy from the Office of National Statistics; on prevalence of ill-health and disability from prevalence rates used in the POPPI and PANSI information systems, to develop projections.
- Some data were not available, or not sufficiently detailed. This was a particular issue with the Fishing Fleet and to a lesser extent with the Merchant Navy. This meant that in some areas projections are based on a series of assumptions.
The full IPC report can be found at: https://ipc.brookes.ac.uk/publications/publication_806.html
• Opinion Research Services (2016) ‘Older Seafarers’ Needs’. This study used surveys of and telephone interviews with older seafarers and their dependants and carers to build a picture of the current and potential future needs of this group. The research comprised:
- Postal survey: 872 completed and valid surveys from 5,000 (17.4% response) sent to members of: Royal Naval Association, The Fishermen’s Mission, Shipwrecked Mariners’ Society, Merchant Navy Officers Pension Fund, Merchant Navy Ratings Pension Fund and Ensign Pensions. All questionnaires were sent to (retired or non-retired) seafarers aged 60 or over as well as their dependants who were aged 16 and over. The authors note that the questionnaires were not distributed systematically and as such the respondent profile is an imperfect reflection of the older seafaring population, thus comparisons must be interpreted carefully and are indicative only.
- In-depth telephone interviews: 50 one-hour interviews with 52 individuals who were seafarers, or

Navigating Change: A Review of the UK Maritime Welfare Charity Sector | 2017 207
their carers, widows or other dependants (30 seafarers, 18 widows, 16 carers and one dependant)1. Respondents were recruited through the following maritime organisations: The Fishermen’s Mission, Nautilus International, Seafarers’ Link, The Royal Naval Association (RNA) and The Royal Navy Widows Association (RNWA).
The full ORS report can be found at: http://www.seafarers.uk/wp-content/uploads/2017/08/Maritime-Charities-Group-Older-Seafarers-Needs-Report.pdf
• Institute of Public Care (2016) ‘The needs and aspirations of the dependants and families of seafarers under retirement age’. This study involved face-to-face and telephone interviews with key stakeholders and an electronic survey of families and dependants of seafarers under retirement age to describe the current and future needs of this group. The research comprised:
- Review of relevant public policy context
- In-depth face-to-face and telephone interviews with key stakeholders: fifteen interviews with members of the Maritime Charities Group and a range of other maritime charities and welfare bodies: Aggie’s, The Fishermen’s Mission, Greenwich Hospital, Nautilus UK Welfare Fund, Naval Families Federation, RN and RM Children’s Fund, RBL, The Royal Liverpool Seamen’s Orphan Institution, Royal Merchant Navy Education Foundation, The Royal Navy Benevolent Trust, RNRM Welfare Team, Sailors’ Children’s Society, Shipwrecked Mariners’ Society, SSAFA, WRNS BT.
- Quantitative online survey: 538 completed surveys with families and dependants of working age seafarers, including beneficiaries. The survey was distributed by members of the Maritime Charities Group and a range of other maritime charities and welfare bodies via email, text, Facebook, Twitter and post. Seventy-three per cent of responses came from people with connections to the Royal Navy and Royal Marines, 16% from those with connections to the Merchant Navy and 5% with connections to the Fishing Fleet (and 6% other). While there was an over-representation of respondents with RNRM connections, possibly due to the greater number of RNRM charities, the responses were felt to represent a sound basis for conclusions about this group of beneficiaries and potential beneficiaries.
The full IPC report can be found at: http://www.seafarers.uk/wp-content/uploads/2017/08/Maritime-Charities-Group-The-Needs-and-Aspirations-of-the-Dependants-of-Seafarers-Under-Retirement-Age-Report.pdf
2. QUANTITATIVE DATA ANALYSIS
The present quantitative analysis reported here comprises four parts:
• Identification of the Maritime Welfare Charity (MWC) sector, whose primary focus is on providing welfare support to maritime beneficiaries (N=81). This involved scrutiny of a number of sources: the Merchant Navy Welfare Board (MNWB) Maritime Charities Welfare Guide, a review of Armed Forces Charities (Pozo and Walker (2104)), the online list of current Armed Forces charities (www.armedforcescharities.org.uk), a review of Armed Forces Charities in Scotland (Cole and Traynor (2016)), and Seafarers’ UK grantee list plus input from the Maritime Charities Group (MCG). Each individual charity was examined to make sure that they met the following criteria: UK-registered charity providing welfare (‘relief in need’) support primarily to a wide group2 of maritime beneficiaries (RNRM, MN, FF). Tri-Service (Armed Forces) charities (providing some support to RNRM and sometimes MN) were considered separately.
• Analysis of the finances of maritime welfare charities (MWCs). Annual income and expenditure figures for each individual charity were extracted from the Charity Commission for England and Wales from an extract of charity accounts available under the Open Government Licence v3.03, and from the website of the Office of the Scottish Charity Register (OSCR) and from the Charity Commission for Northern Ireland. Information was extracted for the last ten years, 2005-2015, where available.
1 Individuals could fall into more than one category, and so these numbers total to more than the 52 individuals interviewed.2 Notconfinedtothecrewofonevesselorbase.3 TheauthorsaregratefulbothtotheCharityCommissionforEnglandandWalesforprovidingthisextract,andtoChrisRossofSoundtechSolutionsLtdwhoprovided
theSQLknow-howtoextractthedata,andfinallytoNCVOforprovidingusefulnotesonhowtoapproachthisprocess(https://data.ncvo.org.uk/a/almanac17/how-to-create-a-database-for-charity-commission-data/).

Navigating Change: A Review of the UK Maritime Welfare Charity Sector | 2017 208
• In addition, for charities with incomes over £500,000 their full financial accounts (Part B) were extracted and analysed, over ten years where available. This was input individually for all Scottish charities and for charities where only one part of their income and expenditure fell under the MWC bracket (e.g. Trinity House Maritime Charity/The Corporation of Trinity House of Deptford Strond and Greenwich Hospital (excluding the Royal Hospital School)). A number of samples were drawn for analysis:
- 81 MWCs providing total income and total expenditure data in 2015;
- 48 MWCs providing total income and total expenditure data over ten years (2005-2015), and accounting for 48% of the MWC sector’s income and 46% of its expenditure4;
- 29 MWCs with incomes over £500,000, providing full financial details (Part B) in 2015, and accounting for 95% of the MWC sector’s income and 94% of its expenditure;
- 22 MWCs with incomes over £500,000, providing full financial details (Part B) over ten years (2005-2015), and accounting for 71% of the MWC sector’s income and expenditure;
- 43 MWCs selected by size, providing total income and total expenditure data 2005-2015 - 15 small charities (income less than £100,000), 17 medium charities (income between £100,000 and £1 million), and 11 large charities (income over £1 million) - and accounting for 56% of the MWC sector’s income and 55% of its expenditure;
- 27 MWCs selected by size, providing full financial details (Part B) over ten years (2005-2015) - 7 small charities (income less than £100,000), 11 medium charities (income between £100,000 and £1 million), and 9 large charities (income over £1 million) - and accounting for 28% of the MWC sector’s income and expenditure;
- 30 MWCs selected by quota sample as per qualitative interviews whose Reserves Policies were scrutinised.
To set the MWC sector in context, an analysis of the UK third sector as a whole between 2005-2015 was also undertaken for which the source of data was mainly the NCVO’s Civil Society Almanac from 2005-2016.
NOTES ON REPORTING
While The Researchery has taken every care to ensure the accuracy of the data and analysis presented, the usual caveats apply, including that:
• all data supplied by registered charities in their annual report and accounts, to the Charity Commission, or on their websites, remains the responsibility of those charities;
• methodological differences to the ones described above could produce different results;
• our analysis regarding the role and practices of individual charities and groups of charities is subject to some degree of individual interpretation based on our understanding of the evidence available.
3. FIELDWORK AND QUALITATIVE ANALYSIS
In order to corroborate and better inform the quantitative analysis, The Researchery also undertook bespoke primary research, in the form of in-depth interviews and an online survey.
3.1 IN-DEPTH INTERVIEWING
• In-depth interviews with Maritime Charities Group members: Seven MCG members took part in face-to-face interviews lasting around one hour: Greenwich Hospital, Merchant Navy Welfare Board (MNWB), Nautilus Welfare Fund, Royal Navy and Royal Marines Charity (RNRMC), Seafarers Hospital Society, Seafarers UK and Trinity House. Interviews took place in December 2016 and January 2017 and used an outline ‘topic guide’ to encourage an open and discursive conversation. As well as directly
4 In order to see long-term trends over ten years it was necessary to delete from the sample any charity which didn’t provide data in any one year (either because it did not exist at that point or for any other reason). In this way, individual charity trends may have been missed, but an overall view of the sector is achieved.

Navigating Change: A Review of the UK Maritime Welfare Charity Sector | 2017 209
contributing to this report, insights from the MCG interviews were used to frame the themes and issues covered in the MWC telephone interviews which followed.
• Tele-depth interviews with other maritime charities: 30 in-depth interviews, conducted over the phone and taking, on average, 45-60 minutes were conducted between February-April 2017. Those approached for interview were selected by The Researchery in order to ensure good representation of charities providing support to beneficiaries from each of the three maritime communities: Royal Navy and Royal Marines, Merchant Navy and Fishing Fleet, as well as the different types of support provided (Advice, Support, Financial, Accommodation), size of organisation by revenue and geographical coverage. Interviews were recorded (with permission of the interviewee), transcribed in full and analysed for common themes, concerns and issues arising. Verbatim quotations from these interviews are presented throughout the report to illustrate points made in the text commentary. Quotations are identified by the beneficiary types supported by the organisation (RNRM / MN / FF) and a broad revenue band to provide some idea of organisation size. In addition to the open discussion, some ‘agree/disagree’ statements rated on a 10-point numeric scale were asked during the interviews, the results of which were combined to provide an aggregated view alongside the responses from the online survey. Participant organisations, which we would like to thank for giving their time, are:
NOTES ON REPORTING
The views expressed in the qualitative outputs may or may not be accurate as accounts of the facts. The Researchery cannot arbitrate on the correctness or otherwise of people’s views when reporting them.
The Researchery has reported the verbatim comments as given and does not necessarily endorse the opinions presented.
3.2 ONLINE SURVEY
Using the insights from the tele-depth interviews, a structured online questionnaire was designed from which to elicit quantitative results for key areas of interest and concern. The questionnaire was administered online via the SurveyMonkey research platform. Prior to launch, the survey was tested by a number of maritime charity personnel to ensure that the questions made sense, were of relevance and interest, and
Apostleship of the Sea
Dame Agnes Weston’s Royal Sailors’ Rests (Aggie’s)
Go Commando
ISWAN
King William IV Naval Foundation
Liverpool Seafarers Centre
Lowestoft Fishermen’s and Seafarers’ Benevolent Society
Marine Society and Sea Cadets
Merchant Navy Association
Royal Merchant Navy Education Foundation
Royal National Mission to Deep Sea Fishermen (The Fishermen’s Mission)
SAIL: Seafarers’ Advice and Information Line
Sailors’ Children’s Society
Scottish Nautical Welfare Society
Scottish Shipping Benevolent Association
Shipwrecked Fishermen and Mariners’ Royal Benevolent Society
Sir Gabriel Wood’s Mariners’ Home
SSAFA
The Honourable Company of Master Mariners and Howard Leopold Davis Charity
The Merchant Seamen’s War Memorial Society (CareAshore)
The Mission to Seafarers
The Royal Alfred Seafarers’ Society
The Royal Liverpool Seamen’s Orphan Institution
The Royal Maritime Club
The Royal Naval Benevolent Trust
The Sailors’ Orphan Society of Scotland
The Watch Ashore
The White Ensign Association
Tyne Mariners’ Benevolent Institution
Women’s Royal Naval Service Benevolent Trust

Navigating Change: A Review of the UK Maritime Welfare Charity Sector | 2017 210
that the task was not too onerous. The survey took approximately 20-30 minutes to complete on average, the exact length being dependent on each individual’s responses, and the extent of activities undertaken by their charity. Where identifiable, email invites were addressed to the Chief Executive or Chairman of each charity, alternatively the key contact as per the charity’s website or Charity Commission contact details were used.
Invites to the survey were sent to 775 Maritime Welfare Charities on 13 April, and to 41 tri-Service Armed Forces charities on 20 April. The survey closed on 30 May, with 46 MWC and 20 tri-Service interviews completed (60% and 49% response respectively). In combination with the tele-depth and MCG interviews, a total of 61 maritime related organisations took part in the research programme.
The sample profile of the participant charities is shown in the table below:
No. supporting each beneficiary type*
TOTAL RNRM MN FF
Total Maritime (online and in-depth) ^ 61 31 42 31
Maritime completing the online survey 46 25 30 20
Total tri-Service completing the online survey 20 20 14 6
TOTAL Maritime and tri-Service interviews 81 51 56 37
* Respondents stated within the interview which maritime beneficiary groups their charity supports. Charities can support more than one beneficiary group, and so this over-adds against the total number of interviews conducted
^ Some respondents completed both an in-depth interview (MCG or wider MWC) and the online survey. This total excludes any duplicate participants: 61 is the total number of individual maritime organisations that participated across all elements of the research programme
NOTES ON REPORTING
In absolute interview numbers, sample sizes are sometimes small, for example, when reporting purely on accommodation providers or block grant-givers. However, across all interview methods, 61 maritime charities participated in the research in total, which represents three-quarters of the total MWC sector identified as 81 organisations. Even the numbers participating in the online survey (46) represent over half of the MWC sector. There is, therefore, every reason to believe that the findings presented are reasonably representative of overall opinions and concerns across the MWC sector.
The online survey was completed by both Maritime and tri-Service Armed Forces organisations. In most cases, the Maritime charity results are reported, given their specific focus on seafarers. However, differences in tri-Service results are flagged as appropriate, and in some cases where sample sizes are smaller (e.g. for accommodation provider results), Maritime and tri-Service results may be combined. The audience(s) covered and samples size for each result are provided as footnotes throughout the report.
Some of the same quantitative measures (i.e. agree/disagree statements scored out of 10) were asked in both the MWC tele-depth interviews and the online survey, so results have been combined wherever possible to provide a more robust sample size on which to report these measures. For those individuals that completed both a tele-depth and online interview, the numeric measure from the online survey has been used as this was completed more recently.
Not everyone completing the online survey choose to answer all questions, and so results are reported on all ‘responding’ to a particular question, rather than total respondents.
Where percentages do not sum to 100%, this may be due to rounding, the exclusion of ‘don’t know’ categories, or multiple answers.
For agree/disagree statements rated on a scale of 1-10, we have taken 7-10 as our active ‘agree’ measure, and 1-4 as our ‘disagree’ measure, with 5-6 being seen as more neutral/ambivalent.
5 Of the 81 charities that comprise the MWC sector, two had no email address or telephone contact details and so were unable to be included, whilst a further two shared the same respondent as another related charity/fund within the sample

Navigating Change: A Review of the UK Maritime Welfare Charity Sector | 2017 211
AP
PE
ND
ICE
S

Navigating Change: A Review of the UK Maritime Welfare Charity Sector | 2017 212
APPENDIX 1
TABLE 11.1
Estimated and projected numbers in ‘The Seafaring Community’ 2005-2015 (thousands)1
2005i Total Royal Navy and Royal Marines
Merchant Navy Fishing Fleet
Servingii 79 - 88 40iii 27iv - 32v 13vi - 16vii
Formerviii 707 - 757 530 - 565 123 - 132 ix 54 - 60x
Former (working age)
260 - 272 170 -175 xi 63 -67 xii 27 - 30 xiii
Former (ret irement age)
447 - 485 360 -390 xiv 60 -65 xv 27 - 30 xvi
Dependantsxvii 551 - 593 375 -395 120 -133 xviii 56 - 65
Dependent adults 190 - 204 (under ret irement age)
215 - 232 (older)
405 - 436 (total)
1 15 - 120 (under ret irement age)
170 - 180 (older)
285 - 300 (total) xix
52 - 58 (under ret irement age)
30 -35 (older)
82 – 93 (total) xx
23 – 26 (under ret irement age)
15 -17 (older)
38 – 43 (total) xxi
Dependent children 146 - 157 90 - 95 xxii 38 - 40 xxiii 18 - 22
Total 1 ,337 - 1 ,438 945 - 1 ,000 270 - 297 123 - 141
2015xxiv Total Royal Navy and Royal Marines
Merchant Navy Fishing Fleet
Serving 75 33xxv 30xxvi 12.5 xxvii
Former 614 368xxviii 151 xxix 96xxx
Former (working age)
258 165 57 36
Former (65+) 357 202xxxi 94 60
Former (85+) 67 55xxxii 7 5
Dependants 662 390xxxiii 171 xxxiv 101 xxxv
Dependent adults 173 (under ret irement age)
298 (older)
471 (total)
103 (under ret irement age)
169 (older)
272 (total)xxxvi
45 (under ret irement age)
79 (older)
124 (total)
25 (under ret irement age)
50 (older)
75 (total)
Dependent children 191 1 18xxxvii 47 26
Total 1 ,351 790 352 209
2020 Total Royal Navy and Royal Marines
Merchant Navy Fishing Fleet
Serving 71 30xxxviii 28 12.5
Former 539 312 141 86
1 Figures have been rounded to the nearest thousand. Any summation errors therefore may be due to rounding. *‘Dependentadults(underretirementage)’definedasdependantadultsofseafarersandformerseafarersunder65 **‘Dependentadults(older)’definedaswidowsaged65+andadultdependantsofformerseafarersaged65+

Navigating Change: A Review of the UK Maritime Welfare Charity Sector | 2017 213
TABLE 11.1 cont.
2005i Total Royal Navy and Royal Marines
Merchant Navy Fishing Fleet
Servingii 79 - 88 40iii 27iv - 32v 13vi - 16vii
Formerviii 707 - 757 530 - 565 123 - 132 ix 54 - 60x
Former (working age)
260 - 272 170 -175 xi 63 -67 xii 27 - 30 xiii
Former (ret irement age)
447 - 485 360 -390 xiv 60 -65 xv 27 - 30 xvi
Dependantsxvii 551 - 593 375 -395 120 -133 xviii 56 - 65
Dependent adults 190 - 204 (under ret irement age)
215 - 232 (older)
405 - 436 (total)
1 15 - 120 (under ret irement age)
170 - 180 (older)
285 - 300 (total) xix
52 - 58 (under ret irement age)
30 -35 (older)
82 – 93 (total) xx
23 – 26 (under ret irement age)
15 -17 (older)
38 – 43 (total) xxi
Dependent children 146 - 157 90 - 95 xxii 38 - 40 xxiii 18 - 22
Total 1 ,337 - 1 ,438 945 - 1 ,000 270 - 297 123 - 141
2015xxiv Total Royal Navy and Royal Marines
Merchant Navy Fishing Fleet
Serving 75 33xxv 30xxvi 12.5 xxvii
Former 614 368xxviii 151 xxix 96xxx
Former (working age)
258 165 57 36
Former (65+) 357 202xxxi 94 60
Former (85+) 67 55xxxii 7 5
Dependants 662 390xxxiii 171 xxxiv 101 xxxv
Dependent adults 173 (under ret irement age)
298 (older)
471 (total)
103 (under ret irement age)
169 (older)
272 (total)xxxvi
45 (under ret irement age)
79 (older)
124 (total)
25 (under ret irement age)
50 (older)
75 (total)
Dependent children 191 1 18xxxvii 47 26
Total 1 ,351 790 352 209
2020 Total Royal Navy and Royal Marines
Merchant Navy Fishing Fleet
Serving 71 30xxxviii 28 12.5
Former 539 312 141 86
Former (working age)
213 144 44 25
Former (65+) 326 169 97 60
Former (85+) 59 44 9 6
Dependants 585 337 157 91
Dependent adults 421 232 1 19 71
Dependent adults (under ret irement age)*
147 90 37 20
Dependent adults (older)**
274 142 81 51
Dependent children 164 105 38 20
Total 1 ,195 680 326 189
2025 Total Royal Navy and Royal Marines
Merchant Navy Fishing Fleet
Serving 67 30xxxix 24 12.5
Former 466 265 126 75
Former (working age)
181 124 37 20
Former (65+) 285 141 89 54
Former (85+) 51 30 13 8
Dependants 513 292 140 81
Dependent adults 368 198 107 63
Dependent adults (under ret irement age)*
129 80 32 17
Dependent adults (older)**
239 1 19 75 46
Dependent children 145 94 33 18
Total 1 ,046 588 290 168
2035 Total Royal Navy and Royal Marines
Merchant Navy Fishing Fleet
Serving 63 30xl 20 12.5
Former 353 207 93 53

Navigating Change: A Review of the UK Maritime Welfare Charity Sector | 2017 214
TABLE 11.1 cont.
Former (working age)
213 144 44 25
Former (65+) 326 169 97 60
Former (85+) 59 44 9 6
Dependants 585 337 157 91
Dependent adults 421 232 1 19 71
Dependent adults (under ret irement age)*
147 90 37 20
Dependent adults (older)**
274 142 81 51
Dependent children 164 105 38 20
Total 1 ,195 680 326 189
2025 Total Royal Navy and Royal Marines
Merchant Navy Fishing Fleet
Serving 67 30xxxix 24 12.5
Former 466 265 126 75
Former (working age)
181 124 37 20
Former (65+) 285 141 89 54
Former (85+) 51 30 13 8
Dependants 513 292 140 81
Dependent adults 368 198 107 63
Dependent adults (under ret irement age)*
129 80 32 17
Dependent adults (older)**
239 1 19 75 46
Dependent children 145 94 33 18
Total 1 ,046 588 290 168
2035 Total Royal Navy and Royal Marines
Merchant Navy Fishing Fleet
Serving 63 30xl 20 12.5
Former 353 207 93 53
Former (working age)
155 105 32 18
Former (65+) 198 102 60 35
Former (85+) 46 21 16 10
Dependants 408 239 107 62
Dependent adults 279 155 78 46
Dependent adults (under ret irement age)*
1 13 70 28 16
Dependent adults (older)**
166 86 51 30
Dependent children 129 84 28 16
Total 824 476 220 128
2050 Total Royal Navy and Royal Marines
Merchant Navy Fishing Fleet
Serving 64 30xli 21 12.5
Former 260 159 64 38
Former (working age)
149 92 38 19
Former (65+) 1 1 1 67 25 19
Former (85+) 26 13 8 5
Dependants 329 196 84 49
Dependent adults 204 1 19 52 32
Dependent adults (under ret irement age)*
1 10 63 31 16
Dependent adults (older)**
94 56 21 16
Dependent children 125 77 32 17
Total 653 386 168 100
i 2005 figures from Marit ime Charit ies Funding Group (2007), except where stated otherwise. ii Also known as ‘working age seafarers’ . iii Including Royal Marines. IPC (2015). Table 1 p9. iv IPC (2015). Table 1 p39. Applies to ‘UK MN seafarers active at sea’ . v Deloitte/ Oxford Economics (2011 ). Table 12.1b.

Navigating Change: A Review of the UK Maritime Welfare Charity Sector | 2017 215
TABLE 11.1 Footnotes
vi IPC (2015). Estimate drawn from surveys carried out by the Marine Management Organisation in England, the Welsh Assembly Government, the Department of Agriculture and Rural Development in Northern Ireland, Marine Scotland and Marine Scotland Science. vii BBC News: UK Fishermen 1995-2014. In MNWB (2017a). viii These figures include ‘older seafarers’ (defined as being over the usual retirement age - 60 in the Naval Service and the fishing fleets and 62 in the Merchant Navy. Former Naval Service personnel) plus former working age seafarers (those under 60). Marit ime Charit ies Funding Group (2007). ix Marit ime Charit ies Funding Group (2007). No updated figures available although IPC (2015) note that these estimates were made on the basis of ‘weaker data’ indicating much higher rates of pension scheme membership among MN Officers. x Marit ime Charit ies Funding Group (2007). I t is believed that these figures were probably too low although a revised estimate is not available (see IPC, 2015). xi Marit ime Charit ies Funding Group (2007). No updated figures available. xii Ditto. xiii Ditto. xiv Marit ime Charit ies Funding Group (2007). No updated figures available. xv Ditto. xvi Ditto. xvii These figures include ‘working age dependent adults’, ‘children under 18’ and ‘older dependants’ , SS07. xviii Marit ime Charit ies Funding Group (2007). No updated figures available. xix Marit ime Charit ies Funding Group (2007). No updated figures available. xx Ditto. xxi Ditto. xxii Marit ime Charit ies Funding Group (2007). No updated figures available. xxiii Ditto. xxiv IPC (2015). xxv Trained strength as at 1 December 2015. (HM Gov (2015)) . This is higher than the 30,000 strength force posited in the Strategic Defence and Security Review , 2010. Includes Royal Marines but not Reserves. xxvi IPC (2015) estimate based on Deloitte/ Oxford Economics (2011 ), Table 6, p50. The authors note that this is potentially a sl ight over-estimate as it is based on scaled-up DfT figures of 23,080. Future figures are l ikely to be more accurate as the DfT and Deloitte figures converge. xxvii Due to the lack of information about entry and exit numbers, it is not possible to make a detailed projection of numbers beyond an assumption that numbers seem likely to remain level, having been reasonably steady over the most recent five years for which the data are available. IPC (2015).. xxviii IPC (2015). xxix IPC (2015). Table 9 p97. Within these figures, no account has been taken of the length of service. For some ex-seafarers this may be very minimal and preclude them meeting the eligibil ity criteria of most marit ime charit ies. xxx IPC, 2015, Table 4. On the basis of assumptions made, estimated figures generate a total number of former FF seafarers considerably higher than the total of 56,120 in Marit ime Charit ies Funding Group (2007). A key input to these figures was an educated guess by the Fishermen’s Mission. It is understood that their current view is that the 2007 overall figure was probably low. xxxi Based on the finding that 55% of RN veterans were over 65 in 2014 (Compass Partnership, 2014) quoted in IPC (2015). xxxii IPC (2015). xxxiii IPC (2015), Table p21 . xxxiv IPC (2015) Table 10. xxxv IPC (2015). Table 5 p81 . See also note 30. xxxvi IPC (2015). xxxvii Ibid. xxxviii In l ine with SDSR (2015). xxxix In l ine with SDSR (2015). xl In l ine with SDSR (2015). xli In l ine with SDSR (2015).
Former (working age)
155 105 32 18
Former (65+) 198 102 60 35
Former (85+) 46 21 16 10
Dependants 408 239 107 62
Dependent adults 279 155 78 46
Dependent adults (under ret irement age)*
1 13 70 28 16
Dependent adults (older)**
166 86 51 30
Dependent children 129 84 28 16
Total 824 476 220 128
2050 Total Royal Navy and Royal Marines
Merchant Navy Fishing Fleet
Serving 64 30xli 21 12.5
Former 260 159 64 38
Former (working age)
149 92 38 19
Former (65+) 1 1 1 67 25 19
Former (85+) 26 13 8 5
Dependants 329 196 84 49
Dependent adults 204 1 19 52 32
Dependent adults (under ret irement age)*
1 10 63 31 16
Dependent adults (older)**
94 56 21 16
Dependent children 125 77 32 17
Total 653 386 168 100
i 2005 figures from Marit ime Charit ies Funding Group (2007), except where stated otherwise. ii Also known as ‘working age seafarers’ . iii Including Royal Marines. IPC (2015). Table 1 p9. iv IPC (2015). Table 1 p39. Applies to ‘UK MN seafarers active at sea’ . v Deloitte/ Oxford Economics (2011 ). Table 12.1b.

Navigating Change: A Review of the UK Maritime Welfare Charity Sector | 2017 216
FIGURE 11.1
Differences between estimates of the seafaring community in 2015 and 2020 made in ‘Supporting Seafarers’ (2007) [SS] and IPC (2015) [IPC]2
TABLE 11.2
The percentage difference between estimates of the seafaring community in 2015 and 2020 made in ‘Supporting Seafarers’ (2007) and IPC (2015) illustrated in Figure 11.1
YearTotal
(RNRM + MN + FF)Royal Navy and Royal Marines
Merchant Navy Fishing Fleet
2015 27% 9% 49% 109%
2020 31% 8% 63% 134%
2 The data for ‘Supporting Seafarers’ (2007) taken from an unpublished study by Kathleen Baster of the University of Hertfordshire in 2005 which was commissioned by the MCFGandreportedin‘Supportingseafarersandtheirfamilies’report.The2015updatedfiguresweretakenfromIPC(2015)
11 .1
11 .2
0
200,000
400,000
600,000
800,000
1,000,000
1,200,000
1,400,000
1,600,000
2015 2020
SS Total
SS RNRM
SS MN
SS FF
IPC Total
IPC RNRM
IPC MN
IPC FF
SS Total
SS RNRM
SS MN
SS FF
IPC Total
IPC RNRM
IPC MN
IPC FF

Navigating Change: A Review of the UK Maritime Welfare Charity Sector | 2017 217
BIB
LIO
GR
AP
HY

Navigating Change: A Review of the UK Maritime Welfare Charity Sector | 2017 218
BIBLIOGRAPHYOnline locations for the various publications and information sourced are provided where available, it should be noted, however, that internet locations and addresses are subject to change, and that sites are accessed at the user’s own risk.
Age UK (2014), Later Life in the United Kingdom. http://www.ageuk.org.uk/publications/age-uk-information-guides-and-factsheets/
Ainsworth, D., Civil Society (1 March 2017a), Turning the Tide: How do we ensure public trust in charity? https://www.civilsociety.co.uk/finance/turning-the-tide.html
Ainsworth, D., Civil Society Voices (29 June 2017b), Why is the cost of raising funds rising so fast? https://www.civilsociety.co.uk/voices/david-ainsworth-why-is-the-cost-of-raising-funds-rising-so-fast.html
Allen P, Wellens B and Smith A., International Maritime Health (2010), Fatigue in British fishermen. https://journals.viamedica.pl/international_maritime_health/article/view/26223/0
Alzheimer’s Research Trust and The Dementia Stats Hub (accessed 2/5/2017). https://www.dementiastatistics.org/
Alzheimer’s Society (2013), Low Expectations: Attitudes on choice, care and community for people with dementia in care homes. https://www.alzheimers.org.uk/downloads/download/1024/alzheimers_society_low_expectations_report
Alzheimer’s Society (2014), Dementia UK update. Researched and written by King’s College London and the London School of Economics. https://www.alzheimers.org.uk/info/20025/policy_and_influencing/251/dementia_uk
Association of Charitable Organisations (ACO) (2017), Charity News Review – Issue 282: June 2017, ACO Annual Member Survey 2017.
Baster, K., University of Hertfordshire (2007), The Maritime Charities Funding Group Research Project. Reported in: MCGF (2007), Supporting Seafarers and their families: Challenges for the Future. https://secure.toolkitfiles.co.uk/clients/18838/sitedata/publications/SUPPORTING_SEAFARERS_2007.pdf
Belai, J., Association of Charitable Organisations (ACO) (2013), Changing for Good: Trusts and Foundations that give grants and other support to individuals in need. https://www.aco.uk.net/page/Survey-Report-2013
Beth Johnson Foundation (2016), Ageing in the UK Now: A Snapshot of Current Research. https://www.bjf.org.uk/research-influence/current-research
Bluewater (2017), The Superyacht Industry – what is a superyacht? Presentation by Wyborn, J. to Maritime UK’s ‘People & Skills’ Awareness Subgroup 9th May 2017.
Bupa (2011), Who Cares? Funding Adult Social Care over the Next Decade. https://www.housinglin.org.uk/_assets/Resourcc-es/Housing/Support_materials/Other_reports_and_guidance/Care_Brochure_BUPA.pdf
Centre for Future Studies, for The Royal British Legion (2011), Legion welfare in the 2010s: a decade of change. http://media.britishlegion.org.uk/Media/2279/legionwelfare2010s.pdf
Centre for Social Justice (2016). Military Families and Transition. http://www.centreforsocialjustice.org.uk/library/military-families-and-transition
Charities Aid Foundation (2013), Why We Give. https://www.cafonline.org/docs/default-source/about-us-publications/caf-why-we-give-jan14.pdf?sfvrsn=5.pdf
Charities Aid Foundation/ACEVO (2017), Social Landscape. https://www.cafonline.org/about-us/publications/2017-publii-cations/social-landscape-2017
Charity Commission for England and Wales (2006), RS13: Tell It Like It Is: The extent of charity reserves and reserves policies. https://www.gov.uk/government/publications/tell-it-like-it-is-rs13
Charity Commission for England and Wales (2010), Charities and the Economic Downturn. https://www.gov.uk/government/publications/charities-and-the-economic-downturn-parliamentary-briefing
Charity Commission for England and Wales (2016), Charity reserves: building resilience (CC19). https://www.gov.uk/government/publications/charities-and-reserves-cc19
Charity Governance Code, https://www.charitygovernancecode.org/en
Charity Governance Code Steering Group (2017a), Charity Governance Code for larger charities. Group members: acevo, Association of Chairs, icsa, NCVO, Small Charities Coalition and WCVA; Observor: Charity Commission for England and Wales; Supported by The Clothworkers’ Company and Barrow Cadbury Trust. https://www.charitygovernancecode.org/en/
Charity Governance Code Steering Group (2017b), Charity Governance Code for smaller charities. Group members: acevo, Association of Chairs, icsa, NCVO, Small Charities Coalition and WCVA; Observor: Charity Commission for England and Wales; Supported by The Clothworkers’ Company and Barrow Cadbury Trust. https://www.charitygovernancecode.org/en/

Navigating Change: A Review of the UK Maritime Welfare Charity Sector | 2017 219
Coalition for Efficiency (2011), The Trustee’s Dilemma: to spend or to save? Maximising the benefits of retained funds in operating charities. Research conducted by the Institute for Philanthropy. http://www.cfefficiency.org.uk/wp-content/uploads/2015/09/Trustees-Dilemma.pdf
Cole, S. and Traynor, T., Directory of Social Change (2016), Sector Insight: Armed Forces Charities in Scotland. Produced in association with Cobseo and funded by Forces in Mind Trust. https://www.dsc.org.uk/wp-content/uploads/2016/10/Armed-Forces-Charities-in-Scotland-Web-Version.pdf
Compass Partnership (2014), A UK Household Survey of the Ex-Service Community 2014. Supported by FiMT, National Lottery, RBL. http://media.britishlegion.org.uk/Media/2273/2014householdsurvey_execsummary.pdf
Crewtoo (2016), Seafarers Happiness Index. http://survey.crewtoo.com/happiness
Croucher, Lowson and Fountain, York University for the Department for Communities and Local Government (DCLG) (2012), National Review of the Handyperson programme. https://www.gov.uk/government/uploads/system/uploads/attachment_data/file/6247/2075820.pdf
Davies, B., IPPR North (2014), For Future Living: Innovative Approaches to Joining Up Housing and Health. https://www.ippr.org/publications/for-future-living-innovative-approaches-to-joining-up-housing-and-health
Deloitte / Oxford Economics (2011), An independent review of the economic requirement for trained seafarers in the UK. Final Report to DfT and Review Panel. https://www.gov.uk/government/publications/an-independent-review-of-the-economic-requirement-for-trained-seafarers-in-the-uk
Department for Communities and Local Government (DCLG) (2014), English Housing Survey 2012: Profile of English Housing Report. https://www.gov.uk/government/collections/english-housing-survey
Department for Transport (DfT) (2017), Seafarer Statistics 2016. https://www.gov.uk/government/statistics/seafarer-statistics-2016
Department for Work and Pensions (DWP) (2017), Pensioners’ Incomes Series: An analysis of trends in Pensioner Incomes: 1994/95-2015/16. https://www.gov.uk/government/statistics/pensioners-incomes-series-financial-year-201516
Department of Health (2011), Resource Allocation: Weighted Capitation Formula Seventh Edition. Statistics relate to ONS, National Population Projections 2010 Based Statistical Bulletin, Oct 2011, Tables 4 and 12. https://www.gov.uk/government/publications/resource-allocation-weighted-capitation-formula
Elizabeth Finn Care (2012), Shaping the Future of Benevolence: ‘Understanding challenges and developing solutions in a dynamic sector. https://wwwturn2us-2938.cdn.hybridcloudspan.com/T2UWebsite/media/Documents/Benevolence-Report.pdf
Evidential Consulting, a report for Lloyds Bank Foundation England and Wales (2017), Facing Forward: How Small and Medium-Sized Charities Can Adapt to Survive. https://www.lloydsbankfoundation.org.uk/Facing-Forward-2017.pdf
FutureNautics (2015), Crew Connectivity 2015. http://www.futurenautics.com/crewconn15
Giannangeli, M., in The Express (13 February 2017), Royal Navy tries to plug its staff sinkhole with urgent plea to retired and ageing sailors. http://www.express.co.uk/news/uk/766183/Royal-Navy-plug-staff-shortage-urgent-plea-ex-sailors
Gutch, R., Prospectus and Eastside (2012), The Good Merger Guide. https://prospect-us.co.uk/media/14002/the-good-merger-guide.pdf
Harflett, Pitts, Greig and Bown, NDTi (2017), Housing Choices: What is the evidence for the cost or cost-effectiveness of hous-ing and support options for people with care or support needs? https://www.ndti.org.uk/uploads/files/Housing_Choicc-es_Discussion_Paper_1.pdf
Henderson, A., Langston, V. and Greenberg, N., King’s College London (2009), Alcohol misuse in the Royal Navy. Occupational Medicine 2009; 59:25-31. https://www.kcl.ac.uk/kcmhr/publications/assetfiles/alcoholsmoking/Henderson2008-alcoholmisusenavy.pdf
HM Government, UK (2010), Securing Britain in an Age of Uncertainty: The Strategic Defence and Security Review (SDSR) 2010. https://www.gov.uk/government/uploads/system/uploads/attachment_data/file/62482/strategic-defence-security-review.pdf
HM Government, UK (2015), National Security Strategy and Strategic Defence and Security Review (SDSR) 2015. https://www.gov.uk/government/publications/national-security-strategy-and-strategic-defence-and-security-review-2015
House of Lords (2017), Select Committee on Charities. Report of Session 2016–17. Stronger charities for a stronger society. HL Paper 133. https://publications.parliament.uk/pa/ld201617/ldselect/ldchar/133/133.pdf
Hunt, Wessely, Jones, Rona and Greenberg, KCL – King’s Centre for Military Health Research (2014), The mental health of the UK Armed Forces; where facts meet fiction. https://www.kcl.ac.uk/kcmhr/publications/assetfiles/2014/Hunt2014.pdf
Hurst, G., The Times (1 July 2017), Care home nursery fills generation gap. https://www.thetimes.co.uk/article/care-home-nursery-fills-generation-gap-xjd329wf8
Institute for Fiscal Studies (IFS) (2015), Nearly two-thirds of children in poverty live in working families, press release 16/07/2015. http://www.ifs.org.uk/publications/7880
Institute of Public Care (IPC) (2011) for the Maritime Charities Group, Accommodation, Care and Support Strategy for Older Seafarers and their Dependants. https://ipc.brookes.ac.uk/publications/pdf/Final_Report.pdf
https://www.dsc.org.uk/wp-content/uploads/2016/10/Armed-Forces-Charities-in-Scotland-Web-Version.pdf

Navigating Change: A Review of the UK Maritime Welfare Charity Sector | 2017 220
Institute of Public Care (IPC) (2015) for the Maritime Charities Group, UK Seafarers’ Demographic Profile. https://ipc.brookes.ac.uk/publications/publication_806.html
Institute of Public Care (IPC) (2016) for the Maritime Charities Group, The needs and aspirations of the dependants and families of seafarers under retirement age. http://www.seafarers.uk/wp-content/uploads/2017/08/Maritime-Charities-Group-The-Needs-and-Aspirations-of-the-Dependants-of-Seafarers-Under-Retirement-Age-Report.pdf
International Labour Organization (ILO) (2004), The Global Seafarer: Living and working conditions in a globalized industry. Cited in Mackay S and Wright T (2008). http://www.ilo.org/global/publications/books/WCMS_069003/lang--en/index.htm
International Labour Organization (ILO) (accessed 12/5/2017), MLC 2006: What it is and what it does. http://www.ilo.org/global/standards/maritime-labour-convention/what-it-does/lang--en/index.htm
ITF Seafarers’ Trust (2016), Port-based Welfare Services Survey. http://www.seafarerstrust.org/the-itf-seafarers-trust-port-based-welfare-services-survey-2016-summary-report/
Japan’s Ministry of Internal Affairs and Communication, Statistics Bureau (2016), Japan Statistical Yearbook, Chapter 2: Population and Households. As reported in Davies, B, IPPR North (2014). http://www.stat.go.jp/english/data/nenkan/65nenkan/1431-02.htm
Kahveci, E., SIRC (2007), Port Based Welfare Services for Seafarers. http://www.itfseafarers.org/files/seealsodocs/4423/WelfareReportl.pdf
Kingston Smith (2013), Impact Measurement Toolkit – for the charity sector. http://www.kingstonsmith.co.uk/upload/pdf/ImpactToolkit2013_updated_FINAL_1.pdf
Lawrie, T., Matheson, C., Ritchie, L., Murphy, E. and Bond, C. (2004), The health and lifestyle of Scottish fishermen: a need for health promotion, Health Educ. Res., Aug. 19,4, pp373-9. https://www.ncbi.nlm.nih.gov/pubmed/15199010
Leonard, J.F. (2003), A Comparison of the Causes and Rates of Early Retirement upon Medical Grounds in personnel of the Royal Fleet Auxiliary Service with those in the Royal Navy. Thesis for the Diploma of Membership of the Faculty of Occupational Medicine.
Mackay, S. and Wright, T. (2008), Seafarers in a global world: the changing needs of seafarers for advice, support and rep-resentation, WLRI Working Paper 3. http://www.academia.edu/7557986/Seafarers_in_a_global_world_the_changing_needs_of_seafarers_for_advice_support_and_representation
Maritime Charities Funding Group (2007). ‘Supporting Seafarers and their families: Challenges for the Future. https://secure.toolkitfiles.co.uk/clients/18838/sitedata/publications/SUPPORTING_SEAFARERS_2007.pdf
Matheson, C., Morrison, S., Murphy, E., Lawrie, T., Ritchie, L. and Bond, C. (2001), The health of fishermen in the catching sector of the fishing industry: a gap analysis, Occupational Medicine; 51: 5: 305-11. https://www.ncbi.nlm.nih.gov/pubmed/11473136
McFarlane, H., Parentline Plus, for the Maritime Charities Funding Group (2009), Research into the parenting needs of seafaring families. Unpublished. Available from the Maritime Charities Group by request
McNeil and Hunter, IPPR (2014), The generation strain: collective solutions to care in an ageing society. https://www.ippr.org/publications/the-generation-strain-collective-solutions-to-care-in-an-ageing-society
Merchant Navy Welfare Board (MNWB) (2011), Annual Report and Accounts.
Merchant Navy Welfare Board (MNWB) (2016a), MNWB Strategy 2017/18. https://secure.toolkitfiles.co.uk/clients/18838/sitedata/Misc/MNWB-Strategy-Document-2016-2017.pdf
Merchant Navy Welfare Board (MNWB) (2016b), Seafarers’ Centres and Port Welfare Services Study.
Merchant Navy Welfare Board (MNWB) (2017a), Older Seafarers and Families Working Group Report. http://www.mnwb.org/Publications
Merchant Navy Welfare Board (MNWB) (2017b), Serving Seafarers Working Group Report. http://www.mnwb.org/Publications
Ministry of Defence (MOD) (2015a), TSP7 - UK Reserve Forces and Cadets. https://www.gov.uk/government/statistics/uk-reserve-forces-and-cadets-strengths-2015
Ministry of Defence (MOD) (2015b), The Armed Forces Covenant Annual Report. https://www.gov.uk/government/publications/armed-forces-covenant-annual-report-2015
Ministry of Defence (MOD) (2015c), Annual Medical Discharges in the UK Regular Armed Forces 2010/11 - 2014/15. https://www.gov.uk/government/statistics/uk-service-personnel-medical-discharges-financial-year-201415
Ministry of Defence (MOD) (2015d), DASA Defence Statistics Armed Forces Biannual Diversity Statistics. https://www.gov.uk/government/statistics/uk-armed-forces-biannual-diversity-statistics-2015
Ministry of Defence (MOD) (2016), UK Armed Forces Monthly Service Personnel Statistics, 1 September 2016. https://www.gov.uk/government/statistics/uk-armed-forces-monthly-service-personnel-statistics-2016
Ministry of Defence (MOD) (2017a), Tri-Service Families Continuous Attitude Survey. https://www.gov.uk/government/statis-tics/tri-service-families-continuous-attitude-survey-2017

Navigating Change: A Review of the UK Maritime Welfare Charity Sector | 2017 221
Ministry of Defence (MOD) (2017b), UK Regular Armed Forces Continuous Attitude Survey. https://www.gov.uk/government/statistics/armed-forces-continuous-attitude-survey-2017
Ministry of Defence (MOD) (2017c), Veterans Key Facts. https://www.armedforcescovenant.gov.uk/wp-content/up-loads/2016/02/Veterans-Key-Facts.pdf
Ministry of Defence (MOD) (2017d), Alcohol usage in the UK Armed Forces 1 June 2016 – 31 May 2017. https://www.gov.uk/government/statistics/alcohol-usage-in-the-uk-armed-forces-1-june-2016-to-31-may-2017
Monbiot, G., The Guardian (October 2014 – accessed 11/5/2017), ‘The age of loneliness is killing us’. https://www.theguardian.com/commentisfree/2014/oct/14/age-of-loneliness-killing-us
Moore B., Pritchard-Wilkes V., Miles S., Sweeney R., Alzheimer’s Society (2017), Dementia-friendly housing charter. Guidance on delivering a dementia-friendly approach to housing. https://www.alzheimers.org.uk/info/20079/dementia_friendly_communities/1021/dementia-friendly_housing_charter
Morris, N., the ‘i’ newspaper online (17 April 2017), Paupers’ funerals rise by 50 per cent in four years. https://inews.co.uk/es-sentials/news/uk/worrying-picture-isolation-numbers-paupers-funerals-soar/
Nautilus International (2010), Survey of seafarers’ living and working conditions. https://m.nautilusint.org/media/169333/Seafarers-Conditions-Survey-Report-2010.pdf
Nautilus International, a report by the Labour Research Department (2015), Membership Survey 2015. https://nautilusint.org/media/1668312/Nautilus_membership_survey_2015.pdf
Nautilus International (2017), An investigation into connectivity at sea, 2017. https://nautilusint.org/media/1674641/Connecc-tivity_at_sea_Nautilus_whitepaper.pdf
NAVCA (2016), In sickness and in health - a Case Study on small VCS organisations, impact data, and the delivery of health service contracts. https://www.navca.org.uk/assets/000/000/210/In_sickness_and_in_health_original.pdf?1477562514
NCVO (2016), The Civil Society Almanac, 2016. https://data.ncvo.org.uk/almanac16/
NCVO (2017a), The Civil Society Almanac, 2017. https://data.ncvo.org.uk/
NCVO (2017b), A financial sustainability review: change and adaptation in the voluntary sector as the economy recovers. CFG, Small Charities Coalition, Institute of Fundraising, NAVCA, Locality. https://www.ncvo.org.uk/images/documents/policy_and_research/funding/financial-sustainability-review-of-the-voluntary-sector-july-2015.pdf
NCVO and Lloyds Bank Foundation (2016), Navigating Change: An analysis of financial trends for small and medium-sized charities. http://www.ncvo.org.uk/images/documents/policy_and_research/funding/financial-trends-for-small-and-medium-sized-charities-ncvo-lloyds-bank-foundation-2016.pdf
NCVO Funding Commission (2010), Paper 1 – Capitalisation and Social Investment – Emerging Findings and Recommendations. www.ncvo-vol.org.uk/fundingcommission
nfpSynergy for Turn2us/ACO (2014), Grant-Giving Charities Research. https://wwwturn2us-2938.cdn.hybridcloudspan.com/T2UWebsite/media/Documents/Turn2us-ACO-grant-giving-charity-research-report-December-2014_2.pdf
nfpSynergy (2016), Challenging cuts: Investigating the response of charities to frontline service cuts. https://nfpsynergy.net/free-report/challenging-cuts-investigating-response-charities-frontline-service-cuts
nfpSynergy (2017), Charity Awareness Monitor. https://nfpsynergy.net/blog/ten-things-it-useful-know-about-trust-charities-and-other-bodies
NHS Benchmarking Network (2013), National Audit of Intermediate Care. https://www.nhsbenchmarking.nhs.uk/projects/naic
NHS (2014), Five Year Forward View. https://www.england.nhs.uk/wp-content/uploads/2014/10/5yfv-web.pdf
Ni Ogain, Lumley and Pritchard, New Philanthropy Capital (2012), Making an Impact. http://www.thinknpc.org/publications/making-an-impact/
Niven, R., The Guardian (2012), Is it time for your charity to conduct a strategic review? https://www.theguardian.com/voluntary-sector-network/2012/jun/13/charity-conduct-strategic-review-advantages
Office for National Statistics (ONS) (2011), 2011 Census data, as quoted in ORS (2016). https://www.ons.gov.uk/census/2011census
Office for National Statistics (ONS) (2014), National Population Projections: 2014-based Statistical Bulletin. https://www.ons.gov.uk/peoplepopulationandcommunity/populationandmigration/populationprojections/bulletins/nationalpopulationprojections/2015-10-29
Office for National Statistics (ONS) (2015a), Population Estimates for UK, England and Wales, Scotland and Northern Ireland: mid- 2015. https://www.ons.gov.uk/peoplepopulationandcommunity/populationandmigration/populationestimates/bulletins/annualmidyearpopulationestimates/mid2015
Office for National Statistics (ONS) (2015b), Internet Access - Households and Individuals: 2015. https://www.ons.gov.uk/peoplepopulationandcommunity/householdcharacteristics/homeinternetandsocialmediausage/bulletins/internetaccesshouseholdsandindividuals/previousReleases

Navigating Change: A Review of the UK Maritime Welfare Charity Sector | 2017 222
Opinion Research Services (ORS) (2016) for the Maritime Charities Group, Older Seafarers’ Needs. http://www.seafarers.uk/wp-content/uploads/2017/08/Maritime-Charities-Group-Older-Seafarers-Needs-Report.pdf
Oxford Economics, for the Department for Transport, (2016), UK Seafarer Projections. Report commissioned as part of the government’s Maritime Growth Study. http://www.oxfordeconomics.com/recent-releases/uk-seafarer-projections
Pannell, Aldridge and Kenway, NPI for Shelter / Joseph Rowntree Foundation (2012), Market Assessment of Housing Options for Older People. http://www.npi.org.uk/publications/housing-and-homelessness/market-assessment-housing-options-older-people/
Parkin and Baker, House of Commons Library (2016), Dementia: policy, services and statistics. http://researchbriefings.parliament.uk/ResearchBriefing/Summary/SN07007#fullreport
Pensions Policy Institute (2017), Pension Facts. May 2017. http://www.pensionspolicyinstitute.org.uk/pension-facts/pension-facts-tables
Pharoah, C. (2017), Top 100 UK Fundraising Charities Spotlight Report. Charity Financials, Wilmington Insight, March 2017. http://www.charityfinancials.com/charity-financials-insider/top-100-uk-fundraising-charities-spotlight-report-1713.html
Pozo, A. and Walker, C., Directory for Social Change (2014), UK Armed Forces Charities: an overview and analysis. Produced in associated with Cobseo and funded by Forces in Mind Trust. https://www.dsc.org.uk/educational-funding-research/
Public Health England (PHE) (2015), Local action on health inequalities: Reducing social isolation across the life-course. https://www.gov.uk/government/publications/local-action-on-health-inequalities-reducing-social-isolation
Rance, S. and Westlake, D., (2015), Evaluation of Community Network´s Seafarers Link Project. Unpublished. Available from the Maritime Charities Group by request
Roberts, R., The Independent (May 2017), 200,000 children from poorest households hit by benefit cap. http://www.independent.co.uk/news/uk/home-news/200000-children-are-being-made-poorer-by-the-benefits-cap-a7718776.html
Roberts, S., Maritime Policy and Management (2000), Occupational mortality among British merchant seafarers (1986- 1995), as quoted in Mackay and Wright (2008). http://www.tandfonline.com/doi/abs/10.1080/030888300411095
Sailors Society (2014), Annual Report and Accounts. https://issuu.com/janecrowley9/docs/2014_sailors__society_report___acco
Save the Royal Navy (2014), 9-month deployments and the Navy’s sensible response to the manpower crisis, 16 October 2014. http://www.savetheroyalnavy.org/9-month-deployments-and-the-navys-sensible-response-to-manpower-crisis/
Seafarers UK (2011), Annual Report and Accounts. https://issuu.com/healthcare_manager/docs/0x_ar2011_all_final
Seafarers UK (2014), Seafarers Awareness Week survey. http://www.ship-technology.com/features/featuresea-blindness-uk-maritime-in-the-public-eye-5843321/
The Foundation for Social Improvement (FSI) (2017a), UK small charity sector skills survey 2016/17. http://www.thefsi.org/wp-content/uploads/2015/06/UK-Small-Charity-Sector-Skills-Survey-2014%EF%80%A215.pdf
The Foundation for Social Improvement (FSI) (2017b), Taking the Pulse of the Small Charity Sector. 15th Edition, 2016/17. http://www.thefsi.org/wp-content/uploads/2017/04/Index-Dec-Feb17.pdf
The Foundation for Social Improvement (FSI) (2017c), Skills Survey 2016-2017. http://www.thefsi.org/wp-content/uploads/2017/03/Skills-Survey-16-17.pdf
The Marmot Review Team (2010), Fair Society, Healthy Lives: Strategic review of health inequalities in England post-2010. http://www.parliament.uk/documents/fair-society-healthy-lives-full-report.pdf
The Review of Fundraising Self-regulation (2015), Regulating Fundraising for The Future: Trust in Charities, Confidence in Fundraising Regulation. https://www.ncvo.org.uk/images/documents/policy_and_research/giving_and_philanthropy/fundraising-review-report-2015.pdf
Thomas, M., Seafarers International Research Centre (2003), Lost at sea and lost at home. The predicament of seafaring families. http://www.sirc.cf.ac.uk/uploads/publications/Lost%20at%20Sea.pdf
Triangle Consulting (2016), Independence Star: The Outcomes Star for the Armed Forces community. Developed by Triangle Consulting in collaboration with The Officers’ Association. http://www.outcomesstar.org.uk/using-the-star/see-the-stars/independence-star/
UK Chamber of Shipping (2017), Research conducted by ComRes into awareness of maritime industry https://www.ukk-chamberofshipping.com/latest/opinion-poll-confirms-seablindness-myth/
Walker, C., The Researchery (2016), A Tale of Two Southwarks: A needs analysis of the London Borough of Southwark. A report for Southwark Giving. http://southwarkgiving.org/wp-content/uploads/2016/12/A-Tale-of-Two-Southwarks-1.pdf
Walker, C., The Researchery for Charity Financials Insider Magazine (2017), The scandal that keeps on scandalising - LIBOR fines and what to do with them. http://www.charityfinancials.com/charity-financials-insider/the-scandal-that-keeps-on-scandalising-libor-fines-and-what-to-do-with-them-1703.html
Weakley, K., Civil Society (3 July 2017), Charities ‘significantly unprepared’ for GDPR, say one-fifth of respondents. https://www.civilsociety.co.uk/news/charity-sector-significantly-unprepared-for-gdpr-say-one-fifth-of-survey-respondents.html
Williams, R., PhD Thesis - Newcastle University (2008), Changing Constructions of Identity: Fisher Households and Industry Restructuring. https://theses.ncl.ac.uk/dspace/bitstream/10443/2040/1/Williams%2C%20R.%202008.pdf


Published by: Seafarers UK
8 Hatherley St, Westminster, London SW1P 2QT
tel: 020 7932 0000
web: www.seafarers.uk
Seafarers UK (King George’s Fund for Sailors) is a Registered Charity, no. 226446 in England and Wales, incorporated under Royal Charter. Registered in Scotland, no. SC038191.
© 2017 Maritime Charities Group
© C
row
n Im
age
s